Giving to Excellence: Generating Philanthropic Support for UK ...
54
Giving to Excellence: Generating Philanthropic Support for UK Higher Education 2011-12 Ross-CASE Survey Report Authors: Steven Coutinho and Mari Toomse-Smith Date: 11/04/2013 Prepared for: The Ross Group and CASE
-
Upload
khangminh22 -
Category
Documents
-
view
4 -
download
0
Transcript of Giving to Excellence: Generating Philanthropic Support for UK ...
Giving to Excellence: Generating Philanthropic Support for UK Higher Education 2011-12 Ross-CASE Survey Report Authors: Steven Coutinho and Mari Toomse-Smith Date: 11/04/2013 Prepared for: The Ross Group and CASE
At NatCen Social Research we believe that social research has the power to make life better. By really understanding the complexity of people’s lives and what they think about the issues that affect them, we give the public a powerful and influential role in shaping decisions and services that can make a difference to everyone. And as an independent, not for profit organisation we’re able to put all our time and energy into delivering social research that works for society.
NatCen Social Research 35 Northampton Square London EC1V 0AX T 020 7250 1866 www.natcen.ac.uk A Company Limited by Guarantee Registered in England No.4392418. A Charity registered in England and Wales (1091768) and Scotland (SC038454)
NatCen Social Research | Annual report and accounts 2011/2012 3
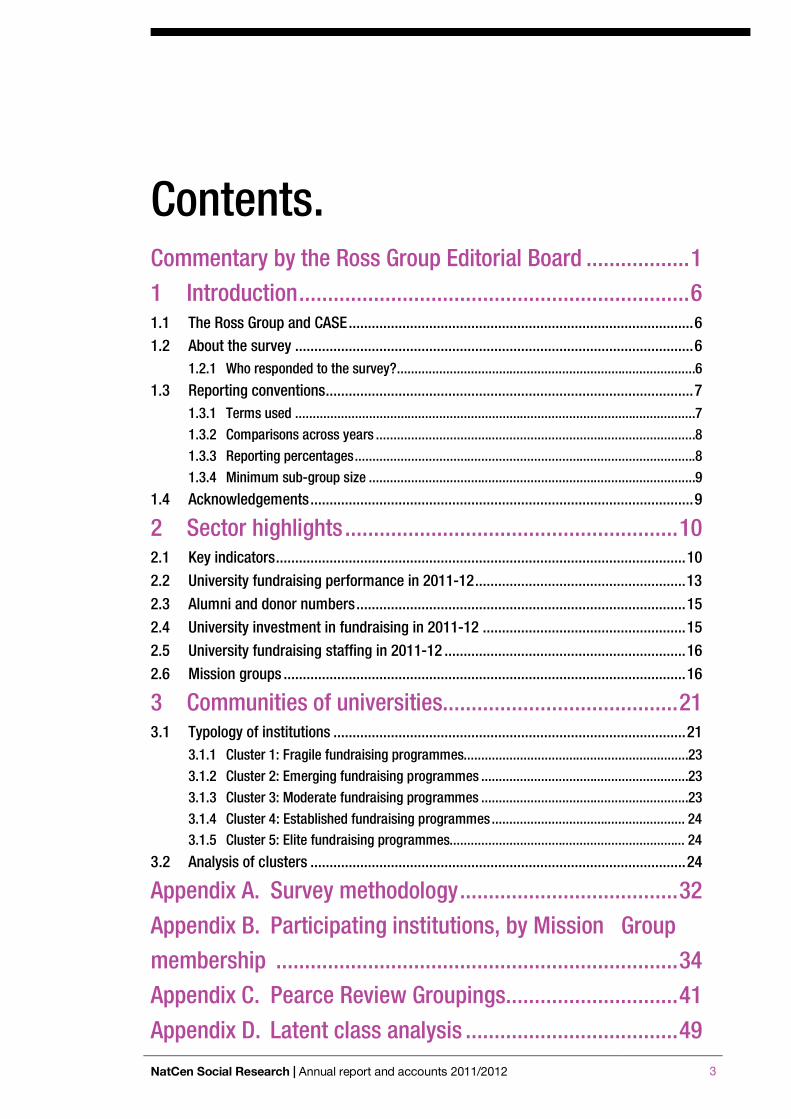
Contents.
Commentary by the Ross Group Editorial Board ..................1
1 Introduction....................................................................6
1.1 The Ross Group and CASE..........................................................................................6 1.2 About the survey ........................................................................................................6
1.2.1 Who responded to the survey?.....................................................................................6 1.3 Reporting conventions................................................................................................7
1.3.1 Terms used ..................................................................................................................7 1.3.2 Comparisons across years ...........................................................................................8 1.3.3 Reporting percentages.................................................................................................8 1.3.4 Minimum sub-group size .............................................................................................9
1.4 Acknowledgements....................................................................................................9
2 Sector highlights..........................................................10
2.1 Key indicators...........................................................................................................10 2.2 University fundraising performance in 2011-12.......................................................13 2.3 Alumni and donor numbers......................................................................................15 2.4 University investment in fundraising in 2011-12 .....................................................15 2.5 University fundraising staffing in 2011-12 ...............................................................16 2.6 Mission groups .........................................................................................................16
3 Communities of universities.........................................21
3.1 Typology of institutions ............................................................................................21 3.1.1 Cluster 1: Fragile fundraising programmes................................................................23 3.1.2 Cluster 2: Emerging fundraising programmes ...........................................................23 3.1.3 Cluster 3: Moderate fundraising programmes ...........................................................23 3.1.4 Cluster 4: Established fundraising programmes....................................................... 24 3.1.5 Cluster 5: Elite fundraising programmes................................................................... 24
3.2 Analysis of clusters ..................................................................................................24
Appendix A. Survey methodology......................................32
Appendix B. Participating institutions, by Mission Group membership ......................................................................34
Appendix C. Pearce Review Groupings..............................41
Appendix D. Latent class analysis .....................................49
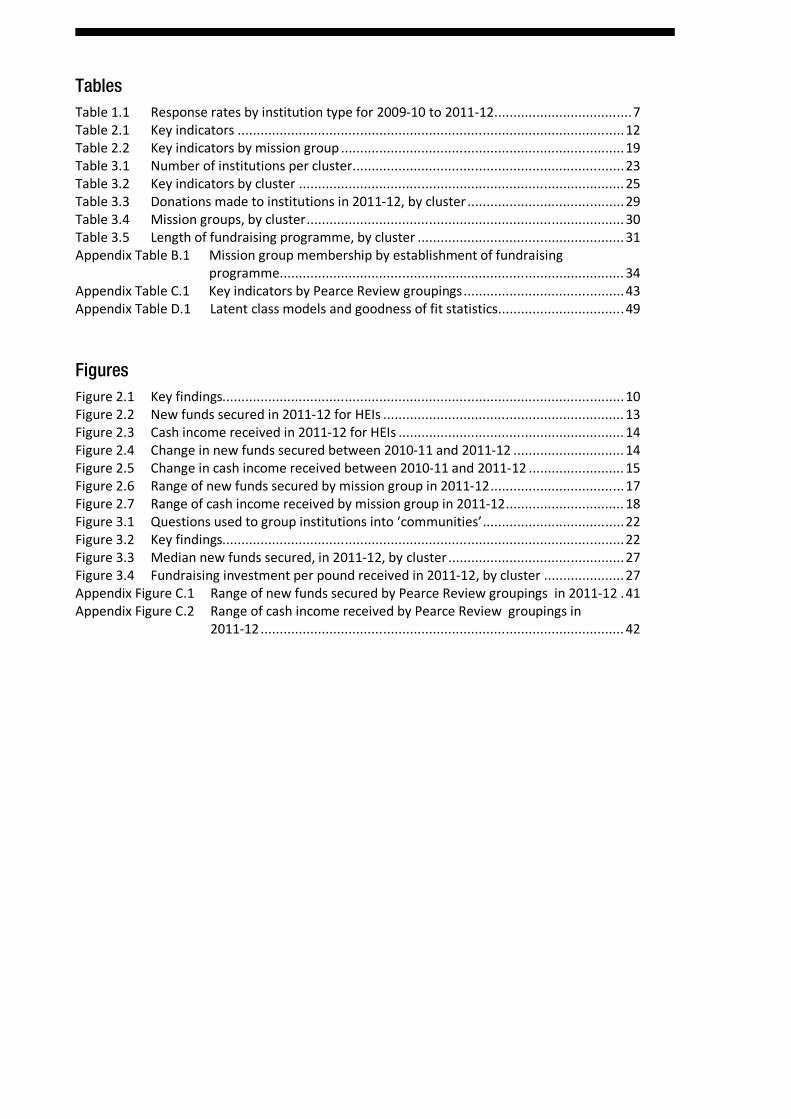
Tables Table 1.1 Response rates by institution type for 2009-10 to 2011-12....................................7 Table 2.1 Key indicators .....................................................................................................12 Table 2.2 Key indicators by mission group ..........................................................................19 Table 3.1 Number of institutions per cluster.......................................................................23 Table 3.2 Key indicators by cluster ..................................................................................... 25 Table 3.3 Donations made to institutions in 2011-12, by cluster .........................................29 Table 3.4 Mission groups, by cluster...................................................................................30 Table 3.5 Length of fundraising programme, by cluster ...................................................... 31 Appendix Table B.1 Mission group membership by establishment of fundraising programme.......................................................................................... 34 Appendix Table C.1 Key indicators by Pearce Review groupings..........................................43 Appendix Table D.1 Latent class models and goodness of fit statistics.................................49
Figures Figure 2.1 Key findings.........................................................................................................10 Figure 2.2 New funds secured in 2011-12 for HEIs ............................................................... 13 Figure 2.3 Cash income received in 2011-12 for HEIs ........................................................... 14 Figure 2.4 Change in new funds secured between 2010-11 and 2011-12 ............................. 14 Figure 2.5 Change in cash income received between 2010-11 and 2011-12 ......................... 15 Figure 2.6 Range of new funds secured by mission group in 2011-12...................................17 Figure 2.7 Range of cash income received by mission group in 2011-12............................... 18 Figure 3.1 Questions used to group institutions into ‘communities’.....................................22 Figure 3.2 Key findings.........................................................................................................22 Figure 3.3 Median new funds secured, in 2011-12, by cluster ..............................................27 Figure 3.4 Fundraising investment per pound received in 2011-12, by cluster ..................... 27 Appendix Figure C.1 Range of new funds secured by Pearce Review groupings in 2011-12 .41 Appendix Figure C.2 Range of cash income received by Pearce Review groupings in 2011-12............................................................................................... 42
NatCen Social Research | Giving to Excellence: Generating Philanthropic Support for UK Higher Education 2011-12
1
Commentary by the Ross Group Editorial Board
Introduction
In response to comments from users of previous surveys this year’s summary report is shorter and focuses on the key measures that provide an overall picture of the current state of philanthropy to support higher education. Some additional figures are available to survey participants, depending on the nature of the request. A dataset is available for those who participate in the data sharing exercise1.
This year’s survey demonstrates that fundraising to support UK Higher Education (HE) is a substantial and growing business across the sector. The importance of philanthropy in maintaining the excellence of the sector was marked in 2011-12 by four landmark events:
The continued growth in fundraising in 2011-12, despite this being the first year after the end of the Higher Education Funding Council for England (HEFCE) Matched Funding Scheme2
, suggests that this innovative programme has left a positive legacy of investments in fundraising across the sector and has increased the willingness of alumni and others to make philanthropic investments in higher education.
The completion of Europe’s first £1 billion fundraising campaign by the University of Cambridge, in November 2011 (which closed on a total of £1.18 billion) and the announcement by the University of Oxford in March 2012 that they had passed their original campaign target of £1.25 billion demonstrated that large scale philanthropy is not a preserve of the top US universities.
The HEFCE commissioned ‘Review of Philanthropy in UK Higher Education3’ (overseen by a group chaired by Professor Shirley Pearce, then Vice Chancellor of Loughborough University, and hence referred to in this report as the ’Pearce Review‘) demonstrated both the success of fundraising over the past ten years and the challenges and opportunities that still exist.
The important part played by universities, working with the rest of the charitable sector, to persuade the Government that its proposals in the
1 Those who consent to data sharing are included in a dataset. This dataset can be used by institutions to perform their own analyses and to benchmark themselves against other institutions. 2 In 2008 the UK government launched a three-year matched funding scheme for voluntary giving to higher education in England, administered by HEFCE. The scheme aimed to achieve a step-change in philanthropic giving and matched eligible donations raised between August 2008 and July 2011 at participating higher education institutions (HEIs) and directly funded further education institutions (FEIs). A similar scheme was run in Wales by the Higher Education Funding Council for Wales (HEFCW). 3 More Partnership (July 2012). Review of Philanthropy in UK Higher Education: 2012 Status Report and Challenges for the Next Decade. Available at http://www.hefce.ac.uk/media/hefce/content/pubs/indirreports/2012/philanthropyinukhe/HEFCE%20Philanthropy%20Report.pdf (Accessed 27 March 2013)
2 NatCen Social Research | Giving to Excellence: Generating Philanthropic Support for UK Higher Education 2011-12
2012 Budget to limit tax relief on donations would have been very damaging to philanthropy in the UK.
For the past three years participation in the survey has been mandatory for all those institutions participating in the Matched Funding Scheme. 2011-12 was the first year in which we returned to entirely voluntary participation and the Editorial Board are delighted that 143 institutions chose to participate (including eight Further Education Institutions (FEIs). We believe that this reflects the importance of the survey to the sector as a whole and as an increasingly valuable source of benchmarking data for individual institutions. Further development of the survey as a tool for helping institutions to assess performance and evaluate investments in fundraising is therefore a high priority.
However regional coverage remains uneven. Whilst 117 English and seven Welsh institutions responded (out of 135 and ten invited respectively) only 11 out of 21 Scottish and Northern Irish HE institutions (HEIs) returned questionnaires. These response rates mean that the survey results are not comprehensively representative of the UK as a whole and the Editorial Board will work with sector bodies to try to improve this situation.
Overview
Overall the sector had a successful year. Total new funds secured4 rose by 14 per cent over the previous year, to a record of £774 million (and by 33 per cent compared to 2009-10). By comparison giving to US universities and colleges (as reported by the Council for Aid to Education5) rose by only two per cent over the past year, despite some remarkable performances by individual US institutions. Our success, achieved against the backdrop of poor economic conditions, resulted in good measure from the sector’s continued commitment to investment in fundraising with expenditure rising by five per cent to £79 million, considerably faster than the rate of inflation. Almost 1,200 professionals are now employed across the sector to support fundraising.
Very large gifts are an important driver of the sector new funds secured and cash income received aggregates (for example the Coutts Million Pound Donor Report for 2012 shows that universities received 54 per cent of all million pound gifts in that year).
Alumni making donations rose to a new high of almost 170,000, a five per cent increase over 2010-11, despite the end of the Matched Funding Scheme. The Higher Education sector can also make a strong case to non-alumni for philanthropic investment, both in the UK and internationally. The number of non-alumni donors rose in 2011-12 by 11 per cent, to another new high of almost 44,000.
An important component of giving is the flow of cash received from legacies. The data received this year (not explicitly shown in this summary report) show that in 2011-12 this amounted to £62 million or 11 per cent of total cash received. However this area of funding remains for many institutions an untapped long term opportunity (for example one leading medical research charity received £137 million from legacies over the same period, more than twice the amount received by the entire HE sector, covered by this survey, as a whole).
4 The different between ‘funds secured’ and ‘cash income received’ is explained in chapter 2. 5 The Council for Aid to Education (CAE) Voluntary Support of Education Survey is the authoritative source of information on private giving to higher education and private independent schools in the USA.
NatCen Social Research | Giving to Excellence: Generating Philanthropic Support for UK Higher Education 2011-12
3
There may be a number of factors at play in the significant increase (from 22p to 36p) in the median cost per pound cash income received. As indicated below, analysis by mission group and other groupings shows significant variation across the sector on a number of measures, this one included. In addition, many institutions invested more in 2011-12 than in 2010-11 and, as indicated elsewhere in this report it can be some years before that investment is reflected in increased new funds secured and cash received. The median sector figure has been in this bracket before (33p in 2007-08) and subsequently fallen back to around 24p for every pound raised.
Variations in Performance
Behind these aggregate measures there is, as in previous years, considerable variation in performance between institutions – and as shown in Figure 2.4 and Figure 2.5 for individual institutions year to year. This can be seen in the significant difference between the mean and the median for each of the broad measures of performance.
In previous survey reports these differences have been described by reference to the established university mission groups (e.g. the Russell Group, the 1994 Group, etc.). This year’s report continues that tradition but it has become increasingly clear that this segmentation is becoming less useful for two reasons: first the mission groups themselves are no longer stable in membership; second, there is significant variation in performance within the mission groups. The Pearce Review noted these difficulties and looked at alternative groupings. Analysts from More Partnership decided to reference institutional age in relation to fundraising performance rather than mission group on the basis that both institutional and performance characteristics were better aligned through this grouping.
In this year’s report NatCen Social Research have taken this analysis a step further, using the statistical technique of ‘Latent Class Analysis’ to discover whether there are communities of universities that share similar fundraising characteristics based on the three years of data recorded by this year’s survey (i.e. 2009-10, 2010-11, 2011-12). The analysis revealed five communities of universities (including the eight FE respondents) with a clear progression of fundraising performance across them. The detailed results of this analysis are presented in Chapter 3 of the report. The Editorial Board hope that this analysis will encourage more informed discussion and research within the sector on the factors that influence good fundraising performance and the ways in which institutions can progressively improve that performance over time. Partly because this analysis is new and partly because institutions were not informed that such an analysis would be undertaken, we are not publishing the names of institutions in each of the communities with the exception of the best performing community (where the published data reports already highlight this subset).
The best performing community of ‘Elite fundraising programmes’ consists of the University of Oxford and the University of Cambridge, which together raised 45 per cent of the total new funds secured in 2011-12. This proportion appears to be stable; other universities are therefore sharing in the overall growth of philanthropic giving to HE.
A small group of eight Russell Group Universities are in the second best performing group of ‘Established fundraising programmes’. They had median new funds secured in 2011-12 of £23.2 million and more than twice as many alumni donors as the next community. The median spend on fundraising at almost £1.4 million was also twice as much as the group below, but they appear to have passed the threshold of an economy of scale in which their income /cost ratio is
4 NatCen Social Research | Giving to Excellence: Generating Philanthropic Support for UK Higher Education 2011-12
close to that achieved by the University of Oxford and the University of Cambridge.
The largest numbers of institutions are grouped in the next two communities: ‘Moderate fundraising programmes’ and ‘Emerging fundraising programmes’. The community of moderate programmes includes 13 Russell Group universities, eight from the 1994 Group, one from the University Alliance and 16 institutions that are not aligned with any mission group. Median new funds secured were £3.3 million (with a mean of £4.7 million indicating that the best of this group were significantly ahead of the worst). On average their fundraising programmes were newer than in the ‘Established’ community with only 55 per cent having been established for more than ten years, compared to 88 per cent in the ‘Established’ group.
The ‘Emerging fundraising programmes’ community is the largest numerically, consisting of 89 institutions drawn from every HE mission group and those which belong to no mission group. The eight FE respondents also fall into this performance grouping. For many in this group their fundraising programmes are relatively new and the number of fundraising staff is frequently low (with a median value of three). Given the size of the group there is a wider spread of performance with mean new funds secured at just over £0.5 million and a median value of £0.2 million. Despite these relatively low numbers, this group raised significantly more than they spent on fundraising, on average.
Finally, there are six institutions in the poorest performing community, ’Fragile fundraising programmes’. Many of these programmes were established relatively recently and in some cases institutions are investing more than they are currently receiving (a situation typical of a ‘start-up’ fundraising operation). In future years we would expect these programmes either to begin yielding positive results that would allow institutions to move up to the ‘Emerging fundraising programmes’ cluster or to shut down. It is indicative of the maturity and sophistication of HE fundraising as a whole that there are only six universities in this position out of the 143 respondents to this survey.
Conclusion
This annual survey of fundraising performance across the HE sector has become a valuable tool for government, for commentators on Higher Education and most of all for the participating institutions. However in order to retain its usefulness the Editorial Board have concluded that further development is required:
It has become increasingly clear that for the survey to provide a full benchmarking service to participants it needs to be more detailed, and it needs flexible on-line benchmarking tools that can be used whenever they are required. To this end the survey is being redesigned for the 2012-13 year and will incorporate these features, which are being developed in consultation with representative users.
The survey reports on facts and this Commentary, prepared by experienced practitioners, describes the trends that those facts seem to reveal. However there is, as was noted by the Pearce Review, a need for more in-depth research into philanthropy in the UK. Whilst some of this could be informed by the availability of more granular survey results in the future, we also need to understand more systematically the factors that drive philanthropic decisions, the impact that gifts make and drivers of relative performance between institutions and over time. This understanding will be even more critical for an HE sector facing significant change in its relationship with future alumni (most of whom will have paid
NatCen Social Research | Giving to Excellence: Generating Philanthropic Support for UK Higher Education 2011-12
5
much higher fees than their predecessors) and Government (who are re-ordering their spending priorities for HE within a reduced overall public spending total). As alumni and other donors become more important to the future of so many of our universities, the sector needs to understand more about alumni and other donor motivations and how their support can be won and sustained for the long term.
6 NatCen Social Research | Giving to Excellence: Generating Philanthropic Support for UK Higher Education 2011-12
1 Introduction
1.1 The Ross Group and CASE The Council for Advancement and Support of Education (CASE) is a professional association serving educational institutions and the advancement professionals who work on their behalf in alumni relations, communications, development, marketing and allied areas. The Ross Group Development Directors’ Forum is an independent support group of senior development directors involved in fundraising for higher education. Members come from HE institutions across England, Scotland and Northern Ireland; membership is by invitation of the group. The Ross Group has helped fund the Ross-CASE Survey over a number of years and works closely with CASE to develop and promote the survey.
1.2 About the survey This report presents findings from the 2011-12 Ross-CASE Survey of charitable giving to universities and further education institutions. The survey was conducted by NatCen Social Research for the Ross Group and CASE. The first Ross-CASE Survey was carried out in 2002 and has been repeated annually since then. The methodology of the 2011-12 survey was very similar to that of its predecessors. Vice-chancellors and Ross-CASE Survey contacts were contacted about the start of the survey. The questionnaire was for the most part unchanged and involved the self-completion of an Excel Spreadsheet. One exception to this was the removal of questions and references to the Matched Funding Scheme from the questionnaire and Reporting Rules to reflect the end of the Matched Funding Scheme in England. In total, 143 institutions participated in the survey. The submitted data was checked by NatCen Social Research. Analysis was carried out by NatCen using PASW for Windows (formerly known as SPSS for Windows). A detailed description of the survey methodology can be found in Appendix A. The Reporting Rules can be found at the Ross-CASE website6.
1.2.1 Who responded to the survey? The response rate to the Ross-CASE Survey among English HEIs fell to 87 per cent in 2011-12 (compared with 97 per cent in 2010-11). This decline can be attributed to the end of the Matched Funding Scheme in England. Previously, the completion of the survey had been a mandatory requirement for those participating in the scheme. A similar pattern was observed in Wales with 70 per cent of Welsh HEIs participating in the survey in 2011-12, compared with 100 per cent in 2010-11. Again this corresponds with the end of the Matched Funding Scheme in Wales. The response rate among Scottish and Northern Irish HEIs fell to 52 per cent (compared with 67 per cent in 2010-11). This was higher than the 42 per cent achieved in 2008-9 but lower than all other years.
6 This can be found at http://www.rosscasesurvey.org.uk/
NatCen Social Research | Giving to Excellence: Generating Philanthropic Support for UK Higher Education 2011-12
7
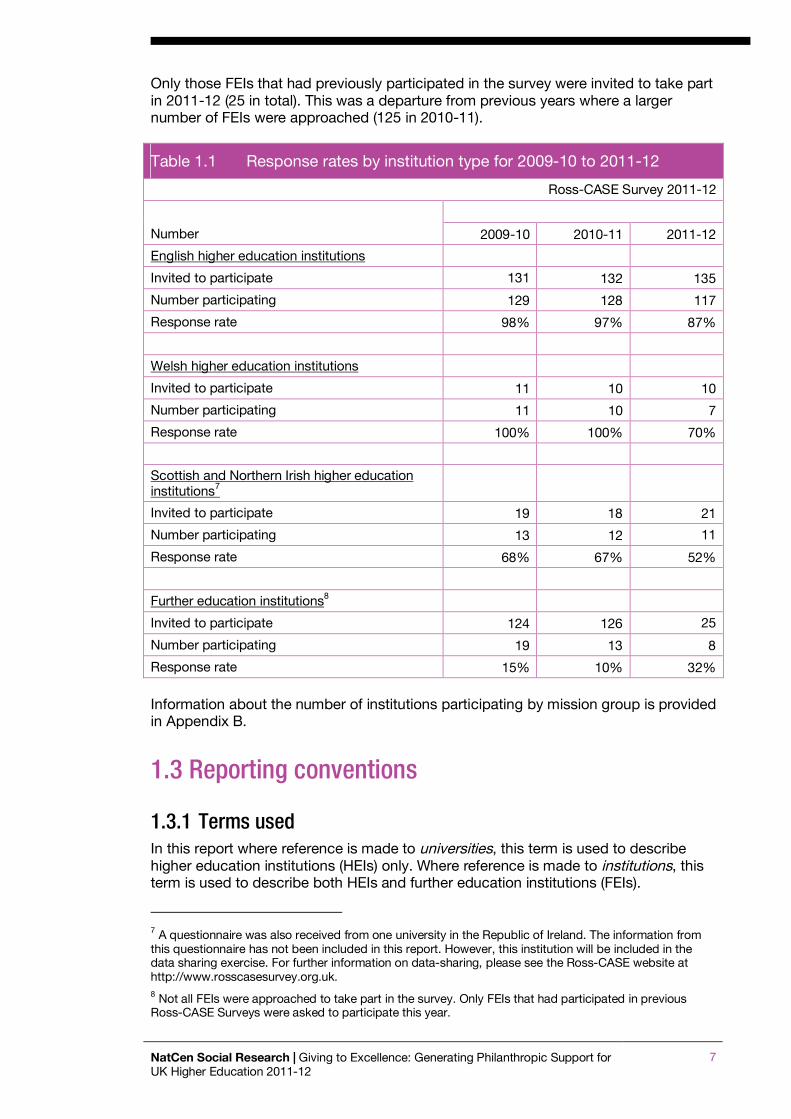
Only those FEIs that had previously participated in the survey were invited to take part in 2011-12 (25 in total). This was a departure from previous years where a larger number of FEIs were approached (125 in 2010-11).
Table 1.1 Response rates by institution type for 2009-10 to 2011-12
Ross-CASE Survey 2011-12
Number 2009-10 2010-11 2011-12
English higher education institutions
Invited to participate 131 132 135
Number participating 129 128 117
Response rate 98% 97% 87%
Welsh higher education institutions
Invited to participate 11 10 10
Number participating 11 10 7
Response rate 100% 100% 70%
Scottish and Northern Irish higher education institutions7
Invited to participate 19 18 21
Number participating 13 12 11
Response rate 68% 67% 52%
Further education institutions8
Invited to participate 124 126 25
Number participating 19 13 8
Response rate 15% 10% 32%
Information about the number of institutions participating by mission group is provided in Appendix B.
1.3 Reporting conventions
1.3.1 Terms used In this report where reference is made to universities, this term is used to describe higher education institutions (HEIs) only. Where reference is made to institutions, this term is used to describe both HEIs and further education institutions (FEIs).
7 A questionnaire was also received from one university in the Republic of Ireland. The information from this questionnaire has not been included in this report. However, this institution will be included in the data sharing exercise. For further information on data-sharing, please see the Ross-CASE website at http://www.rosscasesurvey.org.uk. 8 Not all FEIs were approached to take part in the survey. Only FEIs that had participated in previous Ross-CASE Surveys were asked to participate this year.
8 NatCen Social Research | Giving to Excellence: Generating Philanthropic Support for UK Higher Education 2011-12
Where references are made to universities or institutions, this relates to those universities and/or institutions that participated in the 2011-12 survey, rather than all universities or institutions. Many figures are broken down by the length of the fundraising programme. Where this occurs, programmes described as ‘established’ began before 2001, those described as ‘developing’ were established between 2001 and 2007, and those described as ‘newer’ were established in 2008 or later. There have been some changes in the mission groups since the 2010-11 Ross-CASE Survey and these changes are reflected in this report. A list of which universities are included in each mission group is shown in Appendix B.
1.3.2 Comparisons across years Where figures from previous years are used, these are derived from the data submitted in the 2011-12 Ross-CASE Survey returns only. (The 2011-12 survey asked respondents for information relating to the 2011-12 and two previous financial years). On occasion these figures differ slightly from those published in the previous reports on the 2009-10 and 2010-11 surveys. Some institutions have made improvements to their record keeping since the survey began, and have supplied corrections to returns from previous years. Hence it is believed the historical data supplied in the 2011-12 survey is more accurate than that supplied in previous years. Another reason for differences in the figures between survey reports is that the list of responding institutions changes between surveys. The University of Oxford and the University of Cambridge have been excluded from several of the tables presented in the report because the amount they receive in philanthropic gifts is so much larger than other universities, their findings can disguise trends within the rest of the sector. Where trend data are presented, often reference is made to a percentage change between two figures. These percentage changes have been calculated on the precise figures, rather than the rounded figures used in the report. Hence they may vary slightly from calculations completed using rounded figures. It is possible that the change in the mix of institutions responding could affect our total estimates. Therefore, we have also analysed the total for new funds secured and cash income received by those institutions that responded in this year’s survey and the Ross-CASE Survey in 2010-11. This is explicitly highlighted where this is the case. For most measures the change in the mix of survey respondents has not had any substantial impact on the estimates, or on the interpretation of the results.
1.3.3 Reporting percentages For a small number of questions the results are presented as the proportions of all respondents giving certain answers. For these questions a zero indicates at least one respondent but less than half of one per cent of all respondents gave an answer. A hyphen indicates no respondents gave that answer.
NatCen Social Research | Giving to Excellence: Generating Philanthropic Support for UK Higher Education 2011-12
9
1.3.4 Minimum sub-group size NatCen place great importance on protecting the confidentiality of responses from individual institutions. Hence aggregate figures have not been presented where the group being analysed comprises fewer than six institutions. An exception to this is the Oxbridge group that consists of only two universities which have agreed to their data being presented in this manner.
1.4 Acknowledgements First and foremost we would like to thank the university and further education institution staff who gave up their time to provide information about the philanthropic income of their institutions. We are grateful to HEFCE, Higher Education Funding Council for Wales (HEFCW) and the Ross Group for funding this study. For the report of the findings of the 2011-12 survey, the Ross Group appointed a dedicated Editorial Board that has worked with NatCen on the Ross-CASE Survey report. Members of the Board currently are: Ross Group members Fran Shepherd, Tania Jane Rawlinson, Chris Cox and Michelle Calvert; Executive Director of CASE Europe, Kate Hunter; and emeritus Ross Group member Peter Agar. We are very grateful to them all for their guidance and support. In addition, we are grateful to HEFCE for supplying us with a list of relevant UK institutions; and to CASE for their involvement in the survey. We are also grateful to the More Partnership for advising us on institution groupings used for the HEFCE Review of Philanthropy in UK Higher Education (Pearce Review).9 Within NatCen we are immensely grateful to Catherine O’Donnell and Hannah Silvester who provided valuable administrative support; and to Jenny Chanfreau for her guidance and support during the analysis process. We are also grateful to our telephone interviewers who assisted us in maximising the number of questionnaires returned.
9 More Partnership (July 2012). Review of Philanthropy in UK Higher Education: 2012 Status Report and Challenges for the Next Decade. Available at http://www.hefce.ac.uk/media/hefce/content/pubs/indirreports/2012/philanthropyinukhe/HEFCE%20Philanthropy%20Report.pdf (Accessed 27 March 2013)
10 NatCen Social Research | Giving to Excellence: Generating Philanthropic Support for UK Higher Education 2011-12
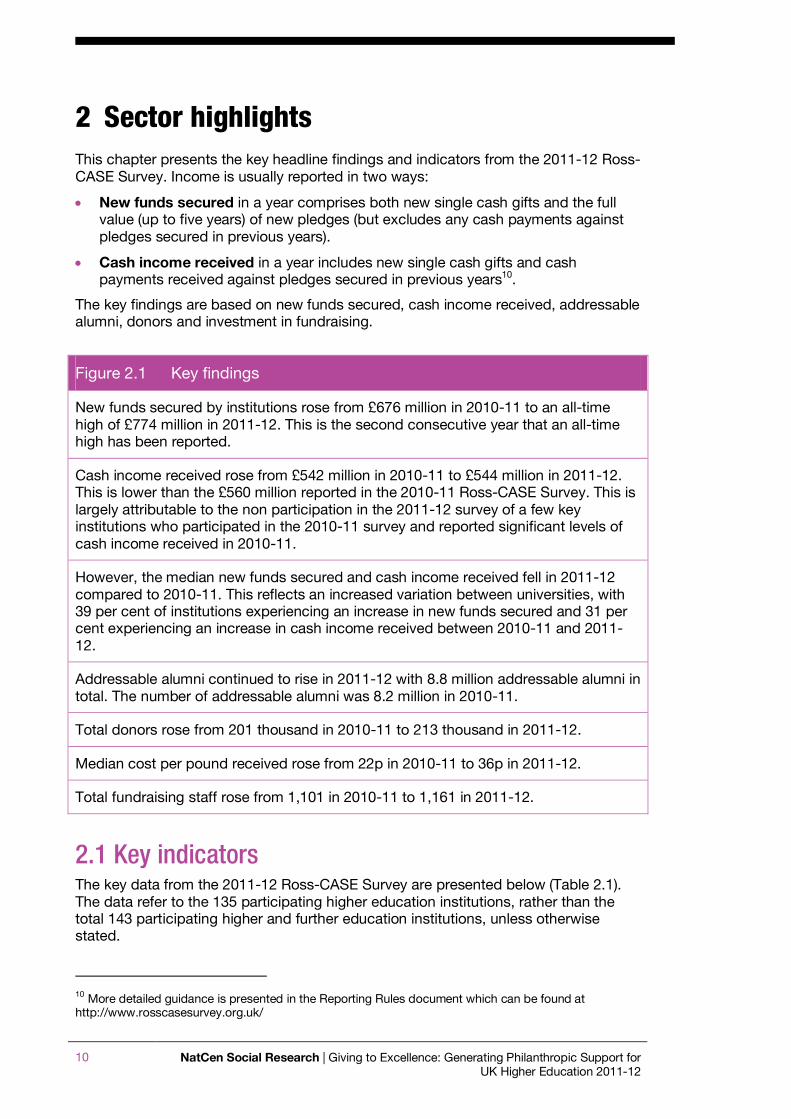
2 Sector highlights This chapter presents the key headline findings and indicators from the 2011-12 Ross-CASE Survey. Income is usually reported in two ways:
New funds secured in a year comprises both new single cash gifts and the full value (up to five years) of new pledges (but excludes any cash payments against pledges secured in previous years).
Cash income received in a year includes new single cash gifts and cash payments received against pledges secured in previous years10.
The key findings are based on new funds secured, cash income received, addressable alumni, donors and investment in fundraising.
Figure 2.1 Key findings
New funds secured by institutions rose from £676 million in 2010-11 to an all-time high of £774 million in 2011-12. This is the second consecutive year that an all-time high has been reported.
Cash income received rose from £542 million in 2010-11 to £544 million in 2011-12. This is lower than the £560 million reported in the 2010-11 Ross-CASE Survey. This is largely attributable to the non participation in the 2011-12 survey of a few key institutions who participated in the 2010-11 survey and reported significant levels of cash income received in 2010-11.
However, the median new funds secured and cash income received fell in 2011-12 compared to 2010-11. This reflects an increased variation between universities, with 39 per cent of institutions experiencing an increase in new funds secured and 31 per cent experiencing an increase in cash income received between 2010-11 and 2011-12.
Addressable alumni continued to rise in 2011-12 with 8.8 million addressable alumni in total. The number of addressable alumni was 8.2 million in 2010-11.
Total donors rose from 201 thousand in 2010-11 to 213 thousand in 2011-12.
Median cost per pound received rose from 22p in 2010-11 to 36p in 2011-12.
Total fundraising staff rose from 1,101 in 2010-11 to 1,161 in 2011-12.
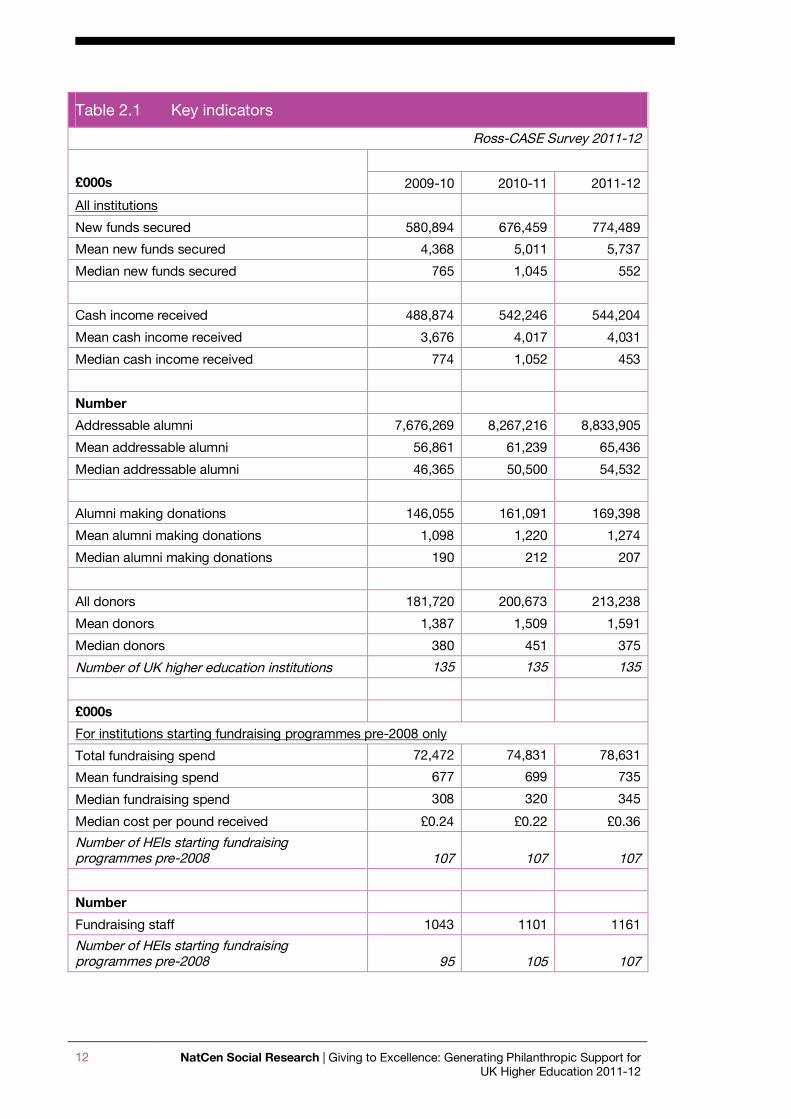
2.1 Key indicators The key data from the 2011-12 Ross-CASE Survey are presented below (Table 2.1). The data refer to the 135 participating higher education institutions, rather than the total 143 participating higher and further education institutions, unless otherwise stated.
10 More detailed guidance is presented in the Reporting Rules document which can be found at http://www.rosscasesurvey.org.uk/
NatCen Social Research | Giving to Excellence: Generating Philanthropic Support for UK Higher Education 2011-12
11
Please note that all data has been taken from the 2011-12 survey, which was compiled using the three-year self-reported returns submitted by each participant in this survey (with the exception of staff numbers).
12 NatCen Social Research | Giving to Excellence: Generating Philanthropic Support for UK Higher Education 2011-12
Table 2.1 Key indicators
Ross-CASE Survey 2011-12
£000s 2009-10 2010-11 2011-12
All institutions
New funds secured 580,894 676,459 774,489
Mean new funds secured 4,368 5,011 5,737
Median new funds secured 765 1,045 552
Cash income received 488,874 542,246 544,204
Mean cash income received 3,676 4,017 4,031
Median cash income received 774 1,052 453
Number
Addressable alumni 7,676,269 8,267,216 8,833,905
Mean addressable alumni 56,861 61,239 65,436
Median addressable alumni 46,365 50,500 54,532
Alumni making donations 146,055 161,091 169,398
Mean alumni making donations 1,098 1,220 1,274
Median alumni making donations 190 212 207
All donors 181,720 200,673 213,238
Mean donors 1,387 1,509 1,591
Median donors 380 451 375
Number of UK higher education institutions 135 135 135
£000s
For institutions starting fundraising programmes pre-2008 only
Total fundraising spend 72,472 74,831 78,631
Mean fundraising spend 677 699 735
Median fundraising spend 308 320 345
Median cost per pound received £0.24 £0.22 £0.36
Number of HEIs starting fundraising programmes pre-2008 107 107 107
Number
Fundraising staff 1043 1101 1161
Number of HEIs starting fundraising programmes pre-2008 95 105 107
NatCen Social Research | Giving to Excellence: Generating Philanthropic Support for UK Higher Education 2011-12
13
2.2 University fundraising performance in 2011-12 In total, UK universities secured £774 million in new philanthropic funds in 2011-
12, an increase from the 2010-11 figure of £676 million. This figure is the sum of all new pledges, new cash gifts and gifts-in-kind, and a commonly used figure in counting campaign totals.
However, while the mean amount of new funds secured increased over the same period, the median amount of new funds secured decreased. This reflects the fact that the gap in new funds secured between the highest performing universities and the rest has increased.
The total amount of new funds secured by UK universities has increased by 14 per cent since 2010-11 and 33 per cent since 2009-10. Cash income received has increased by 11 per cent since 2009-10 but has remained stable since 2010-11. UK universities received £544 million in cash income received in 2011-12, up from £542 million in 2010-11.
For most survey measures in 2011-12 there was a very large variation in fundraising between universities, as in previous years. Very high figures continued to be reported by the largest and most established universities. For example, the University of Oxford and the University of Cambridge accounted for 45 per cent of the total new funds secured by UK universities in the year. This share has been relatively stable, standing at 45 per cent in 2010-11 according to this year’s survey returns. The Russell Group (excluding Oxbridge) experienced the largest increase of their share of total new funds secured, rising from 26 per cent in 2009-10 to 38 per cent in 2011-12. Over the three year period between 2009-10 and 2011-12, the shares of total new funds raised by 1994 Group (three per cent in 2009-10 to four per cent in 2011-12) and University Alliance Group (two per cent in 2009-10 to three per cent in 2011-12) have also remained stable. Higher education institutions not formally part of a mission group have experienced a decrease in their share (15 per cent in 2009-10 to ten per cent in 2011-12).
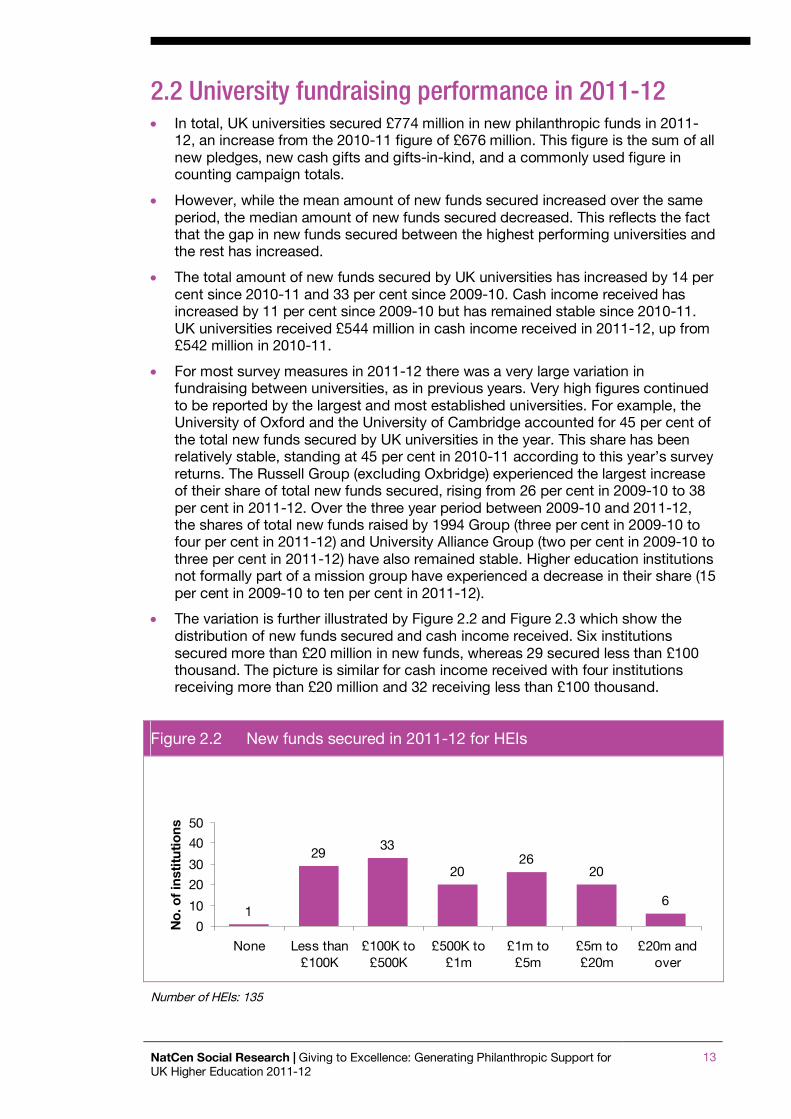
The variation is further illustrated by Figure 2.2 and Figure 2.3 which show the distribution of new funds secured and cash income received. Six institutions secured more than £20 million in new funds, whereas 29 secured less than £100 thousand. The picture is similar for cash income received with four institutions receiving more than £20 million and 32 receiving less than £100 thousand.
Figure 2.2 New funds secured in 2011-12 for HEIs
1
2933
2026
20
6
0
10
20
30
40
50
None Less than£100K
£100K to£500K
£500K to£1m
£1m to£5m
£5m to£20m
£20m andover
No
. of
inst
itu
tio
ns
Number of HEIs: 135
14 NatCen Social Research | Giving to Excellence: Generating Philanthropic Support for UK Higher Education 2011-12
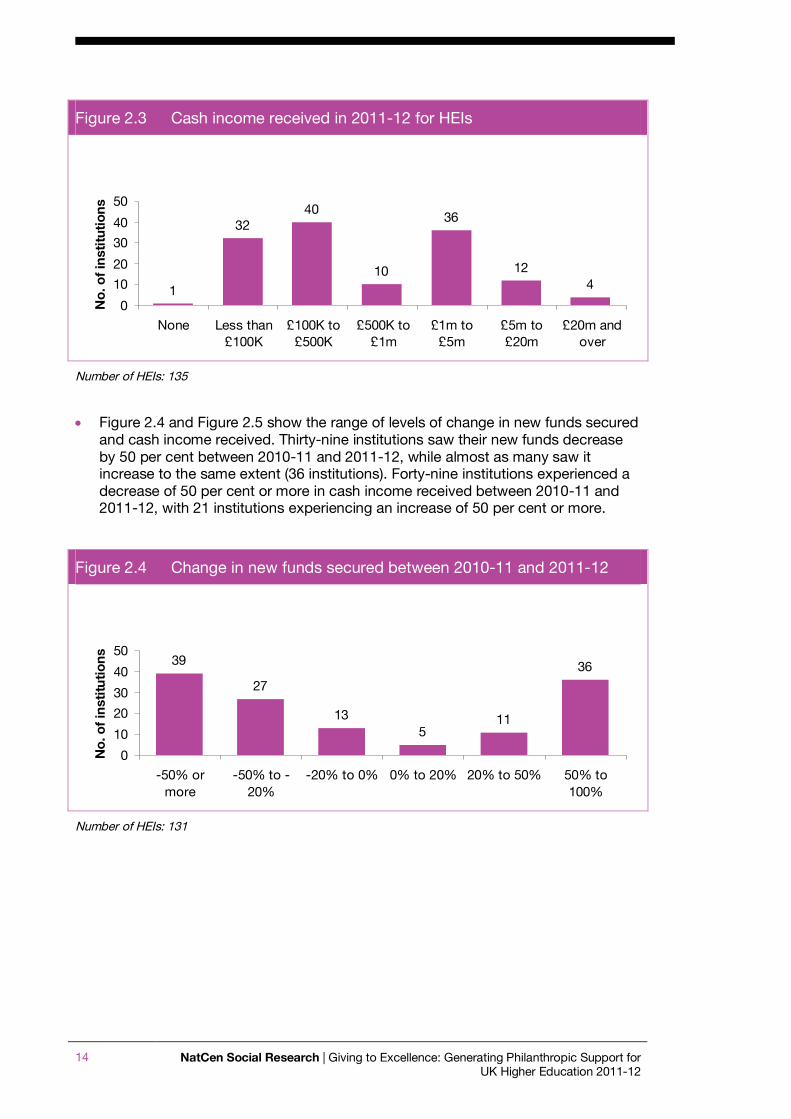
Figure 2.3 Cash income received in 2011-12 for HEIs
1
3240
10
36
124
0
10
20
30
40
50
None Less than£100K
£100K to£500K
£500K to£1m
£1m to£5m
£5m to£20m
£20m andover
No
. of
inst
itut
ion
s
Number of HEIs: 135
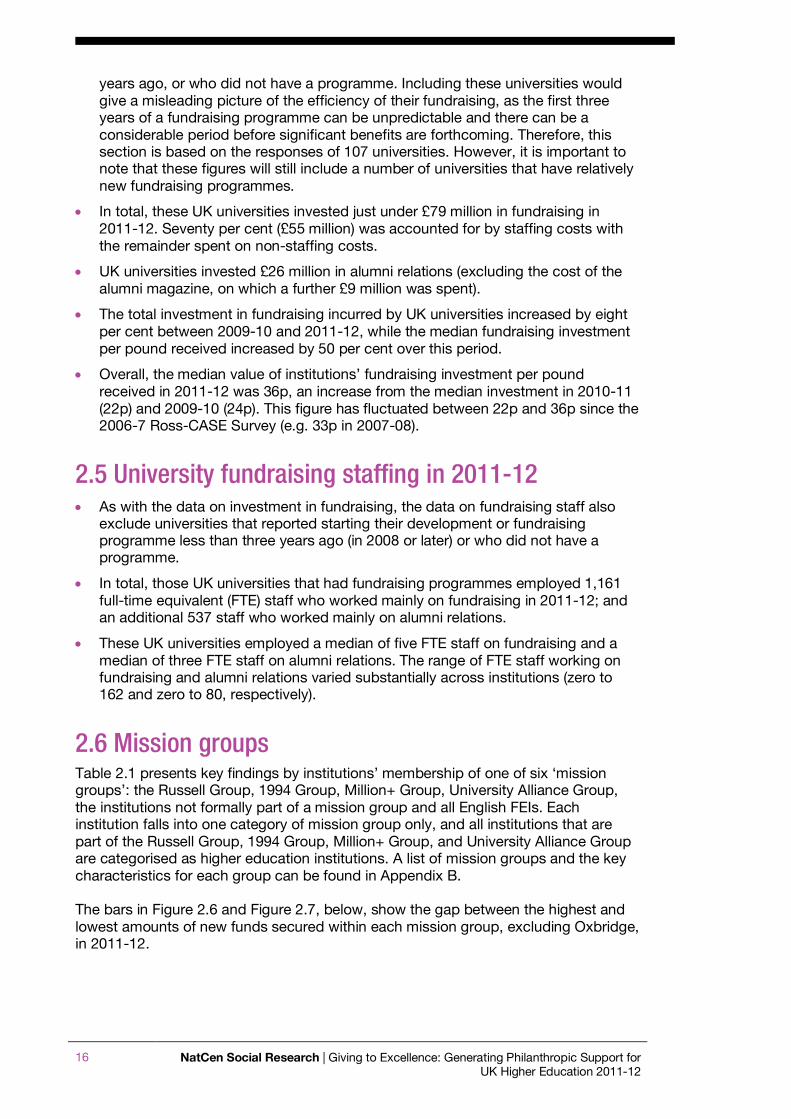
Figure 2.4 and Figure 2.5 show the range of levels of change in new funds secured and cash income received. Thirty-nine institutions saw their new funds decrease by 50 per cent between 2010-11 and 2011-12, while almost as many saw it increase to the same extent (36 institutions). Forty-nine institutions experienced a decrease of 50 per cent or more in cash income received between 2010-11 and 2011-12, with 21 institutions experiencing an increase of 50 per cent or more.
Figure 2.4 Change in new funds secured between 2010-11 and 2011-12
39
27
135
11
36
0
10
20
30
40
50
-50% ormore
-50% to -20%
-20% to 0% 0% to 20% 20% to 50% 50% to100%
No
. of
inst
ituti
on
s
Number of HEIs: 131

NatCen Social Research | Giving to Excellence: Generating Philanthropic Support for UK Higher Education 2011-12
15
Figure 2.5 Change in cash income received between 2010-11 and 2011-12
49
26
167
1321
0
10
20
30
40
50
-50% ormore
-50% to -20%
-20% to 0% 0% to 20% 20% to 50% 50% to100%
No
. of i
nst
itu
tion
s
Number of HEIs: 132
As a result of the large variation in fundraising between universities, the mean amounts of new funds secured were generally much higher than the median amounts. Therefore, median values are used as our preferred measure throughout the report, although some means are also provided.
The median value of new funds secured by universities fell from £1 million in 2010-11 to £552 thousand in 2011-12, despite an increase in total new funds secured across the sector.
2.3 Alumni and donor numbers In total, UK universities had just over 8.8 million addressable alumni in 2011-12, of
whom 169 thousand made a gift. The mean proportion of addressable alumni making a gift in 2011-12 was just over one per cent. Seven universities had greater than four per cent of alumni making a gift.
The mean numbers for addressable alumni and for addressable alumni making a gift in 2011-12 were generally much higher than the median amounts. The Russell Group, including Oxbridge, made up 37 per cent of total addressable alumni and 71 per cent of the total addressable alumni making a gift in 2011-12.
There has been significant growth in addressable alumni between 2009-10 and 2011-12. Alumni numbers grow in two distinct ways: through new graduates and through universities working to identify ‘lost’ alumni (i.e. those who are not in contact with the institution).
The total number of all donors who gave to universities was 213 thousand in 2011-12; an increase of six per cent since 2010-11; and an increase of 17 per cent since 2009-10. The proportion of the total number of donations made by alumni has remained stable at around 80 per cent of all donors.
2.4 University investment in fundraising in 2011-12 The summary figures on investment in fundraising exclude universities that
reported starting their development or fundraising programme less than three
16 NatCen Social Research | Giving to Excellence: Generating Philanthropic Support for UK Higher Education 2011-12
years ago, or who did not have a programme. Including these universities would give a misleading picture of the efficiency of their fundraising, as the first three years of a fundraising programme can be unpredictable and there can be a considerable period before significant benefits are forthcoming. Therefore, this section is based on the responses of 107 universities. However, it is important to note that these figures will still include a number of universities that have relatively new fundraising programmes.
In total, these UK universities invested just under £79 million in fundraising in 2011-12. Seventy per cent (£55 million) was accounted for by staffing costs with the remainder spent on non-staffing costs.
UK universities invested £26 million in alumni relations (excluding the cost of the alumni magazine, on which a further £9 million was spent).
The total investment in fundraising incurred by UK universities increased by eight per cent between 2009-10 and 2011-12, while the median fundraising investment per pound received increased by 50 per cent over this period.
Overall, the median value of institutions’ fundraising investment per pound received in 2011-12 was 36p, an increase from the median investment in 2010-11 (22p) and 2009-10 (24p). This figure has fluctuated between 22p and 36p since the 2006-7 Ross-CASE Survey (e.g. 33p in 2007-08).
2.5 University fundraising staffing in 2011-12 As with the data on investment in fundraising, the data on fundraising staff also
exclude universities that reported starting their development or fundraising programme less than three years ago (in 2008 or later) or who did not have a programme.
In total, those UK universities that had fundraising programmes employed 1,161 full-time equivalent (FTE) staff who worked mainly on fundraising in 2011-12; and an additional 537 staff who worked mainly on alumni relations.
These UK universities employed a median of five FTE staff on fundraising and a median of three FTE staff on alumni relations. The range of FTE staff working on fundraising and alumni relations varied substantially across institutions (zero to 162 and zero to 80, respectively).
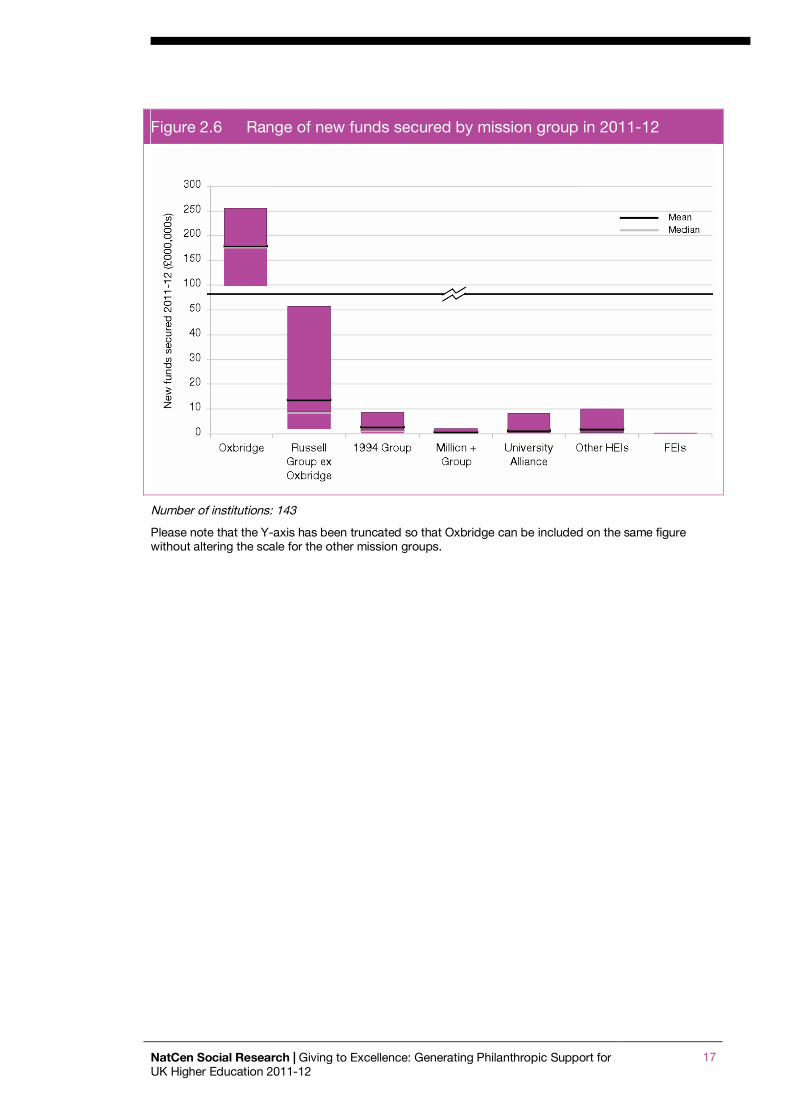
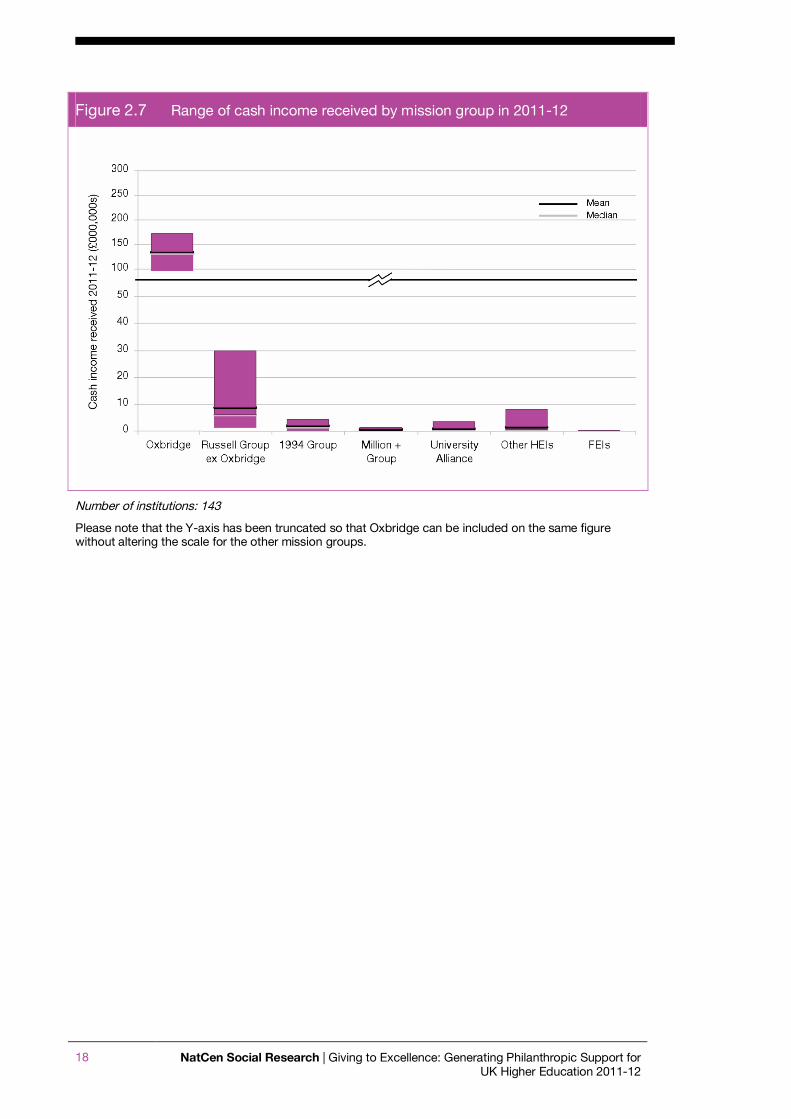
2.6 Mission groups Table 2.1 presents key findings by institutions’ membership of one of six ‘mission groups’: the Russell Group, 1994 Group, Million+ Group, University Alliance Group, the institutions not formally part of a mission group and all English FEIs. Each institution falls into one category of mission group only, and all institutions that are part of the Russell Group, 1994 Group, Million+ Group, and University Alliance Group are categorised as higher education institutions. A list of mission groups and the key characteristics for each group can be found in Appendix B. The bars in Figure 2.6 and Figure 2.7, below, show the gap between the highest and lowest amounts of new funds secured within each mission group, excluding Oxbridge, in 2011-12.
NatCen Social Research | Giving to Excellence: Generating Philanthropic Support for UK Higher Education 2011-12
17
Figure 2.6 Range of new funds secured by mission group in 2011-12
Number of institutions: 143
Please note that the Y-axis has been truncated so that Oxbridge can be included on the same figure without altering the scale for the other mission groups.
18 NatCen Social Research | Giving to Excellence: Generating Philanthropic Support for UK Higher Education 2011-12
Figure 2.7 Range of cash income received by mission group in 2011-12
Number of institutions: 143
Please note that the Y-axis has been truncated so that Oxbridge can be included on the same figure without altering the scale for the other mission groups.
NatCen Social Research | Giving to Excellence: Generating Philanthropic Support for UK Higher Education 2011-12
19
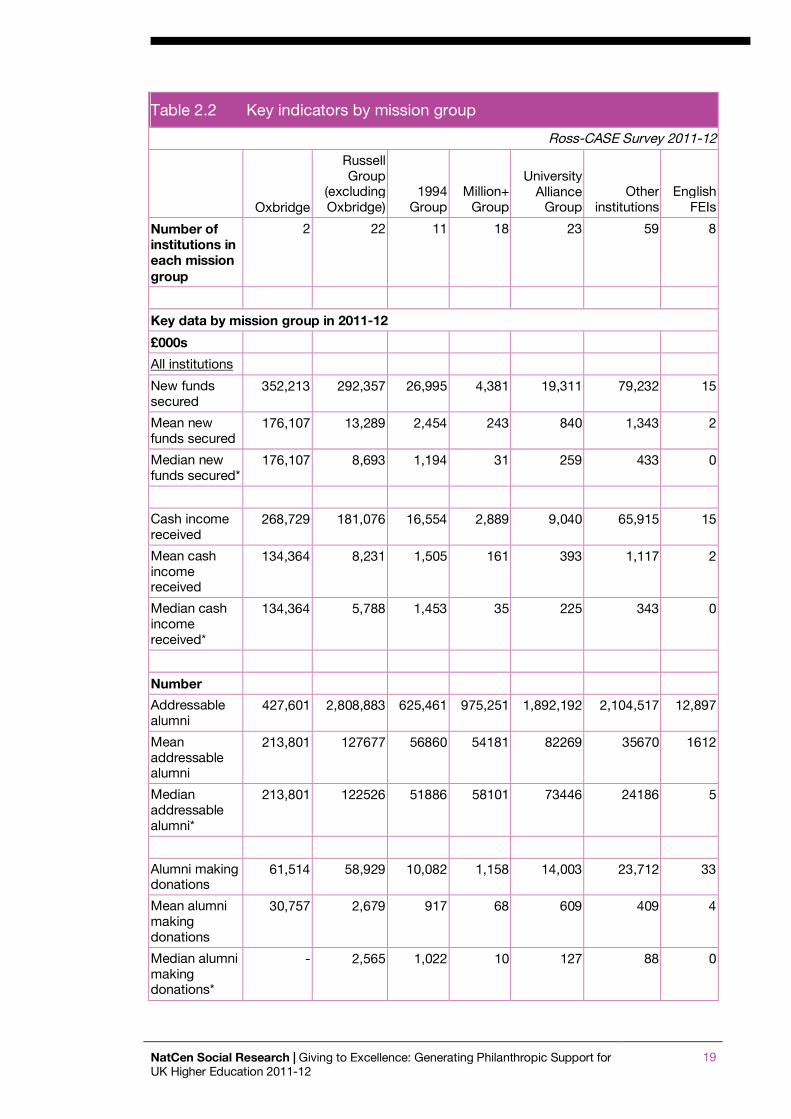
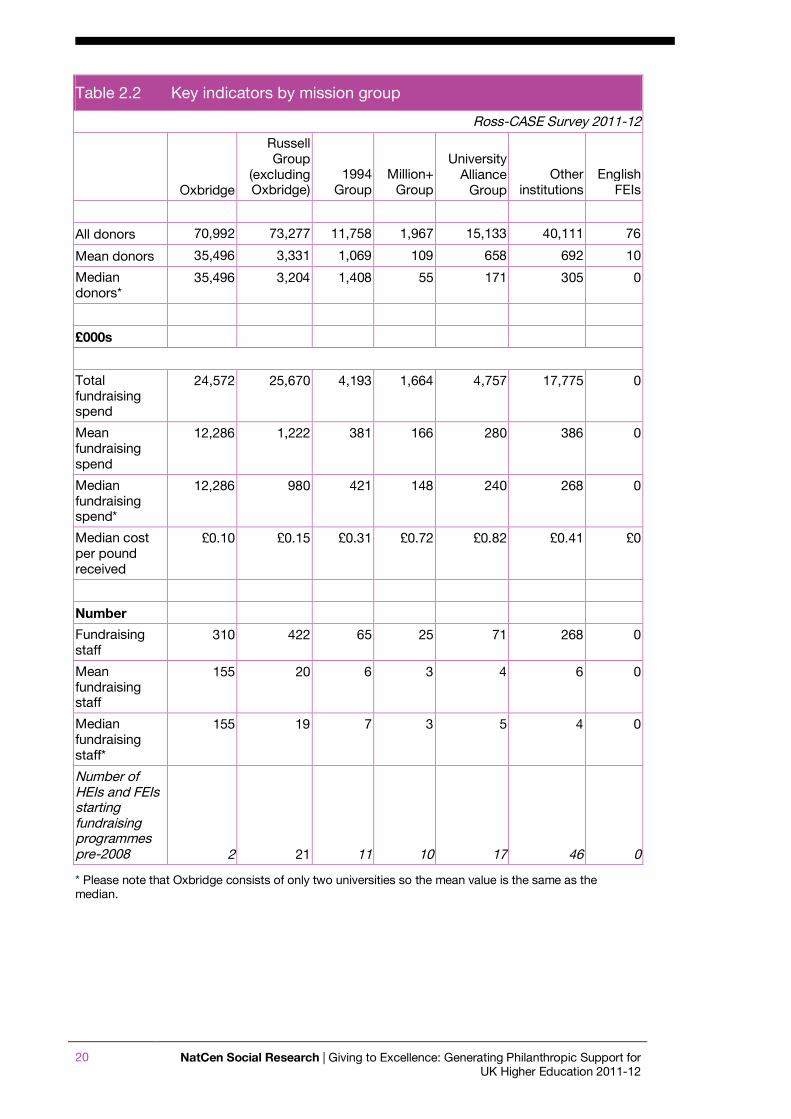
Table 2.2 Key indicators by mission group
Ross-CASE Survey 2011-12
Oxbridge
Russell Group
(excluding Oxbridge)
1994 Group
Million+ Group
University Alliance
Group Other
institutions English
FEIs
Number of institutions in each mission group
2 22 11 18 23 59 8
Key data by mission group in 2011-12
£000s
All institutions
New funds secured
352,213 292,357 26,995 4,381 19,311 79,232 15
Mean new funds secured
176,107 13,289 2,454 243 840 1,343 2
Median new funds secured*
176,107 8,693 1,194 31 259 433 0
Cash income received
268,729 181,076 16,554 2,889 9,040 65,915 15
Mean cash income received
134,364 8,231 1,505 161 393 1,117 2
Median cash income received*
134,364 5,788 1,453 35 225 343 0
Number
Addressable alumni
427,601 2,808,883 625,461 975,251 1,892,192 2,104,517 12,897
Mean addressable alumni
213,801 127677 56860 54181 82269 35670 1612
Median addressable alumni*
213,801 122526 51886 58101 73446 24186 5
Alumni making donations
61,514 58,929 10,082 1,158 14,003 23,712 33
Mean alumni making donations
30,757 2,679 917 68 609 409 4
Median alumni making donations*
- 2,565 1,022 10 127 88 0
20 NatCen Social Research | Giving to Excellence: Generating Philanthropic Support for UK Higher Education 2011-12
Table 2.2 Key indicators by mission group
Ross-CASE Survey 2011-12
Oxbridge
Russell Group
(excluding Oxbridge)
1994 Group
Million+ Group
University Alliance
Group Other
institutions English
FEIs
All donors 70,992 73,277 11,758 1,967 15,133 40,111 76
Mean donors 35,496 3,331 1,069 109 658 692 10
Median donors*
35,496 3,204 1,408 55 171 305 0
£000s
Total fundraising spend
24,572 25,670 4,193 1,664 4,757 17,775 0
Mean fundraising spend
12,286 1,222 381 166 280 386 0
Median fundraising spend*
12,286 980 421 148 240 268 0
Median cost per pound received
£0.10 £0.15 £0.31 £0.72 £0.82 £0.41 £0
Number
Fundraising staff
310 422 65 25 71 268 0
Mean fundraising staff
155 20 6 3 4 6 0
Median fundraising staff*
155 19 7 3 5 4 0
Number of HEIs and FEIs starting fundraising programmes pre-2008 2 21 11 10 17 46 0
* Please note that Oxbridge consists of only two universities so the mean value is the same as the median.
NatCen Social Research | Giving to Excellence: Generating Philanthropic Support for UK Higher Education 2011-12
21
3 Communities of universities As the previous section showed, institutions vary widely by their fundraising profile. In recent years, for Ross-CASE Survey analysis purposes institutions have been grouped by the mission group to which they belong. However, there is a substantial degree of variation within mission groups. In recent years, the membership of these groups has not remained static, making year on year comparisons more difficult. Moreover, a significant number of institutions are not affiliated to any mission group. In recognition of this, the Pearce Review11 proposed a new way of grouping institutions, separating out Oxbridge and specialist institutions and grouping the others by year of obtaining university status. The key data is presented by these groupings in Appendix C. Inspired by this, the Ross-CASE Survey wished to explore the possibility of uncovering ‘communities’ of universities that have a fundraising profile similar to each other. This analysis was conducted using Latent Class Analysis (LCA).
3.1 Typology of institutions LCA is a statistical approach used to group individuals or, in this case, institutions into different clusters according to how they answer a series of questions. Each cluster brings together institutions with the most similar answers to the selected questions. The questions listed in Figure 3.1 were chosen because they reflect the key characteristics of fundraising activities and also because they vary sufficiently between universities to use as a differentiating factor. LCA is typically carried out on datasets which represent a large number of cases. However, the size of the Ross-CASE Survey dataset is ultimately restricted by the number of institutions available to study. Given the small number of cases available, the number of questions used in the analysis was restricted to a handful that were considered to be the most informative. The seven variables used to cluster institutions are shown in Figure 3.1. The three-year averages were used to ensure that the results reflect the overall performance and not small annual fluctuations.
11 More Partnership (July 2012). Review of Philanthropy in UK Higher Education: 2012 Status Report and Challenges for the Next Decade. Available at http://www.hefce.ac.uk/media/hefce/content/pubs/indirreports/2012/philanthropyinukhe/HEFCE%20Philanthropy%20Report.pdf (Accessed 27 March 2013)
22 NatCen Social Research | Giving to Excellence: Generating Philanthropic Support for UK Higher Education 2011-12
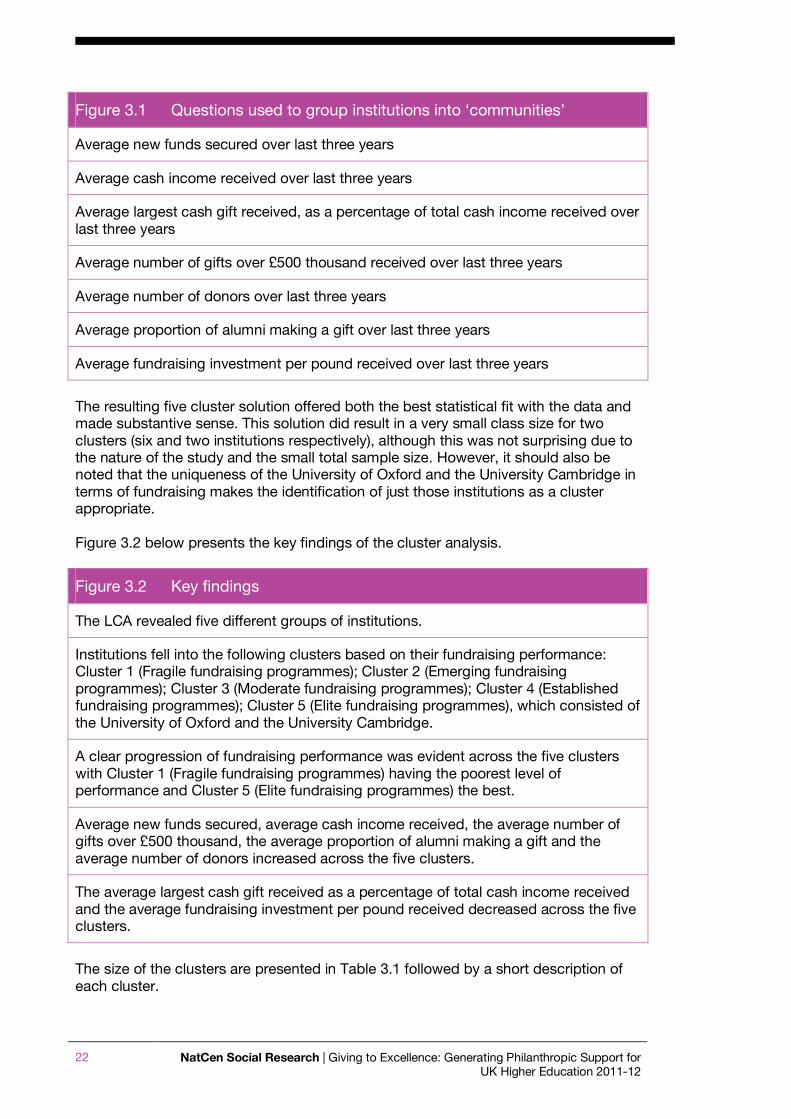
Figure 3.1 Questions used to group institutions into ‘communities’
Average new funds secured over last three years
Average cash income received over last three years
Average largest cash gift received, as a percentage of total cash income received over last three years
Average number of gifts over £500 thousand received over last three years
Average number of donors over last three years
Average proportion of alumni making a gift over last three years
Average fundraising investment per pound received over last three years
The resulting five cluster solution offered both the best statistical fit with the data and made substantive sense. This solution did result in a very small class size for two clusters (six and two institutions respectively), although this was not surprising due to the nature of the study and the small total sample size. However, it should also be noted that the uniqueness of the University of Oxford and the University Cambridge in terms of fundraising makes the identification of just those institutions as a cluster appropriate. Figure 3.2 below presents the key findings of the cluster analysis.
Figure 3.2 Key findings
The LCA revealed five different groups of institutions.
Institutions fell into the following clusters based on their fundraising performance: Cluster 1 (Fragile fundraising programmes); Cluster 2 (Emerging fundraising programmes); Cluster 3 (Moderate fundraising programmes); Cluster 4 (Established fundraising programmes); Cluster 5 (Elite fundraising programmes), which consisted of the University of Oxford and the University Cambridge.
A clear progression of fundraising performance was evident across the five clusters with Cluster 1 (Fragile fundraising programmes) having the poorest level of performance and Cluster 5 (Elite fundraising programmes) the best.
Average new funds secured, average cash income received, the average number of gifts over £500 thousand, the average proportion of alumni making a gift and the average number of donors increased across the five clusters.
The average largest cash gift received as a percentage of total cash income received and the average fundraising investment per pound received decreased across the five clusters.
The size of the clusters are presented in Table 3.1 followed by a short description of each cluster.
NatCen Social Research | Giving to Excellence: Generating Philanthropic Support for UK Higher Education 2011-12
23
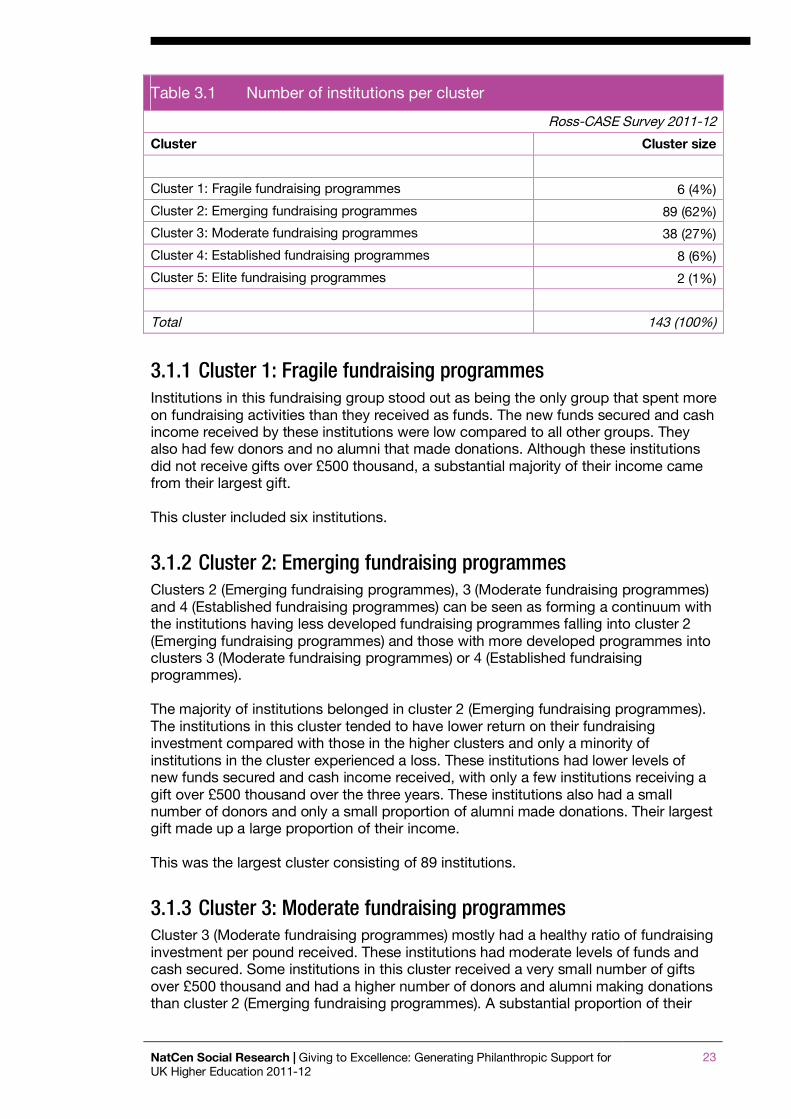
Table 3.1 Number of institutions per cluster
Ross-CASE Survey 2011-12
Cluster Cluster size
Cluster 1: Fragile fundraising programmes 6 (4%)
Cluster 2: Emerging fundraising programmes 89 (62%)
Cluster 3: Moderate fundraising programmes 38 (27%)
Cluster 4: Established fundraising programmes 8 (6%)
Cluster 5: Elite fundraising programmes 2 (1%)
Total 143 (100%)
3.1.1 Cluster 1: Fragile fundraising programmes Institutions in this fundraising group stood out as being the only group that spent more on fundraising activities than they received as funds. The new funds secured and cash income received by these institutions were low compared to all other groups. They also had few donors and no alumni that made donations. Although these institutions did not receive gifts over £500 thousand, a substantial majority of their income came from their largest gift. This cluster included six institutions.
3.1.2 Cluster 2: Emerging fundraising programmes Clusters 2 (Emerging fundraising programmes), 3 (Moderate fundraising programmes) and 4 (Established fundraising programmes) can be seen as forming a continuum with the institutions having less developed fundraising programmes falling into cluster 2 (Emerging fundraising programmes) and those with more developed programmes into clusters 3 (Moderate fundraising programmes) or 4 (Established fundraising programmes). The majority of institutions belonged in cluster 2 (Emerging fundraising programmes). The institutions in this cluster tended to have lower return on their fundraising investment compared with those in the higher clusters and only a minority of institutions in the cluster experienced a loss. These institutions had lower levels of new funds secured and cash income received, with only a few institutions receiving a gift over £500 thousand over the three years. These institutions also had a small number of donors and only a small proportion of alumni made donations. Their largest gift made up a large proportion of their income. This was the largest cluster consisting of 89 institutions.
3.1.3 Cluster 3: Moderate fundraising programmes Cluster 3 (Moderate fundraising programmes) mostly had a healthy ratio of fundraising investment per pound received. These institutions had moderate levels of funds and cash secured. Some institutions in this cluster received a very small number of gifts over £500 thousand and had a higher number of donors and alumni making donations than cluster 2 (Emerging fundraising programmes). A substantial proportion of their
24 NatCen Social Research | Giving to Excellence: Generating Philanthropic Support for UK Higher Education 2011-12
income came from their largest gift, although less so than cluster 2 (Emerging fundraising programmes). Thirty-eight institutions belong to this group.
3.1.4 Cluster 4: Established fundraising programmes Cluster 4 (Established fundraising programmes) consisted of institutions that had substantial levels of new funds secured and cash income received. These institutions had to invest little relative to the amount of money they secured. The institutions in this group tended to receive a greater number of gifts over £500 thousand and also had a higher number of donors and alumni that made donations. A substantial proportion of their income came from their largest gift but less so than in cluster 3 (Moderate fundraising programmes). This cluster was relatively small consisting of eight institutions.
3.1.5 Cluster 5: Elite fundraising programmes Cluster 5 (Elite fundraising programmes) consisted of institutions with elite fundraising programmes that were performing very well. This was the smallest cluster, consisting of only two HEIs (the University of Oxford and the University of Cambridge). Universities in this cluster performed significantly better than those in other clusters and represent a step change in fundraising programme. These universities had a similar ratio of fundraising investment per pound received as cluster 4 (Established fundraising programmes). They had substantial levels of new funds secured and cash income received. They clearly outperformed all other clusters both in terms of the number of gifts received over £500 thousand; and in overall donor numbers. It is notable that when comparing this cluster to the other four clusters, two subtly different points hold true: a higher proportion of their donors are alumni, and a higher proportion of their alumni are donors.
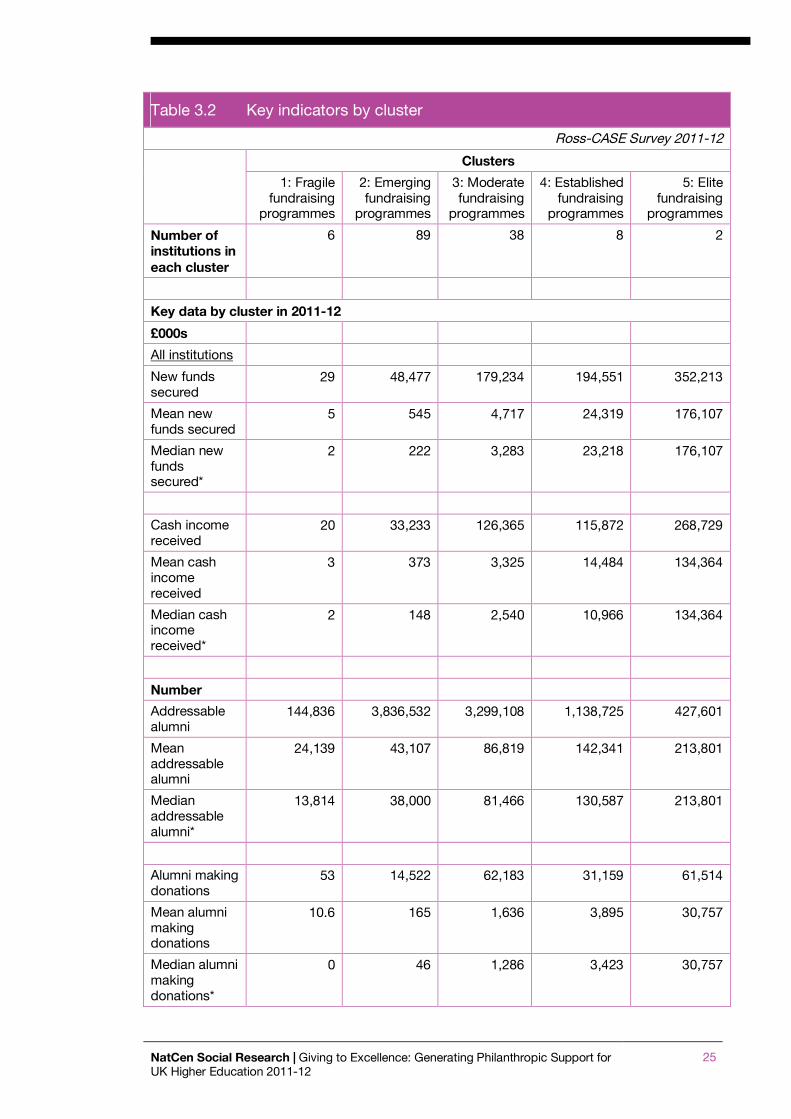
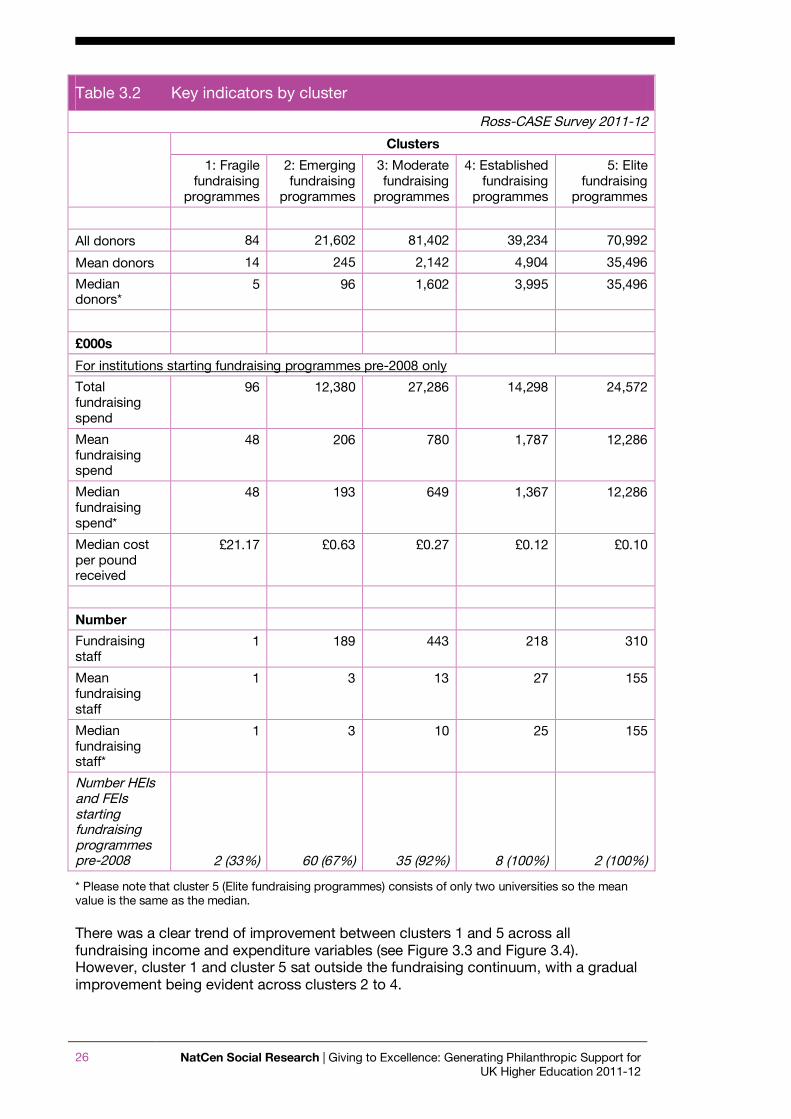
3.2 Analysis of clusters This section provides a more detailed analysis of how the clusters differ from each other. Table 3.2 illustrates the fundraising income and expenditure of institutions, by clusters. Cluster 1 had the lowest amount of median new funds secured (£2,300), median cash income received (£1,800) and the highest median cost per pound received (£21.17). Cluster 5 had the highest amounts of median new funds secured (£176 million) and median cash income received (£134 million). Clusters 4 and 5 had the lowest median cost per pound received (12p and 10p, respectively). Having a low median cost per pound received did not necessarily reflect total fundraising expenditure. Institutions in cluster 5 spent a median of £12 million despite having the lowest median cost per pound received. Conversely, institutions in cluster 1 spent the least on fundraising with a median cost of £47,60012.
12 Please note that figures shown for the fundraising spend and cost per pound are only shown for those institutions that started their fundraising programme before 2008.
NatCen Social Research | Giving to Excellence: Generating Philanthropic Support for UK Higher Education 2011-12
25
Table 3.2 Key indicators by cluster
Ross-CASE Survey 2011-12
Clusters
1: Fragile fundraising
programmes
2: Emerging fundraising
programmes
3: Moderate fundraising
programmes
4: Established fundraising
programmes
5: Elite fundraising
programmes
Number of institutions in each cluster
6 89 38 8 2
Key data by cluster in 2011-12
£000s
All institutions
New funds secured
29 48,477 179,234 194,551 352,213
Mean new funds secured
5 545 4,717 24,319 176,107
Median new funds secured*
2 222 3,283 23,218 176,107
Cash income received
20 33,233 126,365 115,872 268,729
Mean cash income received
3 373 3,325 14,484 134,364
Median cash income received*
2 148 2,540 10,966 134,364
Number
Addressable alumni
144,836 3,836,532 3,299,108 1,138,725 427,601
Mean addressable alumni
24,139 43,107 86,819 142,341 213,801
Median addressable alumni*
13,814 38,000 81,466 130,587 213,801
Alumni making donations
53 14,522 62,183 31,159 61,514
Mean alumni making donations
10.6 165 1,636 3,895 30,757
Median alumni making donations*
0 46 1,286 3,423 30,757
26 NatCen Social Research | Giving to Excellence: Generating Philanthropic Support for UK Higher Education 2011-12
Table 3.2 Key indicators by cluster
Ross-CASE Survey 2011-12
Clusters
1: Fragile fundraising
programmes
2: Emerging fundraising
programmes
3: Moderate fundraising
programmes
4: Established fundraising
programmes
5: Elite fundraising
programmes
All donors 84 21,602 81,402 39,234 70,992
Mean donors 14 245 2,142 4,904 35,496
Median donors*
5 96 1,602 3,995 35,496
£000s
For institutions starting fundraising programmes pre-2008 only
Total fundraising spend
96 12,380 27,286 14,298 24,572
Mean fundraising spend
48 206 780 1,787 12,286
Median fundraising spend*
48 193 649 1,367 12,286
Median cost per pound received
£21.17 £0.63 £0.27 £0.12 £0.10
Number
Fundraising staff
1 189 443 218 310
Mean fundraising staff
1 3 13 27 155
Median fundraising staff*
1 3 10 25 155
Number HEIs and FEIs starting fundraising programmes pre-2008 2 (33%) 60 (67%) 35 (92%) 8 (100%) 2 (100%)
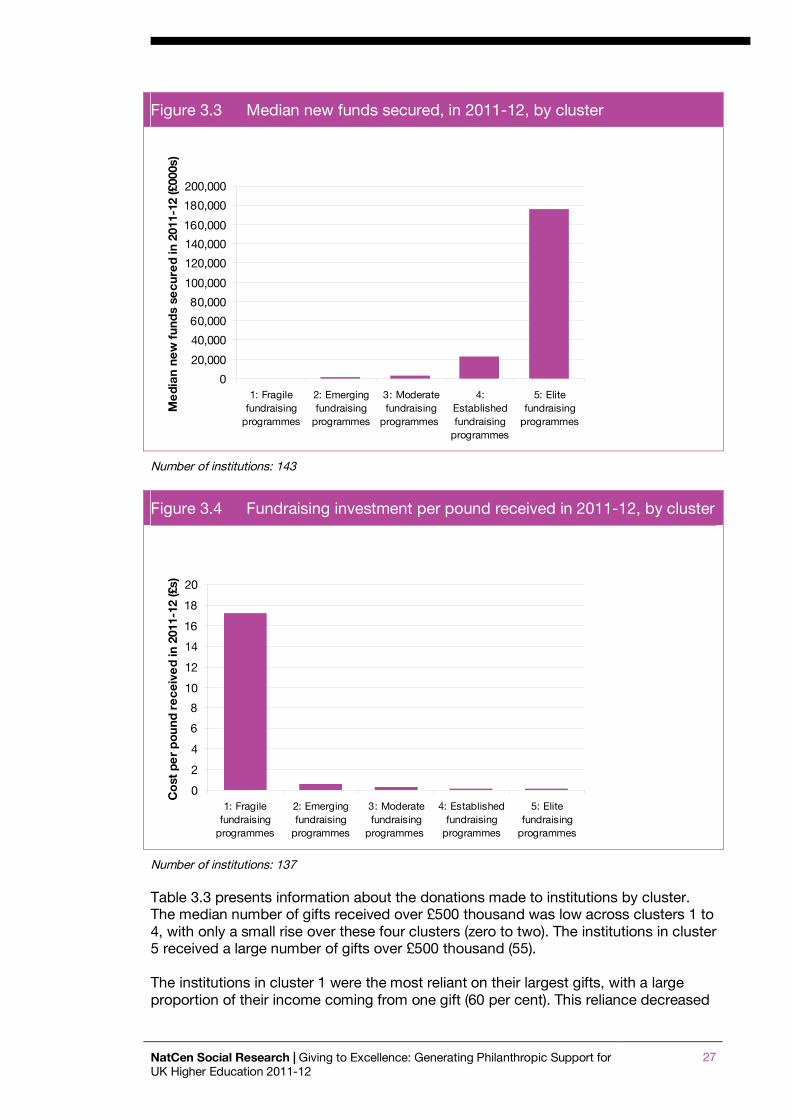
* Please note that cluster 5 (Elite fundraising programmes) consists of only two universities so the mean value is the same as the median. There was a clear trend of improvement between clusters 1 and 5 across all fundraising income and expenditure variables (see Figure 3.3 and Figure 3.4). However, cluster 1 and cluster 5 sat outside the fundraising continuum, with a gradual improvement being evident across clusters 2 to 4.
NatCen Social Research | Giving to Excellence: Generating Philanthropic Support for UK Higher Education 2011-12
27
Figure 3.3 Median new funds secured, in 2011-12, by cluster
0
20,000
40,000
60,000
80,000
100,000
120,000
140,000
160,000
180,000
200,000
1: Fragilefundraising
programmes
2: Emergingfundraising
programmes
3: Moderatefundraising
programmes
4:Establishedfundraising
programmes
5: Elitefundraising
programmes
Me
dian
new
fun
ds
secu
red
in 2
011-
12 (£
000s
)
Number of institutions: 143
Figure 3.4 Fundraising investment per pound received in 2011-12, by cluster
0
2
4
6
8
10
12
14
16
18
20
1: Fragilefundraising
programmes
2: Emergingfundraising
programmes
3: Moderatefundraising
programmes
4: Establishedfundraising
programmes
5: Elitefundraising
programmes
Co
st p
er
pou
nd r
ece
ive
d in
201
1-12
(£s)
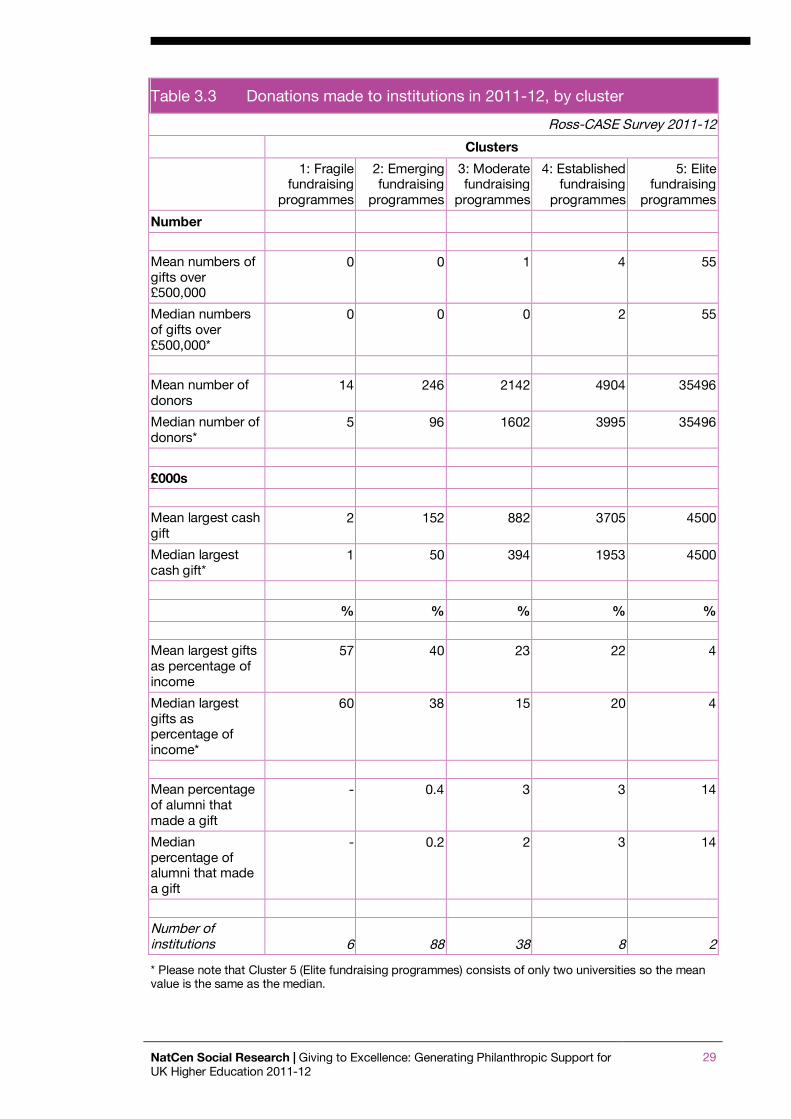
Number of institutions: 137 Table 3.3 presents information about the donations made to institutions by cluster. The median number of gifts received over £500 thousand was low across clusters 1 to 4, with only a small rise over these four clusters (zero to two). The institutions in cluster 5 received a large number of gifts over £500 thousand (55). The institutions in cluster 1 were the most reliant on their largest gifts, with a large proportion of their income coming from one gift (60 per cent). This reliance decreased
28 NatCen Social Research | Giving to Excellence: Generating Philanthropic Support for UK Higher Education 2011-12
across clusters 1 and 5 (60 per cent to four per cent). This is not surprising given the large number of gifts received in cluster 5. However, this was not a reflection of the size of the largest gift, with those in cluster 1 receiving the lowest median largest cash gift (£1,400) and cluster 5 receiving the highest (£4.5 million). The median proportion of alumni making donations increased between clusters 1 and 5 (zero per cent to 14 per cent). This indicates that institutions that performed better had more varied income sources.
NatCen Social Research | Giving to Excellence: Generating Philanthropic Support for UK Higher Education 2011-12
29
Table 3.3 Donations made to institutions in 2011-12, by cluster
Ross-CASE Survey 2011-12
Clusters
1: Fragile fundraising
programmes
2: Emerging fundraising
programmes
3: Moderate fundraising
programmes
4: Established fundraising
programmes
5: Elite fundraising
programmes
Number
Mean numbers of gifts over £500,000
0 0 1 4 55
Median numbers of gifts over £500,000*
0 0 0 2 55
Mean number of donors
14 246 2142 4904 35496
Median number of donors*
5 96 1602 3995 35496
£000s
Mean largest cash gift
2 152 882 3705 4500
Median largest cash gift*
1 50 394 1953 4500
% % % % %
Mean largest gifts as percentage of income
57 40 23 22 4
Median largest gifts as percentage of income*
60 38 15 20 4
Mean percentage of alumni that made a gift
- 0.4 3 3 14
Median percentage of alumni that made a gift
- 0.2 2 3 14
Number of institutions 6 88 38 8 2
* Please note that Cluster 5 (Elite fundraising programmes) consists of only two universities so the mean value is the same as the median.
30 NatCen Social Research | Giving to Excellence: Generating Philanthropic Support for UK Higher Education 2011-12
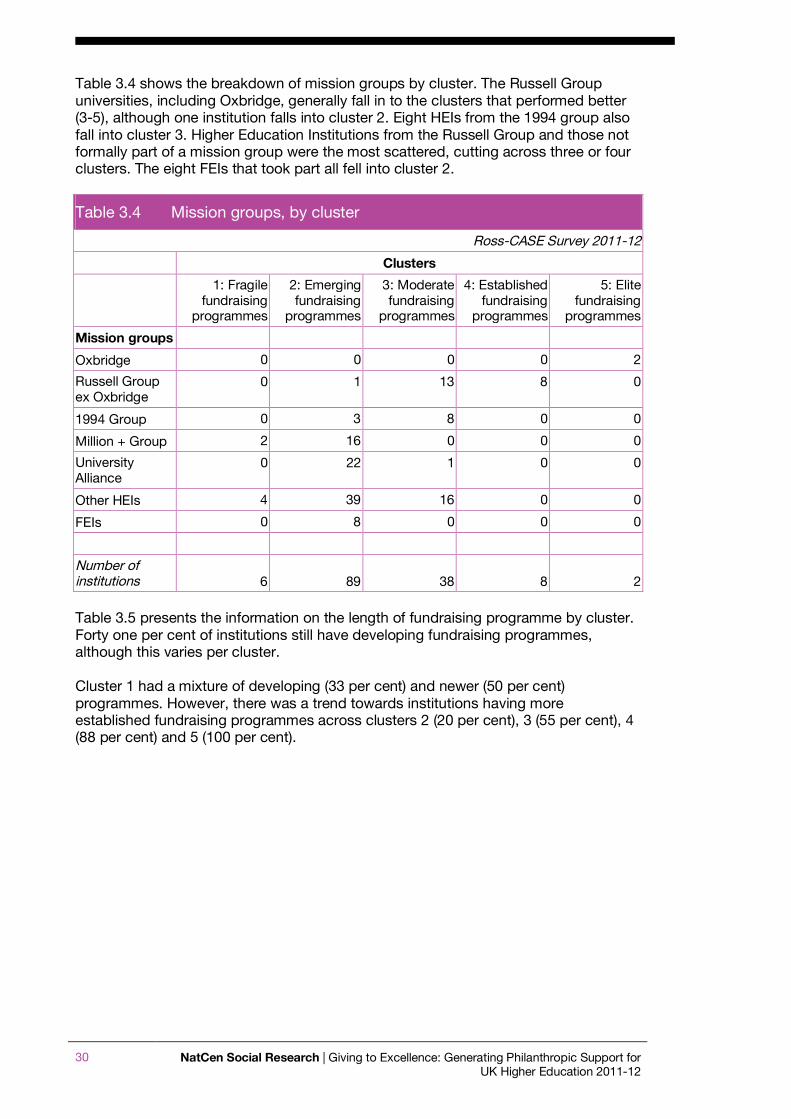
Table 3.4 shows the breakdown of mission groups by cluster. The Russell Group universities, including Oxbridge, generally fall in to the clusters that performed better (3-5), although one institution falls into cluster 2. Eight HEIs from the 1994 group also fall into cluster 3. Higher Education Institutions from the Russell Group and those not formally part of a mission group were the most scattered, cutting across three or four clusters. The eight FEIs that took part all fell into cluster 2.
Table 3.4 Mission groups, by cluster
Ross-CASE Survey 2011-12
Clusters
1: Fragile fundraising
programmes
2: Emerging fundraising
programmes
3: Moderate fundraising
programmes
4: Established fundraising
programmes
5: Elite fundraising
programmes
Mission groups
Oxbridge 0 0 0 0 2
Russell Group ex Oxbridge
0 1 13 8 0
1994 Group 0 3 8 0 0
Million + Group 2 16 0 0 0
University Alliance
0 22 1 0 0
Other HEIs 4 39 16 0 0
FEIs 0 8 0 0 0
Number of institutions 6 89 38 8 2
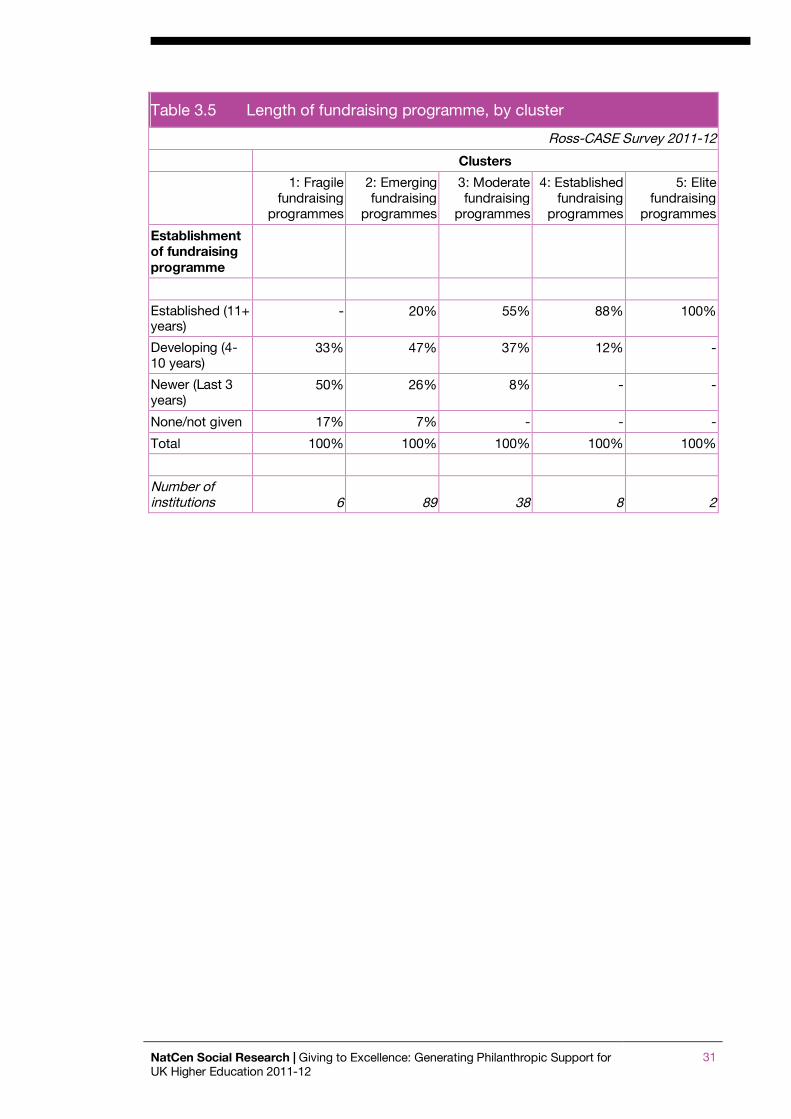
Table 3.5 presents the information on the length of fundraising programme by cluster. Forty one per cent of institutions still have developing fundraising programmes, although this varies per cluster. Cluster 1 had a mixture of developing (33 per cent) and newer (50 per cent) programmes. However, there was a trend towards institutions having more established fundraising programmes across clusters 2 (20 per cent), 3 (55 per cent), 4 (88 per cent) and 5 (100 per cent).
NatCen Social Research | Giving to Excellence: Generating Philanthropic Support for UK Higher Education 2011-12
31
Table 3.5 Length of fundraising programme, by cluster
Ross-CASE Survey 2011-12
Clusters
1: Fragile fundraising
programmes
2: Emerging fundraising
programmes
3: Moderate fundraising
programmes
4: Established fundraising
programmes
5: Elite fundraising
programmes
Establishment of fundraising programme
Established (11+ years)
- 20% 55% 88% 100%
Developing (4-10 years)
33% 47% 37% 12% -
Newer (Last 3 years)
50% 26% 8% - -
None/not given 17% 7% - - -
Total 100% 100% 100% 100% 100%
Number of institutions 6 89 38 8 2

32 NatCen Social Research | Giving to Excellence: Generating Philanthropic Support for UK Higher Education 2011-12
Appendix A. Survey methodology The questionnaire for the 2011-12 survey was similar to that used for the 2010-11
survey. One question relating to the Matched Funding Scheme was removed as it was no longer relevant. Institutions were again asked whether they would be willing to join a group of institutions that shared their questionnaire returns on a confidential basis. Benchmarking reports were not offered this year as institutions are able to undertake their own benchmarking analysis using the data directly.
As in previous years, the Ross Group provided a detailed guidance document for participants explaining how the key concepts used in the questionnaire should be interpreted. These Reporting Rules for the survey13 were for the most part unchanged from those used in the 2010-11 survey. Again, the one exception was the removal of references to the matched funding question. The rules relating to the inclusion or exclusion of corporate gifts and sponsorship can also be found on the Ross-CASE Survey website14.
HEFCE provided NatCen with a list of UK institutions that should be approached for the study. We approached 136 English HEIs, ten Welsh HEIs, 22 other HEIs and 25 FEIs. A smaller number of FEIs were approached than the 2010-11 survey, with only those who had previously participated in the Ross-CASE Survey being approached.
The Vice-Chancellors of institutions were sent an advance letter signed by Professor Eric Thomas, the Chair of CASE Europe, inviting their institutions to participate. Those individuals who submitted a return on behalf of their institution for the 2010-11 survey were also emailed directly by NatCen to draw their attention to the survey. Both the letter and the emails provided the address of the Ross-CASE Survey website (www.rosscasesurvey.org.uk) from which the questionnaire could be downloaded. The website also included background information about the survey, Reporting Rules for questionnaire completion and a Data Release Protocol.
The questionnaire was in an Excel format and completed questionnaires were returned to NatCen by email. Reminder calls and emails were used to encourage participation. Fieldwork took place between October 2012 and January 2013.
A total of 143 questionnaires were returned in time to be included in the analysis (21 less than for the 2010-11 survey). A list of participating institutions can be found in Appendix B.
Data processing was carried out by NatCen. Editing was carried out to distinguish between zero returns and missing data, to check outliers and to resolve observable errors such as data being entered in thousands where figures as whole numbers were requested. Where possible, missing or inconsistent data were queried with the institutions to check that they were correct before analysis was performed.
Analysis was carried out by NatCen using PASW for Windows (formerly known as SPSS for Windows).
Data quality 13 The Reporting Rules can be found on the Ross-CASE website at http://www.rosscasesurvey.org.uk/ 14 This can be found at http://www.rosscasesurvey.org.uk/
NatCen Social Research | Giving to Excellence: Generating Philanthropic Support for UK Higher Education 2011-12
33
We acknowledge that some HEIs and FEIs who have completed the survey, particularly those doing so for the first time, may have struggled to collect the appropriate data for submission or may have misinterpreted some of the guidelines for completion. Therefore, NatCen made calls to institutions whose data raised some issues and in many cases the data were improved. For the 2011-12 survey, the systematic checking process agreed with the Ross Group for the 2008-9, 2009-10 and 2010-11 surveys was used, apart from the removal of matched funding checks. It is important to note that all comparative figures between 2009-10, 2010-11 and 2011-12 presented in this report were compiled using the three-year returns submitted by each participant in this recent survey – making the year-on-year comparisons consistent in standard for each participating institution.
34 NatCen Social Research | Giving to Excellence: Generating Philanthropic Support for UK Higher Education 2011-12
Appendix B. Participating institutions, by Mission Group membership
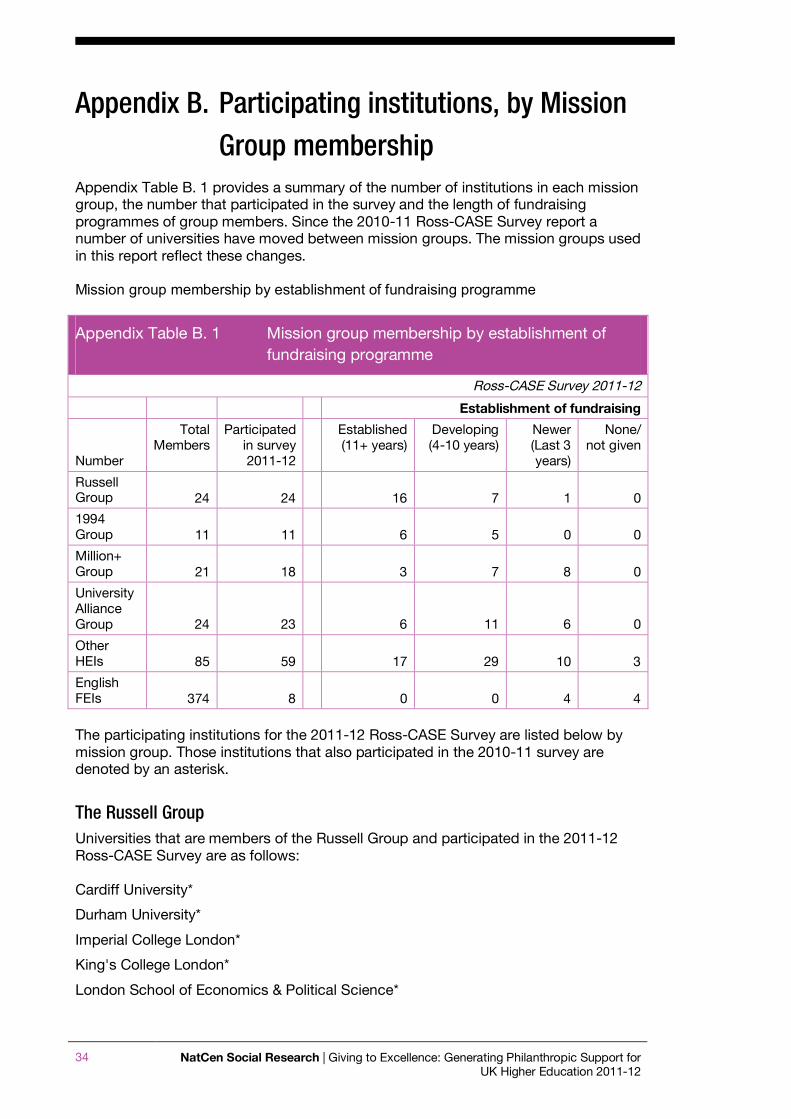
Appendix Table B. 1 provides a summary of the number of institutions in each mission group, the number that participated in the survey and the length of fundraising programmes of group members. Since the 2010-11 Ross-CASE Survey report a number of universities have moved between mission groups. The mission groups used in this report reflect these changes. Mission group membership by establishment of fundraising programme
Appendix Table B. 1 Mission group membership by establishment of fundraising programme
Ross-CASE Survey 2011-12
Establishment of fundraising
Number
Total Members
Participated in survey 2011-12
Established (11+ years)
Developing (4-10 years)
Newer (Last 3 years)
None/ not given
Russell Group 24 24 16 7 1 0
1994 Group 11 11 6 5 0 0
Million+ Group 21 18 3 7 8 0
University Alliance Group 24 23 6 11 6 0
Other HEIs 85 59 17 29 10 3
English FEIs 374 8 0 0 4 4
The participating institutions for the 2011-12 Ross-CASE Survey are listed below by mission group. Those institutions that also participated in the 2010-11 survey are denoted by an asterisk.
The Russell Group Universities that are members of the Russell Group and participated in the 2011-12 Ross-CASE Survey are as follows: Cardiff University*
Durham University*
Imperial College London*
King's College London*
London School of Economics & Political Science*
NatCen Social Research | Giving to Excellence: Generating Philanthropic Support for UK Higher Education 2011-12
35
Newcastle University*
Queen Mary, University of London*
Queen's University Belfast*
University College London*
University of Birmingham*
University of Bristol*
University of Cambridge*
University of Edinburgh*
University of Exeter*
University of Glasgow*
University of Leeds*
University of Liverpool*
University of Manchester*
University of Nottingham*
University of Oxford*
University of Sheffield*
University of Southampton*
University of Warwick*
University of York*
The Russell Group is an Association of 24 research-intensive universities in the UK (http://www.russellgroup.ac.uk/). Most of the participating universities from this mission group are English HEIs (83 per cent) while the others are from Northern Ireland, Scotland and Wales. About two-thirds (67 per cent) of the universities have fundraising programmes which were established before 2001; 29 per cent established their programmes between 2001 and 2007; and four per cent established their programmes in 2008 or later.
The 1994 Group All universities that are members of the 1994 Group participated in the 2011-12 Ross–CASE Survey. The member institutions are as follows: Birkbeck, University of London*
Goldsmiths, University of London*
Institute of Education, University of London*
Lancaster University*
Loughborough University*
Royal Holloway, University of London*
School of Oriental and African Studies*
University of East Anglia*

36 NatCen Social Research | Giving to Excellence: Generating Philanthropic Support for UK Higher Education 2011-12
University of Essex*
University of Leicester*
University of Sussex*
The 1994 Group has 11 member universities that share common aims, standards and values and was founded in 1994 (www.1994group.ac.uk). The 1994 Group is comprised of English HEIs (100 per cent). Fifty-five per cent of the universities have fundraising programmes which were established before 2001. About 45 per cent established their programmes between 2001 and 2007.
The Million+ Group Institutions that are members of the Million+ Group and participated in the 2011-12 Ross–CASE Survey are as follows: Anglia Ruskin University*
Bath Spa University*
Canterbury Christ Church University*
Edinburgh Napier University*
Leeds Metropolitan University*
London Metropolitan University*
Middlesex University*
Staffordshire University*
University of Bedfordshire*
University of Bolton*
University of Cumbria*
University of Derby*
University of East London
University of Greenwich*
University of Sunderland*
University of the West of Scotland
University of West London*
University of Wolverhampton*
The Million+ Group, formerly known as Campaigning for Mainstream Universities (CMU) is a university think tank which aims to help solve complex problems in higher education (www.millionplus.ac.uk). Those responding from the Million+ Group comprised mostly English HEIs (89 per cent). Seventeen per cent began their fundraising programmes prior to 2001. Thirty-nine per cent of member universities began their fundraising programmes between 2001 and 2007 while under half (44 per cent) of the universities have fundraising programmes which were established in 2008 or more recently.
NatCen Social Research | Giving to Excellence: Generating Philanthropic Support for UK Higher Education 2011-12
37
The University Alliance Group Institutions that are members of the University Alliance Group and participated in the 2011-12 Ross–CASE Survey are as follows: Bournemouth University*
Cardiff Metropolitan University*
Coventry University*
De Montfort University*
Glasgow Caledonian University*
Kingston University*
Liverpool John Moores University*
Manchester Metropolitan University*
Northumbria University*
Nottingham Trent University*
Open University*
Oxford Brookes University*
Plymouth University*
Teesside University*
The University of Salford*
University of Bradford*
University of Glamorgan Group*
University of Hertfordshire*
University of Huddersfield*
University of Lincoln*
University of Portsmouth*
University of the West of England*
University of Wales, Newport*
The University Alliance Group was formed in 2006 and comprises of a mix of pre and post 1992 universities. Member institutions have a balanced portfolio of research, teaching, enterprise and innovation in the individual missions. Eighty-three per cent of participating University Alliance Group members are English HEIs. Twenty-seven per cent of universities began their fundraising programmes before 2001 and just under a half (48 per cent) established their programme between 2001 and 2007. Twenty-six per cent established their programmes in 2008 or more recently.
38 NatCen Social Research | Giving to Excellence: Generating Philanthropic Support for UK Higher Education 2011-12
Other HEIs This group comprises of all HEIs that participated in the 2011-12 survey and are not members of the Russell, 1994, Million+ or University Alliance mission groups. The HEIs included in this group are as follows:
Aberystwyth University*
Aston University*
Bangor University*
Bishop Grosseteste University College Lincoln*
Brunel University*
Buckinghamshire New University*
Central School of Speech and Drama*
City University London*
Cranfield University*
Edge Hill University*
Guildhall School of Music & Drama*
Harpers Adams University College*
Heythrop College*
Institute of Cancer Research*
Keele University*
Leeds College of Music*
Leeds Trinity University College*
Liverpool Hope University*
London Business School*
London School of Hygiene & Tropical Medicine*
London South Bank University*
Newman University College*
Rose Bruford College*
Royal College of Art*
Royal College of Music*
Royal Northern College of Music*
Royal Veterinary College*
St George's, University of London*
St Marys University College*
Swansea University*
The Arts University College at Bournemouth*
The Courtauld Institute of Art*
NatCen Social Research | Giving to Excellence: Generating Philanthropic Support for UK Higher Education 2011-12
39
The Glasgow School of Art*
The Liverpool Institute for Performing Arts*
The University of London and its Institutes*
Trinity Laban Conservatoire of Music and Dance*
University Campus Suffolk*
University College Birmingham*
University College Falmouth*
University for the Creative Arts*
University of Aberdeen*
University of Bath*
University of Brighton*
University of Chester*
University of Dundee*
University of Gloucestershire*
University of Hull*
University of Kent*
University of Reading*
University of Roehampton*
University of St Andrews*
University of Strathclyde*
University of Surrey*
University of the Arts London*
University of the Highlands and Islands
University of Westminster*
University of Winchester*
University of Worcester*
York St John University*
40 NatCen Social Research | Giving to Excellence: Generating Philanthropic Support for UK Higher Education 2011-12
English FEIs This group comprises of all participating English FEIs, the institutions included are as follows: Askham Bryan College*
Blackburn College
Bradford College
Leeds City College*
Moulton College*
North Warwickshire and Hinckley College
South Gloucestershire and Stroud College
Stockport College*
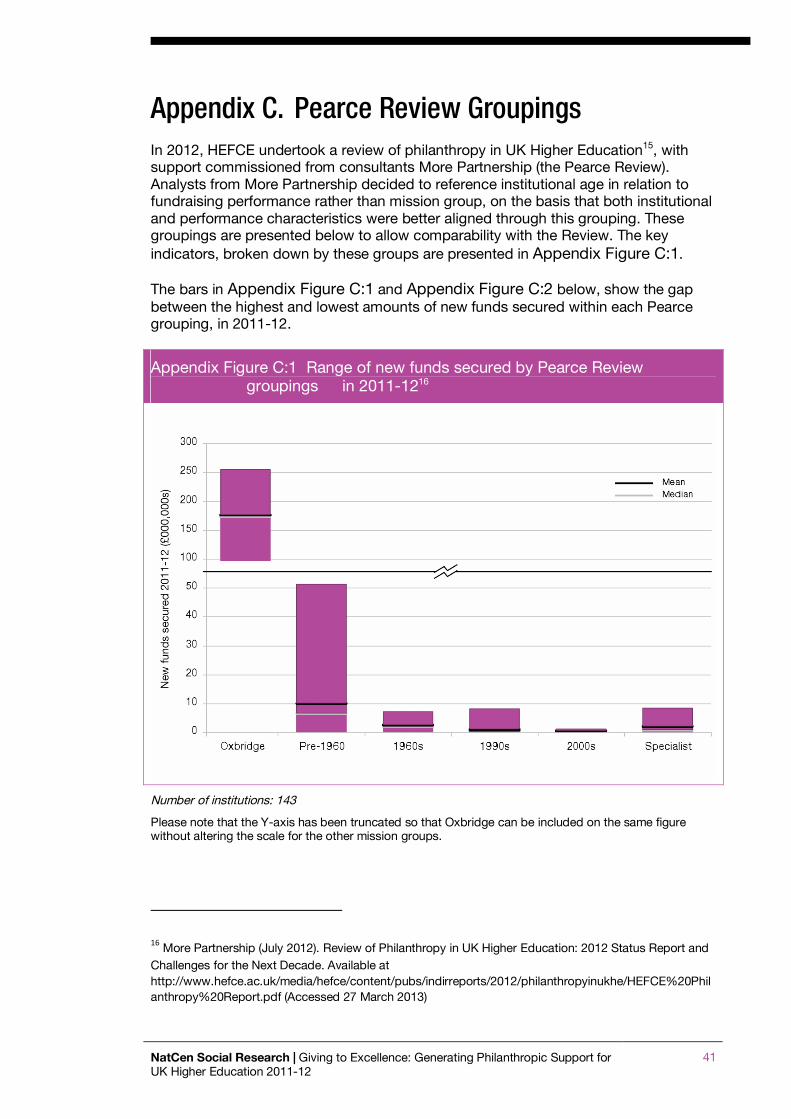
NatCen Social Research | Giving to Excellence: Generating Philanthropic Support for UK Higher Education 2011-12
41
Appendix C. Pearce Review Groupings In 2012, HEFCE undertook a review of philanthropy in UK Higher Education15, with support commissioned from consultants More Partnership (the Pearce Review). Analysts from More Partnership decided to reference institutional age in relation to fundraising performance rather than mission group, on the basis that both institutional and performance characteristics were better aligned through this grouping. These groupings are presented below to allow comparability with the Review. The key indicators, broken down by these groups are presented in Appendix Figure C:1. The bars in Appendix Figure C:1 and Appendix Figure C:2 below, show the gap between the highest and lowest amounts of new funds secured within each Pearce grouping, in 2011-12.
Appendix Figure C:1 Range of new funds secured by Pearce Review groupings in 2011-1216
Number of institutions: 143
Please note that the Y-axis has been truncated so that Oxbridge can be included on the same figure without altering the scale for the other mission groups.
16 More Partnership (July 2012). Review of Philanthropy in UK Higher Education: 2012 Status Report and Challenges for the Next Decade. Available at http://www.hefce.ac.uk/media/hefce/content/pubs/indirreports/2012/philanthropyinukhe/HEFCE%20Philanthropy%20Report.pdf (Accessed 27 March 2013)
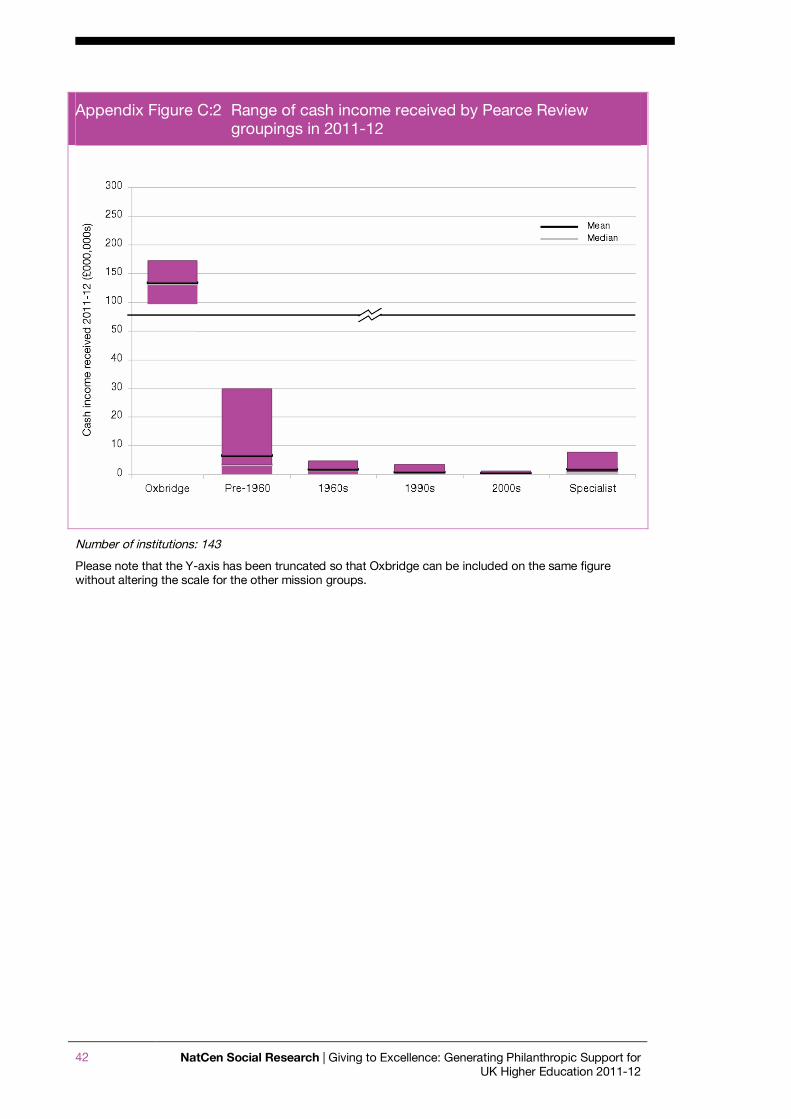
42 NatCen Social Research | Giving to Excellence: Generating Philanthropic Support for UK Higher Education 2011-12
Appendix Figure C:2 Range of cash income received by Pearce Review groupings in 2011-12
Number of institutions: 143
Please note that the Y-axis has been truncated so that Oxbridge can be included on the same figure without altering the scale for the other mission groups.
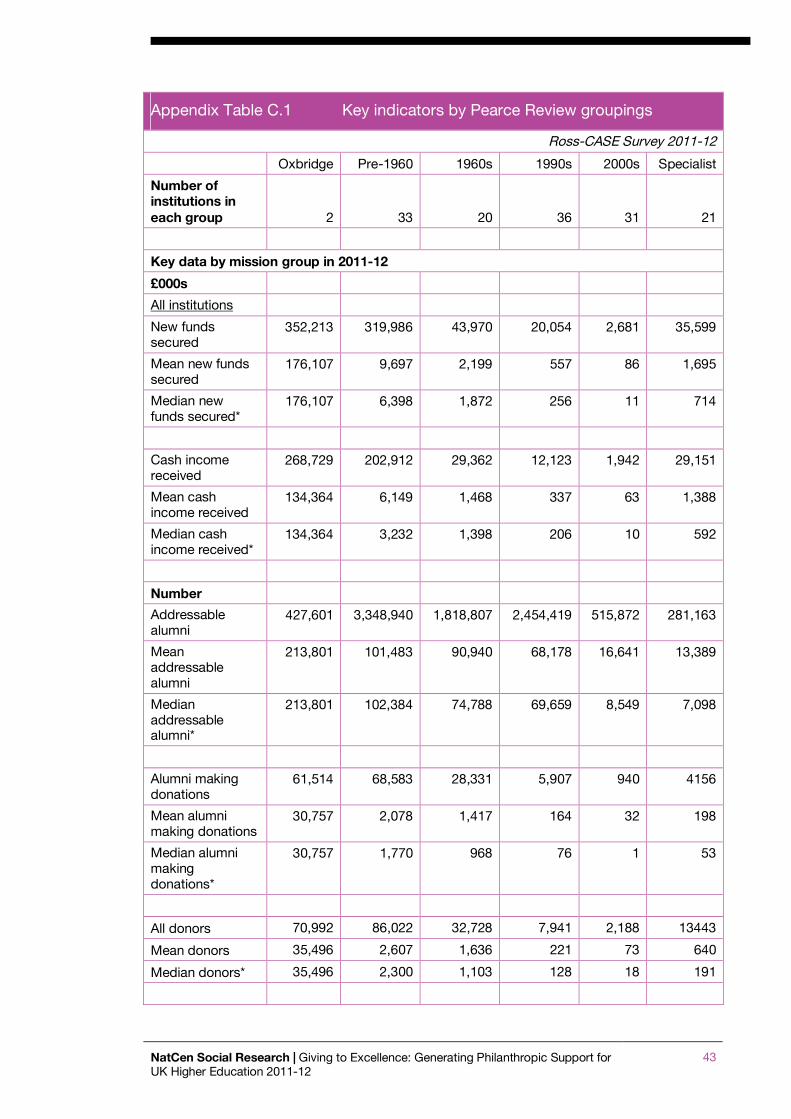
NatCen Social Research | Giving to Excellence: Generating Philanthropic Support for UK Higher Education 2011-12
43
Appendix Table C.1 Key indicators by Pearce Review groupings
Ross-CASE Survey 2011-12
Oxbridge Pre-1960 1960s 1990s 2000s Specialist
Number of institutions in each group 2 33 20 36 31 21
Key data by mission group in 2011-12
£000s
All institutions
New funds secured
352,213 319,986 43,970 20,054 2,681 35,599
Mean new funds secured
176,107 9,697 2,199 557 86 1,695
Median new funds secured*
176,107 6,398 1,872 256 11 714
Cash income received
268,729 202,912 29,362 12,123 1,942 29,151
Mean cash income received
134,364 6,149 1,468 337 63 1,388
Median cash income received*
134,364 3,232 1,398 206 10 592
Number
Addressable alumni
427,601 3,348,940 1,818,807 2,454,419 515,872 281,163
Mean addressable alumni
213,801 101,483 90,940 68,178 16,641 13,389
Median addressable alumni*
213,801 102,384 74,788 69,659 8,549 7,098
Alumni making donations
61,514 68,583 28,331 5,907 940 4156
Mean alumni making donations
30,757 2,078 1,417 164 32 198
Median alumni making donations*
30,757 1,770 968 76 1 53
All donors 70,992 86,022 32,728 7,941 2,188 13443
Mean donors 35,496 2,607 1,636 221 73 640
Median donors* 35,496 2,300 1,103 128 18 191
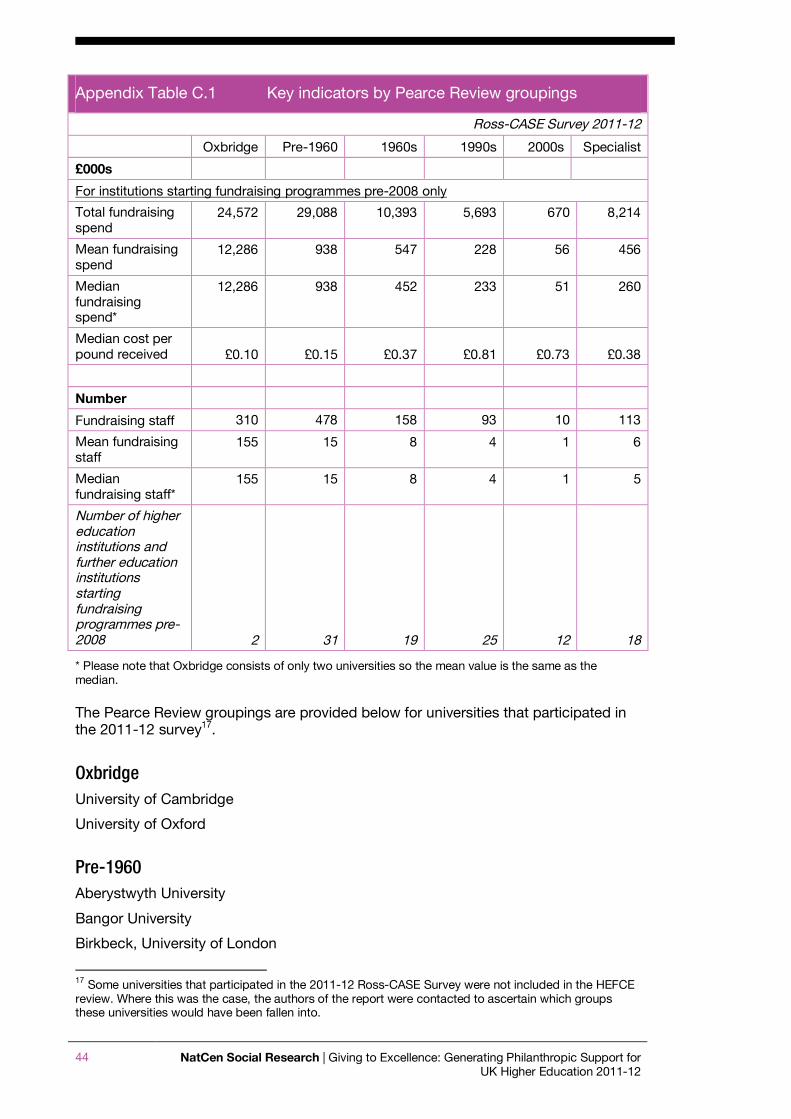
44 NatCen Social Research | Giving to Excellence: Generating Philanthropic Support for UK Higher Education 2011-12
Appendix Table C.1 Key indicators by Pearce Review groupings
Ross-CASE Survey 2011-12
Oxbridge Pre-1960 1960s 1990s 2000s Specialist
£000s
For institutions starting fundraising programmes pre-2008 only
Total fundraising spend
24,572 29,088 10,393 5,693 670 8,214
Mean fundraising spend
12,286 938 547 228 56 456
Median fundraising spend*
12,286 938 452 233 51 260
Median cost per pound received £0.10 £0.15 £0.37 £0.81 £0.73 £0.38
Number
Fundraising staff 310 478 158 93 10 113
Mean fundraising staff
155 15 8 4 1 6
Median fundraising staff*
155 15 8 4 1 5
Number of higher education institutions and further education institutions starting fundraising programmes pre-2008 2 31 19 25 12 18
* Please note that Oxbridge consists of only two universities so the mean value is the same as the median. The Pearce Review groupings are provided below for universities that participated in the 2011-12 survey17.
Oxbridge University of Cambridge
University of Oxford
Pre-1960 Aberystwyth University
Bangor University
Birkbeck, University of London
17 Some universities that participated in the 2011-12 Ross-CASE Survey were not included in the HEFCE review. Where this was the case, the authors of the report were contacted to ascertain which groups these universities would have been fallen into.
NatCen Social Research | Giving to Excellence: Generating Philanthropic Support for UK Higher Education 2011-12
45
Cardiff University
Durham University
Goldsmiths, University of London
Imperial College London
King's College London
London School of Economics & Political Science
Newcastle University
Queen Mary, University of London
Queen's University Belfast
Royal Holloway and Bedford New College
SOAS, University of London
Swansea University
The University of Edinburgh
The University of London and its Institutes
The University of Nottingham
UCL
University of Aberdeen
University of Birmingham
University of Bristol
University of Exeter
University of Glasgow
University of Hull
University of Leeds
University of Leicester
University of Liverpool
University of Manchester
University of Reading
University of Sheffield
University of Southampton
University of St Andrews
1960s Aston University
Brunel University
City University London
Cranfield University
Keele University
Lancaster University
46 NatCen Social Research | Giving to Excellence: Generating Philanthropic Support for UK Higher Education 2011-12
Loughborough University
Open University
The University of Salford
University of Bath
University of Bradford
University of Dundee
University of East Anglia
University of Essex
University of Kent
University of Strathclyde
University of Surrey
University of Sussex
University of Warwick
University of York
1990s Anglia Ruskin University
Bath Spa University
Bournemouth University
Cardiff Metropolitan University
Coventry University
De Montfort University
Edinburgh Napier University
Glasgow Caledonian University
Kingston University
Leeds Metropolitan University
Liverpool John Moores University
London Metropolitan University
London South Bank University
Manchester Metropolitan University
Middlesex University
Northumbria University
Nottingham Trent University
Oxford Brookes University
Plymouth University
Staffordshire University
Teesside University
University of Brighton
NatCen Social Research | Giving to Excellence: Generating Philanthropic Support for UK Higher Education 2011-12
47
University of Derby
University of East London
University of Glamorgan Group
University of Greenwich
University of Hertfordshire
University of Huddersfield
University of Lincoln
University of Portsmouth
University of Sunderland
University of the West of England
University of the West of Scotland
University of West London
University of Westminster
University of Wolverhampton
2000s Askham Bryan College
Bishop Grosseteste University College Lincoln
Blackburn College
Bradford College
Buckinghamshire New University
Canterbury Christ Church University
Edge Hill University
Leeds City College
Leeds Trinity University College
Liverpool Hope University
Moulton College
Newman University College
North Warwickshire and Hinckley College
South Gloucestershire and Stroud College
St Marys University College
Stockport College
The Arts University College at Bournemouth
University Campus Suffolk
University College Birmingham
University College Falmouth
University of Bedfordshire
University of Bolton
48 NatCen Social Research | Giving to Excellence: Generating Philanthropic Support for UK Higher Education 2011-12
University of Chester
University of Cumbria
University of Gloucestershire
University of Roehampton
University of the Highlands and Islands
University of Wales, Newport
University of Winchester
University of Worcester
York St John University
Specialist Central School of Speech and Drama
Guildhall School of Music & Drama
Harpers Adams University College
Heythrop College
Institute of Cancer Research
Institute of Education, University of London
Leeds College of Music
London Business School
London School of Hygiene & Tropical Medicine
Rose Bruford College
Royal College of Art
Royal College of Music
Royal Northern College of Music
Royal Veterinary College
St George's, University of London
The Courtauld Institute of Art
The Glasgow School of Art
The Liverpool Institute for Performing Arts
Trinity Laban Conservatoire of Music and Dance
University for the Creative Arts
University of the Arts London
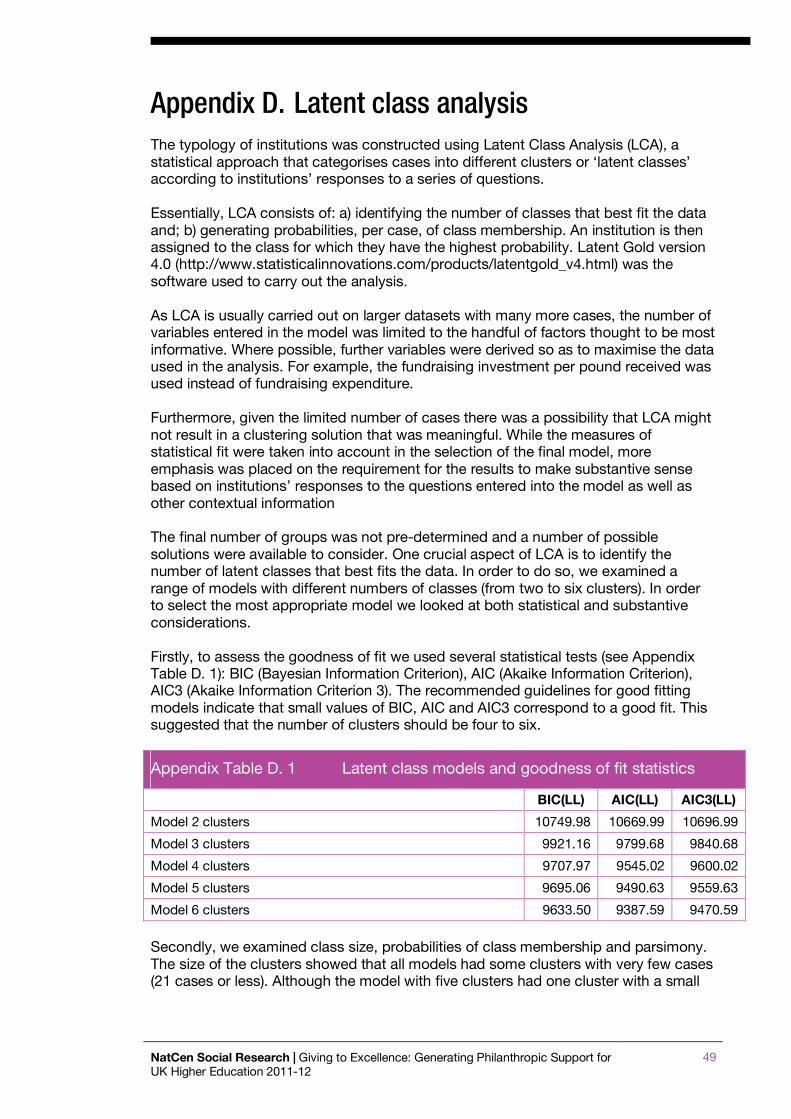
NatCen Social Research | Giving to Excellence: Generating Philanthropic Support for UK Higher Education 2011-12
49
Appendix D. Latent class analysis The typology of institutions was constructed using Latent Class Analysis (LCA), a statistical approach that categorises cases into different clusters or ‘latent classes’ according to institutions’ responses to a series of questions. Essentially, LCA consists of: a) identifying the number of classes that best fit the data and; b) generating probabilities, per case, of class membership. An institution is then assigned to the class for which they have the highest probability. Latent Gold version 4.0 (http://www.statisticalinnovations.com/products/latentgold_v4.html) was the software used to carry out the analysis. As LCA is usually carried out on larger datasets with many more cases, the number of variables entered in the model was limited to the handful of factors thought to be most informative. Where possible, further variables were derived so as to maximise the data used in the analysis. For example, the fundraising investment per pound received was used instead of fundraising expenditure. Furthermore, given the limited number of cases there was a possibility that LCA might not result in a clustering solution that was meaningful. While the measures of statistical fit were taken into account in the selection of the final model, more emphasis was placed on the requirement for the results to make substantive sense based on institutions’ responses to the questions entered into the model as well as other contextual information The final number of groups was not pre-determined and a number of possible solutions were available to consider. One crucial aspect of LCA is to identify the number of latent classes that best fits the data. In order to do so, we examined a range of models with different numbers of classes (from two to six clusters). In order to select the most appropriate model we looked at both statistical and substantive considerations. Firstly, to assess the goodness of fit we used several statistical tests (see Appendix Table D. 1): BIC (Bayesian Information Criterion), AIC (Akaike Information Criterion), AIC3 (Akaike Information Criterion 3). The recommended guidelines for good fitting models indicate that small values of BIC, AIC and AIC3 correspond to a good fit. This suggested that the number of clusters should be four to six.
Appendix Table D. 1 Latent class models and goodness of fit statistics
BIC(LL) AIC(LL) AIC3(LL)
Model 2 clusters 10749.98 10669.99 10696.99
Model 3 clusters 9921.16 9799.68 9840.68
Model 4 clusters 9707.97 9545.02 9600.02
Model 5 clusters 9695.06 9490.63 9559.63
Model 6 clusters 9633.50 9387.59 9470.59
Secondly, we examined class size, probabilities of class membership and parsimony. The size of the clusters showed that all models had some clusters with very few cases (21 cases or less). Although the model with five clusters had one cluster with a small
50 NatCen Social Research | Giving to Excellence: Generating Philanthropic Support for UK Higher Education 2011-12
size (only two cases), we believed this was the best solution because institutions within each class were reasonably homogenous in terms of their responses. The probabilities of class membership suggested that a four or five-cluster model was the best model. Ideally, each institution should have a probability of one of being in one class and zero of being in other classes, showing that the model assigns cases into their designated class with accuracy. An examination of the average membership probabilities indicated that for all models, the probability of being assigned to the class for which they have the highest probability was very high (over 0.97). The highest average membership probability was for the models with four (0.97) and fiver clusters (0.99). When viewed alongside the BIC goodness of fit statistic for this model solution, this suggests that a model with five clusters fits the data well. The principle of parsimony, which suggests that a model with fewer parameters that fits the data well should be preferred over one with more parameters, indicated that a model with five clusters was the best solution for our data. Finally, the classes within the five-cluster model were examined to ensure they had a meaningful interpretation on the basis of the eight fundraising variables used. We observed that each class was distinctive from the rest and had a meaningful interpretation. Thus, based on all these considerations we chose a model with five latent classes.