GIS/GPS SOLUTIONS AS EFFICIENT TOOLS FOR ...
9
Copyright © 2019 e Author(s). Published by VGTU Press is is an Open Access article distributed under the terms of the Creative Commons Attribution License (http://creativecommons.org/licenses/by/4.0/), which permits unre- stricted use, distribution, and reproduction in any medium, provided the original author and source are credited. Geodesy and Cartography ISSN 2029-6991 / eISSN 2029-7009 2019 Volume 45 Issue 1: 28–36 https://doi.org/10.3846/gac.2019.7083 *Corresponding author. E-mail: [email protected] ere are several techniques in obtaining spatial data for specific areas in the real world. GPS (Global Positioning System) among the surveying methods is very important technique for gathering geospatial information from the field. GPS has made a big difference in the methodology and the method of data collection from the terrain by giv- ing a different approach to the mapping and field meas- urements. Besides making very precise and homogenous measurements for geodetic needs, it also performs various multidimensional functions; apart from determining the position, GPS can be combining with various GIS applica- tions that enable collection of the attributes of geographic information (GI). Application of GPS and GIS systems nowadays are an essential tool for managing, monitoring and updating information in daily, monthly or annual basis. A review of number of OpenGeo products exposed worldwide show that there have been major improvements in much UDK 528.344 GIS/GPS SOLUTIONS AS EFFICIENT TOOLS FOR SUSTAINABLE MANAGEMENT OF VINEYARDS IN KOSOVO Ymer KUKA 1 , Perparim AMETI 2* , Temenoujka BANDROVA 3 1, 2 University of Prishtina, Faculty of Civil Engineering, Architecture and Geodesy, Bregu i Diellit p.n. 10 000 Prishtine, Kosova 3 University of Architecture, Civil Engineering and Geodesy 1, Chr. Smirnenski Blvd, 1046 Sofia, Bulgaria Received 12 December 2018; accepted 20 December 2018 Abstract. e main objective of this paper is to analyze and develop a GIS system that includes all necessary information obtained by using GPS and mobile GIS techniques as well. Since several techniques for information management exist, the aim is how to integrate them for a sustainable management of vineyards areas in Kosovo. It has been designed a system, which is able to produce maps, make various analyses based on the requests of the specific users and offers trend orientation for decision making. e JAVA programming language has been used. is provides the most possible flexibility in the data flow and data management. e structure of the data base is proposed to be designed in that way that the textual and geometric data have been processed in a unique data base in PostGIS PostgreSQL technology. Web GIS technology presented in this paper, shows an advantage comparing to the desktop based technology since it enables an access in real time. Foremost, the application offers an access depending on the roles and privileges for differ- ent users. Development of a WEB application for viticulture management will improve the efficiency and decision making process as well. Results show numerous capabilities of GIS methodologies to manage the agricultural crops, in this particular case, the vineyards. Further, the results provide insight into information management in a single system and serve as a basis for similar researches in other areas of agriculture in the future. Keywords: GIS, GPS, map, WEB application, vineyard. Introduction Nowadays GIS is helping cartography a lot in providing with analysis as well as visualizing tools for representa- tion of geospatial information in maps. However, GIS can manage large volume of data, which overcome on the capabilities of a hard copy map. Also, GIS can provide much faster and more accurate information as compared to the printed maps. So, GIS offers great advantages such as: the collection and maintenance of a large volume of information, processing of such data rapidly and with a small outlay that is incomparable by manual methods that have been used up until recently. It provides simultaneous access on the same synchronized data and enables data exchange to various organizations and units. GIS in not able to create spatial data without the help of any other techniques. Always, is necessary to use a source data which further could be processed by GIS tools.
-
Upload
khangminh22 -
Category
Documents
-
view
1 -
download
0
Transcript of GIS/GPS SOLUTIONS AS EFFICIENT TOOLS FOR ...

Copyright © 2019 The Author(s). Published by VGTU Press
This is an Open Access article distributed under the terms of the Creative Commons Attribution License (http://creativecommons.org/licenses/by/4.0/), which permits unre-stricted use, distribution, and reproduction in any medium, provided the original author and source are credited.
Geodesy and CartographyISSN 2029-6991 / eISSN 2029-7009
2019 Volume 45 Issue 1: 28–36
https://doi.org/10.3846/gac.2019.7083
*Corresponding author. E-mail: [email protected]
There are several techniques in obtaining spatial data for specific areas in the real world. GPS (Global Positioning System) among the surveying methods is very important technique for gathering geospatial information from the field. GPS has made a big difference in the methodology and the method of data collection from the terrain by giv-ing a different approach to the mapping and field meas-urements. Besides making very precise and homogenous measurements for geodetic needs, it also performs various multidimensional functions; apart from determining the position, GPS can be combining with various GIS applica-tions that enable collection of the attributes of geographic information (GI).
Application of GPS and GIS systems nowadays are an essential tool for managing, monitoring and updating information in daily, monthly or annual basis. A review of number of OpenGeo products exposed worldwide show that there have been major improvements in much
UDK 528.344
GIS/GPS SOLUTIONS AS EFFICIENT TOOLS FOR SUSTAINABLE MANAGEMENT OF VINEYARDS IN KOSOVO
Ymer KUKA1, Perparim AMETI2*, Temenoujka BANDROVA3
1, 2University of Prishtina, Faculty of Civil Engineering, Architecture and Geodesy, Bregu i Diellit p.n. 10 000 Prishtine, Kosova
3University of Architecture, Civil Engineering and Geodesy 1, Chr. Smirnenski Blvd, 1046 Sofia, Bulgaria
Received 12 December 2018; accepted 20 December 2018
Abstract. The main objective of this paper is to analyze and develop a GIS system that includes all necessary information obtained by using GPS and mobile GIS techniques as well. Since several techniques for information management exist, the aim is how to integrate them for a sustainable management of vineyards areas in Kosovo. It has been designed a system, which is able to produce maps, make various analyses based on the requests of the specific users and offers trend orientation for decision making. The JAVA programming language has been used. This provides the most possible flexibility in the data flow and data management. The structure of the data base is proposed to be designed in that way that the textual and geometric data have been processed in a unique data base in PostGIS PostgreSQL technology.Web GIS technology presented in this paper, shows an advantage comparing to the desktop based technology since it enables an access in real time. Foremost, the application offers an access depending on the roles and privileges for differ-ent users. Development of a WEB application for viticulture management will improve the efficiency and decision making process as well.Results show numerous capabilities of GIS methodologies to manage the agricultural crops, in this particular case, the vineyards. Further, the results provide insight into information management in a single system and serve as a basis for similar researches in other areas of agriculture in the future.
Keywords: GIS, GPS, map, WEB application, vineyard.
Introduction
Nowadays GIS is helping cartography a lot in providing with analysis as well as visualizing tools for representa-tion of geospatial information in maps. However, GIS can manage large volume of data, which overcome on the capabilities of a hard copy map. Also, GIS can provide much faster and more accurate information as compared to the printed maps. So, GIS offers great advantages such as: the collection and maintenance of a large volume of information, processing of such data rapidly and with a small outlay that is incomparable by manual methods that have been used up until recently. It provides simultaneous access on the same synchronized data and enables data exchange to various organizations and units.
GIS in not able to create spatial data without the help of any other techniques. Always, is necessary to use a source data which further could be processed by GIS tools.

Geodesy and Cartography, 2019, 45(1): 28–36 29
functionality recently. The application of GIS systems in creation of cartography products (different maps) plays an essential role. The idea to have updated maps might be instituted through very fast field measurements through GPS techniques and through systems based on GIS with large scale of functionalities for data storing, processing and analysis.
1. Goals and objectives
The main goal of this paper is to identify the vine planted areas on the territory of Kosovo by using various data col-lection techniques and finally to develop a web GIS ap-plication in order to manage such information in accurate and rational way.
Identification of the vine planted areas is conducted by applying two methods. It is essential that while searching for methods how to collect new information related with geographic component as well, initially we have to analyze the existing cartographic products which can assist us in collecting the necessary information. Such products which are used for this paper are: cadastral maps, topographic maps, orthophoto and other information on vineyards (ownership, digital terrain model, elevations above sea level, exposition, etc.). The second method which is used is by applying GPS technique for field measurements in order to collect the location for the vineyards (location and their attributes).
Finally, one of the main objectives was to develop a web GIS system which will manage the above mentioned collected data and be able to produce various maps for dif-ferent users, provide with accurate vineyard management, make various analyses on the vineyards, and at the same time use this information for various purposes based on specific requests.
2. Study area
The study area is the distribution of vineyards in the terri-tory of Kosovo. Based on the fact that wine cultivation in Kosovo is present in the Dukagjini region (West Kosovo), then this region is considered as a viticulture region in Kosovo.
Kosovo has a vine growing Region – Region of Duk-agjini, and two sub-regions: South Sub region and North Sub region (Figure 1). South sub region has 6 viticulture areas: Rahovec, Suhareke, Gjakove, Prizren, Mamushe and Malisheve. North sub region has 3 viticulture areas: Peje, Istog, and Kline. South sub region has 160 viticulture loca-tions, while North sub region has 55 viticulture locations.
Study area is located in south-western Kosovo and covers an area of about 3500 km². It is located between latitudes 42°9′9.854′′ and 42°48′57.804′′N and longitudes 20°17′5.691′′ and 21°15′32.650′′E. The vineyards lie be-tween 310 m (the lowest altitude) and 795 m (the highest altitude).
3. Materials and methods
To create a GIS database, it is required to determine its content. It is required to know the sources of informa-tion available to come to the desired results. The various cartographic products offer a good opportunity to come up to the required research results rapidly, accurately and efficiently. The more available diverse cartographic prod-ucts, the research results are more complete and at the same time are faster.
Maps are the main source of information for GIS and one of the ways in visualizing information generated with GIS (Franges, Frančula, & Lapaine, 2002).
Cadastral plans have an important role in identifying the boundaries of vineyard parcels and they are a very good source of information. A cadastral map is a map showing the boundaries of subdivisions of land, often with the bearings and lengths thereof and the areas of individual tracts, for purposes of describing and record-ing ownership. Topographic maps are another important product and have an important role in this research. They are used to determine the terrain slopes and elevation of specific points. The slope is determined through Digital Relief Model (DRM). In almost any geographic or car-tographic application, topographic surfaces are regarded as functions f(x, y), associating with each point (x, y) its respective altitude and being at least twice continuously differentiable, a view that is also widely employed when dealing with mappings describing socio-economic, physi-cal, and other phenomena (Achilleos, 2012).
Figure 1. Viticulture region

30 Y. Kuka et al. GIS/GPS solutions as efficient tools for sustainable management of vineyards in Kosovo
All maps: cadastral plans, topographic maps, have been in raster format where have been converted to vec-tor format through digitization process. Digitization is a process of conversion of existing maps from analogue form into digital form.
Digitalization in fact represents an important and complex process, which consists of three main stages: scanning, goereferencing, and vectorizing (Idrizi, 2006). A vector data model represents space as points, lines or polygons that are geographically referenced. The raster model divides a space into equal sized cells (pixels) with attributes recorded as a numeric value for each pixel; re-motely sensed data are an example of raster data (Quan, Oudwater, Pender, & Martin, 2001).
Lately, aerial photographs have become a very im-portant in providing information that can be used and incorporated for production of various maps. Given the importance of this information most GIS systems develop modules to support different formats of images and ortho-photos and by providing them as background which offers extraordinary auxiliary in achieving the desired outcome during the handling of spatial data.
Orthophotos are radio metrically processed aerial photography data, geometrically projected to an orthogo-nal map projection by using an elevation model. In an orthophoto the scale or distance between points are not affected by variations in the terrain (GSD, 2015).
In this research orthophotos play an extremely impor-tant role because we are able to identify the areas planted with vines.
4. GPS/GIS for field data collection
By using the GIS methods in managing spatial informa-tion related to certain locations, the aim is not just to manage some information, but to manage all of them, which represent the reality as modeled one. For this pur-pose, besides using existing information in certain prod-ucts, we need to see for other possibilities in order to get the most updated information.
In this research also methods for data collection in the field are used, such as: GPS or GIS/GPS as integrated tech-nologies. The process is conducted through mobile devices with real time synchronization (GPRS-Internet) as well as with offline synchronization (not real time). Nowadays, GPS plays a very important role in the development of computer technology that associates each piece of infor-mation with its geographical position (location). GPS technology provides the fastest, easiest and most produc-tive method of mapping the locations and geometries of ground features for a GIS database (Trimble, 2007).
The way GPS is used, by providing GIS data, it can be categorized in two broad areas. The first is simply applying a controlling reference to some other source of data from which the GIS can collect the information that it needs. The other is to use GPS for the direct acquisition of the GIS information (French, 1996).
5. Mobile GIS technology
As long as the development of certain GIS systems, for the purpose of data collection requires the field survey-ing methods, the best way is doing it digitally, rather than writing the information on papers and digitizing them afterwards. This method has a great impact in saving the time and the cost as well. By modeling the database in such mobile devices, this could be used as integrated one in the final database of the system.
The entry of attribute information into a GIS by using a GPS receiver is facilitated by a data dictionary, which is a hierarchical collection of textual terms stored in the GPS receiver’s memory. The terms fall into three catego-ries (Kennedy, 2002):
– Feature; – Attribute; – Value.
In this paper, the method of data collection through off-line synchronization mobile devices is presented. These mobile devices, that have operating systems installed on them, enable the installation of various software and ap-plications for data collection from the field. There are nu-merous reasons for choosing this data collection method in this research. Initially, vineyards are located in a wide and mountainous terrain where there is limited GPRS coverage. Further, there is a large amount of data and or-thophotos transfer that must be made in the device. So, having to transfer large amount of data in a limited GPRS coverage area, is not a good solution. The user “sees” the object of interest in both forms, naturally and symboli-cally on the digital graphic display. This contributes to an easier process of matching symbol dimensions (used in maps) directly with phenomenon dimensions (occurring in nature) (Pundt & Brinkkotter-Runde, 2000).
With the rise of smart phones and ever more sophis-ticated handheld computers, many that now incorporate GPS (“sat nav”) technologies make a tremendous poten-tial for undertaking mixed-method research, including the collection of spatially referenced data (Jones, Drury, & McBeath, 2011).
The software which is quite useful and qualitative for such purposes is ESRI’s product named ArcPAD. This ap-plication provides database access, map creation, GIS, and GPS integration to the users directly in the field by mobile devices and handheld equipment. Data collection process through ArcPAD is fast and quite easy. As it is mentioned above, ArcPAD is part of the GIS solution and it is inte-grated into ArcGIS. Supports maps in vector and raster formats including the ESRI shape files, JPEG, BMP and MrSID image format.
By using mobile devices for data collection process, the following steps should be followed:
1. Design of initial geodatabase,2. Development of an application (forms and pro-
gramming),3. GIS Operators (data synchronization with gdb),4. Users (data collection from the field).

Geodesy and Cartography, 2019, 45(1): 28–36 31
Designing geodatabase for data collection is based on a common set of steps with basic GIS projections, which is done via ArcGIS Diagrammer software. Geodatabase de-sign includes spatial information organization in a series of data based on layers and other information related to these spatial data. So, in order to design the geodatabase, initially the features that will be used should be identified and their content and representation of the features should be specified.
Geodatabase design with ArcGIS Diagrammer (Fig-ure 2) enables the geodatabase to be valid and more sta-ble, have a detailed design of every field-attribute and its type, geospatial extension of the feature, the list of codes for attribute, categorization via codes, creation of special tables with textual data, creation of relations between ta-bles with textual and spatial data. In this paper, regarding spatial data, the following features are identified: polygon
with the characteristics of area, the terrain data, data on the user, the varieties and the inclusive percentage, or the number of vines and dimensions between rows and vines, etc.
Application development for mobile devices allows the data collection in the forms prepared specially for this research and it also allows the data synchronization with the geodatabase. Application development is performed by ArcPAD Studio, which creates the form and design. It also makes the connection to the database where data should be stored. A form prepared for data collection is presented below in Figure 3.
After collecting new data from the field or chang-ing existing data, they are registered in the geodatabase. The registration of these data in the geodatabase is done with ArcPAD Data Manager which enables the insertion of the new records, respectively the automatic update of
Figure 2. Geodatabase design – ArcGIS diagrammer
Figure 3. Development of ArcPAD application for data collection from the field

32 Y. Kuka et al. GIS/GPS solutions as efficient tools for sustainable management of vineyards in Kosovo
the changed records. During data import in the device, a report is generated containing the number of created, edited, or deleted objects (Figure 4).
After imported, these records are automatically up-dated in the geodatabase and relevant maps.
6. GIS methodologies for data management
One of the main objectives of this research is to develop a Web GIS system in order to enable the information man-agement related to vineyards in Kosovo. Creation of such system serves as an evidence of country assets and enables various planning and analysis in the field of viticulture. The development and management of a GIS system makes an interconnection of all the products mentioned above that are necessary to reach the intended result of this study. According to Parker and Asencio (2009), GIS allows for the display of multiple variables in different formats in order to convey more complex information.
GIS is a tool that can access, integrate, and distribute layers of map information (Esri, 2014). The five parts of a GIS include hardware, software, data, procedures, and people (Bandrova, Konecny, & Yotova, 2014) The three most important elements of a typical Geographic Infor-mation System can be summarized as follows (Logsdon, 1995): 1. Cartographic capability; 2. Data management capability; 3. Analytical capability.
The GIS system in this study will connect all the exist-ing data (cadastral maps, topographic maps, orthophotos, etc.) with other information collected through GPS/GIS technologies. All these data are stored in one place, and by accessing them it makes possible to answer several ques-tions by conducting spatial analyses, editing, and produce maps, graphs and statistics (Figure 5).
7. Developing a Web GIS system
Development of a GIS application for proper vineyards management will contribute to facilitating the implemen-tation of the tasks and responsibilities of employees based on the course of proceedings and their rights within the institution, as well as the update of data in real time from the users in various locations.
A good GIS program is able to process geographic data from a variety of sources and integrate them into a map project (Esri, 2009).
In the development of such systems, special attention should be paid to the development of system technology, speed, data security, and ease of use considering that this system will be used by people of different profiles. An easy and understandable access and navigation, simple forms for data entry, retrieval, and edits, would make the sys-tem very practical and not complicated for operation and maintenance.
GIS system starts with the construction of the base of the information. The base of the information is formed by combining the measurements taken on the field with their attributes, orthophotos and data collected through scan-ning / digitalization of various maps and various registers. A GIS system has four components: equipment (hard-ware), application (software), people, and data (Drishti, 2012).
The application allows the scanned maps to be dis-played in the background while the vector is over them. When all these data are entered in the system, then the system is designed to establish relations between them in order to enable the production of various maps, genera-tion of various statistics and analysis as requested by the users. The data in GIS system is entered in two forms: geographical or spatial data and attributes or non-spatial data. Spatial data are records that contain a geographical location in the form of coordinates. On the other hand, attribute notes are a cluster of descriptive data that con-tain various information related to the analyzed location (owner, parcel number, grape variety, slope, exposition, etc.) (Figure 6).
Data enter into a GIS in a more or less basic structure, as points and lines for vector-based applications and as pixels and images for raster-based applications. Such basic data are the building blocks for more complex structures that are needed to model the real world in a way that can be put to use for typical GIS applications (Danko, 2012).
Figure 4. Device synchronization with the geodatabase
Figure 5. The ArcGIS family of products (ESRI, 2004) Figure 6. Different data sources

Geodesy and Cartography, 2019, 45(1): 28–36 33
With all the afore mentioned information regarding of what a GIS system should contain in order to meet the requirements of various users, it can be concluded that the system will be based on WEB technology with client-server architecture, specifically three tier architecture:
– Data Tier – allows management of logical database entities such as tables, views, functions, types, etc.
– Logic Tier (Application tier (business logic, logic tier, or middle tier)) – enables data generation and pro-cessing in server application.
– Presentation tier (GUI) – is a tier in which informa-tion of static and dynamic data, as well as graphics and maps are displayed.
The data format is another important consideration in data acquisition and use. The importance of format is due mainly to the software used to process the data and when comparisons among datasets that use different formats are desired (Clay, 2011).
8. Database model
Lots of data for specific events are produced continuously at various times. A database is a collection of data stored in a structured format using a computer. A database can be thought of as a table, but the distinction is that the table is just one way (of many) to represent the database (Harvey, 2008).
These data are gathered by methods explained in this paper. All these numerous and voluminous data are man-aged in a database. Also, the development of GIS system requires multiple steps to process data from raw form to
the final form – used for migration to the database – and presentation of these data from the database to the server and the client. Any form of data is raw data in its own, but in the case of vineyard GIS system raw data are considered only the data collected on the ground without any further processing, even though such data are collected through mobile devices and the application for data collection that has a built-in data validation processes.
Data models are a set of rules and/or constructs used to describe and represent aspects of the real world in a computer. Two primary data models are available to com-plete this task: raster data models and vector data models (Campbell & Shin, 2012).
After raw data processing and controlling, they are mi-grated in the final model of the database, where the data are checked and are subject of respective constraints (Fig-ure 7). This means the process of data migration in the database server PostgreSQL/PostGIS, where they will be used as final information for further processing into the vineyard GIS system and also will be used for the devel-opment of various web services for their usage in WEB-GIS to the client. After the data migration in the database server, the client is able to manage spatial and textual data using the vineyard system and the presentation of the data in page (GUI).
Taking into consideration that for the presentation of the spatial data on the map it should be referred to the appropriate coordinate system, highlights the fact that the coordinate system should be initially defined in the ap-propriate PostGIS and Proj4 format (Figure 8) which in-teract with other formats, such as ESRI projections. While
Figure 7. From raw data to Web GIS
Figure 8. Determination of the Coordinate System
Figure 9. Constraints / conditions on the geometric attributes
34 Y. Kuka et al. GIS/GPS solutions as efficient tools for sustainable management of vineyards in Kosovo
defining the attributes, specifically geometric types, some constraints / conditions are set (Figure 9).
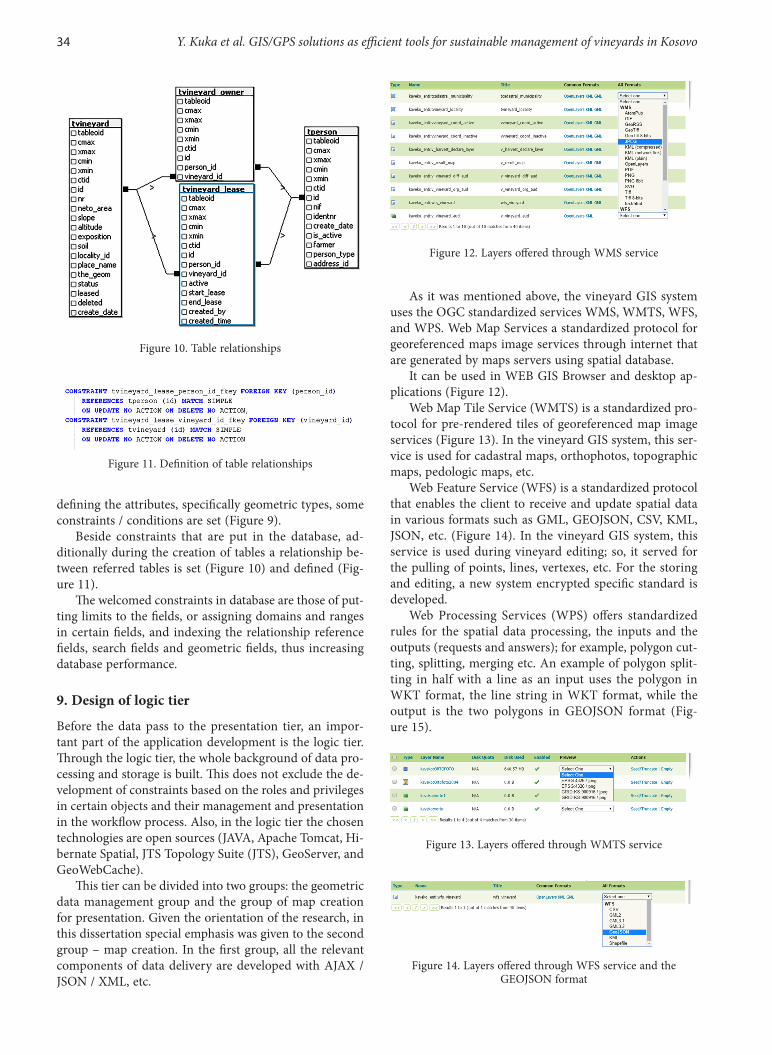
Beside constraints that are put in the database, ad-ditionally during the creation of tables a relationship be-tween referred tables is set (Figure 10) and defined (Fig-ure 11).
The welcomed constraints in database are those of put-ting limits to the fields, or assigning domains and ranges in certain fields, and indexing the relationship reference fields, search fields and geometric fields, thus increasing database performance.
9. Design of logic tier
Before the data pass to the presentation tier, an impor-tant part of the application development is the logic tier. Through the logic tier, the whole background of data pro-cessing and storage is built. This does not exclude the de-velopment of constraints based on the roles and privileges in certain objects and their management and presentation in the workflow process. Also, in the logic tier the chosen technologies are open sources (JAVA, Apache Tomcat, Hi-bernate Spatial, JTS Topology Suite (JTS), GeoServer, and GeoWebCache).
This tier can be divided into two groups: the geometric data management group and the group of map creation for presentation. Given the orientation of the research, in this dissertation special emphasis was given to the second group – map creation. In the first group, all the relevant components of data delivery are developed with AJAX / JSON / XML, etc.
As it was mentioned above, the vineyard GIS system uses the OGC standardized services WMS, WMTS, WFS, and WPS. Web Map Services a standardized protocol for georeferenced maps image services through internet that are generated by maps servers using spatial database.
It can be used in WEB GIS Browser and desktop ap-plications (Figure 12).
Web Map Tile Service (WMTS) is a standardized pro-tocol for pre-rendered tiles of georeferenced map image services (Figure 13). In the vineyard GIS system, this ser-vice is used for cadastral maps, orthophotos, topographic maps, pedologic maps, etc.
Web Feature Service (WFS) is a standardized protocol that enables the client to receive and update spatial data in various formats such as GML, GEOJSON, CSV, KML, JSON, etc. (Figure 14). In the vineyard GIS system, this service is used during vineyard editing; so, it served for the pulling of points, lines, vertexes, etc. For the storing and editing, a new system encrypted specific standard is developed.
Web Processing Services (WPS) offers standardized rules for the spatial data processing, the inputs and the outputs (requests and answers); for example, polygon cut-ting, splitting, merging etc. An example of polygon split-ting in half with a line as an input uses the polygon in WKT format, the line string in WKT format, while the output is the two polygons in GEOJSON format (Fig-ure 15).
Figure 10. Table relationships
Figure 11. Definition of table relationships
Figure 12. Layers offered through WMS service
Figure 13. Layers offered through WMTS service
Figure 14. Layers offered through WFS service and the GEOJSON format

Geodesy and Cartography, 2019, 45(1): 28–36 35
Figure 15. Polygon splitting with a line through WPS service
10. Presentation tier
All above mentioned services are used in the development of the vineyard GIS system, specifically in the back-end tier or logic tier. However, in order to show or display the information it is needed to develop the presentation tier in GUI. For the development of this tier and its interac-tion with the logic tier, open source technologies such as Bootstrap / HTML5, OpenLayers, jQuery / Ajax / JSON / jqGrid, etc. are used. Besides, OpenLayers library, that is used to display maps and geometry, other libraries are used for the presentation of textual and graphic informa-tion. A combination of all these technologies has produced a very flexible and secure system (Figure 16).
Results / Conclusions
– Proposal of suitable Web-GIS based solution as an ef-ficient tool for the management of agricultural vine-yard crops. It is first application attempt for Kosovo.
– The database design introduced into mobile device, by containing all new technologies such as GIS, GPS, and GPRS increases the possibility and efficiency for quick field data collection and results presentation.
– The automatic generation of maps based on the known source/input data can be achieved only in sys-tems with an integrated data base composed by nu-merical and geometric values in one side and simul-taneous displaying of the statistical results and map view at the other side. This research has achieved the targeted goal.
– Having detailed information about vineyards with the possibility of doing different analysis (statistics, reports, charts) helps the state institutions on bet-ter decision making. The most probable groups that will benefit from the method developed in this the-sis are public and private authorities from agriculture related issues, i.e. Ministry of Agriculture, Forestry and Rural Development, Institute of Viticulture and Enology, private farmers etc.
– This methodology of data collection and system de-velopment can be used in other fields such as for-estry, horticulture, spatial planning etc as well.
ReferencesAchilleos, G. (2012, 18-22 June). Allocating the DEM elevation
error into its components: The contribution of digitazing and interpolation to the total error. Proceedings vol. 1, 4th Inter-national Conference on Cartography and GIS (pp. 139-148). Albena Bulgaria.
Apache Tomcat. (2019). Retrieved from http://tomcat.apache.orgBandrova, T., Konecny, M., & Yotova, A. (2014, 15-20 June).
Cartography development and chalanges on the basis of Big Data. 5th International Conference on Cartography and GIS, Proceedings, 1 (pp. 164-173). Riviera, Bulgaria.
Bootstrap / HTML5. (2019). Retrieved from http://getbootstrap.com
Campbell, E. J., & Shin, M. (2012). Geographic Information System Basics (v. 1.0). Retrieved from http://2012books.lardbucket.org/
Clay, A. SH. (2011). GIS Applications in Agriculture, Vol 3. – In-vasive Species, Taylor and Francis Group LLC, London, New York.
Danko, K. (2012). Springer handbook of geographic information. Berlin, New York: Springer.
Drishti, B. (2012). GIS ne planifikimin e zhvillimit te qendrueshem te nje rajoni. Tiranë.
Figure 16. General Presentation (GUI) of Vineyard System

36 Y. Kuka et al. GIS/GPS solutions as efficient tools for sustainable management of vineyards in Kosovo
ESRI. (2009, March). GIS best practices. Using GIS with GPS. Retrieved from www.esri.com
ESRI. (2014, October). Essays on Geography and GIS, 7. Esri.Franges, S., Frančula, N., & Lapaine, M. (2002). The future of
cartography. Kartografija i geoinformacije, Vol. 1, No. 1.French, T. G. (1996). Understanding the GPS – An Introduction to
the global positioning system. GeoResearch, Inc. USA.GeoServer. (2019). Retrieved from http://geoserver.orgGeoWebCache. (2019). Retrieved from http://geowebcache.orgGSD Geografska Sverigedata Lantmateriet, Document ver-
sion 1.1. (2015). Product description: GSD – Orthophoto and GSD-Othophoto 25.
Harvey, F. (2008). A Primer of GIS fundamental geographic and cartographic concepts. New York, London: The Guilford Press.
Hibernate Spatial. (2019). Retrieved from http://www.hiber-natespatial.org
Idrizi, B. (2006). Perpilimi i hartave & pergjithesimi Hartografik. FineArt Multimedia, Skopje.
JAVA. (2019). Retrieved from https://www.java.com/en Jones, Ph., Drury, R., & McBeath, J. (2011). Using GPS-Enabled
mobile computing to augment qualitative interviewing: Two case studies. Field Methods, 23, 173. https://doi.org/10.1177/1525822X10388467
jQuery. (2019). Retrieved from https://jquery.comKennedy, M. (2002). The global positioning system and GIS an
introduction (2nd ed.). London and New York: Taylor & Fran-cis Inc.
Logsdon, T. (1995). Understanding the Navstar GPS, GIS, and IVHS (2nd ed.). Chapman & Hall, USA.
OpenLayers. (2019). Retrieved from http://openlayers.orgParker, N. R., & Asencio, K. E. (2009). GIS and spatial analysis
for the social sciences, coding, mapping, and modeling. Rout-ledge. https://doi.org/10.4324/9780203929346
PostGIS. (2019). Retrieved from http://postgis.net/ PostgreSQL. (2019). Retrieved from http://www.postgresql.org/Pundt, H., & Brinkkotter-Runde, K. (2000). Visualization of spa-
tial data for field based GIS. Computers & Geosciences, 26(1), 51-56. https://doi.org/10.1016/S0098-3004(99)00033-3
Quan, J., Oudwater, N., Pender, J., & Martin, A. (2001). GIS and participatory approaches in natural resources research. Natural Resources Institute, The University of Greenwich. Published by Natural Resources Institute.
Trimble. (2007). GPS The First Global Navigation Satellite System. Trimble Navigation Limited, USA.