Gilead Sciences, Inc. (NYSE: GILD) Healthcare - Tippie ...
29
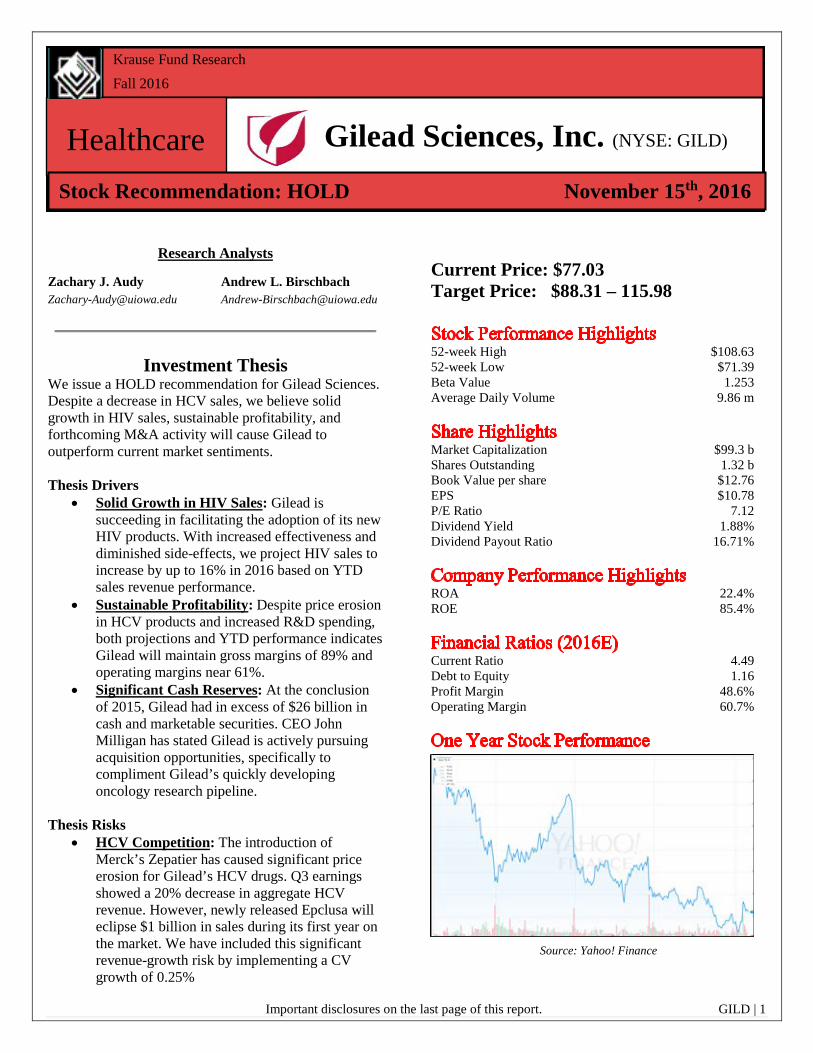
Important disclosures on the last page of this report. GILD | 1 Krause Fund Research Fall 2016 Research Analysts Investment Thesis We issue a HOLD recommendation for Gilead Sciences. Despite a decrease in HCV sales, we believe solid growth in HIV sales, sustainable profitability, and forthcoming M&A activity will cause Gilead to outperform current market sentiments. Thesis Drivers • Solid Growth in HIV Sales: Gilead is succeeding in facilitating the adoption of its new HIV products. With increased effectiveness and diminished side-effects, we project HIV sales to increase by up to 16% in 2016 based on YTD sales revenue performance. • Sustainable Profitability: Despite price erosion in HCV products and increased R&D spending, both projections and YTD performance indicates Gilead will maintain gross margins of 89% and operating margins near 61%. • Significant Cash Reserves: At the conclusion of 2015, Gilead had in excess of $26 billion in cash and marketable securities. CEO John Milligan has stated Gilead is actively pursuing acquisition opportunities, specifically to compliment Gilead’s quickly developing oncology research pipeline. Thesis Risks • HCV Competition: The introduction of Merck’s Zepatier has caused significant price erosion for Gilead’s HCV drugs. Q3 earnings showed a 20% decrease in aggregate HCV revenue. However, newly released Epclusa will eclipse $1 billion in sales during its first year on the market. We have included this significant revenue-growth risk by implementing a CV growth of 0.25% Current Price: $77.03 Target Price: $88.31 – 115.98 52-week High $108.63 52-week Low $71.39 Beta Value 1.253 Average Daily Volume 9.86 m Market Capitalization $99.3 b Shares Outstanding 1.32 b Book Value per share $12.76 EPS $10.78 P/E Ratio 7.12 Dividend Yield 1.88% Dividend Payout Ratio 16.71% ROA 22.4% ROE 85.4% Current Ratio 4.49 Debt to Equity 1.16 Profit Margin 48.6% Operating Margin 60.7% Source: Yahoo! Finance Zachary J. Audy Andrew L. Birschbach [email protected] [email protected] Gilead Sciences, Inc. (NYSE: GILD) Stock Recommendation: HOLD November 15 th , 2016 Healthcare
-
Upload
khangminh22 -
Category
Documents
-
view
2 -
download
0
Transcript of Gilead Sciences, Inc. (NYSE: GILD) Healthcare - Tippie ...
Important disclosures on the last page of this report. GILD | 1
Krause Fund Research
Fall 2016
Krause Fund Research Fall 2016
Research Analysts
Investment Thesis We issue a HOLD recommendation for Gilead Sciences. Despite a decrease in HCV sales, we believe solid growth in HIV sales, sustainable profitability, and forthcoming M&A activity will cause Gilead to outperform current market sentiments. Thesis Drivers
• Solid Growth in HIV Sales: Gilead is succeeding in facilitating the adoption of its new HIV products. With increased effectiveness and diminished side-effects, we project HIV sales to increase by up to 16% in 2016 based on YTD sales revenue performance.
• Sustainable Profitability: Despite price erosion in HCV products and increased R&D spending, both projections and YTD performance indicates Gilead will maintain gross margins of 89% and operating margins near 61%.
• Significant Cash Reserves: At the conclusion of 2015, Gilead had in excess of $26 billion in cash and marketable securities. CEO John Milligan has stated Gilead is actively pursuing acquisition opportunities, specifically to compliment Gilead’s quickly developing oncology research pipeline.
Thesis Risks • HCV Competition: The introduction of
Merck’s Zepatier has caused significant price erosion for Gilead’s HCV drugs. Q3 earnings showed a 20% decrease in aggregate HCV revenue. However, newly released Epclusa will eclipse $1 billion in sales during its first year on the market. We have included this significant revenue-growth risk by implementing a CV growth of 0.25%
Current Price: $77.03 Target Price: $88.31 – 115.98
52-week High $108.63 52-week Low $71.39 Beta Value 1.253 Average Daily Volume 9.86 m
Market Capitalization $99.3 b Shares Outstanding 1.32 b Book Value per share $12.76 EPS $10.78 P/E Ratio 7.12 Dividend Yield 1.88% Dividend Payout Ratio 16.71%
ROA 22.4% ROE 85.4%
Current Ratio 4.49 Debt to Equity 1.16 Profit Margin 48.6% Operating Margin 60.7%
Source: Yahoo! Finance
Zachary J. Audy Andrew L. Birschbach [email protected] [email protected]
Gilead Sciences, Inc. (NYSE: GILD)
Stock Recommendation: HOLD November 15th, 2016
Healthcare
Important disclosures on the last page of this report. GILD | 2
Gilead Sciences, Inc. (NYSE: GILD) is a research-based biopharmaceutical company that discovers, develops, and commercializes innovative medical solutions in areas of unmet medical need. Gilead was founded by Michael Riordan in 1987, incorporated in Delaware on June 22nd, 1987 and held its initial public offering in January 1992.1 The company is headquartered in Foster City, California but maintains operations worldwide. Gilead has six primary product categories: HIV, Hepatitis C (HCV), Hepatitis B (HBV), Hematology, Cardiovascular, and Other.2
Throughout its history, Gilead has focused its product development on novel, first-to-market drug therapies for diseases prevalent throughout the world. While the health care sector is generally viewed as defensive in nature, the hyper-demand (and consequent pricing) associated with the novel treatments developed by Gilead cause it to operate largely outside of such theoretical parameters. We have structured our analysis to reflect the most important factors impacting Gilead’s operational decisions. We begin with a discussion of the biopharmaceutical industry, its overall competitive landscape, and key performance metrics amongst companies. However, competition is best understood through examining individual disease treatments. Thus, we examine the specific competitive landscape for each of Gilead’s primary drug therapies. Finally, we consider macroeconomic factors that influence the health care sector before describing how we each of these lenses has informed our financial models.
Gilead Sciences, Inc. operates in the biotechnology industry. The biotechnology industry involves the development of biological and biochemical products to be used for improving human health, animal health, and the broader environment. Biological drug products include treatments and the development of new products for oncology, cardiovascular health, infectious disease, autoimmune disorders, neurological disorders and mental health disorders. Gilead Sciences, Inc. specifically operates in the sub-industry of biopharmaceuticals. The biopharmaceutical industry has significantly outperformed the S&P 500 in recent years. From January 1, 2011 through December 31, 2015 the S&P 1500 Biotechnology Index rose 309.2% compared with a 130.8% increase for the broader S&P Health Care Index.21
The S&P 1500 Biotechnology Index has underperformed in 2016, down 5.9% YTD through November 15, 2016.22 One potential high-level cause of this underperformance may include scrutiny of high drug prices in the United States. Another possible cause of the underperformance may be due to decelerating sales growth. From 2012 to 2015, sales’ compound annual growth rate for biotechnology companies was 20.3%, while forecasts for 2016 decrease to 6.4%.1
R&D, a biopharmaceutical company’s investment in its scientific team, is the most critical component of maintaining and increasing future sales revenue/profits. Novel drug therapies provide opportunity for the greatest return on investment, as previously unsatisfied demand for disease cures allows for high prices until rival drugs can force price erosion. The patent approval process provides biopharmaceutical companies with exclusive intellectual property protection to profit from their R&D advancements for stipulated period of time. FDA Approval Process The biopharmaceutical industry is subject to substantial government regulation. Because drugs can have harmful side-effects, an extensive approval process must be passed before companies can earn revenue on developmental products. As such, a primary arena of biopharmaceutical competition is the Food and Drug Administration’s (FDA) approval process:
• Stage One: Early Discovery and Preclinical Development This stage involves discovering genetic linkages for diseases of interest, developing biochemical compounds for testing, performing tests on animal subjects in preclinical trials, and filing a New Drug Application (NDA) to advance to clinical trials. This stage usually requires the greatest R&D investment for biopharmaceutical companies.21
• Stage Two: Clinical Trials (Three Phases)
Phase One involves assessing the drug’s safety by providing a small amount of the drug to a small population. The dosage is then incrementally increased in small amounts. Phase Two involves assessing the drug’s effectiveness by providing the drug to those afflicted with the illness/disease of interest. Phase Three involves a further investigation of the drug’s safety and effectiveness by providing it to a larger population. Following the clinical trials, scientists may send a formal Biologics
Executive Summary
Industry Analysis
Important disclosures on the last page of this report. GILD | 3
License Application (BLA) to the FDA for further review.21
• Stage Three: Regulatory Filing and Review
If the NDA or BLA is approved by the FDA, the FDA creates documents containing information about the biochemical composition of the drug and its treatment symptoms. Finally, the FDA reviews the drug in an even larger population to assess whether the drug displays any significant side effects.21
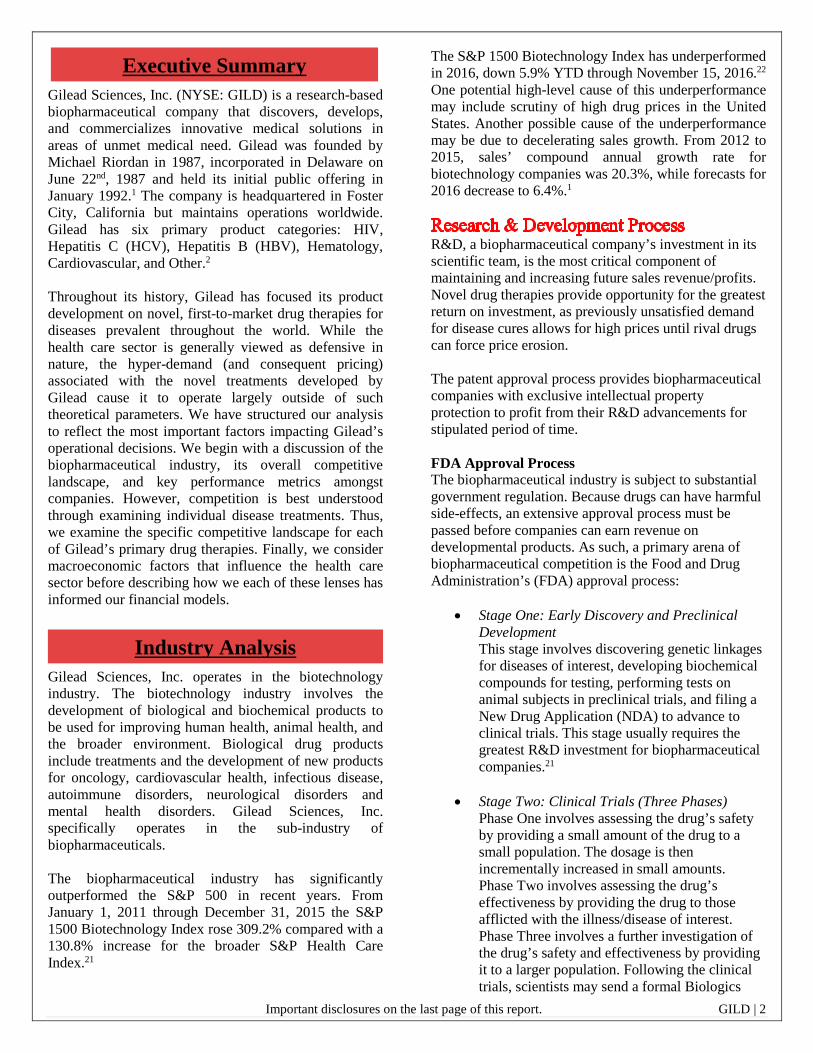
According to the FDA, 70% of drugs in Stage One move on to Stage Two, 33% of drugs in Stage Two move on to Stage Three, and 27% of drugs in Stage Three move are approved. Approximately 6 in 100 drugs make it from Phase 1 to the FDA process at the average cost of $39 million.
Source: U.S. Department of Health & Human Services Thus, biopharmaceutical companies seek to have a diverse portfolio of drugs throughout the various stages of the FDA approval process, as drug pipelines are drivers of future revenue growth.
A Porter’s Five Forces analysis details the precise competitive forces that face companies within the biopharmaceutical industry. Threat of Entry: Low Gaining FDA approval for a drug therapy requires substantial research and development expense and time. Once FDA approval is gained, low production costs allow firms to maintain high profit margins, a factor that increases the attractiveness of the biopharmaceutical industry. Another significant barrier to entry is the legal team required to navigate the complex patent laws that the industry is organized around. Extent of Rivalry: High Substantial rivalry exists in the markets for individual diseases. The first-to-market treatment for a previously untreatable disease is allowed to name its price, enjoying substantial profit margins. As such, a company can enjoy
a monopoly-like market share for a disease until another drug passes FDA approval and is then adopted by doctors, hospitals, and health insurance companies. Thus, firms attempt to diversify research pipelines in order to maintain revenue in multiple disease markets. Buyer Bargaining Power: Low, but Rising People that are afflicted with a life-threatening disease typically have very little bargaining power in terms of drug price. However, pricing pressure from competitors results in reduced cost to the customer as companies compete directly against one another’s products for market share. The biopharmaceutical industry has also recently become a target for pricing scrutiny due to cases such as Mylan increasing the cost of the EpiPen approximately 400% and Martin Shkreli increasing the price of Daraprim by a factor of 56.23
While the end consumers of most specialty drugs have little bargaining power, health maintenance organizations and pharmacy benefit managers (a middle-man between pharmaceutical companies and health providers) do. They can choose whether or not to subsidize a drug, which could negatively impact drug sales. Supplier Bargaining Power: Low Due to the large amount of drug manufacturers and the limited amount of drug patents, supplier bargaining power is low. The bargaining power of scientists that work for biopharmaceutical companies is also low, because the employment contracts of such scientists grant the companies exclusive rights to any intellectual property discovered by the scientists during their employment. Threat of Substitutes: Low Patents grant companies the ability to produce a drug with a low threat of substitutes. Once the patent expires, there will likely be an influx of substitutes in the form of generics/biosimilars.24
While thousands of firms would classify themselves as biopharmaceutical companies, the majority of both market share and profitability is consolidated amongst a fairly small number of larger firms. Direct competition between entire biopharmaceutical companies is rare. Highly specific competition exists for companies that offer products that treat the same disease. These rivalries can involve significant price erosion, as each company in a particular disease market competes for market share.
Important disclosures on the last page of this report. GILD | 4
$-
$50,000
GILD ABBV MRK BMY AMG CELG BIIB GSK
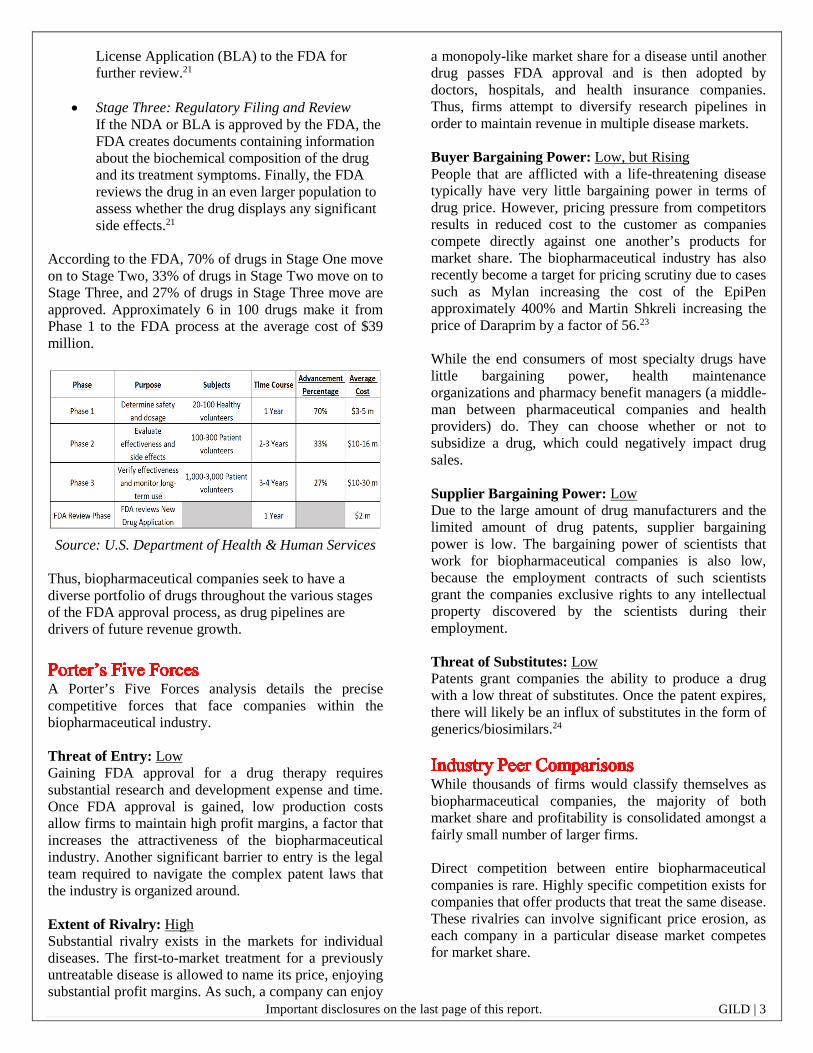
Annual Sales Revenue (billions)
2012 2013 2014 2015
0.0%
10.0%
20.0%
30.0%
2012 2013 2014 2015 2016
R&D as % of Revenue
Gilead R&D as % of Revenue
Peer Average R&D as % of Revenue
0.00%
50.00%
GILD ABBV MRK BMY AMG CELG GSK BIIB
SGA as % of Revenue
2015 SGA as % of Revenue
2016 YTD SGA as % of Revenue
However, all biopharmaceutical companies operate in what can be understood as a positive feedback loop.
• Once a drug clears the FDA approval process, the firm is able to increase revenue which can be reinvested into the R&D process.
• The more capital available for investment, the more innovative (i.e., inherently risky, higher-reward) disease treatments can be pursued.
• The more innovative an R&D program, the greater the likelihood of releasing a first-to-market drug therapy.
Source: GILD, ABBV, MRK, BYM, AMG, CELG, BIIB, GSK 10-K
Source: Yahoo! Finance Gilead has exhibited precisely the aforementioned positive feedback loop behavior with its flagship HCV medications: Sovaldi and Harvoni.
• First-to-market monopolization of market share • Rapid revenue growth at high prices due to
filling a substantial medical need • Significant cash reserves for discretionary
management decisions
Research & Development Efficiency We believe that an important metric within the biopharmaceutical industry is R&D expense as a percentage of total sales revenue. Specifically, we believe this metric represents a company’s fiscal dedication to its research program. Gilead has spent less on R&D as a percentage of revenue over the past three years compared to peer averages.
While the company has increased their R&D expenditures, their sales revenue has disproportionately risen due to the historic success of two HCV drugs: Harvoni and Sovaldi. Ultimately, we believe that higher R&D expense as a percentage of revenue leads to more successful pipeline development. Specifically, higher capital investment occurs as a drug advances through the three stages of the FDA approval process. Thus, increases in R&D spending indicate healthy scientific programs. Based on Q3 results, Gilead has increased their R&D expense YTD in 2016. This reflects the presence of three oncology drugs reaching Stage Three of the FDA approval process.
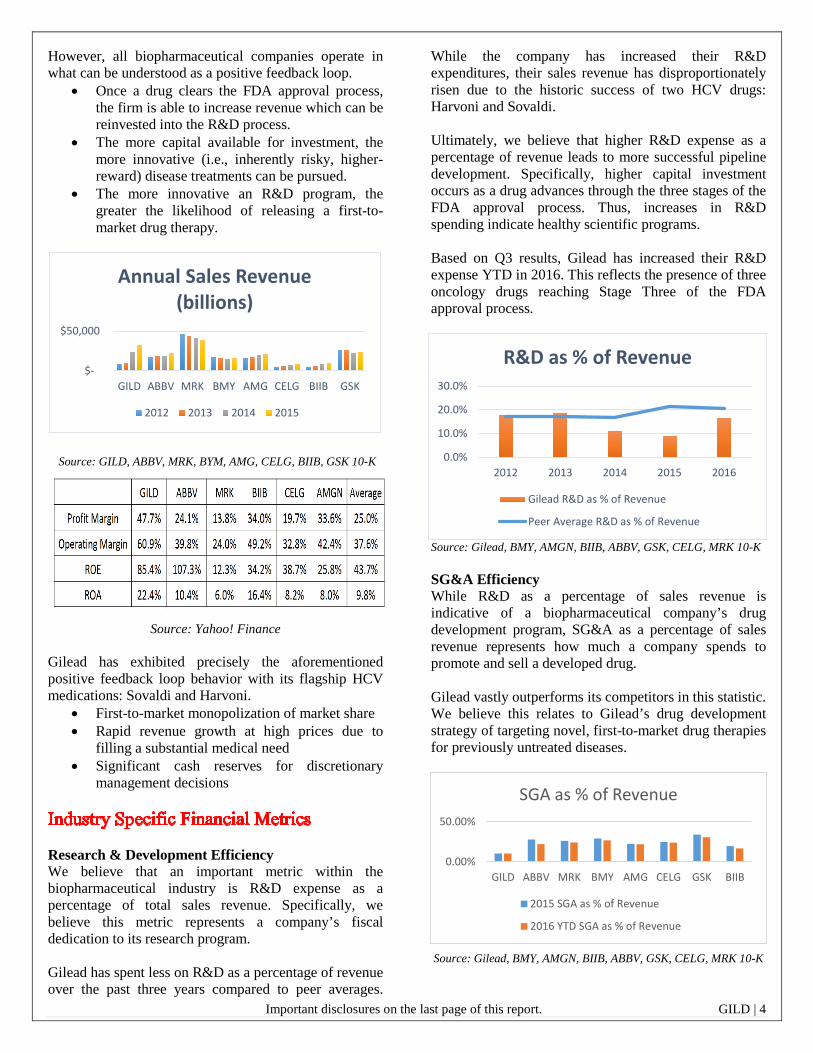
Source: Gilead, BMY, AMGN, BIIB, ABBV, GSK, CELG, MRK 10-K SG&A Efficiency While R&D as a percentage of sales revenue is indicative of a biopharmaceutical company’s drug development program, SG&A as a percentage of sales revenue represents how much a company spends to promote and sell a developed drug. Gilead vastly outperforms its competitors in this statistic. We believe this relates to Gilead’s drug development strategy of targeting novel, first-to-market drug therapies for previously untreated diseases.
Source: Gilead, BMY, AMGN, BIIB, ABBV, GSK, CELG, MRK 10-K
Important disclosures on the last page of this report. GILD | 5
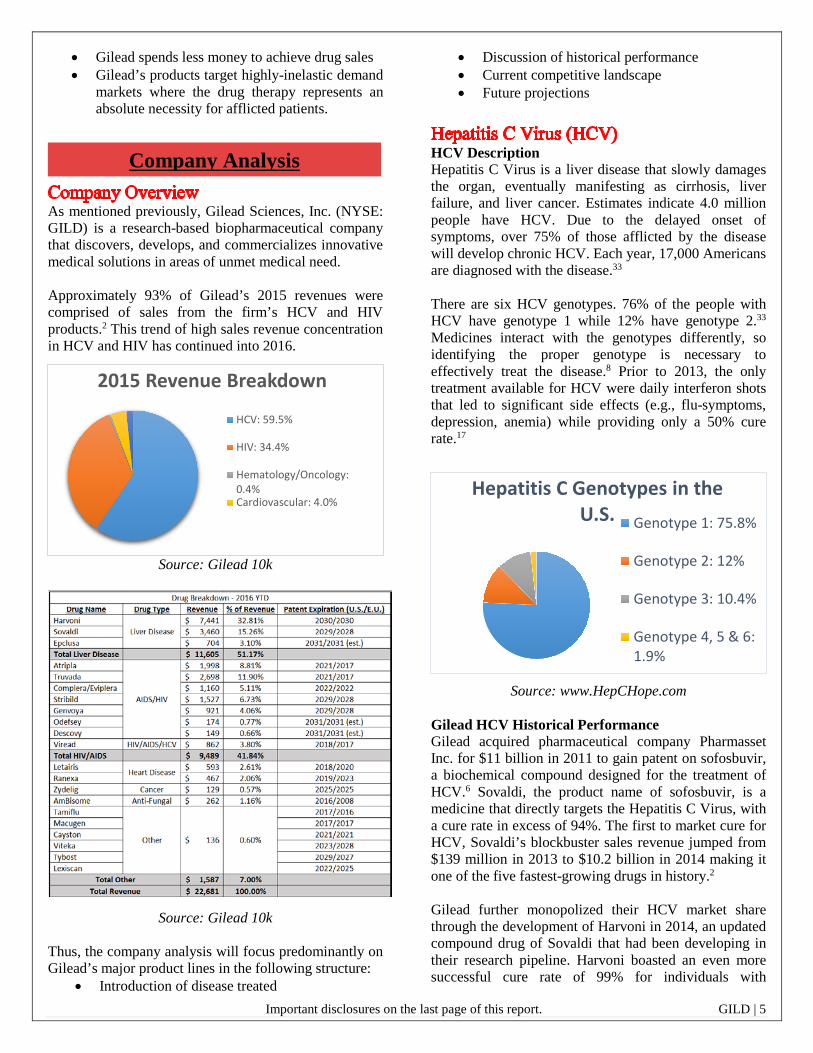
2015 Revenue Breakdown
HCV: 59.5%
HIV: 34.4%
Hematology/Oncology:0.4%Cardiovascular: 4.0%
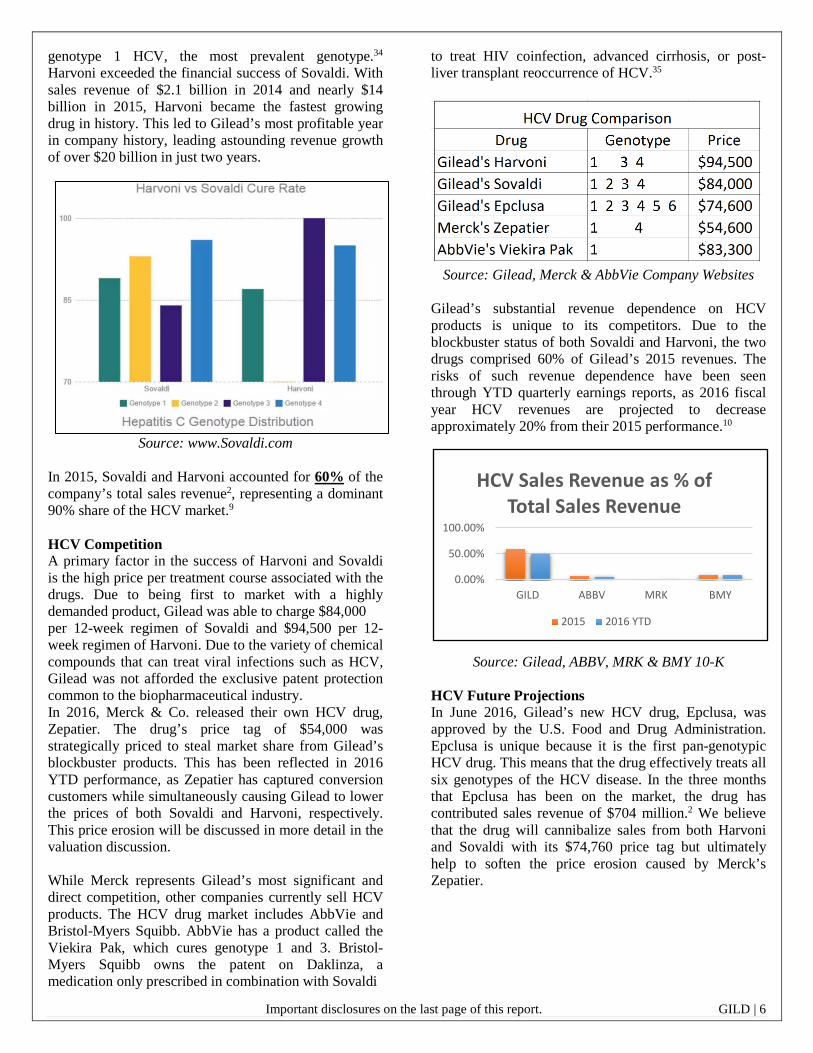
Hepatitis C Genotypes in the U.S. Genotype 1: 75.8%
Genotype 2: 12%
Genotype 3: 10.4%
Genotype 4, 5 & 6:1.9%
• Gilead spends less money to achieve drug sales • Gilead’s products target highly-inelastic demand
markets where the drug therapy represents an absolute necessity for afflicted patients.
As mentioned previously, Gilead Sciences, Inc. (NYSE: GILD) is a research-based biopharmaceutical company that discovers, develops, and commercializes innovative medical solutions in areas of unmet medical need. Approximately 93% of Gilead’s 2015 revenues were comprised of sales from the firm’s HCV and HIV products.2 This trend of high sales revenue concentration in HCV and HIV has continued into 2016.
Source: Gilead 10k
Source: Gilead 10k Thus, the company analysis will focus predominantly on Gilead’s major product lines in the following structure:
• Introduction of disease treated
• Discussion of historical performance • Current competitive landscape • Future projections
HCV Description Hepatitis C Virus is a liver disease that slowly damages the organ, eventually manifesting as cirrhosis, liver failure, and liver cancer. Estimates indicate 4.0 million people have HCV. Due to the delayed onset of symptoms, over 75% of those afflicted by the disease will develop chronic HCV. Each year, 17,000 Americans are diagnosed with the disease.33
There are six HCV genotypes. 76% of the people with HCV have genotype 1 while 12% have genotype 2.33 Medicines interact with the genotypes differently, so identifying the proper genotype is necessary to effectively treat the disease.8 Prior to 2013, the only treatment available for HCV were daily interferon shots that led to significant side effects (e.g., flu-symptoms, depression, anemia) while providing only a 50% cure rate.17
Source: www.HepCHope.com Gilead HCV Historical Performance Gilead acquired pharmaceutical company Pharmasset Inc. for $11 billion in 2011 to gain patent on sofosbuvir, a biochemical compound designed for the treatment of HCV.6 Sovaldi, the product name of sofosbuvir, is a medicine that directly targets the Hepatitis C Virus, with a cure rate in excess of 94%. The first to market cure for HCV, Sovaldi’s blockbuster sales revenue jumped from $139 million in 2013 to $10.2 billion in 2014 making it one of the five fastest-growing drugs in history.2 Gilead further monopolized their HCV market share through the development of Harvoni in 2014, an updated compound drug of Sovaldi that had been developing in their research pipeline. Harvoni boasted an even more successful cure rate of 99% for individuals with
Company Analysis
Important disclosures on the last page of this report. GILD | 6
0.00%
50.00%
100.00%
GILD ABBV MRK BMY
HCV Sales Revenue as % of Total Sales Revenue
2015 2016 YTD
genotype 1 HCV, the most prevalent genotype.34 Harvoni exceeded the financial success of Sovaldi. With sales revenue of $2.1 billion in 2014 and nearly $14 billion in 2015, Harvoni became the fastest growing drug in history. This led to Gilead’s most profitable year in company history, leading astounding revenue growth of over $20 billion in just two years.
Source: www.Sovaldi.com In 2015, Sovaldi and Harvoni accounted for 60% of the company’s total sales revenue2, representing a dominant 90% share of the HCV market.9
HCV Competition A primary factor in the success of Harvoni and Sovaldi is the high price per treatment course associated with the drugs. Due to being first to market with a highly demanded product, Gilead was able to charge $84,000 per 12-week regimen of Sovaldi and $94,500 per 12-week regimen of Harvoni. Due to the variety of chemical compounds that can treat viral infections such as HCV, Gilead was not afforded the exclusive patent protection common to the biopharmaceutical industry. In 2016, Merck & Co. released their own HCV drug, Zepatier. The drug’s price tag of $54,000 was strategically priced to steal market share from Gilead’s blockbuster products. This has been reflected in 2016 YTD performance, as Zepatier has captured conversion customers while simultaneously causing Gilead to lower the prices of both Sovaldi and Harvoni, respectively. This price erosion will be discussed in more detail in the valuation discussion. While Merck represents Gilead’s most significant and direct competition, other companies currently sell HCV products. The HCV drug market includes AbbVie and Bristol-Myers Squibb. AbbVie has a product called the Viekira Pak, which cures genotype 1 and 3. Bristol-Myers Squibb owns the patent on Daklinza, a medication only prescribed in combination with Sovaldi
to treat HIV coinfection, advanced cirrhosis, or post-liver transplant reoccurrence of HCV.35
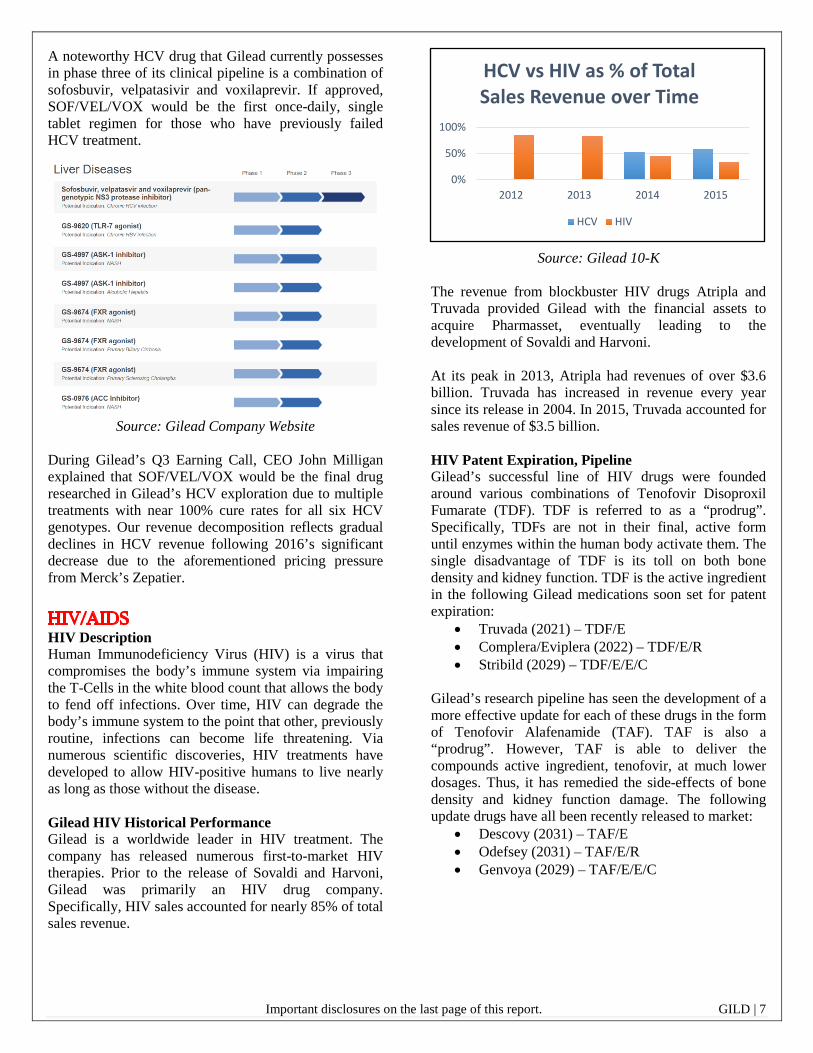
Source: Gilead, Merck & AbbVie Company Websites
Gilead’s substantial revenue dependence on HCV products is unique to its competitors. Due to the blockbuster status of both Sovaldi and Harvoni, the two drugs comprised 60% of Gilead’s 2015 revenues. The risks of such revenue dependence have been seen through YTD quarterly earnings reports, as 2016 fiscal year HCV revenues are projected to decrease approximately 20% from their 2015 performance.10
Source: Gilead, ABBV, MRK & BMY 10-K HCV Future Projections In June 2016, Gilead’s new HCV drug, Epclusa, was approved by the U.S. Food and Drug Administration. Epclusa is unique because it is the first pan-genotypic HCV drug. This means that the drug effectively treats all six genotypes of the HCV disease. In the three months that Epclusa has been on the market, the drug has contributed sales revenue of $704 million.2 We believe that the drug will cannibalize sales from both Harvoni and Sovaldi with its $74,760 price tag but ultimately help to soften the price erosion caused by Merck’s Zepatier.
Important disclosures on the last page of this report. GILD | 7
0%
50%
100%
2012 2013 2014 2015
HCV vs HIV as % of Total Sales Revenue over Time
HCV HIV
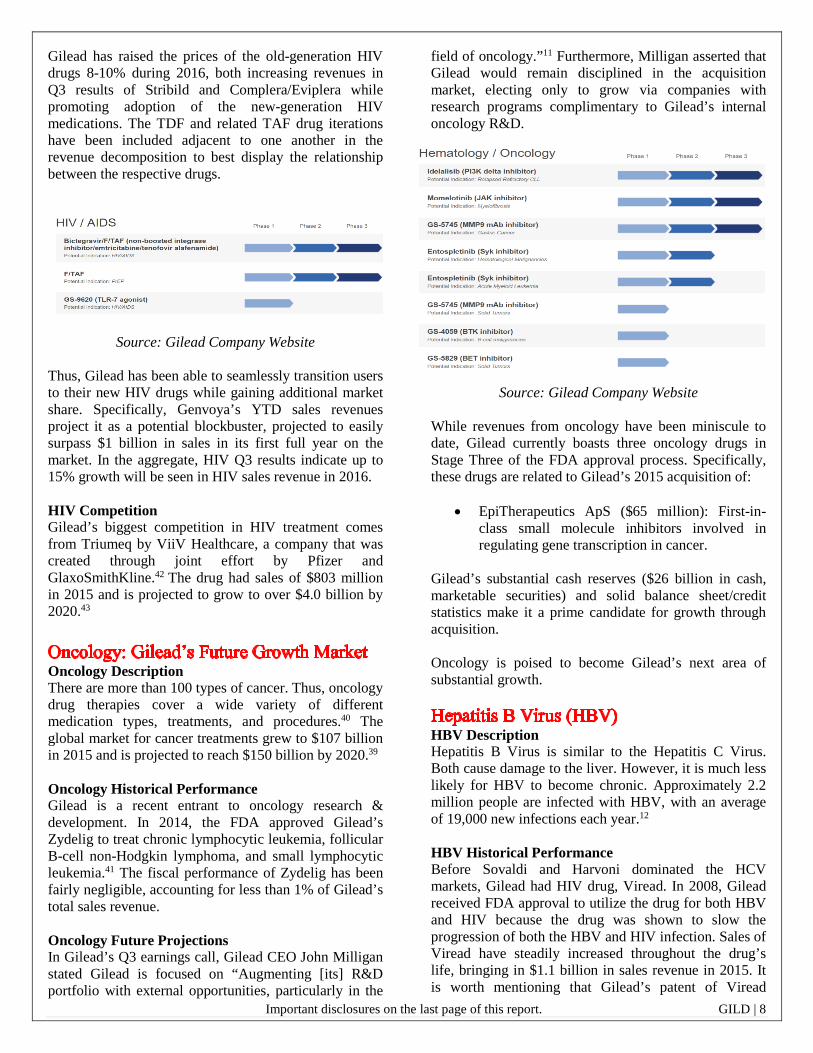
A noteworthy HCV drug that Gilead currently possesses in phase three of its clinical pipeline is a combination of sofosbuvir, velpatasivir and voxilaprevir. If approved, SOF/VEL/VOX would be the first once-daily, single tablet regimen for those who have previously failed HCV treatment.
Source: Gilead Company Website During Gilead’s Q3 Earning Call, CEO John Milligan explained that SOF/VEL/VOX would be the final drug researched in Gilead’s HCV exploration due to multiple treatments with near 100% cure rates for all six HCV genotypes. Our revenue decomposition reflects gradual declines in HCV revenue following 2016’s significant decrease due to the aforementioned pricing pressure from Merck’s Zepatier.
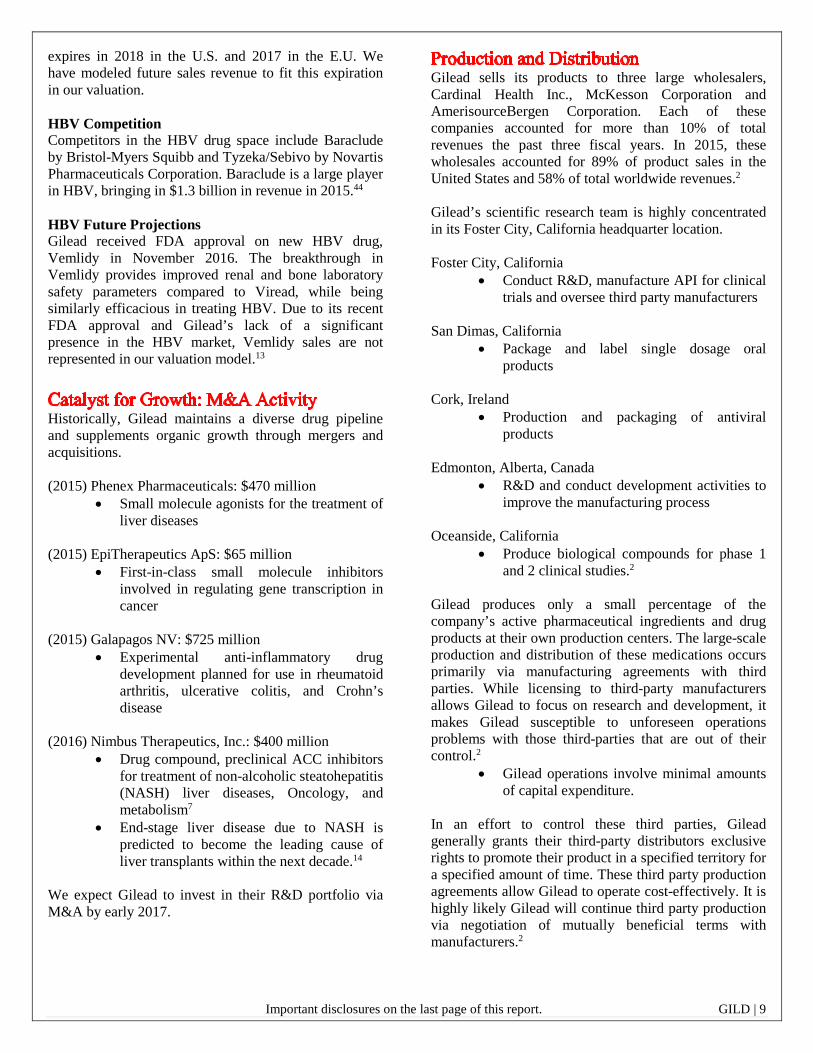
HIV Description Human Immunodeficiency Virus (HIV) is a virus that compromises the body’s immune system via impairing the T-Cells in the white blood count that allows the body to fend off infections. Over time, HIV can degrade the body’s immune system to the point that other, previously routine, infections can become life threatening. Via numerous scientific discoveries, HIV treatments have developed to allow HIV-positive humans to live nearly as long as those without the disease. Gilead HIV Historical Performance Gilead is a worldwide leader in HIV treatment. The company has released numerous first-to-market HIV therapies. Prior to the release of Sovaldi and Harvoni, Gilead was primarily an HIV drug company. Specifically, HIV sales accounted for nearly 85% of total sales revenue.
Source: Gilead 10-K The revenue from blockbuster HIV drugs Atripla and Truvada provided Gilead with the financial assets to acquire Pharmasset, eventually leading to the development of Sovaldi and Harvoni. At its peak in 2013, Atripla had revenues of over $3.6 billion. Truvada has increased in revenue every year since its release in 2004. In 2015, Truvada accounted for sales revenue of $3.5 billion. HIV Patent Expiration, Pipeline Gilead’s successful line of HIV drugs were founded around various combinations of Tenofovir Disoproxil Fumarate (TDF). TDF is referred to as a “prodrug”. Specifically, TDFs are not in their final, active form until enzymes within the human body activate them. The single disadvantage of TDF is its toll on both bone density and kidney function. TDF is the active ingredient in the following Gilead medications soon set for patent expiration:
• Truvada (2021) – TDF/E • Complera/Eviplera (2022) – TDF/E/R • Stribild (2029) – TDF/E/E/C
Gilead’s research pipeline has seen the development of a more effective update for each of these drugs in the form of Tenofovir Alafenamide (TAF). TAF is also a “prodrug”. However, TAF is able to deliver the compounds active ingredient, tenofovir, at much lower dosages. Thus, it has remedied the side-effects of bone density and kidney function damage. The following update drugs have all been recently released to market:
• Descovy (2031) – TAF/E • Odefsey (2031) – TAF/E/R • Genvoya (2029) – TAF/E/E/C
Important disclosures on the last page of this report. GILD | 8
Gilead has raised the prices of the old-generation HIV drugs 8-10% during 2016, both increasing revenues in Q3 results of Stribild and Complera/Eviplera while promoting adoption of the new-generation HIV medications. The TDF and related TAF drug iterations have been included adjacent to one another in the revenue decomposition to best display the relationship between the respective drugs.
Source: Gilead Company Website Thus, Gilead has been able to seamlessly transition users to their new HIV drugs while gaining additional market share. Specifically, Genvoya’s YTD sales revenues project it as a potential blockbuster, projected to easily surpass $1 billion in sales in its first full year on the market. In the aggregate, HIV Q3 results indicate up to 15% growth will be seen in HIV sales revenue in 2016. HIV Competition Gilead’s biggest competition in HIV treatment comes from Triumeq by ViiV Healthcare, a company that was created through joint effort by Pfizer and GlaxoSmithKline.42 The drug had sales of $803 million in 2015 and is projected to grow to over $4.0 billion by 2020.43
Oncology Description There are more than 100 types of cancer. Thus, oncology drug therapies cover a wide variety of different medication types, treatments, and procedures.40 The global market for cancer treatments grew to $107 billion in 2015 and is projected to reach $150 billion by 2020.39 Oncology Historical Performance Gilead is a recent entrant to oncology research & development. In 2014, the FDA approved Gilead’s Zydelig to treat chronic lymphocytic leukemia, follicular B-cell non-Hodgkin lymphoma, and small lymphocytic leukemia.41 The fiscal performance of Zydelig has been fairly negligible, accounting for less than 1% of Gilead’s total sales revenue.
Oncology Future Projections In Gilead’s Q3 earnings call, Gilead CEO John Milligan stated Gilead is focused on “Augmenting [its] R&D portfolio with external opportunities, particularly in the
field of oncology.”11 Furthermore, Milligan asserted that Gilead would remain disciplined in the acquisition market, electing only to grow via companies with research programs complimentary to Gilead’s internal oncology R&D.
Source: Gilead Company Website While revenues from oncology have been miniscule to date, Gilead currently boasts three oncology drugs in Stage Three of the FDA approval process. Specifically, these drugs are related to Gilead’s 2015 acquisition of:
• EpiTherapeutics ApS ($65 million): First-in-class small molecule inhibitors involved in regulating gene transcription in cancer.
Gilead’s substantial cash reserves ($26 billion in cash, marketable securities) and solid balance sheet/credit statistics make it a prime candidate for growth through acquisition. Oncology is poised to become Gilead’s next area of substantial growth.
HBV Description Hepatitis B Virus is similar to the Hepatitis C Virus. Both cause damage to the liver. However, it is much less likely for HBV to become chronic. Approximately 2.2 million people are infected with HBV, with an average of 19,000 new infections each year.12 HBV Historical Performance Before Sovaldi and Harvoni dominated the HCV markets, Gilead had HIV drug, Viread. In 2008, Gilead received FDA approval to utilize the drug for both HBV and HIV because the drug was shown to slow the progression of both the HBV and HIV infection. Sales of Viread have steadily increased throughout the drug’s life, bringing in $1.1 billion in sales revenue in 2015. It is worth mentioning that Gilead’s patent of Viread
Important disclosures on the last page of this report. GILD | 9
expires in 2018 in the U.S. and 2017 in the E.U. We have modeled future sales revenue to fit this expiration in our valuation. HBV Competition Competitors in the HBV drug space include Baraclude by Bristol-Myers Squibb and Tyzeka/Sebivo by Novartis Pharmaceuticals Corporation. Baraclude is a large player in HBV, bringing in $1.3 billion in revenue in 2015.44 HBV Future Projections Gilead received FDA approval on new HBV drug, Vemlidy in November 2016. The breakthrough in Vemlidy provides improved renal and bone laboratory safety parameters compared to Viread, while being similarly efficacious in treating HBV. Due to its recent FDA approval and Gilead’s lack of a significant presence in the HBV market, Vemlidy sales are not represented in our valuation model.13
Historically, Gilead maintains a diverse drug pipeline and supplements organic growth through mergers and acquisitions. (2015) Phenex Pharmaceuticals: $470 million
• Small molecule agonists for the treatment of liver diseases
(2015) EpiTherapeutics ApS: $65 million
• First-in-class small molecule inhibitors involved in regulating gene transcription in cancer
(2015) Galapagos NV: $725 million
• Experimental anti-inflammatory drug development planned for use in rheumatoid arthritis, ulcerative colitis, and Crohn’s disease
(2016) Nimbus Therapeutics, Inc.: $400 million
• Drug compound, preclinical ACC inhibitors for treatment of non-alcoholic steatohepatitis (NASH) liver diseases, Oncology, and metabolism7
• End-stage liver disease due to NASH is predicted to become the leading cause of liver transplants within the next decade.14
We expect Gilead to invest in their R&D portfolio via M&A by early 2017.
Gilead sells its products to three large wholesalers, Cardinal Health Inc., McKesson Corporation and AmerisourceBergen Corporation. Each of these companies accounted for more than 10% of total revenues the past three fiscal years. In 2015, these wholesales accounted for 89% of product sales in the United States and 58% of total worldwide revenues.2 Gilead’s scientific research team is highly concentrated in its Foster City, California headquarter location. Foster City, California
• Conduct R&D, manufacture API for clinical trials and oversee third party manufacturers
San Dimas, California
• Package and label single dosage oral products
Cork, Ireland
• Production and packaging of antiviral products
Edmonton, Alberta, Canada
• R&D and conduct development activities to improve the manufacturing process
Oceanside, California
• Produce biological compounds for phase 1 and 2 clinical studies.2
Gilead produces only a small percentage of the company’s active pharmaceutical ingredients and drug products at their own production centers. The large-scale production and distribution of these medications occurs primarily via manufacturing agreements with third parties. While licensing to third-party manufacturers allows Gilead to focus on research and development, it makes Gilead susceptible to unforeseen operations problems with those third-parties that are out of their control.2
• Gilead operations involve minimal amounts of capital expenditure.
In an effort to control these third parties, Gilead generally grants their third-party distributors exclusive rights to promote their product in a specified territory for a specified amount of time. These third party production agreements allow Gilead to operate cost-effectively. It is highly likely Gilead will continue third party production via negotiation of mutually beneficial terms with manufacturers.2

Important disclosures on the last page of this report. GILD | 10
Demographic research shows that the United States has an ageing population. With an ageing population, healthcare needs are shifting, and as a result, demand for healthcare is increasing. As of 2011, the baby boomer generation has turned 65. By 2030, more than 60% of this generation will have at least 1 chronic condition. This statistic indicates a promising future need for healthcare.
• We believe the ageing population represents a unique growth opportunity for Gilead’s oncology product line expansion.
Additionally, the increase in the world population will lead to an increase in the need for health care services. By 2050 the world population is expected to grow from 7 billion to 9.5 billion.30
The Patient Protection and Affordable Care Act has been the largest driver of change in the health care sector in this decade following the legislation’s passing in 2010. The ACA has been successful in reducing the amount of citizens in the U.S. without healthcare.
• An increase in the number of citizens with access to healthcare means an increase in the number of paying customers for companies in the healthcare sector.
Source: Gallup-Healthways Well-Being Index Government intervention in the health care system is poised for significant revisions following Donald Trump’s presidential election and a Republican controlled House of Representatives. Specifically, Trump has stated:
• Desire to abolish ACA’s Individual Mandate that requires a tax penalty for each full
month that a citizen does not have health care
• Promotion of free-market policies that allow for consumer shopping of insurance plans across state lines.
Perhaps most significant to the biopharmaceutical industry, Hillary Clinton’s scrutiny of high-drug prices will not influence legislation in the executive branch of the federal government.
• From Election Day (November 8, 2016) to today, NASDAQ Biotechnology Index has increased by 11.24%.
• Limited government regulation represents more positive environment for biopharmaceutical industry profitability
Unemployment is an important economic indicator for the health care sector because it materially affects demand for health care goods and services. The unemployment rate is significantly, negatively correlated with the possession of health insurance, as most Americans rely on employer-provided insurance. For adult males, a 1% increase in the unemployment rate results in a 1.67% decrease in the probability of having health insurance and a 1% decrease in the probability of having company-paid health insurance.14
According to a National Center for Health Statistics study, in adults aged 18-64, 48.1% of unemployed citizens had health insurance while 81.4% of employed citizens had health insurance coverage.15
Source: National Center for Health Statistics Similarly, the unemployment rate is significantly, negatively correlated with the utilization of preventative health care services. A 1% increase in the unemployment rate results in a 1.58% decrease in such services.16
Preventative medicine often carries high one-time costs and is therefore viewed as a luxury, rather than a treatment necessity.
Economic Analysis
Important disclosures on the last page of this report. GILD | 11
Thus, although health care is generally considered a defensive sector, evidence indicates it still suffers from decreased demand during recessionary periods.
For 2015-2025, health spending is projected to grow at an average rate of 5.8 percent per year. Health spending is projected to grow 1.3 percent faster than Gross Domestic Product per year over this period; as a result, the health share of GDP is expected to rise from 17.5% in 2014 to 20.1% by 2025. As the initial impacts associated with the Affordable Care Act’s coverage expansions fade, growth in health spending is expected to respond to changes in economic growth, faster growth in medical prices, and population aging. By the end of the projection, Federal, state and local governments are projected to finance 47% of national health spending, an increase compared to 45% in 2014. Health spending growth is expected to accelerate and average 5.7% for 2017 through 2019 as a result of gradual increases in economy-wide and medical-specific prices. Also contributing to faster average growth over these three years are increases in the use and intensity of medical goods and services driven by greater gains in disposable personal income.45
Gilead has made plans to expand operations into 101 countries. This endeavor will provide Gilead with an increased market, but will also increase susceptibility to exchange rate risk due to the increase in the number of countries the company plans to expand operations into.
For our valuation model, we utilized a 3 Year, Raw Beta based on monthly returns of 1.253. We believe this time period best encompasses the firm’s future performance conditions in relation to broader market conditions. Based on a market risk premium of 6.0%, 10-Year Treasury Note risk-free rate of 2.94%, and the 4.4% YTM of Gilead’s 30-Year Corporate Bond, we have utilized a WACC of 9.21% throughout our model. Revenue Decomposition Revenue growth within the forecasted period will depend primarily on:
• Strategic efforts to combat price erosion on HCV drugs by Merck’s Zepatier
• Continued adoption and growth of next-generation HIV treatments
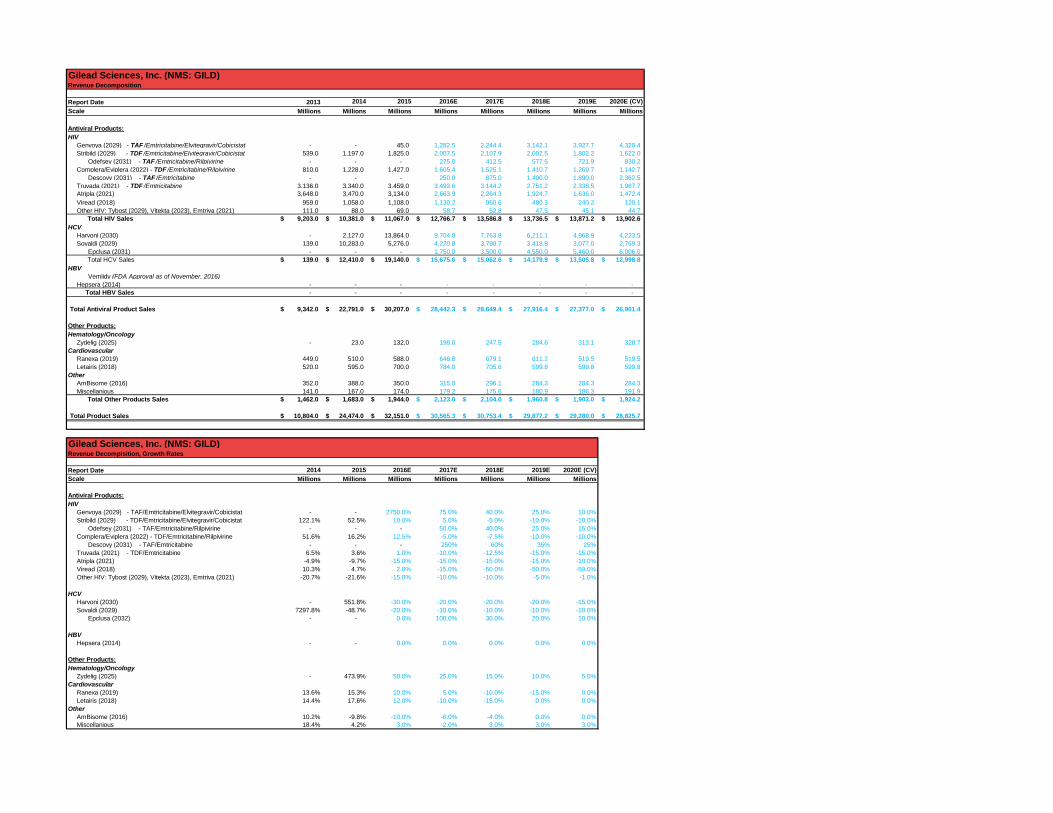
To this end, we forecast that Gilead’s period of astronomic revenue growth is over. However, we believe that stable growth in TAF-HIV treatments will help to mitigate the significant price erosion seen in Q3 HCV results. Thus, we ultimately project profits to remain stable within the range of $28-30 billion through the forecasted period of 2020. Price Adjustments to Merck’s Zepatier Gilead has lowered the price of Sovaldi near the $54,000 price tag of Zepatier, a 35% reduction in price from its original $84,000. However, we believe this decrease in price will be accompanied by increased sales quantity through adoption from Harvoni users. Specifically, we believe that Sovaldi will compete directly with Zepatier for genotype 1 HCV patients (76% of HCV cases). Thus, Gilead will retain its dominant market share in the treatment of genotypes 2 & 3 with the higher priced Harvoni and newly-introduced Epclusa, as Zepatier is unable to treat either of these genotypes. This coverage gap will allow Gilead to charge a premium price for each treatment. Zepatier’s coverage gap represents 12% (genotype 2) and 10.4% (genotype 3) of all HCV patients, respectively. Q3 results have supported this projection, as Epclusa generated $640 million in sales revenue during its first full quarter on the market due to its ability to treat all six HCV genotypes. Adoption of HIV Treatments Faced with multiple upcoming patent expirations, Gilead has brought multiple HIV treatments to market throughout 2016. Composed of the same chemical formulas as the successful TDF drugs (Stribild, Complera/Eviplrea, Truvada), the new TAF drugs (Genvoya, Odefsey, Descovy) will provide the same efficacy as the old offerings with a much lower impact on kidney health and bone density. Gilead has deftly raised the prices of the old-generation HIV drugs 8-10% during 2016, both increasing revenues in Q3 results of Stribild and Complera/Eviplera while promoting adoption of the new-generation HIV medications at a slight premium in price. The TDF and related TAF drug iterations have been included adjacent to one another in the revenue decomposition to best display the relationship between the respective drugs. While the new-generation HIV drugs have only gained 6-10% of customers from outside of Gilead’s product line, the price increase and significant reduction in side-effects underlies our modest growth projections for the HIV product line as a whole.
Valuation Discussion
Important disclosures on the last page of this report. GILD | 12
These factors coalesce to inform our modest CV growth rate of 0.50%. Ultimately, we believe Gilead’s substantial cash reserves, solid credit statistics, and early pipeline development in novel disease areas indicate growth through acquisition to be forthcoming. This suspicion was confirmed by CEO John Milligan’s Q3 earnings call comments that numerous acquisitions had recently been considered. He stated that management would remain disciplined in considering only companies whose scientific developments complemented Gilead’s current R&D portfolio. Operating Assumptions Operating Expenses As detailed in the analysis of industry competition, Gilead has routinely spent a smaller percentage of its revenue on R&D expense than its primary competitors. Due to the lack of blockbuster potential in Gilead’s immediate pipeline, we have projected R&D expense at an increased 14% of sales revenue due to the need to replace declining revenues. This increase has been observed in Gilead’s YTD quarterly earnings reports. Both COGS and SG&A have been projected at 11% of sales revenue, consistent with their recent historical averages. Profit Margin Forecasts Gross margin will decrease slightly to 89% throughout the forecast period due to the decrease in Solvaldi and Harvoni treatment prices. Similarly, operating margin will decrease from a peak of 68% in 2015 to a projected 61% throughout the forecasted period. Once drugs are discovered, production involves inexpensive raw materials and low labor costs. Thus, Gilead will remain a leader in the biopharmaceutical industry in profitability. Model Results Both our DCF/EP and DDM results reveal that the market’s current price of $77.03 is under-valuing Gilead. We believe Gilead has upside potential, and thus recommend a HOLD rating for the Krause Fund portfolio. Specifically, we have recommended a target price range of $88.31 (DDM) to $115.98 (DCF).
1. Gilead: About. (n.d.). Retrieved from http://www.gilead.com/about
2. Gilead Sciences Form 10K (2015, February 25). http://investors.gilead.com/phoenix.zhtml?c=6996 4&p=irol-sec
3. "U.S. Food and Drug Administration Approves Gilead’s Single Tablet Regimen Genvoya® (Elvitegravir, Cobicistat, Emtricitabine and Tenofovir Alafenamide) for Treatment of HIV-1 Infection," http://www.gilead.com/news/press-releases/2015/11/us-food-and-drug-administration-approves-gileads-single-tablet-regimen-genvoya-elvitegravir-cobicistat-emtricitabine-and-tenofovir-alafenamide-for-treatment-of-hiv1-infection
4. Mukherjee, S. (2016, April 5). The FDA just approved another next -gen gilead hiv drug. Fortune. Retrieved from http://fortune.com/2016/04/05/gilead -next -gen - hiv/
5. Google Finance https://www.google.com/finance?q=gild&ei=D4IqWPmqOIW7ep7hpbAJ
6. Lewis Krauskopf and Anand Basu, 11-21-2011, "Gilead bets $11 billion on hepatitis in Pharmasset deal," Reuters, http://www.reuters.com/article/us-gilead-pharmasset-idUSTRE7AK0XU20111121
7. "Gilead Corporate History Timeline," http://www.gilead.com/about/corporate-history-timeline
8. "What is Hepatitis C?," http://hepc.liverfoundation.org/what-is-hepatitis-c/
9. Quinn Foley, "Gilead's Strategy For Epclusa," Seeking Alpha, http://seekingalpha.com/article/3986281-gileads-strategy-epclusa
10. Drugs, 3-9-2016, "How much does Daklinza cost?," https://www.drugs.com/answers/how-much-does-daklinza-cost-3017110.html
11. "Gilead," http://investors.gilead.com/phoenix.zhtml?c=69964&p=IROL-secToc&TOC=aHR0cDovL2FwaS50ZW5rd2l6YXJkLmNvbS9vdXRsaW5lLnhtbD9yZXBvPXRlbmsmaXBhZ2U9MTEyMTcxMjQmc3Vic2lkPTU3&ListAll=1&sXBRL=1
12. Center for Disease Control, “The ABCs of Hepatitis” http://www.cdc.gov/hepatitis/resources/professionals/pdfs/abctable.pdf
13. Tracy Staton, 11-14-2016, "Pharma News," http://www.fiercepharma.com/
14. "Nimbus Therapeutics Granted Fast Track Designation for Its Allosteric ACC Inhibitor, NDI-010976, for the Treatment of NASH," http://www.nimbustx.com/news-events/press-releases/nimbus-therapeutics-granted-fast-track-designation-its-allosteric-acc
15. "Examination of Clinical Trial Costs and Barriers for Drug Development," ASPE, https://aspe.hhs.gov/report/examination-clinical-trial-costs-and-barriers-drug-development
16. “Discover Harvoni” http://www.harvoni.com/discover-harvoni/about-harvoni
17. Anne-Harding, “Pros and Cons of New Hepatitis C Drugs.” http://www.everydayhealth.com/news/pros-cons-new-hepatitis-treatments-patients/
18. HepCBC, 10-20-2016, "Gilead Announces SVR12 Rates From Four Phase 3 Studies of a Once-Daily, Fixed-Dose Combination of Sofosbuvir, Velpatasvir and Voxilaprevir in Treatment-Naïve and Treatment-Experienced Genotype 1-6 Chronic HCV-Infected Patients," http://hepcbc.ca/2016/10/20/gilead-announces-svr12-
References
Important disclosures on the last page of this report. GILD | 13
rates-four-phase-3-studies-daily-fixed-dose-combination-sofosbuvir-velpatasvir-voxilaprevir-treatment-naive-treatment-experienced-genotype-1-6-chr/
19. Intrepid Investor, "Gilead Is Too Busy With Its Pipeline For A Big Acquisition," Seeking Alpha, http://seekingalpha.com/article/3964242-gilead-busy-pipeline-big-acqusition
20. Simply Safe, 9-6-2016, "Gilead Sciences (GILD): Cheap Dividend Growth Or Value Trap?," ValueWalk, http://www.valuewalk.com/2016/09/gilead-sciences-dividend-value-trap/
21. Loo, J. (2016, August). Biotechnology: Industry Profile. Retrieved from http://www.netadvantage.standardandpoors.com.proxy.lib.uiowa.edu/NASApp/Net Advantage/showIndustry Survey.do?code=bio
22. Google Finance: Key Financial Statistics. Retrieved from https://www.google.com/finance
23. Zoe Thomas & Tim Swift, 9-23-2015, "Who is Martin Shkreli," BBC News, http://www.bbc.com/news/world-us-canada-34331761
24. “Pfizer Report,” http://www.mcafee.cc/Classes/BEM106/Papers/2007/Pfizer.pdf
25. "Merck & Co., Inc.," No Publication, http://investors.merck.com/investors/financial-reports/quarterly-financials/default.aspx
26. "AbbVie," No Publication, http://www.abbvieinvestor.com/phoenix.zhtml?c=251551&p=irol-sec
27. "Biogen," https://www.biogen.com/ 28. "Interferon: Drug Facts, About Side Effects and Dosing,"
MedicineNet, http://www.medicinenet.com/interferon/article.htm
29. "Celgene buys EngMab for $600M and will head into clinic next year," http://www.fiercebiotech.com/biotech/celgene-600m-engmab-biotech-buy-to-head-into-clinic-next-year
30. Esteban Ortiz-Ospina, "World Population Growth," Our World In Data, https://ourworldindata.org/world-population-growth
31. Overview, 12-18-2015, "Affordable Care Act Cadillac Tax," Cigna, a Global Health Insurance and Health Service Company, http://www.cigna.com/health-care-reform/cadillac-tax
32. "Gallup-Healthways Well-Being Index," http://www.well-beingindex.com/
33. “Understanding Hepatitis,” HEPCHOPE.com 34. Hepatitis C New Drug Research And Liver Health,
"Genotypes/Treatment," http://hepatitiscnewdrugresearch.com/genotypestreatment.html
35. "Chronic Hepatitis C Treatment," http://www.daklinza.bmscustomerconnect.com/
36. Us Department of Commerce, Bea, Bureau Of Economic Analysis, 11-29-2016, "News Release: Gross Domestic Product,” http://www.bea.gov/newsreleases/national/gdp/gdpnewsrelease.htm
37. Tami Luhby, 7-28-2015, "Health care spending expected to grow faster," CNNMoney,
http://money.cnn.com/2015/07/28/news/economy/health-care-spending/
38. "GDP Annual Growth Rate," http://www.tradingeconomics.com/forecast/gdp-annual-growth-rate
39. "IMS Health Study: Global Market for Cancer Treatments Grows to $107 Billion in 2015, Fueled by Record Level of Innovation," IMS Health, https://www.imshealth.com/en/about-us/news/ims-health-study-global-market-for-cancer-treatments-grows-to-107-billion-in-2015-fueled-by-record-level-of-innovation
40. "Cancer Types," National Cancer Institute, https://www.cancer.gov/types
41. "Top 25 Pharma Companies by Oncology Revenue," http://www.pmlive.com/top_pharma_list/oncology_revenues
42. “ViiV Healthcare receives FDA Approval for Triumeq” https://www.viivhealthcare.com/media/press-releases/2014/august/viiv-healthcare-receives-fda-approval-for-triumeq.aspx
43. "Triumeq," http://www.fiercepharma.com/special-report/20-triumeq
44. "Bristol-Myers Squibb: Key Facts," https://www.bms.com/ourcompany/Pages/keyfacts.aspx
45. “National Health Expenditure Projections 2015-2025,” Centers for Medicare and Medicaid Services. https://www.cms.gov/research-statistics-data-and-systems/statistics-trends-and-reports/nationalhealthexpenddata/nationalhealthaccountsprojected.html
This report was created by students enrolled in the Applied Equity Valuation (6F:112) course at the University of Iowa. The report was originally created to offer an internal investment recommendation for the University of Iowa Krause Fund and its advisory board. The report also provides potential employers and other interested parties an example of the students’ skills, knowledge and abilities. Members of the Krause Fund are not registered investment advisors, brokers or officially licensed financial professionals. The investment advice contained in this report does not represent an offer or solicitation to buy or sell any of the securities mentioned. Unless otherwise noted, facts and figures included in this report are from publicly available sources. This report is not a complete compilation of data, and its accuracy is not guaranteed. From time to time, the University of Iowa, its faculty, staff, students, or the Krause Fund may hold a financial interest in the companies mentioned in this report.
Important Disclaimer
Gilead Sciences, Inc. (NMS: GILD)Revenue Decomposition
Report Date 2013 2014 2015 2016E 2017E 2018E 2019E 2020E (CV) Scale Millions Millions Millions Millions Millions Millions Millions Millions
Antiviral Products:HIV Genvoya (2029) - TAF /Emtricitabine/Elvitegravir/Cobicistat - - 45.0 1,282.5 2,244.4 3,142.1 3,927.7 4,320.4 Stribild (2029) - TDF /Emtricitabine/Elvitegravir/Cobicistat 539.0 1,197.0 1,825.0 2,007.5 2,107.9 2,002.5 1,802.2 1,622.0
Odefsey (2031) - TAF /Emtricitabine/Rilpivirine - - - 275.0 412.5 577.5 721.9 830.2 Complera/Eviplera (2022) - TDF /Emtricitabine/Rilpivirine 810.0 1,228.0 1,427.0 1,605.4 1,525.1 1,410.7 1,269.7 1,142.7
Descovy (2031) - TAF /Emtricitabine - - - 250.0 875.0 1,400.0 1,890.0 2,362.5 Truvada (2021) - TDF /Emtricitabine 3,136.0 3,340.0 3,459.0 3,493.6 3,144.2 2,751.2 2,338.5 1,987.7 Atripla (2021) 3,648.0 3,470.0 3,134.0 2,663.9 2,264.3 1,924.7 1,636.0 1,472.4 Viread (2018) 959.0 1,058.0 1,108.0 1,130.2 960.6 480.3 240.2 120.1 Other HIV: Tybost (2029), Vitekta (2023), Emtriva (2021) 111.0 88.0 69.0 58.7 52.8 47.5 45.1 44.7 Total HIV Sales 9,203.0$ 10,381.0$ 11,067.0$ 12,766.7$ 13,586.8$ 13,736.5$ 13,871.2$ 13,902.6$
HCV Harvoni (2030) - 2,127.0 13,864.0 9,704.8 7,763.8 6,211.1 4,968.9 4,223.5 Sovaldi (2029) 139.0 10,283.0 5,276.0 4,220.8 3,798.7 3,418.8 3,077.0 2,769.3
Epclusa (2031) - - - 1,750.0 3,500.0 4,550.0 5,460.0 6,006.0 Total HCV Sales 139.0$ 12,410.0$ 19,140.0$ 15,675.6$ 15,062.6$ 14,179.9$ 13,505.8$ 12,998.8$
HBVVemlidy (FDA Approval as of November, 2016)
Hepsera (2014) - - - - - - - - Total HBV Sales - - - - - - - -
Total Antiviral Product Sales 9,342.0$ 22,791.0$ 30,207.0$ 28,442.3$ 28,649.4$ 27,916.4$ 27,377.0$ 26,901.4$
Other Products:Hematology/Oncology Zydelig (2025) - 23.0 132.0 198.0 247.5 284.6 313.1 328.7 Cardiovascular Ranexa (2019) 449.0 510.0 588.0 646.8 679.1 611.2 519.5 519.5 Letairis (2018) 520.0 595.0 700.0 784.0 705.6 599.8 599.8 599.8 Other AmBisome (2016) 352.0 388.0 350.0 315.0 296.1 284.3 284.3 284.3 Miscellanious 141.0 167.0 174.0 179.2 175.6 180.9 186.3 191.9 Total Other Products Sales 1,462.0$ 1,683.0$ 1,944.0$ 2,123.0$ 2,104.0$ 1,960.8$ 1,903.0$ 1,924.2$
Total Product Sales 10,804.0$ 24,474.0$ 32,151.0$ 30,565.3$ 30,753.4$ 29,877.2$ 29,280.0$ 28,825.7$
Gilead Sciences, Inc. (NMS: GILD)Revenue Decompisition, Growth Rates Report Date 2014 2015 2016E 2017E 2018E 2019E 2020E (CV)Scale Millions Millions Millions Millions Millions Millions Millions
Antiviral Products:HIV Genvoya (2029) - TAF/Emtricitabine/Elvitegravir/Cobicistat - - 2750.0% 75.0% 40.0% 25.0% 10.0% Stribild (2029) - TDF/Emtricitabine/Elvitegravir/Cobicistat 122.1% 52.5% 10.0% 5.0% -5.0% -10.0% -10.0%
Odefsey (2031) - TAF/Emtricitabine/Rilpivirine - - - 50.0% 40.0% 25.0% 15.0% Complera/Eviplera (2022) - TDF/Emtricitabine/Rilpivirine 51.6% 16.2% 12.5% -5.0% -7.5% -10.0% -10.0%
Descovy (2031) - TAF/Emtricitabine - - - 250% 60% 35% 25% Truvada (2021) - TDF/Emtricitabine 6.5% 3.6% 1.0% -10.0% -12.5% -15.0% -15.0% Atripla (2021) -4.9% -9.7% -15.0% -15.0% -15.0% -15.0% -10.0% Viread (2018) 10.3% 4.7% 2.0% -15.0% -50.0% -50.0% -50.0% Other HIV: Tybost (2029), Vitekta (2023), Emtriva (2021) -20.7% -21.6% -15.0% -10.0% -10.0% -5.0% -1.0%
HCV Harvoni (2030) - 551.8% -30.0% -20.0% -20.0% -20.0% -15.0% Sovaldi (2029) 7297.8% -48.7% -20.0% -10.0% -10.0% -10.0% -10.0%
Epclusa (2032) - - 0.0% 100.0% 30.0% 20.0% 10.0%
HBV Hepsera (2014) - - 0.0% 0.0% 0.0% 0.0% 0.0%
Other Products:Hematology/Oncology Zydelig (2025) - 473.9% 50.0% 25.0% 15.0% 10.0% 5.0%Cardiovascular Ranexa (2019) 13.6% 15.3% 10.0% 5.0% -10.0% -15.0% 0.0% Letairis (2018) 14.4% 17.6% 12.0% -10.0% -15.0% 0.0% 0.0%Other AmBisome (2016) 10.2% -9.8% -10.0% -6.0% -4.0% 0.0% 0.0% Miscellanious 18.4% 4.2% 3.0% -2.0% 3.0% 3.0% 3.0%
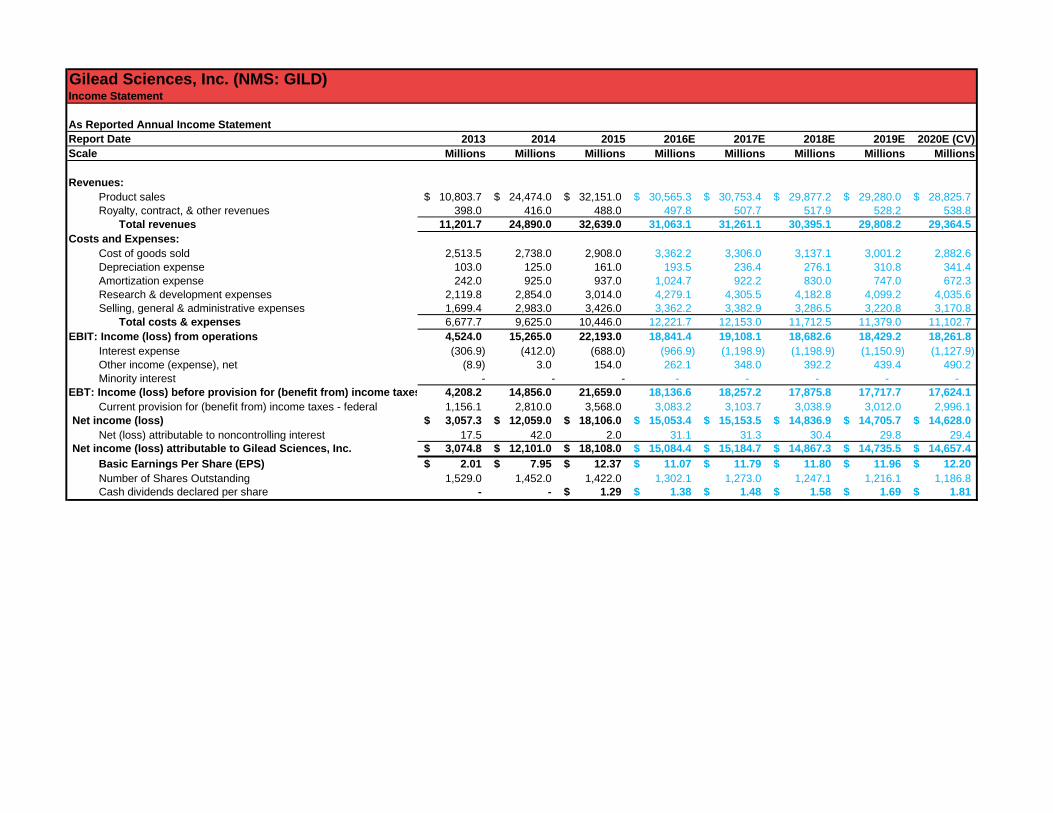
Gilead Sciences, Inc. (NMS: GILD)Income Statement
As Reported Annual Income Statement Report Date 2013 2014 2015 2016E 2017E 2018E 2019E 2020E (CV)Scale Millions Millions Millions Millions Millions Millions Millions Millions
Revenues:Product sales 10,803.7$ 24,474.0$ 32,151.0$ 30,565.3$ 30,753.4$ 29,877.2$ 29,280.0$ 28,825.7$ Royalty, contract, & other revenues 398.0 416.0 488.0 497.8 507.7 517.9 528.2 538.8
Total revenues 11,201.7 24,890.0 32,639.0 31,063.1 31,261.1 30,395.1 29,808.2 29,364.5 Costs and Expenses:
Cost of goods sold 2,513.5 2,738.0 2,908.0 3,362.2 3,306.0 3,137.1 3,001.2 2,882.6 Depreciation expense 103.0 125.0 161.0 193.5 236.4 276.1 310.8 341.4 Amortization expense 242.0 925.0 937.0 1,024.7 922.2 830.0 747.0 672.3 Research & development expenses 2,119.8 2,854.0 3,014.0 4,279.1 4,305.5 4,182.8 4,099.2 4,035.6 Selling, general & administrative expenses 1,699.4 2,983.0 3,426.0 3,362.2 3,382.9 3,286.5 3,220.8 3,170.8
Total costs & expenses 6,677.7 9,625.0 10,446.0 12,221.7 12,153.0 11,712.5 11,379.0 11,102.7 EBIT: Income (loss) from operations 4,524.0 15,265.0 22,193.0 18,841.4 19,108.1 18,682.6 18,429.2 18,261.8
Interest expense (306.9) (412.0) (688.0) (966.9) (1,198.9) (1,198.9) (1,150.9) (1,127.9) Other income (expense), net (8.9) 3.0 154.0 262.1 348.0 392.2 439.4 490.2 Minority interest - - - - - - - -
EBT: Income (loss) before provision for (benefit from) income taxes 4,208.2 14,856.0 21,659.0 18,136.6 18,257.2 17,875.8 17,717.7 17,624.1 Current provision for (benefit from) income taxes - federal 1,156.1 2,810.0 3,568.0 3,083.2 3,103.7 3,038.9 3,012.0 2,996.1
Net income (loss) 3,057.3$ 12,059.0$ 18,106.0$ 15,053.4$ 15,153.5$ 14,836.9$ 14,705.7$ 14,628.0$ Net (loss) attributable to noncontrolling interest 17.5 42.0 2.0 31.1 31.3 30.4 29.8 29.4
Net income (loss) attributable to Gilead Sciences, Inc. 3,074.8$ 12,101.0$ 18,108.0$ 15,084.4$ 15,184.7$ 14,867.3$ 14,735.5$ 14,657.4$ Basic Earnings Per Share (EPS) 2.01$ 7.95$ 12.37$ 11.07$ 11.79$ 11.80$ 11.96$ 12.20$ Number of Shares Outstanding 1,529.0 1,452.0 1,422.0 1,302.1 1,273.0 1,247.1 1,216.1 1,186.8 Cash dividends declared per share - - 1.29$ 1.38$ 1.48$ 1.58$ 1.69$ 1.81$
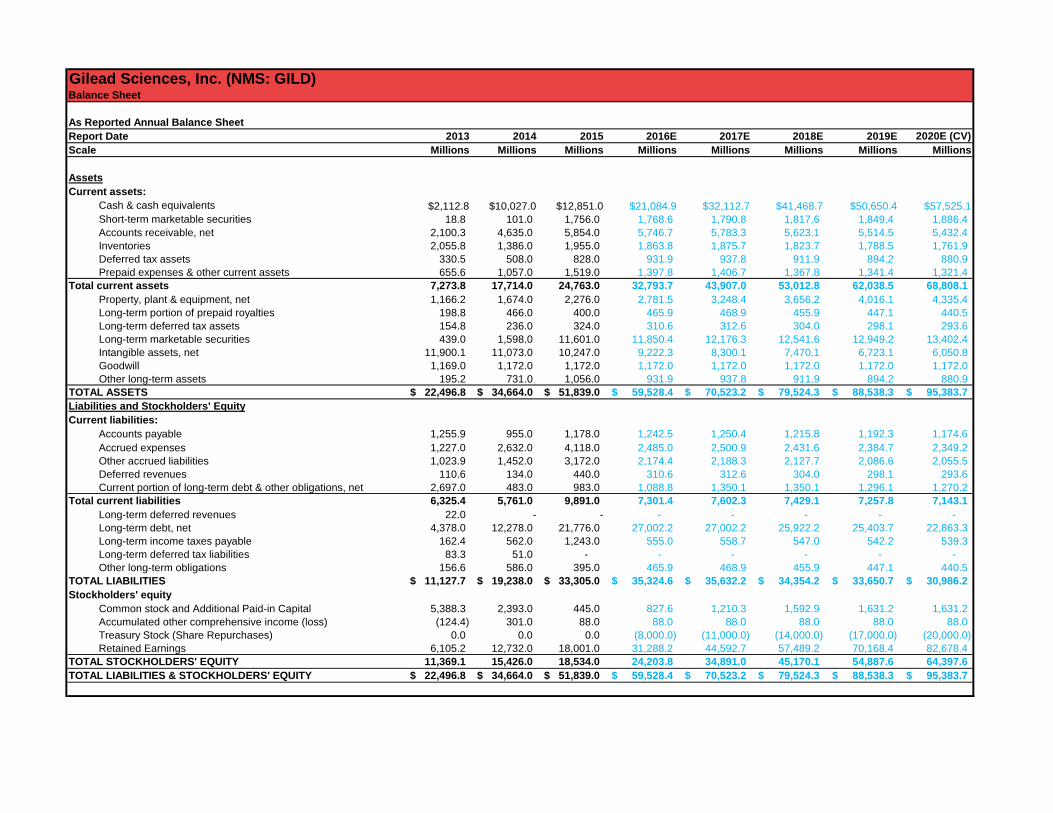
Gilead Sciences, Inc. (NMS: GILD)Balance Sheet
As Reported Annual Balance Sheet Report Date 2013 2014 2015 2016E 2017E 2018E 2019E 2020E (CV)Scale Millions Millions Millions Millions Millions Millions Millions Millions
AssetsCurrent assets:
Cash & cash equivalents $2,112.8 $10,027.0 $12,851.0 $21,084.9 $32,112.7 $41,468.7 $50,650.4 $57,525.1Short-term marketable securities 18.8 101.0 1,756.0 1,768.6 1,790.8 1,817.6 1,849.4 1,886.4Accounts receivable, net 2,100.3 4,635.0 5,854.0 5,746.7 5,783.3 5,623.1 5,514.5 5,432.4Inventories 2,055.8 1,386.0 1,955.0 1,863.8 1,875.7 1,823.7 1,788.5 1,761.9Deferred tax assets 330.5 508.0 828.0 931.9 937.8 911.9 894.2 880.9Prepaid expenses & other current assets 655.6 1,057.0 1,519.0 1,397.8 1,406.7 1,367.8 1,341.4 1,321.4
Total current assets 7,273.8 17,714.0 24,763.0 32,793.7 43,907.0 53,012.8 62,038.5 68,808.1Property, plant & equipment, net 1,166.2 1,674.0 2,276.0 2,781.5 3,248.4 3,656.2 4,016.1 4,335.4Long-term portion of prepaid royalties 198.8 466.0 400.0 465.9 468.9 455.9 447.1 440.5Long-term deferred tax assets 154.8 236.0 324.0 310.6 312.6 304.0 298.1 293.6Long-term marketable securities 439.0 1,598.0 11,601.0 11,850.4 12,176.3 12,541.6 12,949.2 13,402.4Intangible assets, net 11,900.1 11,073.0 10,247.0 9,222.3 8,300.1 7,470.1 6,723.1 6,050.8Goodwill 1,169.0 1,172.0 1,172.0 1,172.0 1,172.0 1,172.0 1,172.0 1,172.0Other long-term assets 195.2 731.0 1,056.0 931.9 937.8 911.9 894.2 880.9
TOTAL ASSETS 22,496.8$ 34,664.0$ 51,839.0$ 59,528.4$ 70,523.2$ 79,524.3$ 88,538.3$ 95,383.7$ Liabilities and Stockholders' EquityCurrent liabilities:
Accounts payable 1,255.9 955.0 1,178.0 1,242.5 1,250.4 1,215.8 1,192.3 1,174.6Accrued expenses 1,227.0 2,632.0 4,118.0 2,485.0 2,500.9 2,431.6 2,384.7 2,349.2Other accrued liabilities 1,023.9 1,452.0 3,172.0 2,174.4 2,188.3 2,127.7 2,086.6 2,055.5Deferred revenues 110.6 134.0 440.0 310.6 312.6 304.0 298.1 293.6Current portion of long-term debt & other obligations, net 2,697.0 483.0 983.0 1,088.8 1,350.1 1,350.1 1,296.1 1,270.2
Total current liabilities 6,325.4 5,761.0 9,891.0 7,301.4 7,602.3 7,429.1 7,257.8 7,143.1Long-term deferred revenues 22.0 - - - - - - - Long-term debt, net 4,378.0 12,278.0 21,776.0 27,002.2 27,002.2 25,922.2 25,403.7 22,863.3Long-term income taxes payable 162.4 562.0 1,243.0 555.0 558.7 547.0 542.2 539.3Long-term deferred tax liabilities 83.3 51.0 - - - - - - Other long-term obligations 156.6 586.0 395.0 465.9 468.9 455.9 447.1 440.5
TOTAL LIABILITIES 11,127.7$ 19,238.0$ 33,305.0$ 35,324.6$ 35,632.2$ 34,354.2$ 33,650.7$ 30,986.2$ Stockholders' equity
Common stock and Additional Paid-in Capital 5,388.3 2,393.0 445.0 827.6 1,210.3 1,592.9 1,631.2 1,631.2Accumulated other comprehensive income (loss) (124.4) 301.0 88.0 88.0 88.0 88.0 88.0 88.0Treasury Stock (Share Repurchases) 0.0 0.0 0.0 (8,000.0) (11,000.0) (14,000.0) (17,000.0) (20,000.0)Retained Earnings 6,105.2 12,732.0 18,001.0 31,288.2 44,592.7 57,489.2 70,168.4 82,678.4
TOTAL STOCKHOLDERS' EQUITY 11,369.1 15,426.0 18,534.0 24,203.8 34,891.0 45,170.1 54,887.6 64,397.6TOTAL LIABILITIES & STOCKHOLDERS' EQUITY 22,496.8$ 34,664.0$ 51,839.0$ 59,528.4$ 70,523.2$ 79,524.3$ 88,538.3$ 95,383.7$
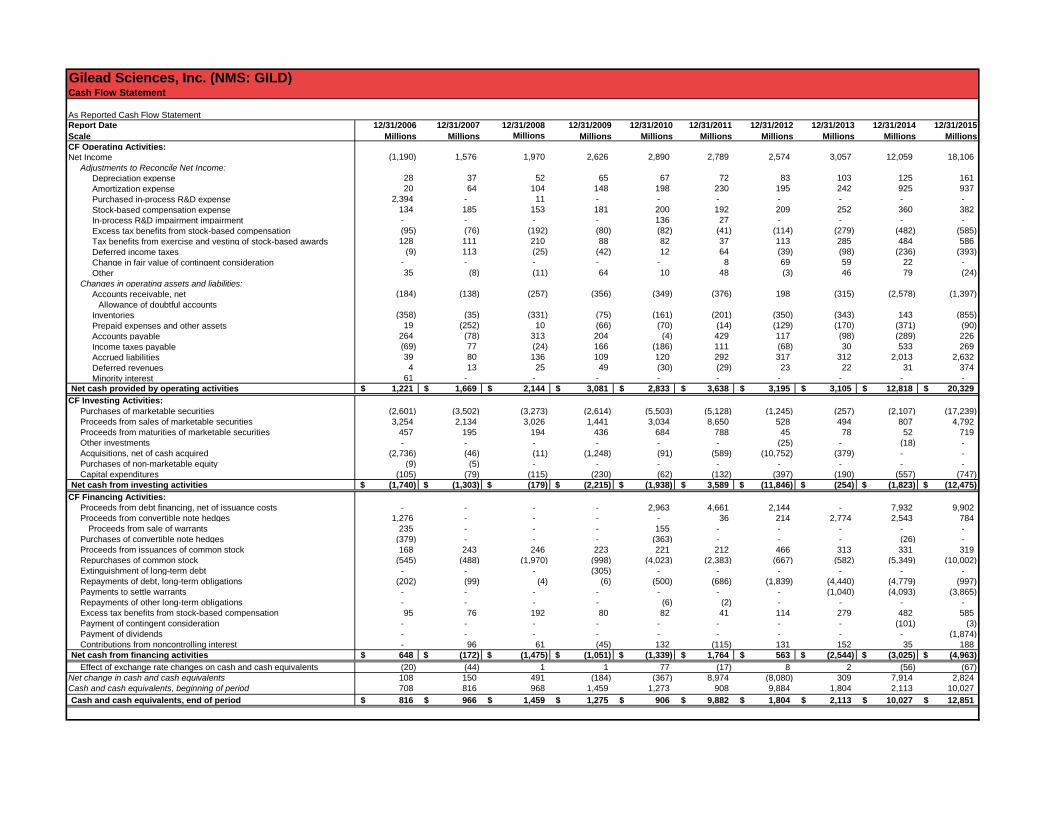
Gilead Sciences, Inc. (NMS: GILD)Cash Flow Statement
As Reported Cash Flow StatementReport Date 12/31/2006 12/31/2007 12/31/2008 12/31/2009 12/31/2010 12/31/2011 12/31/2012 12/31/2013 12/31/2014 12/31/2015 Scale Millions Millions Millions Millions Millions Millions Millions Millions Millions Millions CF Operating Activities:Net Income (1,190) 1,576 1,970 2,626 2,890 2,789 2,574 3,057 12,059 18,106 Adjustments to Reconcile Net Income: Depreciation expense 28 37 52 65 67 72 83 103 125 161 Amortization expense 20 64 104 148 198 230 195 242 925 937 Purchased in-process R&D expense 2,394 - 11 - - - - - - - Stock-based compensation expense 134 185 153 181 200 192 209 252 360 382 In-process R&D impairment impairment - - - - 136 27 - - - - Excess tax benefits from stock-based compensation (95) (76) (192) (80) (82) (41) (114) (279) (482) (585) Tax benefits from exercise and vesting of stock-based awards 128 111 210 88 82 37 113 285 484 586 Deferred income taxes (9) 113 (25) (42) 12 64 (39) (98) (236) (393) Change in fair value of contingent consideration - - - - - 8 69 59 22 - Other 35 (8) (11) 64 10 48 (3) 46 79 (24) Changes in operating assets and liabilities: Accounts receivable, net (184) (138) (257) (356) (349) (376) 198 (315) (2,578) (1,397)
Allowance of doubtful accounts Inventories (358) (35) (331) (75) (161) (201) (350) (343) 143 (855) Prepaid expenses and other assets 19 (252) 10 (66) (70) (14) (129) (170) (371) (90) Accounts payable 264 (78) 313 204 (4) 429 117 (98) (289) 226 Income taxes payable (69) 77 (24) 166 (186) 111 (68) 30 533 269 Accrued liabilities 39 80 136 109 120 292 317 312 2,013 2,632 Deferred revenues 4 13 25 49 (30) (29) 23 22 31 374 Minority interest 61 - - - - - - - - - Net cash provided by operating activities 1,221$ 1,669$ 2,144$ 3,081$ 2,833$ 3,638$ 3,195$ 3,105$ 12,818$ 20,329$
CF Investing Activities: Purchases of marketable securities (2,601) (3,502) (3,273) (2,614) (5,503) (5,128) (1,245) (257) (2,107) (17,239) Proceeds from sales of marketable securities 3,254 2,134 3,026 1,441 3,034 8,650 528 494 807 4,792 Proceeds from maturities of marketable securities 457 195 194 436 684 788 45 78 52 719 Other investments - - - - - - (25) - (18) - Acquisitions, net of cash acquired (2,736) (46) (11) (1,248) (91) (589) (10,752) (379) - - Purchases of non-marketable equity (9) (5) - - - - - - - - Capital expenditures (105) (79) (115) (230) (62) (132) (397) (190) (557) (747) Net cash from investing activities (1,740)$ (1,303)$ (179)$ (2,215)$ (1,938)$ 3,589$ (11,846)$ (254)$ (1,823)$ (12,475)$
CF Financing Activities: Proceeds from debt financing, net of issuance costs - - - - 2,963 4,661 2,144 - 7,932 9,902 Proceeds from convertible note hedges 1,276 - - - - 36 214 2,774 2,543 784
Proceeds from sale of warrants 235 - - - 155 - - - - - Purchases of convertible note hedges (379) - - - (363) - - - (26) - Proceeds from issuances of common stock 168 243 246 223 221 212 466 313 331 319 Repurchases of common stock (545) (488) (1,970) (998) (4,023) (2,383) (667) (582) (5,349) (10,002) Extinguishment of long-term debt - - - (305) - - - - - - Repayments of debt, long-term obligations (202) (99) (4) (6) (500) (686) (1,839) (4,440) (4,779) (997) Payments to settle warrants - - - - - - - (1,040) (4,093) (3,865) Repayments of other long-term obligations - - - - (6) (2) - - - - Excess tax benefits from stock-based compensation 95 76 192 80 82 41 114 279 482 585 Payment of contingent consideration - - - - - - - - (101) (3) Payment of dividends - - - - - - - - - (1,874) Contributions from noncontrolling interest - 96 61 (45) 132 (115) 131 152 35 188 Net cash from financing activities 648$ (172)$ (1,475)$ (1,051)$ (1,339)$ 1,764$ 563$ (2,544)$ (3,025)$ (4,963)$
Effect of exchange rate changes on cash and cash equivalents (20) (44) 1 1 77 (17) 8 2 (56) (67) Net change in cash and cash equivalents 108 150 491 (184) (367) 8,974 (8,080) 309 7,914 2,824 Cash and cash equivalents, beginning of period 708 816 968 1,459 1,273 908 9,884 1,804 2,113 10,027 Cash and cash equivalents, end of period 816$ 966$ 1,459$ 1,275$ 906$ 9,882$ 1,804$ 2,113$ 10,027$ 12,851$
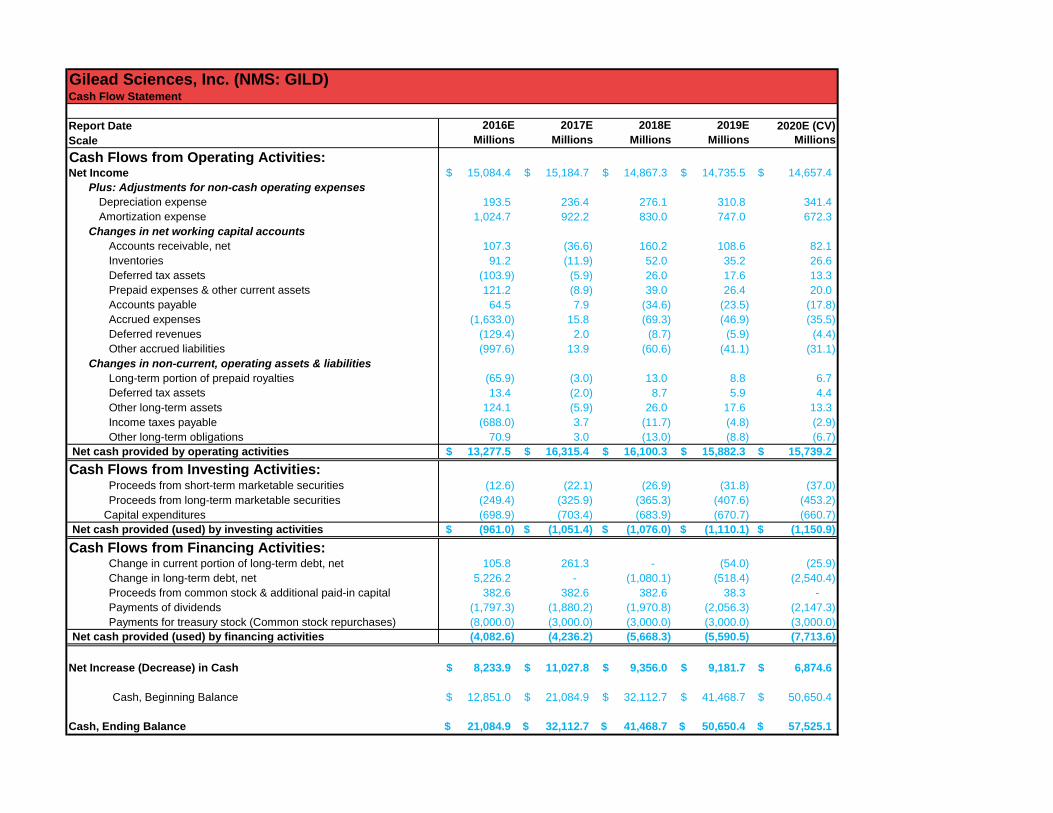
Gilead Sciences, Inc. (NMS: GILD)Cash Flow Statement
Report Date 2016E 2017E 2018E 2019E 2020E (CV)Scale Millions Millions Millions Millions Millions Cash Flows from Operating Activities:Net Income 15,084.4$ 15,184.7$ 14,867.3$ 14,735.5$ 14,657.4$
Plus: Adjustments for non-cash operating expenses Depreciation expense 193.5 236.4 276.1 310.8 341.4 Amortization expense 1,024.7 922.2 830.0 747.0 672.3
Changes in net working capital accountsAccounts receivable, net 107.3 (36.6) 160.2 108.6 82.1 Inventories 91.2 (11.9) 52.0 35.2 26.6 Deferred tax assets (103.9) (5.9) 26.0 17.6 13.3 Prepaid expenses & other current assets 121.2 (8.9) 39.0 26.4 20.0 Accounts payable 64.5 7.9 (34.6) (23.5) (17.8) Accrued expenses (1,633.0) 15.8 (69.3) (46.9) (35.5) Deferred revenues (129.4) 2.0 (8.7) (5.9) (4.4) Other accrued liabilities (997.6) 13.9 (60.6) (41.1) (31.1)
Changes in non-current, operating assets & liabilitiesLong-term portion of prepaid royalties (65.9) (3.0) 13.0 8.8 6.7 Deferred tax assets 13.4 (2.0) 8.7 5.9 4.4 Other long-term assets 124.1 (5.9) 26.0 17.6 13.3 Income taxes payable (688.0) 3.7 (11.7) (4.8) (2.9) Other long-term obligations 70.9 3.0 (13.0) (8.8) (6.7)
Net cash provided by operating activities 13,277.5$ 16,315.4$ 16,100.3$ 15,882.3$ 15,739.2$ Cash Flows from Investing Activities:
Proceeds from short-term marketable securities (12.6) (22.1) (26.9) (31.8) (37.0) Proceeds from long-term marketable securities (249.4) (325.9) (365.3) (407.6) (453.2)
Capital expenditures (698.9) (703.4) (683.9) (670.7) (660.7) Net cash provided (used) by investing activities (961.0)$ (1,051.4)$ (1,076.0)$ (1,110.1)$ (1,150.9)$ Cash Flows from Financing Activities:
Change in current portion of long-term debt, net 105.8 261.3 - (54.0) (25.9) Change in long-term debt, net 5,226.2 - (1,080.1) (518.4) (2,540.4) Proceeds from common stock & additional paid-in capital 382.6 382.6 382.6 38.3 - Payments of dividends (1,797.3) (1,880.2) (1,970.8) (2,056.3) (2,147.3) Payments for treasury stock (Common stock repurchases) (8,000.0) (3,000.0) (3,000.0) (3,000.0) (3,000.0)
Net cash provided (used) by financing activities (4,082.6) (4,236.2) (5,668.3) (5,590.5) (7,713.6)
Net Increase (Decrease) in Cash 8,233.9$ 11,027.8$ 9,356.0$ 9,181.7$ 6,874.6$
Cash, Beginning Balance 12,851.0$ 21,084.9$ 32,112.7$ 41,468.7$ 50,650.4$
Cash, Ending Balance 21,084.9$ 32,112.7$ 41,468.7$ 50,650.4$ 57,525.1$
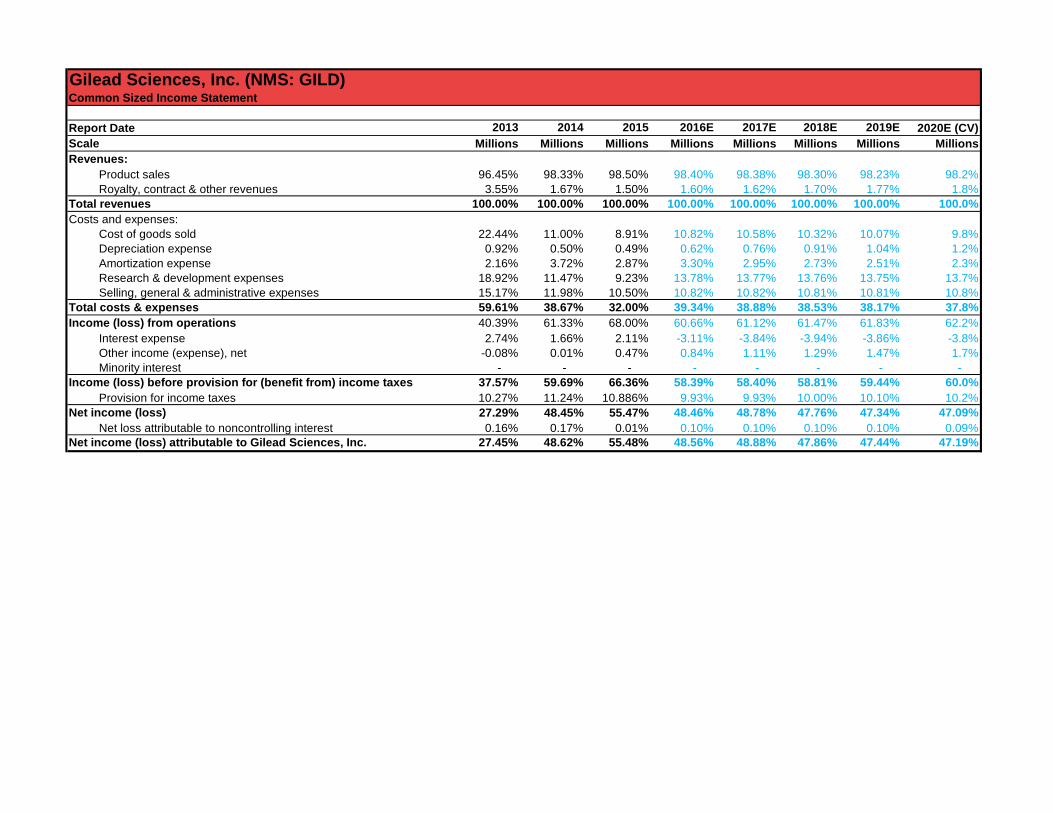
Gilead Sciences, Inc. (NMS: GILD)Common Sized Income Statement
Report Date 2013 2014 2015 2016E 2017E 2018E 2019E 2020E (CV)Scale Millions Millions Millions Millions Millions Millions Millions MillionsRevenues:
Product sales 96.45% 98.33% 98.50% 98.40% 98.38% 98.30% 98.23% 98.2%Royalty, contract & other revenues 3.55% 1.67% 1.50% 1.60% 1.62% 1.70% 1.77% 1.8%
Total revenues 100.00% 100.00% 100.00% 100.00% 100.00% 100.00% 100.00% 100.0%Costs and expenses:
Cost of goods sold 22.44% 11.00% 8.91% 10.82% 10.58% 10.32% 10.07% 9.8%Depreciation expense 0.92% 0.50% 0.49% 0.62% 0.76% 0.91% 1.04% 1.2%Amortization expense 2.16% 3.72% 2.87% 3.30% 2.95% 2.73% 2.51% 2.3%Research & development expenses 18.92% 11.47% 9.23% 13.78% 13.77% 13.76% 13.75% 13.7%Selling, general & administrative expenses 15.17% 11.98% 10.50% 10.82% 10.82% 10.81% 10.81% 10.8%
Total costs & expenses 59.61% 38.67% 32.00% 39.34% 38.88% 38.53% 38.17% 37.8%Income (loss) from operations 40.39% 61.33% 68.00% 60.66% 61.12% 61.47% 61.83% 62.2%
Interest expense 2.74% 1.66% 2.11% -3.11% -3.84% -3.94% -3.86% -3.8%Other income (expense), net -0.08% 0.01% 0.47% 0.84% 1.11% 1.29% 1.47% 1.7%Minority interest - - - - - - - -
Income (loss) before provision for (benefit from) income taxes 37.57% 59.69% 66.36% 58.39% 58.40% 58.81% 59.44% 60.0%Provision for income taxes 10.27% 11.24% 10.886% 9.93% 9.93% 10.00% 10.10% 10.2%
Net income (loss) 27.29% 48.45% 55.47% 48.46% 48.78% 47.76% 47.34% 47.09%Net loss attributable to noncontrolling interest 0.16% 0.17% 0.01% 0.10% 0.10% 0.10% 0.10% 0.09%
Net income (loss) attributable to Gilead Sciences, Inc. 27.45% 48.62% 55.48% 48.56% 48.88% 47.86% 47.44% 47.19%
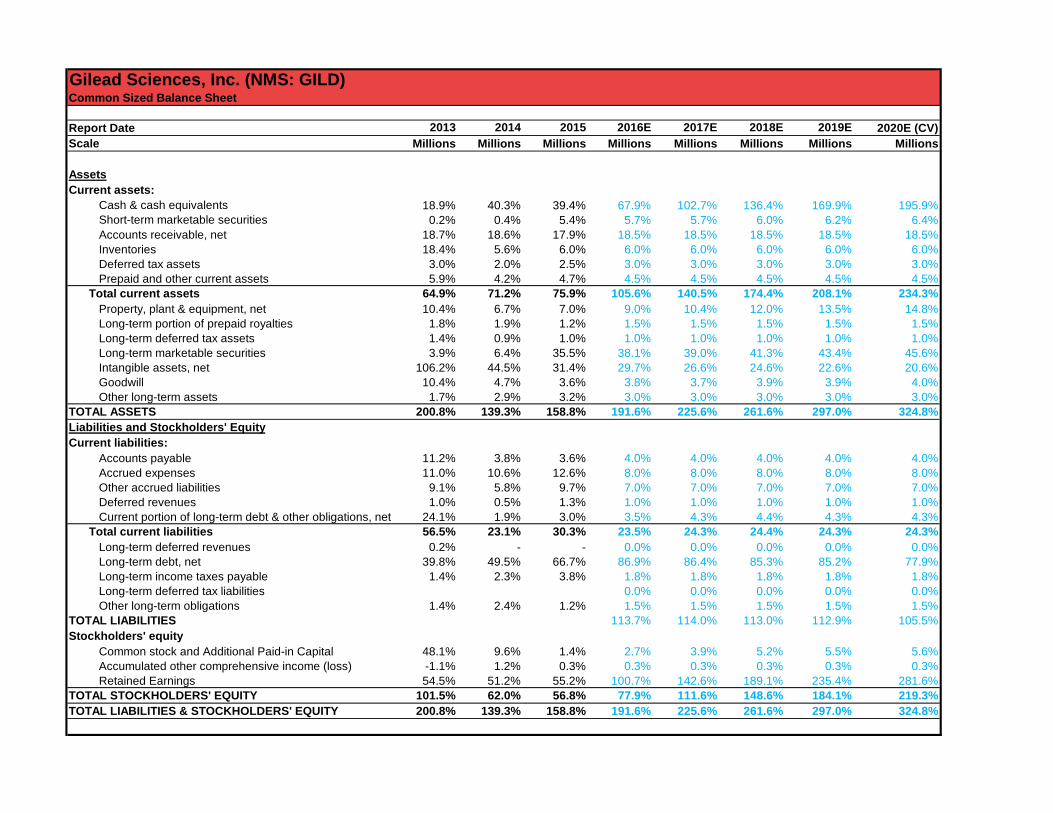
Gilead Sciences, Inc. (NMS: GILD)Common Sized Balance Sheet
Report Date 2013 2014 2015 2016E 2017E 2018E 2019E 2020E (CV)Scale Millions Millions Millions Millions Millions Millions Millions Millions
AssetsCurrent assets:
Cash & cash equivalents 18.9% 40.3% 39.4% 67.9% 102.7% 136.4% 169.9% 195.9%Short-term marketable securities 0.2% 0.4% 5.4% 5.7% 5.7% 6.0% 6.2% 6.4%Accounts receivable, net 18.7% 18.6% 17.9% 18.5% 18.5% 18.5% 18.5% 18.5%Inventories 18.4% 5.6% 6.0% 6.0% 6.0% 6.0% 6.0% 6.0%Deferred tax assets 3.0% 2.0% 2.5% 3.0% 3.0% 3.0% 3.0% 3.0%Prepaid and other current assets 5.9% 4.2% 4.7% 4.5% 4.5% 4.5% 4.5% 4.5%
Total current assets 64.9% 71.2% 75.9% 105.6% 140.5% 174.4% 208.1% 234.3%Property, plant & equipment, net 10.4% 6.7% 7.0% 9.0% 10.4% 12.0% 13.5% 14.8%Long-term portion of prepaid royalties 1.8% 1.9% 1.2% 1.5% 1.5% 1.5% 1.5% 1.5%Long-term deferred tax assets 1.4% 0.9% 1.0% 1.0% 1.0% 1.0% 1.0% 1.0%Long-term marketable securities 3.9% 6.4% 35.5% 38.1% 39.0% 41.3% 43.4% 45.6%Intangible assets, net 106.2% 44.5% 31.4% 29.7% 26.6% 24.6% 22.6% 20.6%Goodwill 10.4% 4.7% 3.6% 3.8% 3.7% 3.9% 3.9% 4.0%Other long-term assets 1.7% 2.9% 3.2% 3.0% 3.0% 3.0% 3.0% 3.0%
TOTAL ASSETS 200.8% 139.3% 158.8% 191.6% 225.6% 261.6% 297.0% 324.8%Liabilities and Stockholders' EquityCurrent liabilities:
Accounts payable 11.2% 3.8% 3.6% 4.0% 4.0% 4.0% 4.0% 4.0%Accrued expenses 11.0% 10.6% 12.6% 8.0% 8.0% 8.0% 8.0% 8.0%Other accrued liabilities 9.1% 5.8% 9.7% 7.0% 7.0% 7.0% 7.0% 7.0%Deferred revenues 1.0% 0.5% 1.3% 1.0% 1.0% 1.0% 1.0% 1.0%Current portion of long-term debt & other obligations, net 24.1% 1.9% 3.0% 3.5% 4.3% 4.4% 4.3% 4.3%
Total current liabilities 56.5% 23.1% 30.3% 23.5% 24.3% 24.4% 24.3% 24.3%Long-term deferred revenues 0.2% - - 0.0% 0.0% 0.0% 0.0% 0.0%Long-term debt, net 39.8% 49.5% 66.7% 86.9% 86.4% 85.3% 85.2% 77.9%Long-term income taxes payable 1.4% 2.3% 3.8% 1.8% 1.8% 1.8% 1.8% 1.8%Long-term deferred tax liabilities 0.0% 0.0% 0.0% 0.0% 0.0%Other long-term obligations 1.4% 2.4% 1.2% 1.5% 1.5% 1.5% 1.5% 1.5%
TOTAL LIABILITIES 113.7% 114.0% 113.0% 112.9% 105.5%Stockholders' equity
Common stock and Additional Paid-in Capital 48.1% 9.6% 1.4% 2.7% 3.9% 5.2% 5.5% 5.6%Accumulated other comprehensive income (loss) -1.1% 1.2% 0.3% 0.3% 0.3% 0.3% 0.3% 0.3%Retained Earnings 54.5% 51.2% 55.2% 100.7% 142.6% 189.1% 235.4% 281.6%
TOTAL STOCKHOLDERS' EQUITY 101.5% 62.0% 56.8% 77.9% 111.6% 148.6% 184.1% 219.3%TOTAL LIABILITIES & STOCKHOLDERS' EQUITY 200.8% 139.3% 158.8% 191.6% 225.6% 261.6% 297.0% 324.8%
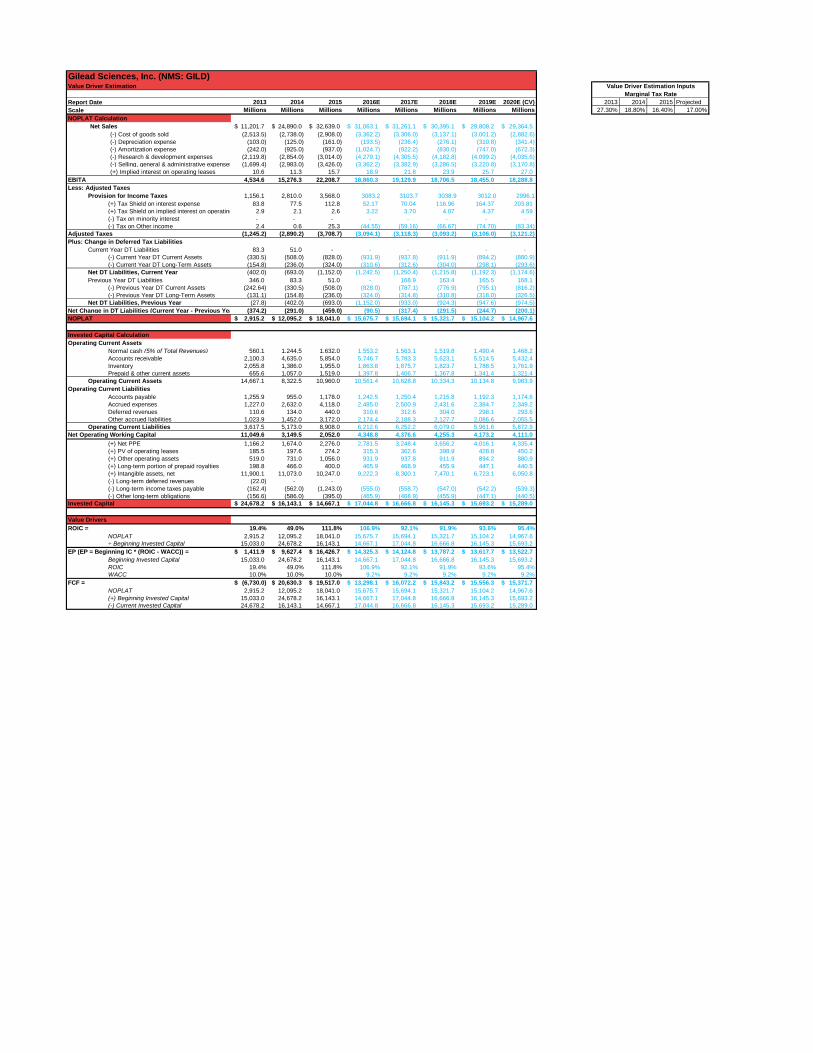
Gilead Sciences, Inc. (NMS: GILD)Value Driver Estimation
Report Date 2013 2014 2015 2016E 2017E 2018E 2019E 2020E (CV) 2013 2014 2015 ProjectedScale Millions Millions Millions Millions Millions Millions Millions Millions 27.30% 18.80% 16.40% 17.00%NOPLAT Calculation
Net Sales 11,201.7$ 24,890.0$ 32,639.0$ 31,063.1$ 31,261.1$ 30,395.1$ 29,808.2$ 29,364.5$ (-) Cost of goods sold (2,513.5) (2,738.0) (2,908.0) (3,362.2) (3,306.0) (3,137.1) (3,001.2) (2,882.6) (-) Depreciation expense (103.0) (125.0) (161.0) (193.5) (236.4) (276.1) (310.8) (341.4) (-) Amortization expense (242.0) (925.0) (937.0) (1,024.7) (922.2) (830.0) (747.0) (672.3) (-) Research & development expenses (2,119.8) (2,854.0) (3,014.0) (4,279.1) (4,305.5) (4,182.8) (4,099.2) (4,035.6) (-) Selling, general & administrative expenses (1,699.4) (2,983.0) (3,426.0) (3,362.2) (3,382.9) (3,286.5) (3,220.8) (3,170.8) (+) Implied interest on operating leases 10.6 11.3 15.7 18.9 21.8 23.9 25.7 27.0
EBITA 4,534.6 15,276.3 22,208.7 18,860.3 19,129.9 18,706.5 18,455.0 18,288.8 Less: Adjusted Taxes
Provision for Income Taxes 1,156.1 2,810.0 3,568.0 3083.2 3103.7 3038.9 3012.0 2996.1(+) Tax Shield on interest expense 83.8 77.5 112.8 52.17 70.04 116.96 164.37 203.81 (+) Tax Shield on implied interest on operating 2.9 2.1 2.6 3.22 3.70 4.07 4.37 4.59 (-) Tax on minority interest - - - - - - - - (-) Tax on Other income 2.4 0.6 25.3 (44.55) (59.16) (66.67) (74.70) (83.34)
Adjusted Taxes (1,245.2) (2,890.2) (3,708.7) (3,094.1) (3,118.3) (3,093.2) (3,106.0) (3,121.2) Plus: Change in Deferred Tax Liabilities
Current Year DT Liabilities 83.3 51.0 - - - - - - (-) Current Year DT Current Assets (330.5) (508.0) (828.0) (931.9) (937.8) (911.9) (894.2) (880.9) (-) Current Year DT Long-Term Assets (154.8) (236.0) (324.0) (310.6) (312.6) (304.0) (298.1) (293.6)
Net DT Liabilities, Current Year (402.0) (693.0) (1,152.0) (1,242.5) (1,250.4) (1,215.8) (1,192.3) (1,174.6) Previous Year DT Liabilities 346.0 83.3 51.0 - 168.9 163.4 165.5 168.1
(-) Previous Year DT Current Assets (242.64) (330.5) (508.0) (828.0) (787.1) (776.9) (795.1) (816.2) (-) Previous Year DT Long-Term Assets (131.1) (154.8) (236.0) (324.0) (314.8) (310.8) (318.0) (326.5)
Net DT Liabilities, Previous Year (27.8) (402.0) (693.0) (1,152.0) (933.0) (924.3) (947.6) (974.5) Net Change in DT Liabilities (Current Year - Previous Yea (374.2) (291.0) (459.0) (90.5) (317.4) (291.5) (244.7) (200.1) NOPLAT 2,915.2$ 12,095.2$ 18,041.0$ 15,675.7$ 15,694.1$ 15,321.7$ 15,104.2$ 14,967.6$
Invested Capital CalculationOperating Current Assets
Normal cash (5% of Total Revenues) 560.1 1,244.5 1,632.0 1,553.2 1,563.1 1,519.8 1,490.4 1,468.2 Accounts receivable 2,100.3 4,635.0 5,854.0 5,746.7 5,783.3 5,623.1 5,514.5 5,432.4 Inventory 2,055.8 1,386.0 1,955.0 1,863.8 1,875.7 1,823.7 1,788.5 1,761.9 Prepaid & other current assets 655.6 1,057.0 1,519.0 1,397.8 1,406.7 1,367.8 1,341.4 1,321.4
Operating Current Assets 14,667.1 8,322.5 10,960.0 10,561.4 10,628.8 10,334.3 10,134.8 9,983.9 Operating Current Liabilities
Accounts payable 1,255.9 955.0 1,178.0 1,242.5 1,250.4 1,215.8 1,192.3 1,174.6 Accrued expenses 1,227.0 2,632.0 4,118.0 2,485.0 2,500.9 2,431.6 2,384.7 2,349.2 Deferred revenues 110.6 134.0 440.0 310.6 312.6 304.0 298.1 293.6 Other accrued liabilities 1,023.9 1,452.0 3,172.0 2,174.4 2,188.3 2,127.7 2,086.6 2,055.5
Operating Current Liabilities 3,617.5 5,173.0 8,908.0 6,212.6 6,252.2 6,079.0 5,961.6 5,872.9 Net Operating Working Capital 11,049.6 3,149.5 2,052.0 4,348.8 4,376.6 4,255.3 4,173.2 4,111.0
(+) Net PPE 1,166.2 1,674.0 2,276.0 2,781.5 3,248.4 3,656.2 4,016.1 4,335.4 (+) PV of operating leases 185.5 197.6 274.2 315.3 362.6 398.9 428.8 450.2 (+) Other operating assets 519.0 731.0 1,056.0 931.9 937.8 911.9 894.2 880.9 (+) Long-term portion of prepaid royalties 198.8 466.0 400.0 465.9 468.9 455.9 447.1 440.5 (+) Intangible assets, net 11,900.1 11,073.0 10,247.0 9,222.3 8,300.1 7,470.1 6,723.1 6,050.8 (-) Long-term deferred revenues (22.0) - - - - - - - (-) Long-term income taxes payable (162.4) (562.0) (1,243.0) (555.0) (558.7) (547.0) (542.2) (539.3) (-) Other long-term obligations (156.6) (586.0) (395.0) (465.9) (468.9) (455.9) (447.1) (440.5)
Invested Capital 24,678.2$ 16,143.1$ 14,667.1$ 17,044.8$ 16,666.8$ 16,145.3$ 15,693.2$ 15,289.0$
Value DriversROIC = 19.4% 49.0% 111.8% 106.9% 92.1% 91.9% 93.6% 95.4%
NOPLAT 2,915.2 12,095.2 18,041.0 15,675.7 15,694.1 15,321.7 15,104.2 14,967.6 ÷ Beginning Invested Capital 15,033.0 24,678.2 16,143.1 14,667.1 17,044.8 16,666.8 16,145.3 15,693.2
EP (EP = Beginning IC * (ROIC - WACC)) = 1,411.9$ 9,627.4$ 16,426.7$ 14,325.3$ 14,124.8$ 13,787.2$ 13,617.7$ 13,522.7$ Beginning Invested Capital 15,033.0 24,678.2 16,143.1 14,667.1 17,044.8 16,666.8 16,145.3 15,693.2 ROIC 19.4% 49.0% 111.8% 106.9% 92.1% 91.9% 93.6% 95.4%WACC 10.0% 10.0% 10.0% 9.2% 9.2% 9.2% 9.2% 9.2%
FCF = (6,730.0)$ 20,630.3$ 19,517.0$ 13,298.1$ 16,072.2$ 15,843.2$ 15,556.3$ 15,371.7$ NOPLAT 2,915.2 12,095.2 18,041.0 15,675.7 15,694.1 15,321.7 15,104.2 14,967.6 (+) Beginning Invested Capital 15,033.0 24,678.2 16,143.1 14,667.1 17,044.8 16,666.8 16,145.3 15,693.2 (-) Current Invested Capital 24,678.2 16,143.1 14,667.1 17,044.8 16,666.8 16,145.3 15,693.2 15,289.0
Value Driver Estimation InputsMarginal Tax Rate
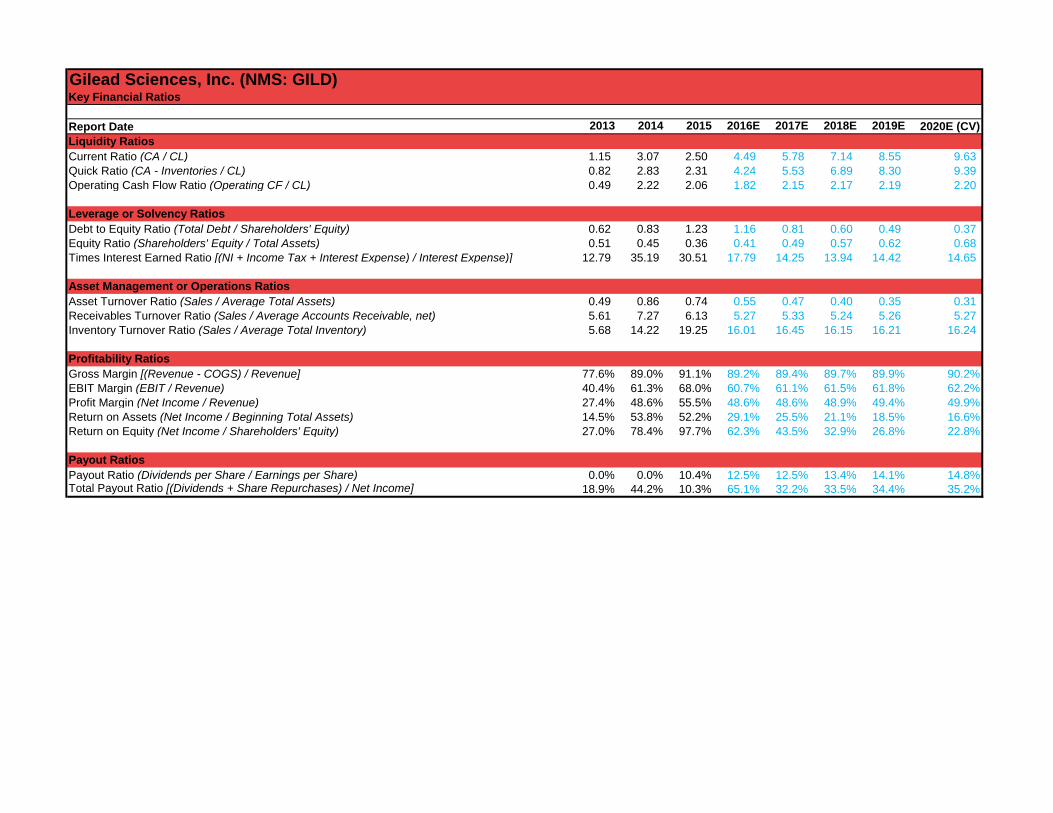
Gilead Sciences, Inc. (NMS: GILD)Key Financial Ratios
Report Date 2013 2014 2015 2016E 2017E 2018E 2019E 2020E (CV)Liquidity RatiosCurrent Ratio (CA / CL) 1.15 3.07 2.50 4.49 5.78 7.14 8.55 9.63 Quick Ratio (CA - Inventories / CL) 0.82 2.83 2.31 4.24 5.53 6.89 8.30 9.39 Operating Cash Flow Ratio (Operating CF / CL) 0.49 2.22 2.06 1.82 2.15 2.17 2.19 2.20
Leverage or Solvency RatiosDebt to Equity Ratio (Total Debt / Shareholders' Equity) 0.62 0.83 1.23 1.16 0.81 0.60 0.49 0.37 Equity Ratio (Shareholders' Equity / Total Assets) 0.51 0.45 0.36 0.41 0.49 0.57 0.62 0.68 Times Interest Earned Ratio [(NI + Income Tax + Interest Expense) / Interest Expense)] 12.79 35.19 30.51 17.79 14.25 13.94 14.42 14.65
Asset Management or Operations RatiosAsset Turnover Ratio (Sales / Average Total Assets) 0.49 0.86 0.74 0.55 0.47 0.40 0.35 0.31 Receivables Turnover Ratio (Sales / Average Accounts Receivable, net) 5.61 7.27 6.13 5.27 5.33 5.24 5.26 5.27 Inventory Turnover Ratio (Sales / Average Total Inventory) 5.68 14.22 19.25 16.01 16.45 16.15 16.21 16.24
Profitability RatiosGross Margin [(Revenue - COGS) / Revenue] 77.6% 89.0% 91.1% 89.2% 89.4% 89.7% 89.9% 90.2%EBIT Margin (EBIT / Revenue) 40.4% 61.3% 68.0% 60.7% 61.1% 61.5% 61.8% 62.2%Profit Margin (Net Income / Revenue) 27.4% 48.6% 55.5% 48.6% 48.6% 48.9% 49.4% 49.9%Return on Assets (Net Income / Beginning Total Assets) 14.5% 53.8% 52.2% 29.1% 25.5% 21.1% 18.5% 16.6%Return on Equity (Net Income / Shareholders' Equity) 27.0% 78.4% 97.7% 62.3% 43.5% 32.9% 26.8% 22.8%
Payout RatiosPayout Ratio (Dividends per Share / Earnings per Share) 0.0% 0.0% 10.4% 12.5% 12.5% 13.4% 14.1% 14.8%Total Payout Ratio [(Dividends + Share Repurchases) / Net Income] 18.9% 44.2% 10.3% 65.1% 32.2% 33.5% 34.4% 35.2%
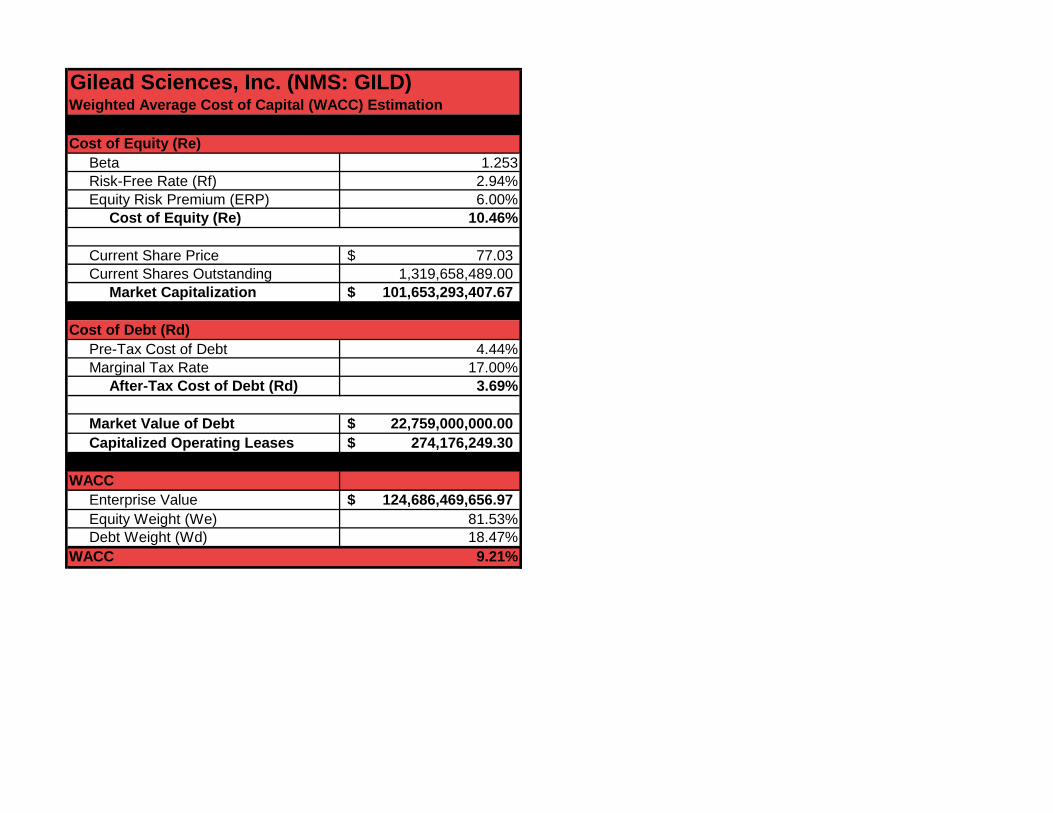
Gilead Sciences, Inc. (NMS: GILD)Weighted Average Cost of Capital (WACC) Estimation
Cost of Equity (Re)Beta 1.253Risk-Free Rate (Rf) 2.94%Equity Risk Premium (ERP) 6.00%
Cost of Equity (Re) 10.46%
Current Share Price 77.03$ Current Shares Outstanding 1,319,658,489.00
Market Capitalization 101,653,293,407.67$
Cost of Debt (Rd)Pre-Tax Cost of Debt 4.44%Marginal Tax Rate 17.00%
After-Tax Cost of Debt (Rd) 3.69%
Market Value of Debt 22,759,000,000.00$ Capitalized Operating Leases 274,176,249.30$
WACCEnterprise Value 124,686,469,656.97$ Equity Weight (We) 81.53%Debt Weight (Wd) 18.47%
WACC 9.21%
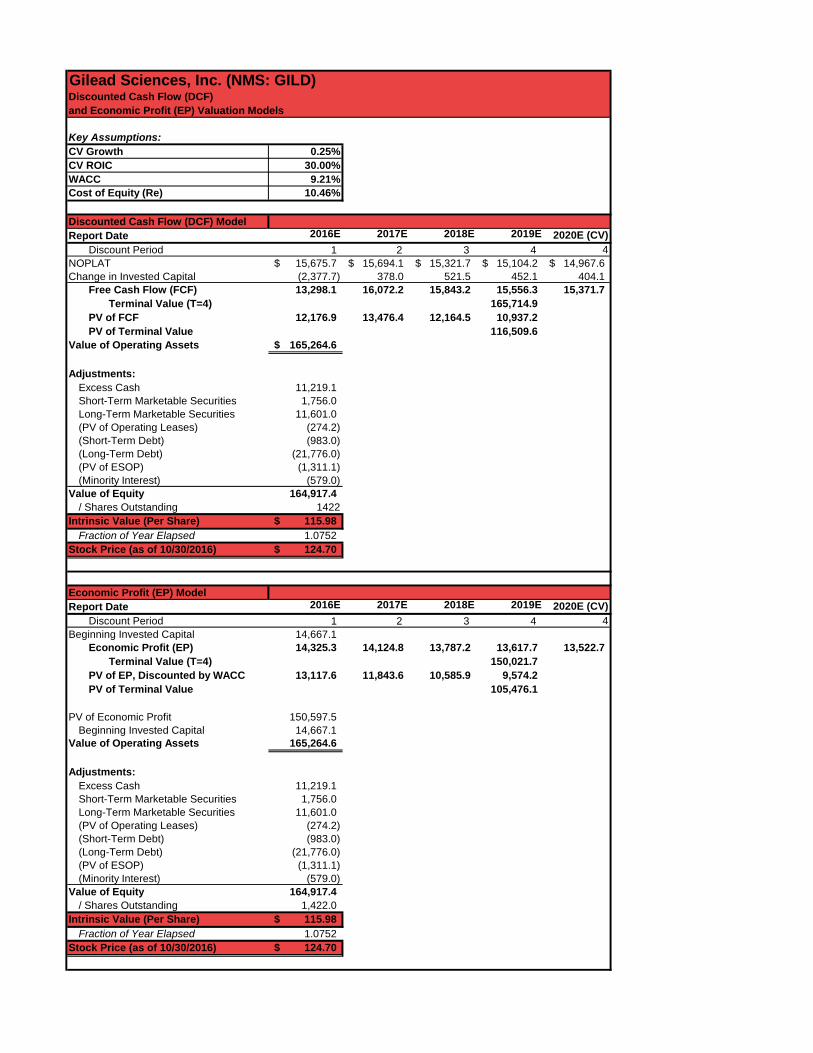
Gilead Sciences, Inc. (NMS: GILD)Discounted Cash Flow (DCF)and Economic Profit (EP) Valuation Models
Key Assumptions:CV Growth 0.25%CV ROIC 30.00%WACC 9.21%Cost of Equity (Re) 10.46%
Discounted Cash Flow (DCF) ModelReport Date 2016E 2017E 2018E 2019E 2020E (CV)
Discount Period 1 2 3 4 4NOPLAT 15,675.7$ 15,694.1$ 15,321.7$ 15,104.2$ 14,967.6$ Change in Invested Capital (2,377.7) 378.0 521.5 452.1 404.1
Free Cash Flow (FCF) 13,298.1 16,072.2 15,843.2 15,556.3 15,371.7 Terminal Value (T=4) 165,714.9
PV of FCF 12,176.9 13,476.4 12,164.5 10,937.2 PV of Terminal Value 116,509.6
Value of Operating Assets 165,264.6$
Adjustments:Excess Cash 11,219.1 Short-Term Marketable Securities 1,756.0 Long-Term Marketable Securities 11,601.0 (PV of Operating Leases) (274.2) (Short-Term Debt) (983.0) (Long-Term Debt) (21,776.0) (PV of ESOP) (1,311.1) (Minority Interest) (579.0)
Value of Equity 164,917.4 / Shares Outstanding 1422
Intrinsic Value (Per Share) 115.98$ Fraction of Year Elapsed 1.0752
Stock Price (as of 10/30/2016) 124.70$
Economic Profit (EP) ModelReport Date 2016E 2017E 2018E 2019E 2020E (CV)
Discount Period 1 2 3 4 4Beginning Invested Capital 14,667.1
Economic Profit (EP) 14,325.3 14,124.8 13,787.2 13,617.7 13,522.7 Terminal Value (T=4) 150,021.7
PV of EP, Discounted by WACC 13,117.6 11,843.6 10,585.9 9,574.2 PV of Terminal Value 105,476.1
PV of Economic Profit 150,597.5 Beginning Invested Capital 14,667.1
Value of Operating Assets 165,264.6
Adjustments:Excess Cash 11,219.1 Short-Term Marketable Securities 1,756.0 Long-Term Marketable Securities 11,601.0 (PV of Operating Leases) (274.2) (Short-Term Debt) (983.0) (Long-Term Debt) (21,776.0) (PV of ESOP) (1,311.1) (Minority Interest) (579.0)
Value of Equity 164,917.4 / Shares Outstanding 1,422.0
Intrinsic Value (Per Share) 115.98$ Fraction of Year Elapsed 1.0752
Stock Price (as of 10/30/2016) 124.70$
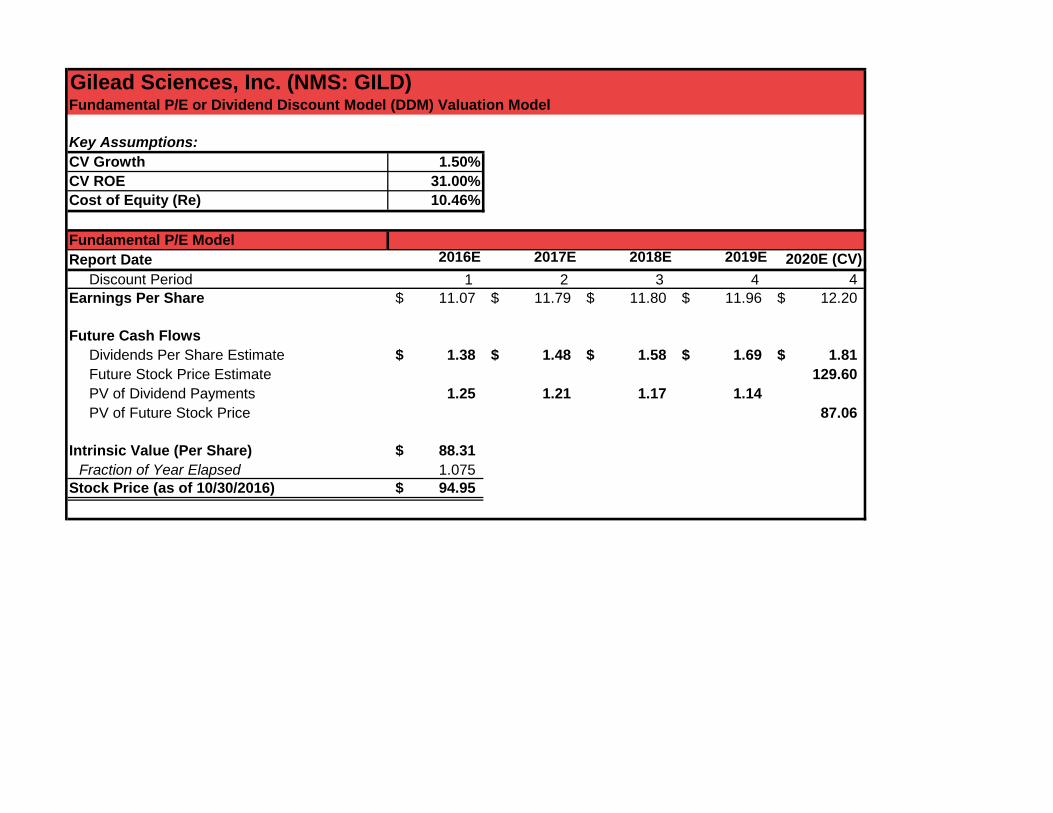
Gilead Sciences, Inc. (NMS: GILD)Fundamental P/E or Dividend Discount Model (DDM) Valuation Model
Key Assumptions:CV Growth 1.50%CV ROE 31.00%Cost of Equity (Re) 10.46%
Fundamental P/E ModelReport Date 2016E 2017E 2018E 2019E 2020E (CV)
Discount Period 1 2 3 4 4 Earnings Per Share 11.07$ 11.79$ 11.80$ 11.96$ 12.20$
Future Cash FlowsDividends Per Share Estimate 1.38$ 1.48$ 1.58$ 1.69$ 1.81$ Future Stock Price Estimate 129.60 PV of Dividend Payments 1.25 1.21 1.17 1.14 PV of Future Stock Price 87.06
Intrinsic Value (Per Share) 88.31$ Fraction of Year Elapsed 1.075
Stock Price (as of 10/30/2016) 94.95$
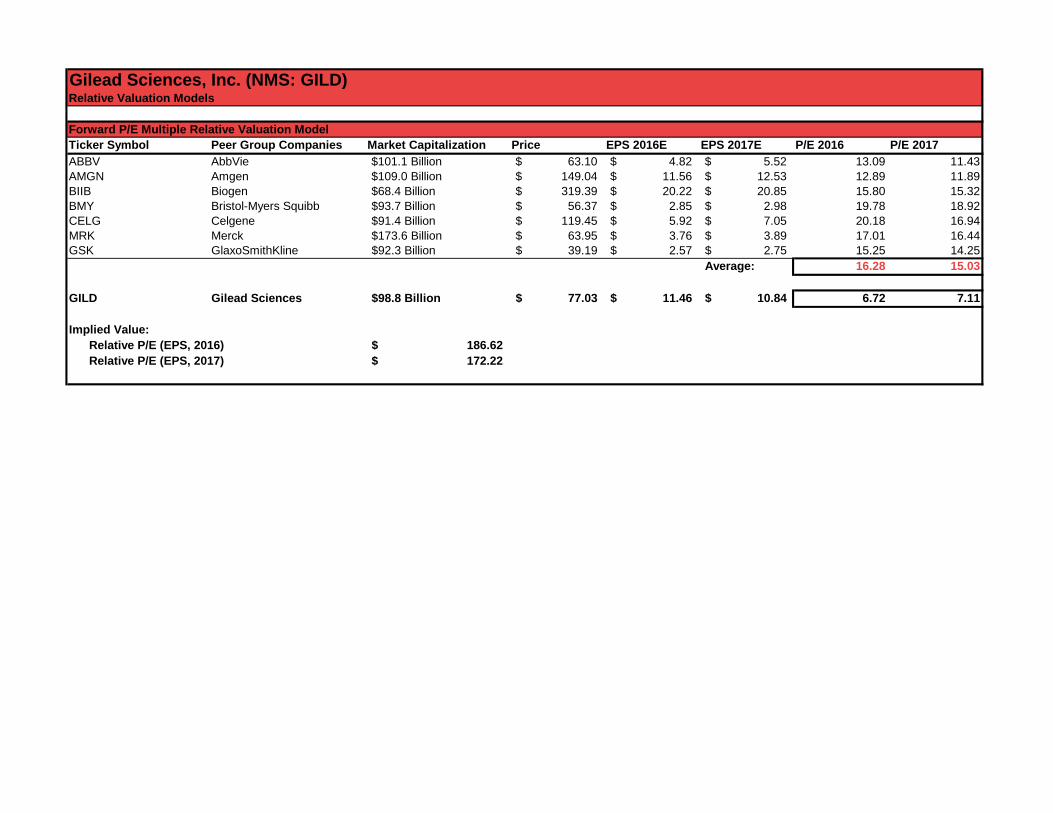
Gilead Sciences, Inc. (NMS: GILD)Relative Valuation Models
Forward P/E Multiple Relative Valuation ModelTicker Symbol Peer Group Companies Market Capitalization Price EPS 2016E EPS 2017E P/E 2016 P/E 2017ABBV AbbVie $101.1 Billion 63.10$ 4.82$ 5.52$ 13.09 11.43AMGN Amgen $109.0 Billion 149.04$ 11.56$ 12.53$ 12.89 11.89BIIB Biogen $68.4 Billion 319.39$ 20.22$ 20.85$ 15.80 15.32BMY Bristol-Myers Squibb $93.7 Billion 56.37$ 2.85$ 2.98$ 19.78 18.92CELG Celgene $91.4 Billion 119.45$ 5.92$ 7.05$ 20.18 16.94MRK Merck $173.6 Billion 63.95$ 3.76$ 3.89$ 17.01 16.44GSK GlaxoSmithKline $92.3 Billion 39.19$ 2.57$ 2.75$ 15.25 14.25
Average: 16.28 15.03
GILD Gilead Sciences $98.8 Billion 77.03$ 11.46$ 10.84$ 6.72 7.11
Implied Value:Relative P/E (EPS, 2016) 186.62$ Relative P/E (EPS, 2017) 172.22$
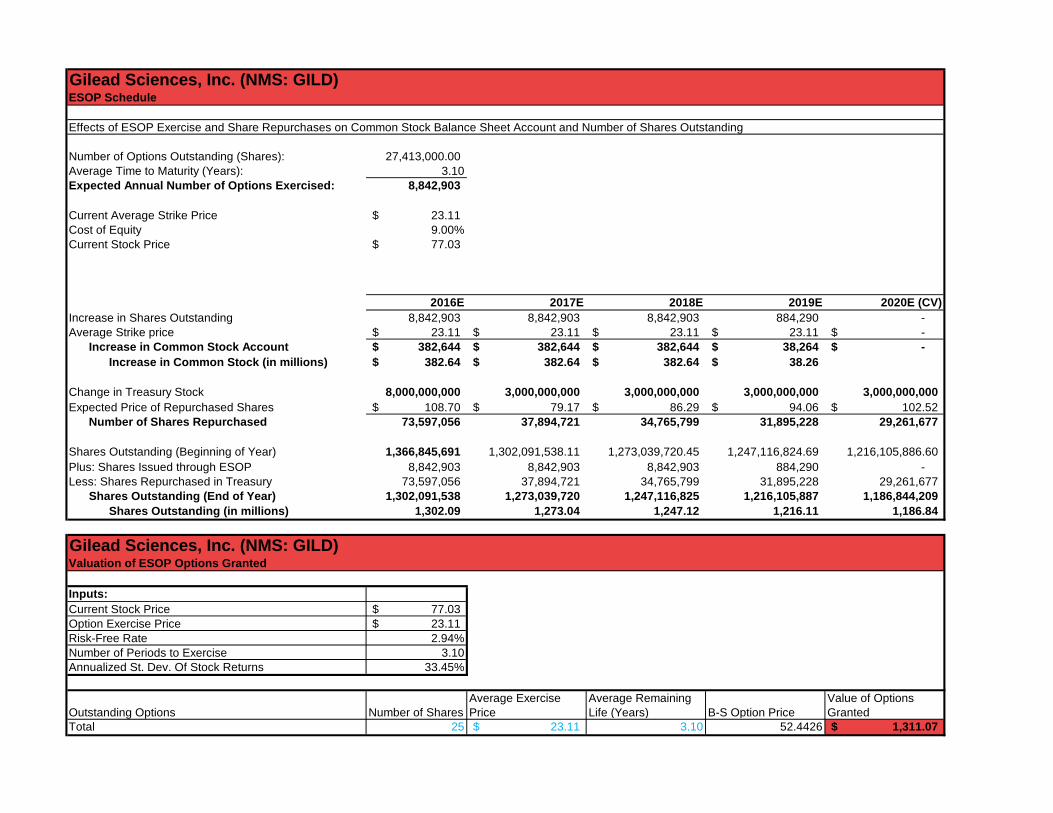
Gilead Sciences, Inc. (NMS: GILD)ESOP Schedule
Effects of ESOP Exercise and Share Repurchases on Common Stock Balance Sheet Account and Number of Shares Outstanding
Number of Options Outstanding (Shares): 27,413,000.00 Average Time to Maturity (Years): 3.10Expected Annual Number of Options Exercised: 8,842,903
Current Average Strike Price 23.11$ Cost of Equity 9.00%Current Stock Price 77.03$
2016E 2017E 2018E 2019E 2020E (CV)Increase in Shares Outstanding 8,842,903 8,842,903 8,842,903 884,290 - Average Strike price 23.11$ 23.11$ 23.11$ 23.11$ -$
Increase in Common Stock Account 382,644$ 382,644$ 382,644$ 38,264$ -$ Increase in Common Stock (in millions) 382.64$ 382.64$ 382.64$ 38.26$
Change in Treasury Stock 8,000,000,000 3,000,000,000 3,000,000,000 3,000,000,000 3,000,000,000 Expected Price of Repurchased Shares 108.70$ 79.17$ 86.29$ 94.06$ 102.52$
Number of Shares Repurchased 73,597,056 37,894,721 34,765,799 31,895,228 29,261,677
Shares Outstanding (Beginning of Year) 1,366,845,691 1,302,091,538.11 1,273,039,720.45 1,247,116,824.69 1,216,105,886.60 Plus: Shares Issued through ESOP 8,842,903 8,842,903 8,842,903 884,290 - Less: Shares Repurchased in Treasury 73,597,056 37,894,721 34,765,799 31,895,228 29,261,677
Shares Outstanding (End of Year) 1,302,091,538 1,273,039,720 1,247,116,825 1,216,105,887 1,186,844,209 Shares Outstanding (in millions) 1,302.09 1,273.04 1,247.12 1,216.11 1,186.84
Gilead Sciences, Inc. (NMS: GILD)Valuation of ESOP Options Granted
Inputs:Current Stock Price 77.03$ Option Exercise Price 23.11$ Risk-Free Rate 2.94%Number of Periods to Exercise 3.10Annualized St. Dev. Of Stock Returns 33.45%
Outstanding Options Number of SharesAverage Exercise Price
Average Remaining Life (Years) B-S Option Price
Value of Options Granted
Total 25 23.11$ 3.10 52.4426 1,311.07$
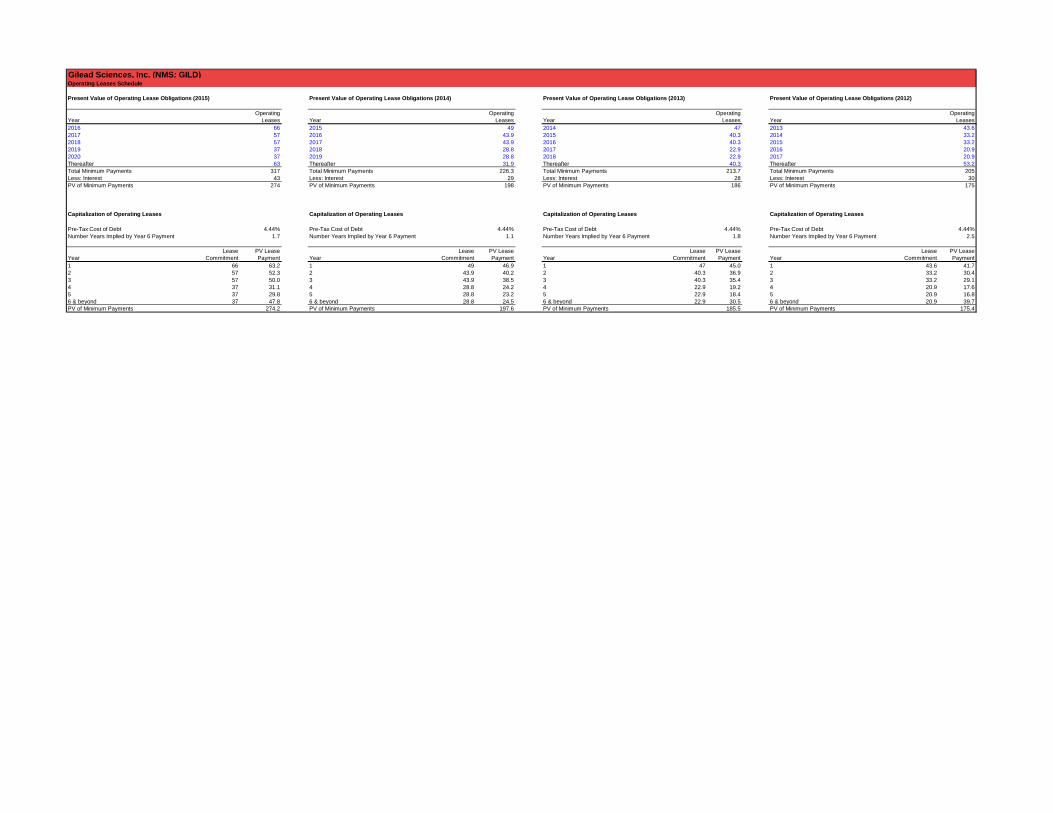
Gilead Sciences, Inc. (NMS: GILD)Operating Leases Schedule
Present Value of Operating Lease Obligations (2015) Present Value of Operating Lease Obligations (2014) Present Value of Operating Lease Obligations (2013) Present Value of Operating Lease Obligations (2012)
Operating Operating Operating OperatingYear Leases Year Leases Year Leases Year Leases2016 66 2015 49 2014 47 2013 43.62017 57 2016 43.9 2015 40.3 2014 33.22018 57 2017 43.9 2016 40.3 2015 33.22019 37 2018 28.8 2017 22.9 2016 20.92020 37 2019 28.8 2018 22.9 2017 20.9Thereafter 63 Thereafter 31.9 Thereafter 40.3 Thereafter 53.2Total Minimum Payments 317 Total Minimum Payments 226.3 Total Minimum Payments 213.7 Total Minimum Payments 205Less: Interest 43 Less: Interest 29 Less: Interest 28 Less: Interest 30PV of Minimum Payments 274 PV of Minimum Payments 198 PV of Minimum Payments 186 PV of Minimum Payments 175
Capitalization of Operating Leases Capitalization of Operating Leases Capitalization of Operating Leases Capitalization of Operating Leases
Pre-Tax Cost of Debt 4.44% Pre-Tax Cost of Debt 4.44% Pre-Tax Cost of Debt 4.44% Pre-Tax Cost of Debt 4.44%Number Years Implied by Year 6 Payment 1.7 Number Years Implied by Year 6 Payment 1.1 Number Years Implied by Year 6 Payment 1.8 Number Years Implied by Year 6 Payment 2.5
Lease PV Lease Lease PV Lease Lease PV Lease Lease PV LeaseYear Commitment Payment Year Commitment Payment Year Commitment Payment Year Commitment Payment1 66 63.2 1 49 46.9 1 47 45.0 1 43.6 41.72 57 52.3 2 43.9 40.2 2 40.3 36.9 2 33.2 30.43 57 50.0 3 43.9 38.5 3 40.3 35.4 3 33.2 29.14 37 31.1 4 28.8 24.2 4 22.9 19.2 4 20.9 17.65 37 29.8 5 28.8 23.2 5 22.9 18.4 5 20.9 16.86 & beyond 37 47.8 6 & beyond 28.8 24.5 6 & beyond 22.9 30.5 6 & beyond 20.9 39.7PV of Minimum Payments 274.2 PV of Minimum Payments 197.6 PV of Minimum Payments 185.5 PV of Minimum Payments 175.4
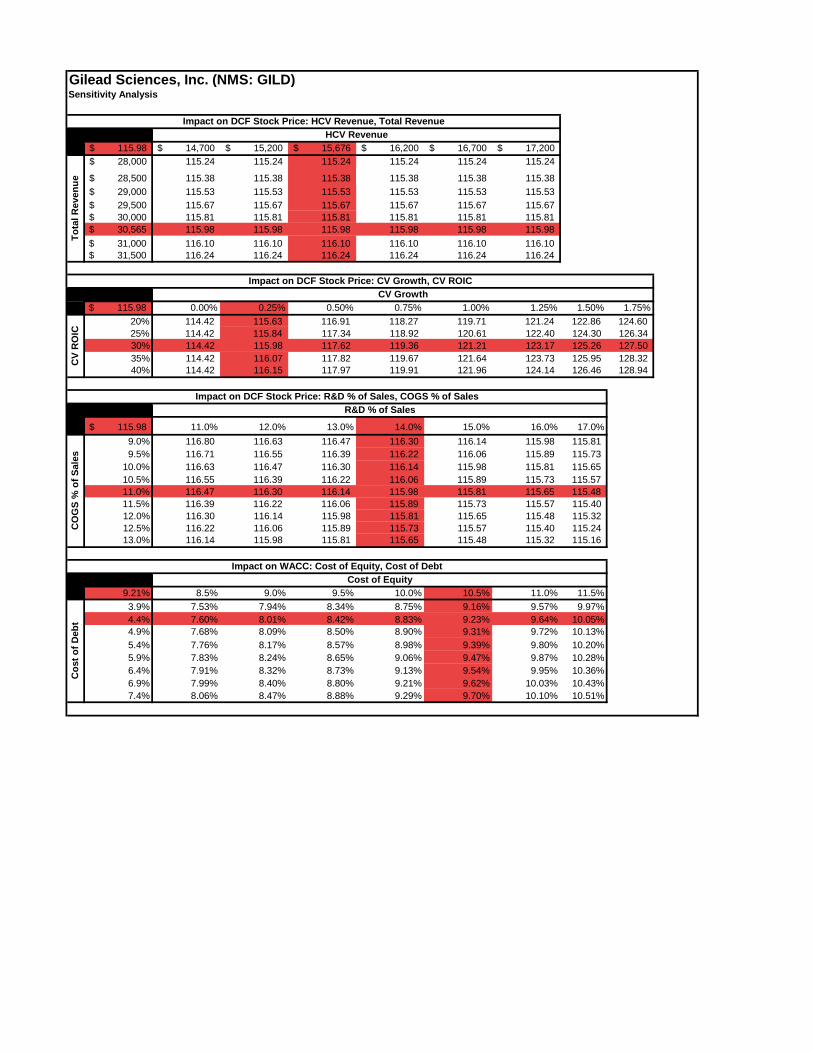
Gilead Sciences, Inc. (NMS: GILD)Sensitivity Analysis
115.98$ 14,700$ 15,200$ 15,676$ 16,200$ 16,700$ 17,200$ 28,000$ 115.24 115.24 115.24 115.24 115.24 115.24
28,500$ 115.38 115.38 115.38 115.38 115.38 115.38 29,000$ 115.53 115.53 115.53 115.53 115.53 115.53 29,500$ 115.67 115.67 115.67 115.67 115.67 115.67 30,000$ 115.81 115.81 115.81 115.81 115.81 115.81 30,565$ 115.98 115.98 115.98 115.98 115.98 115.98 31,000$ 116.10 116.10 116.10 116.10 116.10 116.10 31,500$ 116.24 116.24 116.24 116.24 116.24 116.24
115.98$ 0.00% 0.25% 0.50% 0.75% 1.00% 1.25% 1.50% 1.75%20% 114.42 115.63 116.91 118.27 119.71 121.24 122.86 124.60 25% 114.42 115.84 117.34 118.92 120.61 122.40 124.30 126.34 30% 114.42 115.98 117.62 119.36 121.21 123.17 125.26 127.50 35% 114.42 116.07 117.82 119.67 121.64 123.73 125.95 128.32 40% 114.42 116.15 117.97 119.91 121.96 124.14 126.46 128.94
115.98$ 11.0% 12.0% 13.0% 14.0% 15.0% 16.0% 17.0%9.0% 116.80 116.63 116.47 116.30 116.14 115.98 115.81 9.5% 116.71 116.55 116.39 116.22 116.06 115.89 115.73
10.0% 116.63 116.47 116.30 116.14 115.98 115.81 115.65 10.5% 116.55 116.39 116.22 116.06 115.89 115.73 115.57 11.0% 116.47 116.30 116.14 115.98 115.81 115.65 115.48 11.5% 116.39 116.22 116.06 115.89 115.73 115.57 115.40 12.0% 116.30 116.14 115.98 115.81 115.65 115.48 115.32 12.5% 116.22 116.06 115.89 115.73 115.57 115.40 115.24 13.0% 116.14 115.98 115.81 115.65 115.48 115.32 115.16
9.21% 8.5% 9.0% 9.5% 10.0% 10.5% 11.0% 11.5%3.9% 7.53% 7.94% 8.34% 8.75% 9.16% 9.57% 9.97%4.4% 7.60% 8.01% 8.42% 8.83% 9.23% 9.64% 10.05%4.9% 7.68% 8.09% 8.50% 8.90% 9.31% 9.72% 10.13%5.4% 7.76% 8.17% 8.57% 8.98% 9.39% 9.80% 10.20%5.9% 7.83% 8.24% 8.65% 9.06% 9.47% 9.87% 10.28%6.4% 7.91% 8.32% 8.73% 9.13% 9.54% 9.95% 10.36%6.9% 7.99% 8.40% 8.80% 9.21% 9.62% 10.03% 10.43%7.4% 8.06% 8.47% 8.88% 9.29% 9.70% 10.10% 10.51%
Impact on DCF Stock Price: HCV Revenue, Total RevenueHCV Revenue
Tota
l Rev
enue
Cost of Equity
Cos
t of D
ebt
CV
RO
IC
Impact on WACC: Cost of Equity, Cost of Debt
Impact on DCF Stock Price: R&D % of Sales, COGS % of SalesR&D % of Sales
CO
GS
% o
f Sal
es
Impact on DCF Stock Price: CV Growth, CV ROICCV Growth