Geostatistical Simulation of the Total Organic Carbon Values: An Example from Petroleum Source Rocks...
15
PLEASE SCROLL DOWN FOR ARTICLE This article was downloaded by: [TÜBTAK EKUAL] On: 25 November 2008 Access details: Access Details: [subscription number 772815469] Publisher Taylor & Francis Informa Ltd Registered in England and Wales Registered Number: 1072954 Registered office: Mortimer House, 37-41 Mortimer Street, London W1T 3JH, UK Petroleum Science and Technology Publication details, including instructions for authors and subscription information: http://www.informaworld.com/smpp/title~content=t713597288 Geostatistical Simulation of the Total Organic Carbon Values: An Example from Petroleum Source Rocks on the Coastal Area of Western Taurus Region, Turkey Cem Sarac a ; Ismail Hakki Demirel a ; Ozgul Sen a ; Nehir Varol a a Department of Geological Engineering, Hacettepe University, Ankara, Turkey Online Publication Date: 02 January 2004 To cite this Article Sarac, Cem, Demirel, Ismail Hakki, Sen, Ozgul and Varol, Nehir(2004)'Geostatistical Simulation of the Total Organic Carbon Values: An Example from Petroleum Source Rocks on the Coastal Area of Western Taurus Region, Turkey',Petroleum Science and Technology,22:3,367 — 379 To link to this Article: DOI: 10.1081/LFT-120024394 URL: http://dx.doi.org/10.1081/LFT-120024394 Full terms and conditions of use: http://www.informaworld.com/terms-and-conditions-of-access.pdf This article may be used for research, teaching and private study purposes. Any substantial or systematic reproduction, re-distribution, re-selling, loan or sub-licensing, systematic supply or distribution in any form to anyone is expressly forbidden. The publisher does not give any warranty express or implied or make any representation that the contents will be complete or accurate or up to date. The accuracy of any instructions, formulae and drug doses should be independently verified with primary sources. The publisher shall not be liable for any loss, actions, claims, proceedings, demand or costs or damages whatsoever or howsoever caused arising directly or indirectly in connection with or arising out of the use of this material.
Transcript of Geostatistical Simulation of the Total Organic Carbon Values: An Example from Petroleum Source Rocks...

PLEASE SCROLL DOWN FOR ARTICLE
This article was downloaded by [TUumlBTAK EKUAL]On 25 November 2008Access details Access Details [subscription number 772815469]Publisher Taylor amp FrancisInforma Ltd Registered in England and Wales Registered Number 1072954 Registered office Mortimer House37-41 Mortimer Street London W1T 3JH UK
Petroleum Science and TechnologyPublication details including instructions for authors and subscription informationhttpwwwinformaworldcomsmpptitle~content=t713597288
Geostatistical Simulation of the Total Organic Carbon Values An Example fromPetroleum Source Rocks on the Coastal Area of Western Taurus RegionTurkeyCem Sarac a Ismail Hakki Demirel a Ozgul Sen a Nehir Varol a
a Department of Geological Engineering Hacettepe University Ankara Turkey
Online Publication Date 02 January 2004
To cite this Article Sarac Cem Demirel Ismail Hakki Sen Ozgul and Varol Nehir(2004)Geostatistical Simulation of the Total OrganicCarbon Values An Example from Petroleum Source Rocks on the Coastal Area of Western Taurus Region TurkeyPetroleumScience and Technology223367 mdash 379
To link to this Article DOI 101081LFT-120024394
URL httpdxdoiorg101081LFT-120024394
Full terms and conditions of use httpwwwinformaworldcomterms-and-conditions-of-accesspdf
This article may be used for research teaching and private study purposes Any substantial orsystematic reproduction re-distribution re-selling loan or sub-licensing systematic supply ordistribution in any form to anyone is expressly forbidden
The publisher does not give any warranty express or implied or make any representation that the contentswill be complete or accurate or up to date The accuracy of any instructions formulae and drug dosesshould be independently verified with primary sources The publisher shall not be liable for any lossactions claims proceedings demand or costs or damages whatsoever or howsoever caused arising directlyor indirectly in connection with or arising out of the use of this material
PETROLEUM SCIENCE AND TECHNOLOGY
Vol 22 Nos 3 amp 4 pp 367ndash379 2004
Geostatistical Simulation of the Total Organic
Carbon Values An Example from Petroleum
Source Rocks on the Coastal Area of Western
Taurus Region Turkey
Cem Sarac Ismail Hakki Demirel
Ozgul Sen and Nehir Varol
Department of Geological Engineering Hacettepe
University Beytepe Campus Ankara Turkey
ABSTRACT
Geostatistical conditional simulation is widely used and accepted as a
method of generating stochastic models of hydrocarbon reservoirs
There are many applications described in the literature using one or
more of the range of methods now available and apart from the
petroleum reservoirs simulated annealing technique is applied to the
total organic carbon values of the potential hydrocarbon sourcemdash
rocks which has been penetrated by seven wells drilled on the western
Taurus region The main source rock intervals are mostly encountered
in the autochthonous Beydaglari carbonates After a description of
Correspondence Dr Ismail Hakki Demirel Department of Geological
Engineering Hacettepe University Beytepe Campus 06532 Ankara Turkey
Fax thorn90 312 2902025 E-mail hakkidhacettepeedutr
367
DOI 101081LFT-120024394 1091-6466 (Print) 1532-2459 (Online)
Copyright amp 2004 by Marcel Dekker Inc wwwdekkercom
Downloaded By [TUumlBTAK EKUAL] At 0945 25 November 2008
ORDER REPRINTS
the geology of the area a geostatistical study based on 440 composite
samples is presented The composite samples gave a positively skewed
distribution with a mean of 027 total organic carbon values
Experimental variograms representing three main directionsmdashstrike
plunge cross dip and downdip directionsmdashwere calculated a spherical
typemodel was fitted to variograms Amodel validation and a number
of conditional simulation were applied to the data respectively and
the best simulation senario was chosen Thus a total of 1 440 000 grid
nodes were conditonally simulated using the set of 440 data values
Simulation results indicate that the amount of organic matter that has
generated hydrocarbons increases with increasing depth and signifi-
cant source rocks rich in organic matter has concentrated on the
coastal area of the western Taurus region
Key Words Geostatical simulation Total organic carbon Western
Taurus region
INTRODUCTION
Hydrocarbon prospection studies on the autochthonous BeydaglariUnits in the western Taurus region were carried out through 1980sBecause of the negative thermal anomalies which were encountered in anumber of drillholes the petroleum system definition could not have beencompleted yet However in the second half of 1990s the region hasbecome fruitful by discovering the potential hydrocarbon source rocksof various ages The total organic carbon contents (average 8) of thesamples from the outcrops of the coastal area and Demre-1 Alakir-1wells have higher values than the samples from the northern parts ofthe region which contain less than 05 of the total organic carboncontent As mentioned in Demirel and Gunay (2000) central and north-ern parts of the Western Taurus region have an average height of2000ndash2500m with high mountains sharp peaks deep valleys narrowgorges and all the karst features such as dolines poljes underground(last) rivers and caverns Consequently rapid circulation of meteoricwaters and subsurface waters moving within the geological system influ-ence the distribution of the total organic matter content and temperaturesin the subsurface environments
This study aims to evaluate the differences between northern andsouthern parts of the area in relation to the total organic carbon(TOC) content To realize the objective geochemical data from sevenwells were integrated with the geostatistical conditional simulation as amethod of generating stochastic models of hydrocarbon explorations
368 Sarac et al
Downloaded By [TUumlBTAK EKUAL] At 0945 25 November 2008
ORDER REPRINTS
SUMMARY OF GEOLOGICAL SETTING
The western Taurus region lies in the southwestern part of Turkeyand is bordered by the Aksu Fault in the east and Aegean Sea in the westdrill-hole locations and simplified geological map of the area is shown inFig 1 The sedimentary succession autochthonous Beydaglari Unitshere act a western side of the Autochthonous Taurus Unit which belongsto the northern margin of the Gondwana (Guvenc et al 1994)
The stratigraphic section in the western Taurus region ranges inthe age from Upper Triassic to Quaternary and divided into two strati-graphic sequences as autochthonous Beydaglari Units and AntalyaNappes (Blumenthal 1951 Ozgul and Arpat 1973 Lefevre 1967Gunay and Bolukbasi 1980 Monod et al 1974 Marcoux 1979Y|lmaz et al 1981 and Senel et al 1983) Tectono-stratigraphiccolumn section of western Taurus region is given in Fig 2 In thestudy area Paleozoic succession of the Autochthonous Taurus Unitwas not penetrated in the wells Upper Triassic sequence is composedof limestones and dolomites During the Jurassic and Cretaceous timesthe autochthonous Beydaglari Units were represented by shelf carbonatesand detritals which were deposited on the continental slope to basinCarbonat platform has begun to break by a rifting occurred in thenorthern margin of the Gondwana through Middle-Upper Triassic andoceanic crust materials were accumulated on the margins of the subsidingrift areas Fine-grained sediments and ophiolites deposited in deeper con-tinental slope and basins were pushed and thrust as three different nappeslices (Lower Middle and Upper Antalya Nappes) onto the relativelyautochthonous Beydaglari carbonates by the first compressionaltectonism of the Upper Cretaceous and Early Paleocene
Following the second compressional regime in the Eocene timeyounger tectono-stratigraphic sequences namely the Elmali Nappesandor Lycian Nappes were thrust onto the Beydaglari UnitsSedimentation from Eocene to Quaternary was continued in the localbasins which were developed by the later extentional periods
DATA PROCESSING VARIOGRAM
FUNCTION AND MODELING
The data was obtained from seven petroleum vertical wells betweenthe area of Kas and Acipayam towns in western Taurus The TOC valueswere composited into a constant length of 30m from sample lengths thatvaried from 12m to 86m A histogram of the TOC values presented in
Geostatical Stimulation in Turkey 369
Downloaded By [TUumlBTAK EKUAL] At 0945 25 November 2008
ORDER REPRINTS
Figure 1 Well locations and simplified geological map of western Taurus region
(After Demirel and Gunay 2000)
370 Sarac et al
Downloaded By [TUumlBTAK EKUAL] At 0945 25 November 2008
ORDER REPRINTS
Fig 3 shows a positively skewed distribution with a very low coefficientof variation The 440 composite TOC values have a mean of 027 witha variance of 021
Geostatistics is used to estimate the spatial variability of differentreservoir parameters such as TOC values permeability and porosity Acharacteristic behavior or structure of the spatial variability of variablescan be discerned behind a locally erratic aspect Geostatistics considersthese parameters regionalized variables and both the random andstructured aspects of the regionalized variables are expressed by theprobabilistic language of random functions (Journel and Huijbregts1978) every point of the study area defines a random variable and theparameter at this point is interpreted as a realization of that randomvariable A random function is seen as a set of random variables definedat each point in the area and a regionalized variable is a realization of therandom function
Figure 2 Tectono-stratigraphic column section of the western Taurus region
Geostatical Stimulation in Turkey 371
Downloaded By [TUumlBTAK EKUAL] At 0945 25 November 2008
ORDER REPRINTS
In geostatistics the spatial variability of a regionalized variable ischaracterized by the variogram function 2(h) (Journel and Huijbregts1978)
2ethhTHORN frac14 Var ZethxTHORN Zethxthorn hTHORNfrac12
In application
2ethhTHORN frac141
NethhTHORN
XNethhTHORN
ifrac141
zethxiTHORN zethxithornhTHORN 2
whereh the separation vector
(h) the semi-variogramZ(x) a random variable defined at the point x andz(x) an outcome of Z(x)
In most data sets the data values along a certain direction aremore coherent than along the others The direction with best continuityrepresents the maximum correlation direction of the data set and theminimum correlation direction is perpendicular to the maximum correla-tion direction (Isaaks and Srivastava 1989) The ratio between maximumand minimum correlation lengths is known as the anisotropy The similaraxis notation as in Dowd (1985) and Sarac (1998) was used in the study
Figure 3 Histogram of TOC values (View this art in color at wwwdekkercom)
372 Sarac et al
Downloaded By [TUumlBTAK EKUAL] At 0945 25 November 2008
ORDER REPRINTS
The experimental variograms were calculated in the four main directionsand no severe anisotrophy was found Therefore only the omnidirectionalvariogram was retained and modelled The vertical variogram andomnidirectional variogram are shown in Fig 4(a) and (b) respectively
The following simple spherical type variogram model has beenadapted
ethhTHORN frac14 002thorn 0263h
2a
h
2a3
h etha frac14 650 mTHORN
ethhTHORN frac14 028 h gt etha frac14 650 mTHORN
ethhTHORN frac14 0 h frac14 etha frac14 650 mTHORN
The model variogram fitted to the experimental variogram can beseen in Fig 4(b) The model parameters were checked by the use of theback-estimation technique where the data values were removed from thedata set in turn and the estimation was made using the remaining dataand the variogram model This was repeated removing each data valuetogether with all data within a specified ellipsoid of the data value Modelvalidation results verified the chosen model
CONDITIONAL SIMULATION OF THE TOC VALUES
The goal of hydrocarbon reservoir characterization is to provide anumerical model of reservoir attributes (porosity permeability TOCvalues saturations etc) The reservoir model is fine if it providesresponse functions similar to those which would be provided by a perfectmodel based on an exhaustive drilling of hydrocarbon reservoir
Geostatistical simulation is a powerful tool for generating stochasticmodels of hydrocarbon reservoirs The purpose of simulation is togenerate functions or sets of values of a variable of reservior that areconsistent with the available information
Simulation of random fields can be classified into unconditional andconditional methods The simulation techniques commonly used inspatial random field models are
1 Non-conditional Simulation
The turning bands method (Matheron 1973)
The spectral method (Mejia and Rodriguez-Iturbe 1974)
The LUmdashlower uppermdashdecomposition methodthe ring decom-position method (Davis 1987 Sarac and Dowd 1994)
The neural network method (Dowd and Sarac 1994)
Geostatical Stimulation in Turkey 373
Downloaded By [TUumlBTAK EKUAL] At 0945 25 November 2008
ORDER REPRINTS
Figure 4 (a) Vertical (down-dip) variogram (b) Omnidirectional variogram and
model variogram
374 Sarac et al
Downloaded By [TUumlBTAK EKUAL] At 0945 25 November 2008
ORDER REPRINTS
2 Conditional Simulation
The LU decompositionthe ring decomposition
The non-conditional simulation technique combined withkriging technique
Sequential indicator simulation (Alabert 1987)
Techniques combined with heuristic optimization algorithm(Deutsch and Cockerham 1994)
Non-conditional simulation refers to the generation of values witha desired mean and covariance Conditional simulation which refers to asimulation in which the generated values are restricted to be equal tospecified values such as experimental reservoir characterics at theknown locations
In this study the simulated annealing technique is used for con-ditional simulation The main purpose of simulated annealing is toperturb continuously an original image until it matches some prespecifiedcharacteristics written into an objective function (average squareddifference between the experimental and the model variogram) Aperturbation is accepted if the objective function is lowered The successof the method depends on a slow cooling of the realization controlled bya temperature function which decreases with time The simulation iscomplete when the realization is frozen ie when further perturbationsdo not lower the objective function (Deutsch and Journel 1998)
0 frac14Xh
ethhTHORN ethhTHORNfrac12 2
ethhTHORN2
The conditional simulation of TOC values was done a total of 120(xmdasheasting) 150 ( ymdashnorting) 80 (zmdashvertical direction) points Thegrid spacing in x and y directions is 1000m and in z direction is 100mThe full set of 440 data values were used for conditioning Thus a total of1440000 grid nodes were conditionally simulated A set of 1440000obtained conditional simulation of TOC values which conform to thefollowing
(a) At all sampled locations (440 locations) they coincide with thedata values
(b) They have the same distribution as the data values (mean of027 variance of 021 and the same histogram characteristics)
(c) They have the same spatial dispersion ie same variogram asthe data values
Geostatical Stimulation in Turkey 375
Downloaded By [TUumlBTAK EKUAL] At 0945 25 November 2008
ORDER REPRINTS
Figure 5 Block diagrams and image maps of simulated TOC values for
levels (a) thorn1000m (b) 1000m (c) 3000m (View this art in color at www
dekkercom)
376 Sarac et al
Downloaded By [TUumlBTAK EKUAL] At 0945 25 November 2008
ORDER REPRINTS
Thirty-five different simulations were produced using the same param-etres and the best senario which means to be compatible of the existancepetroleum production areas and covers the most wide area was acceptedfor this study Figure 5(andashc) shows the simulated TOC values forthe vertical directions of thorn1000m (a) 1000m (b) and 3000m (c)respectively
RESULTS AND CONCLUSIONS
A conditional simulation study is first used to evaluate the TOCvalues obtained from 7 wells in the western part of Turkey The simulatedannealing technique is applied according to Deutsch and Journel (1998)
The present study indicates that three-dimensional variograms of thearea can be modeled by a spherical model The models were then used tosimulate the total organic carbon values of 120m 150m 80m blocksA number of different simulations were applied and the best scenariowas accepted The simulation results of the total organic carbon valuesare shown in Fig 5 It is clearly seen from the figure that the TOCvalues are increasing with increasing depth
Although active source rocks has found on the coastal area it isnoticed that the actual petroleum leakages are far from coastal areaThis means that migration route is toward northern part of the studyarea so exploration studies of hydrocarbon reservoirs should carry onthe carbonates which are overlied by the Antalya Nappes in the middleand northern part of the western Taurus region
REFERENCES
Alabert F (1987) Stochastic Imaging of Spatial Distributions UsingHard and Soft Information MSc thesis Stanford University253 pp
Blumenthal M M (1951) Recherches geologiques dans le Taurusaccidental dans lrsquoarriere pays drsquoAlanya Publication 5-D MineralResearch and Exploration of Turkey Ankara 1ndash134
Davis M (1987) Production of conditional simulations via the LUtriangular decomposition of the covariance matrix MathematicalGeology 19(2)91ndash98
Demirel I H Gunay Y (2000) Tectonic and karstic effects on thewestern Taurus region southwestern Turkey relations to presenttemperature gradients and total organic carbon content EnergySources 22(5)431ndash442
Geostatical Stimulation in Turkey 377
Downloaded By [TUumlBTAK EKUAL] At 0945 25 November 2008
ORDER REPRINTS
Deutsch C V Cockerham P W (1994) Practical considerations in theapplication of simulated annealing to stochastic simulationMathematical Geology 26(1)67ndash82
Deutsch C V Journel A G (1998) GSLIB Geostatistical SoftwareLibrary and Userrsquos Guide 2nd Ed Applied Geostatistics SeriesNew York Oxford University Press
Dowd P A Sarac C (1994) A neural network approach to geostatis-tical simulation Mathematical Geology 26(4)491ndash503
Dowd P A (1985) Algorithms for three-dimensional interpolationbetween planar slices In Earnshaw R A Ed FundamentalAlgorithms for Computer Graphics Vol F17 BerlinSpringer-Verlag 531ndash554
Gunay Y Bolukbasi S (1980) Finike-Kas-Korkuteli arasinda kalanBeydaglarirsquonin jeolojisi ve petrol olanaklari Report 1450 TPAOAnkara (in Turkish)
Guvenc T Demirel I H Meshur M Gul M A Tekinli U K(1994) The Paleogeography of Anatolia During the Permian andTriassic Vol 11 (A-B) New Series ESRI Occasional Publication11ndash40
Isaaks E H Srivastava R M (1989) An Introduction to AppliedGeostatistics Oxford Oxford University Press
Journel A G Huijbregts Ch J (1978) Mining Geostatistics LondonAcademic Press
Lefevre R (1967) Un nouvel element dans la geologie du Taurus Lycienles nappes drsquoAntalya (Turquie) Comptes Rendus de lrsquoAcademie desSciences 7(D)1365ndash1368
Marcoux J (1979) Antalya Naplar|n|n genel yap|s| ve Tetis guneykenar| paleocografyas|ndaki yeri Turkiye Jeoloji Kurumu Bulteni221ndash5 (in Turkish)
Matheron G (1973) The intrinsic random functions and their applica-tions Adv Appl Prob 5439ndash468
Mejia J M Rodriguez-Iturbe I (1974) On the synthesis of random fieldsampling from the spectrum an application to the generation ofhydrologic spatial processes Water Resources Research10(4)705ndash711
Monod O Marcoux J Poisson A Dumont J F (1974)Le domaine drsquoAntalya temoin de la fracturation de laplatforme Africaine au cours du Trias Bull Soc Geol France16116ndash127
Ozgul N Arpat E (1973) Structural units of the Taurus orogenic beltand their continuation in neighboring regions Geological SocietyBulletin of Greece 10(1)155ndash164
378 Sarac et al
Downloaded By [TUumlBTAK EKUAL] At 0945 25 November 2008
ORDER REPRINTS
Sarac C (1998) Geology and ore reserve estimation at Sivrihisar sepio-lite mine (Eskisehir Turkey) Transactions of the Institution ofMining and Metallurgy 107A6ndashA12
Sarac C Dowd P A (1994) Conditional simulation by ring decom-position of the covariance matrix Sciences de la Terre SerieInformatique Geologique 321ndash14
Senel M Serdaroglu M Kengil R Univerdi M Gozler M Z(1983) Teke Toroslar| guneydogusunun jeolojisi MTA Dergisi9513ndash24 (in Turkish)
Y|lmaz P O Maxwell J C Meuhlberger W R (1981) Antalya kom-pleksinin yap|sal evrimi ve Dogu Akdenizrsquodeki yeri YerbilimleriDergisi 7119ndash127 (in Turkish)
Received August 16 2002Accepted October 15 2002
Geostatical Stimulation in Turkey 379
Downloaded By [TUumlBTAK EKUAL] At 0945 25 November 2008
Request PermissionOrder Reprints
Reprints of this article can also be ordered at
httpwwwdekkercomservletproductDOI101081LFT120024394
Request Permission or Order Reprints Instantly
Interested in copying and sharing this article In most cases US Copyright Law requires that you get permission from the articlersquos rightsholder before using copyrighted content
All information and materials found in this article including but not limited to text trademarks patents logos graphics and images (the Materials) are the copyrighted works and other forms of intellectual property of Marcel Dekker Inc or its licensors All rights not expressly granted are reserved
Get permission to lawfully reproduce and distribute the Materials or order reprints quickly and painlessly Simply click on the Request Permission Order Reprints link below and follow the instructions Visit the US Copyright Office for information on Fair Use limitations of US copyright law Please refer to The Association of American Publishersrsquo (AAP) website for guidelines on Fair Use in the Classroom
The Materials are for your personal use only and cannot be reformatted reposted resold or distributed by electronic means or otherwise without permission from Marcel Dekker Inc Marcel Dekker Inc grants you the limited right to display the Materials only on your personal computer or personal wireless device and to copy and download single copies of such Materials provided that any copyright trademark or other notice appearing on such Materials is also retained by displayed copied or downloaded as part of the Materials and is not removed or obscured and provided you do not edit modify alter or enhance the Materials Please refer to our Website User Agreement for more details
Downloaded By [TUumlBTAK EKUAL] At 0945 25 November 2008

ORDER REPRINTS
SUMMARY OF GEOLOGICAL SETTING
The western Taurus region lies in the southwestern part of Turkeyand is bordered by the Aksu Fault in the east and Aegean Sea in the westdrill-hole locations and simplified geological map of the area is shown inFig 1 The sedimentary succession autochthonous Beydaglari Unitshere act a western side of the Autochthonous Taurus Unit which belongsto the northern margin of the Gondwana (Guvenc et al 1994)
The stratigraphic section in the western Taurus region ranges inthe age from Upper Triassic to Quaternary and divided into two strati-graphic sequences as autochthonous Beydaglari Units and AntalyaNappes (Blumenthal 1951 Ozgul and Arpat 1973 Lefevre 1967Gunay and Bolukbasi 1980 Monod et al 1974 Marcoux 1979Y|lmaz et al 1981 and Senel et al 1983) Tectono-stratigraphiccolumn section of western Taurus region is given in Fig 2 In thestudy area Paleozoic succession of the Autochthonous Taurus Unitwas not penetrated in the wells Upper Triassic sequence is composedof limestones and dolomites During the Jurassic and Cretaceous timesthe autochthonous Beydaglari Units were represented by shelf carbonatesand detritals which were deposited on the continental slope to basinCarbonat platform has begun to break by a rifting occurred in thenorthern margin of the Gondwana through Middle-Upper Triassic andoceanic crust materials were accumulated on the margins of the subsidingrift areas Fine-grained sediments and ophiolites deposited in deeper con-tinental slope and basins were pushed and thrust as three different nappeslices (Lower Middle and Upper Antalya Nappes) onto the relativelyautochthonous Beydaglari carbonates by the first compressionaltectonism of the Upper Cretaceous and Early Paleocene
Following the second compressional regime in the Eocene timeyounger tectono-stratigraphic sequences namely the Elmali Nappesandor Lycian Nappes were thrust onto the Beydaglari UnitsSedimentation from Eocene to Quaternary was continued in the localbasins which were developed by the later extentional periods
DATA PROCESSING VARIOGRAM
FUNCTION AND MODELING
The data was obtained from seven petroleum vertical wells betweenthe area of Kas and Acipayam towns in western Taurus The TOC valueswere composited into a constant length of 30m from sample lengths thatvaried from 12m to 86m A histogram of the TOC values presented in
Geostatical Stimulation in Turkey 369
Downloaded By [TUumlBTAK EKUAL] At 0945 25 November 2008
ORDER REPRINTS
Figure 1 Well locations and simplified geological map of western Taurus region
(After Demirel and Gunay 2000)
370 Sarac et al
Downloaded By [TUumlBTAK EKUAL] At 0945 25 November 2008
ORDER REPRINTS
Fig 3 shows a positively skewed distribution with a very low coefficientof variation The 440 composite TOC values have a mean of 027 witha variance of 021
Geostatistics is used to estimate the spatial variability of differentreservoir parameters such as TOC values permeability and porosity Acharacteristic behavior or structure of the spatial variability of variablescan be discerned behind a locally erratic aspect Geostatistics considersthese parameters regionalized variables and both the random andstructured aspects of the regionalized variables are expressed by theprobabilistic language of random functions (Journel and Huijbregts1978) every point of the study area defines a random variable and theparameter at this point is interpreted as a realization of that randomvariable A random function is seen as a set of random variables definedat each point in the area and a regionalized variable is a realization of therandom function
Figure 2 Tectono-stratigraphic column section of the western Taurus region
Geostatical Stimulation in Turkey 371
Downloaded By [TUumlBTAK EKUAL] At 0945 25 November 2008
ORDER REPRINTS
In geostatistics the spatial variability of a regionalized variable ischaracterized by the variogram function 2(h) (Journel and Huijbregts1978)
2ethhTHORN frac14 Var ZethxTHORN Zethxthorn hTHORNfrac12
In application
2ethhTHORN frac141
NethhTHORN
XNethhTHORN
ifrac141
zethxiTHORN zethxithornhTHORN 2
whereh the separation vector
(h) the semi-variogramZ(x) a random variable defined at the point x andz(x) an outcome of Z(x)
In most data sets the data values along a certain direction aremore coherent than along the others The direction with best continuityrepresents the maximum correlation direction of the data set and theminimum correlation direction is perpendicular to the maximum correla-tion direction (Isaaks and Srivastava 1989) The ratio between maximumand minimum correlation lengths is known as the anisotropy The similaraxis notation as in Dowd (1985) and Sarac (1998) was used in the study
Figure 3 Histogram of TOC values (View this art in color at wwwdekkercom)
372 Sarac et al
Downloaded By [TUumlBTAK EKUAL] At 0945 25 November 2008
ORDER REPRINTS
The experimental variograms were calculated in the four main directionsand no severe anisotrophy was found Therefore only the omnidirectionalvariogram was retained and modelled The vertical variogram andomnidirectional variogram are shown in Fig 4(a) and (b) respectively
The following simple spherical type variogram model has beenadapted
ethhTHORN frac14 002thorn 0263h
2a
h
2a3
h etha frac14 650 mTHORN
ethhTHORN frac14 028 h gt etha frac14 650 mTHORN
ethhTHORN frac14 0 h frac14 etha frac14 650 mTHORN
The model variogram fitted to the experimental variogram can beseen in Fig 4(b) The model parameters were checked by the use of theback-estimation technique where the data values were removed from thedata set in turn and the estimation was made using the remaining dataand the variogram model This was repeated removing each data valuetogether with all data within a specified ellipsoid of the data value Modelvalidation results verified the chosen model
CONDITIONAL SIMULATION OF THE TOC VALUES
The goal of hydrocarbon reservoir characterization is to provide anumerical model of reservoir attributes (porosity permeability TOCvalues saturations etc) The reservoir model is fine if it providesresponse functions similar to those which would be provided by a perfectmodel based on an exhaustive drilling of hydrocarbon reservoir
Geostatistical simulation is a powerful tool for generating stochasticmodels of hydrocarbon reservoirs The purpose of simulation is togenerate functions or sets of values of a variable of reservior that areconsistent with the available information
Simulation of random fields can be classified into unconditional andconditional methods The simulation techniques commonly used inspatial random field models are
1 Non-conditional Simulation
The turning bands method (Matheron 1973)
The spectral method (Mejia and Rodriguez-Iturbe 1974)
The LUmdashlower uppermdashdecomposition methodthe ring decom-position method (Davis 1987 Sarac and Dowd 1994)
The neural network method (Dowd and Sarac 1994)
Geostatical Stimulation in Turkey 373
Downloaded By [TUumlBTAK EKUAL] At 0945 25 November 2008
ORDER REPRINTS
Figure 4 (a) Vertical (down-dip) variogram (b) Omnidirectional variogram and
model variogram
374 Sarac et al
Downloaded By [TUumlBTAK EKUAL] At 0945 25 November 2008
ORDER REPRINTS
2 Conditional Simulation
The LU decompositionthe ring decomposition
The non-conditional simulation technique combined withkriging technique
Sequential indicator simulation (Alabert 1987)
Techniques combined with heuristic optimization algorithm(Deutsch and Cockerham 1994)
Non-conditional simulation refers to the generation of values witha desired mean and covariance Conditional simulation which refers to asimulation in which the generated values are restricted to be equal tospecified values such as experimental reservoir characterics at theknown locations
In this study the simulated annealing technique is used for con-ditional simulation The main purpose of simulated annealing is toperturb continuously an original image until it matches some prespecifiedcharacteristics written into an objective function (average squareddifference between the experimental and the model variogram) Aperturbation is accepted if the objective function is lowered The successof the method depends on a slow cooling of the realization controlled bya temperature function which decreases with time The simulation iscomplete when the realization is frozen ie when further perturbationsdo not lower the objective function (Deutsch and Journel 1998)
0 frac14Xh
ethhTHORN ethhTHORNfrac12 2
ethhTHORN2
The conditional simulation of TOC values was done a total of 120(xmdasheasting) 150 ( ymdashnorting) 80 (zmdashvertical direction) points Thegrid spacing in x and y directions is 1000m and in z direction is 100mThe full set of 440 data values were used for conditioning Thus a total of1440000 grid nodes were conditionally simulated A set of 1440000obtained conditional simulation of TOC values which conform to thefollowing
(a) At all sampled locations (440 locations) they coincide with thedata values
(b) They have the same distribution as the data values (mean of027 variance of 021 and the same histogram characteristics)
(c) They have the same spatial dispersion ie same variogram asthe data values
Geostatical Stimulation in Turkey 375
Downloaded By [TUumlBTAK EKUAL] At 0945 25 November 2008
ORDER REPRINTS
Figure 5 Block diagrams and image maps of simulated TOC values for
levels (a) thorn1000m (b) 1000m (c) 3000m (View this art in color at www
dekkercom)
376 Sarac et al
Downloaded By [TUumlBTAK EKUAL] At 0945 25 November 2008
ORDER REPRINTS
Thirty-five different simulations were produced using the same param-etres and the best senario which means to be compatible of the existancepetroleum production areas and covers the most wide area was acceptedfor this study Figure 5(andashc) shows the simulated TOC values forthe vertical directions of thorn1000m (a) 1000m (b) and 3000m (c)respectively
RESULTS AND CONCLUSIONS
A conditional simulation study is first used to evaluate the TOCvalues obtained from 7 wells in the western part of Turkey The simulatedannealing technique is applied according to Deutsch and Journel (1998)
The present study indicates that three-dimensional variograms of thearea can be modeled by a spherical model The models were then used tosimulate the total organic carbon values of 120m 150m 80m blocksA number of different simulations were applied and the best scenariowas accepted The simulation results of the total organic carbon valuesare shown in Fig 5 It is clearly seen from the figure that the TOCvalues are increasing with increasing depth
Although active source rocks has found on the coastal area it isnoticed that the actual petroleum leakages are far from coastal areaThis means that migration route is toward northern part of the studyarea so exploration studies of hydrocarbon reservoirs should carry onthe carbonates which are overlied by the Antalya Nappes in the middleand northern part of the western Taurus region
REFERENCES
Alabert F (1987) Stochastic Imaging of Spatial Distributions UsingHard and Soft Information MSc thesis Stanford University253 pp
Blumenthal M M (1951) Recherches geologiques dans le Taurusaccidental dans lrsquoarriere pays drsquoAlanya Publication 5-D MineralResearch and Exploration of Turkey Ankara 1ndash134
Davis M (1987) Production of conditional simulations via the LUtriangular decomposition of the covariance matrix MathematicalGeology 19(2)91ndash98
Demirel I H Gunay Y (2000) Tectonic and karstic effects on thewestern Taurus region southwestern Turkey relations to presenttemperature gradients and total organic carbon content EnergySources 22(5)431ndash442
Geostatical Stimulation in Turkey 377
Downloaded By [TUumlBTAK EKUAL] At 0945 25 November 2008
ORDER REPRINTS
Deutsch C V Cockerham P W (1994) Practical considerations in theapplication of simulated annealing to stochastic simulationMathematical Geology 26(1)67ndash82
Deutsch C V Journel A G (1998) GSLIB Geostatistical SoftwareLibrary and Userrsquos Guide 2nd Ed Applied Geostatistics SeriesNew York Oxford University Press
Dowd P A Sarac C (1994) A neural network approach to geostatis-tical simulation Mathematical Geology 26(4)491ndash503
Dowd P A (1985) Algorithms for three-dimensional interpolationbetween planar slices In Earnshaw R A Ed FundamentalAlgorithms for Computer Graphics Vol F17 BerlinSpringer-Verlag 531ndash554
Gunay Y Bolukbasi S (1980) Finike-Kas-Korkuteli arasinda kalanBeydaglarirsquonin jeolojisi ve petrol olanaklari Report 1450 TPAOAnkara (in Turkish)
Guvenc T Demirel I H Meshur M Gul M A Tekinli U K(1994) The Paleogeography of Anatolia During the Permian andTriassic Vol 11 (A-B) New Series ESRI Occasional Publication11ndash40
Isaaks E H Srivastava R M (1989) An Introduction to AppliedGeostatistics Oxford Oxford University Press
Journel A G Huijbregts Ch J (1978) Mining Geostatistics LondonAcademic Press
Lefevre R (1967) Un nouvel element dans la geologie du Taurus Lycienles nappes drsquoAntalya (Turquie) Comptes Rendus de lrsquoAcademie desSciences 7(D)1365ndash1368
Marcoux J (1979) Antalya Naplar|n|n genel yap|s| ve Tetis guneykenar| paleocografyas|ndaki yeri Turkiye Jeoloji Kurumu Bulteni221ndash5 (in Turkish)
Matheron G (1973) The intrinsic random functions and their applica-tions Adv Appl Prob 5439ndash468
Mejia J M Rodriguez-Iturbe I (1974) On the synthesis of random fieldsampling from the spectrum an application to the generation ofhydrologic spatial processes Water Resources Research10(4)705ndash711
Monod O Marcoux J Poisson A Dumont J F (1974)Le domaine drsquoAntalya temoin de la fracturation de laplatforme Africaine au cours du Trias Bull Soc Geol France16116ndash127
Ozgul N Arpat E (1973) Structural units of the Taurus orogenic beltand their continuation in neighboring regions Geological SocietyBulletin of Greece 10(1)155ndash164
378 Sarac et al
Downloaded By [TUumlBTAK EKUAL] At 0945 25 November 2008
ORDER REPRINTS
Sarac C (1998) Geology and ore reserve estimation at Sivrihisar sepio-lite mine (Eskisehir Turkey) Transactions of the Institution ofMining and Metallurgy 107A6ndashA12
Sarac C Dowd P A (1994) Conditional simulation by ring decom-position of the covariance matrix Sciences de la Terre SerieInformatique Geologique 321ndash14
Senel M Serdaroglu M Kengil R Univerdi M Gozler M Z(1983) Teke Toroslar| guneydogusunun jeolojisi MTA Dergisi9513ndash24 (in Turkish)
Y|lmaz P O Maxwell J C Meuhlberger W R (1981) Antalya kom-pleksinin yap|sal evrimi ve Dogu Akdenizrsquodeki yeri YerbilimleriDergisi 7119ndash127 (in Turkish)
Received August 16 2002Accepted October 15 2002
Geostatical Stimulation in Turkey 379
Downloaded By [TUumlBTAK EKUAL] At 0945 25 November 2008
Request PermissionOrder Reprints
Reprints of this article can also be ordered at
httpwwwdekkercomservletproductDOI101081LFT120024394
Request Permission or Order Reprints Instantly
Interested in copying and sharing this article In most cases US Copyright Law requires that you get permission from the articlersquos rightsholder before using copyrighted content
All information and materials found in this article including but not limited to text trademarks patents logos graphics and images (the Materials) are the copyrighted works and other forms of intellectual property of Marcel Dekker Inc or its licensors All rights not expressly granted are reserved
Get permission to lawfully reproduce and distribute the Materials or order reprints quickly and painlessly Simply click on the Request Permission Order Reprints link below and follow the instructions Visit the US Copyright Office for information on Fair Use limitations of US copyright law Please refer to The Association of American Publishersrsquo (AAP) website for guidelines on Fair Use in the Classroom
The Materials are for your personal use only and cannot be reformatted reposted resold or distributed by electronic means or otherwise without permission from Marcel Dekker Inc Marcel Dekker Inc grants you the limited right to display the Materials only on your personal computer or personal wireless device and to copy and download single copies of such Materials provided that any copyright trademark or other notice appearing on such Materials is also retained by displayed copied or downloaded as part of the Materials and is not removed or obscured and provided you do not edit modify alter or enhance the Materials Please refer to our Website User Agreement for more details
Downloaded By [TUumlBTAK EKUAL] At 0945 25 November 2008
ORDER REPRINTS
Figure 1 Well locations and simplified geological map of western Taurus region
(After Demirel and Gunay 2000)
370 Sarac et al
Downloaded By [TUumlBTAK EKUAL] At 0945 25 November 2008
ORDER REPRINTS
Fig 3 shows a positively skewed distribution with a very low coefficientof variation The 440 composite TOC values have a mean of 027 witha variance of 021
Geostatistics is used to estimate the spatial variability of differentreservoir parameters such as TOC values permeability and porosity Acharacteristic behavior or structure of the spatial variability of variablescan be discerned behind a locally erratic aspect Geostatistics considersthese parameters regionalized variables and both the random andstructured aspects of the regionalized variables are expressed by theprobabilistic language of random functions (Journel and Huijbregts1978) every point of the study area defines a random variable and theparameter at this point is interpreted as a realization of that randomvariable A random function is seen as a set of random variables definedat each point in the area and a regionalized variable is a realization of therandom function
Figure 2 Tectono-stratigraphic column section of the western Taurus region
Geostatical Stimulation in Turkey 371
Downloaded By [TUumlBTAK EKUAL] At 0945 25 November 2008
ORDER REPRINTS
In geostatistics the spatial variability of a regionalized variable ischaracterized by the variogram function 2(h) (Journel and Huijbregts1978)
2ethhTHORN frac14 Var ZethxTHORN Zethxthorn hTHORNfrac12
In application
2ethhTHORN frac141
NethhTHORN
XNethhTHORN
ifrac141
zethxiTHORN zethxithornhTHORN 2
whereh the separation vector
(h) the semi-variogramZ(x) a random variable defined at the point x andz(x) an outcome of Z(x)
In most data sets the data values along a certain direction aremore coherent than along the others The direction with best continuityrepresents the maximum correlation direction of the data set and theminimum correlation direction is perpendicular to the maximum correla-tion direction (Isaaks and Srivastava 1989) The ratio between maximumand minimum correlation lengths is known as the anisotropy The similaraxis notation as in Dowd (1985) and Sarac (1998) was used in the study
Figure 3 Histogram of TOC values (View this art in color at wwwdekkercom)
372 Sarac et al
Downloaded By [TUumlBTAK EKUAL] At 0945 25 November 2008
ORDER REPRINTS
The experimental variograms were calculated in the four main directionsand no severe anisotrophy was found Therefore only the omnidirectionalvariogram was retained and modelled The vertical variogram andomnidirectional variogram are shown in Fig 4(a) and (b) respectively
The following simple spherical type variogram model has beenadapted
ethhTHORN frac14 002thorn 0263h
2a
h
2a3
h etha frac14 650 mTHORN
ethhTHORN frac14 028 h gt etha frac14 650 mTHORN
ethhTHORN frac14 0 h frac14 etha frac14 650 mTHORN
The model variogram fitted to the experimental variogram can beseen in Fig 4(b) The model parameters were checked by the use of theback-estimation technique where the data values were removed from thedata set in turn and the estimation was made using the remaining dataand the variogram model This was repeated removing each data valuetogether with all data within a specified ellipsoid of the data value Modelvalidation results verified the chosen model
CONDITIONAL SIMULATION OF THE TOC VALUES
The goal of hydrocarbon reservoir characterization is to provide anumerical model of reservoir attributes (porosity permeability TOCvalues saturations etc) The reservoir model is fine if it providesresponse functions similar to those which would be provided by a perfectmodel based on an exhaustive drilling of hydrocarbon reservoir
Geostatistical simulation is a powerful tool for generating stochasticmodels of hydrocarbon reservoirs The purpose of simulation is togenerate functions or sets of values of a variable of reservior that areconsistent with the available information
Simulation of random fields can be classified into unconditional andconditional methods The simulation techniques commonly used inspatial random field models are
1 Non-conditional Simulation
The turning bands method (Matheron 1973)
The spectral method (Mejia and Rodriguez-Iturbe 1974)
The LUmdashlower uppermdashdecomposition methodthe ring decom-position method (Davis 1987 Sarac and Dowd 1994)
The neural network method (Dowd and Sarac 1994)
Geostatical Stimulation in Turkey 373
Downloaded By [TUumlBTAK EKUAL] At 0945 25 November 2008
ORDER REPRINTS
Figure 4 (a) Vertical (down-dip) variogram (b) Omnidirectional variogram and
model variogram
374 Sarac et al
Downloaded By [TUumlBTAK EKUAL] At 0945 25 November 2008
ORDER REPRINTS
2 Conditional Simulation
The LU decompositionthe ring decomposition
The non-conditional simulation technique combined withkriging technique
Sequential indicator simulation (Alabert 1987)
Techniques combined with heuristic optimization algorithm(Deutsch and Cockerham 1994)
Non-conditional simulation refers to the generation of values witha desired mean and covariance Conditional simulation which refers to asimulation in which the generated values are restricted to be equal tospecified values such as experimental reservoir characterics at theknown locations
In this study the simulated annealing technique is used for con-ditional simulation The main purpose of simulated annealing is toperturb continuously an original image until it matches some prespecifiedcharacteristics written into an objective function (average squareddifference between the experimental and the model variogram) Aperturbation is accepted if the objective function is lowered The successof the method depends on a slow cooling of the realization controlled bya temperature function which decreases with time The simulation iscomplete when the realization is frozen ie when further perturbationsdo not lower the objective function (Deutsch and Journel 1998)
0 frac14Xh
ethhTHORN ethhTHORNfrac12 2
ethhTHORN2
The conditional simulation of TOC values was done a total of 120(xmdasheasting) 150 ( ymdashnorting) 80 (zmdashvertical direction) points Thegrid spacing in x and y directions is 1000m and in z direction is 100mThe full set of 440 data values were used for conditioning Thus a total of1440000 grid nodes were conditionally simulated A set of 1440000obtained conditional simulation of TOC values which conform to thefollowing
(a) At all sampled locations (440 locations) they coincide with thedata values
(b) They have the same distribution as the data values (mean of027 variance of 021 and the same histogram characteristics)
(c) They have the same spatial dispersion ie same variogram asthe data values
Geostatical Stimulation in Turkey 375
Downloaded By [TUumlBTAK EKUAL] At 0945 25 November 2008
ORDER REPRINTS
Figure 5 Block diagrams and image maps of simulated TOC values for
levels (a) thorn1000m (b) 1000m (c) 3000m (View this art in color at www
dekkercom)
376 Sarac et al
Downloaded By [TUumlBTAK EKUAL] At 0945 25 November 2008
ORDER REPRINTS
Thirty-five different simulations were produced using the same param-etres and the best senario which means to be compatible of the existancepetroleum production areas and covers the most wide area was acceptedfor this study Figure 5(andashc) shows the simulated TOC values forthe vertical directions of thorn1000m (a) 1000m (b) and 3000m (c)respectively
RESULTS AND CONCLUSIONS
A conditional simulation study is first used to evaluate the TOCvalues obtained from 7 wells in the western part of Turkey The simulatedannealing technique is applied according to Deutsch and Journel (1998)
The present study indicates that three-dimensional variograms of thearea can be modeled by a spherical model The models were then used tosimulate the total organic carbon values of 120m 150m 80m blocksA number of different simulations were applied and the best scenariowas accepted The simulation results of the total organic carbon valuesare shown in Fig 5 It is clearly seen from the figure that the TOCvalues are increasing with increasing depth
Although active source rocks has found on the coastal area it isnoticed that the actual petroleum leakages are far from coastal areaThis means that migration route is toward northern part of the studyarea so exploration studies of hydrocarbon reservoirs should carry onthe carbonates which are overlied by the Antalya Nappes in the middleand northern part of the western Taurus region
REFERENCES
Alabert F (1987) Stochastic Imaging of Spatial Distributions UsingHard and Soft Information MSc thesis Stanford University253 pp
Blumenthal M M (1951) Recherches geologiques dans le Taurusaccidental dans lrsquoarriere pays drsquoAlanya Publication 5-D MineralResearch and Exploration of Turkey Ankara 1ndash134
Davis M (1987) Production of conditional simulations via the LUtriangular decomposition of the covariance matrix MathematicalGeology 19(2)91ndash98
Demirel I H Gunay Y (2000) Tectonic and karstic effects on thewestern Taurus region southwestern Turkey relations to presenttemperature gradients and total organic carbon content EnergySources 22(5)431ndash442
Geostatical Stimulation in Turkey 377
Downloaded By [TUumlBTAK EKUAL] At 0945 25 November 2008
ORDER REPRINTS
Deutsch C V Cockerham P W (1994) Practical considerations in theapplication of simulated annealing to stochastic simulationMathematical Geology 26(1)67ndash82
Deutsch C V Journel A G (1998) GSLIB Geostatistical SoftwareLibrary and Userrsquos Guide 2nd Ed Applied Geostatistics SeriesNew York Oxford University Press
Dowd P A Sarac C (1994) A neural network approach to geostatis-tical simulation Mathematical Geology 26(4)491ndash503
Dowd P A (1985) Algorithms for three-dimensional interpolationbetween planar slices In Earnshaw R A Ed FundamentalAlgorithms for Computer Graphics Vol F17 BerlinSpringer-Verlag 531ndash554
Gunay Y Bolukbasi S (1980) Finike-Kas-Korkuteli arasinda kalanBeydaglarirsquonin jeolojisi ve petrol olanaklari Report 1450 TPAOAnkara (in Turkish)
Guvenc T Demirel I H Meshur M Gul M A Tekinli U K(1994) The Paleogeography of Anatolia During the Permian andTriassic Vol 11 (A-B) New Series ESRI Occasional Publication11ndash40
Isaaks E H Srivastava R M (1989) An Introduction to AppliedGeostatistics Oxford Oxford University Press
Journel A G Huijbregts Ch J (1978) Mining Geostatistics LondonAcademic Press
Lefevre R (1967) Un nouvel element dans la geologie du Taurus Lycienles nappes drsquoAntalya (Turquie) Comptes Rendus de lrsquoAcademie desSciences 7(D)1365ndash1368
Marcoux J (1979) Antalya Naplar|n|n genel yap|s| ve Tetis guneykenar| paleocografyas|ndaki yeri Turkiye Jeoloji Kurumu Bulteni221ndash5 (in Turkish)
Matheron G (1973) The intrinsic random functions and their applica-tions Adv Appl Prob 5439ndash468
Mejia J M Rodriguez-Iturbe I (1974) On the synthesis of random fieldsampling from the spectrum an application to the generation ofhydrologic spatial processes Water Resources Research10(4)705ndash711
Monod O Marcoux J Poisson A Dumont J F (1974)Le domaine drsquoAntalya temoin de la fracturation de laplatforme Africaine au cours du Trias Bull Soc Geol France16116ndash127
Ozgul N Arpat E (1973) Structural units of the Taurus orogenic beltand their continuation in neighboring regions Geological SocietyBulletin of Greece 10(1)155ndash164
378 Sarac et al
Downloaded By [TUumlBTAK EKUAL] At 0945 25 November 2008
ORDER REPRINTS
Sarac C (1998) Geology and ore reserve estimation at Sivrihisar sepio-lite mine (Eskisehir Turkey) Transactions of the Institution ofMining and Metallurgy 107A6ndashA12
Sarac C Dowd P A (1994) Conditional simulation by ring decom-position of the covariance matrix Sciences de la Terre SerieInformatique Geologique 321ndash14
Senel M Serdaroglu M Kengil R Univerdi M Gozler M Z(1983) Teke Toroslar| guneydogusunun jeolojisi MTA Dergisi9513ndash24 (in Turkish)
Y|lmaz P O Maxwell J C Meuhlberger W R (1981) Antalya kom-pleksinin yap|sal evrimi ve Dogu Akdenizrsquodeki yeri YerbilimleriDergisi 7119ndash127 (in Turkish)
Received August 16 2002Accepted October 15 2002
Geostatical Stimulation in Turkey 379
Downloaded By [TUumlBTAK EKUAL] At 0945 25 November 2008
Request PermissionOrder Reprints
Reprints of this article can also be ordered at
httpwwwdekkercomservletproductDOI101081LFT120024394
Request Permission or Order Reprints Instantly
Interested in copying and sharing this article In most cases US Copyright Law requires that you get permission from the articlersquos rightsholder before using copyrighted content
All information and materials found in this article including but not limited to text trademarks patents logos graphics and images (the Materials) are the copyrighted works and other forms of intellectual property of Marcel Dekker Inc or its licensors All rights not expressly granted are reserved
Get permission to lawfully reproduce and distribute the Materials or order reprints quickly and painlessly Simply click on the Request Permission Order Reprints link below and follow the instructions Visit the US Copyright Office for information on Fair Use limitations of US copyright law Please refer to The Association of American Publishersrsquo (AAP) website for guidelines on Fair Use in the Classroom
The Materials are for your personal use only and cannot be reformatted reposted resold or distributed by electronic means or otherwise without permission from Marcel Dekker Inc Marcel Dekker Inc grants you the limited right to display the Materials only on your personal computer or personal wireless device and to copy and download single copies of such Materials provided that any copyright trademark or other notice appearing on such Materials is also retained by displayed copied or downloaded as part of the Materials and is not removed or obscured and provided you do not edit modify alter or enhance the Materials Please refer to our Website User Agreement for more details
Downloaded By [TUumlBTAK EKUAL] At 0945 25 November 2008

ORDER REPRINTS
Fig 3 shows a positively skewed distribution with a very low coefficientof variation The 440 composite TOC values have a mean of 027 witha variance of 021
Geostatistics is used to estimate the spatial variability of differentreservoir parameters such as TOC values permeability and porosity Acharacteristic behavior or structure of the spatial variability of variablescan be discerned behind a locally erratic aspect Geostatistics considersthese parameters regionalized variables and both the random andstructured aspects of the regionalized variables are expressed by theprobabilistic language of random functions (Journel and Huijbregts1978) every point of the study area defines a random variable and theparameter at this point is interpreted as a realization of that randomvariable A random function is seen as a set of random variables definedat each point in the area and a regionalized variable is a realization of therandom function
Figure 2 Tectono-stratigraphic column section of the western Taurus region
Geostatical Stimulation in Turkey 371
Downloaded By [TUumlBTAK EKUAL] At 0945 25 November 2008
ORDER REPRINTS
In geostatistics the spatial variability of a regionalized variable ischaracterized by the variogram function 2(h) (Journel and Huijbregts1978)
2ethhTHORN frac14 Var ZethxTHORN Zethxthorn hTHORNfrac12
In application
2ethhTHORN frac141
NethhTHORN
XNethhTHORN
ifrac141
zethxiTHORN zethxithornhTHORN 2
whereh the separation vector
(h) the semi-variogramZ(x) a random variable defined at the point x andz(x) an outcome of Z(x)
In most data sets the data values along a certain direction aremore coherent than along the others The direction with best continuityrepresents the maximum correlation direction of the data set and theminimum correlation direction is perpendicular to the maximum correla-tion direction (Isaaks and Srivastava 1989) The ratio between maximumand minimum correlation lengths is known as the anisotropy The similaraxis notation as in Dowd (1985) and Sarac (1998) was used in the study
Figure 3 Histogram of TOC values (View this art in color at wwwdekkercom)
372 Sarac et al
Downloaded By [TUumlBTAK EKUAL] At 0945 25 November 2008
ORDER REPRINTS
The experimental variograms were calculated in the four main directionsand no severe anisotrophy was found Therefore only the omnidirectionalvariogram was retained and modelled The vertical variogram andomnidirectional variogram are shown in Fig 4(a) and (b) respectively
The following simple spherical type variogram model has beenadapted
ethhTHORN frac14 002thorn 0263h
2a
h
2a3
h etha frac14 650 mTHORN
ethhTHORN frac14 028 h gt etha frac14 650 mTHORN
ethhTHORN frac14 0 h frac14 etha frac14 650 mTHORN
The model variogram fitted to the experimental variogram can beseen in Fig 4(b) The model parameters were checked by the use of theback-estimation technique where the data values were removed from thedata set in turn and the estimation was made using the remaining dataand the variogram model This was repeated removing each data valuetogether with all data within a specified ellipsoid of the data value Modelvalidation results verified the chosen model
CONDITIONAL SIMULATION OF THE TOC VALUES
The goal of hydrocarbon reservoir characterization is to provide anumerical model of reservoir attributes (porosity permeability TOCvalues saturations etc) The reservoir model is fine if it providesresponse functions similar to those which would be provided by a perfectmodel based on an exhaustive drilling of hydrocarbon reservoir
Geostatistical simulation is a powerful tool for generating stochasticmodels of hydrocarbon reservoirs The purpose of simulation is togenerate functions or sets of values of a variable of reservior that areconsistent with the available information
Simulation of random fields can be classified into unconditional andconditional methods The simulation techniques commonly used inspatial random field models are
1 Non-conditional Simulation
The turning bands method (Matheron 1973)
The spectral method (Mejia and Rodriguez-Iturbe 1974)
The LUmdashlower uppermdashdecomposition methodthe ring decom-position method (Davis 1987 Sarac and Dowd 1994)
The neural network method (Dowd and Sarac 1994)
Geostatical Stimulation in Turkey 373
Downloaded By [TUumlBTAK EKUAL] At 0945 25 November 2008
ORDER REPRINTS
Figure 4 (a) Vertical (down-dip) variogram (b) Omnidirectional variogram and
model variogram
374 Sarac et al
Downloaded By [TUumlBTAK EKUAL] At 0945 25 November 2008
ORDER REPRINTS
2 Conditional Simulation
The LU decompositionthe ring decomposition
The non-conditional simulation technique combined withkriging technique
Sequential indicator simulation (Alabert 1987)
Techniques combined with heuristic optimization algorithm(Deutsch and Cockerham 1994)
Non-conditional simulation refers to the generation of values witha desired mean and covariance Conditional simulation which refers to asimulation in which the generated values are restricted to be equal tospecified values such as experimental reservoir characterics at theknown locations
In this study the simulated annealing technique is used for con-ditional simulation The main purpose of simulated annealing is toperturb continuously an original image until it matches some prespecifiedcharacteristics written into an objective function (average squareddifference between the experimental and the model variogram) Aperturbation is accepted if the objective function is lowered The successof the method depends on a slow cooling of the realization controlled bya temperature function which decreases with time The simulation iscomplete when the realization is frozen ie when further perturbationsdo not lower the objective function (Deutsch and Journel 1998)
0 frac14Xh
ethhTHORN ethhTHORNfrac12 2
ethhTHORN2
The conditional simulation of TOC values was done a total of 120(xmdasheasting) 150 ( ymdashnorting) 80 (zmdashvertical direction) points Thegrid spacing in x and y directions is 1000m and in z direction is 100mThe full set of 440 data values were used for conditioning Thus a total of1440000 grid nodes were conditionally simulated A set of 1440000obtained conditional simulation of TOC values which conform to thefollowing
(a) At all sampled locations (440 locations) they coincide with thedata values
(b) They have the same distribution as the data values (mean of027 variance of 021 and the same histogram characteristics)
(c) They have the same spatial dispersion ie same variogram asthe data values
Geostatical Stimulation in Turkey 375
Downloaded By [TUumlBTAK EKUAL] At 0945 25 November 2008
ORDER REPRINTS
Figure 5 Block diagrams and image maps of simulated TOC values for
levels (a) thorn1000m (b) 1000m (c) 3000m (View this art in color at www
dekkercom)
376 Sarac et al
Downloaded By [TUumlBTAK EKUAL] At 0945 25 November 2008
ORDER REPRINTS
Thirty-five different simulations were produced using the same param-etres and the best senario which means to be compatible of the existancepetroleum production areas and covers the most wide area was acceptedfor this study Figure 5(andashc) shows the simulated TOC values forthe vertical directions of thorn1000m (a) 1000m (b) and 3000m (c)respectively
RESULTS AND CONCLUSIONS
A conditional simulation study is first used to evaluate the TOCvalues obtained from 7 wells in the western part of Turkey The simulatedannealing technique is applied according to Deutsch and Journel (1998)
The present study indicates that three-dimensional variograms of thearea can be modeled by a spherical model The models were then used tosimulate the total organic carbon values of 120m 150m 80m blocksA number of different simulations were applied and the best scenariowas accepted The simulation results of the total organic carbon valuesare shown in Fig 5 It is clearly seen from the figure that the TOCvalues are increasing with increasing depth
Although active source rocks has found on the coastal area it isnoticed that the actual petroleum leakages are far from coastal areaThis means that migration route is toward northern part of the studyarea so exploration studies of hydrocarbon reservoirs should carry onthe carbonates which are overlied by the Antalya Nappes in the middleand northern part of the western Taurus region
REFERENCES
Alabert F (1987) Stochastic Imaging of Spatial Distributions UsingHard and Soft Information MSc thesis Stanford University253 pp
Blumenthal M M (1951) Recherches geologiques dans le Taurusaccidental dans lrsquoarriere pays drsquoAlanya Publication 5-D MineralResearch and Exploration of Turkey Ankara 1ndash134
Davis M (1987) Production of conditional simulations via the LUtriangular decomposition of the covariance matrix MathematicalGeology 19(2)91ndash98
Demirel I H Gunay Y (2000) Tectonic and karstic effects on thewestern Taurus region southwestern Turkey relations to presenttemperature gradients and total organic carbon content EnergySources 22(5)431ndash442
Geostatical Stimulation in Turkey 377
Downloaded By [TUumlBTAK EKUAL] At 0945 25 November 2008
ORDER REPRINTS
Deutsch C V Cockerham P W (1994) Practical considerations in theapplication of simulated annealing to stochastic simulationMathematical Geology 26(1)67ndash82
Deutsch C V Journel A G (1998) GSLIB Geostatistical SoftwareLibrary and Userrsquos Guide 2nd Ed Applied Geostatistics SeriesNew York Oxford University Press
Dowd P A Sarac C (1994) A neural network approach to geostatis-tical simulation Mathematical Geology 26(4)491ndash503
Dowd P A (1985) Algorithms for three-dimensional interpolationbetween planar slices In Earnshaw R A Ed FundamentalAlgorithms for Computer Graphics Vol F17 BerlinSpringer-Verlag 531ndash554
Gunay Y Bolukbasi S (1980) Finike-Kas-Korkuteli arasinda kalanBeydaglarirsquonin jeolojisi ve petrol olanaklari Report 1450 TPAOAnkara (in Turkish)
Guvenc T Demirel I H Meshur M Gul M A Tekinli U K(1994) The Paleogeography of Anatolia During the Permian andTriassic Vol 11 (A-B) New Series ESRI Occasional Publication11ndash40
Isaaks E H Srivastava R M (1989) An Introduction to AppliedGeostatistics Oxford Oxford University Press
Journel A G Huijbregts Ch J (1978) Mining Geostatistics LondonAcademic Press
Lefevre R (1967) Un nouvel element dans la geologie du Taurus Lycienles nappes drsquoAntalya (Turquie) Comptes Rendus de lrsquoAcademie desSciences 7(D)1365ndash1368
Marcoux J (1979) Antalya Naplar|n|n genel yap|s| ve Tetis guneykenar| paleocografyas|ndaki yeri Turkiye Jeoloji Kurumu Bulteni221ndash5 (in Turkish)
Matheron G (1973) The intrinsic random functions and their applica-tions Adv Appl Prob 5439ndash468
Mejia J M Rodriguez-Iturbe I (1974) On the synthesis of random fieldsampling from the spectrum an application to the generation ofhydrologic spatial processes Water Resources Research10(4)705ndash711
Monod O Marcoux J Poisson A Dumont J F (1974)Le domaine drsquoAntalya temoin de la fracturation de laplatforme Africaine au cours du Trias Bull Soc Geol France16116ndash127
Ozgul N Arpat E (1973) Structural units of the Taurus orogenic beltand their continuation in neighboring regions Geological SocietyBulletin of Greece 10(1)155ndash164
378 Sarac et al
Downloaded By [TUumlBTAK EKUAL] At 0945 25 November 2008
ORDER REPRINTS
Sarac C (1998) Geology and ore reserve estimation at Sivrihisar sepio-lite mine (Eskisehir Turkey) Transactions of the Institution ofMining and Metallurgy 107A6ndashA12
Sarac C Dowd P A (1994) Conditional simulation by ring decom-position of the covariance matrix Sciences de la Terre SerieInformatique Geologique 321ndash14
Senel M Serdaroglu M Kengil R Univerdi M Gozler M Z(1983) Teke Toroslar| guneydogusunun jeolojisi MTA Dergisi9513ndash24 (in Turkish)
Y|lmaz P O Maxwell J C Meuhlberger W R (1981) Antalya kom-pleksinin yap|sal evrimi ve Dogu Akdenizrsquodeki yeri YerbilimleriDergisi 7119ndash127 (in Turkish)
Received August 16 2002Accepted October 15 2002
Geostatical Stimulation in Turkey 379
Downloaded By [TUumlBTAK EKUAL] At 0945 25 November 2008
Request PermissionOrder Reprints
Reprints of this article can also be ordered at
httpwwwdekkercomservletproductDOI101081LFT120024394
Request Permission or Order Reprints Instantly
Interested in copying and sharing this article In most cases US Copyright Law requires that you get permission from the articlersquos rightsholder before using copyrighted content
All information and materials found in this article including but not limited to text trademarks patents logos graphics and images (the Materials) are the copyrighted works and other forms of intellectual property of Marcel Dekker Inc or its licensors All rights not expressly granted are reserved
Get permission to lawfully reproduce and distribute the Materials or order reprints quickly and painlessly Simply click on the Request Permission Order Reprints link below and follow the instructions Visit the US Copyright Office for information on Fair Use limitations of US copyright law Please refer to The Association of American Publishersrsquo (AAP) website for guidelines on Fair Use in the Classroom
The Materials are for your personal use only and cannot be reformatted reposted resold or distributed by electronic means or otherwise without permission from Marcel Dekker Inc Marcel Dekker Inc grants you the limited right to display the Materials only on your personal computer or personal wireless device and to copy and download single copies of such Materials provided that any copyright trademark or other notice appearing on such Materials is also retained by displayed copied or downloaded as part of the Materials and is not removed or obscured and provided you do not edit modify alter or enhance the Materials Please refer to our Website User Agreement for more details
Downloaded By [TUumlBTAK EKUAL] At 0945 25 November 2008
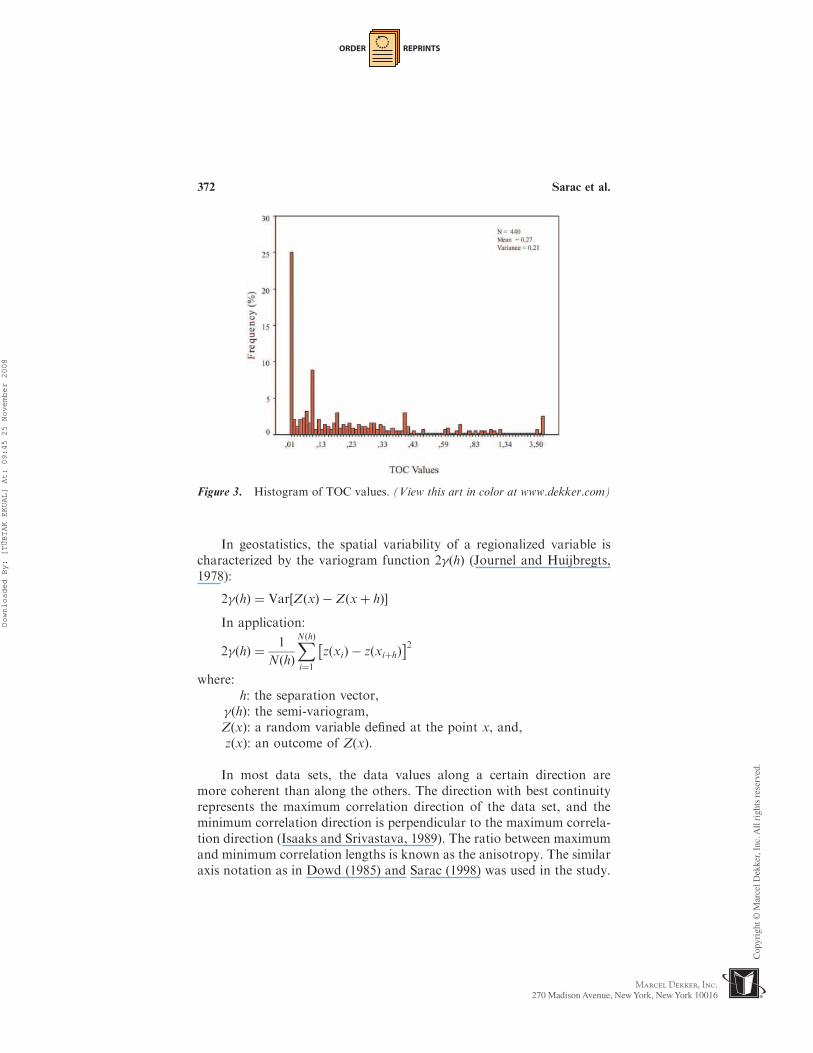
ORDER REPRINTS
Sarac C (1998) Geology and ore reserve estimation at Sivrihisar sepio-lite mine (Eskisehir Turkey) Transactions of the Institution ofMining and Metallurgy 107A6ndashA12
Sarac C Dowd P A (1994) Conditional simulation by ring decom-position of the covariance matrix Sciences de la Terre SerieInformatique Geologique 321ndash14
Senel M Serdaroglu M Kengil R Univerdi M Gozler M Z(1983) Teke Toroslar| guneydogusunun jeolojisi MTA Dergisi9513ndash24 (in Turkish)
Y|lmaz P O Maxwell J C Meuhlberger W R (1981) Antalya kom-pleksinin yap|sal evrimi ve Dogu Akdenizrsquodeki yeri YerbilimleriDergisi 7119ndash127 (in Turkish)
Received August 16 2002Accepted October 15 2002
Geostatical Stimulation in Turkey 379
Downloaded By [TUumlBTAK EKUAL] At 0945 25 November 2008
Request PermissionOrder Reprints
Reprints of this article can also be ordered at
httpwwwdekkercomservletproductDOI101081LFT120024394
Request Permission or Order Reprints Instantly
Interested in copying and sharing this article In most cases US Copyright Law requires that you get permission from the articlersquos rightsholder before using copyrighted content
All information and materials found in this article including but not limited to text trademarks patents logos graphics and images (the Materials) are the copyrighted works and other forms of intellectual property of Marcel Dekker Inc or its licensors All rights not expressly granted are reserved
Get permission to lawfully reproduce and distribute the Materials or order reprints quickly and painlessly Simply click on the Request Permission Order Reprints link below and follow the instructions Visit the US Copyright Office for information on Fair Use limitations of US copyright law Please refer to The Association of American Publishersrsquo (AAP) website for guidelines on Fair Use in the Classroom
The Materials are for your personal use only and cannot be reformatted reposted resold or distributed by electronic means or otherwise without permission from Marcel Dekker Inc Marcel Dekker Inc grants you the limited right to display the Materials only on your personal computer or personal wireless device and to copy and download single copies of such Materials provided that any copyright trademark or other notice appearing on such Materials is also retained by displayed copied or downloaded as part of the Materials and is not removed or obscured and provided you do not edit modify alter or enhance the Materials Please refer to our Website User Agreement for more details
Downloaded By [TUumlBTAK EKUAL] At 0945 25 November 2008