Geographica 54(1) 6645_celek.indd - Nakladatelství Karolinum
114
A C T A U N I V E R S I T A T I S C A R O L I N A E AUC GEOGRAPHICA 54 1/2019 CHARLES UNIVERSITY • KAROLINUM PRESS
-
Upload
khangminh22 -
Category
Documents
-
view
3 -
download
0
Transcript of Geographica 54(1) 6645_celek.indd - Nakladatelství Karolinum

A C T A U N I V E R S I T A T I S C A R O L I N A E
AUC G EO G R A PH I C A 54 1/2019
C H A R L E S U N I V E R S I T Y • K A R O L I N U M P R E S S

AUC Geographica is licensed under a Creative Commons Attribution License (http://creativecommons.org/licenses/by/4.0), which permits unrestricted use, distribution, and reproduction in any medium, provided the original author and source are credited.
© Charles University, 2019ISSN 0300-5402 (Print)ISSN 2336-1980 (Online)

Original Article 3
On the bottle: situating place-based discourses in global production networks – a visual and textual analysis of craft beer labelsJames E. Baker
University of Nebraska – Lincoln, Department of Geography, USA* Corresponding author: [email protected]
ABSTRACTPlace remains a critical concept within globalization processes, often communicated via packaging, design, and branding. This article uses grounded theory methodology to develop a theory of Place-Based Discourses (PBDs) based on a dataset of beer labels col-lected, coded, memoed and analyzed between 2011–2019. I argue that the beer label incorporates all three elements and presents a primary site for studying value addition, providing a ready space for producers to introduce national motifs, such as flags and tartans in the case of Scotch Ales, or depictions of local working landscapes to connote ecological, social, and economic connections to place. Drawing on extant literature on conceptualizations of place within the Global Production Networks perspective (GPNs), this paper contributes to debates about food and drink branding and globalization by generating new ways of examining the sites and processes of representation of place within cultural-material hybrids (such as beer labels) imbricated through globalization mechanisms. I interpret three constituent themes which emerged during the theorization of PBDs – historical imagination and local identity, thin place and thick networks, and performative globalizations – and I argue that this approach provides an impor-tant contribution to the geographies of globalization, linking cultural analysis of branding and place to the GPN tradition. Future studies can apply this knowledge to move towards an understanding of other place-based sites and processes within GPNs, with specific research attention directed towards how PBDs can “reveal and rebalance” power structures vis-à-vis the place dimensions of globalization.
KEYWORDSbeer; grounded theory; global production networks; localism; globalization
Received: 25 May 2018Accepted: 7 March 2019Published online: 4 April 2019
Baker, J. E. (2019): On the bottle: situating place-based discourses in global production networks – a visual and textual analysis of craft beer labels. AUC Geographica 54(1), 3–14https://doi.org/10.14712/23361980.2019.1
© 2019 The Author. This is an open-access article distributed under the terms of the Creative Commons Attribution License (http://creativecommons.org/licenses/by/4.0).
4 James E. Baker
1. Introduction
This paper explores conceptions of place within Glob-al Production Networks (GPNs), seeking to contribute to debates about food and drink branding and globali-zation by generating new conceptualizations of place within the contemporary globalizing economy of beer. Place remains a critical concept within globali-zation processes, often communicated via packaging, design, and branding. The beer label incorporates all three elements of packaging, design, and branding, presenting a primary site for value addition, provid-ing a ready space for producers to introduce national motifs, such as flags and tartans in the case of Scotch Ales, or depictions of local working landscapes to con-note ecological, social, and economic connections to place.
Labeling and design are an integral part of the presentation of localized knowledge at the regional, national, and global scales of innovation within the brewing industry (Pulec 2016; Dicken 2015; Bathelt, Malmberg, Maskell 2004; Gertler 2003). Previous research on craft beer has seen a sustained focus on understanding the processes of (neo)localism, branding, and identity on the development of sens-es of place and place-making within craft brewing in predominantly Anglophone spaces (i.e. United States, Canada, Australia, and New Zealand) (Argent 2017; Murray, Overton 2016; Fletchall 2016; Elzinga, Trem-blay, Tremblay 2015; Schnell, Reese 2014; McLaugh-lin, Reid, Moore 2014; Reid, McLaughlin, Moore 2014; Eberts 2014; Flack 1997). Other studies have consid-ered the economics of craft beer from a comparative global, international, or regionally-scaled perspec-tive, assessing spatial patterns of consumption and their impacts on foreign direct investment and public health policy, for example (Garavaglia, Swinnen 2018; Jernigan, Babor 2015; McCaig 2010; Jernigan 2009; Grigg 2004). Fewer studies have approached the organization of regional and national brewing indus-tries from a GPN perspective (Pulec 2016; The Barth-Haas Group 2012; Smith 2012; Swinnen, Van Herck 2010). A third, adjacent body of literature focuses on local, material, and discursive processes within the organization of the global economy, promoting the integration of local knowledge creation and brand-ing practices into GPNs (Floysand, Jakobsen, Bjarnar 2012; Marquis, Battilana 2009; Bathelt, Malmberg, and Maskell 2004; Aaker 1996). Local knowledge and a sense of place plays an important role in the sociocultural environment and identity of localities, nations, and regions in which global production net-works are embedded.
This article directs research focus to the beer label as a site where local knowledge, often in the form of visual and textual representations of place, becomes materially ‘attached’ to the organizational and geo-graphical territory of a GPN (Dicken 2015). Beer labels are also sites where consumers imbue place
with economic and cultural value, linking upstream processes (such as supplying and brewing) to down-stream processes (such as wholesaling, distribution, and consumption) within Global Value Chains (GVCs) (Pulec 2016; Gereffi et al. 2005; Gereffi 1994). GPNs of beer globalize via joint ventures between multi-national firms in local developmental contexts, often importing key elements (such as brewmasters and manufacturing technology) rather than embedding with local subcontractors. Control over the marketing of brands and the creation of brand identity remains a distinguishing feature of the GPN, as brand owners choose to embed value in the development of a loy-al, readily identifying consumer base (Dicken 2015; Jernigan 2009; Aaker 1996). However, the emer-gence of fictive geographies of brewing where no tacit knowledge of the industry previously existed, concurrent with the fierce loyalty of (neo)local craft brewers speak to a rapidly evolving spatiality of craft brewing in previously underdeveloped markets, such as the Middle East and Eastern Europe, and devel-oped markets alike (Argent 2017; Murray, Overton 2016; Dicken 2015; Eberts 2014). Coupled with what McLaughlin, Reid, and Moore (2014) term “the ubiq-uity of good taste”, recent shifts in cultural, economic, and environmental geographies of consumption, driv-en by globalization and its attendant lifestyle chang-es, pose formidable challenge to the prevalent GPN perspective. Thus, further research attention must be directed at how representations of place alloy with value-addition as mechanisms of globalization.
To thoroughly understand the processes by which representations of place – understood as textual and visual indicators of local materials, traditions, land-scapes, (sub)national iconographies, and histories depicted on the container label itself – becomes an integral part of the global systems of production, dis-tribution, and consumption which constitute GPNs of beer, key factors and relationalities must be sys-tematically observed, coded, and analyzed. By using qualitative interpretive approaches to examine the visual and textual processes by which place becomes situated within GPNs of beer, researchers can bet-ter analyze the role of Place-Based Discourses within multi-scalar, multi-territorial power relationships by which GPNs produce geographical outcomes (Coe et al. 2008: 271). Within the GPN approach, theoreti-cal explanations for how culturally-bound notions of place imbricate with value-addition and spatial embeddedness to create Place-Based Discourses could provide a useful framework for rethinking the rules of meaning and relational power within a set of sup-plier-producer-customer relations (Bathelt, Taylor 2002; Clegg 1989; Latour 1986). The purpose of this study was to understand this process among GPNs of beer by generating an empirically-grounded theoret-ical framework which introduces a new theorization to the GPN perspective, the Place-Based Discourse (PBDs), and explains how this approach can be used

Place-based discourses in global production networks 5
to explain points of integration where sociocultural sites and processes such as place, value-adding, and GPNs entangle.
Four main research questions are addressed in this article: i) What is the Place-Based Discourse (PBD)? ii) What are the processes (themes, situations) in which beer labels, as material sites of PBDs circulat-ing within GPNs, are imbricated in globalization? iii) What qualitative-interpretive methods can be used to unpack the content of these packaging-based PBDs? iv) How can PBDs be used to examine other sites and processes within the global production network of beer?
This article is broken down into three sections. The first section presents a review of literature pertain-ing to the organization of GPNs and the geographies of beer. The second section introduces the grounded theory approach, sampling methods, data collection, and data analysis, offering a general definition for the PBD as the central phenomenon of study in this arti-cle. It also introduces the dataset, emergent codes and themes, and offers a justification of selected findings and the strategies used to thoroughly interpret the selections and illustrate how PBDs are constituted. The last part considers the practical implications of PBDs as well as the limitations of this study, and con-cludes by highlighting future areas of investigation.
2. Literature review
My approach considers the GPN perspective pro-posed by Henderson et al. (2002), and subsequently developed into a ‘school’ within economic geography (Smith 2014; Glassman 2011; Arnold, Pickles 2011; Coe et al. 2008, 2004). This approach, different from the Global Commodity Chains (GCC) theorized by Ger-effi (2001; 1995; 1994) moves beyond the “vertical sequence” leading from production to consumption and maintenance of goods and services, and high-lights the networked relationships between firms and states which “binds” these actors into larger econom-ic and industrial organizational patterns (Sturgeon 2001; in Henderson et al. 2002: 442). The GPN per-spective demands a multi-dimensional, multi-layered approach to understanding economic activity as net-worked actors that can only be understood through relational materiality and connectivity to other enti-ties (Henderson 2002; Dicken 2001; Law 1999; Har-vey 1969). Notably, in his study of the Czech brewing industry’s integration into GPNs in 2013, Pulec (2016; 2014) identifies several important criteria by which he evaluates the integration of Czech brewing compa-nies into GPN structures. He lists ownership by local Czech, Russian, British, or Trans National Corpora-tion (TNC; e.g., the Canadian-American firm Molson Coors’ ownership of the Staropramen brewery and brand); hops and malt suppliers; packaging suppliers (including glass, plastic, and metal packaging); and
distribution to customers via a GPN-connected export base as measures of regional and national scale inte-gration of Czech brewers into GPNs. A multi-dimen-sional, multi-layered perspective presents the GPN as a complex, spatially differentiated network of brew-ers, firms, and the materials which constitute the pro-duction of beer.
While sociocultural factors, such as the textual and visual components enrolled in product brand-ing, packaging, promotion, are absent from this (and other) GPN analyses, they are part of the play of local knowledge and power relations within the process-es and mechanisms of economic globalization. Cru-cially, in defining network discourse, Henderson et al. go on to explain the potential benefits of the GPN perspective. They suggest going beyond charting ver-tical ties between firms and territorial embedded-ness, instead formulating a more analytically flexible, approach to power geometries which between actors and institutions, looking at how institutional and local knowledge are mobilized across producer-con-sumer relations. Gereffi (2005) notes the capacity of a GPN perspective to approach organizational theory through a diversity of perspectives, enabling actors within the model – such as TNCs and developing countries within a world-system – to improve their standing by adopting developmental strategies which mobilize power asymmetries and networks of inno-vation. Place is a critical interface within the GPN net-work, specifically within theorizations of ‘embedding,’ however, the GPN perspective overlooks the central role of place in producing and sustaining a discourse of sense making.
The contextual openness of GPN lends itself to dis-cursively-oriented qualitative analysis, such as the ‘situational’ praxis explained by Morrione as “both an object confronted and an ongoing process subsequent to that confrontation”, connecting different social worlds and lattices of production (Morrione 1985: 161–162). These situations, then, are “construed as meaningful to the actors themselves”, a core episte-mological concern within symbolic interactionist paradigms of sociological analysis (Clarke 2005: 110; Strauss 1993; Clarke 1991). As with the Actor-Net-work Theory approach to GPN espoused by Hender-son et al. (2002) and Law (1999), I take the perspec-tive shared by Adele Clarke that “social worlds are ‘universes of discourse’ centered on collective social meaning-making … hybridized/continuous with the nonhuman” (Clarke 2005: 109; Strauss 1978). Where-as in a GPN network ecology, the focus of the social world is largely production and consumption-driven, in my adaptation, interpretations of network struc-tures and axiologies of land (more or less develop-mental spaces), labor, and capital recenter the social world around diverse cultural sense making (Gould-ing 2017).
This should come as no surprise, as economic geographers of beer, food, and other comestibles have
6 James E. Baker
noted that the construction of place is an increasing-ly important factor in production and valorization (Murray, Overton 2016; Fletchall 2016; Schnell, Reese 2014; Marquis, Battilana 2009). The role of place within the discursive spaces which constitute the social world of the network is too often overlooked by GPN traditionalists. Fletchall quotes Yi-Fu Tuan in the introduction to her article on place-making in Mon-tana’s craft brewing scene: “[w]hat begins as undif-ferentiated space becomes place as we get to know it better and endow it with value” (Fletchall 2016: 539; Tuan 1977). Dicken is correct in stating that GPNs are ‘grounded’ in specific places; I contend that a ground-ed theory approach (Strauss, Corbin 1998) is useful here because of the gap in knowledge regarding the dynamic processes and relationships which create geographical outcomes, by relationalizing the ‘nature’ and power of place to value-adding sites and pro-cesses within GPNs (Coe et al. 2008). This approach enriches the economic geographer’s understanding of place beyond the static definition as a bric-a-brac of firms and owners where “organizational networks connect into geographical networks” (Dicken 2015: 251–253). The role of place deserves more than the ‘parts is parts’ definition assumed by most GPN-fo-cused analysis. Instead, as Flack (1997) asserted, the desire to attach to local places has long driven the microbrewery revolution, and that cultural, sense making work carries on throughout the industry at large, and often via Place-Based Discourses (PBDs).
Finally, this paper is not the first to tackle the idea of selling the local through a connection to place. In their landmark study of microbreweries, place, and iden-tity in the U.S., Schnell and Reese (2014) conceive of imagery as a key to promoting local ties, interpreting how images make explicit the links “between place, identity, and uniqueness” (Schnell and Reese 2014: 169). Visual and textual imagery provide a critical link to unpacking meaning-making and localism in sever-al ways: as mentioned above, social researchers have a robust toolkit at their disposal to theorize via empir-ical analysis and interpretive work by doing grounded theory in contexts specific and relevant to the actors framed by the gaze of research. Moreover, visual and textual images provide a durable connection to the land, labor, and capital aspect of GPNs which manifest in ‘local’ geographies of food and drink through con-cepts such as ‘terroir.’ Schnell and Reese observe that the place attachment evoked by brewing practices, coupled with narratives of place constructed through
1 Examples of local arts globalized and relocalized include the German Koelsch and Altbier styles, which maintain deep sociological and technological associations to the cities of Cologne and Duesseldorf, respectively.
2 Elzinga et al. (2015: 247) note the rise of contract brewing in their analysis of Jim Koch’s brand, Samuel Adams, which despite an obvious place attachment to the Boston historical-cultural milieux through the Adams name and the Boston Beer Company imprint, initially contracted the facilities of Pittsburgh Brewing Company to brew the Koch’s Boston Lager for additional “capacity at marginal cost”. Koch’s ‘billion dollar’ Boston Lager brand is still brewed in eastern Pennsylvania, a point (perhaps strategically) underplayed by Boston’s beer loving football fans in light of New England’s loss to the Philadelphia Eagles in Super Bowl LII. This example serves to illustrate Murray and Overton’s observation that materiality and place often join relationally on a continuum.
label imagery, marketing and promotional material, provide ample local color to make up for brewcraft’s lack of a characteristic terroir.1 One problem inherent in this conceptualization, however, relates to the pos-sible conflation of ‘sense of place’ with what Murray and Overton term a fictive geography on a “continuum of materiality in [geographical] clusters, moving from the ‘real’ towards the ‘imagined,’” but are innovative and competitive enough on economic and cultural grounds “to maintain the sustainability of any given sector” (Murray and Overton 2016: 187; Fløysand et al. 2012).2 PBDs can be helpful in understanding how ‘thick’ and ‘thin’ approaches to place, existing on a continuum, compete and can be seen as both factors of production and value-addition.
3. Methods
For this study, I took a situational analysis (SA) approach to grounded theory (Clarke et al. 2015; Clarke 2005; Strauss, Corbin 1998). SA is a “method of analysis … especially useful in multi-site or multi-mod-al research that can draw together different sites, or both” (Clarke et al. 2015: 16–17). As a strategy of qual-itative inquiry, SA builds on the traditional grounded theory approach in that it empowers researchers to collect data from the “bottom-up” and “outside-in” when developing propositions which ground empir-ically-based theorization (Clarke et al. 2015: 21). As a postmodern, poststructural extension of ground-ed theory, SA is especially helpful in research which seeks to locate and disentangle power hierarchies, specifically when considering how access to material, nonhuman things – internet connections, cell phones, housing, food, and drink – “instantiate and reproduce” social stratification (Clarke et al. 2015: 21). Such an approach is especially helpful when ‘getting in on the ground floor’ of GPNs; these materialities, their net-works, and their power interrelations condition what is possible within a social situation (Foucault 1975).
Building on the adage that “data are generated, not ‘given,’” I employ an interpretive constructivist methodology within grounded theory-SA (Yanow, Schwartz-Shea 2013: 5; Charmaz 2000). What counts as data in this methodological perspective is theo-ry-dependent, bounded, and iteratively coded around emergent themes which are used to develop a theoret-ical explanation of the phenomenon of place on beer labels within GPNs. This theorization is grounded in
Place-based discourses in global production networks 7
data collected from the material objects themselves, then interpreted based on emergent categories aggre-gated around a common idea (a Place-Based Dis-course, or PBD; Creswell, Poth 2018: 328). Pre-estab-lished sociological theories, per Layder (1998) inform the initial coding, while the systematic progression from codes to categories to theory and the analysis of their interrelation is the hallmark of the development of a grounded theory (Corbin, Strauss 2015; Saldaña 2016: 15).
The dataset was constructed between 2011 and 2019 using opportunistic sampling from retail sites throughout the United States, Canada, United King-dom, France, and Germany, generating visual and textual data from 1,040 beer labels selected based on four main criteria: 1) diversity of brewing styles, 2) (sub)national, regional, or local origins, 3) ownership (including TNC, foreign, national, private, coopera-tive, municipal and state-owned) and 4) label design. Opportunistic sampling allows for the researcher to follow new leads and take advantage of unexpected developments within the situation of inquiry (Cress-well, Poth 2018: 159). Each item within the dataset then received manual theoretical coding for visual and textual elements contained within the beer label. Theoretical codes, developed by Glaser (1978) and Charmaz (2006), emerge through data analysis and present a relational model through which all other codes and categories are related back to the core cat-egory of place (Hernandez 2009). Theoretical codes which I recorded include: human, nonhuman/living, nonhuman/nonliving, ingredient (such as depictions of water, hops, or malts), spatial/temporal claims to tradition, language (English, French, German, etc.), typeface, placename, landscape, mobility, transporta-tion, map/logo, folk motif, national iconography, and local history. I then compiled short narratives in the form of ‘first impressions’ of the ‘big’ and ‘little’ pic-tures of specific visual images and texts from labels within my dataset, systematically deconstructing these narratives through the creation of specifica-tion memos, defined by Clarke (2005: 227–228) as a systematic narrative ‘breaking of frame’ designed to ‘see’ an image in multiple ways. I specifically included Clarke’s topics of framing, featuring, viewpoint, pres-ence/absence, intended/unintended audience, image composition, technical elements, relations with local visual cultures, symbolic references within the image, and injunctions to the viewer. I linked codes and memos, including visual, textual, and tasting narra-tives, into dynamic, richly and thickly described lan-guage-based data to create categories, concepts, and finally, a grounded theory (Clarke 2005: 227; Saldaña 2016).
Following the development of the grounded theo-ry (PBD), I adapt Saldaña’s approach for the purposes of this article, analyzing visual data using “a holistic,
3 Derived from Weedon’s (1987) and Diamond and Quimby’s (1988) interpretation of Foucault’s discourse (1970).
interpretive lens guided by intuitive inquiry and strategic questions”, (re)grounded in local and the-ory-based context, informed in part from the inter-pretive guidelines of visual grounded theory analysis espoused by Mey and Dietrich (2017) and Peez (2006). Samples presented for this article were selected using theory-based sampling strategies, examining visual data within the perspective of the GPN, using a theo-ry of Place-Based Discourses (Cresswell, Poth 2018).
4. Discussion and analysis
I define Place-Based Discourse3 as:The site and process of 1) visual, textual, materi-
al, and sensorial ways of constituting knowledge as 2) a set of relations and practices presented across a social field, 3) representing and embodying a range of modes of subjectivity of the ‘nature,’ meaning, and power of a place, which can 4) ‘attach’ to strategies of domination and resistance through GPN-inherent pro-cesses of value-addition and spatial embedding.
The images in Figures 1–4 are grouped here as representative of a theory of PBD in GPNs of beer. Each example functions on two discursive levels: as a cultural-material text, printed on the bottle, and as a node within a GPN, where they present a social and cultural component of what Dicken (2015: 252) terms the “place dimension”. In the first instance, each example represents both a site and a process, moving forward with Morrione’s (1985) situational praxis. In the second instance, each example is both a product in a Globalized Production Circuit (GPC), a node in the global network which, according to Dicken (2015), creates value through the application of labor, tech-nology, and organizational expertise, tying in tradi-tionally downstream operations such as branding, marketing, logistics, distribution, and so forth. Fur-thermore, as nodes within a GPN, these beers are more than products: they mediate aspects of place which resonate with local producers and consumers, integrating local, regional, and national economic pro-duction with local conceptualizations and discourses of place.
Each of these PBDs demand interpretation of, in Schnell and Reese’s words, “a history that requires familiarity with place” (Schnell, Reese 2014: 179). The first two cases interpreted in this section deal with the roles and tensions of place and history within PBDs, building upon the theme of historical imagination and local identity constructed iteratively from theoretical coding. The third case presents a locally-situated PBD of non-place, selected for narrative interpretation as a representative of the theme of thin place and thick networks. The fourth case interprets the theme of performative globalizations as a PBD. Furthermore, as PBDs within GPNs which must operate within local
8 James E. Baker
legal-institutional parameters, it is important to note the presence and absence of references to military weapons technology within geographically situated histories of (inter)state and (counter) revolutionary violence (Figures 1 and 2). Within the U.S., Bureau of Alcohol Tobacco and Firearms regulations prohibit the branding of alcohol with references to military or weapons technology, a development which would potentially ‘normalize’ the discursive force of some PBDs (Schnell, Reese 2014: 179).4
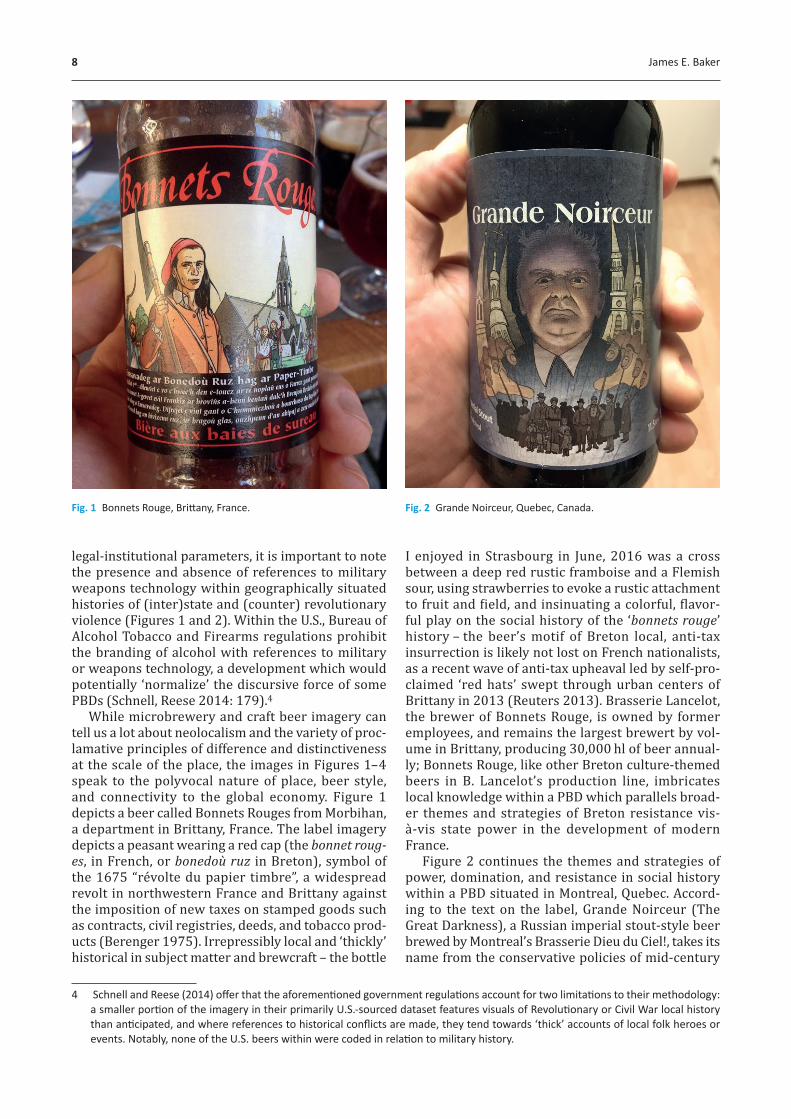
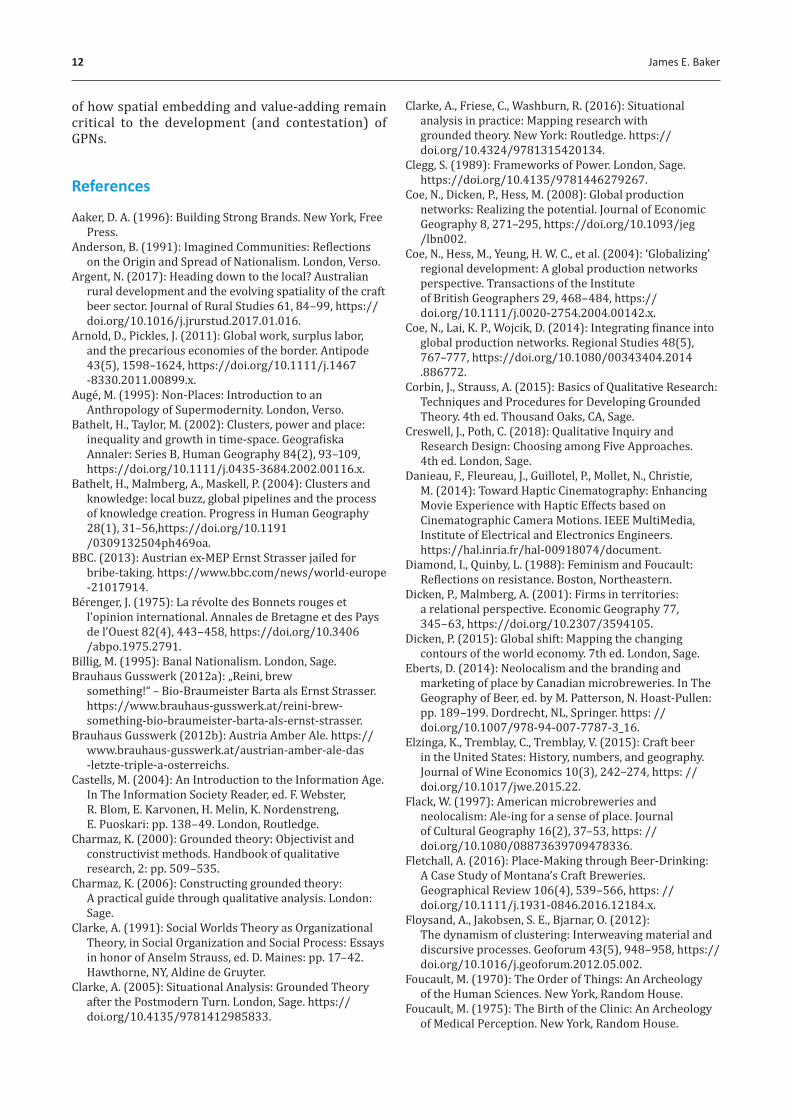
While microbrewery and craft beer imagery can tell us a lot about neolocalism and the variety of proc-lamative principles of difference and distinctiveness at the scale of the place, the images in Figures 1–4 speak to the polyvocal nature of place, beer style, and connectivity to the global economy. Figure 1 depicts a beer called Bonnets Rouges from Morbihan, a department in Brittany, France. The label imagery depicts a peasant wearing a red cap (the bonnet roug-es, in French, or bonedoù ruz in Breton), symbol of the 1675 “révolte du papier timbre”, a widespread revolt in northwestern France and Brittany against the imposition of new taxes on stamped goods such as contracts, civil registries, deeds, and tobacco prod-ucts (Berenger 1975). Irrepressibly local and ‘thickly’ historical in subject matter and brewcraft – the bottle
4 Schnell and Reese (2014) offer that the aforementioned government regulations account for two limitations to their methodology: a smaller portion of the imagery in their primarily U.S.-sourced dataset features visuals of Revolutionary or Civil War local history than anticipated, and where references to historical conflicts are made, they tend towards ‘thick’ accounts of local folk heroes or events. Notably, none of the U.S. beers within were coded in relation to military history.
I enjoyed in Strasbourg in June, 2016 was a cross between a deep red rustic framboise and a Flemish sour, using strawberries to evoke a rustic attachment to fruit and field, and insinuating a colorful, flavor-ful play on the social history of the ‘bonnets rouge’ history – the beer’s motif of Breton local, anti-tax insurrection is likely not lost on French nationalists, as a recent wave of anti-tax upheaval led by self-pro-claimed ‘red hats’ swept through urban centers of Brittany in 2013 (Reuters 2013). Brasserie Lancelot, the brewer of Bonnets Rouge, is owned by former employees, and remains the largest brewert by vol-ume in Brittany, producing 30,000 hl of beer annual-ly; Bonnets Rouge, like other Breton culture-themed beers in B. Lancelot’s production line, imbricates local knowledge within a PBD which parallels broad-er themes and strategies of Breton resistance vis-à-vis state power in the development of modern France.
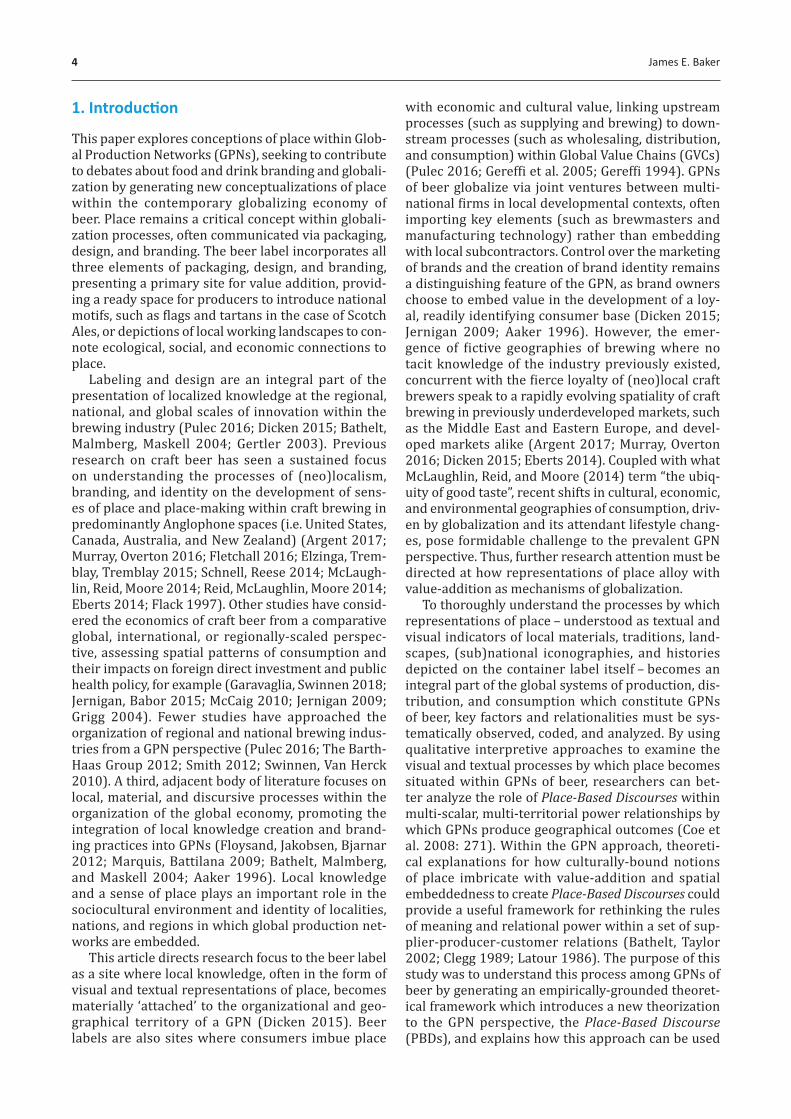
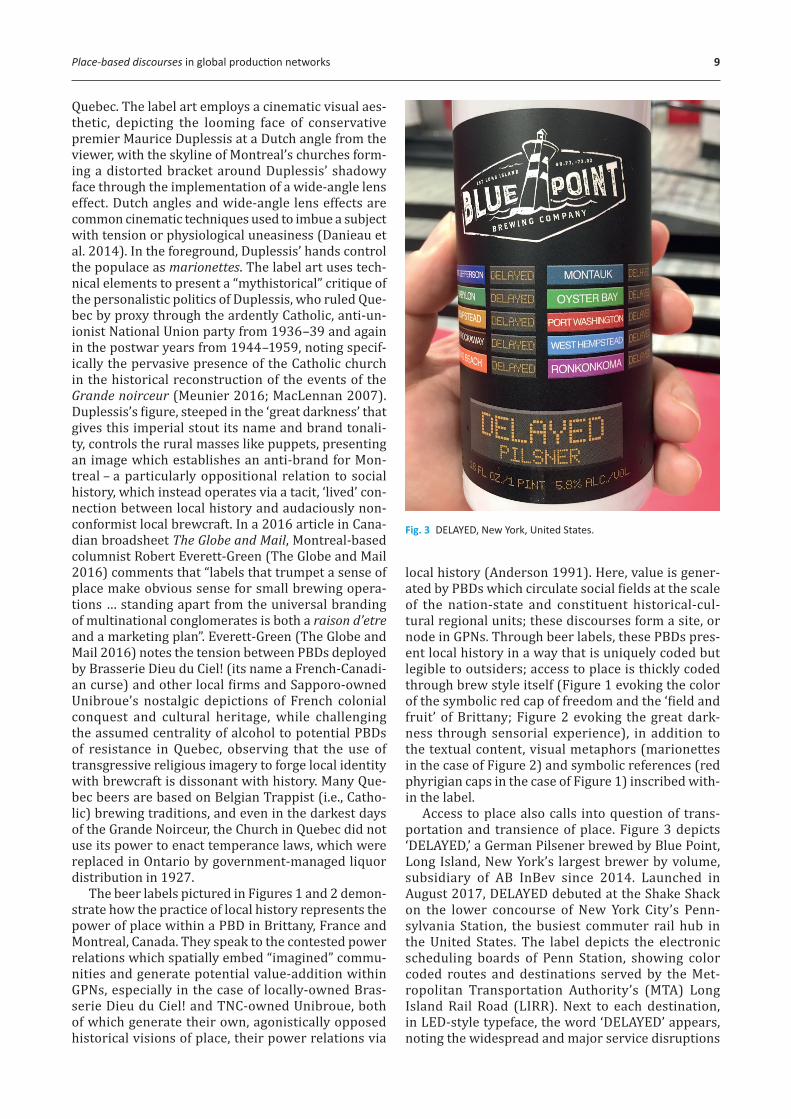
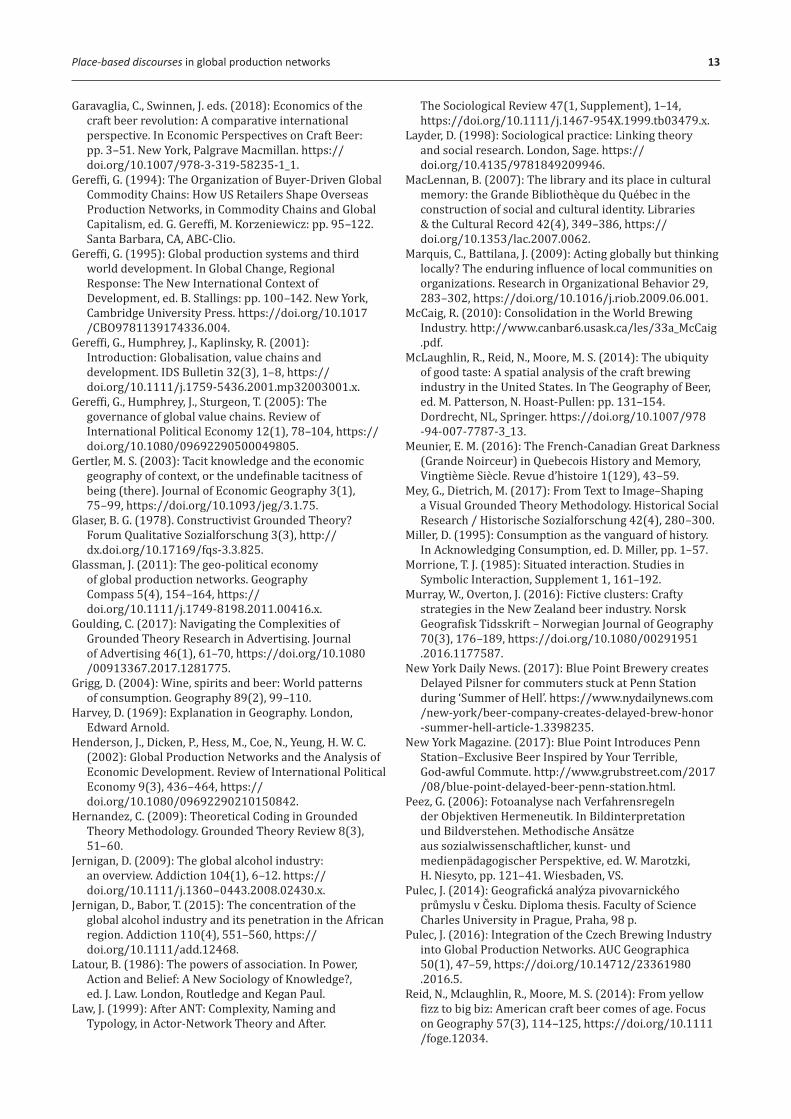
Figure 2 continues the themes and strategies of power, domination, and resistance in social history within a PBD situated in Montreal, Quebec. Accord-ing to the text on the label, Grande Noirceur (The Great Darkness), a Russian imperial stout-style beer brewed by Montreal’s Brasserie Dieu du Ciel!, takes its name from the conservative policies of mid-century
Fig. 1 Bonnets Rouge, Brittany, France. Fig. 2 Grande Noirceur, Quebec, Canada.
Place-based discourses in global production networks 9
Quebec. The label art employs a cinematic visual aes-thetic, depicting the looming face of conservative premier Maurice Duplessis at a Dutch angle from the viewer, with the skyline of Montreal’s churches form-ing a distorted bracket around Duplessis’ shadowy face through the implementation of a wide-angle lens effect. Dutch angles and wide-angle lens effects are common cinematic techniques used to imbue a subject with tension or physiological uneasiness (Danieau et al. 2014). In the foreground, Duplessis’ hands control the populace as marionettes. The label art uses tech-nical elements to present a “mythistorical” critique of the personalistic politics of Duplessis, who ruled Que-bec by proxy through the ardently Catholic, anti-un-ionist National Union party from 1936–39 and again in the postwar years from 1944–1959, noting specif-ically the pervasive presence of the Catholic church in the historical reconstruction of the events of the Grande noirceur (Meunier 2016; MacLennan 2007). Duplessis’s figure, steeped in the ‘great darkness’ that gives this imperial stout its name and brand tonali-ty, controls the rural masses like puppets, presenting an image which establishes an anti-brand for Mon-treal – a particularly oppositional relation to social history, which instead operates via a tacit, ‘lived’ con-nection between local history and audaciously non-conformist local brewcraft. In a 2016 article in Cana-dian broadsheet The Globe and Mail, Montreal-based columnist Robert Everett-Green (The Globe and Mail 2016) comments that “labels that trumpet a sense of place make obvious sense for small brewing opera-tions … standing apart from the universal branding of multinational conglomerates is both a raison d’etre and a marketing plan”. Everett-Green (The Globe and Mail 2016) notes the tension between PBDs deployed by Brasserie Dieu du Ciel! (its name a French-Canadi-an curse) and other local firms and Sapporo-owned Unibroue’s nostalgic depictions of French colonial conquest and cultural heritage, while challenging the assumed centrality of alcohol to potential PBDs of resistance in Quebec, observing that the use of transgressive religious imagery to forge local identity with brewcraft is dissonant with history. Many Que-bec beers are based on Belgian Trappist (i.e., Catho-lic) brewing traditions, and even in the darkest days of the Grande Noirceur, the Church in Quebec did not use its power to enact temperance laws, which were replaced in Ontario by government-managed liquor distribution in 1927.
The beer labels pictured in Figures 1 and 2 demon-strate how the practice of local history represents the power of place within a PBD in Brittany, France and Montreal, Canada. They speak to the contested power relations which spatially embed “imagined” commu-nities and generate potential value-addition within GPNs, especially in the case of locally-owned Bras-serie Dieu du Ciel! and TNC-owned Unibroue, both of which generate their own, agonistically opposed historical visions of place, their power relations via
local history (Anderson 1991). Here, value is gener-ated by PBDs which circulate social fields at the scale of the nation-state and constituent historical-cul-tural regional units; these discourses form a site, or node in GPNs. Through beer labels, these PBDs pres-ent local history in a way that is uniquely coded but legible to outsiders; access to place is thickly coded through brew style itself (Figure 1 evoking the color of the symbolic red cap of freedom and the ‘field and fruit’ of Brittany; Figure 2 evoking the great dark-ness through sensorial experience), in addition to the textual content, visual metaphors (marionettes in the case of Figure 2) and symbolic references (red phyrigian caps in the case of Figure 1) inscribed with-in the label.
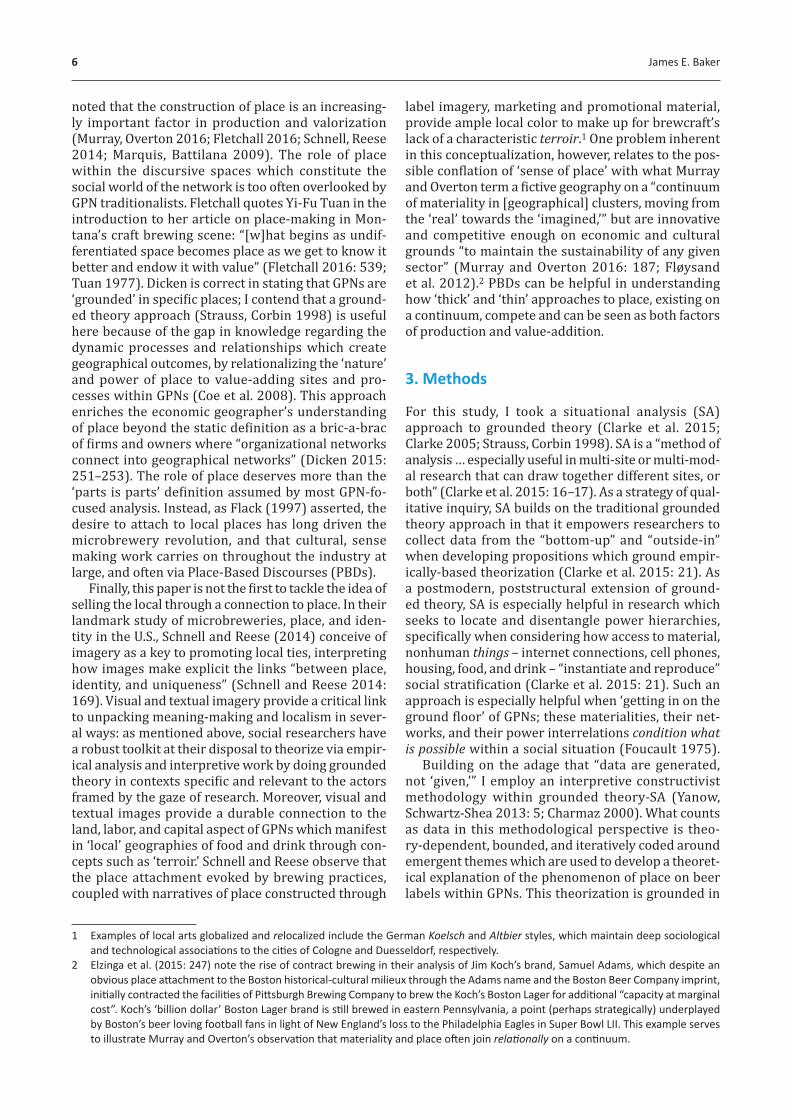
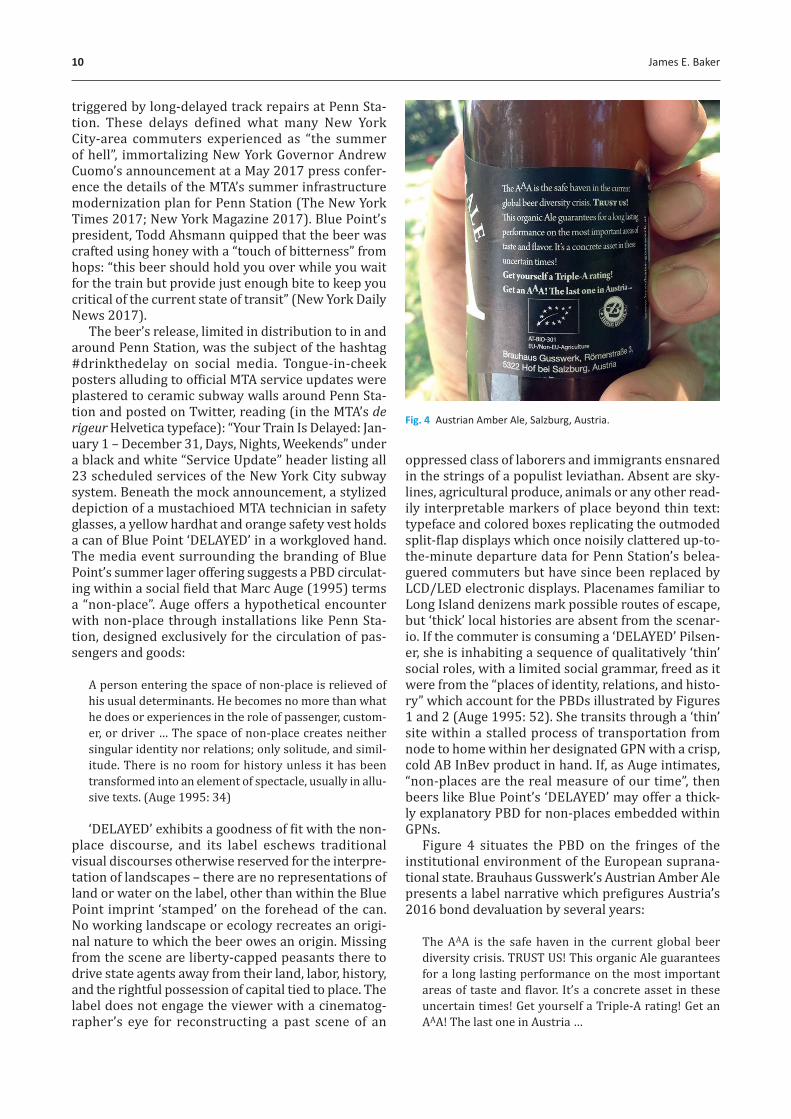
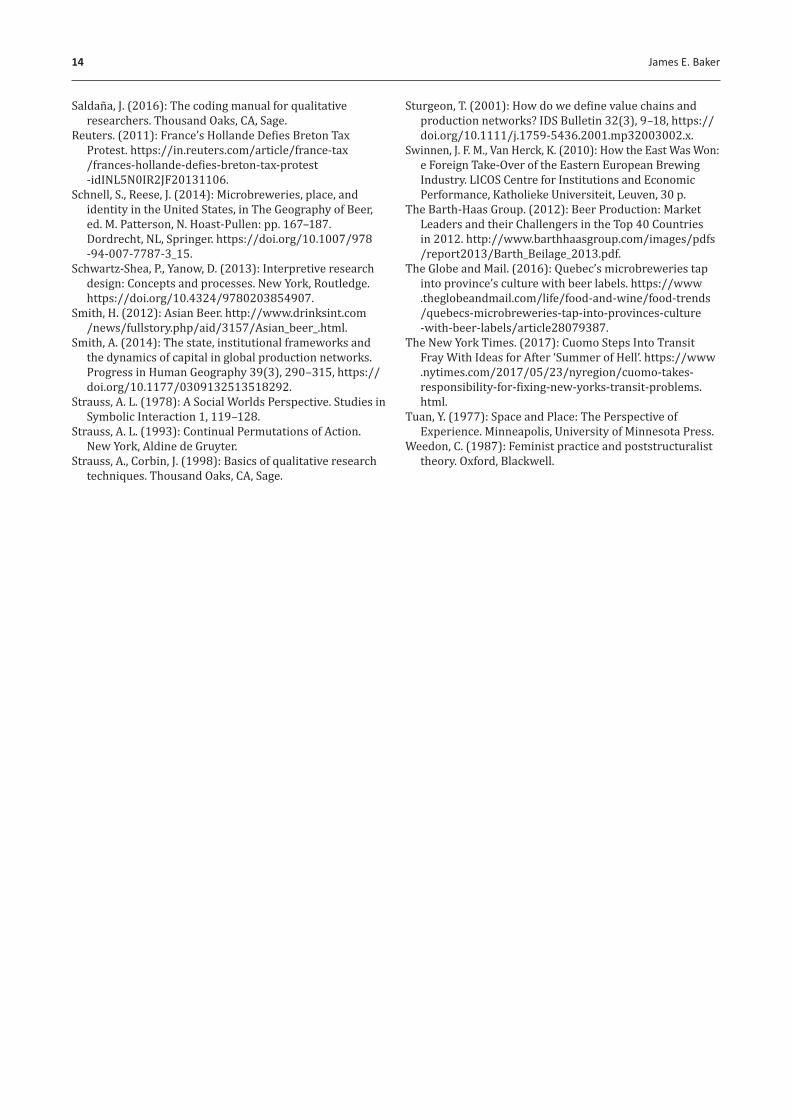
Access to place also calls into question of trans-portation and transience of place. Figure 3 depicts ‘DELAYED,’ a German Pilsener brewed by Blue Point, Long Island, New York’s largest brewer by volume, subsidiary of AB InBev since 2014. Launched in August 2017, DELAYED debuted at the Shake Shack on the lower concourse of New York City’s Penn-sylvania Station, the busiest commuter rail hub in the United States. The label depicts the electronic scheduling boards of Penn Station, showing color coded routes and destinations served by the Met-ropolitan Transportation Authority’s (MTA) Long Island Rail Road (LIRR). Next to each destination, in LED-style typeface, the word ‘DELAYED’ appears, noting the widespread and major service disruptions
Fig. 3 DELAYED, New York, United States.
10 James E. Baker
triggered by long-delayed track repairs at Penn Sta-tion. These delays defined what many New York City-area commuters experienced as “the summer of hell”, immortalizing New York Governor Andrew Cuomo’s announcement at a May 2017 press confer-ence the details of the MTA’s summer infrastructure modernization plan for Penn Station (The New York Times 2017; New York Magazine 2017). Blue Point’s president, Todd Ahsmann quipped that the beer was crafted using honey with a “touch of bitterness” from hops: “this beer should hold you over while you wait for the train but provide just enough bite to keep you critical of the current state of transit” (New York Daily News 2017).
The beer’s release, limited in distribution to in and around Penn Station, was the subject of the hashtag #drinkthedelay on social media. Tongue-in-cheek posters alluding to official MTA service updates were plastered to ceramic subway walls around Penn Sta-tion and posted on Twitter, reading (in the MTA’s de rigeur Helvetica typeface): “Your Train Is Delayed: Jan-uary 1 – December 31, Days, Nights, Weekends” under a black and white “Service Update” header listing all 23 scheduled services of the New York City subway system. Beneath the mock announcement, a stylized depiction of a mustachioed MTA technician in safety glasses, a yellow hardhat and orange safety vest holds a can of Blue Point ‘DELAYED’ in a workgloved hand. The media event surrounding the branding of Blue Point’s summer lager offering suggests a PBD circulat-ing within a social field that Marc Auge (1995) terms a “non-place”. Auge offers a hypothetical encounter with non-place through installations like Penn Sta-tion, designed exclusively for the circulation of pas-sengers and goods:
A person entering the space of non-place is relieved of his usual determinants. He becomes no more than what he does or experiences in the role of passenger, custom-er, or driver … The space of non-place creates neither singular identity nor relations; only solitude, and simil-itude. There is no room for history unless it has been transformed into an element of spectacle, usually in allu-sive texts. (Auge 1995: 34)
‘DELAYED’ exhibits a goodness of fit with the non-place discourse, and its label eschews traditional visual discourses otherwise reserved for the interpre-tation of landscapes – there are no representations of land or water on the label, other than within the Blue Point imprint ‘stamped’ on the forehead of the can. No working landscape or ecology recreates an origi-nal nature to which the beer owes an origin. Missing from the scene are liberty-capped peasants there to drive state agents away from their land, labor, history, and the rightful possession of capital tied to place. The label does not engage the viewer with a cinematog-rapher’s eye for reconstructing a past scene of an
oppressed class of laborers and immigrants ensnared in the strings of a populist leviathan. Absent are sky-lines, agricultural produce, animals or any other read-ily interpretable markers of place beyond thin text: typeface and colored boxes replicating the outmoded split-flap displays which once noisily clattered up-to-the-minute departure data for Penn Station’s belea-guered commuters but have since been replaced by LCD/LED electronic displays. Placenames familiar to Long Island denizens mark possible routes of escape, but ‘thick’ local histories are absent from the scenar-io. If the commuter is consuming a ‘DELAYED’ Pilsen-er, she is inhabiting a sequence of qualitatively ‘thin’ social roles, with a limited social grammar, freed as it were from the “places of identity, relations, and histo-ry” which account for the PBDs illustrated by Figures 1 and 2 (Auge 1995: 52). She transits through a ‘thin’ site within a stalled process of transportation from node to home within her designated GPN with a crisp, cold AB InBev product in hand. If, as Auge intimates, “non-places are the real measure of our time”, then beers like Blue Point’s ‘DELAYED’ may offer a thick-ly explanatory PBD for non-places embedded within GPNs.
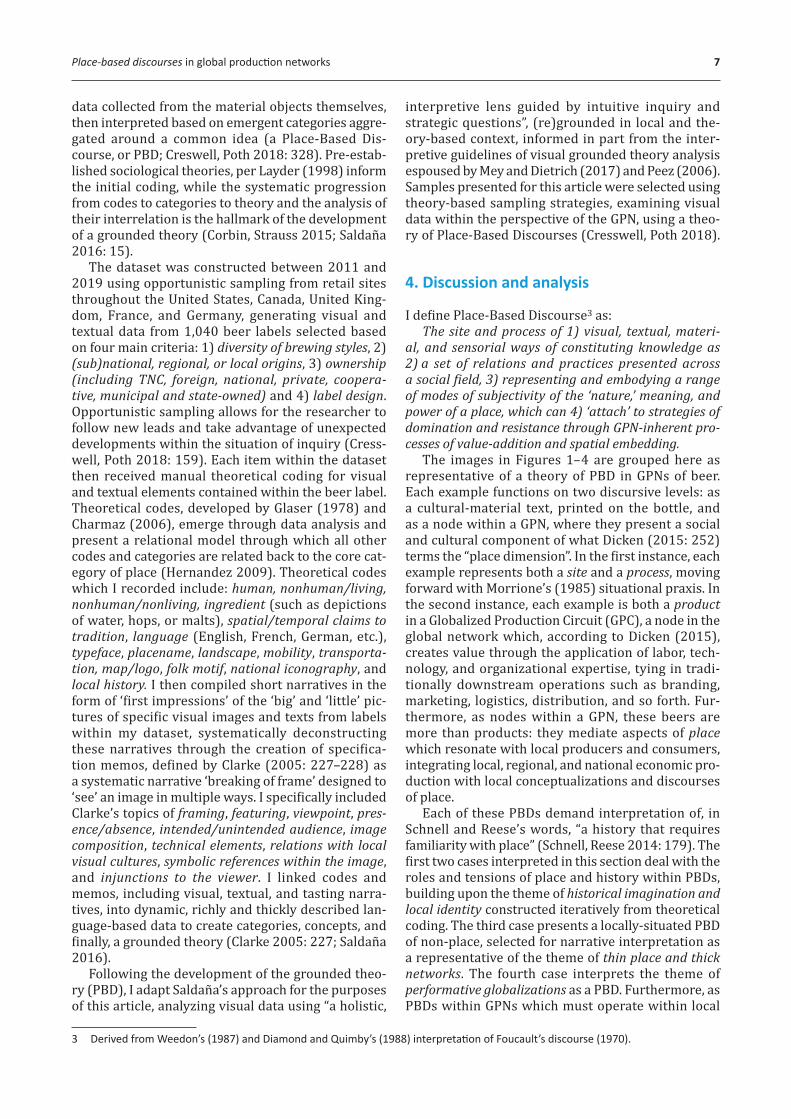
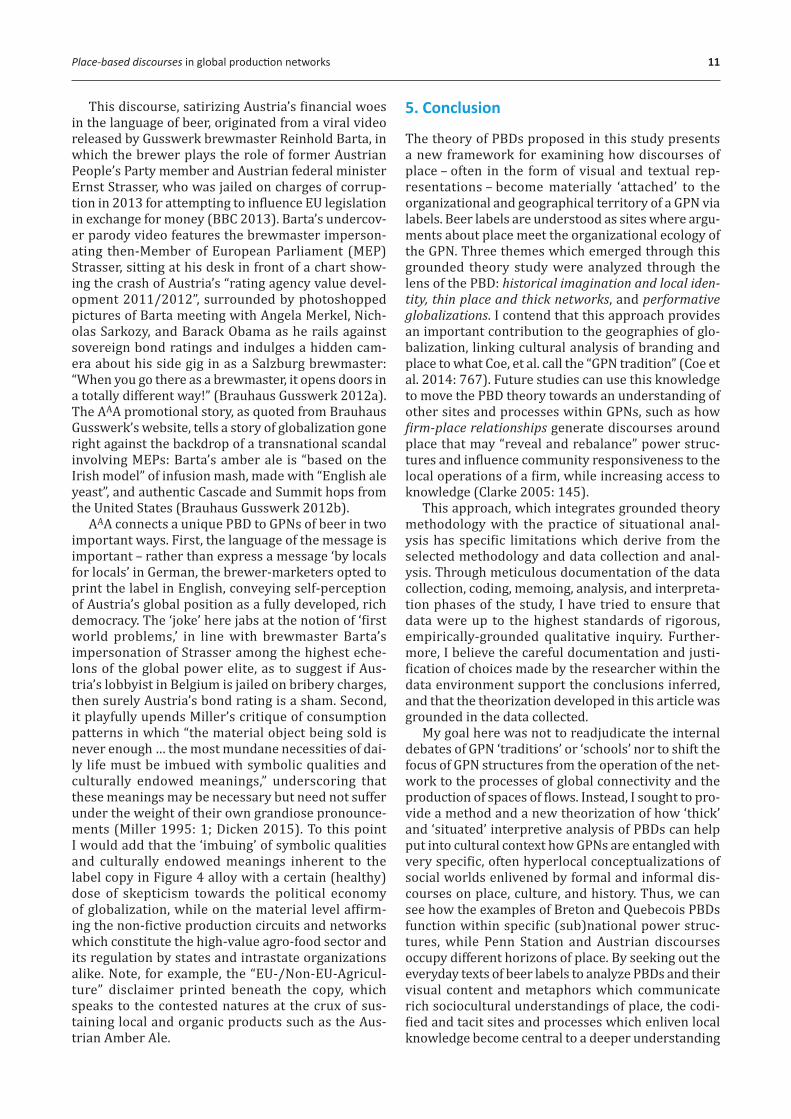
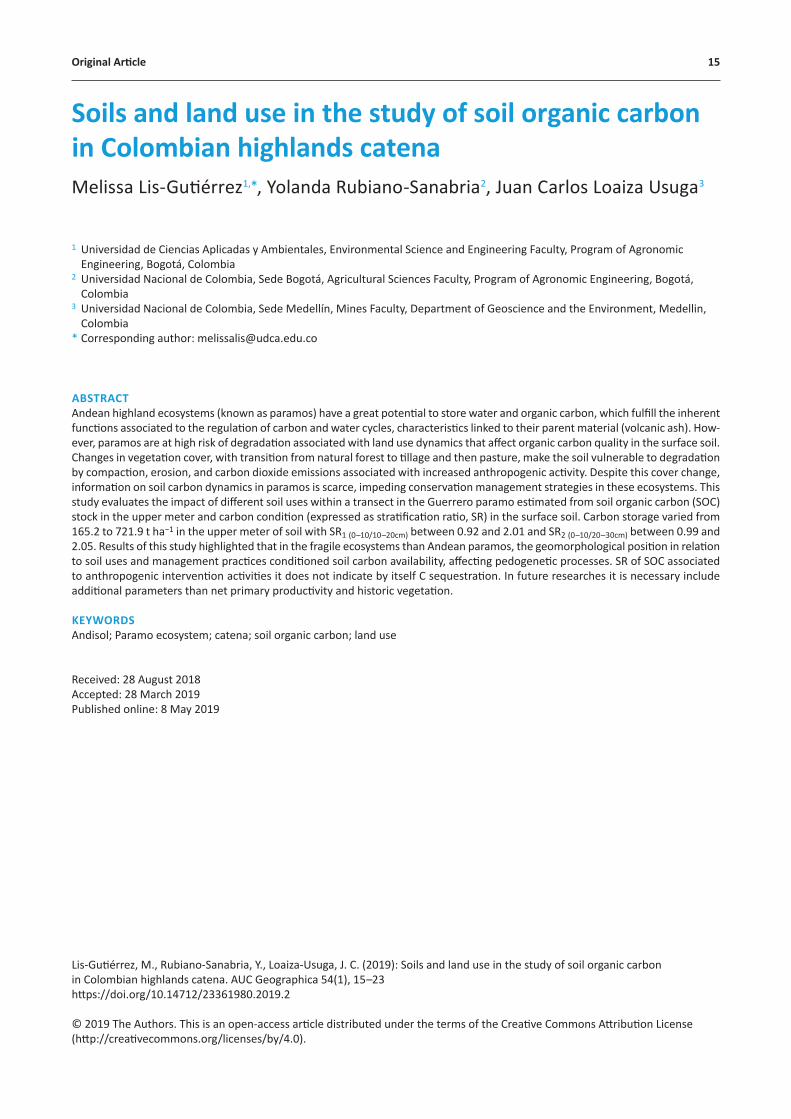
Figure 4 situates the PBD on the fringes of the institutional environment of the European suprana-tional state. Brauhaus Gusswerk’s Austrian Amber Ale presents a label narrative which prefigures Austria’s 2016 bond devaluation by several years:
The AAA is the safe haven in the current global beer diversity crisis. TRUST US! This organic Ale guarantees for a long lasting performance on the most important areas of taste and flavor. It’s a concrete asset in these uncertain times! Get yourself a Triple-A rating! Get an AAA! The last one in Austria …
Fig. 4 Austrian Amber Ale, Salzburg, Austria.
Place-based discourses in global production networks 11
This discourse, satirizing Austria’s financial woes in the language of beer, originated from a viral video released by Gusswerk brewmaster Reinhold Barta, in which the brewer plays the role of former Austrian People’s Party member and Austrian federal minister Ernst Strasser, who was jailed on charges of corrup-tion in 2013 for attempting to influence EU legislation in exchange for money (BBC 2013). Barta’s undercov-er parody video features the brewmaster imperson-ating then-Member of European Parliament (MEP) Strasser, sitting at his desk in front of a chart show-ing the crash of Austria’s “rating agency value devel-opment 2011/2012”, surrounded by photoshopped pictures of Barta meeting with Angela Merkel, Nich-olas Sarkozy, and Barack Obama as he rails against sovereign bond ratings and indulges a hidden cam-era about his side gig in as a Salzburg brewmaster: “When you go there as a brewmaster, it opens doors in a totally different way!” (Brauhaus Gusswerk 2012a).The AAA promotional story, as quoted from Brauhaus Gusswerk’s website, tells a story of globalization gone right against the backdrop of a transnational scandal involving MEPs: Barta’s amber ale is “based on the Irish model” of infusion mash, made with “English ale yeast”, and authentic Cascade and Summit hops from the United States (Brauhaus Gusswerk 2012b).
AAA connects a unique PBD to GPNs of beer in two important ways. First, the language of the message is important – rather than express a message ‘by locals for locals’ in German, the brewer-marketers opted to print the label in English, conveying self-perception of Austria’s global position as a fully developed, rich democracy. The ‘joke’ here jabs at the notion of ‘first world problems,’ in line with brewmaster Barta’s impersonation of Strasser among the highest eche-lons of the global power elite, as to suggest if Aus-tria’s lobbyist in Belgium is jailed on bribery charges, then surely Austria’s bond rating is a sham. Second, it playfully upends Miller’s critique of consumption patterns in which “the material object being sold is never enough … the most mundane necessities of dai-ly life must be imbued with symbolic qualities and culturally endowed meanings,” underscoring that these meanings may be necessary but need not suffer under the weight of their own grandiose pronounce-ments (Miller 1995: 1; Dicken 2015). To this point I would add that the ‘imbuing’ of symbolic qualities and culturally endowed meanings inherent to the label copy in Figure 4 alloy with a certain (healthy) dose of skepticism towards the political economy of globalization, while on the material level affirm-ing the non-fictive production circuits and networks which constitute the high-value agro-food sector and its regulation by states and intrastate organizations alike. Note, for example, the “EU-/Non-EU-Agricul-ture” disclaimer printed beneath the copy, which speaks to the contested natures at the crux of sus-taining local and organic products such as the Aus-trian Amber Ale.
5. Conclusion
The theory of PBDs proposed in this study presents a new framework for examining how discourses of place – often in the form of visual and textual rep-resentations – become materially ‘attached’ to the organizational and geographical territory of a GPN via labels. Beer labels are understood as sites where argu-ments about place meet the organizational ecology of the GPN. Three themes which emerged through this grounded theory study were analyzed through the lens of the PBD: historical imagination and local iden-tity, thin place and thick networks, and performative globalizations. I contend that this approach provides an important contribution to the geographies of glo-balization, linking cultural analysis of branding and place to what Coe, et al. call the “GPN tradition” (Coe et al. 2014: 767). Future studies can use this knowledge to move the PBD theory towards an understanding of other sites and processes within GPNs, such as how firm-place relationships generate discourses around place that may “reveal and rebalance” power struc-tures and influence community responsiveness to the local operations of a firm, while increasing access to knowledge (Clarke 2005: 145).
This approach, which integrates grounded theory methodology with the practice of situational anal-ysis has specific limitations which derive from the selected methodology and data collection and anal-ysis. Through meticulous documentation of the data collection, coding, memoing, analysis, and interpreta-tion phases of the study, I have tried to ensure that data were up to the highest standards of rigorous, empirically-grounded qualitative inquiry. Further-more, I believe the careful documentation and justi-fication of choices made by the researcher within the data environment support the conclusions inferred, and that the theorization developed in this article was grounded in the data collected.
My goal here was not to readjudicate the internal debates of GPN ‘traditions’ or ‘schools’ nor to shift the focus of GPN structures from the operation of the net-work to the processes of global connectivity and the production of spaces of flows. Instead, I sought to pro-vide a method and a new theorization of how ‘thick’ and ‘situated’ interpretive analysis of PBDs can help put into cultural context how GPNs are entangled with very specific, often hyperlocal conceptualizations of social worlds enlivened by formal and informal dis-courses on place, culture, and history. Thus, we can see how the examples of Breton and Quebecois PBDs function within specific (sub)national power struc-tures, while Penn Station and Austrian discourses occupy different horizons of place. By seeking out the everyday texts of beer labels to analyze PBDs and their visual content and metaphors which communicate rich sociocultural understandings of place, the codi-fied and tacit sites and processes which enliven local knowledge become central to a deeper understanding
12 James E. Baker
of how spatial embedding and value-adding remain critical to the development (and contestation) of GPNs.
References
Aaker, D. A. (1996): Building Strong Brands. New York, Free Press.
Anderson, B. (1991): Imagined Communities: Reflections on the Origin and Spread of Nationalism. London, Verso.
Argent, N. (2017): Heading down to the local? Australian rural development and the evolving spatiality of the craft beer sector. Journal of Rural Studies 61, 84–99, https://doi.org/10.1016/j.jrurstud.2017.01.016.
Arnold, D., Pickles, J. (2011): Global work, surplus labor, and the precarious economies of the border. Antipode 43(5), 1598–1624, https://doi.org/10.1111/j.1467 -8330.2011.00899.x.
Augé, M. (1995): Non-Places: Introduction to an Anthropology of Supermodernity. London, Verso.
Bathelt, H., Taylor, M. (2002): Clusters, power and place: inequality and growth in time-space. Geografiska Annaler: Series B, Human Geography 84(2), 93–109, https://doi.org/10.1111/j.0435-3684.2002.00116.x.
Bathelt, H., Malmberg, A., Maskell, P. (2004): Clusters and knowledge: local buzz, global pipelines and the process of knowledge creation. Progress in Human Geography 28(1), 31–56,https://doi.org/10.1191 /0309132504ph469oa.
BBC. (2013): Austrian ex-MEP Ernst Strasser jailed for bribe-taking. https://www.bbc.com/news/world-europe -21017914.
Bérenger, J. (1975): La révolte des Bonnets rouges et l’opinion international. Annales de Bretagne et des Pays de l’Ouest 82(4), 443–458, https://doi.org/10.3406 /abpo.1975.2791.
Billig, M. (1995): Banal Nationalism. London, Sage.Brauhaus Gusswerk (2012a): „Reini, brew
something!“ – Bio-Braumeister Barta als Ernst Strasser. https://www.brauhaus-gusswerk.at/reini-brew-something-bio-braumeister-barta-als-ernst-strasser.
Brauhaus Gusswerk (2012b): Austria Amber Ale. https:// www.brauhaus-gusswerk.at/austrian-amber-ale-das -letzte-triple-a-osterreichs.
Castells, M. (2004): An Introduction to the Information Age. In The Information Society Reader, ed. F. Webster, R. Blom, E. Karvonen, H. Melin, K. Nordenstreng, E. Puoskari: pp. 138–49. London, Routledge.
Charmaz, K. (2000): Grounded theory: Objectivist and constructivist methods. Handbook of qualitative research, 2: pp. 509–535.
Charmaz, K. (2006): Constructing grounded theory: A practical guide through qualitative analysis. London: Sage.
Clarke, A. (1991): Social Worlds Theory as Organizational Theory, in Social Organization and Social Process: Essays in honor of Anselm Strauss, ed. D. Maines: pp. 17–42. Hawthorne, NY, Aldine de Gruyter.
Clarke, A. (2005): Situational Analysis: Grounded Theory after the Postmodern Turn. London, Sage. https:// doi.org/10.4135/9781412985833.
Clarke, A., Friese, C., Washburn, R. (2016): Situational analysis in practice: Mapping research with grounded theory. New York: Routledge. https:// doi.org/10.4324/9781315420134.
Clegg, S. (1989): Frameworks of Power. London, Sage. https://doi.org/10.4135/9781446279267.
Coe, N., Dicken, P., Hess, M. (2008): Global production networks: Realizing the potential. Journal of Economic Geography 8, 271–295, https://doi.org/10.1093/jeg /lbn002.
Coe, N., Hess, M., Yeung, H. W. C., et al. (2004): ‘Globalizing’ regional development: A global production networks perspective. Transactions of the Institute of British Geographers 29, 468–484, https:// doi.org/10.1111/j.0020-2754.2004.00142.x.
Coe, N., Lai, K. P., Wojcik, D. (2014): Integrating finance into global production networks. Regional Studies 48(5), 767–777, https://doi.org/10.1080/00343404.2014 .886772.
Corbin, J., Strauss, A. (2015): Basics of Qualitative Research: Techniques and Procedures for Developing Grounded Theory. 4th ed. Thousand Oaks, CA, Sage.
Creswell, J., Poth, C. (2018): Qualitative Inquiry and Research Design: Choosing among Five Approaches. 4th ed. London, Sage.
Danieau, F., Fleureau, J., Guillotel, P., Mollet, N., Christie, M. (2014): Toward Haptic Cinematography: Enhancing Movie Experience with Haptic Effects based on Cinematographic Camera Motions. IEEE MultiMedia, Institute of Electrical and Electronics Engineers. https://hal.inria.fr/hal-00918074/document.
Diamond, I., Quinby, L. (1988): Feminism and Foucault: Reflections on resistance. Boston, Northeastern.
Dicken, P., Malmberg, A. (2001): Firms in territories: a relational perspective. Economic Geography 77, 345–63, https://doi.org/10.2307/3594105.
Dicken, P. (2015): Global shift: Mapping the changing contours of the world economy. 7th ed. London, Sage.
Eberts, D. (2014): Neolocalism and the branding and marketing of place by Canadian microbreweries. In The Geography of Beer, ed. by M. Patterson, N. Hoast-Pullen: pp. 189–199. Dordrecht, NL, Springer. https: // doi.org/10.1007/978-94-007-7787-3_16.
Elzinga, K., Tremblay, C., Tremblay, V. (2015): Craft beer in the United States: History, numbers, and geography. Journal of Wine Economics 10(3), 242–274, https: // doi.org/10.1017/jwe.2015.22.
Flack, W. (1997): American microbreweries and neolocalism: Ale-ing for a sense of place. Journal of Cultural Geography 16(2), 37–53, https: // doi.org/10.1080/08873639709478336.
Fletchall, A. (2016): Place-Making through Beer-Drinking: A Case Study of Montana’s Craft Breweries. Geographical Review 106(4), 539–566, https: // doi.org/10.1111/j.1931-0846.2016.12184.x.
Floysand, A., Jakobsen, S. E., Bjarnar, O. (2012): The dynamism of clustering: Interweaving material and discursive processes. Geoforum 43(5), 948–958, https://doi.org/10.1016/j.geoforum.2012.05.002.
Foucault, M. (1970): The Order of Things: An Archeology of the Human Sciences. New York, Random House.
Foucault, M. (1975): The Birth of the Clinic: An Archeology of Medical Perception. New York, Random House.
Place-based discourses in global production networks 13
Garavaglia, C., Swinnen, J. eds. (2018): Economics of the craft beer revolution: A comparative international perspective. In Economic Perspectives on Craft Beer: pp. 3–51. New York, Palgrave Macmillan. https:// doi.org/10.1007/978-3-319-58235-1_1.
Gereffi, G. (1994): The Organization of Buyer-Driven Global Commodity Chains: How US Retailers Shape Overseas Production Networks, in Commodity Chains and Global Capitalism, ed. G. Gereffi, M. Korzeniewicz: pp. 95–122. Santa Barbara, CA, ABC-Clio.
Gereffi, G. (1995): Global production systems and third world development. In Global Change, Regional Response: The New International Context of Development, ed. B. Stallings: pp. 100–142. New York, Cambridge University Press. https://doi.org/10.1017 /CBO9781139174336.004.
Gereffi, G., Humphrey, J., Kaplinsky, R. (2001): Introduction: Globalisation, value chains and development. IDS Bulletin 32(3), 1–8, https:// doi.org/10.1111/j.1759-5436.2001.mp32003001.x.
Gereffi, G., Humphrey, J., Sturgeon, T. (2005): The governance of global value chains. Review of International Political Economy 12(1), 78–104, https://doi.org/10.1080/09692290500049805.
Gertler, M. S. (2003): Tacit knowledge and the economic geography of context, or the undefinable tacitness of being (there). Journal of Economic Geography 3(1), 75–99, https://doi.org/10.1093/jeg/3.1.75.
Glaser, B. G. (1978). Constructivist Grounded Theory? Forum Qualitative Sozialforschung 3(3), http:// dx.doi.org/10.17169/fqs-3.3.825.
Glassman, J. (2011): The geo-political economy of global production networks. Geography Compass 5(4), 154–164, https:// doi.org/10.1111/j.1749-8198.2011.00416.x.
Goulding, C. (2017): Navigating the Complexities of Grounded Theory Research in Advertising. Journal of Advertising 46(1), 61–70, https://doi.org/10.1080 /00913367.2017.1281775.
Grigg, D. (2004): Wine, spirits and beer: World patterns of consumption. Geography 89(2), 99–110.
Harvey, D. (1969): Explanation in Geography. London, Edward Arnold.
Henderson, J., Dicken, P., Hess, M., Coe, N., Yeung, H. W. C. (2002): Global Production Networks and the Analysis of Economic Development. Review of International Political Economy 9(3), 436–464, https:// doi.org/10.1080/09692290210150842.
Hernandez, C. (2009): Theoretical Coding in Grounded Theory Methodology. Grounded Theory Review 8(3), 51–60.
Jernigan, D. (2009): The global alcohol industry: an overview. Addiction 104(1), 6–12. https:// doi.org/10.1111/j.1360–0443.2008.02430.x.
Jernigan, D., Babor, T. (2015): The concentration of the global alcohol industry and its penetration in the African region. Addiction 110(4), 551–560, https:// doi.org/10.1111/add.12468.
Latour, B. (1986): The powers of association. In Power, Action and Belief: A New Sociology of Knowledge?, ed. J. Law. London, Routledge and Kegan Paul.
Law, J. (1999): After ANT: Complexity, Naming and Typology, in Actor-Network Theory and After.
The Sociological Review 47(1, Supplement), 1–14, https://doi.org/10.1111/j.1467-954X.1999.tb03479.x.
Layder, D. (1998): Sociological practice: Linking theory and social research. London, Sage. https:// doi.org/10.4135/9781849209946.
MacLennan, B. (2007): The library and its place in cultural memory: the Grande Bibliothèque du Québec in the construction of social and cultural identity. Libraries & the Cultural Record 42(4), 349–386, https:// doi.org/10.1353/lac.2007.0062.
Marquis, C., Battilana, J. (2009): Acting globally but thinking locally? The enduring influence of local communities on organizations. Research in Organizational Behavior 29, 283–302, https://doi.org/10.1016/j.riob.2009.06.001.
McCaig, R. (2010): Consolidation in the World Brewing Industry. http://www.canbar6.usask.ca/les/33a_McCaig .pdf.
McLaughlin, R., Reid, N., Moore, M. S. (2014): The ubiquity of good taste: A spatial analysis of the craft brewing industry in the United States. In The Geography of Beer, ed. M. Patterson, N. Hoast-Pullen: pp. 131–154. Dordrecht, NL, Springer. https://doi.org/10.1007/978 -94-007-7787-3_13.
Meunier, E. M. (2016): The French-Canadian Great Darkness (Grande Noirceur) in Quebecois History and Memory, Vingtième Siècle. Revue d’histoire 1(129), 43–59.
Mey, G., Dietrich, M. (2017): From Text to Image–Shaping a Visual Grounded Theory Methodology. Historical Social Research / Historische Sozialforschung 42(4), 280–300.
Miller, D. (1995): Consumption as the vanguard of history. In Acknowledging Consumption, ed. D. Miller, pp. 1–57.
Morrione, T. J. (1985): Situated interaction. Studies in Symbolic Interaction, Supplement 1, 161–192.
Murray, W., Overton, J. (2016): Fictive clusters: Crafty strategies in the New Zealand beer industry. Norsk Geografisk Tidsskrift – Norwegian Journal of Geography 70(3), 176–189, https://doi.org/10.1080/00291951 .2016.1177587.
New York Daily News. (2017): Blue Point Brewery creates Delayed Pilsner for commuters stuck at Penn Station during ‘Summer of Hell’. https://www.nydailynews.com /new-york/beer-company-creates-delayed-brew-honor -summer-hell-article-1.3398235.
New York Magazine. (2017): Blue Point Introduces Penn Station–Exclusive Beer Inspired by Your Terrible, God-awful Commute. http://www.grubstreet.com/2017 /08/blue-point-delayed-beer-penn-station.html.
Peez, G. (2006): Fotoanalyse nach Verfahrensregeln der Objektiven Hermeneutik. In Bildinterpretation und Bildverstehen. Methodische Ansätze aus sozialwissenschaftlicher, kunst- und medienpädagogischer Perspektive, ed. W. Marotzki, H. Niesyto, pp. 121–41. Wiesbaden, VS.
Pulec, J. (2014): Geograficka analyza pivovarnickeho prumyslu v Cesku. Diploma thesis. Faculty of Science Charles University in Prague, Praha, 98 p.
Pulec, J. (2016): Integration of the Czech Brewing Industry into Global Production Networks. AUC Geographica 50(1), 47–59, https://doi.org/10.14712/23361980 .2016.5.
Reid, N., Mclaughlin, R., Moore, M. S. (2014): From yellow fizz to big biz: American craft beer comes of age. Focus on Geography 57(3), 114–125, https://doi.org/10.1111 /foge.12034.
14 James E. Baker
Saldaña, J. (2016): The coding manual for qualitative researchers. Thousand Oaks, CA, Sage.
Reuters. (2011): France’s Hollande Defies Breton Tax Protest. https://in.reuters.com/article/france-tax /frances-hollande-defies-breton-tax-protest -idINL5N0IR2JF20131106.
Schnell, S., Reese, J. (2014): Microbreweries, place, and identity in the United States, in The Geography of Beer, ed. M. Patterson, N. Hoast-Pullen: pp. 167–187. Dordrecht, NL, Springer. https://doi.org/10.1007/978 -94-007-7787-3_15.
Schwartz-Shea, P., Yanow, D. (2013): Interpretive research design: Concepts and processes. New York, Routledge. https://doi.org/10.4324/9780203854907.
Smith, H. (2012): Asian Beer. http://www.drinksint.com /news/fullstory.php/aid/3157/Asian_beer_.html.
Smith, A. (2014): The state, institutional frameworks and the dynamics of capital in global production networks. Progress in Human Geography 39(3), 290–315, https://doi.org/10.1177/0309132513518292.
Strauss, A. L. (1978): A Social Worlds Perspective. Studies in Symbolic Interaction 1, 119–128.
Strauss, A. L. (1993): Continual Permutations of Action. New York, Aldine de Gruyter.
Strauss, A., Corbin, J. (1998): Basics of qualitative research techniques. Thousand Oaks, CA, Sage.
Sturgeon, T. (2001): How do we define value chains and production networks? IDS Bulletin 32(3), 9–18, https://doi.org/10.1111/j.1759-5436.2001.mp32003002.x.
Swinnen, J. F. M., Van Herck, K. (2010): How the East Was Won: e Foreign Take-Over of the Eastern European Brewing Industry. LICOS Centre for Institutions and Economic Performance, Katholieke Universiteit, Leuven, 30 p.
The Barth-Haas Group. (2012): Beer Production: Market Leaders and their Challengers in the Top 40 Countries in 2012. http://www.barthhaasgroup.com/images/pdfs /report2013/Barth_Beilage_2013.pdf.
The Globe and Mail. (2016): Quebec’s microbreweries tap into province’s culture with beer labels. https://www .theglobeandmail.com/life/food-and-wine/food-trends /quebecs-microbreweries-tap-into-provinces-culture -with-beer-labels/article28079387.
The New York Times. (2017): Cuomo Steps Into Transit Fray With Ideas for After ‘Summer of Hell’. https://www .nytimes.com/2017/05/23/nyregion/cuomo-takes-responsibility-for-fixing-new-yorks-transit-problems.html.
Tuan, Y. (1977): Space and Place: The Perspective of Experience. Minneapolis, University of Minnesota Press.
Weedon, C. (1987): Feminist practice and poststructuralist theory. Oxford, Blackwell.
Original Article 15
Soils and land use in the study of soil organic carbon in Colombian highlands catenaMelissa Lis-Gutiérrez1,*, Yolanda Rubiano-Sanabria2, Juan Carlos Loaiza Usuga3
1 Universidad de Ciencias Aplicadas y Ambientales, Environmental Science and Engineering Faculty, Program of Agronomic Engineering, Bogotá, Colombia2 Universidad Nacional de Colombia, Sede Bogotá, Agricultural Sciences Faculty, Program of Agronomic Engineering, Bogotá, Colombia3 Universidad Nacional de Colombia, Sede Medellín, Mines Faculty, Department of Geoscience and the Environment, Medellin, Colombia* Corresponding author: [email protected]
ABSTRACTAndean highland ecosystems (known as paramos) have a great potential to store water and organic carbon, which fulfill the inherent functions associated to the regulation of carbon and water cycles, characteristics linked to their parent material (volcanic ash). How-ever, paramos are at high risk of degradation associated with land use dynamics that affect organic carbon quality in the surface soil. Changes in vegetation cover, with transition from natural forest to tillage and then pasture, make the soil vulnerable to degradation by compaction, erosion, and carbon dioxide emissions associated with increased anthropogenic activity. Despite this cover change, information on soil carbon dynamics in paramos is scarce, impeding conservation management strategies in these ecosystems. This study evaluates the impact of different soil uses within a transect in the Guerrero paramo estimated from soil organic carbon (SOC) stock in the upper meter and carbon condition (expressed as stratification ratio, SR) in the surface soil. Carbon storage varied from 165.2 to 721.9 t ha−1 in the upper meter of soil with SR1 (0–10/10–20cm) between 0.92 and 2.01 and SR2 (0–10/20–30cm) between 0.99 and 2.05. Results of this study highlighted that in the fragile ecosystems than Andean paramos, the geomorphological position in relation to soil uses and management practices conditioned soil carbon availability, affecting pedogenetic processes. SR of SOC associated to anthropogenic intervention activities it does not indicate by itself C sequestration. In future researches it is necessary include additional parameters than net primary productivity and historic vegetation.
KEYWORDSAndisol; Paramo ecosystem; catena; soil organic carbon; land use
Received: 28 August 2018Accepted: 28 March 2019Published online: 8 May 2019
Lis-Gutiérrez, M., Rubiano-Sanabria, Y., Loaiza-Usuga, J. C. (2019): Soils and land use in the study of soil organic carbon in Colombian highlands catena. AUC Geographica 54(1), 15–23https://doi.org/10.14712/23361980.2019.2
© 2019 The Authors. This is an open-access article distributed under the terms of the Creative Commons Attribution License (http://creativecommons.org/licenses/by/4.0).
16 Melissa Lis-Gutiérrez, Yolanda Rubiano-Sanabria, Juan Carlos Loaiza-Usuga
1. Introduction
Soil is an important emission source and reservoir of organic carbon (OC). At the global scale, it is the second largest reservoir of carbon (C) and the high-est C pool in terrestrial ecosystems, storing between 1462–1548 Pg of C in the upper meter (Batjes 1996), about twice that of the atmosphere (750 Pg of C) and vegetation (650 Pg of C) (FAO 2002). Soil organic car-bon (SOC) stock comprises 69.8% of the biosphere OC (FAO 2002) and >71% of the terrestrial C reserves (Parras-Alcantara et al. 2015). SOC is an impor-tant component of the biogeochemical cycle and its dynamics are controlled by the vertical and lateral C fluxes (Armas 2009). SOC plays a key role in relation to physical, chemical and biological properties of soil, conditioning the fertility, productivity and soil qual-ity (Batjes 1996; Post and Kwon 2000). Soil fertility (biological, physical and chemical) in the tropics par-ticularly benefits from SOC inputs because of the poor nutrient status and highly weathered soil conditions. According to Kim et al. (2004) and Brady and Weil (2007), reduction in SOC content will be accentuate by degradation processes (erosion, compaction, nutri-ent loss, leaching and acidification), what leads to loss of biodiversity and soil productivity and even severe environmental problems, such as floods, droughts, underground water shortage, soil depletion and other unpredicted events.
Tropical rainforests store most of their C in vegeta-tion, whereas paramos mostly store C in soils (CODE-SAN 2009) because of lower decomposition rates and nutrient recycling related to low temperatures that promote C accumulation. Thus, C in paramos min-eralizes slowly and converts to humus, storing up to 1700 t C ha−1, whereas soils from tropical rainforests only store 50 t of C ha−1 (Hofstede et al. 2003). From a global change perspective, land management influ-ences the ability of soils to serve as both a source and a sink of SOC and nutrients (Schrumpf et al. 2011). Land use/cover change (LUCC) affects the global C balance and is recognized as a major factor affect-ing soil carbon storage over decades to centuries (Scott et al. 2002). Soil degradation worldwide due to anthropic activities is estimated at approximate-ly 1094 million ha: 43% of this land degradation is due to forest conversion or other vegetation cover change, 29% to pastures, 24% by poor management, and 4% to over-use of natural resources (Walling and Fang 2003).
Among Colombian paramo soils, Andisols (soils derived from volcanic ash weathering, with accumu-lation of short range order minerals and stable orga-no-mineral complexes) dominate. These soils have high OC, with the vertical OC distribution directly dependent on vegetation and geomorphology (Nan-zyo 2002). The Andisols in Colombian mountains have good structure associated to high organic mat-ter (OM) and presence of allophane parameters that
have been extensively studied (Jenny 1950; Flórez and Parra 2001). In natural paramo hillslopes, little surface water erosion occurs on Andisols, but this behavior changes when the natural vegetation is converted to agriculture due to intense mechanized tillage or conversion to pastures where trampling occurs (Pla 1990; Dörner et al. 2016). Some contra-dictory findings on erosion resistance related to the degree of disturbance of Andisols have been report-ed (Pla 1990; Nanzyo et al. 1993; Dahlgren et al. 2004).
Numerous studies in Colombia have quantified total carbon stocks within different compartments of heterogeneous tropical and neotropical forests, including aboveground biomass, belowground bio-mass, necromass, and soils (Jenny 1950; Loaiza et al. 2010; 2013). However, information on carbon dynam-ics in different ecosystem components in paramos is scarce or non-existent, especially for the relation of SOC with land use and the consequences on soil qual-ity. The aims of this study were to estimate the impact of several land uses on the quality of the soils along a transect in the Guerrero Paramo (Cundinamarca – Colombia) and propose the use of SOC stocks and stratification ratio (SR) as indicators of SOC dynamics in the paramo in relation to land use. In addition, we aim to understand the C variability of the topsoil layer, as this layer has the highest potential of mobilizing substantial amounts of C under climate or land use changes.
2. Materials and Methods
2.1 Study siteThe study area is located in the Guerrero paramo at Tausa village on the Cundinamarca region (Colom-bia). The coordinates of the study site in Colombia are 5°12′48″N 74°00′16″W and 5°11′47″N 74°1′20″W (Figure 1). Soil parent material is composed of Upper Cretaceous and Lower Tertiary sedimentary rocks, mainly composed of compact sandstones with fri-able insertions of siliceous siltstones, mudstones, claystones and shales, local volcanic ash layers, and consolidated and semi consolidated Quaternary sed-iments (Ávila 2005). There are three different mor-phogenetic environments: (1) structural denudated mountains (60%) divided into glaci-structural moun-tains (24%) and structural-erosional mountains (36%), (2) fluvial accumulation processes (31%) and (3) glacial plains or depressions (9%) (Ávila 2005; CAR et al. 1997) (Table 1). A description of the com-plete soil survey can be found in IGAC (2000). The main climate in this zone is moist and cold, with some small zones classified as extremely cold and moist or semi-moist and very cold, according to Caldas-Lang classification. There is bimodal precipitation regime which varies from 865 mm (Salitre-El Neusa sta-tion) to 1107 mm (Los Pinos station) as multiannual

Soils and land use in the study of soil organic carbon 17
averages. Soil use is classified into high mountain park (855 ha), grazing (345 ha), intensive agriculture (292 ha), wetlands (16.5 ha) and mining (0.5 ha).
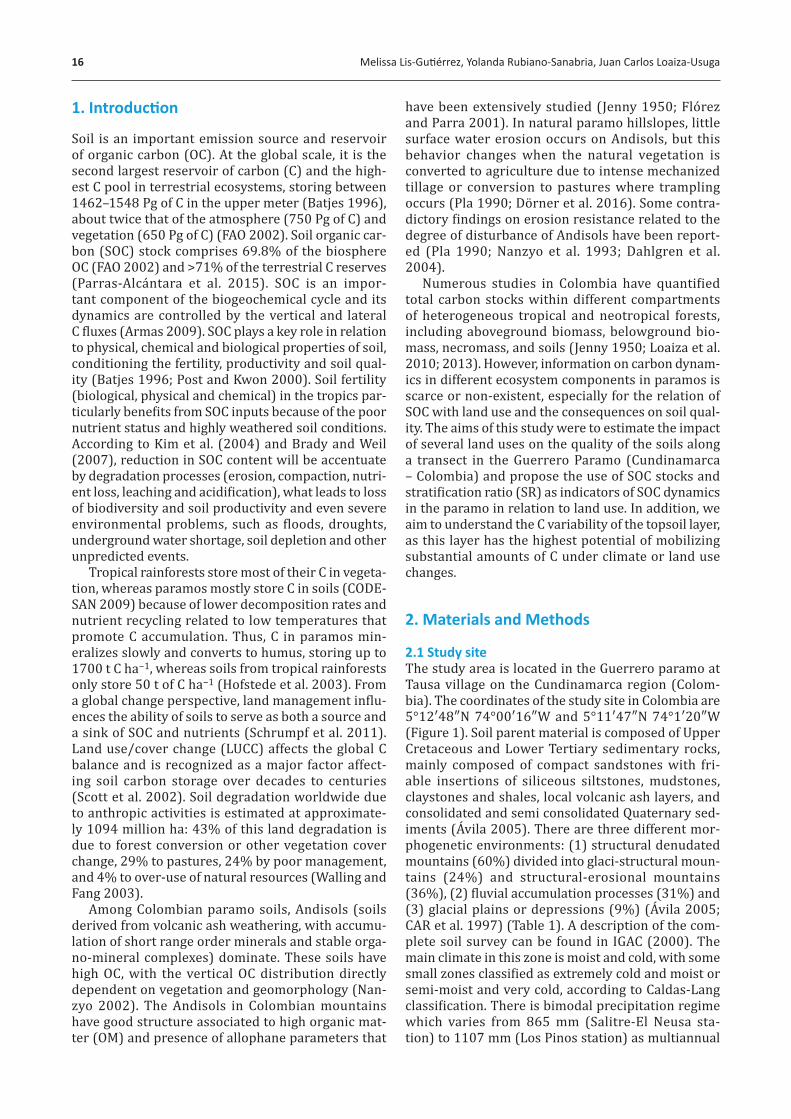
2.2 Field and Laboratory studySoil organic carbon (SOC) was studied using a geo-morphic transect through the Guerrero paramo con-sidering the relationship between soil and geormor-phology in the context of soil forming components (Buol et al. 1989; Birkeland 1999; Birkeland et al. 2003). Soils profiles across different geomorpho-logical positions in the Guerrero Paramo ecosystem, which determine the organic matter behavior and many of the morphological properties, vegetation and land use are shown in Figure 2. The transect length is 4.8 km with altitudes ranging from 3,369 to 3,630 m.a.s.l. The four representative land uses are potatoes, pasture, paramo vegetation, and natural forest. The main characteristics of transect are shown in Tables 1, 2 and Figure 2.
Ten representative soils profiles associated with different geomorphological positions, vegetation,
and land use for study zone were selected, described according to Soil Survey Manual (SSS, 1993) and clas-sified according to Soil Taxonomy (SSS, 2014). The soils that integrate this catena correspond to nine Andisols of the suborder Udands and one Incepti-sol of the suborder Udepts (Table 1). The soils with andic properties (according to soil taxonomy param-eters) are characterized by dark and deep morpho-genetic horizons, with high organic matter content and low bulk densities (less than 0.9 g cm−3). Soils are extremely acidic to moderately acidic, with low and very low Cation Exchange Capacity (CEC), high organic matter (OM), OC and nitrogen (N) contents, medium C/N ratio, phosphorous (P) very low to high, calcium (Ca) very low to medium, potassium (K) very low to high, magnesium very low to low, sodium (Na) low to medium, aluminum (Al) low to high; and tex-tures that vary with depth, progressing from coarse to fine and finally very fine textures. A detailed result for soil profiles laboratory analysis are showed in Table 2. For each soil profile used in the SOC stock assessment, undisturbed soil samples were taken with split tube
Fig. 1 Study site location.
Tab. 1 Description of characteristics in the field study sites and SR.
Profile Soil classification(SSS, 2014) Geomorphology Vegetation Land use Environmental
conditionsSlope
(%)Elevation (m.a.s.l.)
SR1 (0–10/10–20)
SR2 (0–10/20–30)
I Typic Endoaquand Fluviolacustrine Plain
scrublands and mosses, C nitida, C multiflora, D granadensis, Espeletia sp,
Natural high mountain
Extremely cold and moist
3–7 3629 0.92 1.15
IITypic Endoaquand
Moraines 7–12 3610 1.08 1.28
III Pachic Melanudand Abrupt homoclinal crest Espeletia and shrubs
Really cold and moist
25–50
3542 1.20 1.42
IV Lithic Humudept Slope 3569 1.35 1.39
V Pachic Melanudand Accumulation Glacis
Pasture Pasture
3452 1.08 1.14
VI Pachic Melanudand Valley
12–25
3404 1.06 1.09
VII Typic Endoaquand Accumulation Glacis 3432 1.00 0.99
VIII Pachic Melanudand Hill Forest Weinmannia Natural high mountain 3462 0.98 1.01
IX Pachic Melanudand Hill Bare Soil-Potatoes Intensive agriculture
3437 1.02 1.00
X Pachic Melanudand Hill Pasture-Potatoes 25–50 3369 2.01 2.05
18 Melissa Lis-Gutiérrez, Yolanda Rubiano-Sanabria, Juan Carlos Loaiza-Usuga
sampler (Eijkelkamp ®) to a maximum depth of one meter to determine bulk density; and disturbed sam-ples were collected at the same depths to determine SOC. Samples were analyzed according to SSS (2004) methodologies. Subsequently Total Carbon (TC) was determined through dry combustion with an elemen-tal analyzer (Leco CNS®).
2.3 Soil organic carbon and stratification ratio calculation
The model used to calculate SOC from Total Carbon (TC) is based on Goidts et al. (2009) equation:
SOC Stock = d × C × ρ [1 − RM] / 100
Where stock is the SOC stock (t C ha–1), d is the sam-pling depth considered (m), C is the soil organic car-bon concentration (g C kg–1), ρ is the bulk density (kg m–3), and RM is the mass proportion of rock frag-ment content (dimensionless).
Stratification Ratio (SR) was determined according Franzluebbers (2002) methodology as a soil quality indicator:
SR1 = COT0–10 cm / COT10–20 cm and SR2 =
COT0–10 cm / COT20–30 cm
Where COT is the concentration of SOC (g kg−1) and sampling depths (subscripts) are 0–10 cm, 10–20 cm, and 20–30 cm.
3. Results and discussion
3.1 Soil organic carbon stockThe current study found that SOC stock fluctuates from 165.1 to 721.8 t ha−1. In the Table 3 the behav-ior of SOC stocks for different combinations of soils and soil use in relation to geomorphological position are showed. The first set of transect consist of Profiles I–V. Profile III has higher SOC stocks (350.6 t ha−1, Fig-ures 2 and 3), where surface curvature (Terrain based classification) indicate that profile or vertical curva-ture (Vc) was classified as flat and favors the depo-sition of colluvium in the concave plan or horizon-tal curvature (Hc) direction; allow much colluvium to deposit resulting in deeper profiles and horizons (Yoo et al. 2006). Deep soil profiles were developed in flat topographic conditions that favors organic mat-ter enrichment, soil profile stability and rejuvenation (Buol et al. 1989; Birkeland et al. 2003; Mora et al. 2014).
Profile II accumulated 339.3 t C ha−1, this behavior is associated to concave and flat slopes that promote accumulation of organic matter transported from Pro-file I. In Profile I, there is material loss by surface run-off, which despite the flat and concave topography (Vc and Hc) and slightly rolling slopes (3–7%), decreased the SOC content by 33% compared to Profile II.
Profiles I and II have high potential of C storage due to the geomorphological position. A second set with-in the study transect, consists of Profiles VI to X. The lowest SOC values along the whole toposequence were
Fig. 2 Vertical distribution of SOC (t ha−1) up to one meter depth, along the study transect. Soils are described according to Soil Survey Manual SSS (1993).
Soils and land use in the study of soil organic carbon 19
Tab. 2 Characteristics of soils in the study sites.
Profile Horizon Depth (cm) Texture BD pH %OC %OM %N
P Ca K Mg Na Al%BS
CEC
ppm meq 100 g−1 cmol kg−1
I
A 0–36 Silty clay 0.36 4.0 26.00 45.51 2.27 29.20 1.33 0.17 0.17 0.09 4.55 1.76 6.31
Ag 36–49 Clay 0.53 4.6 8.95 15.43 1.00 3.96 0.52 0.13 0.11 0.08 5.37 0.84 6.21
2Bwg 49–64 Clay 0.72 4.7 3.39 5.84 0.29 4.33 0.16 0.08 0.04 0.07 7.49 0.35 7.84
3Cg 64x Clay – 4.4 0.74 1.28 2.00 4.09 0.20 0.21 0.05 0.07 9.86 0.53 10.39
II
A 0–40 Clay loam 0.41 4.0 19.00 32.07 1.60 7.74 0.27 0.20 0.18 0.11 7.64 0.76 8.40
2Ag 40–60 Clay 0.49 5.0 9.89 17.05 0.85 2.73 0.18 0.07 0.07 0.1 1.78 0.42 2.20
3Bw 60–69 Clay 0.76 5.1 3.26 5.62 0.28 3.98 0.18 0.11 0.03 0.25 1.85 0.57 2.42
4C 69–90x Clay – 4.6 0.44 0.76 0.04 12.80 0.29 0.08 0.06 0.11 7.32 0.54 7.86
III
A 0–19 Clay loam 0.64 5.0 14.00 23.27 1.17 16.40 0.13 0.32 0.15 0.1 0.48 0.70 1.18
2Ag 19–58 Sandy loam 0.65 5.3 9.29 16.02 0.80 12.10 0.17 0.11 0.08 0.05 1.05 0.41 1.46
3Bw1 58–95 Sandy loam 0.58 5.5 4.32 7.45 0.37 5.88 0.17 0.04 0.04 0.08 0 0.33 0.33
3Bw2 95–123 Sandy loam 0.60 5.5 3.84 6.62 0.33 3.97 0.14 0.02 0.02 0.07 0 0.25 0.25
3Bw3 123–157 Sandy loam – 5.5 3.32 5.72 0.29 2.50 0.11 0.01 0.01 0.06 0 0.19 0.19
4Bw4 157–172 Sandy loam – 5.2 4.69 8.09 0.40 4.84 0.16 0.05 0.04 0.1 0.53 0.35 0.88
5Ab 172x Loamy sand – 5.3 9.86 17.00 0.85 21.00 0.21 0.02 0.06 0.08 1.06 0.37 1.43
IV
A1 0–14 Clay 0.74 4.0 16.00 26.89 1.34 9.15 1.34 0.21 0.15 0.08 6.10 1.78 7.88
A2 14–26 Clay 0.78 4.7 12.30 21.21 1.06 2.12 0.15 0.09 0.08 0.08 4.26 0.40 4.66
R 26x – – – – – – – – – – – – – –
V
Ap 0–25 Clay loam 0.62 5.0 14.00 24.83 1.24 105.00 5.56 0.17 0.71 0.15 1.66 6.59 8.25
A 25–63 Sandy loam 0.73 5.3 9.29 16.02 0.80 24.50 4.84 0.11 0.75 0.1 0.85 5.80 6.65
BC 63–100x Sandy clay loam 0.75 5.6 2.92 5.03 0.25 >116 2.54 0.05 0.29 0.19 0 3.07 3.07
VI
Ap 0–34 silty clay 0.72 5.0 15.00 26.03 1.30 >116 1.39 0.89 0.28 0.12 4.09 2.68 6.77
A1 34–56 Clay loam 0.68 4.5 14.40 24.83 1.25 >116 1.51 0.53 0.18 0.11 3.9 2.33 6.23
A2 56–79 Loam 0.96 4.7 11.60 20.00 1.00 10.50 1.43 0.44 0.12 0.07 2.35 2.06 4.41
BC 79–100x Clay loam 0.85 5.1 1.86 3.21 0.16 27.10 0.52 0.22 0.05 0.06 0.24 0.85 1.09
VII
Ap 0–41 Clay loam 0.76 5.0 15.00 25.17 1.26 >116 2.87 0.48 0.33 0.06 2.90 3.74 6.64
A1 41–79 Sandy loam 0.68 4.9 15.00 25.86 1.30 104.00 1.70 0.15 0.31 0.07 3.00 2.23 5.23
A2 79–132 Silty clay loam 0.62 4.9 13.80 23.79 1.19 2.74 0.42 0.13 0.13 0.06 2.59 0.74 3.33
AB 132–172 Silty clay loam 0.60 4.9 8.90 15.34 2.19 2.03 0.35 0.09 0.07 0.05 2.41 0.56 2.97
Bw 172–222x Sandy loam – 5.0 6.20 10.69 3.19 1.86 0.25 0.15 0.24 0.05 1.34 0.69 2.03
VIII
A 0–63 Silty clay loam 0.50 5.0 17.00 29.83 1.49 25.70 0.42 0.36 0.25 0.08 2.98 1.11 4.09
A1 63–90 Sandy loam 0.52 5.0 10.90 18.79 0.94 2.50 0.18 0.09 0.04 0.07 0.58 0.38 0.96
A2 90–105 Sandy loam 0.63 5.0 6.08 10.48 0.59 1.78 0.22 0.09 0.03 0.07 0.31 0.41 0.72
Bw 105–170 Sandy loam – 5.1 5.10 8.79 0.44 2.26 0.21 0.12 0.05 0.07 0.19 0.45 0.64
IX
Ap 0–40 Silty clay loam 0.5 4.0 15.00 26.55 1.33 29.20 1.33 0.17 0.17 0.09 4.55 1.76 6.31
A1 40–95 Silty clay loam 0.54 4.5 14.80 25.52 1.28 9.01 0.61 0.07 0.04 0.09 2.82 0.81 3.63
A2 95–140 Sandy clay loam 0.56 4.6 6.86 11.83 0.59 3.04 0.25 0.06 0.02 0.05 0.34 0.38 0.72
AB 140–160 Loam – 4.5 5.70 9.83 0.49 2.04 0.25 0.08 0.03 0.06 0.48 0.42 0.9
Bw 160–205x Sandy loam – 4.6 4.92 8.48 0.42 2.28 0.25 0.08 0.01 0.06 0.28 0.40 0.68
X
Ap 0–55 silty clay 0.82 5.0 11.00 18.10 0.91 >116 4.34 1.08 0.5 0.06 2.80 5.98 8.78
A1 55–92 Clay 0.77 4.4 13.00 22.41 1.12 82.00 1.96 0.59 0.14 0.08 3.91 2.77 6.68
A2 92–127 Clay 0.80 4.4 13.70 23.62 1.18 12.50 0.68 0.41 0.1 0.05 4.70 1.24 5.94
A3 127–168 silty clay – 4.8 10.00 17.24 0.86 7.10 0.31 0.29 0.04 0.05 2.35 0.69 3.04
2Bw 168–209 silty clay – 5.1 2.86 4.93 0.25 1.82 0.54 0.21 0.08 0.06 5.60 0.89 6.49
OC: organic carbon, OM: organic matter, N: nitrogen, P: phosphorous, Ca: calcium, K: potassium, Mg: magnesium, Na: sodium, SB: base saturation, CEC: cation exchange capacity, Al: Aluminum

20 Melissa Lis-Gutiérrez, Yolanda Rubiano-Sanabria, Juan Carlos Loaiza-Usuga
found in profiles IV and V with C values of 165.14 t C ha−1 and 267.65 t C ha−1, respectively. Presence of rugged topography (25–50% of slope) favored a decrease of SOC in all profiles referring to the second set of tran-sect. Profile V has 62% more SOC than Profile IV, like-ly due to the concave planform, which favors higher accumulation of material from zones close to Profile IV. The thin soils and surface rocks (paralithic contact) provide evidence of the influence of climate and relief conditions on soil profile evolution.
Profile VII has the highest SOC values (721.9 t C ha−1); this area is covered by pasture. Traditionally pasture zones correspond to recovering or fallow lands, some of which employ alternating tillage cycles about every 5 years. The highest OM incorporation in forest soils under volcanic ash soils is well documented by Loaiza et al. (2010), Mora et al. (2014), Peña-Ramírez et al. (2009). Land use change leads to the loss of carbon stock from natural forests (Kim et al. 2004); however, SOC is somewhat influenced by root inputs and more strongly affected by fauna bioturbation (Tonneijck and Jongmans 2008). According to Wang et al. (2012), the increase of SOC content could be attributed to fer-tilizer contribution during tillage periods.
The SOC stock in X profile is 624.1 t C ha−1; an ancient tillage site that experienced occasional trampling by cattle and sheep despite the steep gradient. In pro-file IX, SOC values are relatively high (618.2 t C ha−1); however, they show negative effects of tillage on surface horizons (20 to 40 cm depth), where SOC declines may reach 40% (Figure 2) with respect to the upper 10 cm of soil. Conversion from native for-est to pasture can lead to soil degradation related to intensification of land use (Dörner et al. 2010, 2016). However, changes on SOC stocks associated with land use change mainly affects the upper 10 cm of sin the studied soil catena, where between 10 % and 40% of the total carbon (between 52.93 and 96.89 t C ha−1), see Figure 2 and Table 3. Farming also conspicuously changes chemical and biological properties of Andis-ols, such as decreasing organic carbon content (Shoji et al. 1993). Profile X exhibited two trends related to
material behavior: (1) colluvium material accumula-tion associated with concave slopes, and (2) trans-port of materials across convex slopes. Under forests (profile VIII), SOC stocks were 514.2 t C ha−1 with 60% of the C found in the A horizon (Figure 2). This behav-ior is more evident in forest ecosystems despite the presence of undulating slopes with concave and flat segments where the organic-rich A horizon, derived from volcanic ashes, reaches a depths greater than one meter. Volcanic soils have a large potential for organic carbon storage and forest growth, particularly in moist temperate climates (Mora et al. 2014; Peña-Ramírez et al. 2009). In Andisols under natural forests (montane moist forest life zone), decomposition and OM accu-mulation are very efficient, and this promotes aggre-gate stability and erosive resistance (Loaiza et al. 2010, Mora et al. 2014; Peña-Ramírez et al. 2009). In Profile VI, under tillage of potatoes and pasture with crop rota-tion, SOC values reach 510.6 t C ha−1 on undulating, planar, and concave slopes which favor accumulation, that coincide with findings of Jenny (1950), Nanzyo et al. (1993), Buytaert et al. (2002), Dahlgren et al. (2004).
Soil profiles III, VII and X on the lowest parts of the slope and in the zones with gradients between 25% and 50%, may be considered accumulation sections along the transect because on their concave, flat and foot slope profiles. Vertical distribution of SOC is negatively correlated with soil depth (Table 3 and Figure 2), simi-lar to Zhang et al. (2015) Jobbagy and Jackson (2000) Mora et al. (2014) reports.
3.2 Stratification of Organic Carbon
Throughout our study site, SR1 (0–10cm/10–20cm) fluctu-ated between 0.92–1.35 scrublands, 1–1.08 pasture, 098 natural forest and 0.98–2.01 potato rotation and for SR2 (0–10cm/20–30cm) variations were 1.15–1.42 scrublands, 0.99–1.14 pasture, 1–2.05 and 1.01 natu-ral forest potato rotation. When grouping all land use, SR1 varies between 0.92–2.01 and SR2 varies between 0.99 and 2.05 (Table 1). Results of Franzluebbers (2002) showed stratification ratios of soil organic C
Tab. 3 Carbon Stock on t ha−1 along the Catena (every 10 cm up to one meter m depth).
Depth (cm) I II III IV V VI VII VIII IX X
0–10 63.55 72.87 60.14 63.82 60.69 73.15 72.58 52.93 63.89 96.89
10–20 67.93 68.94 51.80 50.72 49.05 62.86 79.38 70.53 64.05 42.37
20–30 47.52 54.19 39.78 50.60 61.65 66.63 78.31 67.15 70.32 55.64
30–40 49.02 50.39 37.61 – 28.21 49.32 71.86 63.04 29.43 58.27
40–50 35.47 42.71 35.92 – 27.95 48.21 75.51 59.89 63.82 53.58
50–60 34.25 30.97 36.35 – 40.10 63.01 72.46 46.61 69.53 56.59
60–70 – 19.24 21.42 – – 43.90 68.63 49.74 60.14 58.15
70–80 – – 21.11 – – 59.44 63.92 40.98 76.21 64.04
80–90 – – 23.47 – – 32.90 66.76 35.87 71.47 63.39
90–100 – – 22.99 – – 11.16 72.48 27.45 49.36 75.12
SOC Stock 297.74 339.31 350.59 165.14 267.65 510.58 721.89 514.19 618.22 624.04
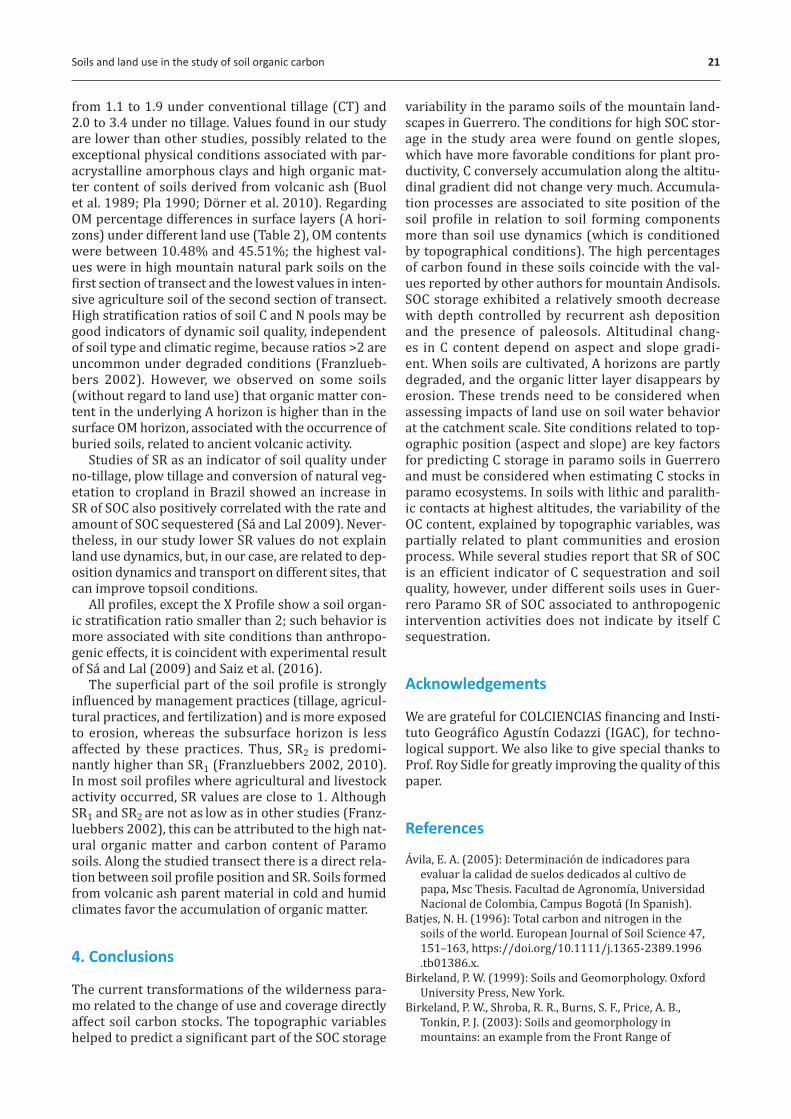
Soils and land use in the study of soil organic carbon 21
from 1.1 to 1.9 under conventional tillage (CT) and 2.0 to 3.4 under no tillage. Values found in our study are lower than other studies, possibly related to the exceptional physical conditions associated with par-acrystalline amorphous clays and high organic mat-ter content of soils derived from volcanic ash (Buol et al. 1989; Pla 1990; Dörner et al. 2010). Regarding OM percentage differences in surface layers (A hori-zons) under different land use (Table 2), OM contents were between 10.48% and 45.51%; the highest val-ues were in high mountain natural park soils on the first section of transect and the lowest values in inten-sive agriculture soil of the second section of transect. High stratification ratios of soil C and N pools may be good indicators of dynamic soil quality, independent of soil type and climatic regime, because ratios >2 are uncommon under degraded conditions (Franzlueb-bers 2002). However, we observed on some soils (without regard to land use) that organic matter con-tent in the underlying A horizon is higher than in the surface OM horizon, associated with the occurrence of buried soils, related to ancient volcanic activity.
Studies of SR as an indicator of soil quality under no-tillage, plow tillage and conversion of natural veg-etation to cropland in Brazil showed an increase in SR of SOC also positively correlated with the rate and amount of SOC sequestered (Sa and Lal 2009). Never-theless, in our study lower SR values do not explain land use dynamics, but, in our case, are related to dep-osition dynamics and transport on different sites, that can improve topsoil conditions.
All profiles, except the X Profile show a soil organ-ic stratification ratio smaller than 2; such behavior is more associated with site conditions than anthropo-genic effects, it is coincident with experimental result of Sa and Lal (2009) and Saiz et al. (2016).
The superficial part of the soil profile is strongly influenced by management practices (tillage, agricul-tural practices, and fertilization) and is more exposed to erosion, whereas the subsurface horizon is less affected by these practices. Thus, SR2 is predomi-nantly higher than SR1 (Franzluebbers 2002, 2010). In most soil profiles where agricultural and livestock activity occurred, SR values are close to 1. Although SR1 and SR2 are not as low as in other studies (Franz- luebbers 2002), this can be attributed to the high nat-ural organic matter and carbon content of Paramo soils. Along the studied transect there is a direct rela-tion between soil profile position and SR. Soils formed from volcanic ash parent material in cold and humid climates favor the accumulation of organic matter.
4. Conclusions
The current transformations of the wilderness para-mo related to the change of use and coverage directly affect soil carbon stocks. The topographic variables helped to predict a significant part of the SOC storage
variability in the paramo soils of the mountain land-scapes in Guerrero. The conditions for high SOC stor-age in the study area were found on gentle slopes, which have more favorable conditions for plant pro-ductivity, C conversely accumulation along the altitu-dinal gradient did not change very much. Accumula-tion processes are associated to site position of the soil profile in relation to soil forming components more than soil use dynamics (which is conditioned by topographical conditions). The high percentages of carbon found in these soils coincide with the val-ues reported by other authors for mountain Andisols. SOC storage exhibited a relatively smooth decrease with depth controlled by recurrent ash deposition and the presence of paleosols. Altitudinal chang-es in C content depend on aspect and slope gradi-ent. When soils are cultivated, A horizons are partly degraded, and the organic litter layer disappears by erosion. These trends need to be considered when assessing impacts of land use on soil water behavior at the catchment scale. Site conditions related to top-ographic position (aspect and slope) are key factors for predicting C storage in paramo soils in Guerrero and must be considered when estimating C stocks in paramo ecosystems. In soils with lithic and paralith-ic contacts at highest altitudes, the variability of the OC content, explained by topographic variables, was partially related to plant communities and erosion process. While several studies report that SR of SOC is an efficient indicator of C sequestration and soil quality, however, under different soils uses in Guer-rero Paramo SR of SOC associated to anthropogenic intervention activities does not indicate by itself C sequestration.
Acknowledgements
We are grateful for COLCIENCIAS financing and Insti-tuto Geografico Agustín Codazzi (IGAC), for techno-logical support. We also like to give special thanks to Prof. Roy Sidle for greatly improving the quality of this paper.
References
Ávila, E. A. (2005): Determinación de indicadores para evaluar la calidad de suelos dedicados al cultivo de papa, Msc Thesis. Facultad de Agronomía, Universidad Nacional de Colombia, Campus Bogota (In Spanish).
Batjes, N. H. (1996): Total carbon and nitrogen in the soils of the world. European Journal of Soil Science 47, 151–163, https://doi.org/10.1111/j.1365-2389.1996 .tb01386.x.
Birkeland, P. W. (1999): Soils and Geomorphology. Oxford University Press, New York.
Birkeland, P. W., Shroba, R. R., Burns, S. F., Price, A. B., Tonkin, P. J. (2003): Soils and geomorphology in mountains: an example from the Front Range of

22 Melissa Lis-Gutiérrez, Yolanda Rubiano-Sanabria, Juan Carlos Loaiza-Usuga
Colorado soils and geomorphology in mountains. Geomorphology 55, 329–344, https://doi.org/10.1016/S0169-555X (03)00148-X.
Brady, N. C., Weil, R. R. (2007): The nature and properties of soils. Ed. S. Helba. Macmillan, New York.
Buol, S., Hole, F., Mccracken, R. (1989): Soil Genesis and Classification. Iowa State University Press.
Buytaert, W., Deckers, J., Dercon, G., De Bieavre, B., Poesen, J., Govers, G. (2002): Impact of land use changes on the hydrological properties of volcanic ash soils in South Ecuador. Soil Use and Management 18, 94–100, https://doi.org/10.1111/j.1475-2743.2002.tb00226.x.
CAR, IGAC, Alcaldía de Tausa (1997): Plan de Ordenamiento Territorial del municipio de Tausa (In Spanish).
CODESAN (2009): Taller Regional – Cuantificación y estimación de los stocks de Carbono en ecosistemas de alta montaña, Lima (In Spanish).
Dahlgren, R. A., Saigusa, M., Ugolini, F. C. (2004): The nature, properties, and management of volcanic soils. Advances in Agronomy 82, 113–182, https://doi.org/10.1016 /S0065-2113(03)82003-5.
Dörner, J., Dec, D., Thiers, O., Paulino, L., Zúñiga, F., Valle, S., Martínez, O., Horn, R. (2016): Spatial and temporal variability of physical properties of Aquands under different land uses in southern Chile. Soil Use and Management 32, 411–421, https://doi.org/10.1111 /sum.12286.
Dörner, J., Dec, D., Peng, X., Horn, R. (2010): Effect of land use change on the dynamic behaviour of structural properties of an Andisol in southern Chile under saturated and unsaturated hydraulic conditions. Geoderma 159, 189–197, https://doi.org/10.1016 /j.geoderma.2010.07.011.
FAO (2002): Captura de carbono en los suelos para un mejor manejo de la tierra. Organización de las naciones unidas para la agricultura y la alimentación (In Spanish).
Flórez, M., Parra, L. (2001): Genesis de suelos y paleosuelos andicos a partir del estudio de pedocomponentes. Revista Facultad de Ingeniería 22, 50–66 (In Spanish).
Franzluebbers, A. J. (2002): Soil organic matter stratification ratio as an indicator of soil quality. Soil and Tillage Research 66(2), 95–106, https:// doi.org/10.1016/S0167-1987(02)00018-1.
Franzluebbers, A. J. (2010): Depth distribution of soil organic carbon as a signature of soil quality, 19th World Congress of Soil Science, Soil Solutions for a Changing World, 1–6 August 2010, Brisbane, Australia, Published on DVD 1.
Goidts, E., Van Wesemael, B., Crucifix, M. (2009): Magnitude and sources of uncertainties in soil organic carbon (SOC) stock assessments at various scales. European Journal of Soil Science 60(5), 723–739, https:// doi.org/10.1111/j.1365-2389.2009.01157.x.
Hofstede, R., Segarra, P., Mena, P. (eds.) (2003): Los paramos del Mundo. Quito: Global Proyecto Atlas Mundial de los Paramos, Peatland Initiative – NC-IUCN – EcoCiencia, Quito (In Spanish).
IGAC (2000): Estudio general de suelos y zonificación de tierras del departamento de Cundinamarca. Instituto Geografico Agustin Codazzi, IGAC, Bogota D.C. (In Spanish).
Jenny, H. (1950): Causes of the high nitrogen and organic matter content of certain tropical forest soils.
Soil Science 69(1), 63–70, https://doi.org/10.1097 /00010694-195001000-00005.
Jobbagy, E. G., Jackson, R. B. (2000): The vertical distribution of soil organic carbon and its relation to climate and vegetation. Ecological Applications 10, 423–436, https://doi.org/10.1890/1051-0761 (2000)010[0423:TVDOSO]2.0.CO;2.
Kim, N., Knorr, W., Kim, S. (2004): Appropriate measures for conservation of terrestrial carbon stocks: Analysis of trends of forest management in Southeast Asia. Forest Ecology and Management, 191, 283–299, https:// doi.org/10.1016/j.foreco.2003.12.019.
Loaiza-Usuga, J. C., Rodríguez, J. A., Ramírez, M. V., Lema, A. (2010): Estimation of biomass and carbon stocks in plants, soil and forest floor in different tropical forests. Forest Ecology and Management 260, 1906–1913, https://doi.org/10.1016/j.foreco.2010.08.040.
Loaiza-Usuga, J. C., León-Pelaez, J. D., Gonzalez-Hernandez, M. I., Gallardo-Lancho, J. F., Osorio-Vega, W., Correa-Londoño, G. (2013): Alteration in Litter decomposition pattern in tropical montane forest of Colombia: Oak forests contrasted with coniferous plantations. Canadian Journal of Forest Research 43(6), https:// doi.org/10.1139/cjfr-2012-0438.
Mora, J. L., Guerra, J. A., Armas-Herrera, C. M., Arbelo, C. D., Rodríguez-Rodríguez, A. (2014): Storage and depth distribution of organic carbon in volcanic soils as affected by environmental and pedological factors. Catena 123, 163–175, https://doi.org/10.1016/j.catena.2014.08.004.
Nanzyo, M. (2002): Unique properties of Volcanic Ash Soils. Global Environmental Research 6(2), 99–112.
Nanzyo, M., Shoji, S., Dahlgren, R. (1993): Volcanic Ash Soils: Physical characteristics of volcanic ash soils. Developments in Soil Science 21, 189–208, https:// doi.org/10.1016/S0166-2481(08)70268-X.
Parras-Alcantara, L., Lozano-García, B., Brevik, E. C., Cerda, A. (2015): Soil organic carbon stocks assessment in Mediterranean natural areas: A comparison of entire soil profiles and soil control sections. Journal of Environmental Management 155, 219–228, https:// doi.org/10.1016/j.jenvman.2015.03.039.
Peña-Ramírez, V. M., Vazquez-Selem, L., Siebe, C. (2009): Soil organic carbon stocks and forest productivity in volcanic ash soils of different age (1835–30,500 years B.P.) in Mexico. Geoderma 149, 224–234, https:// doi.org/10.1016/j.geoderma.2008.11.038.
Pla, I. (1990): Methodological problems to evaluate soil physical degradation. Trans. 14th Int. Congress of Soil Sci. Soc. Kyoto (Japan), 1, 95–100.
Post, W. M., Kwon, K. C. (2000): Soil carbon sequestration and land-use change: Processes and potential. Global Change Biology 6(3), 317–327, https:// doi.org/10.1046/j.1365-2486.2000.00308.x.
Sa, J. C. De, M., Lal, R. (2009): Stratification ratio of soil organic matter pools as an indicator of carbon sequestration in a tillage chronosequence on a Brazilian Oxisol. Soil and Tillage Research 103(1), 46–56, https://doi.org/10.1016/j.still.2008.09.003.
Saiz, G., Wandera, F. M., Pelster, D. E., Ngetich, W., Okalebo, J. R., Rufino, M. C., Butterbach-Bahl, K. (2016): Long-term assessment of soil and water conservation measures (Fanya-juu terraces) on soil organic matter in South Eastern Kenya. Geoderma 274, 1–9, https:// doi.org/10.1016/j.geoderma.2016.03.022.

Soils and land use in the study of soil organic carbon 23
Schrumpf, M., Schulze, E. D., Kaiser, K., Schumacher, J. (2011): How accurately can soil organic carbon stocks and stock changes be quantified by soil inventories? Biogeosciences 8(5), 1193–1212, https:// doi.org/10.5194/bg-8-1193-2011.
Scott, N. A., Tate, K. R., Giltrap, D. J., Tattersall Smith, C., Wilde, R. H., Newsome, P. F., Davis, M. R. (2002): Monitoring land-use change effects on soil carbon in New Zealand: quantifying baseline soil carbon stocks. Environmental Pollution 116, 167–186, https:// doi.org/10.1016/S0269-7491(01)00249-4.
Shoji, S., Dahlgren, R., Nanzyo, M. (1993): Volcanic Ash Soils: Genesis of volcanic ash soils. Developments in Soil Science 21, 37–71, https://doi.org/10.1016 /S0166-2481(08)70264-2.
SSS (2014): Keys to Soil Taxonomy, Twelfth Edition, United States Department of Agriculture (USDA), Natural Resources Conservation Service (NRCS).
SSS (2004): Soil Survey Laboratory Methods Manual, Rebecca Burt ed., USDA-NRCS Government Printing Office Washington D.C.
SSS (1993): Soil survey manual (Tech. Rep. No 18) Washington, DC: Soil Survey Division Staff, Soil Conservation Service, US Department of Agriculture.
Tonneijck, F. H., Jongmans, A. G. (2008): The influence of bioturbation on the vertical distribution of soil organic matter in volcanic ash soils: a case study in northern Ecuador. European Journal of Soil Science 59, 1063–1075, https://doi.org/10.1111/j.1365-2389 .2008.01061.x.
Walling, D. E., Fang, D. (2003): Recent trends in the suspended sediment loads of the world’s rivers. Global and Planetary Change 39(1–2), 111–126, https:// doi.org/10.1016/S0921-8181(03)00020-1.
Wang, S., Wang, X., Ouyang, Z. (2012): Effects of land use, climate, topography and soil properties on regional soil organic carbon and total nitrogen in the Upstream Watershed of Miyun Reservoir, North China. Journal of Environmental Sciences 24(3), 387–395, https:// doi.org/10.1016/S1001-0742(11)60789-4.
Yoo, K., Amundson, R., Heimsath, A. M., Dietrich, W. E. (2006): Spatial patterns of soil organic carbon on hillslopes: Integrating geomorphic processes and the biological C cycle. Geoderma 130(1–2), 47–65, https://doi.org/10.1016/j.geoderma.2005.01.008.
Zhang, F., Wang, X., Guo, T., Zhang, P., Wang, J. (2015): Soil organic and inorganic carbon in the loess profiles of Lanzhou area: implications of deep soils. Catena 126, 68–74, https://doi.org/10.1016/j.catena.2014.10.031.
24 Original Article
Inoculation with a soil fungus accelerates decomposition of avocado cv. Hass leaf litter in three plantations in ColombiaÁlvaro Tamayo-Vélez1, Guillermo Correa-Londoño2, Nelson Walter Osorio3,*
1 Colombian corporation for agricultural research, AGROSAVIA, Colombia2 Universidad Nacional de Colombia, Sede Bogotá, Agricultural Sciences Faculty, Bogotá, Colombia3 Universidad Nacional de Colombia, Science Faculty, Bogotá, Colombia* Corresponding author: [email protected]
ABSTRACTThe objective of this study was to evaluate the effect of a fungal inoculation on the litter decomposition in three plantations of avo-cado (Persea americana) cv. Hass in Colombia at different altitudes (Támesis 1340 m, Jericó 1900 m, and Entrerríos 2420 m). These processes are key in the proper functioning of soil biogeochemical cycles. The litter was either uninoculated or inoculated with the fungus Mortierella sp., then transferred into litter bags and finally deposited in the field sites where remained for 430 days. Residual dry matter (RDM) and nutrient content was monitored overtime. Five regression models of litter decomposition were employed: single, double, and triple exponential models and two continuous models. Although, all models properly fitted the data variation, the double exponential was the most effective based on regression parameters (mean square error and Akaike index). In all three sites the rate of decomposition was higher when the litter was inoculated with the fungus. Thus, the RDM was significantly lower when the litter was inoculated with Mortierella sp. At day 430, the uninoculated RDM in Tamesis, Jerico, and Entrerrios was 0.48, 0.47, and 0.50, respectively; while the inoculated RDM was 0.47, 0.44, and 0.46, respectively. The rate of decomposition followed the decreasing sequence: Jericó > Támesis > Entrerríos. The nutrient release pattern was: K > Ca > Mg > N > P > Cu > Mn > Zn > Fe. While K was rapidly released, Ca, Mg, and N were slowly released; P, Cu, Mn, Zn, and Fe were immobilized during the decomposition process. However, fungal inoculation on the litter significantly reduced the magnitude of nutrient accumulation for P, Mg, S, Mn, and Zn. This effect was variable overtime and among sites. Litter N and P contents and the N:P ratio were good indicators of the decaying process.
KEYWORDSPersea americana; litter bags; litter decomposition; nutrient cycling
Received:16 August 2018Accepted: 10 March 2019Published online: 17 May 2019
Tamayo-Vélez, Á., Correa-Londoño, G., Osorio, N. W. (2019): Inoculation with a soil fungus accelerates decomposition of avocado cv. Hass leaf litter in three plantations in Colombia. AUC Geographica 54(1), 24–36https://doi.org/10.14712/23361980.2019.3
© 2019 The Authors. This is an open-access article distributed under the terms of the Creative Commons Attribution License (http://creativecommons.org/licenses/by/4.0).

Fungal inoculation on the litter decomposition of avocado 25
1. Introduction
In the last decade, avocado (Persea americana) cv. Hass fruit production is a growing agroindustry in Colombia as an alternative to traditional crops. This crop has been receiving great attention due to the profit margins that this generates and promising export expectations (Bernal and Diaz 2014). Avoca-do cv. Hass has been introduced from California and Mexico to the highlands in Colombia where the mod-erate temperature (16–18 °C) favors its yield and fruit quality. This is a new crop in the country and little is known about its management. It has been noticed that it produces a lot of leaf litter (Tamayo 2016); however, the litter decomposition seems to be slow likely due to low temperatures and perhaps lack of microorganisms capable of accelerating the process. The litter decomposition is a key process in this sys-tem because soil fertility and soil’s nutrient holding capacity is too low.
Litter decomposition is the set of physical and chemical processes by which this is reduced in its basic chemical constituents (Aert 1997). It is also the most important process of nutrient recycling in any ecosystem (Wang et al. 2008; Castellanos and Leon 2011), as by the decomposition of litter, nutrients become available to plants. This process regulates the amount and biochemical content of organic matter produced in an ecosystem (Aber and Melillo 1991) and is responsible for the formation of humic sub-stances that contribute to soil quality/fertility (Berg and McClaugherty 2008; Versini et al. 2014). Litter decomposition is controlled by three main factors: climate, leaf litter quality, and abundance of degrada-tive organisms (Swift et al. 1979; Lavelle et al. 1993; Coûteaux et al. 1995; Aerts 1997; Rocha-Loredo and Ramírez-Marcial 2009; Lorenzo and Rodríguez-Ech-everría 2015).
The use of biofertilizers to promote plant growth and nutrient uptake is gaining attention because it is effective and environment friendly (Osorno and Oso-rio 2015). Among the functions of some biofertilizers are: nitrogen fixation, mineral dissolution (particular-ly phosphate compounds), plant root promotion, myc-orrhizal association, and organic matter decomposi-tion (Afanandor 2017). Unfortunately, little has been studied about the use of biofertilizers in tropical envi-ronments and lesser associated to litter decaying. The
soil fungus Mortierella sp. has been used as a biofer-tilizer to promote plant growth and nutrient uptake given its ability to dissolve minerals (via organic acid production) and decompose organic matter (via cellu-lase and phosphatase enzymes) (Alvarez et al. 2013). In a recent study with this fungus some soil fertility parameters were enhanced when the avocado litter was inoculated with it (Tamayo and Osorio 2018).
The processes of leaf litter decomposition have been studied extensively in tropical and subtrop-ical ecosystems (Heneghan et al. 1998; Pandey et al. 2007), semiarid (Tateno et al. 2007), temperate (Magill and Aber 2000; Cookson et al. 2007) and in Mediterranean conditions (Moro and Domingo 2000; Ribeiro et al. 2002). However, studies on rates of leaf litter decomposition and nutrient release in crops in tropical environments are less frequent are the stud-ies in which microbial inoculation is directly involved. One of the main factors that control air and soil tem-perature is the altitude and since plantations of avo-cado cv. Hass have been established at different alti-tudes from 1300 to 2500 m (Bernal and Diaz 2014), this condition may affect the soil microbial activity and consequently the rate of litter decay. Therefore, we consider that this factor should be considered. Our hypothesis in this study is that the fungal inocu-lation of leaf litter accelerates its decomposition rate and increases nutrient release. Therefore, the aim of this study was to determine the effect of inoculation with the soil fungus Mortierella sp. on the decom-position of avocado cv. Hass leaf litter and nutrient release in three plantations with contrasting altitude in Colombia.
2. Materials and methods
2.1 Experimental sitesThe study was conducted in three 5-yr-old plantations of avocado cv. Hass in Colombia with contrasting alti-tude. The trees were grafted on Antillean rootstocks grown in three production zones in the department of Antioquia, Colombia (Tamesis, Jericó and Entrerríos) (Table 1). The distance among trees was 5 × 7 m (285 trees ha−1). Automated meteorological stations (SpecWare 9 Pro®, Spectrum Technologies Inc., ver-sion 9.03 Build 0240) were established in these sites (Table 1). Soil fertility tests were performed in surface
Tab. 1 Description of the sites where leaf litter production was evaluated.
Site Altitude (m)
Annual mean temperature (°C)
Annual rainfall (mm)
Annual mean air humidity (%) Sunshine (h) Ecological life
zone*USDA soil taxonomy
(2014)**
Támesis 1350 23 1900 85 1726 PMF Ultic Melanudand
Jericó 1900 18 2500 85 2430 PWF Typic Hapludand
Entrerríos 2420 16 1900 83 1684 LMMF Ultic Melanudand
* PMF: premontane moist forest; PWF: premontane wet forest, LMMF: lower montane moist forest (Holdrige, 1967)** Soil profiles were described and classified by Professor Juan Carlos Loaiza, Universidad Nacional de Colombia

26 Álvaro Tamayo-Vélez, Guillermo Correa-Londoño, Nelson Walter Osorio
samples (0–20 cm) collected at random in the root area of 15 trees per site. These tests were carried out in the Soil Fertility Laboratory of the Universidad Nacional de Colombia at Medellín (Table 2). Details for the methods are available in the Soil Survey Staff (2014)
2.2 Leaf litter material In each experimental site, some senescent leaves were collected at random from 5-year-old avocado trees cv. Hass and then a sample was oven-dried at 60 °C until reaching constant dry mass and analyzed for initial nutrient content in the Laboratory of Soil Chemistry Soil and Plant Tissue of CORPOICA. The methods are described in Westermann (1990).
2.3 TreatmentsSamples of dried senescent leaves (10 g per sample) were either uninoculated or inoculated with the soil fungus Mortierella sp. This fungus was obtained from the microbial collection of the Laboratory of Ecolo-gy and Environmental Conservation of the Universi-dad Nacional de Colombia at Medellín. This fungus is capable of decompose organic materials via enzyme activity (e.g., cellulase and phosphatase) (Álvarez et al. 2013). To this purpose, the fungus was aseptically multiplied in yeast-mannitol-agar (YMA) medium for 5 days at 25 °C. After this time, spores and mycelia were suspended aseptically in sterile distilled water at a density of 107 colony forming units (CFU) per ml. Senescent leaves were inoculated by spraying them at a rate of 2.5 ml of fungal suspension per 10 g (dry base) of leaves. Uninoculated leaves were sprayed with 2.5 ml of sterile distilled water.
An aliquot of 10-g (dry base) of avocado leaves (either inoculated or uninoculated) were trans-ferred into litter plastic bags (20 × 20 cm, mesh size 1 × 1 mm) to measure its decomposition based on the mass loss over time (Montagnini et al. 1991). The lit-ter bag allows access of detritivores invertebrates to the inside of the bags, but minimizes fragmentation losses (Douce and Crossley 1982).
In each site (Jericó, Tamesis, and Entrerríos), 50 bags (25 uninoculated and 25 inoculated) were randomly distributed on the soil surface around the trees and held by staples to prevent their lost by rodents or by runoff. Senescent leaves used in each site corresponded to the same site.
2.4 VariablesFive collections were made at 30, 90, 130, 330, and 430 days after treatment, covering this way a peri-od of nearly 15 months. After each withdrawal, the bags were transported to the laboratory and the leaf litter contents were manually washed with distilled water to remove soil and roots adhered. Then, the residual leaf litter contained in the bags was dried at 60 °C, until reaching constant dry mass. Finally, sam-ples were weighed (residual dry matter – RDM) and then grounded for analyzing elemental concentration. N content was measured by the Kjeldhal method. Sam-ples were subjected to a closed digestion with nitric acid : hydrogen peroxide : water (5 : 1 : 2). Then, Ca, Mg, K, Fe, Mn, Cu, and Zn concentrations were meas-ured with an atomic absorption spectrophotometer; P concentration was measured by the molybdate blue method with an visible-light spectrophotometer.
Residual contents of nutrients at each time were calculated by the product of the RDM × nutrient con-centration divided by this product at the moment of inoculation (day 0). Pearson correlation coefficients were obtained to determine the relationship between RDM and some factors such as total rainfall and litter parameters (N, P, and N:P ratio).
Finally, the presence of Mortierella sp. In the lit-ter samples was determined at the end of the study. Briefly, 1 g of litter sample from each bag was sus-pended in 9 ml of sterile distilled water to generate a 10−1 dilution, and then 10−2 and 10−3 serial dilu-tions were also obtained. From the last two dilutions, 100 µl were aseptically transferred into petri dishes containing YMA medium (Yeast-Mannitol-Agar). The medium contained two antibiotics [streptomycin sul-fate 500 mg l−1 and tetracycline 0.1 mg l−1] and two fungicides [benomyl 75 mg l−1 and cycloheximide 100 mg l−1) based on the method developed by Osorio and Habte (2013).Then, Petri dishes were incubated at 28 °C for 48 h; after that, the number of fungal col-onies was recorded.
2.5 Data analysisAnalyses of variance were performed to evaluate the effects of the inoculation, time and location on the variables. Changes of leaf litter RDM as a function of time were evaluated in each site with five regression models: single, double and triple exponential discon-tinuous models (Berg and McClaugherty, 2008) (D1,
Tab. 2 Soil chemical properties in the three experimental sites.
Site pH SOM Al Ca Mg K Na P S Fe Cu Mn Zn B
g kg −1 cmolc kg −1 mg kg −1
Támesis 4.8 284 2.4 1.2 0.6 0.25 0.05 8 7 58 2 5 20 0.2
Jericó 5.0 132 1.7 2.4 0.9 0.37 0.01 13 43 115 2 6 4 0.1
Entrerríos 5.4 258 1.6 3.4 4.8 0.76 0.16 20 43 177 16 49 7 2.1
Soil pH (water, 1 : 1); soil organic matter (SOM) content by Walkley and Black method; Al extracted by 1 M KCl; Ca, Mg, K, and Na extracted by 1 M ammonium acetate; P extracted by Bray II; S extracted by 0.008 M calcium phosphate; Fe, Mn, Cu, and Zn extracted by Olsen-EDTA; B extracted by hot water.

Fungal inoculation on the litter decomposition of avocado 27
D2, and D3, respectively) and two continuous models (C1 and C2, see results). The D1 model assumes a sin-gle compartment of all organic matter under a sin-gle constant of decomposition, k (Olson 1963). The D2 model is a derivation from the single exponential model, but it assumes that the leaf litter substrate has two compartments (labile and recalcitrant) and two decomposition constants (k1 and k2) (Bunnell and Tait 1974). The D3 model is based on the assumption that the substrate litter has three compartments (labile, metastable, and recalcitrant) with three different decomposition constants (k1, k2, and k3) (Coûteaux et al. 1995). The models of continuous decomposition (C1 and C2) were proposed by Tarutis (1994) and Manzoni et al. (2012).
Using the D1 model, the time required to decom-pose 50 and 99% of the leaf litter were calculated as follows: t0.5 = LN 0.5/k and t0.99 = LN (1–0.99)/k. The time t0.99 is used to provide an approximation of the time needed to clear almost all leaf litter, since the negative exponential model describes a curve that tends asymptotically to zero.
Similarly, the mean permanence time (Tp) was estimated as the inverse of k , this is Tp = 1/k (Olson 1963; Waring and Schlesinger1985; Songwe et al. 1995; Perez-Harguindeguy et al. 2013).
To find the model that fit the best, three indicators were employed: coefficient of determination (R2), mean square error (MSE), and the Akaike Informa-tion Criterion (AIC). Models D1 and D2 and C1 were fit using SAS program (Statistical Analysis System, version 9.0), model C2 was fit using MATLAB (Math-works, Natick, Massachusetts).
3. Results
3.1 Residual dry matterThe RDM was significantly affected by the factors site, time, inoculation and by the interaction site x time x inoc-ulation (Table 3A). For instance, the initial loss of RDM at day 30 (RDM90) was faster in Tamesis (0.79–0.81) and Jericó (0.78–0.85) and slower in Entrerríos (0.89) (Fig. 1). This tendency was maintained until the end when RDM430 was 0.49 in Tamesis, 0.42–0.48 in Jericó, and 0.46–0.51 in Entrerríos. In general, the values of RDM were lower when the leaf litter was inoculated than when was uninoculated (Fig.1). This effect was more significant in Tamesis at day 90 (0.71 uninoc-ulated vs. 0.63 inoculated), in Jericó at days 30 (0.85 uninoculated vs. 0.78 inoculated) and 430 (0.48 unin-oculated vs. 0.42 inoculated), and in Entrerríos at day 430 (0.51 uninoculated vs. 0.46 inoculated).
Although all regression models exhibited highly significant P-values (<0.0001), the values of R2 were consistently lower with the single exponential model (Table 4). In general, the double exponential model
showed values of R2 higher, MSE lower, and AIC lower than the other models. For this reason, this model can be considered the most effective to fit the data and represent satisfactorily the dynamics of mass loss of avocado leaf litter in all three sites.
Fig. 1 Residual dry matter (RDM) of leaf litter avocado cv. Hass uninoculated (□) and inoculated (▪) with the fungus Mortierella sp. as a function of time in three sites of Colombia. Each value is the mean of five replicates. The bars indicate the standard error.
0,0
0,2
0,4
0,6
0,8
1,0
0 90 180 270 360 450
Resi
dual
dry
matt
er
Time (days)
(A) TámesisUninoculated
Inoculated
0,0
0,1
0,2
0,3
0,4
0,5
0,6
0,7
0,8
0,9
1,0
0 90 180 270 360 450
Resi
dual
dry
matt
er
Time (days)
(B) Jericó Uninoculated
Inoculated
0,0
0,1
0,2
0,3
0,4
0,5
0,6
0,7
0,8
0,9
1,0
0 90 180 270 360 450
Resi
dual
dry
matt
er
Time (days)
(C) EntrerríosUninoculated
Inoculated
28 Álvaro Tamayo-Vélez, Guillermo Correa-Londoño, Nelson Walter Osorio
3.2 Residual nutrient contentThe residual nutrient contents were significantly affected by the single factors site and time, and by the interaction site x time (except for Fe) (Table 3A, 3B). On the other hand, the single effect of inoculation on Mn residual content was significant. Also, significant interactive effects of site x inoculation affected P and Zn residual contents; time x inoculation significantly affected Mg, S, and Zn residual contents. On the other hand, site x time x inoculation affected significantly P and Zn residual nutrient contents (Table 3A, 3B). The coefficients of variation (CV) were low for all macro-nutrients (<30%) and high for all micronutrients (30–60%).
The residual contents for all macronutrients, except P, showed a tendency to decrease over time (Table 5). According to the residual contents at day 430, the relative release of macronutrients followed the following pattern: K (0.02–0.03) > Mg (0.3–0.4) > Ca (0.3–0.53) > N (0.64–0.74) >> P (2.1–4.3).
It is worthy to mention that release of K was very rapid, at day 30 the residual K contents were only 0.18, 0.15, and 0.21 in Tamesis, Jericó, and Entrerríos, respectively. This indicates that the relative release of K contained in the leaf litter of avocado was 82, 85, and 79% at the end of the first month of decomposition. The release continued during the period of observa-tion, thus at day 430 this was between 97–98%. In the case of N, its release was slower and seemed to be irregular. In intermediate sampling dates (130–330 d) occurred an apparently stabilization phase because the values increased with respect to previous values.
In all three sites, the tendency for the residual P content was to increase overtime (Table 5A). At day 430, in Tamesis, Jericó, and Entrerríos the values were 2.09, 4.33, and 2.69, respectively, which suggested an apparent process of P immobilization or even gain. This was detected from the initial stages of decompo-sition, for instance at day 30 the values already were 1.51, 2.55, and 2.48, respectively. However, this effect was lower in Tamesis and Jericó when the litter was inoculated, particularly at the beginning of the decay-ing process (<90 d).
In the case of Mg, there was an accumulation over time, but this had a lower magnitude when the litter was inoculated, particularly after 130 d. There was also accumulation of sulfur in the litter over time, but this effect was lower when the litter was inoculated.
All microelements also exhibited significant increases in the residual content in the leaf litter of avocado (Table 5B). For instance, at day 430 the value for Fe-residual ranged 100–171, Zn 18–58, Mn 7–14, and Cu 1–6; significant differences were detected among sites. These results clearly suggest that there was a gain in the content of these micronutrients. In the case of Fe and Zn the increase was higher over time, while with Mn and Cu there were higher values in intermediate dates (90–330 d). The inoculation with the fungus changed the pattern of accumulation. For instance, the quantity of Mn accumulated was lower when the litter was inoculated; in the case of Zn, there were less accumulation at the beginning of the decomposition process (<90 d) in Tamesis and Entrerrios and along the process in Jerico.
Tab. 3A Significant P-values for Anova’s tests of RDM and macronutrient contents.
Factor Degree of fredom RDM N P K Ca Mg S
Site (A) 2 <0.0001 <0.0001 <0.0001 <0.0001 <0.0001 <0.0001 0.0261
Time (B) 5 <0.0001 <0.0001 <0.0001 <0.0001 <0.0001 <0.0001 <0.0001
Inoculation (C) 1 <0.0001 NS NS NS NS NS NS
AB 10 <0.0001 <0.0001 <0.0001 <0.0001 <0.0001 <0.0001 <0.0001
AC 2 NS NS 0.0371 NS NS NS NS
BC 5 NS NS NS NS NS <0.0001 0.0010
ABC 10 0.0435 NS 0.0047 NS NS NS NS
CV (%) 5.0 14.1 27.6 17.3 14.4 10.3 25.0
Tab. 3B Significant P-values for Anova’s tests of micronutrient contents.
Factor Fe Mn Zn Cu
Site (A) <0.0001 <0.0001 <0.0001 <0.0001
Time (B) <0.0001 <0.0001 <0.0001 <0.0001
Inoculation (C) NS 0.0084 NS NS
AB NS <0.0001 0.0002 0.0003
AC NS NS 0.0005 NS
BC NS NS 0.0254 NS
ABC NS NS 0.0067 NS
CV (%) 56 30 55 60

Fungal inoculation on the litter decomposition of avocado 29
Tab. 4 Regression models for RDM of leaf litter avocado cv. Hass uninoculated (−) and inoculated (+) with the fungus Mortierella sp. as a function of time in three sites of Colombia.
Site Inoculation Regression models P-value R2* MSE AIC
Támesis
− Xt/Xo = e−0.7627t <0.0001 68.3 0.097 −136.9
+ Xt/Xo = e−0.8788t <0.0001 49.8 0.129 −119.7
− Xt/Xo = 0.226e−17.1301 + 0.774e−0.3861t <0.0001 96.6 0.033 −200.1
+ Xt/Xo = 0.363e−9.913 + 0.637e−0.229t <0.0001 95.9 0.039 −190.5
− Xt/Xo = 0.226e−17.1265 + 0.431e−0.3861t + 0.343e−0.3861t <0.0001 96.6 0.033 −200.1
+ Xt/Xo = 0.280e−9.9421 + 0.637e−0.2293t + 0.083e−9.9421t <0.0001 95.9 0.039 −190.5
− Xt/Xo = 0.059−0.780/(0.059 + t)0.780 <0.0001 95.6 0.038 −119.9
+ Xt/Xo = 0.031−0.833/(0.031 + t)0.833 <0.0001 95.3 0.041 −186.9
− Xt/Xo = 29.082e−0.0063t − 0.0063e−29.082t [Ei(−29.082t) − Ei(−0.0063t)]0.1832t/29.076 <0.0001 95.7 0.036 −193.9
+ Xt/Xo = 54.4878e−0.0059t − 0.0063e−54.488t [Ei(−54.488t) − Ei(−0.0059t)]0.3215t/54.172 <0.0001 95.2 0.041 −187.0
Jericó
− Xt/Xo = e−0.781t <0.0001 76.8 0.089 −142.0
+ Xt/Xo = e−0.913t <0.0001 74.6 0.097 −136.9
− Xt/Xo = 0.238e−9.4071 + 0.762e−0.3963t <0.0001 94.6 0.045 –181.7
+ Xt/Xo = 0.221e−24.0382 + 0.779e−0.514t <0.0001 97.6 0.031 −204.2
− Xt/Xo = 0.238e−9.4438 + 0.423e−0.3965t + 0.338e−0.3965t <0.0001 94.6 0.045 −181.7
+ Xt/Xo = 0.169e−11.8918 + 0.335e−t + 0.497e−1.3523t <0.0001 97.8 0.029 −206.6
− Xt/Xo = 0.119−0.701/(0.119 + t)0.701 <0.0001 94.3 0.046 −180.1
+ Xt/Xo = 0.080−0.714/(0.080 + t)0.714 <0.0001 96.3 0.038 −190.9
− Xt/Xo = 16.072e−0,0167t − 0.0167e−16.0722t − [Ei(−16.072t) − Ei(−0.0167t)]0.0.25715t/16.072 – 00.167 <0.0001 94.3 0.045 −181.0
+ Xt/Xo = 25.746e−0.0177t − 0.0177e−25.7458t − [Ei(−25.746t) − Ei(−0.0177t)]0.4570t/25.748 <0.0001 96.5 0.037 −193.1
Entrerríos
− Xt/Xo = e−0.691t <0.0001 87.2 0.062 −164.3
+ Xt/Xo = e−0.732t <0.0001 93.8 0.047 −180.1
− Xt/Xo = 0.124e−13.8325 + 0.876e−0.4532t <0.0001 95.0 0.040 −188.1
+ Xt/Xo = 0.112e−13.4596 + 0.888e−0.558t <0.0001 98.5 0.024 −219.6
− Xt/Xo = 0.333e−0.4532 + 0.543e−0.4532t + 0.124e−13.8637t <0.0001 95.0 0.040 −188.1
+ Xt/Xo = 0.112e−13.4199 + 0.555e−0.558t + 0.333e−0.558t <0.0001 98.5 0.024 −219.6
− Xt/Xo = 0.301−0.599/(0.301b + t)0.599 <0.0001 94.0 0.044 −182.9
+ Xt/Xo = 0.475−0.401/(0.475 + t)0.401 <0.0001 98.1 0.027 −211.3
− Xt/Xo = 7.1786e−0.0235t – 0.0235e−7.1786t − [Ei(−7.1786t) − Ei(−0.0235t)]0.1686971t/7.1551 <0.0001 93.9 0.043 −183.6
+ Xt/Xo = 5.5686e−0.0579t − 0.0579e−5.5686t − [Ei(−5.569t) − Ei(−0.0579t)]0.32242t/5.569 <0.0001 98.0 0.027 −211.8
*R2: Coefficient of determination; MSE: Mean Square Error; AIC: Akaike Information Criterion (1974).

30 Álvaro Tamayo-Vélez, Guillermo Correa-Londoño, Nelson Walter Osorio
The contrasting dynamics for some nutrients can be summarized in Table 6. In the case of litter K concen-tration, the final value (430 d = mean 0.04%) was low-er than the initial value (mean 0.50%), a clear exam-ple of release. With N there was an immobilization because at the end of the study the N concentration in
the leaf litter was higher (mean 2.22%) than the ini-tial concentration (mean 1.42%). In the case of P, the initial mean concentration was 0.04 and at the end it was 0.28, meaning a net gain. The initial values of the N:P ratio were very high (24.1–46.3), higher than the optimal suggested of 10–11 (Leon 2007).
Tab. 5A Residual macronutrient contents in leaf litter of avocado cv. Hass as a function on the decomposition time in three sites of Colombia. Each value is the mean of five replicates; in parenthesis the standard error. Means followed by a common letters do not significantly differ (P-value ≤0.05) (vertical comparisons).
Time(days)
Támesis Jericó Entrerríos
N P K Ca Mg N P K Ca Mg N P K Ca Mg
01.00*(0.03)a
1.00(0.01)k
1.00 (0.02)a
1.00 (0.04)a
1.00 (0.02)a
1.00(0.03)a
1.00 (0.01)k
1.00 (0.02)a
1.00 (0.04)a
1.00(0.02)a
1.00(0.03)a
1.00 (0.01)k
1.00 (0.02)a
1.00 (0.04)a
1.00 (0.02)a
300.91(0.03)ab
1.51(0.01)j
0.18 (0.02)c
0.87 (0.04)b
0.60(0.02)c
0.70(0.03)def
2.55 (0.01)ef
0.15 (0.02)d
0.88 (0.04)b
0.41(0.02)e
0.70(0.03)def
2.48 (0.01)f
0.21 (0.02)b
0.93 (0.04)ab
0.70 (0.02)b
900.77(0.03)cde
1.59(0.01)ij
0.14 (0.02)d
0.67 (0.04)c
0.50(0.02)d
0.76(0.03)de
2.92 (0.01)d
0.09 (0.02)e
0.62 (0.04)c
0.37(0.02)ef
0.71(0.03)def
2.27 (0.01)g
0.12 (0.02)bc
0.80 (0.04)b
0.50 (0.02)d
1300.80(0.03)bcd
1.73(0.01)i
0.10 (0.02)de
0.63 (0.04)c
0.40(0.02)e
0.87(0.03)g
3.82 (0.01)b
0.09 (0.02)ef
0.50 (0.04)d
0.35(0.02)ef
0.73(0.03)def
2.97 (0.01)d
0.13(0.02)bc
0.80 (0.04)b
0.40 (0.02)e
3300.88(0.03)b
1.91(0.01)h
0.04 (0.02)ef
0.57 (0.04)cd
0.40(0.02)e
0.58(0.03)efg
3.55 (0.01)c
0.04 (0.02)fg
0.40 (0.04)e
0.30(0.02)f
0.75(0.03)de
2.95 (0.01)d
0.05 (0.02)ef
0.60 (0.04)c
0.40 (0.02)e
4300.74(0.03)def
2.09(0.01)g
0.02 (0.02)fg
0.53 (0.04)d
0.40(0.02)e
0.67(0.03)a
4.33 (0.01)a
0.02 (0.02)g
0.30 (0.04)f
0.30(0.02)f
0.64(0.03)fg
2.69 (0.01)e
0.03 (0.02)fg
0.50 (0.04)d
0.30 (0.02)f
Tab. 5B Residual microelements contents in leaf litter of avocado cv. Hass as a function on the decomposition time in three sites of Colombia.
Time (days)
Támesis Jericó Entrerríos
Fe Cu Mn Zn Fe Cu Mn Zn Fe Cu Mn Zn
0 1*f
1f
1g
1e
1f
1f
1g
1e
1f
1cd
1g
1e
3051(14)de
15 (3.9)bc
11 (1.4)cd
13 (9.1)bc
51(14)de
4(3.9)ef
7 (1.4)f
16(9.1)de
17(14)f
14(3.9)bc
12(1.4)bcd
9(9.1)de
9080(14)cd
17(3.9)bc
11 (1.4)cd
15(9.1)bc
67(14)cd
6(3.9)ef
8 (1.4)ef
15(9.1)de
22 (14)ef
8(3.9)cd
15(1.4)ab
13(9.1)de
13081(14)cd
17(3.9)bc
10 (1.4)d
20(9.1)b
135(14)ab
6(3.9)ef
8 (1.4)ef
33(9.1)c
16 (14)ef
13(3.9)bc
11(1.4)ab
13(9.1)de
330126(14)b
21(3.9)ab
16 (1.4)a
50(9.1)a
174(14)a
5(3.9)ef
8 (1.4)ef
41(9.1)bc
105(14)bc
24(3.9)a
13(1.4)abc
17(9.1)de
430138(14)ab
5(3.9)f
14 (1.4)ab
58(9.1)a
171(14)a
6(3.9)f
7 (1.4)f
46(9.1)abc
100(14)bc
1(3.9)cd
10(1.4)de
18(9.1)d
* Each value is the mean of five replicates; in parenthesis the standard error. Means followed by common letters do not significantly differ (P-value ≤ 0.05) (vertical comparisons).

Fungal inoculation on the litter decomposition of avocado 31
Tab. 6 Initial and final (430 d after inoculation) relevant quality parameters of leaf litter in avocado cv. Hass in three sites of Colombia. In parenthesis the standard errors.
Site N (%) P (%) K (%) N: P
Initial values
Támesis 1.69 (0.08) 0.07 (0.02) 0.44 (0.01) 24.1 (0.78)
Jericó 1.39 (0.08) 0.03 (0.02) 0.62 (0.01) 46.3 (0.78)
Entrerríos 1.19 (0.08) 0.03 (0.02) 0.45 (0.01) 39.7 (0.78)
Mean 1.42 (0.05) 0.04 (0.01) 0.50 (0.005) 36.7 (0.45)
Final values
Támesis 2.62 (0.08) 0.30 (0.02) 0.05 (0.01) 9.9 (0.78)
Jericó 2.00 (0.08) 0.28 (0.02) 0.03 (0.01) 7.1 (0.78)
Entrerríos 1.56 (0.08) 0.17 (0.02) 0.05 (0.01) 9.7 (0.78)
Mean 2.06 (0.05) 0.28 (0.01) 0.04 (0.005) 9.0 (0.45)
Although the best regression model was the dou-ble exponential, the single exponential model offers some parameters of easy visualization of the con-trasts detected in this study. For instance, in all three sites the decomposition rate (k) was higher when the leaf litter of avocado was inoculated (Tamesis: 0.88 > 0.76; Jericó 0.91 > 0.78; Entrerríos 0.73 > 0.69). Consequently, the mean residence time of the leaf litter was lower when it was inoculated (1.09–1.36) than when was uninoculated (1.28–1.44). In the same way, the time needed for decomposing half of the lit-ter (t0.5) was also lesser in the inoculated leaf litter: in Tamesis it was 10.9 months with uninoculated leaf litter and 9.5 months when inoculated; in Jer-icó, 10.7 months with uninoculated leaf litter and 9.1 months when inoculated; and in Enterríos, 12 months without inoculation and 11.4 months with inoculation.
4. Discussion
The results clearly support our hypothesis that the decomposition rate of avocado leaf litter can be increased with the inoculation of effective microor-ganisms. It was evident that in all three sites the mass loss in the RDM was higher when the leaf litter was inoculated with the fungus Mortierella sp. The unin-oculated RDM in Tamesis, Jerico, and Entrerrios at day 330 were 0.57, 0.55, and 0.60, respectively; while the inoculated RDM was 0.54, 0.48, and 0.54, respective-ly. At day 430 the values of uninoculated RDM were 0.48, 0.47, 0.50, while the values for inoculated RDM were 0.47, 0.44, and 0.46, respectively. This indicates that the rate of decomposition was higher when the litter was inoculated with Mortierella sp. In a previ-ous work, it was detected that this fungus is able to release cellulase and phosphatase enzymes (Álvarez et al. 2013).
The high rate of decomposition in the early stages of the process coincide with those reported by Berg
(2000), Goma-Tchimbakala and Bernhard-Reversat (2006) for Terminalia superba, Castellanos and León (2011) in plantations of Acacia mangium and Florez et al. (2013) in Azadirachta indica. The general pat-tern for mass loss during this process comprises two phases: an initial phase with a fast decomposition of labile materials (e.g., sugars, some phenols, starch-es, and proteins) and a second phase that results in a gradual (slow) decomposition of recalcitrant ele-ments (e.g., cellulose, hemicellulose, lignin, and tan-nins) (Arellano et al. 2004; Goma-Tchimbakala and Bernhard-Reversat, 2006; Weerakkody and Parkin-son 2006a). This rate of litter decomposition can vary depending on different factors such as soil humidity, soil temperature, soil nutrient availability, plant spe-cies, plant age, and litter concentrations of N and P, C:N and N:P ratios, lignin, tannins, etc.). The litter quality characteristics determine in turn the microbi-al biomass and nutrient release (Attiwill and Adams 1993; Bubb et al. 1998; McGrath et al. 2000; Kumar and Agrawal, 2001; Villela Proctor, 2002; Singh et al. 2004; Weerakkody and Parkinson, 2006a; Liao et al. 2006; Huang et al. 2007; Castellanos and Leon 2010; Aragon et al. 2014).
The rate of decomposition (k) of leaf litter among sites followed a decreasing order: Jericó ≥ Tamesis > Entrerríos. It is possible that these differences can be attributable to the environmental conditions of each site as microclimate, soil properties, and mainly the activity of soil biota (Swift et al. 1979; Attiwill and Adams 1993; Aerts and Chapin 2000; Leon 2007). According to the double exponential model for the three sites, a rapid degradation of labile materials occurred during the first 100 days, followed by a slow-er decomposition. These results differ from studies of Castellanos and León (2011), whose values of k indi-cate a more rapid degradation of the labile fractions. Differences in these decomposition rates suggest that affect the rate at which leaf litter nutrients become available for plant roots. Speed and efficiency with which the plant again uptake these nutrients depend on other soil process since them may be (i) leached out from the soil profile (e.g., NO3
−, K+), (ii) strong-ly adsorbed by soil clay and Fe-oxides (e.g., H2PO4
−, SO4
2−) or (iii) absorbed by soil biota (Schlesinger 2000; Ribeiro et al. 2002).
Values of k from 0.69 to 0.91 obtained in this study are similar to those reported in avocado (k = 0.90) on the coast of Granada Spain by Rodríguez et al. (2011) and Pleguezuelo et al. (2011) and in several forest species of Sri Lanka by Weerakkody and Par-kinson 2006b and in Andean forests of Colombia by Loaiza et al. (2013). The difference of k between Entrerríos (2420 m, 16 °C) and the other two sites, Jericó (1900 m, 18 °C) and Tamesis (1350 m, 23 °C) may be associated with the differences in altitude and climate conditions. It has been demonstrated the importance of soil and climate in the regulation of leaf litter decomposition (Berg 2000; Martin et al. 1996;
32 Álvaro Tamayo-Vélez, Guillermo Correa-Londoño, Nelson Walter Osorio
Gholz et al. 2000; Barlow et al. 2007; Cornwell et al. 2008).
In many studies it has been determined that the quality of the leaf litter also influences the decompo-sition (Xuluc-Tolosa et al. 2003; Ngoran et al. 2006; Martinez-Yerízar et al. 2007; Prause and Fernandez 2007; Castellanos and Léon 2011 Furey et al. 2014; Gaspar Santos et al. 2015). Among the indicators of litter quality are the litter content of N and P and the N:P ratio (Kainulainen and Holopainen 2002; Xuluc-Tolosa et al. 2003; Alhamd et al. 2004; Ngoran et al. 2006; Martinez-Yerízar et al. 2007; Prause and Fernandez 2007; Castellanos and Leon 2011; Nou-vellon et al. 2012 Pérez-Harguindeguy et al. 2013; Aragon et al. 2014; Furey et al. 2014). According to Budd et al. (1998) and Gallardo-Lancho (2000) the N and P concentrations showed a negative correlation with the residual dry matter (RDM) this indicates their participation in the leaf litter decomposition. It is important to highlight the limiting nature of P in these Andisols on the decay process and the low N supply from the soil humus. This could be corrob-orated by obtaining a significant inverse correlation between the decomposition constant (k) and the N:P ratio. This agrees with reports of some authors who claim that the N:P ratio exercises control over the decomposition (Flórez et al. 2013; Prescott 2005; Berg and Laskowski 1997). Aerts (1997) proposed the value 11.9 as critical in the leaf litter for the N:P ratio, which represents in tropical forests, some degree of shortage of P for decomposition organisms, as in the cells of fungi and bacteria such ratio is about 10–15. A low N:P ratio may be associated with larger populations of bacteria in the decomposition process (Güsewell and Gessner 2009).
In a study carried out by Castellanos and Léon (2011), in Acacia mangium plantations established on degraded soils in Colombia, litter N and P contents and the C:N and N:P ratios were good predictors of the process. This could be corroborated by obtaining a significant inverse correlation between the decay constant (k) and the N:P ratio (r = 0.72, 0.76 and 0.75 for Tamesis, Jericó and Entrerríos, respectively). The locality of slower litter decomposition was Entrerríos, followed by Tamesis and Jericó.
In spite of the significant effect of inoculation on the RDM dynamic there were no significant differenc-es with this on the litter residual nutrient contents. In other words, the data did not support that the inoc-ulation can accelerate the release of nutrient from avocado litter. This may be due to the interference of other factors such as the microbial colonization of leaf litter during the observation time. It is worth to men-tion that in the same experimental sites, Tamayo and Osorio (2018) found that the soil below the inoculat-ed litter had higher concentration of some nutrients (P, K, Ca, Mg, B) than the soil below the uninoculated litter, which suggested a more active nutrient release due to the enzymatic activity of Mortierella sp.
In other studies in the coffee region of Colombia, Cardona and Sadeghian (2005) evaluated the litter supply (leaves, stems, flowers, fruits and other plant organs) and associated nutrient release in coffee plantations to sun exposure and with shading. These authors concluded that in shade coffee plantations, there is a significant contribution of organic materi-al equivalent to 11 t ha−1, which contributes to the formation of stable soil organic matter and to supply nutrient into the soils (N, P, K, Ca, Mg, Fe, Mn, Zn).
Data in the present research showed variable dynamics of the litter residual nutrient contents dur-ing the decay process. Thus, nutrient release, immobi-lization, and gain in the litter occurred simultaneously or sequentially. For instance, there was a very rapid net release of K, while the N release was initially rapid (0–30 d), then there was a stabilization phase in inter-mediate dates (30–330), and finally a slow release (330–430 d), as reported by Schlesinger (1991). By contrast, there was apparently gain of P during the period of observation. This apparently gain of P occur in despite of an increase in the surface soil P availa-bility (0–5 cm, upper A Horizon) reported by Tamayo and Osorio (2018) in the same avocado plantations. This contradiction can be explained by a possible translocation of P by fungi and insects that colonize litter and the abundant presence of fungal mycelium that occur, as reported by several authors (Melillo et al. 1982; Koenig and Cochran 1994; Musovoto et al. 2000).
The general pattern of nutrient release was: K > Ca > Mg > N > P. The rapid release of K has been widely reported due to their mobile nature as a result of not being occluded to the organic structures in leaf tissue, but being in free form, which is easily washed and/or removed (Tukey 1970; Parker 1983). Thus, Villela and Proctor (2002) in tropical forests of Para (Brazil) found K losses of 70%, in leaves of Ecclinusa guian-ensis. Similar trends were reported by Ngoran et al. (2006) for A. mangium, with losses of this element higher than 80% and Castellanos and León (2011) of 70%. K was the element with the higher rate of release in all locations, reaching at the end of the study almost entirely on the initial content (96%), resulting from their mobile nature (Parker 1983).
The release of Ca was of 47%, this was higher than that of N (26%) and P (0%). These results are similar to those reported by Liao et al. (2006) in humid for-ests of Taiwan, where the Ca showed higher mobility during the decomposition process, exceeding the gen-eral release trends that show N and P, in the tropical forests. Pleguezuelo et al. (2011) in Spain found a net N release from litter avocado after 159 d, while in this study the release was detected as earlier as 30 d, but it was then immobilized , contrary to the reported by other authors as Hasegawa and Takeda (1996) and Enoki and Hawaguchi (2000).
On the other hand, during the litter decomposition process micronutrients (Fe, Mn, Cu, and Zn) were

Fungal inoculation on the litter decomposition of avocado 33
immovilized (Table 5B). This had been also reported by León (2007) studying the litter decomposition of Pinus patula and Cupresus lusitanica in Andean forest of Colombia. The reason for this immobilization seems to be associated with the ability of organic matter to form complex with cations of these elements, leaving them in unavailable forms (Stevenson and Cole 1999).
5. Conclusions
The RDM was significantly lower when the litter was inoculated with the fungus Mortierella sp. It means the fungal inoculation accelerated the rate of decom-position; however, the effect was affected by the site and time after inoculation. Thus, the inoculation effect was significant in Tamesis at day 90 (0.71 uninocu-lated vs. 0.63 inoculated), in Jericó at days 30 (0.85 uninoculated vs. 0.78 inoculated) and 430 (0.48 unin-oculated vs. 0.42 inoculated), and in Entrerríos at day 430 (0.51 uninoculated vs. 0.46 inoculated).
The rate of decomposition followed the decreasing sequence: Jericó > Tamesis > Entrerríos. The nutrient release pattern was: K > Ca > Mg > N > P > Cu > Mn > Zn > Fe. While K was rapidly released, Ca, Mg, and N were slowly released; P, Cu, Mn, Zn, and Fe were immobilized during the decomposition process. How-ever, the fungal inoculation on the litter significantly reduced the magnitude of nutrient accumulation for P, Mg, S, Mn, and Zn. This effect was variable overtime and among sites.
Acknowledgements
We thank CORPOICA and the Ministry of Agriculture and Rural Development of Colombia for their finan-cial support during the doctoral studies of A. Tamayo. Also, we thank Diana M. Pedroza B. for her technical assistance in the laboratory. Conflict of interests: the authors declare that there is no conflict of interests regarding the publication of this paper.
References
Akaike, H. (1974): A new look at the statistical model identification. IEEE Transactions on Automatic Control 19(6), 716–723, https://doi.org/10.1109/TAC.1974 .1100705.
Aber, J. D., Melillo, J. M. (1991): Terrestrial Ecosystems. 2nd Ed. Academic Press, San Diego, California.
Aerts, R. (1997): Climate. Leaf litter chemistry and leaf litter decomposition in terrestial ecosystems: a triangular relationship. Oikos 79, 439–449, https://doi.org/10.2307/3546886.
Afanador, L. N. (2017): Biofertilizers: concepts, benefits and its application in Colombia. Ingeciencia 2(1), 65–76.
Alhamd, L., Arakaki S., Hagihara, A. (2004): Decomposition of leaf litter of four tree species in a subtropical
evergreen broad-leaved forest, Okinawa Island. Forest Ecology and Management 202, 1–11, https:// doi.org/10.1016/j.foreco.2004.02.062.
Álvarez, C. L., Osorio, N. W., Marin, M. (2013): Molecular identification of microorganisms associated to the rhizosphere of vanilla plants in Colombia. Acta Biologica Colombiana 18, 293–306, https://doi.org/10.15446/abc.
Aragón, R., Montti, L., Ayup, M., Fernandez, R. (2014): Exotic species as modifers of ecosystem processes: litter decomposition in native and invaded secondary forests of NW Argentina. Acta Oecologica 54, 21–28, https:// doi.org/10.1016/j.actao.2013.03.007.
Arellano, R., Paolini, J., Vasquez, V., Mora, E. (2004): Producción y descomposición de hojarasca en tres agroecosistemas de café en el estado de Trujillo, Venezuela. Revista Forestal Venezuela 48, 7–14.
Attiwill, P. M., Adams, M. A. (1993): Tansley Review No. 50. Nutrient cycling in forests. New Phytologist 124, 561–582, https://doi.org/10.1111/j.1469-8137.1993 .tb03847.x.
Barlow, J., Gardner, T. A., Ferreira, L. V., Peres, C. A. (2007): Litter fall and decomposition in primary, secondary and plantation forests in the Brazilian Amazon. Forest Ecology and Management 247, 91–97, https:// doi.org/10.1016/j.foreco.2007.04.017.
Berg, B., Laskowski, R. (1997): Changes in nutrient concentrations and nutrient release in decomposing needle litter in monocultural systems of Pinus contorta and Pinus sylvestris: a comparison and synthesis. Scandinavian Journal of Forest Research 12, 113–121, https://doi.org/10.1080/02827589709355392.
Berg, B., McClaugherty, C. (2008): Plant litter: Decomposition, humus formation, carbon sequestration. 2nd Ed. Springer, Berlin, Heidelberg.
Berg, B. (2000): Litter decomposition and organic matter turnover in northern forest soils. Forest Ecology and Management 133, 13–22, https://doi.org /10.1016 /S0378-1127(99)00294.
Bubb, K. A., Xu, Z. H., Simpson, J. A., Safigna, P. G. (1998): Some nutrient dynamics associated with litterfall and litter decomposition in hoop pine plantations of southeast Queensland, Australia. Forest Ecology and Management 110, 343–352, https://doi.org/10.1016 /S0378-1127(98)00295-3.
Bunnel, F. Y., Tait, D. E. (1974): Mathematical simulation models of decomposition soil organisms and decomposition in Tundra. In: Soil organisms and decomposition in tundra. Ed. A. J. Holding, S. F. Heal, J. Maclean, P. W. Flanagan. Tundra Biome Steering Conmmittee, Stockholm, 207–225.
Cardona, C., Sadeghian, K. S. (2005): Aporte de material organico y nutrientes en cafetales al sol y bajo sombrío de guamo. Avances Tecnicos Cenicafe 334, 1–8.
Castellanos, J., León, J. D. (2010): Caída de hojarasca y dinamica de nutrientes en plantaciones de Acacia mangium (Mimosaceae) de Antioquia Colombia. Acta biológica Colombiana 15(2), 289–308.
Castellanos, J., León, J. D. (2011): Descomposición de hojarasca y liberación de nutrientes en plantaciones de Acacia mangium (Mimosaceae) establecidas en suelos degradados de Colombia. Revista de Biologia Tropical 59(1), 113–128.
Cookson, W. R., Osman, M., Marschner, P., Abaye, D. A., Clarck, I., Murphy, D. V., Stockdale, E. A., Watson, C. A.

34 Álvaro Tamayo-Vélez, Guillermo Correa-Londoño, Nelson Walter Osorio
(2007): Controls on soil nitrogen cycling and microbial community composition across land use and incubation temperature. Soil Biology and Biochemistry 39, 744–756, https://doi.org/10.1016/j.soilbio.2006.09.022.
Cornwell, W. K., Cornelissen, J. H., Amatangelo, K., Dorrepaal, E., Eviner, V. T., Godoy, O., Hobbie, S. E., Hoorens, B., Kurokawa, H., Pérez-Harguindeguy, N., Quested, H. M., Santiago, L. S., Wardle, D. A., Wright, I. J., Aerts, R., Allison S. D., Van Bodegom, P., Brovkin, V., Chatain, A., Callaghan, T. V., Díaz, S., Garnier, E., Gurvich, D. E., Kazakou, E., Klein, J. A., Read, J., Reich, P. B., Soudzilovskaia, N. A., Vaieretti, M. V., Westoby, M. (2008): Plant species traits are the predominant control on litter decomposition rates within biomes worldwide. Ecology Letters 11(10), 1065–1071, https:// doi.org/10.1111/j.1461-0248.2008.01219.x.
Coûteaux, M. M., Bottner, P., Berg, B. (1995): Litter decomposition climate and litter qualitym. Trends in Ecology Evolution 10, 63–66, https://doi.org/10.1016 /S0169-5347(00)88978-8.
Enoki, T., Hawaguchi, H.(2000): Initial nitrogen and topographic moisture effects on the decomposition of pine needles. Ecological Research 15, 425–434, https://doi.org/10.1046/j.1440-1703.2000.00363.x.
Furey, C., Tecco, P. A., Perez-Harguindeguy, N., Giorgis, M. A., Grossi, M. (2014): The importance of native and exotic plant identity and dominance on decomposition patterns in mountain woodlands of central Argentina. Acta Oecologica 54, 13–20, https://doi.org/10.1016 /j.actao.2012.12.005.
Gallardo-Lancho, J. F. (2000): Biogeochemistry of Mediterranean forest ecosystems, a case study. In: Soil Biochemtry 10. Ed. J. M. Bollag, G. Stotzky. Marcel Dekker, New York, EEUU, 423–460.
Gaspar-Santos, E. S., Gonzalez-Espinosa, M., Ramírez-Marcial, N., Álvarez-Solís, J. D. (2015): Acumulación y descomposición de hojarasca en bosques secundarios del sur de la Sierra Madre de Chiapas, Mexico. Bosque (Valdivia) 36(3), 467–480, https://doi.org/10.4067 /S0717-92002015000300013.
Gholz, H. L., Wedin, D. A., Smitherman, S. M., Harmon, M. E., Parton, W. J. (2000): Long-term dynamics of pine and hardwood litter in contrasting envi- ronments: toward a global model of decomposition. Global Change Biology 6, 751–765, https://doi.org/10.4067 /S0717-92002015000300013.
Goma-Tchimbakala, J. Bernhard-Reversat, F. (2006): Comparison of litter dynamics in three plantations of an indigenous timber-tree species (Terminalia superba) and a natural tropical forest in Mayombe, Congo. Forest Ecology and Management 229, 304–313, https:// doi.org/10.1016/j.foreco.2006.04.009.
Güsewell, S., Gessner, M. O. (2009): N:P ratios influence litter decomposition and colonization by fungi and bacteria in microcosms. Funtional Ecology 23, 211–219, https://doi.org/10.1111/j.1365-2435.2008.01478.x.
Hasegawa, M., Takeda, H. (1996): Carbon and nutrient dynamics in decomposing pineneedle litter in relation to fungal and fauna labundances. Pedobiologia 40, 171–184.
Heneghan, L., Coleman, D. C., Zou, X., Crossley, Jr D. A., Haines, B. L. (1998): Soil microarthropod community structure and litter decomposition dynamics: a study of tropical and temperate sites.
Applied Soil Ecology 9, 33-38, https://doi.org/10.1016 /S0929-1393(98)00050-X.
Holdridge, L. R. (1967): Life zone ecology. Tropical Science Center, San Jose, Costa Rica.
Huang, J., Wang, X., Yan, E. (2007): Leaf nutrient concentration. Nutrient resorption and litter decomposition in an evergreen broad-leaved forest in eastern China. Forest Ecology and Management 239, 150–158, https://doi.org/10.1016/j.foreco.2006.11.019.
Kumar, R., Agrawal, M. (2001): Litterfall litter decomposition and nutrient release in five exotic plant species planted on coal mine spoils. Pedobiologia 45, 298–312, https://doi.org/10.1078/0031-4056-00088.
Lavelle, P., Blanchart, E., Martin, A., Spain, A., Toutain, F., Barois, I., Schaefer, R. (1993): A hierarchical model for decomposition in terrestial ecosystems: application to soil of the humid tropics. Biotropica 25, 130–150, https://doi.org/10.2307/2389178.
León, J. D. (2007): Contribución al conocimiento del ciclo de nutrientes en bosques montanos naturales de Quercus humboldtii y reforestados (Pinus patula y Cupresus lusitanica) de la Región de Piedras Blancas, Antioquia (Colombia). Tesis Doctoral, Universidad de Salamanca, Espa-a.
Liao, J. H., Wang, H. H., Tsai, C. H., Hseu, Z. Y. (2006): Litter production. Decomposition and nutrient return of uplifted Coral Reef tropical forest. Forest Ecology and Management 235, 4–185, https://doi.org/10.1016 /j.foreco.2006.08.010.
Loaiza-Usuga, J. C., León-Pelaez, J. D., Gonzalez-Hernandez, M. I., Gallardo-Lancho, J. F., Osorio-Vega, W., Correa-Londo-o, G. (2013): Alterations in litter decomposition patterns in tropical montane forests of Colombia: a comparison of oak forests and coniferous. Canadian Journal of Forest Research 3, 528–533, https:// doi.org/10.1139/cjfr-2012-0438.
Lorenzo, P., Rodríguez-Echeverría, S. (2015): Soil changes mediated by invasive Australian acacias. Ecosistemas 24(1), 59–66, https://doi.org/10.7818 /ECOS.2015.24-1.10.
Magill, A. H., Aber, J. D. (2000): Dissolved organic carbon and nitrogen relationships in forest litter as affected by nitrogen deposition. Soil Biology Biochemistry 32, 603–613, https://doi.org/10.1016/S0038-0717 (99)00187-X.
Manzoni, S., Pieiro, G., Jackson, R. B., Jobbagy, E. G., Kim, J. H., Porporato, A. (2012): Analytical models of soil and litter decomposition: solutions for mass loss and time-dependent decay rates. Soil Biology Biochemistry 50, 66–76, https://doi.org/10.1016/j.soilbio.2012.02.029.
Mcgrath, A. D., Comerford, N. B., Duryea, M. L. (2000). Litter dynamics and monthly fluctuations in soil phosphorus availability in an Amazonian agroforest. Forest Ecology and Management 131, 167–181.
Melillo, J. M., Aber, J. D., Muratore, J. F. (1982): Nitrogen and lignin control of hardwood leaf litter decomposition dynamics. Ecology 63, 621–626, https://doi.org /10.2307/1936780.
Montagnini, F., Sancho, F., Ramstad, K., Stijhoorn, E. (1991): Multipurpose trees for soil restoration in humid lowlands of Costa Rica. In: Research on multipurpose trees in Asia. Ed. D. A. Taylor, K.G. Dicken. Winrock Int. Inst. For Agricultural Developmente. Bangkok, 41–58.
Fungal inoculation on the litter decomposition of avocado 35
Moro, M. J., Domingo, F. (2000): Litter decomposition in four woody spcies in a Mediterranean climate: weight loss. N and P dynamics. Annals Bot-London 86, 1065–1071, https://doi.org/10.1006/anbo.2000.1269.
Musovoto, C., Campbell, B. M., Kirchmann, H. (2000): Decomposition and nutrient release from mango and miombo woodland litter in Zimbabwe. Soil Biology and Biochemistry 32, 1111–1119, https://doi.org/10.1016 /S0038-0717(00)00023-7.
Ngoran, A., Zakra, N., Ballo, K., Kouamé, C., Zapata, F., Hofman, G., van Cleemput, O. (2006): Litter decomposition of Acacia auriculiformis Cunn. Ex Benth. and Acacia mangium Willd. under coconut trees on quaternary sandy soils in ivory Coast. Biology and Fertility of Soils 43, 102–106, https://doi.org/10.1007 /s00374-005-0065-2.
Nouvellon, Y., Epron, D., Marsden, C., Kinana, A., Maire, C., Deleporte, P., Saint-André, L., Bouillet, J. P., Laclau, J. P. (2012): Age-related changes in litter inputs explain annual trends in soil C02 effluxes over a full Eucalyptus rotation after afforestation of a tropical savannah. Biogeochemistry-US 111, 515–533, https://doi.org /10.1007/s10533-011-9685-9.
Olson, J. S. (1963): Energy storage and the balance of producers and decomposers in ecological systems. Ecology 44, 322–331, https://doi.org/10.2307 /1932179.
Osorio, N. W., Habte, M. (2013): Synergistic effect of a phosphate solubilizing fungus and an arbuscular mycorrhizal fungus on leucaena seedlings in an oxisol fertilized with rock phosphate. Botany 91, 274–281, https://doi.org/10.1139/cjb-2012-0226.
Osorio, N. W., Osorno, L. (2015): Biofertilization with mycorrhizal fungi and phosphate solubilizing microorganisms enhance effectiveness of phosphate fertilizers in tropical soils. In: Fertilizer Technology, 2, Synthesis. Ed. J. N. Govil. Studium Press LLC (Houston, USA. New Delhi, India), 298–326.
Pandey, R. R., Sharma, G., Tripathi, S. K., Singh, A. K. (2007): Litterfall: Litter decomposition and nutrient dynamics in a subtropical oak forest and managed plantation in northeastern India. Forest Ecology and Management. 249, 96–104, https://doi.org/10.1016 /j.foreco.2006.12.013.
Parker, G. G. (1983): Through fall and stem flow in the forest nutrient cycle. Advances in Ecological Research 13, 57–133, https://doi.org/10.1016/S0065-2504(08)60108-7.
Pérez-Harguindeguy, N., Díaz, S., Garnier, E., Lavorel, S., Poorter, H., Jaureguiberry, P., Bret-Harte, M. S., Cornwell, W. K., Craine, J. M., Gurvich, D. E., Urcelay, Veneklaas, J. E., Reich, P. B., Poorter, L., Wright, I. J., Ray, P., Enrico, L., Pausas, J. G., de Vosf, A. C., Buchmann, N., Funes, G., Quétier, F., Hodgson, J. G., Thompson, K., Morgan, H. D., Ter Steege, H., van der Heijden, M. G. A., Sack, L., Blonder, B., Poschlod, P., Vaieretti, M. V., Conti, G., Staver, A. C., Aquino, S., Cornelissen, J. (2013): New handbook for standardized measurement of plant functional traits worldwide. Australian Journal of Botany 61, 167–234, https://doi.org/10.1071/BT12225.
Pleguezuelo, R., Zuazo, D. V., Fernandez, M. J., Tarifa, F. D. (2011): Descomposición de hojarasca y reciclado del nitrógeno de frutales tropicales y subtropicales en
terrazas de cultivo en la costa de granada (SE Espa-a). Comunicate Scientiae 2(1), 42–48.
Prause, J., Fernandez, C. (2007): Litter decomposition and lignin/cellulose and lignin/total nitrogen rates of leaves in four species of the Argentine Subtropical forest. Agrochimica 51, 294–300.
Prescott, C. E. (2005): Decomposition and mineralization of nutrients from Litter and Humus. In: Nutrient acquisition by plants an ecological perspective. Ed. H. Bassiri Rad, 15–41, https://doi.org/10.1007/3-540-27675-0_2.
Ribeiro, C., Madeira, M., Araújo, M. C. (2002): Decomposition and nutrient release from leaf litter of Eucalyptus globulus grown under different water and nutrient regimes. Forest Ecology and Management 171, 31–41, https://doi.org/10.1016/S0378-1127(02)00459-0.
Rocha-Loredo, A. G., Ramírez-Marcial, N. (2009): Producción y descomposición de hojarasca en diferentes condiciones sucesionales del bosque de pino-encino en Chiapas, Mexico. Boletín de la Sociedad Botanica de Mexico 84, 1–12.
Schlesinger, W. H. (1991): Biogeochemistry: An analysis of global change. Academic, New York, EEUU.
Schlesinger, W. H. (2000): Biogeoquímica: un analisis global. Ariel Ciencia, Barcelona, Espa-a.
Singh, R., Kumar, R., Agrawal, M. (2004): Litter decomposition and nutrient release in relation to atmospheric deposition of S and N in a dry tropical region. Pedobiologia 48, 305–311, https://doi.org /10.1016/j.pedobi.2004.03.003.
Soil Survey Staff. Keys to soil taxonomy. (2014): USDA-Natural Resources Conservation Services. 12th Ed. Washington, DC.
Soil Survey Staff. Soil survey field and laboratory methods manual (2014): USDA-Natural Resources Conservation Services. Washington, DC.
Songwe, N. C., Okali, D. V. V., Fasehum, F. E. (1995): Litter decomposition and nutrient release in a tropical rainforest, Southern Bakkundu Forest Reserve, Cameroon. Journal of Tropical Ecology 11, 333–350, https://doi.org/10.1017/S0266467400008816.
Stevenson, F. J., Cole, A. M. (1999): Cycles of soil. Carbon, nitrogen, phosphorus, sulfur, and micronutrients. 2nd Ed. New York, John Wiley and Sons.
Swift, M. J., Heal, O. W., Anderson, J. M. (1979): Decomposition in terrestrial ecosystems. Blackwell Scientific, Oxford, UK.
Tamayo, A., Osorio, N. W. (2018): Soil fertility improvement by litter decomposition and inoculation with the fungus Motierella sp. in avocado plantations of Colombia. Communications in Soil Science and Plant Analysis 49, 139–147, https://doi.org/10.1080/00103624.2017.1417420.
Tarutis, W. J. (1994): A mean-variance approach for describing organic matter decomposition. Journal of Theoretical Biology, 168, 13–18, https://doi.org /10.1006/jtbi.1994.1083.
Tateno, R., Tokuchi, N., Yamanaka, N., Du, S., Otsuki, K., Shimamura, T., Xue, Z., Wang, S., Hou, Q. (2007): Comparison of litterfal production and leaf litter decomposition between an exotic black locust plantation and an indigenous oak forest near Yan’an on the Loess Plateau, China. Forest Ecology and Management 241, 84–90, https://doi.org/10.1016/j.foreco.2006.12.026.
36 Álvaro Tamayo-Vélez, Guillermo Correa-Londoño, Nelson Walter Osorio
Versini, A., Zeller, B., Derrien, D., Mazoumbou, J. C., Mareschal, L., Saint-André, L., Ranger, J., Laclau, J. P. (2014): The role of harvest residues to sustain tree growth and soil nitrogen stocks in a tropical Eucalyptus plantation. Plant and Soil 346, 245–260, https://doi.org /10.1007/s11104-013-1963-y.
Villela, D. M., Proctor, J. (2002): Leaf litter decomposition and monodominance in the Peltogyne forest of Maraca Island, Brazil. Biotropica 34, 334–347.
Wang, Q., Wang, S., Huang, Y. (2008): Comparisons of litterfall litter decomposition and nutrient return in a monoculture Cunninghamia lanceolata and a mixed stand in southern China. Forest Ecology and Management 255, 1210–1218, https:// doi.org/10.1016/j.foreco.2007.10.026.
Waring, E. H., Schlesinger, W. H. (1985): Forest ecosystems. Academic Press. Orlando. USA.
Weerakkody, J., Parkinson, D. (2006a): Input. Accumulation and turnover of organic matter nitrogen and phosphorus in surface organic layers of an upper montane rainforest in Sri Lanka. Pedobiologia 50, 377–383, https:// doi.org/10.1016/j.pedobi.2006.06.006.
Weerakkody, J., Parkinson, D. (2006b): Leaf litter decomposition in an upper montane rainforest in Sri Lanka. Pedobiologia, 50, 387–395, https:// doi.org/10.1016/j.pedobi.2006.07.002.
Westerman, R. L. (1990): Soil testing and plant analysis. 3rd Ed. Soil Science Society of America.
Xuluc-Tolosa, F. J., Vestera, H. F. M., Ramírez-Marcial, N., Castellanos-Albores, J., Lawrence, D. (2003): Leaf litter decomposition of tree species in three successional phases of tropical dry secondary forest in Campeche, Mexico. Forest Ecology and Management 174, 401–412, https://doi.org/10.1016/S0378-1127(02)00059§2.
Original Article 37
Spatial differentiations of trade links between Ukraine and CzechiaVolodymyr Lazhnik1, Andrii Maister2, Serhii Puhach3,*
1 Lesia Ukrainka Eastern European National University, Lutsk, Ukraine2 Lutsk Institute of Human Development of the University “Ukraine”, Lutsk, Ukraine3 Lesia Ukrainka Eastern European National University, Lutsk, Ukraine* Corresponding author: [email protected]
ABSTRACTThe purpose of this article is to examine the current status of economic ties between Ukraine and Czechia, identify main trends in the contemporary commodity trade between Ukraine and Czechia, and to investigate the regional structure of Ukraine’s external trade with Czechia. The article employs the coefficients of equilibrium and connectivity of regional trade links between Ukraine and Czechia in order to classify Ukrainian regions into distinct categories based on the degree of connectivity of commodity trade and the types of trade links between these two countries.
KEYWORDSexports; imports; commodity trade; trade equilibrium coefficient; trade connectivity coefficient; Ukraine; Czechia
Received: 20 May 2018Accepted: 17 April 2019Published online: 22 May 2019
Lazhnik, V., Maister, A., Puhach, S. (2019): Spatial differentiations of trade links between Ukraine and Czechia. AUC Geographica 54(1), 37–47https://doi.org/10.14712/23361980.2019.4
© 2019 The Authors. This is an open-access article distributed under the terms of the Creative Commons Attribution License (http://creativecommons.org/licenses/by/4.0).

38 Volodymyr Lazhnik, Andrii Maister, Serhii Puhach
1. Introduction
Foreign trade is a traditional object of geographic research, which is realized within the context of the theory of international division of labor. The mecha-nism of foreign trade is conditioned by the existence of a country’s or a region’s benefits in the production of certain goods, as well as existing theoretical models based on united theories of location and international trade that can be applied to international trade rela-tions. The main reason for foreign trade interactions between countries and regions is the presence of var-ious factors of production, which lead to commodity and industrial specialization within the domestic and international divisions of labor. These factors also lead to regional differences in foreign trade.
In models of foreign trade, developed by Krug-man (1991) within the framework of new econom-ic geography, the emphasis is on the mechanisms of monopolistic competition, which, along with the clas-sical principles of absolute and relative advantages, provide additional gain from international trade by increasing the scale of production. The ideas of Krug-man make it possible to prove that the geographical structure of countries’ foreign trade is characterized by dominance of large cities and industrially devel-oped regions that benefit from high volumes of pro-duction. This leads to territorial disproportions and regional differences in the distribution of external and internal trade flows.
P. Krugman, M. Fujita and others consider the mod-el of new economic geography as a model of the loca-tion combining elements of traditional regional sci-ence and a new trade theory (Krugman 1999; Fujita, Krugman and Venables 1999). It is designed for the analysis of the spatial structure peculiarities, for the degree of concentration and differentiation of coun-tries’ and regions’ foreign trade relations.
Models of the new economic geography became the basis for developing gravitational models of trade interaction between countries and regions proposed by J. Tinbergen (Tinbergen 1962), D. Anderson and E. Wincoop (Anderson and Wincoop 2003), D. McCal-lum (McCallum 1995), etc. Gravitational models of foreign trade make it possible to assess bilateral trade flows between countries and regions, considering the gross regional product of two countries or regions and the distances between them.
Porter (1998) has attempted to combine neoclas-sical theories of competitiveness at the country level with the theory of foreign economic activity of indi-vidual regions and firms. According to Porter’s theo-ry of competitiveness, the spatial structure of foreign trade is highly differentiated due to competition on the domestic market, which determines the level of participation in international trade, depending on the availability of competitive advantages. The regional approach to the study of foreign trade is therefore important since it allows for assessing the regional
geographic structure of foreign trade and for the iden-tifying spatial concentration and differentiation of trade flows between individual countries and regions.
The purpose of this article is to analyze the dynam-ics and main trends in the trade relations between Ukraine and Czechia between 2001 and 2017, to elu-cidate the features of the spatial differentiation of the bilateral commodity trade at the level of the Ukrainian regions and to determine the further interregional interaction prospects.
A key target of the Ukraine’s sustainable and suc-cessful growth is to expand the external economic relations. The Ukrainian cooperation with Central and Eastern European countries holds a special place in this strategy. Ukraine has become active in the mar-kets of those countries Czechia, as a partner country with lasting into external commercial relations with Ukraine has supported Ukraine in its attempts to integrate into the EU and it traditionally stays to be an important trading partner among other Central and Eastern European countries (Politychni … 2017). Many Ukrainian regions have established stable trade relations with trading companies and partners from Czechia. Therefore, the goal of this article is to con-duct the spatial analysis of bilateral trade relations among regions of Ukraine and Czechia.
Only recently, Ukrainian scholars have begun to study the challenging issues of the Ukrainian-Czech cooperation, primarily within the political realm, whilst other areas of the bilateral cooperation have not been comprehensively studied. Tsup (2009) focused on the analysis of the Ukrainian-Czech inter-state relations in the 20th and early 21st centuries, including economic relations. Various aspects of Ukrainian relations have been examined by R. Korsak (2007, 2013, 2014, 2016). In particular, Korsak (2007) analyzed the bilateral relations, including trade links between Czechia and Ukraine between 1991 and 2005. Additional publications included Ukrainian periodicals (Molodczenko 2013; Mudriyevs’ka 2013; Reznikov and Borodenko 2014; Tkaczenko 2013; Ustych 2003; Tsup and Lazarovych 2007, et al.) and web sites (Ukraine-Czech … 2005; Aktual’ni … 2011; Ukrainе … 2017). All of them primarily deal with the analysis of exports and imports of goods between the regions of Ukraine and Czechia, as well as the dynam-ics, structure and prospects of their trade relations. Some publications discuss the main trends and pros-pects essential to the development of trade relations among Ukraine’s regions and countries of Central Europe, as well as between Ukraine and the EU, which partially cover some of the aspects characterizing the Ukrainian-Czech trade relations (Matveieva 2007; Moroz and colleagues 2017; Petruk and Kovtun 2016, and others). The Ukrainian-Czech trade and economic relations and their status are also partially examined in Krayinoznavcha … (2015). However, the compre-hensive spatial analysis of Ukrainian-Czech trade rela-tions is still absent.
Trade links between Ukraine and Czechia 39
The Ukrainian-Czech interstate trade and econom-ic cooperation has not yet been sufficiently analyzed. Moreover, there is a little attention paid to the anal-ysis of trade relations between these two countries. The exception is Fomenko (2006) who analyzed the Ukrainian-Czech trade relations between 2001 and 2006. However, the bilateral trade relations from the geographical point of view are not studied at all.
Among Czech authors, Palata (2011, 2012) and Vesela (2011) focus their attention on political aspects of the Ukrainian-Czech interstate relations, pointing out that the rapprochement of Ukraine with the European Union will have a positive effect on the economic development of Ukraine and its bilateral trade relations with the EU. Vošta et. al (2016) consid-er Ukraine’s foreign trade relations with the EU with-in the framework of the Eastern Partnership Program, some attention has been paid to Ukraine in various documents (e.g. Agenda 2017) (Hlavní … 2017; Con-cept … 2015), and in the analysis of the Czech foreign policy (Kořan 2016).
Overall, scientific publications dealing with the study of the Ukrainian and Czech trade relations tes-tify to the insufficient and superficial coverage of this issue from the standpoint of social geography whilst geographical aspects of these links and their spatial differences have not yet been deeply studied either in the Ukrainian or in the Czech scientific literature. There are no publications studying the spatial differ-entiation and concentration of bilateral ties as to the trade in goods and services existing among regions of these two countries. For these reasons, we will conduct the analysis of trade cooperation between Ukraine and Czechia from the geographical perspec-tive in the remainder of this article.
2. Data and Methods
Some statistical data for the period from 2001 up to 2017 given by the National Bureau of Statistics of Ukraine were used to analyze the Ukrainian-Czech trade links and to determine the main trends in their formation. To reveal the spatial features of the region-al distribution of these links, the official data of the regional statistical offices of the Ukrainian 24 regions and the city of Kyiv have been used with taking into consideration the analysis of their commodity export and import volumes, foreign trade turnover and bal-ance over 2016. The data on Crimea, including the city of Sevastopol, and some area in the East of Ukraine have not been taken into consideration because they are not available. The commodity trade accounts for more than 92% of the total volume of the interstate trade operations between Ukraine and Czechia and the total turnover of the trade in services was only USD 129,6 million (Derzhavna … 2018). Therefore, in this article the trade in services has not been exam-ined within the framework of the Ukrainian regions
(Derzhavna … 2018) because of their small export volumes to Czechia and imports from Czechia to most Ukrainian regions. As a result, it requires a separate detailed study.
In order to conduct the analysis of regional trade relations between Czechia and Ukraine, we have first selected indicators and procedures of their interpre-tation and applied them to the dynamics of foreign commodity trade between Ukraine and Czechia for the period between 2001 and 2017. Both its com-modity structure and intensity of growth in exports, imports, balances and foreign trade turnovers have been determined relying upon the regression and cor-relation analyses. We have used a probabilistic poly-nomial model to find the dependent variables by the following formula:
yi = bo + b1x + b2x2 + b3x
3 + b4x4 (1)
Unknown parameters like b0, b1, b2, b3, b4, char-acterizing some of groups involved factors affecting commodity trade have been calculated using the least square method. Any verification of the expository power of the polynomial model chosen herein allows explaining the specific dynamics of trade flows and the general trend in this dynamics on-study. Addi-tionally, the correlation analysis technique has been employed to show the reliance of volumes of trade flows on various factors influencing on the regional foreign economic activity and to test the expository power of the regression model, entirety. To test the statistical significance of the correlation coefficients, Student’s criterion (t-test) was used.
An important foreign trade factor is its coeffi-cient of equilibrium reflecting the ratio of export and import flows among the regions of Ukraine and Cze-chia. It is calculated as the ratio of the foreign trade balance to the total trade turnover by the following formula:
Kzbi = Si / Ti, (2)
where Kzbi – the coefficient of equilibrium of com-modity trade between the i-region of Ukraine and Czechia; Si – the balance of trade in goods of the same region of Ukraine with Czechia; Ti – the volume of foreign trade turnover of the i-region with Czechia. The value of the Kzbi coefficient of equilibrium of commodity trade can range from 1 to −1. The posi-tive value reflects the greater volume of exports than imports, the negative value shows the greater volume of imports than exports, and 0 (zero) reflects the equality of exports and imports.
The trade connectivity coefficient (Kzv) has been used for the spatial analysis of foreign commodi-ty trade among the regions of Ukraine and Czechia. It has been calculated by the technique proposed by A. Vaniushkin (Vaniushkin 2004) under the formula (3):

40 Volodymyr Lazhnik, Andrii Maister, Serhii Puhach
Kzv = (Xmn / Xm) : (Mnm / Mm), (3)
where Kzv – means the trade connectivity coefficient of the m-region with the n-country; Xmn – exports from the m-region to the n-country; Xm – the aggre-gate exports of the m-region; Mnm – imports from the n-country to the m-region; Mm is the total imports of the m-region.
The trade connectivity coefficient Kzv equal to 1 or more than 1 points out to the fact that the m-region has some trade connectivity with the n-country (in our case with Czechia), as well as, that there is a high degree of focus on the trade relations with trading partners in the n-country. The coefficient less than 1 reflect three possibilities (Matveieva 2007). In the first case, the share of exports from the m-region to the n-country is much greater than the average vol-ume of its exports to all of the countries with which it trades. Then, such a region depends upon the n-im-porter, but there is no feedback due to the significant size of the n-country’s market. In a formalized form, it looks as follows:
Xmn ≫ Xm / Nxm, (4)
where Nxm means the number of those countries to which the m-region exports goods.
In the second case, the n-country’s share in the exports of the m-region is much smaller than the share of the m-region in the n-country’s imports. Then, the n-country depends on the exports of the m-region, but the m-region does not depend on trade with the n-country. In a formalized form, it looks like:
(Xmn / Xm) ≪ (Mnm / Mn), (5)
where Mn means the n-country’s aggregate import.In the third case, the exports from the m-region
to the n-country are less than the average volume of its exports to all the partner countries, and imports from the m-region to the n-country are less than the average volume of the n-country’s imports from all of the trading partner countries. This shows the inde-pendence of the m-region and the n-partner-country from each other in the commodity trade. In a formal-ized form, it looks like:
Xmn < (Xm / Nxm) and Mnm < (Mn / Nmn), (6)
where Nmn means the number of countries from which the n-country imports goods.
Computational results concerning the connectivi-ty coefficient (Kzv) of trade links among the Ukrainian and Czech regions according to the technique men-tioned above allow us to assess the dominant trade flows and the asymmetry of the trade relations, as well as to classify regions by the type of their trade links with Czechia. Various values of the trade connec-tivity coefficient are possible in the conditions of the
commodity trade asymmetry, which point to a certain degree of dependence of each region on the n-country (in our case, Czechia) either relative to the exports or imports of goods.
According to this methodology, the connectivity coefficient of trade in goods among the 25 Ukrainian regions and Czech regions in the unilateral direction is calculated due to the lack of the statistical informa-tion as to the foreign trade of the Czech regions with the Ukrainian ones. The statistical data on exports and imports of goods from the Ukrainian regions have been used to perform calculations based on the data from the regional statistical offices and the foreign trade data of Czechia for 2016 from the web-site of the Czech Statistical Office (External … 2017; Zovnishn’oekonomichna … 2018).
3. The Current State of the External Commodity Trade between Ukraine and CzechiaHaving a long history of development, the Ukraini-an-Czech interstate relations have been dynamic. The legal framework of agreements concluded between Ukraine and Czechia includes more than 50 inter-state documents that regulate foreign trade relations between these two countries. The most important treaties include The Treaty on Friendly Relations and Cooperation between Ukraine and Czechia dated April 26, 1995 (Dohovir … 1995), and the Agreement between the Cabinet of Ministers of Ukraine and the Government of Czechia ‘On Economic, Industrial and Scientific-Technical Cooperation’ dated April 15, 2004.
The EU-Ukraine Association Agreement signed in 2014 and effective on September 1, 2017 is very essential for the development of the Ukrainian-Czech bilateral relations. It envisages the establishment of a free trade zone between Ukraine and the EU. The Ukrainian-Czech Intergovernmental Mixed Commis-sion on Economic, Industrial, Scientific and Techni-cal Cooperation (established in December 1995) has become crucial for the coordination of bilateral trade and economic cooperation. The last (seventh) meet-ing of the Commission was held in June 2017 in Kyiv (Posol’stvo 2018).
Since the independence of Ukraine and the estab-lishment of diplomatic relations with Czechia (Janu-ary 3, 1993), the foreign trade relations between these two countries have been constantly expanding. The intensity of the Ukrainian-Czech economic ties over the past decades has been affected by geopolitical, social, economic, political and geographical circum-stances Czechia has always been one of the import-ant trade partners of Ukraine since the moment of its (Ukrane) independence (Torhovel’no-ekonomichne … 2018).
The revival of bilateral trade cooperation between Ukraine and Czechia in the early 21st century is
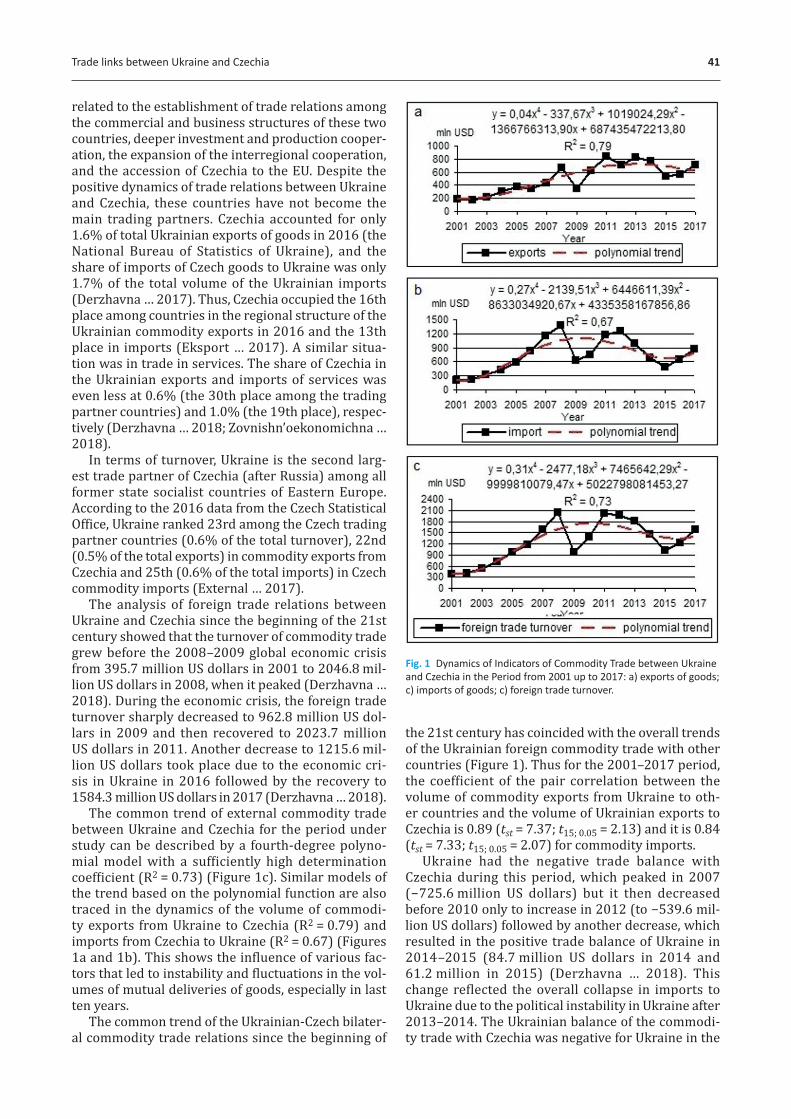
Trade links between Ukraine and Czechia 41
related to the establishment of trade relations among the commercial and business structures of these two countries, deeper investment and production cooper-ation, the expansion of the interregional cooperation, and the accession of Czechia to the EU. Despite the positive dynamics of trade relations between Ukraine and Czechia, these countries have not become the main trading partners. Czechia accounted for only 1.6% of total Ukrainian exports of goods in 2016 (the National Bureau of Statistics of Ukraine), and the share of imports of Czech goods to Ukraine was only 1.7% of the total volume of the Ukrainian imports (Derzhavna … 2017). Thus, Czechia occupied the 16th place among countries in the regional structure of the Ukrainian commodity exports in 2016 and the 13th place in imports (Eksport … 2017). A similar situa-tion was in trade in services. The share of Czechia in the Ukrainian exports and imports of services was even less at 0.6% (the 30th place among the trading partner countries) and 1.0% (the 19th place), respec-tively (Derzhavna … 2018; Zovnishn’oekonomichna … 2018).
In terms of turnover, Ukraine is the second larg-est trade partner of Czechia (after Russia) among all former state socialist countries of Eastern Europe. According to the 2016 data from the Czech Statistical Office, Ukraine ranked 23rd among the Czech trading partner countries (0.6% of the total turnover), 22nd (0.5% of the total exports) in commodity exports from Czechia and 25th (0.6% of the total imports) in Czech commodity imports (External … 2017).
The analysis of foreign trade relations between Ukraine and Czechia since the beginning of the 21st century showed that the turnover of commodity trade grew before the 2008–2009 global economic crisis from 395.7 million US dollars in 2001 to 2046.8 mil-lion US dollars in 2008, when it peaked (Derzhavna … 2018). During the economic crisis, the foreign trade turnover sharply decreased to 962.8 million US dol-lars in 2009 and then recovered to 2023.7 million US dollars in 2011. Another decrease to 1215.6 mil-lion US dollars took place due to the economic cri-sis in Ukraine in 2016 followed by the recovery to 1584.3 million US dollars in 2017 (Derzhavna … 2018).
The common trend of external commodity trade between Ukraine and Czechia for the period under study can be described by a fourth-degree polyno-mial model with a sufficiently high determination coefficient (R2 = 0.73) (Figure 1c). Similar models of the trend based on the polynomial function are also traced in the dynamics of the volume of commodi-ty exports from Ukraine to Czechia (R2 = 0.79) and imports from Czechia to Ukraine (R2 = 0.67) (Figures 1a and 1b). This shows the influence of various fac-tors that led to instability and fluctuations in the vol-umes of mutual deliveries of goods, especially in last ten years.
The common trend of the Ukrainian-Czech bilater-al commodity trade relations since the beginning of
the 21st century has coincided with the overall trends of the Ukrainian foreign commodity trade with other countries (Figure 1). Thus for the 2001–2017 period, the coefficient of the pair correlation between the volume of commodity exports from Ukraine to oth-er countries and the volume of Ukrainian exports to Czechia is 0.89 (tst = 7.37; t15; 0.05 = 2.13) and it is 0.84 (tst = 7.33; t15; 0.05 = 2.07) for commodity imports.
Ukraine had the negative trade balance with Czechia during this period, which peaked in 2007 (−725.6 million US dollars) but it then decreased before 2010 only to increase in 2012 (to −539.6 mil-lion US dollars) followed by another decrease, which resulted in the positive trade balance of Ukraine in 2014–2015 (84.7 million US dollars in 2014 and 61.2 million in 2015) (Derzhavna … 2018). This change reflected the overall collapse in imports to Ukraine due to the political instability in Ukraine after 2013–2014. The Ukrainian balance of the commodi-ty trade with Czechia was negative for Ukraine in the
Fig. 1 Dynamics of Indicators of Commodity Trade between Ukraine and Czechia in the Period from 2001 up to 2017: a) exports of goods; c) imports of goods; c) foreign trade turnover.

42 Volodymyr Lazhnik, Andrii Maister, Serhii Puhach
period from 2016 up to 2017 (−154.0 million US dol-lars in 2017) (Derzhavna … 2018).
The commodity structure of Ukrainian exports to Czechia has not changed significantly in recent years. For example, there was an increase in exports of 13 and a decrease in seven major commodity headings out of 20 in 2016 compared to 2015 (Eksport … 2017). Although the share of raw materials has decreased, iron ore and concentrates (39%) still prevailed in the Ukrainian exports, followed by the electric machinery and equipment (24%), ferrous metals (13.1%), sets of wires for spark plugs (9.7%), cables (5.4%), iron and steel products (4.9%) and other goods (Eksport … 2017).
At the same time, technological goods accounted for the largest share of Ukrainian imports from Cze-chia in 2016, including nuclear reactors, boilers and equipment (22.9% of the total), electrical machin-ery and equipment (14.9%), land transport (14.0%). Ukraine also imported devices for cellular networks (9.0%), polymer materials, plastics (7.2%), mineral fuel, oil and its distillation products (4.7%) and sets of wires for spark plugs (4, 5%) from Czechia in 2017. Overall, the share of technological goods in Czech exports to Ukraine increased by 43.1% between 2015 and 2016 (Eksport … 2017; Posol’stvo … 2017).
4. Results and Discussion
A significant spatial differentiation and greater vari-ability in the values of the trade turnover are seen in the regional structure of the external commodity trade among the Ukrainian and Czech regions during the analysed period. The most economically devel-oped and western border regions of Ukraine have become leaders in trade relations with Czechia. The largest volume of the trade turnover is accounted for by the city of Kyiv (282.1 million US dollars in 2016). Dnipropetrovsk, Transcarpathian, Lviv, Donetsk, Zaporizhzhia, Ivano-Frankivsk and Poltava regions had slightly smaller volumes of trade with Czechia (Figure 2). It should be noted that Dnipropetrovsk region mainly exports goods of mining and metallurgy industries to Czechia, and it is almost 4.3 times more than it imports from Czechia. Close trade relations have developed between the Transcarpathian region and partners from Czechia, because only the Tran-scarpathian region has a partnership and cooperation agreement with the Czech Vysočina region. In 2016, the Transcarpathian region had the third largest trade turnover with Czechia among the Ukrainian regions (152.8 million US dollars). Trade relations of Tran-scarpathia with Czech regions, especially with the
Fig. 2 Spatial Differentiations of Export-Import Relations among regions of Ukraine with Czechia in 2016.

Trade links between Ukraine and Czechia 43
province Vysočina, can be partially explained by his-toric ties (Transcarpathia was part of former Czecho-slovakia between 1918 and 1939) and the transpor-tation proximity. Czech-based enterprises also supply parts and accessories for the assembly of Škoda and Volkswagen models under lincenses by ‘Eurocar’, which is located in the village of Solomonovo, Uzhgo-rod district of the Transcarpathian region, 2 kilome-ters from the border with Slovakia and Hungary.
Kyiv, a sister city of Prague, accounts for more than 38% of all Czech imports to Ukraine. The dominant role of Kyiv is explained by it its large consumer mar-ket and the concentration of high-tech machine-build-ing industries that require import supplies of equip-ment and components from Czechia. Chernivtsi, Kherson, Chernihiv, Mykolaiv, Sumy and Cherkasy regions have low levels of socio-economic develop-ment and also had the smallest volumes of the com-modity trade with Czechia in 2016 (Figure 2). There is a positive correlation between the trade turnover of Ukrainian and Czech regions and the gross regional product (the coefficient of the pair correlation 0.82, tst = 6.87; t23; 0,05 = 2.07).
The city of Kyiv and the most developed Ukrainian regions (Dnipropetrovsk, Lviv, Donetsk, Zaporizhzhia and Poltava regions), as well as the Transcarpathian
region, are the most important exporters to Czechia by volume. The lowest volumes of Ukrainian exports to Czechia originate in the Mykolaiv, Chernihiv, Cher-nivtsi, Ternopil and Cherkasy regions (Figure 2). In 2016, Czechia was the third most important export destination for the Lviv region, the 4th – for the Iva-no-Frankivsk region, the 5th – for the Luhansk region, the 6th – for the Transcarpathian region, and the 7th – for the Poltava region.
The most important regional destinations of Czech commodity exports in Ukraine include Kiev (251.8 million US dollars in 2016), the Transcarpath-ian region (103.1 million US dollars), Lviv region (49.0 million US dollars), Dnipropetrovsk region (34.3 million US dollars) and Ivano-Frankivsk region (30.0 million US dollars). The least important Czech export destinations to Ukraine include the Chernivtsi, Kherson and Kirovograd regions (Figure 2).
Ten regions of Ukraine had a positive balance of the commodity trade turnover with Czechia in 2016. Dni-propetrovsk region had the largest positive balance (112.8 million US dollars) due to the supply of iron and manganese ore to Czechia, as well as products of the metallurgical, chemical and machine-build-ing industries. The largest negative trade balance (−221.6 million US dollars) was in the city of Kyiv
Fig. 3 The Commodity Trade Connectivity Coefficient of regions of Ukraine with Czechia.
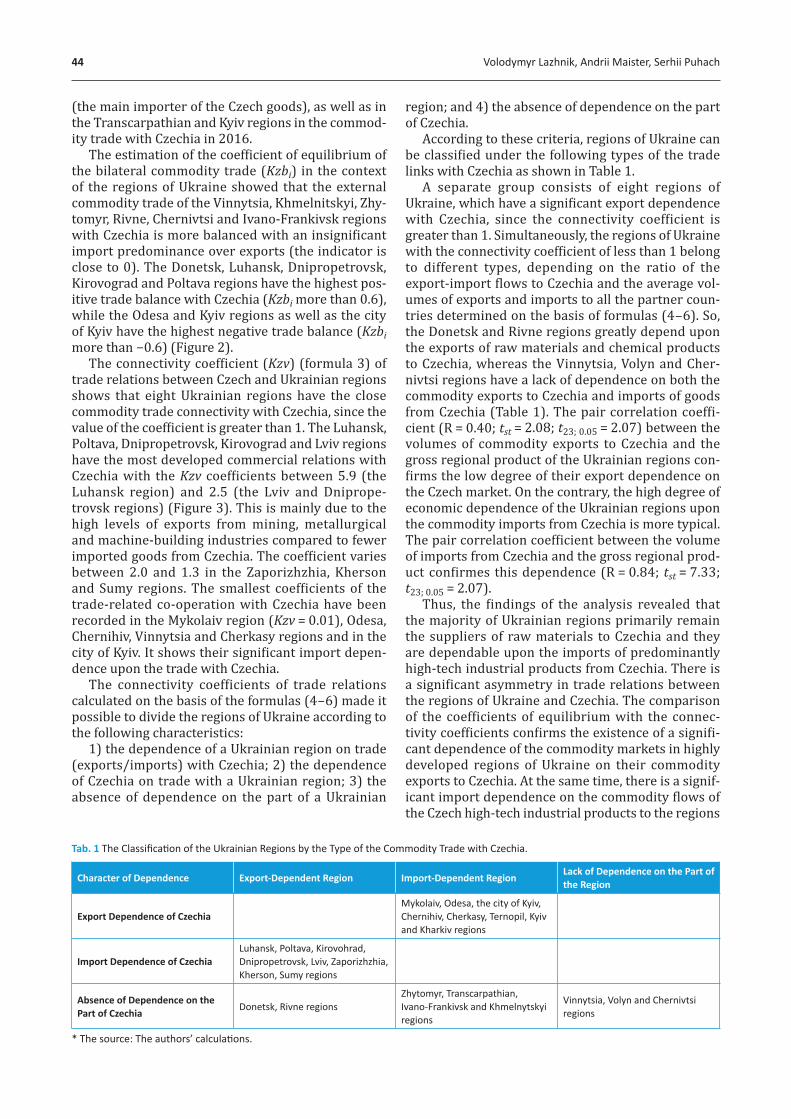
44 Volodymyr Lazhnik, Andrii Maister, Serhii Puhach
(the main importer of the Czech goods), as well as in the Transcarpathian and Kyiv regions in the commod-ity trade with Czechia in 2016.
The estimation of the coefficient of equilibrium of the bilateral commodity trade (Kzbi) in the context of the regions of Ukraine showed that the external commodity trade of the Vinnytsia, Khmelnitskyi, Zhy-tomyr, Rivne, Chernivtsi and Ivano-Frankivsk regions with Czechia is more balanced with an insignificant import predominance over exports (the indicator is close to 0). The Donetsk, Luhansk, Dnipropetrovsk, Kirovograd and Poltava regions have the highest pos-itive trade balance with Czechia (Kzbi more than 0.6), while the Odesa and Kyiv regions as well as the city of Kyiv have the highest negative trade balance (Kzbi more than −0.6) (Figure 2).
The connectivity coefficient (Kzv) (formula 3) of trade relations between Czech and Ukrainian regions shows that eight Ukrainian regions have the close commodity trade connectivity with Czechia, since the value of the coefficient is greater than 1. The Luhansk, Poltava, Dnipropetrovsk, Kirovograd and Lviv regions have the most developed commercial relations with Czechia with the Kzv coefficients between 5.9 (the Luhansk region) and 2.5 (the Lviv and Dniprope-trovsk regions) (Figure 3). This is mainly due to the high levels of exports from mining, metallurgical and machine-building industries compared to fewer imported goods from Czechia. The coefficient varies between 2.0 and 1.3 in the Zaporizhzhia, Kherson and Sumy regions. The smallest coefficients of the trade-related co-operation with Czechia have been recorded in the Mykolaiv region (Kzv = 0.01), Odesa, Chernihiv, Vinnytsia and Cherkasy regions and in the city of Kyiv. It shows their significant import depen-dence upon the trade with Czechia.
The connectivity coefficients of trade relations calculated on the basis of the formulas (4–6) made it possible to divide the regions of Ukraine according to the following characteristics:
1) the dependence of a Ukrainian region on trade (exports/imports) with Czechia; 2) the dependence of Czechia on trade with a Ukrainian region; 3) the absence of dependence on the part of a Ukrainian
region; and 4) the absence of dependence on the part of Czechia.
According to these criteria, regions of Ukraine can be classified under the following types of the trade links with Czechia as shown in Table 1.
A separate group consists of eight regions of Ukraine, which have a significant export dependence with Czechia, since the connectivity coefficient is greater than 1. Simultaneously, the regions of Ukraine with the connectivity coefficient of less than 1 belong to different types, depending on the ratio of the export-import flows to Czechia and the average vol-umes of exports and imports to all the partner coun-tries determined on the basis of formulas (4–6). So, the Donetsk and Rivne regions greatly depend upon the exports of raw materials and chemical products to Czechia, whereas the Vinnytsia, Volyn and Cher-nivtsi regions have a lack of dependence on both the commodity exports to Czechia and imports of goods from Czechia (Table 1). The pair correlation coeffi-cient (R = 0.40; tst = 2.08; t23; 0.05 = 2.07) between the volumes of commodity exports to Czechia and the gross regional product of the Ukrainian regions con-firms the low degree of their export dependence on the Czech market. On the contrary, the high degree of economic dependence of the Ukrainian regions upon the commodity imports from Czechia is more typical. The pair correlation coefficient between the volume of imports from Czechia and the gross regional prod-uct confirmes this dependence (R = 0.84; tst = 7.33; t23; 0.05 = 2.07).
Thus, the findings of the analysis revealed that the majority of Ukrainian regions primarily remain the suppliers of raw materials to Czechia and they are dependable upon the imports of predominantly high-tech industrial products from Czechia. There is a significant asymmetry in trade relations between the regions of Ukraine and Czechia. The comparison of the coefficients of equilibrium with the connec-tivity coefficients confirms the existence of a signifi-cant dependence of the commodity markets in highly developed regions of Ukraine on their commodity exports to Czechia. At the same time, there is a signif-icant import dependence on the commodity flows of the Czech high-tech industrial products to the regions
Tab. 1 The Classification of the Ukrainian Regions by the Type of the Commodity Trade with Czechia.
Character of Dependence Export-Dependent Region Import-Dependent Region Lack of Dependence on the Part of the Region
Export Dependence of CzechiaMykolaiv, Odesa, the city of Kyiv, Chernihiv, Cherkasy, Ternopil, Kyiv and Kharkiv regions
Import Dependence of CzechiaLuhansk, Poltava, Kirovohrad, Dnipropetrovsk, Lviv, Zaporizhzhia, Kherson, Sumy regions
Absence of Dependence on the Part of Czechia Donetsk, Rivne regions
Zhytomyr, Transcarpathian, Ivano-Frankivsk and Khmelnytskyi regions
Vinnytsia, Volyn and Chernivtsi regions
* The source: The authors’ calculations.

Trade links between Ukraine and Czechia 45
that have a low level of the industrial development and specialize in the production of the agricultural commodity products. In general, Ukraine’s trade with Czechia is more important for Ukraine and for most of its regions than it is for Czechia, since Czechia has a more diversified regional structure of its external commodity trade.
Therefore, the commodity trade of the Ukrainian regions with Czechia is significantly spatially differ-entiated. As to the regional structure of the external commodity trade between Ukraine and Czechia, the most economically developed regions and the west-ern border regions of Ukraine occupy the leading posi-tions because of their relative geographic proximity to Czechia. The balance assessment of the trade in ser-vices in the context of the Ukrainian regions has con-firmed that the external commodity trade of Czechia is balanced in regions with an average level of their economic development. Highly developed regions of Ukraine have an unbalanced commodity trade due to the dominance of raw materials in their exports to Czechia. The connectivity coefficient for the bilateral commodity flows shows that a high level of trade with Czechia is typical for only 8 (eight) regions of Ukraine, while Ukraine, in general, has a relatively high level of its dependence on trade with Czechia (Kzv = 1.39) (Matveieva 2007). There is also a significant spatial asymmetry in the bilateral Ukrainian-Czech trade in goods, since Czechia does not have a significant dependence on the trade with Ukraine, because of its focus on the EU and on highly developed world coun-tries. At the same time, Ukraine is strongly dependent on exports of commodities to the Czech market. This situation can be addressed through the increased cooperation in research, the development of technol-ogies, in the advancement of individual industries, in agriculture and in the modernization of transport infrastructure. Neither Ukraine nor Czechia fully uses the opportunities of their interregional cooperation based on the economic and natural potential of their regions because of limited financial resources and the difficult economic situation in Ukraine.
Thus, Ukraine is characterized by significant inter-regional differences in the level of attractiveness of regions in trade relations with Czechia. The spatial differentiation of trade relations of Ukrainian regions with Czechia is characterized by variability and the presence of significant spatial asymmetry. Regional disproportions are caused by the heterogeneity of the economic space of Ukraine, the degree of localiza-tion and concentration of export production and the specialization of import-oriented regions. The spatial structure of Ukraine’s trade relations with Czechia is typified by the dominance of the capital city and developed regions in the volume of export-import flows. The calculated coefficients of interconnection of bilateral commodity flows show that most regions of Ukraine have a significant import dependence on trade with Czechia. The classification of Ukrainian
regions by the type of commodity trade with Czechia shows that eight economically developed regions have a close connection between commodity trading with Czechia and a significant export dependence on deliveries of mineral raw materials, metallurgical and machine-building goods to Czech markets. The select-ed types of regions reflect the optimality of the spatial structure of foreign trade of regions of Ukraine with Czechia. Results of this research can be considered during the development and adoption of managerial decisions aimed at optimizing the foreign trade activ-ity of the regions of Ukraine.
Acknowledgements
This research has been carried out within the frame-work of the state budget scientific theme of the Department of International Relations and Regional Studies of Lesia Ukrainka Eastern European Nation-al University called “Ukraine in the System of the European Integration and the Cross-Border Cooper-ation”. Prospects for further researches are related to the analysis of trade relations among the regions of Ukraine and Czechia with the help of some gravity models.
References
Agenda for Czech Foreign Policy 2017 (2017): (Eds.: Vit Dostal and Tereza Jermanova). Praha, AМО.
Aktual’ni problemy ukrayins’ko-сzes’kykh vidnosyn ta perspektyvy intensyfikatsii dvostoronn’oho dialohu. Analityczna zapyska. Natsional’nyi instytut stratehicznykh doslidzhen’ (2011): [Actual problems of Ukrainian-Czech relations and prospects for intensification of bilateral dialogue. Analytical note / The National Institute For Strategic Studies]. http://www.niss.gov.ua/article/447/
Anderson, J., Wincoop, E. (2003): Gravity with Gravitas: A Solution to the Border Puzlle. American Economic Review 93(1), 170–192, https://doi.org/10.1257 /000282803321455214.
Concept of the Czech Republic’s Foreign Policy. Ministry of Foreign Affairs of the Czech Republic (2015). https://www.mzv.cz/file/1574645/Concept_of_the_Czech _Republic_s_Foreign_Policy.pdf
Derzhavna sluzhba statystyky Ukrainy (2018) [State Statistics Service of Ukraine. 2018]. http://www.ukrstat.gov.ua
Dohovir pro druzhni vidnosyny i spivrobitnytsvo mizh Ukrainoiu ta Czes’koiu Respublikoiu (1995) [Treaty on friendly relations and cooperation between Ukraine and the Czech Republic]. Polityka i czas 6, 74–77.
Eksport ta import mizh Ukrainoiu ta Czes’koiu Respublikoiu (2017) [Export and import between Ukraine and the Czech Republic]. http://vcci.com.ua/2017/03/export/
External trade of the Czech Republic in 2016 (2017). Praha, Czech Statistical Office, https://doi.org/10.13052 /jsn2445-9739.2017.003.
46 Volodymyr Lazhnik, Andrii Maister, Serhii Puhach
Fedurtsia, V. P. (2006): Systema rehyliuvannia zovnishn’otkonomichnykh zv’iazkiv u Ches’kii Respublitsi: dosvid orhanizatsii dlia Ukrainy: avtoreferat dysertatsii na zdobuttia naukovogo stupenia kandydata ekonomichnykh nauk [System of regulation of foreign economic relations in the Czech Republic: experience of organization for Ukraine]. PhD thesis. Uzhgorod, UzhNU.
Fomenko, S. (2006): Obchodní vztahy mezi Ukrajinou a Ceskou republikou. Diplomova prace / Vysoka škola ekonomicka v Praze. Fakulta mezinarodních vztahu. Katedra mezinarodního obchodu. Hlavní specializace: Mezinarodní obchod. Praha.
Fujita, M., KrugmaN, P., Venables, A. J. (1999): The Spatial Economy: Cities, Regions and International Trade. Cambridge, MIT Press, https://doi.org/10.7551 /mitpress/6389.001.0001.
Hlavní tendence prumyslu a zahraničního obchodu v roce 2016 a úvahy o dalším vyvoji (2016). Ministerstvo prumyslu a obchodu [Major trends in industry and external trade in 2016 and reflections on future developments]. https://www.mpo.cz/assets/cz /zahranicni-obchod/statistiky-zahranicniho -obchodu/2017/4/Hlavni-tendence-prumyslu -a-zahranicniho-obchodu-v-roce-2016_ 2017_04_12 -_-kopie.pdf
Korsak, R. V. (2007): Ukrayins’ko-ches’ke mizhderzhavne spivrobitnytsvo v 1991–2005 rr. [Ukrainian-czech interstate cooperation in 1991–2005]. Uzhgorod, Grazhda.
Korsak, R. V. (2013): The question of interstate cooperation of Ukraine and Czech Republic in Czech scientists’ labors (the beginning ХХІ century). Nauka і Studia 20, 102–114.
Korsak, R. V. (2014): Aktual’ni pytannia ukrains’ko-zces’koi torgovel’noi spravy (2000−2012 rr.) [Actual questions of ukrainian-czech trade cooperation (2000–2012)]. Gileia: naukovyi zbirnyk 88, 50–53.
Korsak, R. V. (2014): Chesko-ulrainskaia torhovo-elonomicheskaia politika v rabotakh cheshlikh uchenykh (2000–2012 hh.) [Czech-ukrainian commerce and economic policy in the works czech scientists (2000–2012 gg.). The Urals Scientific Herald 28(107), 111–116.
Korsak, R. V. (2014): Ukrajinsko-ceska hospodarske a politicke spoluprace v praceh ceskych vedcu [Ukrainian-Czech economic and political cooperation in the works of Czech scientists]. Stredoevropsky vestnik pro vedu a vyzkum 7(9), 81–84.
Korsak, R. V. (2014): Problemy ta perspektyvy ukrains’ko-zces’koi ekonomichnoi spivpratsi (XXI st.) [Problems and prospects of Ukrainian-Czech economic cooperation (XXI century)]. Aktual’ni pytannia humanitarnykh nauk. Drohobych 10, 29–32, https://doi.org/10.15407 /ugz2014.01.010.
Korsak, R. V. (2016): Istoriia ukrayins’ko-zces’kykh mizhderzhavnykh vidnosyn (kinets’ XX pochatok XXI stolittia): navtsal’nyi posibnyk [The history of Ukrainian-Czech inter-state relations (the end of the XXth to the beginning of the XXI century): educational manual]. Uzhhorod, Uzhhorods’kyi narsional’nyi universytet.
Kořan, M. (2016): Ceska zahraniční politika v roce 2015: analyza ÚMV. Praha, ÚMV.
Krayinoznavcha kharakterystyka Czes’koi Respubliki: kolektyvna monografiia (2015): V. Y. Lazhnik, I.
P. Mandryk, V. O. Patiyczuk [ta in.] ; za nauk. red. V. Y. Lazhnika [Country-specific characteristic of the Czech Republic]. Lutsk, Vezha-Druk. https://internationalconference2014.files.wordpress .com/2014/03/d181hechia-015d0b0d0b2d182 d0bed180.pdf
Krugman, P. R. (1991): Geography and Trade. Cambridge, MIT Press.
Matveieva, V. (2007): Deiaki aspekty zovnishn’oi torhivli Ukrainy v konteksti ievrointehratsii [Some aspects of Ukraine’s foreign trade in the context of European integration]. Zhurnal ievropeis’koi ekonomiky [Journal of the European Economy] 6(3), 280–293.
McCallum, J. (1995): National Borders Matter: Canada-U.S. Regional Trade Patterns. American Economic Review 85(3), 615‒623.
Molodczenko, O. M. (2013): Shliakhy podolannia problemnykh pytan’ dvostoronnich torhovel’no-ekonomicznykh vidnosyn mizh Ukrainoiu ta Czes’koiu Respublikoiu [Ways to Promote Problem Questions of Bilateral Trade-Economic Relations Between Ukraine and The Czech Republic]. Visnyk ekonomiky transportu i promyslovosti 41, 56–60.
Moroz, S., Nagyova, L., Bilan, Y., Horska, E., Polakova, Z. (2017): The current state and prospects of trade relations between Ukraine and the European Union: the Visegrad vector. Economic Annals-XXI 163(1–2(1)), 14–21, https://doi.org/10.1515/vjbsd-2015-0008.
Mudriyevs’ka, I. (2013): Dynamika rozvytku spivrobitnytstva Ukraiiny z Czes’koiu Respublikoiu [The Dynamics of the Development of the Cooperation of Ukraine with Czech Republic (1993–2011)]. Newsletter Precarpathian University. History 23–24, 452–459.
Palata, L. (2011): Otazka smyslu Ukrajiny. Mezinarodní politika 9, 2.
Palata, L. (2012): Ukrajina zustava chaotickou demokracii. Mezinarodni politika 11, 2.
Petruk, V., Kovtun, E. (2016): Development of Euro-regional cooperation of Ukraine in the context of the Visegrad experience. Visegrad Journal on Bioeconomy and Sustainable Development 2, 33–35, https doi.org/10.1515/vjbsd-2015-0008.
Politychni vidnosyny mizh Ukrainoiu ta Czekhiieiu. Posol’stvo Ukrainy v Ches’kii Respublitsi (2017). [Political relations between Ukraine and the Czech Republic. Embassy of Ukraine in the Czech Republic]. http://czechia.mfa.gov.ua/ua/ukraine-czechia /diplomacy
Porter, M. E. (1998): The Competitive Advantage of Nations, 2nd ed. New York, Free Press, https://doi.org/10.1007 /978-1-349-14865-3.
Posol’stvo Ukrainy v Ches’kii Respublitsi. Ofitsiinyi sait (2017) [Embassy of Ukraine in the Czech Republic. Official site]. http://czechia.mfa.gov.ua/ua
Reznіkov, V. V., Borodenko, M. M. (2014): Ekonomiko-dyplomatycznyi aspekt ukrains’ko-zces’kykh vidnosyn na suczasnomu etapi [Current Economic and Diplomatic Aspect of Ukrainian-Czech Relations at the Present Stage]. Helard of the Kharkiv National University named after V. N. Karazin. Series “International Relations. Economy. Country Studies. Tourism” 1(3), 1144, 61–64.
Tinbergen, J. (1962): Shaping the World Economy: Suggestions for an International Economic Policy. New York, Twentieth Century Fund.
Trade links between Ukraine and Czechia 47
Tkachenko, I. (2013): Rozvytok vzaiemyn Ukrainy ta Czes’koi Respubliky pislia zdobuttia nezalezhnosti ta ikh perspektyvy v XXI stolitti [The development of relations between Ukraine and Czech Republic after obtaining the independence and its perspectives in the XXI century]. Naukovi zapysky Instytutu politychykh i etnjnarsional’nykh doslidzhen’ imeni I. F. Kurasa NAN Ukrainy 5(67), 372–384.
Torhovel’no-ekonomichne spivrobitnytstvo mizh Ukrainoiu ta Czekhiieiu. Posol’stvo Ukrainy v Ches’kii Respublitsi (2018) [Trade and economic cooperation between Ukraine and the Czech Republic. Embassy of Ukraine in the Czech Republic]. http://czechia.mfa.gov.ua/ua /ukraine-czechia/trade
Tsup, O. V. (2009): Ches’ka Respublika i Ukraina v mizhderzhavnykh vidnosynakh kintsia XX – pochatku XXI st.: avtoref. dys. kand. ist. nauk [Czech Republic and Ukraine in interstate relationships at the end of 20 − beginning of 21 cent.]. PhD thesis. L’viv, L’viv. nats. un-t im. I. Franka.
Tsup, O., Lazarovych, V. (2007): Torhovel’no-rkonomichni vidnosyny mizh Ukrainoiu ta Ches’koiu Respublikoiu (1993–2004 rr.) [Trade and Economic Relations between Ukraine and the Czech Republic (1993–2004)]. Ukrains’ka nauka: mynule, sutsasne, maibytnie 12, 313–319.
Ukrajina: Obchodní a ekonomicka spoluprace s CR (2017): [Ukraine: Business and economic cooperation with the
CR]. http://www.businessinfo.cz/cs/clanky/ukrajina-obchodni-a-ekonomicka-spoluprace-s-cr-19080.html
Ukraina-chekhiia: perspektyvy rozshyrennia spivronitnytstva ie! (2005) [Ukraine-Czech Republic: prospects for expanding cooperation is!]. Mizhnarodni zv’iazky Ukrainy: naukovi poshuky i znakhidky 14. http://sich.iatp.org.ua/n1021_10.htm
Ustych, S. (2003): Ukraina-Chekhiia: partnerstvo, spriamovane y perspektyvy [Ukraine-Czech Republic: a partnership aimed at the future]. Polityka i chas 11, 14–23.
Vaniushkin, A. S. (2004): Vyiavlieniie problem razvitiia do sozdaniia intehrarsionnykh obiedinienii [Identification of development problems prior to the creation of integration associations]. Kul’tura narodov Prychernomor’ia 56, 1, 97–100.
Vesela, N. (2011): Dvě desetiletí nezavisle Ukrajiny. Mezinarodní politika 9, 2.
Vošta, M., Musiyenko, S., Abrham, J. (2016): Ukraine-EU deep and comprehensive free trade area as part of Eastern Partnership initiative. Journal of International Studies 9(3), 21–35, https://doi.org/10.14254/2071-8330.2016/9-3/2.
Zovnishn’oekonomichna diial’nist’ (2018): Derzhavna sluzhba statystyky Ukrainy. Ofitsiinyi sait [Foreign economic activity. State Statistics Service of Ukraine]. http://www.ukrstat.gov.ua

48 Original Article
Laboratory rainfall-induced slope failure in a soil from the Colombian coffee regionLuis Fernando Salazar-Gutiérrez1,*, Fabián Hoyos-Patiño2, Oscar Echeverri-Ramírez2, Edgar Hincapié-Gómez3
1 National Center for Coffee Research, Cenicafé, Manizales, Colombia2 National University of Colombia, Medellín, Colombia3 Colombian Sugarcane Research Center, Cenicaña, Cali, Colombia* Corresponding author: [email protected], [email protected]
ABSTRACTThere are few studies on the processes involved in landslides in the soils of the Colombian coffee region in relation to the soil water content. In order to contribute to this knowledge, several experiments over a terrain model under simulated rainfall were conducted. Seven experiments on laboratory slope models, 1.8 m2 base, 1.0 m height, and 32° slope, with soil bulk density and soil horizons arrangement similar to in situ conditions, were built. Samples of altered residual soil derived from granitic rocks were collected in the municipality of Ibagué – Colombia from the surface down to 1.6 m depth. In each laboratory model, eight suction tensiometers (0 to −85 kPa) were located, and measurement under simulated rainfall was done. The results indicated a relationship of mass movements with hydrological processes occurring in the slope, related to soil permeability, rainfall intensity and duration, and water table changes. The major portion of soil slope instability cases was related to a saturated condition of the slope toe.
KEYWORDSsuction; non-saturated soils; landslides; geotechnical engineering
Received: 23 August 2018Accepted: 17 April 2019Published online: 20 May 2019
Salazar-Gutiérrez, L. F., Hoyos-Patiño, F., Echeverri-Ramírez, O., Hincapié-Gómez, E. (2019): Laboratory rainfall-induced slope failure in a soil from the Colombian coffee region. AUC Geographica 54(1), 48–56https://doi.org/10.14712/23361980.2019.5
© 2019 The Authors. This is an open-access article distributed under the terms of the Creative Commons Attribution License (http://creativecommons.org/licenses/by/4.0).
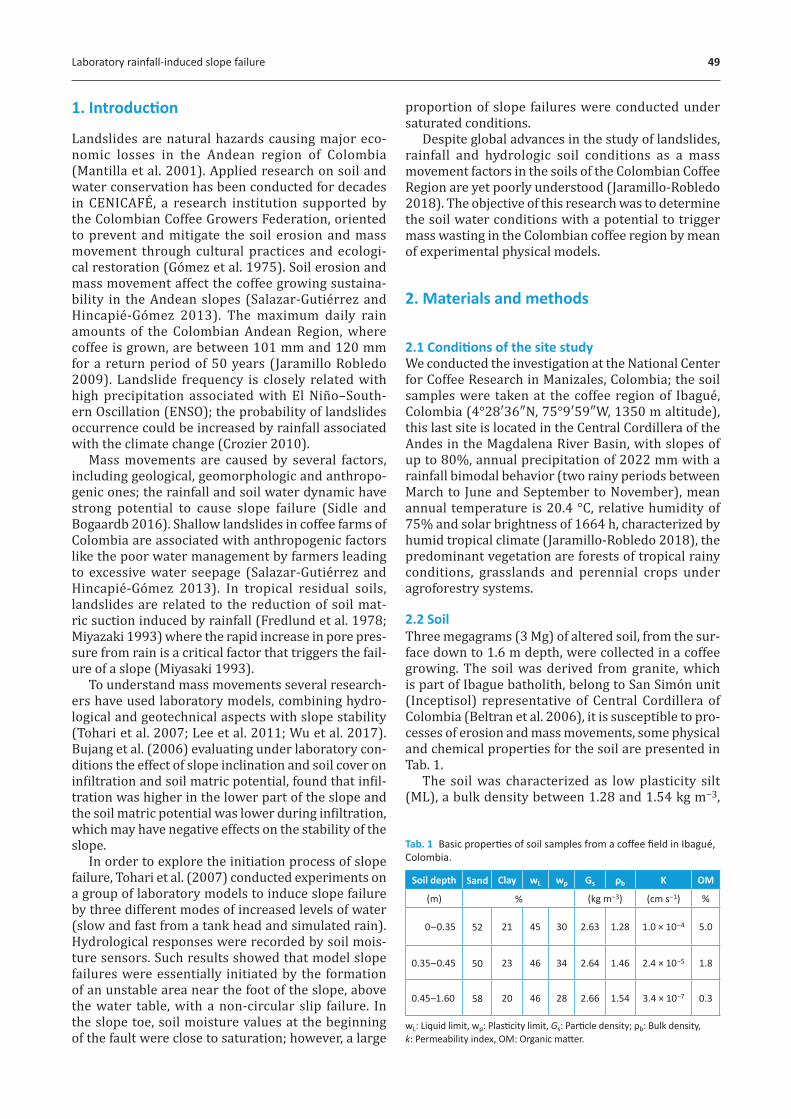
Laboratory rainfall-induced slope failure 49
1. Introduction
Landslides are natural hazards causing major eco-nomic losses in the Andean region of Colombia (Mantilla et al. 2001). Applied research on soil and water conservation has been conducted for decades in CENICAFÉ, a research institution supported by the Colombian Coffee Growers Federation, oriented to prevent and mitigate the soil erosion and mass movement through cultural practices and ecologi-cal restoration (Gómez et al. 1975). Soil erosion and mass movement affect the coffee growing sustaina-bility in the Andean slopes (Salazar-Gutiérrez and Hincapie-Gómez 2013). The maximum daily rain amounts of the Colombian Andean Region, where coffee is grown, are between 101 mm and 120 mm for a return period of 50 years (Jaramillo Robledo 2009). Landslide frequency is closely related with high precipitation associated with El Niño–South-ern Oscillation (ENSO); the probability of landslides occurrence could be increased by rainfall associated with the climate change (Crozier 2010).
Mass movements are caused by several factors, including geological, geomorphologic and anthropo-genic ones; the rainfall and soil water dynamic have strong potential to cause slope failure (Sidle and Bogaardb 2016). Shallow landslides in coffee farms of Colombia are associated with anthropogenic factors like the poor water management by farmers leading to excessive water seepage (Salazar-Gutierrez and Hincapie-Gómez 2013). In tropical residual soils, landslides are related to the reduction of soil mat-ric suction induced by rainfall (Fredlund et al. 1978; Miyazaki 1993) where the rapid increase in pore pres-sure from rain is a critical factor that triggers the fail-ure of a slope (Miyasaki 1993).
To understand mass movements several research-ers have used laboratory models, combining hydro-logical and geotechnical aspects with slope stability (Tohari et al. 2007; Lee et al. 2011; Wu et al. 2017). Bujang et al. (2006) evaluating under laboratory con-ditions the effect of slope inclination and soil cover on infiltration and soil matric potential, found that infil-tration was higher in the lower part of the slope and the soil matric potential was lower during infiltration, which may have negative effects on the stability of the slope.
In order to explore the initiation process of slope failure, Tohari et al. (2007) conducted experiments on a group of laboratory models to induce slope failure by three different modes of increased levels of water (slow and fast from a tank head and simulated rain). Hydrological responses were recorded by soil mois-ture sensors. Such results showed that model slope failures were essentially initiated by the formation of an unstable area near the foot of the slope, above the water table, with a non-circular slip failure. In the slope toe, soil moisture values at the beginning of the fault were close to saturation; however, a large
proportion of slope failures were conducted under saturated conditions.
Despite global advances in the study of landslides, rainfall and hydrologic soil conditions as a mass movement factors in the soils of the Colombian Coffee Region are yet poorly understood (Jaramillo-Robledo 2018). The objective of this research was to determine the soil water conditions with a potential to trigger mass wasting in the Colombian coffee region by mean of experimental physical models.
2. Materials and methods
2.1 Conditions of the site studyWe conducted the investigation at the National Center for Coffee Research in Manizales, Colombia; the soil samples were taken at the coffee region of Ibagué, Colombia (4°28′36″N, 75°9′59″W, 1350 m altitude), this last site is located in the Central Cordillera of the Andes in the Magdalena River Basin, with slopes of up to 80%, annual precipitation of 2022 mm with a rainfall bimodal behavior (two rainy periods between March to June and September to November), mean annual temperature is 20.4 °C, relative humidity of 75% and solar brightness of 1664 h, characterized by humid tropical climate (Jaramillo-Robledo 2018), the predominant vegetation are forests of tropical rainy conditions, grasslands and perennial crops under agroforestry systems.
2.2 SoilThree megagrams (3 Mg) of altered soil, from the sur-face down to 1.6 m depth, were collected in a coffee growing. The soil was derived from granite, which is part of Ibague batholith, belong to San Simón unit (Inceptisol) representative of Central Cordillera of Colombia (Beltran et al. 2006), it is susceptible to pro-cesses of erosion and mass movements, some physical and chemical properties for the soil are presented in Tab. 1.
The soil was characterized as low plasticity silt (ML), a bulk density between 1.28 and 1.54 kg m−3,
Tab. 1 Basic properties of soil samples from a coffee field in Ibagué, Colombia.
Soil depth Sand Clay wL wp Gs ρb K OM
(m) % (kg m−3) (cm s−1) %
0–0.35 52 21 45 30 2.63 1.28 1.0 × 10⁻⁴ 5.0
0.35–0.45 50 23 46 34 2.64 1.46 2.4 × 10⁻⁵ 1.8
0.45–1.60 58 20 46 28 2.66 1.54 3.4 × 10⁻⁷ 0.3
wL: Liquid limit, wp: Plasticity limit, Gs: Particle density; ρb: Bulk density, k: Permeability index, OM: Organic matter.
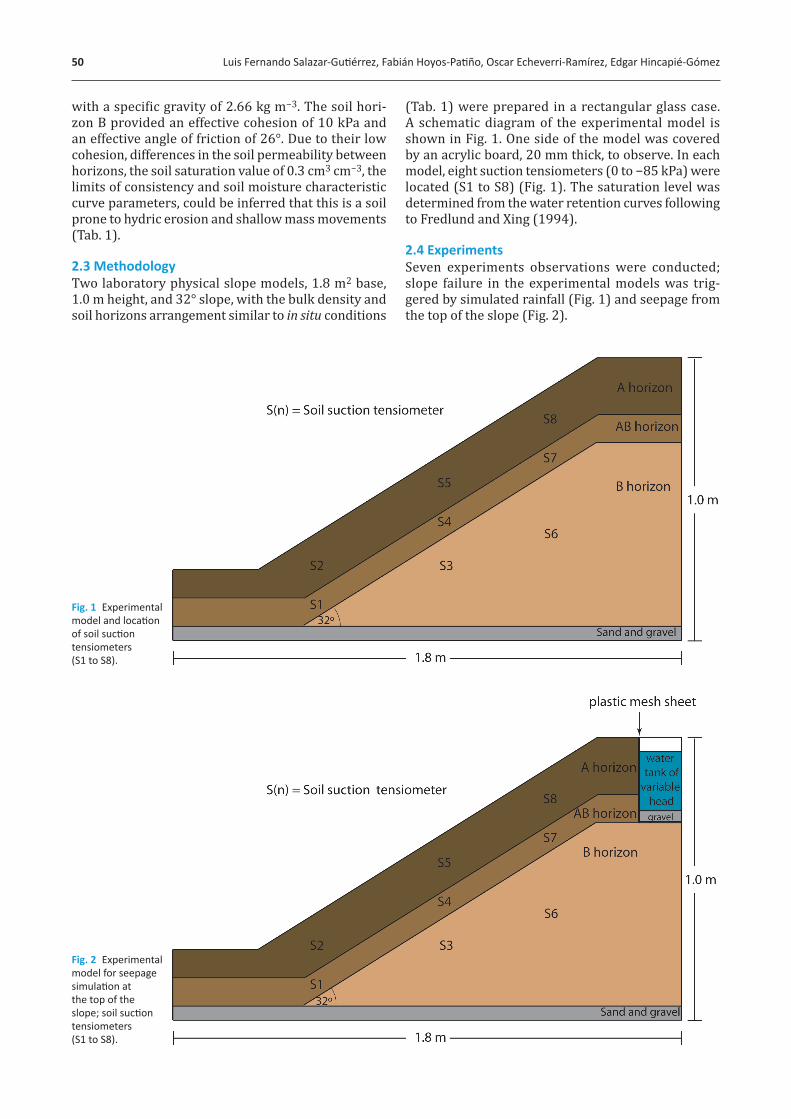
50 Luis Fernando Salazar-Gutiérrez, Fabián Hoyos-Patiño, Oscar Echeverri-Ramírez, Edgar Hincapié-Gómez
with a specific gravity of 2.66 kg m−3. The soil hori-zon B provided an effective cohesion of 10 kPa and an effective angle of friction of 26°. Due to their low cohesion, differences in the soil permeability between horizons, the soil saturation value of 0.3 cm3 cm−3, the limits of consistency and soil moisture characteristic curve parameters, could be inferred that this is a soil prone to hydric erosion and shallow mass movements (Tab. 1).
2.3 MethodologyTwo laboratory physical slope models, 1.8 m2 base, 1.0 m height, and 32° slope, with the bulk density and soil horizons arrangement similar to in situ conditions
(Tab. 1) were prepared in a rectangular glass case. A schematic diagram of the experimental model is shown in Fig. 1. One side of the model was covered by an acrylic board, 20 mm thick, to observe. In each model, eight suction tensiometers (0 to −85 kPa) were located (S1 to S8) (Fig. 1). The saturation level was determined from the water retention curves following to Fredlund and Xing (1994).
2.4 ExperimentsSeven experiments observations were conducted; slope failure in the experimental models was trig-gered by simulated rainfall (Fig. 1) and seepage from the top of the slope (Fig. 2).
Fig. 1 Experimental model and location of soil suction tensiometers (S1 to S8).
Fig. 2 Experimental model for seepage simulation at the top of the slope; soil suction tensiometers (S1 to S8).
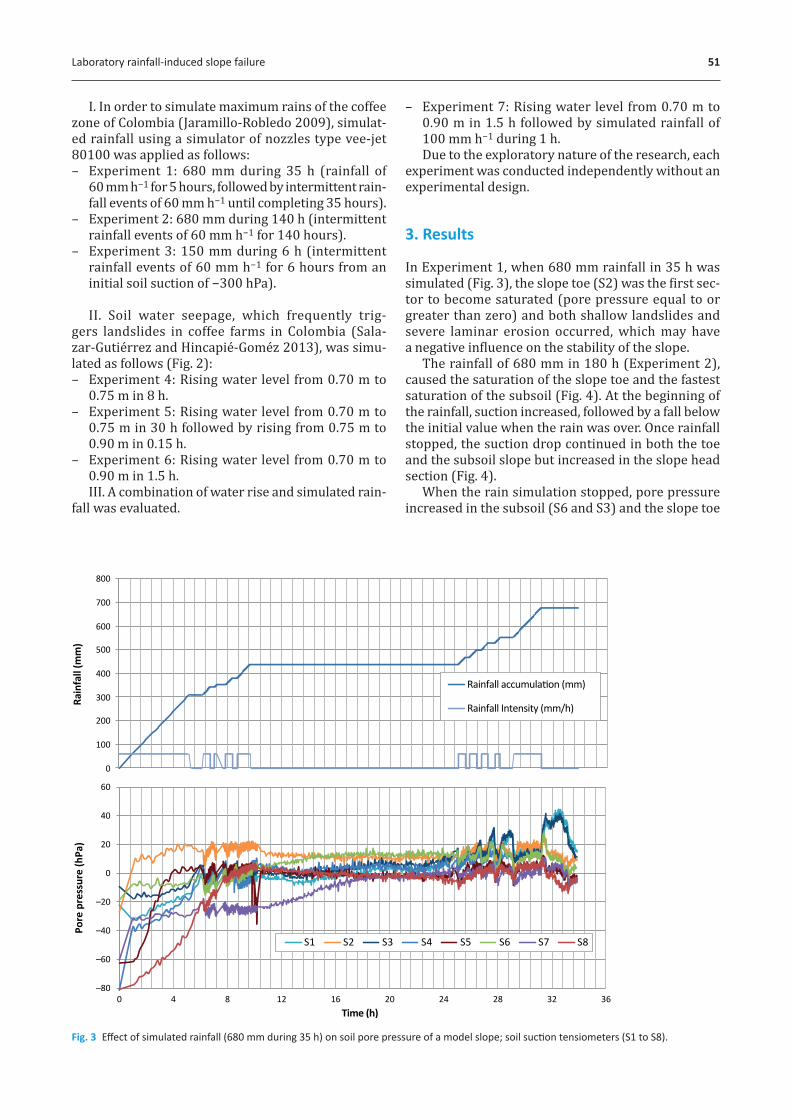
Laboratory rainfall-induced slope failure 51
I. In order to simulate maximum rains of the coffee zone of Colombia (Jaramillo-Robledo 2009), simulat-ed rainfall using a simulator of nozzles type vee-jet 80100 was applied as follows: – Experiment 1: 680 mm during 35 h (rainfall of
60 mm h−1 for 5 hours, followed by intermittent rain-fall events of 60 mm h−1 until completing 35 hours).
– Experiment 2: 680 mm during 140 h (intermittent rainfall events of 60 mm h−1 for 140 hours).
– Experiment 3: 150 mm during 6 h (intermittent rainfall events of 60 mm h−1 for 6 hours from an initial soil suction of −300 hPa).
II. Soil water seepage, which frequently trig-gers landslides in coffee farms in Colombia (Sala-zar-Gutiérrez and Hincapié-Goméz 2013), was simu-lated as follows (Fig. 2): – Experiment 4: Rising water level from 0.70 m to
0.75 m in 8 h.– Experiment 5: Rising water level from 0.70 m to
0.75 m in 30 h followed by rising from 0.75 m to 0.90 m in 0.15 h.
– Experiment 6: Rising water level from 0.70 m to 0.90 m in 1.5 h.III. A combination of water rise and simulated rain-
fall was evaluated.
– Experiment 7: Rising water level from 0.70 m to 0.90 m in 1.5 h followed by simulated rainfall of 100 mm h−1 during 1 h.Due to the exploratory nature of the research, each
experiment was conducted independently without an experimental design.
3. Results
In Experiment 1, when 680 mm rainfall in 35 h was simulated (Fig. 3), the slope toe (S2) was the first sec-tor to become saturated (pore pressure equal to or greater than zero) and both shallow landslides and severe laminar erosion occurred, which may have a negative influence on the stability of the slope.
The rainfall of 680 mm in 180 h (Experiment 2), caused the saturation of the slope toe and the fastest saturation of the subsoil (Fig. 4). At the beginning of the rainfall, suction increased, followed by a fall below the initial value when the rain was over. Once rainfall stopped, the suction drop continued in both the toe and the subsoil slope but increased in the slope head section (Fig. 4).
When the rain simulation stopped, pore pressure increased in the subsoil (S6 and S3) and the slope toe
–80
–60
–40
–20
0
20
40
60
0 4 8 12 16 20 24 28 32 36
Pore
pre
ssur
e (h
Pa)
Time (h)
S1 S2 S3 S4 S5 S6 S7 S8
0
100
200
300
400
500
600
700
800
Rain
fall
(mm
)
Rainfall accumulation (mm)
Rainfall Intensity (mm/h)
Fig. 3 Effect of simulated rainfall (680 mm during 35 h) on soil pore pressure of a model slope; soil suction tensiometers (S1 to S8).
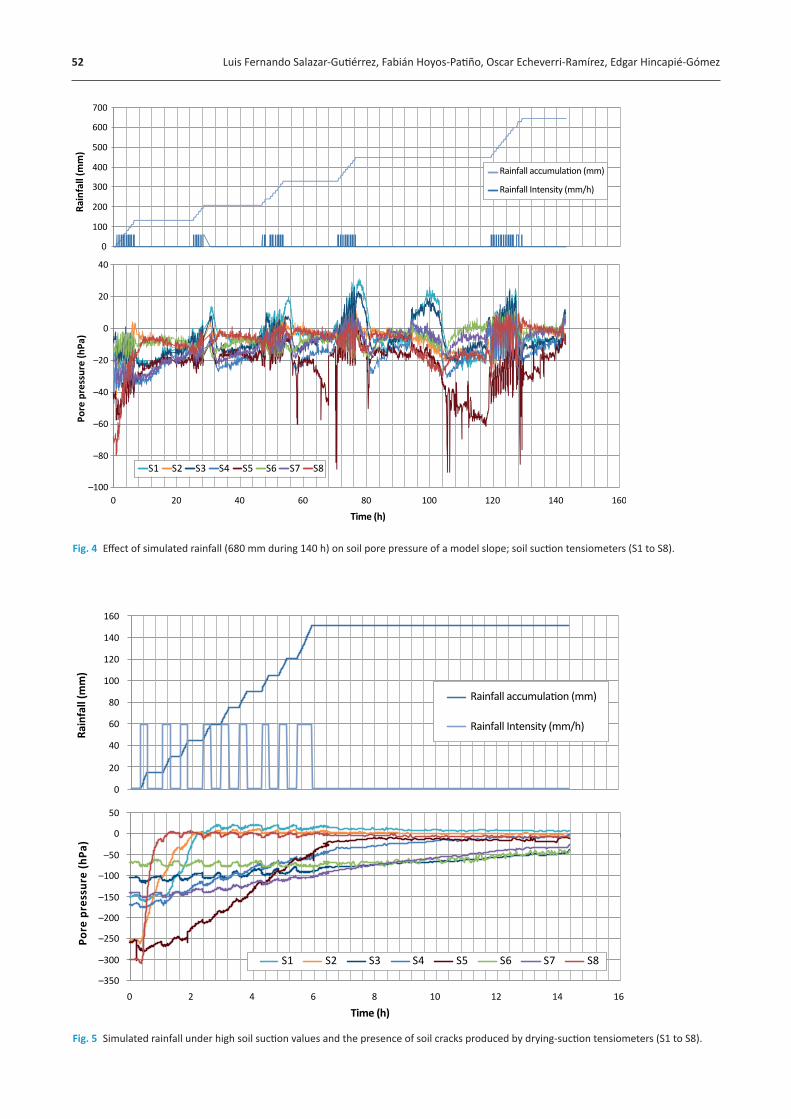
52 Luis Fernando Salazar-Gutiérrez, Fabián Hoyos-Patiño, Oscar Echeverri-Ramírez, Edgar Hincapié-Gómez
0
20
40
60
80
100
120
140
160
Rain
fall
(mm
)
Rainfall accumulation (mm)
Rainfall Intensity (mm/h)
–350
–300
–250
–200
–150
–100
–50
0
50
0 2 4 6 8 10 12 14 16
Pore
pre
ssur
e (h
Pa)
Time (h)
S1 S2 S3 S4 S5 S6 S7 S8
Fig. 5 Simulated rainfall under high soil suction values and the presence of soil cracks produced by drying-suction tensiometers (S1 to S8).
–100
–80
–60
–40
–20
0
20
40
0 20 40 60 80 100 120 140 160
Pore
pre
ssur
e (h
Pa)
Time (h)
S1 S2 S3 S4 S5 S6 S7 S8
0
100
200
300
400
500
600
700
Rain
fall
(mm
)
Rainfall accumulation (mm)
Rainfall Intensity (mm/h)
Fig. 4 Effect of simulated rainfall (680 mm during 140 h) on soil pore pressure of a model slope; soil suction tensiometers (S1 to S8).
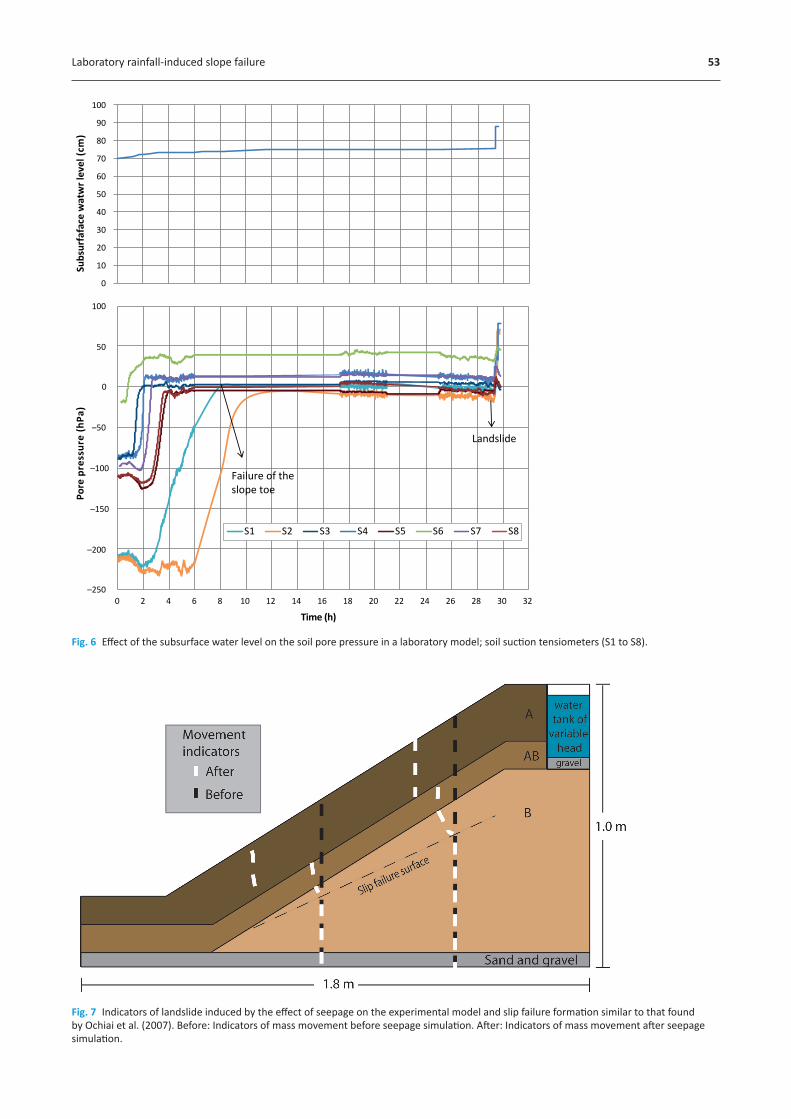
Laboratory rainfall-induced slope failure 53
–250
–200
–150
–100
–50
0
50
100
0 2 4 6 8 10 12 14 16 18 20 22 24 26 28 30 32
Pore
pre
ssur
e (h
Pa)
Time (h)
Failure of the slope toe
0
10
20
30
40
50
60
70
80
90
100
Subs
urfa
face
wat
wr l
evel
(cm
)
Landslide
S1 S2 S3 S4 S5 S6 S7 S8
Fig. 6 Effect of the subsurface water level on the soil pore pressure in a laboratory model; soil suction tensiometers (S1 to S8).
Fig. 7 Indicators of landslide induced by the effect of seepage on the experimental model and slip failure formation similar to that found by Ochiai et al. (2007). Before: Indicators of mass movement before seepage simulation. After: Indicators of mass movement after seepage simulation.
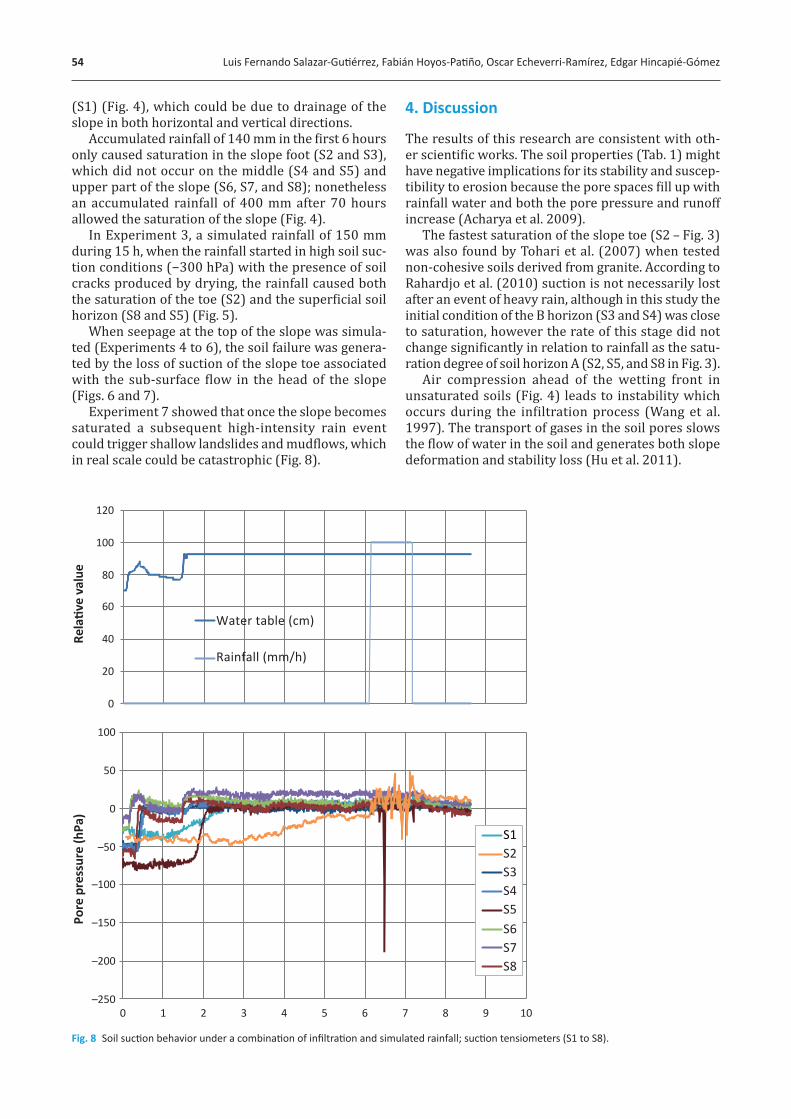
54 Luis Fernando Salazar-Gutiérrez, Fabián Hoyos-Patiño, Oscar Echeverri-Ramírez, Edgar Hincapié-Gómez
(S1) (Fig. 4), which could be due to drainage of the slope in both horizontal and vertical directions.
Accumulated rainfall of 140 mm in the first 6 hours only caused saturation in the slope foot (S2 and S3), which did not occur on the middle (S4 and S5) and upper part of the slope (S6, S7, and S8); nonetheless an accumulated rainfall of 400 mm after 70 hours allowed the saturation of the slope (Fig. 4).
In Experiment 3, a simulated rainfall of 150 mm during 15 h, when the rainfall started in high soil suc-tion conditions (−300 hPa) with the presence of soil cracks produced by drying, the rainfall caused both the saturation of the toe (S2) and the superficial soil horizon (S8 and S5) (Fig. 5).
When seepage at the top of the slope was simula-ted (Experiments 4 to 6), the soil failure was genera-ted by the loss of suction of the slope toe associated with the sub-surface flow in the head of the slope (Figs. 6 and 7).
Experiment 7 showed that once the slope becomes saturated a subsequent high-intensity rain event could trigger shallow landslides and mudflows, which in real scale could be catastrophic (Fig. 8).
4. Discussion
The results of this research are consistent with oth-er scientific works. The soil properties (Tab. 1) might have negative implications for its stability and suscep-tibility to erosion because the pore spaces fill up with rainfall water and both the pore pressure and runoff increase (Acharya et al. 2009).
The fastest saturation of the slope toe (S2 – Fig. 3) was also found by Tohari et al. (2007) when tested non-cohesive soils derived from granite. According to Rahardjo et al. (2010) suction is not necessarily lost after an event of heavy rain, although in this study the initial condition of the B horizon (S3 and S4) was close to saturation, however the rate of this stage did not change significantly in relation to rainfall as the satu-ration degree of soil horizon A (S2, S5, and S8 in Fig. 3).
Air compression ahead of the wetting front in unsaturated soils (Fig. 4) leads to instability which occurs during the infiltration process (Wang et al. 1997). The transport of gases in the soil pores slows the flow of water in the soil and generates both slope deformation and stability loss (Hu et al. 2011).
–250
–200
–150
–100
–50
0
50
100
0 1 2 3 4 5 6 7 8 9 10
Pore
pre
ssur
e (h
Pa)
Time (h)
S1S2S3S4S5S6S7S8
0
20
40
60
80
100
120
Rela
tive
valu
e
Water table (cm)
Rainfall (mm/h)
Fig. 8 Soil suction behavior under a combination of infiltration and simulated rainfall; suction tensiometers (S1 to S8).
Laboratory rainfall-induced slope failure 55
Rahardjo et al. (2010) found similar results in their field experiments which may be interpreted as if when the simulated precipitation was over, the degree of saturation in the upper part of the slope decreased and in the lower part continued to increase. When the rain finished the infiltration and the decrease in soil suction continued (Fig. 4).
The initial slope state in terms of soil suction (Fig. 5) can also affect the rate of soil saturation, this has been found in several experimental models, where soils with fine particles subjected to drying, showed that infiltration is not governed by soil per-meability as it is by the preferential flow through the soil discontinuities developed by soil drying (Lee et al. 2011).
A slip failure surface similar to that found by Ochi-ai et al. (2007) was formed (Fig. 7); the failure was associated with the permeability of the soil horizons and the changes in the soil water table (Figs. 6 and 7). Changes in soil matric potential can result in adverse variations in the soil shear strength as well as in the soil volume (Fredlund 2006).
Similar to our results (Figs. 6, 7 and 8), Jia et al. (2009) found a major problem of a large number of failures observed during the rapid fluctuation of the water level on the slopes. In this sense Germer and Braun (2011) found that the position of the water table and especially the abrupt change in pore pres-sure have a large influence on the stability conditions of a slope; for that reason, these authors suggest that pore pressure monitoring is an important tool of sta-bility prediction.
Mortrasio and Valentino (2007), working with experimental models on soils derived from pyroclas-tic materials, found that the slope failure occurred just after reaching full saturation of the slope; similar con-clusions were reached in our investigation (Figs. 6, 7 and 8). This type of flows has already caused disasters in the municipality of Ibague – Colombia (Beltran et al. 2006).
The results have a limited scope due to the sam-pling site may not represent the general behavior of the soil derived from granitic rocks, due to its hetero-geneity which is governed by soil formation factors. One of the major limitations of the experimental mod-el is the problem of scale.
From the results obtained, we can consider some practical recommendations for the management of coffee crops. The soil and water management prac-tices in coffee farming should prevent soil saturation by means of drainage systems and conservation tree planting in the toe of the slope. During long periods of drought in the coffee farming, it’s necessary to cov-er the soil with mulch to reduce the expansion crack formation which could have slope stabilization (Sala-zar-Gutiérrez and Hincapié-Goméz, 2013).
5. Conclusions
Experimental models can contribute to the knowledge of the behavior of the soil humidity and the failure of unsaturated soils triggering by rainfall or subsurface water flow. It helps to clarify the physical processes associated with the failure of the slopes.
Under study conditions, the results provide a link of mass movement to hydrological processes occur-ring in the slope which are related to the soil per-meability, intensity, and duration of the rainfall and water table changes. The major portion of soil slope instability was related to a saturated condition of the slope toe.
Acknowledgements
The authors acknowledge the National Federation of Coffee Growers of Colombia and to the National Center for Coffee Research – Cenicafe – for supporting and financing this research. To the National University of Colombia Campus Medellín – Magister Program in Geotechnical Engineering for its contributions.
References
Acharya, G., Cochrane, T.A., Davies, T., Bowman, E. (2009): The influence of shallow landslides on sediment supply: A flume-based investigation using sandy soil. Engineering Geology 109(3–4), 161–169, https:// doi.org/10.1016/j.enggeo.2009.06.008.
Beltran, J., Castiblanco, W., Alfaro, A. (2006): Evaluación de Zonas con posible amplificación topografica y susceptibles a deslizamientos debido a un sismo en Ibague-Colombia. IMME 44(3), 9–16. Online: http://www.scielo.org.ve/scielo.php?script=sci _arttext&pid=S0376-723X2006000300002&lng =es&nrm=iso>. ISSN 0376-723X.
Bujang, B. K., Faisal, H. J., Low, T. H. (2006): Water infiltration characteristics of unsaturated soil slope and its effect on suction and stability. Geotechnical and Geological Engineering 24, 1293–1306, https://doi .org/10.1007/s10706-005-1881-8.
Crozier, M. J. (2010): Deciphering the effect of climate on landslide activity: A review. Geomorphology 124, 260–267, https://doi.org/10.1016/j.geomorph .2010.04.009.
Fredlund, D. G. (2006): Unsaturated Soil Mechanics in Engineering Practice. Journal of Geotechnical and Geoenvironmental Engineering 132(3), 286–321, https://doi.org/10.1061/(ASCE)1090-0241 (2006)132:3(286).
Fredlund, D. G., Morgenstern, N. R., Widger, R. A. (1978): The shear strength of unsaturated soils. Canadian Geotechnical Journal 15(3), 313–321, https:// doi.org/10.1139/t78-029.

56 Luis Fernando Salazar-Gutiérrez, Fabián Hoyos-Patiño, Oscar Echeverri-Ramírez, Edgar Hincapié-Gómez
Fredlund, D.G.; Xing A. (1994): Equations for the soil-water characteristic curve. Canadian Geotechnical Journal 31, 521–532, https://doi.org/10.1139/t94-061.
Germer, K., Braun, J. (2011): Effects of saturation on slope stability: Laboratory experiments utilizing external load. Vadose Zone Journal 10(2), 477–486, https:// doi.org/10.2136/vzj2009.0154.
Gómez-Aristizabal, A., Grisales-García, A., Suarez-Serrato, J. (1975): Manual de conservación de suelos de ladera. Chinchina (Colombia), Cenicafe.
Hu, R., Chen, Y., Zhou, C. (2011): Modeling of coupled deformation, water flow and gas transport in soil slopes subjected to rain infiltration. Science China Technological Sciences 54(10), 2561–2575. https://doi.org/10.1007 /s11431-011-4504-z.
Jaramillo-Robledo, A. (2018). El clima de la caficultura en Colombia. Chinchina, Cenicafe.
Jaramillo-Robledo, A. (2009): Lluvias maximas en 24 horas para la región andina de Colombia. Cenicafe 56(4): 250–268.
Jia, G. W., Zhan, L.T, Chen, Y. M., Fredlund, D. G. (2009): Performance of a large-scale slope model subjected to rising and lowering water levels. Engineering Geology (106), 92–103, https://doi.org/10.1016/j.enggeo .2009.03.003.
Lee, M., Kassim, A., Gofar, N. (2011): Performances of two instrumented laboratory models for the study of rainfall infiltration into unsaturated soils. Engineering Geology 117, 78–89, https://doi.org/10.1016/j.enggeo .2010.10.007.
Mantilla, G., De La Torre, L. S., Gómez, C. E., Ordoñez, N., Ceballos, J. L., Euscategui, C., Pérez, P., Pérez, S., Martínez, N., Sanchez, R., Maldonado, N., Perez, S., Gaitan, J., Chaves, L., Chamorro, C., Flórez, A. (2001): Los suelos: estabilidad, productividad y degradación. In: Leiva, P. El medio ambiente en Colombia. IDEAM Bogota, 2° edición, 228–277.
Miyazaki, T. (1993): Water flow in soils. Marcel Dekker, Inc. New York.
Mortrasio, L., Valentino, R. (2007): Experimental analysis and modelling of shallow landslides. Landslides (4), 291–296, https://doi.org/10.1007/s10346-007-0082-3.
Ochiai, H., Sammori, H., Okada, Y. (2007): Landslide experiments on artificial and natural slopes. In: Sassa, K., Fukuoka, H., Wang, F., Wang, G. (Eds.), Progress in Landslide Science, Springer, Berlin, Heidelberg, 209–226, https://doi.org/10.1007/978-3-540-70965-7_15.
Rahardjo, H., Ong, T. H., Rezaur, R. B., Leong, E. C., Fredlund, D. G. (2010): Response parameters for characterization of infiltration. Environment Earth Science 60, 1369–1380, https://doi.org/10.1007/s12665-009 -0273-4.
Salazar-Gutierrez, L. F., Hincapie-Gómez, E. (2013): Conservación de suelos y aguas. Manual del cafetero colombiano. Investigación y tecnología para la sostenibilidad de la caficultura. Chinchina. Caldas. Colombia: FNC-Cenicafe, 287–320.
Sidle, R. C., Bogaard, T. A. (2016): Dynamic earth system and ecological controls of rainfall-initiated landslides. Earth-Science Reviews 159, 275–291, https:// doi.org/10.1016/j.earscirev.2016.05.013.
Tohari, A., Nishigaki, M., Komatsu, M. (2007): Laboratory rainfall-induced slope failure with moisture content measurement. Journal of Geotechnical and Geoenviromental Engineer 133(5), 575–587, https://doi.org/10.1061/(ASCE)1090-0241(2007)133:5(575).
Wang, Z. J., Feyen, D. R., Van Genuchten, M. T. (1997): A two-phase flow infiltration equations accounting for air entrapment effects. Water Resources Research 33(2), 2759–2767, https://doi.org/10.1029/97WR01708.
Wu, L. Z., Zhoua, Y., Sunb, P., Shi, J. S., Liu, G. G., Bai, L. Y. (2017): Laboratory characterization of rainfall-induced loess slope failure. Catena 150(2017), 1–8, https:// doi.org/10.1016/j.catena.2016.11.002.

Original Article 57
Speed dating: an effective tool for technology transfer in a fragmented regional innovation system?Vojtěch Kadlec*
Charles University, Faculty of Science, Department of Social Geography and Regional Development, Czechia* Corresponding author: [email protected]
ABSTRACTThe main goal of this paper is to demonstrate the impacts of speed dating on the enhancement of university-business collaboration. With the example of the metropolitan region of Prague and its largest university (Charles University), the case study on a speed dat-ing event was organized by this University in the field of life science and medical devices. The results show, that speed dating itself has limited direct impact on real technology transfer. Only 1 of the 44 newly gained contacts was transformed into real cooperation in the form of consultancy. On the other hand, speed dating has several indirect impacts, which can moderate fragmentation of the regional innovation system, i.e. community and trust building, learning of common “language” and exchange of information. Direct impact can be enhanced by the follow-up activities of dedicated people (e.g. technology scouts or business development managers), who can encourage and support creation of more new technology partnerships.
KEYWORDSspeed dating; technology transfer; community building; follow-up activities
Received: 31 January 2019Accepted: 18 April 2019Published online: 20 May 2019
Kadlec, V. (2019): Speed dating: an effective tool for technology transfer in a fragmented regional innovation system? AUC Geographica 54(1), 57–66https://doi.org/10.14712/23361980.2019.6
© 2019 The Authors. This is an open-access article distributed under the terms of the Creative Commons Attribution License (http://creativecommons.org/licenses/by/4.0).

58 Vojtěch Kadlec
1. Introduction
The role of universities in the economic development of regions and states has become an integral part of the focus of researchers in regional development in recent years (Breznitz 2011; Czarnitzki et al. 2012; Goddard et al. 2013; Guerrero et al. 2014; Sotarauta and Suvinen 2018), as well as one of the priorities for support from the European Union Structural Funds and national finance for applied research. The coop-eration between universities and the business sector has thus become widely considered as an important component of development strategies of regions and engagement strategies of universities. Nevertheless, there are still many barriers that limit the effective transfer of technology and knowledge from universi-ties via channels such as contractual and collaborative research, intellectual property sales, active student engagement or corporate university professorships.
In general, cooperation between firms and univer-sities or research organizations is most often seen in the context of promoting innovation and knowl-edge-based competitiveness that would enhance overall social and economic development (Nonaka and Takeuchi 1995; Kadlec and Blažek 2015; Coenen et al. 2017).1 However, expectations of the benefits of closer links between universities and firms, both in terms of research and human resources, are based on positive examples from advanced countries, especial-ly from Western Europe or the United States of Amer-ica, which differ substantially from post-communist countries in terms of institutional frameworks and highly developed business sectors.
Prague, as one of the most developed regions in post-communist countries, is characterized by the so-called fragmented regional innovation sys-tem (Tödtling and Trippl 2005; Blažek and Žížalova 2010), with a high density of actors; however, the subsystems of knowledge generation and knowledge exploitation are only poorly interconnected. Charles University is undoubtedly one of the key stakeholders in the Prague innovation ecosystem. Its active partici-pation in the systematic building of research coopera-tion with companies through appropriate tools might represent a significant step towards higher socio-eco-nomic benefits from the transfer of knowledge and technology in Prague.
One of the tools for effectively overcoming the frag-mentation of the whole system – and for building or enhancing both formal and informal relationships – is speed dating (Maxwell 2005; Tödtling and Trippl 2005). Speed dating can facilitate an effective increase in mutual cooperation among stakeholders, both in close and relatively remote fields, and promote tech-nology transfer among research organizations, uni-versities, and companies. This transfer can lead to
1 See also, for example, the National Research and Innovation Strategy for Smart Specialization of the Czech Republic (National RIS3 Strategy).
innovations that will strengthen a region’s develop-ment (Cooke and Leydesdorff 2006; Breznitz 2011; Czarnitzki et al. 2012; Franco and Gussoni 2014). Article aims to demonstrate the impacts of speed dat-ing event on technology transfer at Charler University, the biggest university in a fragmented regional inno-vation system of Prague. Thus, this article contributes to the literature by linking practical tool with theoret-ical background.
The article is structured as follows. The second chapter discusses the extant literature and theoretical concepts and it is followed by the third chapter, which explains the methodology approach and data. The fourth chapter presents the main empirical results and their discussion, and the paper is closed by the conclusions.
2. Role of speed dating in regional innovation systems
Most of the current conceptual approaches in the sphere of regional development deal with the collabo-ration between companies and research organizations (including universities). Such conceptual approaches include, for example, the concept of ‘differentiated knowledge bases’ (Asheim and Getler 2005; Asheim et al. 2007; Boschma 2017; Květoň and Kadlec 2018; Grillitsch et al. 2019b), local buzz and global pipelines (Bathelt et al. 2004; Bathelt 2007; Huggins et al. 2019; Grillitsch et al. 2019a), or Triple Helix (Etzkowitz and Leydesdorff 2000; Leydesdorff 2018). However, the regional innovation systems approach (Cooke et al. 1997; Cooke 2007; Coenen et al. 2017; Isaksen et al. 2018) seems particularly useful in terms of research and practice, as this approach to a large extent repre-sents the synthesis of the above-mentioned approach-es. The main advantage of the regional innovation systems approach is its more comprehensive charac-ter compared to other conceptualizations. It seeks to understand the functioning of the entire innovation system of the region and not just of partial areas, as is the case with other approaches. Another advan-tage of this approach is the fact that it provides not only an analytical tool for system research, but also a sound basis for the effective support of regional devel-opment (Tödtling and Trippl 2005; Moodysson et al. 2010; Flanagan and Uyarra 2016).
The regional innovation systems basically consist of two main subsystems: the subsystem of knowledge generation (primarily representing research organi-zations) and the subsystem of knowledge exploitation (which is mainly made up of companies). For the effi-cient functioning of the regional innovation system, it is important not only to achieve a sufficient size of

Speed dating in regional innovation systems 59
both subsystems, but also a proper interface between them (Blažek and Kadlec 2019; Asheim and Gertler 2005; Nonaka and Takeuchi 1995). From the point of view of the creation of innovation, which is the desired effect of knowledge and technology transfer, tacit (non-codified) knowledge is crucial; and person-al contact is essential for the transmission or exchange of tacit knowledge (Bathelt et al. 2004; Polanyi 1967). This is confirmed by the experience of managers in companies, who receive about two-thirds of their use-ful information from personal contacts and only one-third via formal documents (Davenport and Prusak 2000). Speed dating or other structured networking initiatives generally take on importance in this con-text. On the other hand, it is important to emphasize that the innovation process is a complex phenomenon and has many forms. Therefore, it would be unrealis-tic to expect that a single measure could be efficient in all cases.
However, in contrast to findings in the relevant literature, which are based mainly on research into highly developed world regions, there is only limited interaction in Czechia between the business sphere and the research organizations. In the Czech con-text, some authors even talk about the ‘Berlin Wall’ between the academic and business spheres (Blažek and Uhlíř 2007). The foundations of this ‘wall’ were laid during the decades of state-socialism, when on the one hand private entrepreneurial activity was ille-gal, which led to the suppression of entrepreneurial spirit and artificial and top-down-orchestrated coop-eration among businesses.
On the other hand, basic research was confined within institutes of the Academy of Sciences, which were not expected to come up with any kind of inno-vation, and research at universities was relatively marginal. This specific heritage, which is common in the former state-socialism economies (Jasinski 2010; Grimm and Jaenicke 2012; World Bank 2018), has created institutional practice that is unsuitable under the conditions of the market economy. Never-theless, despite the existence of the ‘wall’ between the academic community and the business sector, there are several interesting examples of cooperation that were able to overcome this barrier (Kadlec and Blažek 2015; Stejskal et al. 2016; World Bank 2018). Their common denominator is personal contact between representatives of both parties based upon trust and mutual respect. This confirms the key role of ‘soft’ fac-tors in regional development, such as mutual trust, reputation and skills of key personalities or the role of tacit knowledge that contains strategic information. In some instances, strategic information is even more important than technical information (know-how) (Amin and Hausner 1997). In essence, acquiring tacit knowledge is a key part of knowledge and technology transfer. This also underlines the importance of local buzz both on the regional level and on the organisa-tional level (Bathelt 2007; Grillitsch et al. 2019a).
Structural networking such as a speed dating can act as a condensing core for initiating new local buzz.
Speed dating can be considered as a sort of a more formalized local buzz (Bathelt et al. 2004), because it creates a space for formal and subsequently less for-mal discussions with both professional and informal content. This is related to the fact that speed dating events are designed to make participants feel com-fortable or even free. At the same time, speed dating is a very effective tool in terms of time and money. For example, each participant can meet more than twenty new people during less than two hours. Such efficien-cy is crucial for busy people from both academia and business. These two “worlds” differ in the language they use, approach to their jobs and also in their val-ue systems. Speed dating can help them build mutual empathy and also awareness about what they do and what they can offer to each other. Ideally, such net-working events can lead towards a more connected system, i.e. the fragmentation of regional innovation system is gradually moderated.
In this context, it is useful to recall three basic types of imperfect regional innovation systems, as defined by Tödtling and Trippl (2005). They comprise: (i) organizationally thin, where key knowledge insti-tutions are missing – this type is especially character-istic of peripheral regions; (ii) internally locked-in, where long-term specialization led to the inbreeding and emergence of the ‘not invented here’ syndrome, typical of old industrial regions; and (iii) fragmented, where the key players are not properly connected, as often occurs in metropolitan regions. From this perspective, Prague represents a typical example of a fragmented regional innovation system.
Accordingly, speed dating can be an appropriate tool in the case of such fragmented regional innova-tion systems, as it helps to build mutual trust based on personal reputation and tacit knowledge. During speed dating events, the participants share their professional backgrounds and goals (Chaston 1996; Lev 2003; Zimmerman and Forlizzi 2017). Speed dating as a networking tool for businesses and their representatives began to be used around the begin-ning of the new millennium in Western Europe and the USA, where it gained relatively high popularity (Maxwell 2005). In Czechia, speed dating as a form of quick acquaintance with business partners has become popular over the last ten years thanks to the activities of the South Moravian Innovation Center (JIC). Activities such as ‘120 seconds for innovation’ have also gradually begun to be developed in other Czech regions, even though these regions do not have a strong metropolitan core with a high concentration of R&D activities, such as Brno and Prague.
Although according to author’s knowledge the targeted use of speed dating as a tool for linking the academic and private spheres has not been studied systematically so far. Existing studies agree that speed dating has a positive impact on the level of actors’

60 Vojtěch Kadlec
engagement and business relationships (Chaston 1996; Lev 2003; Zimmerman and Forlizzi 2017; van de Laar 2019), indicating that structured and man-aged interconnection supports the emergence of new partnerships. Similar conclusions are made in a report by the Australian Government (2013), which highlights the contribution to competitiveness of mobilising local resources, e.g. university and busi-ness. Connecting relevant partners on a local level is a key element for overcoming the fragmentation of regional innovation system and for fostering com-petitiveness through efficient connection between existing or future demand and supply. Well-prepared speed dating initiatives can enhance the intercon-nectedness of stakeholders in both close and rela-tively remote fields, and, therefore, they can facilitate technology transfer between research organizations (including universities) and companies. This transfer can lead to significant innovations that will strength-en the region’s overall development.
Furthermore, the need to search for new partners is becoming an essential requirement in the context of current innovation and knowledge-based economies. The extant literature denotes this mode of collabo-ration as hyper-collaboration (Radjou and Prabhu 2015). Cooperation based on the principle of open innovation (Chesbrough 2006) shifts away from the paradigm that knowledge is power, to the paradigm that sharing knowledge is power (Radjou and Prabhu 2015).
3. Regional innovation context for technology transfer at Charles University
Technology and knowledge transfer are charac-terized by several specific features in the region of Prague. These features mainly relate to the relatively developed infrastructure needed for dynamic eco-nomic development and the high density of actors with high potential for technological or knowledge transfer. With these features is connected the imper-fect regional innovation system typical for metropol-itan regions, fragmented regional innovation system (Tödtling and Trippl 2005). A high concentration of actors can be documented by the fact that Prague’s metropolitan region represents one-third of Czech R&D employment, of which three-quarters represent jobs in the business sector, 11% in the government sector, and less than 10% in the university sector (Czech Statistical Office 2017a). Accordingly, 52% of all companies in Czechia are registered in Prague (Czech Statistical Office 2017b). High concentration of these actors also translates in relatively strong vol-ume of R&D activities. High development of Prague’s innovation system is proved by Blažek and Žižalova (2010), Blažek and Kadlec (2019) and Květoň and Kadlec (2018).
Charles University, with nearly 5,000 R&D and academic employees, represents 3% of Czech Sci-ence and Technology (S&T) employment, resp. 14% of (S&T) employment in Prague Thus, three faculties which participated in the speed dating event repre-sent about 1% of total Czech S&T employment and 4% of total Prague S&T employment. Employment in Science and Technology shows the dominant role of Prague in the national innovation system. Never-theless, small and medium sized companies (SMEs) in Prague collaborate on innovation with other part-ners almost 20% less than the SMEs in metropoli-tan regions in highly developed countries (Europe-an Commission 2016). This reflects the fragmented nature of Prague’s innovation system (Květoň and Kadlec 2018).
Tab. 1 Employment in Science and Technology.
Specialist in Science and Technology
Academic employees
R&D employees
FTE % FTE FTE
Czechia 144 508 100.0%
Prague 34 974 24.2%
Charles University 4 724 3.3% 3 839 885
3 selected faculties 1 473 1.0% 996 477
Faculty of Science 642 0.4% 349 292
Faculty of Mathematics and Physics
580 0.4% 408 172
3rd Medicine Faculty 252 0.2% 239 13
Source: Czech Statistical Office 2018 and Annual Report of Charles University, 2017
Charles University is one of the leading universi-ties in Central Europe. In some fields, such as some specialisations in Life Sciences including medical chemistry, analytical chemistry and parasitology, the university ranks among the world’s best (Jurajda et al. 2015). Yet, the third role of Charles Universi-ty – supporting economic and social development through knowledge spillovers and targeted knowl-edge transfer (Leydesdorff and Etzkowitz 1998; God-dard and Chatterton 1999; Holland 2001; Trippl et al. 2015) – is still largely underdeveloped. The transfer of technologies and knowledge has been carried out on an individual basis (by researchers themselves without any professional support) and with vary-ing intensity over the last decades. Fragmentation of R&D activities and the limited inter-faculty or inter-university co-operation in this area were and still are one of the causes and consequences of the disintegrated Prague innovation system (Blažek et al. 2011). Shown in Table 2, Charles University has only less than 2% of ROI (Return on investment) in R&D as technology transfer revenues. This contrasts with the situation in the USA, where the best universities

Speed dating in regional innovation systems 61
in technology transfer has the ROI around 9%2 (Far-rell 2008). Thus, so far, Charles University has not ful-filled its potential to be one of the leaders in research cooperation.
Tab. 2 Technology transfer revenues as a return on investments (ROI) in R&D, 2017–2015.
2017 2016 2015
R&D expenditures (mio. CZK) 1535.80 1483.38 1470.46
TT revenues (mio. CZK) 27.72 31.27 23.72
ROI 1.80% 2.11% 1.61%
Source: Annual Reports 2015–17 of Charles UniversityNote: R&D expenditures = purpose money + another national sources (Ministries, Technology Agency of Czech Republic, Grant Agency of Czech Republic etc.) + international resources (H2020, Frame Programmes, EU support, Non-EU support)
4. Methodology
This paper explores a case study focused on identi-fying the impacts of speed dating on technology and knowledge transfer in the context of a fragmented regional innovation system. The research was not intended to be representative but to give deep insights into one concrete case study. Therefore, the methodol-ogy is based on questionnaires containing both closed and open questions and participatory observation in combination with quantitative analysis based on data from questionnaires. Questionnaires were performed a few weeks after the speed dating event and two years later to observe a long-term impact of speed dating. The questionnaires were complemented by a participatory observation in order to add specific insights from the “backstage culture”, which enables author to describe “behaviours, intentions situations,
2 Excluding top 2 universities because of extreme values.
and events as understood by one’s informants” (as defined by DeMunck and Sobo 1998, p. 43).
This paper is based on data from one speed dat-ing event, which was, according to the author’s best knowledge, the first speed-dating event for connect-ing academia and business in Prague. This event inspired Prague’s municipality to organize another speed dating events, but the organizers didn’t collect any data relevant for this study. Therefore, this paper is based solely on this one event and thus cannot uncover more general patterns. On the other side, this approach allows author to observe both the direct and indirect long-term impact of speed dating. The following indicators were used:– number of new contacts,– number of appointments agreed during the event,– number of transformed new contacts into research
collaboration,– perception of added value of speed dating on uni-
versity-business collaboration,– main barriers of university-business collaboration,– perception of third role of university.
The first speed dating event ever held in Prague took place on 25 May 2016 and was organized by the Centre for the Transfer of Knowledge and Technolo-gy (CTKT) of Charles University, under the title ‘Sci-ence meets Business’. The theme was ‘Life Sciences and Medical Devices’, and the event was attended by 9 representatives of companies and 12 representa-tives of Charles University research teams from three faculties, namely the 3rd Faculty of Medicine (3. FM), the Faculty of Mathematics and Physics (MFF), and the Faculty of Sciences (FS) (see Table 3). The event spanned over two hours, during which the individu-al representatives of research teams and companies alternated in a round-table fashion. The event start-ed with a keynote speech about the current trends
Tab. 3 Overview of participants in the speed dating event ‘Science meets Business’.
CU Research teams Companies
Computer Graphics Group, MFF Contipro Group, s.r.o.
Coordination Group of Bioorganic Chemistry, FS Contipro Pharma, a.s.
Group of Biomolecular Physics, MFF Dyntec spol. s r.o.
Laboratory of Yeast Colony Biology, FS ELLA-CS, s.r.o.
Laboratory of Electrophoretic Separation Methods, 3. FM Interpharma, a.s.
Laboratory of Immunoregulation, FS LINET Holding, s.r.o.
Laboratory of Tumor Cell Invasiveness, FS Medicem Institute, s.r.o.
Laboratory of Structure and Function of Biomolecules, FS SciTech Visual s.r.o.
Laboratory of Molecular Carcinogenesis and Drug Development, FS SOTIO a.s.
UNESCO Laboratory of Environmental Electrochemistry, FS
Photochemistry and Supramolecular Chemistry of Porphyrinoids, FS
Specialized Experimental Imaging Laboratory, 3. FM
Source: FS CU – https://www.natur.cuni.cz/fakulta/veda-a-vyzkum/prenos-poznatku-a-technologii/vedci-potkavaji-firmy-aneb-navazujeme-nova -partnerstvi?searchterm=vědci+potk
62 Vojtěch Kadlec
in corporate R&D, which opened the first theme for discussion, and continued with two minutes pres-entations, where each participant introduced him-self/herself with his/her offer and demand. At each table sat 5 or 6 participants. The event had 5 rounds of these roundtables with a coffee break and dinner for subsequent informal networking.
The collection of primary data was performed through two online questionnaires (including open and closed questions). The first questionnaire had a return rate of 86% (17 from 21); the second done two years later was still relatively high with 43% (9 from 21). The first questionnaire was completed a few weeks after the event (25. 5. – 10. 6. 2016) with the goal to identify the number of new contacts includ-ing the names of the most relevant contact, to map the character of considered cooperation and to get feedback on the meaningfulness of the event itself. The second questionnaire, organized two years later (30. 11. – 16. 12. 2018), aimed at analysing the real impact on university-business collaboration, i.e. new-ly established collaboration and its nature, reasons why collaboration was or was not established, alter-native tools how to promote technology and knowl-edge transfer and perception of the “third role” of the university.3
These data and methods should help to answer the main research question: “What are the impacts of speed dating on technology and knowledge at Charles University?”
5. Impact of Speed Dating on Technology Transfer
The CTKT at Charles University in Prague decided to set-up the joint action of the Faculty of Science, the Faculty of Mathematics and Physics and the 3rd Faculty of Medicine in the form of the speed dating event to promote university-business collaboration. Within this networking session, vivid discussions at the end of each of the 15-minute blocks provided evi-dence of the sincere search of all participants to find new partners for cooperation across the disciplinary boundary. Moreover, participants continued their dis-cussions about possible cooperation during the infor-mal dinner and even after the official end of the event. The fact that almost every participant recommended that his colleague or business partner should attend a similar meeting was interpreted as a very positive perception of the usefulness of the action.4 In terms of positive effects and overcoming the fragmentation of the regional innovation system, this is an important
3 Universities consciously and strategically response to societal and economic challenges. (Zomer and Benneworth 2011)4 On a scale of 1 (not recommended at all) to 7 (certainly recommended), the median was 6, respectively 7 in the case of recommen-
dations to business partners. 5 18 out of 18 respondents said yes.
indicator, as personal recommendations are among the most effective references. At the same time, the participants themselves stated that they would take part in similar events again.5 Therefore, such form of an intensive networking is clearly capable to pro-mote the empathy of actors both from academia and companies as well as to increase the awareness about both the supply and demand in technology and knowledge transfer. Empathy is a crucial component of various speed dating events, which in turn helps to create effective local buzz, which then helps to connect yet non-connected actors. Sillanpää (2016) supports this finding on the example of young scien-tists in Finland entering into academic community and in collaboration with companies. Therefore, the fragmented regional innovation system can gradual-ly become more interconnected. Moreover, as van de Laar (2019) states, speed dating can help to overcome formal hierarchal structures.
This statement can be supported by the fact that participants were able to obtain 2.6 new contacts on average, even among seemingly unrelated indus-tries, which again contributes towards mitigation of the fragmentation of the regional innovation sys-tem in Prague’s metropolitan region. This finding is important, as one of the key risks of networking is the limited absorption capacity of the key players. When players have too many contacts, which they cannot manage, it can leads to the rejection of new contacts or to radical selectivity. This finding shows the rele-vance of concept of hyper-collaboration (Radjou and Prabhu 2015) and also shows how systematic support can address the issue of lacking possibilities to find right partners. One example would be mutual interest between the representative of a hospital bed manu-facturer and a scientist focused on separation meth-ods. This is in line with cognitive proximity where similar knowledge bases can bridge on first view dif-ferent fields (Boshma 2005; Garcia et al. 200; Stram-bach and Klement 2012).
The total number of participants was relatively high, illustrating, among other things, that despite the absence of systematic support for the development of Prague’s innovation environment there is a relatively strong demand for new partners, both from compa-nies and from researchers. This is neatly illustrated by the following quotes obtained from the participants:– “The event was well managed on the organization-
al side, and the meeting was conducted in a friend-ly spirit. I made some interesting contacts and at least one lead for deeper cooperation. I can recom-mend it.” (company representative)
– “I perceived it as time used meaningfully.” (compa-ny representative)

Speed dating in regional innovation systems 63
– “The event was perfectly prepared, and it is very good that such actions are starting to take place.” (research team representative)These quotes are supported by findings of van de
Laar (2019, p.1) who stated, that speed dating bring the “meta value” in: “Creativity, exploring various angles to look at your research topic, and allowing yourself to think outside the box …”
Nevertheless, our survey performed two years lat-er indicated that the potential established during the evening wasn’t fully exploited. Only 1 of the 44 newly gained contact was transformed into real coopera-tion in the form of consultancy. Another participant answered, that both sides had sincere will to meet in the future but were unable to arrange the appoint-ment and the meeting had lost priority over time. The rest of participants said, that they didn’t find a com-mon theme for future cooperation. As declared one of the participants, follow-up activities by technol-ogy scouts or business development managers are missing:
“In addition, there is a lack of professionals fully committed to mediation between the university and the firms. Neither companies nor university have such employee, and thus cooperation depends on who can find a place for co-operation” (research team representative).
On the other hand, all participants who answered this second survey performed after a two-year lag, still see the event as beneficial for building closer university-business cooperation. Participants most-ly appreciated that the event offers a pleasant and inspiring environment for establishing new relation-ships while participants can get an idea of what new projects are being done on both sides (i.e. academia and industry). This is also supported by Zimmerman and Forlizzi (2017) who developed speed dating for user experience design new products. Generally, par-ticipants mentioned the importance of building the community of experts in specific fields. Moreover, one of the researchers saw the benefit in communication with companies, respectively in learning how to com-municate with the business sector. Another partici-pant emphasised:
“I can see the benefit of the event in that it hap-pened at all. It was the first swallow that could give a chance for a new collaboration.” (research team representative)
Participants see the biggest barriers for a deep-er cooperation between universities and companies primarily in two spheres. The first sphere is repre-sented by a limited time of researchers to cooper-ate with companies along with their teaching duties and university research projects. The limited time roots mainly in high bureaucratic burdens and lim-ited human resources. On the side of companies, the biggest barrier perceived is represented by a limited innovation aspiration, which partially reflect the char-acter of national economy. In other words, the type
of demand from businesses is frequently unattractive for the researchers. In the context of concentration of company R&D in Prague we can view this barrier also through the view of the regional innovation system concept. The fragmented regional innovation system in Prague’s region lead to insufficient exchange of information and unawareness of the right partners. From this perspective, the benefit of speed dating events in the form of community building gains in its meaning.
The participants were also asked about their per-ception of the third role of the university. All partici-pants, who answered this question see the third role of the university as an important and integral part of university activities. On the other hand, university researchers perceive that Charles University has not yet made sufficient use of its potential. Moreover, one of the researchers emphasized:
“The idea is right, but the actual realization is important.” (research team representative)
This is a very important idea and actually it is also the hardest part. At the same time, this view illus-trates more than ten years of discussion on the third role of Charles University and the actual fulfilment of the visions declared in the University’s strategy. From the point of view of companies, universities should refrain from the ambition to build academic start-ups on their own. Instead, representatives of companies see the strongest competence of universities in an principal research, not in the business. According to them, the drivers for setting-up new start-ups should be experienced experts from industry. However, there are only a few such experts in Czechia, because of 40-year ban on private entrepreneurial initiative during the communist era. Despite these opinions of our respondents, foreign experience shows that academic start-up companies can represent one of the tools which can – at least in a long-term perspec-tive – eliminate the fragmentation of regional innova-tion system, because academic spin-offs can establish long-term relations between universities and busi-ness sectors.
6. Conclusions
The main goal of this paper was to demonstrate the impacts of speed dating on technology transfer. Using the example of the Prague region and its biggest uni-versity was elaborated in this case study of a speed dating event organized by Charles University in the field of life science and medical devices.
Despite the fact that after the end of the speed dating event, it seemed that a number of new part-nerships and cooperation could be established, our survey performed two years later showed that this has not actually happened. Overall, only a single new contact was transformed into real cooperation in the form of consultancy services. Therefore, we can
64 Vojtěch Kadlec
conclude that the direct impact of this first speed dat-ing event ever undertaken in Prague is low. This is mostly attributable to missing follow-up activities. In particular, follow-up activities, such as assistance from the technology scouts or from business development managers in establishing further appointments and moderating the following discussion could increase the success rate of future speed dating events.
On the other hand, the speed dating event had several indirect impacts, which can contribute to a gradual improvement of the regional innovation sys-tem. First of all, participants acknowledged the posi-tive effect on a sense of community building in their specific field. Moreover, already the first speed dating event enabled an exchange of information about the needs of companies as well as about current research projects at the university. This knowledge can also serve as inspiration for both sides in designing new research projects. Moreover, speed dating helped to exchange information not only between universi-ties and companies, but also between companies or research teams itself.
Another impact is in the learning process, when both sides, universities and company representatives, learn how to communicate with each other. Building common language is crucial for good understanding of the needs of both sides. Very often, the universi-ty-business partnership fails, because both compa-nies and researchers have different expectations. It is similar to traveling to foreign country without knowl-edge of a foreign language. Therefore, building of a common language is crucial in eliminating the frag-mentation of the innovation system.
This study is obviously limited by its pioneer char-acter, because speed dating events with the primary focus on supporting university-industry collabora-tion are still rare. Therefore, much more empirical research is needed in the future. However, the results of this speed-dating event underline the need for a more proactive approach, which can overcome the fragmentation of regional innovation systems and a need to gradually enrich the local buzz for an effec-tive technology transfer via properly designed fol-low-up activities.
Nevertheless, it has to be acknowledged that speed dating events and networking in general are likely to make the greatest contribution to knowledge trans-fer in metropolitan regions where a wide range of actors operates. This is in line with the current trend of ‘hyper-cooperation’, which encourages the more frequent use of such actions, as sharing knowledge is a key factor in the current innovation process. Last-ly, it should be emphasized that speed dating is not self-sustaining, and for effective and dynamic technol-ogy transfer it is necessary to use a wide spectrum of tools to enhance the broader acceptance of the need for effective cooperation between the academic com-munity and companies.
Acknowledgements
This work has been supported by Charles University [grant number UNCE/HUM/018].
References
Amin, A., Hausner, J. (1997): Beyond Market and Hierarchy: Interactive Governance and Social Complexity. Cheltenham: Edward Elgar.
Asheim, B. T., Getler, M. S. (2005): The geography of innovation: Regional innovation systems. In: Fagerberg, J., Mowery, D. C., Nelson, R. R. (eds.): The Oxford Handbook of Innovation, 291–317, Oxford: Oxford University Press.
Asheim, B. T., Coenen, L., Vang, J. (2007): Face-to-face, buzz and knowledge bases: Sociospatial implications for learning, innovation, and innovation policy, Environment and Planning C: Government and Policy 25, 655–670, https://doi.org/10.1068/c0648.
Australian Government (2013): Speed Dating for a Perfect Business Match. Central Highlands Digital Enterprise. Accessed at: http://www.digibiz.net.au/resources /Speed%20Dating%20for%20a%20Perfect%20Business %20Match.pdf.
Bathelt, H., Malberg, A., Maskell, P. (2004): Clusters and knowledge: Local buzz, global pipelines and the process of knowledge creation. Progress in Human Geography 28, 31–56, https://doi.org/10.1191/0309132504ph469oa.
Bathelt, H. (2007): Buzz-and-Pipeline Dynamics: Towards a Knowledge-Based Multiplier Model of Clusters. In: Geography Compass 1/6, 1282–1298, https://doi .org/10.1111/j.1749-8198.2007.00070.x.
Blažek, J., Kadlec, V. (2019): Knowledge bases, R&D structure and socio-economic and innovation performance of European regions. Innovation: The European Journal of Social Science Research 32(1), 26–47, https://doi.org /10.1080/13511610.2018.1491000.
Blažek, J., Uhlíř, D. (2007): Regional innovation policies in the Czech Republic and the case of Prague: An emerging role of a regional level? European Planning Studies 15, 871–888, https://doi.org/10.1080 /09654310701356175.
Blažek, J., Žižalova, P. (2010): The biotechnology industry in the Prague metropolitan region: A cluster within a fragmented innovation system? Environment and Planning C: Government and Policy 28, 887–904, https://doi.org/10.1068/c09113.
Blažek, J., Žižalova, P., Rumpel, P., Skokan, K. (2011): Where Does the Knowledge for Knowledge-intensive Industries Come From? The Case of Biotech in Prague and ICT in Ostrava. European Planning Studies 19(7), 1277–1303, https://doi.org/10.1080/09654313.2011.573136.
Boschma, R. (2005): Proximity and Innovation: A Critical Assessment. Regional Studies 39(1), 61–74, https:// doi.org/10.1080/0034340052000320887.
Boschma, R. (2017). A concise history of the knowledge base literature: Challenging questions for future research. Papers in Evolutionary Economic Geography (PEEG) 1721, Utrecht University, Department of Human
Speed dating in regional innovation systems 65
Geography and Spatial Planning, Group Economic Geography.
Breznitz, S. M. (2011): Improving or impairing? Following technology transfer changes at the University of Cambridge. Regional Studies 45, 463–478, https:// doi.org/10.1080/00343401003601909.
Charles University (2018): Annual Report 2017. Accessed 27. 8. 2017 at: https://www.cuni.cz/UK-8533-version1 -vzc_2017_web.pdf
Chaston, I. (1996): Critical events and process gaps in the Danish Technological Institute SME structured networking model. International Small Business Journal 14, 71–84, https://doi.org/10.1177 /0266242696143004.
Chesbrough, H. (2006): Open Innovation: The New Imperative for Creating and Profiting from Technology. Boston: Harvard Business School Publishing.
Coenen, L., Asheim, B. T., Bugge, M. M., Herstad, S. (2017): Advancing Regional InnovationsSystems: What Does Evolutionary Economic Geography Bring to the Policy Table? Environment and Planning C: Government and Policy 35(4), 600–620, https://doi.org/10.1177 /0263774X16646583.
Cooke, P. (2007): Regional innovation systems, asymmetric knowledge and the legacies of learning. In: Rutten, R., Boekema, F. (eds.): The Learning Region. Foundations, State of the Art, Future, 184–206. Cheltenham.
Cooke, P., Leydesdorff, L. (2006): Regional development in the knowledge-based economy: The construction of regional advantage. Journal of Technology Transfer 31, 5–15, https://doi.org/10.1007/s10961-005-5009-3.
Cooke, P., Uranga, M. G., Etxebarria, G. (1997): Regional innovation systems: Institutional and organisational dimensions. Research Policy 26, 475–491, https:// doi.org/10.1016/S0048-7333(97)00025-5.
Czarnitzki, D., Hussinger, K., Schneider, C. (2012): The nexus between science and industry: Evidence from faculty inventions. Journal of Technology Transfer 37, 755–776, https://doi.org/10.1007/s10961-011-9214-y.
Czech Statistical Office (2017a): Data on Research and Development (R&D) in the regions of the Czech Republic for the years 2005–2015. Accessed 27.8.2017 at: https://www.czso.cz/csu/czso/statistika_vyzkumu_a_vyvoje
Czech Statistical Office (2017b): Economic entities according to selected legal forms – territorial comparison. Accessed 27. 8. 2017 at: https://vdb.czso .cz/vdbvo2/faces/index.jsf?page=vystup-objekt&pvo =ORG02&katalog=30831&z=T&f=TABULKA&str=v7&evo =v460_!_VUZEMI97-100_1&c=v4~2__RP2015MP12DP31
Czech Statistical Office (2018): Economic entities according to selected legal forms – territorial comparison. Accessed 29. 12. 2018 at: https://www.czso.cz/csu/czso/specialiste-v-oblasti-vedy-a-techniky-a-jejich-mzdy
Davenport, T. H., Prusak, L. (2000): Working Knowledge: How Organisations Manage What They Know. Boston: Harvard Business Press, https:// doi.org/10.1145/347634.348775.
deMunck, V. C., Sobo, E. J. (1998): Using methods in the field: a practical introduction and casebook. Walnut Creek: AltaMira Press.
Etzkowitz, H., Leydesdorff, L. (2000): The dynamics of innovation: From national system and ‘mode 2’ to a triple helix of university-industry-government relations.
Research Policy 29, 109–123, https://doi.org/10.1016 /S0048-7333(99)00055-4.
European Commission (2016): Regional Innovation Scoreboard, https://doi.org/10.2873/84730.
Farrell, M. (2008): Universities That Turn Research Into Revenue. Forbes. Accessed 18. 1. 2019 at: https://www .forbes.com/2008/09/12/google-general-electric-ent -tech-cx_mf_0912universitypatent.html#3be2c8c66a3a
Flanagan, K., Uyarra, E. (2016): Four Dangers in Innovation Policy Studies–and how to Avoid Them. Industry and Innovation23 (2), 177–88, https://doi.org/10.1080 /13662716.2016.1146126.
Franco, C., Gussoni, M. (2014): The role of firm and national level factors in fostering R&D cooperation: A cross country comparison. Journal of Technology Transfer 39, 945–976, https://doi.org/10.1007/s10961-013-9306-y.
Garcia, R., Araújo, V., Mascarini, S., Gomes Dos Santos, E., Costa, A. R. (2018): An Analysis of the Relation Between Geographical and Cognitive Proximity in University-Industry Linkages, Anais do XLIV Encontro Nacional de Economia. Proceedings of the 44th Brazilian Economics Meeting, 132, ANPEC.
Goddard, J., Chatterton, P. (1999): Regional development agencies and the knowledge economy: Harnessing the potential of universities. Environment and Planning C: Government and Policy 17, 685–699, https://doi.org /10.1068/c170685.
Goddard, J., Kempton, L., Vallance, P. (2013): Universities and smart specialisation: Challenges, tensions and opportunities for the innovation strategies of European regions. Ekonomiaz: Revista Vasca de Economi, 83, 83–102, https://doi.org/10.1068/c170685.
Grillitsch, M., Rekers, J. V., Tödtling, F. (2019a): When drivers of clusters shift scale from local towards global: What remains for regional innovation policy? Geoforum, 102, 57–68, https://doi.org/10.1016/j.geoforum .2019.03.010.
Grillitsch, M., Schubert, T., Srholec, M. (2019b): Knowledge base combinations and firm growth. Research Policy, 48(1), 234–247, https://doi.org/10.1016/j.respol .2018.08.009.
Grimm, H., Jaenicke J. (2012): What drives patenting and commercialisation activity at East German universities? The role of new public policy, institutional environment and individual prior knowledge. The Journal of Technology Transfer, 37(4), 454–477, https:// doi.org/10.1007/s10961-010-9195-2.
Guerrero, M., Urbano, D., Cunningham, J., Organ, D. (2014): Entrepreneurial universities in two European regions: A case study comparison. Journal of Technology Transfer, 39, 415–434, https://doi.org/10.1007/s10961-012 -9287-2.
Holland, B.A. (2001): Toward a definition and characterization of the engaged university. In: Metropolitan Universities, 2, 20–29.
Huggins, R., Izushi, H., Prokop, D. (2019): Regional advantage and the geography of networks: Explaining global–local knowledge sourcing patterns. Papers in Regional Science, 1–18, https://doi.org/10.1111/pirs. 12423.
Isaksen, A., Martin, R., Trippl, M. (2018): New Avenues for Regional Innovation Systems – Theoretical Advances, Empirical Cases and Policy Lessons. Cham: Springer Nature, https://doi.org/10.1007/978-3-319-71661-9.

66 Vojtěch Kadlec
Jasinski, A.H. (2010): Technology transfer in Poland: A poor state of affairs and a wavering policy. Science and Public Policy, 27(4), 235–240, https://doi.org/10.3152 /147154300781781904.
Jurajda, Š., Kouzoubek, S., Munich, D., Škoda, S. (2015): Mezinarodní srovnaní kvality publikačního vykonu vědních oboru v Ceske republice. IDEA – CERGE-EI 12/2015, 1–264.
Kadlec, V., Blažek, J. (2015): University-business collaboration as perceived by leading academics: Comparing and contrasting the two most innovative Czech regions. Erdkunde 69, 327–339, https://doi.org /10.3112/erdkunde.2015.03.03.
Květoň, V., Kadlec, V. (2018): Evolution of knowledge bases in European regions: searching for spatial regularities and links with innovation performance. European Planning Studies 26(7), 1366–1388, https://doi.org /10.1080/09654313.2018.1464128.
Leydesdorff, L. (2018): Synergy in Knowledge-Based Innovation Systems at National and Regional Levels: The Triple-Helix Model and the Fourth Industrial Revolution. Journal of Open Innovation: Technology, Market, and Complexity 4(2), 1–16, https://doi .org/10.3390/joitmc4020016.
Leydesdorff, L., Etzkowitz, H. (1998): The triple helix as a model for innovation studies. Science and Public Policy 25, 195–203.
Lev, L. (2003): Using speed dating techniques to enliven and improve conferences and workshops. Journal of Extension 41(2), 2TOT4.
Maxwell, K. (2005): Speed networking. Accessed 26. 10. 2016 at: http://www.macmillandictionary.com /buzzword/entries/speed-networking.html
Moodysson, J., Coenen, L., Asheim, B. (2010): Two sides of the same coin? Local and global knowledge flows in Medicon Valley. In: Belussi, F., Sammarra, A. (eds.): Business Networks in Clusters and Industrial Districts: The Governance of the Global Value Chain, 356–376.
Nonaka, I., Takeuchi, H. (1995): The Knowledge-Creating Company. Oxford and New York: Oxford University Press.
Polanyi, M. (1967): The Tacit Dimension. London: Routledge & Kegan Paul.
Radjou, N., Prabhu, J. (2015): Frugal Innovation: How to do More with Less. London: Profile Books.
Sillanpää, V. (2016): Research speed dating, connectedness and comradeship. Alto University. Available from: https://www.aallonhuiput.fi/research-speed-dating -connectedness-and-companionship/
Sotarauta, M., Suvinen, N. (2018): Institutional Agency and Path Creation: Institutional Path from Industrial to Knowledge City. In Isaksen, A., Martin, R.,Trippl, M. (eds) New Avenues for Regional Innovation Systems – Theoretical Advances, Empirical Cases and Policy Lessons. Cham: Springer Nature, https:// doi.org/10.1007/978-3-319-71661-9_5.
Stejskal, J., Meríčkova B., Prokop, V. (2016): The cooperation between enterprises: Significant part of the innovation process. A case study of the Czech machinery industry. Ekonomie a Management 19, 110–122, https://doi.org /10.15240/tul/001/2016-3-008.
Strambach, S., Klement, B. (2012): Cumulative and Combinatorial Micro-dynamics of Knowledge: The Role of Space and Place in Knowledge Integration. European Planning Studies 20(11), 1843–1866, https://doi.org /10.1080/09654313.2012.723424.
Tödtling, F., Trippl, M. (2005): One size fits all? Towards a differentiated regional innovation policy approach. Research Policy 34, 1203–1219, https://doi.org /10.1016/j.respol.2005.01.018.
Trippl, M., Sinozic, T., Smith, H. L. (2015): The Role of Universities in Regional Development: Conceptual Models and Policy Institutions in the UK, Sweden and Austria. European Planning Studies 23(9), 1722–1740, https://doi.org/10.1080/09654313.2015.1052782.
van de Laar, M. (2019): Research speed dating: Breaking the ice to build capacity and networks, United Nation University: Maastricht University. Accessed 6. 4. 2019 at: https://www.merit.unu.edu/research-speed-dating -breaking-the-ice-to-build-capacity-networks/
World Bank (2018): Poland Catching-up Regions: Overview report, Washington: World Bank Publications.
Zimmerman. J., Forlizzi. J. (2017): Speed Dating: Providing a Menu of Possible Futures. The Journal of Design, Economics, and Innovation 3(1), 30–50, https://doi.org /10.1016/j.sheji.2017.08.003.
Zomer, A., Benneworth, P. (2011): The rise of the university’s Third Mission. In: J. Enders, H. F. de Boer, D. Westerheijden (eds.) Reform of higher education in Europe, Rotterdam: Sense Publishers, https://doi.org /10.1007/978-94-6091-555-0_6.
Original Article 67
Tourists’ satisfaction with public transport services in Lagos, NigeriaAli Alphonsus Nwachukwu*, Nwosu Ijeoma Gladys, Okpe Kennedy Chikezie
University of Nigeria, Faculty of Social Science, Department of Geography, Nigeria* Corresponding author: [email protected]
ABSTRACTThis research examined tourists use and perception of public transport services in the city of Lagos, Nigeria. It strived to find out factors that influence their level of satisfaction with public transport services. Data were collected from a study of tourists using a self-rating questionnaire with an intercept survey at chosen tourist sites in Lagos. Data were analysed using descriptive statistics, principal component analysis and discriminant function analysis. The results depict that tourists were not satisfied with public transport services in the city of Lagos. Principal component analysis results identified five underlying components – accessibility, journey comfort, traveling security, traveling information, and customer services − that impact on tourists’ contentment with public transportation services. The study recommended extensive improvement of public transport systems that will enhance satisfaction of tourists and help to address tourists and local users’ problems of using public transport systems get to their destinations in the city of Lagos.
KEYWORDSpublic transport; urban tourism; tourist use; satisfaction; quality of service attributes
Received: 28 August 2018Accepted: 29 April 2019Published online: 13 June 2019
Nwachukwu, A. A., Gladys, N. I., Chikezie, O. K. (2019): Tourists’ satisfaction with public transport services in Lagos, Nigeria. AUC Geographica 54(1), 67–80https://doi.org/10.14712/23361980.2019.7
© 2019 The Authors. This is an open-access article distributed under the terms of the Creative Commons Attribution License (http://creativecommons.org/licenses/by/4.0).

68 Ali Alphonsus Nwachukwu, Nwosu Ijeoma Gladys, Okpe Kennedy Chikezie
1. Introduction
The importance of transportation for tourism is the same as the importance of water for navigation (Aso-kan and Prideaux 2000; Praveen 2013; Ladki et al. 2014; Yuksek et al. 2016; Ojekunle et al. 2016). “Good quality public transport services improve connec-tivity of urban places and improve development, by carrying several users in the available space. Mass transit has a significant task to play in relieving traf-fic jam and make flows of traffic to flow smoothly by moving large numbers of passengers very efficiently” (Flausch 2015: 1–2). Public transportation in urban areas refers to any transport system by which a great-er number of urban population obtain access to reach socio-economic activities and services they need to enhance their sustenance and welfare (Fitzger-ald 2012). The importance of comprehending and facilitating the use of public transport by tourists is becoming increasingly important because of the sig-nificance of the tourist economy for numerous urban areas including city of Lagos. In spite of that, majority of researchers focused on the use of public transport by local residents with little or no knowledge about the public transport needs of tourists in urban tour-ism including the city of Lagos. To encourage the use of mass transit either by local users or tourists it is vital to have well organized and functional public transport system that is demand-oriented with a good knowledge of user behaviour (Oseyomon and Ibadin 2016). Previous research on customer satisfaction with public transport at nationwide and district lev-els in Nigeria concentrated only on local customers (Ali 2014; Afolabi 2016; Oseyomon and Ibadin 2016: Wojuade and Badiora 2017), yet, there is no publica-tions on tourist contentment with mass transit servic-es within Nigerian metropolises including the city of Lagos For the providers of mass transit, the additional incomes they make depend on the more passengers that patronize the services they provide. It is essen-tial, hence, to comprehend in what ways visitors uti-lize mass transportation so that blueprints and mar-keting master plans for model rearrangement may be evolved in the city of Lagos.
Lagos as one of the major tourism cities in Nigeria with the growing improvement of public transport network supplies an outstanding situation in the country for a research of visitor utilization of mass transit at a metropolitan attraction. Again, according to the 2014 Mastercard Global Destinations Cities Index, Lagos emerged the fourth most visited des-tination city in Africa with 1.3million internation-al overnight visitors up 5.8 percent from the 1.25 million international visitors who visited the city in 2013. International visitors to Lagos in 2014 spent US $710 million, up 3.8 percent from the US $684 million in 2013 (Hedrick-Wong and Choong 2014). Again, presently “Lagos is housing 2000 industrial institu-tions, 10,000 business ventures and 23 industrial
estates. Lagos is accountable for thirty percent of nation’s Gross Domestic Products. It also accounts for seventy percent of the national maritime cargo freight; eighty percent international aviation traf-fic and fifty percent of energy consumed in Nigeria” (Babatunde 2016: 5). With these rich statistics that greatly underpin escalated advancement in tourism business in Lagos state, it becomes indispensable to investigate the perception of tourists of public trans-port in order to incorporate their ideas in improv-ing the existing public transport systems in Lagos. Public transport stated in this study refers mainly to buses and ferries. “Tourists are all visitors remain-ing behind between one night and one year outside their usual environment” (Peeters et al. 2004: 6). The identification of passenger needs and wants is of great importance for appropriate enhancement of the efficiency and quality of services of public trans-port systems (Banyte et al. 2011). Thus, this study investigated the tourist use of public transport in the city of Lagos, Nigeria. Three basic objectives pursued to achieve this aim were to (1) discern the tourists’ perception of public transportation services available in the city; (2) identify underlying factors that affect their satisfaction with public transport services in the city and (3) examine the most significant service quality attributes contributing to the overall satisfac-tion of tourists with the public transport as the deter-mination of the most influential service attributes is important for service improvement in the study area by the operators.
2. Literature Review
2.1 Tourist destination and transport accessibilityDevelopment of transport infrastructure and suffi-cient accessibility is essential for the development of tourism in any given areas (Więckowski et al. 2014). This is because the accessibility and quality of the transport system (especially public transportation network) motivate tourists to travel to several are-as within close proximity to make them enjoy many linked relaxation pursuits (Xiao et al. 2012). One of the major problems confronting many tourist sites in developing countries including Nigeria is poor phys-ical accessibility (Omisore and Akande 2009). Pre-dominantly, the geographic accessibility to any tourist destination can be affected by usable transport infra-structure and services (Kahtani et al. 2011). For the publicity of visitor attraction sites to be successful, accessibility is a vital matter. For a greater number of tourists, a satisfactory accessibility to a tourist attrac-tion is when the locale can be reached and toured, expeditiously, cheaply and congenially (e.g. by means of public transport). “As tourist attractions are con-nected to good roads, they then become highly acces-sible to numerous customers with their movements creating distinctive motif on spatial scenery. Tourist
Tourists’ satisfaction with public transport services in Lagos, Nigeria 69
attractions with excellent accessibility to customers will lessen the price of visitors patronizing the attrac-tion sites and also make them to go long distance to patronize other visitor attractions that they need to enjoy themselves” (Omisore and Akande 2009: 70). Accessibility of the destinations included the basic physical facilities, operational plans and government laws and opined that destination accessibility impacts on tourist satisfaction (Araslı and Baradarani 2014). Accessibility is studied as a dimension of transpor-tation services, destination image and dimension of attribute of satisfaction (Chi and Qu 2008; Currie and Falconer 2014).
2.2 Customer Satisfaction with Public Transport The import of customer satisfaction both practically and theoretically for organizations’ performance and continuity cannot be overstressed (Zalatar 2012). Sat-isfaction is analyzed by investigating the supposition of service and perceptions. To find out the dimension of customer contentment with public transportation services is a vital theme in transport studies and appli-cation. In enhancing customer’s satisfaction with pub-lic transportation services and increasing the number of users, operators are required to discern the extent of passenger suppositions that have really been sat-isfied, Customer studies are very important because they supply transportation providers with useful facts about service quality attributes that are essential for customers and they will also help to identify service quality attributes the customers are pleased or those that they are unpleased. According to Oliver (2010: 8) “satisfaction is the client’s accomplishment answer. It is a perception that a service attribute supplied (or is supplying) a delightful degree of utilization-relat-ed attainment, as well as degrees of bellow or over fulfillment”. Customer satisfaction helps to determine if the services or products supplied by the provider meet the need or transcend the expectations of the customer. Khadka and Maharjan (2017: 5) pointed out that “customer satisfaction is a crucial component of business strategy as well as customer retention and product repurchase”. Analyzing customer satisfaction with the services of public transport systems is a vital theme in transport study and implementation. In order to enhance public transport services and attract more customers, suppliers need to discern how much customer suppositions have absolutely been fulfilled. Andaleeb et al (2007) investigated methods of ame-liorating bus transport services in Dhaka. The study identified “eight components to address content-ment levels of constant bus customers whose point of views and regards are considered indispensable in making bus service provisions in the city more effi-ciently arranged, demand based, and service aligned. Using factor analysis and multiple regressions, five of the eight chosen underlying dimensions were discov-ered to have remarkable consequences on custom-ers’ satisfaction. These comprise comfort levels, staff
behaviour, number of buses changed to arrive at des-tination, supervision, and bus stand facilities. Rozmi et al. (2013) studied the comparison of customers, preference and satisfaction toward Malaysian public transport network especially Train commuter (KTM) and light Rail Transit (LRT). The results showed that passengers’ preference and satisfactions in LRT net-work is higher than KTM network. The study also identified four underlying dimensions that play a part in the liking and satisfaction of passengers with the mass transit which are facilities, service quality, com-fort and vehicle design. Generally, it was discovered that a greater number of passengers have assessed as displeased with the Malaysia mass transit. Radnovic et al. (2015) conducted a research to determine the satisfaction of public transport users in Belgrade with the aim of improving their satisfaction. The results of the study showed a significant correlation between quality of service, attitude and behavior of employees, adequate information, quality of vehicles, line routes and timetable factors and passenger satisfaction with public transport services in Belgrade and that users are dissatisfied with the services provided by the operators. Yuksek et al. (2016) examined the effects of public transport performance on destination sat-isfaction in the Turkish city of Eskişehir and using regression analysis found that “destination satisfac-tion is affected by infrastructure, ease of use, timing and physical condition, respectively” (Yukksek et al. 2016: 8), The results of their study indicate that local transport significantly impacts on the destination satisfaction of visitors. This implies that destination managers of establishments in relation to destina-tions need to concentrate more in accommodating the satisfaction of visitors at destination being dependent on local transport. In his study of passenger satisfac-tions with the service quality attributes of public bus transport services in Abuja, (Ali 2014) identified four service dimensions − comfort, accessibility, adequacy and bus stop facilities – that influence customer con-tentment with public bus transportation services in the city of Abuja. “Regression analysis additionally depicted that the influence of comfort in the vehicle on general satisfaction is the highest. “Accessibility came after comfort in the vehicle and followed by adequacy and bus stop facilities in relative order of importance in impacting customer contentment of bus mass transit service provision in the city” (Ali 2014: 99–100). With the inception of Bus Rapid Tran-sit in 2008 in Lagos, Afolabi (2016) investigated the impact of Bus Rapid Transit on customer’ satisfaction in the city of Lagos. The results of the study revealed that a little above mean of the customers were pleased with the Bus Rapid Transit system whereas some were completely displeased. The study did not investigate the specific factors that influence their satisfaction with the Bus Rapid Transit in city and as such the management of the BRT need to carry out research to find out the specific factors that influence
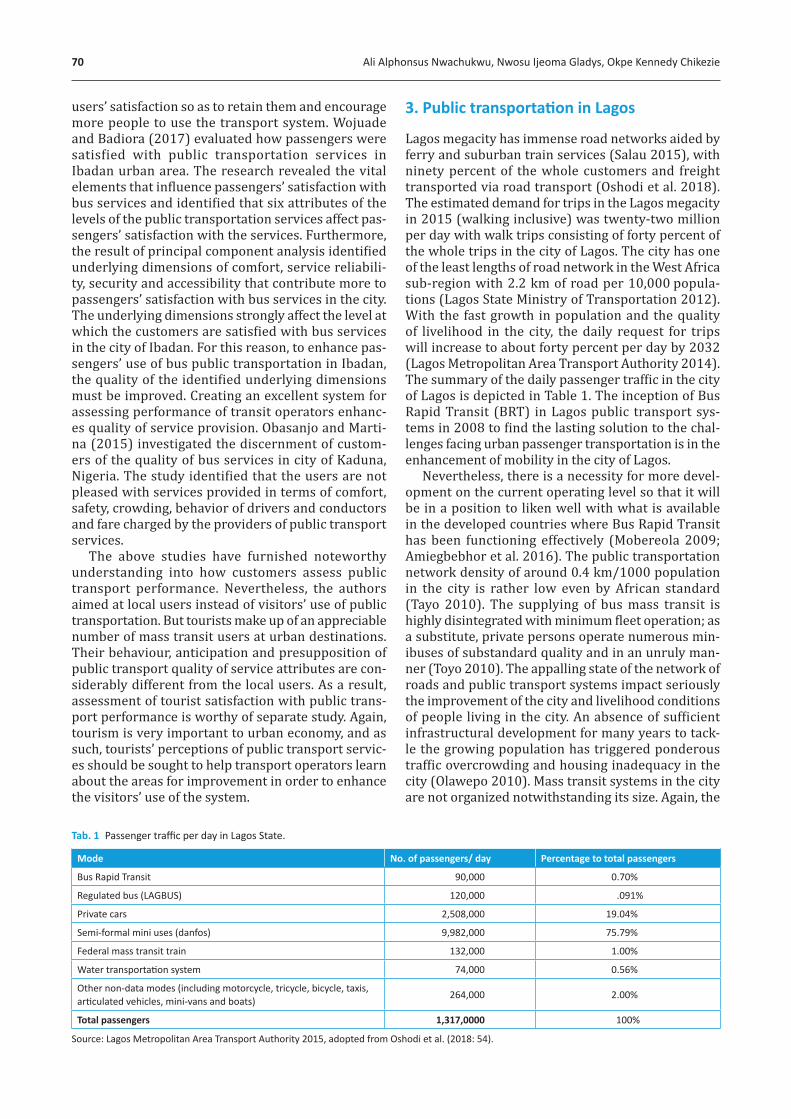
70 Ali Alphonsus Nwachukwu, Nwosu Ijeoma Gladys, Okpe Kennedy Chikezie
users’ satisfaction so as to retain them and encourage more people to use the transport system. Wojuade and Badiora (2017) evaluated how passengers were satisfied with public transportation services in Ibadan urban area. The research revealed the vital elements that influence passengers’ satisfaction with bus services and identified that six attributes of the levels of the public transportation services affect pas-sengers’ satisfaction with the services. Furthermore, the result of principal component analysis identified underlying dimensions of comfort, service reliabili-ty, security and accessibility that contribute more to passengers’ satisfaction with bus services in the city. The underlying dimensions strongly affect the level at which the customers are satisfied with bus services in the city of Ibadan. For this reason, to enhance pas-sengers’ use of bus public transportation in Ibadan, the quality of the identified underlying dimensions must be improved. Creating an excellent system for assessing performance of transit operators enhanc-es quality of service provision. Obasanjo and Marti-na (2015) investigated the discernment of custom-ers of the quality of bus services in city of Kaduna, Nigeria. The study identified that the users are not pleased with services provided in terms of comfort, safety, crowding, behavior of drivers and conductors and fare charged by the providers of public transport services.
The above studies have furnished noteworthy understanding into how customers assess public transport performance. Nevertheless, the authors aimed at local users instead of visitors’ use of public transportation. But tourists make up of an appreciable number of mass transit users at urban destinations. Their behaviour, anticipation and presupposition of public transport quality of service attributes are con-siderably different from the local users. As a result, assessment of tourist satisfaction with public trans-port performance is worthy of separate study. Again, tourism is very important to urban economy, and as such, tourists’ perceptions of public transport servic-es should be sought to help transport operators learn about the areas for improvement in order to enhance the visitors’ use of the system.
3. Public transportation in Lagos
Lagos megacity has immense road networks aided by ferry and suburban train services (Salau 2015), with ninety percent of the whole customers and freight transported via road transport (Oshodi et al. 2018). The estimated demand for trips in the Lagos megacity in 2015 (walking inclusive) was twenty-two million per day with walk trips consisting of forty percent of the whole trips in the city of Lagos. The city has one of the least lengths of road network in the West Africa sub-region with 2.2 km of road per 10,000 popula-tions (Lagos State Ministry of Transportation 2012). With the fast growth in population and the quality of livelihood in the city, the daily request for trips will increase to about forty percent per day by 2032 (Lagos Metropolitan Area Transport Authority 2014). The summary of the daily passenger traffic in the city of Lagos is depicted in Table 1. The inception of Bus Rapid Transit (BRT) in Lagos public transport sys-tems in 2008 to find the lasting solution to the chal-lenges facing urban passenger transportation is in the enhancement of mobility in the city of Lagos.
Nevertheless, there is a necessity for more devel-opment on the current operating level so that it will be in a position to liken well with what is available in the developed countries where Bus Rapid Transit has been functioning effectively (Mobereola 2009; Amiegbebhor et al. 2016). The public transportation network density of around 0.4 km/1000 population in the city is rather low even by African standard (Tayo 2010). The supplying of bus mass transit is highly disintegrated with minimum fleet operation; as a substitute, private persons operate numerous min-ibuses of substandard quality and in an unruly man-ner (Toyo 2010). The appalling state of the network of roads and public transport systems impact seriously the improvement of the city and livelihood conditions of people living in the city. An absence of sufficient infrastructural development for many years to tack-le the growing population has triggered ponderous traffic overcrowding and housing inadequacy in the city (Olawepo 2010). Mass transit systems in the city are not organized notwithstanding its size. Again, the
Tab. 1 Passenger traffic per day in Lagos State.
Mode No. of passengers/ day Percentage to total passengers
Bus Rapid Transit 90,000 0.70%
Regulated bus (LAGBUS) 120,000 .091%
Private cars 2,508,000 19.04%
Semi-formal mini uses (danfos) 9,982,000 75.79%
Federal mass transit train 132,000 1.00%
Water transportation system 74,000 0.56%
Other non-data modes (including motorcycle, tricycle, bicycle, taxis, articulated vehicles, mini-vans and boats) 264,000 2.00%
Total passengers 1,317,0000 100%
Source: Lagos Metropolitan Area Transport Authority 2015, adopted from Oshodi et al. (2018: 54).
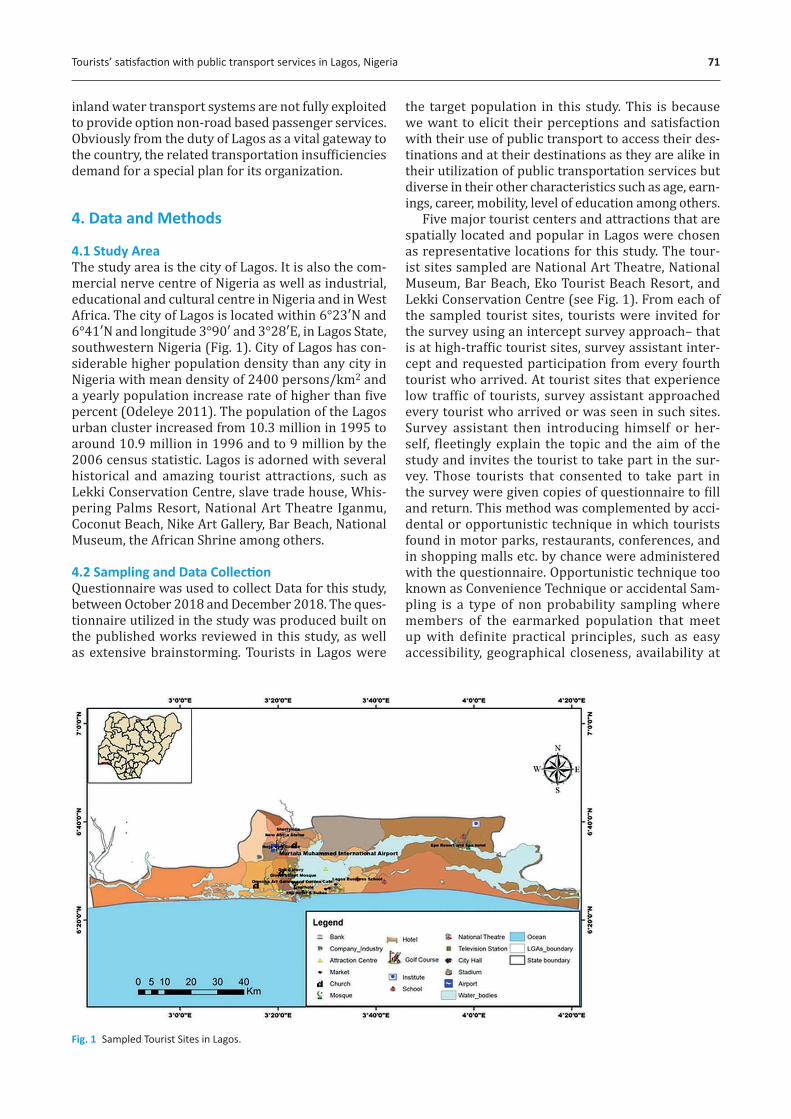
Tourists’ satisfaction with public transport services in Lagos, Nigeria 71
inland water transport systems are not fully exploited to provide option non-road based passenger services. Obviously from the duty of Lagos as a vital gateway to the country, the related transportation insufficiencies demand for a special plan for its organization.
4. Data and Methods
4.1 Study Area The study area is the city of Lagos. It is also the com-mercial nerve centre of Nigeria as well as industrial, educational and cultural centre in Nigeria and in West Africa. The city of Lagos is located within 6°23′N and 6°41′N and longitude 3°90′ and 3°28′E, in Lagos State, southwestern Nigeria (Fig. 1). City of Lagos has con-siderable higher population density than any city in Nigeria with mean density of 2400 persons/km2 and a yearly population increase rate of higher than five percent (Odeleye 2011). The population of the Lagos urban cluster increased from 10.3 million in 1995 to around 10.9 million in 1996 and to 9 million by the 2006 census statistic. Lagos is adorned with several historical and amazing tourist attractions, such as Lekki Conservation Centre, slave trade house, Whis-pering Palms Resort, National Art Theatre Iganmu, Coconut Beach, Nike Art Gallery, Bar Beach, National Museum, the African Shrine among others.
4.2 Sampling and Data CollectionQuestionnaire was used to collect Data for this study, between October 2018 and December 2018. The ques-tionnaire utilized in the study was produced built on the published works reviewed in this study, as well as extensive brainstorming. Tourists in Lagos were
the target population in this study. This is because we want to elicit their perceptions and satisfaction with their use of public transport to access their des-tinations and at their destinations as they are alike in their utilization of public transportation services but diverse in their other characteristics such as age, earn-ings, career, mobility, level of education among others.
Five major tourist centers and attractions that are spatially located and popular in Lagos were chosen as representative locations for this study. The tour-ist sites sampled are National Art Theatre, National Museum, Bar Beach, Eko Tourist Beach Resort, and Lekki Conservation Centre (see Fig. 1). From each of the sampled tourist sites, tourists were invited for the survey using an intercept survey approach– that is at high-traffic tourist sites, survey assistant inter-cept and requested participation from every fourth tourist who arrived. At tourist sites that experience low traffic of tourists, survey assistant approached every tourist who arrived or was seen in such sites. Survey assistant then introducing himself or her-self, fleetingly explain the topic and the aim of the study and invites the tourist to take part in the sur-vey. Those tourists that consented to take part in the survey were given copies of questionnaire to fill and return. This method was complemented by acci-dental or opportunistic technique in which tourists found in motor parks, restaurants, conferences, and in shopping malls etc. by chance were administered with the questionnaire. Opportunistic technique too known as Convenience Technique or accidental Sam-pling is a type of non probability sampling where members of the earmarked population that meet up with definite practical principles, such as easy accessibility, geographical closeness, availability at
Fig. 1 Sampled Tourist Sites in Lagos.
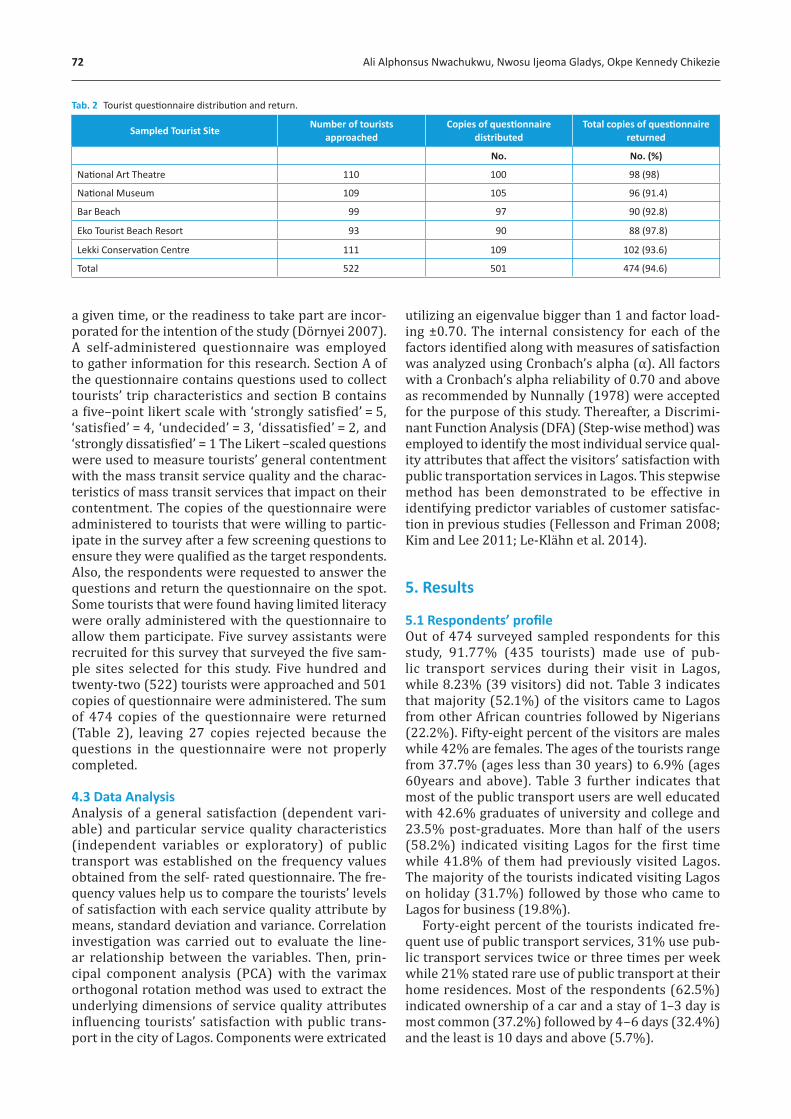
72 Ali Alphonsus Nwachukwu, Nwosu Ijeoma Gladys, Okpe Kennedy Chikezie
a given time, or the readiness to take part are incor-porated for the intention of the study (Dörnyei 2007). A self-administered questionnaire was employed to gather information for this research. Section A of the questionnaire contains questions used to collect tourists’ trip characteristics and section B contains a five–point likert scale with ‘strongly satisfied’ = 5, ‘satisfied’ = 4, ‘undecided’ = 3, ‘dissatisfied’ = 2, and ‘strongly dissatisfied’ = 1 The Likert –scaled questions were used to measure tourists’ general contentment with the mass transit service quality and the charac-teristics of mass transit services that impact on their contentment. The copies of the questionnaire were administered to tourists that were willing to partic-ipate in the survey after a few screening questions to ensure they were qualified as the target respondents. Also, the respondents were requested to answer the questions and return the questionnaire on the spot. Some tourists that were found having limited literacy were orally administered with the questionnaire to allow them participate. Five survey assistants were recruited for this survey that surveyed the five sam-ple sites selected for this study. Five hundred and twenty-two (522) tourists were approached and 501 copies of questionnaire were administered. The sum of 474 copies of the questionnaire were returned (Table 2), leaving 27 copies rejected because the questions in the questionnaire were not properly completed.
4.3 Data AnalysisAnalysis of a general satisfaction (dependent vari-able) and particular service quality characteristics (independent variables or exploratory) of public transport was established on the frequency values obtained from the self- rated questionnaire. The fre-quency values help us to compare the tourists’ levels of satisfaction with each service quality attribute by means, standard deviation and variance. Correlation investigation was carried out to evaluate the line-ar relationship between the variables. Then, prin-cipal component analysis (PCA) with the varimax orthogonal rotation method was used to extract the underlying dimensions of service quality attributes influencing tourists’ satisfaction with public trans-port in the city of Lagos. Components were extricated
utilizing an eigenvalue bigger than 1 and factor load-ing ±0.70. The internal consistency for each of the factors identified along with measures of satisfaction was analyzed using Cronbach’s alpha (α). All factors with a Cronbach’s alpha reliability of 0.70 and above as recommended by Nunnally (1978) were accepted for the purpose of this study. Thereafter, a Discrimi-nant Function Analysis (DFA) (Step-wise method) was employed to identify the most individual service qual-ity attributes that affect the visitors’ satisfaction with public transportation services in Lagos. This stepwise method has been demonstrated to be effective in identifying predictor variables of customer satisfac-tion in previous studies (Fellesson and Friman 2008; Kim and Lee 2011; Le-Klähn et al. 2014).
5. Results
5.1 Respondents’ profile Out of 474 surveyed sampled respondents for this study, 91.77% (435 tourists) made use of pub-lic transport services during their visit in Lagos, while 8.23% (39 visitors) did not. Table 3 indicates that majority (52.1%) of the visitors came to Lagos from other African countries followed by Nigerians (22.2%). Fifty-eight percent of the visitors are males while 42% are females. The ages of the tourists range from 37.7% (ages less than 30 years) to 6.9% (ages 60years and above). Table 3 further indicates that most of the public transport users are well educated with 42.6% graduates of university and college and 23.5% post-graduates. More than half of the users (58.2%) indicated visiting Lagos for the first time while 41.8% of them had previously visited Lagos. The majority of the tourists indicated visiting Lagos on holiday (31.7%) followed by those who came to Lagos for business (19.8%).
Forty-eight percent of the tourists indicated fre-quent use of public transport services, 31% use pub-lic transport services twice or three times per week while 21% stated rare use of public transport at their home residences. Most of the respondents (62.5%) indicated ownership of a car and a stay of 1–3 day is most common (37.2%) followed by 4–6 days (32.4%) and the least is 10 days and above (5.7%).
Tab. 2 Tourist questionnaire distribution and return.
Sampled Tourist Site Number of tourists approached
Copies of questionnaire distributed
Total copies of questionnaire returned
No. No. (%)
National Art Theatre 110 100 98 (98)
National Museum 109 105 96 (91.4)
Bar Beach 99 97 90 (92.8)
Eko Tourist Beach Resort 93 90 88 (97.8)
Lekki Conservation Centre 111 109 102 (93.6)
Total 522 501 474 (94.6)

Tourists’ satisfaction with public transport services in Lagos, Nigeria 73
5.2 Public Transport Use by Tourists in Lagos The public transportation use by tourists in the city of Lagos is a function of their purposes of being to the city. Majority of the tourists in Lagos (81.2%) used public transportation to get to their attractions (Table 4). Transport for business activities accounted for 15.27% of the total respondents, while visiting relatives and friends, shopping, educational activities and others accounted for 25.1%, 14.1%, 9.2% and 2.5% respectively. Public bus transport mode was found to be mostly used by the tourists in Lagos of which 48.7% of the tourist used Bus Rapid Transit (BRT), 50% used other buses and 8.5 of the tourists used ferry services.
5.3 Tourists’ Satisfaction with Public Transport Services in Lagos The analysis of tourists’ perception of overall satis-faction and the 24 specific service quality attributes
that affect their satisfaction with public transport in Lagos using mean, standard deviation and variance is presented in Table 5 (in descending order by mean). It is observed from Table 5 that tourists tended not to be satisfied with the overall satisfaction of public transport services in Lagos with a mean score of 2.81, standard deviation of 0.6 and variance of 0.4. The tourists were also not satisfied with the most of spe-cific quality attributes of public transport services in the city of Lagos. This is because 14 of the 24 specific service quality attributes have mean scores below 3.0 (mean < 3.0). The specific service attributes of pub-lic transport in Lagos that were relatively appreciat-ed (mean > 3.0) by the tourists are transport price /fare is affordable, short walking distance to bus stop and ferry stop, vehicles are generally available, route network coverage, ease of finding information about routes, destinations and stops, willingness of bus and ferry staff to help passengers, attitude of driver/staff
Tab. 3 Respondents profile.
Items Frequency Percentage
Country of residence
Nigeria Other African countries Europe America Asia
97227
183558
22.252.1
4.18.3
13.3
Gender Male Female
254181
58.042.0
Age
<3030–3940–4950–5960 and above
164103
845430
37.723.719.312.4
6.9
Marital status Single Married Others
171211
53
39.348.512.2
Educational status
No formal Primary school Secondary school University and college Post graduate
323
118190102
0.65.2
27.143.623.5
Visiting Lagos for the first time Yes No
182253
41.858
Major purpose of visit
Holiday Business Official mission Education Visiting friends and relatives Others
225.86185344
9
51.119.8
4.112.210.1
2.1
Use of public transport at home Frequently Twice or three times per week Rarely
209135
91
48.031.021.0
Car ownership Yes No
272163
62.537.5
Trip duration
One day 1–3 days 4–6 days 7–910 days and above
34162141
7325
7.837.232.416.8
5.7
Source: Authors’ Fieldwork (2018).

74 Ali Alphonsus Nwachukwu, Nwosu Ijeoma Gladys, Okpe Kennedy Chikezie
and availability of staff on board. The 24 service qual-ity attributes plus the overall satisfaction of tourists with public transport in Lagos were transformed into a matrix of inter-correlation between the variables to know the strength of their correlations (Matrix not presented here). Principal Component Analysis (PCA)
using SPSS 20.0 was used to collapse the 24 service quality attributes of public transport into few under-lying dimensions of tourists’ satisfaction with public transport services in the city of Lagos. The underlying dimensions will help to improve the public transport services to enhance tourists’ use in the city of Lagos. The analysis of the varimax rotated components matrix resulted into five components explaining 95.29% of the total variance (Table 6).
Each component was labeled according to the appropriateness of variables loaded in it. Compo-nents 1 (α = 0.81) has eigenvalue of 5.31 and explains 31.41% of the total variance. It has loadings on (Transport price/fare is affordable, high frequency of service, short waiting time at bus stop and ferry stop, vehicles are generally available, short travel time in the vehicle, route network coverage, and short walk-ing distance to bus stop and ferry stop) components 1 is generally describing functionality of service quali-ty characteristics influencing tourits’ contentment in obtaining ingress to utilize public transportation to get to their journey ends in Lagos. Thus, component 1 is recognised as “accessibility”. The component 2 (α = 0.78) comprises six variables (enough leg-space in vehicles, vehicles are well maintained, safety of
Tab. 4 Purpose of use of public transport services and mode of public transport used by tourists in Lagos.
Purposes of use Percentage of tourists used
public transport for each purpose (%)
Tourists attractions in the city 81.2
Business related-purposes 15.27
Educational activities 9.20
Visiting relatives and friends 25.1
Shopping purposes 14.1
Public transport mode used by the tourists
Mode type %
(1) Bus (a) BRT 48.7
Other buses 50
Ferry 8.5
N. B Multiple: Totals are greater than 100%.
Tab. 5 Tourists’ Comparison of the Service Quality Attributes and the Overall Satisfaction responses of the Public Transport Services in Lagos by mean.
Service Quality Attributes Mean Standard deviation Variance
Comfort while waiting at bus stop and ferry stop 4.10 0.3 0.1
Availability of staff on board 4.01 0.3 02
Transport price/fare is affordable 3.73 0.5 0.3
Ease of finding information about routes, destinations and stops 3.64 0.3 0.1
Willingness of bus and ferry staff to help passengers 3.31 0.5 0.
Route network coverage 3.27 0.4 0.2
Vehicles are clean inside 3.17 0.3 0.1
Attitude of drivers/staff 3.01 0.4 0.2
Short walking distance to bus stop and ferry stop 3.00 0.4 0.2
Availability of arrival information for vehicles 3.00 0.3 0.1
Personal security on board 2.92 0.4 0.2
Vehicles are generally available 2.87 0.5 0.3
Seats are generally available 2.86 0.6 0.4
Short waiting time at bus stop and ferry stop 2.86 0.6 0.4
Availability of information about service delays 2.82 0.5 0.3
Punctuality of service 2.80 0.4 0.3
Security while waiting at bus stop and ferry stop 2.71 0.4 0.2
Security of luggage on board 2.62 0.4 0.2
High frequency of service 2.50 0.4 0.2
Vehicles are well maintained 2.40 0.5 0.3
Safety of passenger on board 2.32 0.4 0.2
Short travel time in the vehicle 2.16 0.6 0.4
Reliability of service 2.15 0.6 0.4
Enough leg-space in vehicles 2.11 0.3 0.1
Overall satisfaction with public transport services 2.81 0.6 0.4

Tourists’ satisfaction with public transport services in Lagos, Nigeria 75
passenger on board, seats are generally available, vehicles are clean inside, and comfort while waiting at bus stop and ferry stop). The variables describe the conditions of facilities in the vehicles and at bus/fer-ry station that affect tourists’ satisfaction with public transport services. Thus, component 2 is identified as “journey comfort”. It has an eigenvalue of 4.92 and accounts for 25.11% of the total variance. The third component (α = 0.75) accounts for 16.01 percent of the total variance with eigenvalue of 3.02. It has sig-nificant leadings on three variables (personal secu-rity during trip, security while waiting at bus/ferry stop and security of luggage on board. This compo-nent depicts the importance of security of tourists and their luggage on their journey). Component 3 is, therefore, identified as “traveling security”. The fourth component (α = 0.73) comprises three varia-bles (ease of finding information about routes, des-tinations and stops, availability of information about service delays and availability of arrival information
for vehicles) and highlight the tourists needs of rele-vant information in traveling to his/her destinations and it is, therefore, identified as “traveling informa-tion”. Component 5 (α = 0.71) has significant loading on three variables (willingness of bus staff and ferry staff to help passengers, attitude of driver/staff and availability of staff on board) and accounts for 10.21 percent of the total variance component 5 generally describes the visitors expected services from bus/ferry staff while on journey to their destinations and thus, it is identified as “customer services”.
5.4 Discriminant Function AnalysisThe public transport in Lagos was examined in the service quality attributes. The influences of these service quality attributes on the tourists’ overall sat-isfaction of public transport vary from each other. For the purposes of public transport improvement, it is vital to identify the most influential service quality attributes that have strongest impact on the tourists’
Tab. 6 Principal component analysis of public transport service dimensions.
Service Quality Attributes Components
1 2 3 4 5
Transport price/fare is affordable 0.817* 0.217 0.069 0.117 0.342
High frequency of service 0.701* 0.125 0.223 0.168 0.201
Enough leg-space in vehicles 0.337 0.786* 0.006 0.127 0.110
Vehicles are well maintained 0.147 0.764* 0.219 0.341 0.215
Safety of passenger on board 0.371 0.879* 0.428 0.106 0.213
Seats are generally available 0.424 0.713* 0.314 0.116 0.310
Short waiting time at bus stop and ferry stop 0.811* 0.218 0.334 0.124 0.427
Punctuality of service 0.499 0.414 0.228 0.09 0.389
Reliability of service 0.592 0.292 0.108 0.009 0.119
Short walking distance to bus stop and ferry stop 0.714* 0.443 0.376 0.210 0.104
Vehicles are clean inside 0.196 0.872* 0.211 0.355 0.220
Vehicles are generally available 0.892* 0.422 0.169 0.129 0.431
Comfort while waiting at bus stop and ferry stop 0.289 0.802* 0.011 0.123 0.316
Personal security on board 0.008 0.138 0.882* 0.223 0.427
Short travel time in the vehicle 0.723* 0.155 0.333 0.417 0.248
Route network coverage 0.871* 0.390 0.199 0.249 0.107
Ease of finding information about routes, destinations and stops 0.346 0.218 0.010 0.821* 0.501
Security while waiting at bus stop and ferry stop 0.141 0.337 0.817* 0.117 0.101
Availability of information about service delays 0.421 0.309 0.025 0.825* 0.108
Availability of arrival information for vehicles 0.282 0.313 0.105 0.921* 0.502
Willingness of bus staff and ferry staff to help passenger 0.222 0.219 0.002 0.107 0.773*
Attitude of driver/staff 0.371 0.393 0.115 0.401 0.833*
Security of luggage on board 0.147 0.189 0.902* 0.380 0.281
Availability of staff on board 0.129 0.298 0.347 0.221 0.910*
Eigenvalue 5.31 4.92 3.02 2.47 2.35
% explained 31.41 25.11 16.01 12.55 10.21
Commulative% 31.41 56.52 72.53 85.08 95.29
Reliability coefficient (Cronbach’s alpha (α)) 0.81 0.78 0.75 0.73 0.71
*Significant loadings = ±0.70

76 Ali Alphonsus Nwachukwu, Nwosu Ijeoma Gladys, Okpe Kennedy Chikezie
satisfaction with public transport services. To iden-tify which individual service quality attribute that has greatest influence on tourists’ overall satisfaction with public transport, a Discriminant Function Anal-ysis (DFA) was employed. To carry out this analysis, tourists’ overall satisfaction with public transport was taken as the grouping variable (dependent variable) and the 24 service quality attributes as the independ-ent variables. Wilk’s Lambda statistic or value of dis-criminant function analysis was used to identify the service quality attributes that have the greatest influ-ence on tourists’ satisfaction with public transport. The value or statistic of Wilk’s Lambda ranges from 0 to 1 and the smaller the value the more consequen-tial the exploratory variables to DFA. The significant of Wilk’s Lambda statistic is determined by F test. The results of the Discriminant Function Analysis identi-fied eight service quality attributes that are the most important to tourist satisfaction with public trans-port services in Lagos. They are personal security on board; ease of finding information about routes, des-tinations and stops; vehicles are clean inside; securi-ty while waiting at bus stop and ferry stop; comfort while waiting at bus stop and ferry stop; transport price/fare are affordable and willingness of bus and ferry staff to help passengers (Table 7).
6. Discussion of Results
6.1 Public Transport Service DimensionsIn this study, five service underling dimensions were identified. They are: accessibility, journey comfort, traveling security, traveling information and custom-er services. From the literature reviewed earlier in
this work, a number of dimensions of public trans-port services were identified. In situating the findings of this study with the findings of the previous studies, some similarities and differences were established. Like the findings of Le-Klähn et al. (2014), this study also identified accessibility as a vital underlying ser-vice dimension. The increasing number of individual owned vehicle fleet, amalgamated with dependence on informal vehicles such as okadas, danfos among others has precipitated utmost traffic congestion across the city and unsatisfactory features of pub-lic transport service prospects (Oshodi et al. 2018) which has a great effect on tourists’ access to public transport services in the city of Lagos This finding is also in accordance with the findings of Soltani et al. (2012) that accessibility is an important standard for high-quality, sustainable public transport sys-tems. Accessibility to stations and transport vehicles, physically and financially, is important to enhance the improvement of penetration of visitors in the city. This includes access to destinations and within destinations. Transport accessibility and connectiv-ity affect tourist choice of recreational destinations (Xiao, Jia and Jiang 2012).
Provision of public transport access and improving its services are essential, especially for national parks, suburban and rural areas near major urban areas. Journey comfort is another vital dimension of public transport performance which was also investigated in earlier studies (Rozmi et al. 2013). Comfort has the greatest impact on passenger satisfaction with public transport vehicle. With the exception of high capacity buses of Lagos State Bus Rapid Transit serving some routes totaling 22 km, other bus operators do not pay adequate attention to passenger comfort.
Tab. 7 Results of discriminant function analysis (overall satisfaction with public transport as the grouping variable – dependent variable)a,b,c,d.
Stage Entered
Wilks’ Lambda
Statistic Df1 Df2 Df3Exact F
Statistic Df1 Df2 Sig
1 Personal security on board 0.912 1 6 385.000 45.510 1 385.000 0.000
2 Ease of finding information about routes, destinations and stops 0.876 2 6 385.000 33.145 2 366.000 0.000
3 High frequency of service 0.868 3 6 385000 29.425 3 341.000 0.000
4 Vehicles are clean inside 0.842 4 6 385000 26.512 4 330.000 0.000
5 Security while waiting at bus stop and ferry stop 0.783 5 6 385000 24.441 5 325.000 0.000
6 Comfort while waiting at bus stop and ferry stop 0.734 6 6 385000 19.562 6 320.000 0.000
7 Transport price/fare is affordable 0.644 7 6 385000 17.120 7 319.000 0.000
8 Willingness of bus and ferry staff to help passengers 0.603 8 6 385000 16.101 8 316.000 0.000
At each stage, variable that minimizes overall Wilks’ Lambda is entered.a) Highest number of step is 48b) Highest significance of F to enter is 0.05c) Highest significance of f to remove is 0.10 d) F level, tolerance, or VIN insufficient for further computation Source: Authors’ Fieldwork 2018.

Tourists’ satisfaction with public transport services in Lagos, Nigeria 77
Traveling information is one of the key attributes on which the quality of a public transport service and customer satisfaction with such service is frequent-ly measured. This finding is in accordance with the finding of Radnovic et al. (2015) that visitors have a greater requirement for public transport informa-tion than local users when making public transport journeys to their destinations. Customer Services shared similarities with Fellesson and Friman (2008) of attitude and behavior of employees. Security is the new dimension found in this study. It was not explored in previous studies. Walking to a bus or fer-ry station, waiting for the vehicle to arrive, and trav-eling on the system are all situations where a person could be assaulted especially with insecurity situa-tion in Nigeria. With present insecurity all over the world, public transport security is now an important factor that impacts greatly on passenger satisfaction with any public transport mode services in Lagos. According to Akinyemi and Isiugo-Abanihe (2014), Nigeria is still battling with the provision of minimal basic infrastructural facilities including transporta-tion and security.
6.2 Identification of Individual Service Quality Attribute that has Greatest Influence on Tourists’ Overall Satisfaction with Public Transport in the City of LagosThe most influential service quality attributes identi-fied that have strongest impact on tourists’ satisfac-tion with public transport services are discussed in this section.
Personal security on board and Security while waiting at bus/ferry stop) (Table 6) are the security attributes of service quality. These attributes were identified as vital for tourists traveling by public transport in the city of Lagos. This is in line with the findings from Somuyiwa and Adebayo (2014). Securi-ty aspect of public transport quality of service is very important as public transport closely relates with human lives in greater numbers as many customers happen to be riding in one vehicle. Types of security incidents that happen in public transport in the city include pick pocking (pilfering), robbery, inflicting bodily harm, killings etc.
Ease of finding information about routes destina-tions and stops highlights the tourists’ need of infor-mation of the routes to be taken to reach and locate their destinations when they are using public trans-port. As tourists, they need information of the area they are visiting more than the local users especially those tourists who are visiting a place for the first time (Thompson 2004). In Lagos, high service frequency is recognized as a major factor to customer satisfac-tion with any public transport system. Service quality attribute appeared consistently in studies on public transport service assessment (Del Castillo and Ben-itez 2012; Redman et al. 2013). Public transport sys-tems in Lagos do not run frequently especially during
off – peak periods. Traffic congestion in Lagos during peak hours also reduces service frequency of public transport. Almost all the routes experience traffic congestion difficulty in Lagos which impacts on jour-ney time, the number of trips a bus provider will make in a day and also the price of travel the customers will recompense. Increasing service frequency is believed to enhance ridership (Wall and Donald 2007).
Vehicles are clean inside: Poor standards of clean-liness on board public transport or at bus/ ferry sta-tion and stop can lead to an image of a neglected and poorly maintained public transport system (Mounica 2014). Tourists in Lagos were relatively satisfied with the cleanliness of public transport vehicles especially those used by Lagos Bus Rapid Transit (BRT).
Comfort while waiting at bus stop and ferry stop. To be comfortable while waiting for bus or ferry at their stations, means that there will be enough sitting spaces, shelters, lighting, fans etc. Availability of these facilities determine the customer satisfaction with public transport service (Eboli and Mazzilla 2007). In the city of Lagos, these facilities are quite deplor-able in most of the bus and ferry stations and stops exposing commuters to crime, discomfort and many other physical and psychological costs that substan-tially exceed the benefit of traveling in public trans-port vehicles in the city and they are needed to be provided.
Transport price/fare is affordable. Price/fare has a major influence on the attractiveness of public transport (Redman et al. 2013). A considerable num-ber of negative comments from tourists were related to the methods of payment.
Willingness of bus and ferry staff to help passen-gers: Tourists who are not familiar with a destination are likely to place greater importance on helpfulness and reassurance from public transport staff than the local users. In addition tourists may value knowledge-able drivers who are not only familiar with the route but have patience and courtesy in communication and can also advice on connections to other modes of transport to access visitors’ attractions.
Even though respondents were relatively satis-fied with public transport staff assistance to them in Lagos, there is still a great need for public transport operators to train their staff on how to attend to cus-tomers especially visitors to the city to encourage tourists’ patronage of public transport services.
7. Conclusion and Recommendations
In conclusion, tourists were not adequately pleased with the public transportation services within the city of Lagos. The study also identified five underlying components – accessibility, journey comfort, traveling security, traveling information, and customer services − that influence visitors’ satisfaction with public trans-port services in the city. The five service underlying
78 Ali Alphonsus Nwachukwu, Nwosu Ijeoma Gladys, Okpe Kennedy Chikezie
dimensions, jointly explained 95.29% of the total variance of tourists’ satisfaction with public trans-portation services in the city. The eight major service quality attributes that influence overall satisfaction of tourists with public transport were identified by the use of Discriminant function analysis. They are per-sonal security on board; ease of finding information about routes, destinations and stops; high frequency of service; vehicles are clean inside; security while waiting at bus stop and ferry Stop; transport price /fare is affordable and willingness of bus and ferry staff to help passengers.
Therefore, to enhance the public transport perfor-mance in Lagos for effective use by both tourists and local customers, we make the following recommen-dations:
We recommend that in addition to Bus Rapid Tran-sit already in operation in the city, Lagos State should embark on more Vigorous road restoration should be carried out in all the local government areas including building of new roadways. A robust Integrated Mass Transit Scheme for rail, road, and water transportation services and effectual traffic management to enhance traffic flow and public transport service frequency which will address the tourists’ accessibility problems to public transport and the use of public transportation services to get to their destinations in the city of Lagos. Again, providing more services along major tourist routes, for example, Lagos Island to Lekki Conservation Centre, should be a topic for major future planning of public transport providers in the city. The study also recommends installation of security cam-eras on board transit vehicles and at stations, improve-ment of lighting and human surveillance at stops and stations and the introduction of public transport Police Force in the city of Lagos. The public transport police force is expected to monitor and be sure of the func-tionality of all aspects of public transport. Furthermore, security screening of passengers and their bags should be intensified to prevent use of bombs on public trans-port in the city. Security is a business of everybody, and as such, organized awareness education should be pre-pared and distribute to operators and users from time to time to educate them on their roles for effective security in public transport operation in the city of Lagos. The awareness education to be organized should be pre-pared in different languages. Providers of public trans-port services in Lagos should prepare information on routes, destinations and major public transport stops and distribute to users in the stations and vehicles, and also cooperate with tourist centres, tourist attractions and hotels to reach more tourists.
Comfort while waiting at bus stop is an important consideration for riders of public transport, and as such, the providers of public transport services in Lagos should make the waiting areas at bus stops and ferry stops clean, attractive, well-lit and accessible.
Again, shelters and benches should be provided in public transport stops and stations in the city of Lagos to enhance the comfortability of boarding and lighting riders. It is necessary that the method of payments should be a topic of future planning by public trans-port operators in the city. Even though respondents were relatively satisfied with public transport staff assistance to them in Lagos, there is still a great need for public transport operators to train their staff on how to attend to customers especially tourists to the city to encourage their patronage of public transport services.
References
Afolabi, J. O. (2016): Commuters Perception and Preferences on the Bus Rapid Transit in Lagos State. Journal of Research in National Development 14(2), 34–47.
Akinyemi, A. I., Isiugo-Abanihe, U. C. (2014): Demographic dynamics and development in Nigeria: Issues and perspectives. African Population Studies 27(2, Suppl, March 2014), 239–248, https://doi.org/10.11564 /27-2-471.
Al Kahtani, S. J. H., Xia, J., Veenendaal, B. (2011): Measuring accessibility to tourist attractions, the Geospatial Science Research Symposium, Melbourne.
Ali, A. N. (2014): Assessment of Passenger Satisfaction with Intra-city Public Bus Transport Services in Abuja. Nigeria, Journal of Public Transportation 17(1), 99–119, https://doi.org/10.5038/2375-0901.17.1.5.
Amiegbebhor, D. E., Akarakiri T. B., Dickson, O. F. (2016): Evaluation of Technical Innovations in Bus Rapid Transit System in Lagos State, Nigeria. Advances in Research. 6(2), 1–12, https://doi.org/10.9734/AIR/2016/20585.
Andeleeb, S., Haq, S., Mohmadul, H., Ahmed, R. I. (2007): Reforming inner-city bus transportation in a developing country: A passenger-driven model. Journal of Public Transportation 10(1), 1–25, https://doi.org/10.5038 /2375-0901.10.1.1.
Araslı, H., Baradarani, S. (2014): European tourist perspective on destination satisfaction in Jordan’s industries. Procedia-Social and Behavioral Sciences 109, 1416–1425, https://doi.org/10.1016 /j.sbspro.2013.12.645.
Asokan, R., Praveen, R. (2013): Role of Transportation in Tourism Industry in Sikkim State, India. International Journal of Innovative Research and Development 2(6), 336-346.
Babatunde, O. (2016): Roadmap for Lagos tourism growth. Retrieved: January 14, 2019.
Bajadaa,T., Titheridgea, H. (2017): The attitudes of tourists towards a bus service: implications for policy from a Maltese – case study. Transportation Research Procedia 25, 4110–4129, https://doi.org/10.1016 /j.trpro.2017.05.342.
Banyte, Ј., Gudonaviciene, R., Grubys, D. (2011): Changes in Marketing Channels Formation. Inzinerine Ekonomika - Engineering Economics 22(3), 319–329, https://doi .org/10.5755/j01.ee.22.3.522.
Bimonte, S., Punzo, L. F. (2016): Tourist development and host–guest interaction: An economic exchange theory.

Tourists’ satisfaction with public transport services in Lagos, Nigeria 79
Annals of Tourism Research 58, 128–139, https:// doi.org/10.1016/j.annals.2016.03.004.
Chandrakumara, D. P. S. (2014): Urban dwellers’ satisfaction on public bus passenger transport in Sri Lanka. Asian Journal of Empirical Research 4(11), 514–525.
Chi, C. G., Qu, H. (2008): Examining the structural relationships of destination image, tourist satisfaction and destination loyalty: An integrated approach. Tourism Management 29(4), 624–636, https:// doi.org/10.1016/j.tourman.2007.06.007.
Currie, C., Falconer, P. (2014): Maintaining sustainable island destinations in Scotland: The role of the transport–tourism relationship. Journal of Destination Marketing and Management 3(3), 162–172, https:// doi.org/10.1016/j.jdmm.2013.10.005.
Currie, C., Falconer, P. (2014): Maintaining sustainable island destinations in Scotland: The role of the transport–tourism relationship. Journal of Destination Marketing and Management 3(3), 162–172, https:// doi.org/10.1016/j.jdmm.2013.10.005.
Del Castillo, J. M., Benitez, F. G. (2012): A Methodology for modeling and identifying user’s satisfaction issues in public transport systems based on users surveys. Procedia – Social and Behavioral Sciences 54, 1104–1114, https://doi.org/10.1016/j.sbspro.2012 .09.825.
Eboli. L., Mazzulla, G. (2007): Service quality attributes affecting customer satisfaction for bus transits. Journal of Public Transportation 10(3), 21–43, https://doi.org /10.5038/2375-0901.10.3.2.
Fellesson, M., Friman, M. (2008): Service quality attributes affecting customer satisfaction for bus transit. Journal of the Public Transportation Research Forum 47(3), 93–104.
Fitzgerald, G. (2012): The social impacts of poor access to transport in rural New Zealand. NZ Transport Agency Research Report 484.
Flausch, A. (2015): How public transport supports business and tourism in cities. International Transport forum, Annual Programme.
Guiver, J., Lumsdon, L., Weston, R. (2008). Traffic reduction at visitor attractions: the case of Hadrian’s Wall. Journal of Transport Geography 16(2), 142–150, https://doi.org /10.1016/j.jtrangeo.2007.04.007.
Guiver, J., Lumsdon, L., Weston, R., Ferguson, M. (2007): Do buses help meet tourism objectives? The contribution and potential of scheduled buses in rural destination areas. Transport Policy 14(4), 275–282, https://doi.org /10.1016/j.tranpol.2007.02.006.
Hedrick-Wong, Y., Choonng, D. (2014): Mastercard 2014 Global Destination Cities Index: Tracking Global Growth 2009–2014.
Kim, Y. K., Lee, H. R. (2011): Customer satisfaction using low cost carriers, Tourism Management 32(2), 235–243, https://doi.org/10.1016/j.tourman.2009.12.008.
Ladki, S., Shatilla, F., Ismail, S. (2014): The Effect of Lebanese Public Transport on Visitor’s Satisfaction. Journal of Tourism Challenges and Trends 7(2), 87–96.
Lagos Metropolitan Area Transport Authority (2014): Presentation by LAMATA MD/CEO at the National Conference of the Nigerian Institute of Town Planners 2014, Lagos, Nigeria.
Lagos State Ministry of Transportation (2012): An overview of the transformation of Lagos State transport sector.
Le-Klähn, D.-T., Hall, C. M., Gerike, R. (2014): Analysis of Visitor Satisfaction with Public Transport in Munich. Journal of Public Transportation 17(3), 68–85, https://doi.org/10.5038/2375-0901.17.3.5.
Le-Klähn, D. T.; Gerike, R., Hall, C. M. (2014): Visitor users vs. non-users of public transport: The case of Munich, Germany. Journal of Destination Marketing and Management 3(3), 152–161, https://doi.org/10.1016 /j.jdmm.2013.12.005.
Lee, J. W., Brahmasrene, T. (2013): Investigating the influence of tourism on economic growth and carbon emissions: Evidence from panel analysis of the European Union. Tourism Management 38, 69–76, https:// doi.org/10.1016/j.tourman.2013.02.016.
Lumsdon, L., Downward, P., Rhoden, S. (2006): Transport for tourism: can public transport encourage a modal shift in the day visitor market? Journal of Sustainable Tourism 14(2), 139–156, https://doi.org /10.1080/09669580608669049.
Mandeno, T. G. (2011): Is Tourism a Driver for Public Transport Investment? (Master of Planning), University of Otago, Dunedin, New Zealand.
McKercher, B., Wong, C., Lau, G. (2006): How tourists consume a destination. Journal of Business Research 59(5), 647–652, https://doi.org/10.1016/j.jbusres .2006.01.009.
Mobereola, D. (2009): Lagos Bus Rapid Transit. Africa’s First Bus Rapid Transit Scheme. The Lagos BRT – Lite System Sub-Saharan Africa Transport Policy Program.
Mounica, V. (2014): Customer Satisfaction Level in Public Bus Transport Services in Tirupati, Andhra Pragesh. Asia Pacific Journal of Research 1(20), 97–103.
Nunnally, J. C. (1978): Psychometric theory. 2nd ed. New York, Mc Graw – Hill.
Obasanjo, O. T., Martina, F. (2015): Quality of intra-urban passenger bus services in Kaduna metropolis, Nigeria. International Journal of Traffic and Transportation Engineering 4(1), 1–7.
Odeleye, J. A. (2011): Road traffic congestion management and parking infrastructural planning in metropolitan Lagos: The linkage. World Transport Policy and Practice 17, 27–36.
Ojekunle, K. R., Oni, S. I., Medoh, A. N. (2016): An Overview of Transportation and Tourism in Lagos State. A paper presented at the 57th Annual Conference of the Association of Nigerian Geographers (UNILAG ANG-2016) Theme: The Geographical Perspectives on National Development held at University of Lagos Main Campus, Akoka Yaba, Lagos, Nigeria, April 10–15, 2016.
Olawepo, R. A. (2010): Perspectives on Urban Renewal and Transportation Development in Lagos: Implications for Urban Development in Nigeria. An International Multi-Disciplinary Journal, Ethiopia 4 (1), 273–287, https://doi.org/10.4314/afrrev.v4i1.58226.
Oliver, R. L. (2010): Satisfaction: a behavioral perspective on the consumer. Armonk, N.Y., M.E. Sharpe.
Omisore, E. O., Akande, C. G. (2009): Accessibility Constraints of Patronage of Tourist Sites in Ondo and Ekiti States, Nigeria. Ethiopian Journal of Environmental Studies and Management 2(1), 66–74, https://doi.org /10.4314/ejesm.v2i1.43509.
Opeifa, K. (2012): How do we harness electricity to Transform Social Infrastructure? 7th Lagos Economic

80 Ali Alphonsus Nwachukwu, Nwosu Ijeoma Gladys, Okpe Kennedy Chikezie
Summit on Powering the Lagos Economic Real Opportunities, Endless Opportunities.
Oseyomon, P. E., Ibadin, L. A. (2016): Perceived customer patronage of transport companies in a developing country. International Journal of Business and Finance Research 4, 103–108.
Oshodi, L., Salau, T., Udoma-Ejorh, O., Seun, O., Unuigboje, R. (2018): Urban Mobility and Transportation, Urban Planning Processes in Lagos: Policies, Laws, Planning Instruments, Strategies and Actors of Urban Projects. In: Urban Development, and Urban Services in Africa’s Largest City. Second, Revised Edition, pp. 43–118. Heinrich Boll Stiftung, Nigeria.
Payne, A., Holt, S. (2001): Diagnosing customer value: Integrating the value process and relationship marketing. British Journal of Management 12, 159–182, https://doi.org/10.1111/1467-8551.00192.
Peeters, P., van Egmond, T., Visser, N. (2004): European Tourism, Transport and Environment, Final Version, Breda: NHTV CSTT.
Prideaux, B. (2000): The role of the transport system in destination development. Tourism Management 21(1), 53–63, https://doi.org/10.1016/S0261 -5177(99)00079-5.
Radnovic, B., Maric, R., Radnovic, V., Ilic, M., Lukas, D. (2015): Marketing Research on Passenger Satisfaction with Public Transport Service in the City of Belgrade. Promet − Traffic and Transportation 27(1), 47–57, https://doi.org/10.7307/ptt.v27i1.1522.
Redman, L., Friman, M., Garling, T., Harting, T. (2013): Quality attributes of public transport that attract car users: A research review. Transport Policy 25, 119–127, https://doi.org/10.1016/j.tranpol.2012.11.005.
Regnerus, H. D., Beunen, R., Jaarsma, C. F. (2007): Recreational traffic management: The relations between research and implementation. Transport Policy 14(3), 25–267, https://doi.org/10.1016/j.tranpol.2007 .02.002.
Rozmi, I., Mohammad, H. H., Rahim, M. N. (2013): Passengers Preference and Satisfaction of Public Transport in Malaysia, Part II: A Comparative Analysis of Komuter and LRT Network. Research Journal of Applied Sciences, Engineering and Technology 6(8), 1450–1456, https://doi.org/10.19026/rjaset.6.3969.
Salau, T. (2015): Public transportation in metropolitan Lagos, Nigeria: analysis of public transport users’ socioeconomic characteristics. Urban, Planning and Transport Research 3(1), 132–139, https://doi.org /10.1080/21650020.2015.1124247.
Somuyiwa Adebambo Adebayo, I. T. (2009): Impact of Bus Rapid Transit System (BRT) on Passengers’ Satisfaction in Lagos Metropolis, Nigeria. International Journal of Creativity and Technical Development 1(1–3), 106–122.
Soltani, S. H. K., Sham, M., Awang, M., Yaman, R. (2012): Accessibility for disabled in public transportation terminal. Procedia – Social and Behavioral Sciences 35, 89–96, http://dx.doi.org/10.1016/j.sbspro.2012.02.066.
Tayo, O. (2010): The bus rapid transit system of Lagos State Nigeria: A presentation to United Nations climate change mitigation, fuel efficiency and sustainable Urban Transport, Seoul, Korea, Corporate and Investment Planning, Lagos Metropolitan Area Transport Authority (LAMATA).
Thompson, K. (2004): Tourists’ use of public transportation information: What they need and what they get. In: Association for European Transport. Strasbourg, France. Retrieved from http://www.etcproceedings.org/paper /tourists-use-of-public-transport-information-what -they-need-and-what-they-get.
Wall, G., McDonald, M. (2007): Improving bus service quality and information in Winchester. Transport Policy 14(2), 165–179, https://doi.org/10.1016/j.tranpol.2006 .12.001.
Więckowski, M., Michniak, D., Bednarek-Szczepańsk, M., Chrenka, B., Ira, V., Komornicki, T., Rosik, P., Stępniak, M., Szekely, V., Śleszyński, P., Świątek, D., Wiśniewski, R. (2014): Road accessibility to tourist destinations of the Polish-Slovak borderland: 2010–2030 prediction and planning. Geographia Polonica 87(1), 5–26, https:// doi.org/10.7163/GPol.2014.1.
Wojuade, C. A., Badiora, A. I. (2017): Users’ Satisfaction with Public Transport Operations in Ibadan, Nigeria. The Journal of Social Sciences Research 3(9), 88–96.
World Tourism Organization UNWTO (2015): “Understanding Tourism: Basic Glossary,” (Online), http://media.unwto.org/en/content/understanding-tourism-basic-glossary (Accessed: December 29, 2017).
World Trade Organisation (WTO) (2014): Annual Report 2014.
Xiao, S., Jia, L., Jiang, L. (2012): Forest recreation opportunity spectrum in the suburban mountainous region of Beijing. Journal of Urban Planning and Development 138(4), 335–341, https:// doi.org/10.1061/(ASCE)UP.1943-5444.0000125.
Yang, Y. (2010): Analysis of public transport for urban tourism in China. The University of Hong Kong, Hong Kong.
Yukseka, G., Akkoç, I. T., Bayerc, R. U. (2016): The Effects of Public Transport Performance on Destination Satisfaction in the Turkish City of Eskişehir. African Journal of Hospitality, Tourism and Leisure 5(4), 1–12.
Zalatar, W. F. (2012): Quantifying Customers Gender Effects on Service Quality Perceptions of Philippine Commercial Banks, International Conference on Asia Business Innovation and Technology Management. Procedia – Social and Behavioral Science 57, 268–274, https://doi.org/10.1016/j.sbspro.2012.09.1185.

Original Article 81
Landscape types and regional identity – by example of case study in Northwest BohemiaJiří Anděl*, Martin Balej, Ladislav Bobr
J. E. Purkyně University, Faculty of Science, Department of Geography, Czechia* Corresponding author: [email protected]
ABSTRACTThe study examines the relationship of the inhabitants of socially and geographically distinct areas (regions) of Czechia and their relation to regional identity. That is understood as identifying oneself with the region where the inhabitants live, however, we also examine the relationship to hierarchically differing territorial levels.The research was conducted at a regional level, by means of a questionnaire survey, demographic and sociological analyses. Four regions are defined in the study, according to the nature of their environment (devastated, recreational, suburban, and landscape types). The study monitored the population’s identification with a region, or regions of higher orders (NUTS, Czechia, EU, etc.).It was found that the type of landscape has an important role for regional identity, together with some other socio-economic and cultural aspects of the population. The research results have generally confirmed the hypothesis about the impact of selected vari-ables on regional identity. However, the hypothesis about the impact of the natives has not been fully confirmed. The highest values of the identification with the region have been detected in agricultural and suburban landscapes. The devastated landscape turned out to be the worst. When monitoring the hierarchy, it is possible to see the decrease of identity with a growing scale. Therefore, Europe and the EU ended up being the worst. The research is carried out on the example of Northwest Bohemia – Ústí Region, which represents a significantly differentiated space with different types of landscape.
KEYWORDSregion; regional identity; landscape; population; Northwest Bohemia – Ústí Region
Received: 30 January 2018Accepted: 4 May 2019Published online: 10 June 2019
Anděl, J., Balej, M., Bobr, L. (2019): Landscape types and regional identity – by example of case study in Northwest Bohemia. AUC Geographica 54(1), 81–91https://doi.org/10.14712/23361980.2019.8
© 2019 The Authors. This is an open-access article distributed under the terms of the Creative Commons Attribution License (http://creativecommons.org/licenses/by/4.0).

82 Jiří Anděl, Martin Balej, Ladislav Bobr
1. Introduction
Formation of regional identity depends on a whole series of factors. These factors relate to the region where the person lives. The type of landscape can play an important role, together with the socio-eco-nomic and cultural characteristics of population in the region. Examples include education, economic activi-ty or religiosity. In this article, the authors focus atten-tion on proving or disproving the existing connection. They want to answer questions such as: Do the rural residents identify with the region more than the res-idents of urban territories? What negative role does the devastated landscape have? Is regional identity affected by the educational attainment of the popula-tion? In the article we deal with hierarchic dimension of regional identity. Our point of interest is wheth-er the urbanized population has a greater sense of belonging to the state or to the European Union than the rural population.
Regional identity is understood as perception of the people in a particular territory or a region with its specific characteristics. For example, it concerns the natural environment and culture in a region that is different from the others (Tuan 1996). For shaping and forming of regional identity, the specific relation-ships are of great importance, and they strictly have to include identity. This is because the individuals or groups of individuals can understand it well. After that, cultural, national, political, etc. identity can be shaped (Castells 1997).
The personal identity shows their relationship to the surroundings. It has a pluralistic character, this means that it relates to a variety of objects and sub-jects, for example to individuals, groups, values, man-ners, cultures, but also to a variety of events, and the physical environment (Kyle et al. 2004). With its own identity a person responds to questions like “what
am I”, “where do I belong”, “who do I differ from”, etc. One of the personal identity components is also regional identity, i.e. the relationship between people and the place they live or lived in (Zich 2003; Paasi 1991, 2009). Regional identity particularly answers the question “where do I belong?” it implies identi-fication with the territory, “putting down roots” in a place, and in the strict meaning “what I consider to be home”. This relationship can take various forms, from a strong relationship demonstrated by inter-vention to improve the appearance of the territory, to a weak relationship, when individuals find a region to be a place, which does not connect them to their own future, and which they want to leave (Kasala 2006).
In terms of regional identity, the region is a ter-ritory, which an individual is identified with. It is obvious that such a region will vary in different peo-ple’s minds, and it may not be the same as administra-tively defined units. According to Zich (2003, p. 22), it is mostly “about the historically formed territorial units characterized by the relative boundaries (per-ception of national borders), its own history, partly by its specific culture, and last but not least the social composition of the population”. Each of these and other characteristics (economic development, trans-port accessibility, ecology, landscape type, aesthetic appearance, etc.) can be other partial dimensions of regional identity, or at least they can influence it. The region also has its name, which is used in everyday communication, and it usually does not match with the territory of the administrative units (Semian, Chromy 2014). Zich further mentions two aspects of identification with the territory. Firstly, it is the identification with the physical environment, which is also described as the material base. Secondly, it is the identification with the social environment of the territory. The Research of Walker and Ryan (2008) confirms these facts. They are talking about making
Fig. 1 Regional identity dimension.Source: By A. Paasi (1986, p. 132)

Landscape types and regional identity 83
an attachment to places which could satisfy our needs and life goals. Regional identity also includes the peo-ple living in the territory, their ways of life, institu-tions, organisations, their culture, history, etc. As it is specified further, these two aspects have different levels – from their own residence (microregion) to higher territorial units (macroregions). This idea is not new for geographers, it is referred to as hierarchi-cal levels (or scale), and developmental complexity of systems (Hampl 2000; Lewicka 2011).
Chromy (2003), who applies the theoretical approach of the Finnish regional geographer Ans-si Paasi (see Fig. 1), cites Paasi in his work: “We can understand the territorial identity as originality, uni-ty and conformity, and in particular harmony in the behaviour of the population in a territory at a specific moment (time).” Furthermore, he uses the term “iden-tity of the region”, which is the same within the mean-ing of territorial identity. In general it can be said that this approach to the topic is more objectivistic. There is no longer such an emphasis on the identification of people with the territory. The identification is nec-essary to be studied with an emphasis on a personal view, but the research focuses on the observable dif-ferences from the surrounding regions. That means it is research of what we can be identified with, and how the region has evolved. The key words of Chromy and Paasi’s work include e.g. a symbolic shape of the region (Semian, Chromy, Kučera 2016), and the insti-tutionalisation of the region.
Chromy (2003) developed this theory on the dimension of regional identity, and he also divided identity into a subjective and an objective level. The subjective level includes the opinions of inhabitants and individuals living outside the region, and there-fore it is all about regional awareness. The objective level includes structuring on the basis of different sci-entific disciplines (commuting, physical geography). Each region has its own image, and it is perceived by individuals in their specific way each time, and it is also shaped in different ways. Nevertheless, every region should have its name (Semian 2016), a symbol or a logo of the region (Šifta, Chromy 2017), political power, offices, cultural areas, and other less impor-tant specifics (Heřmanova, Chromy et al. 2009).
2. Methodological notes
Current problems with the stability of the population are just one of the consequences of earlier develop-ment with a major negative impact on the economic preferences (mining industry, power engineering, and chemistry). Orientation towards heavy industry (as a base for an armoury) at the expense of the commer-cial sectors has led to an increase in energy require-ments. There was a tendency to create a closed sec-toral cycle with crosslinks and deliveries (lignite mining, power industry, chemicals, transportation
and capital construction), and significantly autono-mous character with a high consumption of resourc-es and devastating effects on the environment (Anděl, Jeřabek, Oršulak 2004). These dynamic changes have resulted in disruption of the continuity of natural development, increase in heterogeneity of the terri-tory, and the disruption of regional identity.
The following types of landscape have been select-ed: a) agricultural type, where you can theoretically assume a distinct regional identity (or its current strengthening); b) recreational area, intensely influ-enced by the departure of German-speaking popula-tion after World War II (Bičík et al. 2010; Houžvička, Novotny 2007), and by the subsequent lack of settle-ment (cottages have a significant recreational poten-tial), c) the suburban type on the periphery of a large city, d) devastated (industrial) type, where a signif-icant loss of regional identity took place during the second half of the 20th century (the area of intensive mining of brown coal).
On the basis of a field survey, demographic and social analysis, there were some case studies done for the case study landscape. Those include the eval-uation of geographical location, natural potential (geomorphology, hydrological potential, environ-mental resources), the historical potential (histori-cal memory, regional symbolism, typical landscapes and buildings earlier and now, historical and cultur-al monuments, etc.), the demographic potential (age index, the percentage of college students, religiosi-ty, the year of maximum number of inhabitants, the population development index 1950/1930, etc.); the socio-economic potential (production tradition, work and business opportunities, unemployment and its development, job mobility, transport accessibility). The case studies also include an interpretation of the questionnaire investigation results. The investi-gation demonstrated how the region is reflected in the awareness of local residents (for more detail see Anděl, Balej, Raška et al. 2014).
The survey was conducted during the years 2015–2016. For each case study landscape there were 100 completed questionnaires gathered. In addition to the identification questions (age, gender, occupation, uni-versity rate, religiosity), the respondents were asked how long they had lived in the region, and which of the territorial units they could most identify with (microregion, Ústi Region, Czechia, European Union, Europe). From a total of 12, some questions involved for example typical elements that symbolize the region, and things that the residents could be proud of (Šifta, Chromy 2014).
3. Case study landscapes
The Ústí Region is situated in Northwest Bohemia. It is characterized by a specific landscape and econom-ic activities related to the natural potential (brown

84 Jiří Anděl, Martin Balej, Ladislav Bobr
Fig. 2 The researched area in relation to administrative units of Czechia.Author: Bobr (2017). Data source: Arc ČR 500. Projection: Albers
Fig. 3 Landscape types – evolution of population 1950/1930.Source: Czech Statistical Office (2006) – Český statistický úřad (2006)
Tab. 1 Landscape types – selected socio-economic characteristics 2011.
IndicatorLandscape type
Agricultural Recreational Suburban Devastated
Natives (%) 35 18 25 41
University rate (%) 5 5 9 2
Religiosity (%) 11 8 11 3
Net migration 7 18 3 –2
Source: SLDB (2011)
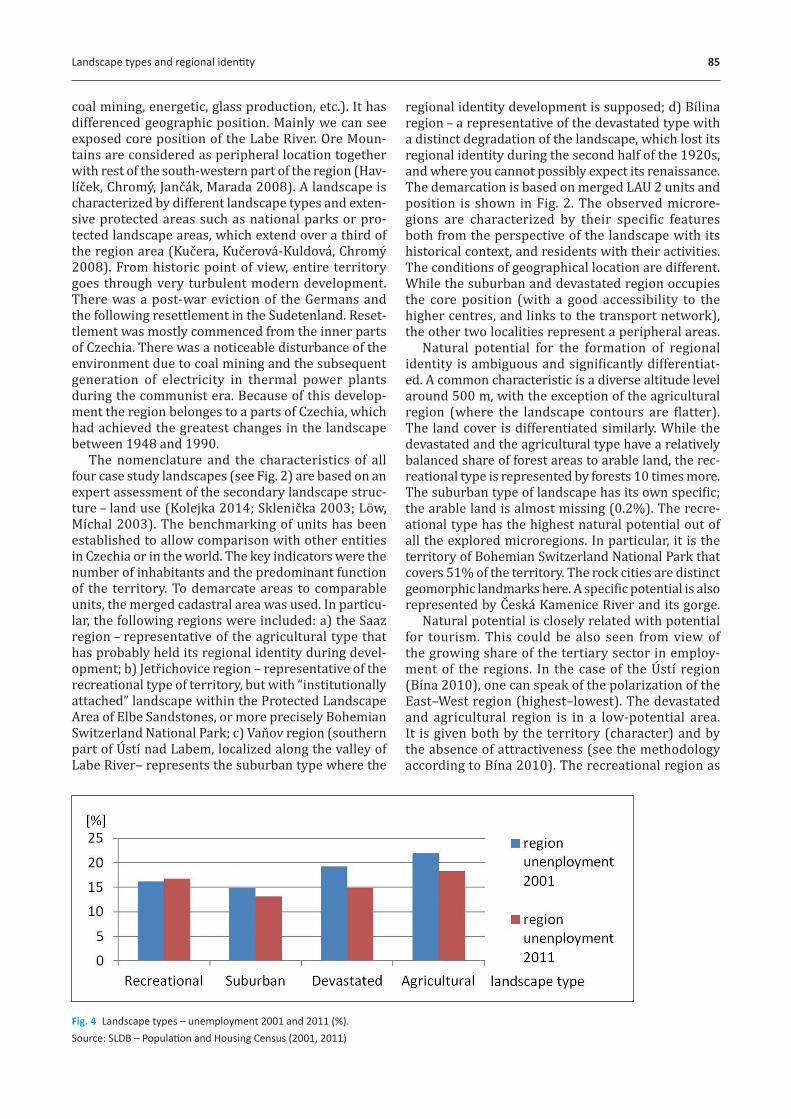
Landscape types and regional identity 85
coal mining, energetic, glass production, etc.). It has differenced geographic position. Mainly we can see exposed core position of the Labe River. Ore Moun-tains are considered as peripheral location together with rest of the south-western part of the region (Hav-líček, Chromy, Jančak, Marada 2008). A landscape is characterized by different landscape types and exten-sive protected areas such as national parks or pro-tected landscape areas, which extend over a third of the region area (Kučera, Kučerova-Kuldova, Chromy 2008). From historic point of view, entire territory goes through very turbulent modern development. There was a post-war eviction of the Germans and the following resettlement in the Sudetenland. Reset-tlement was mostly commenced from the inner parts of Czechia. There was a noticeable disturbance of the environment due to coal mining and the subsequent generation of electricity in thermal power plants during the communist era. Because of this develop-ment the region belonges to a parts of Czechia, which had achieved the greatest changes in the landscape between 1948 and 1990.
The nomenclature and the characteristics of all four case study landscapes (see Fig. 2) are based on an expert assessment of the secondary landscape struc-ture – land use (Kolejka 2014; Sklenička 2003; Löw, Míchal 2003). The benchmarking of units has been established to allow comparison with other entities in Czechia or in the world. The key indicators were the number of inhabitants and the predominant function of the territory. To demarcate areas to comparable units, the merged cadastral area was used. In particu-lar, the following regions were included: a) the Saaz region – representative of the agricultural type that has probably held its regional identity during devel-opment; b) Jetřichovice region – representative of the recreational type of territory, but with “institutionally attached” landscape within the Protected Landscape Area of Elbe Sandstones, or more precisely Bohemian Switzerland National Park; c) Vaňov region (southern part of Ústí nad Labem, localized along the valley of Labe River– represents the suburban type where the
regional identity development is supposed; d) Bílina region – a representative of the devastated type with a distinct degradation of the landscape, which lost its regional identity during the second half of the 1920s, and where you cannot possibly expect its renaissance. The demarcation is based on merged LAU 2 units and position is shown in Fig. 2. The observed microre-gions are characterized by their specific features both from the perspective of the landscape with its historical context, and residents with their activities. The conditions of geographical location are different. While the suburban and devastated region occupies the core position (with a good accessibility to the higher centres, and links to the transport network), the other two localities represent a peripheral areas.
Natural potential for the formation of regional identity is ambiguous and significantly differentiat-ed. A common characteristic is a diverse altitude level around 500 m, with the exception of the agricultural region (where the landscape contours are flatter). The land cover is differentiated similarly. While the devastated and the agricultural type have a relatively balanced share of forest areas to arable land, the rec-reational type is represented by forests 10 times more. The suburban type of landscape has its own specific; the arable land is almost missing (0.2%). The recre-ational type has the highest natural potential out of all the explored microregions. In particular, it is the territory of Bohemian Switzerland National Park that covers 51% of the territory. The rock cities are distinct geomorphic landmarks here. A specific potential is also represented by Ceska Kamenice River and its gorge.
Natural potential is closely related with potential for tourism. This could be also seen from view of the growing share of the tertiary sector in employ-ment of the regions. In the case of the Ústí region (Bína 2010), one can speak of the polarization of the East–West region (highest–lowest). The devastated and agricultural region is in a low-potential area. It is given both by the territory (character) and by the absence of attractiveness (see the methodology according to Bína 2010). The recreational region as
Fig. 4 Landscape types – unemployment 2001 and 2011 (%).Source: SLDB – Population and Housing Census (2001, 2011)

86 Jiří Anděl, Martin Balej, Ladislav Bobr
whole is situated in the average region of Czechia in scope of tourism potential, but it is above average at local levels. It is mainly due to natural attractions. The last suburban region lies in the above-average area, because it combines the presence of cultural attractions along with the natural landscape of the hills situated nearby.
The core areas lost significantly smaller amounts of population – only 12% of the inhabitants lived in the suburban type, and 28% of them in the devastated regions between the years 1930–1950. However, the population was reduced to a third in the peripheral and the recreational region, and to a half in the agri-cultural region (see Fig. 3). Here, of course, nation-al diversity played a part, at least in the case of the industrial (now heavily devastated) type, where the percentage of Germans was “only” 54%. On the con-trary, only one Czech family lived in the suburban type of landscape in 1930.
The low proportion of natives (see Tab. 1), low religiosity and low education work against the forma-tion of the sense of belonging to a region. Low level of natives compounded between the years 2001–2011. Especially in the recreational type it was reduced to a half. The reason is probably high migration relat-ed to a very high-quality environment. A particular advantage is the increase of population with a uni-versity degree, especially for the suburbanized areas, and the growth of population in peripheral locations thanks to the high migration connected with favour-able living conditions. On the contrary, the number of residents is decreasing in the devastated region, where the conditions are very adverse.
The most serious problem, with the exception of the suburbanized region, is high unemployment (see
Fig. 4), exceeding 17% for the agricultural areas. A typical crop for Saaz area is primarily a world-fa-mous variety of hops (Saaz hops). Job mobility of citizens has decreased significantly, which is mainly the result of a strategic plan for the development of the town of Saaz, in which the municipal authorities try to support small businesses. At the same time, the unemployment decreases.
4. Results
The public opinion survey took place during the sem-inar of students of the Department of Geography, Fac-ulty of Science at Jan Evangelista Purkyně University, in autumn of 2015 and 2016. It provides quite an inte-grated collection of information about the opinions of local populations. For each region were collected 100 questionnaires. Due to the size of the regions, gender and educational structure of the respondents, the survey is to be regarded as representative (Tab. 2). The respondents can give relevant indications about the locations because 70% of them have lived here more than 10 years, and they also have an immedi-ate and long-term possibility to perceive individual events in their region (Tab. 3).
The hierarchy of regional identity (see Tab. 4) is aligned with the territory at different hierarchical levels (microregion, NUTS 4, Ústí Region, Czechia, EU, and Europe) in the 4 types of landscape mentioned above. The highest values of regional identity are in the smallest territorial units, i.e. microregions. This is primarily due to the fact that small units are closer to identity than the large ones. It is also demonstrated by the values for the EU, which has a weak regional
Tab. 2 Landscape types – structure of respondents 2013 (%).
IndicatorLandscape type
Agricultural Recreational Suburban Devastated
Women (%) 49 52 63 47
Age 25–44 years (%) 22 48 38 29
University rate (%) 5 15 14 6
Natives (%) 36 26 72 46
Working at place of residence (%) 30 38 45 42
Source: Investigation of the Department of Geography, Faculty of Science, J. E. Purkyně University, Ústí nad Labem
Tab. 3 Landscape types – length of life in the place of residence 2013 (%).
IndicatorLandscape type
Agricultural Recreational Suburban Devastated
Natives (%) 36 26 72 46
Over 10 years citizens 37 41 19 35
Between 2–9 years citizens 22 26 8 12
Between 0–1 years citizens 5 7 1 7
Source: Investigation of the Department of Geography, Faculty of Science, J. E. Purkyně University, Ústí nad Labem

Landscape types and regional identity 87
identity. In the context of the region, the agricultural landscape has the highest identity, since here there are certain traditions that are held close by the people. It is primarily about the relationship to the land. In con-trast, the smallest values of identity are to be found in the devastated landscape, where the residents cannot create regional identity to such an extent. It is also a peripheral area, where there is no such proportion of the indigenous population, the so-called “deni-zens”. Within the district, the recreational landscape has the highest values, which may be due to the fact that in this type of landscape residents live tempo-rarily, and their identification with the territory is often very strong. These are often the cottagers, who are closely connected with the region (they stay in the building where their ancestors lived). These peo-ple can identify with this place, and they feel a part of it (Lewicka 2011; Lokocz et al. 2011). Within the territory of Czechia, the suburban landscape has the highest values of regional identity. This is due to the fact that residents feel the closest to the place of their residence and the surrounding area, which is repre-sented by the urban and suburban zone. On the oth-er hand, the devastated landscape has the smallest values again. Within the EU, as mentioned earlier, regional identity reaches negligible values, but the highest values are in the countryside, where many people from the EU go on holiday. As far as the whole of Europe, the values are very similar, and the differ-ences are very slight.
Identification with the region is significantly dif-ferentiated by age of the respondents (see Fig. 5). In the youngest age group, under 24 years, the respond-ents feel themselves the most to be the inhabitants of Czechia and the Ústí Region, and the least of the European Union. Category 25–44 is fairly balanced, the respondents identify themselves with the Euro-pean Union the least. Respondents aged 45–64 years feel to belong to the place of residence the most, and the least to the European Union again. A similar situ-ation is in the category of over 65 years, whose mem-bers feel to be the citizens of their place of residence; then the case study region, and Czechia. Age structure reflects that older respondents are more accustomed with the area where they live, and they feel to be a part of their residence. The respondents of younger age groups feel more to be a part of larger territorial units, such as Czechia or the Ústí Region.
Figure 6 shows the existence of at least general ide-as about connections between the type of landscape and regional identity with the selected variables. The variables included the indicators, which may influ-ence the formation of regional identity (Heřmanova, Chromy et al. 2009; Chromy, Janu 2003). With refer-ence to these studies, we chose the following indica-tors. As for natural potential, it is assumed that the region with higher potential will have stronger region-al identity, similarly to the territory with a higher per-centage of natives, university degree holders and the religious. The Influence of natives is confirmed by Walker and Ryan (2008, p. 143) in their paper. They also present a hypothesis that attachment to a place grows with time. For migration, the situation is incon-sistent. However, it seems the regions with a positive migration balance could create conditions for strong-er regional identity in the territory. The variables were obtained from the data of the population census 2011 (see Tab. 1). The value of the natural potential was established by the five-member expert group on the basis of data from the case studies (see the meth-odological part).
5. Discussion
Natural potential has an important role in the cho-sen types of landscape. Where it is significant, there could be seen relatively strong regional identity in the population (Fialova, Chromy, Kučera et al. 2010). Population of devastated lands shows a low degree of identity, according to assumptions.
The largest proportion of natives is situated in agri-cultural and devastated landscapes, as was assumed. Agricultural landscape is a traditional landscape and especially older generations have lived here for a life-time, similarly with the devastated region. Another factor that affects a portion of natives is low mobil-ity and education of inhabitants in this region. This could be seen in Tab. 2. Agricultural and devastated regions have less than half of people with university degree compared to the other two studied regions. If the people from these regions wanted to change their living space and move for example to the city, they encountered barriers. These restrains take form of low sale value of their estate or low education. Both of these examples make it harder or impossible for an
Tab. 4 Landscape types – hierarchy of regional identity 2013 (%).
Landscape type Europe EUNUTS 1 NUTS NUTS 4
MICROREGIONCzechia Ústí Region DISTRICT
Agricultural 13 1 28 16 14 28
Recreational 13 7 23 18 21 18
Suburban 12 6 21 19 19 23
Devastated 17 8 23 17 13 22
Source: Investigation of the Department of Geography, Faculty of Science, J. E. Purkyně University, Ústí nad Labem

88 Jiří Anděl, Martin Balej, Ladislav Bobr
Fig. 5 Landscape types – total number of respondents who expressed a local sentiment according to age groups 2013.Source: Investigation of the Department of Geography, Faculty of Science, J. E. Purkyně University, Ústí nad Labem
Fig. 6 Landscape types – relation between regional identity and its variables 2013.Author: Bobr (2017). Data source: Arc ČR 500. Projection: Albers
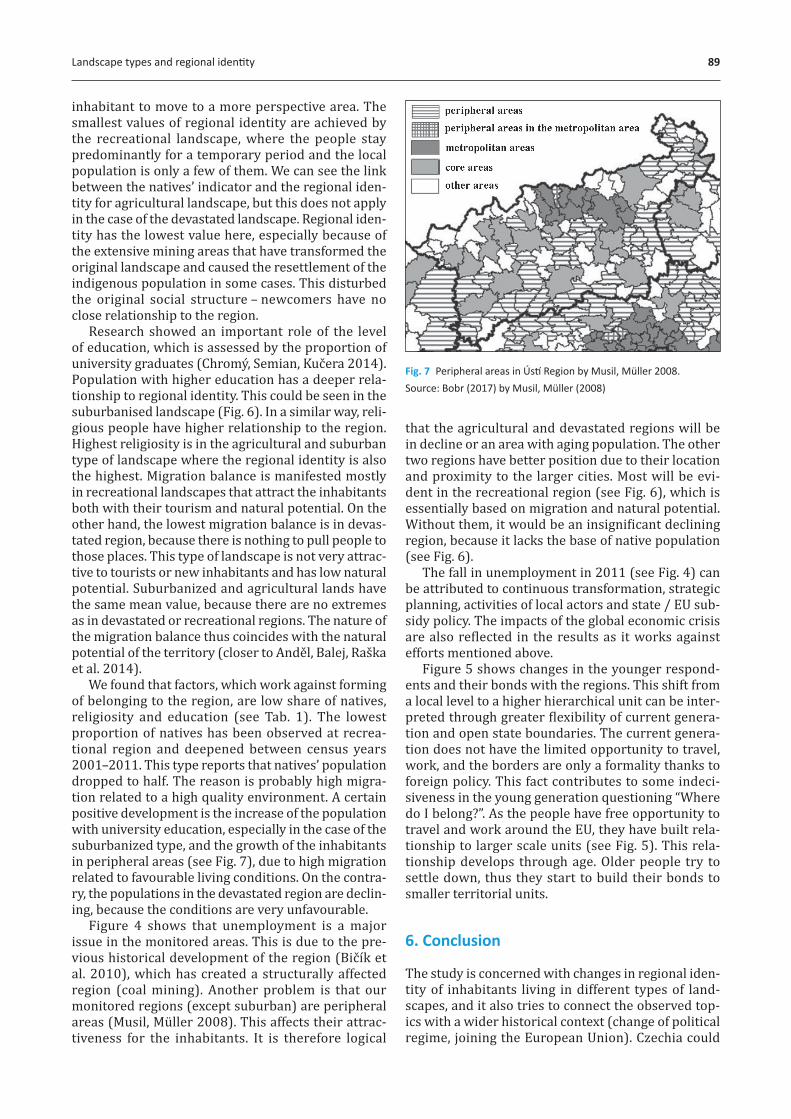
Landscape types and regional identity 89
inhabitant to move to a more perspective area. The smallest values of regional identity are achieved by the recreational landscape, where the people stay predominantly for a temporary period and the local population is only a few of them. We can see the link between the natives’ indicator and the regional iden-tity for agricultural landscape, but this does not apply in the case of the devastated landscape. Regional iden-tity has the lowest value here, especially because of the extensive mining areas that have transformed the original landscape and caused the resettlement of the indigenous population in some cases. This disturbed the original social structure – newcomers have no close relationship to the region.
Research showed an important role of the level of education, which is assessed by the proportion of university graduates (Chromy, Semian, Kučera 2014). Population with higher education has a deeper rela-tionship to regional identity. This could be seen in the suburbanised landscape (Fig. 6). In a similar way, reli-gious people have higher relationship to the region. Highest religiosity is in the agricultural and suburban type of landscape where the regional identity is also the highest. Migration balance is manifested mostly in recreational landscapes that attract the inhabitants both with their tourism and natural potential. On the other hand, the lowest migration balance is in devas-tated region, because there is nothing to pull people to those places. This type of landscape is not very attrac-tive to tourists or new inhabitants and has low natural potential. Suburbanized and agricultural lands have the same mean value, because there are no extremes as in devastated or recreational regions. The nature of the migration balance thus coincides with the natural potential of the territory (closer to Anděl, Balej, Raška et al. 2014).
We found that factors, which work against forming of belonging to the region, are low share of natives, religiosity and education (see Tab. 1). The lowest proportion of natives has been observed at recrea-tional region and deepened between census years 2001–2011. This type reports that natives’ population dropped to half. The reason is probably high migra-tion related to a high quality environment. A certain positive development is the increase of the population with university education, especially in the case of the suburbanized type, and the growth of the inhabitants in peripheral areas (see Fig. 7), due to high migration related to favourable living conditions. On the contra-ry, the populations in the devastated region are declin-ing, because the conditions are very unfavourable.
Figure 4 shows that unemployment is a major issue in the monitored areas. This is due to the pre-vious historical development of the region (Bičík et al. 2010), which has created a structurally affected region (coal mining). Another problem is that our monitored regions (except suburban) are peripheral areas (Musil, Müller 2008). This affects their attrac-tiveness for the inhabitants. It is therefore logical
that the agricultural and devastated regions will be in decline or an area with aging population. The other two regions have better position due to their location and proximity to the larger cities. Most will be evi-dent in the recreational region (see Fig. 6), which is essentially based on migration and natural potential. Without them, it would be an insignificant declining region, because it lacks the base of native population (see Fig. 6).
The fall in unemployment in 2011 (see Fig. 4) can be attributed to continuous transformation, strategic planning, activities of local actors and state / EU sub-sidy policy. The impacts of the global economic crisis are also reflected in the results as it works against efforts mentioned above.
Figure 5 shows changes in the younger respond-ents and their bonds with the regions. This shift from a local level to a higher hierarchical unit can be inter-preted through greater flexibility of current genera-tion and open state boundaries. The current genera-tion does not have the limited opportunity to travel, work, and the borders are only a formality thanks to foreign policy. This fact contributes to some indeci-siveness in the young generation questioning “Where do I belong?”. As the people have free opportunity to travel and work around the EU, they have built rela-tionship to larger scale units (see Fig. 5). This rela-tionship develops through age. Older people try to settle down, thus they start to build their bonds to smaller territorial units.
6. Conclusion
The study is concerned with changes in regional iden-tity of inhabitants living in different types of land-scapes, and it also tries to connect the observed top-ics with a wider historical context (change of political regime, joining the European Union). Czechia could
Fig. 7 Peripheral areas in Ústí Region by Musil, Müller 2008.Source: Bobr (2017) by Musil, Müller (2008)

90 Jiří Anděl, Martin Balej, Ladislav Bobr
serve as example in studies of people displacement impact due to the events in borderland at the end of World War II. Aftermath of these following events can still be felt to present day. Newcomers have to build relationship to new landscape but the process was broken due the rise of Communist Party regime which began with collectivisation. The onset of capitalism at the end of 80s brings another problem with returning land to individual people. There was the same prob-lem at the end of World War II. When government started returning land to the original owners before collectivisation, many of them were simply too old or dead and their posterity lived in different milieu to take care of returned land. Those events were draw-back for people’s relationship to those places and reduced their regional identity to almost nothing, if they even bothered to come back. It has been proven that the type of landscape has an important role, as well as some social and economic aspects of people living there. Similar results were obtained for exam-ple by Kasala (2006) or Raagmaa (2002).
The highest value of regional identity has been identified in the agricultural and the suburban land-scape. This result supports the hypothesis of Brown and Raymond (2007) about the influence of nature in creation of the attachment to a place. They also claim that nature along the studied roads has helped to improve the attachment to a place (Brown, Ray-mond 2007, p. 108). These case study territories have the highest proportion of religiosity, and the highest, respectively mean proportion values of natives; medi-um, respectively the highest proportion of undergrad-uates; and medium intensity of the natural potential and migration balance. The recreational landscape has the mean value of regional identity; it also has a high natural potential and migration balance; medium intensity of undergraduates and religiosity, but a low proportion of natives. This could be caused by repeat-ed visits to that place. Kyle et al. (2004) points out the effect of addiction to a place. He has mentioned, that if we visit a place very often, we could develop stronger attachment to it (positive or negative). The results generally confirm the hypothesis that regional identity depends on the observed variables of land-scape potential, education, religiosity, and migratory movements. This hypothesis was not confirmed fully in the context of the share of natives. It shows that a higher proportion of natives may not result in the strengthening of regional identity. The natives don’t have to be necessarily perspective for the future of regional development, because they could stay in declining region due to their age or low mobility. In most cases the newcomers are wealthier and young-er. They appreciate natural landscape in same way as natives, maybe more because they mostly came from cityscape, where in most cases the natural landscape is not present. There is a higher chance that newcom-ers will have tendencies to protect and cultivate sur-rounding landscape (see recreational area).
To start or keep up with area development is important to aim at strong sides of regions. All sur-veyed locations have advantage of good transport con-nectivity, which is elemental for current global society. When landscape planning, a negative intervention in nature has to be avoided, because it could lower the attractiveness for free time activity as whole. Recrea-tional areas natural landscape is often the only thing which attracts people to go there.
The analysis of the hierarchy of regional identity provides interesting results. For all types of land-scapes, we can say that the relationship to our own region is strong. In the agricultural and suburban landscape, it is the strongest. Then it is the sense of belonging to Czechia. In the recreational landscape, the sense of belonging to the district is stronger than to the region. The devastated landscape has generally the weakest regional identity. In all of the case study territories, the relationship to the EU and Europe, the largest territorial units, is marginal. In the case of the agricultural landscape it is most obvious. This is due to the fact that people are not directly related to these units. They do not have to be concerned with them because they are outside their area of interest, and beyond their everyday needs.
The results further illustrate the fact that the rate of population’s feeling of belonging to a region offers the potential for forming a vision for develop-ment. This vision should reflect regional specificities, including geographically differentiated relationship to the countryside where people live (Chromy, Sem-ian, Kučera 2014; Walker, Ryan 2008; Lokocz et al. 2011; Gobster et al. 2007). In the longstanding weak or peripheral areas, people also recognize factors oth-er than the economic values of the territory.
ReferencesAnděl, J., Balej, M., Raška, P. et al. (2014): Regionalní identita
Ústeckeho kraje – vybrane případove studie. MINO, UJEP.Anděl, J., Jeřabek, M., Oršulak, T. (2004): Vyvoj sídelní
struktury a obyvatelstva pohraničních okresu Ústeckeho kraje. Acta Universitatis Purkynianae, 88, Studia geographica, IV.
Bičík, I. et al. (2010): Vyvoj využití ploch v Cesku. Praha: CGS.
Bína, J. (2010): Potencial cestovního ruchu v Ceske republice [zavěrečna zprava]. Brno: Ústav územního rozvoje Ceske republiky [cit. 2017-01-16], http://www .uur.cz/default.asp?ID=3690.
Brown, G., Raymond, C. (2007): The relationship between place attachment and landscape values: Toward mapping place attachment. Applied Geography 27, 89–111, https://doi.org/10.1016/j.apgeog.2006.11.002.
Castells, M. (1997): The power of identity. II. Oxford: Blackwell.
Cesky statisticky úřad (2006): Historicky lexikon obcí Ceske republiky 1869–2005 [online]. Praha: CSÚ [cit. 2017-03-19], http://www.czso.cz/csu/2004edicniplan .nsf/p/4128-04.

Landscape types and regional identity 91
Fialova, D., Chromy, P., Kučera, Z. et al. (2010): The forming of regional identity and identity of regions in Czechia – introduction to the research on the impact of second housing and tourism, AUC Geographica 45(1), 49–60.
Gobster, P. H., Nassauer, J. I., Daniel, T. C., Fry, G. (2007): The shared landscape: what does aesthetics have to do with ecology? Landscape Ecology 22(7), 959–972, https://doi.org/10.1007/s10980-007-9110-x.
Hampl, M. (2000): Reality, Society and Geographical/Environmental Organization: Searching for an Integrated Order. Department of Social Geography and Regional Development, Charles University in Prague, Faculty of Science, Prague, 112 pp.
Havlíček, T., Chromy, P., Jančak, V., Marada, M. (2008): Innere und äußere Peripherie am Beispiel Tschechiens. Mitteilungen der Österreichischen Geographischen Gesellschaft 150, 299–316.
Heřmanova, E., Chromy, P. et al. (2009): Kulturní regiony a geografie kultury: kulturní realie a kultura v regionech Ceska. Praha: ASPI.
Houžvička, V., Novotny, L., eds. (2007): Otisky historie v regionalních identitach obyvatel pohraničí: sebedefinice a vzajemne vnímaní Cechu a Němcu v přímem sousedství. Praha: Sociologicky ústav AV CR.
Chromy, P., Janu, H. (2003): Regional identity, activation of territorial communities and the potential of the development of peripheral regions. AUC Geographica 38(1), 105–117.
Chromy, P. (2003): Formovaní regionalní identity: nezbytna součast geografickych vyzkumu. Geografie na cestach poznaní. Sborník příspěvku k šedesatinam I. Bičíka. Praha: Univerzita Karlova, PřF, Katedra socialní geografie a regionalního rozvoje, pp. 163–178.
Chromy, P., Semian, M., Kučera, Z. (2014): Regional Awareness and Regional Identity in Czechia: Case Study of the Bohemian Paradise. Geografie 119(3), 259–277.
Kasala, K. (2006): Meniaca sa identita miesta: metodika vyskumu. Geograficka revue 2(2), 709–723.
Kolejka, J. (2014): Přírodní krajiny Ceske republiky. Katalog typu přírodních krajin. Brno: Masarykova univerzita.
Kučera, Z., Kučerova-Kuldova, S., Chromy, P. (2008): Landscape heritage between areal preservation and areal development – the case of Czechia. Geographia Polonica 81(2), 5–23.
Kyle, G. et al. (2004): Effects of place attachment on users’ perceptions of social and environmental conditions in a natural setting. Journal of Environmental Psychology 24, 213–225.
Lewicka, M. (2011): Place attachment: How far have we come in the last 40 years? Journal of Environmental Psychology 31, 207–230.
Lokocz, E., Ryan, R. L., Sadler, A. J. (2011): Motivations for land protection and stewardship: Exploring place attach-ment and rural landscape character in Massachusetts. Landscape and Urban Planning 99, 65–76.
Löw, J., Míchal, I. (2003): Krajinny raz. Kostelec nad Cernymi lesy: Lesnicke prace s. r. o.
Musil, J., Müller, J. (2008): Inner Peripheries of the Czech Republic as a Mechanism of Social Exclusion. Czech Sociological Review 44(2), 321–348.
Paasi, A. (1986): The institutionalization of regions: a theoretical Framework for understanding the emergence of regions and the constitution of regional identity. Fennia 164(1), 105–146.
Paasi, A. (1991): Deconstructing regions: notes on the scales of spatial life. Environment and Planning A 23, 239–256.
Paasi, A. (2009): The resurgence of the ‘Region’ and ‘Regional Identity’: theoretical perspectives and empirical observations on regional dynamics in Europe. Review of International Studies 35, 121–146, https:// doi.org/10.1017/S0260210509008456.
Raagmaa, G. (2002): Regional identity in regional development and planning. European Planning Studies 10(1), 55–77.
SLDB – Sčítaní lidu domu a bytu (2001): Ekonomicka aktivita obyvatelstva [online]. Praha: CSÚ [cit. 2017-01-16]. Dostupné z: https://www.czso.cz/csu/czso/ekonomicka -aktivita-obyvatelstva-2001-2xolmf0veo.
SLDB – Sčítaní lidu domu a bytu (2011): Obyvatelstvo podle pohlaví a podle ekonomické aktivity v obci [online]. Praha: CSÚ [cit. 2017-01-16]. Dostupne z: http://vdb .czso.cz/sldbvo/#!stranka=podle-tematu&tu=0&th =a+podle+ekonomick%C3%A9+aktivity+v+obci&v=&vo =null&vseuzemi=null&void=.
Semian, M. (2016): Region in its complexity: A discussion on constructivist approaches. AUC Geographica 51(2), 177–186, https://doi.org/10.14712/23361980 .2016.15.
Semian, M., Chromy, P. (2014): Regional identity as a driver or a barrier in the process of regional development: A comparison of selected European experience. Norsk Geografisk Tidsskrift – Norwegian Journal of Geography 68(5), 263–270, https://doi.org/10.1080/00291951 .2014.961540.
Semian, M., Chromy, P., Kučera, Z. (2016): Name as a regional brand: The case of Local Action Groups in Czechia. Journal of Language and Politics 15(6), 768–789.
Sklenička, P. (2003): Zaklady krajinneho planovaní. 2nd ed. Praha: Nakl. Naděžda Skleničkova.
Šifta, M., Chromy, P. (2014): Symboly a identita regionu: analyza vnímaní přírodních symbolu oblastí s intenzivně přeměněnou krajinou v Cesku. Geograficky časopis 66(4), 401–415.
Šifta, M., Chromy, P. (2017): The importance of symbols in the region formation process. Norsk Geografisk Tidsskrift – Norwegian Journal of Geography 71(2), 98–113, http://dx.doi.org/10.1080/00291951.2017 .1317285.
Tuan, Y. F. (1996): Space and Place: Humanistic Perspective, (reprint). In: Agnew, J., Livingstone, D., Rogers, A.: Human Geography: An Essential Anthology. Oxford: Blackwell, 445–457.
Walker, A. J., Ryan, R. L. (2008): Place attachment and landscape preservation in rural New England: A Maine case study. Landscape and Urban Planning 86, 141–152.
Zich, F., ed. (2003): Regionalní identita obyvatel v pohraničí: Sborník příspěvku z konference “Evropska, narodní či regionalní identita?”. Praha: Sociologicky ústav AV CR.

92 Original Article
The ‘exotic’ phenomenon of the American Bar in interwar Berlin and Prague: Re-reading the concept of placeTomáš Mozr*
Charles University, Faculty of Science, Department of Social Geography and Regional Development, Czechia* Corresponding author: [email protected]
ABSTRACTThis paper deals with the socio-spatial relations of changes in the concept of place. Since the 1970s, place has been one of the key terms of humanistic geography. Therefore, this paper reflects how the concept of place, its functions and meanings could be applied in the changing space-time and social contexts. The ‘exotic’ phenomenon of the American Bar which had penetrated into Europe in the first half of the 20th century can be regarded as a representative of place when it had emerged during Americanisation as a new cultural element. This article compares the interwar development of this phenomenon in two European capitals (Berlin, Prague) and analyses both differences and the common attributes of the process of forming place. Emphasis is placed not only on the localisation of the American Bar, but also on more complex historical and geographical analysis of its development and per-ception that were characteristic exclusively for the Central European region. Using the archive materials, the contemporary press, legislative measures and professional and memoir literature, the study confirms that the American Bar phenomenon had acquired different meanings within different contexts which had changed over time and which can be documented through the “spreading” of this phenomenon in space.
KEYWORDSplace; American Bar; night-life geography; Americanization; Berlin; Prague
Received: 16 June 2018Accepted: 30 April 2019Published online: 13 June 2019
Mozr, T. (2019): The ‘exotic’ phenomenon of the American Bar in interwar Berlin and Prague: Re-reading the concept of place. AUC Geographica 54(1), 92–104https://doi.org/10.14712/23361980.2019.9
© 2019 The Author. This is an open-access article distributed under the terms of the Creative Commons Attribution License (http://creativecommons.org/licenses/by/4.0).

The phenomenon of the American Bar in interwar Berlin and Prague 93
1. Introduction
This comparative study deals with the concept of place, which is one of the crucial concepts of geo-graphic thought (Cresswell 2004; Vavra 2010). Besides space, region and landscape, place constitutes a very urgent and frequented geographic topic, which had undergone numerous changes over the last half century, especially as geographers have increasing-ly engaged different theoretical traditions in the humanities and social sciences (Claval 2007; Entrik-in 2018). One of the generally accepted definitions of place is as follows: ‘places are “fusions” of human and natural order and are the significant centres of our immediate experiences of the world…. allowing us to experience authentic, original and meaningful life’ (Relph 1976: 141). The American Bar represents place in this study, when the term ‘exotic’ refers to new and different kind of experience. This institution was a symbol of the newly established cultural ele-ment in the first half of the 20th century, especially between the wars, and we can observe it as a part of the wider process of Americanisation. From the per-spective of social and humanistic geography, Ameri-canisation may be perceived as a process of the spa-tial spread of innovative socio-cultural elements from one setting to another. Hence, it means not only the distribution of new cultural patterns or an urban way of life, but also of fashion trends and technical pro-gress (Heřmanova 2012).
For a long time, Europe remained in the position of the main partner of the USA, for which it was a source of cultural traditions. On the other hand, the USA was the nation of ‘unlimited’ opportunities, the country whose breakthrough inventions and technological progress staggered the public at world expositions on every occasion (Tučkova 2015). The growing American influence had been apparent in Europe since the beginning of the 20th century, but it had been limited rather only to cultural aspects at that time (Stead 1902). All the same, it took only forty years until the publisher of Life, Henry Luce, referred in February 1941 to an ‘American’ century when jazz, Hollywood films, modern machines and other pat-ented products had been something known to each and every community in the world from Zanzibar to Hamburg. But the real Americanisation of Europe could be seen in the interwar period when the United States had been economically involved in the post-war restoration of Europe and in the implementation of Dawes’ and Young’s plans. However, the most dis-tinctive manifestation of Americanisation could be seen through the cultural phenomena when 60–95% of films screened in the 1920s and 1930s in the United Kingdom, France, Italy, the Netherlands and Germany had come from the American production (Lundestad 2003).
The atmosphere following World War I was crucial for the success of Americanisation, and especially of
the American Bar concept. This is also characterised by a quotation of the German poet, Friedrich von Hard-enberg: ‘A comedy must be written after the unhappy war’ (Bříza 2006: 296). However, at least when read-ing the statements of individual actors in the interwar period, we can see that it was a comedy with rather a bitter and sweet tone (Teige 1928). The war chaos had produced a generation which longed for anything which would help it celebrate survival of the previous years, which is why the love of the present moment had prevailed everywhere (Dorúžka 1988). The time had come for cheerful years of unflagging excitement and technical progress. The time when everything was possible and everything became experience. It was ‘Experience’ with a capital ‘E’ where the ‘E’ would mean absolutely everything – decay, decline, entertainment, breakthrough, profit or an absolutely principal change (Friedrich 1995). German journal-ist Sebastian Haffner (2002) even captured this time with the following memory:
There had suddenly been numerous bars and nightclubs. Young couples were whirling around along the streets of entertaining neighbourhoods just like in the films about the upper ten thousand. Wher-ever you looked, there was someone involved in love, yet in a hurry (Haffner 2002: 62).
However, love acquired a bit passing and inverted character. That time rooted for new stories because ‘amid so much suffering, despair and beggarly misery, passionate youth, joie de vivre and the general carni-val mood were thriving’ (Haffner 2002: 62).
Only a few realize today how natural an ele-ment the institution of a bar is for the normal urban atmosphere, since it no longer is perceived as some-thing exotic, as something new from far, far away, as something with bright colours of neon signs while the inside hides an unusual offer of unknown cock-tails (Mozr 2013a). Nonetheless, it is important to realize that the American Bar in the interwar period was a symbol of the yet unknown type of a business and general service that it simply cannot be neglect-ed or even compared with other types of hospitality businesses (Mozr 2015). Generally, the American Bar concept may be explained as an invasion of a foreign form of service in the well-established and tradition-ally working European gastronomic system (Carlin 2012). Numerous research questions arise in con-nection with this fairly loose definition, which may be divided into three areas: (1) defining questions connected with the classification of the American Bar concept; (2) time-space questions related to the spe-cific information within this concept; (3) meaning-re-lated questions with which we can follow and analyse the situated subjective experience of an individual or entire community.
As for the first area, our primary question is: What was this concept about? What did it look like? Who formulated it? Why was its offer so attractive? Who went there, etc.? The second area offers questions

94 Tomáš Mozr
connected with time and space: To which extent had the concept changed within the transfer? Where and when did the American Bar emerge for the first time in selected European metropolises? Was it a gradual invasion of a foreign form of service which may be divided into stages, or was it a sudden social element? Which were the common and different aspects from the perspective of localisation, existence and func-tioning of the American Bar in selected metropolis-es (Berlin, Prague), or – what was the spatial spread and where was this phenomenon most concentrated (downtown vs. suburbs)? Consequently, the third area is connected with the meaning of this concept where we can ask as follows: What was the extent of the American Bar from the perspective of social influence when it had represented a place for intermingling of cultures? What was the depiction of this concept like in the contemporary artistic representation or to which extent had this depiction corresponded to the real-life model?
To analyse and fully understand the American Bar phenomenon, it is, however, desirable to clarify what the modifier American actually meant and what it had stood for. Historian Joseph Carlin (2012) puts the term American Bar in the context of transatlantic
bonds. He believes it was a consequence of tourism enabled by higher standards of living and the techno-logical progress in transport when Europe and Amer-ica had become closer to each other than ever before and hence also more available to a more intensive cultural interchange. However, he wrongly regards the activities of the American units during World War I and the growing number of American students at European universities in the interwar period as the core force behind this form of service. Although Car-lin’s theory seems to be convincing, many documents from archives and libraries have shown that the his-tory of the American Bar in Europe dates back at least deep into the 19th century (Mozr 2015; Soyer 1859). Therefore, the modifier’s explanation is likely to have a much simpler geographical foundation because this term has until recently been almost unknown on the American continent. After all, the local bars can only be American. Therefore, this term was estab-lished due to the need to designate the penetration of a new and original form of service which had kicked in individual localities in Europe in different time sequences since the second half of the 19th century. The American Bar had gradually emerged throughout the continent, from the United Kingdom over France
Fig. 1 American Bar.

The phenomenon of the American Bar in interwar Berlin and Prague 95
to Germany and Austria, or even farther. Hence, the diffusion of American Bar could be divided into three stages according to the degree to which the phenome-non has been established in society (see Appendix 1). Its designation had penetrated as a specific form of service from its cradle in America in an effort to expand the offer and attract a higher number of cus-tomers. Some European hotels and cafes introducing cocktails even initially simply named their bars as the ‘American Bar’ (Carlin 2012). It is therefore apparent from this explanation that the first bars in Europe had apparently been all purely classic American Bars and their differentiation, or ‘emancipation’, had emerged through the gradual stabilisation of the given service (Mozr 2015).1
The primary objective of the study is to introduce the American Bar as an ‘exotic’ concept of place, which has many contradictions2 and which still remains aside the intensive interest of experts, as well as to deepen the knowledge about the development of this concept as an important part of everyday life for the development of the group identity of the inhabitants of two selected European metropolises during the course of time.
2. Methodology
Just like countryside, town has been traditionally a very rich source of inspiration in geography. Among others, this is perhaps because a town can be under-stood as a place which makes part of a large and undif-ferentiated space, becoming a place at the moment individuals or communities give it a certain meaning. Understandingly, there are also such places which are perceived by individuals and entire communities more intensively than other. Just this stronger meaning of places is characteristic of towns as ‘places par excel-lence’ (Tuan 1977). This part of paper concentrates on the discussion why the American Bar phenome-non as an integral component of urban night-life was chosen as the object of historical geography research, which methods were used and to which extent is this approach new and less traditional.
As Entrikin (2018) points out: ‘Place has gained greater attention in the late twentieth and early twen-ty-first centuries, as geographers moved from a rigid naturalist conception of their field’ (Entrikin 2018: 47–48). However, what kind of places were studied? When speaking about public places, one can imagine museums, theatres, boutiques, hotels or restaurants, but also various cinemas, bars, dance halls and clubs. Their character substantially differs from common
1 The degree of American Bar activities and its development also depended on the relationship of an individual to this facility. He could have been an employee, a visitor, someone living nearby; he could have performed his economic plan in the bar, i.e. being a supplier, or he could have assumed other subjective positions through his profession (a writer, a politician, a policeman, etc.).
2 The American Bar had an ambivalent character when the given subject of interest may be both welcomed and celebrated by society as well as rejected and condemned (May 1996).
day-time centres (Jayne 2006) because night means much more than just an absence of light. Night attracts roaming walkers and simply ‘changes human activi-ties when it comes to their arrangement and distri-bution in space’ (Pixova 2011: 30). Day-time centres have a character differing from night-time centres because the latter are only concentrated in certain parts of a town (Pixova 2011; Mozr 2017). From this perspective, it is possible to find many works focused on geographies of the urban night (Bianchini 1995; Edensor 2015; Grazian 2009; Gwiazdzinski 2015; Hadfield 2015; Howell 2000; McKewon 2003; Shaw 2014; Tadié 2015; Van Liempt et al. 2015). However, there is no article or book, which could evaluate the production of ‘nightlife economy’ in the same original way as this paper, because the American Bar repre-sents a unique luxurious place of the night-life and plays a major role in this kind of economy in the inter-war period (Mozr 2017). Only a few papers are con-centrated on the concept of bar (Hadfield 2006; Ram-sey, Everitt 2007), but these studies are limited mostly on the discussion of general issues about urban night or on the spatial analysis of the concept.
As indicated above in introduction, it is impossible to obtain the necessary information through direct observation due to the period subject to research. Intensive research of the American Bar is therefore based on the study of archive materials (Landesarchiv in Berlin; AHMP in Prague), where the main aim was to find further information about city council and public opinion in the collections; contemporary press (Lidové noviny, Národní listy), where the articles were found in databases through heuristic method of looking up the key words; professional and memoir literature, legislative measures and other iconographic sources. All these materials are used for the reconstruction of place and its meanings. The outcome of the analysis also includes cartographical visualisations providing a reconstructed view of the scope of this phenome-non’s establishment in one of the selected localities (Prague) and a view of the real distribution of innova-tion in European society between 1851–1929. Besides many city-guides and other professional book in local libraries, the key source for a view of the American Bar diffusion was Vintage Cocktail Books Free Digital Library The E.U.V.S. that stands for Exposition Univer-selle des Vins et Spiritueux, which refers to a Museum in Bendor Island in south of France.
Selected metropolises – Berlin and Prague – are chosen for this analysis on purpose, instead of London or Paris, where the research of American Bar and its spatial and socio-cultural influence could be easier to detect as a cocktail historian Philip Green (2018) has
96 Tomáš Mozr
shown in his latest book. Berlin and Prague are cho-sen, because these cities can provide a sufficient num-ber of archive materials to analyse the development of the American Bar and are also relatively close to each other and also fell within a close socio-cultural frame-work of Central Europe during the period subject to research. However, they had undergone a different development despite these relations. In the post-war era, there was the subverted, defeated and broken Germany transforming into the Weimar Republic after several failed revolutionary attempts (Buffet 1999) opposite the newly established Czechoslovakia which was full of hope and ideals arising from the unex-pectedly acquired freedom with constant problems of national minorities that could but did not have to find their fulfilment (Karník 2008). And it is namely on this background where the American Bar phenom-enon had emerged.
3. American Bar phenomenon in Berlin and Prague
The American Bar phenomenon can be viewed as a concept of place which had been both realistically and imaginarily reflected in everyday life of inhabit-ants and which can also be assessed as a ‘network of varied actors developing a range of activities, influ-encing not only each other, but also forming the char-acter of place and its image’ (Kaškova et al. 2016: 8). Both in Czechia and in Germany, the analysed phe-nomenon emerged as late as in the last quarter of the 19th century despite the interesting history of mixed drinks, later known as cocktails. In the united Germa-ny3, the fifth edition of Das Buch der Getränke (The Book of Drinks) by Charlotte Wagner was published in 1882 (Mozr 2013b) and nine years later, in 1891, there was even an entire pavilion dedicated to the American Bar institution at the international exhibi-tion of electrical engineering in Frankfurt am Main (Miller & Brown 2009). Prague became acquainted with the American Bar phenomenon in the same year as Frankfurt and it was also everybody who had vis-ited the General Land Centennial Exhibition that had also displayed a stand of Mr Jan Prochazka and Mr Jindřich Grass from Bremen. The stand was installed in Pavilion 5, not far from the main entrance to the site, and it was produced in the American style with an offer of ice drinks (Mozr 2015; Mikšovic 2012; Kaf-ka 1891). We can view this enterprise as the ‘imagi-nary beginnings of the bar catering in Bohemia, but Prochazka & Grass had not offered only drinks, but an entire whirl of attractions and sales tricks, start-ing with black service and ending with live music and cocktails’ (Mozr 2013c). Exoticism of the so-called American ice drinks, as they were presented, can also
3 The political and administrative unification of Germany was officially proclaimed on 18 January 1871 in the Hall of Mirrors of the Palace of Versailles in France.
be seen in the historically first photograph of a mixed drink in Bohemia in the second part of the monog-raphy entitled Sto let práce (One Hundred Years of Work) (Mikšovic 2012). However, on closer examina-tion, we can see that this is not the only picture. We can actually see a view over a part of the bar, the inte-rior, the stand staff and the performing band (Mozr 2015, 2013c). Other documents also show that ice drinks and their names Bivoj, Palcát (Mace) or Ceske kvítko (Czech Blossom) clearly touched the national chord even though their price (25 Korunas per cock-tail) did not seem to be too ‘popular’ (Mozr 2015a, 2013c; Kafka 1891).
The American Bar had therefore since 1891 appar-ently positioned itself as an essential element of major events. It had eventually established itself not only as something new at various social events, but it had also become an essential part of hotel complexes and oth-er hospitality facilities that had placed great empha-sis on modernity and first-class services. Adlon Hotel situated in the very centre of Berlin at the start of the boulevard Unter den Linden was an icon among hotels. Its construction was backed even by the king and it was opened on 23 October 1907 (Mozr 2015, 2013c; Auer 1997; Adlon 1909). Its American-style bar was quite unique and in addition to the new and extrava-gant atmosphere and special offer, it was extraordi-nary due to its location that was directly connected with the foyer, yet sufficiently set aside. It even had its own entrance from the street, which enabled its inde-pendent operations with respect to the hotel (Adlon 1909). But Adlon was not the only place offering the so-called American drinks. Its competitors includ-ed the first international hotel in Berlin, Kaiserhof, Queen bar, which was popular and well-known in the 1920s thanks to the artistic depiction of George Grosz, or the Café Bauer pointing to the theory that the American Bar had not worked only as a part of hotels but had also developed from the café settings (Mozr 2015; Wood 1997), which is also documented by the fragmentary information that ‘each café had its Amer-ican bar where American drinks were served’ (Mikšovic 2009: 82). A certain degree of expansion and exclu-siveness of the American Bar can also be observed through the fact that even the future German chancel-lor and the first German president, Friedrich Ebert, had worked behind the bar before the war (Mozr 2015; Friedrich 1995).
Compared to Berlin, a similarly aspiring bar in the American style was opened in Prague five years later. Its primary purpose was to become a supplementary part of a modern gastronomic complex. This Ameri-can bar was located in the basement of the Municipal House of the City of Prague and even though it was not established by the king or emperor, it could undoubt-edly equal Adlon with respect to its decorations
The phenomenon of the American Bar in interwar Berlin and Prague 97
in which even Czech artist Mikolaš Aleš had been involved (Mozr 2015, 2012; Hostimil 1910).
The gradual socio-spatial transformation is also apparent from the growing number of records in Czech and German professional publications, in the daily press, as well as in the poster production. Com-pared to Berlin, we can also see a similar development of Prague cafes, when cafes and other businesses had been transformed and innovated into bars. As an example, we can use the opening of a new wine bar by the former cafe owner, Rudolf Löbl, in Templova Street, under the name Bonbonniére-Bar (Mozr 2015; Hostimil 1917). However, we can only argue to what extent the wine bar had been true to its name because according to the explanation of Czech actor and caba-ret performer Josef Waltner (1931), some businesses had used the ‘title of the bar although one could not get any drink there’ (Waltner 1931: 50), i.e. the bar-café would apparently be a more appropriate term here.
Austrian prose, essay and poetry writer Stefan Zweig wrote that in the new ‘big’ Berlin of the 1920s, ‘bars, entertainment parks and pubs are springing up like mushrooms’ (Buffet 1999: 263). In the post-war period, the American Bar became an ideal place for loose morals of Berlin of the 1920s. In addition to the offer fitting in the excitement from the American culture, it had naturally offered an uninhibited envi-ronment without any rules determining when a guest should come and go, where he should sit, etc. The guest could come and go whenever he wanted to; he could sit wherever he wanted to and next to anyone (Mozr 2015; Metzger 2007; Bříza 2006). Also Prague in the post-war period was hit by a clear growth of new American bars, which is apparent from the car-tographic visualisation of Prague bar facilities until the end of 1939 (see Fig. 2 and Table 1). The expan-sion of the American Bar was influenced not only by the breakthrough spatial arrangement in the form of a bar desk, but primarily by the unique offer of bar drinks, mostly cocktails, whose recipes had even appeared on the pages of the daily newspapers such as Lidové noviny or Národní listy (Mozr 2015; Lidové noviny 1929; Národní listy 1931). It may be deduced from the news of that time that in Prague, night life had been moving from the highly busy Old Town to the vicinity of Wenceslas Square, which had also cor-responded to the Berlin transformation and its post-war migration wave of entertainment described as Der Zug nach Westen, i.e. ‘The Train to the West’. That entailed the move of many businesses from the area around Friedrichstrasse and Unter den Linden to the west towards Kurfűrstendamn and Postdammer Platz (Mozr 2015) where tourists could retire to night spots in the American style such as Mississippi, Peloponnes and Mikado (Buffet 1999).
Essay writer and historian Josef Kroutvor was also wondering about the American Bar phenomenon in the Czech environment when he wrongly wrote that
the first bar of this type had probably emerged in the Rokoko Palace in Prague in 1920 or in Konvikt in Bartolomějska Street which has been working, with minor breaks, until now (Kroutvor 2012). He was only right when he wrote about the occurrence of new small cabarets, with the most significant being Orient, Chapeau Rouge, Boston-Bar, Tank bar, Palais Rokoko, Montmartre and others which offered improvised entertainment enriched with alcohol consumption (Mozr 2015; Kroutvor 1988).
If we halt for a moment at the café named Bos-ton-Bar, previously known as Mikado, we can see a few remarkable circumstances. This bar was situat-ed near Wenceslas Square, in Na Mustku Street, which was compared by Waltner (1931) to a similar street connecting Unter den Linden and Friedrichstrasse in Berlin. But the sketchy information on a changed owner surprisingly points to a cultural parallel that could, but did not have to, reflect the mutual influence and cooperation of the Czech and German bar scene, because there also used to be a Mikado bar in Berlin (Mozr 2015; Hostimil 1927, 1929).
As time passed, the phenomenon no longer restrict-ed itself to downtown Prague, but it had stretched out and moved towards the periphery, e.g. we could find a newly established bar in Radlicka Street in Prague-Smíchov, named Special (Hostimil 1927); there was the Rejna-Bar in Poděbradova Street in Prague-Žižkov where liquors were ‘mixed only in belly and one can get quite a big shot for CZK 1’ (Waltner 1931), or, if we move even farther, we could read about the plan of Czech businessman Vaclav M. Havel regarding the construction of the Barrandov Terraces in 1929. The Trilobit bar became part of the Terraces in 1937, act-ing as a counterweight to a mass-scale restaurant and offering a free option to remain in Barrandov until early morning hours (Mozr 2015).
Although the interwar revelry may seem as cease-less, the opposite is the truth. For instance, that is proved by an agreement of owners of several leading bars regarding the limited entertainment programme (Mikšovic 2009) or the onset of the Nazis in Germa-ny whose aversion to ‘Negroid’ music and ‘non-Ger-man’ drinks resulted in a failure of many spots such as Excelsior Hotel. The thing was that its owner refused to accommodate Adolf Hitler during his pre-elec-tion campaign (Mozr 2015; Landesarchiv, Hotelbe-triebs-AG, A.Rep.225-01, Nr. B3838). The immedi-ate impact of economic crisis was another hit which had also been reflected in the transformation of the American Bar at the beginning of the 1930s. Accord-ing to the period news published in Cíšnicke rozhledy (Waiters’ Horizons), there were allegedly only thir-teen bars in Prague; there was a single price for con-sumption which, compared to the price of the initially luxury goods such as mixed drinks, points to their higher availability for broader masses (Mozr 2015; Mikšovic 2009; Kafka 1891). So we can suddenly see an emerging trend of spots reminding of the pre-war
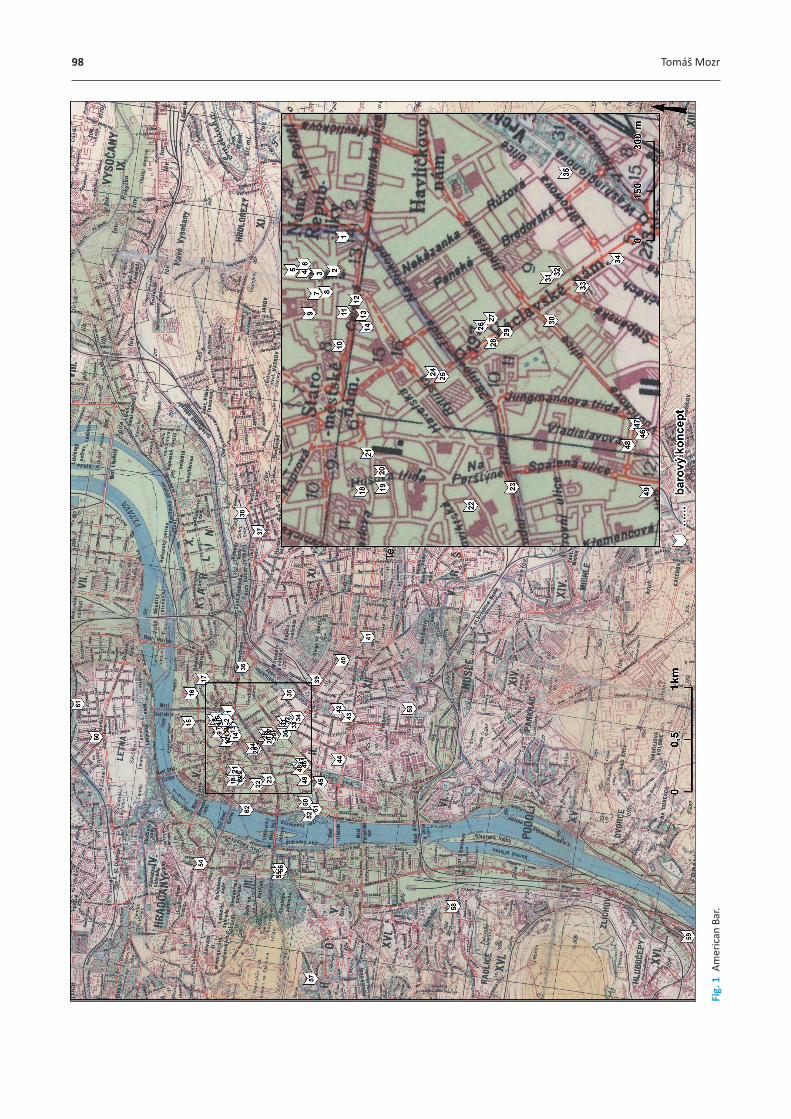
98 Tomáš Mozr
Fig.
1 A
mer
ican
Bar
.

The phenomenon of the American Bar in interwar Berlin and Prague 99
dancing halls, but the popularity of the American cul-ture developed further, as well. This was documented by French historian Cyril Buffet (1999) who remarked that Berlin intelligentsia ‘is meeting only at certain places and enjoys gilded decorations at Adlon Hotel, the ‘small luxurious restaurant Montmartre which is regularly visited by Christopher Isherwood, Schlich-ter’s pub where writers have their own booked tables’ (Buffet 1999: 262). This is again an apparent coinci-dence of names because Prague also had its Montmar-tre although the American dancing hall, locally simply named the U Machačku local, had been more popular, especially with a significant part of the avant-garde. The ‘Generation Local’, as it was called by the chron-icler of night life in Prague, Adolf Hoffmeister, was
a modern spot indeed. It was probably for its infor-mality because it was situated in a baroquely restored building, or for its location in Karlova Street, aside from the normal urban bustle, why this spot was famous, as was later described by Czech architect, Karel Honzík, in his work Ze života avantgardy (Of Avant-Garde Life) (Mozr 2015; Štembera, Kreuzzigerova 2005).
4. Perception of the American Bar
The term ‘perception’ is classified by Siwek (2011) as a ‘process during which human mind creates the image of reality. Reality means the outside world, the setting surrounding the man and whose qualities are
1. Americký bar in Municipal House, Náměstí republiky 5
2. Boccacio Bar in Grandhotel Steiner, Královodvorská street 4
3. American Hall at the Sect Pavillon, Rybná street 5
4. Espirit Bar, Rybná street 8
5. Cascade, Rybná street 10
6. Little Bar, Jakubská street 5
7. Bonbonniére Bar (later called City), Templová street
8. Anglo-American Bar, Templová street 6
9. Chapeau Rouge, Jakubská street 2
10. Chat Noir, Celetná street
11. Bar U Pavouka, Celetná street 17
12. Orient Bar, Celetná street
13. Pigall’s Bar, Ovocný trh 13
14. Dancing bar Astoria, Ovocný trh 9
15. A-B-C, Rybná street 28
16. Bar Felix, Soukenická street 24
17. White Star Bar, Zlatnická street 4
18. Macháček Dancing Hall, Karlova street 30
19. Montmartre “American Bar”, Řetězová street 7
20. Pohádka, Jalovcová street 1
21. Radio Bar, Jilská street 22
22. Konvikt, Bartolomějská street 291
23. Bar Moulin Rouge under Louvre Café, Národní třída 20
24. Bar Turandot, Na Můstku street 3
25. Boston-Bar (previously Mikado), Na Můstku street
26. Embassy Bar in Alhambra, Wenceslas Square 11
27. Zlatá Husa (known among foreigners as Golden Goose), Wenceslas Square 13
28. Bar-Tabarin Zámečník (previously Akron or Casanova), Wenceslas Square 16
29. Juliš, Wenceslas Square 22
30. Lucerna Bar, Vodičkova street 42
31. Grandhotel Šroubek, Wenceslas Square 37
32. Luxor, Wenceslas Square 41
33. Bar Gri-Gri in Palais Rokoko, Wenceslas Square 44
34. Bar of Fénix Insurance Company, corner of Krakovská street and Wenceslas Square
35. EST Bar in Esplanade Hotel, Washingtonova street 19
36. Sanssouci Tabarin-Bar, Mariánská street 34
37. Sport Bar, Komenského square, Žižkov
38. Rejna-Bar, Poděbradova třída, Žižkov
39. Bar Frou-Frou, Fochova třída 10, Královské Vinohrady
40. Bajazzo, Římská street 45
41. Nippon, Moravská street 14
42. Tank-Bar (later Tabarin Tango), Mikovcova street 4, Královské Vinohrady
43. Tabarin Sport Bar, Legerova street 53
44. Dancing bar “De Paris”, Ječná street 10
45. Kavárna Metropol, Charles square 18
46. Bar Kavárna Pod Věží, Vodičkova street 2/3
47. Brabcův Zlatý Sklípek (previously Crystal Pavillon), Vodičkova street 7
48. Grado Bar, Lazarská street
49. Palais de Danse (also known as Bar U Myslíků), Myslíkova street 171/31
50. Bonne Nuit, Pštrosova street 9
51. Trocadero, Náplavní street 7
52. Ateliér Bar in the 1st floor of Mánes, Masarykovo nábřeží 250/1
53. Club-Bar, Bělehradská street 56
54. Ferri Bar, Malostranské square 252
55. Bar Ikar, Újezd (opposite the Arizona Bar)
56. Arizona Bar, Újezd (next to Štefánik’s Barracks)
57. Bar in Švédská street, Švédská street 36
58. Bar Special, Radlická třída 27
59. Trilobit Bar at the Barrandov Terraces, Barrandovská street, Hlubočepy
60. Bar Oasa, Letenské square
61. Maxim Bar, Kamenická street 49
62. Elyseé Restaurant Bar, Masarykovo nábřeží 20
Tab. 1 The list of Prague bar facilities until 1939.

100 Tomáš Mozr
recognised through senses’ (Siwek 2011: 70). The perception of the American Bar phenomenon in life of inhabitants of Germany and Czechoslovakia between two world wars may be captured in two different ways, especially in printed documents in the media or normative measures and through an analysis of iconographic documents, whether of a purely artis-tic character or in the poster production reflecting the power of the moment and everydayness of that time.
The American Bar’s ingression into the daily grind may be divided according to its influence on the man: (1) direct influence, i.e. the relationship between the man and the bar (staff, suppliers, performers, visi-tors, etc.); and (2) indirect influence including medi-ated experience (media image, legislative measures, recounting from friends, etc.). Bar guests are the most typical and often the most attractive directly influ-enced group for research.
The post-war ‘merry-go-round’ of political, eco-nomic and social changes brought forth a certain group of people who had experienced luxury thanks to the war and who had not hesitated to manifest this luxury and their excitement often until early morning hours. This naturally irritated people and provoked authorities, which was reflected in various bans of such ‘naughty’ behaviour in Prague. The politi-cal representation focused mainly on the hot topic of licencing of new bars. For instance, we can read about various town hall interventions and measures. The sources tell us about the scope of these regula-tions ranging from the innocent measures setting the amount of the lighting contribution according to the number of bulbs in luxury flats, bars and enter-tainment sites (AHMP, Minutes of Meetings of the Top Administrative Commission [18 October – December 1923], Inv. No. 487), to the consent of the Metropol-itan Council with the mayor’s statement on bars and their operation. The meeting resulted in the ban on opening additional bars in Prague stating that the current number of these facilities was sufficient and satisfied the demand (Hostimil 1928). This act was a success of those advocating for the regulation and control of bars. This group was led by Mayor Karel Baxa who had voiced his opinion during the meet-ing of the Central Council of the City of Prague on 5 November 1923. He reacted to the speech by Com-munist Dr. Hecht who had pointed to the consequenc-es of sexually transmitted diseases and alcoholism and spoken out against the ‘reproduction of bars that are a hotbed of sexual diseases’ (AHMP, Minutes of Meetings of the Central Council [October–Decem-ber 1923], Inv. No. 870). It is because compared to the banned houses of prostitution, bars were open almost to everyone. The presentation of Dr. Hecht can therefore indicate the high moral aspect where bars had been a thorn in their side not only due to the offer of alcoholic drinks and their occasional excessive consumption, but especially from the social
point of view focusing on the group of people staying in this environment. Although the mayor did not go to bars, he based his opinion on the mediated imag-ination of space, i.e. on the statements from his col-leagues or policemen. The Berlin bars gave a similar impression. This is obvious in the work of German painter Jeanne Mammen who had captured, thanks to her sexual orientation, the free and unconventional love towards the present moment (Wells 2012). But the well-preserved poster production provides evi-dence that the actions against bars had not been very successful. It confirms that the American Bar and its offer and accompanying programme had played an important role in social life of the 1920s and 1930s (Mozr 2015; Mikšovic 2009).
The aforementioned moral and social aspects were an important guideline in the imagination about the American Bar because not everyone had been admit-ted to a bar. The American Bar represented a luxurious type of service, i.e. there used to be the correspond-ing ‘dress code’ requirements. The right clothing also manifested the visitor’s property situation, but these requirements had been reduced in some time. We can see the depiction of the required ‘dress code’ in the poster production for the so-called Paris in Prague, i.e. the Pigall’s dancing bar in Ovocny trh. The poster from 1925 shows a dandy in a traditional suit while the lady on his side fascinates with a short haircut and a modern evening dress (Kroutvor 1988). A different view of night pleasures can be seen in the picture Metropolis by German painter Otto Dix, showing very easy morals through naked legs of a woman. Even Czech poet of that time Vítězslav Nezval commented on this element (1928):
Let’s not be afraid for the naked legs of women. We would fall into lies, Racin-like virtue of aristocrats. We are afraid for dignity and slavery that is a threat everywhere where it is possible to buy. That is why we forbid ourselves to go to cabarets, bars and theatres. They are the windows of the shops selling naked legs (Nezval 1928: 308).
Nonetheless, it was often not only about legs, which is evident from many outraged remarks com-plaining about the excessive nakedness of girls in bars and cabarets. German playwright Carl Zuckmay-er even recalls a private party where girls employed to serve drinks were moving around almost naked, only in transparent silver knickers with a fig leaf pat-tern (Gill 1993). Morality had almost always been associated with the female element that had and has been an integral part of the bar environment (Mozr 2015; Hostimil 1928).
On the other hand, the American Bar may be per-ceived as a revolutionary setting which had become a common point for sexes and a place subject to the emancipation development since the turn of the cen-tury. Until then, the common functioning in an enter-taining setting had been fairly clearly defined and sep-arated, which may also be inferred from the fact that

The phenomenon of the American Bar in interwar Berlin and Prague 101
cocktails had not been initially neutral as to differen-tiating sexes. It was mainly men who had consumed stronger drinks, including cocktails, while women had been destined to drink fortified wines or brandy in case of health problems (Carlin 2012).
The offer of American mixed drinks – or cock-tails – was a significant element of the American Bar. Their popularity had gradually penetrated into all social structures. Anyone who could do it, tested cocktails, and who could not could at least read about them in the popular ‘bar’ literature that had been a target of complaint by Czech writer Karel Capek to his publisher, Otakar Štorch-Marien. Those who were lucky could also attend an improvised lecture about Bary – chrámy dvacátého století (Bars – the Temples of the 20th Century) by Czech cubistic architect Josef Chochol (Marešova 2012).
In the first half of the 20th century, there also used to be a widely spread opinion regarding the cura-tive effects of alcohol (Mozr 2015, 2012; Vošahlík-ova 1999). It is therefore no surprise that the society was not discouraged even by the activities of various movements against the consumption of alcoholic beverages. A clear example of perception of alcohol as medicine can be seen in the opening scene of the film Hej rup! where the character of the extravagant manufacturer, Simonid (represented by Czech actor Jan Werich), is waking up after a long party. His first thought goes to a hangover relief, which is why he puts himself on the Prairie Oyster cocktail (Hej rup 1934). The popularity of the Prairie Oyster cocktail in the interwar period is also reflected by British writer Christopher Isherwood (2012) whose main character in the Sally Bowles story gives not only a recipe for this drink, but makes it straight that she ‘practically lives on this cocktail’ (Isherwood 2012: 29).
In 1937, Czech writer and journalist Karel Polaček was comparing the importance of the modern attrac-tion, the American Bar, with the Czech pub. He empha-sised both spatial aspects where ‘pubs are above the ground while bars are in the cellar’ (Marešova 2012), and the atmosphere created by the given communi-ty or the music arrangement. Last, but not least, he mentioned the contemporary role of these facilities, stating the pubs had rather been institutions while bars had been a fashionable issue (Marešova 2012). But it is also obvious from the aforementioned infor-mation how wrong Karel Polaček had been in this respect because bars had gradually been embedded in legislation (see Government Regulation No. 254, on Benefits for Administrative Acts dated 22 December 1926; Mozr 2015; Mikšovic 2009; Hostimil 1931). On the one hand, it also seems that he was right that the American Bar had been a fashionable phenomenon because it had reacted to new trends, to the post–war desire for entertainment and relaxation, which could be reflected both in the wild pace of dancing and in the flamboyant cocktail.
5. Conclusion
The concept of place is a ‘complicated system of objects, actors, processes and their mutual relations and ways of perception and interpretation’ (Kaškova et al. 2016: 11). And this is twice as much true in the case of the selected ‘exotic’ phenomenon. American historian and geographer David Lowenthal (1961) pointed out that each image and idea in the world around us is based on personal experience, learn-ing, projection and memory. Thanks to projections and fantasy, the places that we live in, visit and travel through, as well as the worlds that we read about and see in the work of artists contribute to our perception of individual settings and people in them.
The aim of the study was to point to the introduce the American Bar phenomenon as well as to deepen the knowledge regarding the development of this con-cept that had directly and indirectly been engaged in the formation of identity of social groups of inhabit-ants in the given metropolises during the course of time. Although this phenomenon had been in many aspects true to its original model, e.g. in the applica-tion of the serving of ice-cold American mixed drinks, it may be stated following an analysis of sources and comparison of the situation in Prague and Berlin that in the Central European space, the American Bar rep-resented a clash of reality and imagination, which had formed an absolutely unique environment. On the one hand, the common elements of the original con-cept and the American Bar included the depiction of place as an immoral environment tempting to villainy, while on the other hand, it was a welcomed escape from reality, a curative setting designed for a select-ed part of the society where one could search for and find new adventures. All the same, the acceptance of the phenomenon in the different socio-cultural space, the transformation of values, its gradual anchoring and participation of the locals in the development of the American Bar not only as consumers, but also as direct creators of this concept (employee, owner) are among the aspects fuelling this innovation with such importance and meaning.
As a new and original form of service, the American Bar had gradually emerged across the continent since the second half of the 19th century, from the United Kingdom over France to Germany and Austria, and even farther. The establishment of this phenomenon may be divided into three stages. In the first stage, taking place in both metropolises (Berlin, Prague) in the last decade of the 19th century at the latest, it was about becoming familiar with this phenomenon. In the second stage, on the contrary, we can see a gradual emergence of the first bars whose number had slowly grown until World War I. This fact is also reflected in the existence of the first bars in the Central European space where we could see this concept through the American Bar in Vienna designed by architect Adolf
102 Tomáš Mozr
Loos since 1908 or since 1912 thanks to the Amer-ican Bar in the basement of the Municipal House in Prague. The interwar period represented the third stage which also received major attention in research. It was namely in this period when the American Bar had enormously flourished; there was a growing number of bars in this style and this phenomenon had fully established itself in the society, which can be observed in the penetration of this innovation outside the historical centre of the city.
The research encountered many rigours, i.e. although it was comparing two capital cities, they are in fact hard to compare due to their actual size and economic potential. We might as well point to the transformation of the form of the concept which was based on the current historical and geographical per-spective in individual metropolises. Hence, imagina-tion mediated through local and foreign films could create an image of an absolutely different setting than had been in reality formed in the given locality. This even evokes thought to which extent the original con-cept of the bar in the United States had corresponded to the subsequent depiction in the Hollywood films. Some other thematic approaches may also come into consideration: e.g. the description of internal regu-lations, who worked at the American Bar, whether they were locals or strangers, what was typical of this profession and what the bar space had looked like. It is also possible to provide a deeper analysis of the political framework, e.g. actions by the Nazi regime in Germany or the national issue in Czechoslovakia, considering whether the bars had been differentiated as rather German or rather Czech. There are undoubt-edly many options which could move the American Bar phenomenon even further. All the same, the focus of this contribution on the concept of place not only on the basis of spatial changes, but especially from the viewpoint of the social turnaround, or a turning point in the development, correlates to the projected objective, i.e. to submit the meaning and importance of the American Bar as a part of Americanisation, since this institution meant a new cultural element to which the locals and political authorities had to define their approach. They had to form a certain relationship, whether through personal experience or imagination.
Funding
The paper was financially supported from the Charles University Grant Agency project 962216: The Con-cept of Place in the Context of Transatlantic Trans-formations and from the Czech Science Foundation P410/12/6113: Historical Geography Research Centre.
Acknowledgements
The author wishes to thank Pavel Chromy whose advice and comments were immensely valuable for the direction of this research and who greatly con-tributed to the publication of this article, and also Ive-ta Ctverakova and Marek Komarek who created Map of Prague Bar Facilities until 1939 and Diffusion of American Bar based on author’s research.
ReferencesAdlon, L. (1909): Hotel Adlon Berlin, Berlin.Auer, P. (1997): Adlon Berlin, Berlin: Pariser Platz.Bianchini, F. (1995): Night Culture, Night Economies.
Planning Practice and Research 10(2), 121–126, https://doi.org/10.1080/02697459550036667.
Bříza, A. (2006): Atheny na Sprevě jsou mrtve, Chicago na Sprevě se rodí. Dvacate století – The Twentieth Century 1(1), 289–322.
Buffet, C. (1999): Berlín. Praha: NLN – Nakladatelství Lidove noviny.
Carlin, J. M. (2012): Cocktails: A Global History. London: Reaktion Books.
Claval, P. (2007): Regional Geography: Past and Present (A Review of Ideas, Approaches and Goals). Geographica Polonica 80(1), 25–42.
Cresswell, T. (2004): Place. A Short Introduction. Oxford: Blackwell.
Dorúžka, L. (1988): Jak se Praha bavila. Pražska naroží 1890–1940. Praha: Katalog k vystavě plakatu z fondu Uměleckoprumysloveho muzea v Praze.
Edensor, T. (2015): The Gloomy City: Rethinking the relationship between light and dark. Urban Studies 52(3), 422–438, https://doi.org/10.1177 /0042098013504009.
Entrikin, J. N. (2018): Geography of Experience: Place and Region. In: Paasi, A., Harrison, J., Jones, M.: Handbook on the Geographies of Regions and Territories. Cheltenham: Edward Elgar Publishing Limited.
Friedrich, O. (1995): Before the Deluge: A Portrait of Berlin 1920s. New York: Harper Perennial.
Gill, A. (1993): A Dance Between Flames: Berlin between the Wars. New York: Caroll & Graf.
Grazian, D. (2009): Nightlife, Social Capital and the Public Life of Cities. Sociological Forum 24(4), 908–917, https://doi.org/10.1111/j.1573-7861.2009.01143.x.
Green, P. (2018): A Drinkable Feast: A Cocktail Companion to 1920s Paris. New York: TarcherPerigee.
Gwiazdzinski, L. (2015): The Urban Night: A Space Time for Innovation and Sustainable Development. Journal of Urban Research 11, 1–39.
Hadfield, P. (2006): Bar Wars: Contesting the Night in Contemporary British Cities. Oxford: Oxford University Press, https://doi.org/10.1093 /acprof:oso/9780199297856.003.0009.
Hadfield, P. (2015): The Night-time City. Four Modes of Exclusion: Reflections on the Urban Studies Special Collection. Urban Studies 52(3), 606–616, https:// doi.org/10.1177/0042098014552934.
The phenomenon of the American Bar in interwar Berlin and Prague 103
Haffner, S. (2002): Příběh jednoho Němce: Vzpomínky na leta 1914–1933. Praha: Prostor.
Heřmanova, E. (2012): Difúze inovace (diffusion of innovation). On-line vykladovy slovník arts managementu a art marketingu [online]. Praha: Fakulta podnikohospodařska VŠE [cit. 2017-03-31], http:// www.artslexikon.cz//index.php?title=Dif%C3%BAze _inovace.
Howell, P. (2000): A Private Contagious Diseases Act: Prostitution and Public Space in Victorian Cambridge. Journal of Historical Geography 26(3), 376–402, https://doi.org/10.1006/jhge.2000.0235.
Isherwood, C. (2012): Goodbye to Berlin. New York: New Directions.
Jayne, M. (2006): Cities and Consumption. London: Routledge, https://doi.org/10.4324/9780203358733.
Kafka, J. (1891): Ilustrovany pruvodce všeobecnou zemskou jubilejní vystavou s pruvodcem Prahou. Praha: Agitační komitet pro obeslaní Zemske jubilejní vystavy r. 1891.
Karník, Z. (2008): Male dějiny československe (1867–1939). Praha: Dokořan.
Kaškova, M., Kučera, Z., Chromy, P. (2016): Místo a značka: place branding a problémy jeho konceptualizace. Informace CGS 35(2), 1–16.
Kroutvor, J. (1988): Pražska naroží 1890–1940. Praha: Katalog k vystavě plakatu z fondu Uměleckoprumyslo- vého muzea v Praze.
Kroutvor, J. (2012): Když v baru houstl dym. Gastronomicky silvestr aneb polarní zaře v kuchyni ve vltavskem vysílaní 31. 12. 2012 – celodenní cyklus na tema světa gastronomie. Cesky Rozhlas Vltava.
Lowenthal, D. (1961): Geography, Experience and Imagination: Towards a Geographical Epistemology. Annals of the Association of American Geographers 51(5), 241–260, https://doi.org/10.1111/j.1467-8306 .1961.tb00377.x.
Lundestad, G. (2003): The United States and Western since 1945: From ‘Empire’ by Invitation to Transatlantic Drift. Oxford: Oxford University Press.
Marešova, M. M. (2012): Když v baru houstl dym. Gastronomicky silvestr aneb polarní zaře v kuchyni ve vltavskem vysílaní 31. 12. 2012 – celodenní cyklus na tema světa gastronomie, Cesky Rozhlas Vltava.
May, J. (1996): ‘A Little Taste of Something More Exotic’: The Imaginative Geographies of Everyday Life. Geography 81(1), 57–64.
Mckewon, E. (2003): The Historical Geography of Prostitution in Perth. Australian Geographer 34(3), 297–310, https:// doi.org/10.1080/0004918032000152393.
Metzger, R. (2007): Berlin in the Twenties: Art and Culture 1918–1933. London: Thames & Hudson.
Mikšovic, A. (2009): Bar. Mixologie, historie, management. Praha: Consoff.
Mikšovic, A. (2012): Bar do kapsy: Pruvodce koktejlovou planetou. Praha: Mlada fronta.
Miller, A., Brown, J. (2009): Spirituous Journey a History of Drink. Book Two: From Publicans to Master Mixologists. London: Mixellany.
Mozr, T. (2012): Fenomen instituce baru jako součast životního stylu za ‘První republiky’. Bachelor thesis, Praha: Univerzita Karlova, Ústav českych dějin.
Mozr, T. (2013a): American Bar: Příspěvek ke specifickemu fenomenu sociokulturních dějin mezivalečneho
Ceskoslovenska. Dvacate století – The Twentieth Century 5(2), 55–78.
Mozr, T. (2013b): Tři tvaře trinkkultur. BARLIFE 10(59), 12–14.
Mozr, T. (2013c): Napříč prachem času. BARLIFE 10(58), 22–23.
Mozr, T. (2015): American Bar – fenomen evropskych metropolí: Londyn, Berlín, Praha. Master thesis, Praha: Univerzita Karlova, Ústav světovych dějin.
Mozr, T. (2017): Genius loci – geografie noci na příkladu percepce proměn mezivalečne Prahy. Geograficke rozhledy 27(2), 16–19.
Nezval, V. (1928): Kapka inkoustu. ReD, měsíčník pro moderní kulturu 1(9), 306–317.
Pixova, M. (2011): Noční prostor očima geografie. Geograficke rozhledy 20(4), 30–31.
Ramsey, D., Everitt, J. (2007): Called to the Bar: A Historical Geography of Beverage Rooms in Brandon, 1881–1966. Manitoba History 56, 12–21.
Relph, E. (1976): Place and placelessness. London: Pion.Shaw, R. (2014): Beyond Night-time Economy: Affective
Atmospheres of the Urban Night. Geoforum 51, 87–95, https://doi.org/10.1016/j.geoforum.2013.10.005.
Siwek, T. (2011): Percepce geografickeho prostoru. Praha: CGS.
Soyer, A. (1859): Memoirs of Alexis Soyer. Ed. F. Volant, J. R. Warren. London: W. Kent.
Stead, W. T. (1902): The Americanization of the World, or The Trend of the Twentieth Century. New York: H. Markley.
Štembera, P., Kreuzzigerova, R. (2005): To Praha ještě neviděla: Pražsky zabavní plakat 1900–1930. Katalog k vystavě plakatu z fondu Uměleckoprumysloveho muzea v Praze, Praha.
Tadié, J. (2015): Night and the City: Clubs, Brothels and Politics in Jakarta. Urban Studies 52(3), 471–485, https://doi.org/10.1177/0042098014537692.
Teige, K.(1928): Manifest poetismu. ReD, měsíčník pro moderní kulturu 1(9), 317–336.
Tuan, Y. F. (1977): Space and Place: The Perspective of Experience. Minneapolis: University of Minnesota Press.
Tučkova, M. (2015): Londyn a Paříž: vliv tzv. „amerikanizace“ na zapadoevropske metropole ve dvacatych letech 20. století [London and Paris: The Influence of the so called ‘Americanization’ on West European Metropolises in the 1920s]. Bachelor thesis, Charles University, Prague.
Van Liempt, I., Van Aalst, I., Schwanen, T. (2015): Introduction: Geographies of the Urban Night. Urban Studies 52(3), 407–421, https://doi .org/10.1177/0042098014552933.
Vavra, J. (2010): Jedinec a místo, jedinec v místě, jedinec prostřednictvím místa. Geografie 115(4), 461–478.
Vošahlíkova, P. (1999): Zlate časy česke reklamy. Praha: Karolinum.
Waltner, J. (1931): Kde se Praha v noci i ve dne baví. Praha: Josef Bartl.
Wells, B. (2012): Germany’s 1920s Weimar Women by Jeanne Mammen 1890–1976. It’s About Time: Searching Centuries of History, Art, Nature & Everyday Life for Unique Perspectives, Uncommon Grace & Unexpected Insights [online] [cit. 2017-03-31], http://bjws.blogspot .cz/2012/11/germanys-1920s-weimar-women-by -jeanne.html.

104 Tomáš Mozr
Wood, A. (1997): The Berlin of George Grosz: Drawings, Watercolours and Prints 1921–1930. London: Yale University Press.
Wright, J. K. (1947): The Place of the Imagination in Geography. Annals of the Association of American Geographers 37(1), 1–15, https://doi.org/10.1080 /00045604709351940.
AHMP (abbreviation of Archiv hlavního města Prahy – in translation known as Prague City Archives) (1923): Protokoly schuzí ústředního zastupitelstva [říjen–prosinec 1923], inv. č. 870.
AHMP (1923): Protokoly schuzí užší spravní komise [18. říjen – prosinec 1923], inv. č. 487.
Narodní listy (1931): Barove napoje, 27. 9. 1931, 71(265), 11.Lidové noviny (1929): Cocktaily, 22. 12. 1929, 37(643), 24.Hej – rup! (Hej – rup! movie, directed by Martin Frič,
Ceskoslovensko, 1934, Ceskoslovensky statní film).Hostimil: odborny časopis věnovany živnosti hostinske
a vyčepnicke (1910): 27(19); (1917), 34 (24); (1927), 44 (2), 44(40); (1928), 45 (6), 45 (11); (1929), 46 (21); (1931), 48 (15), Praha: Jelínek, Grund & spol.
Hotel Excelsior, in: Landesarchiv, Hotelbetriebs-AG, A.Rep. 225-01, Nr. B3838.

Original Article 105
Environmental racism throughout the history of economic globalizationChelle McIntyre-Brewer*
University of Nebraska, Omaha, MA Critical and Creative Thinking Program, USA* Corresponding author: [email protected]
ABSTRACTEnvironmental racism plagues the history and contemporary realities of globalization. To control resources, stake holders seek to dominate lands and peoples in order to produce at a maximum profit. Left in the wake of consumerism are populations of ethnic, religious, and racial minorities. These groups traditionally have an attachment to ancestral lands they wish to protect or are unable to compete with large corporations who establish environmentally unfriendly conditions and unfair working situations for under-served populations. Since a mentality of ‘Not in My Backyard’ (NIMBY) perpetuates apathy for addressing iniquities, remediation of these issues has been slow to non-existent. The value of exploring specific instances and recurring trends within regions of inequity and destructive ecological policy cannot be understated. Without awareness, change is impossible. Inherently, methodologies used to analyze current global systems are imperialist in nature and create further distance from the subjects exposed to detrimental corporate and policy decisions. This research provides an historic overview of globalized environmental racism in order to address and combat negative choices affecting marginalized communities throughout the world.
KEYWORDSenvironmental racism; resources; NIMBY
Received: 22 June 2018Accepted: 7 May 2019Published online: 21 June 2019
McIntyre-Brewer, C. (2019): Environmental racism throughout the history of economic globalization. AUC Geographica 54(1), 105–113https://doi.org/10.14712/23361980.2019.10
© 2019 The Author. This is an open-access article distributed under the terms of the Creative Commons Attribution License (http://creativecommons.org/licenses/by/4.0).

106 Chelle McIntyre-Brewer
1. Introduction
The global economy has major impact on environ-ment with most of its effects hugely altering the eco-logical balance and future of our planet. Across the world, pollution levels continue to rise, and those not in control of resources become the increasingly mar-ginalized. Land degradation is at an all-time high with agricultural pursuits, deforestation, mining, and the deposition of waste (Kwong 2005). There is a high correlation between the wealthy and environmental fitness as opposed to those who come from pover-ty being exposed to the worst environmental fallout consequences due to corporate waste zones, industri-al pollution, and the pervasive ‘not in my backyard’ attitude from those who control resources (Bullard 2008). Despite many efforts to change environmen-tal conditions, very few changes have been made. It is imperative that all major actors in the global economy work judiciously to alter the current trajectory of the earth’s ability to sustain humankind, because current efforts are not enough and at the detriment to under-served populations.
Without an awareness of the issues facing these under-represented communities, environmental racism will continue to plague the global commu-nity. Most realistically, I contend that the means by which to combat environmental racism lies in making people aware of how the mistreatment of the under-served will, in turn, affect those who benefit from the products created by the corporations exacerbating pollution in areas that do not have the representa-tion to advocate for themselves. While the idea ‘Not in My Backyard’ (NIMBY) is convenient for ignoring the state of global pollution, showing people that the neg-ative effects of production do harm everyone forces those controlling resources to acknowledge that envi-ronmental racism is not sustainable (Maiorino 2011). The results may not be seen immediately but will be profoundly obvious when clean water and air become scarce, nutrients in the soil are depleted, and diseases spread from minority areas to those who control eco-nomic supply and demand. Making the consequences of environmental racism relative to the entire popu-lation so that there is an impetus to reform corporate mishandling of waste treatment and overseeing con-servation initiatives in order to manage and restore an ecological balance is of the utmost importance of the future of society. The use of traditional historical review and case studies as examples is an effective means to understand the pervasiveness of character-istics and scenarios surrounding the issue of inequity and environmental racism, serving to bridge the gap between perception and reality.
2. Background
From the dawn of civilization, the allocation of resources has dominated politics at the local, regional, and global levels. This play for ownership has evolved over time and continues to be an area that raises questions about morality, sustainability, efficiency, and capacity for increased profit. Researchers and critics, alike, disagree as to how resources should be dispersed based on the aforementioned issues with some arguing for capitalistic gain at the expense of the masses and others taking a more environmental or humanistic approach. Realistically, these conver-sations need to come to some sort of affable consen-sus sooner rather than later because there is a tangi-ble reality that humans are consuming resources at a rate more pronounced than they are recovered, and entire communities are being destroyed in the name of profit. The history of allocation of resources must be understood to decide how to address the issue of global access to supplies of any nature.
2.1 Pre-historic Quest for Resources
In pre-ancient times, the challenge in the days of the hunter-gatherer was to have enough food to sur-vive. When sustenance disappeared, humans moved to another area until those resources also became scarce, repeating the pattern until agrarian abilities formed (Hakim 2005). Once humans were able to find ways to preserve food to consume in times of want, their explorations could be fulfilled on less of a pri-mal level. “In the paleolithic period men were already aware that at certain times of the year animals and plants are less prolific than at others, and seasonal ritual observances to maintain an adequate supply of them were therefore deemed necessary.” Even dur-ing this early time in history, supply was of utmost importance.
2.2 Emergence of Civilizations and Hierarchy
As humans migrated, so did their cultures, languag-es, and religions. They developed unique identities that have influenced their regions throughout time. As anthropologists continue to study the remains and artifacts of those who predated the current popula-tion, it is commonly agreed that the cradle of civiliza-tion is in the Middle East and Northern Africa, with Ethiopia also having a distinct early culture (Havi-land 2013). As independent civilizations gathered the knowledge and resources to create agrarian societies with more complex governments and the opportunity for caloric energy to be expended on recreation, social hierarchies developed (Whitrow 2004). The result was a miniscule ruling or upper class, a very limited scholarly or merchant class middle class, and the rest being the working class which supported the entire civilization.

Environmental racism throughout the history of economic globalization 107
The upper classes had the luxury of time and wealth, while the lower classes toiled on land they did not own, for profits they could not claim. Their needs were barely being met while those in positions of power lived comfortably. As time progressed, the labor of the lower classes and the prowess of the mer-chant and ruling classes created trade routes span-ning various continents. These routes brought with them the opportunity for economic growth through trade, the profits of war, and the acquisition of land for various civilizations. Inevitably, there was an unbal-ance in resources on all levels (Postgate 1994). In fact, some of the very resources being distributed were the very lowest classes: slaves. The idea of man as a commodity was an idea well-established through-out the continents based on the emerging idea of con-quering to claim for political growth (Brace 2004). Unfortunately, the practice of slavery – in whatever form – developed as a reality wherever the acquisi-tion of resources takes place.
2.3 Age of Exploration
By the Age of Exploration, the dominant political and expeditionary forces, except for the various dynas-ties of eastern Asia, existed in Europe. The focus of established political entities was threefold: gold, God, and glory. Monarchs sought to gain capital by finding gold and other lucrative assets, converting as many foreign civilizations to Christianity, and enjoying the glory of owning more of the Earth’s crust through imperialism (Crowley 2015). The Atlantic, Pacific, Indian, and with them a wide vari-ety of seas were now filled with trade route claims for shipping companies acting under the authority of various kingdoms and countries. Once again, the resources were allocated to the few – those wealthy enough to dictate exploration – and mined, cultivat-ed, or manufactured by the masses. At this point in history, agriculture was not nearly as valued as the precious minerals being mined to sustain the desire for riches of the elite in Europe (Williamson 2009). With the demise of natives in colonial expanses, mer-chants quickly latched on to the market of slaves coming out of the Middle East and Africa, loading human cargo in ships and setting sail for, first, South America, but quickly on its heels, North America, as well. Once the Colombian Exchange was created and agriculture unique to the Americas falling in favor, the Triangular Trade soon followed suit with its own economic cycle. Ships filled with slaves and gold from Africa and the Mediterranean were traded for sugar and molasses in the West Indies where it was turned into rum, and other raw materials from the American Colonies were sent to Europe to be manufactured so they could be sold so that the entire process would begin again (Galeano 1997). Because of the reliance on water routes, countries also hired privateers to act on their behalf essentially as pirates to pull as many
commodities from foreign nations of opposite alle-giance as possible.
While so much attention has been paid to Europe-an imperialism, the Ottoman Empire (Turks) dom-inated the Middle East while Asia was a confluence of the major players in Europe as well as Japan and, eventually the United States between colonial times right on up to the inception of World War I. Prior to that period, it had seen several large imperial forc-es ravage the area. At the very root of colonialism, regardless of location, were resources.
2.4 Industrial Revolution Through World War I
As colonies in the Americas and Asia fought to gain independence, the Industrial Revolution became the impetus for European nations to find means to obtain raw materials to produce finished products. Known as the Scramble for Africa, Europeans ravaged the Afri-can continent, claiming land masses filled with poten-tial income and rivers for transportation at a rapid pace. In 1870, ten percent of Africa was controlled by European entities, but by the onset of World War I, ninety percent had been claimed (Easterly 2009). The fruits of the African continent were being taken at an incredibly high cost to the African people. Despite the atrocities occurring, many wealthy investors ignored the horror of African imperialism.
The beginning of the twentieth century ushered in great transformations, both politically and economi-cally. The emergence of a solid middle class brought about new ideas and challenges to the traditional modes of government. The assassination of Archduke Ferdinand became the excuse needed to embark on a deadly conflict which cultivated a war machine fueled by corporate greed on both sides. Then, the post-war period was difficult on multiple levels. “Industrial pro-duction, which had been geared to the war effort, had to be changed over to peaceful uses.” This time-con-suming process led to unemployment as soldiers from all fronts returned home to find there were few jobs to be filled. Combining this with the Great Stock Market Crash of 1929, the world was struggling to recover.
This time, fascist regimes came forward with eco-nomic promises at the expense of freedom and pro-gress which eventually led to World War II where no continent was left unscathed, whether by being directly involved in battle or through commitment of manpower and resources (Gilbert 1979). Corpo-rations showed their disregard for moral principles by choosing to work with enemy governments while providing products for Allied countries. Some of their technological advancements even led to the death of both Allied troops as well as the victims of wide-spread genocide (Bakan, Crooks, Achbar 2003). To date, corporations involved with this duplicitousness deny direct involvement, taking an amoral approach that they have no control over the use of their product once sold to entities (Bakan et al. 2003).

108 Chelle McIntyre-Brewer
2.5 Post-World War II
Once World War II concluded, it seemed the world was split between communist ideologies and capital-ism. Oil, which came to the forefront during the First World War, dominated economic decisions globally. Europe and Asia were in ravages, while the United States held the upper hand economically on a univer-sal level. It seemed the tables had turned on the former economic and political powers while former colonies exerted their fledgling power in protest of long held oppression. Smaller, previously ignored countries such as Viet Nam and Korea came to the forefront in the fight between capitalism and communism, while the people of those countries were more interested in exercising their independence. Time and again, coun-tries would vie for true freedom from outside influ-ences only to find that they were inherently sewn into the web of globalism. Since Central and South Ameri-ca now had more business ties with the United States than Europe and, as already noted, corporations have a long history with supporting tyrannical govern-ments, this geographic region, like Asia followed by Africa, would find itself in political upheavals at the whim of wealthier governments or connected corpo-rations (Williamson 2009). Even today, the corporate impact over government is undeniable. Corporations such as Monsanto are deeply embedded in the polit-ical decisions made in both developed and develop-ing nations (Robin 2008). Essentially, those corpora-tions, the International Monetary Fund, World Bank, and World Trade Organization are the equivalent of the ancient Mesopotamian priests, making decisions that affect the lives of many while directly benefitting the few.
3. Environmental Racism
Environmental racism is a concept that evokes con-siderable controversy but must be addressed in order to protect the future of our planet. The term takes on different meaning depending on the geo-graphic area depicted, but the basic premise is that the ethnic, religious, and racial minorities of a region are underserved in terms of adequate access to basic environmental protections and rights (Lancet Plan-etary Health 2018). While those currently benefit-ting from this marginalization continue to refuse to acknowledge the profound damage being done to, not only the minority groups directly involved, but the entire planet, our world is rapidly decaying and reaching a point of irrevocable damage. “Leaders in the environmental-justice movement have posit-ed – in places as prestigious and rigorous as United Nations publications and numerous peer-reviewed journals – that environmental racism exists as the inverse of environmental justice, when environmen-tal risks are allocated disproportionately along the
lines of race, often without the input of the affected communities of color.” The history and pervasiveness of colonization throughout time reinforced environ-mental racism so it is entrenched within the context of globalization.
Contemporary discourse centers around the inher-ently problematic issues that arise in attempting to address environmental racism. As the result of impe-rialism and colonization, the injustices associated with controlling resources while maximizing profits often excludes the voices most affected by contami-nation, pollution, and other inequities (Das, Horton 2017). Furthermore, the inability to respond to cor-porate policy that negatively affects communities keeps victims of environmental racism from being able to spearhead legal and legislative reform, much less have the resources to relocate to safer areas or access appropriate medical care. “The issues around environmental racism show that environmental and social issues cannot be neatly separated from each other. Resources, legal and financial, need to be made available to those affected so they can be heard when they call this discrimination out for what it is.” Contin-ued concerted efforts on the part of corporations and policy makers to exploit underserved populations and the environments in which they live despite massive studies indicating the negative impacts to the ecology, health, and sustainability of impacted areas.
3.1 The United States
In the United States, environmental racism is typically identified in areas of lower income, dense population, and primarily minority residents, referring “to any policy, practice or directive that differentially affects or disadvantages (whether intended or unintended) individuals, groups or communities based on race or colour (sic)”. These types of communities are found all over the country, in both urban and rural areas, and involving a multitude of races and ethnicities. Ironi-cally, one of the most affected groups in the United States are Indigenous People. “The legacy of institu-tional racism has left many sovereign Indian nations without an economic infrastructure to address pover-ty, unemployment, inadequate education and health care, and a host of other social problems.” Despite well-known and accepted histories of cultural inter-est in the earth and its relationship to humans, North American Indigenous Peoples are routinely found advocating to protect their land and resources from mostly economic entities determined to find profit at the expense of the environment. Most recently, the Dakota Access Pipeline controversy brought to light the conflict between corporate entities and tribal affiliations with the protests over the possibility of contaminating water and infringing on sacred buri-al grounds at the Standing Rock Indian Reservation (Liu 2016). The sheer apathy of the pipeline’s corpo-rate response caught the American people, as well as

Environmental racism throughout the history of economic globalization 109
global followers, off guard and brought to light the inequalities feeding into institutional environmental racism.
Corporate indifference to industrial pollution is not unique to the Indigenous communities in the United States: “Two influential studies exploring this rela-tionship – one by the U.S. General Accounting Office (USGAO) and the other by the United Church of Christ (UCC) – found that African-Americans and other peo-ple of color were more likely to live close to hazardous waste sites and facilities than whites.” Both studies were conducted in the 1980s and revealed inequities on several levels. The UCC research was able to link race specifically to augmented opportunities for expo-sure to contaminated materials (United Church of Christ 1987). Most importantly, these studies brought awareness to the fact that minority communities were more prone to environmental racism.
Whether natural or man-made, environmental dis-asters continue to dominate in areas where poverty and minority communities exist. In 2005, Hurricane Katrina ravaged the Gulf Coast region, specifically New Orleans. The result was chaos and destruction which impacted all strata of society but particularly in the black community. The authors of Institutional Dis-crimination, Individual Racism, and Hurricane Katrina explore the reasons for this inequity in their research, explaining that previous poverty and lack of resourc-es prior to the hurricane made escaping its wrath more difficult while recovery efforts were statisti-cally stunted by governmental sources as compared to predominantly white areas (Henkel, Dovidio and Gaertner 2006). Over a decade later, the area is still being rebuilt, with a focus on the corporate infrastruc-ture dominating the horizon while some families are still living in FEMA provided trailers (Robertson and Fausset 2015). Nature may have created the storm, but society has allowed its destruction to linger in underserved areas.
Other parts of the United States which experienced environmental racism are affected from a corporate vantage point. Detroit, Michigan is historically known as the car manufacturing center of the United States, while its factories sit empty and pollutants continue to corrode the environment surrounding the city and its outlying regions. In 2014, it was revealed that lead levels in the water of Flint, Michigan could be legal-ly defined as toxic waste by the Environmental Pro-tection Agency (Craven and Tynes 2016). As a major contributor to Detroit’s automotive industry, toxins were being released into the air, water, and soil for generations leading to this crisis and affecting a pre-dominantly minority and underserved population. “Flint’s water crisis fits into a historical trend of envi-ronmental racism in the U.S., which for decades has allowed polluters to prey on communities of color, in part because of weak environmental regulations.” The industrialized North was certainly not alone in its contributions to environmental racism.
In the South, racism continues to be a force of oppression, particularly through corporate impacts on the environment. The USGAO’s study, “Siting of Hazardous Waste Landfills and Their Correlation with the Racial and Socio-Economic Status of Surrounding Communities,” sites lenient regulations and hand-outs for corporations, with little legislation to protect land, water, and air resources (United States General Accounting Office 1983). This information came as a result of the public outcry to the Warren County, North Carolina Polychlorinated Biphenyls (PCB) dump sites created by Ward Transformers Company begin-ning in 1973. While Warren County received support from an outraged populace, other areas of the South were found to be just as contaminated, with a predis-position to place factories, dump waste, and otherwise fuel environmental racism based on the fact that these communities did not have the same representation in political places of power and, in predominantly Latino communities, language barriers added an extra level of under-communication of the dangers of industri-al pollution (Bullard 2000). Across the United States, economic growth has been set as a priority while underserved communities continue to suffer from the effects of pollution and environmental degradation.
3.2 Europe
Environmental racism is also experienced in Europe, which has a vast history of discrimination against minority groups which extended its grip through col-onization. On its own continent, Europe continues to struggle with its treatment of Romani and Indige-nous tribes of the continent. Comparable conditions face the Romani to those of minorities in the United States, as they are relegated to poorer urban areas, with contaminated living situations. The European Roma Rights Centre indicates that “Forced evictions of Roma on environmental grounds are on the rise” while mining and deforestation efforts are threaten-ing the well-being of ethnic groups in the northern regions of Europe (Tauli-Corpuz 2015). Sami, Koni, Yemets, and other Indigenous groups of continen-tal Europe find themselves in similar positions as those in North America, with their food and water supply contaminated by corporate efforts to expand and increase profit (European Racism and Xenopho-bia Information Network 2009). The environmental threat to these marginalized people is very real and seldom recognized at a global level.
With such indifference toward the well-being of the indigenous groups of the region, it is no wonder that the refugee situation in Europe has been cause for discontent and inevitable environmental racism. Vast amounts of those fleeing political unrest in Afri-ca and the Middle East have converged on the Euro-pean continent and are often used for undesirable labor that exposes them to dangerous chemicals and extreme weather conditions to work for wages that
110 Chelle McIntyre-Brewer
do not meet the European standards (Serpis 2015). Further north, refugees routinely jostle with French riot police in Calais as they attempt to access the Unit-ed Kingdom, living in deplorable conditions that are veritable environmental hazards (News France 2017). The European quest to imperialize has extended this sort of behavior to a global level that remains prob-lematic to this day.
3.3 Latin America and the Caribbean
Latin America and the Caribbean were molded by fierce colonialism and exploitation of the land and its Indigenous people (Williamson 2009). Despite centu-ries of pillage and annihilation of the native popula-tion due to war over resources, slavery, and the spread of disease, the people still take an active role in fight-ing environmental racism. “Campesino identity and farmworker identity have long been pillars of politi-cal participation in rural Latin America, particularly where peasants’ demands for justice figure in nation-al histories of revolutionary violence. Now despoiled landscapes, poisoned watersheds, agricultural chem-icals, and other rural environmental problems share the platform with such traditional peasant issues as land, credit, and commodity prices.” The destruction of the environment is largely due to foreign interests either using the raw materials native to South Amer-ica and the Caribbean or creating industrial settings in these areas to save money on labor, production, and the disposal of toxic waste (Carruthers 2008). Much the same as the other cases examined in this writing, ethnicity, race, and poverty are driving forc-es which determine where these corporate outposts are located, and the damage done is typically to the underserved community while those with adequate resources are distant from the damage incurred.
3.4 Africa
Well documented activity exists of so-called first world national corporations sending toxic waste to Africa, stripping the continent of its natural resources without regard to ecological balance, and exploiting labor is pervasive throughout colonial history (Kig-otho 2015). Environmental racism is a volatile issue in Africa, with political unrest being only a portion of the violence as impoverished communities continue to be affected by contamination, disease, and lethal living conditions. “South Africa is in a state of ecolog-ical collapse moving towards ecological catastrophe,” with “[m]ost black South Africans continu[ing] to live on the most damaged land, in the most polluted neighbourhoods near coal fired power stations, steel mills, incinerators and waste sites”. Sadly, the expe-rience of black South Africans is far from an abnor-mal representation of the conditions suffered by the indigenous people of Africa (Cock 2015). The Ogoni people were victims of environmental racism when
Shell Oil began drilling on their tribal lands, leading to toxic environmental levels in what was previous-ly nutrient rich soil (Spitulnik 2011). After a massive outcry from the people and very public protests, the Nigerian government arrested and executed nine pro-testors to quell the situation, ultimately siding with Shell Oil and continuing to allow large scale pollution. Ultimately, the same sort of patterns of environmen-tal racism present themselves in Africa as has been seen elsewhere, with the underserved populations and minorities being exposed to dangerous levels of pollutants and contamination.
3.5 Asia
Geographically, Asia is an interesting area because it is filled with island countries as well as being home to major industrial nations including Korea, Japan, and China. It constitutes an enormous amount of the planet and includes a wide range of ecosystems, gov-ernments, ethnicities, and industries. It also is home to the largest ocean on the planet which, as Haunani-Kay Trask attests, “The vast Pacific is a dumping ground for toxic and hazardous wastes” (Trask 1993). Aside from the tremendous number of environmental contami-nants released during World War II, the area remains rife with industrial activity that releases pollutants at the expense of indigenous people of the region.
Even on the continental mainland, environmen-tal racism has been prevalent throughout the area. In 1983, Texas owned Union Carbide Corporation experienced an industrial catastrophe when its plant mixed methyl isocyanate, a chemical fertilizer, with water causing a noxious gas to loom over the town of Bhopal in India, exposing 520,000 people in the area. Within three days, approximately 8,000 native residents were dead and thousands more would be diagnosed with lung fibrosis, blindness, tuberculo-sis, neurological issues, severe body pains, while the death toll continued to mount (Das Gupta and Das Gupta 2008). The sheer number of those affected is staggering in comparison to many of the other regions of the world, which makes sense considering that Asia homes 59.63% of the world’s population (United Nations 2011). Another common denominator making this disaster like others of its kind in Asia is that the incident occurred with an outsourced subsidiary of a Western corporation. The combination of geograph-ic size, massive diverse populations, varied resources and ecosystems, and economic competition make Asia ripe for opportunities to extort its local populations.
3.6 Not in My Backyard – NIMBY
Throughout time and space, a common theme that keeps arising is NIMBY, an acronym for Not in My Backyard (Bullard 2008). In short, those who pol-lute are sure to place the waste or damage in an area that will not directly impact or inconvenience their
Environmental racism throughout the history of economic globalization 111
lifestyles. Reviewing the evidence researched, it is fair to argue that environmental racism continues to impact the underserved and under-represented. The predominant cause of the issue is a desire to save money at the expense of the environment, thus affect-ing large segments of the population who do not have the resources by which to fight large corporations (Albareda 2008).
Without an awareness of the issues facing these under-represented communities, environmental racism will continue to plague the global commu-nity. Most realistically, I contend that the means by which to combat environmental racism lies in making people aware of how the mistreatment of the under-served will, in turn, affect those who benefit from the products created by the corporations exacerbating pollution in areas that do not have the representa-tion to advocate for themselves. While the idea of NIMBY is convenient for ignoring the state of global pollution, showing people that the negative effects of production, in fact, do harm everyone forces those controlling resources to acknowledge that environ-mental racism is not sustainable. The results may not be seen immediately but will be profoundly obvious when clean water and air become scarce, nutrients in the soil are depleted, and diseases spread from minor-ity areas to those who control economic supply and demand. Making the consequences of environmental racism relative to the entire population so that there is an impetus to reform corporate mishandling of waste treatment and overseeing conservation initiatives in order to manage and restore an ecological balance is of the utmost importance of the future of society.
4. Theories of Application
Those who have power wield it over those who do not, monopolizing access to resources and strategi-cally withholding it from those who need support the most. The question lies in how to adequately deal with the unequal distribution of resources globally. While theorists debate the merits and best practices of eco-nomic development, it is imperative to remember that the past is the key to the present. Humans repeatedly choose to ignore past iniquities, continuing to make the same mistakes. It is imperative to note that case studies which qualitative data, mentioned throughout this discussion, have existed since the early 1980s and continued to be released. Environmental racism per-sists despite years of study.
Classical liberal economists argue for a more tra-ditional view of economic development, ignoring the fact that viewing developing nations with a primitive lens that is often condescending and, in fact, reinforc-es an imperialist mentality. Walt Whitman Rostow, after all, strongly supported efforts by the United States in Viet Nam which led, not only to failure and a highly corrupt government, but to environmental
and human destruction with the introduction of Agent Orange by corporate influence of Monsanto as well as the overall destructiveness of war (Milne 2008). This approach to economic development has been proven, time and again, to be opportunist and elitist, not to mention unsustainable.
Still, a neoclassical movement evolved to advocate for free markets and accountability through private investment and market efficiency. Although this is the predominant theory in practice to date, inherently it is problematic because the investors logically are those who have the means to pay into the system in order make an influence. The negative effect on those marginalized and their environments persists with-out the ability to advocate for themselves beyond a limited grassroots effort.
Unlike the previous two theories, the social theory of development holds the most promise for the glob-al community. This philosophy emulates the desire to view commodities within a framework of sustain-ability and cultural milieu. As Ernst Friedrich Schu-macher advocated in Small is Beautiful: A Study of Eco-nomics as if People Mattered (1999), individuals need meaningful work for proper human development and “production from local resources for local needs is the most rational way of economic life” (Schumacher 1999). Instead of solely relying on economic growth as the key measure of success, social economic theo-rists contend that addressing systemic issues such as poverty, inequality, population migration, premature death rates and other social problems with positive outcomes is just as important.
Localization and decentralization lead to more access for all parties involved to have a say in the allo-cation of resources, which is not to say that globaliza-tion is a bad thing or that the interconnectedness of global production networks is a blight on the future of the planet. Rather, the social theory of develop-ment suggests that taking the time to assess local and regional assets and have them managed by the locali-ty is beneficial for everyone because it adds a layer of personal interest to what is often a distance transac-tion. As Peter Dicken (2015) so aptly explains, “The real effects of globalizing processes are felt not at the global or the national level but at the local scale: the communities within which people struggle to meet the needs of their daily lives”. Affording localities the ability to make choices, and applying this mode of management universally, ensures a better chance of a checks and balances system requiring entities to work with one another to solve issues. Though clear-ly not a panacea, utilizing local interest is an effec-tive means by which to improve circumstances. The result may not be the cheapest, fastest, nor the most technologically advanced, but there is a better chance of sustainability of mankind. Most importantly, the social theory of development engages stakeholders at myriad levels to create a conversation set apart from other efforts to confront environmental racism.
112 Chelle McIntyre-Brewer
5. Conclusion
Historically, humans struggle with sharing resources equitably and with respect to everyone, regardless of class, ethnicity, religion, or race. As the economy became more globalized, machinations were put into place to exert control by the few over the many. The effects have been devastating, ethically questiona-ble, and nonsustainable. In order to move forward, the global population needs to recognize that NIMBY passes the negative aspects of economic growth on to those with more difficulty exacting change. While it is highly unlikely global cities are willing to relin-quish their pervasiveness, it is certainly possible to create more centers for trade and commerce in order to enable diversity in influence. At the time of this writing, cities in Central and Southeast Asia contin-ue to climb to prominence as a chief example. Beyond this, progress in identifying environmental racism and its characteristics continues to pinpoint specific examples of ecological and human devastation. Due diligence in battling policies and procedures that allow this discriminatory behavior must be applied. Currently, such organizations as the United Nations, Transparency International, and the O’Neill Institute are working vigorously to bring incongruities to light, with localized grassroots efforts struggling to be heard and taken seriously. Proactive recognition of the vast scope of environmental racism through involvement, awareness, and practical application is the only viable solution to confront an endemic problem.
References
Albareda, L. (2008): Corporate Responsibility, Governance and Accountability: From Self-Regulation to Co-Regulation. Corporate Governance 8(4), 430–439, https://doi.org/10.1108/14720700810899176.
Bakan, J., Crooks, H., Achbar, M. (2003): The Corporation. Directed by Mark Achbar and Jennifer Abbott. Produced by Mark Achbar and Bart Simpson.
Brace, L. (2004): The Politics of Property: Labour, Freedom and Belonging. Edinburgh: Edinburgh University Press.
Bullard, R. D. (2000): Dumping in Dixie: Race, Class, and Environmental Quality. Boulder, CO: Westview Press.
Bullard, R. D. (2008): Environment and Morality: Confronting Environmental Racism in the United States. United Nations Research Institute for Social Development, 1–36.
Carruthers, D. V. (2008): Environmental Justice in Latin America: Problems, Promise, and Practice. Cambridge: MIT Press, https://doi.org/10.7551/mitpress /9780262033725.001.0001.
Cock, J. (2015): How the Environmental Justice Movement is Gathering Momentum in South Africa. The Conversation, November 1.
Craven, J., Tynes, T. (2016): The Racist Roots of Flint’s Water Crisis. Huffington Post, February 2, B3.
Crowley, R. (2015): Conquerors: How Portugal Forged the First Global Empire. New York: Random House.
Das, P., Horton, R. (2017): Pollution, Health, and the Planet: Time for Decisive Action. Lancet 391, 407–408.
Das Gupta, A., Das Gupta, A. (2008): Corporate Social Responsibility in India: Towards a Sane Society?. Social Responsibility Journal 4(1/2), 209-216, https:// doi.org/10.1108/17471110810856965.
Dicken, P. (2015): Global Shift: Mapping the Changing Contours of the World Economy, Seventh Edition. New York: Guilford Press.
Easterly, W. (2009): The Imperial Origins of State-Led Development. New York: New York University.
European Racism and Xenophobia Information Network (2009): France Raxen National Focal Point Thematic Study: Housing Conditions of Roma and Travellers. Bruxelles: European Union Agency for Fundamental Rights.
Galeano, E. (1997): Open Veins of Latin America: Five Centuries of the Pillage of a Continent: New York: Monthly Review Press.
Gilbert, F. (1979): The End of the European Era, 1890 to the Present. New York: W. W. Norton & Company.
Hakim, J. (2005): A History of US: The First Americans, Prehistory–1600. Oxford: Oxford University Press.
Haviland, W., Prins, H. E. L., Mcbride, B., Walrath, D. (2013): Cultural Anthropology: The Human Challenge. New York: Cengage Learning.
Henkel, E. K., Dovidio, F. J., Gaertner, L. S. (2006): Institutional Discrimination, Individual Racism, and Hurricane Katrina. Analyses of Social Issues and Public Policy 6(1), 99–124, https:// doi.org/10.1111/j.1530-2415.2006.00106.x.
Kigotho, W. (2015): Environmental Crimes and Migration Patterns in Africa. Bloomberg, October 7.
Kwong, J. (2005): Globalization’s Effect on the Environment. Society 42(2), 21–28.
Lancet Planetary Health (2018): Environmental Racism: Time to Tackle Social Injustice. Lancet 2(11), e462, https://doi.org/10.1016/S2542-5196(18)30219-5.
Lawyers Collective and the O’Neill Institute (2017): Global Health and Human Rights Database, September 18, http://www.globalhealthrights.org.
Lim, S., Menaldo, V., Prakash, A. (2015): Foreign Aid, Economic Globalization, and Pollution. Policy Sciences 48(2), 181–205, https://doi.org/10.1007 /s11077-014-9205-6.
Liu, L. (2016): Thousands of Protesters are Gathering in North Dakota – And It Could Lead to “Nationwide Reform”. Business Insider, September 13.
Maiorino, A. (2011): Do You Have Control Over NIMBYism?. Biomass Magazine, March 22.
Milne, D. (2008): America’s Rasputin: Walt Rostow and the Vietnam War. New York: Hill and Wang.
News France (2017): Migrants and Police Clash at Calais Camp Demolition. The Local, March 12.
Postgate, N. (1994): Early Mesopotamia: Society and Economy at the Dawn of History. New York: Routledge.
Robertson, C., Fausset, R. (2015): 10 Years After Katrina. New York Times, August 25.
Schumacher, E. F. (1999): Small is Beautiful: Economics as If People Mattered. New York: Hartley & Marks Publishers.
Serpis, A. (2015): Salad Days? Semi-Slavery on the “Sweating Fields” of Southern Spain. The Ecologist, April 16.

Environmental racism throughout the history of economic globalization 113
Spitulnik, D. (2011): Small Media Against Big Oil (Nigeria). In: Encyclopedia of Social Movement Media. Edited by J. D. H. Downing, SAGE Publications, http://dx.doi .org/10.4135/9781412979313.n203.
Tauli-Corpuz, V. (2015): Preparatory Report from the Sami Parliament in Sweden/Samediggi/Samedigge /Saemiedigkie/Sametinget. New York: United Nations Special Rapporteur on the Rights of Indigenous Peoples.
Trask, H.-K. (1993): Environmental Racism in Hawaii and the Pacific Basin. Boulder, CO: Audio Energy for Democracy, September 29.
United Church of Christ (1987): Toxic Waste and Race in the United States: A National Report on the Racial and Socio-Economic Characteristics of Communities with Hazardous Waste Sites, New York.
United Nations (2011): Population Distribution, Urbanization, Internal Migration and Development: An International Perspective. New York: United Nations Department of Economic and Social Affairs Population Division.
United States General Accounting Office (1983): Siting of Hazardous Waste Landfills and Their Correlation with the Racial and Socio-Economic Status of Surrounding Communities, Washington, DC.
Whitrow, G. J. (2004): Time in History: Views of Time from Prehistory to the Present Day. New York: Oxford University Press.
Williamson, E. (2009): The Penguin History of Latin America. London: Penguin.