Analysis of Phenetic Trees Based on Metabolic Capabilites Across the Three Domains of Life
ARTICLE IN PRESS
0044-5231/$ - se
doi:10.1016/j.jc
�CorrespondGenetics, Instit
97, 602 00 Brno
E-mail addr
Zoologischer Anzeiger 247 (2008) 67–80
www.elsevier.de/jcz
Geographic phenetic variation of two eastern-Mediterranean non-commensal
mouse species, Mus macedonicus and M. cypriacus (Rodentia: Muridae)
based on traditional and geometric approaches to morphometrics
Milos Macholana,b,�, Ondrej Mikulaa, Vladimır Vohralıkc
aLaboratory of Mammalian Evolutionary Genetics, Institute of Animal Physiology and Genetics,
AS CR, 602 00 Brno, Czech RepublicbInstitute of Botany and Zoology, Masaryk University, Brno, Czech RepubliccDepartment of Zoology, Faculty of Sciences, Charles University, 128 44 Prague 2, Czech Republic
Received 19 March 2007; received in revised form 4 July 2007; accepted 4 July 2007Corresponding editor: D.G. Homberger
Abstract
We tested the hypothesis that skull shape within the genus Mus may vary with geographic location by assessingthe extent and spatial distribution of phenotypic skull variation within and among two wild mouse species,M. macedonicus and M. cypriacus, using traditional and geometric morphometrics including a rather novel applicationof sliding semilandmarks. Shape was shown to be significantly correlated both with longitude and latitude inM. macedonicus, yet the correlation between morphometric and geographic distances was not significant, andmorphometric differences between Asian and European populations were not higher than those within the particularcontinents. The phylogenetic signal was found to be stronger in dental characters than in cranial ones, however, overallconcordance between the pattern of morphometric variation and the presumed history of M. macedonicus was ratherweak. In both species, the dorsal and ventral sides of the skull were shown to covary in many aspects though there werealso some differences between them, making the functional interpretation of these differences difficult. Discriminationbetween M. cypriacus and M. macedonicus as well as discrimination between two M. macedonicus subspecies washighly reliable using both traditional and geometric morphometric tools to analyze skull measurements.r 2007 Elsevier GmbH. All rights reserved.
Keywords: Mus macedonicus; Mus cypriacus; Phenotypic variation; Multivariate analysis; Geometric morphometrics; Thin-plate
spline
1. Introduction
In the last decade, data have accumulated broadeningour knowledge of the systematics and phylogenetic
e front matter r 2007 Elsevier GmbH. All rights reserved.
z.2007.07.003
ing author. Laboratory of Mammalian Evolutionary
ute of Animal Physiology and Genetics, AS CR, Veverı
, Czech Republic. Fax: +420 532290138.
ess: [email protected] (M. Macholan).
relationships in mice of the genus Mus (Prager et al.1998; Boursot et al. 1993; Lundrigan et al. 2002; Chevretet al. 2005). New findings have also appeared regardingthe group of west-Palearctic non-commensal mousespecies. This group, called ‘aboriginal’ by Sage (1981),was shown to consist of three species: The western Mus
spretus Lataste, 1883, from southern France, Spain, andnorth-western Africa (Macholan 1999a); and the twoeastern species M. spicilegus Petenyi, 1882, from the
ARTICLE IN PRESSM. Macholan et al. / Zoologischer Anzeiger 247 (2008) 67–8068
Panonian plains and lowlands of eastern Europe(Macholan 1999b) and M. macedonicus Petrov andRuzic, 1983, from the Balkan Peninsula and the MiddleEast (Macholan 1999c). Regardless of whether thesespecies form a monophyletic group or not (cf. e.g., Sheet al. 1990; Sage et al. 1993; Prager et al. 1996), they allhave been considered genetically rather uniform incontrast to the commensal house mouse Mus musculus
(Bonhomme et al. 1984; Prager et al. 1996).However, in the late 1990s, a morphologically distinct
population of M. spicilegus was reported from thevicinity of the town of Ulcinj, Montenegro, anddescribed as a new subspecies, Mus spicilegus adriaticus
(Krystufek and Macholan 1998). At the same time, aclose morphometric similarity of populations fromAlbania (Lake Shkoder, Tirane) and western Greece(Vlaherna) to the M. s. adriaticus was reported byMacholan and Vohralık (1997). More recently, two deepmitochondrial DNA (mtDNA) lineages were revealed inM. macedonicus, one from Israel and the othercomprising populations from the rest of the speciesrange (Orth et al. 2002). This result, together with thedifferentiation of nuclear genes (though slightly lowerthan for mtDNA), led Orth et al. (2002) to describe theIsraeli clade as a separate subspecies, M. macedonicus
spretoides. Finally, a new mouse species, formerlyreferred to as M. macedonicus, was discovered on theMediterranean island of Cyprus (Cucchi et al. 2002).The new taxon, called Mus cypriacus (the Cyprus
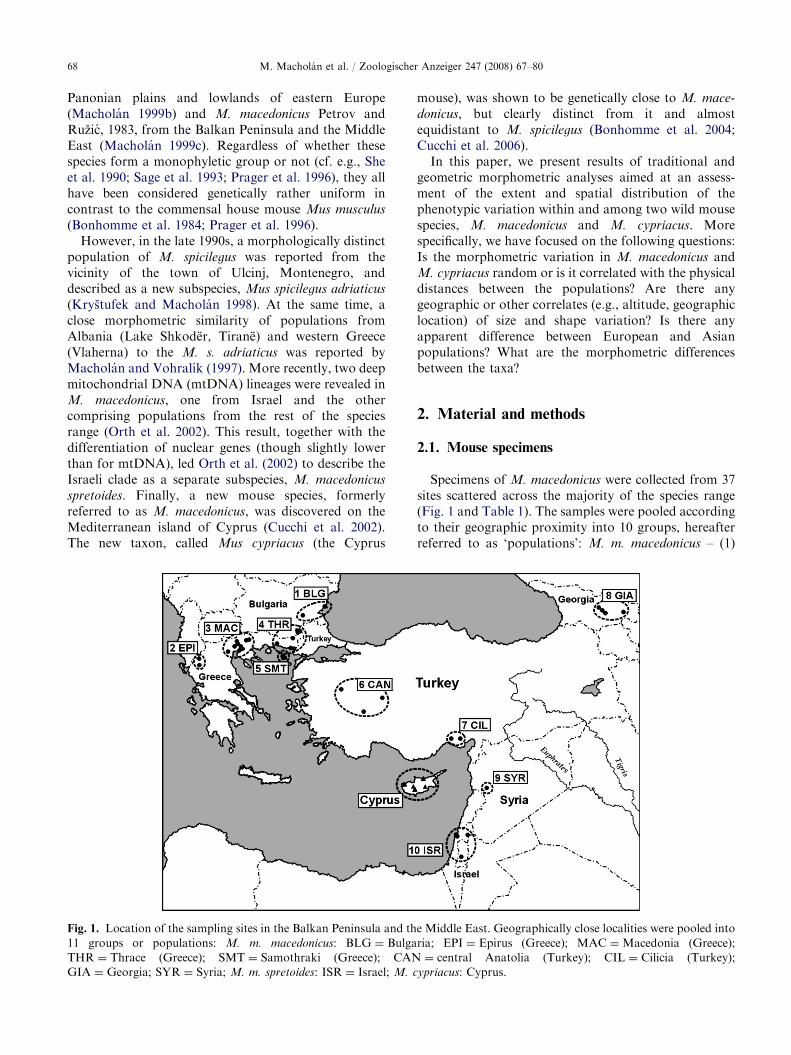
Fig. 1. Location of the sampling sites in the Balkan Peninsula and th
11 groups or populations: M. m. macedonicus: BLG ¼ Bulga
THR ¼ Thrace (Greece); SMT ¼ Samothraki (Greece); CAN
GIA ¼ Georgia; SYR ¼ Syria; M. m. spretoides: ISR ¼ Israel; M. c
mouse), was shown to be genetically close to M. mace-
donicus, but clearly distinct from it and almostequidistant to M. spicilegus (Bonhomme et al. 2004;Cucchi et al. 2006).
In this paper, we present results of traditional andgeometric morphometric analyses aimed at an assess-ment of the extent and spatial distribution of thephenotypic variation within and among two wild mousespecies, M. macedonicus and M. cypriacus. Morespecifically, we have focused on the following questions:Is the morphometric variation in M. macedonicus andM. cypriacus random or is it correlated with the physicaldistances between the populations? Are there anygeographic or other correlates (e.g., altitude, geographiclocation) of size and shape variation? Is there anyapparent difference between European and Asianpopulations? What are the morphometric differencesbetween the taxa?
2. Material and methods
2.1. Mouse specimens
Specimens of M. macedonicus were collected from 37sites scattered across the majority of the species range(Fig. 1 and Table 1). The samples were pooled accordingto their geographic proximity into 10 groups, hereafterreferred to as ‘populations’: M. m. macedonicus – (1)
e Middle East. Geographically close localities were pooled into
ria; EPI ¼ Epirus (Greece); MAC ¼Macedonia (Greece);
¼ central Anatolia (Turkey); CIL ¼ Cilicia (Turkey);
ypriacus: Cyprus.
ARTICLE IN PRESS
Table 1. List of sampling sites, sample sizes (numbers refer to
specimens analyzed with traditional morphometric methods),
and geographic location and approximate altitude of each site
Mus macedonicus macedonicus
1. Bulgaria: Krumovo (N ¼ 7; 421160N; 261240E; 150m a.s.l.);
Banya (N ¼ 5; 421460N; 271490E; 70m);
2. Epirus: Konitsa (N ¼ 2; 401030N; 201460E; 480m); Perama
(N ¼ 3; 391420N; 201510E; 480m);
3. Macedonia: Gephyra (N ¼ 16; 401440N; 221400E; 20m);
Lagadas (N ¼ 3; 401440N; 231050E; 100m); Lagadikia (N ¼ 2;
401390N; 231130E; 100m); Mandres (N ¼ 1; 401520N; 221550E;
90m); Metalliko (N ¼ 3; 411030N; 221500E; 180m);
Rapsomaniki (N ¼ 2; 401340N; 221220E; 20m); Serres (N ¼ 1;
411060N; 231330E; 150m); Strymonikon (N ¼ 3; 411030N;
231210E; 20m); Thessaloniki (N ¼ 2; 401350N; 221580E; 10m);
4. Thrace: Komara (N ¼ 11; 411360N; 261140E; 60m); Ladi
(N ¼ 6; 411280N; 261160E; 50m); Mikro Derio (N ¼ 7;
411200N; 261070E; 170m); Monastirakio (N ¼ 8; 401510N;
261060E; 30m); Porto Lagos (N ¼ 6; 411010N; 251080E; 0m);
Rizia (N ¼ 6; 411370N; 261250E; 50m);
5. Samothraki, Greece: Kamariotissa (N ¼ 17; 401270N;
251310E; 0m); Makrilies (N ¼ 2; 401270N; 251310E; 50m);
6. Central Anatolia: Bardakci (N ¼ 12; 391070N; 281310E;
600m); Karabulut (N ¼ 1; 381280N; 311290E; 1000m);
Suludere (N ¼ 10; 371390N; 301100E; 950m);
7. Cilicia: Adana (N ¼ 10; 371000N; 351190E; 150m); Tarsus
(N ¼ 8; 361550N; 341540E; 150m);
8. Georgia: Alazani (N ¼ 8; 411370N; 451580E; 290m);
Chardakhi (N ¼ 4; 411520N; 441350E; 320m); Krtzanissi
(N ¼ 2; 411360N; 441570E; 250m); Lake Lissi (N ¼ 3; 411440N;
441470E; 250m);
9. Syria: Qattinah (N ¼ 34; 341400N; 361370E; 550m);
M. m. spretoides
10. Israel: Anavim (N ¼ 4; 311490N; 351080E; 320m); Dalyhiat
ah Carmel (N ¼ 1; 321440N; 351020E; 300m); Haifa (N ¼ 1;
321490N; 351000E; 50m); Mt. Carmel (N ¼ 11; 321440N;
351030E; 330m); Ortal (N ¼ 1; 331050N; 351450E; 380m);
Poriyya (N ¼ 1; 321420N; 351370E; 150m);
M. cypriacus
11. Cyprus: Neo Chorio (N ¼ 2; 351010N; 321200E; 300m);
Apsiou (N ¼ 4; 341480N; 331010E; 400m); Paramytha (N ¼ 5;
341460N; 331000E; 300m); Kornos (N ¼ 1; 341560N; 331240E;
305m); St. Hilarion (N ¼ 1; 351190N; 331170E; 570m);
Zeytinlik, Girne (N ¼ 2; 351190N; 331180E; 160m).
M. Macholan et al. / Zoologischer Anzeiger 247 (2008) 67–80 69
Bulgaria (BLG; N [traditional morphometrics/dorsallandmarks/ventral landmarks] ¼ 12/11/11); (2) Epirus,Greece (EPI; N ¼ 5/4/4); (3) Macedonia, Greece (MAC;N ¼ 33/33/33); (4) Thrace, Greece (THR; N ¼ 44/35/33); (5) Samothraki, Greece (SMT; N ¼ 19/19/19); (6)Central Anatolia, Turkey (CAN; N ¼ 23/19/19); (7)Cilicia, southern Turkey (CIL; N ¼ 18/11/10); (8)Georgia (GIA; N ¼ 17/18/18); (9) Syria (SYR; N ¼ 34/32/32); M. m. spretoides; (10) Israel (ISR; N ¼ 19/19/19). M. cypriacus was sampled at six sites locatedthroughout Cyprus, and the samples were pooled into asingle population (Fig. 1): and (11) Cyprus (CYP; 15/15/
15). The whole data set, thus, consisted of 239, 216 and213 specimens, respectively.
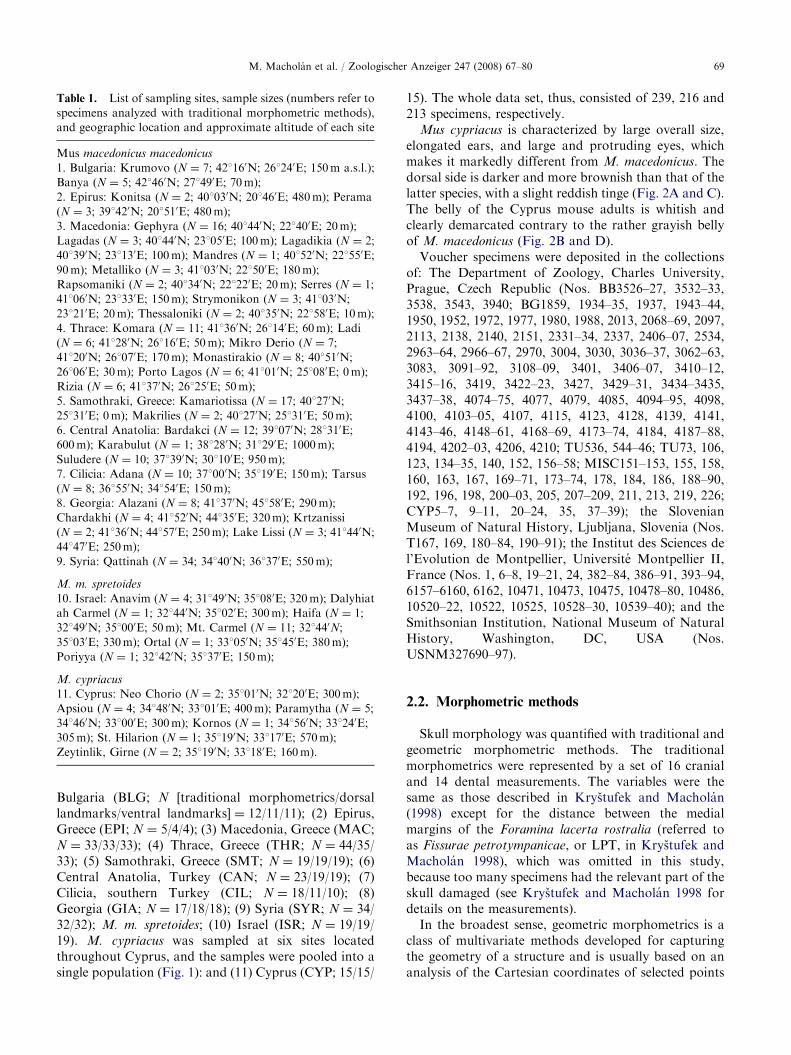
Mus cypriacus is characterized by large overall size,elongated ears, and large and protruding eyes, whichmakes it markedly different from M. macedonicus. Thedorsal side is darker and more brownish than that of thelatter species, with a slight reddish tinge (Fig. 2A and C).The belly of the Cyprus mouse adults is whitish andclearly demarcated contrary to the rather grayish bellyof M. macedonicus (Fig. 2B and D).
Voucher specimens were deposited in the collectionsof: The Department of Zoology, Charles University,Prague, Czech Republic (Nos. BB3526–27, 3532–33,3538, 3543, 3940; BG1859, 1934–35, 1937, 1943–44,1950, 1952, 1972, 1977, 1980, 1988, 2013, 2068–69, 2097,2113, 2138, 2140, 2151, 2331–34, 2337, 2406–07, 2534,2963–64, 2966–67, 2970, 3004, 3030, 3036–37, 3062–63,3083, 3091–92, 3108–09, 3401, 3406–07, 3410–12,3415–16, 3419, 3422–23, 3427, 3429–31, 3434–3435,3437–38, 4074–75, 4077, 4079, 4085, 4094–95, 4098,4100, 4103–05, 4107, 4115, 4123, 4128, 4139, 4141,4143–46, 4148–61, 4168–69, 4173–74, 4184, 4187–88,4194, 4202–03, 4206, 4210; TU536, 544–46; TU73, 106,123, 134–35, 140, 152, 156–58; MISC151–153, 155, 158,160, 163, 167, 169–71, 173–74, 178, 184, 186, 188–90,192, 196, 198, 200–03, 205, 207–209, 211, 213, 219, 226;CYP5–7, 9–11, 20–24, 35, 37–39); the SlovenianMuseum of Natural History, Ljubljana, Slovenia (Nos.T167, 169, 180–84, 190–91); the Institut des Sciences del’Evolution de Montpellier, Universite Montpellier II,France (Nos. 1, 6–8, 19–21, 24, 382–84, 386–91, 393–94,6157–6160, 6162, 10471, 10473, 10475, 10478–80, 10486,10520–22, 10522, 10525, 10528–30, 10539–40); and theSmithsonian Institution, National Museum of NaturalHistory, Washington, DC, USA (Nos.USNM327690–97).
2.2. Morphometric methods
Skull morphology was quantified with traditional andgeometric morphometric methods. The traditionalmorphometrics were represented by a set of 16 cranialand 14 dental measurements. The variables were thesame as those described in Krystufek and Macholan(1998) except for the distance between the medialmargins of the Foramina lacerta rostralia (referred toas Fissurae petrotympanicae, or LPT, in Krystufek andMacholan 1998), which was omitted in this study,because too many specimens had the relevant part of theskull damaged (see Krystufek and Macholan 1998 fordetails on the measurements).
In the broadest sense, geometric morphometrics is aclass of multivariate methods developed for capturingthe geometry of a structure and is usually based on ananalysis of the Cartesian coordinates of selected points
ARTICLE IN PRESS
Fig. 2. Skins of M. cypriacus (A, C) from Paramytha, Cyprus (CY-19, female, leg. M. Macholan) and M. m. macedonicus (B, D)
from Lagadikia, Greece (BG-2135, female, leg. V. Vohralık) from dorsal (A, B) and ventro-lateral (C, D) view. Note the large body
and ears, reddish tinge of the fur on the back, and the clearly demarcated whitish belly of the Cyprus mouse (photo: M. Sandera).
M. Macholan et al. / Zoologischer Anzeiger 247 (2008) 67–8070
called landmarks (Rohlf and Marcus 1993). We used 14landmarks digitized on the dorsal side and 22 landmarkson the ventral side of the skull as shown in Fig. 3. Thepoints correspond to the landmarks of types 1 (discretejuxtaposition of three structures) and 2 (maxima ofcurvature or other morphogenetic processes) accordingto Bookstein (1991). The images of the skulls were takenusing a digital camera and then landmarks weredigitized only on the left side to minimize potentialinfluence of asymmetry. To digitize the ventral side, theskulls were attached to a mat with a piece of Plasticine,and its horizontal orientation was then checked visually.
In addition, 20 ‘sliding semilandmarks’ (Bookstein1997; Rohlf 2005a) were digitized in more or less regularintervals along the outline of the skull in the dorsalprojection: Five sliding semilandmarks between thelandmarks 10 and 11, and 15 sliding semilandmarksbetween the landmarks 8 and 14 as indicated in Fig. 3.Unlike true landmarks, sliding semilandmarks areallowed to move along a curve so as to minimize theamount of shape change between each of the specimensanalyzed and the average of all specimens. For thispurpose, the curves were approximated by the directionof a chord drawn between the adjacent points, and thepoints were positioned iteratively, so as to minimize thebending energy (see below). Both the landmarks and
semilandmarks were digitized with the TpsDig2 pro-gram (Rohlf 2005b). All configurations of landmarksand semilandmarks were superimposed using the gen-eralized least-squares procedure (generalized Procrustesanalysis (GPA); Rohlf and Slice 1990) implemented inthe tpsRelw program (Rohlf 2005a).
2.3. Data analyses
All cranial and dental linear measurements were log-transformed before processing them in order to decreasedifferences in variances between variables. Variation insize and shape, together with morphometric and phylo-genetic relationships among populations, were thenassessed using standard morphometric tools. As skullsize is inherently a multivariate character, principalcomponent analysis was used to detect a size vector. Inorder to avoid potential bias caused by confoundingvariation within and between different groups due topooling character relationships irrespective of group,multiple-group principal components analysis (MGPCA)was used (Thorpe 1983). Canonical variates analysis(CVA) was carried out to reveal morphometric relation-ships among the populations studied while both ordinaryand stepwise discriminant function analysis (DFA) was

ARTICLE IN PRESS
Fig. 3. Positions of the landmarks (dots) on the dorsal (A) and
ventral (B) side of the mouse skull with approximate positions
of 20 semilandmarks (open circles). (A) Dorsal side:
LM1 ¼ rostralmost point of the nasal bone (rhinion);
LM2 ¼ intersection of the naso-frontal suture in the midline
(nasion); LM3 ¼ intersection of the coronal and sagittal
sutures (bregma); LM4 ¼ intersection of the sagittal and
parietal-interparietal sutures (lambda); LM5 ¼ caudal end of
the curvature of the occipital (opistocranion); LM6 ¼ intersec-
tion of the rostral curvature of the nasal process of the incisive
bone (Processus nasalis ossis incisivi) and the nasal bone in the
dorsal projection; LM7 ¼ point of maximum curvature
of the rostro-lateral part of the maxilla; LM8 ¼ rostral end
of the zygomatic plate; LM9 ¼ caudal end of the intersection
of the zygomatic process of the maxilla and the upper limb of
this process; LM10 ¼ lateral end of the naso-frontal suture in
the dorsal projection; LM11 ¼ rostralmost point of the
parietal bone; LM12 ¼ rostral end of the zygomatic process
of the temporal bone (Processus zygomaticus partis squamosae
ossis temporalis); LM13 ¼ intersection of the parietal-inter-
parietal and interparietal-occipital sutures; LM14 ¼ caudo-
lateral end of the occipital bone in the dorsal projection. (B)
Ventral side: LM1 ¼ rostralmost point of the upper incisor in
the midline; LM2 ¼ lateral end of the upper incisor in the
M. Macholan et al. / Zoologischer Anzeiger 247 (2008) 67–80 71
used to assess discrimination between species and/orsubspecies. The whole set of 30 cranial and dentalmeasurements was used (the variables were not log-transformed in this case). Relationships among thepopulations were further summarized through clusteringmethods: Unweighted pair-group method using arith-metic averages (UPGMA) and neighbor-joining (NJ).The Epirus (EPI) population was excluded from bothUPGMA and NJ analyses due to its small sample size.The analyses were performed with Statistica (StatSoft,Inc. 2004; DFA), NTSYS-pc (Rohlf 1997; CVA) andPHYLIP (Felsenstein 2004; UPGMA, NJ).
In order to assess the variation among the landmarkconfigurations, thin-plate spline relative warp analysis(TPSRW; Rohlf 1993) was carried out using tpsRel-w(Rohlf 2005d). This method is equivalent to PCA withvariation weighted by so-called ‘bending energy’. Theprocedures involved in the analysis start by creating abending energy matrix, which is a function of theamount of transformation in shape and the degree oflocalization of this transformation (i.e., the closer twopoints between which the shape change takes place, thehigher the bending energy). Subsequently, partial warpsare created by projecting each specimen onto eigenvec-tors, called principal warps, extracted from the bendingenergy matrix. The zeroth partial warp corresponds toan affine (uniform) shape component whereas all otherpartial warps correspond to non-affine (non-uniform)shape changes. The matrices of partial warp scores(including the affine component) for the dorsal andventral sides, respectively, were used for the standardmultivariate analyses listed above.
When extracting relative warps from partial warps,scaling with a ¼ 0 was used, giving the same weight to allpartial warps, as there was no a priori reason to give greaterweight to either large-scale variation (i.e., variation amongspecimens in the relative positions of widely separatedlandmarks; a40) or small-scale variation (i.e., in thepositions of landmarks that are close to each other; ao0).This approach seems appropriate for most systematicstudies (Rohlf and Corti 2000), including the present one.
dorsal projection; LM3 ¼ rostral end of the rostral palatine
fissure (Fissura palatina); LM4 ¼ caudal end of the rostral
palatine fissure; LM5 ¼ intersection of the maxillo-palatine
suture in the midline; LM6 ¼ center of the Foramen palatinum
majus; LM7 ¼ rostral end of the curvature of the palatine bone
(Lamina horizontalis ossis palatini); LM8 ¼ lateral end of the
basisphenoid-basioccipital suture in the dorsal projection;
LM9 ¼ rostral end of the occipital foramen in the midline
(basion); LM10 ¼ caudal end of the occipital foramen in the
midline (opisthion); LM11 ¼ caudal end of the medial edge of
the occipital condyle; LM12 ¼ rostral end of the zygomatic
plate; LM13 ¼ medial end of the zygomatic plate in the ventral
projection; LM14 ¼ rostral end of the first upper molar in the
dorsal projection; LM15 ¼ lingualmost point of contact of the
first and second upper molars in the ventral projection;
LM16 ¼ lingualmost point of contact of the second
and third upper molars in the ventral projection; LM17 ¼ cau-
dal end of the third upper molar in the ventral projection;
LM18 ¼ rostral end of the Foramen lacertum rostrale;
LM19 ¼ caudal internal maximum curvature of the zygomatic
process of the temporal bone (Processus zygomaticus partis
squamosae ossis temporalis); LM20 ¼ point of juxtaposition of
the tympanic bulla and the muscular process (Processus
muscularis); LM21 ¼ caudal end of the external opening of
the auditory channel; and LM22 ¼ styloglossal process of the
tympanic bulla.
ARTICLE IN PRESSM. Macholan et al. / Zoologischer Anzeiger 247 (2008) 67–8072
The null hypothesis that the shape of the skullchanges isometrically with an increase of size was testedby regressing each partial warp on size using theTpsRegr program (Rohlf 2005c). If the test weresignificant, we would conclude that the skull growth isallometric, i.e., the shape of the skull changes duringgrowth. As a measure of the size of an object (i.e., alandmark configuration), the centroid size was used,defined as the square root of the sum of squareddistances of all landmarks to their centroid (Slice et al.1996). Subsequently, the homogeneity of regressionslopes among the three groups, i.e., M. m. macedonicus,M. m. spretoides, and M. cypriacus, was tested asdescribed in Rohlf (2005c).
In M. macedonicus, isolation by distance was assessedas the correlation between geographic and morpho-metric distance matrices by the Mantel test (Mantel1967) with 5000 permutations using the NTSYS-pcprogram. Mahalanobis and Procrustes distances wereused as measures of morphometric divergence in thetraditional and geometric approaches, respectively.Minimum geographic distances between populationcentroids were measured using the Microsoft EncartaWorld Atlas (1998), avoiding large bodies of water asdescribed in Macholan et al. (2001). Populationcentroids were estimated as weighted means of long-itudes and latitudes of individual sampling sites withineach group.
Finally, a two-block partial least-squares (2B-PLS)analysis was carried out to explore patterns of shapecovariation between the dorsal and ventral sides asdescribed by Rohlf and Corti (2000), using the tpsPLSprogram (Rohlf 2005d). That is, we tried to assess whatcovariation there was between the relative positions oflandmarks on the two projections of the skull. The 2B-PLS method constructs pairs of variables that are linearcombinations of the original variables within each of thetwo sets of variables (i.e., for the dorsal and ventral side,respectively). The combinations are constructed so thatthe new variables account for as much as possible of thecovariation between the two original sets of variables.Landmark coordinates of Procrustes-aligned specimenswere used as shape variables for M. macedonicus andM. cypriacus separately. An advantage of this approachis that the Procrustes shape variables are alreadystandardized for a subsequent 2B-PLS analysis. Semi-landmarks were not used for these analyses.
3. Results
3.1. Measurements
The first multiple-group principal component (PC1),based on 16 cranial measurements, accounted for 43.3%
of the total morphometric variation and seemed toexpress the overall size of the skull, with the populationsfrom Bulgaria, Syria, Cilicia, and Israel being thesmallest and the population from Samothraki thelargest. However, PC1 coefficients differed both in signand magnitude, so that this eigenvector could not beregarded as a size component, and the usual techniqueof size correction by excluding PC1 would have resultedin loss of part of the shape information. Subsequentanalyses were, thus, based on all principal components(‘size-in’ analysis). ‘Size-in’ CVA revealed a largelyrandom pattern.
The second canonical axis (CV2; 25.1% of among-group variation) was probably at least partly related tosize as it contrasted the small skulls of M. m. spretoides
from Israel against the large skulls of M. m. macedonicus
from Samothraki and M. cypriacus from Cyprus. CV1(31.2% of among-group variation), however, is moredifficult to interpret. Finally, CV3 (15.0%) contrastedthe two island populations, namely the one fromSamothraki and the one from Cyprus (M. cypriacus).Importantly, although Mahalanobis distances betweenM. cypriacus and all populations of M. macedonicus
were significant, CVA did not reveal any substantialmorphometric difference between the two species in thesize and shape of the skull.
In contrast to the cranial variables, the first multiple-group principal component extracted from 14 dentalmeasurements (46.8% of the total morphometric varia-tion) can be considered a size vector owing to the samesign and very similar magnitude of PC1 coefficients.According to this component, mouse specimens fromSyria, Israel, and Epirus possess by far the smallestmolars, whereas the largest molars are characteristic ofpopulations from Thrace, Cyprus, Samothraki, andMacedonia. This result is corroborated by the length ofthe upper and lower tooth rows, which is highest inM. cypriacus, as well as by the length of M1 (largest inSamothraki and Cyprus) and M1 (largest in Thrace andSamothraki). Results of both ‘size-in’ and ‘size-out’CVA tended to group geographically close M. macedo-
nicus populations together and showed a rather distinctposition for M. cypriacus as displayed in the NJ treebased on ‘size-out’ Mahalanobis distances betweenpopulation centroids (Fig. 4A). However, the branchingpattern differed between the ‘size-in’ and ‘size-out’analyses, and the position of the Israeli subspecies didnot correspond to its distinct taxonomic and phyloge-netic status.
Within M. macedonicus, the Mantel test revealed asignificant correlation between geographic and morpho-metric distances based on the cranial variables(R ¼ 0.464, p[rand zXobs z] ¼ 0.0128) as well as thedental ones (R ¼ 0.464, p[rand zXobs z] ¼ 0.0116).However, both the cranial and dental morphometricdistances between the European and Asian M. m.

ARTICLE IN PRESS
Fig. 4. Neighbor-joining trees based on Mahalanobis distances between population centroids from the canonical variates analysis of
14 dental measurements with Burnaby size adjustment (A) and 22 ventral landmarks and 20 sliding semilandmarks (B). Population
abbreviations: BLG ¼ Bulgaria; EPI ¼ Epirus (Greece); MAC ¼Macedonia (Greece); THR ¼ Thrace (Greece); SMT ¼ Samo-
thraki (Greece); CAN ¼ central Anatolia (Turkey); CIL ¼ Cilicia (Turkey); GIA ¼ Georgia; SYR ¼ Syria; M. m. spretoides:
ISR ¼ Israel; M. cypriacus: Cyprus. Epirus was excluded from the analyses due to small sample size.
M. Macholan et al. / Zoologischer Anzeiger 247 (2008) 67–80 73
macedonicus populations were not significantly higherthan those between populations within the continents.
DFA revealed all three taxa to be highly significantlydifferentiated, and the classification was correct inall but one case – the only exception being a singleM. m. spretoides specimen incorrectly classified asM. m. macedonicus. When only the M. m. macedonicus
sample from Syria, i.e., the closest population to theIsraeli M. m. spretoides, was considered, the classifica-tion was 100% correct in all cases. The forward stepwiseDFA reduced the number of variables used fordiscrimination to 17, whereas the backward analysisused four measurements only. Since both proceduresyielded 100% correct classification and both shared thesame four variables, we can use the reduced set of fourmeasurements for discriminating between the taxaaccording to the following classification functions:�49.35*LAR+53.31*LAZ+102.41*HCB+371.84*-
LM13I�1180.01 for macedonicus, �67.70*LAR+64.34*LAZ+85.10*HCB+383.29*LM13I�1140.54 forspretoides, and �79.04*LAR+70.74*LAZ+97.20*HCB+413.04*LM13I�1361.14 for M. cypriacus (abbreviations:LAR ¼ rostral width, LAZ ¼ zygomatic width, HCB ¼height of the braincase, LM13I ¼ length of the lowertoothrow).
3.2. Landmarks
3.2.1. Size
The centroid size was computed both for the dorsal(CSD) and ventral (CSV) sides. In agreement with theresults of traditional morphometrics, the largest CS byfar was found in M. cypriacus (Fig. 5A). In M.
macedonicus, the results confirmed the small size of theIsraeli M. m. spretoides; however, the average size of thissubspecies was not significantly different from that ofthe M. m. macedonicus populations nor was it the lowestvalue within the species (Fig. 5B).
Since CS did not discriminate between M. m.
macedonicus and M. m. spretoides (and, hence, the sizedifferences could not be attributed to phylogeny),potential correlates of the skull size were searched for.We tested the significance of the regression of CSDand CSV of individual mouse specimens on the altitude,longitude, and latitude of particular collecting sites. Itwas found that size decreased significantly with altitude(CSD: R ¼ �0.200, p ¼ 0.0046; CSV: R ¼ �0.144,p ¼ 0.0442), whereas it increased with latitude, i.e.,from the south to the north (CSD: R ¼ 0.269, p ¼
0.0001; CSV: R ¼ 0.253, p ¼ 0.0004). Conversely, theregression with longitude was not significant.
3.2.2. Dorsal shape
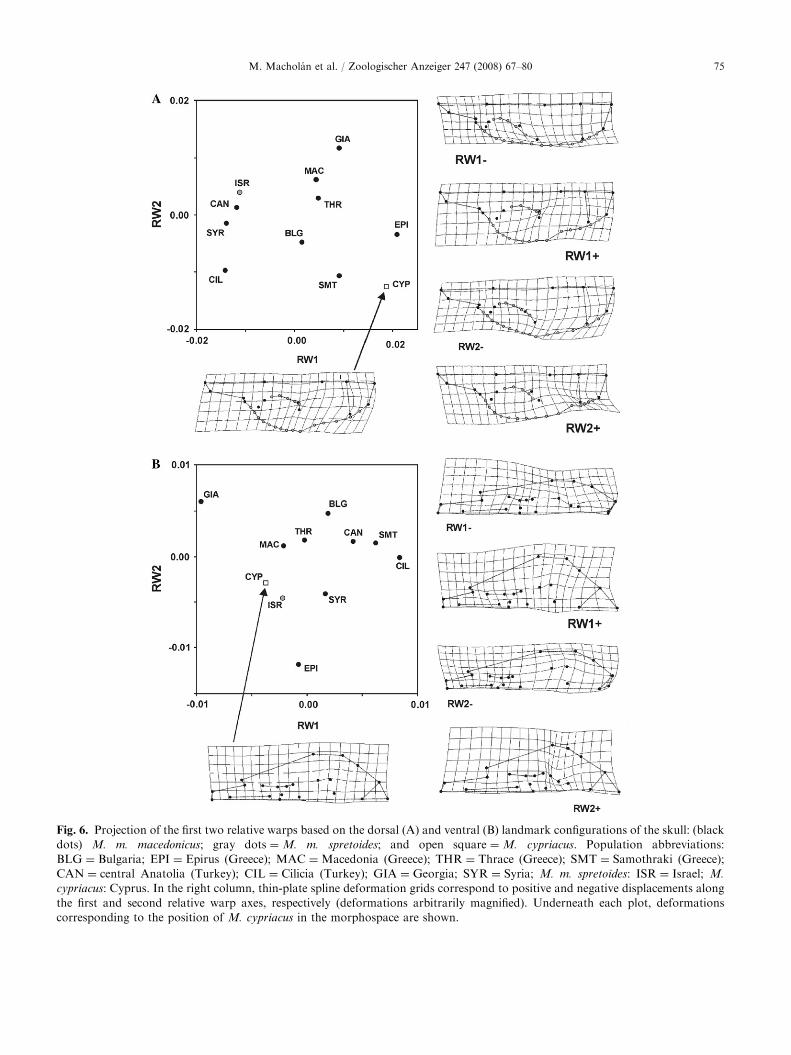
The pattern of morphological variation of the dorsalside of the skull described by the first two relative warpsis shown in Fig. 5a. The shape differences explained bythe RW1 axis are located predominantly in the orbitalarea. As we move from negative to positive RW1 values,the zygomatic arch becomes more convex and protrudesrostrally, whereas the rostral extremity of the squamosalprocess (landmark 12) moves towards the median axis.Thus, the dorsal projection of the orbit has a ratherrounded shape. Moreover, the rostral extremity of thefronto-parietal suture (landmark 11) shifts caudally withincreasing RW1 scores.
While the second relative warp is also partly related toa broadening of the zygomatic arches, the main shape

ARTICLE IN PRESS
Fig. 5. (A) Relative warp 1 scores plotted against the centroid
size for the ventral side of the skull; black dots ¼M. m.
macedonicus; open circles ¼M. m. spretoides; gray tri-
angles ¼M. cypriacus. (B) Box plot showing differences in
the centroid size for the dorsal side of the skull among the M.
macedonicus populations. Population abbreviations:
BLG ¼ Bulgaria; EPI ¼ Epirus (Greece); MAC ¼Macedonia
(Greece); THR ¼ Thrace (Greece); SMT ¼ Samothraki
(Greece); CAN ¼ central Anatolia (Turkey); CIL ¼ Cilicia
(Turkey); GIA ¼ Georgia; SYR ¼ Syria; M. m. spretoides:
ISR ¼ Israel.
M. Macholan et al. / Zoologischer Anzeiger 247 (2008) 67–8074
change described by the RW2 axis is the relative size ofthe braincase (landmarks 13 and 14). Hence, individualswith high RW2 scores (e.g., mice from Georgia [GIA] inFig. 6A) are characterized by relatively broad zygomaticarches and a compressed occipital part of the neurocra-nium. The skull of M. cypriacus (CYP) looks quiterobust, with broad zygomatic arches and braincase(Fig. 5A, bottom left).
The first relative warp was significantly correlatedwith the geographic position of individual collectingsites in M. macedonicus, both with longitude (R ¼�0.229, p ¼ 0.0035) and latitude (R ¼ 0.475,
p ¼ 0.0000). Moreover, RW1 was significantly nega-tively correlated with altitude (R ¼ �0.382, p ¼ 0.0000).This means that from the south-east to the north-westand towards lower altitudes, the skulls of M. macedo-
nicus acquire broad and convex zygomatic arches withthe rostral part of the squamosal process shiftedmedially. On the other hand, the correlation betweengeographic and morphometric (Procrustes) distanceswas not significant (Mantel test: R ¼ 0.161, p[randzXobs z] ¼ 0.2148). In addition, morphometric dis-tances between the European and Asian populationswere not significantly higher than those within thecontinents.
MANOVA revealed highly significant differencesbetween populations (Wilks’ Lambda: 1.5424� 10�4,p ¼ 1.8440� 10�74). The classification matrix is shownin Table 2 (left columns). The rate of correct classifica-tion into predicted groups ranged from �84% in M. m.
spretoides to 100% in M. cypriacus (average: 98.15%).When only M. m. spretoides from Israel and M. m.
macedonicus from Syria (the nearest population studied)were compared, the discrimination was 100% correct,hence individuals from these two Near Eastern popula-tions can be correctly classified using the 14 dorsallandmarks and 20 sliding semilandmarks.
The first canonical variate appeared to separateM. cypriacus from the M. macedonicus populations.The ordination showed a rather central position for theThrace population within M. macedonicus, as this wasconnected with all M. macedonicus populations exceptthat from Cilicia with the minimum-length spanning tree(MST). Similarly, M. cypriacus was rather distinct in theUPGMA and NJ trees, yet the branching pattern withinM. macedonicus appeared rather random (except for asister relationship between the populations from Thraceand Macedonia).
3.2.3. Ventral shape
The first relative warp extracted from positions oflandmarks on the ventral side of the skull explainsdifferences in the position of the zygomatic process ofthe temporal bone and tympanic bulla together with thesize of the occipital foramen (Fig. 6B). Specimens withhigher RW1 scores have relatively broad skulls withlandmarks 19 and 22 shifted laterally; the basion(landmark 9) is shifted rostrally while the opisthion(landmark 10) moves caudally so that the occipitalforamen becomes large. In addition, the size of themolars increases with increasing RW1 scores.
The second relative warp reflects shape differencessimilar to those of RW1, but the changes are morecomplex: The skulls characterized by higher scores havea relatively long rostral part (including a longer rostralpalatine fissure), and the tympanic bulla has shifted in arostro-medial direction (most apparent in landmark 20).
ARTICLE IN PRESS
Fig. 6. Projection of the first two relative warps based on the dorsal (A) and ventral (B) landmark configurations of the skull: (black
dots) M. m. macedonicus; gray dots ¼M. m. spretoides; and open square ¼M. cypriacus. Population abbreviations:
BLG ¼ Bulgaria; EPI ¼ Epirus (Greece); MAC ¼Macedonia (Greece); THR ¼ Thrace (Greece); SMT ¼ Samothraki (Greece);
CAN ¼ central Anatolia (Turkey); CIL ¼ Cilicia (Turkey); GIA ¼ Georgia; SYR ¼ Syria; M. m. spretoides: ISR ¼ Israel; M.
cypriacus: Cyprus. In the right column, thin-plate spline deformation grids correspond to positive and negative displacements along
the first and second relative warp axes, respectively (deformations arbitrarily magnified). Underneath each plot, deformations
corresponding to the position of M. cypriacus in the morphospace are shown.
M. Macholan et al. / Zoologischer Anzeiger 247 (2008) 67–80 75
ARTICLE IN PRESS
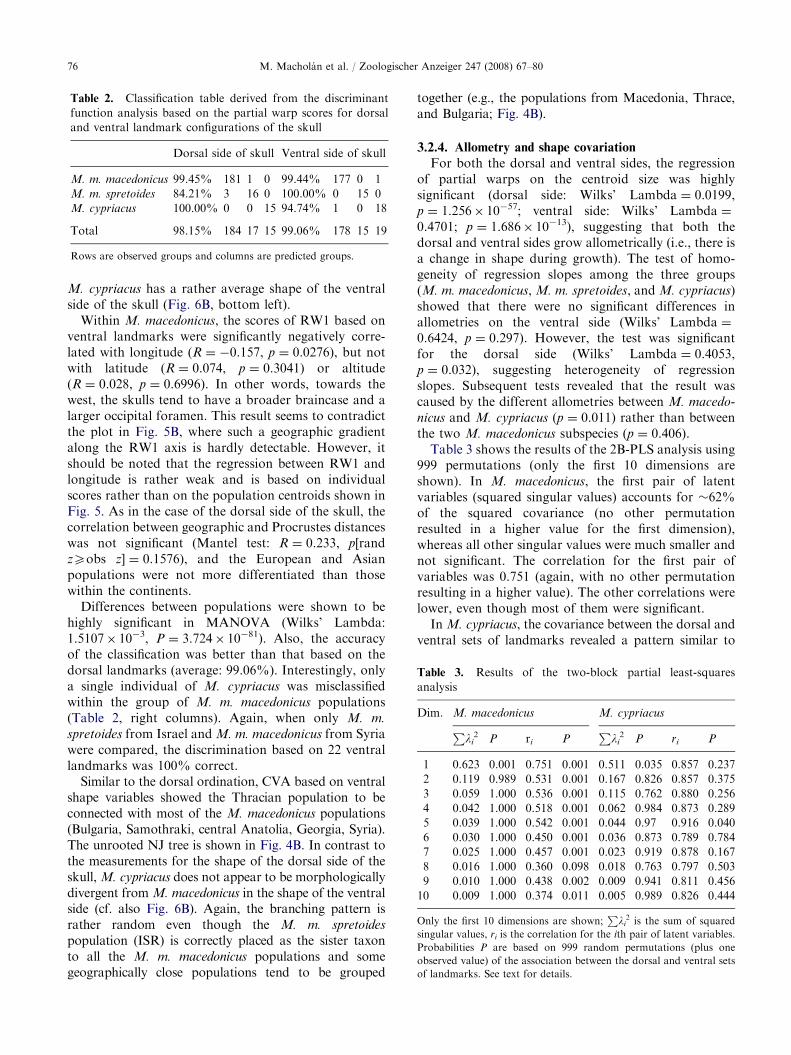
Table 2. Classification table derived from the discriminant
function analysis based on the partial warp scores for dorsal
and ventral landmark configurations of the skull
Dorsal side of skull Ventral side of skull
M. m. macedonicus 99.45% 181 1 0 99.44% 177 0 1
M. m. spretoides 84.21% 3 16 0 100.00% 0 15 0
M. cypriacus 100.00% 0 0 15 94.74% 1 0 18
Total 98.15% 184 17 15 99.06% 178 15 19
Rows are observed groups and columns are predicted groups.
Table 3. Results of the two-block partial least-squares
analysis
Dim. M. macedonicus M. cypriacus
Pli2 P ri P
Pli2 P ri P
1 0.623 0.001 0.751 0.001 0.511 0.035 0.857 0.237
2 0.119 0.989 0.531 0.001 0.167 0.826 0.857 0.375
3 0.059 1.000 0.536 0.001 0.115 0.762 0.880 0.256
4 0.042 1.000 0.518 0.001 0.062 0.984 0.873 0.289
5 0.039 1.000 0.542 0.001 0.044 0.97 0.916 0.040
6 0.030 1.000 0.450 0.001 0.036 0.873 0.789 0.784
7 0.025 1.000 0.457 0.001 0.023 0.919 0.878 0.167
8 0.016 1.000 0.360 0.098 0.018 0.763 0.797 0.503
9 0.010 1.000 0.438 0.002 0.009 0.941 0.811 0.456
10 0.009 1.000 0.374 0.011 0.005 0.989 0.826 0.444
Only the first 10 dimensions are shown;P
li2 is the sum of squared
singular values, ri is the correlation for the ith pair of latent variables.
Probabilities P are based on 999 random permutations (plus one
observed value) of the association between the dorsal and ventral sets
of landmarks. See text for details.
M. Macholan et al. / Zoologischer Anzeiger 247 (2008) 67–8076
M. cypriacus has a rather average shape of the ventralside of the skull (Fig. 6B, bottom left).
Within M. macedonicus, the scores of RW1 based onventral landmarks were significantly negatively corre-lated with longitude (R ¼ �0.157, p ¼ 0.0276), but notwith latitude (R ¼ 0.074, p ¼ 0.3041) or altitude(R ¼ 0.028, p ¼ 0.6996). In other words, towards thewest, the skulls tend to have a broader braincase and alarger occipital foramen. This result seems to contradictthe plot in Fig. 5B, where such a geographic gradientalong the RW1 axis is hardly detectable. However, itshould be noted that the regression between RW1 andlongitude is rather weak and is based on individualscores rather than on the population centroids shown inFig. 5. As in the case of the dorsal side of the skull, thecorrelation between geographic and Procrustes distanceswas not significant (Mantel test: R ¼ 0.233, p[randzXobs z] ¼ 0.1576), and the European and Asianpopulations were not more differentiated than thosewithin the continents.
Differences between populations were shown to behighly significant in MANOVA (Wilks’ Lambda:1.5107� 10�3, P ¼ 3.724� 10�81). Also, the accuracyof the classification was better than that based on thedorsal landmarks (average: 99.06%). Interestingly, onlya single individual of M. cypriacus was misclassifiedwithin the group of M. m. macedonicus populations(Table 2, right columns). Again, when only M. m.
spretoides from Israel and M. m. macedonicus from Syriawere compared, the discrimination based on 22 ventrallandmarks was 100% correct.
Similar to the dorsal ordination, CVA based on ventralshape variables showed the Thracian population to beconnected with most of the M. macedonicus populations(Bulgaria, Samothraki, central Anatolia, Georgia, Syria).The unrooted NJ tree is shown in Fig. 4B. In contrast tothe measurements for the shape of the dorsal side of theskull, M. cypriacus does not appear to be morphologicallydivergent from M. macedonicus in the shape of the ventralside (cf. also Fig. 6B). Again, the branching pattern israther random even though the M. m. spretoides
population (ISR) is correctly placed as the sister taxonto all the M. m. macedonicus populations and somegeographically close populations tend to be grouped
together (e.g., the populations from Macedonia, Thrace,and Bulgaria; Fig. 4B).
3.2.4. Allometry and shape covariation
For both the dorsal and ventral sides, the regressionof partial warps on the centroid size was highlysignificant (dorsal side: Wilks’ Lambda ¼ 0.0199,p ¼ 1.256� 10�57; ventral side: Wilks’ Lambda ¼0.4701; p ¼ 1.686� 10�13), suggesting that both thedorsal and ventral sides grow allometrically (i.e., there isa change in shape during growth). The test of homo-geneity of regression slopes among the three groups(M. m. macedonicus, M. m. spretoides, and M. cypriacus)showed that there were no significant differences inallometries on the ventral side (Wilks’ Lambda ¼0.6424, p ¼ 0.297). However, the test was significantfor the dorsal side (Wilks’ Lambda ¼ 0.4053,p ¼ 0.032), suggesting heterogeneity of regressionslopes. Subsequent tests revealed that the result wascaused by the different allometries between M. macedo-
nicus and M. cypriacus (p ¼ 0.011) rather than betweenthe two M. macedonicus subspecies (p ¼ 0.406).
Table 3 shows the results of the 2B-PLS analysis using999 permutations (only the first 10 dimensions areshown). In M. macedonicus, the first pair of latentvariables (squared singular values) accounts for �62%of the squared covariance (no other permutationresulted in a higher value for the first dimension),whereas all other singular values were much smaller andnot significant. The correlation for the first pair ofvariables was 0.751 (again, with no other permutationresulting in a higher value). The other correlations werelower, even though most of them were significant.
In M. cypriacus, the covariance between the dorsal andventral sets of landmarks revealed a pattern similar to
ARTICLE IN PRESS
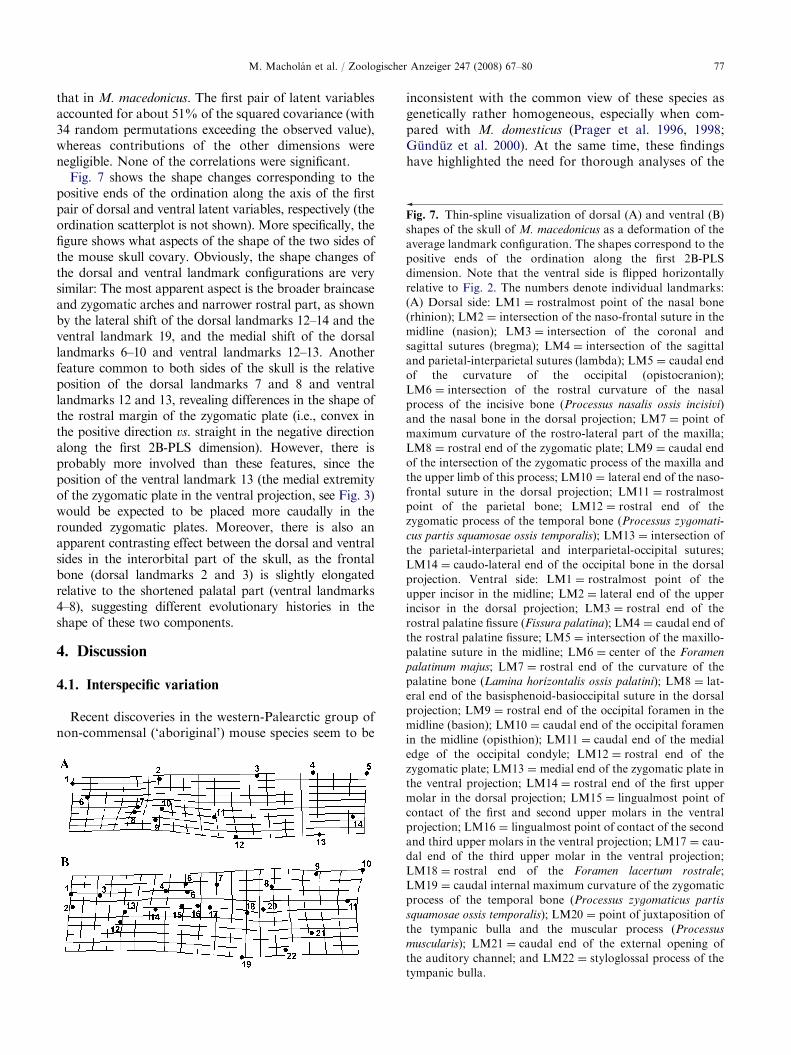
Fig. 7. Thin-spline visualization of dorsal (A) and ventral (B)
shapes of the skull of M. macedonicus as a deformation of the
average landmark configuration. The shapes correspond to the
positive ends of the ordination along the first 2B-PLS
dimension. Note that the ventral side is flipped horizontally
relative to Fig. 2. The numbers denote individual landmarks:
(A) Dorsal side: LM1 ¼ rostralmost point of the nasal bone
(rhinion); LM2 ¼ intersection of the naso-frontal suture in the
midline (nasion); LM3 ¼ intersection of the coronal and
sagittal sutures (bregma); LM4 ¼ intersection of the sagittal
and parietal-interparietal sutures (lambda); LM5 ¼ caudal end
of the curvature of the occipital (opistocranion);
LM6 ¼ intersection of the rostral curvature of the nasal
process of the incisive bone (Processus nasalis ossis incisivi)
and the nasal bone in the dorsal projection; LM7 ¼ point of
maximum curvature of the rostro-lateral part of the maxilla;
LM8 ¼ rostral end of the zygomatic plate; LM9 ¼ caudal end
of the intersection of the zygomatic process of the maxilla and
the upper limb of this process; LM10 ¼ lateral end of the naso-
frontal suture in the dorsal projection; LM11 ¼ rostralmost
point of the parietal bone; LM12 ¼ rostral end of the
zygomatic process of the temporal bone (Processus zygomati-
cus partis squamosae ossis temporalis); LM13 ¼ intersection of
the parietal-interparietal and interparietal-occipital sutures;
LM14 ¼ caudo-lateral end of the occipital bone in the dorsal
projection. Ventral side: LM1 ¼ rostralmost point of the
upper incisor in the midline; LM2 ¼ lateral end of the upper
incisor in the dorsal projection; LM3 ¼ rostral end of the
rostral palatine fissure (Fissura palatina); LM4 ¼ caudal end of
the rostral palatine fissure; LM5 ¼ intersection of the maxillo-
palatine suture in the midline; LM6 ¼ center of the Foramen
palatinum majus; LM7 ¼ rostral end of the curvature of the
palatine bone (Lamina horizontalis ossis palatini); LM8 ¼ lat-
eral end of the basisphenoid-basioccipital suture in the dorsal
projection; LM9 ¼ rostral end of the occipital foramen in the
midline (basion); LM10 ¼ caudal end of the occipital foramen
in the midline (opisthion); LM11 ¼ caudal end of the medial
M. Macholan et al. / Zoologischer Anzeiger 247 (2008) 67–80 77
that in M. macedonicus. The first pair of latent variablesaccounted for about 51% of the squared covariance (with34 random permutations exceeding the observed value),whereas contributions of the other dimensions werenegligible. None of the correlations were significant.
Fig. 7 shows the shape changes corresponding to thepositive ends of the ordination along the axis of the firstpair of dorsal and ventral latent variables, respectively (theordination scatterplot is not shown). More specifically, thefigure shows what aspects of the shape of the two sides ofthe mouse skull covary. Obviously, the shape changes ofthe dorsal and ventral landmark configurations are verysimilar: The most apparent aspect is the broader braincaseand zygomatic arches and narrower rostral part, as shownby the lateral shift of the dorsal landmarks 12–14 and theventral landmark 19, and the medial shift of the dorsallandmarks 6–10 and ventral landmarks 12–13. Anotherfeature common to both sides of the skull is the relativeposition of the dorsal landmarks 7 and 8 and ventrallandmarks 12 and 13, revealing differences in the shape ofthe rostral margin of the zygomatic plate (i.e., convex inthe positive direction vs. straight in the negative directionalong the first 2B-PLS dimension). However, there isprobably more involved than these features, since theposition of the ventral landmark 13 (the medial extremityof the zygomatic plate in the ventral projection, see Fig. 3)would be expected to be placed more caudally in therounded zygomatic plates. Moreover, there is also anapparent contrasting effect between the dorsal and ventralsides in the interorbital part of the skull, as the frontalbone (dorsal landmarks 2 and 3) is slightly elongatedrelative to the shortened palatal part (ventral landmarks4–8), suggesting different evolutionary histories in theshape of these two components.
4. Discussion
4.1. Interspecific variation
Recent discoveries in the western-Palearctic group ofnon-commensal (‘aboriginal’) mouse species seem to be
inconsistent with the common view of these species asgenetically rather homogeneous, especially when com-pared with M. domesticus (Prager et al. 1996, 1998;Gunduz et al. 2000). At the same time, these findingshave highlighted the need for thorough analyses of the
edge of the occipital condyle; LM12 ¼ rostral end of the
zygomatic plate; LM13 ¼ medial end of the zygomatic plate in
the ventral projection; LM14 ¼ rostral end of the first upper
molar in the dorsal projection; LM15 ¼ lingualmost point of
contact of the first and second upper molars in the ventral
projection; LM16 ¼ lingualmost point of contact of the second
and third upper molars in the ventral projection; LM17 ¼ cau-
dal end of the third upper molar in the ventral projection;
LM18 ¼ rostral end of the Foramen lacertum rostrale;
LM19 ¼ caudal internal maximum curvature of the zygomatic
process of the temporal bone (Processus zygomaticus partis
squamosae ossis temporalis); LM20 ¼ point of juxtaposition of
the tympanic bulla and the muscular process (Processus
muscularis); LM21 ¼ caudal end of the external opening of
the auditory channel; and LM22 ¼ styloglossal process of the
tympanic bulla.
ARTICLE IN PRESSM. Macholan et al. / Zoologischer Anzeiger 247 (2008) 67–8078
genetic and morphological variation within and amongaboriginal mouse species. Although some morphometricanalyses were presented in connection with the descrip-tion of M. macedonicus spretoides (Orth et al. 2002) andM. cypriacus (Cucchi et al. 2006), we have extendedthese studies by analyzing populations sampled from themajor part of the species range (M. macedonicus) andfrom the entire Island of Cyprus including the northernTurkish areas (M. cypriacus). We used both traditionaland geometric morphometric tools including a rathernovel application of sliding semilandmarks.
One of the tasks of morphometric studies is to searchfor possible phylogenetic, geographical and ecologicalcorrelates of phenotypic variation within species. In the
context of the present study, we asked whether thepattern of morphometric variation among populationsof the Balkan short-tailed mouse, M. macedonicus,reflected the presumed phylogenetic history of thespecies or, rather, geological events, such as theseparation of Europe and Asia. An alternative hypoth-esis might by a clinal character of variation, following,for example, Bergman’s rule. The latter was suggestedby Orth et al. (2002), who found the southern subspeciesM. m. spretoides to be smaller than the northernpopulations of M. m. macedonicus from Bulgaria andGeorgia, and concluded this to be in agreement withBergman’s rule. Even though we showed a significantpositive correlation between centroid size (CS) andlatitude, as predicted by Bergman’s rule, CS of theIsraeli M. m. spretoides population was not the smallestamong the samples analyzed in this study. Moreover,the correlation between CS and altitude was found to benegative, indicating that the mice were smaller at higheraltitudes. One possible explanation of this phenomenonmay be better nutritional conditions in lowlands relativeto hilly areas.
The clinal character of morphometric variation inM. macedonicus is not limited to size as was shownabove (see Results). Conversely, significant correlationsbetween geographic and morphometric distances werefound only in traditional measurements, both cranialand dental, but not in dorsal and ventral landmarkconfigurations of the skull. In addition, morphometricdifferences between Asian and European M. macedoni-
cus populations were not significantly higher than thosewithin the continents.
The weak concordance between the pattern ofmorphometric variation and the pattern expected fromthe presumed history of M. macedonicus (Krystufek andMacholan 1998; Macholan et al. 2007) seems tocorroborate the results of molecular studies sugges-ting weak phylogeographic structuring in this species
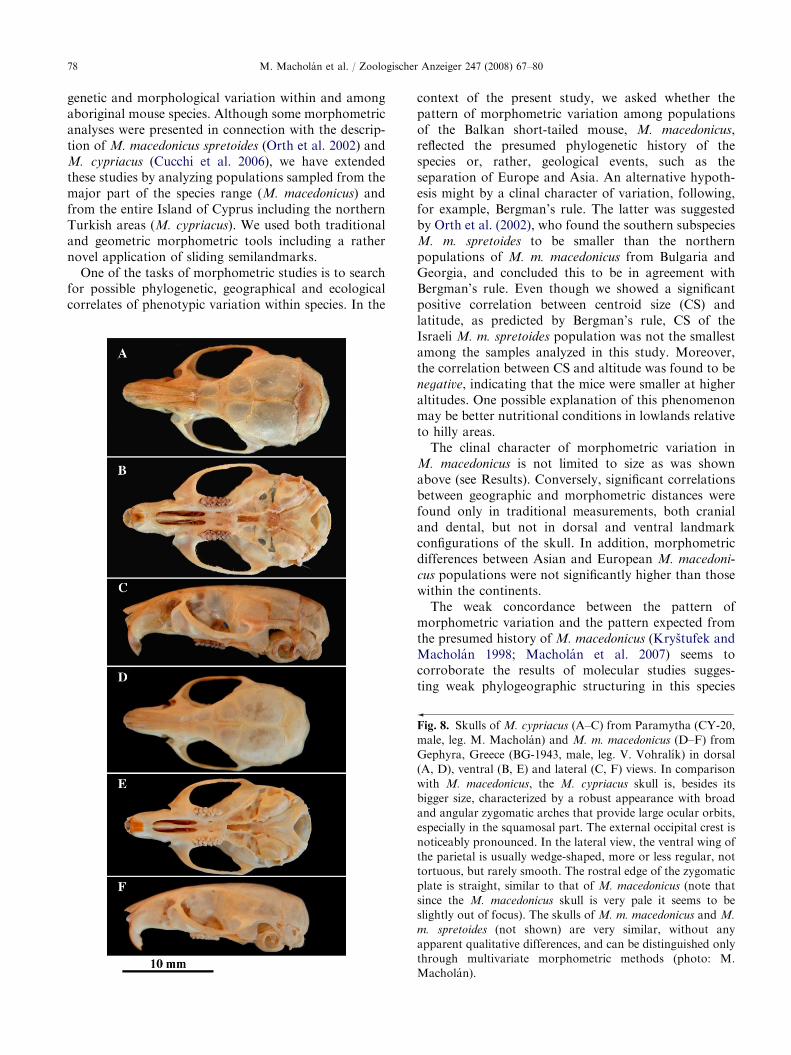
Fig. 8. Skulls of M. cypriacus (A–C) from Paramytha (CY-20,
male, leg. M. Macholan) and M. m. macedonicus (D–F) from
Gephyra, Greece (BG-1943, male, leg. V. Vohralık) in dorsal
(A, D), ventral (B, E) and lateral (C, F) views. In comparison
with M. macedonicus, the M. cypriacus skull is, besides its
bigger size, characterized by a robust appearance with broad
and angular zygomatic arches that provide large ocular orbits,
especially in the squamosal part. The external occipital crest is
noticeably pronounced. In the lateral view, the ventral wing of
the parietal is usually wedge-shaped, more or less regular, not
tortuous, but rarely smooth. The rostral edge of the zygomatic
plate is straight, similar to that of M. macedonicus (note that
since the M. macedonicus skull is very pale it seems to be
slightly out of focus). The skulls of M. m. macedonicus and M.
m. spretoides (not shown) are very similar, without any
apparent qualitative differences, and can be distinguished only
through multivariate morphometric methods (photo: M.
Macholan).
ARTICLE IN PRESSM. Macholan et al. / Zoologischer Anzeiger 247 (2008) 67–80 79
(Macholan et al. 2007). In contrast, the phylogeneticsignal (‘phylogenetic inertia’) was found to be strongerin dental characters than in cranial ones in agreementwith the results of Macholan (2006), who found asignificant correlation between phylogenetic and mor-phometric distances indicating that phylogenetic historycontributes about 80% to the shape differences in thefirst upper molar within the genus Mus.
Both in M. macedonicus and M. cypriacus, the patternof morphometric covariance between the dorsal andventral side of the skull was largely one-dimensional,i.e., the first dimension of the 2B-PLS analysis describedthe major part of this pattern. A similar result wasreported in house mice by Rohlf and Corti (2000), whorevealed a contrasting effect in the rostral and palatalparts of the skull and suggested a differing evolution inshape in these components, resulting in differentfunctionality. In the present study, both sides of theskull were shown to covary in many aspects (i.e., thewidth of the braincase, zygomatic arches and rostralpart of the skull, as well as the shape of the zygomaticplate). In contrast, there were also some differencesbetween the two sides, for instance, in the zygomaticplate or interorbital part of the skull, suggestingdifferent rates or directions in shape change in thesecomponents. However, a functional interpretation ofthese differences is not easy.
4.2. Differences between taxa
The observed close morphometric similarity amongpopulations of M. macedonicus agrees with Orth et al.(2002), who found a great similarity in shape betweenM. m. spretoides and M. m. macedonicus and concludedthat, while the former subspecies could be distinguishedfrom the latter mainly according to its smaller size,reliable discrimination of the two taxa was possible onlythrough the multivariate morphometric approach de-scribed by Gerasimov et al. (1990). However, we haveshown in this study that reliable discrimination of M. m.
spretoides and M. m. macedonicus is possible with as fewas four measurements describing the general shape ofthe skull (i.e., rostral width, zygomatic width, height ofthe braincase, and length of the lower tooth row).Likewise, the percentage of correct classification basedon dorsal and ventral landmark configurations of theskull was very high, reaching 100% when only NearEast populations were used as representatives of the twosubspecies (i.e., M. m. macedonicus from Syria and M.
m. spretoides from Israel).As expected, morphometric differentiation of M.
cypriacus from M. macedonicus is much easier thanbetween the two subspecies of M. macedonicus. The mostdiagnostic trait of M. cypriacus is the great size of its skull.This phenomenon can be ascribed to island gigantism, as
acknowledged also by Cucchi et al. (2006). Besides itsbigger size, the skull is characterized by a generalrobustness with broad and angular zygomatic arches, thistrait being more pronounced in the caudal, squamosalpart. The zygomatic plate is wide and rostrally displaced(Fig. 8). In contrast, the shape of the ventral side of theskull appears rather average among the samples analyzedin this study. Thus, the original description by Cucchiet al. (2006) was largely confirmed by our analysis ofmaterials sampled from six sites covering not only theTroodos Mountains in central Cyprus and adjacent areasas in Cucchi et al. (2002), but also from the north-westernand northern Turkish parts of the island, as well as byusing two sets of semilandmarks describing parts of theskull that do not have reliable landmarks.
Acknowledgements
We are grateful to J.-C. Auffray (Universite Mon-tpellier II), B. Krystufek (Slovenian Museum of NaturalHistory, Ljubljana), and the National Museum ofNatural History (Smithsonian Institution, Washington,DC) for kindly providing skeletal materials; toD. Hardekopf (University of California at San Diego)for language corrections; and to D.G. Homberger andan anonymous reviewer for useful suggestions. Thisstudy was supported partly by Grant no. A6045307 ofthe Grant Agency of the Academy of Sciences of theCzech Republic and partly by the Czech ScienceFoundation Grant nos. 206/06/0707 and 206/05/2334.
References
Bonhomme, F., Catalan, J., Britton-Davidian, J., Chapman,
V.M., Moriwaki, K., Nevo, E., Thaler, L., 1984. Biochem-
ical diversity and evolution in the genus Mus. Biochem.
Genet. 22, 275–303.
Bonhomme, F., Orth, A., Cucchi, T., Hadjisterkotis, E., Vigne,
J.-D., Auffray, J.-C., 2004. Decouverte d’une nouvelle
espece de souris sur l’ıle de Chypre. C. R. Biol. 327,
501–507.
Bookstein, F.L., 1991. Morphometric Tools for Landmark
Data. Cambridge University Press, New York.
Bookstein, F.L., 1997. Landmark methods for forms without
landmarks: morphometrics of group differences in outline
shape. Med. Image Anal. 1, 225–243.
Chevret, P., Veyrunes, F., Britton-Davidian, J., 2005. Mole-
cular phylogeny of the genus Mus (Rodentia: Murinae)
based on mitochondrial and nuclear data. Biol. J. Linn.
Soc. 84, 417–427.
Cucchi, T., Vigne, J.-D., Auffray, J.-C., Croft, P., Peltenburg,
E., 2002. Introduction involontaire de la souris domestique
(Mus musculus domesticus) a Chypre des le Neolithique
preceramique ancien (fin IXe et VIIIe millenaire av. J.-C.).
C. R. Palevol. 1, 235–241.
ARTICLE IN PRESSM. Macholan et al. / Zoologischer Anzeiger 247 (2008) 67–8080
Cucchi, T., Orth, A., Auffray, J.-C., Renaud, S., Fabre, L.,
Catalan, J., Hadjisterkotis, E., Bonhomme, F., Vigne, J.-
D., 2006. A new endemic species of the subgenus Mus
(Rodentia, Mammalia) on the Island of Cyprus. Zootaxa
(1241), 1–36.
Felsenstein, J., 2004. PHYLIP: phylogeny inference package,
version 3.6, University of Washington.
Gerasimov, S., Nikolov, H., Mihailova, V., Auffray, J.-C.,
Bonhomme, F., 1990. Morphometric stepwise discriminant
analysis of the five genetically determined European taxa of
the genus Mus. Biol. J. Linn. Soc 41, 47–64.
Gunduz, I., Tez, C., Malikov, V., Vaziri, A., Polyakov, A.V.,
Searle, J.B., 2000. Mitochondrial DNA and chromosomal
studies of wild mice (Mus) from Turkey and Iran. Heredity
84, 458–467.
Krystufek, B., Macholan, M., 1998. Morphological differen-
tiation in Mus spicilegus and the taxonomic status of
mound-building mice from the Adriatic coast of Yugosla-
via. J. Zool. 245, 185–196.
Lundrigan, B.L., Jansa, S.A., Tucker, P.K., 2002. Phylogenetic
relationships in the genus Mus, based on paternally,
maternally, and biparentally inherited characters. Syst.
Biol. 51, 410–431.
Macholan, M., 1999a. Mus spretus Lataste, 1883. In: Mitchell-
Jones, A.J., Amori, J., Bogdanowicz, W., Krystufek, B.,
Reijnders, P.J.H., Spitzenberger, F., Stubbe, M., Thissen,
J.B.M., Vohralık, V., Zima, J. (Eds.), The Atlas of European
Mammals. Academic Press, London, pp. 290–291.
Macholan, M., 1999b. Mus spicilegus Petenyi, 1882. In:
Mitchell-Jones, A.J., Amori, J., Bogdanowicz, W., Krystu-
fek, B., Reijnders, P.J.H., Spitzenberger, F., Stubbe, M.,
Thissen, J.B.M., Vohralık, V., Zima, J. (Eds.), The Atlas
of European Mammals. Academic Press, London,
pp. 288–289.
Macholan, M., 1999c. Mus macedonicus Petrov & Ruzic, 1983.
In: Mitchell-Jones, A.J., Amori, J., Bogdanowicz, W.,
Krystufek, B., Reijnders, P.J.H., Spitzenberger, F., Stubbe,
M., Thissen, J.B.M., Vohralık, V., Zima, J. (Eds.), The
Atlas of European Mammals. Academic Press, London,
pp. 284–285.
Macholan, M., 2006. A geometric morphometric analysis of
the shape of the first upper molar in mice of the genus Mus
(Muridae, Rodentia). J. Zool. 270, 672–681.
Macholan, M., Vohralık, V., 1997. Note on the distribution of
Mus spicilegus (Mammalia: Rodentia) in the south-western
Balkans. Acta Soc. Zool. Bohem. 61, 219–226.
Macholan, M., Filippucci, M.G., Zima, J., 2001. Genetic
variation and zoogeography of pine voles of the Microtus
subterraneus/majori group in Europe and Asia Minor.
J. Zool. 255, 31–42.
Macholan, M., Vyskocilova, M., Bonhomme, F., Krystufek,
B., Orth, A., Vohralık, V., 2007. Genetic variation and
phylogeography of free-living mouse species (genus Mus) in
the Balkans and the Middle East. Mol. Ecol, in press.
Mantel, N.A., 1967. The detection of disease clustering and a
generalised regression approach. Cancer Res. 27, 209–220.
Orth, A., Auffray, J.-C., Bonhomme, F., 2002. Two deeply
divergent mitochondrial clades in the wild mouse Mus
macedonicus reveal multiple glacial refuges south of
Caucasus. Heredity 89, 353–357.
Prager, E.M., Tichy, H., Sage, R.D., 1996. Mitochondrial
DNA sequence variation in the eastern house mouse, Mus
musculus: comparison with other house mouse mice and
report of 75-bp tandem repeat. Genetics 143, 427–446.
Prager, E.M., Orrego, C., Sage, R.D., 1998. Genetic variation
and phylogeography of Central Asian and other house
mice, including a major new mitochondrial lineage in
Yemen. Genetics 150, 835–861.
Rohlf, F.J., 1993. Relative warp analysis and example of its
application to mosquito wings. In: Marcus, L.F., Bello, E.,
Garcia-Valdecasas, A. (Eds.), Contribution to Morpho-
metrics. Museo Nationale de Ciencias Naturales, Madrid,
pp. 131–159.
Rohlf, F.J., 1997. NTSYS-pc: Numerical Taxonomy and
Multivariate Analysis System, Version 2.00. Exeter Soft-
ware, Setauket, NY.
Rohlf, F.J., 2005a. tpsRelw, relative warps analysis, version 5/
13/05, Department of Ecology and Evolution, State
University of New York at Stony Brook.
Rohlf, F.J., 2005b. tpsDig2, version 2/11/05, Department of
Ecology and Evolution, State University of New York at
Stony Brook.
Rohlf, F.J., 2005c. tpsRegr, version 9/30/05, Department of
Ecology and Evolution, State University of New York at
Stony Brook.
Rohlf, F.J., 2005d. tpsPLS, version 2/18/05, Department of
Ecology and Evolution, State University of New York at
Stony Brook.
Rohlf, F.J., Corti, M., 2000. Use of two-block partial least-
squares to study covariation in shape. Syst. Biol. 49,
740–753.
Rohlf, F.J., Marcus, L.F., 1993. A revolution in morpho-
metrics. Trends Ecol. Evol. 8, 129–132.
Rohlf, F.J., Slice, D.E., 1990. Extensions of the Procrustes
method for the optimal superimpositions of landmarks.
Syst. Zool. 39, 40–59.
Sage, R.D., 1981. Wild mice. In: Foster, H.L., Small, J.D.,
Fox, J.G. (Eds.), The Mouse in Biomedical Research.
Academic Press, New York, pp. 39–90.
Sage, R.D., Atchley, W.R., Capanna, E., 1993. House mice as
models in systematic biology. Syst. Biol. 42, 523–561.
She, J.X., Bonhomme, F., Boursot, P., Thaler, L., Catzeflis, F.,
1990. Molecular phylogenies in the genus Mus: comparative
analysis of electrophoretic scnDNA hybridisation and
mtDNA RFLP data. Biol. J. Linn. Soc. 41, 83–103.
Slice, D.E., Bookstein, F.L., Marcus, L.F., Rohlf, F.J., 1996.
Appendix I. A glossary of geometric morphometrics. In:
Marcus, L.F., Corti, M., Loy, A., Naylor, G.J.P., Slice,
D.E. (Eds.), Advances in Morphometrics. Plenum Press,
New York, London, pp. 531–551.
StatSoft, Inc., 2004. Statistica Cz [Software system for data
analysis], version 7. /www.StatSoft.CzS.
Thorpe, R.S., 1983. A biometric study of the effects of
growth on the analysis of geographic variation: tooth
number in Green geckos (Reptilia: Phelsuma). J. Zool. 201,
13–26.
Copyright © 2022 FDOKUMEN


![Early identification and phenetic analysis of eight species of subtribe Cassiineae [Leguminosae : Caesalpinioidae] found in Tripura in relation to their seedling morphology.](https://static.fdokumen.com/doc/165x107/6322bbe8050768990e0ffde2/early-identification-and-phenetic-analysis-of-eight-species-of-subtribe-cassiineae.jpg)