Geochemical Constraints for the Genesis of Post-collisional Magmatism and the Geodynamic Evolution...
37
Geochemical Constraints for the Genesis of Post-collisional Magmatism and the Geodynamic Evolution of the Northern Taiwan Region KUO-LUNG WANG 1,2 * , SUN-LIN CHUNG 1 , SUZANNE Y. O’REILLY 2 , SHEN-SU SUN 3 , RYUICHI SHINJO 4 AND CHANG-HWA CHEN 5 1 DEPARTMENT OF GEOSCIENCES, NATIONAL TAIWAN UNIVERSITY, PO BOX 13-318, TAIPEI 106, TAIWAN 2 ARC NATIONAL KEY CENTRE FOR THE GEOCHEMICAL EVOLUTION AND METALLOGENY OF CONTINENTS (GEMOC), DEPARTMENT OF EARTH AND PLANETARY SCIENCES, MACQUARIE UNIVERSITY, SYDNEY, N.S.W. 2109, AUSTRALIA 3 16 GIFFEN CLOSE, HOLT, CANBERRA, A.C.T. 2615, AUSTRALIA 4 DEPARTMENT OF PHYSICS AND EARTH SCIENCES, UNIVERSITY OF THE RYUKYUS, OKINAWA, JAPAN 5 INSTITUTE OF EARTH SCIENCES, ACADEMIA SINICA, PO BOX 1-55, NANKANG, TAIPEI, TAIWAN RECEIVED NOVEMBER 14, 2002; ACCEPTED OCTOBER 21, 2003 Taiwan is an active mountain belt created by the oblique collision of the northern Luzon arc with Asia. Late Pliocene extensional collapse of the northern Taiwan mountain belt (NTMB) was accompanied by magmatism that formed the Northern Taiwan Volcanic Zone (NTVZ; 28---02 Ma). The geochemical characteristics of the NTVZ magmas can thus provide constraints both for the mantle source composition and the geodynamic processes operating in the late orogenic stage of the region. The NTVZ volcanic rocks consist dominantly of calc-alkaline andesites and basalts, along with sub- ordinate but heterogeneous lavas including low-K, shoshonitic and ultrapotassic magmas. From the NE to the SW in the NTVZ, the magmas show systematic compositional variations from low-K to calc-alkaline and then shoshonitic. This spatial geochemical varia- tion, characterized by southwesterly increase in potassium and incompatible trace elements, appears to be subparallel to the south- western part of the modern Ryukyu subduction system. Sr---Nd isotope ratios of the NTVZ volcanic rocks ( 87 Sr/ 86 Sr 070376---070551; 143 Nd/ 144 Nd 051259---051301) suggest that two mantle source components are involved in the magma generation, the asthenosphere and metasomatized subconti- nental lithospheric mantle. These two components are represented by the 26 Ma Mienhuayu high-Mg basaltic andesites and the 02 Ma Tsaolingshan high-Mg potassic lavas, respectively. The latter are interpreted to be the products of small-degree melting of a phlogopite- bearing, harzburgite lithospheric mantle source metasomatized recently by the nearby Ryukyu subduction zone processes. The Sr---Nd---Pb isotope systematics and specific trace-element ratios of the NTVZ volcanic rocks suggest that melts derived from subducted sediments and fluids released from slab dehydration reactions were both involved in metasomatizing this mantle source. The unique spatial geochemical variation of the NTVZ volcanic rocks can be successfully modelled using variable degrees of partial melting of the mantle source regions, coupled with mixing of different melt components from depleted asthenospheric and metasomatized lithospheric mantle components beneath individual volcanic fields. It is inferred that mixing of melts from specific mantle components and the degree of partial melting are spatially and temporally related to the tectonic evolution of the northern Taiwan region, and not simply due directly to subduction zone processes. The overall NTVZ geochemical characteristics can be explained by various degrees of melting within an ascending region of the asthenospheric mantle, triggered by extensional collapse of the NTMB, and interaction of these melts with overlying fluid- and sediment-modified lithospheric mantle. JOURNAL OF PETROLOGY VOLUME 45 NUMBER 5 PAGES 975–1011 2004 DOI: 10.1093/petrology/egh001 * Corresponding author. Present address: GEMOC, Department of Earth and Planetary Sciences, Macquarie University, Sydney, N.S.W. 2109, Australia. Fax: 61-2-9850 8943. E-mail: [email protected] Journal of Petrology 45(5) # Oxford University Press 2004; all rights reserved by guest on April 16, 2016 http://petrology.oxfordjournals.org/ Downloaded from
Transcript of Geochemical Constraints for the Genesis of Post-collisional Magmatism and the Geodynamic Evolution...

Geochemical Constraints for the Genesis ofPost-collisional Magmatism and theGeodynamic Evolution of the NorthernTaiwan Region
KUO-LUNG WANG1,2*, SUN-LIN CHUNG1, SUZANNE Y. O’REILLY2,SHEN-SU SUN3, RYUICHI SHINJO4 AND CHANG-HWA CHEN5
1DEPARTMENT OF GEOSCIENCES, NATIONAL TAIWAN UNIVERSITY, PO BOX 13-318, TAIPEI 106, TAIWAN
2ARC NATIONAL KEY CENTRE FOR THE GEOCHEMICAL EVOLUTION AND METALLOGENY OF CONTINENTS
(GEMOC), DEPARTMENT OF EARTH AND PLANETARY SCIENCES, MACQUARIE UNIVERSITY, SYDNEY, N.S.W. 2109,
AUSTRALIA
316 GIFFEN CLOSE, HOLT, CANBERRA, A.C.T. 2615, AUSTRALIA
4DEPARTMENT OF PHYSICS AND EARTH SCIENCES, UNIVERSITY OF THE RYUKYUS, OKINAWA, JAPAN
5INSTITUTE OF EARTH SCIENCES, ACADEMIA SINICA, PO BOX 1-55, NANKANG, TAIPEI, TAIWAN
RECEIVED NOVEMBER 14, 2002; ACCEPTED OCTOBER 21, 2003
Taiwan is an active mountain belt created by the oblique collision of
the northern Luzon arc with Asia. Late Pliocene extensional collapse
of the northern Taiwan mountain belt (NTMB) was accompanied
by magmatism that formed the Northern Taiwan Volcanic Zone
(NTVZ; 2�8---0�2Ma). The geochemical characteristics of the
NTVZ magmas can thus provide constraints both for the mantle
source composition and the geodynamic processes operating in the
late orogenic stage of the region. The NTVZ volcanic rocks consist
dominantly of calc-alkaline andesites and basalts, along with sub-
ordinate but heterogeneous lavas including low-K, shoshonitic and
ultrapotassic magmas. From the NE to the SW in the NTVZ, the
magmas show systematic compositional variations from low-K to
calc-alkaline and then shoshonitic. This spatial geochemical varia-
tion, characterized by southwesterly increase in potassium and
incompatible trace elements, appears to be subparallel to the south-
western part of the modern Ryukyu subduction system. Sr---Ndisotope ratios of the NTVZ volcanic rocks ( 87Sr/86Sr �0�70376---0�70551; 143Nd/144Nd � 0�51259---0�51301)suggest that two mantle source components are involved in the
magma generation, the asthenosphere and metasomatized subconti-
nental lithospheric mantle. These two components are represented by
the 2�6MaMienhuayu high-Mg basaltic andesites and the 0�2Ma
Tsaolingshan high-Mg potassic lavas, respectively. The latter are
interpreted to be the products of small-degree melting of a phlogopite-
bearing, harzburgite lithospheric mantle source metasomatized
recently by the nearby Ryukyu subduction zone processes. The
Sr---Nd---Pb isotope systematics and specific trace-element ratios ofthe NTVZ volcanic rocks suggest that melts derived from subducted
sediments and fluids released from slab dehydration reactions were
both involved in metasomatizing this mantle source. The unique
spatial geochemical variation of the NTVZ volcanic rocks can be
successfully modelled using variable degrees of partial melting of
the mantle source regions, coupled with mixing of different melt
components from depleted asthenospheric and metasomatized
lithospheric mantle components beneath individual volcanic fields.
It is inferred that mixing of melts from specific mantle components
and the degree of partial melting are spatially and temporally related
to the tectonic evolution of the northern Taiwan region, and not
simply due directly to subduction zone processes. The overall NTVZ
geochemical characteristics can be explained by various degrees of
melting within an ascending region of the asthenospheric mantle,
triggered by extensional collapse of the NTMB, and interaction of
these melts with overlying fluid- and sediment-modified lithospheric
mantle.
JOURNAL OF PETROLOGY VOLUME 45 NUMBER 5 PAGES 975–1011 2004 DOI: 10.1093/petrology/egh001
*Corresponding author. Present address: GEMOC, Department of
Earth and Planetary Sciences, Macquarie University, Sydney, N.S.W.
2109, Australia. Fax: 61-2-9850 8943. E-mail: [email protected]
Journal of Petrology 45(5) # Oxford University Press 2004; all rights
reserved
by guest on April 16, 2016
http://petrology.oxfordjournals.org/D
ownloaded from

KEY WORDS: Northern Taiwan Volcanic Zone; post-collisional
magmatism; Pb isotopes; subduction components; geodynamics of basalt
genesis
INTRODUCTION
The tectonic evolution of orogenic belts is typicallymarked by changes in the composition of the associatedmagmatism (e.g. Harris et al., 1986). Post-collisional mag-matism is one of the common features of many orogensaround the world, and may indicate that the orogen isin the process of collapsing (Dewey, 1988). Petrogeneticstudies of post-collisional magmatism not only provideconstraints on the geodynamic processes responsible forthe cessation of collision and onset of extensional col-lapse, but also reveal changes in magma source regionsassociated with such processes. In addition, one of theprevailing characteristics of post-collisional magmatism isits subduction-related geochemical characteristics despitesubduction processes having been terminated as a resultof continental collision. The subduction-related signa-tures are attributed to metasomatism by slab-derivedfluids of the mantle lithosphere prior to collision (Pearceet al., 1990; Turner et al., 1992, 1993, 1996; Platt &England, 1993). Thus, the geochemical characteristicsof calc-alkaline post-collisional magmatism allow theevaluation of subduction-related metasomatism of theirmantle source.Taiwan is an active mountain belt created by the
oblique collision between the northern Luzon arc andthe Asian continent (see Teng, 1990). Despite continuingplate convergence in central and southern Taiwan,extensional collapse has occurred in the northern partof the mountain belt since Plio-Pleistocene times. Accord-ingly, Teng (1996) proposed a model for the orogenicevolution of northern Taiwan, from mountain buildinginduced by collision to subsequent extensional collapse,lasting only a few million years. Wang et al. (1999)proposed that post-collisional extension in the northernTaiwan mountain belt (NTMB) caused the magmatismof the Northern Taiwan Volcanic Zone (NTVZ) (Fig. 1).Compared with other collision orogens also character-ized by extensional collapse (Dewey, 1988; Platt & Visser,1989; Malavielle, 1993), northern Taiwan may provideone of the most active examples of such a tectonic pro-cess. In this study, we aim to: (1) investigate the petrogen-esis of the post-collisional magmatism, which displaysdistinctive spatial and temporal geochemical variationsindicative of changes in magma source region; (2) exploremetasomatism of the mantle source by different subduc-tion components, e.g. hydrous fluids and subducted sedi-ments; (3) track the evolution of the mantle source regionduring the late orogenic stage; (4) show how the geo-chemical trends within individual magmatic episodescan constrain the nature of geodynamic processes.
REGIONAL GEOLOGY: THE NTVZ
Located at the Asian continental margin at the boundaryof the Philippine Sea plate, the island of Taiwan is notonly a collision zone but also a transform region betweenthe opposing Luzon and Ryukyu subduction systems(Fig. 1). The Ryukyu subduction and the resultantRyukyu arc---trench system, active since the Paleogene,are associated with the development of a back-arc basin,the Okinawa Trough, which has a distinct topography(42000m below sea level; Fig. 1) and a strong curvature.Driven by the NWmovement of the Philippine Sea plate,the northern segment of the Luzon arc is generallybelieved to have collided with the Asian continental mar-gin at 10Ma (Teng, 1990). The Taiwan mountain belt,composed of deformed strata of both the Asian continentand the Luzon arc, reaches a maximum altitude near4000m in its central part (Fig. 1). Whereas collisionaltectonism is still continuing, as evidenced by the promi-nent crustal shortening in central and southern Taiwan(e.g. Angelier et al., 1986; Yu & Chen, 1994), structuraland seismological data demonstrate that the northernpart of the Taiwan mountain belt has been subjected toextensional deformation in the Quaternary (Suppe, 1984;Lee & Wang, 1988; Yeh et al., 1991). Thus, Teng (1996)proposed that extensional collapse of the NTMB tookplace in Plio-Pleistocene times. Consequently, the topo-graphic elevation of the orogen reduces from near4000m in central Taiwan to rolling hills in the north-eastern part and eventually becomes submerged in theoffshore area farther to the NE (Fig. 1).The NTVZ comprises two major onshore volcanic
fields, the Tatun and Keelung Volcano Groups (TTVGand KLVG), and several offshore volcanoes (Fig. 1). TheNTVZ volcanic rocks consist dominantly of andesiteswith calc-alkaline geochemical characteristics, similar tothose commonly observed in convergent-margin lavas(e.g. Gill, 1981). Thus, they have conventionally beenregarded as the westernmost part of the Ryukyu volcanicarc (Chen, 1990; Juang, 1993; Chung et al., 1995b; Teng,1996). The conventional view was first questioned byChen (1997), who suggested an extensional rather thana subduction-related tectonic regime for magma genera-tion. To accommodate available geophysical and geo-logical evidence, Wang et al. (1999) proposed that theNTVZ resulted from post-collisional extension relatedto the late Pliocene orogenic collapse of the NTMB.This extension may also account for the reactivation ofthe opening of the Okinawa Trough that commenced inthe middle Miocene (Sibuet et al., 1995) but becameinactive after the arc---continent collision in Taiwan.Reactivated rifting in the Okinawa Trough started pro-pagating to the SW from �1�5Ma, with accompanyingdevelopment of the westernmost part of the Ryukyusubduction system towards Taiwan (Chung et al., 2000).
JOURNAL OF PETROLOGY VOLUME 45 NUMBER 5 MAY 2004
976
by guest on April 16, 2016
http://petrology.oxfordjournals.org/D
ownloaded from

Radiometric age data show that the NTVZ volcanismcommenced at �2�8---2�6Ma and lasted throughout theQuaternary. Figure 2 summarizes existing age data forthe NTVZ volcanic rocks, carried out by various dating
methods including fission track, K---Ar and Ar---Ar. Theage data suggest that the earliest eruptions occurred inthe Sekibisho (SBS) and Mienhuayu (MHY) islets andthe TTVG around 2�8---2�6Ma, with the youngest ages
25°N
130°E
120° 130° 140°E
10°
20°
30°
40°N
25°
26°N
Fig. 1. Maps showing the regional tectonic setting of Taiwan and the volcanic fields of the NTVZ, modified from Wang et al. (1999, 2002). WBPindicates the western boundary of the subducting Philippine plate. It should be noted that the NTVZ is currently located �200 km above theWadati---Benioff zone. Stippled area represents the Taiwan orogen basement characterized by folded and tilted Tertiary strata (Wageman et al.,1970; also named southern Taiwan---Sinzi Folded Zone). Lower right inset: tectonic setting of Taiwan. OT, Okinawa Trough; RT, Ryukyu Trench.Upper left inset: detailed bathymetric map showing the location of the NTVZ. Bold black line indicates the surface projection of the 100 km contourof the depth to the Wadati---Benioff zone (Sibuet et al., 1998).
WANG et al. GEODYNAMIC EVOLUTION OF NORTHERN TAIWAN
977
by guest on April 16, 2016
http://petrology.oxfordjournals.org/D
ownloaded from

around 0�2Ma in most of volcanic fields. In some local-ities, however, the volcanic ages might be younger than0�2Ma, as dating results are close to or even smaller thanthe limit of the dating methods. The age spectrum inFigure 2 shows a generally random distribution in spaceand time, distinct from the southwesterly younging trendof the NTVZ volcanism argued by some workers (e.g.Teng et al., 1992; Teng, 1996). This trend, based onlimited geochronological data, was ascribed to south-westerly propagation of the Ryukyu subduction system(Teng et al., 1992). However, when more recent age data( Juang, 1993; Tsao, 1994; Lee, 1996; Wang et al., 2000;Chung et al., 2001b) are included, the alleged trenddisappears (Fig. 2) so that the argument by Teng et al.(1992) and Teng (1996) is problematic.
SAMPLES AND ANALYTICAL
METHODS
Samples and major-, trace-element andNd---Sr isotope methods
Representative volcanic samples were collected fromdifferent localities in the NTVZ for detailed geochemicalinvestigation, including whole-rock major- and trace-element, and Sr---Nd---Pb isotope determinations. Geo-chemical data for the SBS and Kobisho (KBS) volcanicrocks from Shinjo (1998, and unpublished Pb data, 2003)and some Nd---Sr isotope data from Chen (1989) are alsoincluded in this paper for comparison. All NTVZ volca-nic rocks are microscopically porphyritic. Lithology andphenocryst assemblages are (1) plagioclase þ olivine �titanomagnetite for SBS basalts; (2) plagioclase þolivine þ augite for KBS basalts; (3) olivine þ bronzite þ
plagioclase for MHY basaltic andesites; (4) plagioclase þolivine þ bronzite for Pengchiayu (PCY) basalts;(5) plagioclase þ augite þ hornblende þ biotite forKLVG dacites; (6) plagioclase þ augite þ olivine forTTVG basalts and plagioclase þ augite þ hypersthene þhornblende for andesites; (7) olivineþ augiteþ plagioclasefor Kuanyinshan (KYS) basalts and plagioclaseþ augiteþhypersthene þ hornblende � olivine for andesites;(8) olivine þ diopside þ phlogopite þ Fe---Ti oxide �leucite for TLS absarokites. Detailed petrographic descrip-tions and mineral chemical data have been reported in anumber of publications (Chen, 1990; Juang, 1993; Shinjo,1998; Wang et al., 2000, 2002; Chung et al., 2001b), and soin this paper we focus only on the whole-rock geochemistryof the NTVZ volcanic rocks.Powder samples were prepared using a jaw crusher
and a corundum mill. Major-element compositionswere determined by X-ray fluorescence (XRF) using aRigaku1 RIX 2000 spectrometer at the Department ofGeosciences, National Taiwan University. The analyticaluncertainties are generally better than 5% for all ele-ments (Lee et al., 1997). Loss on ignition was determinedby routine procedures. Powdered samples weighingabout 50mg were dissolved using a HF---HNO3 (10:1)mixture in screw-top Teflon Savillex1 for 7 days at�100�C, followed by evaporation to dryness, refluxingin 7N HNO3 and drying again, and then dissolving thesample cake in 2% HNO3. An internal standard solutionof 10 ppb Re was added and the spiked dissolutions werediluted with 2% HNO3 to a sample/solution weight ratioof 1/1000. The internal standard was used for monitor-ing the signal shift during inductively coupled plasma-mass spectrometry (ICP-MS) measurements using aPerkin Elmer1 Elan-6000 spectrometer at Guangzhou
0
1
2
32.62.6
0.2
0.5
0.4
2.1
0.3
1.0
1.4
0.9
0.3
1.0
2.8
1.5
0.2 0.2
0.4
0.7
1.1
0.5
0.6
0.2
0.5
0.2
0.30.2
FTD
K-Ar
Ar-Ar
NESW
TLS KYS TTVG KLVG PCY MHY KBS SBS
Age
(M
a)
Fig. 2. Radiometric age data for each volcanic field in the NTVZ. Data sources include: fission-track dating (FTD) from Liu et al. (1986), Liu (1987)and Wang & Chen (1990); K---Ar ages from Juang (1988, 1993), Shinjo et al. (1991) and Tsao (1994); Ar---Ar ages from Lee (1996), Wang et al. (2000)and Chung et al. (2001b). It should be noted that eruption ages of the NTVZ display random distribution relative to their geographical locations.Abbreviations of individual volcanic fields: TLS, Tsaolingshan; KYS, Kuanyinshan; TTVG, Tatun Volcanic Group; KLVG, Keelung VolcanicGroup; PCY, Pengchiayu; MHY, Mienhuayu; SBS, Sekibisho; KBS, Kobisho.
JOURNAL OF PETROLOGY VOLUME 45 NUMBER 5 MAY 2004
978
by guest on April 16, 2016
http://petrology.oxfordjournals.org/D
ownloaded from

Institute of Geochemistry, the Chinese Academy ofSciences, China, which has a good stability range within�10% variation (Liu et al., 1996; Li, 1997). Valuesrecommended for the USGS rock standard BCR-1(Govindaraju, 1994) were used for data calibrations; theanalytical errors are generally better than 5% for mosttrace elements. The samples were dissolved for Sr and Ndseparation using routine cation-exchange column techni-ques. Sr and Nd isotope ratios were measured usingVG3541 and Finnigan MAT 2621 mass spectrometers,respectively, at the Institute of Earth Sciences, AcademiaSinica, Taiwan. Detailed chemical and mass spectro-metric procedures were described by Chen et al. (1990).The isotopic ratios were corrected for mass fractionationby normalizing to 86Sr/88Sr¼ 0�1194 and 146Nd/144Nd¼0�7219. Long-term laboratory measurements for SRM987 Sr and La Jolla (UCSD) Nd standards yield 0�71024� 0�00004 (2s) and 0�51187� 0�00003 (2s), respectively.During the period of the study, measurements for theNIST standard SRM 987 gave 86Sr/88Sr ¼ 0�71023 �0�00001 (2s; n ¼ 3), and for the La Jolla (UCSD) Ndstandards gave 0�511867 � 0�000006 (2s; n ¼ 3). Theoverall blank contributions were 0�8 ng Sr for about 20mgSr and 0�3 ng Nd for about 0�6mg Nd in the samples.
Double-spike Pb method
Chemical separation of Pb for isotope analysis wasundertaken at the National Taiwan University, Taiwanand the University of the Ryukyus, Japan. Rock chipsand/or powders were leached with 6NHCl at �80�C for30min. Then they were rinsed with distilled water beforebeing decomposed with HF and HNO3. The Pb wasseparated using standard HBr anion exchange proce-dures in Teflon columns and the sample solution passedthrough the columns twice for purification. All chemicalprocesses resulted in loss of about 50% of the Pb in chipsamples and 90% in powders, respectively. Two smallaliquots of the purified Pb sample were loaded onto twosingle Re filaments used for natural and double-spikedsample runs separately. A small drop of 207Pb---204Pbdouble-spike solution and Pb emitter silica gel---H3PO4
solution, prepared according to Gerstenberger & Haase(1997), were then added to the aliquot on the mixrun filament. Repeated sucking back and release ofthe mixture with the loading pipette ensured a goodsample---spike mixture. Lead isotope measurementswere made on a Finnigan MAT2621 mass spectrometerusing static multi-collector mode at the University of theRyukyus, Japan. Data acquisition was usually performedat a filament temperature of about 1050---1150�C andconsisted of four blocks of data per run, with each blockcomprising ten 16 s integrations (thus, 160 s integrationtime per block). Lead isotope ratios were correctedfor mass fractionation by the use of a 207Pb---204Pb
double-spike method. A new 207Pb---204Pb double-spikesolution was prepared and calibrated in this study. Thespike calibration is briefly described as follows.The isotope composition of the newly prepared
207Pb---204Pb double spike was calibrated with NIST Pbstandard SRM 982. The standard had been measured inseparate natural and mix runs with the new doublespike for calibrating the isotopic compositions of thedouble spike. The isotopic compositions of SRM 982 inthe natural runs (n ¼ 22 in the period of analysis) werenormalized to 208Pb/206Pb ¼ 1�00016, a value recom-mended by Cameron et al. (1969) and accepted in otherPb double-spike and triple-spike studies (e.g. Galer &Abouchami, 1998; Thirlwall, 2000). Data from theseSRM 982 analyses and from double-spiked SRM 982mix runs (n ¼ 8) were then used to correct for massfractionation effect and to determine the isotopic com-position of the double spike. All calculations wereperformed by an iterative technique using an Excelspreadsheet (Woodhead et al., 1995). The 204Pb/207Pbwas determined to be �0�9921 in the newly prepareddouble-spike solution. Once the double-spike composi-tion was calibrated it was tested by obtaining the isotopecomposition of NIST Pb Standard SRM 981 with thedouble-spike method. All mixed samples measured (n ¼54) had Q � 0�7---0�9 [Q ¼ 204Pbspike/(
204Pbspike þ204Pbsample)]. The double-spike calibrated SRM 981 hasthe following composition: 206Pb/204Pb ¼ 16�9411 � 42,207Pb/204Pb¼ 15�4978� 52 and 208Pb/204Pb¼ 36�7185�142 (2s), which agrees well with values recently reportedby Galer & Abouchami (1998) and Thirlwall (2000) usingtriple-spike and double-spike methods, respectively. Theexternal reproducibility of the SRM 981 (2SD, 54 ana-lyses in the period of this study) is 124 ppm for 206Pb/204Pb, 112 ppm for 207Pb/204Pb and 96 ppm for 208Pb/204Pb. The overall blank contributions were 0�4 ng Pb forabout 0�2 mg Pb in the samples. Accordingly, high-qualityPb isotope data were produced for this study using thedouble-spike method.The major- and trace-element and Sr---Nd---Pb isotopic
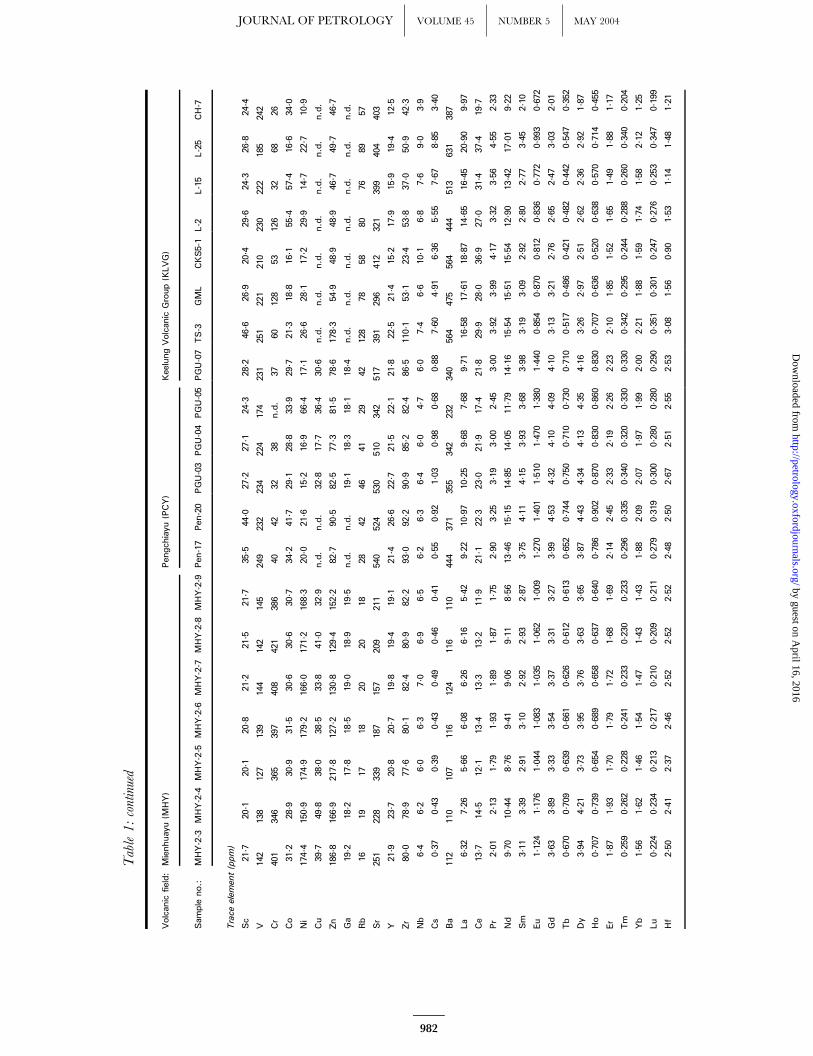
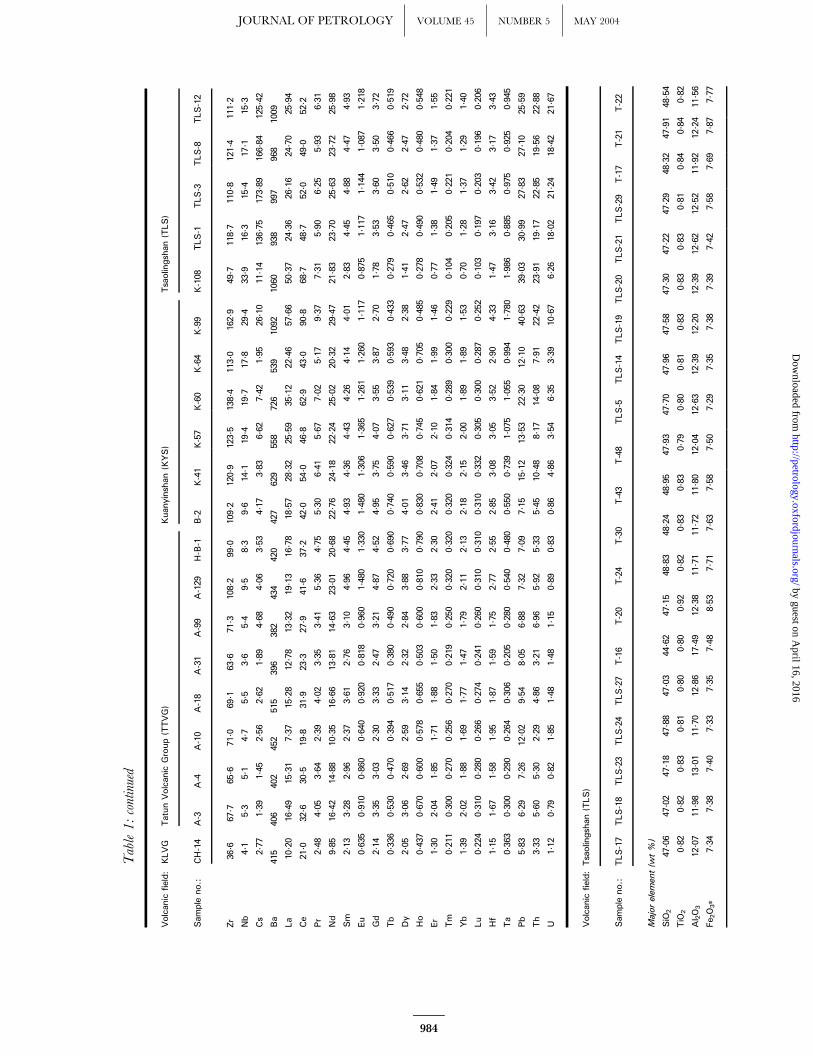
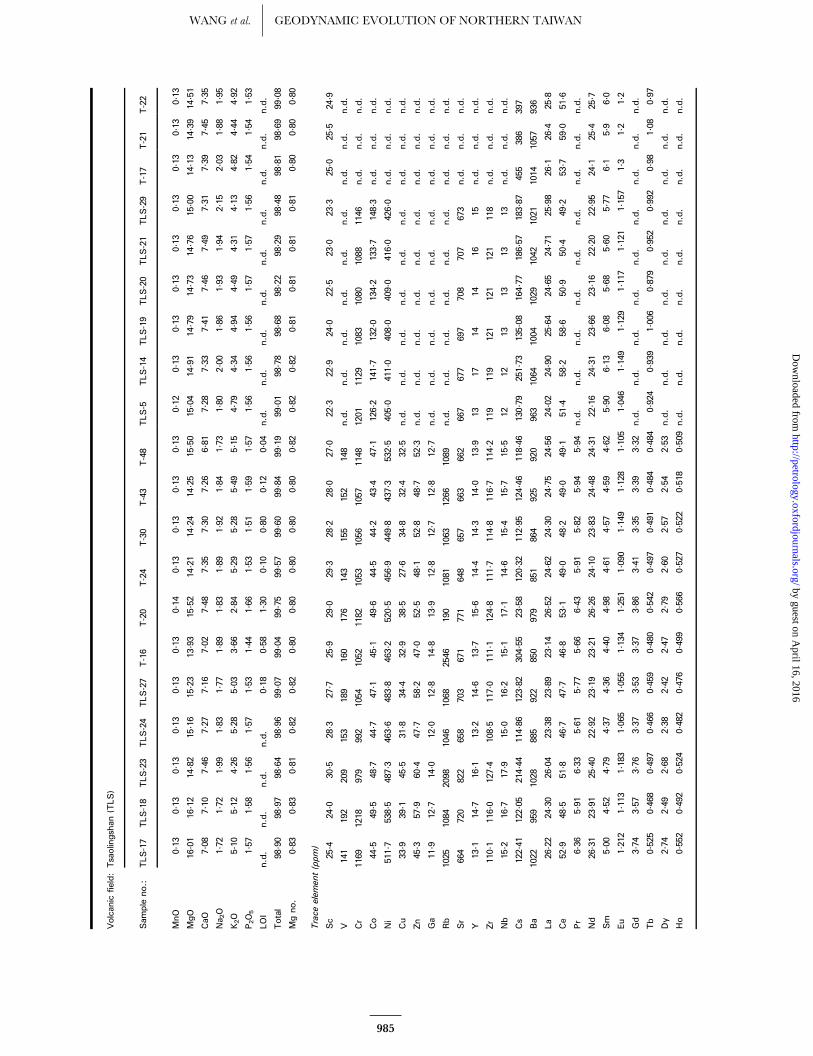
compositions of the NTVZ volcanic rocks are presentedin Tables 1 and 2, respectively.
WHOLE-ROCK GEOCHEMICAL
COMPOSITION
Major-element compositions
In a plot of K2O vs SiO2 (Fig. 3a), most of the NTVZvolcanic rocks display calc-alkaline characteristics exceptfor the SBS and MHY magmas, which are low-K, andthe TLS magmas, which are shoshonitic. Volcanic rocksfrom the offshore volcanoes are principally mafic to inter-mediate, whereas the onshore volcano groups are inter-mediate to felsic. The mafic rocks (SiO2 �55 wt %) from
WANG et al. GEODYNAMIC EVOLUTION OF NORTHERN TAIWAN
979
by guest on April 16, 2016
http://petrology.oxfordjournals.org/D
ownloaded from

Table1:Whole-rockmajor-andtrace-elementcompositionsfortheNTVZvolcanicrocks
Volcan
icfield:
Sekibisho(SBS)1
Kobisho(KBS)
Mienhuayu(M
HY)
Sam
ple
no.:
SBS-1
SBS-2
SBS-7
KBS-1
1KBS-3
1KO-3
KO-4
KO-5
MHH-01
MHY-1
MHY-2
MHY-3
MHY-4
MHY-5
MHY-7
MHY-8
MHY-9
MHY-2-1
MHY-2-2
Majorelem
ent(w
t%)
SiO
249. 91
53. 02
50. 15
50. 66
50. 21
49. 30
50. 02
48. 65
54. 50
53. 30
53. 70
53. 28
49. 44
49. 99
53. 41
53. 56
52. 82
53. 45
54. 21
TiO
20.88
0.83
1.02
0.85
0.85
0.76
0.83
0.85
1.44
1.56
1.64
1.50
1.68
1.61
1.53
1.52
1.48
1.54
1.41
Al 2O3
20. 27
17. 39
18. 84
16. 12
16. 97
17. 20
17. 49
17. 13
14. 60
14. 52
15. 01
14. 35
14. 26
14. 81
14. 35
14. 50
14. 58
14. 49
14. 24
Fe 2O3*
10. 60
10. 58
11. 52
9.52
9.28
9.11
9.13
9.79
10. 39
10. 79
10. 19
10. 65
11. 46
11. 10
10. 58
10. 55
10. 63
10. 69
10. 34
MnO
0.17
0.22
0.18
0.16
0.16
0.15
0.16
0.16
0.14
0.14
0.13
0.14
0.13
0.13
0.13
0.14
0.13
0.14
0.14
MgO
4.38
5.09
4.73
6.60
6.66
7.08
5.95
6.85
7.38
7.80
5.90
8.08
6.46
6.69
7.82
7.87
7.05
7.48
8.08
CaO
10. 44
9.61
10. 16
11. 42
11. 26
12. 59
11. 81
11. 66
8.48
8.22
8.05
8.00
7.28
7.91
8.22
8.03
7.88
8.44
8.27
Na 2O
2.97
2.67
2.88
2.60
2.55
1.82
2.11
1.87
2.14
2.47
2.66
2.72
2.47
2.53
2.67
2.66
2.73
2.45
2.34
K2O
0.26
0.43
0.36
1.67
1.64
1.48
1.74
1.66
0.40
0.41
0.47
0.42
0.55
0.45
0.43
0.42
0.53
0.42
0.59
P2O5
0.10
0.16
0.15
0.39
0.41
0.36
0.42
0.43
0.13
0.54
0.69
0.23
3.41
2.06
0.14
0.14
0.65
0.51
0.29
LOI
1.67
1.11
1.17
1.63
0.99
0.00
0.62
0.38
1.51
0.48
0.93
0.09
1.87
1.60
0.00
0.08
0.54
0.45
0.76
Total
99. 98
100.00
99. 99
99. 99
99. 99
99. 85
100.28
99. 43
101.10
100.22
99. 38
99. 46
99. 02
98. 87
99. 27
99. 47
99. 01
100.06
100.67
Mgno.
0.47
0.51
0.47
0.60
0.61
0.63
0.59
0.60
0.61
0.61
0.56
0.62
0.55
0.57
0.62
0.62
0.59
0.60
0.63
Trace
elem
ent(ppm)
Sc
32. 8
34. 0
30. 0
37. 3
36. 6
24. 3
32. 6
22. 4
21. 5
n.d.
n.d.
n.d.
21. 8
60. 6
67. 9
18. 8
54. 4
21. 1
13. 5
V297
276
281
254
251
230
263
279
170
8389
142
137
149
141
143
141
143
139
Cr
4128
2796
93127
144
92371
241
188
411
422
424
425
434
429
381
414
Co
29. 0
29. 0
31. 0
36. 0
36. 0
38. 7
35. 0
39. 7
42. 0
24. 2
21. 0
42. 4
37. 0
37. 2
41. 5
45. 6
40. 6
30. 8
31. 4
Ni
19. 0
13. 0
16. 0
35. 0
35. 0
40. 2
64. 7
35. 9
138.2
82. 5
51. 5
141.3
94. 4
102.0
139.8
143.5
154.0
132.8
178.1
Cu
n.d.
n.d.
n.d.
n.d.
n.d.
72. 8
83. 0
77. 3
39. 3
18. 3
12. 7
36. 2
38. 9
36. 7
30. 1
36. 5
47. 3
32. 1
54. 3
Zn
n.d.
n.d.
n.d.
n.d.
n.d.
65. 2
70. 0
74. 1
110.0
64. 8
72. 2
102.0
116.5
106.6
103.1
117.0
96. 7
135.3
117.0
Ga
n.d.
n.d.
n.d.
n.d.
n.d.
16. 4
18. 3
17. 2
18. 7
10. 7
11. 3
19. 1
20. 1
20. 8
20. 0
19. 1
19. 7
19. 1
17. 6
Rb
69
670
6744
6446
1610
1215
1415
1616
1917
22
Sr
268
265
392
433
436
421
419
492
187
139
110
178
334
222
195
190
216
212
222
Y20. 7
24. 5
25. 4
19. 2
19. 5
17. 7
18. 4
20. 2
22. 2
12. 3
13. 6
19. 4
13. 8
21. 9
20. 2
19. 7
23. 4
20. 5
18. 4
Zr
47. 0
54. 0
67. 0
81. 0
82. 0
74. 4
88. 1
89. 1
92. 0
50. 8
56. 9
82. 9
90. 4
90. 7
85. 0
84. 6
83. 6
83. 5
80. 6
Nb
1.9
2.0
2.5
3.7
3.7
3.5
4.2
4.1
6.5
3.5
4.4
5.3
5.8
6.0
5.4
5.3
6.4
5.6
7.9
Cs
0.28
0.44
0.30
1.41
1.34
0.72
1.26
0.66
0.50
0.26
0.27
0.53
0.49
0.48
0.51
0.51
0.64
0.38
0.52
Ba
87110
137
234
241
215
232
254
137
102
91131
151
140
139
136
172
94124
La
3.83
4.77
7.16
7.96
8.23
7.27
7.87
8.63
5.58
3.72
4.22
5.03
4.75
5.23
4.57
4.86
6.18
4.90
7.10
Ce
9.7
11. 6
17. 5
17. 7
18. 2
16. 6
17. 8
19. 7
12. 4
6.8
7.6
11. 3
11. 4
12. 0
10. 6
10. 9
13. 6
11. 0
15. 3
Pr
1.46
1.70
2.54
2.35
2.43
2.18
2.41
2.56
1.73
1.13
1.26
1.63
1.63
1.81
1.59
1.64
1.99
1.59
2.15
JOURNAL OF PETROLOGY VOLUME 45 NUMBER 5 MAY 2004
980
by guest on April 16, 2016
http://petrology.oxfordjournals.org/D
ownloaded from

Volcan
icfield:
Sekibisho(SBS)1
Kobisho(KBS)
Mienhuayu(M
HY)
Sam
ple
no.:
SBS-1
SBS-2
SBS-7
KBS-1
1KBS-3
1KO-3
KO-4
KO-5
MHH-01
MHY-1
MHY-2
MHY-3
MHY-4
MHY-5
MHY-7
MHY-8
MHY-9
MHY-2-1
MHY-2-2
Nd
7.16
8.26
12. 03
10. 48
10. 80
9.88
10. 66
11. 55
8.85
6.30
7.06
8.25
8.24
9.12
8.05
8.27
9.48
8.36
9.99
Sm
2.24
2.52
3.36
2.81
2.87
2.55
2.85
2.92
3.15
2.10
2.32
3.15
2.96
3.39
3.04
3.09
3.27
2.94
3.05
Eu
0.834
0.912
1.152
0.981
0.998
0.920
1.008
1.020
1.217
0.830
0.880
1.240
1.170
1.380
1.260
1.270
1.300
1.061
1.028
Gd
2.74
3.03
3.79
3.11
3.17
2.99
3.41
3.46
4.07
2.64
2.81
3.57
3.25
3.78
3.41
3.56
3.73
3.45
3.31
Tb
0.494
0.537
0.641
0.507
0.521
0.490
0.545
0.560
0.657
0.440
0.470
0.690
0.640
0.750
0.690
0.690
0.700
0.646
0.593
Dy
3.33
3.63
4.19
3.16
3.26
2.90
3.32
3.25
3.90
2.60
2.86
3.89
3.48
4.26
3.87
3.85
3.98
3.80
3.57
Ho
0.736
0.812
0.912
0.661
0.678
0.620
0.702
0.700
0.752
0.480
0.530
0.780
0.700
0.830
0.780
0.770
0.800
0.663
0.622
Er
2.16
2.42
2.67
1.88
1.93
1.80
2.03
2.08
1.95
1.30
1.45
2.02
1.79
2.18
2.04
2.04
2.10
1.76
1.66
Tm
0.335
0.377
0.413
0.286
0.294
0.260
0.293
0.290
0.285
0.180
0.200
0.280
0.240
0.300
0.280
0.270
0.290
0.243
0.230
Yb
2.15
2.42
2.62
1.80
1.85
1.70
1.87
1.93
1.69
1.11
1.23
1.68
1.42
1.84
1.72
1.71
1.76
1.49
1.40
Lu
0.319
0.367
0.387
0.264
0.270
0.240
0.284
0.280
0.245
0.160
0.170
0.250
0.210
0.270
0.270
0.250
0.260
0.214
0.205
Hf
1.35
1.53
1.86
2.08
2.13
1.73
2.19
1.97
2.61
1.63
1.77
2.21
2.40
2.48
2.36
2.25
2.18
2.56
2.36
Ta
0.150
0.160
0.190
0.300
0.290
0.200
0.228
0.240
0.375
0.210
0.260
0.330
0.360
0.380
0.350
0.330
0.400
0.324
0.446
Pb
2.18
2.77
2.38
3.13
3.19
2.45
3.01
3.74
2.24
1.93
1.21
4.77
6.49
6.47
2.78
2.43
3.12
2.45
5.98
Th
0.57
0.65
0.99
1.69
1.72
1.64
1.80
1.93
1.15
0.86
0.88
1.26
0.80
1.47
1.44
1.21
1.66
0.84
0.93
U0.20
0.31
0.31
0.53
0.53
0.26
0.53
0.35
0.32
0.21
0.21
0.40
0.68
0.46
0.35
0.33
0.41
0.29
0.31
Volcan
icfield:
Mienhuayu(M
HY)
Pen
gch
iayu
(PCY)
KeelungVolcan
icGroup(KLVG)
Sam
ple
no.:
MHY-2-3
MHY-2-4
MHY-2-5
MHY-2-6
MHY-2-7
MHY-2-8
MHY-2-9
Pen
-17
Pen
-20
PGU-03
PGU-04
PGU-05
PGU-07
TS-3
GML
CKS5-1
L-2
L-15
L-25
CH-7
Majorelem
ent(w
t%)
SiO
252. 76
52. 66
52. 32
54. 20
54. 04
53. 37
52. 96
49. 46
51. 18
53. 12
50. 74
53. 54
52. 84
54. 96
56. 24
56. 25
56. 15
57. 62
57. 11
58. 13
TiO
21.50
1.43
1.40
1.45
1.46
1.44
1.51
1.12
1.19
1.12
1.09
1.19
1.09
0.58
0.56
0.57
0.54
0.50
0.55
0.46
Al 2O3
14. 48
14. 26
13. 89
14. 43
14. 57
14. 35
14. 16
17. 78
17. 24
16. 74
16. 13
15. 40
16. 45
17. 79
18. 20
18. 12
17. 10
18. 13
17. 69
17. 80
Fe 2O3*
10. 77
10. 07
10. 26
10. 56
10. 57
10. 69
10. 76
10. 23
9.49
9.45
9.30
9.87
9.54
6.90
6.11
5.88
6.27
6.00
5.72
6.44
MnO
0.14
0.13
0.14
0.14
0.13
0.14
0.14
0.16
0.15
0.14
0.14
0.14
0.14
0.12
0.11
0.12
0.12
0.12
0.13
0.12
MgO
7.71
7.01
7.67
7.89
7.65
7.81
7.44
5.44
5.45
4.83
5.03
6.47
4.99
4.63
4.62
4.35
4.73
3.75
4.06
3.65
CaO
8.51
8.69
8.91
8.20
8.17
7.92
7.87
10. 37
10. 33
10. 13
10. 36
9.19
10. 22
8.75
7.84
7.28
8.44
7.83
7.39
7.90
Na 2O
2.29
2.48
2.54
2.52
2.57
2.45
2.31
2.28
2.43
1.86
1.87
1.77
1.82
2.55
2.57
2.71
2.68
2.87
2.68
3.12
K2O
0.45
0.61
0.49
0.50
0.56
0.56
0.54
1.41
1.46
1.52
1.34
0.95
1.43
1.87
1.60
1.62
1.68
1.65
1.80
1.62
P2O5
1.01
0.93
0.88
0.25
0.32
0.48
0.76
0.45
0.39
0.38
0.36
0.28
0.37
0.31
0.21
0.37
0.20
0.27
0.33
0.23
LOI
0.52
1.26
1.27
0.12
0.09
0.31
0.87
n.d.
1.23
n.d.
n.d.
n.d.
n.d.
n.d.
n.d.
3.07
n.d.
n.d.
n.d.
n.d.
Total
100.14
99. 53
99. 77
100.26
100.13
99. 52
99. 32
98. 70
100.54
99. 29
96. 37
98. 80
98. 89
98. 44
98. 06
100.34
97. 90
98. 74
97. 45
99. 48
Mgno.
0.61
0.60
0.62
0.62
0.61
0.61
0.60
0.54
0.56
0.53
0.54
0.59
0.53
0.59
0.62
0.62
0.62
0.58
0.61
0.55
WANG et al. GEODYNAMIC EVOLUTION OF NORTHERN TAIWAN
981
by guest on April 16, 2016
http://petrology.oxfordjournals.org/D
ownloaded from
Volcan
icfield:
Mienhuayu(M
HY)
Pen
gch
iayu
(PCY)
KeelungVolcan
icGroup(KLVG)
Sam
ple
no.:
MHY-2-3
MHY-2-4
MHY-2-5
MHY-2-6
MHY-2-7
MHY-2-8
MHY-2-9
Pen
-17
Pen
-20
PGU-03
PGU-04
PGU-05
PGU-07
TS-3
GML
CKS5-1
L-2
L-15
L-25
CH-7
Trace
elem
ent(ppm)
Sc
21. 7
20. 1
20. 1
20. 8
21. 2
21. 5
21. 7
35. 5
44. 0
27. 2
27. 1
24. 3
28. 2
46. 6
26. 9
20. 4
29. 6
24. 3
26. 8
24. 4
V142
138
127
139
144
142
145
249
232
234
224
174
231
251
221
210
230
222
185
242
Cr
401
346
365
397
408
421
386
4042
3238
n.d.
3760
128
53126
3268
26
Co
31. 2
28. 9
30. 9
31. 5
30. 6
30. 6
30. 7
34. 2
41. 7
29. 1
28. 8
33. 9
29. 7
21. 3
18. 8
16. 1
55. 4
57. 4
16. 6
34. 0
Ni
174.4
150.9
174.9
179.2
166.0
171.2
168.3
20. 0
21. 6
15. 2
16. 9
66. 4
17. 1
26. 6
28. 1
17. 2
29. 9
14. 7
22. 7
10. 9
Cu
39. 7
49. 8
38. 0
38. 5
33. 8
41. 0
32. 9
n.d.
n.d.
32. 8
17. 7
36. 4
30. 6
n.d.
n.d.
n.d.
n.d.
n.d.
n.d.
n.d.
Zn
186.8
166.9
217.8
127.2
130.8
129.4
152.2
82. 7
90. 5
82. 5
77. 3
81. 5
78. 6
178.3
54. 9
48. 9
48. 9
46. 7
49. 7
46. 7
Ga
19. 2
18. 2
17. 8
18. 5
19. 0
18. 9
19. 5
n.d.
n.d.
19. 1
18. 3
18. 1
18. 4
n.d.
n.d.
n.d.
n.d.
n.d.
n.d.
n.d.
Rb
1619
1718
2020
1828
4246
4129
42128
7858
8076
8957
Sr
251
228
339
187
157
209
211
540
524
530
510
342
517
391
296
412
321
399
404
403
Y21. 9
23. 7
20. 8
20. 7
19. 8
19. 4
19. 1
21. 4
26. 6
22. 7
21. 5
22. 1
21. 8
22. 5
21. 4
15. 2
17. 9
15. 9
19. 4
12. 5
Zr
80. 0
78. 9
77. 6
80. 1
82. 4
80. 9
82. 2
93. 0
92. 2
90. 9
85. 2
82. 4
86. 5
110.1
53. 1
23. 4
53. 8
37. 0
50. 9
42. 3
Nb
6.4
6.2
6.0
6.3
7.0
6.9
6.5
6.2
6.3
6.4
6.0
4.7
6.0
7.4
6.6
10. 1
6.8
7.6
9.0
3.9
Cs
0.37
0.43
0.39
0.43
0.49
0.46
0.41
0.55
0.92
1.03
0.98
0.68
0.88
7.60
4.91
6.36
5.55
7.67
8.85
3.40
Ba
112
110
107
116
124
116
110
444
371
355
342
232
340
564
475
564
444
513
631
387
La
6.32
7.26
5.66
6.08
6.26
6.16
5.42
9.22
10. 97
10. 25
9.68
7.68
9.71
16. 58
17. 61
18. 87
14. 65
16. 45
20. 90
9.97
Ce
13. 7
14. 5
12. 1
13. 4
13. 3
13. 2
11. 9
21. 1
22. 3
23. 0
21. 9
17. 4
21. 8
29. 9
28. 0
36. 9
27. 0
31. 4
37. 4
19. 7
Pr
2.01
2.13
1.79
1.93
1.89
1.87
1.75
2.90
3.25
3.19
3.00
2.45
3.00
3.92
3.99
4.17
3.32
3.56
4.55
2.33
Nd
9.70
10. 44
8.76
9.41
9.06
9.11
8.56
13. 46
15. 15
14. 85
14. 05
11. 79
14. 16
15. 54
15. 51
15. 54
12. 90
13. 42
17. 01
9.22
Sm
3.11
3.39
2.91
3.10
2.92
2.93
2.87
3.75
4.11
4.15
3.93
3.68
3.98
3.19
3.09
2.92
2.80
2.77
3.45
2.10
Eu
1.124
1.176
1.044
1.083
1.035
1.062
1.009
1.270
1.401
1.510
1.470
1.380
1.440
0.854
0.870
0.812
0.836
0.772
0.993
0.672
Gd
3.63
3.89
3.33
3.54
3.37
3.31
3.27
3.99
4.53
4.32
4.10
4.09
4.10
3.13
3.21
2.76
2.65
2.47
3.03
2.01
Tb
0.670
0.709
0.639
0.661
0.626
0.612
0.613
0.652
0.744
0.750
0.710
0.730
0.710
0.517
0.486
0.421
0.482
0.442
0.547
0.352
Dy
3.94
4.21
3.73
3.95
3.76
3.63
3.65
3.87
4.43
4.34
4.13
4.35
4.16
3.26
2.97
2.51
2.62
2.36
2.92
1.87
Ho
0.707
0.739
0.654
0.689
0.658
0.637
0.640
0.786
0.902
0.870
0.830
0.860
0.830
0.707
0.636
0.520
0.638
0.570
0.714
0.455
Er
1.87
1.93
1.70
1.79
1.72
1.68
1.69
2.14
2.45
2.33
2.19
2.26
2.23
2.10
1.85
1.52
1.65
1.49
1.88
1.17
Tm
0.259
0.262
0.228
0.241
0.233
0.230
0.233
0.296
0.335
0.340
0.320
0.330
0.330
0.342
0.295
0.244
0.288
0.260
0.340
0.204
Yb
1.56
1.62
1.46
1.54
1.47
1.43
1.43
1.88
2.09
2.07
1.97
1.99
2.00
2.21
1.88
1.59
1.74
1.58
2.12
1.25
Lu
0.224
0.234
0.213
0.217
0.210
0.209
0.211
0.279
0.319
0.300
0.280
0.280
0.290
0.351
0.301
0.247
0.276
0.253
0.347
0.199
Hf
2.50
2.41
2.37
2.46
2.52
2.52
2.52
2.48
2.50
2.67
2.51
2.55
2.53
3.08
1.56
0.90
1.53
1.14
1.48
1.21
Table1:continued
JOURNAL OF PETROLOGY VOLUME 45 NUMBER 5 MAY 2004
982
by guest on April 16, 2016
http://petrology.oxfordjournals.org/D
ownloaded from

Volcan
icfield:
Mienhuayu(M
HY)
Pen
gch
iayu
(PCY)
KeelungVolcan
icGroup(KLVG)
Sam
ple
no.:
MHY-2-3
MHY-2-4
MHY-2-5
MHY-2-6
MHY-2-7
MHY-2-8
MHY-2-9
Pen
-17
Pen
-20
PGU-03
PGU-04
PGU-05
PGU-07
TS-3
GML
CKS5-1
L-2
L-15
L-25
CH-7
Ta
0.376
0.359
0.346
0.365
0.399
0.387
0.375
0.366
0.473
0.380
0.360
0.290
0.360
0.645
0.419
0.612
0.641
0.619
0.542
0.394
Pb
1.86
1.70
0.76
1.65
1.61
6.72
1.17
4.93
5.61
3.23
3.31
2.06
4.89
45. 16
7.72
12. 86
7.44
10. 21
12. 55
6.28
Th
0.98
0.91
0.87
0.94
1.09
1.02
0.95
1.64
1.74
1.75
1.66
1.42
1.67
7.10
5.42
6.04
6.90
8.06
8.93
4.06
U0.27
0.31
0.33
0.29
0.27
0.26
0.26
0.50
0.50
0.54
0.52
0.42
0.53
2.82
2.05
2.15
2.56
2.65
3.09
1.42
Volcan
icfield:
KLVG
TatunVolcan
icGroup(TTVG)
Kuan
yinshan
(KYS)
Tsaolingshan
(TLS)
Sam
ple
no.:
CH-14
A-3
A-4
A-10
A-18
A-31
A-99
A-129
H-B-1
B-2
K-41
K-57
K-60
K-64
K-99
K-108
TLS-1
TLS-3
TLS-8
TLS-12
Majorelem
ent(w
t%)
SiO
257. 07
58. 22
55. 20
56. 01
54. 95
56. 65
52. 61
49. 27
51. 94
50. 10
51. 43
51. 26
54. 52
50. 42
59. 98
64. 20
48. 29
47. 65
48. 36
47. 64
TiO
20.49
0.54
0.60
0.52
0.75
0.54
0.81
1.54
1.33
1.54
0.85
1.12
0.79
1.07
0.49
0.35
0.81
0.80
0.81
0.82
Al 2O3
17. 73
18. 52
19. 68
18. 01
19. 35
17. 95
18. 86
17. 38
17. 17
17. 26
17. 08
15. 59
16. 98
14. 85
18. 22
18. 89
11. 80
12. 75
12. 20
11. 44
Fe 2O3*
6.69
6.83
7.30
7.12
7.74
7.47
8.05
9.54
9.32
9.38
8.27
8.68
7.23
8.33
4.29
3.28
7.36
7.24
7.25
7.40
MnO
0.13
0.14
0.14
0.14
0.14
0.14
0.14
0.17
0.16
0.16
0.17
0.16
0.15
0.15
0.10
0.09
0.13
0.13
0.13
0.13
MgO
3.90
2.92
3.46
4.42
3.73
3.22
4.55
5.95
6.13
5.80
7.71
7.96
6.67
8.40
3.38
2.22
15. 51
14. 72
14. 83
16. 07
CaO
7.72
7.26
8.09
8.27
8.19
6.55
9.15
10. 64
10. 21
10. 42
9.29
10. 12
8.91
10. 43
6.01
4.71
7.29
7.24
7.27
7.16
Na 2O
3.05
2.94
2.87
2.66
2.79
2.37
2.50
2.23
2.40
2.38
2.72
2.56
2.80
2.17
3.50
4.68
1.80
1.91
1.89
1.74
K2O
1.65
1.54
1.48
1.76
1.84
1.60
1.70
1.42
1.36
1.53
1.69
1.86
1.72
1.72
2.04
1.91
4.84
4.58
4.82
5.13
P2O5
0.24
0.20
0.22
0.26
0.26
0.25
0.20
0.25
0.23
0.25
0.48
0.37
0.47
0.34
0.31
0.27
1.56
1.54
1.55
1.60
LOI
n.d.
1.17
0.63
0.85
1.05
3.68
0.21
0.18
n.d.
n.d.
0.08
n.d.
n.d.
2.41
1.53
n.d.
n.d.
n.d.
0.01
n.d.
Total
98. 66
100.28
99. 67
100.02
100.43
100.42
98. 78
98. 57
100.24
98. 82
99. 75
99. 68
100.23
100.29
99. 85
100.60
99. 39
98. 56
99. 12
99. 13
Mgno.
0.56
0.48
0.51
0.57
0.51
0.48
0.55
0.58
0.59
0.57
0.67
0.67
0.67
0.69
0.63
0.60
0.82
0.82
0.82
0.83
Trace
elem
ent(ppm)
Sc
22. 9
14. 4
12. 3
29. 5
29. 0
21. 7
21. 2
24. 6
25. 2
24. 2
34. 5
47. 4
30. 5
48. 5
24. 0
15. 9
28. 5
25. 6
29. 5
25. 8
V238
182
177
273
262
206
281
299
323
319
257
287
219
309
135
59191
139
190
141
Cr
274
369
514
1784
112
99249
282
212
292
6323
1064
965
958
1145
Co
28. 2
17. 3
16. 5
23. 4
23. 3
18. 1
26. 2
35. 2
32. 8
33. 5
34. 3
41. 3
29. 3
42. 7
14. 3
7.7
47. 4
41. 9
46. 2
44. 8
Ni
10. 4
6.2
5.8
13. 7
8.3
7.0
11. 4
30. 7
29. 7
26. 7
105.5
93. 2
79. 4
93. 6
36. 2
17. 2
492.0
437.4
466.6
511.4
Cu
n.d.
59. 8
41. 6
n.d.
n.d.
n.d.
134.0
91. 6
102.9
102.5
48. 8
94. 6
40. 8
91. 7
48. 3
18. 7
37. 0
33. 1
38. 9
29. 8
Zn
55. 9
68. 2
65. 6
60. 8
63. 5
67. 5
79. 0
117.1
89. 0
87. 1
69. 0
61. 3
65. 2
61. 2
47. 2
39. 7
60. 0
43. 1
57. 6
43. 0
Ga
n.d.
18. 6
18. 8
n.d.
n.d.
n.d.
17. 8
20. 2
19. 6
20. 4
19. 8
17. 7
20. 0
17. 7
21. 2
19. 2
12. 6
12. 0
12. 8
11. 8
Rb
5844
4618
8445
5945
4344
9998
117
85140
110
1089
2114
1412
1045
Sr
401
412
411
453
431
401
431
463
419
445
771
643
945
630
1394
1382
704
670
733
661
Y13. 5
20. 9
18. 3
11. 8
19. 0
14. 4
17. 8
23. 8
22. 8
23. 3
21. 9
22. 7
19. 6
20. 7
15. 7
7.6
14. 7
12. 9
14. 8
13. 1
WANG et al. GEODYNAMIC EVOLUTION OF NORTHERN TAIWAN
983
by guest on April 16, 2016
http://petrology.oxfordjournals.org/D
ownloaded from
Volcan
icfield:
KLVG
TatunVolcan
icGroup(TTVG)
Kuan
yinshan
(KYS)
Tsaolingshan
(TLS)
Sam
ple
no.:
CH-14
A-3
A-4
A-10
A-18
A-31
A-99
A-129
H-B-1
B-2
K-41
K-57
K-60
K-64
K-99
K-108
TLS-1
TLS-3
TLS-8
TLS-12
Zr
36. 6
67. 7
65. 6
71. 0
69. 1
63. 6
71. 3
108.2
99. 0
109.2
120.9
123.5
138.4
113.0
162.9
49. 7
118.7
110.8
121.4
111.2
Nb
4.1
5.3
5.1
4.7
5.5
3.6
5.4
9.5
8.3
9.6
14. 1
19. 4
19. 7
17. 8
29. 4
33. 9
16. 3
15. 4
17. 1
15. 3
Cs
2.77
1.39
1.45
2.56
2.62
1.89
4.68
4.06
3.53
4.17
3.83
6.62
7.42
1.95
26. 10
11. 14
136.75
173.89
166.84
125.42
Ba
415
406
402
452
515
396
382
434
420
427
629
558
726
539
1092
1060
938
997
968
1009
La
10. 20
16. 49
15. 31
7.37
15. 28
12. 78
13. 32
19. 13
16. 78
18. 57
28. 32
25. 59
35. 12
22. 46
57. 66
50. 37
24. 36
26. 16
24. 70
25. 94
Ce
21. 0
32. 6
30. 5
19. 8
31. 9
23. 3
27. 9
41. 6
37. 2
42. 0
54. 0
46. 8
62. 9
43. 0
90. 8
68. 7
48. 7
52. 0
49. 0
52. 2
Pr
2.48
4.05
3.64
2.39
4.02
3.35
3.41
5.36
4.75
5.30
6.41
5.67
7.02
5.17
9.37
7.31
5.90
6.25
5.93
6.31
Nd
9.85
16. 42
14. 88
10. 35
16. 66
13. 81
14. 63
23. 01
20. 68
22. 76
24. 18
22. 24
25. 02
20. 32
29. 47
21. 83
23. 70
25. 63
23. 72
25. 98
Sm
2.13
3.28
2.96
2.37
3.61
2.76
3.10
4.96
4.45
4.93
4.36
4.43
4.26
4.14
4.01
2.83
4.45
4.88
4.47
4.93
Eu
0.635
0.910
0.860
0.640
0.920
0.818
0.960
1.480
1.330
1.480
1.306
1.365
1.261
1.260
1.117
0.875
1.117
1.144
1.087
1.218
Gd
2.14
3.35
3.03
2.30
3.33
2.47
3.21
4.87
4.52
4.95
3.75
4.07
3.55
3.87
2.70
1.78
3.53
3.60
3.50
3.72
Tb
0.336
0.530
0.470
0.394
0.517
0.380
0.490
0.720
0.690
0.740
0.590
0.627
0.539
0.593
0.433
0.279
0.465
0.510
0.466
0.519
Dy
2.05
3.06
2.69
2.59
3.14
2.32
2.84
3.88
3.77
4.01
3.46
3.71
3.11
3.48
2.38
1.41
2.47
2.62
2.47
2.72
Ho
0.437
0.670
0.600
0.578
0.655
0.503
0.600
0.810
0.790
0.830
0.708
0.745
0.621
0.705
0.485
0.278
0.490
0.532
0.480
0.548
Er
1.30
2.04
1.85
1.71
1.88
1.50
1.83
2.33
2.30
2.41
2.07
2.10
1.84
1.99
1.46
0.77
1.38
1.49
1.37
1.55
Tm
0.211
0.300
0.270
0.256
0.270
0.219
0.250
0.320
0.320
0.320
0.324
0.314
0.289
0.300
0.229
0.104
0.205
0.221
0.204
0.221
Yb
1.39
2.02
1.88
1.69
1.77
1.47
1.79
2.11
2.13
2.18
2.15
2.00
1.89
1.89
1.53
0.70
1.28
1.37
1.29
1.40
Lu
0.224
0.310
0.280
0.266
0.274
0.241
0.260
0.310
0.310
0.310
0.332
0.305
0.300
0.287
0.252
0.103
0.197
0.203
0.196
0.206
Hf
1.15
1.67
1.58
1.95
1.87
1.59
1.75
2.77
2.55
2.85
3.08
3.05
3.52
2.90
4.33
1.47
3.16
3.42
3.17
3.43
Ta
0.363
0.300
0.290
0.264
0.306
0.205
0.280
0.540
0.480
0.550
0.739
1.075
1.055
0.994
1.780
1.986
0.885
0.975
0.925
0.945
Pb
5.83
6.29
7.26
12. 02
9.54
8.05
6.88
7.32
7.09
7.15
15. 12
13. 53
22. 30
12. 10
40. 63
39. 03
30. 99
27. 83
27. 10
25. 59
Th
3.33
5.60
5.30
2.29
4.86
3.21
6.96
5.92
5.33
5.45
10. 48
8.17
14. 08
7.91
22. 42
23. 91
19. 17
22. 85
19. 56
22. 88
U1.12
0.79
0.82
1.85
1.48
1.48
1.15
0.89
0.83
0.86
4.86
3.54
6.35
3.39
10. 67
6.26
18. 02
21. 24
18. 42
21. 67
Volcan
icfield:Tsaolingshan
(TLS)
Sam
ple
no.:
TLS-17
TLS-18
TLS-23
TLS-24
TLS-27
T-16
T-20
T-24
T-30
T-43
T-48
TLS-5
TLS-14
TLS-19
TLS-20
TLS-21
TLS-29
T-17
T-21
T-22
Majorelem
ent(w
t%)
SiO
247. 06
47. 02
47. 18
47. 88
47. 03
44. 62
47. 15
48. 83
48. 24
48. 95
47. 93
47. 70
47. 96
47. 58
47. 30
47. 22
47. 29
48. 32
47. 91
48. 54
TiO
20.82
0.82
0.83
0.81
0.80
0.80
0.92
0.82
0.83
0.83
0.79
0.80
0.81
0.83
0.83
0.83
0.81
0.84
0.84
0.82
Al 2O3
12. 07
11. 98
13. 01
11. 70
12. 86
17. 49
12. 38
11. 71
11. 72
11. 80
12. 04
12. 63
12. 39
12. 20
12. 39
12. 62
12. 52
11. 92
12. 24
11. 56
Fe 2O3*
7.34
7.38
7.40
7.33
7.35
7.48
8.53
7.71
7.63
7.58
7.50
7.29
7.35
7.38
7.39
7.42
7.58
7.69
7.87
7.77
Table1:continued
JOURNAL OF PETROLOGY VOLUME 45 NUMBER 5 MAY 2004
984
by guest on April 16, 2016
http://petrology.oxfordjournals.org/D
ownloaded from
Volcan
icfield:Tsaolingshan
(TLS)
Sam
ple
no.:
TLS-17
TLS-18
TLS-23
TLS-24
TLS-27
T-16
T-20
T-24
T-30
T-43
T-48
TLS-5
TLS-14
TLS-19
TLS-20
TLS-21
TLS-29
T-17
T-21
T-22
MnO
0.13
0.13
0.13
0.13
0.13
0.13
0.14
0.13
0.13
0.13
0.13
0.12
0.13
0.13
0.13
0.13
0.13
0.13
0.13
0.13
MgO
16. 01
16. 12
14. 82
15. 16
15. 23
13. 93
15. 52
14. 21
14. 24
14. 25
15. 50
15. 04
14. 91
14. 79
14. 73
14. 76
15. 00
14. 13
14. 39
14. 51
CaO
7.08
7.10
7.46
7.27
7.16
7.02
7.48
7.35
7.30
7.26
6.81
7.28
7.33
7.41
7.46
7.49
7.31
7.39
7.45
7.35
Na 2O
1.72
1.72
1.99
1.83
1.77
1.89
1.83
1.89
1.92
1.84
1.73
1.80
2.00
1.86
1.93
1.94
2.15
2.03
1.88
1.95
K2O
5.10
5.12
4.26
5.28
5.03
3.66
2.84
5.29
5.28
5.49
5.15
4.79
4.34
4.94
4.49
4.31
4.13
4.82
4.44
4.92
P2O5
1.57
1.58
1.56
1.57
1.53
1.44
1.66
1.53
1.51
1.59
1.57
1.56
1.56
1.56
1.57
1.57
1.56
1.54
1.54
1.53
LOI
n.d.
n.d.
n.d.
n.d.
0.18
0.58
1.30
0.10
0.80
0.12
0.04
n.d.
n.d.
n.d.
n.d.
n.d.
n.d.
n.d.
n.d.
n.d.
Total
98. 90
98. 97
98. 64
98. 96
99. 07
99. 04
99. 75
99. 57
99. 60
99. 84
99. 19
99. 01
98. 78
98. 68
98. 22
98. 29
98. 48
98. 81
98. 69
99. 08
Mgno.
0.83
0.83
0.81
0.82
0.82
0.80
0.80
0.80
0.80
0.80
0.82
0.82
0.82
0.81
0.81
0.81
0.81
0.80
0.80
0.80
Trace
elem
ent(ppm)
Sc
25. 4
24. 0
30. 5
28. 3
27. 7
25. 9
29. 0
29. 3
28. 2
28. 0
27. 0
22. 3
22. 9
24. 0
22. 5
23. 0
23. 3
25. 0
25. 5
24. 9
V141
192
209
153
189
160
176
143
155
152
148
n.d.
n.d.
n.d.
n.d.
n.d.
n.d.
n.d.
n.d.
n.d.
Cr
1169
1218
979
992
1054
1052
1182
1053
1056
1057
1148
1201
1129
1083
1080
1088
1146
n.d.
n.d.
n.d.
Co
44. 5
49. 5
48. 7
44. 7
47. 1
45. 1
49. 6
44. 5
44. 2
43. 4
47. 1
126.2
141.7
132.0
134.2
133.7
148.3
n.d.
n.d.
n.d.
Ni
511.7
538.5
487.3
463.6
483.8
463.2
520.5
456.9
449.8
437.3
532.5
405.0
411.0
408.0
409.0
416.0
426.0
n.d.
n.d.
n.d.
Cu
33. 9
39. 1
45. 5
31. 8
34. 4
32. 9
38. 5
27. 6
34. 8
32. 4
32. 5
n.d.
n.d.
n.d.
n.d.
n.d.
n.d.
n.d.
n.d.
n.d.
Zn
45. 3
57. 9
60. 4
47. 7
58. 2
47. 0
52. 5
48. 1
52. 8
48. 7
52. 3
n.d.
n.d.
n.d.
n.d.
n.d.
n.d.
n.d.
n.d.
n.d.
Ga
11. 9
12. 7
14. 0
12. 0
12. 8
14. 8
13. 9
12. 8
12. 7
12. 8
12. 7
n.d.
n.d.
n.d.
n.d.
n.d.
n.d.
n.d.
n.d.
n.d.
Rb
1025
1084
2098
1046
1068
2546
190
1081
1063
1266
1089
n.d.
n.d.
n.d.
n.d.
n.d.
n.d.
n.d.
n.d.
n.d.
Sr
664
720
822
658
703
671
771
648
657
663
662
667
677
697
708
707
673
n.d.
n.d.
n.d.
Y13. 1
14. 7
16. 1
13. 2
14. 6
13. 7
15. 6
14. 4
14. 3
14. 0
13. 9
1317
1414
1615
n.d.
n.d.
n.d.
Zr
110.1
116.0
127.4
108.5
117.0
111.1
124.8
111.7
114.8
116.7
114.2
119
119
121
121
121
118
n.d.
n.d.
n.d.
Nb
15. 2
16. 7
17. 9
15. 0
16. 2
15. 1
17. 1
14. 6
15. 4
15. 7
15. 5
1212
1313
1313
n.d.
n.d.
n.d.
Cs
122.41
122.05
214.44
114.86
123.82
304.55
23. 58
120.32
112.95
124.46
118.46
130.79
251.73
135.08
164.77
186.57
183.87
455
386
397
Ba
1022
959
1028
885
922
850
979
851
864
925
920
963
1064
1004
1029
1042
1021
1014
1057
936
La
26. 22
24. 30
26. 04
23. 38
23. 89
23. 14
26. 52
24. 62
24. 30
24. 75
24. 56
24. 02
24. 90
25. 64
24. 65
24. 71
25. 98
26. 1
26. 4
25. 8
Ce
52. 9
48. 5
51. 8
46. 7
47. 7
46. 8
53. 1
49. 0
48. 2
49. 0
49. 1
51. 4
58. 2
58. 6
50. 9
50. 4
49. 2
53. 7
59. 0
51. 6
Pr
6.36
5.91
6.33
5.61
5.77
5.66
6.43
5.91
5.82
5.94
5.94
n.d.
n.d.
n.d.
n.d.
n.d.
n.d.
n.d.
n.d.
n.d.
Nd
26. 31
23. 91
25. 40
22. 92
23. 19
23. 21
26. 26
24. 10
23. 83
24. 48
24. 31
22. 16
24. 31
23. 66
23. 16
22. 20
22. 95
24. 1
25. 4
25. 7
Sm
5.00
4.52
4.79
4.37
4.36
4.40
4.98
4.61
4.57
4.59
4.62
5.90
6.13
6.08
5.68
5.60
5.77
6.1
5.9
6.0
Eu
1.212
1.113
1.183
1.065
1.055
1.134
1.251
1.090
1.149
1.128
1.105
1.046
1.149
1.129
1.117
1.121
1.157
1.3
1.2
1.2
Gd
3.74
3.57
3.76
3.37
3.53
3.37
3.86
3.41
3.35
3.39
3.32
n.d.
n.d.
n.d.
n.d.
n.d.
n.d.
n.d.
n.d.
n.d.
Tb
0.525
0.468
0.497
0.466
0.459
0.480
0.542
0.497
0.491
0.484
0.484
0.924
0.939
1.006
0.879
0.952
0.992
0.98
1.08
0.97
Dy
2.74
2.49
2.68
2.38
2.42
2.47
2.79
2.60
2.57
2.54
2.53
n.d.
n.d.
n.d.
n.d.
n.d.
n.d.
n.d.
n.d.
n.d.
Ho
0.552
0.492
0.524
0.482
0.476
0.499
0.566
0.527
0.522
0.518
0.509
n.d.
n.d.
n.d.
n.d.
n.d.
n.d.
n.d.
n.d.
n.d.
WANG et al. GEODYNAMIC EVOLUTION OF NORTHERN TAIWAN
985
by guest on April 16, 2016
http://petrology.oxfordjournals.org/D
ownloaded from

Volcan
icfield:Tsaolingshan
(TLS)
Sam
ple
no.:
TLS-17
TLS-18
TLS-23
TLS-24
TLS-27
T-16
T-20
T-24
T-30
T-43
T-48
TLS-5
TLS-14
TLS-19
TLS-20
TLS-21
TLS-29
T-17
T-21
T-22
Er
1.55
1.40
1.49
1.37
1.35
1.42
1.62
1.47
1.45
1.43
1.43
n.d.
n.d.
n.d.
n.d.
n.d.
n.d.
n.d.
n.d.
n.d.
Tm
0.227
0.206
0.221
0.198
0.198
0.207
0.235
0.216
0.212
0.207
0.205
n.d.
n.d.
n.d.
n.d.
n.d.
n.d.
n.d.
n.d.
n.d.
Yb
1.41
1.29
1.38
1.21
1.26
1.30
1.44
1.34
1.31
1.28
1.28
1.55
1.65
1.74
1.56
1.03
1.23
1.3
1.3
1.6
Lu
0.212
0.196
0.211
0.185
0.191
0.195
0.214
0.201
0.196
0.192
0.190
0.179
0.208
0.222
0.213
0.217
0.194
0.24
0.21
0.25
Hf
3.46
3.04
3.31
2.95
3.04
3.07
3.41
3.02
3.09
3.13
3.09
2.94
7.21
3.10
3.03
3.09
3.10
3.2
2.8
3.1
Ta
0.959
0.884
0.950
0.832
0.858
0.835
0.937
0.791
0.819
0.844
0.829
0.649
0.751
0.765
0.717
0.745
0.704
0.74
0.84
0.70
Pb
30. 02
24. 73
32. 10
23. 45
20. 91
19. 87
23. 29
19. 76
19. 28
20. 15
19. 59
2527
2324
2330
n.d.
n.d.
n.d.
Th
23. 33
17. 68
20. 31
19. 76
18. 75
19. 32
21. 67
19. 76
19. 28
20. 15
19. 59
19. 12
19. 99
20. 53
18. 22
18. 70
20. 54
19. 9
20. 6
19. 6
U22. 13
18. 39
19. 16
18. 21
17. 53
18. 25
20. 01
17. 53
17. 23
17. 58
18. 12
21. 65
22. 42
22. 79
21. 67
20. 94
22. 53
20. 4
20. 4
20. 6
Volcan
icfield:
Tsaolingshan
(TLS)
Sam
ple
no.:
T-25
T-33
T-34
T-36
T-41
T-46
Majorelem
ent(w
t%)
SiO
248. 37
48. 76
47. 92
48. 16
48. 70
48. 46
TiO
20.83
0.82
0.84
0.81
0.82
0.81
Al 2O3
12. 05
11. 49
12. 20
11. 98
12. 37
12. 14
Fe 2O3*
7.63
7.57
7.70
7.46
7.55
7.52
MnO
0.13
0.12
0.13
0.12
0.13
0.13
MgO
14. 22
14. 19
14. 45
14. 01
14. 40
14. 36
CaO
7.25
7.21
7.22
7.14
7.23
7.23
Na 2O
1.91
1.91
1.93
1.91
1.80
1.77
K2O
5.25
5.37
4.45
5.53
5.08
4.85
P2O5
1.52
1.60
1.57
1.57
1.58
1.58
LOI
n.d.
n.d.
n.d.
n.d.
n.d.
n.d.
Total
99. 16
99. 04
98. 41
98. 69
99. 66
98. 85
Mgno.
0.80
0.80
0.80
0.80
0.81
0.81
Trace
elem
ent(ppm)
Sc
24. 2
24. 8
25. 5
25. 0
24. 3
24. 6
Vn.d.
n.d.
n.d.
n.d.
n.d.
n.d.
Cr
n.d.
n.d.
n.d.
n.d.
n.d.
n.d.
Co
n.d.
n.d.
n.d.
n.d.
n.d.
n.d.
Ni
n.d.
n.d.
n.d.
n.d.
n.d.
n.d.
Table1:continued
JOURNAL OF PETROLOGY VOLUME 45 NUMBER 5 MAY 2004
986
by guest on April 16, 2016
http://petrology.oxfordjournals.org/D
ownloaded from
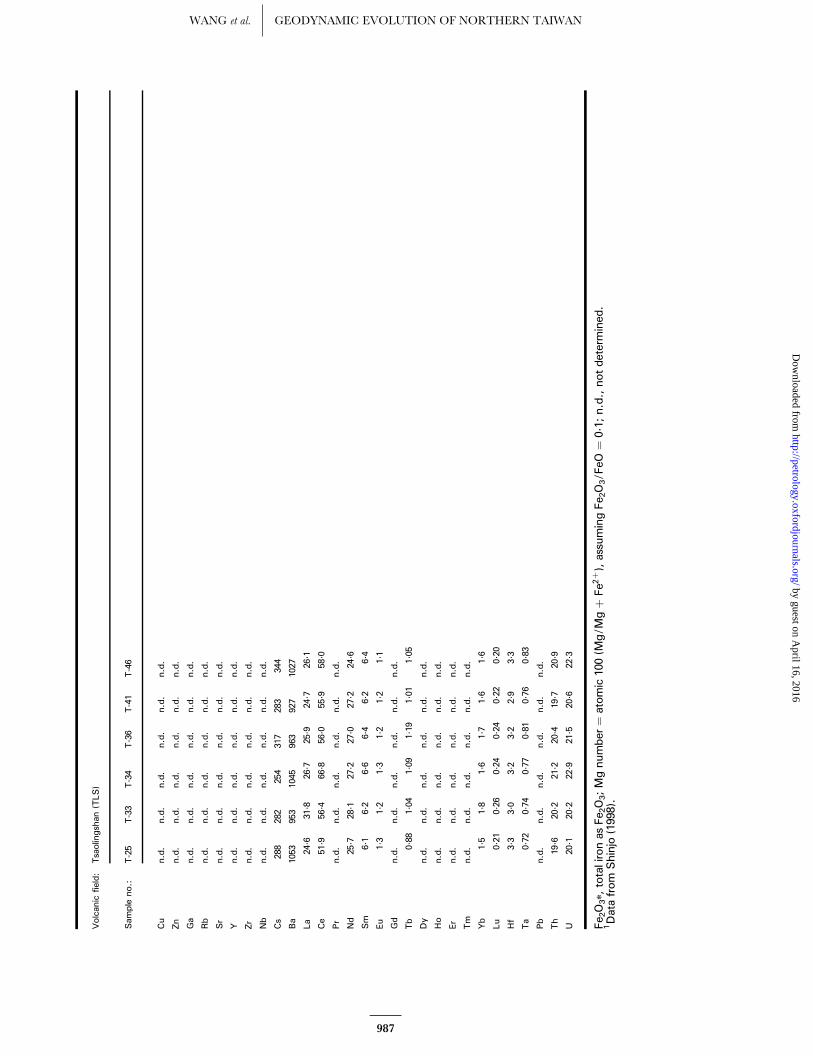
Volcan
icfield:
Tsaolingshan
(TLS)
Sam
ple
no.:
T-25
T-33
T-34
T-36
T-41
T-46
Cu
n.d.
n.d.
n.d.
n.d.
n.d.
n.d.
Zn
n.d.
n.d.
n.d.
n.d.
n.d.
n.d.
Ga
n.d.
n.d.
n.d.
n.d.
n.d.
n.d.
Rb
n.d.
n.d.
n.d.
n.d.
n.d.
n.d.
Sr
n.d.
n.d.
n.d.
n.d.
n.d.
n.d.
Yn.d.
n.d.
n.d.
n.d.
n.d.
n.d.
Zr
n.d.
n.d.
n.d.
n.d.
n.d.
n.d.
Nb
n.d.
n.d.
n.d.
n.d.
n.d.
n.d.
Cs
288
282
254
317
283
344
Ba
1053
953
1045
963
927
1027
La
24. 6
31. 8
26. 7
25. 9
24. 7
26. 1
Ce
51. 9
56. 4
66. 8
56. 0
55. 9
58. 0
Pr
n.d.
n.d.
n.d.
n.d.
n.d.
n.d.
Nd
25. 7
28. 1
27. 2
27. 0
27. 2
24. 6
Sm
6.1
6.2
6.6
6.4
6.2
6.4
Eu
1.3
1.2
1.3
1.2
1.2
1.1
Gd
n.d.
n.d.
n.d.
n.d.
n.d.
n.d.
Tb
0.88
1.04
1.09
1.19
1.01
1.05
Dy
n.d.
n.d.
n.d.
n.d.
n.d.
n.d.
Ho
n.d.
n.d.
n.d.
n.d.
n.d.
n.d.
Er
n.d.
n.d.
n.d.
n.d.
n.d.
n.d.
Tm
n.d.
n.d.
n.d.
n.d.
n.d.
n.d.
Yb
1.5
1.8
1.6
1.7
1.6
1.6
Lu
0.21
0.26
0.24
0.24
0.22
0.20
Hf
3.3
3.0
3.2
3.2
2.9
3.3
Ta
0.72
0.74
0.77
0.81
0.76
0.83
Pb
n.d.
n.d.
n.d.
n.d.
n.d.
n.d.
Th
19. 6
20. 2
21. 2
20. 4
19. 7
20. 9
U20. 1
20. 2
22. 9
21. 5
20. 6
22. 3
Fe 2O3*,
totalironas
Fe 2O3;Mgnumber
¼atomic100(M
g/M
gþ
Fe2
þ),assumingFe 2O3/F
eO¼
0.1;
n.d.,notdetermined
.1Datafrom
Shinjo
(1998).
WANG et al. GEODYNAMIC EVOLUTION OF NORTHERN TAIWAN
987
by guest on April 16, 2016
http://petrology.oxfordjournals.org/D
ownloaded from
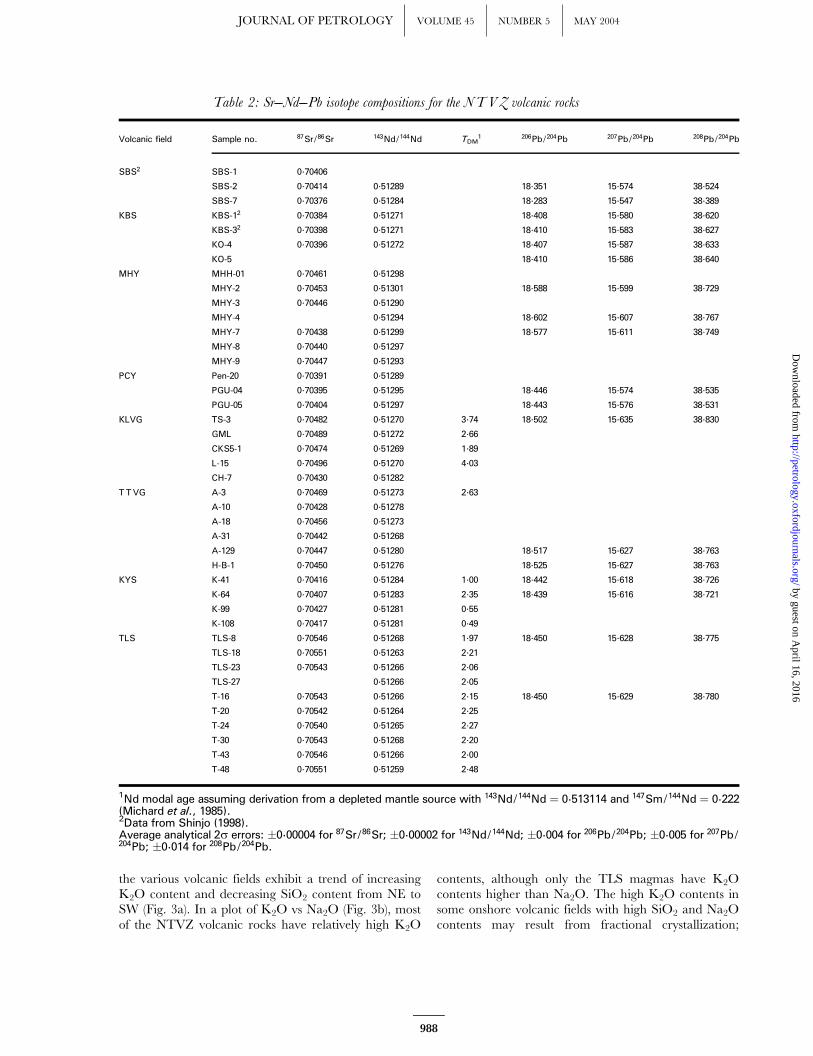
the various volcanic fields exhibit a trend of increasingK2O content and decreasing SiO2 content from NE toSW (Fig. 3a). In a plot of K2O vs Na2O (Fig. 3b), mostof the NTVZ volcanic rocks have relatively high K2O
contents, although only the TLS magmas have K2Ocontents higher than Na2O. The high K2O contents insome onshore volcanic fields with high SiO2 and Na2Ocontents may result from fractional crystallization;
Table 2: Sr---Nd---Pb isotope compositions for the NTVZ volcanic rocks
Volcanic field Sample no. 87Sr/86Sr 143Nd/144Nd TDM1 206Pb/204Pb 207Pb/204Pb 208Pb/204Pb
SBS2 SBS-1 0.70406
SBS-2 0.70414 0.51289 18.351 15.574 38.524
SBS-7 0.70376 0.51284 18.283 15.547 38.389
KBS KBS-12 0.70384 0.51271 18.408 15.580 38.620
KBS-32 0.70398 0.51271 18.410 15.583 38.627
KO-4 0.70396 0.51272 18.407 15.587 38.633
KO-5 18.410 15.586 38.640
MHY MHH-01 0.70461 0.51298
MHY-2 0.70453 0.51301 18.588 15.599 38.729
MHY-3 0.70446 0.51290
MHY-4 0.51294 18.602 15.607 38.767
MHY-7 0.70438 0.51299 18.577 15.611 38.749
MHY-8 0.70440 0.51297
MHY-9 0.70447 0.51293
PCY Pen-20 0.70391 0.51289
PGU-04 0.70395 0.51295 18.446 15.574 38.535
PGU-05 0.70404 0.51297 18.443 15.576 38.531
KLVG TS-3 0.70482 0.51270 3.74 18.502 15.635 38.830
GML 0.70489 0.51272 2.66
CKS5-1 0.70474 0.51269 1.89
L-15 0.70496 0.51270 4.03
CH-7 0.70430 0.51282
T TVG A-3 0.70469 0.51273 2.63
A-10 0.70428 0.51278
A-18 0.70456 0.51273
A-31 0.70442 0.51268
A-129 0.70447 0.51280 18.517 15.627 38.763
H-B-1 0.70450 0.51276 18.525 15.627 38.763
KYS K-41 0.70416 0.51284 1.00 18.442 15.618 38.726
K-64 0.70407 0.51283 2.35 18.439 15.616 38.721
K-99 0.70427 0.51281 0.55
K-108 0.70417 0.51281 0.49
TLS TLS-8 0.70546 0.51268 1.97 18.450 15.628 38.775
TLS-18 0.70551 0.51263 2.21
TLS-23 0.70543 0.51266 2.06
TLS-27 0.51266 2.05
T-16 0.70543 0.51266 2.15 18.450 15.629 38.780
T-20 0.70542 0.51264 2.25
T-24 0.70540 0.51265 2.27
T-30 0.70543 0.51268 2.20
T-43 0.70546 0.51266 2.00
T-48 0.70551 0.51259 2.48
1Nd modal age assuming derivation from a depleted mantle source with 143Nd/144Nd ¼ 0.513114 and 147Sm/144Nd ¼ 0.222(Michard et al., 1985).2Data from Shinjo (1998).Average analytical 2s errors: �0.00004 for 87Sr/86Sr; �0.00002 for 143Nd/144Nd; �0.004 for 206Pb/204Pb; �0.005 for 207Pb/204Pb; �0.014 for 208Pb/204Pb.
JOURNAL OF PETROLOGY VOLUME 45 NUMBER 5 MAY 2004
988
by guest on April 16, 2016
http://petrology.oxfordjournals.org/D
ownloaded from
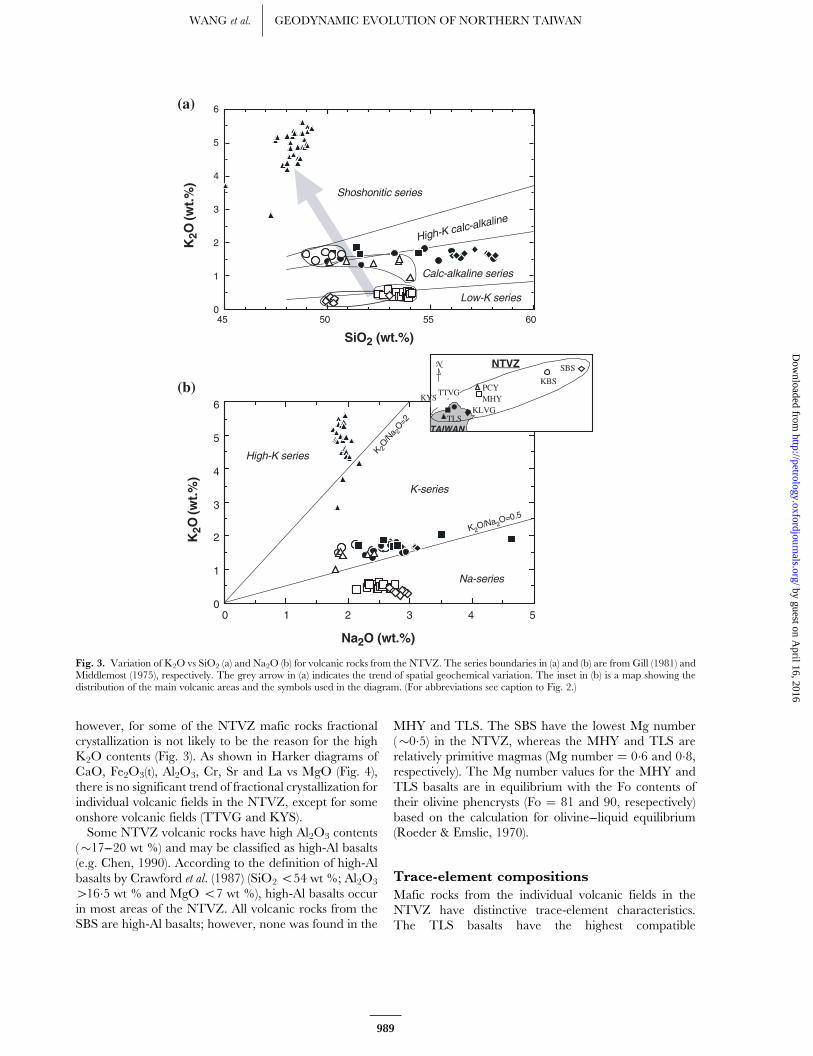
however, for some of the NTVZ mafic rocks fractionalcrystallization is not likely to be the reason for the highK2O contents (Fig. 3). As shown in Harker diagrams ofCaO, Fe2O3(t), Al2O3, Cr, Sr and La vs MgO (Fig. 4),there is no significant trend of fractional crystallization forindividual volcanic fields in the NTVZ, except for someonshore volcanic fields (TTVG and KYS).Some NTVZ volcanic rocks have high Al2O3 contents
(�17---20 wt %) and may be classified as high-Al basalts(e.g. Chen, 1990). According to the definition of high-Albasalts by Crawford et al. (1987) (SiO2 554 wt %; Al2O3
416�5 wt % and MgO 57 wt %), high-Al basalts occurin most areas of the NTVZ. All volcanic rocks from theSBS are high-Al basalts; however, none was found in the
MHY and TLS. The SBS have the lowest Mg number(�0�5) in the NTVZ, whereas the MHY and TLS arerelatively primitive magmas (Mg number ¼ 0�6 and 0�8,respectively). The Mg number values for the MHY andTLS basalts are in equilibrium with the Fo contents oftheir olivine phencrysts (Fo ¼ 81 and 90, resepectively)based on the calculation for olivine---liquid equilibrium(Roeder & Emslie, 1970).
Trace-element compositions
Mafic rocks from the individual volcanic fields in theNTVZ have distinctive trace-element characteristics.The TLS basalts have the highest compatible
Na2O (wt.%)
K-series
High-K series
Na-series
K2O
(w
t.%
)
K 2O/N
a 2O=2
K2O/Na2O
=0.5
Calc-alkaline series
Shoshonitic series
Low-K series
High-K calc-alkaline
SiO2 (wt.%)
K2O
(w
t.%
)
(a)
(b)
NTVZ SBS
KBS
MHYPCY
KLVG
TTVGKYS
N
TAIWANTLS
60555045
5432100
1
2
3
4
5
6
0
1
2
3
4
5
6
Fig. 3. Variation of K2O vs SiO2 (a) and Na2O (b) for volcanic rocks from the NTVZ. The series boundaries in (a) and (b) are from Gill (1981) andMiddlemost (1975), respectively. The grey arrow in (a) indicates the trend of spatial geochemical variation. The inset in (b) is a map showing thedistribution of the main volcanic areas and the symbols used in the diagram. (For abbreviations see caption to Fig. 2.)
WANG et al. GEODYNAMIC EVOLUTION OF NORTHERN TAIWAN
989
by guest on April 16, 2016
http://petrology.oxfordjournals.org/D
ownloaded from

trace-element contents (Ni �500 ppm; Cr �1000 ppm).This characteristic, together with their major-elementchemistry, is consistent with the TLS magmas beingnear-primary magmas. Incompatible trace-elementcharacteristics are illustrated as chondrite-normalizedrare earth element (REE) diagrams in Fig. 5 and as
primitive mantle-normalized element diagrams in Fig. 6.The REE patterns of the NTVZ volcanic rocks are lightREE (LREE) enriched, but the extent of enrichment isvariable between the volcanic fields. The SBS and MHYmafic rocks have the lowest abundances of LREE andshow relatively flat REE patterns, whereas the TLS
20151050
MgO (wt.%)
Al 2
O3O
(w
t.%
)
high-Al basalts
MgO (wt.%)
20151050
Fe 2
O3(
t) (
wt.
%)
20151050
MgO (wt.%)
Cr
(pp
m)
20151050
MgO (wt.%)
Sr
(pp
m)
201510500
10
20
30
40
50
60
MgO (wt.%)
La
(pp
m)
201510500
2
4
6
MgO (wt.%)
CaO
(w
t.%
)
NTVZ SBS
KBS
MHYPCY
KLVGTTVG
KYS
N
TAIWANTLS
0
2
4
6
8
10
12
8
10
12
14
10
12
14
16
18
20
22
0
1000
2000
1
10
100
1000
10000
Fig. 4. Variation diagrams of CaO, Fe2O3(t), Al2O3, Cr, Sr and La vs MgO, respectively, for volcanic rocks from the NTVZ. The inset shows amap of the distribution of the main volcanic areas and the symbols used in the variation diagrams.
JOURNAL OF PETROLOGY VOLUME 45 NUMBER 5 MAY 2004
990
by guest on April 16, 2016
http://petrology.oxfordjournals.org/D
ownloaded from

La Ce Pr Nd Sm Eu Gd Tb Dy Ho Er Tm Yb Lu
SBS-1 (B)
SBS-2 (B)SBS-7 (B)
La Ce Pr Nd Sm Eu Gd Tb Dy Ho Er Tm Yb Lu
KBS-1 (B)
KBS-3 (B)KO-4 (B)
La Ce Pr Nd Sm Eu Gd Tb Dy Ho Er Tm Yb Lu
Pen-17 (B)Pen-20 (B)
PGU-03 (BA)
PGU-04 (BA)PGU-05 (BA)PGU-07 (BA)
La Ce Pr Nd Sm Eu Gd Tb Dy Ho Er Tm Yb Lu
MHY-2-1 (BA)MHY-2-2 (BA)MHH-01 (BA)MHY-1 (BA)MHY-7 (BA)
La Ce Pr Nd Sm Eu Gd Tb Dy Ho Er Tm Yb Lu
TS-3 (A)GML (A)CKS5-1 (A)L-2 (A)
L-15 (A)L-25 (A)
CH-7 (A)CH-14 (A)
La Ce Pr Nd Sm Eu Gd Tb Dy Ho Er Tm Yb Lu
A-3 (A)A-4 (A)A-10 (A)A-18 (BA)A-31 (A)
A-99 (BA)A-129 (B)H-B-1 (B)B-2 (B)
La Ce Pr Nd Sm Eu Gd Tb Dy Ho Er Tm Yb Lu
K-41 (B)
K-57 (B)K-60 (BA)
K-64 (B)K-99 (A)
K-108 (D)
La Ce Pr Nd Sm Eu Gd Tb Dy Ho Er Tm Yb Lu
TLS-8 (B)TLS-18 (B)TLS-23 (B)TLS-27 (B)T-16 (B)
T-20 (B)T-24 (B)T-30 (B)T-43 (B)T-48 (B)
Ro
ck/C
1 ch
on
dri
te SBS
KBS
PCY
MHY
KLVG
TTVG
KYS
TLS
Offshore Onshore
1
10
100
1
10
100
1000
1
10
100
1000
1
10
100
1
10
100
1
10
100
1
10
100
1
10
100
Fig. 5. Chondrite-normalized REE variation diagrams for the NTVZ volcanic rocks. Normalization constants are from Sun &McDonough (1989).The letters in the legend of each diagram represent the lithology: B, basalt; BA, basaltic andesite; A, andesite; D, diorite.
WANG et al. GEODYNAMIC EVOLUTION OF NORTHERN TAIWAN
991
by guest on April 16, 2016
http://petrology.oxfordjournals.org/D
ownloaded from
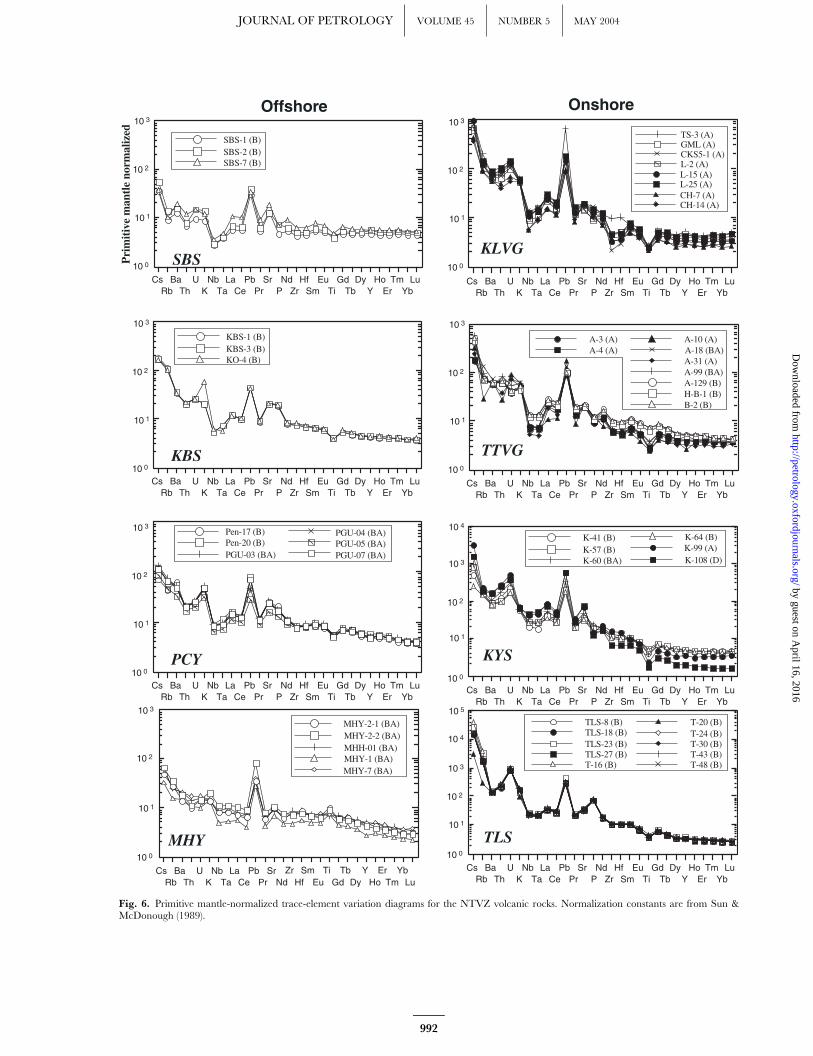
Cs Ba U Nb Nd Hf Eu Gd Dy Ho Tm LuLa Pb SrRb Th Ta Ce Pr Zr Sm Ti Tb Y Er YbPK
Cs Ba U Nb Nd Hf Eu Gd Dy Ho Tm LuLa Pb SrRb Th Ta Ce Pr Zr Sm Ti Tb Y Er YbPK
Cs Ba U Nb Nd Hf Eu Gd Dy Ho Tm LuLa Pb SrRb Th Ta Ce Pr Zr Sm Ti Tb Y Er YbPK
Cs Ba U Nb Nd Hf Eu Gd Dy Ho Tm LuLa Pb SrRb Th Ta Ce Pr Zr Sm Ti Tb Y Er YbPK
Cs Ba U Nb Nd Hf Eu Gd Dy Ho Tm LuLa Pb SrRb Th Ta Ce Pr Zr Sm Ti Tb Y Er YbPK
Cs Ba U Nb Nd Hf Eu Gd Dy Ho Tm LuLa Pb SrRb Th Ta Ce Pr Zr Sm Ti Tb Y Er YbPK
Cs Ba U Nb Nd Hf Eu Gd Dy Ho Tm LuLa Pb SrRb Th Ta Ce Pr Zr Sm Ti Tb Y Er YbPK
Cs Ba U NbNd Hf Eu Gd Dy Ho Tm Lu
La Pb SrRb Th Ta Ce Pr
Zr Sm Ti Tb Y Er YbK
10 0
10 1
10 2
10 3
SBS-1 (B)SBS-2 (B)SBS-7 (B)
10 0
10 1
10 2
10 3
KBS-1 (B)KBS-3 (B)KO-4 (B)
10 0
10 1
10 2
10 3Pen-17 (B)Pen-20 (B)PGU-03 (BA)
PGU-04 (BA)PGU-05 (BA)PGU-07 (BA)
10 0
10 1
10 2
10 3
MHY-2-1 (BA)MHY-2-2 (BA)MHH-01 (BA)MHY-1 (BA)MHY-7 (BA)
10 0
10 1
10 2
10 3
10 4
10 5
TLS-8 (B)TLS-18 (B)TLS-23 (B)TLS-27 (B)T-16 (B)
T-20 (B)T-24 (B)T-30 (B)T-43 (B)T-48 (B)
TLS
10 0
10 1
10 2
10 3
10 4
K-41 (B)K-57 (B)K-60 (BA)
K-64 (B)K-99 (A)K-108 (D)
KYS
10 0
10 1
10 2
10 3
TS-3 (A)GML (A)CKS5-1 (A)L-2 (A)L-15 (A)L-25 (A)CH-7 (A)CH-14 (A)
10 0
10 1
10 2
10 3
A-3 (A)A-4 (A)
A-10 (A)A-18 (BA)A-31 (A)A-99 (BA)A-129 (B)H-B-1 (B)B-2 (B)
Pri
mit
ive
man
tle
norm
aliz
ed
SBS
KBS
PCY
MHY
KLVG
TTVG
Offshore Onshore
Fig. 6. Primitive mantle-normalized trace-element variation diagrams for the NTVZ volcanic rocks. Normalization constants are from Sun &McDonough (1989).
JOURNAL OF PETROLOGY VOLUME 45 NUMBER 5 MAY 2004
992
by guest on April 16, 2016
http://petrology.oxfordjournals.org/D
ownloaded from

basalts are the most LREE enriched. None of the REEpatterns has an obvious negative Eu anomaly, which mayindicate that plagioclase was not a fractionating phase inthe NTVZ volcanic rocks.The primitive mantle-normalized trace-element pat-
terns of the NTVZ volcanic rocks show significant enrich-ments in large ion lithophile elements (LILE) and LREEand a pronounced Pb spike (Figs 6 and 7a). Except forthe MHY samples, which have relatively smooth trace-element patterns, all the NTVZ volcanic rocks have distincthigh field strength element (HFSE; i.e. Nb, Ta and Ti)troughs in their patterns. The TLS magmas have thehighest LILE contents, with Rb concentrations up to2500 ppm, which is the highest reported value for terres-trial rocks (Chung et al., 2001b). High LILE and Kcontents suggest that phlogopite may be present in the
mantle source of the TLS magmas (Chung et al., 2001b).The most mafic NTVZ volcanic rocks also exhibitsystematic enrichment in LILE and LREE from SBS inthe NE to TLS in the SW (Fig. 7a), paralleling the spatialvariation shown by major-element compositions.Notably, the MHY magmas do not show HFSE
depletion but they show positive Pb spikes in the trace-element plots (Fig. 7b). Overall the trace-element patternsof the MHY magmas are similar to those of MioceneTaiwan intra-plate basalts (MTIB) in northwestern Tai-wan (Chung et al., 1994, 1995a) although with lowerLILE and LREE abundances (Fig. 7b). Additionally, theMHY trace-element patterns are almost the same asthose of high-Mg andesites from Iriomote-jima, southernRyukyu (Shinjo, 1999), considered to be associatedwith extensional tectonic activity on the Asian
Cs Rb Ba Th U K Nb Ta La Ce Pb Pr Sr Nd Zr Hf SmEu Ti GdTb Dy Y Ho Er TmYb Lu
MHY
OIB
IR-HMAE-MORB
NTVZ (except MHY)
101
1
102
103
Pri
mit
ive
man
tle
norm
aliz
ed
Miocene Taiwan intraplate tholeiites
(b)
CsRbBaTh U K NbTa La CePbPr Sr P Nd Zr HfSmEu Ti Gd TbDy Y HoErTmYbLu
SBS: 2.6 MaKBS: 0.2 Ma
PCY: 2.1~0.3 MaTTVG: 2.8~0.2 MaKYS: 1.1~0.2 MaTLS: 0.2 Ma
MHY: 2.6; 0.5 Ma
NE
SW
Pri
mit
ive
man
tle
norm
aliz
ed
(a)
1
10
100
1000
10000
Fig. 7. (a) Primitive mantle-normalized trace-element diagrams for representative volcanic rocks for each volcanic field from the NTVZ. It shouldbe noted that only the mafic members are plotted and therefore KLVG is excluded. (b) Primitive mantle-normalized trace-element variationdiagram for representative MHY high-Mg basaltic andesites in comparison with Miocene intraplate basalts from NW Taiwan (MTIB; Chung et al.,1994, 1995a), high-Mg andesites of Iriomote-jima, southern Ryukyus (IR-HMA; Shinjo, 1999), E-MORB, ocean-island basalt (OIB) and otherNTVZ volcanic rocks. Normalization constants, E-MORB and OIB values are from Sun & McDonough (1989).
WANG et al. GEODYNAMIC EVOLUTION OF NORTHERN TAIWAN
993
by guest on April 16, 2016
http://petrology.oxfordjournals.org/D
ownloaded from
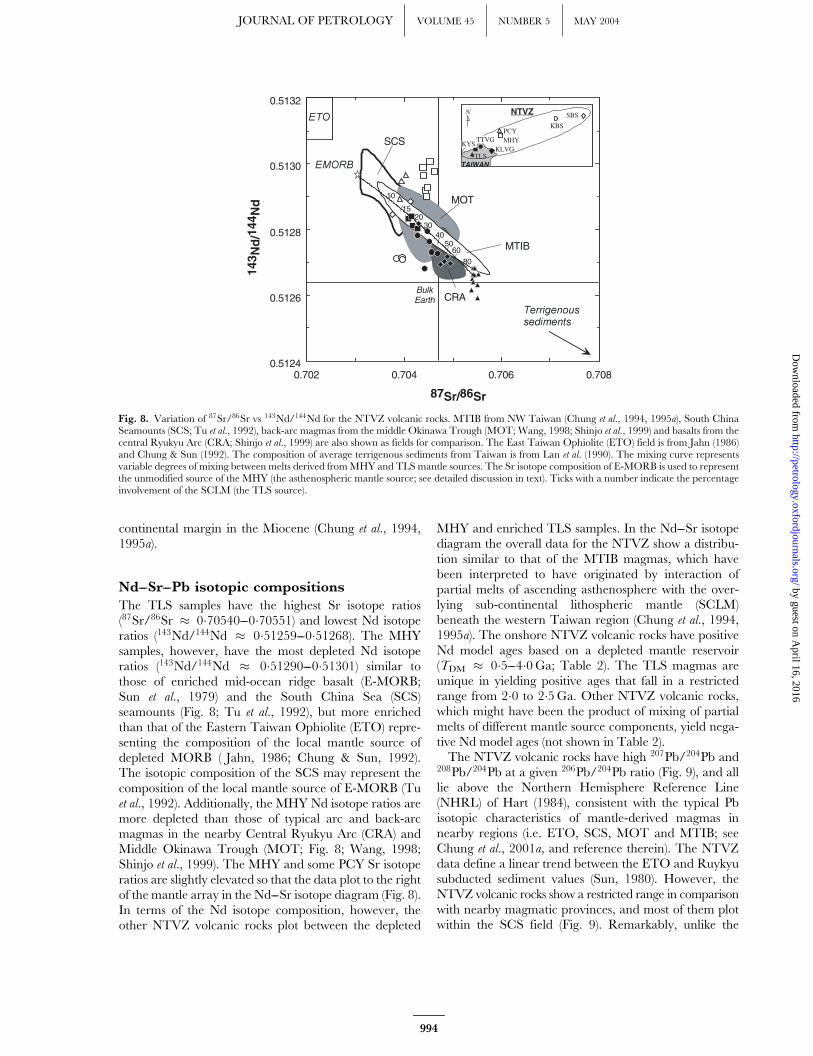
continental margin in the Miocene (Chung et al., 1994,1995a).
Nd---Sr---Pb isotopic compositions
The TLS samples have the highest Sr isotope ratios(87Sr/86Sr � 0�70540---0�70551) and lowest Nd isotoperatios (143Nd/144Nd � 0�51259---0�51268). The MHYsamples, however, have the most depleted Nd isotoperatios (143Nd/144Nd � 0�51290---0�51301) similar tothose of enriched mid-ocean ridge basalt (E-MORB;Sun et al., 1979) and the South China Sea (SCS)seamounts (Fig. 8; Tu et al., 1992), but more enrichedthan that of the Eastern Taiwan Ophiolite (ETO) repre-senting the composition of the local mantle source ofdepleted MORB ( Jahn, 1986; Chung & Sun, 1992).The isotopic composition of the SCS may represent thecomposition of the local mantle source of E-MORB (Tuet al., 1992). Additionally, the MHY Nd isotope ratios aremore depleted than those of typical arc and back-arcmagmas in the nearby Central Ryukyu Arc (CRA) andMiddle Okinawa Trough (MOT; Fig. 8; Wang, 1998;Shinjo et al., 1999). The MHY and some PCY Sr isotoperatios are slightly elevated so that the data plot to the rightof the mantle array in the Nd---Sr isotope diagram (Fig. 8).In terms of the Nd isotope composition, however, theother NTVZ volcanic rocks plot between the depleted
MHY and enriched TLS samples. In the Nd---Sr isotopediagram the overall data for the NTVZ show a distribu-tion similar to that of the MTIB magmas, which havebeen interpreted to have originated by interaction ofpartial melts of ascending asthenosphere with the over-lying sub-continental lithospheric mantle (SCLM)beneath the western Taiwan region (Chung et al., 1994,1995a). The onshore NTVZ volcanic rocks have positiveNd model ages based on a depleted mantle reservoir(TDM � 0�5---4�0Ga; Table 2). The TLS magmas areunique in yielding positive ages that fall in a restrictedrange from 2�0 to 2�5Ga. Other NTVZ volcanic rocks,which might have been the product of mixing of partialmelts of different mantle source components, yield nega-tive Nd model ages (not shown in Table 2).The NTVZ volcanic rocks have high 207Pb/204Pb and
208Pb/204Pb at a given 206Pb/204Pb ratio (Fig. 9), and alllie above the Northern Hemisphere Reference Line(NHRL) of Hart (1984), consistent with the typical Pbisotopic characteristics of mantle-derived magmas innearby regions (i.e. ETO, SCS, MOT and MTIB; seeChung et al., 2001a, and reference therein). The NTVZdata define a linear trend between the ETO and Ruykyusubducted sediment values (Sun, 1980). However, theNTVZ volcanic rocks show a restricted range in comparisonwith nearby magmatic provinces, and most of them plotwithin the SCS field (Fig. 9). Remarkably, unlike the
0.7080.7060.7040.7020.5124
0.5126
0.5128
0.5130
0.5132
87Sr/86Sr
10
2030
4050
60
15
8014
3 Nd
/144
Nd
SCS
MOT
CRA
MTIB
NTVZ SBS
KBS
MHYPCY
KLVGTTVG
KYS
N
TAIWANTLS
Bulk Earth
Fig. 8. Variation of 87Sr/86Sr vs 143Nd/144Nd for the NTVZ volcanic rocks. MTIB from NW Taiwan (Chung et al., 1994, 1995a), South ChinaSeamounts (SCS; Tu et al., 1992), back-arc magmas from the middle Okinawa Trough (MOT; Wang, 1998; Shinjo et al., 1999) and basalts from thecentral Ryukyu Arc (CRA; Shinjo et al., 1999) are also shown as fields for comparison. The East Taiwan Ophiolite (ETO) field is from Jahn (1986)and Chung & Sun (1992). The composition of average terrigenous sediments from Taiwan is from Lan et al. (1990). The mixing curve representsvariable degrees of mixing between melts derived fromMHY and TLS mantle sources. The Sr isotope composition of E-MORB is used to representthe unmodified source of the MHY (the asthenospheric mantle source; see detailed discussion in text). Ticks with a number indicate the percentageinvolvement of the SCLM (the TLS source).
JOURNAL OF PETROLOGY VOLUME 45 NUMBER 5 MAY 2004
994
by guest on April 16, 2016
http://petrology.oxfordjournals.org/D
ownloaded from

major- and trace-element compositions, the Sr---Nd---Pbisotopic compositions of the NTVZ volcanic rocks do notshow any systematic NE to SW variation.
DISCUSSION
In the following sections we consider specific aspects ofthe geochemical characteristics of the NTVZ volcanicrocks including spatial and temporal variations, the man-tle source components involved in melt generation, anddegrees of partial melting. To minimize the effects offractional crystallization, the volcanic rocks from theKLVG [which are all intermediate to silicic in composi-tion (SiO2 � 55---58 wt %)] are excluded and only maficrocks (SiO2 554 wt %) are considered. Crustal contam-ination may be an important process in the petrogenesisof the volcanic rocks from the southwestern part of theNTVZ. However, as shown by a plot of 87Sr/86Sr vs SiO2
(Fig. 10a), it does not appear to have a major influence onthe isotopic characteristics of the NTVZ volcanic rocks.In Fig. 10a the mixing line between the average compositionof the Taiwan upper crust and the MOT basalt (assumedto have a similar mantle source to the NTVZ; see
subsequent discussion) defines a steep slope, distinctfrom the variation trends for the individual volcanic fieldsin the NTVZ.
Spatial and temporal geochemical variationin magma compositions
The spatial geochemical variation from NE to SW in theNTVZ volcanic rocks, expressed as an increase in K2Ocontent, reduction in SiO2 content, and LILE and LREEenrichment (Figs 3 and 7a), suggests increasing involve-ment of an enriched mantle source component ordecreasing degrees of partial melting in the petrogenesisof the most primitive mafic magmas. In terms of theSr---Nd---Pb isotope compositions (Figs 8 and 9), however,they do not show any systematic spatial variation. Forinstance, the KYS magmas have the second highestcontents of K2O, LILE and LREE among the NTVZ(lower only than the highest TLS magmas; Figs 5, 6and 7a), whereas they have relatively higher Nd andlower Sr isotope ratios compared with the other NTVZvolcanic rocks (Fig. 8). Thus, the Nd---Sr isotope composi-tion of the NTVZ volcanic rocks does not support a
19.519.018.518.017.515.3
15.4
15.5
15.6
15.7
15.8
EM2
EM1
37.5
38.0
38.5
39.0
39.5
40.0
EM2
EM120
8 Pb/
204 P
bMOT
MTIB
NHRL
ETO
MOT
NHRL
ETO
MTIB
SCS
Geo
chro
n
207 P
b/20
4 Pb
206Pb/204Pb
Ryukyu subducted sediments
Ryukyu subducted sediments
SCS
NTVZ SBS
KBS
MHYPCY
KLVGTTVG
KYS
N
TAIWANTLS
Fig. 9. 208Pb/204Pb and 207Pb/204Pb vs 206Pb/204Pb diagrams for the NTVZ volcanic rocks. Data for the ETO and Ryukyu subducted sedimentsare from Sun (1980). The enriched mantle components EM1 and EM2 are from Hart (1988). The NHRL is from Hart (1984). Other data sourcesare the same as in Fig. 8.
WANG et al. GEODYNAMIC EVOLUTION OF NORTHERN TAIWAN
995
by guest on April 16, 2016
http://petrology.oxfordjournals.org/D
ownloaded from
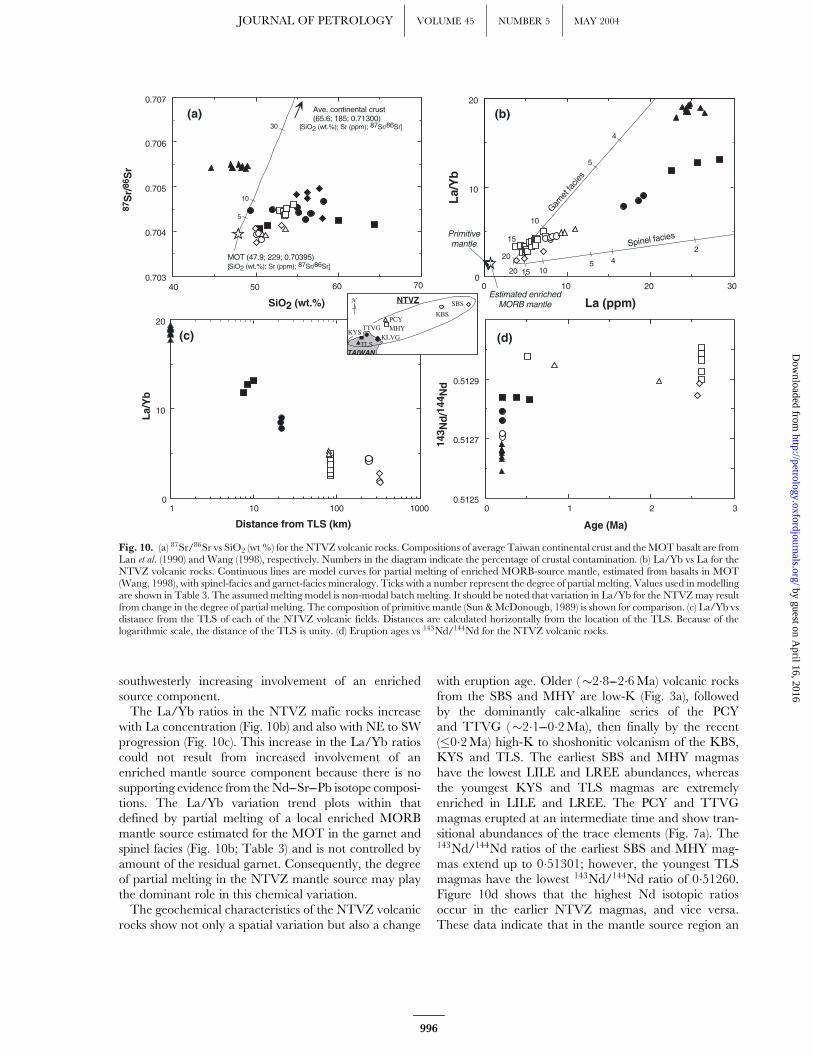
southwesterly increasing involvement of an enrichedsource component.The La/Yb ratios in the NTVZ mafic rocks increase
with La concentration (Fig. 10b) and also with NE to SWprogression (Fig. 10c). This increase in the La/Yb ratioscould not result from increased involvement of anenriched mantle source component because there is nosupporting evidence from the Nd---Sr---Pb isotope composi-tions. The La/Yb variation trend plots within thatdefined by partial melting of a local enriched MORBmantle source estimated for the MOT in the garnet andspinel facies (Fig. 10b; Table 3) and is not controlled byamount of the residual garnet. Consequently, the degreeof partial melting in the NTVZ mantle source may playthe dominant role in this chemical variation.The geochemical characteristics of the NTVZ volcanic
rocks show not only a spatial variation but also a change
with eruption age. Older (�2�8---2�6Ma) volcanic rocksfrom the SBS and MHY are low-K (Fig. 3a), followedby the dominantly calc-alkaline series of the PCYand TTVG (�2�1---0�2Ma), then finally by the recent(�0�2Ma) high-K to shoshonitic volcanism of the KBS,KYS and TLS. The earliest SBS and MHY magmashave the lowest LILE and LREE abundances, whereasthe youngest KYS and TLS magmas are extremelyenriched in LILE and LREE. The PCY and TTVGmagmas erupted at an intermediate time and show tran-sitional abundances of the trace elements (Fig. 7a). The143Nd/144Nd ratios of the earliest SBS and MHY mag-mas extend up to 0�51301; however, the youngest TLSmagmas have the lowest 143Nd/144Nd ratio of 0�51260.Figure 10d shows that the highest Nd isotopic ratiosoccur in the earlier NTVZ magmas, and vice versa.These data indicate that in the mantle source region an
20 15 105 4
215
5
4
20
10
Primitive mantle
0
10
20
La (ppm)
(b)
La/
Yb
3020100
Spinel facies
Garne
t fac
ies
Estimated enriched MORB mantle
32100.5125
0.5127
0.5129
0.5131
Age (Ma)
143 N
d/1
44N
d
(d)
70605040
(a)87
Sr/
86S
r
0.703
0.704
0.705
0.706
0.707
MOT (47.9; 229; 0.70395)
Ave. continental crust (65.6; 185; 0.71300)
[SiO2 (wt.%); Sr (ppm); 87Sr/86Sr]
5
10
30 [SiO2 (wt.%); Sr (ppm); 87Sr/86Sr]
SiO2 (wt.%)
Distance from TLS (km)
La/
Yb
10001001010
10
20
(c)
NTVZ SBS
KBS
MHYPCY
KLVGTTVG
KYS
N
TAIWANTLS
Fig. 10. (a) 87Sr/86Sr vs SiO2 (wt %) for the NTVZ volcanic rocks. Compositions of average Taiwan continental crust and theMOT basalt are fromLan et al. (1990) and Wang (1998), respectively. Numbers in the diagram indicate the percentage of crustal contamination. (b) La/Yb vs La for theNTVZ volcanic rocks. Continuous lines are model curves for partial melting of enriched MORB-source mantle, estimated from basalts in MOT(Wang, 1998), with spinel-facies and garnet-facies mineralogy. Ticks with a number represent the degree of partial melting. Values used in modellingare shown in Table 3. The assumed melting model is non-modal batch melting. It should be noted that variation in La/Yb for the NTVZmay resultfrom change in the degree of partial melting. The composition of primitive mantle (Sun &McDonough, 1989) is shown for comparison. (c) La/Yb vsdistance from the TLS of each of the NTVZ volcanic fields. Distances are calculated horizontally from the location of the TLS. Because of thelogarithmic scale, the distance of the TLS is unity. (d) Eruption ages vs 143Nd/144Nd for the NTVZ volcanic rocks.
JOURNAL OF PETROLOGY VOLUME 45 NUMBER 5 MAY 2004
996
by guest on April 16, 2016
http://petrology.oxfordjournals.org/D
ownloaded from

enriched component became more important in the gen-eration of the younger NTVZ magmas. In summary, thespatial variation of the NTVZ volcanic rocks reflectsdifferences in the degrees of partial melting, whereastheir isotopic change with time suggests changes incompositions of the mantle source components beneaththe NTVZ.
Mantle source components
The asthenospheric mantle and subcontinental lithosphericmantle (SCLM) source components
The MHY and TLS magmas are the most two primitivemelts in the NTVZ, which might shed light on the mantlesource components. The TLS magmas are highlymagnesian (MgO � 15 wt %; Mg number � 80---83) andpotassic (K2O � 5 wt %; K2O/Na2O � 1�6---3�0) withenriched LILE and LREE contents but relatively lowbasaltic components (i.e. Al2O3 � 12 wt %, totalFe2O3 � 7�5 wt % and CaO � 7�5 wt %). They havethe lowest Nd and highest Sr isotopic ratios among theNTVZ. Their overall geochemical characteristics arecomparable with those of the Group I ultrapotassicrocks defined by Foley et al. (1987), such as orogenic
lamproites from central Italy, Spain and Tibet. On thisbasis, Chung et al. (2001b) suggested that the TLS mag-mas resulted from partial melting of a phlogopite-bearingharzburgitic source in the SCLM that underwent a recentmetasomatism by subduction-derived fluids. Thus, anenriched SCLM is one of the potential mantle sourcecomponents for the NTVZ volcanic rocks. The TLS Ndmodel ages also strongly suggest an SCLM origin. Ndmodel ages ranging from 2�0 to 2�5Ga are consistent withRe---Os model ages for sulphides in peridotite mantlexenoliths entrained by the MTIB (TRD � 1�9�2�3Ga;Wang et al., 2003) indicating the presence of ProterozoicSCLM domains beneath northern Taiwan. On the otherhand, the MHY magmas have high MgO contents(� 5�9---8�1 wt %, Mg number � 0�6) relative to SiO2
(� 52�8---54�5 wt %), with moderate enrichment in LILEand LREE but no apparent HFSE depletion (Fig. 7b).They have high basaltic components (i.e. CaO �7�7---8�5 wt %, total Fe2O3 � 10�2---11�8 wt % andTiO2 � 1�4---1�8 wt %) reflecting a fertile mantle source.Although their elevatedSiO2contents (� 52�8---54�5wt%)could indicate fractional crystallization, the high-Mgcharacteristics of the MHY magmas suggest a primitivenature for these silica-saturated magmas (Wang et al.,2002). These high-Mg basaltic andesites have the highestNd isotope ratios and relatively elevated Sr isotopicratios. The geochemical characteristics of the MHYmagmas are similar to those of the MTIB magmas innorthwestern Taiwan (Chung et al., 1994, 1995a) andalmost the same as those of high-Mg andesites fromIriomote-jima, southern Ryukyus (Shinjo, 1999; Fig. 7b);both are considered to be examples of intra-platevolcanism caused by extensional tectonic activity ontheAsian continentalmargin in theMiocene. Similar to themost depleted SCS and NTIB samples (Tu et al., 1992;Chung et al., 1994, 1995a), the MHY lavas have highNd isotopic ratios (143Nd/144Nd � 0�51290---0�51301),which suggest a similar mantle source to the localenriched asthenospheric mantle. This source is not thesame as the SCLM that produced the TLS magmas. It isalso difficult to ascribe the MHY magmas to an SCLMsource because such a source with a Nd isotopic ratio ofup to �0�51301 is probably too refractory to produce thehigh degree of partial melting required for the MHYmagmas (Fig. 10b). Thus, Wang et al. (2002) suggestedthat the MHY magmas were derived from anasthenospheric mantle source with E-MORB character-istics. The high Sr isotopic ratios (87Sr/86Sr �0�70438---0�70453; Wang et al., 2002) of the MHY mag-mas are inferred to be derived by fluxing of aqueous slabfluids with no sedimentary components into the mantlesource region. This process is analogous to that suggestedfor the petrogenesis of some island arc tholeiites in theSouth Sandwich and the Izu---Bonin---Mariana arcs (e.g.Pearce et al., 1995; Taylor & Nesbitt, 1998).
Table 3: Values used in modelling the degree
of partial melting
Spinel peridotite Garnet peridotite
Source
mode (X)
Melting
mode (Pi)
Source
mode (X)
Melting
mode (Pi)
Ol 0.53 ---0.4 0.6 0.1
Opx 0.27 0.3 0.2 0.18
Cpx 0.17 0.9 0.1 0.3
Spinel 0.03 0.2
Garnet 0.1 0.42
Ref. 1 2 1 2
Bulk D Melt
mode (P)
Bulk D Melt
mode (P)
Estimated
E-MORB
mantle conc.
Nb 0.0026 0.0109 0.0025 0.0074 0.5
La 0.0101 0.0496 0.0062 0.0171 0.74
Tb 0.0772 0.3976 0.1660 0.6373 0.15
Yb 0.0962 0.3897 0.7050 2.8262 0.67
Ref. 3 3 4
1, Johnson (1998); 2, Kelemen et al. (1993); 3, Pearce &Parkinson (1993) and Halliday et al. (1995); 4, estimatedfrom basalts in Middle Okinawa Trough (MOT; Wang,1998; Shinjo et al., 1999) assuming the degree of partialmelting is 15%.
WANG et al. GEODYNAMIC EVOLUTION OF NORTHERN TAIWAN
997
by guest on April 16, 2016
http://petrology.oxfordjournals.org/D
ownloaded from
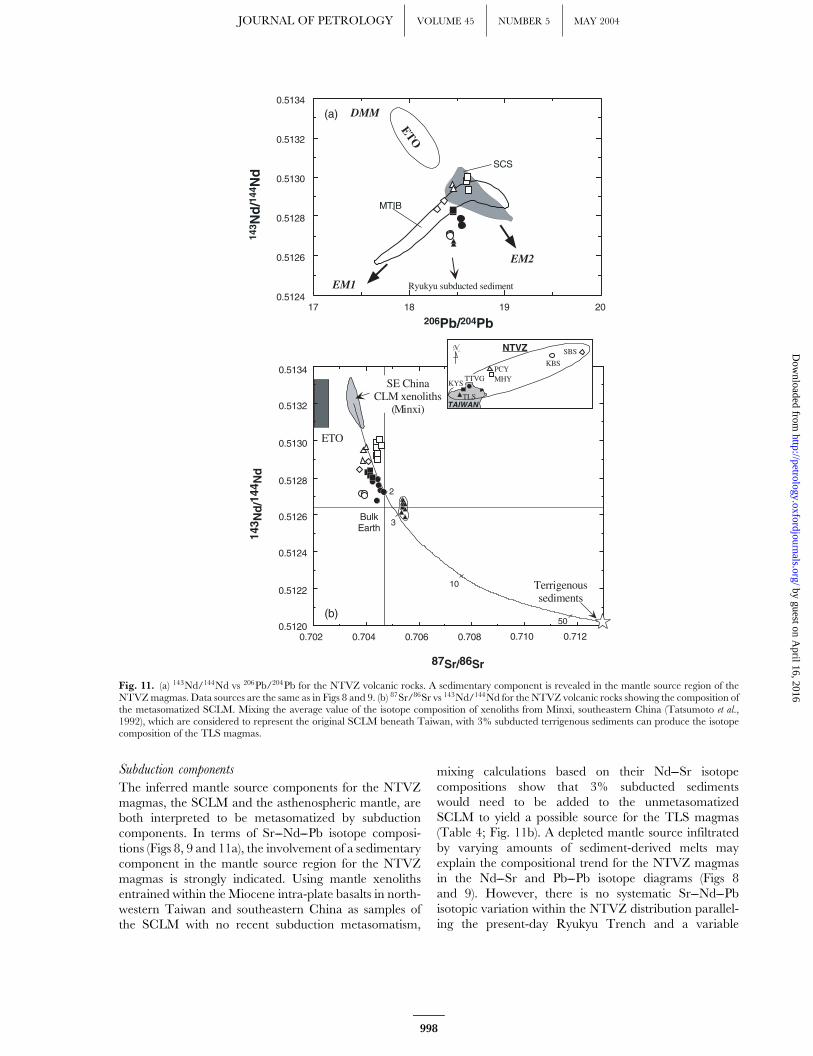
Subduction components
The inferred mantle source components for the NTVZmagmas, the SCLM and the asthenospheric mantle, areboth interpreted to be metasomatized by subductioncomponents. In terms of Sr---Nd---Pb isotope composi-tions (Figs 8, 9 and 11a), the involvement of a sedimentarycomponent in the mantle source region for the NTVZmagmas is strongly indicated. Using mantle xenolithsentrained within the Miocene intra-plate basalts in north-western Taiwan and southeastern China as samples ofthe SCLM with no recent subduction metasomatism,
mixing calculations based on their Nd---Sr isotopecompositions show that 3% subducted sedimentswould need to be added to the unmetasomatizedSCLM to yield a possible source for the TLS magmas(Table 4; Fig. 11b). A depleted mantle source infiltratedby varying amounts of sediment-derived melts mayexplain the compositional trend for the NTVZ magmasin the Nd---Sr and Pb---Pb isotope diagrams (Figs 8and 9). However, there is no systematic Sr---Nd---Pbisotopic variation within the NTVZ distribution parallel-ing the present-day Ryukyu Trench and a variable
201918170.5124
0.5126
0.5128
0.5130
0.5132
0.5134
ETO
DMM
EM1
EM214
3 Nd
/144
Nd
MTIB
206Pb/204Pb
SCS
Ryukyu subducted sediment
(a)
2
3
10
50
0.7120.7100.7080.7060.7040.7020.5120
0.5122
0.5124
0.5126
0.5128
0.5130
0.5132
0.5134
SE China CLM xenoliths
(Minxi)
87Sr/86Sr
ETO
Terrigenous sediments
143 N
d/1
44N
d
Bulk Earth
(b)
NTVZ SBS
KBS
MHYPCY
TTVGKYS
TAIWANTLS
N
Fig. 11. (a) 143Nd/144Nd vs 206Pb/204Pb for the NTVZ volcanic rocks. A sedimentary component is revealed in the mantle source region of theNTVZmagmas. Data sources are the same as in Figs 8 and 9. (b) 87Sr/86Sr vs 143Nd/144Nd for the NTVZ volcanic rocks showing the composition ofthe metasomatized SCLM. Mixing the average value of the isotope composition of xenoliths from Minxi, southeastern China (Tatsumoto et al.,1992), which are considered to represent the original SCLM beneath Taiwan, with 3% subducted terrigenous sediments can produce the isotopecomposition of the TLS magmas.
JOURNAL OF PETROLOGY VOLUME 45 NUMBER 5 MAY 2004
998
by guest on April 16, 2016
http://petrology.oxfordjournals.org/D
ownloaded from

sediment flux into the mantle source is difficult to con-ceive. In addition, the high Nd and Sr isotopic ratios forthe MHY magmas and specific incompatible elementratios in the TLS magmas, e.g. Nb/U � 0�8, Ce/Pb� 2, Rb/Cs � 8 and Ba/Rb � 1, are not consistentwith simple source sediment contamination. Chung et al.(2001b) suggested that another type of non-magmaticenrichment is required. On the basis of mineral---aqueousaqueous fluid experiments (Keppler, 1996; Tatsumi &Kogiso, 1997; Ayers, 1998), we suggest this enrichmentagent to be a hydrous fluid derived from the subductingslab. The distinction between sediment melt and slab-derived fluid is clearly shown by a Nb/La vs Ba/Rb plot(Fig. 12).
Whereas the MHY magmas, with their distinctE-MORB affinity (Nb/La �1), reflect an origin froman asthenospheric source, the TLS and other NTVZvolcanic rocks with Nb/La 51 can be interpreted to bederived from an SCLM altered by subduction-relatedmetasomatism. The TLS magmas have extremely lowBa/Rb ratios, which indicate fluid-dominated meta-somatism of the source rather than sediment melting asshown by the other NTVZ volcanic rocks. As the slab-derived fluid has similar 143Nd/144Nd ratios to MORBbut with unique specific trace-element ratios, andthe sediment melt displays lower 143Nd/144Nd ratioswith different trace-element ratios, plots of Nb/U andCe/Pb vs 143Nd/144Nd can discriminate the extent of
Table 4: Values used in mixing calculation between mantle source components
Nd (ppm) Sr (ppm) 143Nd/144Nd 87Sr/86Sr Nb/U Ce/Pb Ref.
E-MORB (P-ETO) 9.82 0.51309 46.1 25 1
Slab-derived fluid 10.00 0.51320 0.155 0.1125 2
Terrigenous sediments 33.00 185 0.51202 0.71300 8.93 3.2 3
Mantle xenoliths (av.) 0.98 27 0.51320 0.70355 4
TLS (av.) 24.24 705 0.51265 0.70545
MHY (av.) 8.72 210 0.51296 0.70308* 5
1, Sun et al. (1979), Sun (1980) and Jahn (1986); 2, Tatsumi and Kogiso (1997) and Ayers (1998); 3, Lan et al. (1990);4, Tatsumoto et al. (1992); 5, *using E-MORB values (Sun et al., 1979) (see text for explanation).
1001010.10.0
0.5
1.0
1.5
Ba/Rb
Ryukyu subductedsediments
MOT
CRA
N-MORB
E-MORB/OIB
Fluid metasomatism
MTIB
Subduction components
NTVZ SBS
KBS
MHYPCY
TTVGKYS
N
TAIWANTLS
Nb
/La
Fig. 12. Nb/La vs Ba/Rb for the NTVZ volcanic rocks. Values of N-MORB (normal MORB), E-MORB and OIB are from Sun & McDonough(1989). Other data sources are the same as in Figs 8 and 9.
WANG et al. GEODYNAMIC EVOLUTION OF NORTHERN TAIWAN
999
by guest on April 16, 2016
http://petrology.oxfordjournals.org/D
ownloaded from
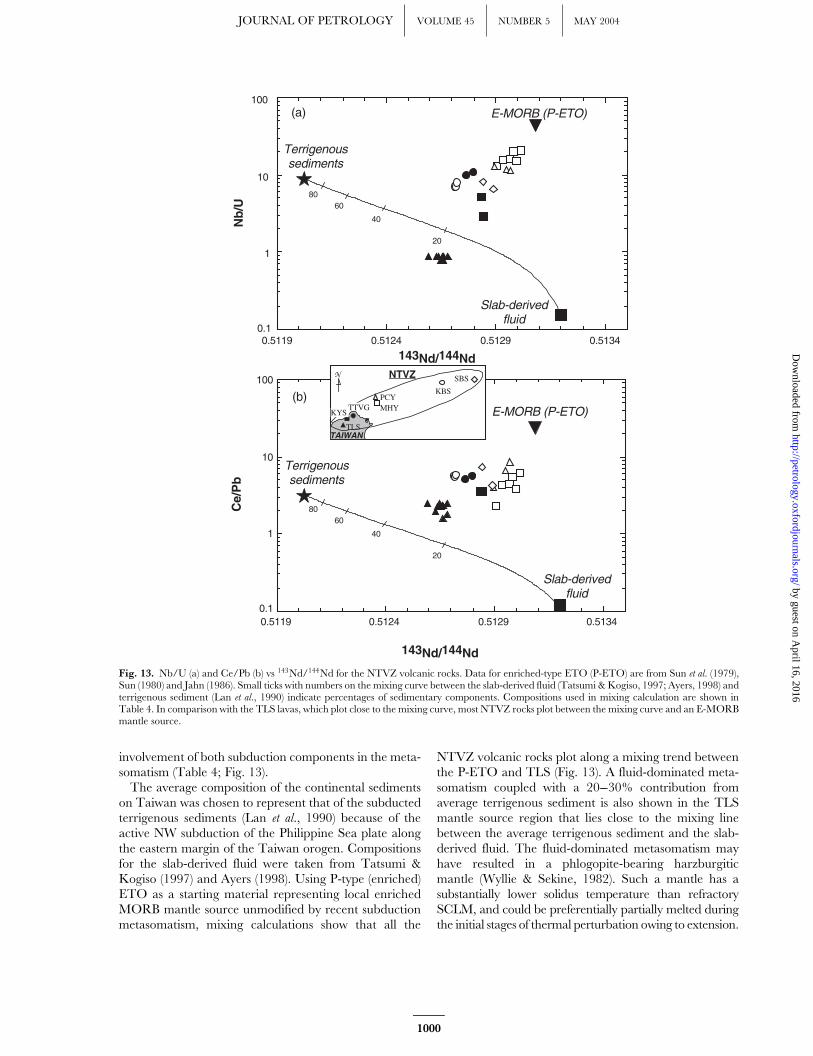
involvement of both subduction components in the meta-somatism (Table 4; Fig. 13).The average composition of the continental sediments
on Taiwan was chosen to represent that of the subductedterrigenous sediments (Lan et al., 1990) because of theactive NW subduction of the Philippine Sea plate alongthe eastern margin of the Taiwan orogen. Compositionsfor the slab-derived fluid were taken from Tatsumi &Kogiso (1997) and Ayers (1998). Using P-type (enriched)ETO as a starting material representing local enrichedMORB mantle source unmodified by recent subductionmetasomatism, mixing calculations show that all the
NTVZ volcanic rocks plot along a mixing trend betweenthe P-ETO and TLS (Fig. 13). A fluid-dominated meta-somatism coupled with a 20---30% contribution fromaverage terrigenous sediment is also shown in the TLSmantle source region that lies close to the mixing linebetween the average terrigenous sediment and the slab-derived fluid. The fluid-dominated metasomatism mayhave resulted in a phlogopite-bearing harzburgiticmantle (Wyllie & Sekine, 1982). Such a mantle has asubstantially lower solidus temperature than refractorySCLM, and could be preferentially partially melted duringthe initial stages of thermal perturbation owing to extension.
0.51340.51290.51240.51190.1
1
10
100
143Nd/144Nd
0.51340.51290.51240.5119
143Nd/144Nd
20
40
6080
E-MORB (P-ETO)
Slab-derived fluid
20
40
6080
E-MORB (P-ETO)(a)
(b)
Ce/
Pb
Nb
/U
NTVZ SBS
KBS
MHYPCY
TTVGKYS
N
TAIWANTLS
0.1
1
10
100
Terrigenous sediments
Slab-derived fluid
Terrigenous sediments
Fig. 13. Nb/U (a) and Ce/Pb (b) vs 143Nd/144Nd for the NTVZ volcanic rocks. Data for enriched-type ETO (P-ETO) are from Sun et al. (1979),Sun (1980) and Jahn (1986). Small ticks with numbers on the mixing curve between the slab-derived fluid (Tatsumi & Kogiso, 1997; Ayers, 1998) andterrigenous sediment (Lan et al., 1990) indicate percentages of sedimentary components. Compositions used in mixing calculation are shown inTable 4. In comparison with the TLS lavas, which plot close to the mixing curve, most NTVZ rocks plot between the mixing curve and an E-MORBmantle source.
JOURNAL OF PETROLOGY VOLUME 45 NUMBER 5 MAY 2004
1000
by guest on April 16, 2016
http://petrology.oxfordjournals.org/D
ownloaded from

Other evidence for fluid-dominated metasomatism ofthe mantle source might come from generation of high-Albasalts in the NTVZ. High-Al basalts have been consid-ered to be primary melts from large degrees (�50---60%)of partial melting of eclogites in subducting plates (e.g.Brophy & Marsh, 1986; Myers et al., 1986). However,considering the difficulty of deriving large-degree partialmelts from the old and cold subducting Philippine plate(�45Ma) in the Ryukyu subduction system, high-Albasalts in the NTVZ are most likely to be the resultof fractional crystallization rather than representingprimary melts. Alternatively, Gaetani et al. (1993) pointedout that the presence of water in the mantle wedge abovea subduction zone can significantly alter the composi-tional path followed by residual liquids, and modify thetypes and compositions of crystals that accumulate at thesite of cooling. Accordingly, under hydrous conditions,early crystallization of plagioclase is suppressed so thataluminium contents in residual liquids increase to yieldhigh-Al basalts (Fig. 14a). Figure 14b shows that mostof the NTVZ volcanic rocks lie along the olivine---clinopyroxene cotectic for hydrous crystallization. Thissuggests that their mantle source region might behydrous. The SBS lavas, all high-Al basalts, plot closestto the olivine---clinopyroxene---plagioclase ternary eutec-tic, indicating that high-Al basalts in the NTVZ arenot primary melts but have undergone some fractionalcrystallization.In comparison with the MTIB in northwestern Taiwan
erupted prior to the Taiwan arc---continent collision(Chen, 1990; Chung et al., 1995b), the NTVZ magmaswith subduction-modified geochemical characteristics
suggest that the upper mantle domain underwent meta-somatism related to subduction zone processes during thebuildup of the NTMB. Considering the tectonic evolu-tion of Taiwan region since arc---continent collision at�10Ma (e.g. Teng, 1990), the Ryukyu subductionsystem is the only one that approached the northernTaiwan region and was most likely to cause the requiredmetasomatism. Most NTVZ volcanic rocks havinggeologically meaningless negative Nd model ages mayalso result from this recent metasomatism.
The mixing of mantle source components and partialmelting conditions
The mixing trend in Fig. 13 also suggests that mixing ofpartial melts of enriched asthenospheric mantle and sub-duction-metasomatized SCLM could explain the geo-chemical characteristics of the NTVZ volcanic rocks.Although the MHY magmas have lower values than theP-ETO, they still plot at the other end of the mixing trend(Fig. 13a). The MHY mantle source might have beenfluxed by slab-derived fluid but not sediment melts, sotheir Ce/Pb ratios are much lower (Fig. 13b). The effectfrom the slab-derived fluid is not clear for Nb/U prob-ably because the MHY magmas have higher Nb contentssimilar to E-MORB. A similar mixing trend is observedin the Nd---Sr isotope diagram (Fig. 8), in which the otherNTVZ volcanic rocks lie along a mixing trend betweenthe depleted MHY and enriched TLS mantle sourcesdespite the elevated Sr isotopic ratios of the MHY mag-mas. A simple source sediment contamination modelis not preferred because variable sediment flux in the
CPX60
OL60
SBSKBS
PCYTTVGKYSTLS
CPX
OlPl
CPX60
PL
Basaltparent
Dry crystallization
Wet crystallization
Projected from silica
(oxygen units)
(a) (b) MHY
Fig. 14. (a) Schematic liquid lines of descent for a primitive basalt under hydrous and anhydrous conditions. (b) Compositions of the NTVZvolcanic rocks. It should be noted that there are different eutectic points and paths of fractional crystallization for parental basaltic magmas underanhydrous and hydrous conditions. Diagrams are modified from Gaetani et al. (1993).
WANG et al. GEODYNAMIC EVOLUTION OF NORTHERN TAIWAN
1001
by guest on April 16, 2016
http://petrology.oxfordjournals.org/D
ownloaded from

NTVZ mantle sources unrelated to NTVZ distributionwould be highly unlikely to lead to systematic isotopicvariation among the NTVZ. Alternatively, we proposethat variable mixing of melts from the depleted astheno-spheric mantle at the site of formation of the MHYmagmas, and the subduction-metasomatized SCLMwhere the TLS magmas formed could satisfy most ofthe geochemical characteristics of the NTVZ magmas.The proportions of the melts from the metasomatizedSCLM mixing with asthenospheric melts can be calcu-lated based on the NTVZ Nd---Sr isotopic ratios:12---17% for the SBS, �20% for the KBS, �13% forthe PCY, �30% for the TTVG and �20% for the KYS,respectively (Fig. 8), using compositions of the MHY andTLS magmas as the two end-members. In the calcula-tion, the most enriched Sr isotope value of E-MORB(87Sr/86Sr ¼ 0�70308; Sun et al., 1979) instead of that ofthe MHY magmas was used because the MHY magmashave elevated Sr isotope ratios as a result of subduction-fluid flux. The degree of partial melting also plays animportant role in controlling the spatial geochemicalvariation among the NTVZ, which the simple sourcesediment contamination model can not decipher.The mantle xenoliths entrained within the MTIB are
dominantly refractory harzburgites (Yang et al., 1987), sothis part of the SCLM is not a productive magma source.Whereas the fluid-dominated metasomatism substantiallylowers the solidus temperature of the refractory SCLM,the TLS magmas, indicative of the most fluid-dominatedmetasomatized SCLM source, still show extremely lowdegrees of partial melting. Using the Batan sub-arcphlogopite-bearing harzburgites from the Philippines(Maury et al., 1992) (which are the analogue of the TLSmantle source and generated similarly high-K magmas)as the starting source material in the graphical concen-tration ratio (CR) method of Maaloe (1994), 52% ofpartial melting is estimated for the TLS magmas(Table 3; Fig. 15). Thus, except for the MHY and TLSmagmas, which are separately derived from the astheno-spheric and lithospheric mantle, most of the NTVZmagmas are the products of variable degrees of partialmelting of asthenosphericmantle, variously ‘contaminated’by melts from the metasomatized SCLM during ascent.The degrees of partial melting for the NTVZ can be
evaluated by the CR method using an enriched MORBmantle source as the starting source material, which isestimated from basalts in the MOT with a subductionflux similar to that for the MHY magmas (Table 3;Fig. 15). We suggest that the parental magmas of theoffshore volcanic fields in the NTVZ were generatedby larger degrees of partial melting (8---20%) than theonshore fields (2---5%). A southwestward decrease indegree of partial melting is also revealed, which is evidentin the plot using dominantly mantle-derived elements orconservative elements (e.g. Nb andYb; Pearce & Parkinson,
1993; Pearce & Peate, 1995) without significant sub-duction contribution (Fig. 15b). The degrees of partialmelting of the asthenospheric source may depend onboth the overlying lithospheric thickness (the minimumdepth at which the melting occurred) and the specificmantle domain composition. The latter cause is not pre-ferred here as the isotopic characteristics of the NTVZmagmas are decoupled from the inferred degree of partialmelting. In addition, the overlying lithospheric thicknessalso determines the extent to which the metasomatizedSCLM contaminated the asthenospheric melts. In theNTVZ, the spatial and temporal changes in magmacomposition, reflecting lithosphere architecture andhistory within a coherent tectonic terrane, allow someimportant inferences to be made about the geodynamicevolution of this complex region (see next section), andalso about the variable nature of the lithosphere traversedby the mantle-derived mafic magmas in time and space.
Petrogenetic model
To test our hypothesis, modelling of trace-elementconcentrations in the mantle sources and melts was carriedout. Non-modal batch melting was assumed and thecompositions of the mantle sources for the MHY andTLS magmas were used as starting points. As Wanget al. (2002) suggested that asthenospheric mantleascended to �60---70 km depth to generate the MHYmagmas at �2�6Ma, we assume that all melts, includingthe TLS melts from the SCLM, occur in the garnetstabilizing field of the mantle. Using the trace-elementpartition coefficients of Halliday et al. (1995), Johnson(1998) and Schmidt et al. (1999), the trace-element com-positions of the MHY and TLS mantle sources werecalculated from the average lava compositions using theestimated degrees of partial melting shown in Fig. 15 (8%for the MHY and 2% for the TLS), and appropriatesource and melt modes (garnet lherzolites for the MHYand phlogopite---garnet harzburgites for the TLS; seeTable 5 for details). Having thus established the trace-element compositions of the enriched asthenospheric andmetasomatized SCLM source components, the trace-element composition of the asthenospheric melts can bederived for the individual NTVZ volcanic fields. Finally,a simple mixing calculation based on the estimated com-positions of the asthenospheric melts and those from themetasomatized SCLM, using the proportions shown inFig. 8 for the individual NTVZ volcanic fields, providestheir model trace-element compositions. The modeltrace-element compositions are plotted in Fig. 16compared with the actual compositions of the NTVZmagmas (except for the MHY and TLS magmas usedas end-members). Although the model compositions forthe NTVZ do not perfectly coincide with their actualvalues in Fig. 16, the geochemical variation trends of
JOURNAL OF PETROLOGY VOLUME 45 NUMBER 5 MAY 2004
1002
by guest on April 16, 2016
http://petrology.oxfordjournals.org/D
ownloaded from

the NTVZ magmas are successfully modelled by thismethod.
GEODYNAMIC MODEL
Wang et al. (1999) proposed that the magmatism of thenorthern Taiwan volcanic zone resulted from post-collisional extension in the NTMB since Plio-Pleistocenetimes. Initiation of the NTVZ thus serves as a straight-forward constraint for the onset of the collapse of theNTMB. Whereas structural and seismological data(Suppe, 1984; Lee & Wang, 1988; Yeh et al., 1991)
provide lines of evidence for post-collisional extension inthe Quaternary, a geodynamic model for the tectonicevolution accommodating seismological and geophysicaldata is still unavailable. This is especially the case whenthe NTVZ is considered not to be part of the RyukyuArc. Using analogies from other localities of Tertiarypost-collisional magmatism, e.g. Tibet, China (e.g.Turner et al., 1996; Maheo et al., 2002) and theBetic---Alboran domain of SE Spain (Turner et al.,1999), we suggest a geodynamic model for the post-colli-sional extension based on our interpretation of theNTVZ geochemical data.
201000
2
4
6
8
Nb (ppm)
Yb
(p
pm
)
20
15
10
54
Garnet facies
Spinel facies
Primitive mantleEstimated
enriched MORB mantle
(b)
201000.0
0.2
0.4
0.6
0.8
1.0
La/Yb
Tb
/Yb
20
15
10
54
2 1 0.5 0.1
Garnet facies
Spinel facies
Primitive mantle
Estimated enriched MORB mantle
(a)
NTVZ SBS
KBS
MHYPCY
TTVGKYS
TAIWANTLS
Spinel facies
Garnet facies
15 105 4
2
10
Batan phlogopite harzburgite
Batan phlogopite harzburgite
2015 10
5 4 2
N
Fig. 15. Variation of (a) Tb/Yb vs La/Yb and (b) Nb vs Yb for the NTVZ volcanic rocks. Bold continuous lines are model curves for partial meltingof the enrichedMORBmantle, estimated from basalts in MOT (Wang, 1998), with spinel-facies and garnet-facies mineralogy. Dashed lines connectthe same degree of partial melting between the two facies. Fine continuous lines are model curves for partial melting of Batan phlogopite harzburgite(Maury et al., 1992), an analogue of the TLS mantle source, with spinel-facies and garnet-facies mineralogy. Small ticks with numbers represent thedegrees of partial melting. Values used in modelling (Table 3), the melting model and distribution coefficients are the same as in Fig. 10b. Theprimitive mantle (Sun & McDonough, 1989) is shown for comparison.
WANG et al. GEODYNAMIC EVOLUTION OF NORTHERN TAIWAN
1003
by guest on April 16, 2016
http://petrology.oxfordjournals.org/D
ownloaded from

Models involving a retreating subduction zone (e.g.Lonergan & White, 1996), slab detachment or break-off(e.g. Davies & von Blankenburg, 1995), delamination(e.g. Bird, 1979) and convective removal of the litho-sphere (e.g. Houseman et al., 1981) have been used toexplain post-collisional extension. All these processescause upwelling of the asthenosphere and this willperturb the original thermal gradient. Consequencesthat follow are magma generation and sequential exten-sion. Combining the magmatic history with otherconstraints based on the tectonic evolution of an areamay lead to a more robust dynamic model (e.g. Turneret al., 1999).Relative to the present-day location of Taiwan, the
initial arc---continent collision started in the NE at�10Ma and propagated southwestward correspondingto the relative motion between the Philippine andEurasian plates (Suppe, 1984). According to the sedimen-tary record (Teng, 1990), the collision activity was mostintensive at �6---5Ma, resulting in an uplift of nearly4000m above sea level (Fig. 1). Meanwhile, both thearc and associated back-arc volcanism in the middlepart of Ryukyu subduction experienced a hiatus in theperiod of 6---2Ma (Letouzey & Kimura, 1986; Kamata &Kodama, 1994; Park, 1996). This indicates a feedbackrelationship between the Taiwan collision and the
development of the part of the Ryukyu subduction systemnear northern Taiwan.Severe compressional forces near the northern Taiwan
region probably stalled the Philippine Sea plate subduc-tion so this slab could not encroach beneath the region.Consequently, the Ryukyu subduction re-established andre-generated arc and back-arc volcanism at a later stage.Two phases of the Okinawa Trough opening at 10---6 and�2Ma (Miki, 1995; Sibuet et al, 1998) may respond tothe re-establishment of the Ryukyu subduction system.The thickened lithosphere caused by arc---continent colli-sion would have also prevented western propagation ofthe Ryukyu subduction system (Fig. 17a). This modeldiffers from previous ones suggesting that the Ryukyusubduction zone was able to continue developing in thenorthern Taiwan region (Chen, 1990; Teng et al., 1992;Teng, 1996).Several lines of evidence also support the interpretation
that the NTVZ is unlikely to be part of the Ryukyu Arc.They include a horizontal displacement (of about150 km) from the western end of the actual Ryukyuvolcanic arc (Iriomotejima; Fig. 1) to the NTVZ, andthe fact that the north-dipping Benioff zone of the sub-ducting Philippine Sea plate is now sitting �200---250 kmbeneath the NTVZ (Eguchi & Uyeda, 1983; Kao et al.,1998) compared with �100 km for the normal RyukyuArc. There are apparent differences in the duration ofvolcanism between the NTVZ and the Ryukyu Arc, asthe latter became dormant in the earliest Pliocene(Shinjo, 1998). In terms of their geochemical character-istics, if the NTVZ magmas represent arc volcanism,their systematic along-arc (spatial) geochemical variations(reflecting systematic variable degrees of partial meltingin their mantle source) should represent a typical cross-arc variation for the arc volcanism. This is not supportedby the actual spatial distribution of the NTVZ parallelingthe Ryukyu Trench. Moreover, the along-arc variation isalso difficult to ascribe because there is no apparentspatial variation in the subducting plate, i.e. sedimentflux etc., if the NTVZ is treated as arc-related volcanism.As there was no active subduction near northern Taiwanduring that time, tectonic models involving a retreatingsubduction zone and slab detachment or break-offmodels cannot be realistic for the NTVZ. However,metasomatism by the Ryukyu subduction zone couldstill affect upper-mantle domains beneath northernTaiwan because of the lateral migration of subductioncomponents (Fig. 17a).The geochemical characteristics of the MHY
asthenospheric melts indicate that significant upwellingof asthenosphere to 60---70 km depth has occurred since�2�6Ma (Wang et al., 2002) at the time of initiation ofthe NTVZ activity (Fig. 17b). Taking account of thecontinental crustal thickness of �30 km in northernTaiwan (Yeh et al., 1989), emplacement of theMHYmagmas
Table 5: Values used in trace-element modelling
Garnet peridotite Phlogopite---garnet harzburgite
Source
mode (X)
Melting
mode (Pi)
Source
mode (X)
Melting
mode (Pi)
Ol 0.6 0.1 0.6 0.05
Opx 0.2 0.18 0.2 0.32
Cpx 0.1 0.3
Garnet 0.1 0.42 0.1 0.4
Phl 0.1 0.23
Ref. 1 2
Bulk D Melt
mode (P)
Bulk D Melt
mode (P)
MHY
(av.)
TLS
(av.)
Nb 0.0025 0.0074 0.0081 0.0199 5.98 16.12
La 0.0062 0.0171 0.0011 0.0020 5.58 24.68
Sm 0.0503 0.1742 0.0239 0.0906 2.96 4.59
Zr 0.0490 0.1643 0.0360 0.1138 78.86 117.51
Y 0.2549 0.9845 0.2109 0.8121 19.71 14.61
Yb 0.7050 2.8262 0.6650 2.5803 1.52 1.32
Ref. 3 1, 3, 4
1, Johnson (1998); 2, Kelemen et al. (1993); 3, Halliday et al.(1995); 4, Schmidt et al. (1999).
JOURNAL OF PETROLOGY VOLUME 45 NUMBER 5 MAY 2004
1004
by guest on April 16, 2016
http://petrology.oxfordjournals.org/D
ownloaded from
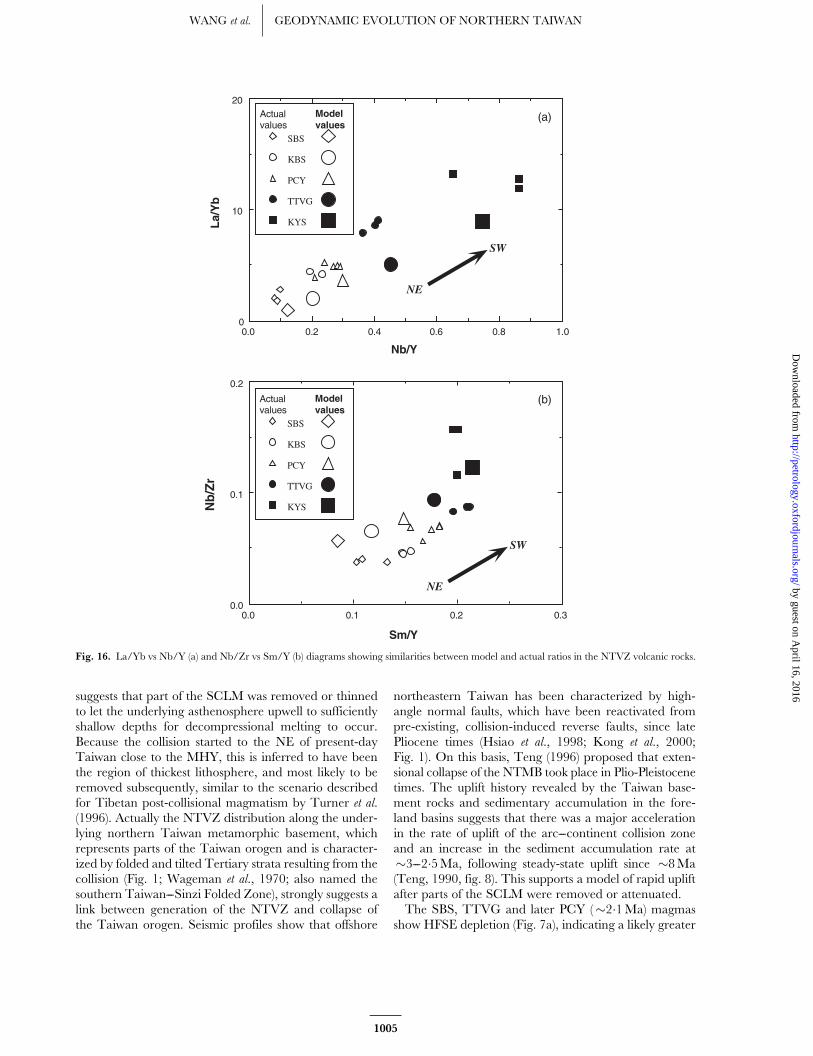
suggests that part of the SCLM was removed or thinnedto let the underlying asthenosphere upwell to sufficientlyshallow depths for decompressional melting to occur.Because the collision started to the NE of present-dayTaiwan close to the MHY, this is inferred to have beenthe region of thickest lithosphere, and most likely to beremoved subsequently, similar to the scenario describedfor Tibetan post-collisional magmatism by Turner et al.(1996). Actually the NTVZ distribution along the under-lying northern Taiwan metamorphic basement, whichrepresents parts of the Taiwan orogen and is character-ized by folded and tilted Tertiary strata resulting from thecollision (Fig. 1; Wageman et al., 1970; also named thesouthern Taiwan---Sinzi Folded Zone), strongly suggests alink between generation of the NTVZ and collapse ofthe Taiwan orogen. Seismic profiles show that offshore
northeastern Taiwan has been characterized by high-angle normal faults, which have been reactivated frompre-existing, collision-induced reverse faults, since latePliocene times (Hsiao et al., 1998; Kong et al., 2000;Fig. 1). On this basis, Teng (1996) proposed that exten-sional collapse of the NTMB took place in Plio-Pleistocenetimes. The uplift history revealed by the Taiwan base-ment rocks and sedimentary accumulation in the fore-land basins suggests that there was a major accelerationin the rate of uplift of the arc---continent collision zoneand an increase in the sediment accumulation rate at�3---2�5Ma, following steady-state uplift since �8Ma(Teng, 1990, fig. 8). This supports a model of rapid upliftafter parts of the SCLM were removed or attenuated.The SBS, TTVG and later PCY (�2�1Ma) magmas
show HFSE depletion (Fig. 7a), indicating a likely greater
0.30.20.10.00.0
0.1
0.2
Sm/Y
Nb
/Zr
SBS
KBS
PCY
TTVG
KYS
Actual values
Model values
NE
SW
(b)
1.00.80.60.40.20.00
10
20
Nb/Y
La/
Yb
NE
SW
(a)
SBS
KBS
PCY
TTVG
KYS
Actual values
Model values
Fig. 16. La/Yb vs Nb/Y (a) and Nb/Zr vs Sm/Y (b) diagrams showing similarities between model and actual ratios in the NTVZ volcanic rocks.
WANG et al. GEODYNAMIC EVOLUTION OF NORTHERN TAIWAN
1005
by guest on April 16, 2016
http://petrology.oxfordjournals.org/D
ownloaded from

involvement of subduction components in the metasoma-tized asthenospheric mantle and/or the SCLM. The SBSand PCY magmas, both offshore and close to the MHYfield, are also low-K and calc-alkalic magmas producedby higher degrees of partial melting and with higher143Nd/144Nd (� 0�51284---0�51289 and 0�51289---0�51297, respectively). The TTVG magmas are calc-alkaline and have lower 143Nd/144Nd (� 0�51268---0�51280). The correlation might suggest that upwellingof the asthenosphere was shallower offshore, so thathigher-degree asthenospheric melts were generated withless contamination by the overlying metasomatizedSCLM, and vice versa (Fig. 17b). As a result of thecontinuing collision in central and southern Taiwan,post-collisional extension induced by asthenosphereupwelling diminished southwestward.
Magmatism during the initial stage of NTVZ activitywas dominantly sourced from the asthenospheric mantle(i.e. the MHY, SBS and PCY). These magmas representhigher degrees of partial melting (8---20%) consistent withthat predicted from decompressional melting of theascending asthenosphere up to �60---70 km depth(10---20%). Some extensive late Pliocene---Quaternarysubsurface magmatic fields distributed within the Taiwanorogen basement have been identified on seismic profiles(Fig. 1; Sun & Hsu, 1991; Hsiao et al., 1998). The volumeof these subsurface volcanic fields is apparently largerthan the NTVZ although no direct age and geochemicaldata for the magmatic rocks are available. However, it isevident that large amounts of volcanic activity haveoccurred offshore northeastern Taiwan since the latePliocene.
crust
lithospheric
mantle
asthenosphere
NTMB
Subducting Philippine Sea Plate
Dehydration
~6~2.6 MaLuzon Arc-Eurasian continent collision
~2.6 MaExtensional collapse of Northern Taiwan Mountain Belt
2~1 MaAfter extensional collapse
1Ma~Present day
TTVGMHY
SBS
KLVGPCY TTVG
TLSKYSKBS
0km km
km km
100
200
0
100
200
0
100
200
0
100
200
Melting of metasomatizedlithospheric mantle
Luzon Arcpresent
Taiwan position
Melting of ascendingasthenospheric mantle
Westward propagation
of Philippine Sea Plate
metaso-
matism
Ryukyu Arc
Okinawa Trough
Southwestward opening of Okinawa Trough
N
?
(a) (b)
(c) (d)
Fig. 17. Schematic representation of the proposed geodynamic model for the NTVZ and related tectonic evolution of the area from �6Ma to thepresent. NTMB, northern Taiwan mountain belt. Volcanoes in different colours indicate different volcanic fields (purple-----the Luzon Arc; pink-----theRyukyu Arc; red-----the NTVZ); the plumes from volcanoes suggest that the volcanoes are active. (a) The Luzon Arc colliding with the Asian continentformed a thickened SCLM, which prevented the Philippine Sea plate from subducting beneath the northern Taiwan region. Consequently, theRyukyu Arc and the Okinawa Trough stalled westward propagation. Black dotted line marks the present position of Taiwan. The arc---continentcollision started in the NE. (b) As soon as parts of the SCLM were ‘removed’, asthenospheric mantle upwelled to shallower depth then melted togenerate the initial NTVZ volcanism. (c) After parts of the SCLM were ‘removed’, the Philippine Sea plate started its westward propagation withreopening of the Okinawa Trough towards NE Taiwan to form the SPOT (southernmost part of Okinawa Trough). (d) The SPOT reached toonshore NE Taiwan as the Philippine Sea plate subducted beneath the northern Taiwan region. The subsequent arc volcanism, the westernextension of the Ryukyu Arc, was generated in the SPOT, which is located �80---100 km above the Benioff zone of the Philippine Sea plate.
JOURNAL OF PETROLOGY VOLUME 45 NUMBER 5 MAY 2004
1006
by guest on April 16, 2016
http://petrology.oxfordjournals.org/D
ownloaded from

After �2�6Ma the subducting Philippine Sea plateresumed its westward motion to penetrate progressivelyinto the region beneath the NTMB because parts ofthe collision-thickened lithosphere that were creating a‘barrier’ had been removed (Fig. 17c). Meanwhile, theRyukyu subduction system developed its southernmostextension corresponding to the movement of thePhilippine Sea plate. The reopening of the OkinawaTrough started at �2Ma after a hiatus (Letouzey &Kimura, 1986; Park, 1996; Sibuet et al., 1998), and itsfast southwestward propagation at �126mm/yr reachedthe I-Lan plain, in NE Taiwan (Liu, 1995) with a verystrong curvature. This part of the Okinawa Trough[named SPOT (southernmost part of Okinawa Trough)by Chung et al. (2000)] is structurally and geochemicallydifferent from its central part. The SPOT back-arcmagmas are bimodal andesites and rhyolites, exhibitingtypical subduction magma-type characteristics similarto those of the CRA and MOT magmas (Chung et al.,2000). Compared with the MHY magmas with intra-plate geochemical affinities, it is most likely that initialmagmatism first occurred within the NTVZ outside thetopographical Okinawa Trough, rather than within thetrough.The NTVZ magmas erupted from 2 to 1Ma consist
dominantly of calc-alkalic rocks and display significantlyHFSE depletion (Fig. 7a) in contrast to the earlier NTVZmagmas with low-K characteristics. These were widelyemplaced at the PCY, KLVG and TTVG localities(Fig. 17c), which extend onshore from an inferred up-welling centre offshore. Greater enrichment in LILEand LREE than the earlier magmas suggests that theproportion of lithospheric components was increasing(Fig. 7a). All phenomena at this stage indicate that sub-sequent thermal perturbation in the SCLM and the pro-pagation of extension followed asthenospheric upwelling.The final stages of volcanism show most activity in the
KBS, PCY, TTVG, KYS and TLS fields (Fig. 17d) withstriking geochemical variations in the magmas. The mostrecent (�0�2Ma) magmas at KBS, KYS and TLS havehigh-K calc-alkaline to shoshonitic---ultrapotassic character-istics with extreme enrichment in LILE and LREE butHFSE depletion (Fig. 7a). The TLS magmas represent anextreme end-member magma type indicative of small-degree partial melts of phlogopite-bearing harzburgiticSCLM. A series of recent volcanic arcs, about 80---100 kmabove the Benioff zone of the subducting Philippine plate,and representing the western end of the Ryukyu Arc,were formed in the SPOT (Sibuet et al., 1998; Chunget al., 2000). The SPOT is an atypical back-arc spreadingsetting, which was formed before or at least synchron-ously with its arc---trench counterpart (Fig. 17d; Wanget al., 1999; Chung et al., 2000). This combination oftectonic and magmatic processes consequently led to aunique collision---extension---subduction context in this
region. Sadeghi et al. (2000) reported low-velocity anom-alies in the uppermost mantle at a depth of 40 kmbeneath the northern Taiwan region, but beyond theSPOT area, and these might be evidence for the astheno-sphere upwelling in the NTMB.Most models for post-collisional magmatism predict
that it should progress from potassic lithosphere-derivedmelts to intra-plate asthenospheric melts with time (e.g.Pearce et al., 1990; Turner et al., 1992, 1993, 1996; Platt& England, 1993; Maheo et al., 2002). However, Turneret al. (1999) reported that post-collisional magmatism inthe Betic---Alboran domain in SE Spain exhibits thereverse progression and suggested that this could be dueto significant differences in the amount of thickened crustin different collision zones. A general model was pro-posed for post-collisional magmatism in Tibet where thethickened crust (�70 km) is twice normal thickness.However, the Betic---Alboran domain may not have hadsuch thickened crust, so that the asthenosphere couldupwell to higher levels (e.g. less than 50---60 km) afterconvective removal of some of the thickened lithosphereand thus induce decompressional melting to generateasthenospheric melts first (Turner et al., 1999). Thus, therheology of both plates in collision, the extent of thecollision and the velocity of plate convergence are impor-tant controls on the geochemical characteristics and timeinterval between the onset of collision and the generationof post-collisional magmatism. In the northern Taiwanregion we also observe a reverse geochemical pattern formagma suites starting with asthenospheric melts thenproceeding to lithospheric melts. The scale of the collisionin the Taiwan region is much smaller than that in Tibet,so it is easier to document in detail the different successivemagma series within a short time span from the onset ofcollision in the NTVZ, thus providing constraints for apost-collisional magmatism in a distinctive geodynamicdomain similar to that of the Betic---Alboran domain.
CONCLUSIONS
The geochemical characteristics of the NTVZ volcanicrocks indicate that they resulted from the upwelling ofasthenosphere in response to post-collisional extensionassociated with collapse of the NTMB in Plio-Pleistocenetimes. Their spatial and temporal geochemical variationcan be explained and semi-quantitatively modelled byvariations in degrees of partial melting, and in the mixingproportions of two dominant end-member source mantletypes beneath individual magma fields, which may bedistinguished in terms of their geographical location andage of volcanism. The spatial variation of the NTVZvolcanic rocks largely reflects partial melting variations,whereas the changes in isotopic composition with timesuggest changes in the compositions of the mantle sourcecomponents beneath the NTVZ.
WANG et al. GEODYNAMIC EVOLUTION OF NORTHERN TAIWAN
1007
by guest on April 16, 2016
http://petrology.oxfordjournals.org/D
ownloaded from

The dominant mantle components are the astheno-spheric mantle and the SCLM that had undergone meta-somatism by subduction processes associated with theRyukyu subduction system.The subduction-relatedmeta-somatism of the SCLM has geochemical characteristicsindicating the involvement of both slab-derived fluid andsediment-derived melts that infiltrated the mantle sourceregion of the NTVZ during the build-up of the NTMB.Thus, the ‘arc signatures’ evident in most of the NTVZvolcanic rocks do not mean that the NTVZ is part of theRyukyu Arc, as these are not direct melts induced bysubduction processes, but extension-induced meltsformed significantly after active subduction ceased andthat were contaminated by the overlying SCLM (whichhad inherited subduction components). The retreatingsubduction zone and slab detachment or break-off modelsare unlikely to be able to explain the generation of theNTVZ volcanic fields.It is suggested that the MHY melts represent astheno-
spheric melting after parts of the thickened lithospherehad been removed (or attenuated) and asthenosphereupwelling took place to shallow depths (�60---70 km).Subsequent emplacement of calc-alkaline magmasindicates increasing involvement of the SCLM in themagma generating process resulting from heating bythe newly juxtaposed hotter asthenosphere. Finally theTLS potassic magmas erupted as a result of meltingdominantly of the metasomatized SCLM itself. TheNTVZ magma series progression is distinct from thatpredicted by general models for post-collisional magma-tism based on the Tibetan post-collisional magmatism,but similar to that of the Betic---Alboran domain. Thismay be a consequence of the different scales of thesecollision zones.
ACKNOWLEDGEMENTS
We thank C. Y. Lee and X. H. Li for their help inarranging XRF and ICP-MS analysis, and C.-H. Chen,F. T. Yang and C.-H. Lo at NTU, T. Y. Lee at NTNU,Taiwan, and M. Zhang at GEMOC, Macquarie Univer-sity, Australia, for thoughtful discussions. Thanks alsogo to R. Maas of Melbourne University for supplyingsilica gel---H3PO4 solution, and to G. Mortimer ofANU, RSES, for supplying SRM 981 and 982, theANU double-spike solution and the Excel spreadsheetsfor double-spike calculation in the early stage of thiswork. The manuscript was significantly improved byconstructive journal reviews from Y. Tatsumi, S. Turner,H. Williams, an anonymous reviewer and the Editor M.Wilson. This study benefited from research grants sup-ported by the National Science Council, Taiwan.Refining of concepts and writing was done while K.-L.Wang was in receipt of a Macquarie University ResearchFellowship. This is GEMOC Publication 335.
REFERENCESAngelier, J., Barrier, E. & Chu, H. T. (1986). Plate collision and
paleostress trajectories in a fold---thrust belt: the foothills of Taiwan.
Tectonophysics 125, 161---178.Ayers, J. (1998). Trace element modeling of aqueous fluid---peridotite
interaction in the mantle wedge of subduction zones. Contributions to
Mineralogy and Petrology 132, 390---404.
Bird, P. (1979). Continental delamination and the Colorado Plateau.
Journal of Geophysical Research 84, 7561---7571.
Brophy, J. G. & Marsh, B. D. (1986). On the origin of high-alumina arc
basalt and the mechanics of melt extraction. Journal of Petrology 27,
763---789.Cameron, A. E., Smith, D. H. & Walker, R. L. (1969). Mass
spectrometry of nanogram-size samples of lead. Analytical Chemistry
41, 525---526.Chen, C. H. (1989). Nd---Sr---O isotopic study of Cenozoic arcs volcanic
rocks in Taiwan. Ph.D. thesis, National Taiwan University, Taipei,
198 pp. (in Chinese).
Chen, C.-H. (1990). Igneous Rocks of Taiwan. Central Geological Survey
Special Publication 1, 137 pp. (in Chinese).
Chen, C. H. (1997). Extensional collapse of the northern Taiwan
mountain belt: Comment. Geology 25, 855---856.
Chen, C. H., Shieh, Y. N., Lee, T., Chen, C.-H. & Mertzman, S. A.
(1990). Nd---Sr---O isotopic evidence for source contamination and
an unusual mantle component under Luzon Arc. Geochimica et
Cosmochimica Acta 54, 2473---2483.Chung, S. L. & Sun, S.-s. (1992). A new genetic model for the
East Taiwan Ophiolite and its implications for Dupal domain in
the northern hemisphere. Earth and Planetary Science Letters 109,
133---145.Chung, S. L., Sun, S.-s., Tu, K., Chen, C.-H. & Lee, C. Y. (1994). Late
Cenozoic basaltic volcanism around the Taiwan Strait, SE China:
product of lithosphere---asthenosphere interaction during continental
extension. Chemical Geology 112, 1---20.Chung, S. L., Jahn, B. M., Chen, S., Lee, T. & Chen, C.-H. (1995a).
Miocene basalts in northwestern Taiwan: evidence for EM-type
mantle sources in the continental lithosphere. Geochimica et
Cosmochimica Acta 59, 549---555.Chung, S. L., Yang, T. F., Lee, C. Y. & Chen, C.-H. (1995b). The
igneous provinciality in Taiwan: consequence of continental rifting
superimposed by Luzon and Ryukyu subduction systems. Journal of
Southeast Asian Earth Sciences 11, 73---80.
Chung, S. L., Wang, S. L., Shinjo, R., Lee, C. S. & Chen, C.-H. (2000).
Initiation of arc magmatism in an embryonic continental rifting zone
of the southernmost part of Okinawa Trough. Terra Nova 12,
225---230.
Chung, S. L., Sun, S.-s. & Crawford, A. J. (2001a). Indian Ocean type
convecting mantle underlies East Asia: a consequence of Gondwana
breakup and reassembly? Western Pacific Earth Sciences 1, 1---18.Chung, S. L., Wang, K. L., Crawford, A. J., Kamenetsky, V. S., Chen,
C.-H., Lan, C. Y. & Chen, C. H. (2001b). High-Mg potassic rocks
from Taiwan: implication for the genesis of orogenic potassic
magmas. Lithos 59, 153---170.
Crawford, A. J., Falloon, T. J. & Eggins, S. (1987). The origin of island
arc high-alumina basalts. Contributions to Mineralogy and Petrology 97,
417---430.Davies, J. H. & von Blankenburg, F. (1995). Slab breakoff: a model of
lithospheric detachment and its test in the magmatism and
deformation of collisional orogens. Earth and Planetary Science Letters
129, 85---102.Dewey, J. F. (1988). Extensional collapse of orogens. Tectonics 7,
1123---1139.
JOURNAL OF PETROLOGY VOLUME 45 NUMBER 5 MAY 2004
1008
by guest on April 16, 2016
http://petrology.oxfordjournals.org/D
ownloaded from

Eguchi, T. & Uyeda, S. (1983). Seismotectonics of the Okinawa
Trough and Ryukyu Arc. Memoir of the Geological Society of China 5,
189---210.
Foley, S. F., Venturelli, G., Green, D. H. & Toscani, L. (1987). The
ultrapotassic rocks: characteristics, classification, and constraints for
petrogenetic models. Earth-Science Reviews 24, 81---134.
Galer, S. J. G. & Abouchami, W. (1998). Practical application of lead
triple spiking for correction of instrumental mass discrimination.
Mineralogical Magazine 62A, 491---492.Gaetani, G. A., Grove, T. L. & Bryan, W. B. (1993). The influence of
water on the petrogenesis of subduction-related igneous rocks. Nature
365, 332---335.Gerstenberger, H. & Haase, G. (1997). A highly effective emitter
substance for mass spectrometric Pb isotope ratio determinations.
Chemical Geology 136, 309---312.
Gill, J. B. (1981). Orogenic Andesites and Plate Tectonics. Berlin: Springer,
390 pp.
Govindaraju, K. (1994). 1994 compilation of working values and
sample description for 383 geostandards. Geostandards Newsletter 18,
1---158.Halliday, A. N., Lee, D. C., Tommasini, S., Davies, G. R., Paslick, C. R.,
Fitton, J. G. & James, D. E. (1995). Incompatible trace elements in
OIB and MORB and source enrichment in the sub-oceanic mantle.
Earth and Planetary Science Letters 133, 379---395.
Harris, N. B. W., Pearce, J. A. & Tindle, A. G. (1986). Geochemical
characteristics of collision zone magmatism. In: Coward, M. P. &
Ries, A. C. (eds) Collision Tectonics. Geological Society, London, Special
Publications 19, 67---82.
Hart, S. R. (1984). A large-scale isotope anomaly in the southern
hemisphere. Nature 309, 753---757.
Hart, S. R. (1988). Heterogeneous mantle domains: signatures, genesis
andmixing chronologies.Earth and Planetary Science Letters 90, 273---296.
Houseman, G. A., McKenzie, D. P. & Molnar, P. J. (1981). Convective
instability of a thickened boundary layer and its relevance for the
thermal evolution of continental convergent belts. Journal of
Geophysical Research 86, 6115---6132.
Hsiao, L. Y., Lin, K. A., Huang, S. T. & Teng, L. S. (1998). Structural
characteristics of the southern Taiwan---Sinzi Folded Zone. Petroleum
Geology of Taiwan 32, 133---153 (in Chinese).
Jahn, B. M. (1986). Mid-ocean ridge or marginal basin origin of the
East Taiwan Ophiolite: chemical and isotopic evidence. Contributions
to Mineralogy and Petrology 92, 194---206.Johnson, K. T. M. (1998). Experimental determination of partition
coefficients for rare earth and high-field-strength elements between
clinopyroxene, garnet, and basaltic melt at high pressures. Contribu-
tions to Mineralogy and Petrology 133, 60---68.Juang, W. S. (1988). Geochronology and chemical variations of late
Cenozoic volcanic rocks in Taiwan. Ph.D. thesis, National Taiwan
University, Taipei, 231 pp. (in Chinese).
Juang, W. S. (1993). Diversity and origin of Quaternary basaltic
magma series in northern Taiwan. Bulletin of the National Museum of
Natural Science 4, 125---166.
Kamata, H. & Kodama, K. (1994). Tectonics of an arc---arc junction:
an example from Kyushu Island at the junction of the Southwest
Japan Arc and the Ryukyu Arc. Tectonophysics 233, 69---81.
Kao, H., Shen, S. J. & Ma, K. F. (1998). Transition from oblique
subduction to collision: earthquakes in the southwesternmost
Ryukyu arc---Taiwan region. Journal of Geophysical Research 103,
7211---7229.
Kelemen, P. B., Shimizu, N. & Dunn, T. (1993). Relative depletion of
niobium in some arc magmas and the continental crust: partitioning
of K, Nb, La and Ce during melt/rock reaction in the upper mantle.
Earth and Planetary Science Letters 120, 111---134.
Keppler, H. (1996). Constraints from partitioning experiments on the
compositions of subduction-zone fluids. Nature 380, 237---240.
Kong, F., Lawver, L. A. & Lee, T.-Y. (2000). Evolution of the southern
Taiwan---Sinzin Folded Zone and opening of the southern Okinawa
trough. Journal of Asian Earth Sciences 18, 325---341.Lan, C. Y., Lee, T. & Wang Lee, C. (1990). The Rb---Sr isotopic record
in Taiwan gneisses and its tectonic implication. Tectonophysics 183,
129---143.
Lee, C. T. & Wang, Y. (1988). Quaternary stress changes in northern
Taiwan and their tectonic significance. Proceedings of the Geological
Society of China 31, 154---168.
Lee,C.Y.,Tsai, J.H.,Ho,H.H.,Yang,T.F.,Chung, S.L.&Chen,C.-H.
(1997). Quantitative analysis in rock samples by an X-ray
fluorescence spectrometer (I) major elements. Program with Abstracts
of 1997 Annual Meeting of Geological Society of China, Taipei, pp. 418---420
(in Chinese).
Lee, S. F. (1996). Volcanic sequence study of the Tatun Volcano
Group: the Chihsinshan subgroup. M.S. thesis, National Taiwan
University, Taipei, 136 pp. (in Chinese).
Letouzey, J. & Kimura, M. (1986). The Okinawa Trough: genesis of a
back-arc basin developing along a continental margin. Tectonophysics
125, 209---230.
Li, X. H. (1997). Geochemistry of the Longsheng Ophiolite from the
southern margin of Yangtze Craton, SE China. Geochemical Journal
31, 323---337.
Liu, C. C. (1995). The Ilan plan and the southwestward extending
Okinawa Trough. Journal of the Geological Society of China 38, 229---242.Liu, T. K. (1987). Some new radiometric ages of rocks from Taiwan.
Program and Abstract Volume, Annual Meeting of Geological Society of China,
p. 62.
Liu, T. K., Chen, C.-H. & Jiang, S. H. (1986). Fission-track study of
igneous rocks from northern Taiwan. Unpublished report to the
National Science Council, Taiwan, 7 pp.
Liu, Y., Liu, H. & Li, X. H. (1996). Simultaneous and precise
determination of 40 trace elements in rock samples. Geochimica 25,
552---558 (in Chinese).
Lonergan, I. & White, N. (1996). Origin of the Betic---Rif mountain
belt. Tectonics 16, 504---522.Maaloe, S. (1994). Estimation of the degree of partial melting
using concentration ratios. Geochimica et Cosmochimica Acta 58,
2519---2525.
Maheo, G., Guillot, S., Blichert-Toft, J., Rolland, Y. & Pecher, A.
(2002). A slab breakoff model for the Neogene thermal evolution of
South Karakorum and South Tibet. Earth and Planetary Science Letters
195, 45---58.
Malavielle, J. (1993). Late orogenic extension in mountain belts:
insights from the Basin and Range and the late Paleozoic Variscan
belt. Tectonics 12, 1115---1130.
Maury, R. C., Defant, M. J. & Joron, J.-L. (1992). Metasomatism of the
sub-arc mantle inferred from trace elements in Philippine xenoliths.
Nature 360, 661---663.
Michard, A., Gurriet, P., Soudant, M. & Albar�eede, F. (1985).
Nd isotope in French Phanerozoic shales: external vs. internal
aspects of crustal evolution. Geochimica et Cosmochimica Acta 49,
601---610.
Middlemost, E. A. K. (1975). The basalt clan. Earth-Science Reviews 11,
337---364.Miki, M. (1995). Two-phase opening model for the Okinawa Trough
inferred from paleomagnetic study of the Ryukyu Arc. Journal of
Geophysical Research 100, 8169---8184.Myers, J. D., Frost, C. & Angevine, C. L. (1986). A test of a quartz
eclogite source for parental Aleutian magmas: a mass balance
approach. Journal of Geology 94, 811---828.
WANG et al. GEODYNAMIC EVOLUTION OF NORTHERN TAIWAN
1009
by guest on April 16, 2016
http://petrology.oxfordjournals.org/D
ownloaded from
Park, J.-O. (1996). Seismic stratigraphy and tectonic evolution of the
southern Ryukyu island arc. Ph.D. thesis, Ocean Research Institute,
University of Tokyo, 145 pp.
Pearce, J. A. & Parkinson, I. J. (1993). Trace element models for mantle
melting: application to volcanic arc petrogenesis. In: Prichard, H.
M., Alabaster, T., Harris, N. B. W. & Neary, C. R. (eds) Magmatic
Processes and Plate Tectonics. Geological Society, London, Special Publications
76, 373---403.
Pearce, J. A. & Peate, D. W. (1995). Tectonic implications of the
composition of volcanic arc magmas. Annual Review of Earth and
Planetary Sciences 23, 251---285.
Pearce, J. A., Bender, J. F., De Long, S. E., Kidd, W. S. F., Low, P. J.,
G€uuner, Y., Saroglu, F., Yilmaz, Y., Moorbath, S. & Mitchell, J. G.
(1990). Genesis of collision volcanism in Eastern Anatolia, Turkey.
Journal of Volcanology and Geothermal Research 44, 189---229.
Pearce, J. A., Baker, P. E., Harvey, P. K. & Luff, I. W. (1995).
Geochemical evidence for subduction fluxed mantle melting and
fractional crystallization beneath the South Sandwich Island arc.
Journal of Petrology 36, 1073---1109.
Platt, J. P. & England, P. C. (1993). Convective removal of lithosphere
beneath mountain belts: thermal and mechanical consequences.
American Journal of Science 293, 307---336.
Platt, J. P. & Visser, R. L. M. (1989). Extensional collapse of thickened
continental lithosphere: a working hypothesis for the Alboran Sea
and Gibraltar arc. Geology 17, 540---543.
Roeder, P. L. & Emslie, R. F. (1970). Olivine---liquid equilibrium.
Contributions to Mineralogy and Petrology 29, 275---289.Sadeghi, H., Suzuki, S. & Takenaka, H. (2000). Tomographic
low-velocity anomalies in the uppermost mantle around the
northeastern edge of Okinawa trough, the backarc of Kyushu.
Geophysical Research Letters 27, 277---280.Schmidt, K. H., Bottazzi, P., Vannucci, R. & Mengel, K. (1999). Trace
element partitioning between phlogopite, clinopyroxene and leucite
lamproite melt. Earth and Planetary Science Letters 168, 287---299.
Shinjo, R. (1998). Petrochemistry and tectonic significance of the
emerged late Cenozoic basalts behind the Okinawa Trough---
Ryukyu arc system. Journal of Volcanology and Geothermal Research 80,
39---53.Shinjo, R. (1999). Geochemistry of high Mg andesites reflects the
tectonic evolution of the Okinawa Trough---Ryukyu arc system.
Chemical Geology 157, 69---88.
Shinjo, R., Ban, M., Saito, K. & Kato, Y. (1991). K---Ar dating of
the volcanic rocks in the Ryukyu arc. Journal of the Japanese Association
of Mineralogists, Petrologists and Economic Geologists 86, 323---328
(in Japanese).
Shinjo, R., Chung, S. L., Kato, Y. & Kimura, M. (1999). Geochemical
and Sr---Nd isotopic characteristics of volcanic rocks from the
Okinawa Trough and Ryukyu arc: implications for the evolution of a
young, intra-continental backarc basin. Journal of Geophysical Research
104, 10591---10608.
Sibuet, J.-C., Hsu, S.-K., Shyu, C.-T. & Liu, C.-S. (1995). Structural
and kinematic evolutions of the Okinawa Trough backarc basin.
In: Taylor, B. (eds) Backarc Basins: Tectonics and Magmatism. New York:
Plenum, pp. 343---379.
Sibuet, J.-C., Deffontaines, B., Hsu, S.-K., Thareau, N., Le Formal, J.-P.,
Liu, C. S. & the ACT party (1998). The Okinawa Trough backarc
basin: early tectonic and magmatic evolution. Journal of Geophysical
Research 103, 30245---30267.
Sun, S. C. & Hsu, Y. Y. (1991). Overview of the Cenozoic geology
and tectonic development of offshore and onshore Taiwan.
TAICRUST Workshop Proceedings (June 10---12, 1991), Taipei, Taiwan,
pp. 35---47.
Sun, S.-s. (1980). Lead isotopic study of young volcanic rocks from
mid-ocean ridges, ocean islands and island arcs. Philosophical
Transactions of Royal Society of London, Series A 297, 409---445.
Sun, S.-s. & McDonough, W. F. (1989). Chemical and isotopic
systematics of oceanic basalts: implications for mantle composition
and processes. In: Saunders, A. D. & Norry, M. J. (eds) Magmatism
in the Ocean Basins. Geological Society, London, Special Publications 42,
313---345.
Sun, S.-s., Nesbitt, R. W. & Sharaskin, A. Y. (1979). Geochemical
characteristics of mid-ocean ridge basalts. Earth and Planetary Science
Letters 44, 119---138.
Suppe, J. (1984). Kinematics of arc---continent collision, flipping of
subduction, and back-arc spreading near Taiwan. Memoir of the
Geological Society of China 6, 21---34.
Tatsumi, Y. & Kogiso, T. (1997). Trace element transport during
dehydration processes in the subducted oceanic crust: 2. Origin of
chemical and physical characteristics in arc magmatism. Earth and
Planetary Science Letters 148, 207---221.
Tatsumoto, M., Basu, A. R., Huang, W. K., Wang, J. W. & Xie, G. H.
(1992). Sr, Nd, and Pb isotopes of ultramafic xenoliths in volcanic
rocks of Eastern China: enriched components EMI and EMII in
subcontinental lithosphere. Earth and Planetary Science Letters 113,
107---128.Taylor, R. N. & Nesbitt, R. W. (1998). Isotopic characteristics of
subduction fluids in an intra-oceanic setting, Izu---Bonin Arc, Japan.
Earth and Planetary Science Letters 164, 79---98.
Teng, L. S. (1990). Geotectonic evolution of late Cenozoic arc---continent collision in Taiwan. Tectonophysics 183, 57---76.
Teng, L. S. (1996). Extensional collapse of the northern Taiwan
mountain belt. Geology 24, 949---952.
Teng, L. S., Chen, C.-H., Wang, W. S., Liu, T. K., Juang, W. S. &
Chen, J. C. (1992). Plate kinematic model for late Cenozoic arc
magmatism in northern Taiwan. Journal of the Geological Society of China
35, 1---18.
Thirlwall, M. F. (2000). Inter-laboratory and other errors in Pb isotope
analyses investigated using a 207Pb---204Pb double spike. Chemical
Geology 163, 299---322.
Tsao, S. J. (1994). Potassium---argon age determination of volcanic
rocks from the Tatun volcano group. Bulletin of the Central Geological
Survey 9, 137---154 (in Chinese).
Tu, K., Flower,M. J., Carlson, R.W., Xie, G., Chen, C. Y. & Zhang,M.
(1992). Magmatism in the South China Basin 1. Isotopic and
trace-element evidence for an endogenous Dupal mantle compo-
nent. Chemical Geology 97, 47---63.
Turner, S., Sandiford, M. & Foden, J. (1992). Some geodynamic and
compositional constraints on ‘postorogenic’ magmatism. Geology 20,
931---934.
Turner, S., Hawkesworth, C. J., Liu, J. Q., Rogers, N., Kelley, S. &
van Calsteren, P. (1993). Timing of Tibetan uplift constrained by
analysis of volcanic rocks. Nature 364, 50---53.
Turner, S., Arnaud, N., Liu, J., Rogers, N.,Hawkesworth, C., Harris, N.,
Kelley, S., van Calsteren, P. & Deng, W. (1996). Post-collisional,
shoshonitic volcanism on the Tibetan Plateau: implications for
convective thinning of the lithosphere and the source of ocean island
basalts. Journal of Petrology 37, 45---71.
Turner, S., Platt, J. P, George, R. M. M., Kelley, S. P., Pearson, D. G.
& Nowell, G. M. (1999). Magmatism associated with orogenic
collapse of the Betic---Alboran Domain, SE Spain. Journal of Petrology
40, 1011---1036.
Wageman, J. M., Hilde, T. W. C. & Emery, K. O. (1970). Structure
framework of East China Sea and Yellow Sea. AAPG Bulletin 54,
1611---1643.
JOURNAL OF PETROLOGY VOLUME 45 NUMBER 5 MAY 2004
1010
by guest on April 16, 2016
http://petrology.oxfordjournals.org/D
ownloaded from
Wang, K. L., Chung, S. L., Shinjo, R., Chen, C. H., Yang, T. F. &
Chen, C.-H. (1999). Post collisional magmatism around northern
Taiwan and its relation with opening of the Okinawa Trough.
Tectonophysics 308, 363---376.
Wang, K. L., Chen, C. H., Chung, S. L., Lin, L. H., Lo, C. H.,
Yang, T. F. & Lee, H. Y. (2000). Field occurrence, 40Ar/39Ar dating
and petrochemical features of volcanic rocks in Mienhuayu off
NE Taiwan. Journal of the Geological Society of China 43, 247---266.
Wang, K. L., Chung, S. L., Chen, C. H. & Chen, C.-H. (2002).
Geochemical constraints on the petrogenesis of high-Mg basaltic
andesites from the northern Taiwan volcanic zone and their
geodynamic significance. Chemical Geology 182, 513---528.Wang,K. L.,O’Reilly, S. Y.,Griffin,W. L.,Chung, S. L.&Pearson,N. J.
(2003). Proterozoic mantle lithosphere beneath the extended margin
of the South China Block: in situ Re---Os evidence. Geology 31,
709---712.Wang, S. L. (1998). Ar---Ar dating and geochemistry of volcanic rocks
dredged from the middle Okinawa Trough. MS thesis, National
Taiwan University, Taipei (in Chinese).
Wang, W. S. & Chen, C.-H. (1990). The volcanology and fission track
age dating of pyroclastic deposits in Tatun Volcano group, northern
Taiwan. Acta Geologica Taiwanica 28, 1---30.
Woodhead, J. D., Volker, F. & McCulloch, M. T. (1995). Routine lead
isotope determination using lead-207---lead-204 double spike: a long-
term assessment of analytical precision and accuracy. Analyst 120,
35---39.
Wyllie, P. J. & Sekine, T. (1982). The formation of mantle phlogopite in
subduction zone hybridization. Contributions to Mineralogy and Petrology
79, 375---380.
Yang, H. J., Chen, J. C. & Yang, H. Y. (1987). Geochemistry of
ultramafic nodules in basaltic rocks from Peiliao, Penghu Islands and
Liutsu, Northern Taiwan. Proceedings of the Geological Society of China 30,
44---57.
Yeh, Y. H., Lin, C. H. & Roecker, S. W. (1989). A study of upper
crustal structures beneath northeastern Taiwan: possible evidence of
the western extension of Okinawa Trough. Proceedings of the Geological
Society of China 32, 139---156.
Yeh, Y. H., Barrier, E., Lin, C. H. & Angelier, J. (1991). Stress tensor
analysis in the Taiwan area from focal mechanisms of earthquakes.
Tectonophysics 200, 267---280.
Yu, S. B. & Chen, H. Y. (1994). Global positioning system
measurements of crustal deformation in the Taiwan arc---continent collision zone. Terrestrial, Atmospheric and Oceanic Sciences 5,
477---498.
WANG et al. GEODYNAMIC EVOLUTION OF NORTHERN TAIWAN
1011
by guest on April 16, 2016
http://petrology.oxfordjournals.org/D
ownloaded from