Geo ogic Controls of Deep Natural Gas Resources in the ...
248
Geo ogic Controls of Deep Natural Gas Resources in the United States U.S. GEOLOGICAL SURVEY BULLETIN 2146
-
Upload
khangminh22 -
Category
Documents
-
view
5 -
download
0
Transcript of Geo ogic Controls of Deep Natural Gas Resources in the ...
Geo ogic Controls of Deep Natural Gas Resources in the United States
U.S. GEOLOGICAL SURVEY BULLETIN 2146

Cover. Lofftand Brothers drill rig on the site of the Lone Star Production Company No. 1 Earnest Baden well spudded in September 1970 in Beckham County, Oklahoma. The No. 1 Earnest Baden well was drilled to a depth of 30,050 ft and is the second deepest petroleum well drilled in the United States. Photograph provided by GHK Company, Oklahoma City, Oklahoma.

Geologic Controls of Deep Natural Gas Resources in the United States
Edited by T.S. Dyman, D.D. Rice, and P.A. Westcott
U.S. GEOLOGICAL SURVEY BULLETIN 2146
The research on which these chapters are based was funded by the Gas Research Institute, U.S. Department of Energy, and U.S. Geological Survey
UNITED STATES GOVERNMENT PRINTING OFFICE, WASHINGTON: 1997

U.S. DEPARTMENT OF THE INTERIOR
BRUCE BABBITT, Secretary
U.S. GEOLOGICAL SURVEY
Gordon P. Eaton, Director
For sale by U.S. Geological Survey, Information Services Box 25286, Federal Center
Denver, CO 80225
Any use of trade, product, or firm names in this publication is for descriptive purposes only and does not imply endorsement by the U.S. Government
Library of Congress Cataloging-in-Publication Data
Geologic controls of deep natural gas resources in the United States I edited by T.S. Dyman, D.D. Rice, and P.A. Westcott.
p. em.- (U.S. Geological Survey bulletin ; ) Includes bibliographical references. Supt. of Docs. no.: I 19.3:B2146A-O 1. Natural gas-Geology-United States. 2. Gas fields-United States.
I. Dyman, T. S. II. Rice, Dudley D. III. Westcott, P. A. IV. Series. QE75.B9 [TN88l.Al] 557.3 s-dc20 [553.2'85'0973] 95-37556
CIP
CONTENTS [Letters designate chapters]
A. Introduction
By T.S. Dyman, D.O. Rice, and P.A. Westcott
B. Maps Illustrating the Distribution of Deep Wells in the United States by Geologic Age
By Craig J. Wandrey and David K. Vaughan
C. Geologic and Production Characteristics of Deep Natural Gas Resources Based on Data From Significant Fields and Reservoirs
By T.S. Dyman, C.W. Spencer, J.K. Baird, R.C. Obuch, and D.T. Nielsen
D. Structural Settings of Deep Natural Gas Accumulations in the Conterminous United States
By William J. Perry, Jr.
E. Sequential Laramide Deformation and Paleocene Depositional Patterns in Deep GasProne Basins of the Rocky Mountain Region
By William J. Perry, Jr., and R.M. Flores
F. Initial Potential Test Data From Deep Wells in the United States
By C.W. Spencer and Craig J. Wandrey
G. Physical Properties of Clastic Reservoir Rocks in the Uinta, Wind River, and Anadarko Basins, As Determined by Mercury-Injection Porosimetry
By C.W. Keighin
H. Porosity Prediction in Deeply Buried Sandstones, With Examples From Cretaceous Formations of the Rocky Mountain Region
By James W. Schmoker
I. Porosity Trends of Pennsylvanian Sandstones With Respect to Thermal Maturity and Thermal Regimes in the Anadarko Basin, Oklahoma
By Timothy C. Hester
J. Source-Rock Potential of Precambrian Rocks in Selected Basins of the United States
By James G. Palacas
K. Minimum Thermal Stability Levels and Controlling Parameters of Methane, As Determined by C15+ Hydrocarbon Thermal Stabilities
By Leigh C. Price
L. Origins, Characteristics, Evidence For, and Economic Viabilities of Conventional and Unconventional Gas Resource Bases
By Leigh C. Price
III
IV CONTENTS
M. Migration of Hydrocarbon and Nonhydrocarbon Gases From the Deep Crust-Composition, Flux, and Tectonic Setting
By Robert C. Burruss
N. Deep Natural Gas Resources in the Eastern Gulf of Mexico
By Dudley D. Rice, Christopher J. Schenk, James W. Schmoker, James E. Fox, Jerry L. Clayton, Thaddeus S. Dyman, Debra K. Higley, C. William Keighin, BenE.Law,andRichardM.Pollastro
0. Assessment Methodology for Deep Natural Gas Resources
By G .L. Dolton and R.A. Crovelli
CONVERSION TABLE
Multiply
Cubic meters Cubic kilometers Kilometers Meters Centimeters Kilopascals Microns (micrometers)
BCFG BOE kPa mD MMCFG MMBO psi psi a R0eq
Ro Tmax
TCFG
By To obtain
35.31 Cubic feet 0.24 Cubic miles 0.62 Miles 3.28 Feet 0.39 Inches 6.90 Pounds per square inch ( 100 bars) 0.001 Millimeters
ABBREVIATIONS
Billions of cubic feet of gas Barrels of oil-equivalent Kilopascal Millidarcy Millions of cubic feet of gas Millions of barrels of oil Pounds per square inch Pounds per square inch (absolute) Equivalent vitrinite reflectance Vitrinite reflectance Maximum pyrolysis temperature Trillions of cubic feet of gas
Introduction
By T.S. Dyman, D.D. Rice, and P.A. Westcott
GEOLOGIC CONTROLS OF DEEP NATURAL GAS RESOURCES IN THE UNITED STATES
U.S. GEOLOGICAL SURVEY BULLETIN 2146-A
UNITED STATES GOVERNMENT PRINTING OFFICE, WASHINGTON: 1997

CONTENTS
References Cited ............................................................................................................ 5
FIGURE
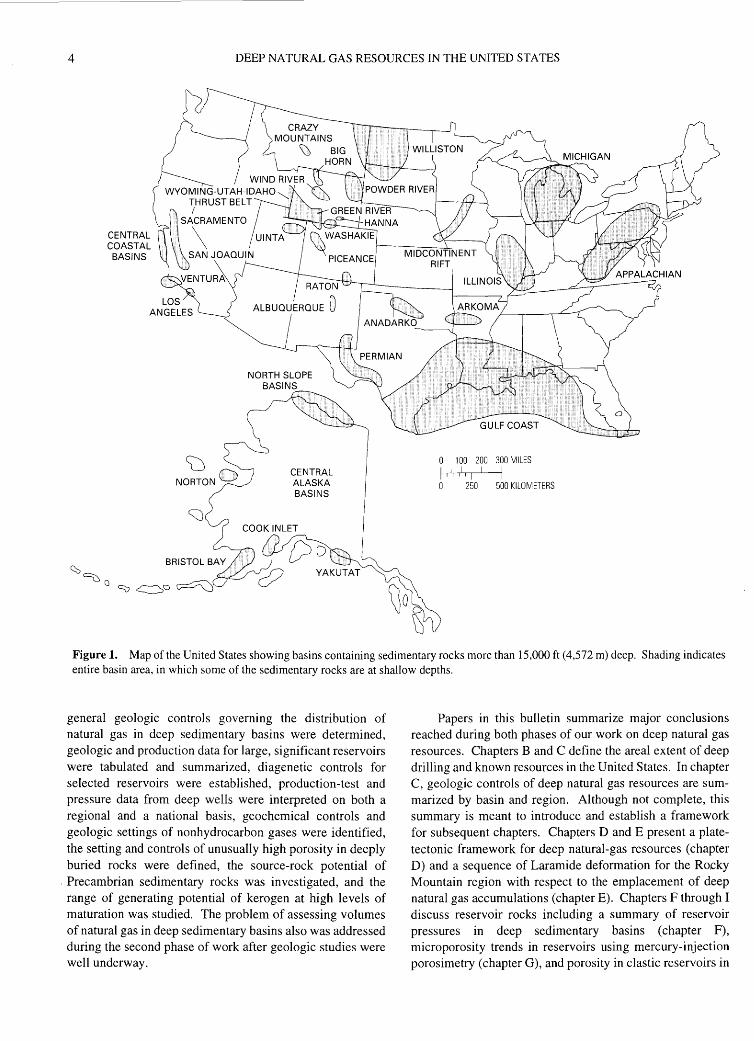
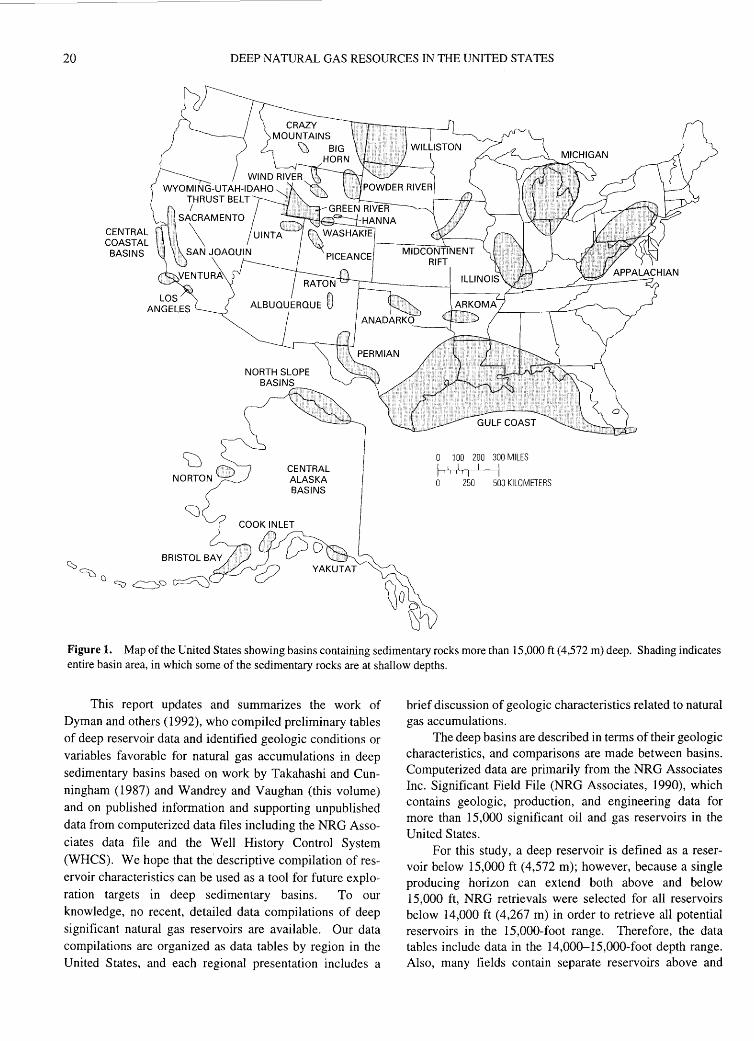
1. Map of the United States showing basins containing sedimentary rocks more than than 15,000 ft (4,572 m) deep...... 4
Introduction
By T.S. Dyman, D.D. Rice, and P.A. Westcott
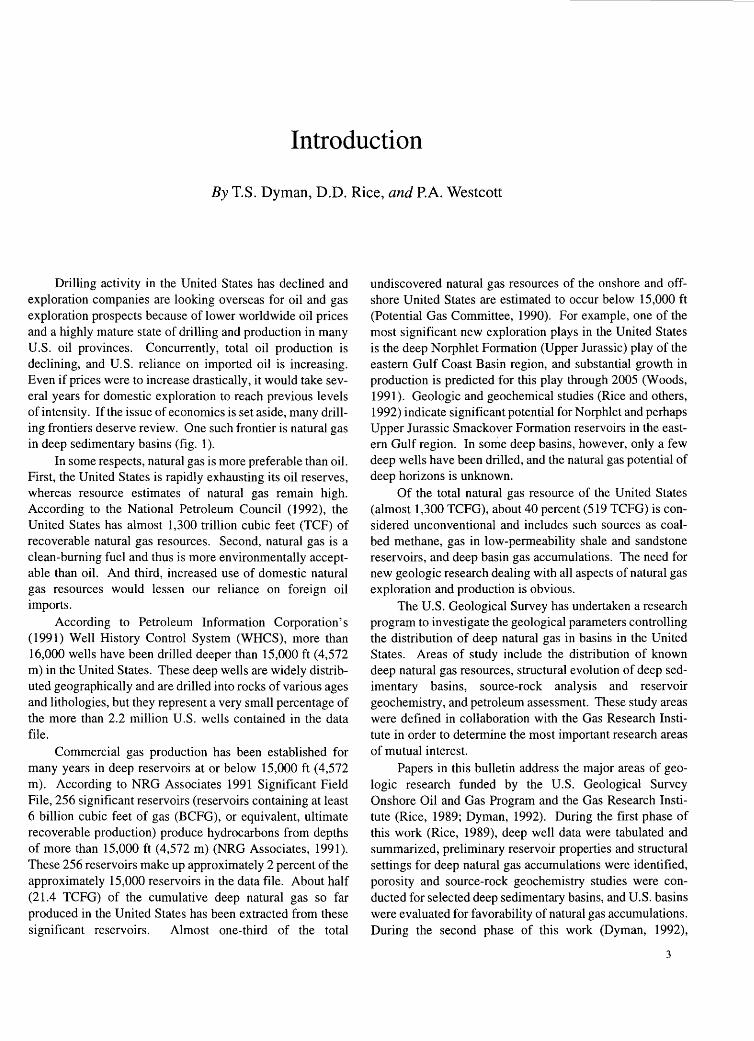
Drilling activity in the United States has declined and exploration companies are looking overseas for oil and gas exploration prospects because of lower worldwide oil prices and a highly mature state of drilling and production in many U.S. oil provinces. Concurrently, total oil production is declining, and U.S. reliance on imported oil is increasing. Even if prices were to increase drastically, it would take several years for domestic exploration to reach previous levels of intensity. Ifthe issue of economics is set aside, many drilling frontiers deserve review. One such frontier is natural gas in deep sedimentary basins (fig. 1).
In some respects, natural gas is more preferable than oil. First, the United States is rapidly exhausting its oil reserves, whereas resource estimates of natural gas remain high. According to the National Petroleum Council (1992), the United States has almost 1,300 trillion cubic feet (TCF) of recoverable natural gas resources. Second, natural gas is a clean-burning fuel and thus is more environmentally acceptable than oil. And third, increased use of domestic natural gas resources would lessen our reliance on foreign oil imports.
According to Petroleum Information Corporation's (1991) Well History Control System (WHCS), more than 16,000 wells have been drilled deeper than 15,000 ft (4,572 m) in the United States. These deep wells are widely distributed geographically and are drilled into rocks of various ages and lithologies, but they represent a very small percentage of the more than 2.2 million U.S. wells contained in the data file.
Commercial gas production has been established for many years in deep reservoirs at or below 15,000 ft ( 4,572 m). According to NRG Associates 1991 Significant Field File, 256 significant reservoirs (reservoirs containing at least 6 billion cubic feet of gas (BCFG), or equivalent, ultimate recoverable production) produce hydrocarbons from depths of more than 15,000 ft (4,572 m) (NRG Associates, 1991). These 256 reservoirs make up approximately 2 percent of the approximately 15,000 reservoirs in the data file. About half (21.4 TCFG) of the cumulative deep natural gas so far produced in the United States has been extracted from these significant reservoirs. Almost one-third of the total
undiscovered natural gas resources of the onshore and offshore United States are estimated to occur below 15,000 ft (Potential Gas Committee, 1990). For example, one of the most significant new exploration plays in the United States is the deep Norphlet Formation (Upper Jurassic) play of the eastern Gulf Coast Basin region, and substantial growth in production is predicted for this play through 2005 (Woods, 1991). Geologic and geochemical studies (Rice and others, 1992) indicate significant potential for Norphlet and perhaps Upper Jurassic Smackover Formation reservoirs in the eastern Gulf region. In some deep basins, however, only a few deep wells have been drilled, and the natural gas potential of deep horizons is unknown.
Of the total natural gas resource of the United States (almost 1,300 TCFG), about 40 percent (519 TCFG) is considered unconventional and includes such sources as coalbed methane, gas in low-permeability shale and sandstone reservoirs, and deep basin gas accumulations. The need for new geologic research dealing with all aspects of natural gas exploration and production is obvious.
The U.S. Geological Survey has undertaken a research program to investigate the geological parameters controlling the distribution of deep natural gas in basins in the United States. Areas of study include the distribution of known deep natural gas resources, structural evolution of deep sedimentary basins, source-rock analysis and reservoir geochemistry, and petroleum assessment. These study areas were defined in collaboration with the Gas Research Institute in order to determine the most important research areas of mutual interest.
Papers in this bulletin address the major areas of geologic research funded by the U.S. Geological Survey Onshore Oil and Gas Program and the Gas Research Institute (Rice, 1989; Dyman, 1992). During the first phase of this work (Rice, 1989), deep well data were tabulated and summarized, preliminary reservoir properties and structural settings for deep natural gas accumulations were identified, porosity and source-rock geochemistry studies were conducted for selected deep sedimentary basins, and U.S. basins were evaluated for favorability of natural gas accumulations. During the second phase of this work (Dyman, 1992),
3
4 DEEP NATURAL GAS RESOURCES IN THE UNITED STATES
CENTRAL COASTAL BASINS
u NORTOND
CENTRAL ALASKA BASINS
0 100 200 300 MILES ,,,, ,1, I I I
0 250 500 KILOMETERS
Figure 1. Map of the United States showing basins containing sedimentary rocks more than 15,000 ft (4,572 m) deep. Shading indicates entire basin area, in which some of the sedimentary rocks are at shallow depths.
general geologic controls governing the distribution of natural gas in deep sedimentary basins were determined, geologic and production data for large, significant reservoirs were tabulated and summarized, diagenetic controls for selected reservoirs were established, production-test and pressure data from deep wells were interpreted on both a regional and a national basis, geochemical controls and geologic settings of nonhydrocarbon gases were identified, the setting and controls of unusually high porosity in deeply buried rocks were defined, the source-rock potential of
, Precambrian sedimentary rocks was investigated, and the range of generating potential of kerogen at high levels of maturation was studied. The problem of assessing volumes of natural gas in deep sedimentary basins also was addressed during the second phase of work after geologic studies were well underway.
Papers in this bulletin summarize major conclusions reached during both phases of our work on deep natural gas resources. Chapters B and C define the areal extent of deep drilling and known resources in the United States. In chapter C, geologic controls of deep natural gas resources are summarized by basin and region. Although not complete, this summary is meant to introduce and establish a framework for subsequent chapters. Chapters D and E present a platetectonic framework for deep natural-gas resources (chapter D) and a sequence of Laramide deformation for the Rocky Mountain region with respect to the emplacement of deep natural gas accumulations (chapter E). Chapters F through I discuss reservoir rocks including a summary of reservoir pressures in deep sedimentary basins (chapter F), microporosity trends in reservoirs using mercury-injection porosimetry (chapter G), and porosity in clastic reservoirs in

INTRODUCTION 5
relation to thermal maturity for Rocky Mountain basins and the Anadarko Basin (chapters Hand I). Chapters J through M describe geochemical and source-rock studies on Precambrian source-rock potential (chapter J), source and controls of deep-basin natural gas (chapters K and L), and migration of hydrocarbon and nonhydrocarbon gases (chapter M). Chapter N discusses the potential of deep natural gas resources in the Gulf Coast Basin in terms of both sourceand reservoir-rocks. In chapter 0, assessment methodologies are evaluated, an assessment is presented for a hypothetical deep natural gas play, and play input parameters are modelled in order to show the range of results under different play conditions. Assessment methods were based on natural gas plays, which are defined by unique geologic characteristics and commonly are basinwide.
The papers presented herein are intended to introduce the petroleum community to a set of geologic tools that may be used to predict deep undiscovered natural gas accumulations. This set of tools is not meant to be complete but is a starting point from which to conduct future exploration and production studies. We hope that future studies will include new and expanded applications of the techniques presented here. For example, studies of porosity prediction using thermal maturity measurements must be tested in many deep sedimentary basins and compared with reservoir controls governing the distribution of natural gas. Our assessment models must be evaluated under a broader range of geologic environments and tested in areas of known deep natural gas accumulations. With continued scientific commitment, we hope that deep natural gas resources will become an even more significant and valued part of our Nation's petroleum endowment.
Acknowledgments.-We acknowledge the careful and critical reviews of manuscripts by Katharine L. Varnes, Mahlon M. Ball, Jerry L. Clayton, Mitchell E. Henry, and Michael D. Lewan. Ronald R. Charpentier, Timothy Klett, and Raymond C. Obuch retrieved reservoir data from the NRG Associates file and well data from the Well History Control System for quantitative analysis. James K. Baird, Diane T. Nielsen, and David K. Vaughan of the U.S. Geological Survey tabulated production data summaries and prepared graphical output for analysis. Many thanks also to
Tommy Kostick of the U.S. Geological Survey for his patience in preparing some text figures and to Leslie Oliver and Shirley Oscarson for their work in computer manuscript processing. Judy Stoeser and Lorna Carter of the U.S. Geological Survey patiently and carefully reviewed the manuscripts for editorial standards. Work was conducted in part under contract to GRI, Chicago, Illinois (Contract Nos. 5087-260-1607 and 5090-260-2040).
REFERENCES CITED
Dyman, T.S., ed., 1992, Geologic controls and resource potential of natural gas in deep sedimentary basins in the United States: U.S. Geological Survey Open-File Report 92-524, 287 p.
National Petroleum Council, 1992, The potential for natural gas in the United States-Executive summary: National Petroleum Council, 24 p., with appendices.
NRG Associates Inc., 1991, The significant oil and gas fields of the United States (through December 31. 1991): Available from Nehring Associates, Inc., P.O. Box 1655, Colorado Springs, Colorado 80901.
Petroleum Information Corporation, 1991, Well History Control System (through December 1991): Available from Pet~oleum Information Corporation, 4100 East Dry Creek Road, Littleton, Colorado 80122.
Potential Gas Committee, 1990, Potential supply of natural gas in the United States: Golden, Colorado, Colorado School of Mines, 169 p.
Rice, D.D., ed., 1989, Distribution of natural gas and reservoir properties in the continental crust of the U.S.: Gas Research Institute Final Report GRI-89/0188, 132 p.
Rice, D.D., Schenk, C.J., Schmoker, J.W., Fox, J.E., Clayton, J.L., Dyman, T.S., Higley, D.K., Keighin, C.W., Law, B.E., and Pollastro, R.M., 1992, Potential for deep natural gas resources in eastern Gulf of Mexico, in Malone, R.D., Shoemaker, H. D., and Byrer, C.W., eds., Proceedings of the natural gas research and development contractors review meeting: U.S. Department of Energy, Morgantown Energy Technology Center Report 92/6125, p. 151-166.
Woods, T.J., 1991, The long-term trends in U.S. gas supply and prices-1991 edition of the GRI baseline projection of U.S. energy supply and demand to 2010: Gas Research Institute, 54p.

Maps Illustrating the Distribution of Deep Wells in the United States by Geologic Age
By Craig J. Wandrey and David K. Vaughan
GEOLOGIC CONTROLS OF DEEP NATURAL GAS RESOURCES IN THE UNITED STATES
U.S. GEOLOGICAL SURVEY BULLETIN 2146-B
UNITED STATES GOVERNMENT PRINTING OFFICE, WASHINGTON: 1997

CONTENTS
Abstract........................................................................................................................... 9 Producing and Nonproducing Deep Wells...................................................................... 9 References Cited . . ..... .......... ... .......... ............. .... .. ...... .. .. ........................ .. .. ... .......... ......... 13
FIGURES
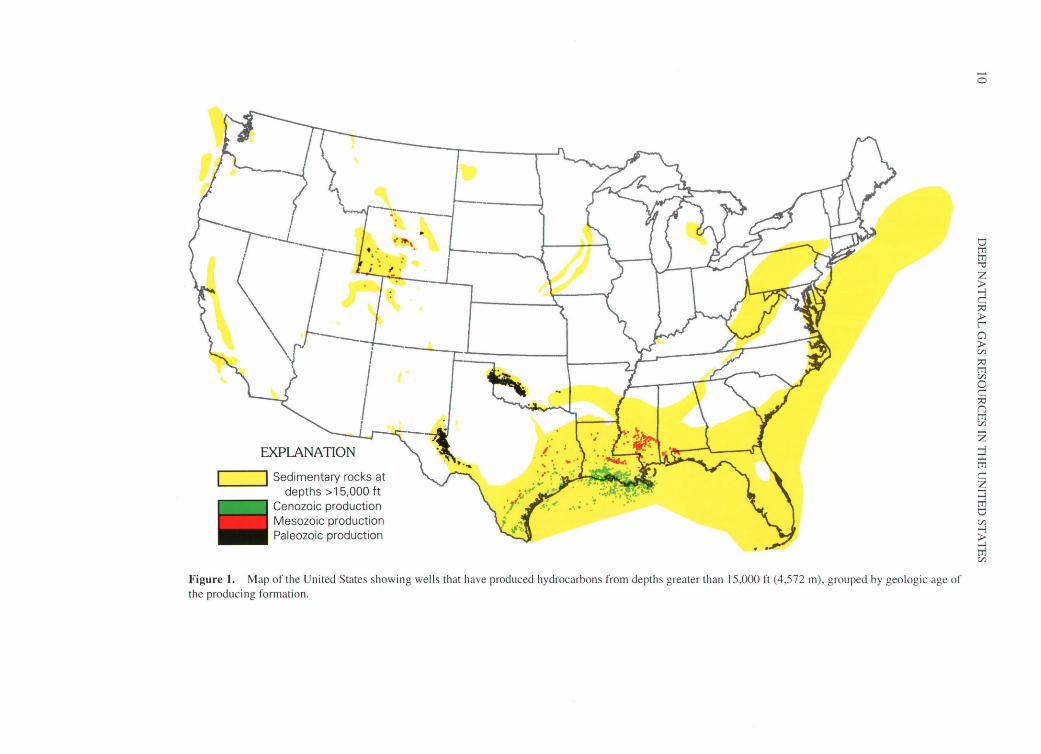
1. Map of the United States showing wells that have produced hydrocarbons from depths greater than 15,000 ft, grouped by geologic age of the producing formation...................................................................................................... 10
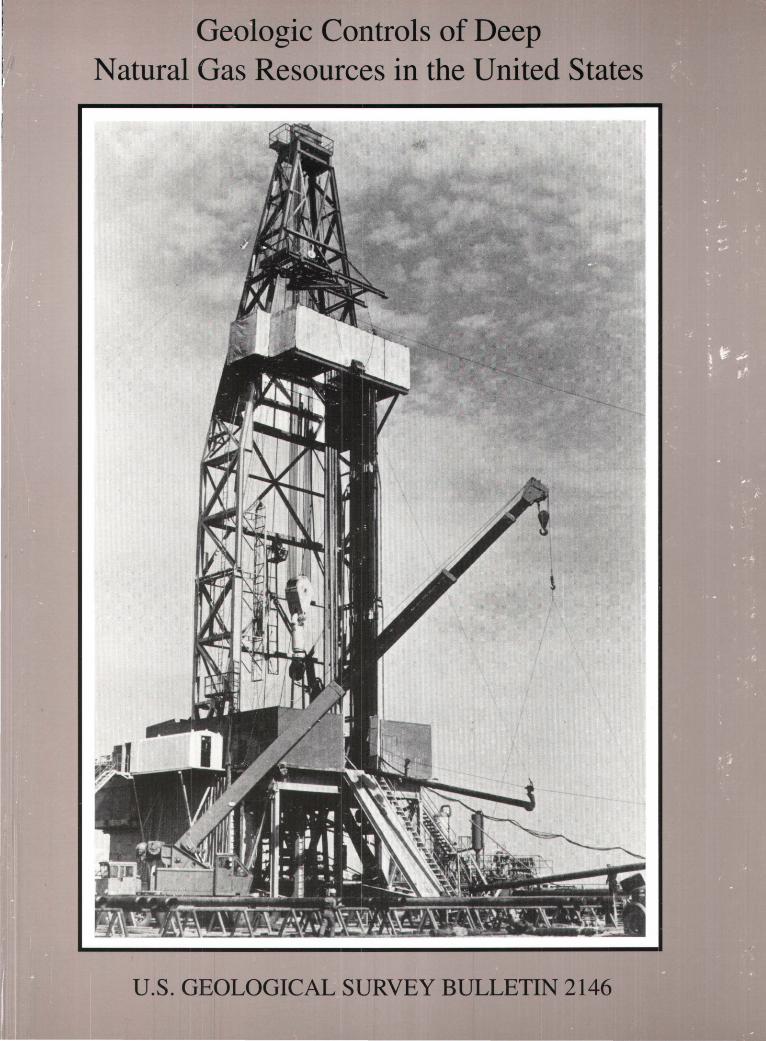
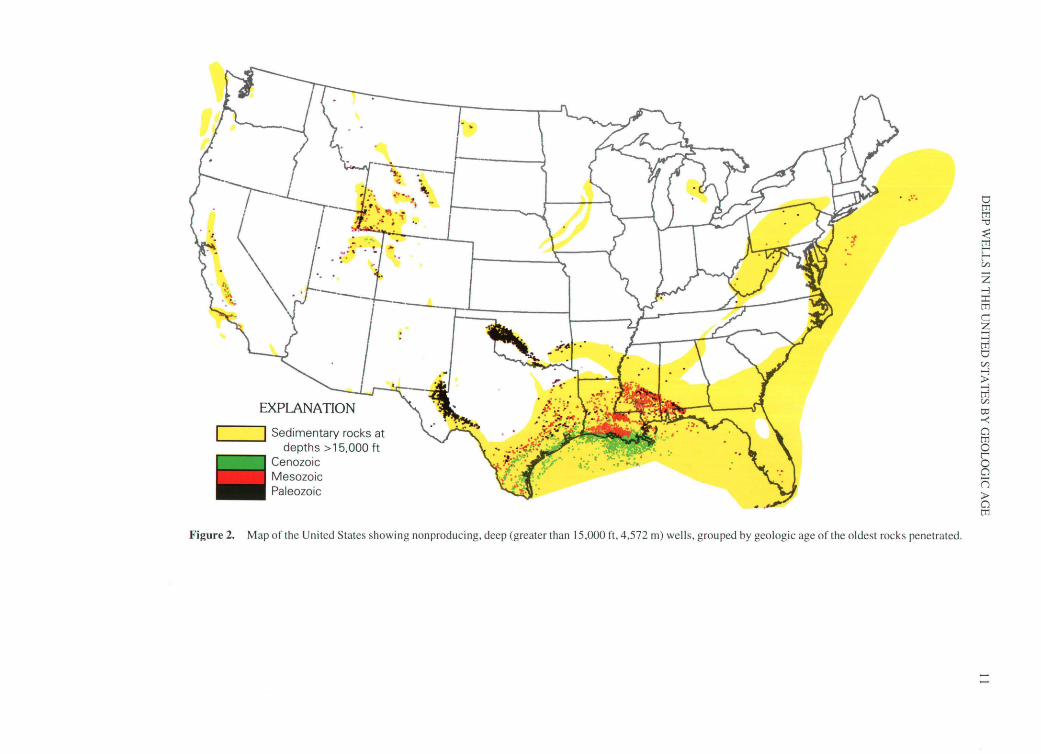
2. Map of the United States showing nonproducing, deep wells, grouped by geologic age of the oldest rocks penetrated......................................................................................................................................................................... 11
TABLE
1. Number of total wells and producing wells by production category and tectonic regime for selected basins in the United States.......................................................................................................................................................... 12
Maps Illustrating the Distribution of Deep Wells in the United States by Geologic Age
By Craig J. Wandrey and David K. Vaughan
ABSTRACT
Two maps display exploration and production histories for wells from deep reservoirs (greater than 15,000 ft, 4,572 m). The first map shows producing oil and condensate or gas wells by geologic age of producing reservoir. The second map shows nonproducing wells by geologic age of the oldest rocks penetrated or investigated. The accompanying table demonstrates the relationship between structural classification of basins and commodities produced. Deep reservoirs in general are gas prone, in part due to long exposure of source rocks to higher temperatures. Younger deep basins are commonly oil prone, in part due to a shorter deep burial history and resultant shorter exposure of source rocks to higher temperatures. Continued hydrocarbon generation in these younger basins also contributes to overpressuring, which in turn contributes to suppression of thermal maturity in source rocks.
PRODUCING AND NONPRODUCING DEEP WELLS
Maps showing wells drilled deeper than 15 ,000 ft ( 4,572 m) were compiled using Petroleum Information Corporation ' s Well History Control System (WHCS) files as of June 1991 (Petroleum Information Corporation, 1991 ). These files contain geologic, engineering, and production data for more than 2.2 million exploration and production wells drilled in the United States. Figure 1 shows wells that have produced hydrocarbons from depths greater than 15,000 ft, grouped by geologic age of the producing formation. Figure 2 shows deep nonproducing wells, grouped by the age of the oldest rocks penetrated.
Parts (yellow areas) of the maps identify areas containing sedimentary rocks at depths of 15,000 ft (4,572 m) or greater in each region or basin . Sedimentary thickness data were compiled using a contour map of sedimentary rock depth of the conterminous United States (Frezon and others, 1983), an unpublished basement map of the southwestern
United States (W.C. Butler, U.S . Geological Survey, 1992), and well log and seismic data for the Midcontinent Rift system (Anderson, 1990). Producing wells shown in figure 1 were color-coded by geologic age of producing formation (Cenozoic, Mesozoic, Paleozoic) using geologic age codes in the WHCS files. These data were compiled from five maps of producing wells by Wandrey and Vaughan (1992).
Although the data are current, they are not always complete or entirely accurate. Therefore, several cross checks were made to ensure that the wells shown in figure 1 did in fact produce from depths greater than 15,000 ft (4,572 m). WHCS records commonly show that a well produced petroleum and was drilled to greater than 15,000 ft, but the depth of production is not identified in the file. In these cases, the wells were cross checked against subsurface geologic maps, depth of formation top, and initial-potential files. Information on individual wells in the Gulf Coast Basin is particularly misleading or missing; in many cases, wells were drilled into salt domes created by flowage of salt from older deeper salt beds up into younger rocks , and the age of the salt rather than that of the surrounding rocks is given.
Table 1 shows a compilation of producing well categories used to prepare figure 1. Of the 6,178 wells that produce or have produced hydrocarbons from depths greater than 15,000 ft (4,572 m), 4,547 are gas or gas and condensate wells (fig. 1 ). The total wells column given in table 1 may not always equal the sum of the other three columns because some wells produced both oil and gas and are listed twice in the table. For some wells final well-classification information indicating the type of production is missing, and for others location information is not available with which to identify the basin. More than 200 of the wells identified in table 1 are not shown in the figures because well classification and location problems could not be resolved. For many offshore wells in the Gulf of Mexico, geologic age is not recorded in the WHCS files; in these cases, the approximate geologic age of formation at total depth of a well was determined by comparing the total depth of the well with that of neighboring wells for which there was geologic age information. For wells outside areas in which sedimentary rocks are 15,000 ft or deeper, location data may be inaccurate or the
9
C -) Sedimentary rocks at depths> 15,000 ft
Cenozoic production Mesozoic production Paleozoic production
Figure 1. Map of the United States showing wells that have produced hydrocarbons from depths greater than 15,000 ft (4,572 m), grouped by geologic age of the producing formation.
0
0 tT1 tT1 '"""0 z > -l c ::0 > c-o > C/)
::0 tT1 C/)
0 c ::0 (J tT1 C/)
z -l :r: tT1 c z ~ tT1 0 C/)
-l > ~ C/)
I I Sedimentary rocks at depths > 15,000 ft
Cenozoic Mesozoic Paleozoic
Figure 2. Map of the United States showing non producing, deep (greater than 15,000 ft, 4,572 m) wells, grouped by geologic age of the oldest rocks penetrated.
u tTl tTl '"0
~ tTl r r C/.l
z -3 :r: m c z ~ u C/.l -3 > -3 tTl C/.l (jj
-< 0 tTl 0 r 0 0 rs > 0 tTl
12 DEEP NATURAL GAS RESOURCES IN THE UNITED STATES
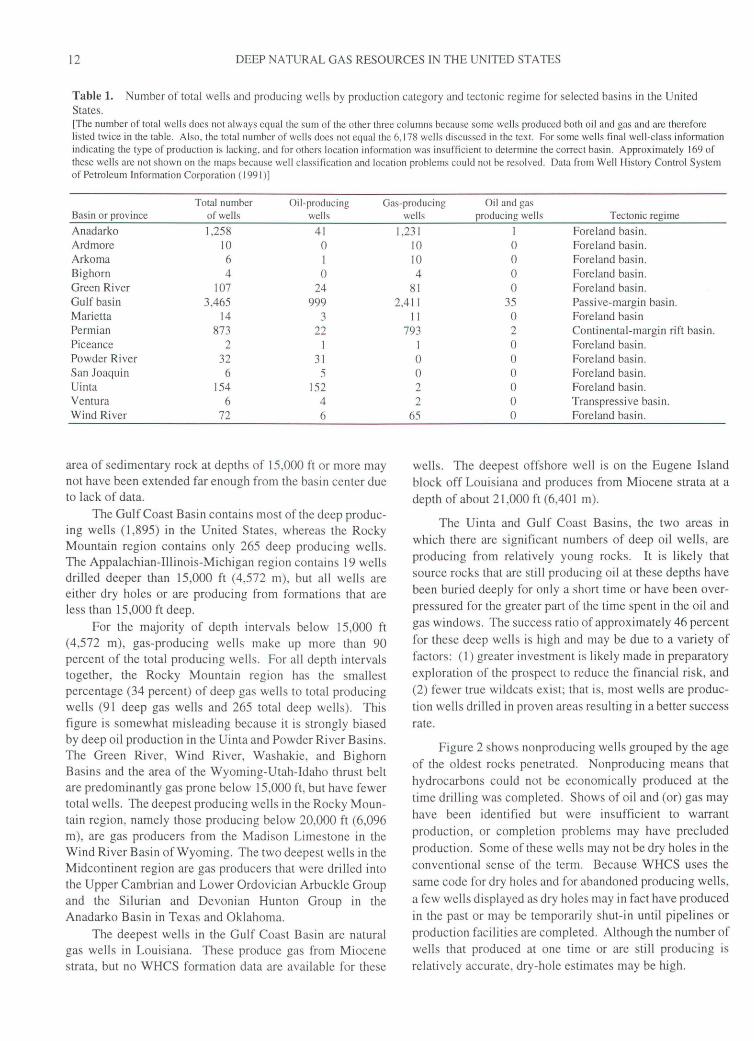
Table 1. Number of total wells and producing wells by production category and tectonic regime for selected basins in the United States. [The number of total wells does not always equal the sum of the other three columns because some wells produced both oil and gas and are therefore listed twice in the table. Also, the total number of wells does not equal the 6, 178 wells discussed in the text. For some wells final well-class information indicating the type of production is lacking, and for others location information was insufficient to determine the correct basin. Approximately 169 of these wells are not shown on the maps because well classification and location problems could not be resolved. Data from Well History Control System of Petroleum Information Corporation (1991 )]
Total number Oil-producing Gas-producing Oil and gas Basin or province of wells wells
Anadarko 1,258 41 Ardmore 10 0 Arkoma 6 1 Bighorn 4 0 Green River 107 24 Gulf basin 3,465 999 Marietta 14 3 Permian 873 22 Piceance 2 I Powder River 32 31 San Joaquin 6 5 Uinta 154 152 Ventura 6 4 Wind River 72 6
area of sedimentary rock at depths of 15,000 ft or more may not have been extended far enough from the basin center due to lack of data.
The Gulf Coast Basin contains most of the deep producing wells (1 ,895) in the United States, whereas the Rocky Mountain region contains only 265 deep producing wells. The Appalachian-Illinois-Michigan region contains 19 wells drilled deeper than 15,000 ft ( 4,572 m), but all wells are either dry holes or are producing from formations that are less than 15,000 ft deep.
For the majority of depth intervals below 15,000 ft ( 4,572 m), gas-producing wells make up more than 90 percent of the total producing wells . For all depth intervals together, the Rocky Mountain region has the smallest percentage (34 percent) of deep gas wells to total producing wells (91 deep gas wells and 265 total deep wells). This figure is somewhat misleading because it is strongly biased by deep oil production in the Uinta and Powder River Basins. The Green River, Wind River, Washakie, and Bighorn Basins and the area of the Wyoming-Utah-Idaho thrust belt are predominantly gas prone below 15,000 ft, but have fewer total wells. The deepest producing wells in the Rocky Mountain region, namely those producing below 20,000 ft (6,096 m), are gas producers from the Madison Limestone in the Wind River Basin of Wyoming. The two deepest wells in the Midcontinent region are gas producers that were drilled into the Upper Cambrian and Lower Ordovician Arbuckle Group and the Silurian and Devonian Hunton Group in the Anadarko Basin in Texas and Oklahoma.
The deepest wells in the Gulf Coast Basin are natural gas wells in Louisiana. These produce gas from Miocene strata, but no WHCS formation data are available for these
wells producing wells Tectonic regime
I ,231 I Foreland basin.
10 0 Foreland basin.
10 0 Foreland basin.
4 0 Foreland basin.
81 0 Foreland basin.
2,411 35 Passive-margin basin.
11 0 Foreland basin
793 2 Continental-margin rift basin.
I 0 Foreland basin.
0 0 Foreland basin.
0 0 Foreland basin.
2 0 Foreland basin.
2 0 Transpressive basin.
65 0 Foreland basin.
wells. The deepest offshore well is on the Eugene Island block off Louisiana and produces from Miocene strata at a depth of about 21,000 ft (6,401 m).
The Uinta and Gulf Coast Basins, the two areas in which there are significant numbers of deep oil wells, are producing from relatively young rocks. It is likely that source rocks that are still producing oil at these depths have been buried deeply for only a short time or have been overpressured for the greater part of the time spent in the oil and gas windows. The success ratio of approximately 46 percent for these deep wells is high and may be due to a variety of factors: (1) greater investment is likely made in preparatory exploration of the prospect to reduce the financial risk, and (2) fewer true wildcats exist; that is, most wells are production wells drilled in proven areas resulting in a better success
rate.
Figure 2 shows nonproducing wells grouped by the age of the oldest rocks penetrated. Nonproducing means that hydrocarbons could not be economically produced at the time drilling was completed. Shows of oil and (or) gas may have been identified but were insufficient to warrant production , or completion problems may have precluded production. Some of these wells may not be dry holes in the conventional sense of the term. Because WHCS uses the same code for dry holes and for abandoned producing wells,
a few wells displayed as dry holes may in fact have produced in the past or may be temporarily shut-in until pipelines or production facilities are completed. Although the number of wells that produced at one time or are still producing is relatively accurate, dry-hole estimates may be high.

DEEP WELLS IN THE UNITED STATES BY GEOLOGIC AGE 13
REFERENCES CITED
Anderson, R.R., 1990, Interpretation of geophysical data over Midcontinent rift system in the area of the M.G, Eischeid No. 1 petroleum test, Carroll County, Iowa, in Anderson, R.R., ed., The Amoco M.G. Eischeid No. 1 deep petroleum test, Carroll County, Iowa, preliminary investigations: Iowa Department of Natural Resources Special Report 2, p. 27-38.
Frezon, S.E., Finn, T.M., and Lister, J.H., 1983, Total thickness of sedimentary rocks in the conterminous United States: U.S.
Geological Survey Open-File Report 83-920, scale 1:5,000,000.
Petroleum Information Corporation, 1991, Well History Control System (through December 1991): Available from Petroleum Information Corporation, 4100 East Dry Creek Road, Littleton, Colorado 80122.
Wandrey, C.J. and Vaughan, D.K., 1992, Maps illustrating the distribution of deep wells in the U.S. by geologic age, in Dyman, T.S., ed., Geologic controls and resource potential of natural gas in deep sedimentary basins: U.S. Geological Survey OpenFile Report 92-524, p. 114-116, 9 plates, scale 1:5,000,000.


Geologic and Production Characteristics of Deep Natural Gas Resources Based on Data From Significant Fields and Reservoirs
By T.S. Dyman, C.W. Spencer, J.K. Baird, R.C. Obuch, and D.T. Nielsen
GEOLOGIC CONTROLS OF DEEP NATURAL GAS RESOURCES IN THE UNITED STATES
U.S. GEOLOGICAL SURVEY BULLETIN 2146-C
UNITED STATES GOVERNMENT PRINTING OFFICE, WASHINGTON: 1997

CONTENTS
Abstract . . . . . . . . . . ... . . . . . . . . . .. . . .. . . . . . . . . . . . . .... . . .... . ... . . . .. . .. . .. . . .. .. . . . ... . . . ... . . . . . . . . . . ..... . . . . . . . ..... ... . . . ..... . 19 Introduction..................................................................................................................... 19 Known Deep Natural Gas Resources.............................................................................. 22
Rocky Mountain Basins . . . . . . . ... . . . ... . . . . . . .. . .. . . . . .. . . . . . . . .. .. . .. .. . . . . . . . . . . . .. . . . . .. . ... ........... ... . . . 25 Anadarko Basin . . ... ... .. . . . . . . . . . . . . .. .. ... . . . .. . . . . .. . . . .. . . . . . . .. . . .. ... .. . . . . . . .. . . . .. . . . . . .. . . . ......... ...... . . 28 Permian Basin .. . . . .. .. .. . . . . . . . . . . . . .. .. . . .. . . . . .. . . . ... .. . . .. . . . . . . . . . . .. .. .. .. . . . . . . . . . .. . . . . .. . . . .. .. . . .. . .. .. .. . . . 30 Gulf Coast Basin .. . . .. . . . . . . . . . . . . .. . . . . .... . . . . ... . .. . .. . .. . . . . . .. . . . .. .. . . . . . . . . . . . . . .. . . . . ... . ...... . .. . ......... 32 Other Regions . . . . . .... .. . . . . . . . . . . . . .. . . . . .. . . . . .. ... . ... . . . .. . . . . . . . .. .. . .. . .. . . . . .. . .. . .. . . . . . .. ........... ...... . . . 36
References Cited ............................................................................................................. 37
FIGURES
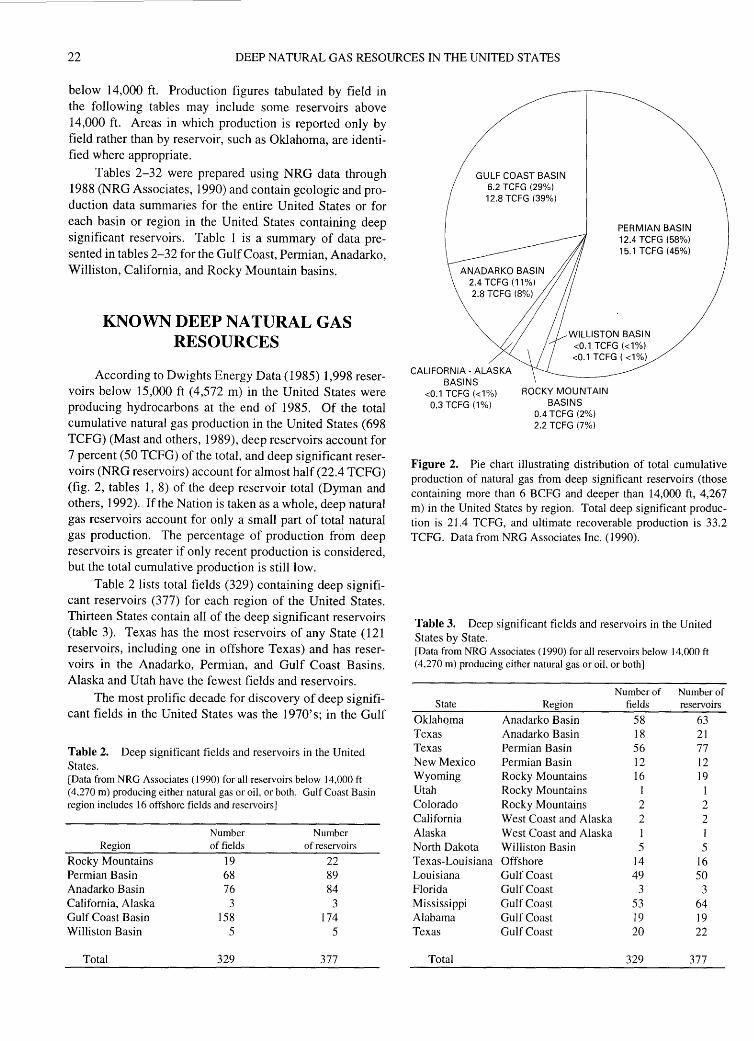
1. Map of the United States showing basins containing sedimentary rocks more than 15,000 ft deep............................. 20 2. Pie chart illustrating distribution of total cumulative production of natural gas from deep significant reservoirs
in the United States by region....................................................................................................................................... 22 3. Map of Rocky Mountain region showing basins in which deep natural gas is presumed to be present
on the basis of gas shows, formation tests, geology, and known production................................................................ 26 4. Plot of porosity versus depth for deep significant reservoirs of the United States........................................................ 27
TABLES
1. Summary of significant reservoirs in major deep basins of the United States.............................................................. 21 2. Deep significant fields and reservoirs in the United States .. .. .. .. .. .. .. .. .. .... .. .. .... .... .. ...... .... .. .. .... .... .. .... .... .. .. .... .. ...... .... .. 22 3. Deep significant fields and reservoirs in the United States by State ............................................................................ 22 4. Deep significant fields in the United States by discovery year..................................................................................... 23 5. Field completion classification for deep significant fields in the United States by region........................................... 24 6. Trapping mechanisms for deep significant reservoirs in the United States by State and (or) basin............................. 24 7. Field and reservoir name, location, average depth to production, discovery year, and cumulative production
for deepest significant reservoir in the United States by region.................................................................................... 24 8. Total cumulative production, proven reserves, and known recoverable natural gas for deep significant
reservoirs in all basins and areas in the United States................................................................................................... 25 9. Structurally trapped deep significant reservoirs in the Rocky Mountain region .......................................................... 25
10. Geographic distribution, reservoir classification, and API gravity for deep significant reservoirs in the Rocky Mountain region .. . ... ... .. . .. . . . . .. . . . . . . . . . . ... . ..... ... .. . .... . . . . . . . . . . . . . . .. ... . . . . . . . . . . . . .... . . . . . . ... . . . . . . . . .. ...... . . . ... . . . . . . ...... . . . . .... ... . . . . . . 25
11. Producing formation, number of reservoirs, geologic age, and lithology of deep significant reservoirs in the Rocky Mountain region....................................................................................................................................... 28
12. Deep significant reservoirs in the Rocky Mountain region by depth ........................................................................... 28 13. Total cumulative production, proven reserves, and known recoverable gas and oil for deep significant
reservoirs in the Rocky Mountain region .. .. .... .......... .... .. .. .... .. .. .. .. .. .. .. .. .. .. .. .. .... .. .. .. .... .. ............. ... .. .. .. .. .. ... .... .. .... ..... .. .. 28 14. Deep significant reservoirs in the Anadarko Basin by location and depth .. .. .. .. .. .. .. .. .. .. .. .. .. .. .. .. ... .. .... .. ..... .. .. .. .. .... .... . .. 29 15. Deep significant reservoirs in the Anadarko Basin by producing stratigraphic unit, geologic age, and lithology....... 29 16. Deep significant reservoirs in the Anadarko Basin by depth and trap type .................................................................. 30 17. Total cumulative production, proven reserves, and known recoverable gas and oil for deep significant
reservoirs in the Anadarko Basin................................................................................................................................... 30
CONTENTS
18. Deep significant reservoirs in the Permian Basin by depth and county......................................................................... 30 19. Deep significant reservoirs in the Permian Basin by stratigraphic unit, geologic age, and lithology .......................... 31 20. Deep significant reservoirs in the Permian Basin by location, reservoir lithology, and depth ..................................... 32 21. Deep significant reservoirs in the Permian Basin by trap type and depth ... . .. . .. . . . . . . . .. . . . . . . . . . . .. . . . .. . . . . . . . ...... ......... ... ... . . . .. . 32 22. Total cumulative production, proven reserves, and known recoverable gas and oil for deep significant
reservoirs in the Permian Basin..................................................................................................................................... 33 23. Deep significant reservoirs in the Gulf Coast Basin by State ....................................................................................... 33 24. Deep significant reservoirs in the Gulf Coast Basin by depth and State ....................................................................... 33 25. Deep significant reservoirs in the Gulf Coast Basin by primary reservoir lithology and depth, for each State............ 34 26. Deep significant reservoirs in the Gulf Coast Basin by producing stratigraphic unit, geologic age of
producing unit, and lithology of producing unit............................................................................................................ 34 27. Deep significant reservoirs in the Gulf Coast Basin by trap type and depth, for each State......................................... 35 28. Known recovery, proven reserves, and cumulative production for deep significant reservoirs and fields
in the Gulf Coast Basin by major lithology .. .. .. .......... ...... .. .. .. .... .. .... .. .... .. .... .. .... . .. .. .. .. . .. .. .. .. .. .... .. ...... .... .... .. .. .............. 36 29. Deep significant reservoirs in the West Coast-Alaska region by geologic age and producing formation
and trap type................................................................................................................................................................... 36 30. Known recovery, proven reserves, and cumulative production for deep significant reservoirs in the
West Coast-Alaska region by major lithology ............................................................................................................. 36 31. Field and reservoir, average depth, reservoir lithology, trap type, and field classification of deep significant
reservoirs in the Williston Basin.................................................................................................................................... 37 32. Known recovery, proven reserves, and cumulative production for significant deep reservoirs in the
Williston Basin by major lithology................................................................................................................................ 37

Geologic and Production Characteristics of Deep Natural Gas Resources Based on
Data From Significant Fields and Reservoirs
By T.S. Dyman, C.W. Spencer, J.K. Baird, R.C. Obuch, and D.T. Nielsen
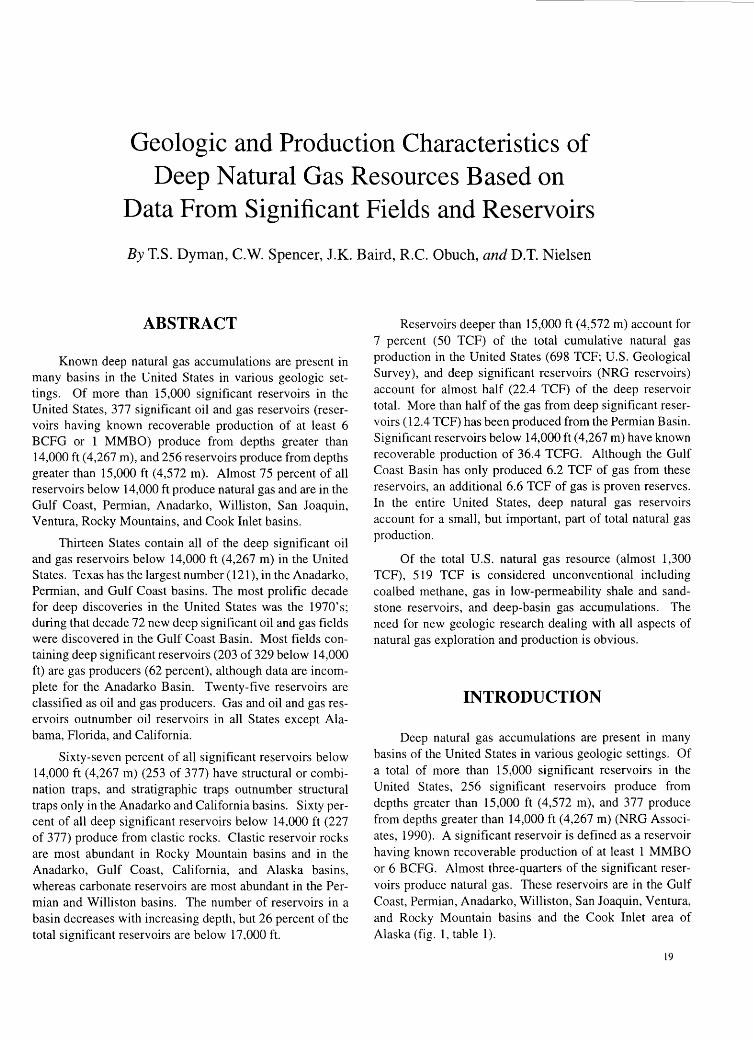
ABSTRACT
Known deep natural gas accumulations are present in many basins in the United States in various geologic settings. Of more than 15,000 significant reservoirs in the United States, 377 significant oil and gas reservoirs (reservoirs having known recoverable production of at least 6 BCFG or 1 MMBO) produce from depths greater than 14,000 ft ( 4,267 m), and 256 reservoirs produce from depths greater than 15,000 ft (4,572 m). Almost 75 percent of all reservoirs below 14,000 ft produce natural gas and are in the Gulf Coast, Permian, Anadarko, Williston, San Joaquin, Ventura, Rocky Mountains, and Cook Inlet basins.
Thirteen States contain all of the deep significant oil and gas reservoirs below 14,000 ft (4,267 m) in the United States. Texas has the largest number ( 121 ), in the Anadarko, Permian, and Gulf Coast basins. The most prolific decade for deep discoveries in the United States was the 1970's; during that decade 72 new deep significant oil and gas fields were discovered in the Gulf Coast Basin. Most fields containing deep significant reservoirs (203 of 329 below 14,000 ft) are gas producers (62 percent), although data are incomplete for the Anadarko Basin. Twenty-five reservoirs are classified as oil and gas producers. Gas and oil and gas reservoirs outnumber oil reservoirs in all States except Alabama, Florida, and California.
Sixty-seven percent of all significant reservoirs below 14,000 ft (4,267 m) (253 of 377) have structural or combination traps, and stratigraphic traps outnumber structural traps only in the Anadarko and California basins. Sixty percent of all deep significant reservoirs below 14,000 ft (227 of 377) produce from clastic rocks. Clastic reservoir rocks are most abundant in Rocky Mountain basins and in the Anadarko, Gulf Coast, California, and Alaska basins, whereas carbonate reservoirs are most abundant in the Permian and Williston basins. The number of reservoirs in a basin decreases with increasing depth, but 26 percent of the total significant reservoirs are below 17,000 ft.
Reservoirs deeper than 15,000 ft (4,572 m) account for 7 percent (50 TCF) of the total cumulative natural gas production in the United States (698 TCF; U.S. Geological Survey), and deep significant reservoirs (NRG reservoirs) account for almost half (22.4 TCF) of the deep reservoir total. More than half of the gas from deep significant reservoirs (12.4 TCF) has been produced from the Permian Basin. Significant reservoirs below 14,000 ft ( 4,267 m) have known recoverable production of 36.4 TCFG. Although the Gulf Coast Basin has only produced 6.2 TCF of gas from these reservoirs, an additional 6.6 TCF of gas is proven reserves. In the entire United States, deep natural gas reservoirs account for a small, but important, part of total natural gas production.
Of the total U.S. natural gas resource (almost 1,300 TCF), 519 TCF is considered unconventional including coalbed methane, gas in low-permeability shale and sandstone reservoirs, and deep-basin gas accumulations. The need for new geologic research dealing with all aspects of natural gas exploration and production is obvious.
INTRODUCTION
Deep natural gas accumulations are present in many basins of the United States in various geologic settings. Of a total of more than 15,000 significant reservoirs in the United States, 256 significant reservoirs produce from depths greater than 15,000 ft (4,572 m), and 377 produce from depths greater than 14,000 ft (4,267 m) (NRG Associates, 1990). A significant reservoir is defined as a reservoir having known recoverable production of at least 1 MMBO or 6 BCFG. Almost three-quarters of the significant reservoirs produce natural gas. These reservoirs are in the Gulf Coast, Permian, Anadarko, Williston, San Joaquin, Ventura, and Rocky Mountain basins and the Cook Inlet area of Alaska (fig. 1, table 1 ).
19
20 DEEP NATURAL GAS RESOURCES IN THE UNITED STATES
CENTRAL COASTAL BASINS
LOS ANGELES
u NORTOND
CENTRAL ALASKA BASINS
0 100 200 300 MILES j 1 r 1 11 1 I I j
0 250 500 KILOMETERS
Figure 1. Map of the United States showing basins containing sedimentary rocks more than 15,000 ft (4,572 m) deep. Shading indicates entire basin area, in which some of the sedimentary rocks are at shallow depths.
This report updates and summarizes the work of Dyman and others (1992), who compiled preliminary tables of deep reservoir data and identified geologic conditions or variables favorable for natural gas accumulations in deep sedimentary basins based on work by Takahashi and Cunningham (1987) and Wandrey and Vaughan (this volume) and on published information and supporting unpublished data from computerized data files including the NRG Associates data file and the Well History Control System (WHCS). We hope that the' descriptive compilation of reservoir characteristics can be used as a tool for future exploration targets in deep sedimentary basins. To our knowledge, no recent, detailed data compilations of deep significant natural gas reservoirs are available. Our data compilations are organized as data tables by region in the United States, and each regional presentation includes a
brief discussion of geologic characteristics related to natural gas accumulations.
The deep basins are described in terms of their geologic characteristics, and comparisons are made between basins. Computerized data are primarily from the NRG Associates Inc. Significant Field File (NRG Associates, 1990), which contains geologic, production, and engineering data for more than 15,000 significant oil and gas reservoirs in the United States.
For this study, a deep reservoir is defined as a reservoir below 15,000 ft (4,572 m); however, because a single producing horizon can extend both above and below 15,000 ft, NRG retrievals were selected for all reservoirs below 14,000 ft ( 4,267 m) in order to retrieve all potential reservoirs in the 15,000-foot range. Therefore, the data tables include data in the 14,000-15,000-foot depth range. Also, many fields contain separate reservoirs above and
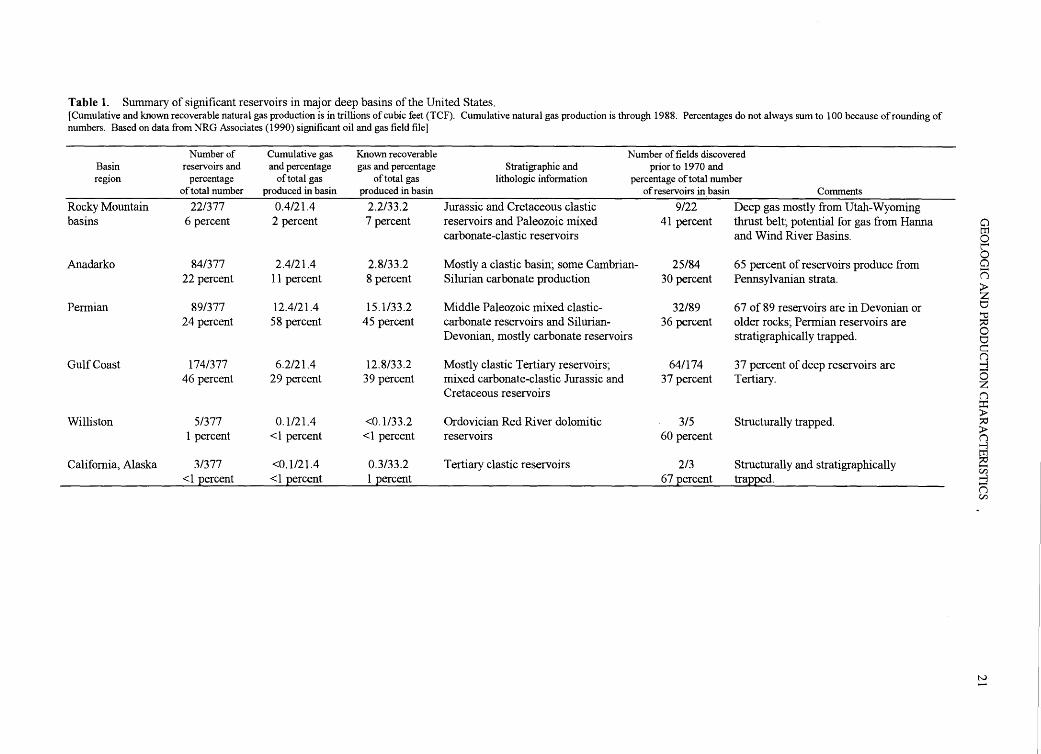
Table 1. Summary of significant reservoirs in major deep basins of the United States. [Cumulative and known recoverable natural gas production is in trillions of cubic feet (TCF). Cumulative natural gas production is through 1988. Percentages do not always sum to 100 because of rounding of numbers. Based on data from NRG Associates (1990) significant oil and gas field file]
Number of Cumulative gas Known recoverable Number of fields discovered Basin reservoirs and and percentage gas and percentage Stratigraphic and prior to 1970 and region percentage oftotal gas oftotal gas lithologic information percentage oftotal number
of total number produced in basin produced in basin of reservoirs in basin Comments
Rocky Mountain 22/377 0.4/21.4 2.2/33.2 Jurassic and Cretaceous clastic 9/22 Deep gas mostly from Utah-Wyoming basins 6 percent 2 percent 7 percent reservoirs and Paleozoic mixed 41 percent thrust belt~ potential for gas from Hanna
carbonate-clastic reservoirs and Wind River Basins.
Anadarko 84/377 2.4/21.4 2.8/33.2 Mostly a clastic basin~ some Cambrian- 25/84 65 percent of reservoirs produce from 22 percent 11 percent 8 percent Silurian carbonate production 30 percent Pennsylvanian strata.
Permian 89/377 12.4/21.4 15.1/33.2 Middle Paleozoic mixed clastic- 32/89 67 of 89 reservoirs are in Devonian or 24 percent 58 percent 45 percent carbonate reservoirs and Silurian- 36 percent older rocks~ Permian reservoirs are
Devonian, mostly carbonate reservoirs stratigraphically trapped.
Gulf Coast 174/377 6.2/21.4 12.8/33.2 Mostly clastic Tertiary reservoirs~ 64/174 37 percent of deep reservoirs are 46 percent 29 percent 39 percent mixed carbonate-clastic Jurassic and 37 percent Tertiary.
Cretaceous reservoirs
Williston 5/377 0.1/21.4 <0.1/33.2 Ordovician Red River dolomitic 3/5 Structurally trapped. 1 percent <1 percent <1 percent reservoirs 60 percent
California, Alaska 3/377 <0.1/21.4 0.3/33.2 Tertiary clastic reservoirs 2/3 Structurally and stratigraphically <1 percent <1 percent 1 percent 67 percent trapped.
Cl
~ r.-0 Cl n ;J;> z u ;g 0 u c (j >-3 0 z (j ::r: >~ >-
~ U:i ::j (j en
N
22 DEEP NATURAL GAS RESOURCES IN THE UNITED STATES
below 14,000 ft. Production figures tabulated by field in the following tables may include some reservoirs above 14,000 ft. Areas in which production is reported only by field rather than by reservoir, such as Oklahoma, are identified where appropriate.
Tables 2-32 were prepared using NRG data through 1988 (NRG Associates, 1990) and contain geologic and production data summaries for the entire United States or for each basin or region in the United States containing deep significant reservoirs. Table 1 is a summary of data presented in tables 2-32 for the Gulf Coast, Permian, Anadarko, Williston, California, and Rocky Mountain basins.
KNOWN DEEP NATURAL GAS RESOURCES
According to Dwights Energy Data ( 1985) 1,998 reservoirs below 15,000 ft ( 4,572 m) in the United States were producing hydrocarbons at the end of 1985. Of the total cumulative natural gas production in the United States (698 TCFG) (Mast and others, 1989), deep reservoirs account for 7 percent (50 TCFG) of the total, and deep significant reservoirs (NRG reservoirs) account for almost half (22.4 TCFG) (fig. 2, tables 1, 8) of the deep reservoir total (Dyman and others, 1992). If the Nation is taken as a whole, deep natural gas reservoirs account for only a small part of total natural gas production. The percentage of production from deep reservoirs is greater if only recent production is considered, but the total cumulative production is still low.
Table 2 lists total fields (329) containing deep significant reservoirs (377) for each region of the United States. Thirteen States contain all of the deep significant reservoirs (table 3). Texas has the most reservoirs of any State (121 reservoirs, including one in offshore Texas) and has reservoirs in the Anadarko, Permian, and Gulf Coast Basins. Alaska and Utah have the fewest fields and reservoirs.
The most prolific decade for discovery of deep significant fields in the United States was the 1970's; in the Gulf
Table 2. Deep significant fields and reservoirs in the United States. (Data from NRG Associates (1990) for all reservoirs below 14,000 ft ( 4,270 m) producing either natural gas or oil, or both. Gulf Coast Basin region includes 16 offshore fields and reservoirs]
Number Number Region of fields of reservoirs
Rocky Mountains 19 22 Permian Basin 68 89 Anadarko Basin 76 84 California, Alaska 3 3 Gulf Coast Basin 158 174 Williston Basin 5 5
Total 329 377
GULF COAST BASIN 6.2 TCFG (29%) 12.8 TCFG (39%)
CALIFORNIA- ALASKA BASINS
<0.1 TCFG (<1%) ROCKY MOUNTAIN 0.3 TCFG (1%) BASINS
0.4 TCFG (2%) 2.2 TCFG (7%)
PERMIAN BASIN 12.4 TCFG (58%) 15.1 TCFG (45%)
Figure 2. Pie chart illustrating distribution of total cumulative production of natural gas from deep significant reservoirs (those containing more than 6 BCFG and deeper than 14,000 ft, 4,267 m) in the United States by region. Total deep significant production is 21.4 TCFG, and ultimate recoverable production is 33.2 TCFG. Data from NRG Associates Inc. (1990).
Table 3. Deep significant fields and reservoirs in the United States by State. [Data from NRG Associates ( 1990) for all reservoirs below 14,000 ft (4,270 m) producing either natural gas or oil, or both]
Number of Number of State Region fields reservoirs
OklahQma Anadarko Basin 58 63 Texas Anadarko Basin 18 21 Texas Permian Basin 56 77 New Mexico Permian Basin 12 12 Wyoming Rocky Mountains 16 19 Utah Rocky Mountains 1 1 Colorado Rocky Mountains 2 2 California West Coast and Alaska 2 2 Alaska West Coast and Alaska 1 1 North Dakota Williston Basin 5 5 Texas-Louisiana Offshore 14 16 Louisiana Gulf Coast 49 50 Florida Gulf Coast 3 3 Mississippi Gulf Coast 53 64 Alabama Gulf Coast 19 19 Texas Gulf Coast 20 22
Total 329 377
GEOLOGIC AND PRODUCTION CHARACTERISTICS 23
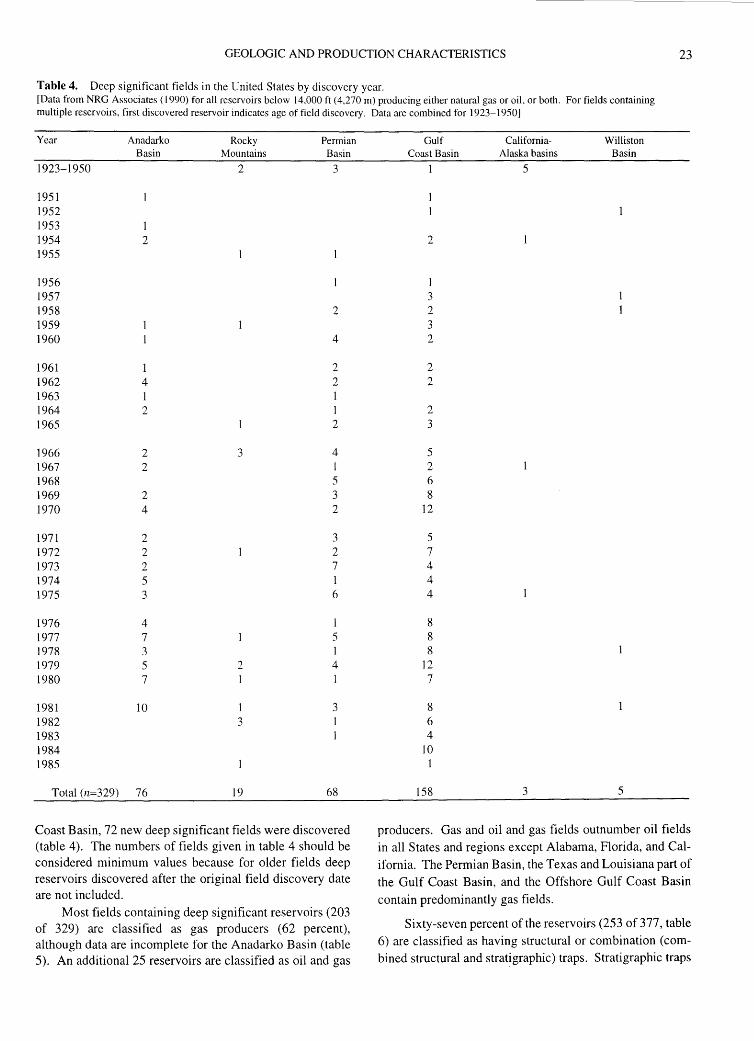
Table 4. Deep significant fields in the United States by discovery year. [Data from NRG Associates ( 1990) for all reservoirs below 14,000 ft ( 4,270 m) producing either natural gas or oil, or both. For fields containing multiple reservoirs, first discovered reservoir indicates age of field discovery. Data are combined for 1923-1950]
Year
1923-1950
1951 1952 1953 1954 1955
1956 1957 1958 1959 1960
1961 1962 1963 1964 1965
1966 1967 1968 1969 1970
1971 1972 1973 1974 1975
1976 1977 1978 1979 1980
1981 1982 1983 1984 1985
Anadarko Basin
1 2
4 1 2
2 2
2 4
2 2 2 5 3
4 7 3 5 7
10
Total (n=329) 76
Rocky Mountains
2
3
2
1 3
19
Permian Basin
3
2
4
2 2 1 I 2
4 1 5 3 2
3 2 7 1 6
5 1 4 1
3
68
Coast Basin, 72 new deep significant fields were discovered (table 4). The numbers of fields given in table 4 should be considered minimum values because for older fields deep reservoirs discovered after the original field discovery date are not included.
Most fields containing deep significant reservoirs (203 of 329) are classified as gas producers (62 percent), although data are incomplete for the Anadarko Basin (table 5). An additional 25 reservoirs are classified as oil and gas
Gulf Coast Basin
2
1 3 2 3 2
2 2
2 3
5 2 6 8
12
5 7 4 4 4
8 8 8
12 7
8 6 4
10 1
158
CaliforniaAlaska basins
5
3
Williston Basin
5
producers. Gas and oil and gas fields outnumber oil fields in all States and regions except Alabama, Florida, and California. The Permian Basin, the Texas and Louisiana part of the Gulf Coast Basin, and the Offshore Gulf Coast Basin contain predominantly gas fields.
Sixty-seven percent of the reservoirs (253 of 377, table 6) are classified as having structural or combination (combined structural and stratigraphic) traps. Stratigraphic traps

24 DEEP NATURAL GAS RESOURCES IN THE UNITED STATES
Table 5. Field completion classification for deep significant fields in the United States by region. [Data from NRG Associates (1990) for all reservoirs below 14,000 ft (4,270 m) producing either natural gas or oil, or both]
Region Oil Gas Oil and gas Unknown Total
Anadarko Basin 22 54 76 Rocky Mountains basins 6 10 3 19 New Mexico (Permian Basin) 11 12 Texas (Permian Basin) 56 56 California 2 2 Alaska 1 Williston Basin 2 3 5 Gulf Coast, Offshore 1 11 2 14 Gulf Coast, Louisiana 4 36 9 49 Gulf Coast, Texas 19 I 20 Gulf Coast, Mississippi 18 32 3 53 Gulf Coast, Florida 3 3 Gulf Coast, Alabama 11 5 3 19
Total 47 203 25 54 329
Table 6. Trapping mechanisms for deep significant reservoirs in the United States by State and (or) basin. [Data from NRG Associates ( 1990) for all reservoirs below 14,000 ft ( 4,270 m) producing either natural gas or oil, or both. Texas and Louisiana include offshore reservoirs]
Region
Anadarko Basin Rocky Mountains basins Permian Basin California Alaska Williston Basin Gulf Coast, Louisiana Gulf Coast, Texas Gulf Coast, Mississippi Gulf Coast, Florida Gulf Coast, Alabama
Total
Structural traps
11 8
40
1 2
41 8
49 2 9
171
Stratigraphic traps
14 9 5 2
7 2
30
Combination Unknown traps traps Total
16 43 84 5 22
30 14 89 2 1
2 1 5 4 18 63 4 6 25
11 2 64 1 3 5 5 19
82 95 377
Table 7. Field and reservoir name, location, average depth to production, discovery year, and cumulative production for deepest significant reservoir in the United States by region. [Data from NRG Associates (1990) for all reservoirs below 14,000 ft (4,270 m) producing either natural gas or oil, or both. Production totals are by field only; cumulative production of natural gas is in billions of cubic feet (BCF). Reservoir names are directly from NRG Associates Inc. (1988)]
Basin Field/reservoir
Anadarko Basin New Liberty SW/Hunton Rocky Mountain basins Bull Frog/Frontier Gulf Coast offshore Eugene Island/Pliocene Permian Basin Cheyenne/Ellenburger Gulf Coast Basin Harrisville/Smackover California basins Fillmore/Pi co Alaska basins Beaver Creek/Tyonek
outnumber structural traps only in the Anadarko Basin and in California; data for the Anadarko Basin are incomplete because of the large number of unknown completion categories. In California, there are only two deep significant reservoirs.
Average depth (feet) Discovery Cumulative production to production year of natural gas (BCF)
23,920 1979 Not reported 18,792 1979 3.7 18,895 1977 3.3 21,699 1960 51.6 (field) 23,007 1984 4.5 14,250 1954 Oil only 14,800 1967 63.0
According to NRG Associates ( 1990), the Harrisville Field in Smith County, Mississippi, contains the deepest significant reservoir in the United States (table 7). In the Harrisville field, the Smackover Formation produces gas from carbonate rocks at an average depth of 23,007 ft

GEOLOGIC AND PRODUCTION CHARACTERISTICS 25
Table 8. Total cumulative production, proven reserves, and known recoverable natural gas for deep significant reservoirs in all basins and areas in United States. [Data from NRG Associates ( 1990) for all reservoirs below 14,000 ft ( 4,270 m) producing natural gas. Data represent maximum values for Oklahoma because production totals only are available for fields, and for some fields no data are available. Data vary in significant figures; rounding taken from NRG data file]
Basin or area Anadarko Basin Rocky Mountain Permian Basin Gulf Coast Basin West Coast and Alaska Williston Basin
Total
Cumulative production (MMCF)
2,358,260 436,400
12,413,306 6,192,094
84,998 12,808
21,497,866
(7,013 m). The 618-foot (188 m)-thick pay zone in the Smackover has produced more than 4.5 BCFG (table 7) and has a known recoverable resource of 37.5 BCFG.
Sixty percent of the deep significant reservoirs (227 of 377 reservoirs, tables 11, 15, 19, 25, 29, 30, 31) produce from clastic rocks. Clastic reservoir rocks are most abundant in Rocky Mountain basins and in the Anadarko, Gulf Coast, California, and Alaska basins. Carbonate reservoir rocks are most abundant in the Permian and Williston basins.
As expected, the number of reservoirs decreases with increasing depth (tables 12, 16, 18, 24), but more than onequarter (26 percent) of the total significant deep reservoirs are below 17,000 ft (5, 180m).
The 377 deep significant reservoirs have a known recoverable resource of 33.6 TCFG. They have produced more than 22.4 TCFG, more than half of which (12.4 TCFG) is from the Permian Basin (fig. 2, table 8). Although the Gulf Coast Rasin has only produced 6.2 TCFG from deep significant reservoirs, an additional 6.6 TCFG is present as proven reserves. Only 2. 7 TCFG is listed as proven reserves in the Permian Basin (table 8).
ROCKY MOUNTAIN BASINS
The Rocky Mountain basins are grouped on the basis of geography and origin. These basins have produced 0.4 TCFG from Jurassic and Cretaceous clastic reservoirs and Paleozoic mixed clastic-carbonate reservoirs. They have a known recoverable resource of 2.2 TCFG (tables 1, 8, 13, fig. 3) (Dyman and others, 1992).
Of the 22 significant reservoirs in the Rocky Mountain region, 19 are in Wyoming. Seven are in the Wyoming-Utah-Idaho thrust belt, two each in the Wind River Basin, Moxa arch, and Sand Wash Basin, four in the Powder River Basin, and five in the Washakie Basin (tables 9, 10). Of these 22 reservoirs, only five are below 17,000 ft (5,182 m). Deep production in the Rocky
Proven reserves (MMCF)
416,490 1,782,900 2,713,874 6,628,587
179,912 25,334
11,747,097
Known reserves (MMCF)
2,774,750 2,219,300
15,127,180 12,820,681
264,910 38,142
33,244,963
Mountain regwn is dominantly natural gas, gas condensate, and high-gravity oil in the Wyoming-UtahIdaho thrust belt (tables 9, 10). Significant reservoirs in the thrust belt produce primarily from Cretaceous (Frontier Formation) and Jurassic (Nugget Sandstone) clastic sequences and from Permian-Pennsylvanian mixed
Table 9. Structurally trapped deep significant reservoirs in the Rocky Mountain region. [Data from NRG Associates (1990) for all reservoirs below 14,000 ft (4,270 m) producing either natural gas or oil, or both. Nine reservoirs that have combination traps are not listed. No stratigraphically trapped reservoirs are listed in the NRG data file]
Reservoir name
Reno Reno East
Classification Basin or area Johnson County, Wyoming
Oil Powder River Basin. Oil Powder River Basin.
Natrona County, Wyoming
Poison Spider West Oil Wind River Basin. Uinta County, Wyoming
Butcher Knife Springs Gas Thrust belt. Whitney Canyon Gas Thrust belt. Anschutz Ranch East Gas and oil Thrust belt. Session Mountain Chicken Creek
Gas Gas and oil
Thrust belt. Thrust belt.
Table 10. Geographic distribution, reservoir classification, and API gravity for deep significant reservoirs in the Rocky Mountain region. [Data from NRG Associates (1990) for all reservoirs below 14,000 ft ( 4,270 m) producing either natural gas or oil, or both. Leaders ( --) indicate no data are available]
Basin or area Number Completion Average of reservoirs classification API gravity
Powder River Basin 4 Oil 35 Moxa arch 2 Oil and gas 40 Wind River Basin 2 Oil and gas 46 Sand Wash Basin 2 Gas Wyoming-Utah-Idaho
thrust belt 7 Oil and gas 51 Washakie Basin 5 Gas

26 DEEP NATURAL GAS RESOURCES IN THE UNITED STATES
GREATER GREEN RIVER
I
II NEW ~~XICO j
__ J
_.J
Figure 3. Map of Rocky Mountain region showing basins (outlined areas) in which deep (greater than 15,000 ft, 4,572 m) natural gas is presumed to be present on the basis of gas shows, formation tests, geology, and known production (shaded areas). Deep gas is being produced in the Wind River Basin and from a few structural traps in the Greater Green River Basin and the thrust belt in southwestern Wyoming and northern Utah.
100 200 300 400 MILES
200 400 600 KILOMETERS
clastic-carbonate sequences (Weber Sandstone and Minnelusa Formation) in primarily structural traps (table 11). Source rocks for deep reservoirs are primarily organic-rich Cretaceous shale in fault contact with older reservoir rocks.
Variations in thermal history and in the Late Cretaceous through Tertiary deformational sequence of Rocky Mountain basins control the distribution of and tendency toward natural gas or oil (Perry and Flores, this volume). Significant deep oil production occurs in conventional reservoirs in Rocky Mountain basins (tables 9, 10). Reservoir rocks are primarily Cretaceous sandstones and PermianPennsylvanian sandstones and carbonate rocks. Reservoirs are in deep areas of abnormally low subsurface temperatures and low thermal maturation, probably caused by cool meteoric water penetrating deep into the basin along bounding faults (Law and Clayton, 1988). The deep western part of the Powder River Basin (table 9) has below normal temperatures, possibly as a result of meteoric waters recharged from outcrops along the western margin of the basin.
Deep significant Mississippian production in the Rocky Mountain region is from limestone and dolomite of
the Madison Group (or Limestone) (table 11). These reservoirs have a high productive capacity (> 20 MMCFG per day per well) and commonly contain significant amounts of nonhydrocarbon gases such as hydrogen sulfide and carbon dioxide. Reservoirs are primarily in large structures.
Methane content ranges from 22.0 to 94.7 percent. The lowest value (22.0 percent) is at the LaBarge deep Madison Limestone reservoir in Lincoln County, Wyoming (NRG Associates, 1990). All Rocky Mountain reservoirs have helium values of less than 0.5 percent. Generally, the highest hydrogen sulfide values are in fields having high carbon dioxide content. The highest carbon dioxide values are in limestone reservoirs.
Only limited porosity-depth data are available from the NRG data file for the Rocky Mountain region (fig. 4). Of the few deep significant reservoirs represented, clastic reservoirs generally exhibit the highest porosities.
Most deep significant reservoirs in the Rocky Mountain region are associated with structural or combination structural (table 9) and stratigraphic trapping mechanisms. Structural traps in Rocky Mountain basins are directly related to the tectonic evolution of the Rocky Mountain

GEOLOGIC AND PRODUCTION CHARACTERISTICS 27
1-L.U L.U u.. u.. 0
14
15
16
17
~ 18 z <( (j)
:::> 0 I 1-z 19
:I 1-a.. L.U 0
20
21
22
23 0
,, ~ 0 ~0 .J;.t O eoo
0 Q •o ~ •• •
0 .. " .. L.. o•~ 0 lol lfOJ • • •
0 I 0 ~ • ' 0 • •• • 0 .~ 0 0
(\ D '-' •a o
•
• • 0 0 0 •
• oo
0 ~0 • •
9) D
0
•
0
D
5 10 15 POROSITY, IN PERCENT
EXPLANATION
•
•
•
•
20
•
' •
•
• •
30
Figure 4. Porosity versus depth for deep significant reservoirs of the United States. Pacific region includes California and Alaska. Data points represent actual porosity values. Data from NRG Associates ( 1990) .
REGION CARBONATE CLASTIC ROCKS ROCKS
Pacific
Gulf Coast 0
Midcontinent
Anadarko Basin D
Williston Basin X Rocky Mountains 0 Permian Basin 0
foreland province. According to Perry and Flores (this volume), initial progression of uplift and basin development from southwest Montana southeastward during the mid-Cretaceous established timing limits on petroleum migration
• • • +
' and trapping trends. Economic implications of this new model of deformation of the Rocky Mountain foreland include progressive opening and subsequent blockage of migration paths for hydrocarbons generated from Paleozoic
28 DEEP NATURAL GAS RESOURCES IN THE UNITED STATES
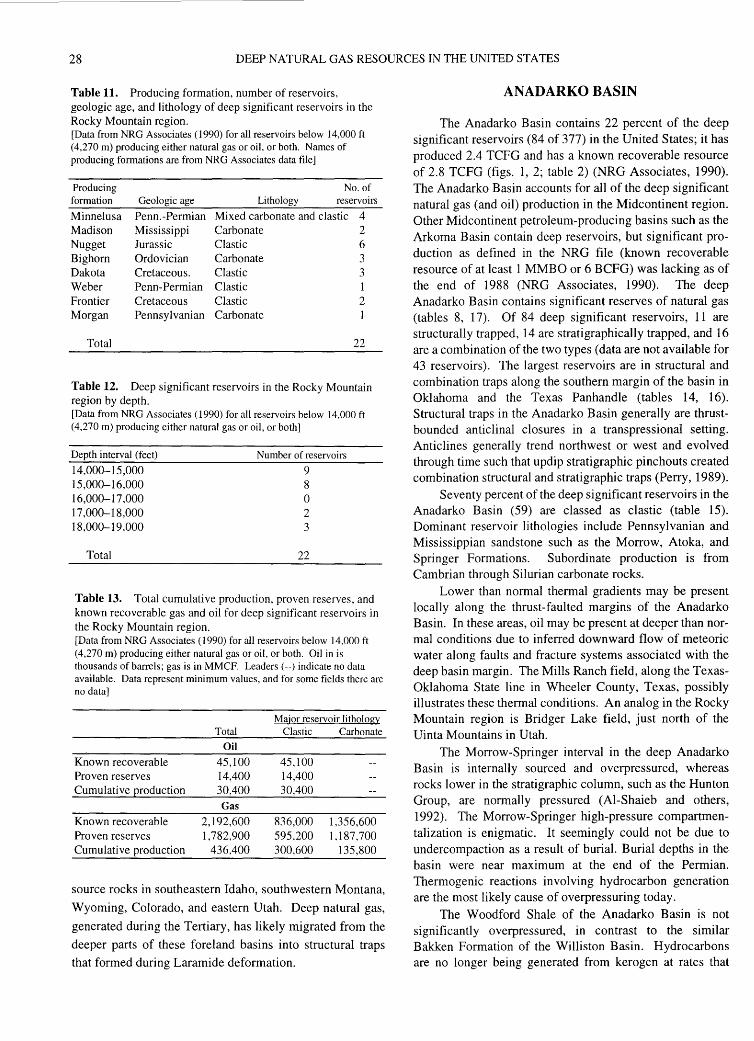
Table 11. Producing formation, number of reservoirs, geologic age, and lithology of deep significant reservoirs in the Rocky Mountain region. [Data from NRG Associates ( 1990) for all reservoirs below 14,000 ft (4,270 m) producing either natural gas or oil, or both. Names of producing formations are from NRG Associates data file]
Producing No. of formation Geologic age Lithology reservoirs
Minnelusa Penn.-Permian Mixed carbonate and clastic 4 Madison Mississippi Carbonate 2 Nugget Jurassic Clastic 6 Bighorn Ordovician Carbonate 3 Dakota Cretaceous. Clastic 3 Weber Penn-Permian Clastic 1 Frontier Cretaceous Clastic 2 Morgan Pennsylvanian Carbonate 1
Total 22
Table 12. Deep significant reservoirs in the Rocky Mountain region by depth. [Data from NRG Associates ( 1990) for all reservoirs below 14,000 ft (4,270 m) producing either natural gas or oil, or both]
Depth interval (feet)
14,000-15,000 15,000-16,000 16,000-17,000 17,000-18,000 18,000-19,000
Total
Number of reservoirs
9 8 0 2 3
22
Table 13. Total cumulative production, proven reserves, and known recoverable gas and oil for deep significant reservoirs in the Rocky Mountain region. [Data from NRG Associates ( 1990) for all reservoirs below 14,000 ft (4,270 m) producing either natural gas or oil, or both. Oil in is thousands of barrels; gas is in MMCF. Leaders ( --) indicate no data available. Data represent minimum values, and for some fields there are no data]
Major reservoir lithology Total Clastic Carbonate
Oil
Known recoverable 45,100 45,100 Proven reserves 14,400 14,400 Cumulative Qroduction 30,400 30,400
Gas
Known recoverable 2,192,600 836,000 1,356,600 Proven reserves 1,782,900 595,200 1,187,700 Cumulative production 436,400 300,600 135,800
source rocks in southeastern Idaho, southwestern Montana,
Wyoming, Colorado, and eastern Utah. Deep natural gas,
generated during the Tertiary, has likely migrated from the
deeper parts of these foreland basins into structural traps
that formed during Laramide deformation.
ANADARKO BASIN
The Anadarko Basin contains 22 percent of the deep significant reservoirs (84 of 377) in the United States; it has produced 2.4 TCFG and has a known recoverable resource of 2.8 TCFG (figs. 1, 2; table 2) (NRG Associates, 1990). The Anadarko Basin accounts for all of the deep significant natural gas (and oil) production in the Midcontinent region. Other Midcontinent petroleum-producing basins such as the Arkoma Basin contain deep reservoirs, but significant production as defined in the NRG file (known recoverable resource of at least 1 MMBO or 6 BCFG) was lacking as of the end of 1988 (NRG Associates, 1990). The deep Anadarko Basin contains significant reserves of natural gas (tables 8, 17). Of 84 deep significant reservoirs, 11 are structurally trapped, 14 are stratigraphically trapped, and 16 are a combination of the two types (data are not available for 43 reservoirs). The largest reservoirs are in structural and combination traps along the southern margin of the basin in Oklahoma and the Texas Panhandle (tables 14, 16). Structural traps in the Anadarko Basin generally are thrustbounded anticlinal closures in a transpressional setting. Anticlines generally trend northwest or west and evolved through time such that updip stratigraphic pinchouts created combination structural and stratigraphic traps (Perry, 1989).
Seventy percent of the deep significant reservoirs in the Anadarko Basin (59) are classed as clastic (table 15). Dominant reservoir lithologies include Pennsylvanian and Mississippian sandstone such as the Morrow, Atoka, and Springer Formations. Subordinate production is from Cambrian through Silurian carbonate rocks.
Lower than normal thermal gradients may be present locally along the thrust-faulted margins of the Anadarko Basin. In these areas, oil may be present at deeper than normal conditions due to inferred downward flow of meteoric water along faults and fracture systems associated with the deep basin margin. The Mills Ranch field, along the TexasOklahoma State line in Wheeler County, Texas, possibly illustrates these thermal conditions. An analog in the Rocky Mountain region is Bridger Lake field, just north of the Uinta Mountains in Utah.
The Morrow-Springer interval in the deep Anadarko Basin is internally sourced and overpressured, whereas rocks lower in the stratigraphic column, such as the Hunton Group, are normally pressured (Al-Shaieb and others, 1992). The Morrow-Springer high-pressure compartmentalization is enigmatic. It seemingly could not be due to undercompaction as a result of burial. Burial depths in the basin were near maximum at the end of the Permian. Thermogenic reactions involving hydrocarbon generation are the most likely cause of overpressuring today.
The Woodford Shale of the Anadarko Basin is not significantly overpressured, in contrast to the similar Bakken Formation of the Williston Basin. Hydrocarbons are no longer being generated from kerogen at rates that
GEOLOGIC AND PRODUCTION CHARACTERISTICS 29
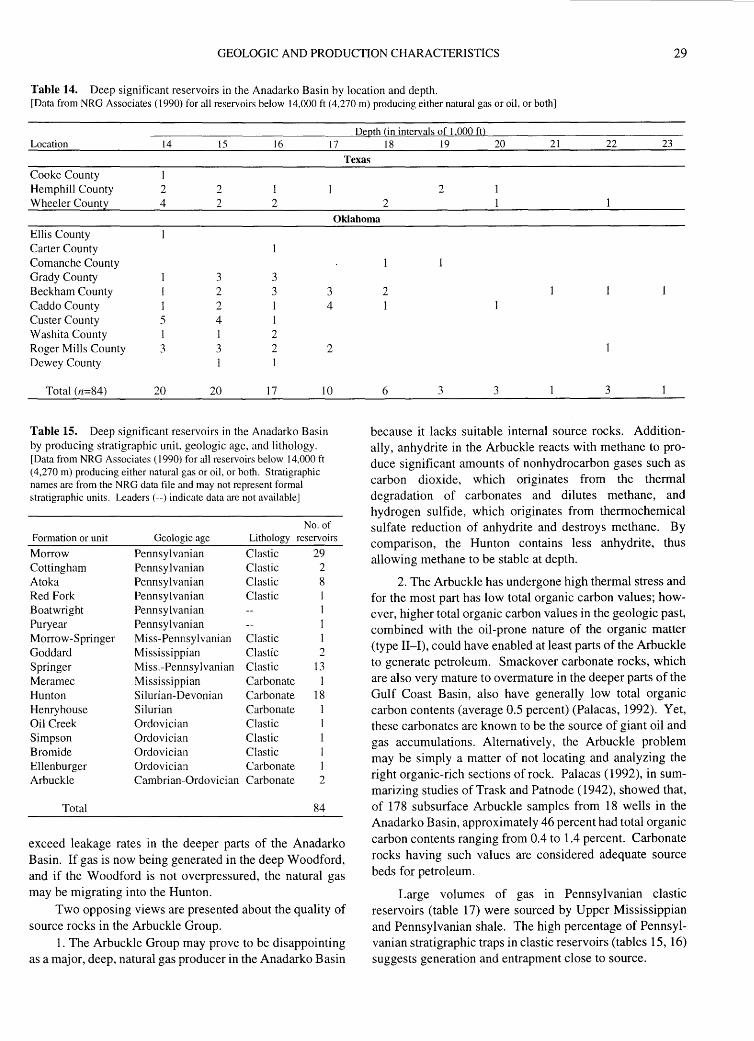
Table 14. Deep significant reservoirs in the Anadarko Basin by location and depth. [Data from NRG Associates (1990) for all reservoirs below 14,000 ft (4,270 m) producing either natural gas or oil, or both]
Depth (in intervals of I 000 ft) Location 14 15 16 17 18 19 20 21 22 23
Texas
Cooke County Hemphill County Wheeler County
I 2 4
2 2
1 2 2 2
Oklahoma
Ellis County Carter County Comanche County Grady County Beckham County Caddo County Custer County Washita County Roger Mills County Dewey County
Total (n=84)
5 1 3
20
3 2 2 4 I 3
20
3 3 3
4
2 2 2
17 10
Table 15. Deep significant reservoirs in the Anadarko Basin by producing stratigraphic unit, geologic age, and lithology. [Data from NRG Associates (1990) for all reservoirs below 14,000 ft (4,270 m) producing either natural gas or oil, or both. Stratigraphic names are from the NRG data file and may not represent formal stratigraphic units. Leaders (--)indicate data are not available]
No. of Formation or unit Geologic age Lithology reservoirs
Morrow Pennsylvanian Clastic 29 Cottingham Pennsylvanian Clastic 2 Atoka Pennsylvanian Clastic 8 Red Fork Pennsy I van ian Clastic I Boatwright Pennsylvanian 1 Puryear Pennsylvanian 1 Morrow-Springer Miss-Pennsylvanian Clastic Goddard Mississippian Clastic 2 Springer Miss.-Pennsylvanian Clastic 13 Meramec Mississippian Carbonate 1 Hunton Silurian-Devonian Carbonate 18 Henryhouse Silurian Carbonate Oil Creek Ordovician Clastic Simpson Ordovician Clastic Bromide Ordovician Clastic Ellenburger Ordovician Carbonate Arbuckle Cambrian-Ordovician Carbonate 2
Total 84
exceed leakage rates in the deeper parts of the Anadarko Basin. If gas is now being generated in the deep Woodford, and if the Woodford is not overpressured, the natural gas may be migrating into the Hunton.
Two opposing views are presented about the quality of source rocks in the Arbuckle Group.
1. The Arbuckle Group may prove to be disappointing as a major, deep, natural gas producer in the Anadarko Basin
2 1
6 3 3 3
because it lacks suitable internal source rocks. Additionally, anhydrite in the Arbuckle reacts with methane to produce significant amounts of nonhydrocarbon gases such as carbon dioxide, which originates from the thermal degradation of carbonates and dilutes methane, and hydrogen sulfide, which originates from thermochemical sulfate reduction of anhydrite and destroys methane. By comparison, the Hunton contains less anhydrite, thus allowing methane to be stable at depth.
2. The Arbuckle has undergone high thermal stress and for the most part has low total organic carbon values; however, higher total organic carbon values in the geologic past, combined with the oil-prone nature of the organic matter (type II-I), could have enabled at least parts of the Arbuckle to generate petroleum. Smackover carbonate rocks, which are also very mature to overmature in the deeper parts of the Gulf Coast Basin, also have generally low total organic carbon contents (average 0.5 percent) (Palacas, 1992). Yet, these carbonates are known to be the source of giant oil and gas accumulations. Alternatively, the Arbuckle problem may be simply a matter of not locating and analyzing the right organic-rich sections of rock. Palacas (1992), in summarizing studies of Trask and Patnode (1942), showed that, of 178 subsurface Arbuckle samples from 18 wells in the Anadarko Basin, approximately 46 percent had total organic carbon contents ranging from 0.4 to 1.4 percent. Carbonate rocks having such values are considered adequate source beds for petroleum.
Large volumes of gas in Pennsylvanian clastic reservoirs (table 17) were sourced by Upper Mississippian and Pennsylvanian shale. The high percentage of Pennsylvanian stratigraphic traps in clastic reservoirs (tables 15, 16) suggests generation and entrapment close to source.
30 DEEP NATURAL GAS RESOURCES IN THE UNITED STATES
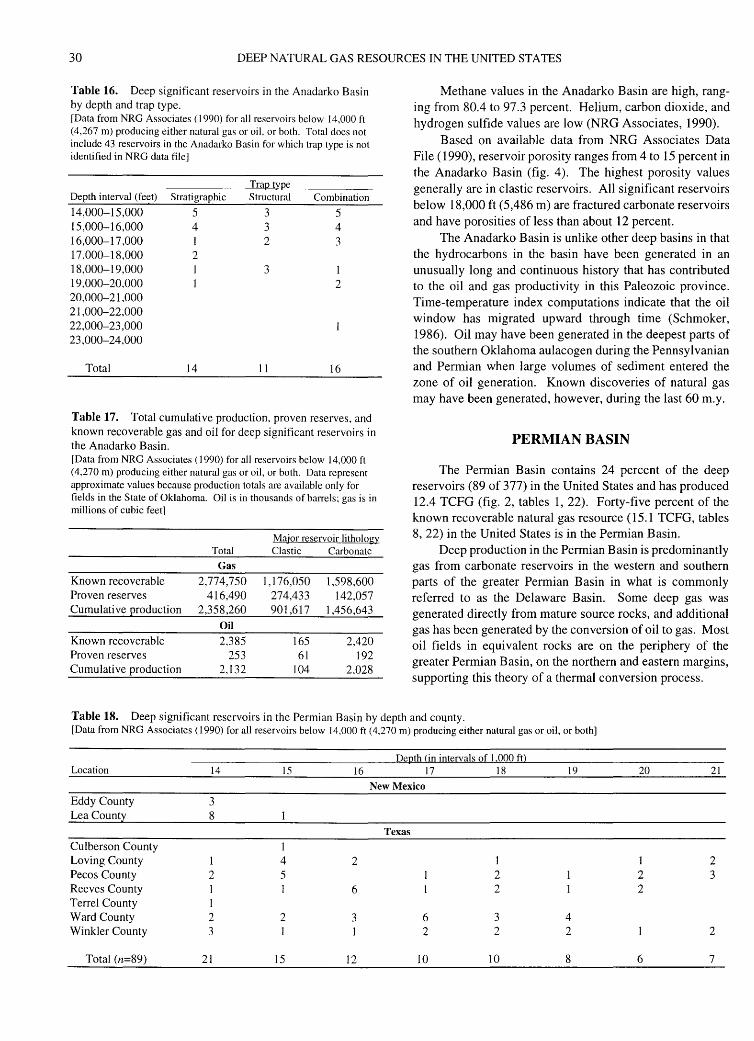
Table 16. Deep significant reservoirs in the Anadarko Basin by depth and trap type. [Data from NRG Associates ( 1990) for all reservoirs below 14,000 ft ( 4,267 m) producing either natural gas or oil, or both. Total does not include 43 reservoirs in the Anadarko Basin for which trap type is not identified in NRG data file]
Depth interval (feet) 14,000-15,000 15,000-16,000 16,000-17,000 17,000-18,000 18,000-19,000 19,000-20,000 20,000-21,000 21,000-22,000 22,000-23,000 23,000-24,000
Total
Stratigraphic 5 4 1 2 1 1
14
Trap type Structural
3 3 2
3
1I
Combination 5 4 3
2
16
Table 17. Total cumulative production, proven reserves, and known recoverable gas and oil for deep significant reservoirs in the Anadarko Basin. [Data from NRG Associates ( 1990) for all reservoirs below 14,000 ft ( 4,270 m) producing either natural gas or oil, or both. Data represent approximate values because production totals are available only for fields in the State of Oklahoma. Oil is in thousands of barrels; gas is in millions of cubic feet]
Major reservoir lithologx Total Clastic Carbonate
Gas
Known recoverable 2,774,750 1,I76,050 1,598,600 Proven reserves 416,490 274,433 142,057 Cumulative Qroduction 2,358,260 901,617 1,456,643
Oil
Known recoverable 2,385 165 2,420 Proven reserves 253 61 192 Cumulative production 2,132 104 2,028
Methane values in the Anadarko Basin are high, ranging from 80.4 to 97.3 percent. Helium, carbon dioxide, and hydrogen sulfide values are low (NRG Associates, 1990).
Based on available data from NRG Associates Data File ( 1990), reservoir porosity ranges from 4 to 15 percent in the Anadarko Basin (fig. 4). The highest porosity values generally are in clastic reservoirs. All significant reservoirs below 18,000 ft (5,486 m) are fractured carbonate reservoirs and have porosities of less than about 12 percent.
The Anadarko Basin is unlike other deep basins in that the hydrocarbons in the basin have been generated in an unusually long and continuous history that has contributed to the oil and gas productivity in this Paleozoic province. Time-temperature index computations indicate that the oil window has migrated upward through time (Schmoker, 1986). Oil may have been generated in the deepest parts of the southern Oklahoma aulacogen during the Pennsylvanian and Permian when large volumes of sediment entered the zone of oil generation. Known discoveries of natural gas may have been generated, however, during the last 60 m.y.
PERMIAN BASIN
The Permian Basin contains 24 percent of the deep reservoirs (89 of 377) in the United States and has produced 12.4 TCFG (fig. 2, tables 1, 22). Forty-five percent of the known recoverable natural gas resource (15.1 TCFG, tables 8, 22) in the United States is in the Permian Basin.
Deep production in the Permian Basin is predominantly gas from carbonate reservoirs in the western and southern parts of the greater Permian Basin in what is commonly referred to as the Delaware Basin. Some deep gas was generated directly from mature source rocks, and additional gas has been generated by the conversion of oil to gas. Most oil fields in equivalent rocks are on the periphery of the greater Permian Basin, on the northern and eastern margins, supporting this theory of a thermal conversion process.
Table 18. Deep significant reservoirs in the Permian Basin by depth and county. [Data from NRG Associates (1990) for all reservoirs below 14,000 ft (4.270 m) producing either natural gas or oil, or both]
Depth (in intervals of 1 000 ft) Location 14 15 16 17 18 19 20 21
New Mexico
Eddy County 3 Lea Count 8
Texas
Culberson County 1 Loving County 1 4 2 1 1 2 Pecos County 2 5 2 2 3 Reeves County I I 6 2 2 Terrel County 1 Ward County 2 2 3 6 3 4 Winkler County 3 1 1 2 2 2 2
Total (n=89) 2I I5 12 IO 10 8 6 7
GEOLOGIC AND PRODUCTION CHARACTERISTICS 31
Table 19. Deep significant reservoirs in the Permian Basin by stratigraphic unit, geologic age, and lithology. [Data from NRG Associates ( 1990) for all reservoirs below 14,000 ft ( 4,270 m) producing either natural gas or oil, or both. Leaders ( --) indicate no data are available. Information in column labeled stratigraphic unit is from NRG Associates data file; in some cases, formation name is not available, and only epoch is given]
Stratigraphic unit or geologic age Geologic age
Wolfcampian Permian Pennsy 1 vanian
Strawn Pennsy I van ian Atoka Pennsylvanian Morrow Pennsy I vani an
Mississippian Lower Devonian Devonian
Silurian-Devonian Silurian
Fusselman Silurian Ellenburger Ordovician
Total
The volume of available reservoir rocks decreases with depth in the greater Permian Basin because the basin area decreases with depth. As a result, the chances of finding new, good-quality, deep gas reservoirs decreases with depth; however, increased pressure as a result of increased depth results in an increase in the amount of gas stored within a given volume of reservoir rock.
Lithologically, relatively shallow reservoirs in the Delaware Basin (14,000-17,000 ft, 4,267-5,181 m) are mixed-carbonate and clastic reservoirs (mostly carbonate) including some Pennsylvanian and Permian rocks (tables 18-20). The reservoirs are in Lea and Eddie Counties, New Mexico, and Loving County, Texas, on the margin of the deep basin. The deepest reservoirs are carbonate rocks of early Paleozoic age in the central part of the Delaware Basin (tables 19, 20). Thirty-three deep reservoirs are in the Ordovician Ellenburger Group alone. Seventy-five percent of Permian Basin reservoirs are in Devonian or older rocks.
The deep Ellenburger of the Permian Basin is similar to the Arbuckle of the Anadarko Basin in that it may not be internally sourced (Palacas, 1992). Hydrocarbons of the Ellenburger are predominantly derived from younger rocks, including the Woodford Shale, where these rocks have been downfaulted during compression or extension. Gas was probably placed in Ellenburger reservoirs after structures were established during Pennsylvanian and Permian time. These late Paleozoic collisional structures formed prior to peak gas generation.
All of the stratigraphically trapped deep reservoirs (6) are at shallower depths (14,000-17,000 ft, 4,267-5,181 m, table 21) in the youngest reservoir strata of Permian age. The post-Wolfcampian Permian Basin is a sedimentary rather than a structural basin, and traps are facies controlled in these younger rocks.
The total gas column in Ellenburger reservoirs is very thick, more than 3,500 ft ( 1,066 m) in the Gomez field (Pecos County, southwestern Texas). Vertical, interconnected
Lithology No. of reservoirs
2 1
Carbonate 3 Clastic and carbonate 5 Clastic 10 Carbonate 1 Chert 5 Carbonate 3 Carbonate 4 Carbonate 22 Carbonate 33
89
fractures are present in some areas. These fracture systems are associated with huge transpressional structures along the eastern margin of the Delaware Basin (Perry, this volume).
Reservoir porosity systematically decreases with depth in the Permian Basin (fig. 4). Generally, significant reservoirs below 16,000 ft ( 4,876 m) are carbonate reservoirs. Matrix porosity is more than 5 percent at depths greater than 19,000 ft (5,791 m) (fig. 4) in the deep Permian Basin. At shallower depths (less than 16,000 ft), clastic reservoirs have higher porosities than carbonate reservoirs.
Fractures are common and result in greatly enhanced permeability and increased deliverability. Porosities can be poor at any depth, but the best porosities decrease with depth at a predictable rate. Limestone reservoirs tend to produce economic volumes of hydrocarbons at lower porosities than do dolomite reservoirs. The highest porosities at these depths are in dolomite reservoirs, although NRG data are limited.
Methane content of natural gas ranges from 47.0 to 97.7 percent in the deep Permian Basin but averages approximately 90 percent. The three lowest methane values are in Ellenburger (carbonate) reservoirs (Brown Bassett field, Terrell County; Mi Vida field, Reeves County; and Moore, Hooper, and Vermejo fields, Loving County) in the southwestern Texas part of the deep basin. Each of these reservoirs has high carbon dioxide values (34.8-53.8 percent). Helium and hydrogen sulfide values are very low in the deep Permian Basin (NRG Associates, 1990).
Source-rock type plays a minor role with respect to the presence of oil and (or) gas in deep reservoirs because thermal cracking converts oil to gas and condensate at depth. Pressure gradients are normal in deep reservoirs in large fields in the Permian Basin. No evidence exists for overpressurized compartments in the significant fields of the NRG data file (Spencer and Wandrey, this volume).

32
0 0
0 C'lu
0\ --u
00 --u
10 --u
.0
..Q (.)
§ ·~ (.)
j
DEEP NATURAL GAS RESOURCES IN THE UNITED STATES
00
0 .......
0 .......
(',I .......
I I I I
.............. (<) ....... (".~ .......
....... (',I
Table 21. Deep significant reservoirs in the Permian Basin by trap type and depth. [Data from NRG Associates (1990) for all reservoirs below 14,000 ft (4,270 m) producing either natural gas or oil, or both. For reservoirs listed in column labeled "Blank," no trap type was identified in NRG file]
Depth interval (feet) Stratigraphic
14,000-15,000 4 15,000-16,000 1 16,000-17,000 1 17,000-18,000 0 18,000-19,000 0 19,000-20,000 0 20,000-21,000 0 21,000-22,000 0
Total (n=89) 6
Trap type Structural Combination
6 6 7 5 6 2 4 3
39
8 4 3 5 2 4 1 3
30
GULF COAST BASIN
Blank
3 4 1
2 2 1
14
Of the 377 reservoirs below 14,000 ft (4,267 m), 174 (or 46 percent) are in the Gulf Coast Basin (fig. 1). Significant reservoirs in the Gulf Coast Basin have produced 6.2 TCFG (fig. 2, tables 8, 28). Reservoirs are primarily in Tertiary clastic rocks and deeper mixed carbonate-clastic rocks of Mesozoic age. Forty percent of the known recoverable natural gas resource (13.3 TCFG, tables 1, 8, 28) in deep significant reservoirs is in the Gulf Coast Basin.
The two oldest fields containing deep reservoirs are the Lake de Cade field in Terrebonne Parish, near Houma, in southeastern Louisiana and the Thorn well South field in Jefferson Davis Parish in southwestern Louisiana (NRG Associates, 1990). Both fields were discovered in 1942, although some deep reservoirs were discovered later. The deep reservoirs produce from immediately below 14,000 ft ( 4,267 m) in Tertiary sandstone. Generally, the oldest fields are in Louisiana and Mississippi. Fields in Texas were discovered from the 1940's through the 1980's. Fields in Alabama were discovered in the 1960's, and fields in Florida were discovered in the early 1970's. More fields containing deep reservoirs were discovered during the 1970's (72) than during any other decade. The number of deep field discoveries approximately doubled with each succeeding decade (1940's, 5 discoveries; 1950's, 13; 1960's, 32; 1970's, 72; 1980's, data incomplete) (table 4) .
Sixty-five percent of the deep significant reservoirs (116) are classified as gas producing (tables 23, 24), and more than 40 percent ( 49) of these gas producers are in Louisiana. Of all of the Gulf Coast States, Louisiana, Texas, and Mississippi have more natural gas reservoirs than oil reservoirs (tables 23, 24). Of the 16 deep significant offshore reservoirs, 15 are gas producers (table 23). Of the 110 deep significant Mesozoic reservoirs onshore, 64 are natural gas producers and an additional 9 are classified as oil and gas producing.

GEOLOGIC AND PRODUCTION CHARACTERISTICS 33
Table 22. Total cumulative production, proven reserves, and known recoverable gas and oil for deep significant reservoirs in the Permian Basin. [Data from NRG Associates (1990) for all reservoirs below 14,000 ft ( 4,270 m) producing either natural gas or oil, or both. Data represent minimum values. Oil is in thousands of barrels; gas is in millions of cubic feet. Leaders(--) indicate no production in category]
Total Clastic
Oil
Known recoverable 8,075 Proven reserves 939 Cumulative production 7,136
Gas
Known recoverable 15,127,180 566,030 Proven reserves 2,713,874 157,053 Cumulative production 12,413,306 408,977
Table 23. Deep significant reservoirs in the Gulf Coast Basin by State. [Data from NRG Associates (1988) for all reservoirs below 14,000 ft ( 4,267 m) producing either natural gas or oil, or both. Data for Texas and Louisiana include 16 offshore reservoirs. Leaders ( --) indicate no reservoirs in category]
State Oil Gas Oil and gas
Louisiana 5 49 11 Texas 22 1 Mississippi 21 40 3 Alabama 11 5 3 Florida 3
Total (n=174) 40 116 18
For all States combined, the number of significant deep reservoirs decreases with increasing depth (table 25). The deepest reservoirs are in Alabama and Mississippi (Mancini and Mink, 1985; NRG Associates, 1990; Curtis, 1991). The Jurassic Smackover gas reservoir in the Harrisville field in Simpson County, south of Jackson in southern Mississippi, is the deepest significant reservoir in the Gulf Coast Basin. The reservoir has an average producing depth of 23,007 ft (7,012 m) and an average reservoir thickness of 618ft (188
Major reservoir lithology Carbonate
8,075 939
7,136
13,766,982 2,481,937
11,285,045
Chert
709,530 49,970
659,560
Blank
84,638 24,914 59,724
m). Only two other reservoirs listed in the NRG data file for the Gulf Coast Basin have greater average thicknesses. The shallower nature of Florida and Texas deep reservoirs is due to the shallow depth of equivalent Mesozoic reservoir rocks. Of the 16 significant reservoirs in offshore Texas and Louisiana, the deepest is 18,895 ft (5,759 m). Most offshore reservoirs produce from depths of less than 16,000 ft ( 4,877 m).
For all depths together, 79 percent of the reservoirs in the Gulf Coast Basin are clastic (table 26). By depth interval, (1) only 16 percent of the total reservoirs are carbonate reservoirs in the 14,000-15,000-foot (4,267-4,572 m) depth interval, and (2) 29 percent of the total reservoirs are carbonate reservoirs in the 16,000-17,000-foot (4,877-5,182 m) depth interval. Few carbonate reservoirs are in the 14,000-15,000-foot depth interval; correspondingly more clastic lithologies of the Tertiary sequence are present. In both Florida and Texas all deep significant Mesozoic reservoirs are carbonate rocks, whereas in Louisiana almost all deep significant Mesozoic reservoirs are clastic rocks. Reservoirs in Alabama and Mississippi are more intermediate facies rocks, and all offshore Texas and Louisiana reservoirs are classified as sandstone.
Table 24. Deep significant reservoirs in the Gulf Coast Basin by depth and State. [Data from NRG Associates (1990) for all reservoirs below 14,000 ft (4,267 m) producing either natural gas or oil, or both. LA, Louisiana; TX, Texas; MS, Mississippi; AL, Alabama; FL. Florida]
Depth Oil Gas Oil and gas interval (feet) LA TX MS AL FL LA TX MS AL FL LA TX MS AL FL
14,000-15,000 1 12 2 19 12 14 2 1 1 15,000-16,000 3 4 3 13 5 13 4 2 2 16,000-17,000 2 3 2 7 4 6 4 17,000-18,000 1 4 1 2 1 18,000-19,000 3 3 1 19,000-20,000 3 2 20,000-21,000 2 21,000-22,000 1 22,000-23,000 23,000-24,000
Total (n=174) 5 21 11 3 49 22 40 5 11 3 3

34 DEEP NATURAL GAS RESOURCES IN THE UNITED STATES
Table 25. Deep significant reservoirs in the Gulf Coast Basin by primary reservoir lithology and depth, for each State. [Data from NRG Associates (1990) for all reservoirs below 14,000 ft (4,267 m) producing either natural gas or oil, or both. Reservoir lithology: C, carbonate reservoirs; Cl, clastic reservoirs]
Depth interval (feet)
14,000-15,000 15,000-16,000 16,000-17,000 17,000-18,000 18,000-19,000 19,000-20,000 20,000-21,000 21,000-22,000 22,000-23,000 23,000-24,000
Total (n=174)
Louisiana C Cl
22 17 12 6 4 3
64
Texas C Cl
3 10 2 3 3 1
1
8 15
Mississippi Alabama Florida C Cl C Cl C Cl
6 20 1 1 2 16 5 2 2 1 8 4 1 3
2 3 2 1
2
14 50 13 6 2
Table 26. Deep significant reservoirs in the Gulf Coast Basin by producing stratigraphic unit, geologic age of producing unit, and lithology of producing unit. [Lithology may vary locally due to facies and depositional variations. Stratigraphic names are taken directly from the NRG Associates (1990) data file; names may be formal or informal stratigraphic units or may be biostratigraphic names applied to intervals; biostratigraphic units are given in italics. Lithology of producing stratigraphic unit: c, carbonate; e-el, mixed carbonate and clastic; cl, clastic]
Stratigraphic unit Lithology
Robulus Fri Miocene Anahuac Bolivina mex. Discorbis B Wilcox Textularia Yegua Planulina
cl cl cl cl cl cl cl cl cl cl
Camerina cl Woodburn cl Pliocene cl Pleistocene cl Bigerina hum. cl
Austin Tuscaloosa Edwards Hosston Sligo James Mooringsport Paluxy Red
c cl c
cl e-el
c cl cl cl
Buckner c Black River cl Cotton Valley Norphlet Smackover
Total (n=174)
cl cl c
14
2 7
15
1 2 2 1
1 3 4 1
3
8 3 5
65
15
10 3
2
2
12 5
1 3 9
50
16
6
3 1 5 1
3
6
28
Depth (in intervals of 1 000 ft) 17 18 19 20
Tertiary
3
Cretaceous
2
1 2
11
3
Jurassic
4
9
3
2 2
6 2
21 22 23 24
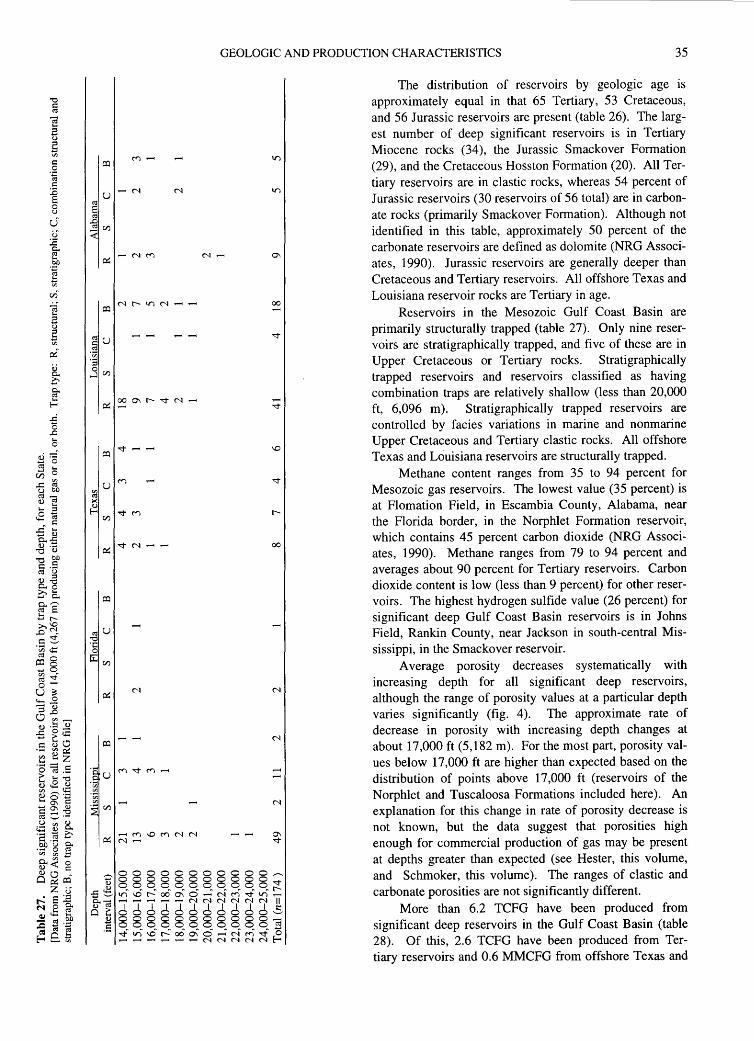
co:sU
"" ·c 0
u::U')
GEOLOGIC AND PRODUCTION CHARACTERISTICS 35
00
00
The distribution of reservoirs by geologic age is approximately equal in that 65 Tertiary, 53 Cretaceous, and 56 Jurassic reservoirs are present (table 26). The largest number of deep significant reservoirs is in Tertiary Miocene rocks (34 ), the Jurassic Smackover Formation (29), and the Cretaceous Hosston Formation (20). All Tertiary reservoirs are in clastic rocks, whereas 54 percent of Jurassic reservoirs (30 reservoirs of 56 total) are in carbonate rocks (primarily Smackover Formation). Although not identified in this table, approximately 50 percent of the carbonate reservoirs are defined as dolomite (NRG Associates, 1990). Jurassic reservoirs are generally deeper than Cretaceous and Tertiary reservoirs. All offshore Texas and Louisiana reservoir rocks are Tertiary in age.
Reservoirs in the Mesozoic Gulf Coast Basin are primarily structurally trapped (table 27). Only nine reservoirs are stratigraphically trapped, and five of these are in Upper Cretaceous or Tertiary rocks. Stratigraphically trapped reservoirs and reservoirs classified as having combination traps are relatively shallow (less than 20,000 ft, 6,096 m). Stratigraphically trapped reservoirs are controlled by facies variations in marine and nonmarine Upper Cretaceous and Tertiary clastic rocks. All offshore Texas and Louisiana reservoirs are structurally trapped.
Methane content ranges from 35 to 94 percent for Mesozoic gas reservoirs. The lowest value (35 percent) is at Flomation Field, in Escambia County, Alabama, near the Florida border, in the Norphlet Formation reservoir, which contains 45 percent carbon dioxide (NRG Associates, 1990). Methane ranges from 79 to 94 percent and averages about 90 percent for Tertiary reservoirs. Carbon dioxide content is low (less than 9 percent) for other reservoirs. The highest hydrogen sulfide value (26 percent) for significant deep Gulf Coast Basin reservoirs is in Johns Field, Rankin County, near Jackson in south-central Mississippi, in the Smackover reservoir.
Average porosity decreases systematically with increasing depth for all significant deep reservoirs, although the range of porosity values at a particular depth varies significantly (fig. 4). The approximate rate of decrease in porosity with increasing depth changes at about 17,000 ft (5,182 m). For the most part, porosity values below 17,000 ft are higher than expected based on the distribution of points above 17,000 ft (reservoirs of the Norphlet and Tuscaloosa Formations included here). An explanation for this change in rate of porosity decrease is not known, but the data suggest that porosities high enough for commercial production of gas may be present at depths greater than expected (see Hester, this volume, and Schmoker, this volume). The ranges of clastic and carbonate porosities are not significantly different.
More than 6.2 TCFG have been produced from significant deep reservoirs in the Gulf Coast Basin (table 28). Of this, 2.6 TCFG have been produced from Tertiary reservoirs and 0.6 MMCFG from offshore Texas and

36 DEEP NATURAL GAS RESOURCES IN THE UNITED STATES
Table 28. Known recovery, proven reserves, and cumulative production for deep significant reservoirs and fields in the Gulf Coast Basin by major lithology. [Data from NRG Associates (1990) for all reservoirs below 14,000 ft (4,267 m) producing either natural gas or oil, or both. Gas is in millions of cubic feet; oil is in millions of barrels]
Major reservoir litholog~ Total Clastic Carbonate Mixed
Gas
Known recoverable 13,262,291 11,110,291 1,679,000 473,000 Proven reserves 6,628,587 5,676,587 719,000 233,000 Cumulative Eroduction 6,192,094 4,993,094 960,000 239,000
Oil
Known recoverable 881,805 330,805 551,000 Proven reserves 128,226 56,226 72,000 Cumulative production 590,579 Ill ,579 479,000
Table 29. Deep significant reservoirs in the West Coast-Alaska region by geologic age and producing formation and trap type. [Data from NRG Associates (1990) for all reservoirs below 14,000 ft ( 4,267 m) producing either natural gas or oil, or both]
Field
Rio Viejo Fillmore Beaver Creek
Geologic age and producing rock unit
Miocene Stevens Sandstone Pliocene-Pleistocene Pico Sandstone Oligocene-Miocene Tyonek Sandstone
Louisiana Tertiary reservoirs. Clastic reservoirs have produced approximately five times as much gas as carbonate reservoirs.
OTHER REGIONS
The preceding four regions account for 369 of the 377 deep significant reservoirs in the NRG data file. Only two deep significant reservoirs are in California, in the Ventura and San Joaquin basins in southern California (Rio Viejo field, Kern County, and Fillmore field, Ventura County, table 29). Both fields have multiple reservoirs and are classified as oil fields. The Beaver Creek field in the Cook Inlet area, Alaska, is classified as a gas field. The deep Rio Viejo reservoir is at 14,100 ft (4,297 m), the Fillmore
Table 30. Known recovery, proven reserves, and cumulative production for deep significant reservoirs in the West CoastAlaska region by major lithology. [Data from NRG Associates ( 1990) for all reservoirs below 14,000 ft (4,270 m) producing either natural gas or oil, or both. Gas is in millions of cubic feet; oil is in millions of barrels]
Major reservoir litholog~ Total Clastic Carbonate
Gas
Known recoverable 264,900 264,900 Proven reserves 179,912 179,912 Cumulative Eroduction 84,988 84,988
Oil
Known recoverable 27,650 27,650 Proven reserves 5,067 5,067 Cumulative production 22,583 22,583
Basin
San Joaquin, California Ventura, California Cook Inlet, Alaska
Trap type
Stratigraphic Stratigraphic Structural
reservoir is at 14,250 ft (4,343 m), and the Beaver Creek reservoir is at 14,800 ft (4,511 m). All three reservoirs produce from Tertiary sandstone (table 29). The California reservoirs have an average reservoir porosity of 31 percent, and the Alaska reservoir has an average porosity of 28 percent (fig. 4). The West Coast-Alaska region has a known recoverable resource of 0.26 TCFG (table 30).
Only five deep significant fields, each containing a single deep reservoir, are in the Williston Basin, in McKenzie County of westernmost North Dakota, but none exceeds 14,200 ft (4,328 m) in depth (table 31). Croff and Bear Den fields are oil fields and North Fork, Cherry Creek, and Poe fields are oil and gas fields. All reservoirs are between 14,003 and 14,188 ft (4,268-4,325 m) depth and produce from dolomite of the Ordovician Red River Formation. The reservoirs are classified as having structural or combination structural and stratigraphic traps. Only one porosity value (11 percent, Cherry Creek field, Red River reservoir; fig. 4) is recorded in the NRG file for Williston Basin significant reservoirs. The Williston Basin province has a known recoverable resource of 38 BCFG (table 32).
Large volumes of deeply buried sedimentary rocks are in other basins in the United States where no significant gas production now exists. Recent work by Palacas (this volume) indicates that parts of the Midcontinent rift system may contain source rocks capable of generating natural gas below 15,000 ft (4,572 m). A minor amount of drilling has occurred in other deep Rocky Mountain basins (fig. 2) including the Raton, Albuquerque, and Crazy Mountains basins, and the recoverable natural gas resource is unknown. Analysis of drilling data by Wandrey and Vaughan (this volume) show that many deeper parts of productive basins

GEOLOGIC AND PRODUCTION CHARACTERISTICS 37
Table 31. Field and reservoir, average depth, reservoir lithology, trap type, and field classification of deep significant reservoirs in the Williston Basin. [Data from NRG Associates (1988) for all reservoirs below 14,000 ft (4.267 m) producing either natural gas or oil, or both. Leaders(--) indicate data are not available]
Average depth Field Reservoir to production
(feet) Croff Red River 14,116 Bear Den Red River 14,188 North Fork Red River 14,048 Cherry Creek Red River 14,003 Poe Red River 14,077
Table 32. Known recovery, proven reserves, and cumulative production for significant deep reservoirs in the Williston Basin by major lithology. [Data from NRG Associates (1988) for all reservoirs below 14,000 ft (4,267 m). Gas is in millions of cubic feet; oil is in millions of barrels. Leaders ( --) indicate production data are missing]
Major reservoir lithology Total Clastic Carbonate
Known recoverable Proven reserves Cumulative production
Known recoverable Proven reserves Cumulative production
Gas
38,142 25,334 12,808 Oil
1,945 1,014
931
38,142 25,334 12,808
1,945 1,014
931
have not been adequately drilled even where source- and reservoir-rock conditions are good. In the 1995 U.S. Geological Survey National Petroleum Assessment, 152 of approximately 600 petroleum plays assessed contained reservoir rocks at least in part buried below 15,000 ft (Dyman and others, 1996; Dyman, unpublished data). Studies of large computerized data files suggest that additional significant quantities of deep natural gas remain to be found in sedimentary basins of the United States.
REFERENCES CITED
Al-Shaieb, Z., Puckette, J., Ely, P., and Tigert, V., 1992, Pressure compartments and seals in the Anadarko Basin, in Johnson, K.S., and Cardott, B.J., eds., Source rocks in the southern Midcontinent: Oklahoma Geological Survey Circular 93, p. 210-228.
Curtis, D.M., 1991, The northern Gulf of Mexico Basin, in Gluskoter, H.J., Rice, D.O., and Taylor, R.B., eds., Economic geology, United States: Geological Society of America, The Geology of North America, v. P-2, p. 301-324.
Dwights Energy Data, 1985, Petroleum Data System (through 1985): Available from Dwights Energy Data Corp., Oklahoma City, Oklahoma 73108.
Reservoir lithology Trap type Field type
Dolomite Structural Oil. Dolomite Structural Oil. Dolomite Combination Oil-gas. Dolomite Oil-gas. Dolomite Combination Oil-gas.
Dyman, T.S., Spencer, C.W., Baird, J., Obuch, R., and Nielsen, D., 1992, Geologic characteristics of deep natural gas resources based on data from significant fields and reservoirs, in Dyman, T.S., ed., Geologic controls and resource potential of natural gas in deep sedimentary basins in the United States: U.S. Geological Survey Open-File Report 92-524, 287 p.
Dyman, T.S., Wilson, M., and Beeman, W.R., 1996, Deep natural gas resources of the United States, in USGS assessment of potential additions to oil and gas reserves of the United States: U.S. Geological Survey Digital Data Series 30.
Law, B.E., and Clayton, J.L., 1987, The role of thermal history in the preservation of oil at the south end of the Moxa arch, Utah and Wyoming-Implications for the oil potential of the southern Green River Basin [abs.], in Carter, L.M.H., ed., U.S. Geological Survey research on energy resources-1988, Program and abstracts: U.S. Geological Survey Circular 1025, p. 27.
Mancini, E.A., and Mink, R.M., 1985, Petroleum production and hydrocarbon potential of Alabama's coastal plain and territorial waters, in Perkins, B.F., and Martin, G.B., eds., Habitat of oil and gas in the Gulf Coast: Society of Economic Paleontologists and Mineralogists Annual Research Conference, 4th, Proceedings, p. 25-42.
Mast, R.F., Dolton, G.L., Crovelli, R.A., Root, D.H., Attanasi, E.D., Martin, P.E., Cooke, L.W., Carpenter, G.B., Pecora, W.C., and Rose, M.B., 1989, Estimates of undiscovered conventional oil and gas resources in the United States-A part of the Nation's energy endowment: U.S. Geological Survey and Minerals Management Service, 44 p.
NRG Associates Inc., 1990, The significant oil and gas fields of the United States (through December 31, 1988): Available from NRG Associates, Inc., P.O. Box 1655, Colorado Springs, Colorado 80901.
Patacas, J.G., 1992, Can carbonate rocks be sources of commercial petroleum deposits? in Johnson, K.S., and Cardott, B.J., eds., Source rocks in the southern Midcontinent, 1990 symposium: Oklahoma Geological Survey Circular 93, p. 256-266.
Perry, W.J., Jr., 1989, Tectonic evolution of the Anadarko Basin region, Oklahoma: U.S. Geological Survey Bulletin 1866-A, 19 p.
Schmoker, J.W., 1986, Oil generation in the Anadarko Basin, Oklahoma and Texas-Modelling using Lopatin's

38 DEEP NATURAL GAS RESOURCES IN THE UNITED STATES
method: Oklahoma Geological Survey Special Publication 86-3,40 p.
Takahashi, K.I., and Cunningham, K.I., 1987, Map showing wells drilled for oil and gas deeper than 15,000 feet (about 4,600 m) in the conterminous United States and
offshore: U.S. Geological Survey Oil and Gas Investigations Map OM-220, scale 1:5,000,000.
Trask, P.D., and Patnode, H.W., 1942, Source beds of petroleum: Tulsa, Oklahoma, American Association of Petroleum Geologists, 566 p.

Structural Settings of Deep Natural Gas Accumulations in the Conterminous United States
By William J. Perry, Jr.
GEOLOGIC CONTROLS OF DEEP NATURAL GAS RESOURCES IN THE UNITED STATES
U.S. GEOLOGICAL SURVEY BULLETIN 2146-D
UNITED STATES GOVERNMENT PRINTING OFFICE, WASHINGTON: 1997
CONTENTS
Abstract . . .. .. . . . . . . . . . . . . .. . . . . . .. . .. . . . . .. . . . . . . . . . . .. . . . ... . . . .. . . .. . .. . . .. . . . . . . . . . . . . . . . . . .. . . . . .. . .. . .. . . . ... . . . . .. .. . . . . . . . 41 Introduction .................................................................................................................... 41 Passive Continental Margin Basins ................................................................................ 42 Forearc Basins .......... ........... ... . . . . . ..... . . ....... .... . .. ........ .... . .. . ........ ..... . . ........... ..... . . . ............ 43 Foreland Basins . .. . .. . . . . .. . .. . .. ............ ................ ... . . . . .. . . . .. ..... ... .... .. ............ ..... . . ......... ........ 44 Extensional and Transtensional Basins Associated with Active Continental Margins.. 45 Rifts and Aulacogens . ......... ..... .. . . .. . . . . ................. ...... ... . . . ... ................. ........ ....... ............ 45 References Cited ..... . . . .. .. . ..................... ..................... ........... ..... . . . ... .. .... . . . .... . .. .... .. . ........ 45
FIGURES
1. Map of the conterminous United States and offshore areas showing basins more than 15,000 ft deep containing sedimentary rocks............................................................................................................................................................. 42
2. Schematic cross section across Pacific-type plate margin............................................................................................... 43 3. Schematic cross section across Val Verde foreland basin showing relationship to Marathon fold and thrust belt......... 43 4. Generalized tectonic map of southeastern Midcontinent................................................................................................. 44 5. Schematic cross sections illustrating tectonic model of development of passive continental margin............................. 45
TABLE
1. Basin settings and their relative favorability for deep natural gas accumulations and thermal history........................... 42

Structural Settings of Deep Natural Gas Accumulations in the Conterminous United States
By William J. Perry, Jr.
ABSTRACT
Deep natural gas accumulations (>15,000 ft, >4,572 m) are associated with two structural settings: passive margin basins not associated with plate boundaries and basins associated with active or once-active plate margins. The first structural setting is relatively simple and is related to crustal cooling. The Western Gulf Basin is a prime example. The second structural setting is more complex and includes forearc basins as well as foreland basins. Foreland basins include major foredeeps such as the Appalachian and Arkoma basins and more complex plate-convergence related basins such as the Anadarko, Hanna, Wind River, and Paradox basins. Extensional and transtensional basins, also associated with active plate margins and crustal spreading, are generally typified by high heat flow and shallow hydrocarbon generation and are not appropriate settings for deep gas accumulations.
INTRODUCTION
Deep natural gas accumulations at depths greater than 15,000 ft (4,572 m) in the conterminous United States are associated primarily with one of two basically different structural settings (table 1, fig. 1): passive continental margin basins and basins associated with and inland from active continental margins. In terms of plate tectonics, the active margins of interest are convergent or transform plate boundaries, whereas passive continental margins are not plate boundaries, except at the very beginning of their development when they form the margin of a rift that then opens into a new ocean basin by sea-floor spreading. Rift basins that fail to open into new ocean basins provide a third type of basinal setting within the conterminous United States; however, these are not a likely structural setting for major deep natural gas accumulations. Intracratonic basins such as the Michigan, Illinois, and Williston basins are simple sag basins within the stable craton, are generally less than 15,000 ft (4,572 m) deep, and not treated in this report.
The following classification is modified from that offered by Bally and Snelson (1980). Active continental margin basins consist of three types: (1) forearc basins developed between an accretionary wedge of sea-floor sediments and volcanics above a continentward-dipping subduction zone and the magmatic arc generated inland from the partial melting of the subducted material (fig. 2); (2) foreland basins beneath and cratonward of the frontal zone of fold and thrust belts (fig. 3); and (3) extensional or transtensional basins cratonward of active continental margins. Forearc basins develop above downgoing slabs of oceanic crust beneath Pacific-type active continental margins (Dickinson and Seely, 1979), whereas foreland basins form as a result of thrust loading (Beaumont, 1981; Jordan, 1981) of and by continental crust inland from both Pacific-type margins and inferred continent-continent plate collision zones such as the Ouachita fold belt (fig. 4 ). Both forearc and foreland basins are favorable sites for deep gas accumulations if deep source rocks, seals, and traps are present. Extensional and transtensional basins form as the result of crustal thinning, are characterized by high geothermal gradients, and are not likely sites for deep gas accumulations.
It must be kept in mind that the North American craton has undergone a complex tectonic history beginning more than 2.5 billion years ago (Muehlberger, 1980), and, as a result, few if any Phanerozoic sedimentary basins in the conterminous United States have developed over undamaged (unflawed) continental crust. For example, the late Paleozoic Anadarko Basin is situated over the northern flank of the early Paleozoic southern Oklahoma aulacogen and trough (Perry, 1989a). The aulacogen in turn is above the older Grenville suture, a continent-continent zone of plate collision (Muehlberger, 1980, fig. 15.4).
In this report, I characterize the structural setting of major deep gas accumulations at depths greater than 15,000 ft ( 4,572 m) in a simple classification scheme in order to provide clues to discovering additional deep gas occurrences. Basin names used in this report are those shown by Frezon and Finn (1988).
41
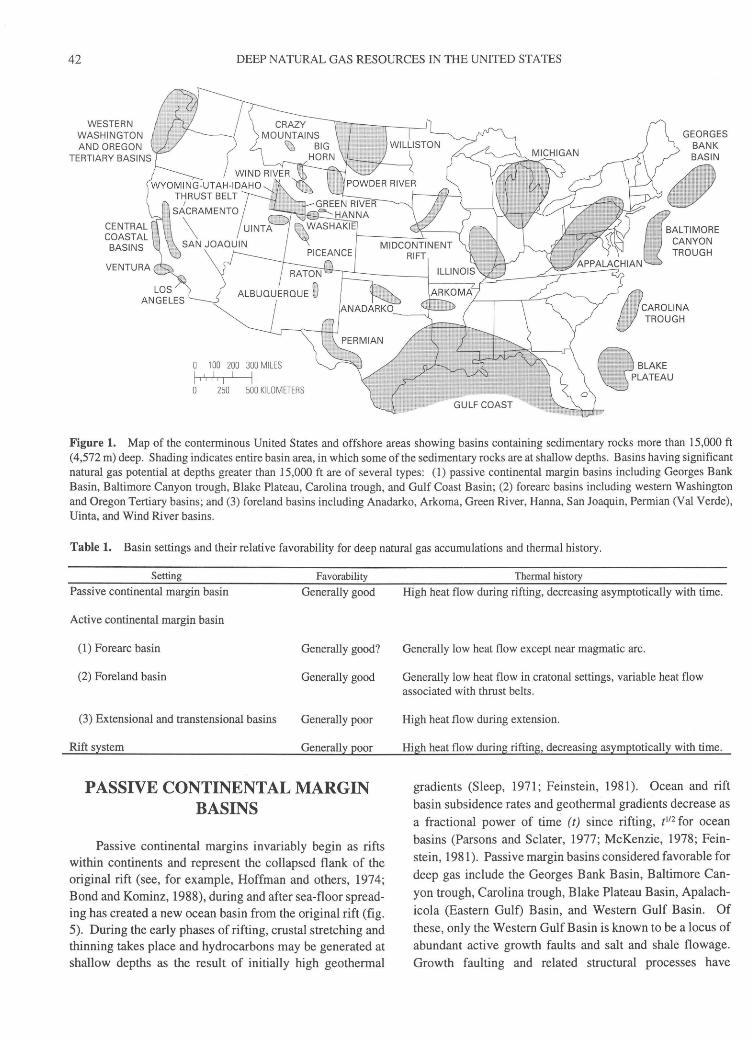
42 DEEP NATURAL GAS RESOURCES IN THE UNITED STATES
WESTERN WASHINGTON AND OREGON
TERTIARY BASINS
CENTRAL COASTAL BASINS
0 100 ZOO 300 MILES I 11 1 ,I, I I I 0 250 500 KILOMETERS
BALTIMORE CANYON TROUGH
Figure 1. Map of the conterminous United States and offshore areas showing basins containing sedimentary rocks more than 15,000 ft (4,572 m) deep. Shading indicates entire basin area, in which some of the sedimentary rocks are at shallow depths. Basins having significant natural gas potential at depths greater than .15,000 ft are of several types: (1) passive continental margin basins including Georges Bank Basin, Baltimore Canyon trough, Blake Plateau, Carolina trough, and Gulf Coast Basin; (2) forearc basins including western Washington and Oregon Tertiary basins; and (3) foreland basins including Anadarko, Arkoma, Green River, Hanna, San Joaquin, Permian (Val Verde), Uinta, and Wind River basins.
Table 1. Basin settings and their relative favorability for deep natural gas accumulations and thermal history.
Setting Favorability Passive continental margin basin Generally good
Active continental margin basin
( 1) Forearc basin Generally good?
(2) Foreland basin Generally good
(3) Extensional and transtensional basins Generally poor
Rift system Generally poor
PASSIVE CONTINENTAL MARGIN BASINS
Passive continental margins invariably begin as rifts within continents and represent the collapsed flank of the original rift (see, for example, Hoffman and others, 1974; Bond and Kominz, 1988), during and after sea-floor spreading has created a new ocean basin from the original rift (fig. 5). During the early phases of rifting, crustal stretching and thinning takes place and hydrocarbons may be generated at shallow depths as the result of initially high geothermal
Thermal history
High heat flow during rifting, decreasing asymptotically with time.
Generally low heat flow except near magmatic arc.
Generally low heat flow in cratonal settings, variable heat flow associated with thrust belts .
High heat flow during extension.
High heat flow during rifting, decreasing asymptotically with time.
gradients (Sleep, 1971; Feinstein, 1981). Ocean and rift basin subsidence rates and geothermal gradients decrease as a fractional power of time (t) since rifting, t112 for ocean basins (Parsons and Sclater, 1977; McKenzie, 1978; Feinstein, 1981 ). Passive margin basins considered favorable for deep gas include the Georges Bank Basin, Baltimore Canyon trough, Carolina trough, Blake Plateau Basin, Apalachicola (Eastern Gulf) Basin, and Western Gulf Basin. Of these, only the Western Gulf Basin is known to be a locus of abundant active growth faults and salt and shale flowage. Growth faulting and related structural processes have
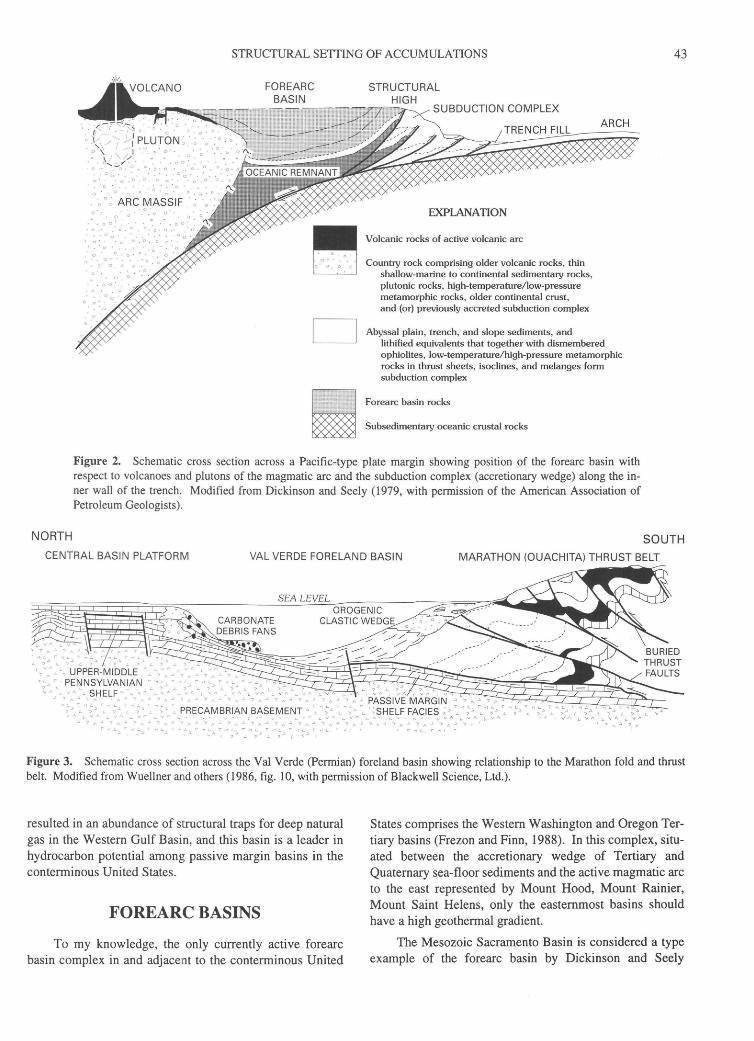
STRUCTURAL SETTING OF ACCUMULATIONS 43
> ~' -~ D 0 0 ) D •
0 .l~ I ~: P~UTON ~ 0
0 \.._ "/ j . . 0 0 ~ . 0
•• ~.( -/ / • 0 0 •
o . , .- a o . a. ' o . o . . . . • • • 0 0
0 · 0 ,o.o o 0 •
••. 0 . ' . • . ~ .
::0a ~,ARc' ~AssiF · ; · 0
0 . 0
0. 0 • 0 . . 0 .
0 0 • .••... .
J o ' 0 • 0 , 0 . D
• ~ ' 0 0 ' .• 0 : D • 0
.. 0. . • •• 0 .
. o' o. o c ·
SUBDUCTION COMPLEX
EXPLANATION
Volcanic rocks of active volcanic arc
Country rock comprising older volcanic rocks, thin shallow-marine to continental sedimentary rocks, plutonic rocks, high-temperature/low-pressure metamorphic rocks, older continental crust, and (or) previously accreted subduction complex
Abyssal plain, trench, and slope sediments, and lithified equivalents that together with dismembered ophiolites, low-temperature/high-pressure metamorphic rocks in thrust sheets, isoclines, and melanges form subduction complex
Forearc basin rocks
Subsedimentary oceanic crustal rocks
Figure 2. Schematic cross section across a Pacific-type plate margin showing position of the forearc basin with respect to volcanoes and plutons of the magmatic arc and the subduction complex (accretionary wedge) along the inner wall of the trench. Modified from Dickinson and Seely (1979, with permission of the American Association of Petroleum Geologists) .
NORTH
CENTRAL BASIN PLATFORM VAL VERDE FORELAND BASIN
SOUTH
MARATHON (OUACHITA) THRUST BELT
Figure 3. Schematic cross section across the Val Verde (Permian) foreland basin showing relationship to the Marathon fold and thrust belt. Modified from Wuellner and others (1986, fig. 10, with permission of Blackwell Science, Ltd.).
resulted in an abundance of structural traps for deep natural gas in the Western Gulf Basin, and this basin is a leader in hydrocarbon potential among passive margin basins in the conterminous United States.
FOREARC BASINS
To my knowledge, the only currently active forearc basin complex in and adjacent to the conterminous United
States comprises the Western Washington and Oregon Tertiary basins (Frezon and Finn, 1988). In this complex, situated between the accretionary wedge of Tertiary and Quaternary sea-floor sediments and the active magmatic arc to the east represented by Mount Hood, Mount Rainier, Mount Saint Helens, only the easternmost basins should have a high geothermal gradient.
The Mesozoic Sacramento Basin is considered a type example of the forearc basin by Dickinson and Seely

44 DEEP NATURAL GAS RESOURCES IN THE UNITED STATES
NEW MEXICO I I I
...........................
// I '--- ...... OKLAHOMA ----7-
ARKANSAS / / / ' .: /R' ~/ : --\---- :' /~ <Q? ·.
/ 0\"~' ........ ' /.i;f (j/ .. --
I I \ \ LANADARKO \
WICHITA '-.......... BASIN I _,.--;:r..p.. ' BASitv................... :' /~C:J~~;?/ ~ TENNESSEE /9:-~ //~~/ J-----(t--
1 ?' : / ~-:y~ .,.,- BLACK I\----- EASTERN / OUACHITA // ~~/ j WARRIOR I : EDGE OF
I MOUNTAINS ~..... \
I r-,-.., ' I I HOLLIS BASIN \ '\_ ", '-..,) _
._ .. ·----~_OUNT~~~~--/,' / f "- .......... BASIN I \fRETACEOUS ···J--- 0/_ .... / I . ROCKS .... 'I\ -
I /_.,---,, WES~~-~~E'-1'~ DELAWARE
( \OF CRETACEOUS/ / .....-- _, ' v-<f ;;<, ~
- l OUACHITA \ C;ylr_ '-.., -~· I \ ROCKS------;. I ::z:.
BASIN I : \ .- //2 \<_..-'1 1 MIDLAND 1 / _i:;;:
-- L J.' \ BASIN \ / ::z:. (/) i;j I I \ 1 1 ~'.~ CO I I \ I 1!J:: Q \ \ I 10 ~ \ \ C~' J LLANO 14: 0
0\ \ A!l.t~.£:>.... _., 1 UPLIFT I :!
DIABL ' "'z ~~ --- ~
(L!'~~FORM' ..... ...-~-\~~6t~S;!l.t ., ~ \ \ \ .... ---- -:::>
X \ ~ - '--/\zl(.~~~ 0 I VAL ~p.:
MARFA'- I VERDE \ DEVILS BASIN BASIN \RIVER
MARATHON UPLIFT ~ ...... /
r~ (OUACHITA) \\ THRUST BELT \...__
(""'-'
I I
\ .....
...... \ ~ )
\
/
SALIENT I -</ ,.¢-_ '1.... •• I 0 \- iomsiANA~ <o s~ 1
I ? <r I / \ I
( MISSISSIPPI 1 - -
TEXAS \ \ ----J I l
\ _J.i\ ' ,.r ,_ ,- ........ ___ /~ ,_. ' ,- " .,.,........- -- - ---'
/ ---f
/
100 200 MILES
100 200 300 400 KILOMETERS
Figure 4. Generalized tectonic map of the southern Midcontinent. Modified from Perry (1989b ).
(1979); however, the western part of this basin has been severely modified by Cenozoic thrusting (Wentworth and Zoback, 1989). Tectonic compaction, high geothermal gradients, and abnormally high fluid pressure development at depths of less than 8,000 ft (2,440 m) (Berry, 1973; Zeiglar and Spotts, 1978) probably are related to this compressional tectonism. The contiguous San Joaquin Basin to the south is a currently active narrow fold-and-thrust belt floored by a late Cenozoic blind thrust (Namson and Davis, 1988). The thick Cretaceous sequence of the San Joaquin Basin probably represents the same forearc basin complex as that of the Sacramento Basin to the north.
FORELAND BASINS
Foreland basins are generally considered to be the result of thrust loading (Beaumont, 1981; Jordan, 1981; Shuster and Steidtmann, 1988), and, as a consequence, their thermal history should be the inverse of that of the passive margin and rift basin development. The thermal gradient should be depressed within the basin during tectonism by thrust loading rather than elevated during tectonism by crustal extension and tectonic thinning as in the rift setting. The thermal history of foreland basins and overthrust
terranes is discussed by Angevine and Turcotte (1983) and Furlong and Edman ( 1984 ). Foreland basins having deep gas potential and (or) production include the Anadarko and Arkoma basins of Oklahoma, Green River and Wind River basins of Wyoming, San Joaquin Basin of California, Uinta Basin of Utah, and Val Verde (Permian) Basin of Texas.
Low-permeability deep regions of all of these basins are overpressured (see, for example, Spencer, 1987), a likely result of active gas generation subsequent to basin development after reestablishment of normal geothermal gradients (Furlong and Edman, 1984). Continued basin filling subsequent to thrust loading, in the Anadarko Basin during the Permian may have been due to compaction and dewatering of the thick Upper Mississippian and Pennsylvanian basin sediments emplaced during transpressional thrust loading (Perry, 1989a).
Foreland basins of the Rocky Mountains, particularly those of Wyoming, may have reached their deepest burial about 18 million years ago (N.M. Denson, oral commun., 1989). Subsequent Neogene uplift to form present-day topographic relief and elevation is suspected to have resulted in cooling of the deeper parts of these basins. In the northern Green River Basin, cooling began 4-2 Ma, since which time "a relatively rapid temperature decrease of20°C (36°F) or more" has taken place (Naeser, 1986).
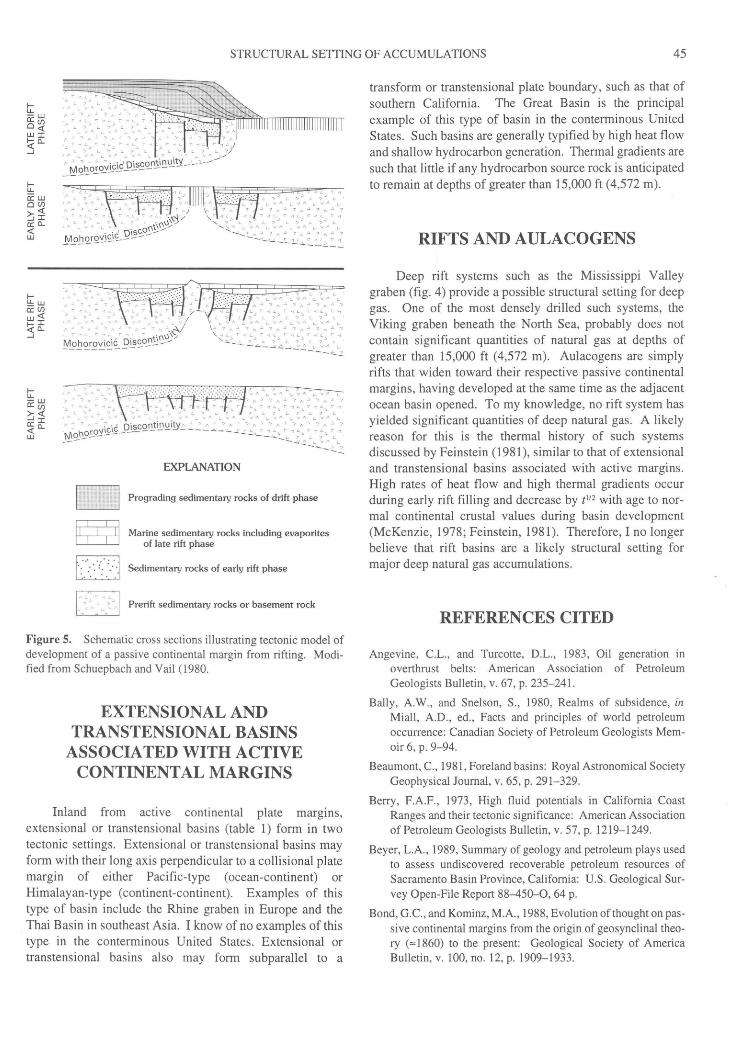
STRUCTURAL SETIING OF ACCUMULATIONS 45
f-u.. -w a:(/) 0<( LlJI
~CL ....J
f-u.. Ci:w OC/l
~~ a:CL <( LlJ
f-u.. -w a:(/) ~<( a: I <(CL LlJ
· ..::, -.:._~ ~'). ~L.,... 7).~ ';'. ;... v 1\ !... v /'. 1- v /i
/\~7"-'7"-"1"~
.). .-L "' ~..) \L - ~.) \L -1 ~..) \L .-,
I 1\ 1..- V t\ 1..- \i /\ :_ V /', /...
/\.~7/\...!.7,.,...:.7/\....:.7/'....;.7....:.
';""L ....., ~.). \L _.. ~,) -L '1 ; .). ,-L _... ). ,... ..-- L
'AA 0. \ V•A-" ~- ~ A·c· ,-ois~o"nti~uit_y :_-..:::_:_// -~Q\:_OI~~!_-------
0 L 7 ~ 7
I/\ 1.- v 1\ .,... V /\
A ....:. 7 " -' I 1\.
L 7.). L /..) \L '1 ~). >L "1
I- v t\ I..- v 1\ L.- v t\ i-
..l 7 1\ .J. 7 " _). 7 1\. .J. .,
\ 4'-.). \ -1'-:_,. \ "1L;:;. \ "1
"'<.. 7L7L7L7L7L ' .:Z /\ 1.- v /\ 1- v /\ t- v /\ I- v /\ /....
--:-._ 7 t\ -" 7 /\ ....:. 7 " ....:. 7 1\ ....:. I
- -.---~-~ 'L'-..:.. =- 2::2: :_
.)-:-_,L.).'I ..... L.).'-L;:.r-;:. ;:.. /
'~"~L ~7:: ~L ~7:,"~L -7~ ::L -,\i,~V ~_b<?_r~:'J~~ p!_:;~O~~- ..-
EXPLANATION
Prograding sedimentary rocks of drift phase
Marine sedimentary rocks including evaporites of late rift phase
Sedimentary rocks of early rift phase
Prerift sedimentary rocks or basement rock
Figure 5. Schematic cross sections illustrating tectonic model of development of a passive continental margin from rifting. Modified from Schuepbach and Vail (1980.
EXTENSIONAL AND TRANSTENSIONAL BASINS
ASSOCIATED WITH ACTIVE CONTINENTAL MARGINS
Inland from active continental plate margins, extensional or transtensional basins (table 1) form in two tectonic settings. Extensional or transtensional basins may form with their long axis perpendicular to a collisional plate margin of either Pacific-type (ocean-continent) or Himalayan-type (continent-continent). Examples of this type of basin include the Rhine graben in Europe and the Thai Basin in southeast Asia. I know of no examples of this type in the conterminous United States. Extensional or transtensional basins also may form subparallel to a
transform or transtensional plate boundary, such as that of southern California. The Great Basin is the principal example of this type of basin in the conterminous United States. Such basins are generally typified by high heat flow and shallow hydrocarbon generation. Thermal gradients are such that little if any hydrocarbon source rock is anticipated to remain at depths of greater than 15,000 ft (4,572 m).
RIFTS AND AULACOGENS
Deep rift systems such as the Mississippi Valley graben (fig. 4) provide a possible structural setting for deep gas. One of the most densely drilled such systems, the Viking graben beneath the North Sea, probably does not contain significant quantities of natural gas at depths of greater than 15,000 ft (4,572 m). Aulacogens are simply rifts that widen toward their respective passive continental margins, having developed at the same time as the adjacent ocean basin opened. To my knowledge, no rift system has yielded significant quantities of deep natural gas. A likely reason for this is the thermal history of such systems discussed by Feinstein (1981 ), similar to that of extensional and transtensional basins associated with active margins. High rates of heat flow and high thermal gradients occur during early rift filling and decrease by t 112 with age to normal continental crustal values during basin development (McKenzie, 1978; Feinstein, 1981). Therefore, I no longer believe that rift basins are a likely structural setting for major deep natural gas accumulations.
REFERENCES CITED
Angevine, C.L., and Turcotte, D.L., 1983, Oil generation in overthrust belts: American Association of Petroleum Geologists Bulletin, v. 67, p. 235-241.
Bally, A.W., and Snelson, S., 1980, Realms of subsidence, in Miall, A.D., ed., Facts and principles of world petroleum occurrence: Canadian Society of Petroleum Geologists Memoir 6, p. 9-94.
Beaumont, C., 1981, Foreland basins: Royal Astronomical Society Geophysical Journal, v. 65, p. 291-329.
Berry, F.A.F., 1973, High fluid potentials in California Coast Ranges and their tectonic significance: American' Association of Petroleum Geologists Bulletin, v. 57, p. 1219-1249.
Beyer, L.A., 1989, Summary of geology and petroleum plays used to assess undiscovered recoverable petroleum resources of Sacramento Basin Province, California: U.S. Geological Survey Open-File Report 88-450-0, 64 p.
Bond, G.C., and Kominz, M.A., 1988, Evolution of thought on passive continental margins from the origin of geosynclinal theory ("" 1860) to the present: Geological Society of America Bulletin, v. 100, no. 12, p. 1909-1933.
46 DEEP NATURAL GAS RESOURCES IN THE UNITED STATES
Dickinson, W.R., and Seely, D.R., 1979, Structure and stratigraphy of forearc regions: American Association of Petroleum Geologists Bulletin, v. 63, p. 2-31.
Feinstein, S., 1981, Subsidence and thermal history of Southern Oklahoma aulacogen-Implications for petroleum exploration: American Association of Petroleum Geologists Bulletin, v. 65,no. 12,p. 2521-2533.
Frezon, S.E., and Finn, T.M., 1988, Map of sedimentary basins in the conterminous United States: U.S. Geological Survey Map OM-223, scale 1:5,000,000.
Furlong, K.P., and Edman, J.D., 1984, Graphic approach to determination of hydrocarbon maturation in overthrust terrains: American Association of Petroleum Geologists Bulletin, v. 68, p. 1818-1824.
Hoffman, P., Dewey, J.F., and Burke, K., 1974, Aulacogens and their genetic relations to geosynclines, with a Proterozoic example from Great Slave Lake, Canada, in Dott, R. J., Jr., and Shaver, R. H., eds., Modern and ancient geosynclinal sedimentation: Society of Economic Paleontologists and Mineralogists Special Publication 19, p. 38-55.
Jordan, T.E., 1981, Thrust loads and foreland basin evolution, Cretaceous, western United States: American Association of Petroleum Geologists Bulletin, v. 65, p. 2506-2520.
McKenzie, D., 1978, Some remarks on the development of sedimentary basins: Earth and Planetary Science Letters, v. 40, p. 25-32.
Muehl berger, W.R., 1980, The shape of North America during the Precambrian, in Continental tectonics-Studies in geophysics: Washington, D.C., National Academy of Sciences, p. 175-183.
Naeser, N.D., 1986, Neogene thermal history of the northern Green River Basin, Wyoming-Evidence from fission-track dating, in Gautier, D.L., ed., Roles of organic matter in sediment diagenesis: Society of Economic Paleontologists and Mineralogists Special Publication 38, p. 65-72.
Namson, J.S., and Davis, T.L., 1988, Seismically active fold and thrust belt in the San Joaquin Valley, central California: Geological Society of America Bulletin, v. 100, p. 257-273.
Parsons, B., and Sclater, J.G., 1977, An analysis of the variations of ocean floor bathymetry and heat flow with age: Journal of Geophysical Research, v. 82, p. 803-827.
Perry, W.J., Jr., 1989a, Tectonic evolution of the Anadarko Basin region, Oklahoma: U.S. Geological Survey Bulletin 1866-A,
19 p.
---1989b, Structural settings of deep natural gas accumulations in the conterminous U.S ., in Rice, D.D., ed., Distribution
of natural gas and reservoir properties in the continental crust of the U.S.: Gas Research Institute Final Report 89- 0188, p.
62-72.
Schuepbach, M.A., and Vail, P.R., 1980, Evolution of outer highs on divergent continental margins, in Continental tectonicsStudies in geophysics: Washington, D.C., National Academy
of Sciences, p. 50-61.
Shuster, M.W., and Steidtmann, J.R., 1988, Tectonic and sedimen
tary evolution of the northern Green River Basin, western Wyoming, in Schmidt, C.J., and Perry, W.J., Jr., eds., Interac
tion of the Rocky Mountain foreland and the Cordilleran thrust belt: Geological Society of America Memoir 171, p. 515-529.
Sleep, N.H., 1971, Thermal effects of the formation of Atlantic continental margins by continental break up: Royal Astronomical Society Geophysical Journal, v. 24, p. 325-350.
Spencer, C.W., 1987, Hydrocarbon generation as a mechanism for overpressuring in Rocky Mountain region: American Associ
ation of Petroleum Geologists Bulletin, v. 71, p. 368-388.
Wentworth, C.M., and Zoback, M.D., 1989, The style of late Cenozoic deformation at the eastern front of the California Coast
Ranges: Tectonics, v. 8, p. 237-246.
Wuellner, D.E., Lehtonen, L.R., and James, W.C., 1986, Sedimentary-tectonic development of the Marathon and Val Verde Basins, West Texas, U.S.A.-A Permo-Carboniferous migrating foredeep, in Allen, P.A., and Homewood, Peter, eds., Foreland basins: International Association of Sedimentologists Special Publication 8, p. 347-368.
Zieglar, D.L., and Spotts, J.H., 1978, Reservoir and source-bed history of Great Valley, California: American Association of
Petroleum Geologists Bulletin, v. 62, p. 813-826.
Sequential Laramide Deformation and Paleocene Depositional Patterns in Deep Gas-Prone Basins of the Rocky Mountain Region
By William J. Perry, Jr., and R.M. Flores
GEOLOGIC CONTROLS OF DEEP NATURAL GAS RESOURCES IN THE UNITED STATES
U.S. GEOLOGICAL SURVEY BULLETIN 2146-E
UNITED STATES GOVERNMENT PRINTING OFFICE, WASHINGTON: 1997
CONTENTS
Abstract . . . . .. . . . . . . . . . . .. . . . . .. . . . . . . . . . . . . . . . . .. . . . . .. . . . .. . . . . .. . . . . . . .. . . .. . . . . .. . . . . .. . . . . . . . . . . .. . . . . . . . . . . .. . . . . .. ... . .. . . . 49 Introduction . . . . . . . . . . .. . . . . . . . . . . . . . . . . . .. . . . .. . . . . .. . . . . . . . . . .. . . . . . . . . . . .. . . . . .. . . . . . . .. . . . . . . . . . .. . . . . . . . . . .. . . . . .. . . .. .. . .. 49 Hanna Basin .. . .. . . . . .... .. .. . . . . .. . . . . . . . . . ... .. . .. .. . . .. . . . . ... . . . . . . . . . . .. . . . .. . .. . .. . .. ... . . . . . . . . . . . . . . . . ...... .. . .. . ..... 51 Wind River Basin ................................................................. .. ........................................ 55 References Cited ............ .... .................. ... ......... ............. ............... .. .. . ... . . . ........... ............ 58
FIGURES
1. Map of Rocky Mountain foreland province showing principal Laramide basins and uplifts ... . . . . . .. . . . .. . .. . . . . . .. .. . . . . .. . . . . .. . . 50 2. Map showing sequence of inception of Laramide deformation in Rocky Mountain region........................................... 51 3. Tectonic map of Hanna Basin region.............................................................................................................................. 52 4. Schematic cross section through northern part of Hanna Basin............................................ .. ........................................ 55 5. Tectonic map of Wind River Basin region...................................................................................................................... 56
TABLE
1. Summary of results of palynologic studies of coal samples from the Ferris and Hanna Formations, Wyoming ........... 53

Sequential Laramide Deformation and Paleocene Depositional Patterns in
Deep Gas-Prone Basins of the Rocky Mountain Region
By William J. Perry, Jr., and R.M. Flores
ABSTRACT
Successive eastward and northeastward partitioning of the Late Cretaceous Rocky Mountain foreland basin took place in southern Montana and Wyoming during latest Cretaceous and Paleocene time. Economic implications, particularly for deep gas accumulations, are examined in terms of this structural sequence. Calculated basin subsidence rates and associated basin-margin faults and folds are characteristic of transpressional (oblique-contractional) deformation. The sequence of structural events within the Hanna and Wind River Basins is discussed in terms of deep gas occurrences, and the possibility, and possible locations, of undiscovered deep gas are explored.
INTRODUCTION
In this report, we describe the structural history, setting, and trapping mechanism of deep gas accumulations in several Rocky Mountain basins in order to relate these factors to undiscovered natural gas resources. We compare the timing, synorogenic-sediment dispersal patterns, and structural style of two deep Rocky Mountain basins in an attempt to approach this goal.
Perry (1989; this volume) showed that deep natural gas accumulations in the conterminous United States are associated primarily with two structural settings: (1) passive continental margin basins and (2) basins associated with and inland from active continental margins. This latter group of basins (type 2 basins of Perry, 1989) was subdivided by Perry into forearc basins, seaward of the magmatic arc above a continentward-dipping subduction zone; foreland basins, beneath and cratonward of the frontal zone of fold
and thrust belts; and extensional or transtensional basins, associated chiefly with transform margins. In this report, we discuss deep gas-prone Late Cretaceous and early Tertiary Laramide basins of the Rocky Mountain foreland, in particular, the Hanna and Wind River basins.
Several sedimentary basins in the central Rocky Mountains contain substantial volumes of sedimentary rock at depths greater than 15,000 ft (4,572 m); the largest of these basins are the Green River and Uinta basins, respectively north and south of the Uinta uplift (fig. 1). These basins initially developed during Cretaceous time as foredeeps in front of the eastward-prograding Wyoming and Utah salients of the Cordilleran thrust belt. A southeastward progression of major uplift and consequent basin development in the Rocky Mountain foreland began in extreme southwestern Montana west of the Neogene Yellowstone volcanic area (fig. 1) during CenomanianTuronian time (Perry and others, 1990; Haley and others, 1991 ). Investigation of the sequence of Laramide deformation and relative timing of Rocky Mountain foreland basin development (Perry and others, 1990, 1992) has begun to revolutionize our understanding of the Late Cretaceous and early Tertiary history of the Rocky Mountain region (Flores and others, 1991; Keighin and others, 1991; Nichols and others, 1991; Roberts and others, 1991 ). The following comments concerning the history of Laramide deformation are summarized from Perry and others (1992).
No evidence of Campanian or older Cretaceous Laramide-style deformation (other than tectonic welts of low relief) is present in the Rocky Mountain foreland east or southeast of the Blacktail-Snowcrest and Wind River uplifts (fig. 1 ), based on available palynostratigraphic dating of preorogenic and synorogenic sediments, with the exception of gravels of unknown origin in the Frontier Formation in the northwestern part of the Bighorn Basin. The Front Range
49
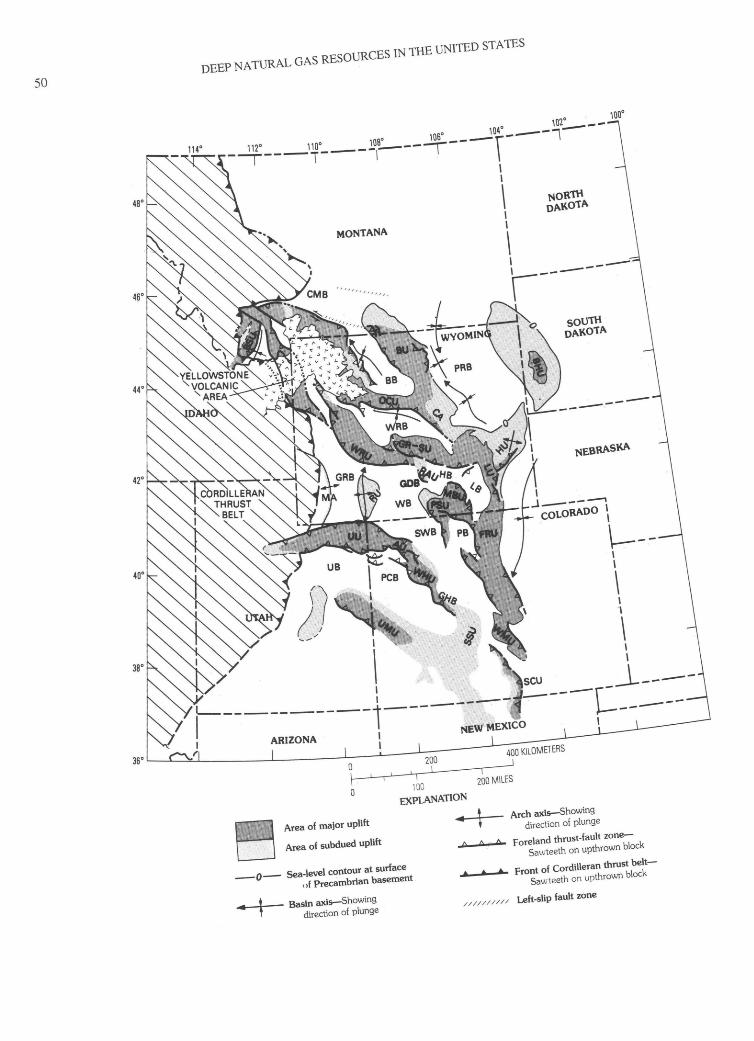
so DEEP NATURAL GAS RESOURCES IN THE UNITED STATES
-112
' 110' 108' 106' 104' 101:---
100
' ~---r----1---~---~---1
MONTANA
I \
\ \ I
\ I r-------
0 200 400 KILOMETERS
b~~~~~ ~~ ~~------~~---_j 100 200 MILES
EXPLANATION
Area of major uplift
Area of subdued uplift
-o- Sea-level contour at surface '1f Precambrian basement
4 Basin axis-Showing direction of plunge
t Arch axis-Showing direction of plunge
Foreland thrust-fault zoneSawteeth on upthrown block
....., • ._ Front of Cordi\leran thrust beltSaw teeth on upthrown block
////////// Left-slip fault zone
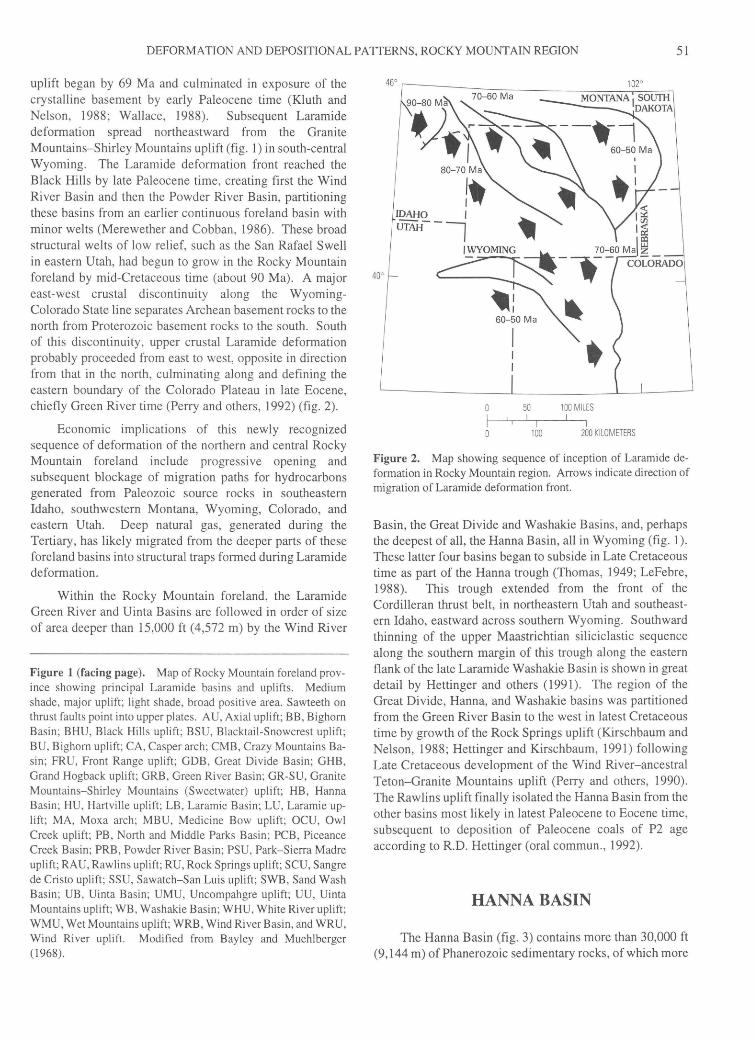
DEFORMATION AND DEPOSITIONAL PATTERNS, ROCKY MOUNTAIN REGION 51
uplift began by 69 Ma and culminated in exposure of the crystalline basement by early Paleocene time (Kluth and Nelson, 1988; Wallace, 1988). Subsequent Laramide deformation spread northeastward from the Granite Mountains-Shirley Mountains uplift (fig. 1) in south-central Wyoming. The Laramide deformation front reached the Black Hills by late Paleocene time, creating first the Wind River Basin and then the Powder River Basin, partitioning these basins from an earlier continuous foreland basin with minor welts (Merewether and Cobban, 1986). These broad structural welts of low relief, such as the San Rafael Swell in eastern Utah, had begun to grow in the Rocky Mountain foreland by mid-Cretaceous time (about 90 Ma). A major east-west crustal discontinuity along the WyomingColorado State line separates Archean basement rocks to the north from Proterozoic basement rocks to the south. South of this discontinuity , upper crustal Laramide deformation probably proceeded from east to west, opposite in direction from that in the north, culminating along and defining the eastern boundary of the Colorado Plateau in late Eocene, chiefly Green River time (Perry and others, 1992) (fig. 2).
Economic implications of this newly recognized sequence of deformation of the northern and central Rocky Mountain foreland include progressive opening and subsequent blockage of migration paths for hydrocarbons generated from Paleozoic source rocks in southeastern Idaho, southwestern Montana, Wyoming, Colorado, and eastern Utah. Deep natural gas, generated during the Tertiary, has likely migrated from the deeper parts of these foreland basins into structural traps formed during Laramide deformation.
Within the Rocky Mountain foreland, the Laramide Green River and Uinta Basins are followed in order of size of area deeper than 15,000 ft (4,572 m) by the Wind River
Figure 1 (facing page). Map of Rocky Mountain foreland province showing principal Laramide basins and uplifts. Medium shade, major uplift ; light shade, broad positive area. Sawteeth on thrust faults point into upper plates . AU, Axial uplift; BB, Bighorn Basin; BHU, Black Hills uplift ; BSU, Blacktail-Snowcrest uplift; BU, Bighorn uplift; CA, Casper arch; CMB, Crazy Mountains Basin; FRU, Front Range uplift; GDB , Great Divide Basin; GHB , Grand Hogback uplift; GRB, Green River Basin; GR-SU, Granite Mountains-Shirley Mountains (Sweetwater) uplift; HB, Hanna Basin ; HU, Hartville uplift; LB, Laramie Basin; LU, Laramie uplift; MA, Moxa arch; MBU, Medicine Bow uplift; OCU, Owl Creek uplift; PB, North and Middle Parks Basin; PCB, Piceance Creek Basin; PRB, Powder River Basin; PSU, Park-Sierra Madre uplift; RAU, Rawlins uplift; RU, Rock Springs uplift; SCU, Sangre de Cristo uplift; SSU, Sawatch-San Luis uplift; SWB, Sand Wash Basin ; UB, Uinta Basin; UMU, Uncompahgre uplift; UU, Uinta Mountains uplift; WB, Washakie Basin; WHU, White River uplift; WMU, Wet Mountains uplift; WRB , Wind River Basin, and WRU, Wind River uplift. Modified from Bayley and Muehlberger (1968).
IDAHO I GTAH--~
I WYOMING
50 100 MILES
1 DO 200 KILOMETERS
Figure 2. Map showing sequence of inception of Laramide deformation in Rocky Mountain region. Arrows indicate direction of migration of Laramide deformation front.
Basin, the Great Divide and Washakie Basins, and, perhaps the deepest of all, the Hanna Basin, all in Wyoming (fig. 1 ). These latter four basins began to subside in Late Cretaceous time as part of the Hanna trough (Thomas, 1949; LeFebre, 1988). This trough extended from the front of the Cordilleran thrust belt, in northeastern Utah and southeastern Idaho, eastward across southern Wyoming. Southward thinning of the upper Maastrichtian siliciclastic sequence along the southern margin of this trough along the eastern flank of the late Laramide Washakie Basin is shown in great detail by Hettinger and others (1991). The region of the Great Divide, Hanna, and Washakie basins was partitioned from the Green River Basin to the west in latest Cretaceous time by growth of the Rock Springs uplift (Kirschbaum and Nelson, 1988; Hettinger and Kirschbaum, 1991) following Late Cretaceous development of the Wind River-ancestral Teton-Granite Mountains uplift (Perry and others, 1990). The Rawlins uplift finally isolated the Hanna Basin from the other basins most likely in latest Paleocene to Eocene time, subsequent to deposition of Paleocene coals of P2 age according to R.D. Hettinger (oral commun. , 1992).
HANNA BASIN
The Hanna Basin (fig. 3) contains more than 30,000 ft (9, 144m) of Phanerozoic sedimentary rocks, of which more
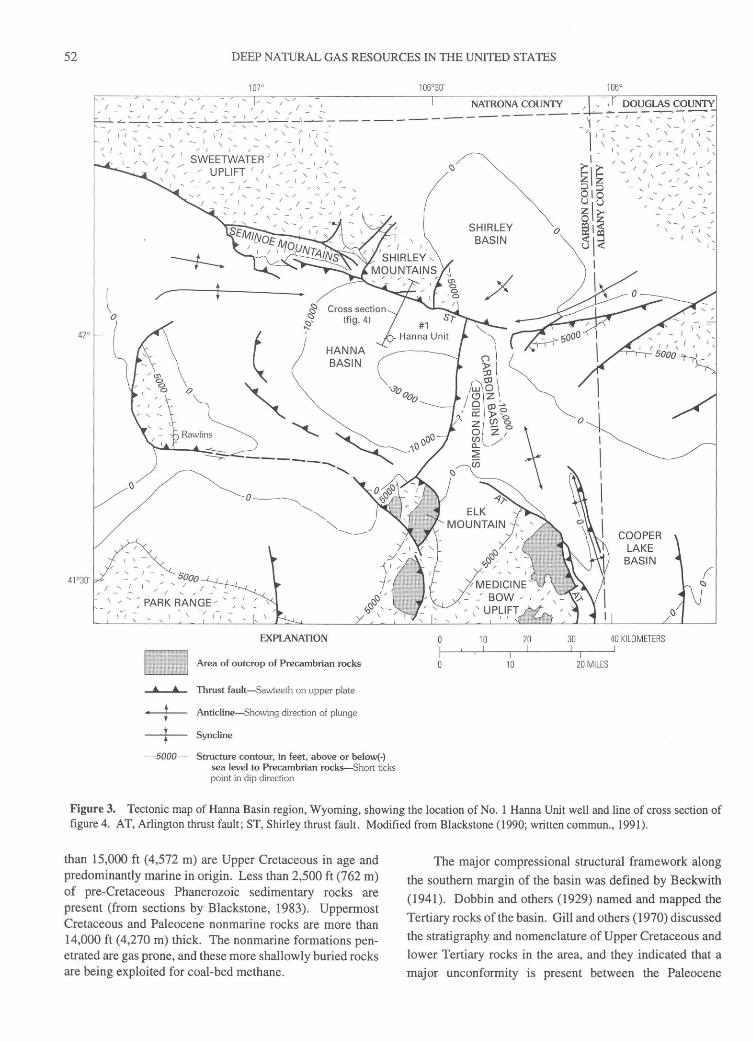
52 DEEP NATURAL GAS RESOURCES IN THE UNITED STATES
41 °30'
l 0
- / , , sooo I ' I \ / ....... I
\-/ ;-: PAR~ RANGE/ ;- : ~ / / - - / / -
\ I '
EXPLANATION
Area of outcrop of Precambrian rocks
4 4 Thrust fault-Sawteeth on upper plate
t Anticline-Showing direction of plunge
+ Syncline
-5000- Structure contour, in feet, above or below(-) sea level to Precambrian rocks--Short ticks point in dip direction
SHIRLEY BASIN
10
10
20
0
30 40 KILOMETERS
20 MILES
Figure 3. Tectonic map of Hanna Basin region, Wyoming, showing the location of No. 1 Hanna Unit well and line of cross section of figure 4. AT, Arlington thrust fault; ST, Shirley thrust fault. Modified from Blackstone (1990; written commun., 1991 ).
than 15,000 ft (4,572 m) are Upper Cretaceous in age and predominantly marine in origin. Less than 2,500 ft (762 m) of pre-Cretaceous Phanerozoic sedimentary rocks are present (from sections by Blackstone, 1983). Uppermost Cretaceous and Paleocene nonmarine rocks are more than 14,000 ft ( 4,270 m) thick. The nonmarine formations penetrated are gas prone, and these more shallowly buried rocks are being exploited for coal-bed methane.
The major compressional structural framework along
the southern margin of the basin was defined by Beckwith
(1941). Dobbin and others (1929) named and mapped the
Tertiary rocks of the basin. Gill and others (1970) discussed
the stratigraphy and nomenclature of Upper Cretaceous and
lower Tertiary rocks in the area, and they indicated that a
major unconformity is present between the Paleocene

DEFORMATION AND DEPOSITIONAL PATTERNS, ROCKY MOUNTAIN REGION 53
Hanna Formation and Cretaceous rocks in the northern Hanna Basin. A deep drill hole to the south of the surface expression of this unconformity shows, however, that at least 6,500 ft (1,980 m) of intervening rocks is present within the basin (fig. 3); most of these rocks are now known to be early to middle Paleocene in age (Cavaroc and others, 1992). The basin contains numerous Upper Cretaceous to Paleocene coals (Glass, 1975; Glass and Roberts, 1984) for which precise palynologic dates have not been previously reported. Eight carefully selected samples from these formations, provided by Dr. G.B. Glass, State Geologist of Wyoming, were processed for pollen by D.J. Nichols of the U.S Geological Survey. The results indicate that virtually the entire coal-bearing section of the Hanna Basin, a more than 8,150-foot-thick (2,480 m) sequence primarily composed of nonmarine siliciclastic rocks, is Paleocene in age (table 1).
Recent work by Cavaroc and others (1992) shows detailed palynostratigraphic biozones of the Ferris and Hanna Formations in the Hanna, Carbon, and Cooper Lake basins. The Ferris Formation in the Hanna Basin is as thick as 5,500 ft (1,676 m) and is dated as P1-P3 in age (early to early middle Paleocene) above the basal conglomeratic sandstone of the Ferris. The overlying Hanna Formation is as thick as 6,500 ft (1,981 m) and is dated as PrP6 in age (early-middle to late Paleocene)(Cavaroc and others, 1992). Zone P6 is thinner than P5 and is directly overlain by a thick carbonaceous shale (gyttja formed in a lake) dated as Eocene in age. In the Carbon Basin east of the Hanna Basin (fig. 3), the Ferris Formation is not present, and the Hanna Formation is as thick as 1,100 ft (335 m) and represents P4-P5 time (late-middle Paleocene-late Paleocene). Farther to the east-southeast in the Cooper Lake Basin, the Hanna Formation is as thick as 680ft (207m) and is dated as P5-P6
in age (late Paleocene).
Palynomorph dates and cross bed measurements (Ryan, 1977; Cavaroc and others, 1992) of the Ferris and Hanna Formations in the Hanna Basin area suggest that a northeastflowing fluvial system drained through the rapidly subsiding Hanna Basin from latest Cretaceous through P3 time (early-middle Paleocene). The outlet may have been in the
area of the present Shirley Basin. Provenance to the south may have been the western flank of the broad latest Cretaceous Front Range uplift. This fluvial system initially was in the form of high-gradient braided streams and evolved into low-gradient meandering-anastomosed streams. The thick Ferris coals, as thick as 30 ft (9 m), accumulated in low-lying mires of these low-gradient streams. The boundary (P3) between the Ferris and Hanna Formations is marked by conglomeratic sandstone found in east-flowing highgradient braided streams. These high-gradient streams evolved into a southeast-through-flowing low-gradient, meandering and anastomosed stream during P rP 6 time. The thick Hanna coals (as thick as 30ft [9 m]) accumulated in associated low-lying mires. Provenance shifted to the Granite, Seminoe, and Shirley Mountains in late Paleocene time.
The fluvial paleodrainage system, consisting of braided to meandering streams, flowed to the southeast from the Hanna Basin to the Carbon Basin during P4-P5 time (late middle Paleocene to early late Paleocene). The Carbon Basin was either a nondepositional or an erosional area in P1-P3 time, and it began to subside during P4 time. Thick Hanna coals (as much as 20ft [6 m]) in the Carbon Basin accumulated in low-lying mires of the braided and meandering fluvial systems.
The fluvial system drained to the southeast into and through the Cooper Lake Basin during P5-P6 time. A shift in dispersal of fluvial sediments from south to northeast in the Cooper Lake Basin developed during late P 5-P 6 time. Conglomerate and conglomeratic sandstone dispersed by alluvial fans from the Medicine Bow Range into the Cooper Lake Basin suggests that uplift of the hanging wall of the Arlington thrust (and thus thrusting) was occurring at this time.
Eocene rocks in the Hanna and Cooper Lake Basins are marked by thick carbonaceous shale and mudstone and a few coarse-grained, conglomeratic sandstone beds. Carbonaceous shale in the northern part of the Hanna Basin indicates gyttja or shallow lake and paludal deposition, whereas mudstone in the Cooper Lake Basin suggests a deeper lake deposit. The gyttja is overlain by burrowed
Table 1. Summary of results of palynologic studies of coal samples from the Ferris and Hanna Formations, Wyoming. [Palynologic analyses by D.J. Nichols; samples provided by Dr. Gary Glass, State Geologist, Wyoming Geological Survey. Bed designations are given, sampled intervals described, and relative positions in the sequence shown in Glass (1975) and Glass and Roberts (1984)]
Stratigraphic unit Bed Sample number
Hanna Formation 80 Hanna Formation 76 Hanna Formation Brooks Rider2
Ferris Formation 65 Ferris Formation 60 Ferris Formation 25 Ferris Formation 24
1Late but not latest Paleocene (D.J. Nichols, written commun., 1991). 2Near base of Hanna Formation.
74-24 75-14 75-14 75-16 77-6 77-14 74-24
Geologic age and zone
Late Paleocene, probably zone P5. Late Paleocene, probably zone P5. 1
Middle Paleocene, zone P3. Early Paleocene, probably zone P2. Early Paleocene, probably zone P2. Early Paleocene, possibly zone Pl. Early Paleocene, possibly zone Pl.

54 DEEP NATURAL GAS RESOURCES IN THE UNITED STATES
coarsening-upward mudstone, siltstone, and rippled sandstone beds. Scouring of the rippled sandstone by a channel sandstone indicates a delta front-distributary channel complex. This sequence is overlain by carbonaceous shale that contains fish remains indicating expansion of the lake. The lake deposit, in tum, is overlain by a coarseningupward delta-front deposit. Thus, during the early Eocene, the Hanna trough was transformed into a closed lacustrine basin, probably resulting in rapid subsidence and (or) rising of groundwater table above a broad alluvial floodplain.
Thus, infilling of the Hanna and associated basins and direction of dispersal of fluvial sediments were controlled by uplift of a south-southwestern source area (west flank of early Front Range uplift) during P 1-P3 time followed by uplift of an active northern source area (Granite-SeminoeShirley Mountains) during PrP5 time and succeeded by a southern source area (Medicine Bow Mountains) during P5-P6 time. The high ash and sulfur content in Hanna Basin coals resulted from erosion of Cretaceous marine finegrained sediments from nearby uplifts, from which detrital and soluton loads entered restricted fluvial pathways and were ponded, interacting with low-lying mires in the rapidly subsiding basin (Ellis and others, 1992). Ponding of these fine-grained sediments continued into the Eocene lake that extended from the Hanna to the Cooper Lake Basin, and during this time rapid subsidence also was accompanied by closure of the Hanna trough.
Twenty-five vitrinite samples from the No. 1 Hanna Unit well (fig. 3) have been analyzed by Ben Law of U.S. Geological Survey. This dry hole was drilled to a depth of 12,496 ft (3,809 m) but did not reach the base of the Ferris Formation. To a depth of almost 10,000 ft (3,048 m), vitrinite reflectance values are less than 0. 7 R0 percent. Below 10,000 ft, vitrinite values increase rapidly to a value of 1.23 Ra percent near the bottom of the hole at a depth of 12,485 ft (3,805 m). The high reflectance values near the base of the drill hole suggest that the more deeply buried marine Cretaceous rocks in the basin should yield thermogenic natural gas; however, only one small gas field, on the northwest flank of the basin, has been developed.
The Hanna Basin is surrounded by Laramide thrust faults that are imprecisely dated. The coal-bearing nonmarine sequence represented by the Hanna and Ferris Formations may represent the time of maximum thrust-related subsidence. This more than 12,000-foot (3,657 m)-thick Paleocene sequence (Cavaroc and others, 1992) may be corrected for compaction (Angevine and others, 1990). If an original mean porosity of 45 percent and a present mean porosity of 25 percent (both very rough estimates) are assumed, then a simple decompaction coefficient of 1.36 results. Using this coefficient to expand the presently known conservative thickness of at least 12,000 ft (3,657 m), more than 16,000 ft (4,974 m) of subsidence may have occurred during the Paleocene in the northern part of the Hanna Basin during a period of about 8.6 m.y., or roughly 1.9 ft (0.57 m)
per 103 years decompacted or 1.4 ft (0.425 m) per 103 years uncorrected for compaction. These values compare to Cenozoic subsidence rates in southern California in small pullapart basins of 2.3 ft/103 years (0.7 m/103 years) in the Eocene-Miocene and 3.3 ft/103 years (1.0 m/103 years) in the post-Miocene (Yeats, 1978), in which the extreme subsidence rates are driven by major strike-slip faulting. Representative tectonic subsidence histories are given for various types of basins by Angevine and others ( 1990, fig. 6.1 ); maximum subsidence rates for foreland basins range from 0.085 to 0.57 ft/103 years (0.02--0.17 m/103 years), whereas rates for strike-slip basins range from 0.5 to 2.18 ft/1 03 years (0.15--0.66 m/103 years). Clearly, anomalously high subsidence rates occurred in the Hanna Basin, well outside the average range for foreland basins but well within the range of rates typical of strike-slip related basins. The northern margin of the Hanna Basin is interpreted to represent the locus of a significant zone of latest Cretaceous to Paleocene accommodation (strike-slip) faulting at the northern margin of the zone of east-west Laramide shortening represented by the present Colorado Front Range and Laramie Range.
The sequence of tectonic events in the Hanna Basin region are as follows: first, development of a sequence of thick marine Upper Cretaceous rocks that trends east-west across southern Wyoming; second, partial isolation of the Hanna Basin as a subarea of the Greater Green River Basin by early Paleocene growth of the Granite Mountains-Shirley Mountains transpressive zone to the north; third, southward tilting, probably in mid-Paleocene time concurrent with growth of the Sweetwater uplift and initial development of the Shirley thrust fault along the northern margin of the basin. The fourth and final phase of structural growth, uplift of the Medicine Bow Mountains and Rawlins uplift concurrent with development of the Arlington thrust fault, probably began in late Paleocene time. The inferred geometry (fig. 4) of the northern margin of the basin suggests that major gas accumulations may be present in the undrilled northern part of the basin beneath the Shirley thrust fault, provided that gas generation continued during and after thrusting. Seismic data (Kaplan and Skeen, 1985) do not clearly define the structure of the northern margin of the Hanna Basin. Much gas may remain to be found in deep Rocky Mountain foreland basins if the scenario described here is correct and if this type of tilting prior to thrusting has occurred in other areas. The high vitrinite reflectance values at depths greater than 10,000 ft (3,048 m) suggest that the deeper Cretaceous units should also yield natural gas; however, only one small gas field has been developed. Very little deep drilling has been conducted in the Hanna Basin, unlike other basins to the west and north, and substantial amounts of deep gas may yet be found in this basin.
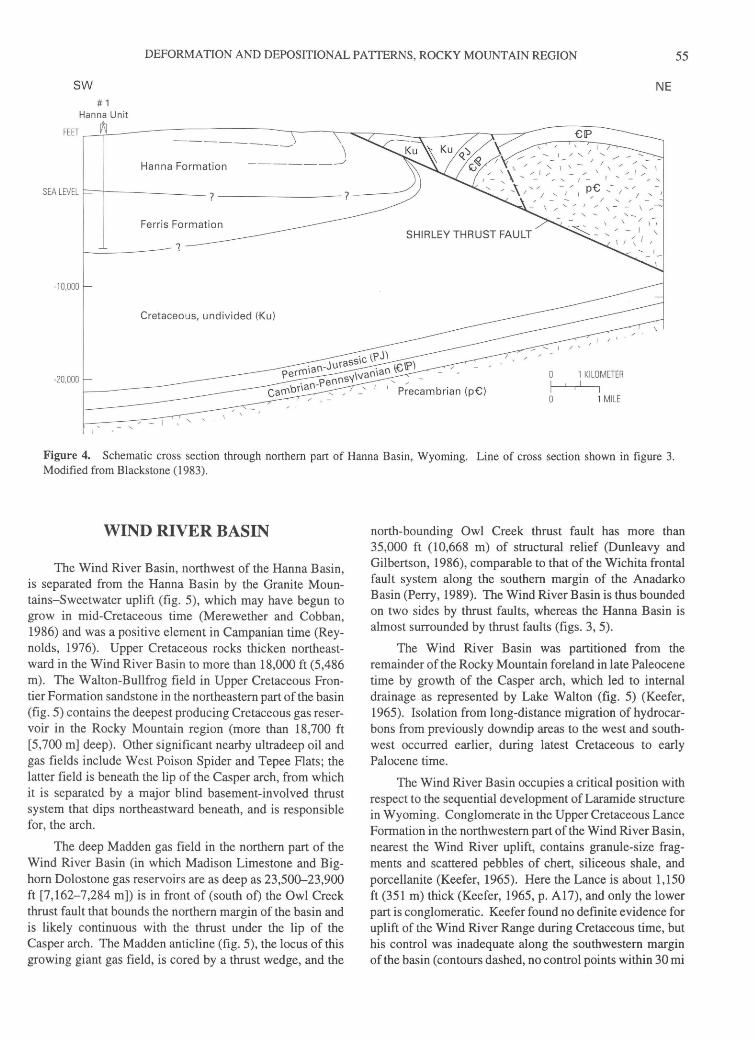
DEFORMATION AND DEPOSITIONAL PATIERNS, ROCKY MOUNTAIN REGION 55
sw # 1
Hanna Unit
NE
FEET ,--~~----------,--'\-..;;;;;::---r-----r------;;:r---y--:;:::::,--
Hanna Formation
SEA LEVEL p---r--------? --------- 7 __ _
Ferris Formation SHIRLEY THRUST FAULT
1 -
-1 0,000
Cretaceous, undivided (Ku)
-20,000 1 KILO METER
I
1 MILE
Figure 4. Schematic cross section through northern part of Hanna Basin, Wyoming. Line of cross section shown in figure 3. Modified from Blackstone (1983).
WIND RIVER BASIN
The Wind River Basin, northwest of the Hanna Basin, is separated from the Hanna Basin by the Granite Mountains-Sweetwater uplift (fig. 5), which may have begun to grow in mid-Cretaceous time (Merewether and Cobban, 1986) and was a positive element in Campanian time (Reynolds, 1976). Upper Cretaceous rocks thicken northeastward in the Wind River Basin to more than 18,000 ft (5,486 m). The Walton-Bullfrog field in Upper Cretaceous Frontier Formation sandstone in the northeastern part of the basin (fig. 5) contains the deepest producing Cretaceous gas reservoir in the Rocky Mountain region (more than 18,700 ft [5,700 m] deep). Other significant nearby ultradeep oil and gas fields include West Poison Spider and Tepee Flats; the latter field is beneath the lip of the Casper arch, from which it is separated by a major blind basement-involved thrust system that dips northeastward beneath, and is responsible for, the arch.
The deep Madden gas field in the northern part of the Wind River Basin (in which Madison Limestone and Bighorn Dolostone gas reservoirs are as deep as 23,500-23,900 ft [7,162-7,284 m]) is in front of (south of) the Owl Creek thrust fault that bounds the northern margin of the basin and is likely continuous with the thrust under the lip of the Casper arch. The Madden anticline (fig. 5), the locus of this growing giant gas field, is cored by a thrust wedge, and the
north-bounding Owl Creek thrust fault has more than 35,000 ft (10,668 m) of structural relief (Dunleavy and Gilbertson, 1986), comparable to that of the Wichita frontal fault system along the southern margin of the Anadarko Basin (Perry, 1989). The Wind River Basin is thus bounded on two sides by thrust faults, whereas the Hanna Basin is almost surrounded by thrust faults (figs. 3, 5).
The Wind River Basin was partitioned from the remainder of the Rocky Mountain foreland in late Paleocene time by growth of the Casper arch, which led to internal drainage as represented by Lake Walton '(fig. 5) (Keefer, 1965). Isolation from long-distance migration of hydrocarbons from previously downdip areas to the west and southwest occurred earlier, during latest Cretaceous to early Palocene time.
The Wind River Basin occupies a critical position with respect to the sequential development of Laramide structure in Wyoming. Conglomerate in the Upper Cretaceous Lance Formation in the northwestern part of the Wind River Basin, nearest the Wind River uplift, contains granule-size fragments and scattered pebbles of chert, siliceous shale, and porcellanite (Keefer, 1965). Here the Lance is about 1,150 ft (351 m) thick (Keefer, 1965, p. A 17), and only the lower part is conglomeratic. Keefer found no definite evidence for uplift of the Wind River Range during Cretaceous time, but his control was inadequate along the southwestern margin ofthe basin (contours dashed, no control points within 30 mi

43°
109°
- / ' '/ ' I ' !__ / /
....._ , / I / \ / ,_ -
\ 1
I I
/ - I \ ' - '
I , I I I I '
'-I /'-.1 ~ -/ '__--/ ___ 1;~'
'//l:;- 1 ~/'1 ()I// ' - -/' I-' - ~- -
'-./ -/'/'I l--:.'
1 I _' '_ I / 1 , / ~ ::
'/ '/'/,-_ (/./ ' - \ /- / ' ;- / ' - / ~ .
/\1 ,, /-1 ~\ .. -I \ ' - ' / I /' I I 1
1,1 11 11, 1
,1,
_20 aoo ~ ~r
"-0-t:.
BIGHORN BASIN
"-!....~<'lt. ""-!..&;,.
"<~;t WIND RIVER BASIN '7. ""-.Or<' 0
oo/'l ~'% ......-:: ~oo v --- 0 \"2. ~-~0
<$)-%~/-- .
\
'0<'~n ,....--/
H~~~~N ~ \ ~Ca~
107°
/"-.1'-__--/'- __ I; 1
I "-. I \ - \ /1/ I,
f'- _..., ,-, ,-, '/ -/,
/'1 !""-!_\// // ,,.. -,/,/
/ \ ,_ \ / / ' --1 I \ /II ''
/ - I \
EXPLANATION
L___j__J_ Basin margin-4,000-5,000 ft above sea level ...____.
~ Thrust fault-Sawteeth on upper plate
Anticline-Showing direction of plunge
0 10 20 30 MILES
0 10 20 30 40 KILOMETERS
Figure 5. Tectonic map of Wind River Basin region, Wyoming. Selected contours (in feet) for top of Pennsylvanian and Permian Minnelusa and Phosphoria Formations. ET, Emmigrant Trail thrust fault; LDA, Little Dome anticline; MA, Madden anticline; PSW, West Poison Spider field; TF, Tepee Flat field; WBU, Walton-Bullfrog field.
V1 01
tJ rn "'0
z
~ :::0 ~ l' a ~ C/.l
:::0 tTl C/.l 0 c :::0 n tTl C/.l
z ~ ::r: tTl c z ~ tJ C/.l
~ C/.l
DEFORMATION AND DEPOSITIONAL PATTERNS, ROCKY MOUNTAIN REGION 57
[50 km] of the northeastern flank of the Wind River Mountains, his fig. 9). The above described conglomerate in the lower part of the Lance was probably eroded from Frontier and older Mesozoic rocks exposed on the growing Wind River uplift.
Murphy and Love (1958) inferred that a broad, domal uplift occurred in latest Cretaceous time on the southeastern flank of the Wind River Basin in the area of the present Granite Mountains, and Keefer (1965) made similar conclusions. In a summary of the Laramide history of the Granite Mountains area, Love (1971) indicated that uplift of this area did not begin until latest Cretaceous time and culminated in the earliest Eocene time. He suggested that the early phase of this uplift may have been coextensive with that of the south-central part of the Wind River Range.
Investigations by Flores and Keighin (1993), Flores and others (1993), and Nichols and Flores (1993) suggest that the Wind River Range was an active source area about P3 (early middle Paleocene) time. Flores and Keighin (1993) described conglomerate and conglomeratic sandstone as thick as 500ft (152m) in the upper part of the lower member of the Fort Union Formation. The conglomerate is made up predominantly of quartzite probably derived from Precambrian-early Paleozoic metaquartzite. Paleocurrent measurements from clast imbrication and trough crossbeds show a west-northwest provenance. Flores and Keighin (1993) suggested that these rocks were deposited in eastsoutheast-flowing braided streams along a structural paleovalley that occupied the Shotgun Butte area. They also reported that the overlying Shotgun Member (P4-P5 age) (Nichols and Flores, 1993) in the same area was deposited in shortheaded meandering and anastomosed streams that drained into Lake Waltman.. Flores and others (1993) described Fort Union conglomerates dominated by quartzite in the Hudson area at the southwestern part of the Wind River Basin (fig. 5). These Fort Union conglomerates are P3
in age or older (early middle Paleocene). Underlying coals of the Mesaverde Formation are Campanian in age (D.J. Nichols, written commun., 1993). Paleocurrent measurements from clast imbrication of the conglomerate and trough crossbeds of the conglomeratic sandstone show northeastward dispersal of braided streams, a dispersal direction that suggests uplift of the Wind River arch at this time. In the Hudson area a high may have existed on which an incised paleovalley was developed (Flores and others, 1993). This high, which extended eastward and was flanked by the Emmigrant Trail thrust fault, was an area of net erosion and (or) nondeposition during Maestrichtian to early Paleocene time prior to deposition of the Fort Union conglomerates. A northwest line from the Emmigrant Trail thrust fault to southwest of Little Dome anticline (Flores and Keighin, 1993; Flores and others, 1993) represents a hinge line east of which was a rapidly subsiding subbasin of the western Wind River Basin proper. Investigation of the Fort Union conglomerates and conglomeratic sandstone by Flores and
others (1992) at Castle Garden (fig. 5) on the south-central flank of the Wind River Basin indicates the appearance of granitic pebbles, cobbles, and boulders by P3 time (early middle Paleocene). Paleocurrent measurements of trough crossbeds show northeastward dispersal associated with a meandering fluvial system. This dispersal direction suggests that the sediments were derived from the Granite Mountains. The age of first appearance of igneous detritus coincides with the P3 biozone determined for dispersal of the Hanna Formation in the Hanna Basin from the SeminoeGranite Mountains and Shirley Mountains. An increase in amount of conglomeratic boulders during P3-P6 time reflect continued uplift of the Granite Mountains, which provided sediments into Lake Waltman. Nichols and Flores (1993) suggested that the PrP6 arkosic conglomeratic sandstone at Castle Garden is in part correlative with the P5-P6 Waltman Shale Member of the Fort Union Formation in the northeastern part of the basin. The Waltman Shale Member represents deposition in a lacustrine setting, as a result of rapid subsidence probably influenced by the Owl Creek thrust fault (transpressional or strike-slip) (Moizer, 1992; Paylor, 1992) and closure of the basin by the Casper arch. The Waltman Shale Member is as thick as 3,000 ft (914 m). Lake Waltman was fed by shortheaded meandering and anastomosed streams and associated fan deltas. The Waltman Shale Member served as source rock for high-paraffin oils in the Fort Union reservoir sandstones (Palacas and others, 1992); however, gas and condensate are the most common hydrocarbons in reservoir sandstones in the Fort Union Formation (Wyoming Geologic Association, 1989).
Keefer (1965) concluded that, although the Cretaceous-Tertiary boundary in the Wind River Basin is generally conformable, extensive downwarping occurred at this time along the present -day northern margin of the basin. Along the northeastern margin of the Wind River Basin, Keefer (1965) observed that the oldest conglomerate zones are in the lower Eocene Indian Meadows Formation. The oldest arkosic conglomerate in this part of the basin is at the base of the Lost Cabin Member of the overlying Eocene Wind River Formation. The presence of extensive lacustrine sediments, which first appeared in the Wind River Basin in late Paleocene time (Nichols and Ott, 1978; Phillips, 1983), is indicative of internal drainage that likely reflects initial growth of the Casper arch and the Owl Creek uplift (fig. 1), which closed the outlets of the basin.
Keefer (1965) estimated that more than 8,800 ft (2,682 m) of middle to late Paleocene uplift occurred in the Owl Creek Mountains and that almost 10,500 ft (3,200 m) of subsidence occurred in the adjacent Wind River Basin; these amounts indicate a cumulative vertical separation (uplift+subsidence) rate of slightly more than 4 ft/103 years (1.2 m/103 years). Keefer estimated that an additional8,500 ft (2,591 m) of uplift and an additional5,600 ft (1,707 m) of subsidence occurred in the early Eocene, yielding a cumulative vertical separation rate of almost 4 ft/103 years (1.2 m/

58 DEEP NATURAL GAS RESOURCES IN THE UNITED STATES
103 years). He showed that thrust faults of the Casper arch cut the lower Eocene Indian Meadows Formation and that the rocks deformed by this thrusting are erosionally truncated by the overlying lower Eocene Wind River Formation. The relations date the cessation of major Laramide deformation in the area as early Eocene. These rates are consistent with relatively late Laramide strike-slip-dominated transpressional deformation along the northern margin of the Wind River Basin, similar to the earlier Laramide transpressional boundary along the northern margin of the Hanna Basin to the south. Structurally trapped deep gas may still be discovered north and northwest of the Madden anticline in the northern part of the Wind River Basin.
REFERENCES CITED
Angevine, C.L., Heller, P.L., and Paola, C., 1990, Quantitative basin modeling: American Association of Petroleum Geologists Continuing Education Course Note Series 32, 133 p.
Bayley, R.W., and Muehlberger, W.R., 1968, Basement rock map of the United States: U.S. Geological Survey, scale 1:2,500,000.
Beckwith, R.H., 1941, Structure of the Elk Mountain district, Carbon County, Wyoming: Geological_ Society of America Bulletin, v. 52, p. 1445-1486.
Blackstone, D.L., Jr., 1983, Laramide compressional tectonics, southeastern Wyoming: Contributions to Geology, University of Wyoming, v. 22, p. 1-38.
---1990, Precambrian basement map of Wyoming-Outcrop and structural configuration, revised, 1990: Geological Survey of Wyoming Map Series 27, scale 1: 1 ,000,000.
Cavaroc, V.V., Flores, R.M., Nichols, D.J., and Perry, W.J., 1992, Paleocene tectono-facies relationships between the Hanna, Carbon, and Cooper Lake Basins, Wyoming [abs.]: American Association of Petroleum Geologists Bulletin, v. 76, p. 1257.
Dobbin, C.E., Bowen, C.F., and Hoots, H.W., 1929, Geology and coal and oil resources of the Hanna and Carbon Basins, Carbon County, Wyoming: U.S. Geological Survey Bulletin 804, 88 p., 27 plates.
Dunleavy, J.M., and Gilbertson, R.L., 1986, Madden anticline-Growing giant, in Noll, J.H., and Doyle, K.M., eds., Rocky Mountain oil and gas fields: Wyoming Geological Association Symposium, 1986, p. 107-157.
Ellis, M.S., Stricker, G.D., and Flores, R.M., 1992, Laramide deformation fronts-Effects on coal quality in Paleocene coal basins, northern Rocky Mountain region [abs.]: American Association of Petroleum Geologists Bulletin, v. 76, p. 1258.
Flores, R.M., Clark, A.C., and Keighin, C.W., 1993, Paleovalley conglomerates of the Fort Union Formation and their aquifer potential in the western Wind River Basin, in Keefer, W.R., Metzger, W.J., and Godwin, L.H., eds., Oil and gas and other resources of the Wind River Basin, Wyoming: Wyoming Geological Association Special Symposium, 1993, p. 143-162.
Flores, R.M., and Keighin, C.W., 1993, Reservoir anisotropy and facies stratigraphic framework in the Fort Union Formation, western Wind River Basin, in Keefer, W.R., Metzger, W.J., and Godwin, L.H., eds., Oil and gas and other resources of the
Wind River Basin, Wyoming: Wyoming Geological Association Special Symposium, 1993, p. 121-141.
Flores, R.M., Keighin, C.W., and Nichols, D.J., 1992, Sedimentology, conglomerate petrology, and palynostratigraphy of the Fort Union Formation (Paleocene), Castle Gardens, Wind River Basin, Wyoming, in Sundell, K.A., and Anderson, T.C., eds., Road log volume for rediscover the Rockies: American Association of Petroleum Geologists and Society of Sedimentary Geology, p. 21-27.
Flores, R.M., Roberts, S.B., Perry, W.J., Jr., and Nichols, D.J., 1991, Evolution of Paleocene depositional systems and coal basins in a tectonic continuum, Rocky Mountain region: Geological Society of America Abstracts with Programs, v. 23, no. 4, p. 22.
Gill, J.R., Merewether, E.A., and Cobban, W.A., 1970, Stratigraphy and nomenclature of some Upper Cretaceous and Lower Tertiary rocks in south-central Wyoming: U.S. Geological Survey Professional Paper 667, 53 p.
Glass, G.B., 1975, Analyses and measured sections of 54 Wyoming coal samples (collected in 1974): Geological Survey of Wyoming Report of Investigations 11, 219 p.
Glass, G.B., and Roberts, J.T., 1984, Analyses and measured sections of 25 coal samples from the Hanna Coal Field of south-central Wyoming (collected between 1975 and 1979): Geological Survey of Wyoming Report of Investigations 27, 104p.
Haley, J.C., Dyman, T.S., and Perry, W.J., Jr., 1991, The Frontier Formation-A record of mid-Cretaceous foreland uplift in southwestern Montana: Geological Society of America Abstracts with Programs, v. 23, no. 4, p. 29.
Hettinger, R.D., Honey, J.G., and Nichols, D.J., 1991, Chart showing correlations of Upper Cretaceous Fox Hills Sandstone and Lance Formation, and lower Tertiary Fort Union, Wasatch, and Green River Formations, from the eastern flank of the Washakie Basin to the southeastern part of the Great Divide Basin, Wyoming: U.S. Geological Survey Miscellaneous Investigations Series 1-2151.
Hettinger, R.D., and Kirschbaum, M.A., 1991, Chart showing correlations of some Upper Cretaceous and lower Tertiary rocks, from the east flank of the Washakie Basin to the east flank of the Rock Springs uplift: U.S. Geological Survey Miscellaneous Investigations Series 1-2152.
Kaplan, S.S., and Skeen, R.C., 1985, North-south regional seismic profile of the Hanna Basin, Wyoming, in Gries, R.R., and Dyer, R.C., eds., Seismic exploration of the Rocky Mountain region: Rocky Mountain Association of Geologists and Denver Geophysical Society, p. 219-224.
Keefer, W.R., 1965, Stratigraphy and geologic history of the uppermost Cretaceous, Paleocene, and lower Eocene rocks in the Wind River Basin, Wyoming: U.S. Geological Survey Professional Paper 495-A, 77 p.
Keighin, C.W., Flores, R.M., and Perry, W.J., Jr., 1991, Provenance tectonism and petrofacies in Paleocene sediments, northern Rocky Mountains: Geological Society of America Abstracts with Programs, v. 23, no. 5, p. A68.
Kirschbaum, M.A., and Nelson, S.N., 1988, Geologic history and palynologic dating of Paleocene deposits, western Rock Springs uplift, Sweetwater County, Wyoming: Contributions to Geology, University of Wyoming, v. 26, no. 1, p. 21-28.
DEFORMATION AND DEPOSITIONAL PATTERNS, ROCKY MOUNTAIN REGION 59
Kluth, C.F., and Nelson, S.N., 1988, Age of the Dawson Arkose, southwestern Air Force Academy, Colorado, and implications for the uplift history of the Front Range: The Mountain Geologist, v. 25, p. 29-35.
LeFebre, G.B., 1988, Tectonic evolution of Hanna Basin, Wyoming-Laramide block rotation in the Rocky Mountain foreland: Laramie, Wyo., University of Wyoming Ph. D. dissertation, 240 p.
Love, J.D., 1971, Relation of Cenozoic geologic events in the Granite Mountains area, central Wyoming, to economic deposits, in Renfro, A.R., ed., Symposium on Wyoming tectonics and their economic significance: Wyoming Geological Association Annual Field Conference, 23rd, Guidebook, p. 74-80.
Merewether, E.A., and Cobban, W.A., 1986, Biostratigraphic units and tectonism in the mid-Cretaceous foreland of Wyoming, Colorado, and adjoining areas, in Peterson, J.A., ed., Paleotectonics and sedimentation: American Association of Petroleum Geologists Memoir 41, p. 443-468.
Moizer, P.C., 1992, Wind River Canyon, in Sundell, K.A., and Anderson, T.C., eds., Road log volume for rediscover the Rockies: American Association of Petroleum Geologists and Society of Sedimentary Geology, p. 29-31.
Murphy, J.P., and Love, J.D., 1958, Tectonic development of the Wind River Basin, central Wyoming [abs.]: American Association of Petroleum Geologists, Rocky Mountain Section, 1958, p. 126-127.
Nichols, D.J., and Flores, R.M., 1993, Palynostratigraphic correlation of the Fort Union Formation (Paleocene) in the Wind River Reservation, Wind River Basin, in Keefer, W.R., Metzger, W.J., and Godwin, L.H., eds., Oil and gas and other resources of the Wind River Basin, Wyoming: Wyoming Geological Association Special Symposium, 1993, p. 175-189.
Nichols, D.J., Perry, W.J., Jr., and Brown, J.L., 1991, Palynostratigraphy in reconstruction of tectonic history and basin evolution, western North America [abs.]: International Symposium on Origin, Sedimentation, and Tectonics of Late Mesozoic to Early Cenozoic Sedimentary Basins at the Eastern Margin of the Asian Continent and Workshop of IGCP 245-Nonmarine Cretaceous Correlations, Fukuoka, Japan, Program and Abstracts, p. 56.
Nichols, D.J., and Ott, H.L., 1978, Biostratigraphy and evolution of the Momipites-Caryapollenites lineage in the Early Tertiary in the Wind River Basin, Wyoming: Palynology, v. 2, p. 93-112.
Palacas, J.G., Flores, R.M., Keighin, C.W., and Anders, D.E., 1992, Characterization and source of oil impregnating a sandstone in the Fort Union Formation, Castle Garden area, Wind River Basin, Wyoming [abs.]: American Association of Petroleum Geologists Bulletin, v. 76, p. 1267.
Paylor, E. D., 1992, Discussion of the intersection of Phloy Mountain thrust zone and Stagner fault, in Sundell, K.A., and Anderson, T.C., eds., Road log volume for rediscover the Rockies:
American Association of Petroleum Geologists and Society of Sedimentary Geology, p. 45-46.
Perry, W.J., Jr., 1989, Structural settings of deep natural gas accumulations in the conterminous United States, Appendix B., in Rice, D.D., ed., Distribution of natural gas and reservoir properties in the continental crust of the United States: Final Report for GRI Contract 5087-260-1607, U.S. Department of Commerce-NTIS Report 89/0188, p. 62-72.
Perry, W.J., Jr., Dyman, T.S., and Nichols, D.J., 1990, Sequential Laramide deformation of the Rocky Mountain foreland, in Thorman, C.H., ed., Workshop on application of structural geology to mineral and energy resources of the Central Region: U.S. Geological Survey Open-File Report 90-0508, p. 11-12.
Perry, W.J., Jr., Nichols, D.J., Dyman, T.S., and Haley, C.J., 1992, Sequential Laramide deformation in Montana and Wyoming, in Thorman, C.H., ed., Application of structural geology to mineral and energy resources of the central and western United States: U.S. Geological Survey Bulletin 2012, p. C1-C14.
Perry, W.J., Jr., Weaver, J.N., Flores, R.M., Roberts, S.B., and Nichols, D.J., 1991, Sequential Laramide deformation in Montana and Wyoming: Geological Society of America Abstracts with Programs, v. 23, no. 4, p. 56.
Phillips, S.T., 1983, Tectonic influence on sedimentation, Waltman Member, Fort Union Formation, Wind River Basin, Wyoming, in Lowell, J.D., and Gries, R., eds., Rocky Mountain foreland basins and uplifts: Denver, Rocky Mountain Association of Geologists, p. 149-160.
Reynolds, M.W., 1976, Influence of recurrent Laramide structural growth on sedimentation and petroleum accumulation, Lost Soldier area, Wyoming: American Association of Petroleum Geologists Bulletin, v. 60, p. 12-33.
Roberts, S.B., Flores, R.M., Perry, W.J., Jr., and Nichols, D.J., 1991, Preliminary paleogeographic interpretations of Paleocene coal basins, Rocky Mountain region: Geological Society of America Abstracts with Programs, v. 23, no. 4, p. 87.
Ryan, J.D., 1977, Late Cretaceous and early Tertiary provenance and sediment dispersal, Hanna and Carbon Basins, Carbon County, Wyoming: Geological Survey of Wyoming Preliminary Report 16, 17 p.
Thomas, H.D., 1949, The geological history and geological structure of Wyoming: Wyoming Geological Survey Bulletin 42, 28 p.
Wallace, A.R., 1988, Comment on "Age of the Dawson Arkose, southwestern Air Force Academy, Colorado, and implications for the uplift history of the Front Range": The Mountain Geologist, v. 25, p. 37-38.
Wyoming Geological Association, 1989, Wyoming oil and gas fields symposium, Bighorn and Wind River Basins: Casper, Wyoming Geological Association, 555 p.
Yeats, R.S., 1978, Neogene acceleration of subsidence rates in southern California: Geology, v. 6, p. 456-460.


Initial Potential Test Data From Deep Wells in the United States
By C.W. Spencer and Craig J. Wandrey
GEOLOGIC CONTROLS OF DEEP NATURAL GAS RESOURCES IN THE UNITED STATES
U.S. GEOLOGICAL SURVEY BULLETIN 2146-F
UNITED STATES GOVERNMENT PRINTING OFFICE, WASHINGTON: 1997
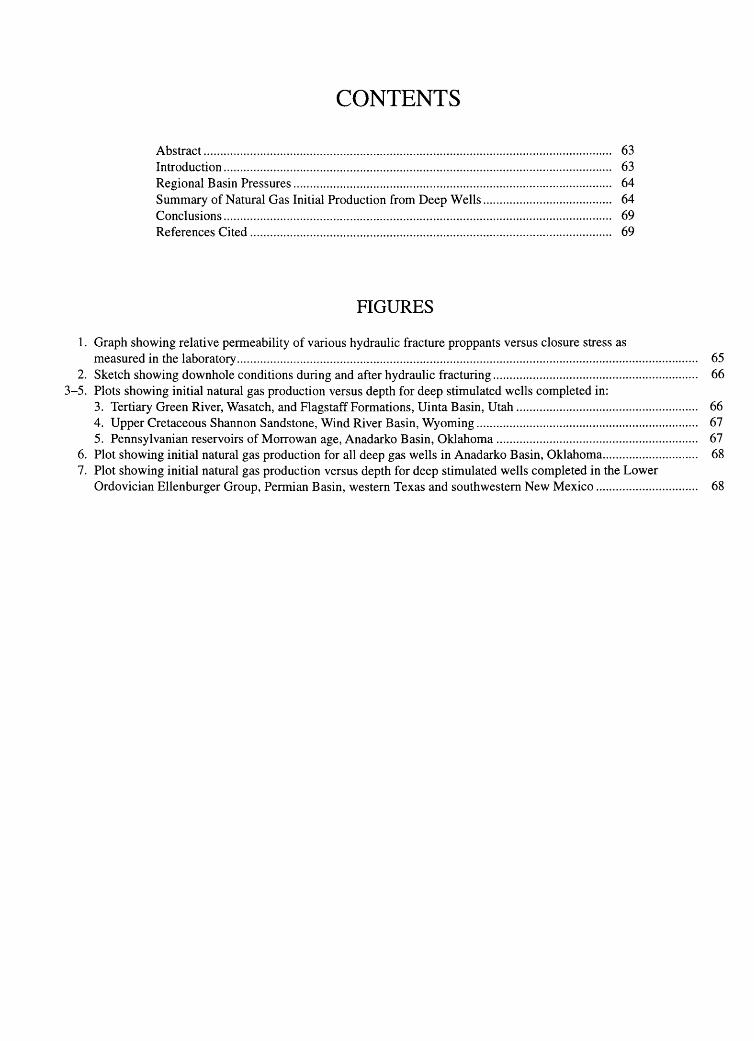
CONTENTS
Abstract........................................................................................................................... 63 Introduction..................................................................................................................... 63 Regional Basin Pressures................................................................................................ 64 Summary of Natural Gas Initial Production from Deep Wells....................................... 64 Conclusions..................................................................................................................... 69 References Cited . . . . . . . . . .. . . . . .. . . . . . . .. . . .. .... .. ........... .. ........ .... ......... ............. .. .. ..... ... . . . . ......... .. 69
FIGURES
1. Graph showing relative permeability of various hydraulic fracture proppants versus closure stress as measured in the laboratory........................................................................................................................................... 65
2. Sketch showing downhole conditions during and after hydraulic fracturing.............................................................. 66 3-5. Plots showing initial natural gas production versus depth for deep stimulated wells completed in:
3. Tertiary Green River, Wasatch, and Flagstaff Formations, Uinta Basin, Utah....................................................... 66 4. Upper Cretaceous Shannon Sandstone, Wind River Basin, Wyoming................................................................... 67 5. Pennsylvanian reservoirs of Morrowan age, Anadarko Basin, Oklahoma............................................................. 67
6. Plot showing initial natural gas production for all deep gas wells in Anadarko Basin, Oklahoma............................. 68 7. Plot showing initial natural gas production versus depth for deep stimulated wells completed in the Lower
Ordovician Ellenburger Group, Permian Basin, western Texas and southwestern New Mexico............................... 68
Initial Potential Test Data From Deep Wells in the United States
By C.W. Spencer and Craig J. Wandrey
ABSTRACT
A study was made of initial potential (IP) test data and well pressures from deep(> 15,000 ft, >4,572 m) wells in the United States. Basinwide, pressures are above normal in the deep parts of the Uinta, Wind River, and Greater Green River basins. Pressures also are above normal in the Anadarko, Permian, and Gulf Coast basins.
The initial potential data were plotted in order to compare hydraulically fractured or acidized wells and unstimulated wells. It is well known that low-permeability shallow (<10,000 ft, <3,050 m) wells generally show significant increases in IPs when stimulated. However, we found that deep gas wells do not show consistent increases when stimulated. Variations in natural fractures and variations in matrix permeabilities are two significant factors but also deep, hot wells do not seem to respond well to hydraulic fracturing because of the high treatment pressures needed, degradation of fracturing gels and the need for long propped fractures in low-permeability formations. Crushing of the proponent used in artificial fracturing is also one of the factors decreasing the effectiveness of this stimulation method.
INTRODUCTION
In this paper, we briefly summarize the distribution of reservoir pressures and show initial production rates from deep natural gas wells in the United States compiled from computerized data files. We present these data in order to better predict reservoir behavior in deep reservoirs and to begin to explain the causes of the differences in behavior.
Understanding deep (> 15,000 ft, >4,572 m) reservoir pressures is important because (1) abnormally high pore pressure (>0.55 psilft, 12.44 kPa/m) may reduce the rates of porosity and permeability loss with increasing burial depth and (2) gas reservoirs having high pore pressure will have more gas in place than low-pressure reservoirs at the same
temperature and porosity owing to the high compressibility of natural gas. Shallow ( <8,000 ft, <2,400 m) reservoirs are usually normally pressured (0.465 psilft, 10.52 kPa/m) or underpressured (<0.43 psi/ft, 9.73 kPa/m), whereas deep (> 15,000 ft) hot reservoirs may have normal to above normal pressures. In order to determine the general distribution of abnormally high pressures and predict their occurrence in undrilled areas, it is helpful to consider possible causes of high pore pressures.
No single cause can adequately explain all occurrences of above normal pressures; however, most proposed mechanisms require that reservoirs be semi-isolated or fairly well sealed in order to maintain abnormal pressure. Some of the more commonly accepted causes of overpressuring are dewatering of shales owing to compaction, claymineral transformations that release water, and aquathermal pressuring caused by thernial expansion of water.
The physical dewatering of clayey sediments such as shale by compaction caused by weight of overburden is a widely accepted mechanism of overpressuring (Dickenson, 1953; Morgan and others, 1968; Chapman, 1980; Chiarelli and Duffaud, 1980). This type of overpressuring is most likely in depocenters characterized by geologically young, rapidly deposited sediments. Diagenetic alteration of smectite-bearing shale and claystone to a more stable mixedlayer illite-smectite or illitic shale also releases water and is a popular mechanism to explain overpressuring in the Gulf Coast Basin ofthe United States (Powers, 1967; Burst, 1969; Bruce, 1984 ); however, Hunt and others (1994) recently concluded that gas generation is a major cause of deep Gulf Coast overpressuring.
Aquathermal pressuring was proposed by Barker (1972) as the cause of some of the high pore pressure along the northern coast of the Gulf of Mexico. In Barker's model, the reservoirs must be essentially isolated from pressure bleed-off. If the temperature of a reservoir rock enclosed in excellent seals is increased, the thermal expansion of pore water will cause an increase in reservoir pressure. Magara (1975) suggested that aquathermal pressuring is responsible for reservoir pressures in the Gulf Coast that exceed the
63
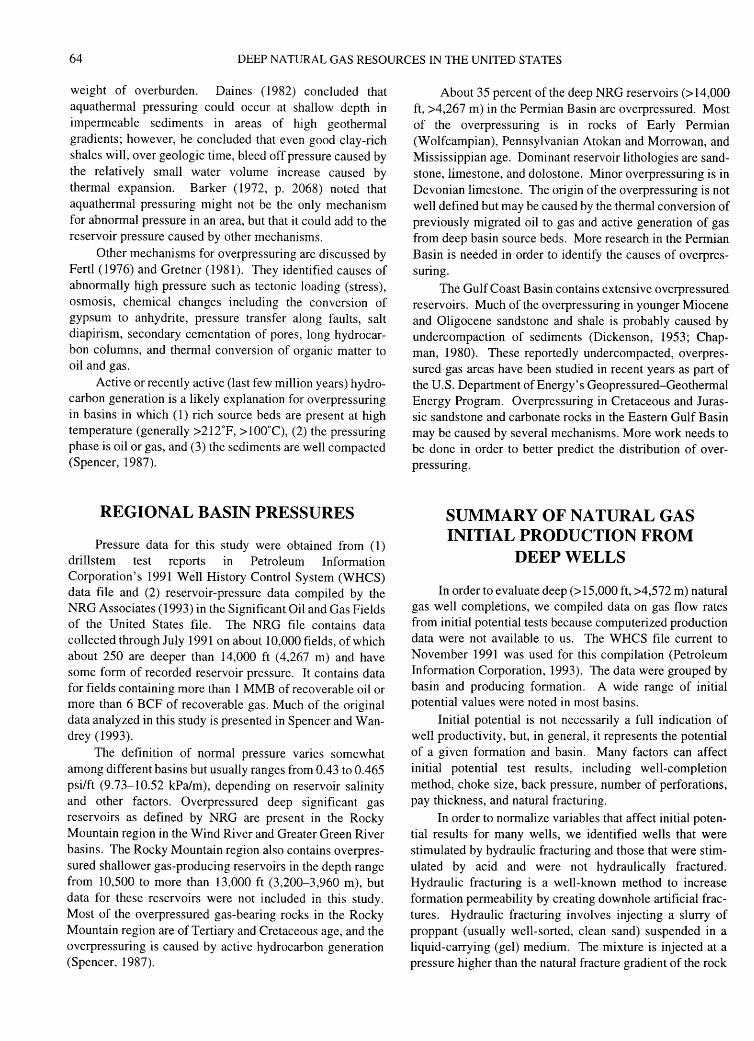
64 DEEP NATURAL GAS RESOURCES IN THE UNITED STATES
weight of overburden. Daines (1982) concluded that aquathermal pressuring could occur at shallow depth in impermeable sediments in areas of high geothermal gradients; however, he concluded that even good clay-rich shales will, over geologic time, bleed off pressure caused by the relatively small water volume increase caused by thermal expansion. Barker (1972, p. 2068) noted that aquathermal pressuring might not be the only mechanism for abnormal pressure in an area, but that it could add to the reservoir pressure caused by other mechanisms.
Other mechanisms for overpressuring are discussed by Fertl (1976) and Gretner (1981). They identified causes of abnormally high pressure such as tectonic loading (stress), osmosis, chemical changes including the conversion of gypsum to anhydrite, pressure transfer along faults, salt diapirism, secondary cementation of pores, long hydrocarbon columns, and thermal conversion of organic matter to oil and gas.
Active or recently active (last few million years) hydrocarbon generation is a likely explanation for overpressuring in basins in which ( 1) rich source beds are present at high temperature (generally >212°F, >100°C), (2) the pressuring phase is oil or gas, and (3) the sediments are well compacted (Spencer, 1987).
REGIONAL BASIN PRESSURES
Pressure data for this study were obtained from ( 1) drillstem test reports in Petroleum Information Corporation's 1991 Well History Control System (WHCS) data file and (2) reservoir-pressure data compiled by the NRG Associates (1993) in the Significant Oil and Gas Fields of the United States file. The NRG file contains data collected through July 1991 on about 10,000 fields, of which about 250 are deeper than 14,000 ft ( 4,267 m) and have some form of recorded reservoir pressure. It contains data for fields containing more than 1 MMB of recoverable oil or more than 6 BCF of recoverable gas. Much of the original data analyzed in this study is presented in Spencer and Wandrey (1993).
The definition of normal pressure varies somewhat among different basins but usually ranges from 0.43 to 0.465 psi/ft (9.73-10.52 kPa/m), depending on reservoir salinity and other factors. Overpressured deep significant gas reservoirs as defined by NRG are present in the Rocky Mountain region in the Wind River and Greater Green River basins. The Rocky Mountain region also contains overpressured shallower gas-producing reservoirs in the depth range from 10,500 to more than 13,000 ft (3,200-3,960 m), but data for these reservoirs were not included in this study. Most of the overpressured gas-bearing rocks in the Rocky Mountain region are of Tertiary and Cretaceous age, and the overpressuring is caused by active hydrocarbon generation (Spencer, 1987).
About 35 percent of the deep NRG reservoirs (> 14,000 ft, >4,267 m) in the Permian Basin are overpressured. Most of the overpressuring is in rocks of Early Permian (Wolfcampian), Pennsylvanian Atokan and Morrowan, and Mississippian age. Dominant reservoir lithologies are sandstone, limestone, and dolostone. Minor overpressuring is in Devonian limestone. The origin of the overpressuring is not well defined but may be caused by the thermal conversion of previously migrated oil to gas and active generation of gas from deep basin source beds. More research in the Permian Basin is needed in order to identify the causes of overpressuring.
The Gulf Coast Basin contains extensive overpressured reservoirs. Much of the overpressuring in younger Miocene and Oligocene sandstone and shale is probably caused by undercompaction of sediments (Dickenson, 1953; Chapman, 1980). These reportedly undercompacted, overpressured gas areas have been studied in recent years as part of the U.S. Department of Energy's Geopressured-Geothermal Energy Program. Overpressuring in Cretaceous and Jurassic sandstone and carbonate rocks in the Eastern Gulf Basin may be caused by several mechanisms. More work needs to be done in order to better predict the distribution of overpressuring.
SUMMARY OF NATURAL GAS INITIAL PRODUCTION FROM
DEEP WELLS
In order to evaluate deep(> 15,000 ft, >4,572 m) natural gas well completions, we compiled data on gas flow rates from initial potential tests because computerized production data were not available to us. The WHCS file current to November 1991 was used for this compilation (Petroleum Information Corporation, 1993). The data were grouped by basin and producing formation. A wide range of initial potential values were noted in most basins.
Initial potential is not necessarily a full indication of well productivity, but, in general, it represents the potential of a given formation and basin. Many factors can affect initial potential test results, including well-completion method, choke size, back pressure, number of perforations, pay thickness, and natural fracturing.
In order to normalize variables that affect initial potential results for many wells, we identified wells that were stimulated by hydraulic fracturing and those that were stimulated by acid and were not hydraulically fractured. Hydraulic fracturing is a well-known method to increase formation permeability by creating downhole artificial fractures. Hydraulic fracturing involves injecting a slurry of proppant (usually well-sorted, clean sand) suspended in a liquid-carrying (gel) medium. The mixture is injected at a pressure higher than the natural fracture gradient of the rock
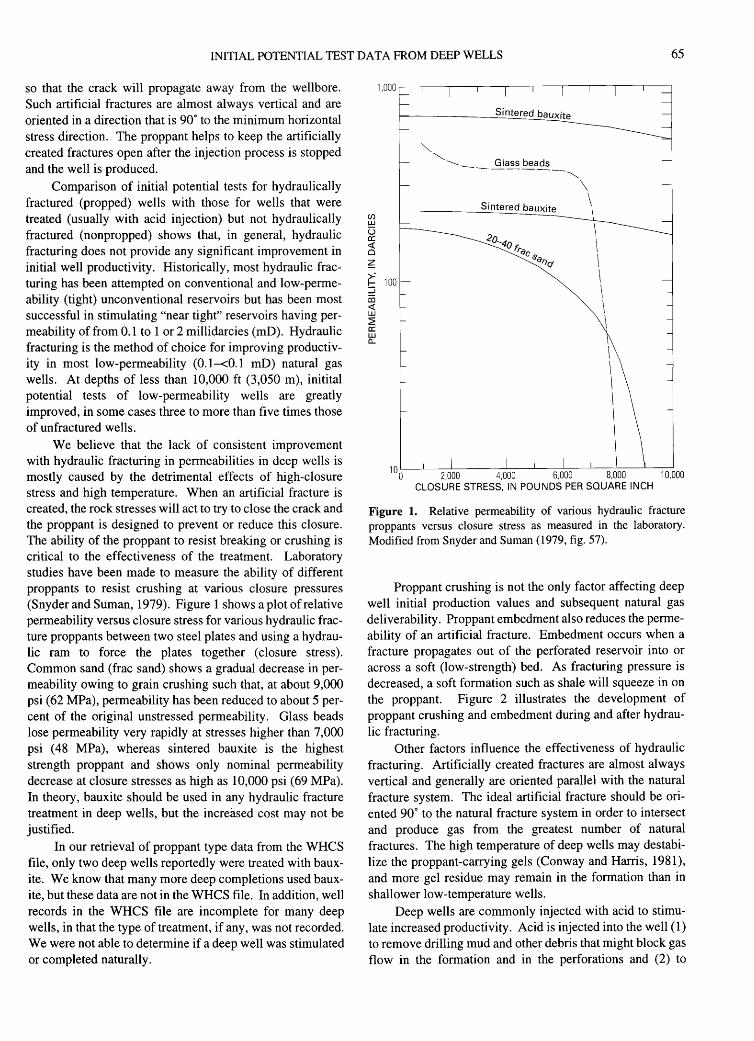
INITIAL POTENTIAL TEST DATA FROM DEEP WELLS 65
so that the crack will propagate away from the wellbore. Such artificial fractures are almost always vertical and are oriented in a direction that is 90° to the minimum horizontal stress direction. The proppant helps to keep the artificially created fractures open after the injection process is stopped and the well is produced.
Comparison of initial potential tests for hydraulically fractured (propped) wells with those for wells that were treated (usually with acid injection) but not hydraulically fractured (nonpropped) shows that, in general, hydraulic fracturing does not provide any significant improvement in initial well productivity. Historically, most hydraulic fracturing has been attempted on conventional and low-permeability (tight) unconventional reservoirs but has been most successful in stimulating "near tight" reservoirs having permeability of from 0.1 to 1 or 2 millidarcies (mD). Hydraulic fracturing is the method of choice for improving productivity in most low-permeability (0.1-<0.1 mD) natural gas wells. At depths of less than 10,000 ft (3,050 m), initital potential tests of low-permeability wells are greatly improved, in some cases three to more than five times those of unfractured wells.
We believe that the lack of consistent improvement with hydraulic fracturing in permeabilities in deep wells is mostly caused by the detrimental effects of high-closure stress and high temperature. When an artificial fracture is created, the rock stresses will act to try to close the crack and the proppant is designed to prevent or reduce this closure. The ability of the proppant to resist breaking or crushing is critical to the effectiveness of the treatment. Laboratory studies have been made to measure the ability of different proppants to resist crushing at various closure pressures (Snyder and Suman, 1979). Figure 1 shows a plot of relative permeability versus closure stress for various hydraulic fracture proppants between two steel plates and using a hydraulic ram to force the plates together (closure stress). Common sand (frac sand) shows a gradual decrease in permeability owing to grain crushing such that, at about 9,000 psi (62 MPa), permeability has been reduced to about 5 percent of the original unstressed permeability. Glass beads lose permeability very rapidly at stresses higher than 7,000 psi ( 48 MPa), whereas sintered bauxite is the highest strength proppant and shows only nominal permeability decrease at closure stresses as high as 10,000 psi (69 MPa). In theory, bauxite should be used in any hydraulic fracture treatment in deep wells, but the increased cost may not be justified.
In our retrieval of proppant type data from the WHCS file, only two deep wells reportedly were treated with bauxite. We know that many more deep completions used bauxite, but these data are not in the WHCS file. In addition, well records in the WHCS file are incomplete for many deep wells, in that the type of treatment, if any, was not recorded. We were not able to determine if a deep well was stimulated or completed naturally.
(f) UJ
u a: <( 0 z >-' f::J iii <( UJ
~ a: UJ a..
Sintered bauxite
1 0 0 2,000 4,000 6,000 8,000 1 0,000 CLOSURE STRESS, IN POUNDS PER SQUARE INCH
Figure 1. Relative permeability of various hydraulic fracture proppants versus closure stress as measured in the laboratory. Modified from Snyder and Suman (1979, fig. 57).
Proppant crushing is not the only factor affecting deep well initial production values and subsequent natural gas deliverability. Proppant embedment also reduces the permeability of an artificial fracture. Embedment occurs when a fracture propagates out of the perforated reservoir into or across a soft (low-strength) bed. As fracturing pressure is decreased, a soft formation such as shale will squeeze in on the proppant. Figure 2 illustrates the development of proppant crushing and embedment during and after hydraulic fracturing.
Other factors influence the effectiveness of hydraulic fracturing. Artificially created fractures are almost always vertical and generally are oriented parallel with the natural fracture system. The ideal artificial fracture should be oriented 90° to the natural fracture system in order to intersect and produce gas from the greatest number of natural fractures. The high temperature of deep wells may destabilize the proppant-carrying gels (Conway and Harris, 1981), and more gel residue may remain in the formation than in shallower low-temperature wells.
Deep wells are commonly injected with acid to stimulate increased productivity. Acid is injected into the well (1) to remove drilling mud and other debris that might block gas flow in the formation and in the perforations and (2) to
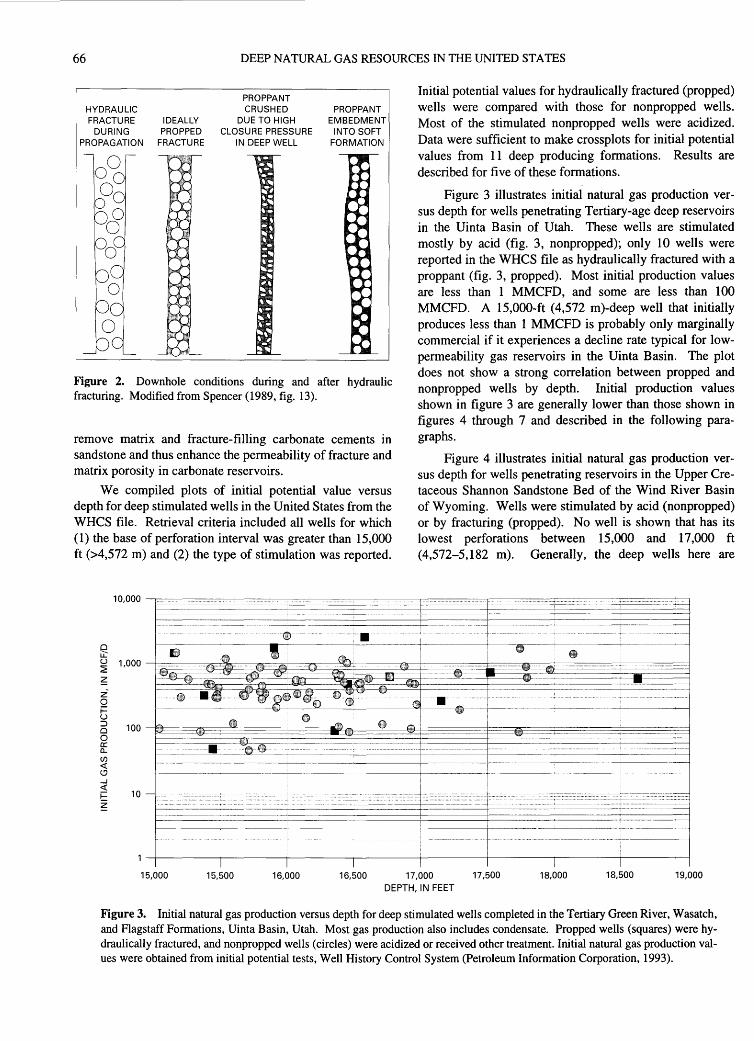
66 DEEP NATURAL GAS RESOURCES IN THE UNITED STATES
HYDRAULIC FRACTURE
DURING PROPAGATION
IDEALLY PROPPED
FRACTURE
PROPPANT CRUSHED
DUE TO HIGH CLOSURE PRESSURE
IN DEEP WELL
PROPPANT EMBEDMENT
INTO SOFT FORMATION
Figure 2. Downhole conditions during and after hydraulic fracturing. Modified from Spencer (1989, fig. 13).
remove matrix and fracture- filling carbonate cements in sandstone and thus enhance the permeability of fracture and matrix porosity in carbonate reservoirs.
We compiled plots of initial potential value versus depth for deep stimulated wells in the United States from the WHCS file. Retrieval criteria included all wells for which (1) the base of perforation interval was greater than 15,000 ft (>4,572 m) and (2) the type of stimulation was reported.
Initial potential values for hydraulically fractured (propped) wells were compared with those for nonpropped wells. Most of the stimulated nonpropped wells were acidized. Data were sufficient to make crossplots for initial potential values from 11 deep producing formations. Results are described for five of these formations.
Figure 3 illustrates initial natural gas production versus depth for wells penetrating Tertiary-age deep reservoirs in the Uinta Basin of Utah. These wells are stimulated mostly by acid (fig. 3, nonpropped); only 10 wells were reported in the WHCS file as hydraulically fractured with a proppant (fig. 3, propped). Most initial production values are less than 1 MMCFD, and some are less than 100 MMCFD. A 15,000-ft (4,572 m)-deep well that initially produces less than 1 MMCFD is probably only marginally commercial if it experiences a decline rate typical for lowpermeability gas reservoirs in the Uinta Basin. The plot does not show a strong correlation between propped and nonpropped wells by depth. Initial production values shown in figure 3 are generally lower than those shown in figures 4 through 7 and described in the following paragraphs.
Figure 4 illustrates initial natural gas production versus depth for wells penetrating reservoirs in the Upper Cretaceous Shannon Sandstone Bed of the Wind River Basin of Wyoming. Wells were stimulated by acid (nonpropped) or by fracturing (propped). No well is shown that has its lowest perforations between 15,000 and 17,000 ft (4,572-5,182 m). Generally, the deep wells here are
10,000 11·~~'''""'~'"~''"''~'''''''"'''~'''''"'''''''"''~''"~~·····~· .. ····~····""'''~''"''';;·········~·········3•''''"'~;······· .. ·~·················~···~;;;;;;··~··~~~~~~~~~~~~~·~···~~~~3 -·--·---··--"''""'' .
------ ~~~-
10 -1 ·.···:·:.·: .. :.: ... : ... :.::: .. :: .. ~-: ... -- ....... , ...... .. ............. .
r---~ ---~--- -----------~---~-----~~~-,--~~~--t-~~~--~~~~---~~------j
15,000 I
15,500 I
16,000
I
I I 16,500 17,000 17,500
DEPTH, IN FEET
I 18,000
I I
18,500 19,000
Figure 3. Initial natural gas production versus depth for deep stimulated wells completed in the Tertiary Green River, Wasatch, and Flagstaff Formations, Uinta Basin, Utah. Most gas production also includes condensate. Propped wells (squares) were hydraulically fractured, and nonpropped wells (circles) were acidized or received other treatment. Initial natural gas production values were obtained from initial potential tests, Well History Control System (Petroleum Information Corporation, 1993).

INITIAL POTENTIAL TEST DATA FROM DEEP WELLS
I
g 1 o ,ooo -~GF::f!~t::===.:~=j:i~;;======:~::::::.:::f:===::::==::=:::::::::==:::==t::::=:::::::::::::::.::::::::.::::::=:::f=::::=::::=::::====:===:f=:=:::::::::::::::::::::::::::::::::::==t:::::::::=::::=:::::::::=:=:=;:~ U """'· ..... - ....... ······ ~ ;···~············· .... :··0 ...... :·· : ....... J· : .. ::··· ..... ::···· : ... : ·: ...... :: .. ·· ...... ::J ···: .... :::··· .... ~··=:: .. : C:::>·C: .. ~::···· .... ~····.:.:.··: .. ::::·:·:: .. ::::·:·: ..... ::''::·: ...... :::::I·········::··:: ... : .. : ·::: ... :.::::·::·: ... · ··::: .. : .. ::··:::::: ... :.:··1::::: .... ::·:·::: ..... : ··:··· ............ ·····+············ .... .
~ f-
~ z' 0 F u :J 0 0 a: a... (/) <( (!) ....J <(
E z
\ .....
1,000 -~~········.··?~···· ····~··~···~····lt··~···~······G······.····?~ ··.·.·.·.···~·······~··•••···~ ;.~····•••••··~······~···········~··••••···~···········~~ ~~.·~········••••••·~·····~·.~····~················~ :~ill~ ........ ~············~·••••··~ .... · .. ···~·········~ ... •.· .. ···~····~~·······~···.···:~~····~:··~····j· ~~···········~············~···············[·····.··· ·~·········.·.·.·.·~·········.··~········ ... ·.·§·· .. · .. ·.:§.· .. ·.~~·········~··················~· ::.~··········~··,········~················§············.·· 100~~~~§~~~~~~~~~~~~~~~~~~~~~~~~ .... ,. .... .c ·• .... ..... ...... ..... •· ..... . ......... -····· .... : ... ....... ............. ............. . .................... ............... ... . .................................... 1 ............ .
I
- ...... .... ....... ··-t ................ -- ........ -................... ..
.-:.::(:_ ~ --~-.o---"• :-.. ·-· :: ... ::: : .. ::· _ .. ' ~··· .::: : .. :::··::.:: .. =--
......... ··········· ···-- ...... . - ........
I I I 17,000 17,500 18,000 18,500 19,000 19,500 20,000 20,500
DEPTH, IN FEET
Figure 4. Initial natural gas production versus depth for deep stimulated wells completed in the Upper Cretaceous Shannon Sandstone, Wind River Basin, Wyoming. Propped wells (squares) were hydraulically fractured, and nonpropped wells (circles) were acidized or received other treatment. Initial natural gas production values were obtained from initial potential tests, Well History Control System (Petroleum Information Corporation, 1993).
1,000,000
0 100,000 u: u ~
~ z' 10,000-0 F u :J 1,000 0 ·:: .... 0 a: a... (/) <( 100 (!) ....J <(
F z 10
..
14,000
•
• -~ -- E:;l
I 15,000
•
I 16,000
I 17,000
DEPTH, IN FEET
...............
- -•
18,000 19,000 20,000
Figure 5. Initial natural gas production versus depth for deep stimulated wells completed in Pennsylvanian reservoirs of Morrowan age, Anadarko Basin, Oklahoma. Propped wells (squares) were hydraulically fractured, and nonpropped wells (circles) were acidized or received other treatment. Initial natural gas production values were obtained from initial potential tests, Well History Control System (Petroleum Information Corporation, 1993).
67
deeper and have higher initial production values than do Tertiary wells in the Uinta Basin. This increase in initial productivity is partly related to better reservoir quality and partly to increased fracturing. The deep Uinta wells are mostly drilled on gentle regional dip, whereas many of the deep Wind River Basin wells are located on seismic structures where more natural fracturing occurs.
Figure 5 illustrates initial natural gas production versus depth for wells penetrating Lower Pennsylvanian (Morrowan) reservoirs in the Anadarko Basin of Oklahoma. Initial production values for wells stimulated with acid and for hydraulically fractured wells are similar. The average initial production value is 5,074 MCFD for acidized Morrow wells and 5,289 MCFD for fractured Morrow wells.

68
0
' u.. u ~
~ cri <( (.9
DEEP NATURAL GAS RESOURCES IN THE UNITED STATES
10,000,000
1,000,000
100,000
10,000
1,000
100
10
15,000 17,000 19,000 21,000 23,000 25,000
DEPTH, IN FEET
EXPLANATION
• GAS WELL
Figure 6 illustrates initial natural gas production versus depth for all deep wells (regardless of reservoir) in the Anadarko Basin. Comparison of figures 5 and 6 indicates that the Morrowan reservoirs are similar to reservoirs of other geologic ages in the basin. Most deep gas wells are concentrated between 15,000 and 18,000 ft (4,572-5,486 m) and wells in this depth range have initial production values mostly between 500 MCFD and 10 MMCFD. Wells deeper than 18,000 ft show much variation.
Figure 6. Initial natural gas production for all deep gas wells in the Anadarko Basin, Oklahoma. Initial natural gas production values were obtained from initial potential tests, Well History Control System (Petroleum Information Corporation, 1993).
Figure 7 illustrates initial natural gas production versus depth for deep wells penetrating the Lower Ordovician Ellenburger Group in the Permian Basin of western Texas and southeastern New Mexico. Data for Ellenburger carbonate rocks show that most deep wells were stimulated by acid (nonpropped, fig. 7). According to the WHCS data file, only four wells were hydraulically fractured, but the file may not record all fractured wells. Acidizing is the stimulation method of choice in carbonate reservoirs. Deep Ellenburger wells have some of the highest initial production values identified in this study. These range from about 1 to 263,500 MMCFD. The average initial production value is 29,547 MMCFD for acidized wells in the Permian Basin and 15,751 MMCFD for hydraulically fractured wells.
1,000,000
0 100,000
Li: u ~
~ 10,000 z 0 i= u ::>
1,000 0 0 0:: c... (/) <( (.9 100 _J
<(
i= z 10
15,000 17,000 19,000 21,000 DEPTH, IN FEET
23,000 25,000 27,000
Figure 7. Initial natural gas production versus depth for deep stimulated wells completed in the Lower Ordovician Ellenburger Group, Permian Basin, western Texas and southwestern New Mexico. Propped wells (squares) were hydraulically fractured, and nonpropped wells (circles) were acidized or received other treatment. Initial natural gas production values were obtained from initial potential tests, Well History Control System (Petroleum Information Corporation, 1993).
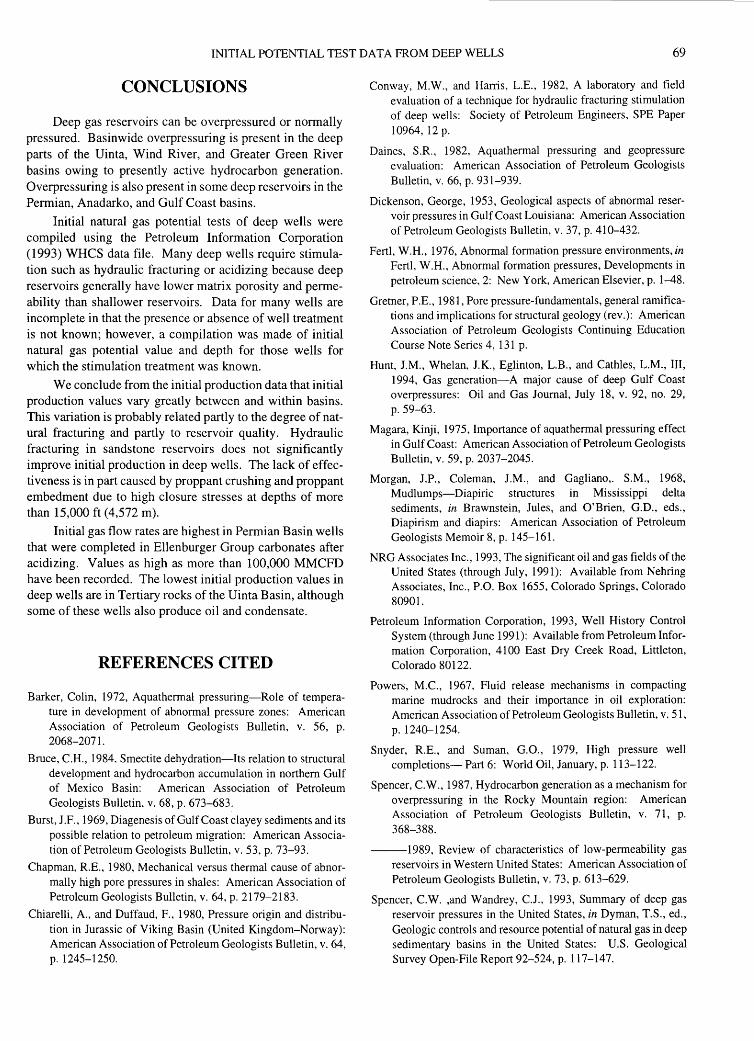
INITIAL POTENTIAL TEST DATA FROM DEEP WELLS 69
CONCLUSIONS
Deep gas reservoirs can be overpressured or normally pressured. Basinwide overpressuring is present in the deep parts of the Uinta, Wind River, and Greater Green River basins owing to presently active hydrocarbon generation. Overpressuring is also present in some deep reservoirs in the Permian, Anadarko, and Gulf Coast basins.
Initial natural gas potential tests of deep wells were compiled using the Petroleum Information Corporation (1993) WHCS data file. Many deep wells require stimulation such as hydraulic fracturing or acidizing because deep reservoirs generally have lower matrix porosity and permeability than shallower reservoirs. Data for many wells are incomplete in that the presence or absence of well treatment is not known; however, a compilation was made of initial natural gas potential value and depth for those wells for which the stimulation treatment was known.
We conclude from the initial production data that initial production values vary greatly between and within basins. This variation is probably related partly to the degree of natural fracturing and partly to reservoir quality. Hydraulic fracturing in sandstone reservoirs does not significantly improve initial production in deep wells. The lack of effectiveness is in part caused by proppant crushing and proppant embedment due to high closure stresses at depths of more than 15,000 ft (4,572 m).
Initial gas flow rates are highest in Permian Basin wells that were completed in Ellenburger Group carbonates after acidizing. Values as high as more than 100,000 MMCFD have been recorded. The lowest initial production values in deep wells are in Tertiary rocks of the Uinta Basin, although some of these wells also produce oil and condensate.
REFERENCES CITED
Barker, Colin, 1972, Aquathennal pressuring-Role of temperature in development of abnormal pressure zones: American Association of Petroleum Geologists Bulletin, v. 56, p. 2068-2071.
Bruce, C.H., 1984, Smectite dehydration-Its relation to structural development and hydrocarbon accumulation in northern Gulf of Mexico Basin: American Association of Petroleum Geologists Bulletin, v. 68, p. 673-683.
Burst, J.F., 1969, Diagenesis of Gulf Coast clayey sediments and its possible relation to petroleum migration: American Association of Petroleum Geologists Bulletin, v. 53, p. 73-93.
Chapman, R.E., 1980, Mechanical versus thermal cause of abnormally high pore pressures in shales: American Association of Petroleum Geologists Bulletin, v. 64, p. 2179-2183.
Chiarelli, A., and Duffaud, F., 1980, Pressure origin and distribution in Jurassic of Viking Basin (United Kingdom-Norway): American Association of Petroleum Geologists Bulletin, v. 64, p. 1245-1250.
Conway, M.W., and Harris, L.E., 1982, A laboratory and field evaluation of a technique for hydraulic fracturing stimulation of deep wells: Society of Petroleum Engineers, SPE Paper 10964, 12 p.
Daines, S.R., 1982, Aquathermal pressuring and geopressure evaluation: American Association of Petroleum Geologists Bulletin, v. 66, p. 931-939.
Dickenson, George, 1953, Geological aspects of abnormal reservoir pressures in Gulf Coast Louisiana: American Association of Petroleum Geologists Bulletin, v. 37, p. 410-432.
Fertl, W.H., 1976, Abnormal formation pressure environments, in Fertl, W.H., Abnormal formation pressures, Developments in petroleum science, 2: New York, American Elsevier, p. 1-48.
Gretner, P.E., 1981, Pore pressure-fundamentals, general ramifications and implications for structural geology (rev.): American Association of Petroleum Geologists Continuing Education Course Note Series 4, 131 p.
Hunt, J.M., Whelan, J.K., Eglinton, L.B., and Cathles, L.M., III, 1994, Gas generation-A major cause of deep Gulf Coast overpressures: Oil and Gas Journal, July 18, v. 92, no. 29, p. 59-63.
Magara, Kinji, 1975, Importance of aquathermal pressuring effect in Gulf Coast: American Association of Petroleum Geologists Bulletin, v. 59, p. 2037-2045.
Morgan, J.P., Coleman, J.M., and Gagliano,. S.M., 1968, Mudlumps-Diapiric structures in Mississippi delta sediments, in Brawnstein, Jules, and O'Brien, G.D., eds., Diapirism and diapirs: American Association of Petroleum Geologists Memoir 8, p. 145-161.
NRG Associates Inc., 1993, The significant oil and gas fields of the United States (through July, 1991): Available from Nehring Associates, Inc., P.O. Box 1655, Colorado Springs, Colorado 80901.
Petroleum Information Corporation, 1993, Well History Control System (through June 1991): Available from Petroleum Information Corporation, 4100 East Dry Creek Road, Littleton, Colorado 80122.
Powers, M.C., 1967, Fluid release mechanisms in compacting marine mudrocks and their importance in oil exploration: American Association of Petroleum Geologists Bulletin, v. 51, p. 1240--1254.
Snyder, R.E., and Suman, G.O., 1979, High pressure well completions- Part 6: World Oil, January, p. 113-122.
Spencer, C.W., 1987, Hydrocarbon generation as a mechanism for overpressuring in the Rocky Mountain region: American Association of Petroleum Geologists Bulletin, v. 71, p. 368-388.
---1989, Review of characteristics of low-permeability gas reservoirs in Western United States: American Association of Petroleum Geologists Bulletin, v. 73, p. 613-629.
Spencer, C.W. ,and Wandrey, C.J., 1993, Summary of deep gas reservoir pressures in the United States, in Dyman, T.S., ed., Geologic controls and resource potential of natural gas in deep sedimentary basins in the United States: U.S. Geological Survey Open-File Report 92-524, p. 117-147.


Physical Properties of Clastic Reservoir Rocks in the Uinta, Wind River, and Anadarko Basins, As Determined by Mercury-Injection Porosimetry
By C.W. Keighin
GEOLOGIC CONTROLS OF DEEP NATURAL GAS RESOURCES IN THE UNITED STATES
U.S. GEOLOGICAL SURVEY BULLETIN 2146-G
UNITED STATES GOVERNMENT PRINTING OFFICE, WASHINGTON: 1997

CONTENTS
Abstract . . . . . . . . . . . . . . . . . .. . . . . . . . . . . . . . . . . . . . . . . . . . . . . . . . .. . . . . . . . . . . . . . . . . . . .. . . . . . . . . . . . . . . . . . . . . . . . .. . . . . . . . . . . . . . . . .. . . . . . . . . . 73 Introduction..................................................................................................................... 73 Sandstone Petrography.................................................................................................... 73 Mercury-injection Porosimetry ....................................................................................... 74 Data Analysis.................................................................................................................. 76 Discussion . . . . . . . . . . . . . . . . . . . . . . . . . . . . . . . . . . . . . . . . . . . . . . . . . . . . . . . . . . . . . . . . . . . . . . . . . . . . . . . . . . . . . . . . . . . . . . . . . . . . . . . . . . . . . . . . . .. . . . . 79 References Cited . . . . . . . . . . . . . . . . . . . . . . . . . . . . . . . . . . . . . . . .. . . . . .. . . . . . . . . . . . . . . . . . . . . . . . . . . . . . . . . . . . . . . . . .. . . . . . . . . . . . . . . . . . . . . 81
FIGURES
1. Photomicrographs of thin sections prepared from plugs on which porosity-permeability and mercury-injection determinations were made............................................................................................................................................... 75
2. Crossplots of in situ Klinkenberg permeability versus in situ helium porosity and routine air permeability for samples from core in the Anadarko, Uinta, and Wind River basins................................................................................ 78
3. Plots illustrating capillary pressure versus wetting phase saturation and pore size distribution for samples under ambient and in situ stress conditions . . . . . .. ... ...... .. . . ....... ... . . . .. . . . ... . . . . .. . .. .. . . . . . .. . . . . .. ... . . . . . . . .. . . .. .. . . . . ... .. ....... .. ....... ......... 79
TABLES
1. Location and geologic formation for samples examined in this study ... .. .. . . . . .... .. ... . . .. . . . . . .. . . . . .. . . . . . . ........ ........ ...... .. . . . . . .... 7 4 2. Sample depth, and summary of modal analyses and measured porosity and permeability for samples examined
in this study...................................................................................................................................................................... 77
Physical Properties of Clastic Reservoir Rocks in the Uinta, Wind River, and Anadarko Basins,
As Determined by Mercury-Injection Porosimetry
By C.W. Keighin
ABSTRACT
Pores, and pore throats, in clastic rocks from three sedimentary basins were studied petrographically and by mercury-injection porosimetry. Samples represent a variety of sedimentary facies, as well as a wide range of depths, and diverse diagenetic histories. Although pore throats may be limiting features in controlling fluid flow in low-permeability sandstones, very few data are available with which to document the effect of confining stress typical of reservoir conditions on capillary pressure or pore-throat size. Understanding the nature of pore throats, and their relationship to facies distribution and to diagenesis, aids in understanding mechanisms of fluid flow in clastic rocks. This information is valuable for calculating hydrocarbon recovery from potential reservoir rocks.
INTRODUCTION
Although studies documenting the effects of confining stress on porosity and permeability in clastic rocks have been made, almost no data are available with which to document the effects of confining stress on pore-throat size distribution when this size distribution has been determined by mercury-injection capillary pressure studies. Mercuryinjection porosimetry may be especially useful for understanding reservoir behavior in deep sedimentary basins.
In this paper, I document the usefulness of mercuryinjection porosimetry in identifying reservoir quality for deep reservoir rocks using data from several basins. Nineteen rock samples from the Uinta, Wind River, and Anadarko basins were examined using standard petrographic techniques and mercury-injection porosimetry to understand the pore-throat structure and overall petrophysical characteristics of reservoir rocks from the deeper parts of the basins. Samples were chosen to represent a wide variety of depositional environments, and petrological suites were selected from both reservoir and nonreservoir rock facies. Individual samples may have been taken from producing or
nonproducing horizons from known reservoir rocks. Samples were taken from different depth intervals, each of which may reflect a different diagenetic history. The three basins from which samples were collected all contribute significant quantities of oil or natural gas to the Nation's energy resource base.
SANDSTONE PETROGRAPHY
Geographic location and stratigraphic position for each sample are given in table 1. Sample depth and a summary of modal analyses and porosity-permeability values are listed in table 2. Photomicrographs of selected samples are shown in figure 1. Because the samples are from widely separated geographic locations and from different depositional environments, their petrologic properties differ significantly. The small number of samples examined in this study limits extrapolation of the results to other basins, although similar rocks might be expected to have similar properties.
The samples vary primarily in the relative abundance of quartz, feldspar, and rock fragments (table 2); carbonate cement is locally abundant. The relative abundance of rock fragments may have a significant effect on macro- and micro-porosity and permeability. Pore size in any sample is initially related to grain size of the original sediment and thus to depositional environment. Pore size and, especially, pore-throat size may be significantly modified by physical compaction or by precipitation of mineral cements. Compression of labile rock fragments reduces intergranular porosity and creates intergranular pseudomatrix; both reduce effective permeability (McBride and others, 1991). Partial dissolution of rock fragments commonly creates microporosity; micropores introduce micro-pore-throats that restrict fluid migration.
The two samples from the Shell-Christenson well in the Uinta Basin of Utah are fine grained and quartz rich. Porosity is low in both samples but for different reasons. The sample from 11,852 ft (3,612 m) depth shows evidence of compaction, but porosity loss is due primarily to the
73
74 DEEP NATURAL GAS RESOURCES IN THE UNITED STATES
Table 1. Location and geologic formation for samples examined in this study.
Sample no. Depth (feet) Well County Location Formation
Uinta Basin, Utah
Ch 1-35 11,852 Shell-Christenson 1-35-A5 Duchesne Sec. 33, T.1 S, R. 5 W. Green River. Ch 1-35 11,932 Shell-Christenson 1-35-A5 Duchesne Sec. 33, T.1 S, R. 5 W. Green River.
Anadarko, Basin, Oklahoma
OK-1 18,076 Kerr-McGee No. 1 Tentanque Cado Sec. 35, T.5 N., R. 10 W. Springer. OK-2 16,078 Texaco No. 1 Carr Cado Sec. 36, T.5 N., R. 11 W. Springer. OK-3 11,960 Humble No. 1 Patterson Grady Sec. 23, T.5 N., R. 6 W. Springer. OK-4 12,072 Humble No. 1 Patterson Grady Sec. 23, T.5 N., R. 6 W. Springer. OK-5 16,626 Chevron 1 Berta B Lay Grady Sec. 8, T.3 N., R. 7 W. Springer. OK-6 10,161 Edwin Cox 1 Miller Canadian Sec. 26, T.14 N., R. 10 W. Morrow. OK-7 7,096 . King Stevenson 1 Anderson Woodward Sec. 26, T.25 N., R. 20 W. Morrow. OK-8 7,197.5 King Stevenson 1 Anderson Woodward Sec. 26, T.25 N., R. 20 W. Morrow. OK-9 10,378 Odessa Nat. Gas 1 Milstead Woodward Sec. 33, T.20 N., R. 21 W. Morrow.
Wind River Basin, Wyoming
WY-8 12,097.5 Monsanto 1-35 Dolis Fremont Sec. 35, T.39 N., R. 91 W. Lance. WY-10 12,111 Monsanto 1-35 Dolis Fremont Sec. 35, T.39 N., R. 91 W. Lance. WY-20 12,709.4 Monsanto 1-35 Dolis Fremont Sec. 35, T.39 N., R. 91 W. Lance. WY-21 13,483 Monsanto 1-35 Dolis Fremont Sec. 35, T.39 N., R. 91 W. Lance. WY-25 13,517.3 Monsanto 1-35 Dolis Fremont Sec. 35, T.39 N., R. 91 W. Lance. WY-27 13,527 Monsanto 1-35 Dolis Fremont Sec. 35, T.39 N., R. 91 W. Lance. WY-31 13,602.5 Monsanto 1-35 Dolis Fremont Sec. 35, T.39 N., R. 91 W. Lance. WY-35 13,631 Monsanto 1-35 Dolis Fremont Sec. 35, T.39 N., R. 91 W. Lance.
presence of approximately 19 percent (by volume) carbonate cement. The sample from 11,932 ft (3,636 m) depth contains approximately 4 percent carbonate cement but is more compacted than the first sample.
Samples from the Anadarko Basin of Oklahoma (OK-1 through OK-9; fig. 1A, B, D) are from different wells, formations, and depths. They exhibit a large variation of porosity and permeability. There is no obvious relationship between grain size and porosity or between depth and porosity, even in the same well. Reduced porosity is most commonly related to increased cementation and sometimes to compaction of labile rock fragments or to poor sorting. Detailed petrologic data for additional samples from the Anadarko Basin are given in Keighin and Flores ( 1989).
Samples from the Wind River Basin of Wyoming (WY-8 through WY-35; fig. 1C) are typically coarser grained and contain more rock fragments than samples from the other basins. The Wind River subset is too small, however, to determine if grain size and (or) the presence of rock fragments affect the distribution of porosity or permeability. Most porosity probably is due to dissolution of rock fragments or other detrital grains. Porosity loss is due primarily to compaction; the volume of porosity-reducing carbonate cement is usually less than 5 percent.
MERCURY -INJECTION POROSIMETRY
Petrophysical characteristics of rocks influence the ability of petroleum reservoirs to produce, and an understanding
of these characteristics can help to maximize production. An analytical technique useful for determining distribution of pore-throat sizes, and thus understanding the structures of pore systems in the reservoir, is capillary pressure analysis. Pore systems consist of pores and smaller channels (pore throats) connecting the pores. Pore throats, in conjunction with pore-system geometry and topology, control the movement of fluids between pores. Through the use of capillarypressure curves derived from mercury-injection porosimetry, it is possible to calculate pore-throat size and distribution.
Mercury-injection porosimetry is based on measurement of volume distribution of pore throats; the method depends on forcing mercury into small voids, pore throats, within the rock. Pore throats control access to larger voids (pores) because greater pressures are required to force mercury, or other nonwetting fluids, into smaller spaces (see Purcell, 1949). Thus, pore throats are bottlenecks in the system, and it is necessary to exceed their critical capillary pressure in order to inject mercury into pores. By injecting mercury at incrementally higher pressures, and allowing time for equilibration between pressure increments, mercury is injected into increasingly smaller pores. It is then possible to calculate the size distribution of pore throats, to determine how pore-throat size is affected by increasing confining stress to approximate reservoir conditions, and to determine how permeability is affected by reduction in pore-throat size.
The samples in table 2 show a large range of porosity and permeability values, although porosity is typically below 8 percent and Klinkenberg permeability below 0.1 mD. Klinkenberg (1941) showed that, especially in low-permeability media, permeability to a gas is a function of the mean

PHYSICAL PROPERTIES OF CLASTIC RESERVOIR ROCKS 75

76 DEEP NATURAL GAS RESOURCES IN THE UNITED STATES
Figure 1 (previous page). Photomicrographs of thin sections prepared from plugs on which porosity-permeability and mercuryinjection determinations were made. Location of samples is given in table 1, and porosity, permeability, and modal analysis results are given in table 2. All photographs taken in plane-polarized light. A, Sample OK-7. Depth, 7,096 ft (2,163 m); helium porosity, 16 percent; in situ permeability, 330 mD. Good porosity and permeability are created by large, open pores (P); pores are generally clay free but are typically lined by wheat-grain siderite (S). Neither porosity nor permeability has been reduced by compaction or chemical cementation in this sample. B, Sample OK-8. Depth, 7,198 ft (2,194 m); helium porosity, 14.1 percent; in situ permeability, 47.7 mD. Sample is poorly sorted but clean (few rock fragments); pores are relatively clean and open, although some are filled with kaolinite (K). Authigenic quartz overgrowths (0) and carbonate cement (C) are present, but neither porosity nor permeability has been significantly reduced by chemical cementation. C, Sample OK-3. Depth, 11,960 ft (3,645 m); helium porosity, 14.3 percent; in situ permeability, 86.6 mD. Sandstone is moderately sorted, fine grained, and relatively clean; pores are typically open and clay-free, although iron-bearing carbonate cement (C) is sometimes present. D, Sample OK-1. Depth 18,076 ft (5,51 0 m); helium porosity, 2.1 percent; in situ permeability, 0.0010 mD. Sandstone is well sorted and clean, but porosity and permeability have been significantly reduced by compaction, quartz overgrowths (0) (silica cementation), and pore-filling carbonate (C). Intergranular pores (P) are present but are typically very thin ( <5 j...Lm). E, Sample WY -8. Depth, 12,097.5 ft (3,687 m); helium porosity, 6.9 percent; in situ permeability, 0.0022 mD. Moderately sorted medium-grained sandstone contains both compacted and partially dissolved rock fragments (R); some porosity is microporosity due to partial dissolution of rock fragments; few pores are clean (free from clays or authigenic cements). Authigenic cements include silica overgrowths and intergranular carbonates. F, Sample WY -35. Depth, 13,631 ft (4,155 m); helium porosity, 7 percent; in situ permeability, 0.0024 mD. Medium-grained, moderately sorted sandstone is rich in rock fragments. Most pores are lined with authigenic chlorite (Ch), and many are filled with other authigenic clays. Porosity has also been reduced by precipitation of intergranular carbonate (C).
free path of the gas molecules. When gas flows through capillaries having diameters small enough to be comparable to the mean free path of the gas, as is typically the case in lowpermeability media, discrepancies appear between gas and liquid permeabilities in the porous media. Klinkenberg introduced the concept of "slip" and the following equation to correct apparent gas permeability, Kg, of a gas flowing at a mean pore pressure, P, to the true permeability of the porous medium, Koo (see also Sampath and Keighin, 1982):
Kg= K00(1 +hiP)
DATA ANALYSIS
Crossplots of in situ Klinkenberg permeability versus in situ helium porosity and in situ Klinkenberg permeability
versus routine air permeability for samples in this study are shown in figure 2. They indicate a generally close correlation between porosity and permeability. As expected, porosity and permeability in general decrease with depth, but depth is not the only factor to consider in the decrease of either porosity or permeability.
Schmoker and Gautier (1988) considered that porosityreducing diagenetic reactions in the subsurface are dependent on time-temperature exposure of the formation and, further, that depth may or may not be a good measure of thermal exposure. In addition, the decrease in porosity with depth may not be uniform (Atkins and McBride, 1992, fig. 9). Examination of thin sections indicates that, although compaction due to increasing depth of burial may be a factor, the degree of compaction is greatly influenced by lithology, especially the presence and quantity of labile rock fragments (Dutton and Diggs, 1992). Cementation, either by silica or by carbonate minerals, reduces both porosity and permeability, as well as significantly modifies pore structure.
This study is particularly aimed at describing pore structure and, necessarily, determining how these structures are generated and modified. It would be especially useful in both exploration and production to be able to accurately predict porosity and the role of mechanisms responsible for modifying porosity and pore structure. Pore throats are an important aspect of overall pore structure. In part because of their small size, they are more sensitive to diagenetic modifications including physical compaction and chemical change (dissolution or precipitation of newly formed minerals). Research to date has not completely answered these questions (Harrison, 1989; Surdam and others, 1989; Bloch, 1991; Bachu and Underschultz, 1992).
Examination of the porosity and permeability data in table 2 reveals a wide variation in measured values; the data also show wide variations in the effects of confining stress on permeability. Relationships between capillary pressure and wetting-phase saturation (that is, air) and pore-size distribution for a range of porosity and permeability values are shown in figure 3 (see also McCreesh and others, 1991). The samples illustrated in figure 3A and B are among the most porous of the samples investigated and, in thin section, have the largest visible pores. Plots of pore-size frequency versus pore entry-throat diameter reveal, however, that pore throats in these samples are most commonly in the 10-J..lm range, significantly smaller than the pores visible in thin section. The plots also show that pore throats are constricted by increased confining stress, although not as dramatically as in samples that have lower initial porosity and permeability and smaller measured pore throats. Data plotted in figures 3C and D indicate that, for samples more typically fitting the "tight" sand designation, pore throats are more typically in the <0.1-J.lm size range and that these already small pores are further reduced by confining stress. Thus, even though pores visible in thin section may be relatively large, all pores must be accessed through pore throats, which are smaller,

Table 2. Sample depth, and summary of modal analyses and measured porosity and permeability for samples examined in this study. [Sample location information is given in table 1. Modal analyses are normalized to 100 percent: Q, quartz; F, feldspar; R, lithic fragments; leaders ( --) indicate not present. Properties are defined at bottom of table. Helium porosity is in situ value. Permeability values are corrected for Kiinkenberg effect. ND indicates not determined]
In situ permeability/ Sample De 11th Modal anal)::sis (volume 11ercent} Pro~rties Porosit):: (~rcent} Permeabilitl ambient permeability
No. (feet, meters) Q F R Size Sort Angularit~ Helium Modal Ambient Insitu (Eercent) Uinta Basin, Utah
Ch 1-35 11,852 (3,612) 91.3 2.5 6.2 165 0.7 3.5 2.2 3 0.0065 0.0004 6.15 Ch 1-35 11,932 (3,637) 93.1 3.1 3.8 193 0.8 2.1 4.0 7.6 0.0165 0.0018 10.9
Anadarko Basin, Oklahoma 'i:)
OK-1 18,076 (5,510) 100 207 0.4 3.5 2.0 0.8 0.0050 0.0010 20. ::c .-<
OK-2 16,078 (4,901) 98.1 0.8 1.1 148 0.4 2.9 4.9 8.5 0.0729 0.0078 10.69 (/.)
OK-3 11,960 (3,645) 99.6 0.4 210 0.9 2.0 13.3 24 95.466 89.6 93.39 n >
OK-4 12,072 (3,680) 100 156 0.4 2.0 4.3 6 0.0477 0.0026 5.45 t-
OK-5 16,626 (5,068) 99.5 0.5 140 1.0 2.5 8.8 10.8 0.5185 0.1975 38.09 'i:) :::0
OK-6 10,161 (3,097) 98.7 0.9 0.4 166 0.5 3.6 ND 15.4 ND ND 0 'i:)
OK-7 7,096 (2,163) 91.4 1.0 7.6 321 0.4 3.8 14. 25 343.75 330.20 96.06 tT1
OK-8 7,197 (2,194) 99.6 0.4 209 1.7 3.8 12.8 22 50.75 47.65 93.89 ~ m OK-9 10,378 (3,163) 98.7 0.65 0.65 101 1.5 0.6 9.6 4.8 0.0078 0.0032 41.03 (/.)
Wind River Basin, Wyoming 0 'T]
WY-8 12,097 (3,687) 85.5 Q.O 12.5 317 0.7 1.5 6.5 12.2 0.0157 0.0022 14.01 (')
WY-10 12,111 (3,691) 85.2 0.5 14.3 162 0.5 1.5 8.2 9.5 0.0077 0.0017 22.07 t->
WY-20 12,709 (3,874) 75.8 2.4 21.8 255 0.8 2 5.5 6.1 0.0106 0.0012 10.85 (/.) .....j
WY-21 13,483 (4,110) 60.4 3.9 35.7 330 1.0 1.8 5.9 5.7 0.0133 0.0010 7.52 n WY-25 13,517 (4,120) 69.7 4.3 26. 226 1.2 1.2 3.7 4.1 0.0012 0.0001 8.33 :::0
tT1 WY-27 13,527 (4,123) 77.8 3.9 18.3 317 0.8 1.5 5.2 3.3 0.0052 0.0005 9.62 (/.)
tT1 WY-31 13,602 (4,146) 80 10.9 18.3 397 0.5 2.1 4.7 4.9 0.0051 0.0011 21.57 :::0
< WY-35 13,631 (4,155) 62.1 15.9 22 272 0.5 2.2 6.7 7.2 0.0065 0.0024 36.92 0 Properties ~
Grain size Sorting Angularitx :::0 0
Size (J..UU) Wentworth size Visual estimate Degree of sorting Class interval Grade term (') ~
550-250 Medium sand 0-0.35 Very well sorted 2.0-3.0 Subangular (/.)
250-125 Fine sand 0.35-0.5 Well sorted 3.0-4.0 Subrounded 125-62.5 Very fine sand 0.5-1.0 Moderately sorted 4.0-5.0 Rounded
1.0-2.0 Poorly sorted
-J -J
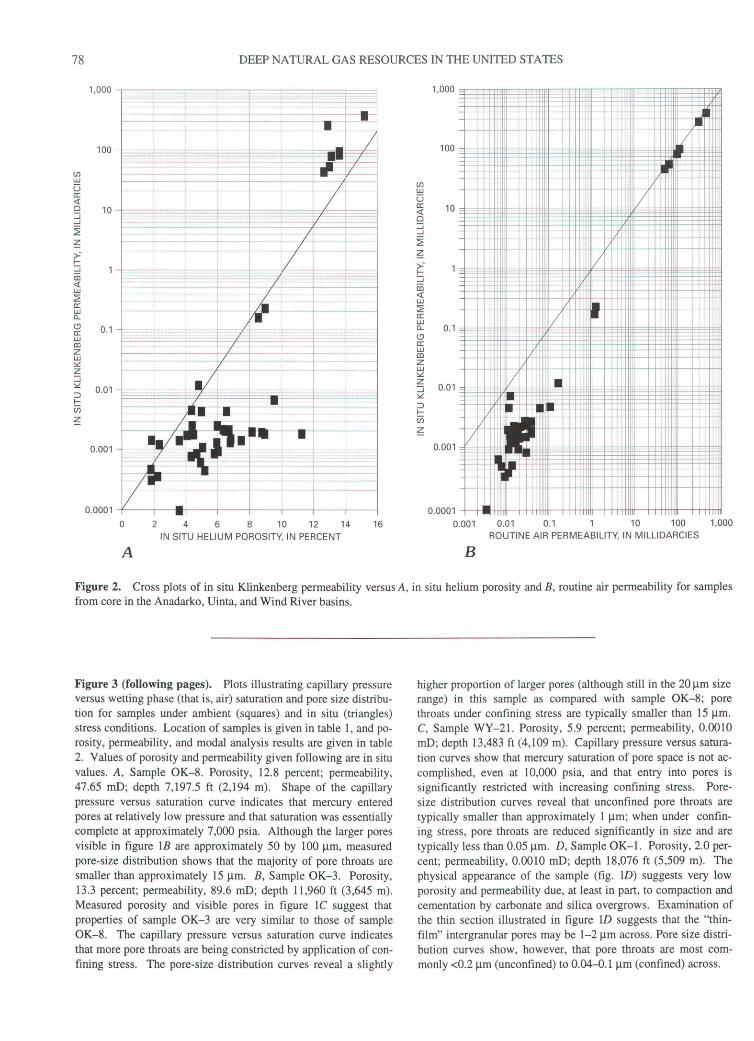
78 DEEP NATURAL GAS RESOURCES IN THE UNITED STATES
(f) UJ
u a: <( 0 :::::i _J
:2! z >-' 1-:::::i ro <( UJ
:2! a: UJ a.. <.9 a: UJ Ill z UJ ~ z :::::i ~
~ 1-(j) z
1,000 ~~--====-====-=t====+=====--~==t====i
-• I
----------· ····----r--- ··----·-----------
I --- - ----- ·t ..... - ... ------ -; -
I. ! . -- -
0.01 -~---'-~ ~-- . ' - - - ---...
!
I • I
" ----1
r-JI~ 0.0001 1 • 1 I I I
--
0 2 4 6 8 10 12 14 16 IN SITU HELIUM POROSITY, IN PERCENT
A
(f) UJ
u a: <( 0 :::::i ::::! :2! ~ >-' 1-:::::i ro <( UJ
:2! a: UJ a.. <.9 a: UJ Ill z UJ ~ z :::::i ~
~ 1-(j)
~
1,000
--
100 = ---- -
10 =
--
:
-
0.1 _ __ -:
0.01 = ---
0.001 I =~ --
0.0001
0.001
B
l v v
' :I ~ ' f
I
I f I tL H .;
H t it '·r • I
; I 11 ·--· ~ ' i f-- it lL ------..-
I ~
It ~ j
... + I
+-· II I
- ---- , ·:: v T
...... -· .
--r .. v rl ·-· lj,,
I .. , -t--r: ~=- ·-
. - -/ i
1 :
I L • I ;: : l I! - t-- - - - f-h ,. • ' It _,
-
r - l1j -
I I I
II I
I II I II I I I II
0.01 0.1 1 10 100 1,000
ROUTINE AIR PERMEABILITY, IN MILLIDARCIES
Figure 2. Cross plots of in situ Klinkenberg permeability versus A, in situ helium porosity and B, routine air permeability for samples from core in the Anadarko, Uinta, and Wind River basins.
Figure 3 (following pages). Plots illustrating capillary pressure versus wetting phase (that is, air) saturation and pore size distribution for samples under ambient (squares) and in situ (triangles) stress conditions. Location of samples is given in table 1, and porosity, permeability, and modal analysis results are given in table 2. Values of porosity and permeability given following are in situ values. A, Sample OK-8. Porosity, 12.8 percent; permeability, 47.65 mD; depth 7,197.5 ft (2,194 m). Shape of the capillary pressure versus saturation curve indicates that mercury entered pores at relatively low pressure and that saturation was essentially complete at approximately 7,000 psia. Although the larger pores visible in figure 1B are approximately 50 by 100 Jlm, measured pore-size distribution shows that the majority of pore throats are smaller than approximately 15 Jlm. B, Sample OK-3. Porosity, 13.3 percent; permeability, 89.6 mD; depth 11,960 ft (3,645 m). Measured porosity and visible pores in figure 1C suggest that properties of sample OK-3 are very similar to those of sample OK-8. The capillary pressure versus saturation curve indicates that more pore throats are being constricted by application of confining stress. The pore-size distribution curves reveal a slightly
higher proportion of larger pores (although still in the 20 Jlm size range) in this sample as compared with sample OK-8; pore throats under confining stress are typically smaller than 15 Jlm. C, Sample WY-21. Porosity, 5.9 percent; permeability, 0.0010 mD; depth 13,483 ft (4,109 m). Capillary pressure versus saturation curves show that mercury saturation of pore space is not accomplished, even at 10,000 psi a, and that entry into pores is significantly restricted with increasing confining stress. Poresize distribution curves reveal that unconfined pore throats are typically smaller than approximately 1 Jlm; when under confining stress, pore throats are reduced significantly in size and are typically less than 0.05 Jlm. D, Sample OK-1. Porosity, 2.0 percent; permeability, 0.0010 mD; depth 18,076 ft (5,509 m). The physical appearance of the sample (fig. 1D) suggests very low porosity and permeability due, at least in part, to compaction and cementation by carbonate and silica overgrows. Examination of the thin section illustrated in figure 1D suggests that the "thinfilm" intergranular pores may be 1-2 Jlm across. Pore size distribution curves show, however, that pore throats are most commonly <0.2 Jlm (unconfined) to 0.04-0.1 Jlm (confined) across.

~ >u
<( U5 ~ UJ a: => (/) (/) UJ a: a.. >-a: <! _J _J
a::: <! u >-a: => u a: UJ
~ c!: <(
10,000
9,000
8,000
7,000
6,000
5,000
4,000
3,000
2,000
1,000
0
0 10
PHYSICAL PROPERTIES OF CLASTIC RESERVOIR ROCKS 79
CAPILLARY PRESSURE VS. SATURATION 2,000
1,800 :t> ""tJ
1,600 jl 0 >< ~ 1,400 :t> '-i m
1,200 ffi G) I
1,000 ~ OJ 0
800 < m ""T1 ::D m
600 m
~
400 ~ m ::D ,
200 .::!
0
20 30 40 50 60 70 80 90 100 WETTING PHASE SATURATION (%)
PORE SIZE DISTRIBUTION
~20-r--~----~--~~~--------~--~----+--+-+~~~~--+-~-r~-H~----~-r~-+++~ => 0 UJ a: l..L..
UJ N U5 UJ a: ~ 10-r--~--~~---~~--~----~--~----+--+-+--hA~~~+-~-r~-H~----r--r~-+++~
0.01 0.1 10 PORE ENTRY[THROAT DIAMETER (!lm)
100 1,000
A
commonly much smaller, than the pores. These data also suggest that pore throats, rather than stress-relief micro fractures, are indeed being closed by increased confining stress.
DISCUSSION
Pores and pore throats are initially controlled by depositional patterns and facies and are subsequently modified by
diagenetic processes. It is usually possible to identify and trace depositional facies through the use of geophysical logs, although these data are commonly too widely spaced to adequately define facies distribution. It is not generally possible, however, because of wide variations in diagenetic processes, to predict capillary pressure characteristics, which
are a measure of pore-throat characteristics, from knowledge of depositional lithofacies. It js necessary to generate the data for calculation of pore-throat characteristics from
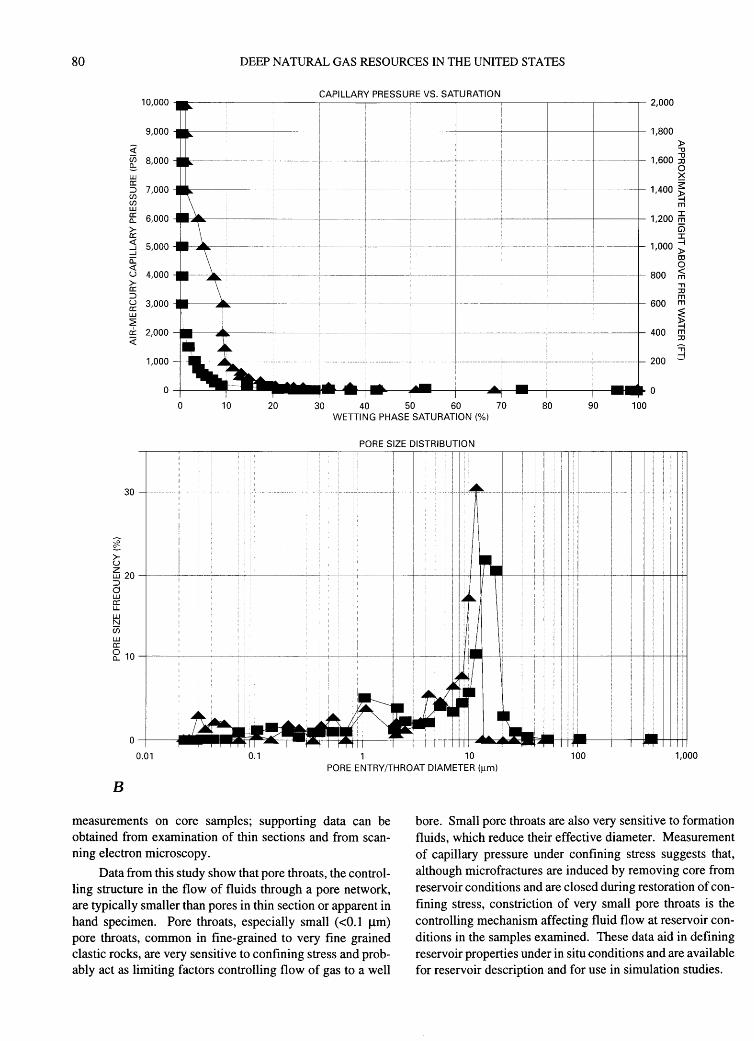
80 DEEP NATURAL GAS RESOURCES IN THE UNITED STATES
CAPILLARY PRESSURE VS. SATURATION 10,000 2,000
9,000 1,800
<C U5 8,000 ~
)> ""0
1,600 ~ 0
UJ a: ::> 7,000 (/) (/) UJ a: 6,000 a..
>< ~ 1,400 )> '-1 m
1,200 ~ >- Gi a: I <! 5,000 _J _J
a: <! u 4,000
1,000 ~ OJ 0
800 < m >-a: ::>
"TI :::0 m
u 3,000 a: UJ
2: 0: 2,000 <(
600 m
~ '-1
400 m :::0 :;:;
1,000 200 ;j
0 0
0 10 20 30 40 50 60 70 80 90 100 WETTING PHASE SATURATION(%)
PORE SIZE DISTRIBUTION
>u
30
~ 20 ---t-~---1-::l d UJ a: L.1..
UJ N U5 UJ a: a: 10
0.01 0.1 1 10 100 1,000 PORE ENTRY(THROAT DIAMETER (IJ.m)
B
measurements on core samples; supporting data can be obtained from examination of thin sections and from scanning electron microscopy.
Data from this study show that pore throats, the controlling structure in the flow of fluids through a pore network, are typically smaller than pores in thin section or apparent in hand specimen. Pore throats, especially small (<0.1 J..Lm) pore throats, common in fine-grained to very fine grained clastic rocks, are very sensitive to confining stress and probably act as limiting factors controlling flow of gas to a well
bore. Small pore throats are also very sensitive to formation fluids, which reduce their effective diameter. Measurement of capillary pressure under confining stress suggests that, although microfractures are induced by removing core from reservoir conditions and are closed during restoration of confining stress, constriction of very small pore throats is the controlling mechanism affecting fluid flow at reservoir conditions in the samples examined. These data aid in defining reservoir properties under in situ conditions and are available for reservoir description and for use in simulation studies.

PHYSICAL PROPERTIES OF CLASTIC RESERVOIR ROCKS 81
CAPILLARY PRESSURE VS. SATURATION 10,000
9,000 1,800 l> ""'0 <(
U5 8,000 ~
~------------~--~-.----~------~-----------+----~------~----~ 1,600 ~ u.J a: ::J (f)
7,000 (f) u.J a: 6,000 a.. >-a: <! 5,000 _J _J
0:: <! u 4,000 >-a: ::J u 3,000 a: u.J
~ r± <(
2,000
1,000
0
0 X ~ -------+----------~------~--------+- 1 ,400 )> '-1 m
1,200 ~ G) :c
--------+-------------+- 1,000 ~ OJ 0
800 ~ "T1 :!J m
600 m
~ 400
'-1 m :!J -::;:;
200 :j
0 10 20 30 40 50 60 70 80 90 100 WETTING PHASE SATURATION (%)
PORE SIZE DISTRIBUTION
>u
20
16
z 12 ~--~----~~~------------~~~--~~-+~~~----+-~--+--+-~----~-+-~~44~ u.J ::J d u.J a: L.l..
u.J
~ 8 u.J a: 0 a..
4
0.01 0.1 1 10 100 1,000 PORE ENTRY{fHROAT DIAMETER (~m)
c
REFERENCES CITED
Atkins, J.E., and McBride, E. F., 1992, Porosity and packing of Holocene river, dune, and beach sands: American Association of Petroleum Geologists Bulletin, v. 76, no. 3, p. 339-355.
Bachu, S., and Underschulz, J. R., 1992, Regional-scale porosity and permeability variations, Peace River arch, Alberta: American Association of Petroleum Geologists Bulletin, v. 76,no.4,p.547-562.
Bloch, S., 1991, Empirical prediction of porosity and permeability in sandstones: American Association of Petroleum Geologists Bulletin, v. 75, no. 7, p. 1145-1160.
Dutton, S.P., and Diggs, T.N., 1992, Evolution of porosity and permeability in the Lower Cretaceous Travis Peak Formation, East Texas: American Association of Petroleum Geologists Bulletin, v. 76, no. 2, p. 252-269.
Harrison, W.J., 1989, Modeling fluid/rock interactions in sedimentary basins, in Cross, T.A., ed., Quantitative dynamic stratigraphy: New York, Prentice Hall, p. 195-231.
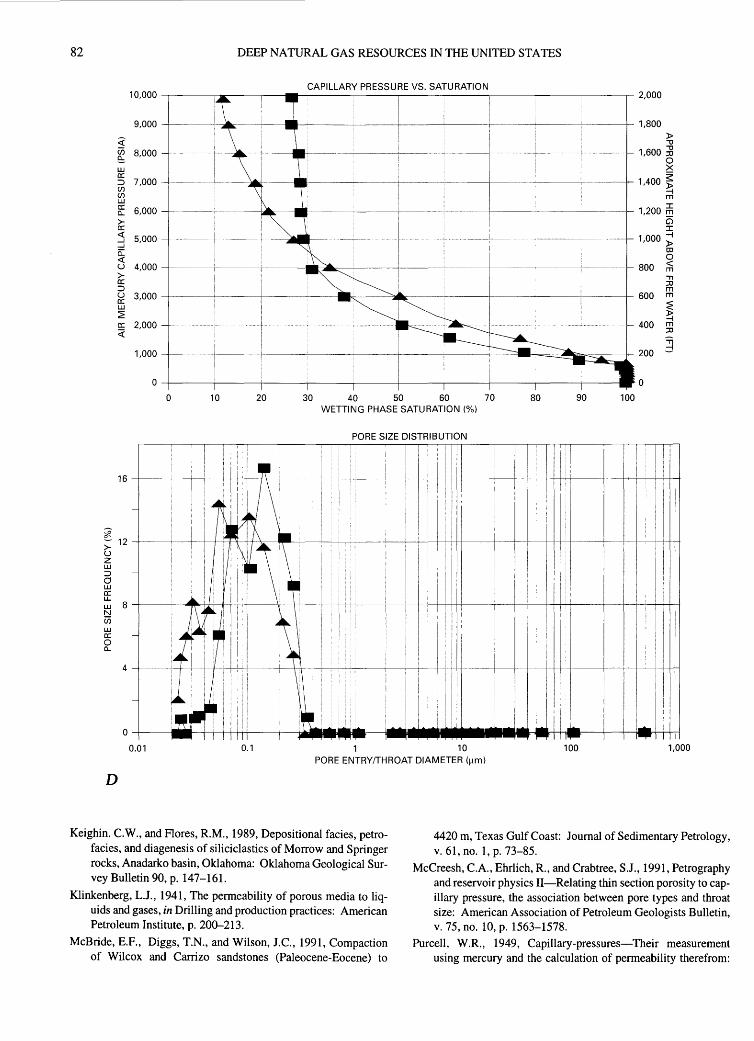
82 DEEP NATURAL GAS RESOURCES IN THE UNITED STATES
CAPILLARY PRESSURE VS. SATURATION 10,000
9,000
I I I l
2,000
1,800
<( U5 8,000 ~
)> ""tJ
1,600 ;g 0
w a: ::> 7,000 (/) (/) w a: 6,000 ~
>< ~ 1,400 )> '-i m
1,200 ~ >- G) a: :::r:: <(
5,000 _J _J
a: <( u 4,000
1,000 ~ OJ 0
800 < m >-a: ::>
"T1 :::0 m u 3,000 a:
w ~ r± 2,000 <{
600 m
~ '-i
400 m :::0 ,
1,000 200 _::J
0 0
0 10 20 30 40 50 60 70 80 90 100 WETTING PHASE SATURATION(%)
PORE SIZE DISTRIBUTION
~ 12 >-u z w ::> d w a: LL.
w 8 N U5 w a: 0 ~
4
O.Q1 0.1 1 10 100 1,000 PORE ENTRY/THROAT DIAMETER (f!m)
D
Keighin. C.W., and Flores, R.M., 1989, Depositional facies, petrofacies, and diagenesis of siliciclastics of Morrow and Springer rocks, Anadarko basin, Oklahoma: Oklahoma Geological Survey Bulletin 90, p. 147-161.
Klinkenberg, L.J., 1941, The permeability of porous media to liquids and gases, in Drilling and production practices: American Petroleum Institute, p. 200-213.
McBride, E.F., Diggs, T.N., and Wilson, J.C., 1991, Compaction of Wilcox and Carrizo sandstones (Paleocene-Eocene) to
4420 m, Texas Gulf Coast: Journal of Sedimentary Petrology, v. 61, no. 1, p. 73-85.
McCreesh, C.A., Ehrlich, R., and Crabtree, S.J., 1991, Petrography and reservoir physics 11-Relating thin section porosity to capillary pressure, the association between pore types and throat size: American Association of Petroleum Geologists Bulletin, v. 75,no. lO,p. 1563-1578.
Purcell, W.R., 1949, Capillary-pressures-Their measurement using mercury and the calculation of permeability therefrom:

PHYSICAL PROPERTIES OF CLASTIC RESERVOIR ROCKS 83
American Institute of Mining, Metallurgical, and Petroleum Engineers, Petroleum Transactions, v. 186, p. 39-48.
Sampath, K., and Keighin, C.W., 1982, Factors affecting slippage in tight sandstones of Cretaceous age in the Uinta Basin: Journal of Petroleum Technology, v. 34, no. 11, p. 2715-2720.
Schmoker, J.W., and Gautier, D.L., 1988, Sandstone porosity as a function of thermal maturity: Geology, v. 16, p. 1007-1010.
Surdam, R.S., Dunn, D.B., MacGowan, T.L., and Heasler, H.P., 1989, Conceptual models for the prediction of porosity evolution with an example from the Frontier Formation, Bighorn Basin, Wyoming, in Coalson, E.B., and others, eds., Petrogenesis and petrophysics of selected sandstone reservoirs of the Rocky Mountain region: Denver, Rocky Mountain Association of Geologists, p. 7-28.

Porosity Prediction in Deeply Buried Sandstones, With Examples From Cretaceous Formations of the Rocky Mountain Region
By James W. Schmoker
GEOLOGIC CONTROLS OF DEEP NATURAL GAS RESOURCES IN THE UNITED STATES
U.S. GEOLOGICAL SURVEY BULLETIN 2146-H
UNITED STATES GOVERNMENT PRINTING OFFICE, WASHINGTON : 1997

CONTENTS
Abstract........................................................................................................................... 89 Introduction..................................................................................................................... 89 Approach to Porosity Prediction..................................................................................... 89 Predictive Porosity Trends for J Sandstone .................................................................... 90
Porosity-Maturity Trends ........................................................................................ 90 Porosity Range at a Given Vitrinite Reflectance Level . . . . ........... ................. .......... 92
Predictive Porosity Trends for Mesaverde Group Sandstones ........................................ 93 Porosity-Maturity Trends........................................................................................ 93 Porosity Range at a Given Vitrinite Reflectance Level.......................................... 94
Predictive Porosity Trends for Undifferentiated Cretaceous Sandstones of Rocky Mountain Region . .. .... ............ ...... .. . . .. .......... .. ........ .. . . . . .. ... .... ........................... 95
Porosity-Thermal Maturity Trends ......................................................................... 95 Alternative Porosity Model..................................................................................... 97
Summary and Conclusions .............................................................................................. 103 References Cited ............................................................................................................. 103
FIGURES
1. Box diagram illustrating data format used to develop porosity-vitrinite reflectance trends................................... 90 2. Map of study area in Denver Basin showing location of wells from which J sandstone porosity and
vitrinite reflectance data were obtained................................................................................................................... 91 3-5. Plots for J sandstone of:
3. Porosity versus vitrinite reflectance for 50th percentile of porosity distributions............................................ 92 4. Porosity versus vitrinite reflectance regression lines for lOth, 25th, 50th, 75th, and 90th porosity
percentiles . . .. . . . . ............... ....... ........... ... ............ ..... ... . . . .................... .. .. . ........ .. .................................. ................ 92 5. Point-count porosity versus clay content.......................................................................................................... 93
6. Map of Piceance and Uinta basins, Colorado and Utah, showing location of wells from which porosity data representing sandstones of Mesaverde Group were obtained . . . . .. . . . . . . . . . . . . .. . ... . . . . ............ .. . . . ... . . . . .. . . . . .. . . . . .. .. . . .. .. ..... .. 93
7, 8. Plots of porosity versus vitrinite reflectance for sandstone of the Mesaverde Group from the Piceance and Uinta basins:
7. 25th through 75th percentiles of porosity distributions.................................................................................... 94 8. 75th percentiles through single highest measurements.................................................................................... 94
9, 10. Plots for Mesaverde Group sandstones of: 9. Core-plug porosity and visible pore space as a function of grain size............................................................. 95
10. Visible pore space as a function of clay-matrix content................................................................................... 96 11. Plot of present-day depth versus vitrinite reflectance for rocks of Cretaceous sandstone data set,
Rocky Mountain basins . .... ... . . . . . . . . . . . .. . . . . . . . . . . . .. ... .. . . . . . ... ... . . . . .. . . . .. . . . . . .. .. . . . . . . . . . . . ......... ...... .. . . . . .. . .. . .. . . . ... . . . . .. . . . . .. . . . . .. . . ... 98 12-16. Plots of porosity versus vitrinite reflectance, Cretaceous sandstone data set, Rocky Mountain basins, for:
12. lOth percentile.................................................................................................................................................. 98 13. 25th percentile.................................................................................................................................................. 99 14. 50th percentile.................................................................................................................................................. 99 15. 75th percentile .................................................................................................................................................. 100 16. 90th percentile .................................................................................................................................................. 100
17, 18. Graphs showing regression lines representing lOth, 25th, 50th, 75th, and 90th porosity percentiles versus vitrinite reflectance, Cretaceous sandstone data set, Rocky Mountain basins 17. Summary .......................................................................................................................................................... 101 18. Subjectively drawn trend lines ......................................................................................................................... 102

CONTENTS
TABLES
1. Power-law regression lines fit to J sandstone porosity-vitrinite reflectance data........................................................... 92 2. Description of Cretaceous sandstone data set, Rocky Mountain basins .... ....... .. .. .... .. . ... ............ ............. .... ............ ....... 97 3. Power-law regression lines fit to combined Rocky Mountain porosity-vitrinite reflectance data................................. 97


Porosity Prediction in Deeply Buried Sandstones, With Examples From Cretaceous Formations
of the Rocky Mountain Region
By James W. Schmoker
ABSTRACT
Empirical porosity trends are examined for the Lower Cretaceous J sandstone in the Denver Basin, sandstones of the Upper Cretaceous Mesaverde Group in the Piceance and Uinta basins, and combined, undifferentiated Cretaceous sandstones in the Denver, Green River, Uinta, and Piceance basins. For each data set, porosity is examined as a function of vitrinite reflectance in an attempt to determine relations between porosity change during burial and thermal history. Correlations between porosity and internal hydrocarbon generation, carbonate cementation, clay content, and grain size are investigated as examples of links between porosity range at a given vitrinite reflectance level and causal geologic elements.
INTRODUCTION
Technology for drilling oil and gas wells below 15,000 ft (4,572 m) is well developed, and the ability to detect traps at these depths has improved steadily over the years. Nevertheless, in some deep basins of the United States, relatively few wells penetrate below 15,000 ft, and deeply buried sandstones in these basins are poorly explored.
One of the factors that has limited deep drilling for sandstone reservoirs is the knowledge that porosity can be too low to sustain economic hydrocarbon production. Better methods for estimating the porosity and porosity range of sandstones are needed for risk evaluation and reduction in deepdrilling programs, as well as for regional assessment of deep hydrocarbon resources.
In this report, I discuss an empirical approach to porosity prediction in deeply buried sandstones. Porosity trends are described as a function of thermal maturity, as represented by vitrinite reflectance (~). The porosity range at a given level of thermal maturity is predicted and is investigated as a function of rock properties such as clay content,
carbonate cementation, and grain size and as a possible function of hydrocarbon generation.
Examples are drawn from Cretaceous sandstones of the Rocky Mountain region, including the Lower Cretaceous J sandstone (an informal unit of the Muddy Sandstone) of the Denver Basin, Colorado, and Upper Cretaceous sandstones of the Mesaverde Group of the Piceance and Uinta basins, Colorado and Utah. This paper is not intended as a report on the geology of these units. Rather, the J and Mesaverde sandstones serve to illustrate an approach to porosity prediction that has broad applicability to deeply buried sandstones. Cretaceous sandstones of Rocky Mountain basins are themselves not deeply buried in many of the areas studied but were chosen as analogs because of the availability of porosity, vitrinite reflectance, and petrographic data.
APPROACH TO POROSITY PREDICTION
Predictive sandstone porosity models should account for effects on porosity of rock properties and burial history. Simply relating porosity to rock properties, as is sometimes done in petrographic and core studies, may yield descriptive data that are difficult to generalize into regional predictive models.
The influence of burial history on porosity commonly has been represented by plots of porosity versus depth (Athy, 1930; Maxwell, 1964; Baldwin and Butler, 1985); however, in recent years, apparent relations between porosity and depth have come under critical review (van de Kamp, 1976; Lyons, 1978, 1979; Cassan and others, 1981; Siever, 1983; Scherer, 1987; Schmoker and Gautier, 1988, 1989; Keighin and others, 1989; Bloch, 1991). The point made in many of these latter papers is that processes of porosity modification during burial are strongly influenced by thermal history.
89
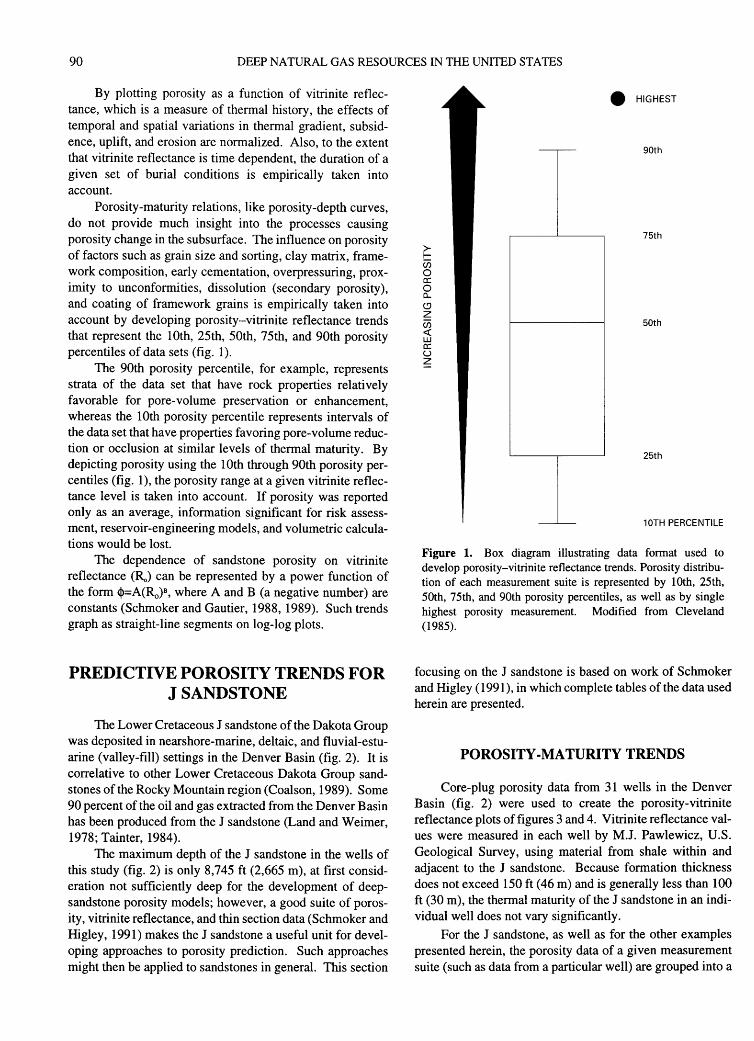
90 DEEP NATURAL GAS RESOURCES IN THE UNITED STATES
By plotting porosity as a function of vitrinite reflectance, which is a measure of thermal history, the effects of temporal and spatial variations in thermal gradient, subsidence, uplift, and erosion are normalized. Also, to the extent that vitrinite reflectance is time dependent, the duration of a given set of burial conditions is empirically taken into account.
Porosity-maturity relations, like porosity-depth curves, do not provide much insight into the processes causing porosity change in the subsurface. The influence on porosity of factors such as grain size and sorting, clay matrix, framework composition, early cementation, overpressuring, proximity to unconformities, dissolution (secondary porosity), and coating of framework grains is empirically taken into account by developing porosity-vitrinite reflectance trends that represent the lOth, 25th, 50th, 75th, and 90th porosity percentiles of data sets (fig. 1).
The 90th porosity percentile, for example, represents strata of the data set that have rock properties relatively favorable for pore-volume preservation or enhancement, whereas the 1Oth porosity percentile represents intervals of the data set that have properties favoring pore-volume reduction or occlusion at similar levels of thermal maturity. By depicting porosity using the lOth through 90th porosity percentiles (fig. 1), the porosity range at a given vitrinite reflectance level is taken into account. If porosity was reported only as an average, information significant for risk assessment, reservoir-engineering models, and volumetric calculations would be lost.
The dependence of sandstone porosity on vitrinite reflectance (R,) can be represented by a power function of the form <I>=A(Ro)8
, where A and B (a negative number) are constants (Schmoker and Gautier, 1988, 1989). Such trends graph as straight-line segments on log-log plots.
PREDICTIVE POROSITY TRENDS FOR JSANDSTONE
The Lower Cretaceous J sandstone of the Dakota Group was deposited in nearshore-marine, deltaic, and fluvial-estuarine (valley-fill) settings in the Denver Basin (fig. 2). It is correlative to other Lower Cretaceous Dakota Group sandstones of the Rocky Mountain region (Coalson, 1989). Some 90 percent of the oil and gas extracted from the Denver Basin has been produced from the J sandstone (Land and Weimer, 1978; Tainter, 1984).
The maximum depth of the J sandstone in the wells of this study (fig. 2) is only 8,745 ft (2,665 m), at first consideration not sufficiently deep for the development of deepsandstone porosity models; however, a good suite of porosity, vitrinite reflectance, and thin section data (Schmoker and Higley, 1991) makes the J sandstone a useful unit for developing approaches to porosity prediction. Such approaches might then be applied to sandstones in general. This section
>-1-U5 0 a: 0 c... <.9 z U5 <( L.U a: u z
--
• HIGHEST
90th
75th
50th
25th
10TH PERCENTILE
Figure 1. Box diagram illustrating data format used to develop porosity-vitrinite reflectance trends. Porosity distribution of each measurement suite is represented by 1Oth, 25th, 50th, 75th, and 90th porosity percentiles, as well as by single highest porosity measurement. Modified from Cleveland (1985).
focusing on the J sandstone is based on work of Schmoker and Higley ( 1991 ), in which complete tables of the data used herein are presented.
POROSITY -MATURITY TRENDS
Core-plug porosity data from 31 wells in the Denver Basin (fig. 2) were used to create the porosity-vitrinite reflectance plots of figures 3 and 4. Vitrinite reflectance values were measured in each well by M.J. Pawlewicz, U.S. Geological Survey, using material from shale within and adjacent to the J sandstone. Because formation thickness does not exceed 150ft (46 m) and is generally less than 100 ft (30 m), the thermal maturity of the J sandstone in an individual well does not vary significantly.
For the J sandstone, as well as for the other examples presented herein, the porosity data of a given measurement suite (such as data from a particular well) are grouped into a
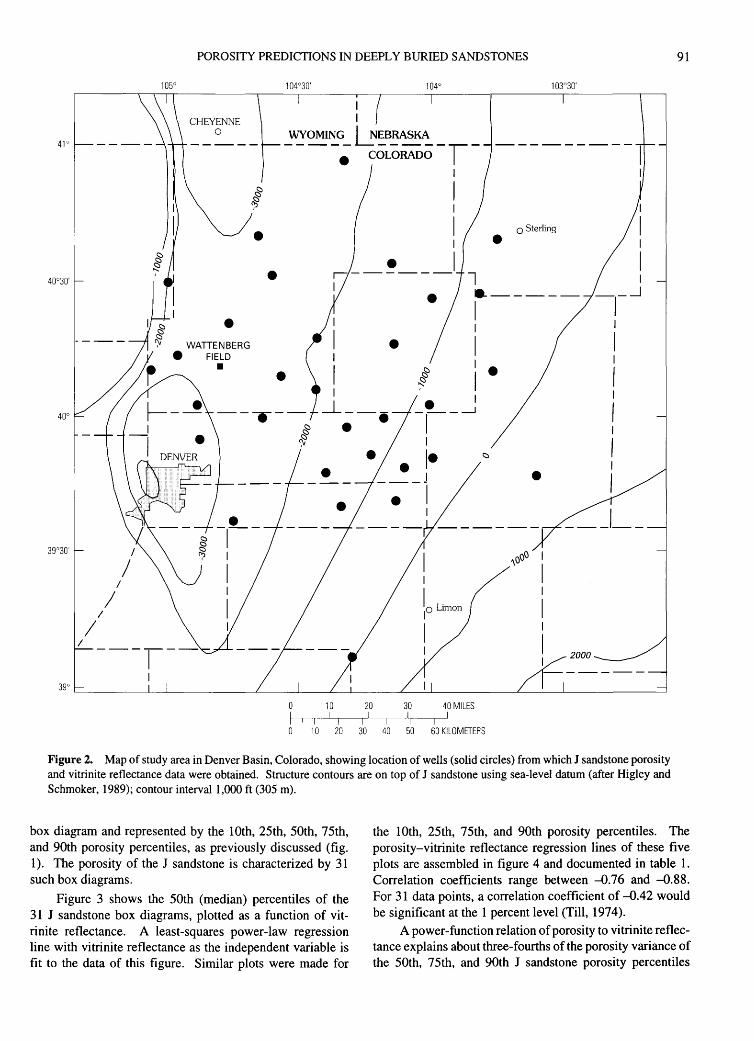
POROSITY PREDICTIONS IN DEEPLY BURIED SANDSTONES 91
105"
I I CHEYENNE
0 WYOMING ~EBRASKA ----; COLORADO--I--
•
• •
•
39°30'
I
I I
I I
39°
10 20 30
10 20 30 40 50
o Sterling
• l
• ._ ____ _
& ~
I
e I ___ __J
I I
I•
10 Limon I
I
40 MILES
60 KILOMETERS
•
•
"ooo
2000
Figure 2. Map of study area in Denver Basin, Colorado, showing location of wells (solid circles) from which J sandstone porosity and vitrinite reflectance data were obtained. Structure contours are on top of J sandstone using sea-level datum (after Higley and Schmoker, 1989); contour intervall,OOO ft (305m).
box diagram and represented by the lOth, 25th, 50th, 75th, and 90th porosity percentiles, as previously discussed (fig. 1). The porosity of the J sandstone is characterized by 31 such box diagrams.
Figure 3 shows the 50th (median) percentiles of the 31 J sandstone box diagrams, plotted as a function of vitrinite reflectance. A least-squares power-law regression line with vitrinite reflectance as the independent variable is fit to the data of this figure. Similar plots were made for
the lOth, 25th, 75th, and 90th porosity percentiles. The porosity-vitrinite reflectance regression lines of these five plots are assembled in figure 4 and documented in table 1. Correlation coefficients range between -0.76 and -0.88. For 31 data points, a correlation coefficient of -0.42 would be significant at the 1 percent level (Till, 1974).
A power-function relation of porosity to vitrinite reflectance explains about three-fourths of the porosity variance of the 50th, 75th, and 90th J sandstone porosity percentiles
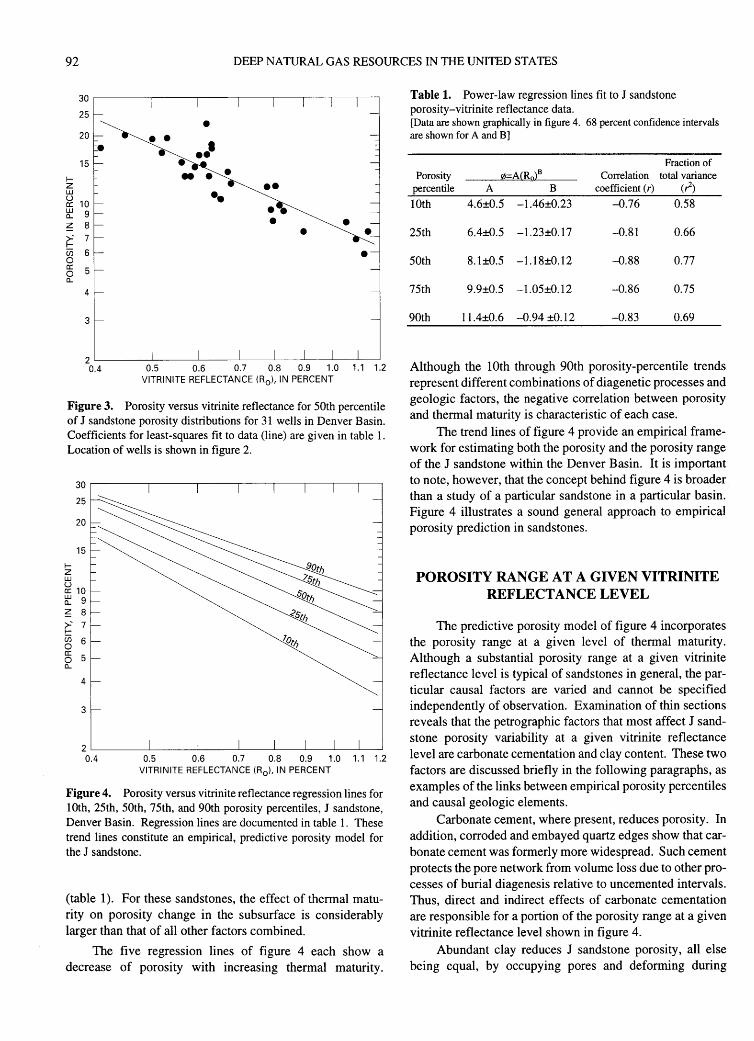
92 DEEP NATURAL GAS RESOURCES IN THE UNITED STATES
30
25
• 20 • • .. • 15 •
f- -• • z LI.J u
10 a: LI.J 9 a.. ~ 8
~- 7
•• •• •• • • (/) 6 0 a: 5 0 a..
4
3
2 0.4 0.5 0.6 0.7 0.8 0.9 1.0 1.1 1.2
VITRINITE REFLECTANCE (R0 ), IN PERCENT
Figure 3. Porosity versus vitrinite reflectance for 50th percentile of J sandstone porosity distributions for 31 wells in Denver Basin. Coefficients for least-squares fit to data (line) are given in table 1. Location of wells is shown in figure 2.
30~------~----~----~--~--~--~--~~
fz LI.J u
25
20
15
a: 10 ~ 9 ~ 8 >=" 7 f-
~ 6 § 5 a..
4
3
2~------~----~----~--~--~--~--~~
0.4 0.5 0.6 0.7 0.8 0.9 1.0 1.1 1.2 VITRINITE REFLECTANCE (R 0 ), IN PERCENT
Figure 4. Porosity versus vitrinite reflectance regression lines for lOth, 25th, 50th, 75th, and 90th porosity percentiles, J sandstone, Denver Basin. Regression lines are documented in table 1. These trend lines constitute an empirical, predictive porosity model for the J sandstone.
(table 1). For these sandstones, the effect of thermal maturity on porosity change in the subsurface is considerably larger than that of all other factors combined.
The five regression lines of figure 4 each show a decrease of porosity with increasing thermal maturity.
Table 1. Power-law regression lines fit to J sandstone porosity-vitrinite reflectance data. [Data are shown graphically in figure 4. 68 percent confidence intervals are shown for A and B]
Porosity percentile
lOth
25th
50th
75th
90th
A B
4.6±0.5 -1.46±0.23
6.4±0.5 -1.23±0.17
8.1±0.5 -1.18±0.12
9.9±0.5 -1.05±0.12
11.4±0.6 -0.94 ±0.12
Fraction of Correlation total variance
coefficient (r) (?)
-0.76 0.58
-0.81 0.66
-0.88 0.77
-0.86 0.75
-0.83 0.69
Although the lOth through 90th porosity-percentile trends represent different combinations of diagenetic processes and geologic factors, the negative correlation between porosity and thermal maturity is characteristic of each case.
The trend lines of figure 4 provide an empirical framework for estimating both the porosity and the porosity range of the J sandstone within the Denver Basin. It is important to note, however, that the concept behind figure 4 is broader than a study of a particular sandstone in a particular basin. Figure 4 illustrates a sound general approach to empirical porosity prediction in sandstones.
POROSITY RANGE AT A GIVEN VITRINITE REFLECTANCE LEVEL
The predictive porosity model of figure 4 incorporates the porosity range at a given level of thermal maturity. Although a substantial porosity range at a given vitrinite reflectance level is typical of sandstones in general, the particular causal factors are varied and cannot be specified independently of observation. Examination of thin sections reveals that the petrographic factors that most affect J sandstone porosity variability at a given vitrinite reflectance level are carbonate cementation and clay content. These two factors are discussed briefly in the following paragraphs, as examples of the links between empirical porosity percentiles and causal geologic elements.
Carbonate cement, where present, reduces porosity. In addition, corroded and embayed quartz edges show that carbonate cement was formerly more widespread. Such cement protects the pore network from volume loss due to other processes of burial diagenesis relative to uncemented intervals. Thus, direct and indirect effects of carbonate cementation are responsible for a portion of the porosity range at a given vitrinite reflectance level shown in figure 4.
Abundant clay reduces J sandstone porosity, all else being equal, by occupying pores and deforming during
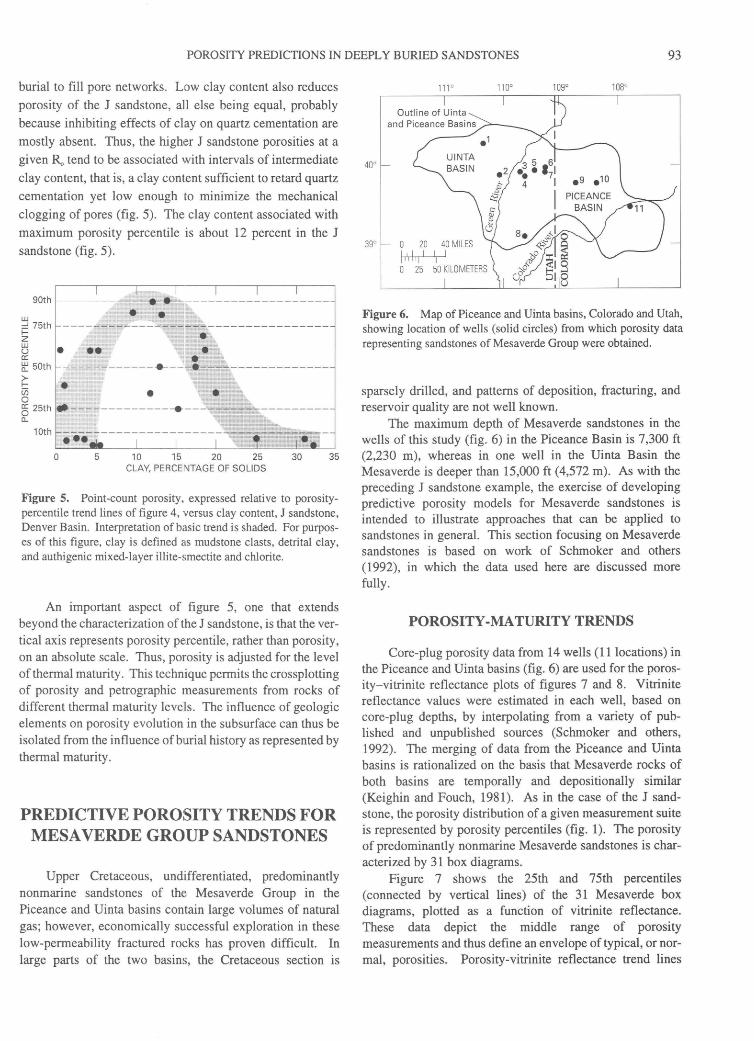
POROSITY PREDICTIONS IN DEEPLY BURIED SANDSTONES 93
burial to fill pore networks. Low clay content also reduces
porosity of the J sandstone, all else being equal, probably
because inhibiting effects of clay on quartz cementation are
mostly absent. Thus, the higher J sandstone porosities at a
given R, tend to be associated with intervals of intermediate
clay content, that is, a clay content sufficient to retard quartz
cementation yet low enough to minimize the mechanical
clogging of pores (fig. 5). The clay content associated with
maximum porosity percentile is about 12 percent in the J
sandstone (fig. 5).
LlJ ::::! 75th f-z LlJ u a: ~50th
~ U5 0 ~25th 0..
10th
0 5 10 15 20 25 30 35 CLAY, PERCENTAGE OF SOLIDS
Figure 5. Point-count porosity, expressed relative to porositypercentile trend lines of figure 4, versus clay content, J sandstone, Denver Basin. Interpretation of basic trend is shaded. For purposes of this figure, clay is defined as mudstone clasts, detrital clay, and authigenic mixed-layer illite-smectite and chlorite.
An important aspect of figure 5, one that extends beyond the characterization of the J sandstone, is that the vertical axis represents porosity percentile, rather than porosity, on an absolute scale. Thus, porosity is adjusted for the level of thermal maturity. This technique permits the crossplotting of porosity and petrographic measurements from rocks of different thermal maturity levels. The influence of geologic elements on porosity evolution in the subsurface can thus be isolated from the influence of burial history as represented by thermal maturity.
PREDICTIVE POROSITY TRENDS FOR MESA VERDE GROUP SANDSTONES
Upper Cretaceous, undifferentiated, predominantly nonmarine sandstones of the Mesaverde Group in the Piceance and Uinta basins contain large volumes of natural gas; however, economically successful exploration in these low-permeability fractured rocks has proven difficult. In large parts of the two basins, the Cretaceous section is
Figure 6. Map of Piceance and Uinta basins, Colorado and Utah, showing location of wells (solid circles) from which porosity data representing sandstones of Mesaverde Group were obtained.
sparsely drilled, and patterns of deposition, fracturing, and reservoir quality are not well known.
The maximum depth of Mesaverde sandstones in the wells of this study (fig. 6) in the Piceance Basin is 7,300 ft (2,230 m), whereas in one well in the Uinta Basin the Mesaverde is deeper than 15,000 ft (4,572 m). As with the preceding J sandstone example, the exercise of developing predictive porosity models for Mesaverde sandstones is intended to illustrate approaches that can be applied to sandstones in general. This section focusing on Mesaverde sandstones is based on work of Schmoker and others (1992), in which the data used here are discussed more fully.
POROSITY -MATURITY TRENDS
Core-plug porosity data from 14 wells (11locations) in the Piceance and Uinta basins (fig. 6) are used for the porosity-vitrinite reflectance plots of figures 7 and 8. Vitrinite reflectance values were estimated in each well, based on core-plug depths, by interpolating from a variety of published and unpublished sources (Schmoker and others, 1992). The merging of data from the Piceance and Uinta basins is rationalized on the basis that Mesaverde rocks of both basins are temporally and depositionally similar (Keighin and Fouch, 1981 ). As in the case of the J sandstone, the porosity distribution of a given measurement suite is represented by porosity percentiles (fig. 1). The porosity of predominantly nonmarine Mesaverde sandstones is characterized by 31 box diagrams.
Figure 7 shows the 25th and 75th percentiles (connected by vertical lines) of the 31 Mesaverde box diagrams, plotted as a function of vitrinite reflectance. These data depict the middle range of porosity measurements and thus define an envelope of typical, or normal, porosities. Porosity-vitrinite reflectance trend lines

94 DEEP NATURAL GAS RESOURCES IN THE UNITED STATES
~ 10 UJ 9 ~ 8 UJ 7 ~ 6
>-' 5 ~ 4 0 gs 3 CL
2
1~--~--~_L~ __ L_L_ ______ L_ __ ~--~~~
0.4 0.5 0.6 0.7 0.8 0.91.0 1.5 2.0 2.5 3.0 VITRINITE REFLECTANCE (R 0 ), IN PERCENT
Figure 7. Porosity versus vitrinite reflectance for 25th through 75th percentiles (vertical lines) of porosity distributions for 31 samples of sandstone of the Mesaverde Group from 11 locations in Piceance and Uinta basins. Type curve, 1Oth percentile, and 90th percentile dashed lines provide a reference framework that represents sandstones in general (Schmoker and Gautier, 1989; Schmoker and Hester, 1990). Sample locations are shown in figure 6.
~\ Li~it of highest yporos1ty measurements
\---~,-----"
___ jli_ll\11~~-J_Ik_l+-- "1-::::_ ~8 perc~nt 1 11
poros1ty
4~--L-~---L~~--L_----~----_L--~--~
0.4 0.5 0.6 0.7 0.8 0.9 1.0 1.5 2.0 2.5 3.0 VITRINITE REFLECTANCE (R 0 ), IN PERCENT
Figure 8. Porosity versus vitrinite reflectance for 75th percentiles through single highest measurements (vertical lines) of porosity distributions for 31 samples of sandstone of the Mesaverde Group from 11 locations in the Piceance and Uinta basins. Sample locations are shown in figure 6.
representing combined data sets of other formations are also
shown in figure 7. The dashed line labeled "type curve" was
presented by Schmoker and Gautier ( 1989) as a typical
porosity versus thermal maturity curve for clastic rocks. The
dashed lines labeled "lOth percentile" and "90th percentile"
are from Schmoker and Hester (1990) and form an envelope
that encompasses 80 percent of their porosity data from var
ious basins and formations. These three trend lines provide
a reference framework against which to compare Mesaverde
porosities.
Porosities of predominantly nonmarine Mesaverde sandstones have been described as low relative to other sandstones; however, comparison to the reference lines of figure 7 demonstrates that this is not the general case if levels of time-temperature exposure (vitrinite reflectance) are taken into consideration. In sharp contrast to J sandstone porosities, which decrease systematically as vitrinite reflectance increases (figs. 3, 4 ), the middle porosity range of Mesaverde sandstones does not show an overall porosity decrease between R0 of 0.7 and 1.8 percent (fig. 7). Whether casual or causal, these vitrinite reflectance levels approximate the window of active hydrocarbon generation (Tissot and Welte, 1984) for the type III kerogen present in nonmarine parts of the Mesaverde Group. Between R0 of 0.7 and 1.8 percent, Mesaverde sandstones have typical porosities in the 5-8 percent range (fig. 7).
Figure 8 shows the 75th percentiles and the single highest measurements (connected by vertical lines) of the 31 Mesaverde box diagrams, plotted as a function of vitrinite reflectance. These data depict the upper quartile of porosity measurements and thus define an envelope of above average porosities. Two reference lines (dashed) are also shown in figure 8. One marks the 8 percent porosity level, which is sometimes taken as an arbitrary lower cutoff for sandstone reservoirs, and the other approximates the high-porosity limit of the data set.
The distribution of upper quartile Mesaverde porosities (fig. 8) is similar in overall shape to that of the middle range of Mesaverde porosities (fig. 7). For vitrinite reflectance between 0. 7 and 1.8 percent, Mesaverde sandstones are likely to have some intervals in which porosity is greater than 8 percent; the maximum porosity in this thermal maturity range is about 13 percent (fig. 8).
Models for the porosity and porosity range of the J and Mesaverde sandstones predict quite different responses of porosity to increasing thermal maturity (figs. 4, 7, 8); however, both models result from the same empirical method of porosity prediction. This method is robust and offers a sound general approach to the problem of porosity prediction in deeply buried sandstones.
POROSITY RANGE AT A GIVEN VITRINITE REFLECTANCE LEVEL
The predictive porosity model of figures 7 and 8 incorporates the porosity range at a given level of thermal maturity. Petrographic data indicate that proximity to the unconformity at the top of the Mesaverde Group, dissolution of early carbonate cement, larger grain size, and lower claymatrix content are all factors favoring higher porosities in Mesaverde sandstones. These factors are discussed as additional examples of the links between empirical porosity percentiles and causal geologic elements.

POROSITY PREDICTIONS IN DEEPLY BURIED SANDSTONES 95
Secondary porosity is probably best developed immediately below the Tertiary-Cretaceous unconformity at the top of the Mesaverde Group, and enhanced dissolution may be associated with surface weathering (Hansley and Johnson, 1990). The unconformity might also have enhanced later stage dissolution, in the subsurface, by focusing the flow of basin waters.
Porosities of Mesaverde sandstones greater than a few percent are unlikely if carbonate cement (determined by point-counting thin sections) exceeds about 12 percent. As in the case of the J sandstone, carbonate cement might have been widespread in intervals that now have little such cement. Early carbonate cement could preserve the pore network from mechanical and chemical compaction during burial relative to uncemented intervals; carbonate-cement dissolution could then develop relatively high, secondary porosity.
Grain size can influence the rate and extent of burial diagenesis (Houseknecht, 1984, and references therein). Data to test for a relation between grain size and porosity in Mesaverde sandstones are plotted in figure 9. The porosity ranges of the different grain-size categories are large and overlap; however, the midpoint porosity of each porosity range increases as grain size increases. These data (fig. 9) indicate a weak relation between grain size and porosity and suggest porosity that is higher in sandstones of larger grain size.
Data to test for a relation between clay-matrix content and porosity in Mesaverde sandstones are plotted in figure 10. Pseudomatrix and authigenic clays resulting from matrix recrystallization are included, to some extent, in the category of clay-matrix content. In contrast to the J sandstone (fig. 5),
w ~ 0 20 z <(
ffi VF~---~----~----~---~ F ___________ ..._ _______ _
M --~--~~··-----1 I I
0 5 10 15 20 VISIBLE PORE SPACE, IN PERCENT
Figure 9. Core-plug porosity and visible pore space (as determined from point counting) as a function of grain size for Mesaverde Group sandstones from Colorado Interstate Gas Exploration Natural Buttes 21 well, sec. 15, T. 10 S., R. 22 E., Uintah County, Utah (loc. 5, fig. 6) (Pitman and others, 1986, 1987). Grain size: VF, very fine, 62-125 microns (micrometers); F, fine, 125-250 microns; M, medium, 250-500 microns.
figure 10 shows no evidence of an association between optimum porosity and intermediate clay content. Although a predictive relation between clay-matrix content and porosity cannot be proposed for the Mesaverde, maximum porosity decreases systematically as matrix content increases (fig. 10). Porosities greater than a few percent are improbable if clay-matrix content exceeds 8 percent.
The examples of the J and Mesaverde sandstones show how effects of geologic factors on porosity range can be incorporated within a thermal maturity framework.
PREDICTIVE POROSITY TRENDS FOR UNDIFFERENTIATED CRETACEOUS
SANDSTONES OF ROCKY MOUNTAIN REGION
Porosity and vitrinite reflectance data from Cretaceous sandstones of Rocky Mountain basins can be combined to develop generic, regional models for porosity as a function of vitrinite reflectance. As in the examples of preceding sections, which focus on individual formations, the development of a predictive porosity model for Cretaceous sandstones of the Rocky Mountain region is intended primarily to illustrate approaches that can be applied to sandstones in general and to deeply buried sandstones in particular.
The Cretaceous data set described in table 2 represents formations in five different basins, a variety of geologic settings, and a wide range of thermal maturities and depths. The J sandstone and Mesaverde Group measurement suites of the preceding sections make up 58 percent of the combined Cretaceous data set.
Ideally, the measurement suites assembled here would represent a comprehensive sampling of all Rocky Mountain Cretaceous sandstones; however, in reality the data set is limited (table 2). Furthermore, wells in these basins are drilled according to specific selection criteria and do not provide an unbiased sampling of the subsurface. Nevertheless, the data set is thought to be sufficient to illustrate characteristics of generic, regional models for porosity and porosity range in which porosity predictivity is based on the level of thermal exposure.
POROSITY-THERMAL MATURITY TRENDS
Vitrinite reflectance is proportional to thermal exposure, which strongly influences burial diagenesis (Siever, 1983), and, as a result, porosity data from basins of varied temperature distributions and burial histories can be combined using vitrinite reflectance as the independent variable of comparison. Depth is sometimes used as the comparison variable, on the implicit assumption that depth is a direct measure of thermal history. Although this assumption is

96 DEEP NATURAL GAS RESOURCES IN THE UNITED STATES
20
15 • f-z L.LJ u 0:: L.LJ a... ~ • L.LJ-
u -· ~ 10 (/)
II L.LJ 0:: 0 •II• a... L.LJ _J
co • U5 > Limit of highest .a.. • • ·--· porosity measurements
5
II • • • •
0
0 5 10 15 20 25+ CLAY MATRIX, IN PERCENT
Figure 10. Point-count data showing visible pore space as a function of clay-matrix content for Mesaverde Group sandstones, from Colorado Interstate Gas Exploration Natural Buttes 21 well (sec. 15, T. 10 S., R. 22 E., Uintah County, Utah) (loc. 5, fig. 6) and Exxon Wilkin Ridge 1 well (sec. 29, T. 10 S., R. 17 E., Duchesne County, Utah) (loc. 2, fig. 6) (Pitman and others, 1988). Because vitrinite reflectance values for Mesaverde rocks in these two wells are similar (0. 75-0.95 percent), porosity need not be expressed relative to porosity-percentile trend lines as in figure 5.
valid for some geologic settings, it is invalid for Rocky Mountain basins. As shown in figure 11, vitrinite reflectance cannot be accurately predicted on the basis of present-day depth within and between Rocky Mountain basins.
Present depth is not a good measure of thermal history in these basins and is therefore not a good parameter for combining the diverse Cretaceous sandstone porosity data of this study.
The lOth, 25th, 50th, 75th, and 90th percentiles (fig. 1) of 107 box diagrams, representing Cretaceous sandstones in the Denver, Green River, Powder River, Uinta, and Piceance Basins (table 2), are plotted as a function of vitrinite reflectance in figures 12-16. For each porosity percentile, an overall decrease of porosity with increasing vitrinite reflectance is apparent. Least-squares power-law regression lines with vitrinite reflectance as the independent variable are fit to the data of figures 12-16 (table 3). Correlation coefficients range between -D.60 and -D.76 (table 3). These correlation coefficients are somewhat lower than those for
the J sandstone data set (table 1), as might be expected because of the greater geologic diversity and range of thermal maturity of the regional Cretaceous data set. For 107 data points, a correlation coefficient of -D.22 would be significant at the 1 percent level (Till, 197 4 ).
The fraction of the total variance explained by the regression lines of figures 12-16 increases from 0.36 for the lOth porosity percentile to 0.58 for the 90th percentile. The higher porosity percentiles are thus modeled with more confidence than the lower percentiles. A power-function relation of porosity to vitrinite reflectance explains slightly more than half of the porosity variance of the 50th, 75th, and 90th percentiles (table 3). For these diverse Rocky Mountain Cretaceous sandstones, the effect of thermal exposure on porosity change in the subsurface is at least equal to that of all other factors combined.
The porosity-vitrinite reflectance regression lines of figures 12-16 together provide a possible empirical framework for estimating the porosity and the porosity range of
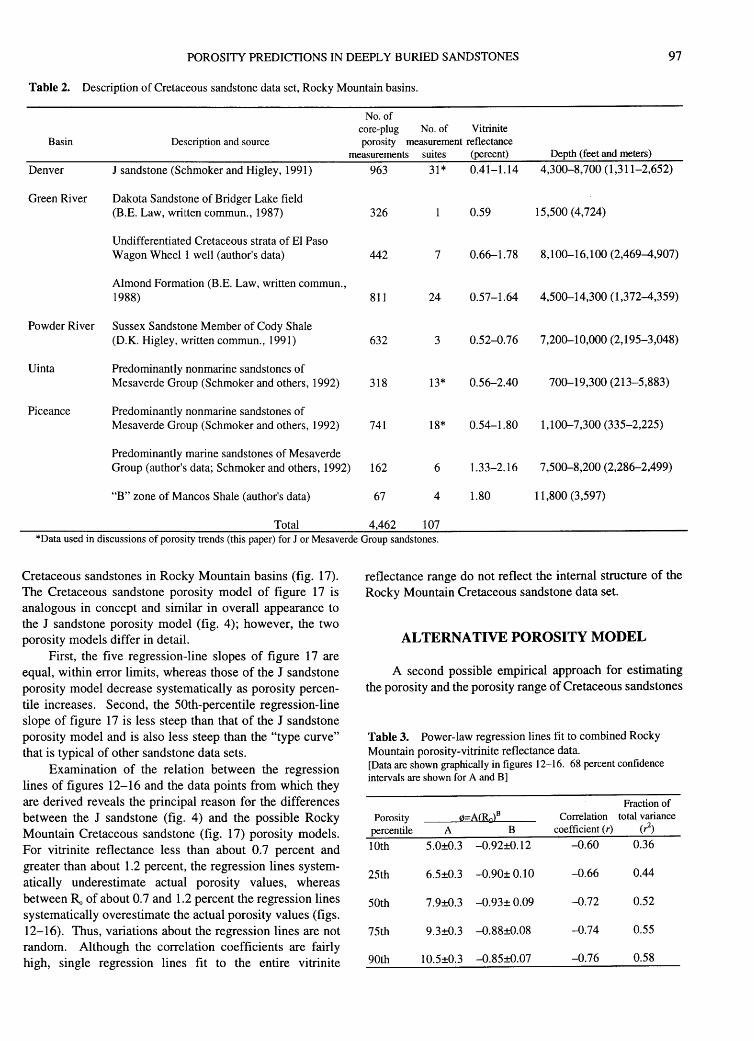
POROSITY PREDICTIONS IN DEEPLY BURIED SANDSTONES 97
Table 2. Description of Cretaceous sandstone data set, Rocky Mountain basins.
No. of core-plug No. of Vitrinite
Basin Description and source porosity measurement reflectance measurements suites (percent) Depth (feet and meters)
Denver J sandstone (Schmoker and Higley, 1991) 963 31* 0.41-1.14 4,300-8,700 (1,311-2,652)
Green River Dakota Sandstone of Bridger Lake field (B.E. Law, written commun., 1987) 326 0.59 15,500 (4,724)
Undifferentiated Cretaceous strata of El Paso Wagon Wheel 1 well (author's data) 442 7 0.66-1.78 8,100-16,100 (2,469-4,907)
Almond Formation (B.E. Law, written commun., 1988) 811 24 0.57-1.64 4,500-14,300 (1 ,372-4,359)
Powder River Sussex Sandstone Member of Cody Shale (O.K. Higley, written commun., 1991) 632 3 0.52-0.76 7,200-10,000 (2,195-3,048)
Uinta Predominantly nonmarine sandstones of Mesaverde Group (Schmoker and others, 1992) 318 13* 0.56-2.40 700-19,300 (213-5,883)
Piceance Predominantly nonmarine sandstones of Mesaverde Group (Schmoker and others, 1992) 741 18* 0.54-1.80 1 '1 00-7,300 (335-2,225)
Predominantly marine sandstones of Mesaverde Group (author's data; Schmoker and others, 1992) 162 6 1.33-2.16 7,500-8,200 (2,286-2,499)
"B" zone of Mancos Shale (author's data) 67 4 1.80 11,800 (3,597)
Total 4,462 107 *Data used in discussions of porosity trends (this paper) for J or Mesaverde Group sandstones.
Cretaceous sandstones in Rocky Mountain basins (fig. 17). The Cretaceous sandstone porosity model of figure 17 is analogous in concept and similar in overall appearance to the J sandstone porosity model (fig. 4); however, the two porosity models differ in detail.
First, the five regression-line slopes of figure 17 are equal, within error limits, whereas those of the J sandstone porosity model decrease systematically as porosity percentile increases. Second, the 50th-percentile regression-line slope of figure 17 is less steep than that of the J sandstone porosity model and is also less steep than the "type curve" that is typical of other sandstone data sets.
Examination of the relation between the regression lines of figures 12-16 and the data points from which they are derived reveals the principal reason for the differences between the J sandstone (fig. 4) and the possible Rocky Mountain Cretaceous sandstone (fig. 17) porosity models. For vitrinite reflectance less than about 0.7 percent and greater than about 1.2 percent, the regression lines systematically underestimate actual porosity values, whereas between R of about 0.7 and 1.2 percent the regression lines systematically overestimate the actual porosity values (figs. 12-16). Thus, variations about the regression lines are not random. Although the correlation coefficients are fairly high, single regression lines fit to the entire vitrinite
reflectance range do not reflect the internal structure of the Rocky Mountain Cretaceous sandstone data set.
ALTERNATIVE POROSITY MODEL
A second possible empirical approach for estimating the porosity and the porosity range of Cretaceous sandstones
Table 3. Power-law regression lines fit to combined Rocky Mountain porosity-vitrinite reflectance data. [Data are shown graphically in figures 12-16. 68 percent confidence intervals are shown for A and B]
Porosity percentile lOth
25th
50th
75th
90th
A B 5.0±0.3 -0.92±0.12
6.5±0.3 -0.90± 0.10
7.9±0.3 -0.93± 0.09
9.3±0.3 -0.88±0.08
1 0.5±0.3 -0.85±0.07
Correlation coefficient (r)
-0.60
-0.66
-0.72
-0.74
-0.76
Fraction of total variance
(?)
0.36
0.44
0.52
0.55
0.58
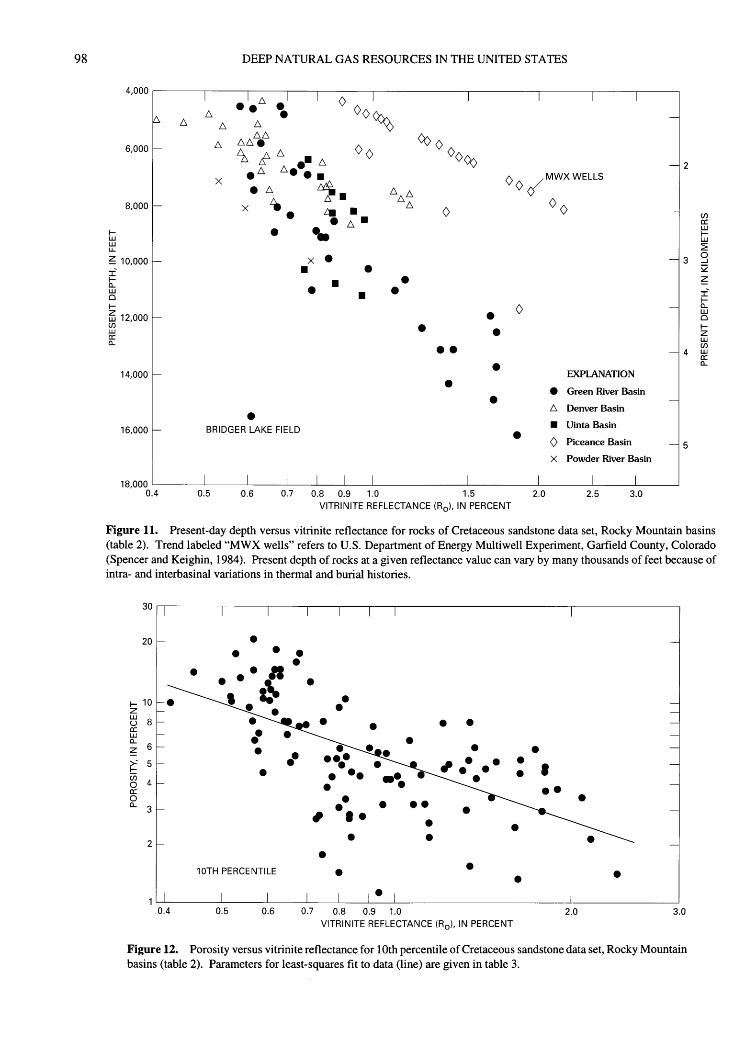
98
fL.LJ L.LJ L.L.
6,000 I-
8,000-
~ 10,000-:i t L.LJ 0 f-
dJ 12,000 -(/) L.LJ c:::: c...
14,000-
16,000-
DEEP NATURAL GAS RESOURCES IN THE UNITED STATES
X
•
• BRIDGER LAKE FIELD
La • . /:::,.. .. X •
• • • • • • • •
•• •
• • • •
() () if MWX WELLS
oo
•
EXPlANATION
e Green River Basin
/:::,. Denver Basin
• Uinta Basin
() Piceance Basin
X Powder River Basin
-
-2
-(/) c:::: L.LJ fL.LJ
:2: -3 g
S2
-
~ :::c' t L.LJ 0 fz L.LJ (/)
-4 ~ c...
-
-5
18,000 L__ _ ____._I __ IL___.L__I_...L...__ I_.L__I_L___I ____ L___I __ ------'---I ___ L___I _ _LI _ _____j
0.4 0.5 0.6 0.7 0.8 0.9 1.0 1.5 2.0 2.5 3.0 VITRINITE REFLECTANCE (R0 ), IN PERCENT
Figure 11. Present-day depth versus vitrinite reflectance for rocks of Cretaceous sandstone data set, Rocky Mountain basins (table 2). Trend labeled "MWX wells" refers to U.S. Department of Energy Multiwell Experiment, Garfield County, Colorado (Spencer and Keighin, 1984). Present depth of rocks at a given reflectance value can vary by many thousands of feet because of intra- and interbasinal variations in thermal and burial histories .
20
f- 10 z ~ 8 c:::: L.LJ
~ 6
~- 5
~ 4 c:::: 0 c... 3
2
• • • .. ·~: • a: • •• • •
10TH PERCENTILE
0.5 0.6
• •
••
• • •
•
• • , ... •
• •
0.7 0.8 0.9 1.0
•
•• • •
• •
•
•
• •
•
•
VITRINITE REFLECTANCE (R 0 ), IN PERCENT
• I
•• •
• 2.0 3.0
Figure 12. Porosity versus vitrinite reflectance for 1Oth percentile of Cretaceous sandstone data set, Rocky Mountain basins (table 2). Parameters for least-squares fit to data (line) are given in table 3.
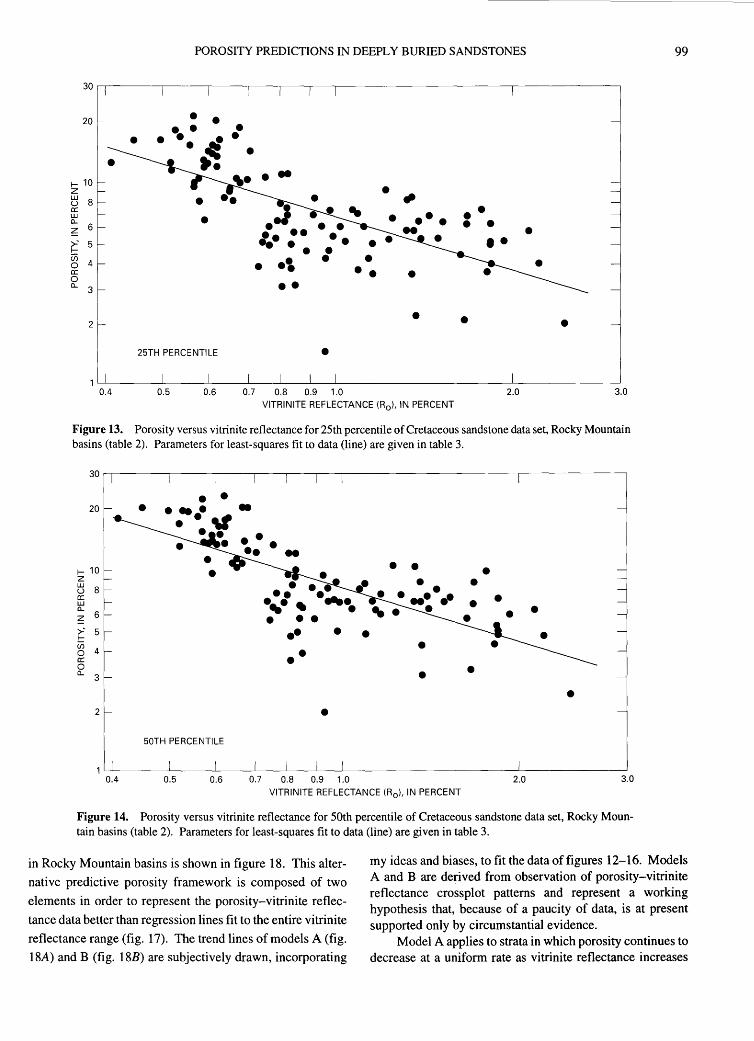
POROSITY PREDICTIONS IN DEEPLY BURIED SANDSTONES 99
20
f- 10 z tj 8 a: w 0...
~ 6
~- 5
~ 4 a: 0 0... 3
2
0.4
•
• ••
25TH PERCENTILE • 0.5 0.6 0.7 0.8 0.9 1.0
• fl'
• • • • • •• •
• • •
2.0 3.0 VITRINITE REFLECTANCE (R0 ), IN PERCENT
Figure 13. Porosity versus vitrinite reflectance for 25th percentile of Cretaceous sandstone data set, Rocky Mountain basins (table 2). Parameters for least-squares fit to data (line) are given in table 3.
20
f- 10 z tj 8 a: w 0...
~ 6
~- 5
~ 4 a: 0 0... 3
2
0.4
•
50TH PERCENTILE
0.5 0.6
• ••••• .... ' ..... • • • ••
•• •
•
0.7 0.8 0.9 1.0
• • •
• • •
•
• •
•
2.0 3.0
VITRINITE REFLECTANCE (R 0 ), IN PERCENT
Figure 14. Porosity versus vitrinite reflectance for 50th percentile of Cretaceous sandstone data set, Rocky Mountain basins (table 2). Parameters for least-squares fit to data (line) are given in table 3.
in Rocky Mountain basins is shown in figure 18. This alter
native predictive porosity framework is composed of two
elements in order to represent the porosity-vitrinite reflec
tance data better than regression lines fit to the entire vitrinite
reflectance range (fig. 17). The trend lines of models A (fig.
18A) and B (fig. 18B) are subjectively drawn, incorporating
my ideas and biases, to fit the data of figures 12-16. Models A and B are derived from observation of porosity-vitrinite reflectance crossplot patterns and represent a working hypothesis that, because of a paucity of data, is at present supported only by circumstantial evidence.
Model A applies to strata in which porosity continues to decrease at a uniform rate as vitrinite reflectance increases

100 DEEP NATURAL GAS RESOURCES IN THE UNITED STATES
20
• • f- 10 • z
w 8 •• u
a: • w 0....
6 • ~ • ~ 5 • ' U5 • • 0 4 a: 0 0....
3 • 2
75TH PERCENTILE
0.4 0.5 0.6 0.7 0.8 0.9 1.0 2.0 3.0 VITRINITE REFLECTANCE (R0 ), IN PERCENT
Figure 15. Porosity versus vitrinite reflectance for 75th percentile of Cretaceous sandstone data set, Rocky Mountain basins (table 2). Parameters for least-squares fit to data (line) are given in table 3.
20
f- 10 z ~ 8 a: w 0.... z 6
~- 5
~ 4 a: 0 0.... 3
2
•
90TH PERCENTILE
• • -c-• •••••
I • • • .... • • • • •
• • • •• • •
• •
1~------~------L---~----L---~--L-----------------------~--------------~ 0.4 0.5 0.6 0.7 0.8 0.9 1.0 2.0 3.0
VITRINITE REFLECTANCE (R0 ), IN PERCENT
Figure 16. Porosity versus vitrinite reflectance for 90th percentile of Cretaceous sandstone data set, Rocky Mountain basins (table 2). Parameters for least-squares fit to data (line) are given in table 3.
above 0.9 percent. Model B applies to strata in which the rate of porosity loss slows as vitrinite reflectance increases above 0.9 percent. (The abrupt change in slope shown in figure 18B schematically represents a transition zone.) For vitrinite reflectance less than 0.9 percent, models A and B are identical.
Differences in models A and B do not directly reflect variability in rock properties such as grain size and sorting, shale content, composition of framework grains, and so on. The effects on porosity of these factors are already incorporated in the porosity range defined by the 1Oth through 90th porosity percentiles. Rather, models A and Bare interpreted

POROSITY PREDICTIONS IN DEEPLY BURIED SANDSTONES 101
20
f- 10 z ~ 8 0: w a... ~ 6
~- 5
~ 4 0: 0 a... 3
2
0.4 0.5 0.6 0.7 0.8 0.9 1.0 2.0 3.0
VITRINITE REFLECTANCE (R0 ), IN PERCENT
Figure 17. Summary figure showing regression lines representing lOth, 25th, 50th, 75th, and 90th porosity percentiles versus vitrinite reflectance shown in figures 12-16 for the Cretaceous sandstone data set, Rocky Mountain basins. These trend lines constitute a possible empirical, predictive porosity model for Cretaceous sandstones of the Rocky Mountain region. An alternative model is presented in figure 18. Dashed type curve (also shown in figures 7 and 18) provides a reference line that represents sandstones in general (Schmoker and Gautier, 1989).
as representing sandstones in which porosity evolution follows fundamentally different pathways.
The predictive porosity models of figure 17 and figure 18A are conceptually similar in that each line segment spans the entire thermal maturity range. Such models implicitly assume that the net effect on porosity of various diagenetic processes, operative at different levels of thermal maturity, can be approximated by single power functions over a large vitrinite reflectance range. This assumption does not seem obvious a priori but is empirically supported by a number of published data sets (Schmoker and Gautier, 1988, 1989; Schmoker and Hester, 1990; Schmoker and Higley, 1991). A single porosity-vitrinite reflectance power function spanning a large vitrinite reflectance range is analogous to a single porosity-depth exponential function spanning a large depth range (Schmoker and Gautier, 1988). Such porositydepth exponential curves are common in the literature, although the underlying assumptions are rarely discussed.
The line segments of figure 18B change slope as vitrinite reflectance increases. Such porosity models implicitly assume that the net effect on porosity of various diagenetic processes varies as different processes wax and wane during burial. Figure 18B could not be depicted by a single exponential curve in the porosity-depth domain.
The choice of diagenetic pathway (model A versus model B) is important for sandstone porosity prediction in
deep parts of Rocky Mountain basins. At 2.0 percent R0 , for example, model A predicts median porosities of about 2 percent and 90th-percentile porosities of only 4 percent; in contrast, model B predicts median porosities of about 5 percent and 90th-percentile porosities of 8 percent. Extrapolating beyond the data to 3.0 percent Ro, model A predicts lOththrough 90th-percentile porosities to all be less than 3 percent, whereas model B predicts some porosities of 6-7 percent. Reference to figure 11 shows that maximum depths of economic production predicted by model A in a given area of a basin would be thousands of feet less than those predicted by model B.
As is apparent from the foregoing porosity comparisons, the hypothesis that porosity evolution can follow distinctly different pathways as vitrinite reflectance increases above 0.9 percent has significant implications for the economic production of deeply buried hydrocarbons. Understanding which sandstones follow models analogous to A and which follow models analogous to B is important. At this point, however, such understanding is uncertain, and the following discussion of cause and effect is speculative.
The particular strata of the data set that conform to model B are from the Almond Formation in the Green River Basin and the Mesaverde Group (marine and nonmarine) in the Piceance Basin (table 2). Low-permeability sandstones in both formations are commonly overpressured at vitrinite

102
20
f- 10 z ~ 8 a: L.U c... z 6
~- 5
~ 4 a: 0 c... 3
2
20
f- 10 z ~ 8 a: L.U c... z 6
~- 5
~ 4 a: 0 c... 3
2
0.4
A
DEEP NATURAL GAS RESOURCES IN THE UNITED STATES
Ro =0.9 percent
0.5 0.6 0.7 0.8 0.9 1.0 2.0 VITRINITE REFLECTANCE (R0 ), IN PERCENT
Ro =0.9 percent
TYPE CURVE
/ TYPE
CURVE
3.0
1~------~------~--~----~--~--~----------------------~--------------~ 0.4 0.5 0.6 0.7 0.8 0.9 1.0 2.0 3.0
VITRINITE REFLECTANCE (R 0 ), IN PERCENT
B Figure 18. Subjectively drawn trend lines representing lOth, 25th, 50th, 75th, and 90th porosity percentiles versus vitrinite reflectance, Cretaceous sandstone data set, Rocky Mountain basins. These trend lines constitute an alternative predictive porosity model to the set of regression lines of figure 17. Dashed type curve (also shown in figures 7 and 17) provides a reference line that represents sandstones in general (Schmoker and Gautier, 1989). For vitrinite reflectance less than 0.9 percent, trend lines of A and Bare identical and represent all data (figs. 12-16). For vitrinite reflectance greater than 0.9 percent, trend lines of A represent strata in which porosity continues to decrease at a uniform rate and trend lines of B represent strata in which the rate of porosity loss decreases.
reflectance greater than 0.9 percent due to hydrocarbon generation (Spencer, 1987). It is thus possible that some Cretaceous sandstones of Rocky Mountain basins do not follow
normal diagenetic pathways (fig. 18A) because of the effects on diagenesis of hydrocarbon generation from adjacent and intercalated coals and organic-rich shales.

POROSITY PREDICTIONS IN DEEPLY BURIED SANDSTONES 103
Hydrocarbon generation, of which overpressuring in the nonsubsiding basins of the Rocky Mountain region is evidential (Spencer, 1987), has the potential to retard porosity loss as vitrinite reflectance increases (fig. 18B) in at least three ways. First, hydrocarbons can inhibit cementation by displacing pore water. Second, carbon dioxide (Schmidt and McDonald, 1979) and organic acids (Surdam and others, 1989) produced by the thermal breakdown of kerogen can create secondary porosity by dissolving cements and framework grains. Third, overpressuring can slow pressure solution and associated porosity decrease by reducing the lithostatic load; overpressuring can also reduce cementation through development of a fluid-flow system characterized by expulsion, rather than exchange, of liquids.
If hydrocarbon generation is indeed the primary underlying process causing some sandstones to deviate from porosity-vitrinite reflectance trends similar to those of figure 18A and follow instead trends similar to those of figure 18B, then the results and discussion of this section are not restricted to Rocky Mountain Cretaceous sandstones.
SUMMARY AND CONCLUSIONS
Porosity descriptions are of limited value if progress is not made toward predictive models. In this report, I describe empirical porosity trends for which sandstone porosity is linked with thermal maturity, rock properties, and hydrocarbon generation. These parameters are useful in predictive porosity models because they commonly can often be anticipated in advance of the drill.
The overall decrease of sandstone porosity during burial is treated as a function of thermal maturity as represented by vitrinite reflectance. In this context, vitrinite reflectance serves as a generalized index of thermal history rather than as a specialized indicator of kerogen decomposition. Complicating the picture, however, the data show that the response of sandstone porosity to increasing thermal maturity may depend in part on the presence or absence of hydrocarbon generation and overpressuring.
The range of porosity at a given level of thermal maturity is not obscured here by averaging but is depicted by porosity-vitrinite reflectance trends representing the 1Oth, 25th, 50th, 75th, and 90th porosity percentiles. Effects on porosity of variations in rock properties are thus taken into account.
Data from Cretaceous sandstones of Rocky Mountain basins are used to illustrate and test methods for predicting the porosity and porosity range of sandstones. Most of these Cretaceous sandstones are not deeply buried, but the availability of porosity, vitrinite reflectance, and rock property data makes them useful formations for developing approaches to porosity prediction. These approaches can be applied to deeply buried sandstones in general.
REFERENCES CITED
Athy, L.F., 1930, Density, porosity, and compaction of sedimentary rocks: American Association of Petroleum Geologists Bulletin, v. 14, no. 1, p. 1-24.
Baldwin, Brewster, and Butler, C.O., 1985, Compaction curves: American Association of Petroleum Geologists Bulletin, v. 69, no. 4, p. 622-626.
Bloch, S., 1991, Empirical prediction of porosity and permeability in sandstones: American Association of Petroleum Geologists Bulletin, v. 75, no. 7, p. 1145-1160.
Cassan, J.P., Garcia-Palacios, M.C., Fritz, Bertrand, and Tardy, Yves, 1981, Diagenesis of sandstone reservoirs as shown by petrographical and geochemical analysis of oil bearing formations in the Gabon basin: Bulletin des Centres de Recherches Exploration-Production Elf-Aquitaine, Pau, France, v. 5, no. 1, p. 113-135.
Cleveland, W.S., 1985, The elements of graphing data: Monterey, California, Wadsworth Advanced Books and Software, 323 p.
Coalson, E.B., ed., 1989, Petrogenesis and petrophysics of selected sandstone reservoirs of the Rocky Mountain region: Denver, Rocky Mountain Association of Geologists, 353 p.
Hansley, P.L., and Johnson, R.C., 1980, Mineralogy and diagenesis of low-permeability sandstones of Late Cretaceous age, Piceance Creek basin, northwestern Colorado: The Mountain Geologist, v. 17, no. 4, p. 88-106.
Higley, D.K., and Schmoker, J.W., 1989, Influence of depositional environment and diagenesis on regional porosity trends in the Lower Cretaceous "J" sandstone, Denver basin, Colorado, in Coalson, E.B., ed., Petrogenesis and petrophysics of selected sandstone reservoirs of the Rocky Mountain region: Denver, Rocky Mountain Association of Geologists, p. 183-196, 334-335.
Houseknecht, D.W., 1984, Influence of grain size and temperature on intergranular pressure solution, quartz cementation, and porosity in a quartzose sandstone: Journal of Sedimentary Petrology, v. 54, no. 2, p. 348-361.
Keighin, C.W., and Fouch, T.D., 1981, Depositional environments and diagenesis of some nonmarine Upper Cretaceous reservoir rocks, Uinta basin, Utah, in Ethridge, F.G., and Flores, R.M., eds., Recent and ancient nonmarine depositional environments-Models for exploration: Society of Economic Paleontologists and Mineralogists Special Publication 31, p. 109-125.
Keighin, C.W., Law, B.E., andPollastro, R.M., 1989, Petrology and reservoir characteristics of the Almond Formation, greater Green River basin, Wyoming, in Coalson, E.B., ed., Petrogenesis and petrophysics of selected sandstone reservoirs of the Rocky Mountain region: Denver, Rocky Mountain Association of Geologists, p. 281-298, 344-347.
Land, C.B., and Weimer, R.J., 1978, Peoria field, Denver basin, Colorado-J sandstone distributary channel reservoir, in Pruit, J.D., and Coffin, P.E., eds., Energy resources of the Denver basin: Denver, Rocky Mountain Association of Geologists, p. 81-104.
Lyons, D.J., 1978, Sandstone reservoirs: Petrography, porositypermeability relationship, and burial diagenesis: Tokyo, Technology Research Center, Japan National Oil Corporation, Report 8, p. 1-69.

104 DEEP NATURAL GAS RESOURCES IN THE UNITED STATES
---1979, Organic metamorphism and sandstone porosity prediction from acoustic data: Tokyo, Technology Research Center, Japan National Oil Corporation, Report 9, p. 1-51.
Maxwell, J.C., 1964, Influence of depth, temperature, and geologic age on porosity of quartzose sandstone: American Association of Petroleum Geologists Bulletin, v. 48, no. 5, p. 697-709.
Pitman, J.K., Anders, D.E., Fouch, T.D., and Nichols, D.J., 1986, Hydrocarbon potential of nonmarine Upper Cretaceous and Lower Tertiary rocks, eastern Uinta basin, Utah, in Spencer, C.W., and Mast, R.F., eds., Geology of tight gas reservoirs: American Association of Petroleum Geologists Studies in Geology 24, p. 235-252.
Pitman, J.K., Franczyk, K.J., and Anders, D.E., 1987, Marine and nonmarine gas-bearing rocks in Upper Cretaceous Blackhawk and Neslen Formations, eastern Uinta basin, Utah-Sedimentology, diagenesis, and source rock potential: American Association of Petroleum Geologists Bulletin, v. 71, no. 1, p. 76-94.
---1988, Diagenesis and burial history of nonmarine Upper Cretaceous rocks in the central Uinta basin, Utah: U.S. Geological Survey Bulletin 1787-D, 24 p.
Scherer, M., 1987, Parameters influencing porosity in sandstones-A model for sandstone porosity prediction: American Association of Petroleum Geologists Bulletin, v. 71, no. 5, p. 485-491.
Schmidt, Volkmar, and McDonald, D.A., 1979, The role of secondary porosity in the course of sandstone diagenesis, in Scholle, P.A., and Schluger, P.R., eds., Aspects of diagenesis: Society of Economic Paleontologists and Mineralogists Special Publication 26, p. 175-207.
Schmoker, J.W., and Gautier, D.L., 1988, Sandstone porosity as a function of thermal maturity: Geology, v. 16, no. 11, p. 1007-1010.
---1989, Compaction of basin sediments: Modeling based on time-temperature history: Journal of Geophysical Research, v. 94(B),no.6,p. 7379-7386.
Schmoker, J.S., and Hester, T.C., 1990, Regional trends of sandstone porosity versus vitrinite reflectance-A preliminary framework, in Nuccio, V.F., and Barker, C.E., eds., Applications of thermal maturity studies to energy exploration:
Rocky Mountain Section, Society of Economic Paleontologists and Mineralogists, Denver, p. 53-60.
Schmoker, J.W., and Higley, D.K., 1991, Porosity trends of the Lower Cretaceous J sandstone, Denver basin, Colorado: Journal of Sedimentary Petrology, v. 61, no. 6, p. 909-920.
Schmoker, J.W., Nuccio, V.F., and Pitman, J.K., 1992, Porosity trends in predominantly nonmarine sandstones of the Upper Cretaceous Mesaverde Group, Uinta and Piceance basins, Utah and Colorado, in Fouch, T.D., Nuccio, V.F., and Chidsey, T.C., eds., Hydrocarbon and mineral resources of the Uinta basin, Utah and Colorado: Salt Lake City, Utah Geological Association Guidebook 20, p. 111-121.
Siever, Raymond, 1983, Burial history and diagenetic reaction kinetics: American Association of Petroleum Geologists Bulletin, v. 67, no. 4, p. 684-691.
Spencer, C.W., 1987, Hydrocarbon generation as a mechanism for overpressuring in Rocky Mountain region: American Association of Petroleum Geologists Bulletin, v. 71, no. 4, p. 368-388.
Spencer, C.W., and Keighin, C.W., eds., 1984, Geologic studies in support of the U.S. Department of Energy Multiwell Experiment, Garfield County, Colorado: U.S. Geological Survey Open-File Report 84-757, 134 p.
Surdam, R.C., Crossey, L.J., Hagen, E.S., and Heasler, H.P., 1989, Organic-inorganic interactions and sandstone diagenesis: American Association of Petroleum Geologists Bulletin, v. 73, no.1,p.1-23.
Tainter, P.A., 1984, Stratigraphic and paleostructural controls on hydrocarbon migration in Cretaceous D and J sandstones of the Denver basin, in Woodward, Jane, Meissner, F.F., and Clayton, J.L., eds., Hydrocarbon source rocks of the greater Rocky Mountain region: Denver, Rocky Mountain Association of Geologists, p. 339-354.
Till, Roger, 1974, Statistical methods for the earth scientist: New York, John Wiley, 154 p.
Tissot, B.P., and Welte, D.H., 1984, Petroleum formation and occurrence (2nd ed.): New York, Springer-Verlag, 699 p.
van de Kamp, P.C., 1976, Inorganic and organic metamorphism in siliciclastic rocks [abs.]: American Association of Petroleum Geologists Bulletin, v. 60, no. 4, p. 729.

Porosity Trends of Pennsylvanian Sandstones With Respect to Thermal Maturity and Thermal Regimes in the Anadarko Basin, Oklahoma
By Timothy C. Hester
GEOLOGIC CONTROLS OF DEEP NATURAL GAS RESOURCES IN THE UNITED STATES
U.S. GEOLOGICAL SURVEY BULLETIN 2146-1
UNITED STATES GOVERNMENT PRINTING OFFICE, WASHINGTON : 1997
CONTENTS
Abstract ........................................................................................................................... 107 Introduction ..................................................................................................................... 107 Thermal Regimes in the Anadarko Basin ....................................................................... 109 Calibration of Vitrinite Reflectance with Depth ............................................................. 109
Anomalously Cool Zone ......................................................................................... 111 Statistical Comparison of Vitrinite Reflectance-Depth Trends .............................. 114
Porosity-Vitrinite Reflectance Data Sets ........................................................................ 115 Porosity-Vitrinite Reflectance Trends ............................................................................ 119 Summary ......................................................................................................................... 121 References Cited ............................................................................................................. 123
FIGURES
1. Map showing total sediment thickness isopach and data locations, Anadarko Basin ............................................... 108 2-4. Graphs showing vitrinite reflectance versus depth for:
2. Pennsylvanian strata ............................................................................................................................................ 110 3. Lower Paleozoic strata ......................................................................................................................................... 110 4. All strata within the anomalously -cool zone of figure 5 ......... .... .. ................. ................ ... ........... ................. ....... 111
5. Map showing plan view of upper and lower boundaries of Pennsylvanian-age part of cool zone and lines of temperature-depth profiles .................................................................................................................................... 112
6. Temperature-depth profiles along dip of stratigraphic horizons at top of Pennsylvanian and top of lower Paleozoic strata................................................................................................................................................ 113
7. Diagram showing confidence intervals at 95 percent level for parameters a and b .................................................. 115 8-10. Graphs showing porosity of Anadarko Basin nonreservoir sandstones (Pennsylvanian) versus
vitrinite reflectance: 8. Least-squares regression line fit to entire data set ............................................................................................... 119 9. Least-squares regression lines fit to each of two data populations separated at
vitrinite reflectance=l.l percent ..................... _ ..................................................................................................... 120 10. Least-squares regression lines fit to lOth, 25th, 50th, 75th, and 90th porosity percentiles of framework
data set representing sandstones in general ...... ... . ............ .. . . . . .. . . ............. ...... ... . . . . .. . . . ... . . . ... .. . .. . . . . .. . .. . . . . . . . .. . . .. .. . . . . 121 11. Graph showing porosity of Anadarko Basin reservoir sandstones (Pennsylvanian) versus vitrinite reflectance ..... 122 12. Summary diagram showing least-squares regression lines fit to the various data sets ............................................. 123
TABLES
1. Oil and (or) gas reservoirs in the Anadarko Basin, Oklahoma, from which reservoir porosity data were obtained ....... 116 2. Wells in the Anadarko Basin, Oklahoma, from which nonreservoir porosity data were obtained ................................. 118

Porosity Trends of Pennsylvanian Sandstones With Respect to Thermal Maturity and Thermal Regimes in the Anadarko
Basin, Oklahoma
By Timothy C. Hester
ABSTRACT
A thermal model by Gallardo ( 1989) shows that the Anadarko Basin can be divided stratigraphically into three thermal regimes based on large-scale changes in thermal gradient. In addition, the model reveals a fourth thermal regime, an anomalously cool zone, that extends along and adjacent to the Wichita Mountains front and vertically downward through Pennsylvanian and lower Paleozoic strata. Empirical vitrinite reflectance-depth curves corroborate these multiple thermal regimes and provide a means of relating sandstone porosity and thermal maturity as measured by vitrinite reflectance in the Anadarko Basin.
Treating porosity as a function of thermal maturity normalizes the overprint of burial history on porosity evolution and allows porosity data from areas having different thermal histories to be combined and (or) compared in the same context. Porosity-vitrinite reflectance trends of Pennsylvanian sandstones of the Anadarko Basin are characterized using three data sets-two representing Anadarko Basin sandstones and one, from basins exclusive of the Anadarko, representing sandstones in general. The two Anadarko Basin data sets are termed reservoir sandstones, those specifically documented in the literature as hydrocarbon reservoirs, and nonreservoir sandstones, those interpreted directly from well logs. By comparing these data sets, sandstone porosity trends for the Anadarko Basin are evaluated relative to each other and to a framework of sandstones in general.
Nonreservoir sandstone porosity data for the Anadarko Basin consist of a less thermally mature population and a more thermally mature population, separated at a vitrinite reflectance value of 1.1 percent. Each population reflects a different rate of porosity decline with increasing vitrinite reflectance. Compared to sandstones in general, the porosity of the less mature trend decreases rapidly, whereas that of the more mature trend decreases slowly.
The porosity of Anadarko Basin reservoir sandstones decreases more slowly than that of nonreservoir sandstones
for vitrinite reflectance of less than 1.1 percent and of sandstones in general. The almost parallel trends of Anadarko Basin reservoir and nonreservoir sandstones for vitrinite reflectance of greater than 1.1 percent suggest that Anadarko Basin sandstones as a whole may retain sufficient porosity for economic accumulations of hydrocarbons, even at the high thermal maturities associated with depths of 15,000 ft ( 4,572 m) and greater.
INTRODUCTION
In this report, I explore a concept introduced by Gallardo ( 1989) of multiple, discrete thermal regimes in the Anadarko Basin of Oklahoma and, in addition, identify and characterize an anomalously cool zone adjacent to the Wichita Mountains front where, along the dip of stratigraphic horizons, temperature and depth vary inversely. Empirical relations of vitrinite reflectance and depth corroborate the thermal model of Gallardo (1989) and provide a means with which to investigate the primary topic of this report, the relation between porosity and thermal maturity for Pennsylvanian sandstones of the Anadarko Basin (Hester and Schmoker, 1990).
Treating porosity as a function of thermal maturity has advantages over the more common treatment as a function of depth. As a function of thermal maturity, the overprint of burial history on porosity evolution is normalized, allowing porosity data from basins or areas having different thermal histories to be combined and (or) compared in the same context (Schmoker and Gautier, 1988). An additional advantage is that porosity change in the subsurface is linked to the maturation of kerogen and petroleum by a common variable, vitrinite reflectance (Schmoker and Hester, 1990).
Porosity-vitrinite reflectance trends of Pennsylvanian sandstones of the Anadarko Basin are characterized in this report using three data sets; two data sets represent Anadarko Basin sandstones (fig. 1 ), and one data set, from basins
107
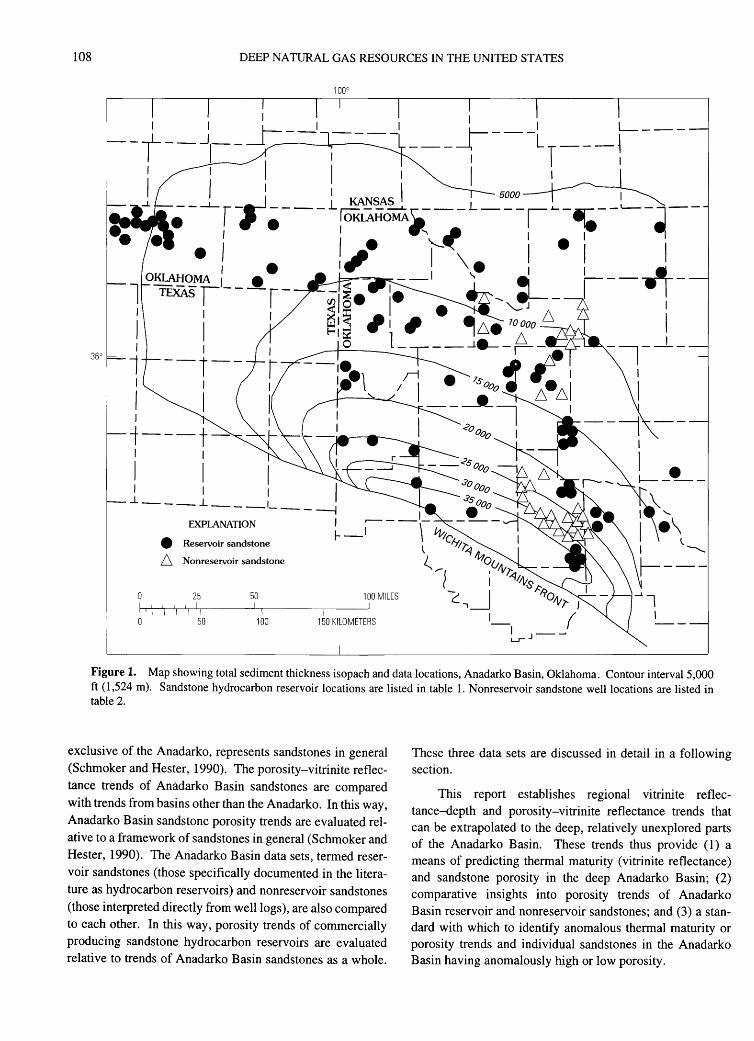
108 DEEP NATURAL GAS RESOURCES IN THE UNITED STATES
36°
I
-t---t-1
I I I I I -L ___ J.. ___ , ____ I I
EXPLANATION I ~- -\- ~
• Reservoir sandstone ~ - ~ 70Jt11;q D Nonreservoir sandstone ( ftto(J.
---~ i 11t7;q1!Vs .._ _j f:"IY. C., OJV)' J 25 50 100 MILES
I_ ( I J-~ L..J"""
50 150 KILOMETERS 100
Figure 1. Map showing total sediment thickness isopach and data locations, Anadarko Basin, Oklahoma. Contour interval5,000 ft (1 ,524 m). Sandstone hydrocarbon reservoir locations are listed in table 1. Nonreservoir sandstone well locations are listed in table 2.
exclusive of the Anadarko, represents sandstones in general (Schmoker and Hester, 1990). The porosity-vitrinite reflectance trends of Anadarko Basin sandstones are compared with trends from basins other than the Anadarko. In this way, Anadarko Basin sandstone porosity trends are evaluated relative to a framework of sandstones in general (Schmoker and Hester, 1990). The Anadarko Basin data sets, termed reservoir sandstones (those specifically documented in the literature as hydrocarbon reservoirs) and nonreservoir sandstones (those interpreted directly from well logs), are also compared to each other. In this way, porosity trends of commercially producing sandstone hydrocarbon reservoirs are evaluated relative to trends of Anadarko Basin sandstones as a whole.
These three data sets are discussed in detail in a following section.
This report establishes regional vitrinite reflectance-depth and porosity-vitrinite reflectance trends that can be extrapolated to the deep, relatively unexplored parts of the Anadarko Basin. These trends thus provide (1) a means of predicting thermal maturity (vitrinite reflectance) and sandstone porosity in the deep Anadarko Basin; (2) comparative insights into porosity trends of Anadarko Basin reservoir and nonreservoir sandstones; and (3) a standard with which to identify anomalous thermal maturity or porosity trends and individual sandstones in the Anadarko Basin having anomalously high or low porosity.

POROSITY TRENDS OF PENNSYLVANIAN SANDSTONES 109
THERMAL REGIMES IN THE ANADARKO BASIN
The Anadarko Basin can be divided stratigraphically into three thermal regimes, primarily defined by changes in thermal conductivity and thermal gradient (Gallardo, 1989). Because thermal conductivity, and thus thermal gradient, varies with rock type (among other things; Robertson, 1988), the boundaries of the thermal regimes generally reflect lithologic (stratigraphic) changes. In particular, the boundaries coincide with the major lithologic changes that mark the transitions from one stage of Anadarko Basin tectonic evolution (Perry, 1989) to the next.
During each stage of Anadarko Basin evolution, a lithologically distinct group of strata was deposited: (1) lower Paleozoic (Mississippian and older) strata, which are mostly carbonate rocks with minor amounts of shale and sandstone; (2) Pennsylvanian strata, which are mostly shale, with some sandstone and limestone, and minor amounts of granite wash (arkose or arkosic sandstone); and (3) Permian strata, which are mostly redbeds (defined by Gallardo [1989] as a separate lithology of red shale and evaporite), with some anhydrite, limestone, and sandstone, and minor amounts of granite wash and dolomite.
Each of these three groups of strata is dominated by a single lithology-carbonate, shale, or redbed-that more or less characterizes that particular stage of basin development and accounts for the distinct thermal conductivity and thermal gradient of that group. The thermal conductivity of each group is a weighted average of the thermal conductivities of all lithologies in the group; thus, the average thermal conductivity of a group is significantly influenced by that of its dominant lithology. Thermal conductivities of the lower Paleozoic and Permian groups of strata are generally high relative to that of the Pennsylvanian group. The three thermal regimes, therefore, result primarily from the separation of two thermally conductive groups of strata by an insulating blanket of Pennsylvanian shale.
Gallardo's (1989) model also reveals a fourth thermal regime, an anomalously cool zone, that extends along and adjacent to the Wichita Mountains front where accumulations of granite wash (high thermal conductivity) replace the otherwise ubiquitous Pennsylvanian shale. In this area, thermal conductivity contrasts between the three lithologic groups are smaller, thus decreasing the thermal gradients and the temperature differences across stratigraphic boundaries. As a result, the highest temperatures, which should be in the deepest parts of the basin, are shifted updip, creating an anomalously cool zone along the Wichita Mountains front in which temperature and depth (measured along stratigraphic horizons) vary inversely. This cool zone is described in detail in a following section.
Except for the Wichita Mountains front area, relative percentages of the lithologies of each group of strata (lower Paleozoic, Pennsylvanian, and Permian) remain fairly
constant across much of the basin (Gallardo, 1989). Thermal characteristics of each group, therefore, also remain more or less laterally continuous. The result, in the greater Anadarko Basin, is blanketlike groups of strata that have vertically contrasting thermal conductivities and gradients. Along the Wichita Mountains front, however, thermal conductivities are uniformly high and thermal gradients are low. The present-day temperature structure of the basin, therefore, reflects normal variations in conductive heat flow through these groups of strata (Gallardo, 1989). A thermal anomaly, such as that inferred by Cardott and Lambert (1985), is not required to produce the observed thermal maturity patterns (Gallardo, 1989).
CALIBRATION OF VITRINITE REFLECTANCE WITH DEPTH
An empirical vitrinite reflectance-depth relation (exponential) for the Pennsylvanian group of strata (fig. 2), analogous to that used by Schmoker ( 1986) for the Anadarko Basin in general, is used here to approximate actual vitrinite reflectance measurements for the porosity-vitrinite reflectance plots (power law) that follow. A second empirical vitrinite reflectance-depth relation for the Upper Devonian and Lower Mississippian Woodford Shale (fig. 3), considered here to be representative of the lower Paleozoic group of strata as a whole, is used for statistical comparison. A third empirical vitrinite reflectance-depth relation for an anomalously cool zone along the Wichita Mountains front that includes both Pennsylvanian and lower Paleozoic strata (fig. 4, discussed in detail in the following section) is used to predict vitrinite reflectance for Pennsylvanian age strata in that area. Data for these calibrations are from published sources referenced by Schmoker (1986), from Brian J. Cardott, Oklahoma Geological Survey (personal commun., 1986), and from Pawlewicz (1989) and are subdivided based on the thermal regimes of Gallardo (1989). No vitrinite reflectance-depth data are available for the Permian group of strata.
Temperature, and thus thermal maturation, in the Anadarko Basin generally increases with depth. Vitrinite reflectance values used in this study range from about 0.5 to 5.0 percent; depths range from about 5,000 to 30,000 ft (1,500-9,100 m). Correlation coefficients (r) for the leastsquares regression lines (using a In vitrinite reflectance transformation) fit to vitrinite reflectance-depth measurements of Pennsylvanian strata (fig. 2) and Woodford Shale (fig. 3) show a strong dependence of vitrinite reflectance on depth (r=0.97 and r=0.95, respectively) for most of the basin. For the anomalously cool zone (fig. 4), the dependence of vitrinite reflectance on depth is not as strong (r=0.81) but is still significant.
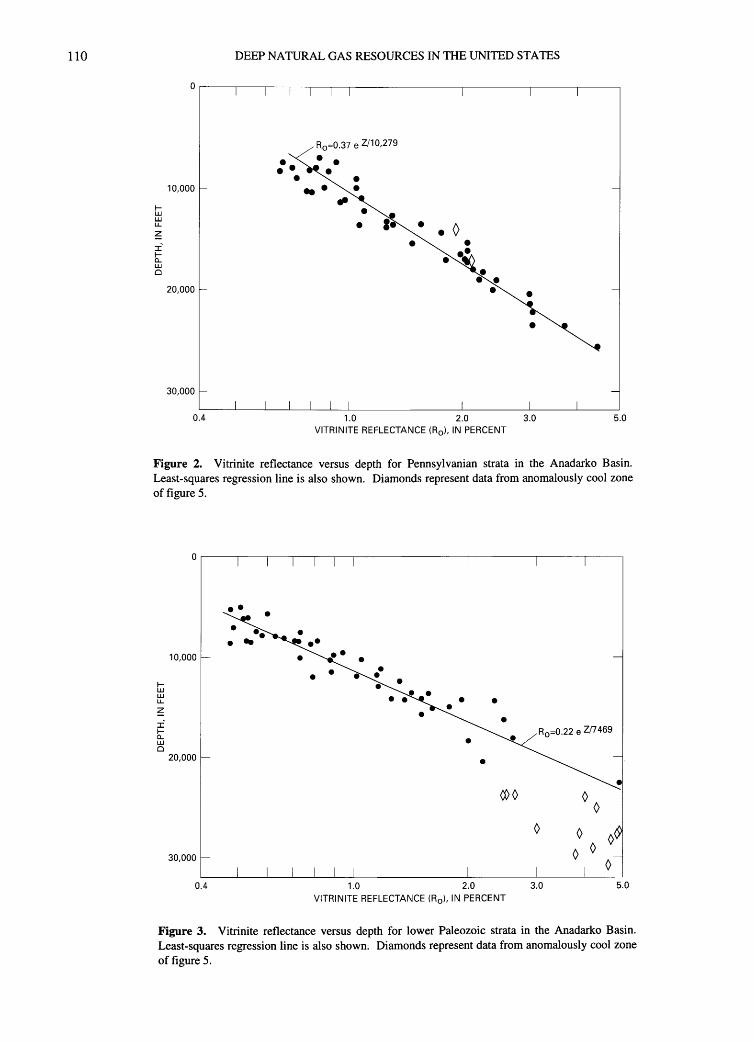
110 DEEP NATURAL GAS RESOURCES IN THE UNITED STATES
Ra=0.37 e Z/10,279
10,000
I-w w LL
~ I, I-a.. w 0
20,000
30,000
0.4 1.0 2.0 3.0 5.0 VITRINITE REFLECTANCE (R0 ), IN PERCENT
Figure 2. Vitrinite reflectance versus depth for Pennsylvanian strata in the Anadarko Basin. Least-squares regression line is also shown. Diamonds represent data from anomalously cool zone of figure 5.
1-w w LL
~ I, 1-a.. w 0
10,000
20,000
30,000
0.4
• •
Ra=0.22 e Z/7469
• •
1.0 2.0 3.0 5.0 VITRINITE REFLECTANCE (R0 ), IN PERCENT
Figure 3. Vitrinite reflectance versus depth for lower Paleozoic strata in the Anadarko Basin. Least-squares regression line is also shown. Diamonds represent data from anomalously cool zone of figure 5.

POROSITY TRENDS OF PENNSYLVANIAN SANDSTONES 111
fLU L.U LL
z I fc.. L.U 0
10,000
20,000
30,000
Ro=0.79 e Z/17,300
••
0.4 1.0 2.0 3.0 5.0 VITRINITE REFLECTANCE (R 0 ), IN PERCENT
Figure 4. Vitrinite reflectance versus depth for all strata in the Anadarko Basin within the anomalously cool zone of figure 5. Least-squares regression line for anomalously cool zone (heavy line) and least-squares regression lines fit to vitrinite reflectance-depth data for Pennsylvanian (fine line) and lower Paleozoic strata (dashed line) are also shown.
ANOMALOUSLY COOL ZONE
Along the Wichita Mountains front, accumulations of Pennsylvanian granite wash replace the otherwise ubiquitous Pennsylvanian shale, changing regional thermal conductivity patterns. Where granite wash is concentrated, thermal conductivity increases and thermal gradients decrease. This effect offsets the highest temperatures (which should be in the deepest parts of the basin) updip, away from the deepest depths (Gallardo, 1989), creating an anomalously cool zone in which temperature and depth (measured along the dip of stratigraphic horizons) vary inversely. This cool zone extends through the stratigraphic section from about the top of the Pennsylvanian to basement rocks.
The upper and lower boundaries of the Pennsylvanian part of the cool zone are constructed here using temperature and structure maps of Gallardo (1989) on top of Pennsylvanian and lower Paleozoic strata, respectively, and are approximated in plan view in figure 5. The contrasting shapes and geographic positions of the boundaries indicate an irregular configuration of the cool zone as it extends through the Pennsylvanian section with both downward and oblique components. The shape and position of the cool zone at a given horizon, between the boundaries mapped in figure 5, are uncertain but must vary as temperature and structural patterns change with depth. Consequently, wells within the boundary mapped on top of the Pennsylvanian
(fig. 5, shaded area) may only intersect the cool zone at its upper part, while at depth, the main body of the cool zone (hachured area) is not penetrated. In contrast, temperature and structure maps at the base of the Arbuckle Group (Gallardo, 1989) indicate that the cool zone probably continues from the base of the Pennsylvanian vertically downward through the lower Paleozoic to the basement with its plan view shape virtually unchanged.
Temperature-depth profiles (fig. 6, using modeled temperatures of Gallardo [1989]) along the dip of stratigraphic horizons at the top of the Pennsylvanian and the lower Paleozoic (fig. 5) are taken along the lines shown in figure 5. Each profile intersects the highest temperatures of that stratigraphic horizon and shows that temperatures increase basinward, along the horizon, to the northern edge of the cool zone and then decrease sharply (fig. 6). The profile along the top of the Pennsylvanian (fig. 6, inset) shows that, within the shallowing area between the southern edge of the cool zone and the Wichita Mountain front (fig. 5), temperature and depth (along the stratigraphic horizon) again co-vary. In this area (fig. 5, adjacent to the mountains front, bounded by the dashed lines), the cooling trend no longer increases basin ward but remains constant (illustrated by the hachured area, fig. 6, inset).
If cooling did not occur, temperatures would continue to increase along the profiles as projected by the dashed lines (with arrows) of figure 6. The temperature differential (that is, the cooling effect) between projected and
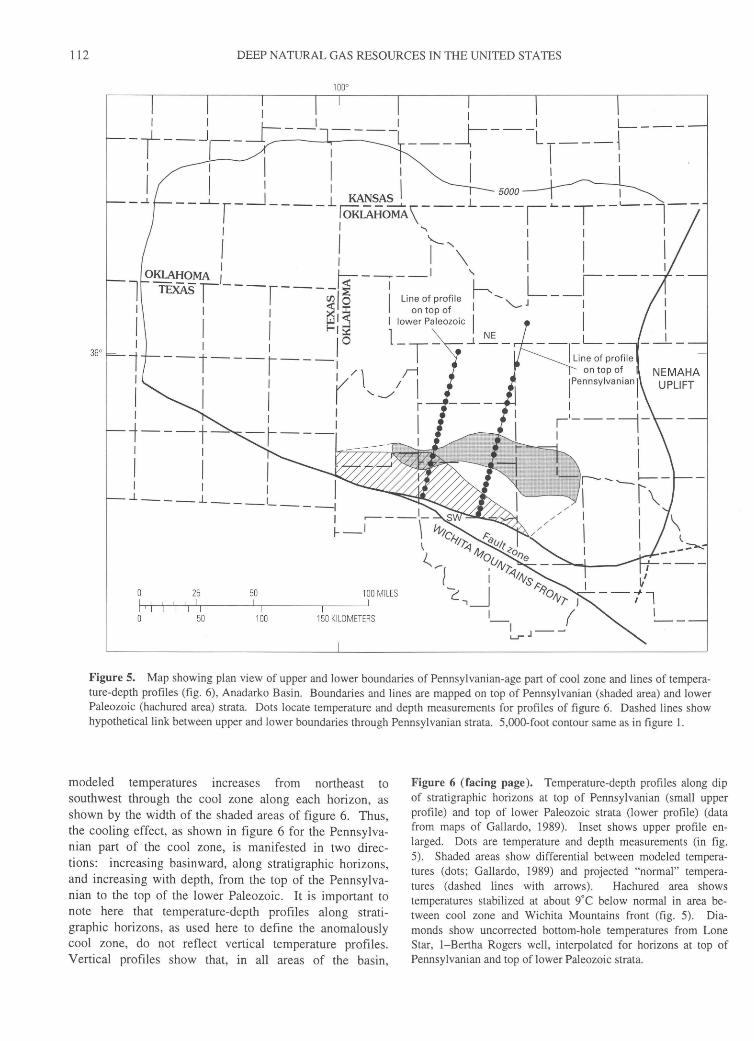
112 DEEP NATURAL GAS RESOURCES IN THE UNITED STATES
I
i---t I I
I I I I I I
-l ___ J. ___ '----1 I .----~-1- _I \ VV;Cf.t; f::
~J 7;.q IZ?o <.,.,.... (;1\t~
l i -<111\ts ~ "2 ., _j IYo!Vr 25 50 100 MILES
( I.~-~ L...1""
50 100 150 KILOMETERS
Figure 5. Map showing plan view of upper and lower boundaries of Pennsylvanian-age part of cool zone and lines of temperature-depth profiles (fig. 6), Anadarko Basin. Boundaries and lines are mapped on top of Pennsylvanian (shaded area) and lower Paleozoic (hachured area) strata. Dots locate temperature and depth measurements for profiles of figure 6. Dashed lines show hypothetical link between upper and lower boundaries through Pennsylvanian strata. 5,000-foot contour same as in figure 1.
modeled temperatures increases from northeast to southwest through the cool zone along each horizon, as shown by the width of the shaded areas of figure 6. Thus, the cooling effect, as shown in figure 6 for the Pennsylvanian part of the cool zone, is manifested in two directions: increasing basinward, along stratigraphic horizons, and increasing with depth, from the top of the Pennsylvanian to the top of the lower Paleozoic. It is important to note here that temperature-depth profiles along stratigraphic horizons, as used here to define the anomalously cool zone, do not reflect vertical temperature profiles. Vertical profiles show that, in all areas of the basin,
Figure 6 (facing page). Temperature-depth profiles along dip of stratigraphic horizons at top of Pennsylvanian (small upper profile) and top of lower Paleozoic strata (lower profile) (data from maps of Gallardo, 1989). Inset shows upper profile enlarged. Dots are temperature and depth measurements (in fig. 5). Shaded areas show differential between modeled temperatures (dots; Gallardo, 1989) and projected "normal" temperatures (dashed lines with arrows). Hachured area shows temperatures stabilized at about 9°C below normal in area between cool zone and Wichita Mountains front (fig. 5). Diamonds show uncorrected bottom-hole temperatures from Lone Star, 1-Bertha Rogers well, interpolated for horizons at top of Pennsylvanian and top of lower Paleozoic strata.

fUJ UJ LJ.. LJ.. 0 CJ)
0 z <(
0
5
10
~ 15 0 I f-z
:i f-a... UJ 0
20
25
NE
sw
POROSITY TRENDS OF PENNSYLVANIAN SANDSTONES
TEMPERATURE, IN DEGREES CELSIUS 30 40 50 60 70 ~-----------,-------------.-------------,------------~3
I
This profile is enlarged in the
inset for the purpose of accurate sca ling
NE
sw
<>
• •
• •
• •
• •
PROFILE ALONG TOP OF LOWER PALEOZOIC
sw
•
PROFILE ALONG TOP OF PENNSYLVANIAN
(INSET)
• •
• •
4
0 m ""'0 -I _I
z -I I 0
5~ )> z 0 CJ)
6
7
0 "'T1
"'T1 m m -I
30L_ __________ _J ____________ _L ____________ ~ ____________ L_ ____________ L-----------~
0 50 100 150 200 250 300 TEMPERATURE, IN DEGREES CELSIUS
113
temperature increases with depth. The cooling effect noted here serves only to decrease the temperature gradient relative to areas outside the cool zone.
Uncorrected bottom-hole temperatures, measured at various stages of drilling in the Lone Star, 1-Bertha Rogers well (sec. 27, T. 10 N., R. 19 W.) and interpolated for

114 DEEP NATURAL GAS RESOURCES IN THE UNITED STATES
horizons at the top of the Pennsylvanian and lower Paleozoic (fig. 6, shown as diamonds), are about 10°C-30°C below those modeled by Gallardo ( 1989). Because mud temperatures in the borehole, from which bottom-hole temperatures are taken, are almost always unequilibrated with the surrounding rock, these low temperatures are expected. Corrections based on curves by Scott ( 1982) increase measured bottom-hole temperatures to within a few degrees of, but still lower than, those modeled by Gallardo (1989), supporting the concept of anomalous cooling in this area. Based on the model given here (using data of Gallardo, 1989), actual temperatures may be as much as 95°C below normal in the Pennsylvanian part of the cool zone (fig. 6) and as much as 125°C below normal through the cool zone of the lower Paleozoic.
Vitrinite reflectance values for the lower Paleozoic part of the cool zone are significantly low relative to the normal vitrinite reflectance-depth trend for that group of strata (fig. 3), reflecting the anomalously low temperatures in that area and supporting the cool zone model. In contrast, vitrinite reflectance values from Pennsylvanian strata, from wells within the boundaries of the cool zone mapped on top of the Pennsylvanian (fig. 5), are within or near the normal range for that group (fig. 2). Whether the two "anomalous" vitrinite reflectance values of figure 2 (shown by diamonds) are from the northern edge of the zone where cooling is minimal or from outside the cool zone altogether (because of its irregular configuration in the subsurface) is unclear. In any case, taken together, the vitrinite reflectance-depth data from wells within the mapped areas representing the cool zone form a separate trend (fig. 4), albeit somewhat loosely constrained (r=0.81 ).
As expected, the cool zone vitrinite reflectance-depth trend diverges from the lower Paleozoic and Pennsylvanian trends (fig. 4) as cooling increases both downward and toward the Wichita Mountains front. The modeled cool zone temperature profiles (fig. 6) indicate, however, that the cooling effect begins at the top of the Pennsylvanian, at depths as shallow as 6,000 ft (1 ,800 m). In contrast, the empirical vitrinite reflectance-depth trend for the cool zone (fig. 4) shows that vitrinite reflectance values apparently are unaffected until much deeper. This apparent contradiction probably arises more from a lack of vitrinite reflectance-depth data from the shallow, Pennsylvanian part of the cool zone than from inaccuracies in the cool zone model. It is suggested here that additional vitrinite reflectance measurements from the cool zone at the low end of the thermal maturation scale where the onset of cooling occurs would result in a better defined and much flatter curve in closer agreement with that part of the model. The more important part of the curve (fig. 4), the high-maturity end where the cooling effect is maximized, agrees more closely with the model and probably would not change significantly with additional data. Therefore, when calculating vitrinite reflectance values for the cool zone, only the lower part of the curve (below 19,500 ft [5,940 m], fig. 4) is used.
STATISTICAL COMPARISON OF VITRINITE REFLECTANCE-DEPTH TRENDS
Exponential relations between vitrinite reflectance and depth have been successfully applied to thermal maturation studies of the Woodford Shale (Cardott and Lambert, 1985; Cardott, 1989), and to the Anadarko Basin in general (Schmoker, 1986), and are used here to approximate vitrinite reflectance values where actual measurements are not available. The parameters a (intercept) and b (relative rate of increase) of the exponential equation
Y=aebx (1)
define exponential profiles in general and, where X is depth (in feet) and Y is vitrinite reflectance (in percent), define the vitrinite reflectance-depth relation, in particular. Whether the profiles presented in this paper are different from each other is determined using confidence intervals for the parameters a and b (fig. 7). The location and width of the confidence intervals depend on the vitrinite reflectance-depth data set and a specified probability, or confidence level. The separation of the confidence intervals along the horizontal axis (fig. 7) reflects the degree to which the parameters, and thus the profiles, are different. At a given level of confidence, the width of the interval increases with variation in the sample population (Walpole and Myers, 1985); thus, a narrower interval, which reflects less variation in the data, is preferred.
Figure 7 shows confidence intervals for parameters a and bat the 95 percent confidence level for a number of vitrinite reflectance-depth profiles. Widely separated intervals for early Paleozoic and Pennsylvanian groups of strata and for the anomalously cool zone indicate discrete vitrinite reflectance-depth profiles that independently corroborate the thermal regimes of Gallardo ( 1989) and the anomalously cool zone described herein. In contrast, overlapping intervals for the Pennsylvanian and for the Anadarko Basin as a whole (this report) indicate profiles that are not statistically different. Figure 7 suggests that the profiles for Pennsylvanian-age strata and for the Anadarko Basin as a whole (Schmoker, 1986; this report) are reasonable approximations of the vitrinite reflectance-depth relation for the Anadarko Basin in general. Individual groups of strata, however, are probably best represented by their respective profiles. Thus, vitrinite reflectance (R0 ) data for the porosity-vitrinite reflectance plots of this report are calculated using vitrinite reflectance-depth profiles for the Pennsylvanian group of strata (fig. 2),
Ra=O. 3 7 eZl I 0,279' (2)
or the anomalously cool zone (below 19,500 ft [5,940 m], fig. 4),
(3)

POROSITY TRENDS OF PENNSYLVANIAN SANDSTONES 115
95 PERCENT CONFIDENCE INTERVAL FOR PARAMETER a (Y intercept)
Schmoker (1986)
Anadarko Basin / (total) ~ __ T_h_is_r_e_po_rt __ _
Lower Paleozoic Pennsylvanian
0.1 0.2 0.3 0.4
Cool zone ---55----
(to 1.44)
0.5
VITRINITE REFLECTANCE, IN PERCENT
95 PERCENT CONFIDENCE INTERVAL FOR PARAMETER b (relative rate of increase)
Schmoker (1986)
> Anadarko Basin This report (total)
Cool zone Pennsylvanian Lower Paleozoic
4 X 10⁻⁵ 8 X 10⁻⁵ 12 x 1o-5
RELATIVE RATE OF INCREASE, PER FOOT
Figure 7. Confidence intervals (solid lines) at 95 percent level for parameter a (Y-intercept) and b (relative rate of increase) of exponential equation Y=aebx where X is depth (in feet) andY is vitrinite reflectance (in percent) (text equation 1) representing vitrinite reflectance-depth profiles for lower Paleozoic, Pennsylvanian, and cool zone strata and the Anadarko Basin as a whole (Schmoker, 1986; this report).
POROSITY-VITRINITE REFLECTANCE DATA SETS
To best characterize porosity trends of Pennsylvanian sandstones in the Anadarko Basin, three data sets are used: two data sets representing Anadarko Basin sandstones (Pennsylvanian only) and one composite data set (Schmoker and Hester, 1990) of sandstones from numerous basins exclusive of the Anadarko representing sandstones in general (all ages). Each of the three data sets consists of many sandstone porosity-vitrinite reflectance data pairs that provide trends representative of that particular subset of sandstones. The two Anadarko Basin data sets are termed reservoir sandstones, those specifically documented in the literature as commercially producing hydrocarbon reservoirs, and nonreservoir sandstones, those which are interpreted directly from well logs.
The important distinction between the two Anadarko Basin data sets is that reservoir sandstones are all documented hydrocarbon-bearing commercially producing
sandstone reservoirs, whereas the nonreservoir sandstones are not. Therefore, the reservoir sandstones data set represents precisely as the term implies. Nonreservoir sandstones, on the other hand, are exclusively log derived. The nonreservoir data set represents, in effect, a systematic and thorough sampling from surface casing to total depth of every sandstone in each of 33 wells. Some of the nonreservoir sandstones may be charged with hydrocarbons and in some areas may contribute to hydrocarbon production, but the majority probably do not. Thus, the nonreservoir sandstone data set more or less represents Anadarko Basin sandstones (Pennsylvanian) as a whole.
The reservoir data set provides a porosity-vitrinite reflectance trend typical of Anadarko Basin Pennsylvanian, hydrocarbon-bearing commercially producing sandstone reservoirs. The porosity data consist of averaged measurements of 88 Pennsylvanian-age sandstone oil and gas reservoirs of the Anadarko Basin (fig. 1, table 1) from published oil- and gas-field compilations (Cramer and others, 1963; Berg and others, 197 4; Pipes, 1980; Harrison and Routh, 1981 ). Vitrinite reflectance values for reservoir sandstones
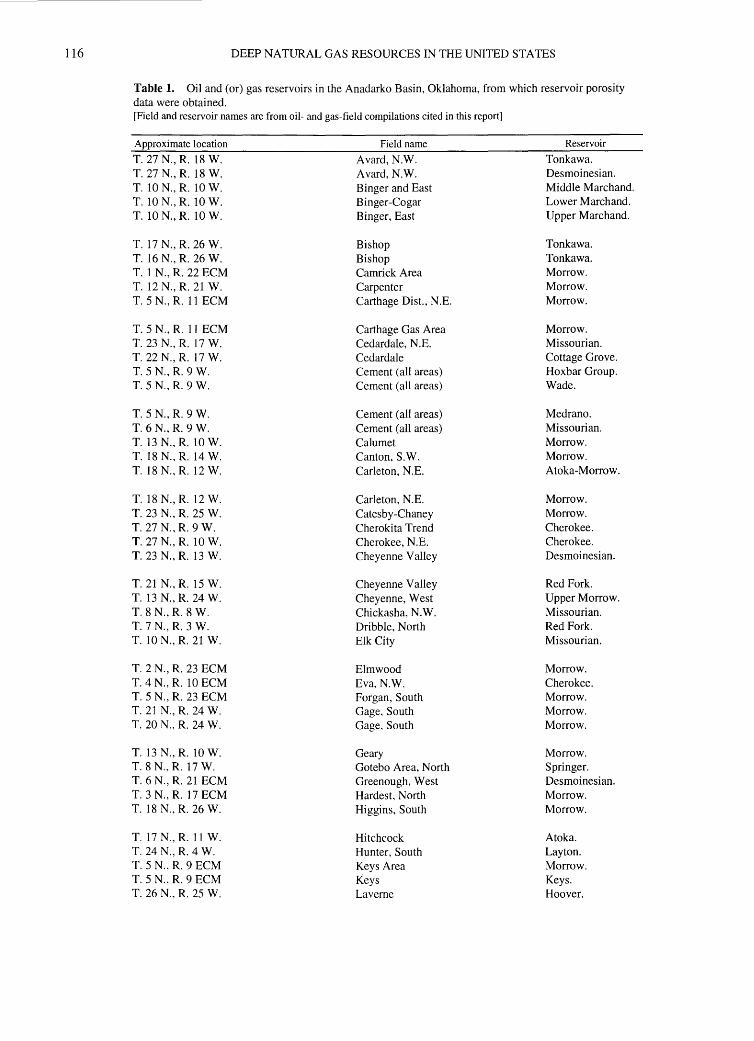
116 DEEP NATURAL GAS RESOURCES IN THE UNITED STATES
Table 1. Oil and (or) gas reservoirs in the Anadarko Basin, Oklahoma, from which reservoir porosity data were obtained. [Field and reservoir names are from oil- and gas-field compilations cited in this report]
Approximate location Field name Reservoir
T. 27 N., R. 18 W. Avard, N.W. Tonkawa. T. 27 N., R. 18 W. Avard, N.W. Desmoinesian. T. 10 N., R. 10 W. Binger and East Middle Marchand. T. 10 N., R. 10 W. Binger-Cogar Lower Marchand. T. 10 N., R. 10 W. Binger, East Upper Marchand.
T. 17 N., R. 26 W. Bishop Tonkawa. T. 16 N., R. 26 W. Bishop Tonkawa. T. 1 N., R. 22 ECM Camrick Area Morrow. T. 12 N., R. 21 W. Carpenter Morrow. T. 5 N., R. 11 ECM Carthage Dist., N.E. Morrow.
T. 5 N., R. 11 ECM Carthage Gas Area Morrow. T. 23 N., R. 17 W. Cedardale, N.E. Missourian. T. 22 N., R. I 7 W. Cedardale Cottage Grove. T. 5 N., R. 9 W. Cement (all areas) Hoxbar Group. T. 5 N., R. 9 W. Cement (all areas) Wade.
T. 5 N., R. 9 W. Cement (all areas) Medrano. T. 6 N., R. 9 W. Cement (all areas) Missourian. T. 13 N., R. 10 W. Calumet Morrow. T. 18 N., R. 14 W. Canton, S.W. Morrow. T. 18 N., R. 12 W. Carleton, N.E. Atoka-Morrow.
T. 18 N., R. 12 W. Carleton, N.E. Morrow. T. 23 N., R. 25 W. Catesby-Chaney Morrow. T. 27 N., R. 9 W. Cherokita Trend Cherokee. T. 27 N., R. 10 W. Cherokee, N.E. Cherokee. T. 23 N., R. 13 W. Cheyenne Valley Desmoinesian.
T. 21 N., R. 15 W. Cheyenne Valley Red Fork. T. 13 N., R. 24 W. Cheyenne, West Upper Morrow. T. 8 N., R. 8 W. Chickasha, N.W. Missourian. T. 7 N., R. 3 W. Dribble, North Red Fork. T. 10 N., R. 21 W. Elk City Missourian.
T. 2 N., R. 23 ECM Elmwood Morrow. T. 4 N., R. 10 ECM Eva, N.W. Cherokee. T. 5 N., R. 23 ECM Forgan, South Morrow. T. 21 N., R. 24 W. Gage, South Morrow. T. 20 N., R. 24 W. Gage, South Morrow.
T. 13 N., R. 10 W. Geary Morrow. T. 8 N., R. 17 W. Gotebo Area, North Springer. T. 6 N., R. 21 ECM Greenough, West Desmoinesian. T. 3 N., R. 17 ECM Hardest, North Morrow. T. 18 N., R. 26 W. Higgins, South Morrow.
T. 17 N., R. 11 W. Hitchcock Atoka. T. 24 N., R. 4 W. Hunter, South Layton. T. 5 N., R. 9 ECM Keys Area Morrow. T. 5 N., R. 9 ECM Keys Keys. T. 26 N., R. 25 W. Laverne Hoover.

POROSITY TRENDS OF PENNSYLVANIAN SANDSTONES 117
Table 1. Oil and (or) gas reservoirs in the Anadarko Basin, Oklahoma, from which reservoir porosity data were obtained-Continued.
Approximate location Field name Reservoir
T. 26 N., R. 25 W. Laverne Tonkawa. T. 26 N., R. 25 W. Laverne Morrow. T. 18 N., R. 18 W. Lenora Morrow. T. 5 N., R. 21 ECM Light Gas Area Upper Morrow. T. 5 N., R. 21 ECM Light Gas Area Basal Morrow.
T. I N., R. 26 ECM Logan, South Morrow. T. IN., R. 26 ECM Logan, South Tonkawa. T. 28 N., R. 2I W. Lovedale Morrow. T. 28 N., R. 21 W. Lovedale Tonkawa. T. 24 N., R. 24 W. Luther Hill Lower Tonkawa.
T. 24 N., R. 24 W. Luther Hill Lower Morrow. T. 28 N., R. 3 W. Mayflower, N.W. Red Fork. T. 8 N., R. 7 W. Minco, S.W. Springer. T. 27 N., R. 24 W. Mocane-Laverne Morrow. T. 5 N., R. 15 ECM Mouser Morrow.
T. 7 N., R. 8 W. Norge & Verden, N.W. Marchand. T. 24 N., R. I3 W. Oakdale, N .W. Red Fork. T. 17 N., R. I4 W. Oakwood, North Morrow. T. I8 N., R. I4 W. Oakwood, N.W. Morrow. T. 20 N., R. 11 W. Okeene, N.W. Red Fork.
T. 19 N., R. 11 W. Okeene, N.W. Red Fork. T. I1 N., R. 2 W. Oklahoma City Prue. T. 5 N., R. 13 ECM Postle Morrow. T. 5 N., R. 13 ECM Postle Cherokee. T. 4 N., R. 13 ECM Postle-Hough Upper Cherokee.
T. 5 N., R. 13 ECM Postle-Hough Upper Morrow. T. 4 N., R. 14 ECM Postle-Hough Upper Morrow. T. 4 N., R. 14 ECM Postle-Hough Morrow. T. I6 N., R. 16 W. Putnam Desmoinesian. T. 13 N., R. 26 W. Reydon, W. and N.W. Upper Morrow.
T. 5 N., R. 12 ECM Richland, Central, N. Morrow. T. 25 N ., R. 3 W. Saltfork, S.E. Skinner. T. 20 N., R. 16 W. Seiling, N.E. Cottage Grove. T. 8 N., R. 20W. Sentinel, West Granite Wash. T. 21 N., R. 21 W. Sharon, West Morrow.
T. 21 N., R. 21 W. Sharon, West Sharon. T. 20 N., R. 8 W. Sooner Trend Desmoinesian. T. 5 N., R. 10 ECM Sturgis, East Morrow. T. 23 N., R. 22 W. Tangier Morrow. T. 28 N., R. 8 W. Wakita Trend Cherokee.
T. 8 N., R. 4 W. Washington, E. Osborne. T. 14 N., R. 10 W. Watonga-Chickasha Morrow. T. 14 N., R. 10 W. Watonga-Chickasha Springer. T. 14 N., R. 10 W. Watonga-Chickasha Atoka. T. 25 N., R. 16 W. Waynoka, N.E. Cottage Grove.
T. 22 N., R. 19 W. Woodward, S.E. Morrow.
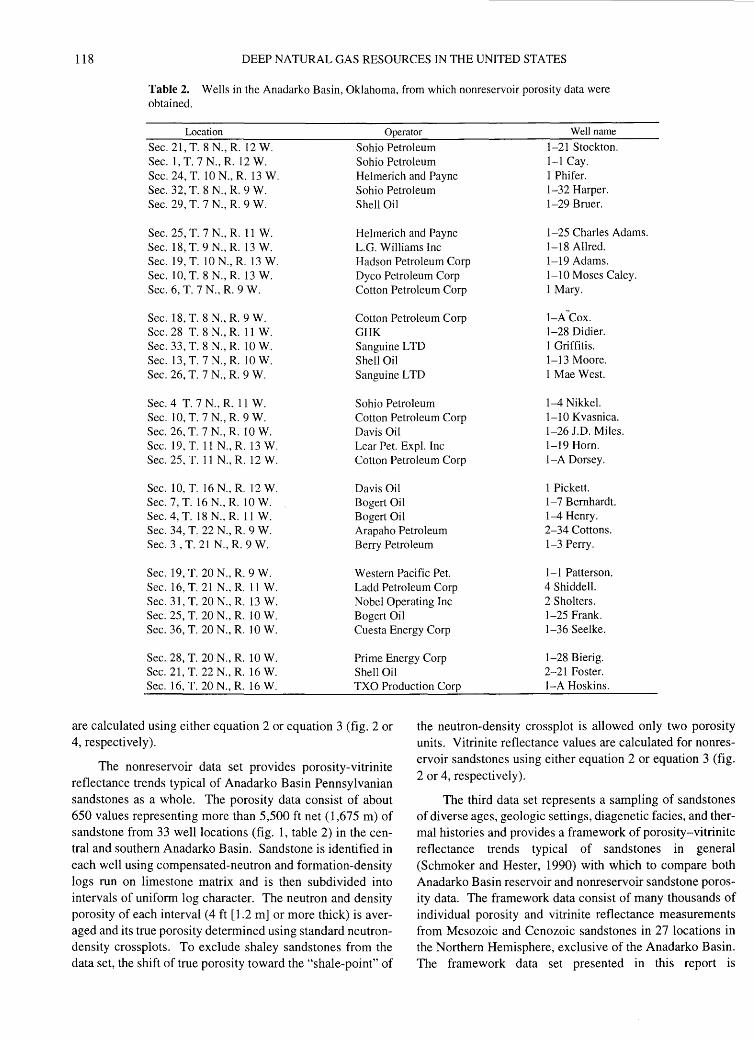
118 DEEP NATURAL GAS RESOURCES IN THE UNITED STATES
Table 2. Wells in the Anadarko Basin, Oklahoma, from which nonreservoir porosity data were obtained.
Location Operator Well name
Sec. 21, T. 8 N., R. 12 W. Sohio Petroleum 1-21 Stockton. Sec. I, T. 7 N., R. 12 W. Sohio Petroleum 1-1 Cay. Sec. 24, T. 10 N., R. 13 W. Helmerich and Payne 1 Phifer. Sec. 32, T. 8 N., R. 9 W. Sohio Petroleum 1-32 Harper. Sec. 29, T. 7 N., R. 9 W. Shell Oil 1-29 Bruer.
Sec. 25, T. 7 N., R. 11 W. Helmerich and Payne 1-25 Charles Adams. Sec. 18, T. 9 N., R. 13 W. L.G. Williams Inc 1-1 8 Allred. Sec. 19, T. 10 N., R. 13 W. Hadson Petroleum Corp 1-19 Adams. Sec. 10, T. 8 N., R. 13 W. Dyco Petroleum Corp 1-10 Moses Caley. Sec. 6, T. 7 N., R. 9 W. Cotton Petroleum Corp 1 Mary.
Sec. 18, T. 8 N., R. 9 W. Cotton Petroleum Corp 1-A'cox. Sec. 28 T. 8 N., R. 11 W. GHK 1-28 Didier. Sec. 33, T. 8 N., R. 10 W. Sanguine LTD 1 Griffitis. Sec. 13, T. 7 N., R. 10 W. Shell Oil 1-13 Moore. Sec. 26, T. 7 N., R. 9 W. Sanguine LTD 1 Mae West.
Sec. 4 T. 7 N., R. 11 W. Sohio Petroleum 1-4 Nikkel. Sec. 10, T. 7 N., R. 9 W. Cotton Petroleum Corp 1-10 Kvasnica. Sec. 26, T. 7 N., R. 10 W. Davis Oil 1-26 J.D. Miles. Sec. 19, T. 11 N., R. 13 W. Lear Pet. Expl. Inc 1-19 Horn. Sec. 25, T. 11 N., R. 12 W. Cotton Petroleum Corp 1-A Dorsey.
Sec. 10, T. 16 N., R. 12 W. Davis Oil 1 Pickett. Sec. 7, T. 16 N., R. 10 W. Bogert Oil 1-7 Bernhardt. Sec. 4, T. 18 N., R. 11 W. Bogert Oil 1-4 Henry. Sec. 34, T. 22 N., R. 9 W. Arapaho Petroleum 2-34 Cottons. Sec. 3 , T. 21 N., R. 9 W. Berry Petroleum 1-3 Perry.
Sec. 19, T. 20 N., R. 9 W. Western Pacific Pet. 1-1 Patterson. Sec. 16, T. 21 N., R. 11 W. Ladd Petroleum Corp 4 Shiddell. Sec. 31, T. 20 N., R. 13 W. Nobel Operating Inc 2 Sholters. Sec. 25, T. 20 N., R. 10 W. Bogert Oil 1-25 Frank. Sec. 36, T. 20 N., R. 10 W. Cuesta Energy Corp 1-36 Seelke.
Sec. 28, T. 20 N., R. 10 W. Prime Energy Corp 1-28 Bierig. Sec. 21, T. 22 N., R. 16 W. Shell Oil 2-21 Foster. Sec. 16, T. 20 N., R. 16 W. TXO Production Corp 1-A Hoskins.
are calculated using either equation 2 or equation 3 (fig. 2 or 4, respectively).
the neutron-density crossplot is allowed only two porosity units. Vitrinite reflectance values are calculated for nonreservoir sandstones using either equation 2 or equation 3 (fig. 2 or 4, respectively).
The nonreservoir data set provides porosity-vitrinite reflectance trends typical of Anadarko Basin Pennsylvanian sandstones as a whole. The porosity data consist of about 650 values representing more than 5,500 ft net (1,675 m) of sandstone from 33 well locations (fig. 1, table 2) in the central and southern Anadarko Basin. Sandstone is identified in each well using compensated-neutron and formation-density logs run on limestone matrix and is then subdivided into intervals of uniform log character. The neutron and density porosity of each interval (4ft [1.2 m] or more thick) is averaged and its true porosity determined using standard neutrondensity crossplots. To exclude shaley sandstones from the data set, the shift of true porosity toward the "shale-point" of
The third data set represents a sampling of sandstones of diverse ages, geologic settings, diagenetic facies, and thermal histories and provides a framework of porosity-vitrinite reflectance trends typical of sandstones in general (Schmoker and Hester, 1990) with which to compare both Anadarko Basin reservoir and nonreservoir sandstone porosity data. The framework data consist of many thousands of individual porosity and vitrinite reflectance measurements from Mesozoic and Cenozoic sandstones in 27 locations in the Northern Hemisphere, exclusive of the Anadarko Basin. The framework data set presented in this report is

POROSITY TRENDS OF PENNSYLVANIAN SANDSTONES 119
represented by least-squares regression lines fit to the lOth, 25th, 50th, 75th, and 90th porosity percentiles (Cleveland, 1985), analogous to those of Schmoker and Hester (1990).
POROSITY-VITRINITE REFLECTANCE TRENDS
A least-squares regression line fit (using a power-function transformation) to the porosity-vitrinite reflectance data for Anadarko Basin nonreservoir sandstones shows that nonreservoir sandstone porosity generally decreases with increasing thermal maturity (fig. 8). The data appear to consist, however, of two separate populations-a less thermally mature population for which vitrinite reflectance is less than 1.1 percent and a more thermally mature population for which vitrinite reflectance is greater than 1.1 percent. Correlation coefficients (r) of the least-squares regression lines fit to each of the two data populations (fig. 9) show a much stronger dependence of porosity on vitrinite reflectance for
• :.~. •• •
~ 4
10
• , f-z • L.U u I 0::: L.U c... • • ~ • ~- • •• U5 0 •• 0::: • • 0 c... • • •
• • •
1.0
the less mature trend of nonreservoir sandstones (where vit
rinite reflectance <1.1 percent, r=-0.63) than for nonreser
voir sandstones taken as a whole (fig. 8, r=-0.39). The
higher correlation of the less mature trend compared to that
of the data set as a whole suggests that the two data popula
tions (vitrinite reflectance < 1.1 percent and vitrinite reflec
tance > 1.1 percent) might best be considered as separate
trends. The two trends probably overlap to some extent as
the more mature trend diverges from the less mature trend.
Also, additional porosity data might show the rapid porosity loss of the less mature trend continuing beyond a vitrinite
reflectance level of 1.1 percent (fig. 9), thereby revealing two
diagenetic pathways of porosity loss for vitrinite reflectance
> 1.1 percent. The separation of the more mature and less mature populations by a single, preliminary boundary at vitrinite reflectance= 1.1 percent is used here for convenience
and does not necessarily imply a direct causal link between
the change in rate of porosity loss and a specific level of thermal maturation.
• • • • •• • • • • • • . ... • • ... -..
··~· . :· . .. G.\• • • . , . , -· •• • •
• • • I
• •
0.5L-------~-------L----~----~----L---~----------------------------~--------------~ 0.4 1.0 2.0 3.0
VITRINITE REFLECTANCE (R0 ), IN PERCENT
Figure 8. Porosity of Anadarko Basin nonreservoir sandstones (Pennsylvanian) versus vitrinite reflectance (calculated using text equation 2 or 3). Least-squares regression line fit to entire data set is also shown.
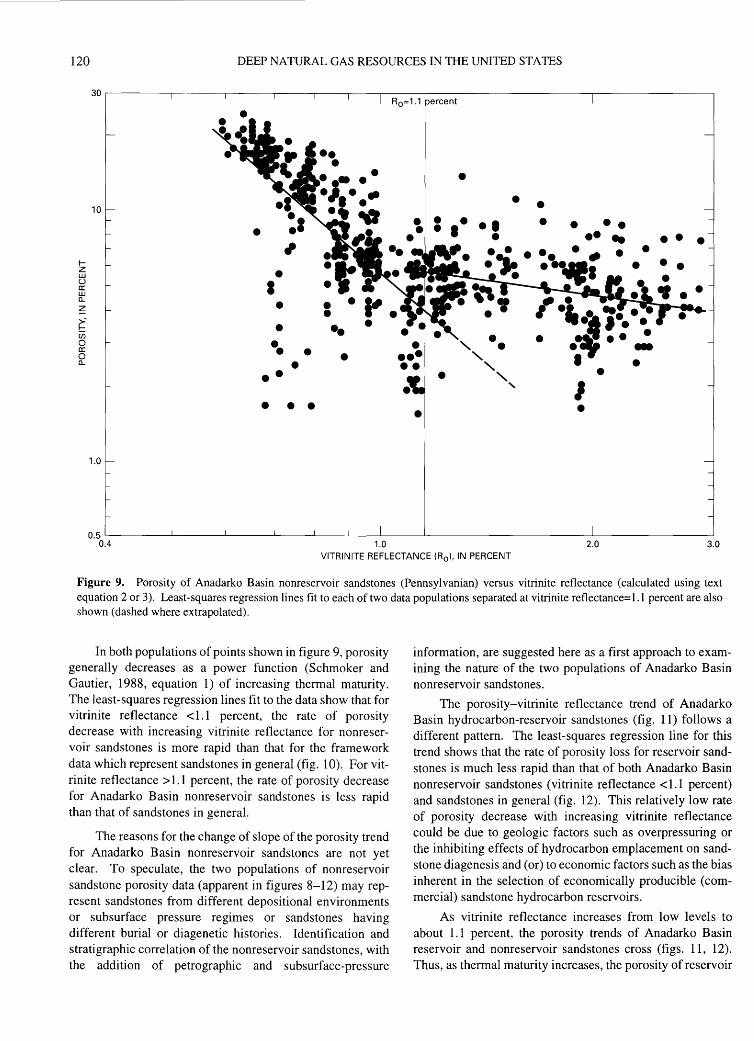
120 DEEP NATURAL GAS RESOURCES IN THE UNITED STATES
• • • 10
• •• • • • • • • • • • I- • • z L.U • u I ct: L.U a.. • , .•. ~,. ~ ~- • •• • U5 • . -~~~ .. 0 •• • ct: • 0 • I • a.. • •• • •
I • • • • •
1.0
1.0 2.0 3.0 VITRINITE REFLECTANCE (R 0 ), IN PERCENT
Figure 9. Porosity of Anadarko Basin nonreservoir sandstones (Pennsylvanian) versus vitrinite reflectance (calculated using text equation 2 or 3). Least-squares regression lines fit to each of two data populations separated at vitrinite reflectance=l.l percent are also shown (dashed where extrapolated).
In both populations of points shown in figure 9, porosity generally decreases as a power function (Schmoker and Gautier, 1988, equation 1) of increasing thermal maturity. The least-squares regression lines fit to the data show that for vitrinite reflectance < 1.1 percent, the rate of porosity decrease with increasing vitrinite reflectance for nonreservoir sandstones is more rapid than that for the framework data which represent sandstones in general (fig. 10). For vitrinite reflectance > 1.1 percent, the rate of porosity decrease for Anadarko Basin nonreservoir sandstones is less rapid than that of sandstones in general.
The reasons for the change of slope of the porosity trend for Anadarko Basin nonreservoir sandstones are not yet clear. To speculate, the two populations of nonreservoir sandstone porosity data (apparent in figures 8-12) may represent sandstones from different depositional environments or subsurface pressure regimes or sandstones having different burial or diagenetic histories. Identification and stratigraphic correlation of the nonreservoir sandstones, with the addition of petrographic and subsurface-pressure
information, are suggested here as a first approach to examining the nature of the two populations of Anadarko Basin nonreservoir sandstones.
The porosity-vitrinite reflectance trend of Anadarko Basin hydrocarbon-reservoir sandstones (fig. 11) follows a different pattern. The least-squares regression line for this trend shows that the rate of porosity loss for reservoir sandstones is much less rapid than that of both Anadarko Basin nonreservoir sandstones (vitrinite reflectance < 1.1 percent) and sandstones in general (fig. 12). This relatively low rate of porosity decrease with increasing vitrinite reflectance could be due to geologic factors such as overpressuring or the inhibiting effects of hydrocarbon emplacement on sandstone diagenesis and (or) to economic factors such as the bias inherent in the selection of economically producible (commercial) sandstone hydrocarbon reservoirs.
As vitrinite reflectance increases from low levels to about 1.1 percent, the porosity trends of Anadarko Basin reservoir and nonreservoir sandstones cross (figs. 11, 12). Thus, as thermal maturity increases, the porosity of reservoir
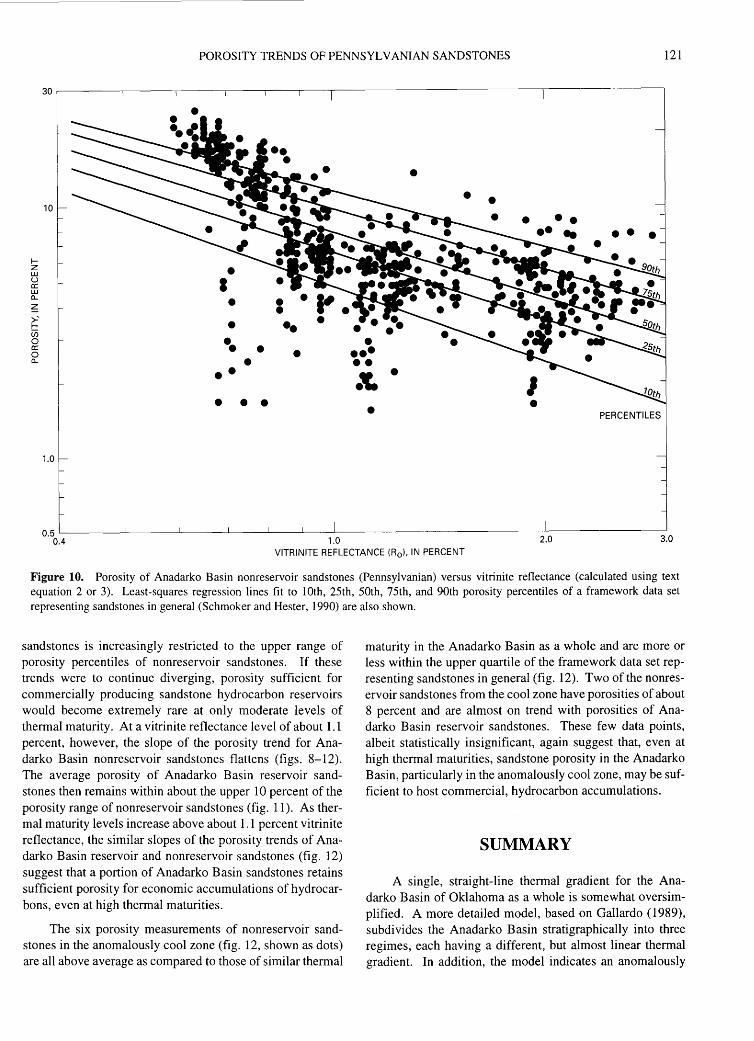
POROSITY TRENDS OF PENNSYLVANIAN SANDSTONES 121
• • • 10
• • • I-z • w u I a: w a... • ~ >-' • •• I-U5 0 •• • a: • • ••• 0 a... • •• •• :c. • I
• • • • •
1.0
0·~.L4 ________ ~ ______ L_ ____ ~ ____ _L ____ L_ __ 1J.o ______________________________ 2L.o--------------~3.o
VITRINITE REFLECTANCE (R0 ), IN PERCENT
Figure 10. Porosity of Anadarko Basin nonreservoir sandstones (Pennsylvanian) versus vitrinite reflectance (calculated using text equation 2 or 3). Least-squares regression lines fit to lOth, 25th, 50th, 75th, and 90th porosity percentiles of a framework data set representing sandstones in general (Schmoker and Hester, 1990) are also shown.
sandstones is increasingly restricted to the upper range of porosity percentiles of nonreservoir sandstones. If these trends were to continue diverging, porosity sufficient for commercially producing sandstone hydrocarbon reservoirs would become extremely rare at only moderate levels of thermal maturity. At a vitrinite reflectance level of about 1.1 percent, however, the slope of the porosity trend for Anadarko Basin nonreservoir sandstones flattens (figs. 8-12). The average porosity of Anadarko Basin reservoir sandstones then remains within about the upper 10 percent of the porosity range of nonreservoir sandstones (fig. 11). As thermal maturity levels increase above about 1.1 percent vitrinite reflectance, the similar slopes of the porosity trends of Anadarko Basin reservoir and nonreservoir sandstones (fig. 12) suggest that a portion of Anadarko Basin sandstones retains sufficient porosity for economic accumulations of hydrocarbons, even at high thermal maturities.
The six porosity measurements of nonreservoir sandstones in the anomalously cool zone (fig. 12, shown as dots) are all above average as compared to those of similar thermal
maturity in the Anadarko Basin as a whole and are more or less within the upper quartile of the framework data set representing sandstones in general (fig. 12). Two of the nonreservoir sandstones from the cool zone have porosities of about 8 percent and are almost on trend with porosities of Anadarko Basin reservoir sandstones. These few data points, albeit statistically insignificant, again suggest that, even at high thermal maturities, sandstone porosity in the Anadarko Basin, particularly in the anomalously cool zone, may be sufficient to host commercial, hydrocarbon accumulations.
SUMMARY
A single, straight-line thermal gradient for the Anadarko Basin of Oklahoma as a whole is somewhat oversimplified. A more detailed model, based on Gallardo (1989), subdivides the Anadarko Basin stratigraphically into three regimes, each having a different, but almost linear thermal gradient. In addition, the model indicates an anomalously
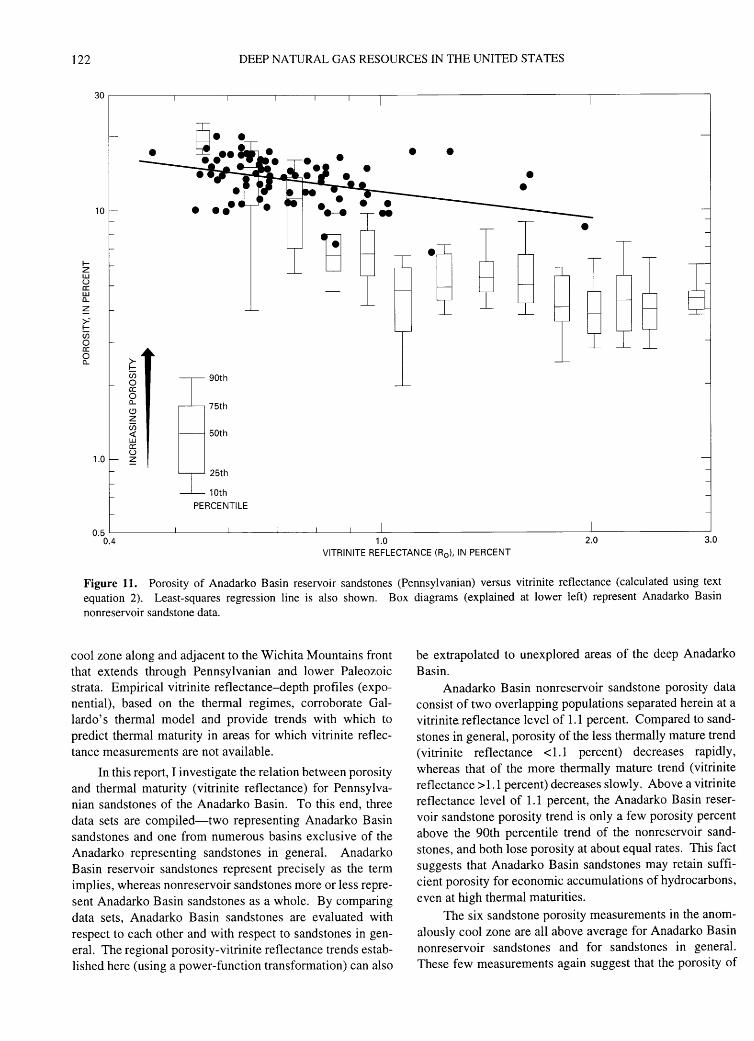
122 DEEP NATURAL GAS RESOURCES IN THE UNITED STATES
1-z w u a: w a... z >-' 1-C/.i 0 a: 0 a...
10
1.0
~ U5 0 a: 0 a... (.!) z U5 <! w a: u z
•
90th
75th
50th
25th
10th
PERCENTILE
• •
1.0
• •
8 l_
2.0 3.0 VITRINITE REFLECTANCE (R0 ), IN PERCENT
Figure 11. Porosity of Anadarko Basin reservoir sandstones (Pennsylvanian) versus vitrinite reflectance (calculated using text equation 2). Least-squares regression line is also shown. Box diagrams (explained at lower left) represent Anadarko Basin nonreservoir sandstone data.
cool zone along and adjacent to the Wichita Mountains front that extends through Pennsylvanian and lower Paleozoic strata. Empirical vitrinite reflectance-depth profiles (exponential), based on the thermal regimes, corroborate Gallardo's thermal model and provide trends with which to predict thermal maturity in areas for which vitrinite reflectance measurements are not available.
In this report, I investigate the relation between porosity and thermal maturity (vitrinite reflectance) for Pennsylvanian sandstones of the Anadarko Basin. To this end, three data sets are compiled-two representing Anadarko Basin sandstones and one from numerous basins exclusive of the Anadarko representing sandstones in general. Anadarko Basin reservoir sandstones represent precisely as the term implies, whereas nonreservoir sandstones more or less represent Anadarko Basin sandstones as a whole. By comparing data sets, Anadarko Basin sandstones are evaluated with respect to each other and with respect to sandstones in general. The regional porosity-vitrinite reflectance trends established here (using a power-function transformation) can also
be extrapolated to unexplored areas of the deep Anadarko Basin.
Anadarko Basin nonreservoir sandstone porosity data consist of two overlapping populations separated herein at a vitrinite reflectance level of 1.1 percent. Compared to sandstones in general, porosity of the less thermally mature trend (vitrinite reflectance < 1.1 percent) decreases rapidly, whereas that of the more thermally mature trend (vitrinite reflectance> 1.1 percent) decreases slowly. Above a vitrinite reflectance level of 1.1 percent, the Anadarko Basin reservoir sandstone porosity trend is only a few porosity percent above the 90th percentile trend of the nonreservoir sandstones, and both lose porosity at about equal rates. This fact suggests that Anadarko Basin sandstones may retain sufficient porosity for economic accumulations of hydrocarbons, even at high thermal maturities.
The six sandstone porosity measurements in the anomalously cool zone are all above average for Anadarko Basin nonreservoir sandstones and for sandstones in general. These few measurements again suggest that the porosity of

POROSITY TRENDS OF PENNSYLVANIAN SANDSTONES 123
fz w u a: w a... z >-' fU) 0 a: 0
10
a... 1.0
R0 =1.1 percent
1.0 2.0 3.0 VITRINITE REFLECTANCE (R0 ), IN PERCENT
Figure 12. Summary diagram showing least-squares regression lines fit to the following data sets: Anadarko Basin nonreservoir sandstones (medium dashed line); each of two populations of Anadarko Basin nonreservoir sandstones separated at vitrinite reflectance=1.1 percent (heavy solid lines, dashed where extrapolated); 1Oth, 25th, 50th, 75th, and 90th porosity percentiles of a framework data set representing sandstones in general (Schmoker and Hester, 1990)(fine solid lines); and Anadarko Basin reservoir sandstones (fine dashed line). Dots represent sandstones from the anomalously cool zone. All sandstones are of Pennsylvanian age.
some sandstones in the Anadarko Basin, particularly those in the anomalously cool zone, may be sufficient to host commercial, hydrocarbon accumulations, even at high thermal maturities. The cool zone described in detail in this report represents an anomalous cooling trend of considerable proportion, considering the magnitude of cooling and the volume of sedimentary rock involved, and thus should be considered along with the three thermal regimes of Gallardo (1989) when modeling thermally controlled processes in the Anadarko Basin.
REFERENCES CITED
Berg, O.R., Koinm, D.N., and Richardson, D.E., eds., 1974, Oil and gas fields of Oklahoma: Oklahoma City Geological Society Reference Report Supplement 1, 54 p.
Cardott, B.J., 1989, Thermal maturation of the Woodford Shale in the Anadarko Basin, in Johnson, K.S., ed., Anadarko Basin symposium, 1988: Oklahoma Geological Survey Circular 90, p. 32-46.
Cardott, B.J., and Lambert, M.W., 1985, Thermal maturation by vitrinite reflectance of Woodford Shale, Anadarko Basin,
Oklahoma: American Association of Petroleum Geologists Bulletin, v. 69, no. 11, p. 1982-1998.
Cleveland, W.S., 1985, The elements of graphing data: Monterey, Calif., Wadsworth Advanced Books and Software, 323 p.
Cramer, R.D., Gatlin, Leroy, and Wessman, H.G., eds., 1963, Oil and gas fields of Oklahoma: Oklahoma City Geological Society Reference Report Volume 1, 200 p.
Gallardo, J.D., 1989, Empirical model of temperature structure, Anadarko Basin, Oklahoma: Dallas, Texas, Southern Methodist University M.S. thesis, 186 p.
Harrison, W.E., and Routh, D.L., compilers, 1981, Reservoir and fluid characteristics of selected oil fields in Oklahoma: Oklahoma Geological Survey Special Publication 81-1, 317 p.
Hester, T.C., and Schmoker, J.W., 1990, Porosity trends ofnonreservoir and reservoir sandstones, Anadarko Basin, Oklahoma [abs.]: American Association of Petroleum Geologists Bulletin, v. 75, no. 3, p. 594.
Pawlewicz, M.J., 1989, Thermal maturation of the eastern Anadarko Basin, Oklahoma: U.S. Geological Survey Bulletin 1866-C, 12 p.
Perry, W.J., 1989, Tectonic evolution of the Anadarko Basin region, Oklahoma: U.S. Geological Survey Bulletin 1866-A, 19 p.
Pipes, P.B., ed., 1980, Oil and gas fields of Oklahoma: Oklahoma City Geological Society Reference Report Supplement 2, 30 p.

124 DEEP NATURAL GAS RESOURCES IN THE UNITED STATES
Robertson, E. C., 1988, Thermal properties of rocks: U.S. Geological Survey Open-File Report 88-441, 106 p.
Schmoker, J.W., 1986, Oil generation in the Anadarko Basin, Oklahoma and Texas-Modeling using Lopatin's method: Oklahoma Geological Survey Special Publication 86-3, 40 p.
Schmoker, J.W., and Gautier, D.L., 1988, Sandstone porosity as a function of thermal maturity: Geology, v. 16, no. 11, p.l007-1010.
Schmoker, J.W., and Hester, T.C., 1990, Regional trends of sandstone porosity versus vitrinite reflectance-A preliminary
framework, in Nuccio, V.F., and Barker, C.E., eds., Applications of thermal maturity studies to energy exploration: Denver, Colo., Rocky Mountain Section, Society of Economic Paleontologists and Mineralogists, p. 53-60.
Scott. G.N., 1982, Temperature equilibration in boreholes-A statistical approach: Ann Arbor, Mich., University of Michigan M.S. thesis, 63 p.
Walpole, R.E., and Myers, R.H., 1985, Probability and statistics for engineers and scientists (3rd ed.): New York, Macmillan, 639 p.
Source-Rock Potential of Precambrian Rocks in Selected Basins of the United States
By James G. Palacas
GEOLOGIC CONTROLS OF DEEP NATURAL GAS RESOURCES IN THE UNITED STATES
U.S. GEOLOGICAL SURVEY BULLETIN 2146-J
UNITED STATES GOVERNMENT PRINTING OFFICE, WASHINGTON : 1997
CONTENTS
Abstract ........................................................................................................................... 127 Introduction ..................................................................................................................... 127 Midcontinent Rift System ............................................................................................... 128
Lake Superior Segment ........................................................................................... 128 Minnesota Segment ................................................................................................. 129 Iowa Segment. ......................................................................................................... 130 Kansas Segment ...................................................................................................... 131
Grand Canyon Area, Northern Arizona .......................................................................... 132 References Cited ............................................................................................................. 133
FIGURES
1. Map showing general location of major rock types of Midcontinent Rift system and localities at which Precambrian sedimentary rocks were studied.................................................................................................................. 129
2. Schematic geologic cross section of Midcontinent Rift system, central Iowa . .. . . . ... ......... .. . . . . . .. . . ... . . . . ....... ... . ... . . . . ... .. .. . .. 131 3. Map showing sample locality and simplified geological section of Chuar Group, eastern Grand Canyon .................... 132 4. Map showing possible distribution of Late Proterozoic Chuar Group or equivalent rocks in
northern Arizona and Utah .............................................................................................................................................. 133
TABLE
1. Geochemical data from possible Precambrian source rocks, Midcontinent Rift system and Grand Canyon, northern Arizona.............................................................................................................................................................. 130

Source-Rock Potential of Precambrian Rocks in Selected Basins of the United States
By James G. Palacas
ABSTRACT
Assessment of gas source potential, based mostly on organic matter richness and thermal maturity, was conducted on Precambrian (Proterozoic) rocks of four segments of the Midcontinent Rift system and in the Grand Canyon area, Arizona. In the Lake Superior segment of the Midcontinent Rift system, at shallow depths, indigenous oil seeps are present in thin intervals of silty shales of the Nonesuch Formation. These shales contain as much as 3.0 percent total organic carbon (average 0.6 percent) and are marginally mature to mature with respect to the principal zone of oil generation. Should thicker sections of organic-rich shales of the Nonesuch Formation be present at greater depths of burial where higher maturity levels have been attained, the gas source potential could be fair to good.
In the Minnesota segment of the Midcontinent Rift system, as evaluated in the Lonsdale 65-1 borehole, St. Croix horst, Rice County, Minnesota, darker gray mudstones of the Solar Church Formation have organic carbon contents of commonly less than 0.4 percent and genetic potentials (S 1 +S2) of less than 0.1 milligrams of hydrocarbon per gram of rock. The rocks are thermally overmature (Tmax=494°C) and most likely have a poor remaining source potential, at least in the vicinity of the Lonsdale well. Other parts of the Minnesota segment have not been appraised.
The Iowa segment of the Midcontinent Rift system was evaluated from drill samples from the Amoco 1 Eischeid well, immediately west of the Iowa (medial) horst, Carroll County, Iowa. Analyses of 200-300 ft (61-91 m) of darkgray to black shale, at depths of 15,000-16,425 ft ( 4,570-5,006 m), indicate that the rocks are overmature (T max=503 OC), contain as much as 1.4 percent organic carbon (average 0.6 percent), and have a genetic potential as high as 0.4 milligrams of hydrocarbon per gram of rock. Although potential for commercial gas production is poor at the Eischeid locality, good source potential cannot be precluded from other areas. One such area may be where equivalent shales are present at lower maturity levels, along the basin flanks, away from the frontal fault zone of the medial horst.
Evaluation of the Kansas segment of the Midcontinent Rift was confined to two boreholes that penetrated only two of a series of small, structurally and stratigraphically complex subbasins. In the first subbasin, penetrated by the Texaco 1 Poersche well, sedimentary rocks of the Rice Formation have no petroleum source potential. In the second subbasin, penetrated by the Producers Engineering 1-4 Finn well, a 296-foot- (90 m)-thick unit of the Rice Formation composed of gray siltstone has some hydrocarbon source potential. The much richer, upper half of this unit is characterized by a total organic carbon content of as much as 0.95 percent (average 0.66 percent) and a genetic potential of as much as 0.75 milligrams of hydrocarbon per gram of rock. A more conclusive evaluation of the Kansas segment requires study of some of the adjoining subbasins.
The 5,370-foot (1,636 m)-thick Late Proterozoic Chuar Group, exposed in the eastern Grand Canyon, Arizona, contains abundant gray to black mudstone and siltstone that have good petroleum source potential. The Walcott Member, the uppermost unit ofthe Chuar Group, is the richest unit in terms of hydrocarbon-generating material. Source rocks of the lower half of the Walcott Member are thermally mature and have organic carbon contents as high as 10.0 percent (average 3.0 percent), genetic potential as high as 16.0 milligrams of hydrocarbon per gram of rock (average 6.0) and extractable organic matter contents as high as 4,000 ppm. Strata of the Chuar Group may be sources for economic accumulations of gas and oil in Late Proterozoic or lower Paleozoic reservoirs in northern Arizona and southern Utah.
INTRODUCTION
Although Precambrian rocks are distributed throughout the United States and commonly are present in the deeper parts of sedimentary basins, their petroleum source-rock potential is poorly known. These rocks may have generated and expelled petroleum that was subsequently trapped in Precambrian and (or) younger overlying Phanerozoic rocks.
127

128 DEEP NATURAL GAS RESOURCES IN THE UNITED STATES
In this report, I discuss the source-rock potential of Precambrian (Proterozoic) unmetamorphosed sedimentary rocks in selected basins of the United States.
The impetus for ascribing a viable petroleum potential to Precambrian rocks in the United States is provided by the production of commercial oil and gas derived from Precambrian rocks in other parts of the world. For example, in Oman, carbonate-evaporite rocks of the Late Proterozoic Huqf Group are believed to be the source of about 12 BBO and an undetermined amount of gas accumulated in Proterozoic and overlying Paleozoic and Mesozoic reservoirs (Grantham and others, 1987; Brett Mattes, as reported in Fritz, 1989; Edgell, 1991). In the Lena-Tunguska petroleum province of eastern Siberia, major and giant fields produce gas, gas condensate, and oil from Proterozoic (Riphean and Vendian age) and Lower Cambrian strata (Meyerhoff, 1980; Clarke, 1985). One of the largest fields discovered, the Verkhnevilyuy field, has proven plus probable reserves of 10.5 TCFG and about 260 million barrels of condensate (Meyerhoff, 1980). The predominant source beds are of Proterozoic age (Meyerhoff, 1980; Clarke, 1985). Undiscovered petroleum resources of the Lena-Tunguska basin may be as high as 189 TCFG and about 11 BBO (Clarke, 1985). Interestingly, in an earlier assessment, Meyerhoff (1980, p. 225) estimated an ultimate recovery of "200 TCFG together with condensate."
In the Sichuan basin of southwest China, giant accumulations of natural gas were derived from Late Proterozoic (Sinian) carbonate rocks (Korsch and others, 1991). One of the gas fields in the basin, the Weiyuan gas field, is estimated to have a total reserve of as much as 1.41 TCFG (Korsch and others, 1991).
In this report, I focus on the source-rock potential of Proterozoic rocks in two regions of the United States, the Midcontinent Rift system and the Grand Canyon area in northern Arizona and vicinity. Other promising areas exhibiting Precambrian petroleum potential are in the Uinta Mountains and vicinity, where the relatively organic rich Late Proterozoic Red Pine Shale and equivalent rocks are widely distributed both in the surface and subsurface (M.W. Reynolds, oral commun., 1990; R. Raynolds, Amoco Production Company, written commun., 1990), and in the Rocky Mountain overthrust belt of northwestern Montana, where gas shows were encountered in 1.43-Ga rocks to depths of 17,774 ft (5,418 m) in the Atlantic-Richfield No. 1 Gibbs well (Shirley, 1985).
MIDCONTINENT RIFT SYSTEM
Rocks of the Midcontinent Rift system, which is delineated by strong gravimetric and magnetic anomalies, are exposed in the Lake Superior region of Michigan, northern Wisconsin, and Minnesota and extend in the subsurface through Minnesota, Iowa, Nebraska, and into northeastern
Kansas (fig. 1). Based on gravity measurements, a related arm of the rift system can also be traced in the subsurface from the Lake Superior region southeastward into the lower peninsula of Michigan (fig. 1) (Dickas, 1986). This easterly extension of the rift is not discussed in this report. The 940-mile (1,500 km)-long Midcontinent Rift system is a failed rift characterized by a series of asymmetric basins filled with clastic rocks in places as thick as 32,000 ft (9,754 m) (Anderson, 1989). The rocks belong to the Middle Proterozoic Keweenawan Supergroup, comprising the Bayfield Group above and the Oronto Group below. The Midcontinent Rift system can be divided into four geographically identifiable segments (Lake Superior, Minnesota, Iowa, and Kansas), and the petroleum potential of each segment is assessed separately, based mostly on geologic and (or) geochemical data derived from examination of Middle Proterozoic rocks from specific localities within each segment.
LAKE SUPERIOR SEGMENT
The potential for petroleum reserves in the Midcontinent Rift system has long been recognized because of active crude oil seeps emanating from shales within the ::::::: 1.1-Ga Nonesuch Formation at the White Pine mine in the Lake Superior region (fig. 1) (Dickas, 1986). In this region, the Nonesuch Formation, the middle unit of the Oronto Group, ranging in thickness from about 250 to 700ft (76-213 m) and averaging 600ft (183m), consists of interbedded darkgrayish to -greenish sandstone, siltstone, and silty shale. Analyses of almost 400 outcrop and shallow core samples (lmbus and others, 1987; Pratt and others, 1989) indicate that the total organic carbon content for Nonesuch rocks is generally less than 0.3 percent; however, the total organic content of finely laminated calcareous and noncalcareous silty shales, which are in thin intervals, ranges from 0.25 to 2.8 percent and averages 0.6 percent (table 1) (Hieshima and others, 1989). It is these finely laminated silty shales that show promise of being hydrocarbon source beds. Surprisingly, these 1.1-Ga shales along the outcrop belt have never experienced severe thermal stress. Rock-Eval Tmax data (table 1) and biological marker distributions suggest that these fine-grained source rocks are marginally mature to mature with respect to the principal zone of oil generation (Hieshima and others, 1989; Pratt and others, 1989).
If thicker sections of these finely laminated, hydrocarbon-generating shales are downdip from the outcrop belt and if these shales were subjected to higher levels of thermal maturation in the geologic past, the gas source potential for the Lake Superior and the adjoining area in northern Wisconsin should be fair to good. This evaluation is, of course, contingent also on the presence of adequate reservoir rocks and seals.
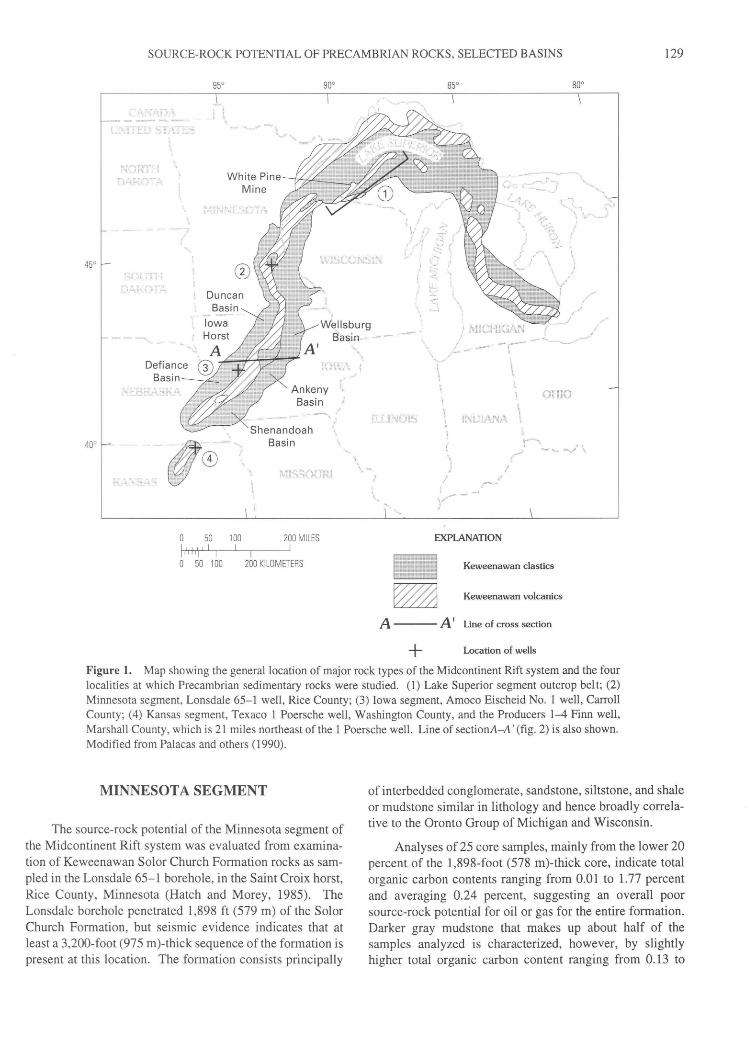
SOURCE-ROCK POTENTIAL OF PRECAMBRIAN ROCKS, SELECTED BASINS 129
Basin
Iowa Horst
0 50 100
1,', 1''1' I I 0 50 100
I
Basin
200 MILES I
200 KILOMETERS
EXPLANATION
Keweenawan clastics
Keweenawan volcanics
A A 1 Line of cross section
+ Location of wells
Figure 1. Map showing the general location of major rock types of the Midcontinent Rift system and the four localities at which Precambrian sedimentary rocks were studied. (1) Lake Superior segment outcrop belt; (2) Minnesota segment, Lonsdale 65-1 well, Rice County; (3) Iowa segment, Amoco Eischeid No. 1 well, Carroll County; (4) Kansas segment, Texaco 1 Poersche well, Washington County, and the Producers 1-4 Finn well, Marshall County, which is 21 miles northeast of the 1 Poersche well. Line of sectionA-A' (fig. 2) is also shown. Modified from Palacas and others (1990).
MINNESOTA SEGMENT
The source-rock potential of the Minnesota segment of the Midcontinent Rift system was evaluated from examination of Keweenawan Solor Church Formation rocks as sampled in the Lonsdale 65-1 borehole, in the Saint Croix horst, Rice County, Minnesota (Hatch and Morey, 1985). The Lonsdale borehole penetrated 1,898 ft (579 m) of the Sol or Church Formation, but seismic evidence indicates that at least a 3,200-foot (975 m)-thick sequence of the formation is present at this location. The formation consists principally
of interbedded conglomerate, sandstone, siltstone, and shale or mudstone similar in lithology and hence broadly correlative to the Oronto Group of Michigan and Wisconsin.
Analyses of 25 core samples, mainly from the lower 20 percent of the 1 ,898-foot (578 m)-thick core, indicate total organic carbon contents ranging from 0.01 to 1.77 percent and averaging 0.24 percent, suggesting an overall poor source-rock potential for oil or gas for the entire formation . Darker gray mudstone that makes up about half of the samples analyzed is characterized, however, by slightly higher total organic carbon content ranging from 0.13 to

130 DEEP NATURAL GAS RESOURCES IN THE UNITED STATES
Table 1. Geochemical data from possible Precambrian source rocks, Midcontinent Rift system and Grand Canyon, northern Arizona. [Locations are shown in figures 1 and 3]
Location Stratigraphic unit and lithology Trnax (°C) Level of maturity
Lake Superior segment 0.6 418-427 Marginally mature to mature.
Minnesota segment Solor Church Formation (mudstone) 0.13-1.77 0.4 494 Overmature.
Iowa segment Nonesuch Formation equivalent (dark shale) 0.1-1.4 0.6 497-508 Overmature.
Kansas segment Keweenawan (undifferentiated) (Producers Finn No. 1 well) (siltstone) 0.1-0.8 0.6 445-450 Mature.
Grand Canyon area, northern Arizona
Eastern Grand Canyon Walcott Member1 (dark mudstone) 1.0-10.0 -3.0 424-452 Mature. 10fthe Kwagunt Formation; the uppermost stratigraphic unit in the Chuar Group (fig. 3).
1.77 percent and averaging 0.4 percent. Under certain circumstances, average total organic carbon contents of0.4 per
cent and even 0.3 percent have been considered by some
geochemists as the minimum necessary to form a hydrocarbon source rock (Dow, 1977; Palacas, 1978; Tissot and Welte, 1984, p. 497) . Thus, from the standpoint of total
organic carbon alone, the shale could be considered to have some petroleum source-rock potential. The average genetic
potential (S ,+S2) of less than 0.1 milligrams of hydrocarbon
per gram of rock strongly indicates, however, that these rocks are now poor in hydrocarbon-generating organic matter both for oil and gas. The very low average genetic potential is mostly attributed to the advanced level of thermal
maturation. This level of thermal maturation is corroborated
by the only realistic T max value ( 494 OC), obtained from the
richest mudstone sample analyzed (total organic carbon con
tent, 1.77 percent). Based on previous maturity evaluations of basins worldwide, the T max value of 494 OC suggests that the Solar Church organic matter at the Lonsdale 65-1 local
ity has advanced to the transition stage between the wet-gas and dry-gas generating zones (Hatch and Morey, 1985).
From the above considerations, it is clear that at the
present time the gas source potential of the Middle Protero
zoic Solar Church Formation rocks is poor in the region of
the Saint Croix horst and particularly at the Lonsdale well
locality. Perhaps in the geologic past economic quantities of
gas were generated; however, Hatch and Morey ( 1985) sug
gested that, if hydrocarbons were generated when the Sol or
Church Formation experienced maximum burial depth and
high geothermal gradients, the generated hydrocarbons were
lost as a consequence of subsequent uplift and erosion that produced clastic sediments included in the overlying Fond duLac Formation (Bayfield Group correlative).
lOW A SEGMENT
The Iowa segment of the Midcontinent Rift system is unique in that the hydrocarbon source-rock assessment was made of the thickest section (14,898 ft, 4,540 m) of Precambrian sedimentary rock sampled by drilling from anywhere in the 940-mile (1,500 km)-long structure. Assessment of this segment is based on analysis of 40 core and cuttings samples from the 17,851-foot (5,440 m)-deep Amoco M.G. Eischeid No. 1 well drilled in 1987 in an asymmetric halfgraben-like basin northwest of the medial horst (Iowa horst), Carroll County, Iowa (figs. 1, 2) (Palacas and others, 1990). The Eischeid well penetrated 2,802 ft (854 m) of Phanerozoic (mostly Paleozoic) strata, 14,898 ft (4,541 m) of Middle Proterozoic (Keweenawan) unmetamorphosed sedimentary rocks, and 151 ft (46 m) of Middle Proterozoic gabbroic intrusive rocks. The Keweenawan rocks comprise 7,708 ft (2,349 m) of an upper "Red Clastic" sequence, resembling the Bayfield Group of Wisconsin, and 7,190 ft (2,191 m) of a lower "Red Clastic" sequence, generally correlative to the Oronto Group of Wisconsin.
Most of the Keweenawan sedimentary rocks, composed of red and red-brown sandstone, siltstone, and silty shale, are oxidized and have no source-rock potential. These oxidized rocks have total organic carbon contents of less than 0.1 percent and genetic potentials of less than 0.1 milligrams of hydrocarbon per gram of rock. In the lower "Red Clastic" sequence, at depths between 15,000 and 16,425 ft (4,572-5,006 m), a conspicuous darker colored section of rock, possibly equivalent to the Nonesuch Formation of the Lake Superior region, contains a cumulative thickness of 200-300 ft (61-91 m) of gray to black, pyrite-bearing, laminated shale. Total organic carbon content of this shale averages 0.6 percent and is as high as 1.4 percent (table 1), and genetic potential ranges from 0.1 to 0.4 milligrams of hydrocarbon per gram of rock. An average Tmax value of 503°C
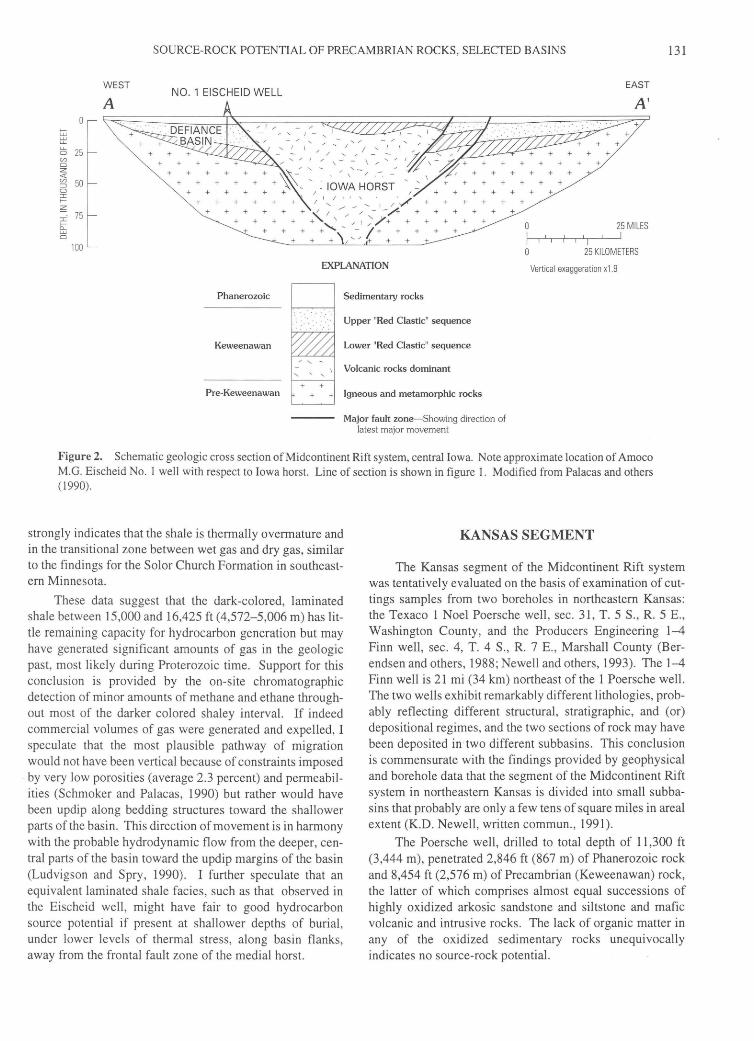
SOURCE-ROCK POTENTIAL OF PRECAMBRIAN ROCKS, SELECTED BASINS 131
~ 0 25 C/J 0 z <( C/J 50 ::l 0 I I-
~ I - 75 fr; 0
100
WEST NO. 1 EISCHEID WELL
EAST
A'
EXPLANATION Vertical exaggeration x1 .9
Phanerozoic Sedimentary rocks
Upper "Red Clastic" sequence
Keweenawan Lower "Red Clastic" sequence
Volcanic rocks dominant ' ' '
+ + Pre-Keweenawan + + Igneous and metamorphic rocks
Major fault zone-Showing direction of latest major movement
Figure 2. Schematic geologic cross section of Midcontinent Rift system, central Iowa. Note approximate location of Amoco M.G. Eischeid No. 1 well with respect to Iowa horst. Line of section is shown in figure 1. Modified from Palacas and others (1990).
strongly indicates that the shale is thermally overmature and in the transitional zone between wet gas and dry gas, similar to the findings for the Solor Church Formation in southeastern Minnesota.
These data suggest that the dark-colored, laminated shale between 15 ,000 and 16,425 ft (4,572-5,006 m) has little remaining capacity for hydrocarbon generation but may have generated significant amounts of gas in the geologic past, most likely during Proterozoic time. Support for this conclusion is provided by the on-site chromatographic detection of minor amounts of methane and ethane throughout most of the darker colored shaley interval. If indeed commercial volumes of gas were generated and expelled, I speculate that the most plausible pathway of migration would not have been vertical because of constraints imposed by very low porosities (average 2.3 percent) and permeabilities (Schmoker and Palacas, 1990) but rather would have been updip along bedding structures toward the shallower parts of the basin. This direction of movement is in harmony with the probable hydrodynamic flow from the deeper, central parts of the basin toward the updip margins of the basin (Ludvigson and Spry, 1990). I further speculate that an equivalent laminated shale facies, such as that observed in the Eischeid well, might have fair to good hydrocarbon source potential if present at shallower depths of burial, under lower levels of thermal stress, along basin flanks , away from the frontal fault zone of the medial horst.
KANSAS SEGMENT
The Kansas segment of the Midcontinent Rift system was tentatively evaluated on the basis of examination of cuttings samples from two boreholes in northeastern Kansas : the Texaco 1 Noel Poersche well, sec. 31, T . 5 S., R. 5 E. , Washington County, and the Producers Engineering 1-4 Finn well, sec. 4, T. 4 S. , R. 7 E. , Marshall County (Berendsen and others, 1988; Newell and others, 1993). The 1-4 Finn well is 21 mi (34 km) northeast of the 1 Poersche well. The two wells exhibit remarkably different lithologies, probably reflecting different structural, stratigraphic, and (or) depositional regimes, and the two sections of rock may have been deposited in ' two different subbasins. This conclusion is commensurate with the findings provided by geophysical and borehole data that the segment of the Midcontinent Rift system in northeastern Kansas is divided into small subbasins that probably are only a few tens of square miles in areal extent (K.D. Newell, written commun., 1991).
The Poersche well, drilled to total depth of 11,300 ft (3,444 m), penetrated 2,846 ft (867 m) of Phanerozoic rock and 8,454 ft (2,576 m) of Precambrian (Keweenawan) rock, the latter of which comprises almost equal successions of highly oxidized arkosic sandstone and siltstone and mafic volcanic and intrusive rocks. The lack of organic matter in any of the oxidized sedimentary rocks unequivocally indicates no source-rock potential.

132 DEEP NATURAL GAS RESOURCES IN THE UNITED STATES
On the other hand, the Producers Engineering 1-4 Finn well, which encountered 1,848 ft (563 m) of Precambrian rock, consisting mostly of arkosic sandstone, siltstone, and shale, showed some minor gas source potential in a 396-foot (90 m)-thick unit of gray siltstone directly beneath the Paleozoic-Precambrian unconformity . The upper half of this unit is the richer, characterized by total organic carbon content as high as about 0.95 percent and averaging 0.66 percent and genetic potential ranging from 0.35 to 0.75 milligrams of hydrocarbon per gram of rock and averaging 0.5 (Newell and others, 1993). The lower half of the unit contains much less organic matter, having total organic carbon contents of about 0.15-0.2 percent. T max values for the entire unit are mostly in the range of 445°C-450°C, well within the oil generation window (435°C-465"C). These maturity values contrast dramatically with the decidely higher maturity values for the Minnesota and Iowa segments of the Midcontinent Rift system (table 1 ).
In summary, although the deepest penetration of Precambrian rock (Poersche well) indicated no hydrocarbon source-rock potential, the 1-4 Finn well, only 21 mi (34 km) northeast of the Poersche well, demonstrates that some gas and (or) oil source potential is present. Because of the structural complexity and abrupt facies changes, individual subbasins should be examined before complete source-rock evaluation is made of the Kansas part of the rift system.
GRAND CANYON AREA, NORTHERN ARIZONA
The Late Proterozoic Chuar Group is exposed in the eastern part of the Grand Canyon. This 5,370-foot (1,636 m)-thick succession of predominantly very fine grained siliciclastic rocks contains thin sequences of sandstone and stromatolitic and cryptalgal carbonate rocks (figs. 3, 4) (Reynolds and others, 1988). More than half the succession consists of organic-rich gray to black mudstone (or shale) and siltstone. Fossil micro-organisms, such as Chua ria (discoidal megaplanktonic algae), tear and flask-shaped chitinozoa (?), filamentous algae, and individual and clusters of spheroidal, cystlike planktonic organisms, are abundant to common throughout successions of dark mudstone and siltstone (Vidal and Ford, 1985).
Geochemical analyses indicate that the 922-foot (281 m)-thick Walcott Member, the uppermost unit of the Kwagunt Formation (fig. 3), has good to excellent petroleum source-rock potential. The lower half of the Walcott is characterized by total organic carbon content as high as 8.0-10.0 percent (average ::::::3.0 percent), hydrogen index as high as 204 milligrams of hydrocarbon per gram of total organic carbon (average ::::::135), genetic potential (S 1+S2) of almost 16,000 ppm (average ::::::6,000 ppm), and chloroformextractable organic matter as high as 4,000 ppm (Palacas and
Sixtymile Formation
Walcott Member
Awatubi Member
Carbon Butte Member
Duppa Member
Carbon Canyon Member
L. 6 6 6 6 Chert & breccia Sixtvm.ile 6 6 6 6 ______ "' _ EQJITlJltlq_n_ --------
Top dolomite
O_Q Q Q Q_O_Q Pisolitic chert -------
-~z::::z:::::z:::::z:::z::j Flaky dolomite
Biohermal = = = =- =.-- stromatolites
Kwagunt Formation
--+-.:...........~-'---'-~+- --- -- - --< --------f-- - - -
f-- --
I I I ---- - --
l I I -------
-------I L l
---- -- -I I I
-------I I I
-·-·-·-·-
Alternating limestones and
shales with stromatolites
Cl.. ::> 0 cc <..9 cc <X: ::> I u
Galeros Formation
JupiterMember =:=:=:=:= -+-~· -~· -~· -~· -""'1 Stromatolites
Tanner Member /
1
/ ~ ) / Massive, / / / / / coarsely
/ / / / / crystalline L__ ______ _1"'-./L"'-/r"..V'L"--"/_,,/'-'l'- <!_olo_!!l_l!~ __ """ _______ _
ARIZONA
KAIBAB PLATEAU
112°00'
10 MILES I I I
10 KILOMETERS
Figure 3. Map of the eastern Grand Canyon, in northern Arizona, showing sampling locality (solid black pattern) and simplified geological section of the Chuar Group. Modified from Vidal and Ford (1985).
Reynolds, 1989; Palacas and Reynolds, unpublished data). Data for the upper part of the Walcott are incomplete but suggest that these rocks are as rich as the lower part of the Walcott. Maturity assessment indicates that source rocks of the Walcott are within the oil-generation window.
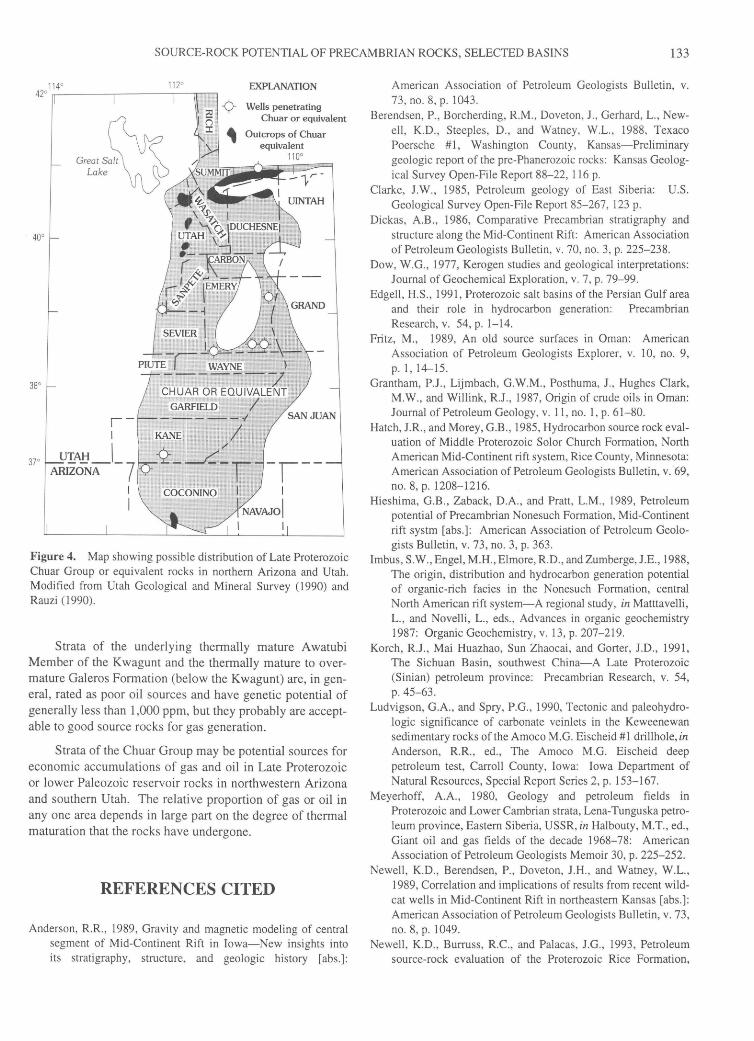
SOURCE-ROCK POTENTIAL OF PRECAMBRIAN ROCKS, SELECTED BASINS 133
EXPLANATION
Wells penetrating Chuar or equivalent
Outcrops of Chuar equivalent
110°
Figure 4. Map showing possible distribution of Late Proterozoic Chuar Group or equivalent rocks in northern Arizona and Utah. Modified from Utah Geological and Mineral Survey ( 1990) and Rauzi (1990).
Strata of the underlying thermally mature Awatubi Member of the Kwagunt and the thermally mature to over
mature Galeros Formation (below the Kwagunt) are, in gen
eral, rated as poor oil sources and have genetic potential of
generally less than 1 ,000 ppm, but they probably are accept
able to good source rocks for gas generation.
Strata of the Chuar Group may be potential sources for
economic accumulations of gas and oil in Late Proterozoic
or lower Paleozoic reservoir rocks in northwestern Arizona
and southern Utah. The relative proportion of gas or oil in
any one area depends in large part on the degree of thermal maturation that the rocks have undergone.
REFERENCES CITED
Anderson, R.R., 1989, Gravity and magnetic modeling of central segment of Mid-Continent Rift in Iowa-New insights into its stratigraphy, structure, and geologic history [abs.]:
American Association of Petroleum Geologists Bulletin, v. 73, no. 8, p. 1043.
Berendsen, P., Borcherding, R.M., Doveton, J., Gerhard, L., Newell, K.D., Steeples, D., and Watney, W.L., 1988, Texaco Poersche #1, Washington County, Kansas-Preliminary geologic report of the pre-Phanerozoic rocks: Kansas Geological Survey Open-File Report 88-22, 116 p.
Clarke, J.W., 1985, Petroleum geology of East Siberia: U.S. Geological Survey Open-File Report 85-267, 123 p.
Dickas, A.B., 1986, Comparative Precambrian stratigraphy and structure along the Mid-Continent Rift: American Association of Petroleum Geologists Bulletin, v. 70, no. 3, p. 225- 238.
Dow, W.G., 1977, Kerogen studies and geological interpretations: Journal of Geochemical Exploration, v. 7, p. 79- 99.
Edgell, H.S., 1991, Proterozoic salt basins of the Persian Gulf area and their role in hydrocarbon generation: Precambrian Research, v. 54, p. 1-14.
Fritz, M., 1989, An old source surfaces in Oman: American Association of Petroleum Geologists Explorer, v. 10, no. 9, p. 1, 14-15.
Grantham, P.J., Lijmbach, G.W.M., Posthuma, J., Hughes Clark, M.W., and Willink, R.J., 1987, Origin of crude oils in Oman: Journal of Petroleum Geology, v. 11, no. 1, p. 61-80.
Hatch, J.R., and Morey, G.B., 1985, Hydrocarbon source rock evaluation of Middle Proterozoic Solar Church Formation, North American Mid-Continent rift system, Rice County, Minnesota: American Association of Petroleum Geologists Bulletin, v. 69, no.8,p. 1208-1216.
Hieshima, G.B., Zaback, D.A., and Pratt, L.M., 1989, Petroleum potential of Precambrian Nonesuch Formation, Mid-Continent rift systm [abs.]: American Association of Petroleum Geologists Bulletin, v. 73, no. 3, p. 363.
Imbus, S.W., Engel, M.H., Elmore, R.D., and Zumberge, J.E., 1988, The origin, distribution and hydrocarbon generation potential of organic-rich facies in the Nonesuch Formation, central North American rift system-A regional study, in Matttavelli, L., and Novelli, L., eds., Advances in organic geochemistry 1987: Organic Geochemistry, v. 13, p. 207-219.
Karch, R.J., Mai Huazhao, Sun Zhaocai, and Gorter, J.D., 1991, The Sichuan Basin, southwest China-A Late Proterozoic (Sinian) petroleum province: Precambrian Research, v. 54, p. 45-63.
Ludvigson, G.A., and Spry, P.G., 1990, Tectonic and paleohydrologic significance of carbonate veinlets in the Keweenewan sedimentary rocks of the Amoco M.G. Eischeid #1 drillhole, in Anderson, R.R., ed., The Amoco M.G. Eischeid deep petroleum test, Carroll County, Iowa: Iowa Department of Natural Resources, Special Report Series 2, p. 153-167.
Meyerhoff, A.A., 1980, Geology and petroleum fields in Proterozoic and Lower Cambrian strata, Lena-Tunguska petroleum province, Eastern Siberia, USSR, in Halbouty, M.T., ed., Giant oil and gas fields of the decade 1968-78: American Association of Petroleum Geologists Memoir 30, p. 225-252.
Newell, K.D., Berendsen, P., Doveton, J.H., and Watney, W.L., 1989, Correlation and implications of results from recent wildcat wells in Mid-Continent Rift in northeastern Kansas [abs.]: American Association of Petroleum Geologists Bulletin, v. 73, no. 8, p. 1049.
Newell, K.D., Burruss, R.C., and Palacas, J.G., 1993, Petroleum source-rock evaluation of the Proterozoic Rice Formation,
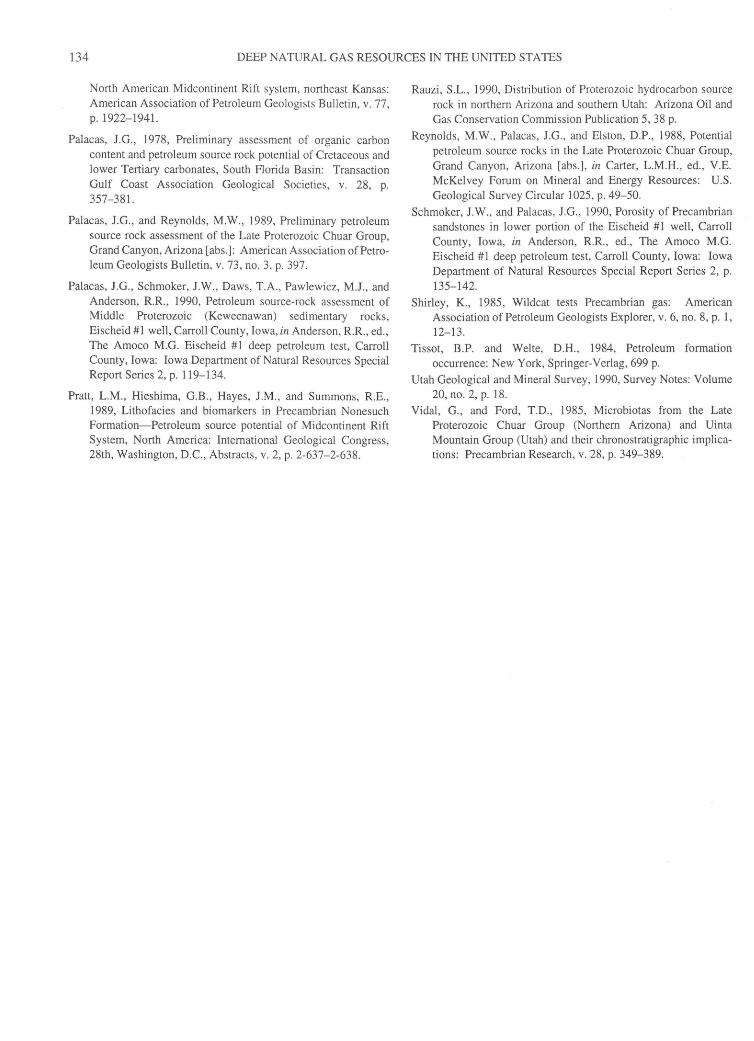
134 DEEP NATURAL GAS RESOURCES IN THE UNITED STATES
North American Midcontinent Rift system, northeast Kansas: American Association of Petroleum Geologists Bulletin, v. 77, p. 1922-1941.
Palacas, J.G. , 1978, Preliminary assessment of organic carbon content and petroleum source rock potential of Cretaceous and lower Tertiary carbonates, South Florida Basin: Transaction Gulf Coast Association Geological Societies, v. 28, p. 357-381.
Palacas, J.G., and Reynolds, M.W., 1989, Preliminary petroleum source rock assessment of the Late Proterozoic Chuar Group, Grand Canyon, Arizona [abs.]: American Association of Petroleum Geologists Bulletin, v. 73, no. 3, p. 397.
Palacas, J.G., Schmoker, J.W., Daws, T.A. , Pawlewicz, M.J., and Anderson, R.R., 1990, Petroleum source-rock assessment of Middle Proterozoic (Keweenawan) sedimentary rocks, Eischeid #1 well, Carroll County, Iowa, in Anderson, R.R., ed., The Amoco M.G. Eischeid #1 deep petroleum test, Carroll County, Iowa: Iowa Department of Natural Resources Special Report Series 2, p. 119-134.
Pratt, L.M., Hieshima, G.B., Hayes, J.M., and Summons, R.E., 1989, Lithofacies and biomarkers in Precambrian Nonesuch Formation-Petroleum source potential of Midcontinent Rift System, North America: International Geological Congress, 28th, Washington, D.C., Abstracts, v. 2, p. 2-637-2-638 .
Rauzi, S.L., 1990, Distribution of Proterozoic hydrocarbon source rock in northern Arizona and southern Utah: Arizona Oil and Gas Conservation Commission Publication 5, 38 p.
Reynolds, M.W ., Palacas, J.G., and Elston, D.P., 1988, Potential petroleum source rocks in the Late Proterozoic Chuar Group, Grand Canyon, Arizona [abs.], in Carter, L.M.H., ed., V.E. McKelvey Forum on Mineral and Energy Resources: U.S. Geological Survey Circular 1025, p. 49-50.
Schmoker, J.W., and Palacas, J.G., 1990, Porosity of Precambrian sandstones in lower portion of the Eischeid #1 well, Carroll County, Iowa, in Anderson, R.R., ed., The Amoco M.G. Eischeid #1 deep petroleum test, Carroll County, Iowa: Iowa Department of Natural Resources Special Report Series 2, p. 135-142.
Shirley, K., 1985, Wildcat tests Precambrian gas: American Association of Petroleum Geologists Explorer, v. 6, no. 8, p. 1, 12-13.
Tissot, B.P. and Welte, D.H., 1984, Petroleum formation occurrence: New York, Springer-Verlag, 699 p.
Utah Geological and Mineral Survey, 1990, Survey Notes: Volume 20, no. 2, p. 18.
Vidal, G., and Ford, T.D., 1985, Microbiotas from the Late Proterozoic Chuar Group (Northern Arizona) and Uinta Mountain Group (Utah) and their chronostratigraphic implications: Precambrian Research, v. 28, p. 349-389.

Minimum Thermal Stability Levels and Controlling Parameters of Methane, As Determined by C15+ Hydrocarbon Thermal Stabilities
By Leigh C. Price
GEOLOGIC CONTROLS OF DEEP NATURAL GAS RESOURCES IN THE UNITED STATES
U.S. GEOLOGICAL SURVEY BULLETIN 2146-K
UNITED STATES GOVERNMENT PRINTING OFFICE, WASHINGTON: 1997

CONTENTS
Abstract ........................................................................................................................... 139 Introduction ..................................................................................................................... 139 Paradigms of Petroleum Geochemistry ........................................................................... 140 Alternate Hypotheses for Organic-Matter Metamorphism ............................................. 140
Reaction Order ........................................................................................................ 140 Effect of Water ........................................................................................................ 141 System Openness .................................................................................................... 142 Fluid Pressure .......................................................................................................... 144 Organic-Matter Type ............................................................................................... 146
Alternate Ranks for Some Petroleum-Geochemical Events ........................................... 151 Hydrocarbon Thermal Stability Limits ........................................................................... 154
Deep Wellbore Data ................................................................................................ 155 Compositional Changes in Saturated Hydrocarbons at Destruction ....................... 157 Compositional Changes in Aromatic Hydrocarbons During Destruction ............... 163 C15+ Hydrocarbon Thermal Stability-Discussion ................................................ 172
Conclusions ..................................................................................................................... 173 References Cited ............................................................................................................. 17 4
FIGURES
1. Diagram illustrating accepted convention regarding occurrence of principal petroleum-geochemical events and hydrocarbon thermal stability........................................................................................................................... 140
2-7. Graphs showing: 2. Reaction extent versus time for aqueous-pyrolysis experiments on shale of Middle Pennsylvanian
Anna Shale Member .......................................................................................................................................... 141 3. Effect of water on thermal cracking of middle oil distillate fraction from Kingfish oil field,
Gippsland Basin, to gas at different experimental temperatures ....................................................................... 141 4. Rock-Eval Tmax and vitrinite reflectance versus Rock-Eval S1 and S2 pyrolysis peaks for worldwide
Paleozoic to Tertiary coals ............................................................................................................................... 142 5. Mean vitrinite reflectance (Rm) versus Rock-Eval hydrogen index for coals of worldwide distribution
and all geologic ages . . . . . . . . . . .. .. . .. . . . . . .. . . . . .. . . . . .. . .. . . . . . . . ... .. . .. .. . . . . .. . . .. . . . . . . . . . . .. . . . . . . .. ... . . . ... . . . . .. . . . . . . .. . . .. . . . . . . . . . .... .. . . . . . . . . 142 6. Amount of carbon dioxide and methane generated in aqueous pyrolysis of lignite ........................................ 143 7. Amount of C9-C 15 and C 15+ saturated hydrocarbons generated by aqueous pyrolysis of Paleocene
Rattlesnake Butte lignite of Fort Union Formation versus experimental temperature, measured Tmax• and estimated vitrinite reflectance..................................................................................................................... 143
8-10. Plots of concentrations of various products generated by aqueous pyrolysis of shale from Lower Permian Phosphoria Formation versus: 8. Experimental temperature ................................................................................................................................ 145 9. Increasing system static fluid pressure at 28TC ............................................................................................... 146
10. Increasing static fluid pressure at 350°C ........................................................................................................... 147 11. Gas chromatograms of C8+ saturated hydrocarbons generated by aqueous pyrolysis of three rocks
at 200°C and 275°C ................................................................................................................................................ 149 12, 13. Plots of vitrinite reflectance and Rock-Eval transformation ratio and S1 pyrolysis peak versus Rock-Eval
hydrogen index for rocks from the California petroleum basins at equilibrium burial temperatures of: 12. 140°C-159.9°C ................................................................................................................................................ 150 13. 180°C-199.9°C ................................................................................................................................................. 151
CONTENTS
14, 15. Plots of petroleum-geochemical data versus depth: 14. Ralph Lowe-1 well bore, Pecos County, Texas .......... ......... ................... ... ......... .. ..... .... .. .. ...................... .... ..... 152 15. Bertha Rogers-1 wellbore, Washita County, Oklahoma .................................................................................. 152
16, 17. Graphs showing: 16. Composition of products from thermal vaporization of coals .......................................................................... 153 17. Amounts of Cis+ hydrocarbons from deep rocks of Bertha Rogers-1, R.G. Jacobs-1, Ralph Lowe-1,
and A.M. Foerster-1 wellbores ........................................................................................................................ 155 18. Plots of petroleum-geochemical parameters versus depth for Chevron R.G. Jacobs-1,
Goliad, Texas, wellbore .......................................................................................................................................... 157 19. Plot of percent porosity and percent residual oil pore saturation versus depth for two of deep
cored intervals ofR.G. Jacobs-1 wellbore ............................................................................................................. 157 20, 21. Gas chromatograms of C8+ saturated hydrocarbons generated by aqueous pyrolysis of:
20. Carbonaceous shale from Middle Pennsylvanian Anna Shale Member ........................................................... 158 21. Lower Permian Phosphoria Formation and lignite ........................................................................................... 160
22. Gas chromatograms of C8+ saturated hydrocarbons for two highly mature Upper Jurassic Smackover Formation gas condensates from Chatom and Big Escambia Creek fields, Alabama, and generated by aqueous pyrolysis of shale from Lower Permian Phosphoria Formation ......................................................... 161
23. Gas chromatograms of Cis+ saturated hydrocarbons for deep rocks of Rogers-1, Foerster-}, Lowe-1, and J acobs-1 well bores and generated by aqueous pyrolysis of Lower Permian Phosphoria Formation.............. 162
24-26. Gas chromatograms of C8+ aromatic hydrocarbons generated by aqueous pyrolysis of: 24. Carbonaceous shale from Middle Pennsylvanian Anna Shale Member and unreacted rock ........................... 163 25. Shale from Lower Permian Phosphoria Formation, in the hydrocarbon thermal destructive phase ................ 164 26. Shale from Eocene Green River Formation and from mid-Miocene of the Los Angeles Basin ..................... 167
27. Cg+ gas chromatograms (flame-photometric detection) of sulfur-bearing aromatic hydrocarbons from immature oil from the Orcutt field, Santa Maria Valley, California, from mature gas-condensate from Big Escambia Creek field, Alabama, and generated by aqueous pyrolysis of shale from Lower Permian Phosphoria Formation of comparable maturity ...................................................................................................... 168
28. Gas chromatograms (flame-photometric-detection) of high-molecular-weight sulfur-bearing aromatic hydrocarbons generated by aqueous pyrolysis of shale from Lower Permian Phosphoria shale and two oils and one gas-condensate of equivalent maturity ........................................................................................ 170
29. C 15+ aromatic hydrocarbon gas chromatograms from bitumen extracted from deep rocks of three deep wells .... 171 30. C8+ aromatic hydrocarbons gas chromatogram (flame-ionization detection) of Flomaton field gas-condensate .. 172 31. Phase diagram of gas species in equilibrium with graphite at a pressure of 1,000 bars ......................................... 173
TABLES
1. Samples on which aqueous-pyrolysis experiments were carried out .............................................................................. 144 2. Hydrocarbon gas concentration and relative loss from equivalent core samples using the "KC core lifter"
and the normal "open" method ........................................................................................................................................ 154 3. List of wells used for figure 17 ........................................................................................................................................ 156 4. Geological and geochemical data for four wells cited in this study................................................................................ 156 5. Normalized percentages for aromatic hydrocarbon compound classes eluting between the dimethylbenzenes
and the trimethylnaphthalenes, as determined by full-scan mass spectrometry, for aqueous-pyrolysis experiments on shale from the Phosphoria Formation (Lower Permian) ............................................................................................ 165
6. Normalized percentages for aromatic hydrocarbon compound classes eluting roughly between the trimethylnaphthalenes and the methylphenanthrenes, as determined by full-scan mass spectrometry, for aqueous-pyrolysis experiments on shale from the Phosphoria Formation (Lower Permian)......................................... 166

Minimum Thermal Stability Levels and Controlling Parameters of Methane,
As Determined by C15+ Hydrocarbon Thermal Stabilities
By Leigh C. Price
ABSTRACT
It is taken as law in petroleum geochemistry that Cis+ hydrocarbons are thermally destroyed at vitrinite reflectance values of 1.35 percent, that C2-C4 hydrocarbons are destroyed at vitrinite reflectance of 2.00 percent, and that rock (greenschist) metamorphism commences at vitrinite reflectance of 4.00 percent. The data of this study lead to the conclusion that these petroleum-geochemical "laws" must be in error. Cis+ hydrocarbons, in reality, are thermally stable to vitrinite reflectance values of7.0-8.0 percent in the natural system, dependent on several variables in deep petroleum basins. CrC4 hydrocarbons are probably thermally stable well into greenschist metamorphic conditions, and methane very probably persists to mantle conditions. The proposed, but erroneous, thermal destruction of Cis+ hydrocarbons by vitrinite reflectance levels of 1.35 percent contradicts the extreme bond strengths (82.6-117 kcaVmole) that must be broken for hydrocarbon destruction, bond strengths which require extreme maturation ranks for disruption.
Evidence for significantly greater thermal stability of Cis+ hydrocarbons than that portrayed by present-day petroleum-geochemical paradigms is from a large petroleumgeochemical data base that demonstrates that high to moderate concentrations of indigenous Cis+ hydrocarbons and bitumen persist in deeply buried rocks at present-day vitrinite reflectance values of 1.35-5.0 percent. Furthermore, moderate to low concentrations of Cis+ hydrocarbons and bitumen persist in rocks having vitrinite reflectance values of 5.0-7.0 percent.
Qualitative analyses of (1) bitumen from high-rank rocks (vitrinite reflectance=2.0-7 .6 percent), (2) high-rank gases and gas condensates, and (3) bitumen from aqueouspyrolysis experiments in the hydrocarbon thermal destructive phase all provide significant insight to Cis+ hydrocarbonthermal destruction. Very characteristic carbon-isotopic and chemical assemblages are present, both in hydrocarbon gases and in C5+ hydrocarbons, in the approach to, and during, Cis+ hydrocarbon-thermal destruction.
Part of the reason for the contradiction between actual Cis+ hydrocarbon thermal stability and the usually accepted petroleum-geochemical paradigm of Cis+ hydrocarbon thermal stability lies in the controlling parameters of organicmatter metamorphism. Organic-matter metamorphism is defined herein as all the reactions involving generation, maturation, and thermal destruction of methane and all C2+ hydrocarbons (and bitumen), and maturation of kerogen. In present-day petroleum geochemistry theory, organic-matter metamorphism is hypothesized to occur by a parallel series of first-order reactions and thus to be controlled primarily by burial temperature and geologic time. A large body of petroleum-geochemical data strongly suggests, however, that organic-matter metamorphic reactions are not first-order reactions but must be higher ordered reactions. If this is the case, then geologic time plays no, or only a minimal, role in organic-matter metamorphism.
Furthermore, possible generally unrecognized, but important, controlling parameters of organic-matter metamorphism have been suggested by U.S. Geological Survey research. These parameters are (1) the absence or presence of water in the system, because Cis+ hydrocarbon-thermal destruction is significantly promoted in water-barren systems and is significantly suppressed in water-bearing systems; (2) increasing fluid pressure, which strongly suppresses all aspects of organic-matter metamorphism, including Cis+ hydrocarbon· generation and thermal destruction; (3) product escape from reaction sites, whether the reaction takes place in an open or closed system (lack of product escape (closed systems) retards organic-matter metamorphism, and product escape (open systems) promotes organic-matter metamorphism); (4) increasing temperature, the principal drive for organic-matter metamorphic reactions, in agreement with present-day petroleum-geochemical paradigms.
INTRODUCTION
The thermal stability of methane in the natural system can be studied in only a few ways. (1) Thermodynamic
139

140 DEEP NATURAL GAS RESOURCES IN THE UNITED STATES
calculations can be carried out (Takach and others, 1987; Barker and Takach, 1992). These calculations, however, predict only what should happen, not what will happen, in the natural system because reaction kinetics can, and in this case do, prevent the predictions from thermodynamics from coming to pass. (2) Methane samples can be taken over wide ranges of maturity from sedimentary and low-grade metamorphic rocks. Such samples, by and large, do not exist (have not previously been taken) and would be expensive to collect. Also, the great mobility of methane would render the analytical results from such a sample base ambiguous. (3) High-temperature laboratory experiments can be carried out. It is difficult, however, to relate the conditions of such experiments to equivalent maturity ranks in the natural system. Furthermore, there are no assurances that the experimental parameters would be equivalent to the controlling parameters of the reactions in nature.
Previous research by myself documents the persistence of moderate to high concentrations of C 1s+ hydrocarbons in rocks at maturation ranks above which methane has been postulated to be thermally stable and moderate to measurable concentrations of C1s+ hydrocarbons in rocks at maturation ranks far above the postulated thermal stability limit for methane. Thus, a fourth way exists with which to firmly set the minimum thermal stability limits for methane, determining the maximum thermal stability limits for C1s+ hydrocarbons in nature.
As will be discussed, because the observed thermal stability limits for C1s+ hydrocarbons are so much greater than the postulated limits for methane, it is insufficient simply to present the data. The reasons for contradictions must be discussed and such a discussion must involve (1) the controlling parameters of hydrocarbon generation and destruction reactions in nature and (2) the origin of the currently accepted paradigms concerning hydrocarbon thermal stability in nature.
Rather than first presenting the data that demonstrates C 1s+ hydrocarbon thermal stability to extreme maturation ranks, the accepted, and other possible, controlling parameters of hydrocarbon generation and destruction are first discussed. The evidence for highly elevated C 1s+ hydrocarbon thermal stability is also the evidence that supports controlling parameters of organic-matter metamorphic reactions alternate to those outlined by current petroleum-geochemical paradigms. By this order of presentation, a better subject continuity is achieved.
PARADIGMS OF PETROLEUM GEOCHEMISTRY
According to present-day petroleum geochemistry, organic-matter metamorphic reactions are first-order, and burial temperature and geologic time are the principal
VITRINITE REFLECTANCE EVENT (R 0 , in percent) 05> 0.9 Oil generation (Oil deposits)
1.35 Oil destroyed; only (Condensate and c,- c4 hydrocarbon wet-gas deposits)
gases stable 2.00
Only methane (Dry gas deposits) stable
4.00
4.00+ Rock metamorphism
Figure 1. Accepted convention regarding occurrence of principal petroleum-geochemical events and hydrocarbon thermal stability.
controls. As such, it is accepted that geologic time can be substituted for burial temperature in Arrhenius equations describing first-order reactions. Hydrocarbon generation begins at a vitrinite reflectance of 0.5-0.6 percent (fig. 1) and is maximum in intensity by a vitrinite reflectance of 0.9 percent. Organic-matter type can affect these vitrinite reflectance values; however, agreement does not exist among petroleum geochemists on the magnitude or direction of the effect for the different types of organic matter . At vitrinite reflectance of 0.9 percent, C1s+ hydrocarbon-thermal destruction commences. By vitrinite reflectance of 1.35 percent all C1s+ hydrocarbons have been destroyed. (Some investigators maintain that all Cs+ hydrocarbons are destroyed by this point.) By vitrinite reflectance of 2.0 percent only methane is stable, and by vitrinite reflectance of 4.0 percent methane is destroyed and rock metamorphism begins.
ALTERNATE HYPOTHESES FOR ORGANIC-MATTER METAMORPHISM
A large published petroleum-geochemical data base does not wholly conform to the above paradigms. Furthermore, interpretation of this data base strongly suggests that alternate petroleum-geochemical models are possible with regards to organic-matter metamorphism.
REACTION ORDER
Increasing burial temperature indeed probably is the principal drive for organic-matter metamorphic reactions; however, organic-matter metamorphic experiments carried out in closed, pressurized, water-wet systems that are thought to simulate nature are not first-order reactions but are higher ordered reactions (Rogers and others, 1962; Bostick, 1970; Brooks, 1971; Mcintyre, 1972; Hesp and
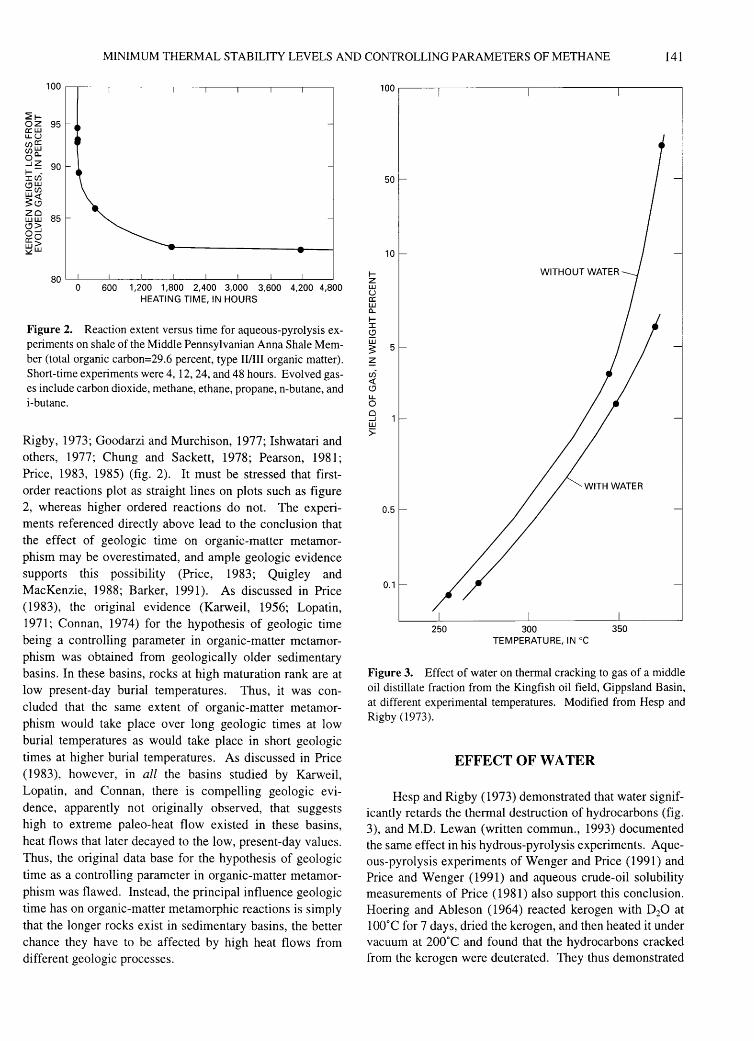
MINIMUM THERMAL STABILITY LEVELS AND CONTROLLING PARAMETERS OF METHANE 141
0 600 1,200 1,800 2,400 3,000 3,600 4,200 4,800 HEATING TIME, IN HOURS
Figure 2. Reaction extent versus time for aqueous-pyrolysis experiments on shale of the Middle Pennsylvanian Anna Shale Member (total organic carbon=29.6 percent, type II/III organic matter). Short-time experiments were 4, 12, 24, and 48 hours. Evolved gases include carbon dioxide, methane, ethane, propane, n-butane, and i-butane.
Rigby, 1973; Goodarzi and Murchison, 1977; Ishwatari and others, 1977; Chung and Sackett, 1978; Pearson, 1981; Price, 1983, 1985) (fig. 2). It must be stressed that firstorder reactions plot as straight lines on plots such as figure 2, whereas higher ordered reactions do not. The experiments referenced directly above lead to the conclusion that the effect of geologic time on organic-matter metamorphism may be overestimated, and ample geologic evidence supports this possibility (Price, 1983; Quigley and MacKenzie, 1988; Barker, 1991). As discussed in Price (1983), the original evidence (Karweil, 1956; Lopatin, 1971; Connan, 1974) for the hypothesis of geologic time being a controlling parameter in organic-matter metamorphism was obtained from geologically older sedimentary basins. In these basins, rocks at high maturation rank are at low present-day burial temperatures. Thus, it was concluded that the same extent of organic-matter metamorphism would take place over long geologic times at low burial temperatures as would take place in short geologic times at higher burial temperatures. As discussed in Price (1983), however, in all the basins studied by Karweil, Lopatin, and Connan, there is compelling geologic evidence, apparently not originally observed, that suggests high to extreme paleo-heat flow existed in these basins, heat flows that later decayed to the low, present-day values. Thus, the original data base for the hypothesis of geologic time as a controlling parameter in organic-matter metamorphism was flawed. Instead, the principal influence geologic time has on organic-matter metamorphic reactions is simply that the longer rocks exist in sedimentary basins, the better chance they have to be affected by high heat flows from different geologic processes.
10
I-z w u a: w a_
I-I l? w 5 5
~ cfj <( l? LL 0 0 _J
w :;::
250 300 TEMPERATURE, IN oc
350
Figure 3. Effect of water on thermal cracking to gas of a middle oil distillate fraction from the Kingfish oil field, Gippsland Basin, at different experimental temperatures. Modified from Hesp and Rigby (1973).
EFFECT OF WATER
Hesp and Rigby (1973) demonstrated that water significantly retards the thermal destruction of hydrocarbons (fig. 3), and M.D. Lewan (written commun., 1993) documented the same effect in his hydrous-pyrolysis experiments. Aqueous-pyrolysis experiments of Wenger and Price (1991) and Price and Wenger (1991) and aqueous crude-oil solubility measurements of Price ( 1981) also support this conclusion. Haering and Ableson (1964) reacted kerogen with D20 at lOOOC for 7 days, dried the kerogen, and then heated it under vacuum at 200°C and found that the hydrocarbons cracked from the kerogen were deuterated. They thus demonstrated
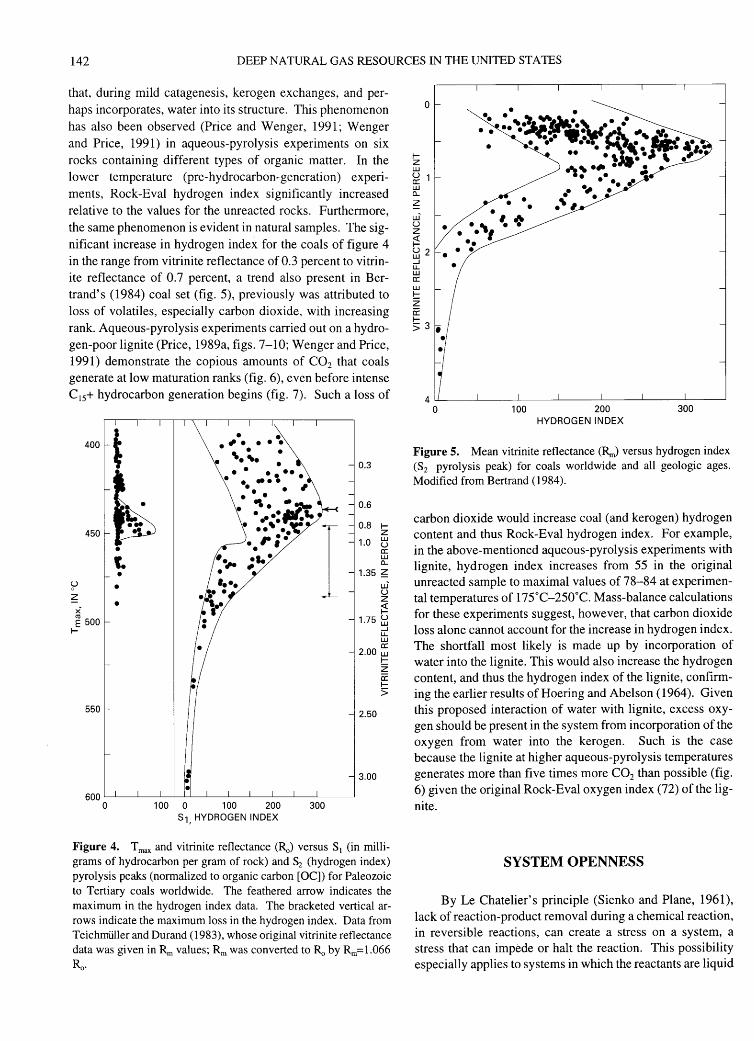
142 DEEP NATURAL GAS RESOURCES IN THE UNITED STATES
that, during mild catagenesis, kerogen exchanges, and perhaps incorporates, water into its structure. This phenomenon has also been observed (Price and Wenger, 1991; Wenger and Price, 1991) in aqueous-pyrolysis experiments on six rocks containing different types of organic matter. In the lower temperature (pre-hydrocarbon-generation) experiments, Rock-Eval hydrogen index significantly increased relative to the values for the unreacted rocks. Furthermore, the same phenomenon is evident in natural samples. The significant increase in hydrogen index for the coals of figure 4 in the range from vitrinite reflectance of 0.3 percent to vitrinite reflectance of 0.7 percent, a trend also present in Bertrand's (1984) coal set (fig. 5), previously was attributed to loss of volatiles, especially carbon dioxide, with increasing rank. Aqueous-pyrolysis experiments carried out on a hydrogen-poor lignite (Price, 1989a, figs. 7-10; Wenger and Price, 1991) demonstrate the copious amounts of C02 that coals generate at low maturation ranks (fig. 6), even before intense C 15+ hydrocarbon generation begins (fig. 7). Such a loss of
400 t • 0.3
~ 0.6
0.8 f-450 z
1.0 LlJ
• u 0:: LlJ a_
1.35 ~
~ LlJ-
~ u z
x· ~ E 5oo 1.75 ~
f- _J u._ LlJ 0::
2.00 LlJ f-z ~ f->
550 2.50
600~--~--L-~~~--L__L __ L_~--~--__J 0 100 0 100 200 300
s1,HYDROGENINDEX
Figure 4. T max and vitrinite reflectance (~) versus S1 (in milligrams of hydrocarbon per gram of rock) and ~ (hydrogen index) pyrolysis peaks (normalized to organic carbon [OC]) for Paleozoic to Tertiary coals worldwide. The feathered arrow indicates the maximum in the hydrogen index data. The bracketed vertical arrows indicate the maximum loss in the hydrogen index. Data from Teichmiiller and Durand (1983), whose original vitrinite reflectance data was given in Rm values; Rm was converted to~ by Rm=l.066 Ro.
fz LlJ u 0:: LlJ a_
z u..i' u z ~
0
~ 2 _J u._ LlJ 0::
~ .· . .. ';.:'r.·-~ .. · .. • • . "•·· •:w~'- .. , .!:.... • • •••• [)&•. NtJe• ~·,. .. . ' , ... ' ·'. ....... -.•.
-~. . .. • • J!, .. , ..
• • ... ,
4 ~----L-----L---~L_ ____ L_ __ ~L_ ____ L_ __ ~
0 100 200 300 HYDROGEN INDEX
Figure 5. Mean vitrinite reflectance (Rru) versus hydrogen index (S2 pyrolysis peak) for coals worldwide and all geologic ages. Modified from Bertrand (1984).
carbon dioxide would increase coal (and kerogen) hydrogen content and thus Rock-Eval hydrogen index. For example, in the above-mentioned aqueous-pyrolysis experiments with lignite, hydrogen index increases from 55 in the original unreacted sample to maximal values of 78-84 at experimental temperatures of 175°C-250°C. Mass-balance calculations for these experiments suggest, however, that carbon dioxide loss alone cannot account for the increase in hydrogen index. The shortfall most likely is made up by incorporation of water into the lignite. This would also increase the hydrogen content, and thus the hydrogen index of the lignite, confirming the earlier results of Haering and Abelson ( 1964). Given this proposed interaction of water with lignite, excess oxygen should be present in the system from incorporation of the oxygen from water into the kerogen. Such is the case because the lignite at higher aqueous-pyrolysis temperatures generates more than five times more C02 than possible (fig. 6) given the original Rock-Eval oxygen index (72) of the lignite.
SYSTEM OPENNESS
By Le Chatelier's principle (Sienko and Plane, 1961), lack of reaction-product removal during a chemical reaction, in reversible reactions, can create a stress on a system, a stress that can impede or halt the reaction. This possibility especially applies to systems in which the reactants are liquid

MINIMUM THERMAL STABILITY LEVELS AND CONTROLLING PARAMETERS OF METHANE 143
150
~ 200
~ ui 0: => ~ 250 0: UJ a.. ~ UJ 1-_.J
~ 300 z UJ ~ 0: UJ a.. >< UJ 350
400
METHANE
•
• •
403 0.22
404 0.23
413 0.31
431 0.54
441 0.72
• 449 0.87
• 453 0.96
558 2.57
• •
• 0.01 0.03 0.06 0.1 0.3 0.6 1 3 6 10 30 60 100 300 600
MILLIGRAMS PER GRAM OF ORGANIC CARBON
Figure 6. Amounts of carbon dioxide and methane generated by aqueous pyrolysis of the Paleocene Rattlesnake Butte lignite of the Fort Union Formation versus experimental temperature, measured Rock-Eval Tmax• and estimated vitrinite reflectance (Ro).
Tmax Ro (oC) (percent)
150 0 403 0.23
404 0.24
200 413 0.31 ~ ~ UJ- 250 431 0.50 0: => 441 0.65 ~ ffi 300 449 0.84 a.. 453 0.93 ~ UJ 558 2.53 1- 350 566 2.63
400
0.01 0.03 0.06 0.1 0.3 0.6 1 3 6 MILLIGRAMS PER GRAM OF ORGANIC CARBON
Figure 7. Amounts of ~-C15 and C15+ saturated hydrocarbons generated by aqueous pyrolysis of the Paleocene Rattlesnake Butte lignite of the Fort Union Formation versus experimental temperature, measured Rock-Eval Tmax• and estimated vitrinite reflectance (R0 ).
or solid and one or more of the products is gas, as is the case in both hydrocarbon-generation and hydrocarbon-thermal destruction reactions. Clearly, organic-matter metamorphic reactions are not reversible reactions for the most part. It is possible, however, but has not been demonstrated, that intermediate species in hydrocarbon-thermal destruction reactions may exist in reversible or equilibrium situations. If such is the case, then one might expect Le Chatelier' s principle to apply to these reactions in closed-chemical systems, and experimental results (discussed later) suggest that this may be the case. Previously, petroleum geochemists (including this author) have considered primary petroleum migration from organic-rich rocks to be very efficient, mostly removing hydrocarbons from their generation sites (Price and others, 1984; Cooles and others, 1986; Leythaueser and others, 1987, 1988; MacKenzie and others, 1987; Talukdar and others, 1987; Ungerer and others, 1987; Espitalie', Maxwell, and others, 1988). Efficient primary migration implies an open-chemical system; however, other considerations (Price and LeFever, 1992; Price, 1994) suggest that in reality most generated hydrocarbons (1) remain locked in source rocks, (2) generally escape only when such rocks are disrupted by faulting, and (3) are lost to drilling muds during the
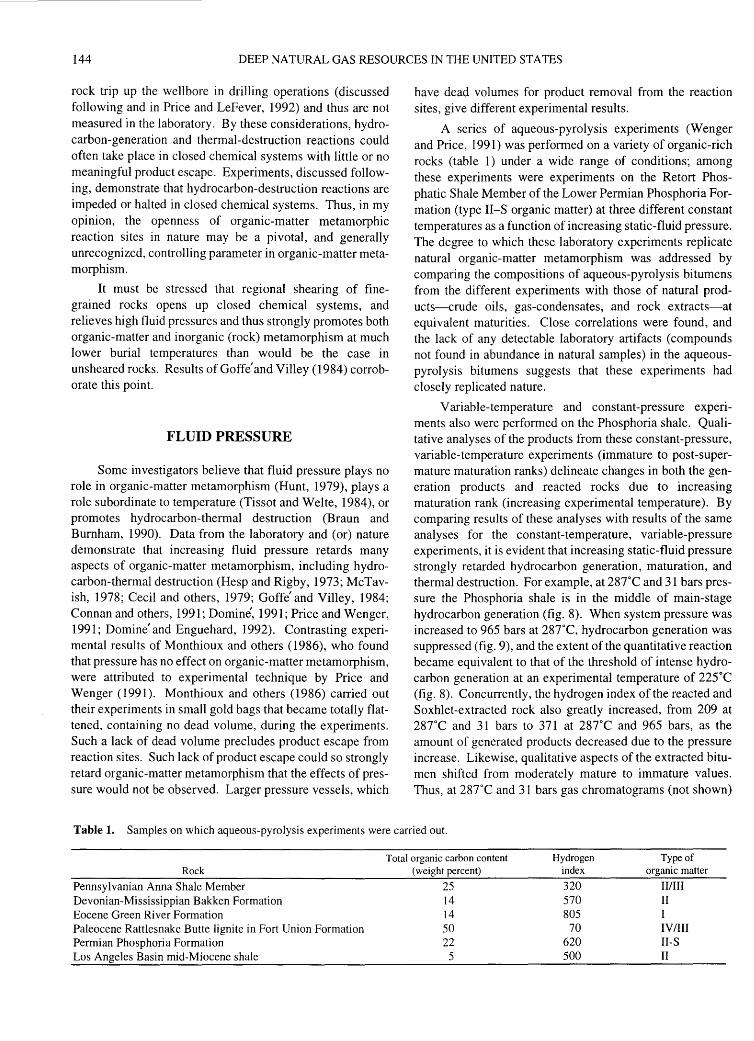
144 DEEP NATURAL GAS RESOURCES IN THE UNITED STATES
rock trip up the well bore in drilling operations (discussed following and in Price and LeFever, 1992) and thus are not measured in the laboratory. By these considerations, hydrocarbon-generation and thermal-destruction reactions could often take place in closed chemical systems with little or no meaningful product escape. Experiments, discussed following, demonstrate that hydrocarbon-destruction reactions are impeded or halted in closed chemical systems. Thus, in my opinion, the openness of organic-matter metamorphic reaction sites in nature may be a pivotal, and generally unrecognized, controlling parameter in organic-matter metamorphism.
It must be stressed that regional shearing of finegrained rocks opens up closed chemical systems, and relieves high fluid pressures and thus strongly promotes both organic-matter and inorganic (rock) metamorphism at much lower burial temperatures than would be the case in unsheared rocks. Results of Goffe' and Villey ( 1984) corroborate this point.
FLUID PRESSURE
Some investigators believe that fluid pressure plays no role in organic-matter metamorphism (Hunt, 1979), plays a role subordinate to temperature (Tissot and Welte, 1984), or promotes hydrocarbon-thermal destruction (Braun and Burnham, 1990). Data from the laboratory and (or) nature demonstrate that increasing fluid pressure retards many aspects of organic-matter metamorphism, including hydrocarbon-thermal destruction (Hesp and Rigby, 1973; McTavish, 1978; Cecil and others, 1979; Goffe' and Villey, 1984; Connan and others, 1991; Domine', 1991; Price and Wenger, 1991; Domine' and Enguehard, 1992). Contrasting experimental results of Monthioux and others ( 1986), who found that pressure has no effect on organic-matter metamorphism, were attributed to experimental technique by Price and Wenger (1991). Monthioux and others (1986) carried out their experiments in small gold bags that became totally flattened, containing no dead volume, during the experiments. Such a lack of dead volume precludes product escape from reaction sites. Such lack of product escape could so strongly retard organic-matter metamorphism that the effects of pressure would not be observed. Larger pressure vessels, which
have dead volumes for product removal from the reaction sites, give different experimental results.
A series of aqueous-pyrolysis experiments (Wenger and Price, 1991) was performed on a variety of organic-rich rocks (table 1) under a wide range of conditions; among these experiments were experiments on the Retort Phosphatic Shale Member of the Lower Permian Phosphoria Formation (type II-S organic matter) at three different constant temperatures as a function of increasing static-fluid pressure. The degree to which these laboratory experiments replicate natural organic-matter metamorphism was addressed by comparing the compositions of aqueous-pyrolysis bitumens from the different experiments with those of natural products-crude oils, gas-condensates, and rock extracts-at equivalent maturities. Close correlations were found, and the lack of any detectable laboratory artifacts (compounds not found in abundance in natural samples) in the aqueouspyrolysis bitumens suggests that these experiments had closely replicated nature.
Variable-temperature and constant-pressure experiments also were performed on the Phosphoria shale. Qualitative analyses of the products from these constant-pressure, variable-temperature experiments (immature to post-supermature maturation ranks) delineate changes in both the generation products and reacted rocks due to increasing maturation rank (increasing experimental temperature). By comparing results of these analyses with results of the same analyses for the constant-temperature, variable-pressure experiments, it is evident that increasing static-fluid pressure strongly retarded hydrocarbon generation, maturation, and thermal destruction. For example, at 28TC and 31 bars pressure the Phosphoria shale is in the middle of main-stage hydrocarbon generation (fig. 8). When system pressure was increased to 965 bars at 28TC, hydrocarbon generation was suppressed (fig. 9), and the extent of the quantitative reaction became equivalent to that of the threshold of intense hydrocarbon generation at an experimental temperature of 225°C (fig. 8). Concurrently, the hydrogen index of the reacted and Soxhlet-extracted rock also greatly increased, from 209 at 28TC and 31 bars to 371 at 28TC and 965 bars, as the amount of generated products decreased due to the pressure increase. Likewise, qualitative aspects of the extracted bitumen shifted from moderately mature to immature values. Thus, at 28TC and 31 bars gas chromatograms (not shown)
Table 1. Samples on which aqueous-pyrolysis experiments were carried out.
Rock
Pennsylvanian Anna Shale Member Devonian-Mississippian Bakken Formation Eocene Green River Formation Paleocene Rattlesnake Butte lignite in Fort Union Formation Permian Phosphoria Formation Los Angeles Basin mid-Miocene shale
Total organic carbon content (weight percent)
25 14 14 50 22 5
Hydrogen index
320 570 805 70
620 500
Type of organic matter
II/III II I IV/III II-S II

MINIMUM THERMAL STABILITY LEVELS AND CONTROLLING PARAMETERS OF METHANE 145
RAW
150
~ 200 ~ w' a: ::> !;j: a: w a...
250 :::2: w I-_J
~ z w :::2: 0: w 300 a... X ASPHALTENES w
350
0 40 80 120 160 MILLIGRAMS OF GENERATED PRODUCTS PER GRAM OF UNREACTED ROCK
Figure 8. Concentration of various products generated by aqueous pyrolysis of shale from the Lower Permian Phosphoria Formation as a function of increasing experimental temperature. "RAW," original unaltered rocks; SA TS, saturated hydrocarbons; AROS, aromatic hydrocarbons.
of the C8+ saturated hydrocarbons had moderately mature characteristics: (1) n-paraffin concentrations generally greater than those of both adjacent isoprenoid hydrocarbons and of biomarker peaks and (2) a regular n-paraffin profile (Price and Wenger, 1991, fig. 7). However, at 28TC and higher pressures C8+ saturated-hydrocarbon distributions become increasingly immature; the 28TC, 865-bar sample was quite immature (n-paraffin concentrations equal to or less than those of adjacent isoprenoid hydrocarbons and biomarker peaks, an irregular n-paraffin profile, and a bimodal distribution in the naphthene envelope). These and much other data (Price and Wenger, 1991) demonstrate that increasing static-fluid pressure retards hydrocarbon generation.
With increasing temperature, by 350°C and 118 bars, the aqueous-pyrolysis experimental system for the Phosphoria shale was strongly into the thermal cracking phase for Cs+ generation products, as indicated by a decrease in the sum of the Cs+ products from a maximum value (versus temperature) of more than 160 mg/g of rock at 333°C to 31 mg/g rock at 350°C (fig. 8). With increasing pressure, however, by 1,077 bars and 350°C, thermal cracking was retarded such that the sum of the Cs+ products increased from 31 to 88 mg/g rock (fig. 10). Furthermore, although the
CI-C4 hydrocarbon gases made up 58.0 percent normalized percent of all the products by weight at 350°C and 118 bars, these gases made up only 16.9 percent of the total product by weight at 350°C and 1,077 bars. At 350°C with increasing pressures, qualitative aspects (maturation indices) of the bitumen and reacted rock also took on less mature characteristics and (or) values, as was true in the 28TC experiments. Thus, data from the 350°C experiments demonstrate that increasing static-fluid pressure also strongly retards the thermal destruction of Cis+ hydrocarbons at a given temperature.
Results of these experiments have implications regarding both hydrocarbon generation and thermal destruction in nature. Consider two geologic situations, one in which the geothermal gradient is high and the other in which it is low, and all other things equal. Hydrocarbon generation may be expected to occur at lower burial temperatures in the high geothermal gradient case as compared to the low geothermal gradient case due to shallower burial depths and thus lower static-fluid pressures. The retardation of Cis+ hydrocarbonthermal destruction at high static-fluid pressures helps explain the presence of moderate to high Cis+ hydrocarbon concentrations in deep (7-10 km) high-rank rocks of deep
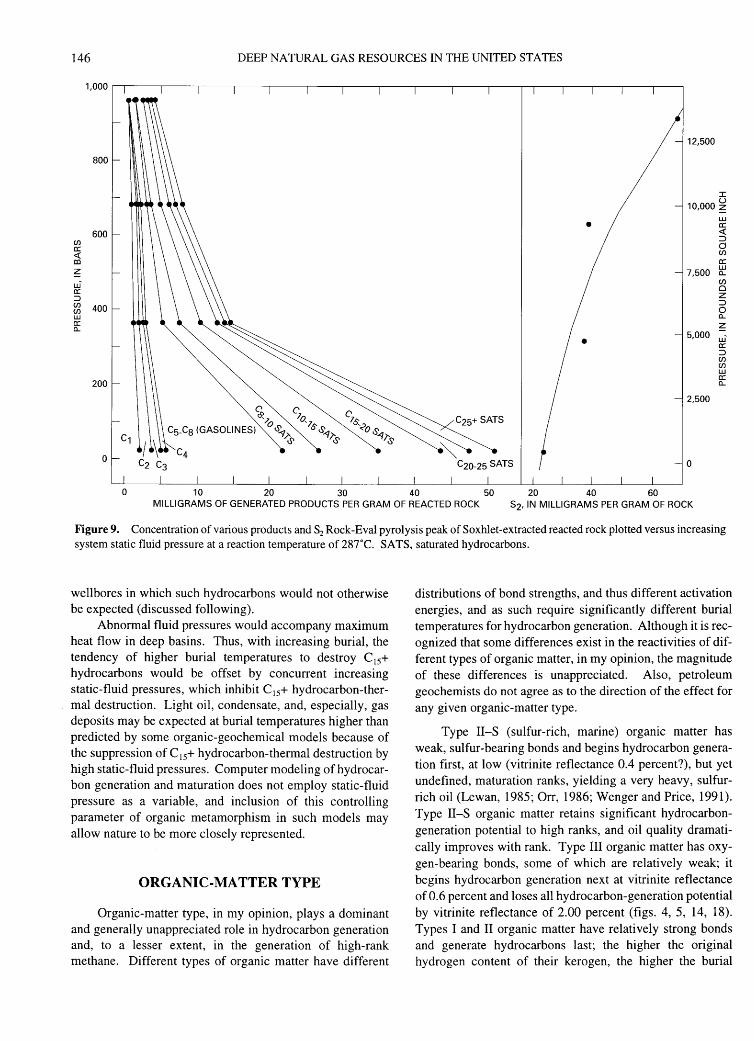
146 DEEP NATURAL GAS RESOURCES IN THE UNITED STATES
12,500
800
I
10,000 ~ UJ • a:
600 <( :J (/) 0 a:
<( (/)
co a: ~ 7,500
UJ a..
UJ- (/)
a: 0 :J z (/) 400
:J (/) 0 UJ a.. a:
~ a.. 5,000 UJ-
a: :J (/) (/) UJ a:
200 a..
2,500
0
0 1 0 20 30 40 50 20 40 60 MILLIGRAMS OF GENERATED PRODUCTS PER GRAM OF REACTED ROCK S2, IN MILLIGRAMS PER GRAM OF ROCK
Figure 9. Concentration of various products and S2 Rock-Eval pyrolysis peak of Soxhlet-extracted reacted rock plotted versus increasing system static fluid pressure at a reaction temperature of 28TC. SATS, saturated hydrocarbons.
wellbores in which such hydrocarbons would not otherwise be expected (discussed following).
Abnormal fluid pressures would accompany maximum heat flow in deep basins. Thus, with increasing burial, the tendency of higher burial temperatures to destroy C 15+ hydrocarbons would be offset by concurrent increasing static-fluid pressures, which inhibit C 15+ hydrocarbon-thermal destruction. Light oil, condensate, and, especially, gas deposits may be expected at burial temperatures higher than predicted by some organic-geochemical models because of the suppression of C15+ hydrocarbon-thermal destruction by high static-fluid pressures. Computer modeling of hydrocarbon generation and maturation does not employ static-fluid pressure as a variable, and inclusion of this controlling parameter of organic metamorphism in such models may allow nature to be more closely represented.
ORGANIC-MATTER TYPE
Organic-matter type, in my opinion, plays a dominant and generally unappreciated role in hydrocarbon generation and, to a lesser extent, in the generation of high-rank methane. Different types of organic matter have different
distributions of bond strengths, and thus different activation energies, and as such require significantly different burial temperatures for hydrocarbon generation. Although it is recognized that some differences exist in the reactivities of different types of organic matter, in my opinion, the magnitude of these differences is unappreciated. Also, petroleum geochemists do not agree as to the direction of the effect for any given organic-matter type.
Type II-S (sulfur-rich, marine) organic matter has weak, sulfur-bearing bonds and begins hydrocarbon generation first, at low (vitrinite reflectance 0.4 percent?), but yet undefined, maturation ranks, yielding a very heavy, sulfurrich oil (Lewan, 1985; Orr, 1986; Wenger and Price, 1991). Type II-S organic matter retains significant hydrocarbongeneration potential to high ranks, and oil quality dramatically improves with rank. Type III organic matter has oxygen-bearing bonds, some of which are relatively weak; it begins hydrocarbon generation next at vitrinite reflectance of 0.6 percent and loses all hydrocarbon-generation potential by vitrinite reflectance of 2.00 percent (figs. 4, 5, 14, 18). Types I and II organic matter have relatively strong bonds and generate hydrocarbons last; the higher the original hydrogen content of their kerogen, the higher the burial
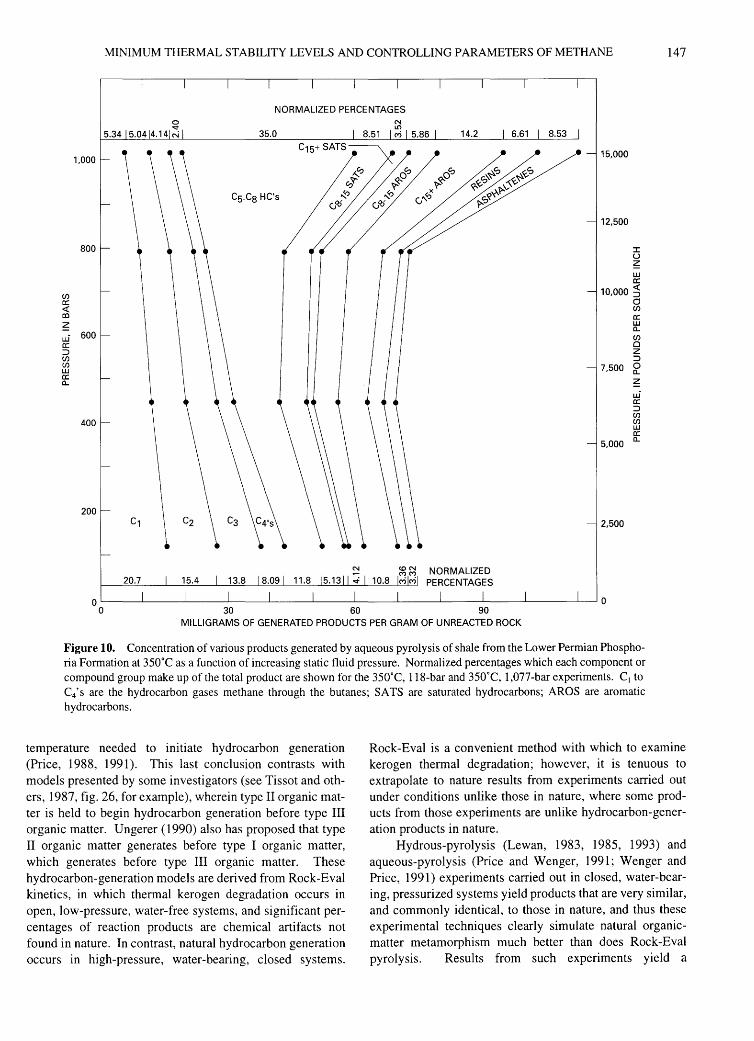
MINIMUM THERMAL STABILITY LEVELS AND CONTROLLING PARAMETERS OF METHANE 147
NORMALIZED PERCENTAGES
1,000
800
(/) a: <( Ill
~ ui 600 a: ::J (/) (/) w a: a..
400
200
15,000
12,500
:I: u z w a:
10,000 ~ 0 (/)
a: w a.. (/) 0 z ::J
7,500 :r z ui a: ::J (/) (/) w a:
5,000 a..
2,500
MILLIGRAMS OF GENERATED PRODUCTS PER GRAM OF UNREACTED ROCK
Figure 10. Concentration of various products generated by aqueous pyrolysis of shale from the Lower Permian Phosphoria Formation at 350oC as a function of increasing static fluid pressure. Normalized percentages which each component or compound group make up of the total product are shown for the 350°C, 118-bar and 350°C, 1,077 -bar experiments. C1 to C4 's are the hydrocarbon gases methane through the butanes; SATS are saturated hydrocarbons; AROS are aromatic hydrocarbons.
temperature needed to initiate hydrocarbon generation (Price, 1988, 1991). This last conclusion contrasts with models presented by some investigators (see Tissot and others, 1987, fig. 26, for example), wherein type II organic matter is held to begin hydrocarbon generation before type III organic matter. Ungerer (1990) also has proposed that type II organic matter generates before type I organic matter, which generates before type III organic matter. These hydrocarbon-generation models are derived from Rock-Eval kinetics, in which thermal kerogen degradation occurs in open, low-pressure, water-free systems, and significant percentages of reaction products are chemical artifacts not found in nature. In contrast, natural hydrocarbon generation occurs in high-pressure, water-bearing, closed systems.
Rock-Eval is a convenient method with which to examine kerogen thermal degradation; however, it is tenuous to extrapolate to nature results from experiments carried out under conditions unlike those in nature, where some products from those experiments are unlike hydrocarbon-generation products in nature.
Hydrous-pyrolysis (Lewan, 1983, 1985, 1993) and aqueous-pyrolysis (Price and Wenger, 1991; Wenger and Price, 1991) experiments carried out in closed, water-bearing, pressurized systems yield products that are very similar, and commonly identical, to those in nature, and thus these experimental techniques clearly simulate natural organicmatter metamorphism much better than does Rock-Eval pyrolysis. Results from such experiments yield a
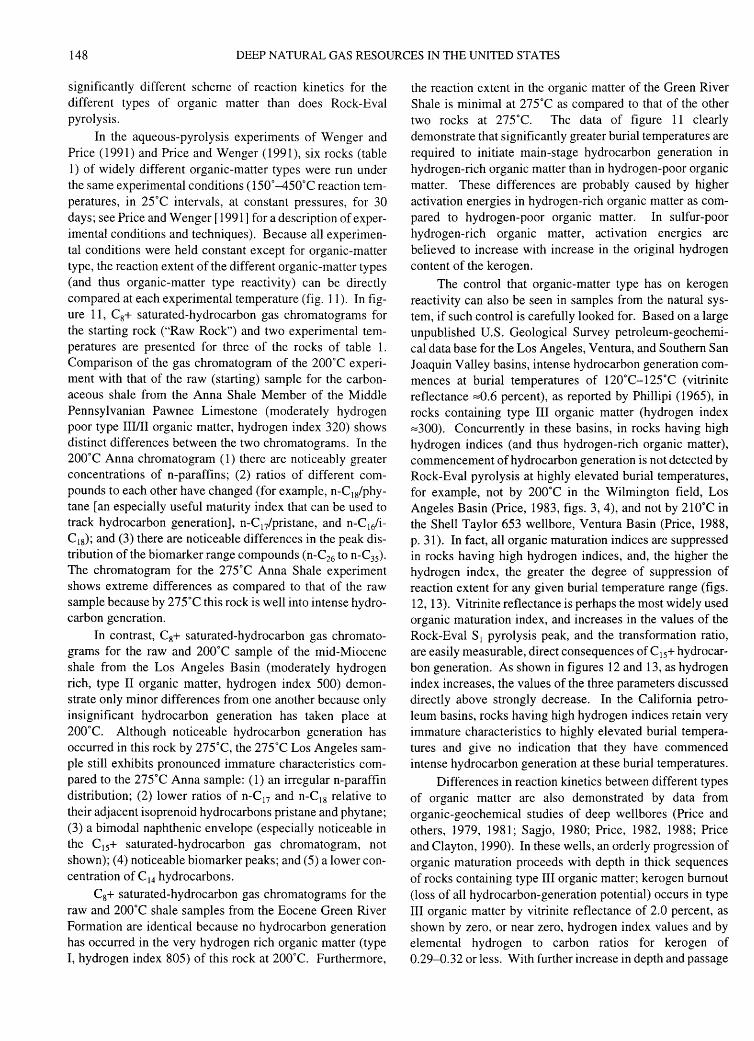
148 DEEP NATURAL GAS RESOURCES IN THE UNITED STATES
significantly different scheme of reaction kinetics for the different types of organic matter than does Rock-Eval pyrolysis.
In the aqueous-pyrolysis experiments of Wenger and Price (1991) and Price and Wenger (1991), six rocks (table 1) of widely different organic-matter types were run under the same experimental conditions ( 150° -450°C reaction temperatures, in 25°C intervals, at constant pressures, for 30 days; see Price and Wenger [1991] for a description of experimental conditions and techniques). Because all experimental conditions were held constant except for organic-matter type, the reaction extent of the different organic-matter types (and thus organic-matter type reactivity) can be directly compared at each experimental temperature (fig. 11 ). In figure 11, C8+ saturated-hydrocarbon gas chromatograms for the starting rock ("Raw Rock") and two experimental temperatures are presented for three of the rocks of table 1. Comparison of the gas chromatogram of the 200°C experiment with that of the raw (starting) sample for the carbonaceous shale from the Anna Shale Member of the Middle Pennsylvanian Pawnee Limestone (moderately hydrogen poor type III/II organic matter, hydrogen index 320) shows distinct differences between the two chromatograms. In the 200°C Anna chromatogram (1) there are noticeably greater concentrations of n-paraffins; (2) ratios of different compounds to each other have changed (for example, n-C 18/phytane [an especially useful maturity index that can be used to track hydrocarbon generation], n-C 17/pristane, and n-C 16/iC18); and (3) there are noticeable differences in the peak distribution of the biomarker range compounds (n-C26 to n-C35). The chromatogram for the 275°C Anna Shale experiment shows extreme differences as compared to that of the raw sample because by 275°C this rock is well into intense hydrocarbon generation.
In contrast, C8+ saturated-hydrocarbon gas chromatograms for the raw and 200°C sample of the mid-Miocene shale from the Los Angeles Basin (moderately hydrogen rich, type II organic matter, hydrogen index 500) demonstrate only minor differences from one another because only insignificant hydrocarbon generation has taken place at 200°C. Although noticeable hydrocarbon generation has occurred in this rock by 275°C, the 275°C Los Angeles sample still exhibits pronounced immature characteristics compared to the 275°C Anna sample: (1) an irregular n-paraffin distribution; (2) lower ratios of n-C 17 and n-C18 relative to their adjacent isoprenoid hydrocarbons pristane and phytane; (3) a bimodal naphthenic envelope (especially noticeable in the C15+ saturated-hydrocarbon gas chromatogram, not shown); ( 4) noticeable biomarker peaks; and (5) a lower concentration of cl4 hydrocarbons.
C8+ saturated-hydrocarbon gas chromatograms for the raw and 200°C shale samples from the Eocene Green River Formation are identical because no hydrocarbon generation has occurred in the very hydrogen rich organic matter (type I, hydrogen index 805) of this rock at 200°C. Furthermore,
the reaction extent in the organic matter of the Green River Shale is minimal at 275°C as compared to that of the other two rocks at 275°C. The data of figure 11 clearly demonstrate that significantly greater burial temperatures are required to initiate main-stage hydrocarbon generation in hydrogen-rich organic matter than in hydrogen-poor organic matter. These differences are probably caused by higher activation energies in hydrogen-rich organic matter as compared to hydrogen-poor organic matter. In sulfur-poor hydrogen-rich organic matter, activation energies are believed to increase with increase in the original hydrogen content of the kerogen.
The control that organic-matter type has on kerogen reactivity can also be seen in samples from the natural system, if such control is carefully looked for. Based on a large unpublished U.S. Geological Survey petroleum-geochemical data base for the Los Angeles, Ventura, and Southern San Joaquin Valley basins, intense hydrocarbon generation commences at burial temperatures of 120°C-125°C (vitrinite reflectance :::::0.6 percent), as reported by Phillipi (1965), in rocks containing type III organic matter (hydrogen index :::::300). Concurrently in these basins, in rocks having high hydrogen indices (and thus hydrogen-rich organic matter), commencement of hydrocarbon generation is not detected by Rock-Eval pyrolysis at highly elevated burial temperatures, for example, not by 200°C in the Wilmington field, Los Angeles Basin (Price, 1983, figs. 3, 4), and not by 210°C in the Shell Taylor 653 wellbore, Ventura Basin (Price, 1988, p. 31). In fact, all organic maturation indices are suppressed in rocks having high hydrogen indices, and, the higher the hydrogen index, the greater the degree of suppression of reaction extent for any given burial temperature range (figs. 12, 13). Vitrinite reflectance is perhaps the most widely used organic maturation index, and increases in the values of the Rock-Eval S 1 pyrolysis peak, and the transformation ratio, are easily measurable, direct consequences of C15+ hydrocarbon generation. As shown in figures 12 and 13, as hydrogen index increases, the values of the three parameters discussed directly above strongly decrease. In the California petroleum basins, rocks having high hydrogen indices retain very immature characteristics to highly elevated burial temperatures and give no indication that they have commenced intense hydrocarbon generation at these burial temperatures.
Differences in reaction kinetics between different types of organic matter are also demonstrated by data from organic-geochemical studies of deep wellbores (Price and others, 1979, 1981; Sagjo, 1980; Price, 1982, 1988; Price and Clayton, 1990). In these wells, an orderly progression of organic maturation proceeds with depth in thick sequences of rocks containing type III organic matter; kerogen burnout (loss of all hydrocarbon-generation potential) occurs in type III organic matter by vitrinite reflectance of 2.0 percent, as shown by zero, or near zero, hydrogen index values and by elemental hydrogen to carbon ratios for kerogen of 0.29-0.32 or less. With further increase in depth and passage
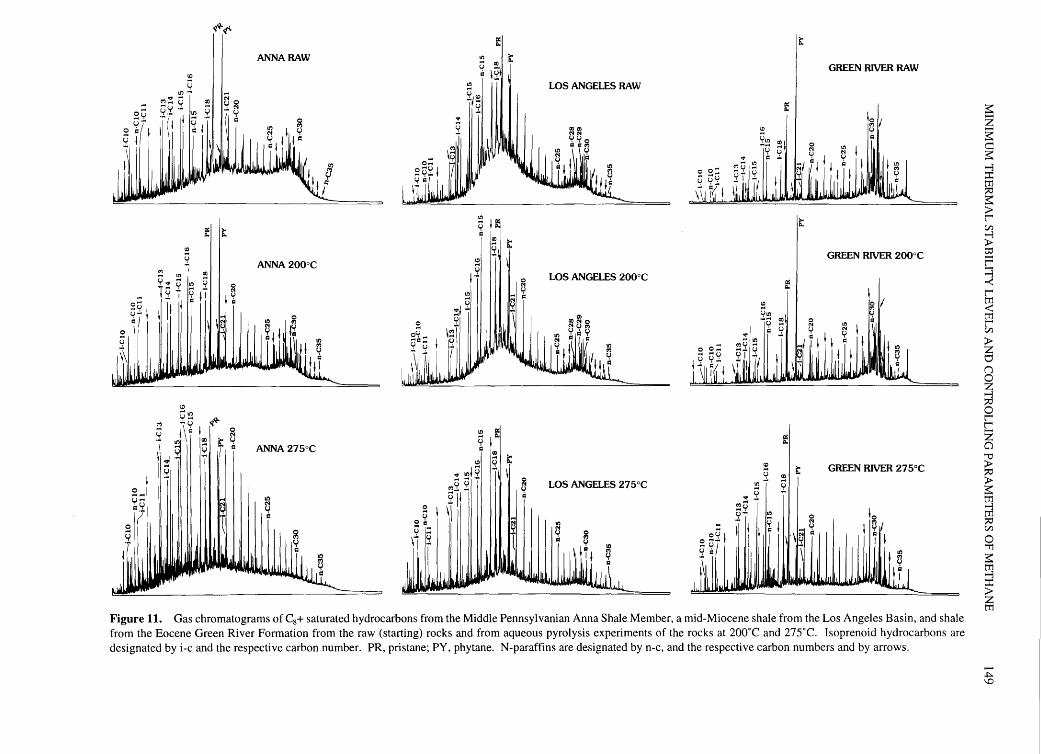
s .... U""
=;
~~~
::e y
yY ·- y C'l~ 0 ·-, QO
;i(! ll ~ ,·-
fl It
~ y., jy
II jl
<Q
~ I
~ Ill u
~ 1!
<Q '"'lfl
0
I~
C'l :!G ~~ 9 1\"= I I ~ i lfl QO t u II .,I ~I ill~ i/ = ~
ANNA RAW
ANNA 200°C
ANNA 275°C
II)
~ ~ I
G ~~::: \I ~
If
QO~ t \Y Ill ,"';' I u .:..,::e ~ .,
~
c IR: =
2J t I ~
u 0 \.:..
... I ~ I~ I \
!!l g: ~ I
<Q
~ d2 2\1 It My y
2jl-\\
0 N u =
LOS ANGELES RAW
LOS ANGELES 200oC
LOS ANGELES 275°C
Ill N y 1:1
t
0: II.
t
g:
g:
~ It u QO
!!lt 2 u
MG .:.I
~~~ ~~~I
GREEN RIVER RAW
GREEN RIVER 200°C
I lg II
GREEN RIVER 275°C
~ u
=
lo
11~(1
Figure 11. Gas chromatograms of Cs+ saturated hydrocarbons from the Middle Pennsylvanian Anna Shale Member, a mid-Miocene shale from the Los Angeles Basin, and shale from the Eocene Green River Formation from the raw (starting) rocks and from aqueous pyrolysis experiments of the rocks at 200°C and 275°C. Isoprenoid hydrocarbons are designated by i-c and the respective carbon number. PR, pristane; PY, phytane. N-paraffins are designated by n-c, and the respective carbon numbers and by arrows.
~ z §: c ~ ...., :I:
~ ~ >l" Cl:l
~ ~ c ...., >-<
~ < tTl l" Cl:l
>z CJ (') 0
~ 0 l" l" z a 'i:)
>:;:tl >~
~ Cl:l
0 "1'1
~ ~ :I: >z tTl
....... +::\0
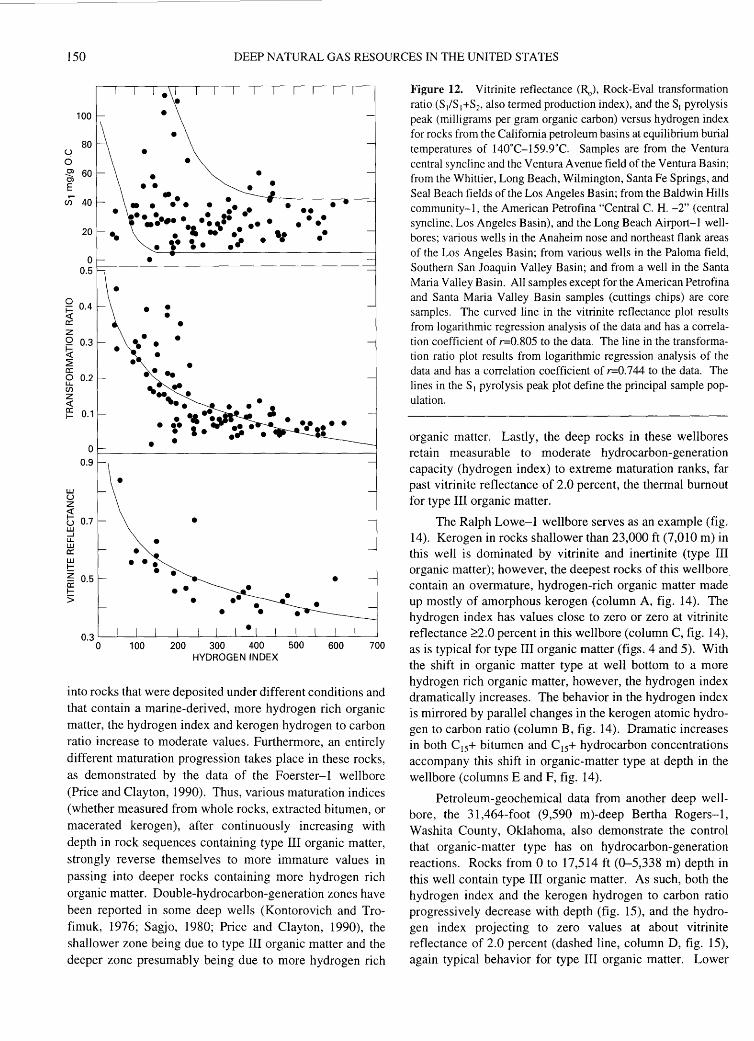
150 DEEP NATURAL GAS RESOURCES IN THE UNITED STATES
100 • •
80 u • 0 • .52: 60 Ol • • E • • J) 40
20
... . • • • • • •• •• • • d • •••••• •••• • •• . . , .. -. .. . ,. '. ·' . "
§ 0.4 • • <:( • a: • z • • 0 0.3 .. • ~ • ~ • • a: .... 0 0.2 u.. ....... (/)
z <( '-· • a: .. I- . .. . • ,. ' .
• •
LU u z ~ • u LU _J
u.. • LU a: • LU • •• I-z • • a: • I->
• 0.3 l___L__j__...l.-.-----l.._....l-----l....--''----'------'----'------'--....__---'-_
0 100 200 300 400 500 600 700 HYDROGEN INDEX
into rocks that were deposited under different conditions and that contain a marine-derived, more hydrogen rich organic matter, the hydrogen index and kerogen hydrogen to carbon ratio increase to moderate values. Furthermore, an entirely different maturation progression takes place in these rocks, as demonstrated by the data of the Foerster-! wellbore (Price and Clayton, 1990). Thus, various maturation indices (whether measured from whole rocks, extracted bitumen, or macerated kerogen), after continuously increasing with depth in rock sequences containing type III organic matter, strongly reverse themselves to more immature values in
passing into deeper rocks containing more hydrogen rich organic matter. Double-hydrocarbon-generation zones have been reported in some deep wells (Kontorovich and Trofimuk, 1976; Sagjo, 1980; Price and Clayton, 1990), the shallower zone being due to type III organic matter and the deeper zone presumably being due to more hydrogen rich
Figure 12. Vitrinite reflectance (~), Rock-Eval transformation ratio (S/S 1+S2> also termed production index), and the S1 pyrolysis peak (milligrams per gram organic carbon) versus hydrogen index for rocks from the California petroleum basins at equilibrium burial temperatures of 140°C-159.9°C. Samples are from the Ventura central syncline and the Ventura A venue field of the Ventura Basin; from the Whittier, Long Beach, Wilmington, Santa Fe Springs, and Seal Beach fields of the Los Angeles Basin; from the Baldwin Hills community-!, the American Petrofina "Central C. H. -2" (central syncline, Los Angeles Basin), and the Long Beach Airport- I wellbores; various wells in the Anaheim nose and northeast flank areas of the Los Angeles Basin; from various wells in the Paloma field, Southern San Joaquin Valley Basin; and from a well in the Santa Maria Valley Basin. All samples except for the American Petrofina and Santa Maria Valley Basin samples (cuttings chips) are core samples. The curved line in the vitrinite reflectance plot results from logarithmic regression analysis of the data and has a correlation coefficient of r=0.805 to the data. The line in the transformation ratio plot results from logarithmic regression analysis of the data and has a correlation coefficient of r=0.744 to the data. The lines in the sl pyrolysis peak plot define the principal sample population.
organic matter. Lastly, the deep rocks in these wellbores retain measurable to moderate hydrocarbon-generation capacity (hydrogen index) to extreme maturation ranks, far past vitrinite reflectance of 2.0 percent, the thermal burnout for type III organic matter.
The Ralph Lowe-1 wellbore serves as an example (fig . 14 ). Kerogen in rocks shallower than 23,000 ft (7 ,010 m) in this well is dominated by vitrinite and inertinite (type III organic matter); however, the deepest rocks of this well bore_ contain an overmature, hydrogen-rich organic matter made up mostly of amorphous kerogen (column A, fig. 14). The hydrogen index has values close to zero or zero at vitrinite reflectance ~2.0 percent in this well bore (column C, fig. 14 ), as is typical for type III organic matter (figs. 4 and 5). With the shift in organic matter type at well bottom to a more hydrogen rich organic matter, however, the hydrogen index dramatically increases. The behavior in the hydrogen index is mirrored by parallel changes in the kerogen atomic hydrogen to carbon ratio (column B, fig. 14). Dramatic increases in both Cis+ bitumen and Cis+ hydrocarbon concentrations accompany this shift in organic-matter type at depth in the wellbore (columns E and F, fig. 14).
Petroleum-geochemical data from another deep wellbore, the 31,464-foot (9 ,590 m)-deep Bertha Rogers-1, Washita County, Oklahoma, also demonstrate the control that organic-matter type has on hydrocarbon-generation reactions. Rocks from 0 to 17,514 ft (0-5,338 m) depth in this well contain type III organic matter. As such, both the hydrogen index and the kerogen hydrogen to carbon ratio progressively decrease with depth (fig. 15), and the hydrogen index projecting to zero values at about vitrinite reflectance of 2.0 percent (dashed line, column D, fig. 15), again typical behavior for type III organic matter. Lower

MINIMUM THERMAL STABILITY LEVELS AND CONTROLLING PARAMETERS OF METHANE 151
120
u 0 80 J2.l Cl
E .... (/) 40
0
~ 0.6 a: z 0
~ ~ 0.4 a: 0 u.. (/)
~ 0.2 a: f-
LLJ
0
1.2
~ 1.0
~ u ~ 0.8 u.. LLJ a: LLJ t:: 0.6 z a: f-> 0.4
100 200 300 400 500 600 700 HYDROGEN INDEX
800
Figure 13. Vitrinite reflectance, Rock-Eval transformation ratio (S/S2+S2, also termed production index), and S1 pyrolysis peak normalized to organic carbon (milligrams per gram organic carbon) versus the hydrogen index for rocks from the California petroleum basins and at equilibrium burial temperatures of 180.C-199.9·c. Samples are from the Wilmington field; the Houghton Community-! (NW plunge Santa Fe Springs field); and the American Petrofina "Central C.H.-2" (all Los Angeles Basin); and from the Paloma field, Southern San Joaquin Valley Basin. The curved line in the vitrinite reflectance plot results from logarithmic regression analysis of the data and has a correlation coefficient of r-0.867 to the data. The lines in the S1 pyrolysis peak plot define the principal sample population.
Pennsylvanian (Morrowan) and older rocks (17,514 ft, 5,338 m, and deeper) were deposited, however, under more marine conditions and as such contain a more hydrogen rich organic matter than the shallower rocks. Hence, both the hydrogen index and the kerogen atomic hydrogen to carbon ratio increase in the deeper rocks (columns B and D, fig. 15).
With further increase in depth, the kerogen hydrogen to carbon ratio again continuously decreases to low values (0.25-0.30) at well bottom. The behavior of the hydrogen index in the deeper rocks is clouded by a large-scale expulsion of bitumen generated by the organic-rich shale of the Woodford Shale (Upper Devonian and Lower Mississippian) into the adjacent organic-poor rocks. The Rock-Eval analysis includes the resins and asphaltenes in this migrated bitumen in the S2 pyrolysis peak. Thus, the elevated hydrogen index at depth does not reflect the true hydrocarbon-generation capacity (which would be low) of these organic-poor rocks, if the rocks were Soxhlet extracted.
Accurate comparisons of reaction kinetics for the different organic-matter types from natural samples have previously been obfuscated by the fact that it is very difficult to obtain valid maturation-rank estimates that can be directly related to vitrinite reflectance or paleo-burial temperature from natural samples that contain types I and II organic matter. It is now recognized that vitrinite reflectance in types I and II organic matter is suppressed at any rank as compared to that in type III organic matter (Price and Barker, 1985). However, all maturation reactions, including vitrinite reflectance, proceed at slower rates for any given thermal history in sulfur-poor, hydrogen-rich organic matter than in type III organic matter buried under the same conditions (Price, 1991). Thus, it is not now possible to assign accurate maturation ranks to sections of rocks that do not contain type III organic matter, such as the Jurassic section of the Paris Basin, the Jurassic through Lower Cretaceous section of the Greater Gulf Coast, and the uppermost Cretaceous through Eocene section in the Uinta Basin. In my opinion, the true maturity of carbonate-evaporite sections presently cannot be estimated with any confidence.
The preceding discussion demonstrates that organicmatter type has a dominant control on hydrocarbon generation. Hydrogen-rich types I and II organic matter both require higher burial temperatures to commence hydrocarbon generation than does type III organic matter, and they also retain measurable (and sometimes moderate to high) hydrocarbon-generation potential to much higher ranks than does type III organic matter. The bearing that these conclusions have on high-rank gas deposits is discussed in Price (this volume).
ALTERNATE RANKS FOR SOME PETROLEUM-GEOCHEMICAL
EVENTS
As stated, the vitrinite reflectance-event pairs of figure are accepted as geochemical law; however, that a large
body of published data does not fall within the constraints of figure 1 suggests that significant problems may exist with figure 1. Figure 4 provides insight to this point. The S 1

152 DEEP NATURAL GAS RESOURCES IN THE UNITED STATES
(/) a: w 1-w ~ 0 _J
S2 ~ ::r:' 1-ll.. w C'l
1-w w u..
12,000
z 16,000
::r:' I-ll.
~ 20,000
24,000
0 0 '<:1"
0 00
MACERAL COMPOSITION,
IN PERCENT
A
N '<:1" C.O 00 0 0 0 0 000 0 0 0 0 '<:1" OO N 0.,.:
H/C HI
B c
0 0 0 0 c-..i cv; Lri
D
0 0 N_
0 0 '<:1" N"
c15+ BITUMEN
E
0 0 0 0 0 0 0 0 0 0 0 ~ "<:tOON,~
F
3
(/)
4ffi 1-w ~
50 _J
S2 z
6 -_ J:
h: w
70
Figure 14. Petroleum-geochemical data from the Ralph Lowe-1 wellbore, Pecos County, Texas, versus depth. A, Maceral analyses of isolated kerogen by Robertson Research; EX., exinite; AMPH., amorphous. B, Atomic hydrogen to carbon ratio for isolated kerogen. C, Rock-Eval hydrogen index for Soxhlet-extracted powdered rock. D, Vitrinite reflectance (in percent). The straight line in this plot has a correlation coefficient (r) of 0.992 to the data. E, Cis+ bitumen (in parts per million by rock weight). F, Cis+ hydrocarbons (in parts per million by rock weight).
0
r=0.988 4,000
• 2 • • • • • 139 • • • 8,000
• • 3 • • • 12,000 4 •
• • 1-w w u.. / • 5 • • 16,000 ~
• • / / •
6 • / • • • /
• ~ • ::r:' • 1-
I • ll.. I • w
20,000 C'l
• • •• • 7 • •
'· • • 8 • • • • • • 9
•• • • • • 24,000 • • • • • • •••• • 28,000
• • • •• •
10 32,000
0 0 0 0 N '<:1" c.o 00 N '<:1" c.o 0 0 0 0
N '<:j-(.0 ~ 0 00 0 0 0 0 0 0 0 0 00 c-..i ~<ri oO N '<:1" c.o 00 ~
c15+ HCs H/C mg/g OC Ro HI
A B c D
Figure 15. Petroleum-geochemical data from the Bertha Rogers-1 wellbore, Washita County, Oklahoma, versus depth. A, Milligrams of C1s+ hydrocarbons per gram of organic carbon. B, Atomic hydrogen to carbon ratio for isolated kerogen. C, Vitrinite reflectance (in percent); the straight line in this plot has a correlation coefficient (r) of 0.988 to the data. D, Rock-Eval hydrogen index.
pyrolysis peak is a measure of C1s+ hydrocarbon generation. Thus, the increase in S 1 pyrolysis peak values (fig. 4) at R0 =0.6 percent (due to an increase in Soxhlet-extractable
hydrocarbons) results from the commencement of hydrocarbon generation. This increase in C1s+ hydrocarbons at R0=0.6 percent is equated to the first possibility of
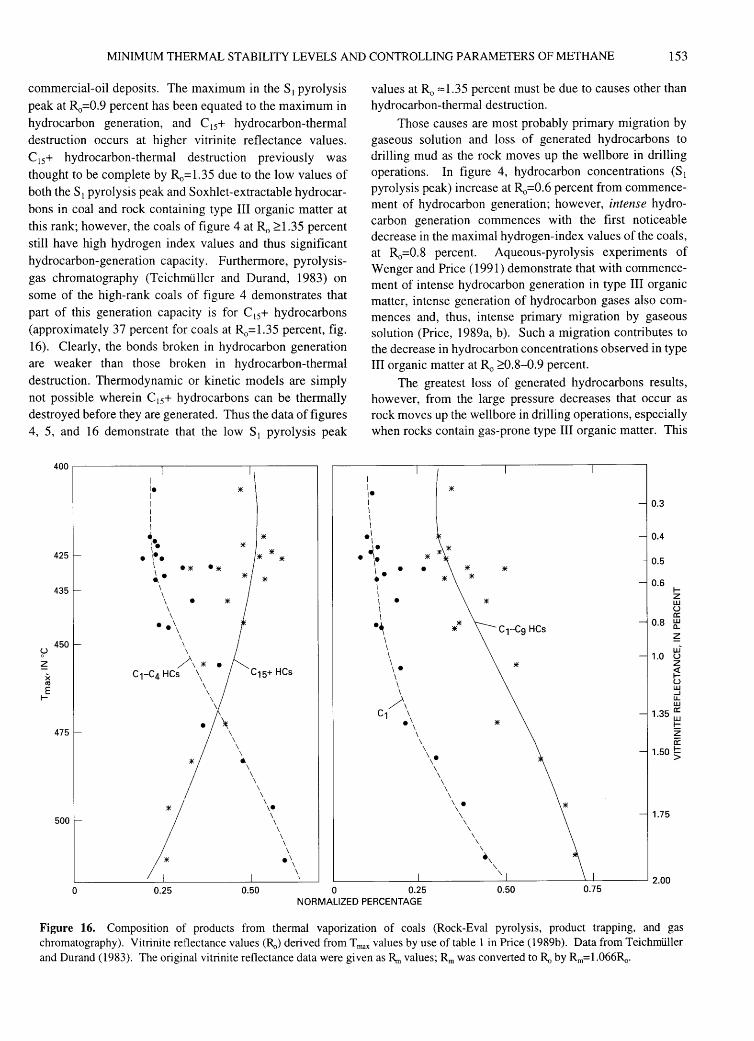
MINIMUM THERMAL STABILITY LEVELS AND CONTROLLING PARAMETERS OF METHANE 153
commercial-oil deposits. The maximum in the S1 pyrolysis peak at R0=0.9 percent has been equated to the maximum in hydrocarbon generation, and C1s+ hydrocarbon-thermal destruction occurs at higher vitrinite reflectance values. Cis+ hydrocarbon-thermal destruction previously was thought to be complete by R0 = 1.35 due to the low values of both the SI pyrolysis peak and Soxhlet-extractable hydrocarbons in coal and rock containing type III organic matter at this rank; however, the coals of figure 4 at R0 ~1.35 percent still have high hydrogen index values and thus significant hydrocarbon-generation capacity. Furthermore, pyrolysisgas chromatography (Teichrntiller and Durand, 1983) on some of the high-rank coals of figure 4 demonstrates that part of this generation capacity is for Cis+ hydrocarbons (approximately 37 percent for coals at R0 =1.35 percent, fig. 16). Clearly, the bonds broken in hydrocarbon generation are weaker than those broken in hydrocarbon-thermal destruction. Thermodynamic or kinetic models are simply not possible wherein Cis+ hydrocarbons can be thermally destroyed before they are generated. Thus the data of figures 4, 5, and 16 demonstrate that the low sl pyrolysis peak
400~----------~-----------,---------.
I le * I I I I I •. * \• * 425 * * * . ~·. I .* .* ~· * 435 \
\ \ • * \
\ .. \ \
450 \
$? \
/\ * ~ • c 1-c4 HCs \ c 15+ HCs x \
Ill \ E \ 1- \
\
~ 475 \
\ \ \ • \
\ \
\ \
! \ ,.
500 \ \ \ \ \ \
•' \ \
\
0 0.25 0.50 0
I I
values at R0
::::::1.35 percent must be due to causes other than hydrocarbon-thermal destruction.
Those causes are most probably primary migration by gaseous solution and loss of generated hydrocarbons to drilling mud as the rock moves up the wellbore in drilling operations. In figure 4, hydrocarbon concentrations (S I pyrolysis peak) increase at R0=0.6 percent from commencement of hydrocarbon generation; however, intense hydrocarbon generation commences with the first noticeable decrease in the maximal hydrogen-index values of the coals, at R
0=0.8 percent. Aqueous-pyrolysis experiments of
Wenger and Price ( 1991) demonstrate that with commencement of intense hydrocarbon generation in type III organic matter, intense generation of hydrocarbon gases also commences and, thus, intense primary migration by gaseous solution (Price, 1989a, b). Such a migration contributes to the decrease in hydrocarbon concentrations observed in type III organic matter at R0 ~0.8-0.9 percent.
The greatest loss of generated hydrocarbons results, however, from the large pressure decreases that occur as rock moves up the well bore in drilling operations, especially when rocks contain gas-prone type III organic matter. This
I• * I 0.3 I I I
.I I 0.4
~· e lie * 0.5
• • * * ~· * 0.6 I 1-I z I • * w I u I a:
·~ 0.8 w
a..
I ~ I w' \ 1.0 u \
* z \. ~ \
\ u w
\ ....J
/\ u.. w
c1 \ 1.35 ~ .\ * 1-\ z \
\ a: \ 1.50 ~ \•
\ \ \
\ \
\ . \
1.75 \ \
\ \
\ \ .,
' ' 2.00 0.25 0.50 0.75
NORMALIZED PERCENTAGE
Figure 16. Composition of products from thermal vaporization of coals (Rock-Eval pyrolysis, product trapping, and gas chromatography). Vitrinite reflectance values CRa) derived from Tmax values by use of table 1 in Price (1989b). Data from Teichmliller and Durand (1983). The original vitrinite reflectance data were given as Rm values; Rm was converted to Ro by Rm=l.066Ro.
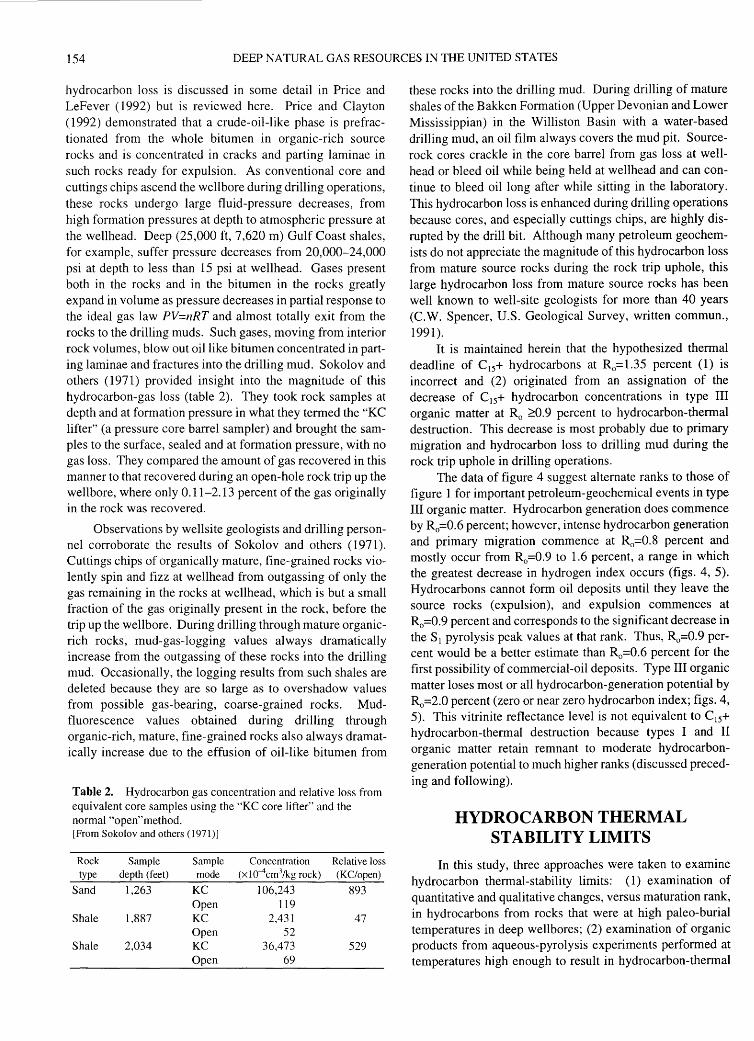
154 DEEP NATURAL GAS RESOURCES IN THE UNITED STATES
hydrocarbon loss is discussed in some detail in Price and LeFever ( 1992) but is reviewed here. Price and Clayton (1992) demonstrated that a crude-oil-like phase is prefractionated from the whole bitumen in organic-rich source rocks and is concentrated in cracks and parting laminae in such rocks ready for expulsion. As conventional core and cuttings chips ascend the well bore during drilling operations, these rocks undergo large fluid-pressure decreases, from high formation pressures at depth to atmospheric pressure at the wellhead. Deep (25,000 ft, 7,620 m) Gulf Coast shales, for example, suffer pressure decreases from 20,000-24,000 psi at depth to less than 15 psi at wellhead. Gases present both in the rocks and in the bitumen in the rocks greatly expand in volume as pressure decreases in partial response to the ideal gas law PV=nRT and almost totally exit from the rocks to the drilling muds. Such gases, moving from interior rock volumes, blow out oil like bitumen concentrated in parting laminae and fractures into the drilling mud. Sokolov and others ( 1971) provided insight into the magnitude of this hydrocarbon-gas loss (table 2). They took rock samples at depth and at formation pressure in what they termed the "KC lifter" (a pressure core barrel sampler) and brought the samples to the surface, sealed and at formation pressure, with no gas loss. They compared the amount of gas recovered in this manner to that recovered during an open-hole rock trip up the well bore, where only 0.11-2.13 percent of the gas originally in the rock was recovered.
Observations by wellsite geologists and drilling personnel corroborate the results of Sokolov and others (1971). Cuttings chips of organically mature, fine-grained rocks violently spin and fizz at wellhead from outgassing of only the gas remaining in the rocks at wellhead, which is but a small fraction of the gas originally present in the rock, before the trip up the well bore. During drilling through mature organicrich rocks, mud-gas-logging values always dramatically increase from the outgassing of these rocks into the drilling mud. Occasionally, the logging results from such shales are deleted because they are so large as to overshadow values from possible gas-bearing, coarse-grained rocks. Mudfluorescence values obtained during drilling through organic-rich, mature, fine-grained rocks also always dramatically increase due to the effusion of oil-like bitumen from
Table 2. Hydrocarbon gas concentration and relative loss from equivalent core samples using the "KC core lifter" and the normal "open"method. [From Sokolov and others ( 1971)]
Rock Sample Sample Concentration Relative loss type depth (feet) mode (xl0-4cm3/kg rock) (KC/open)
Sand 1,263 KC 106,243 893 Open 119
Shale 1,887 KC 2,431 47 Open 52
Shale 2,034 KC 36,473 529 Open 69
these rocks into the drilling mud. During drilling of mature shales of the Bakken Formation (Upper Devonian and Lower Mississippian) in the Williston Basin with a water-based drilling mud, an oil film always covers the mud pit. Sourcerock cores crackle in the core barrel from gas loss at wellhead or bleed oil while being held at wellhead and can continue to bleed oil long after while sitting in the laboratory. This hydrocarbon loss is enhanced during drilling operations because cores, and especially cuttings chips, are highly disrupted by the drill bit. Although many petroleum geochemists do not appreciate the magnitude of this hydrocarbon loss from mature source rocks during the rock trip uphole, this large hydrocarbon loss from mature source rocks has been well known to well-site geologists for more than 40 years (C.W. Spencer, U.S. Geological Survey, written commun., 1991).
It is maintained herein that the hypothesized thermal deadline of Cis+ hydrocarbons at R0=1.35 percent (1) is incorrect and (2) originated from an assignation of the decrease of Cis+ hydrocarbon concentrations in type III organic matter at R0 ~0.9 percent to hydrocarbon-thermal destruction. This decrease is most probably due to primary migration and hydrocarbon loss to drilling mud during the rock trip uphole in drilling operations.
The data of figure 4 suggest alternate ranks to those of figure 1 for important petroleum-geochemical events in type III organic matter. Hydrocarbon generation does commence by R
0=0.6 percent; however, intense hydrocarbon generation
and primary migration commence at R0=0.8 percent and mostly occur from R0=0.9 to 1.6 percent, a range in which the greatest decrease in hydrogen index occurs (figs. 4, 5). Hydrocarbons cannot form oil deposits until they leave the source rocks (expulsion), and expulsion commences at R
0=0.9 percent and corresponds to the significant decrease in
the S I pyrolysis peak values at that rank. Thus, R0=0.9 percent would be a better estimate than R0 =0.6 percent for the first possibility of commercial-oil deposits. Type III organic matter loses most or all hydrocarbon-generation potential by R
0=2.0 percent (zero or near zero hydrocarbon index; figs. 4,
5). This vitrinite reflectance level is not equivalent to Cis+ hydrocarbon-thermal destruction because types I and II organic matter retain remnant to moderate hydrocarbongeneration potential to much higher ranks (discussed preceding and following).
HYDROCARBON THERMAL STABILITY LIMITS
In this study, three approaches were taken to examine hydrocarbon thermal-stability limits: (1) examination of quantitative and qualitative changes, versus maturation rank, in hydrocarbons from rocks that were at high paleo-burial temperatures in deep wellbores; (2) examination of organic products from aqueous-pyrolysis experiments performed at temperatures high enough to result in hydrocarbon-thermal
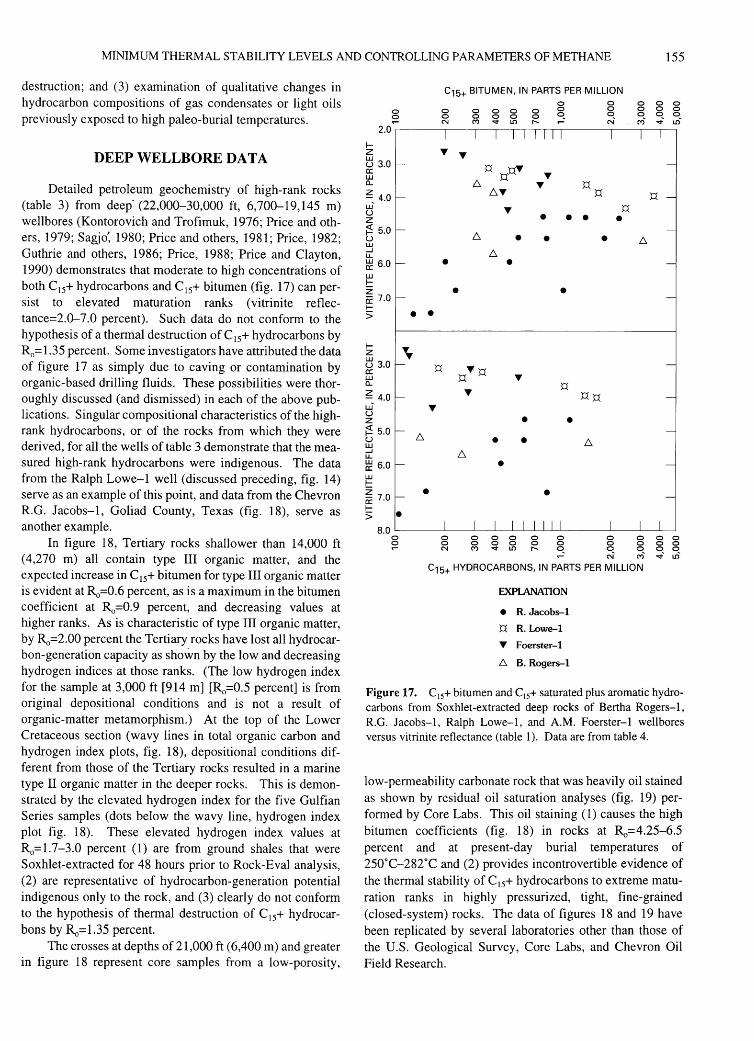
MINIMUM THERMAL STABILITY LEVELS AND CONTROLLING PARAMETERS OF METHANE 155
destruction; and (3) examination of qualitative changes in hydrocarbon compositions of gas condensates or light oils previously exposed to high paleo-burial temperatures.
DEEP WELLBORE DATA
Detailed petroleum geochemistry of high-rank rocks (table 3) from deep· (22,000-30,000 ft, 6,700-19,145 m) wellbores (Kontorovich and Trofimuk, 1976; Price and others, 1979; Sagjo: 1980; Price and others, 1981; Price, 1982; Guthrie and others, 1986; Price, 1988; Price and Clayton, 1990) demonstrates that moderate to high concentrations of both Cis+ hydrocarbons and Cis+ bitumen (fig. 17) can persist to elevated maturation ranks (vitrinite reflectance=2.0-7.0 percent). Such data do not conform to the hypothesis of a thermal destruction of Cis+ hydrocarbons by R0= 1.35 percent. Some investigators have attributed the data of figure 17 as simply due to caving or contamination by organic-based drilling fluids. These possibilities were thoroughly discussed (and dismissed) in each of the above publications. Singular compositional characteristics of the highrank hydrocarbons, or of the rocks from which they were derived, for all the wells of table 3 demonstrate that the measured high-rank hydrocarbons were indigenous. The data from the Ralph Lowe-1 well (discussed preceding, fig. 14) serve as an example of this point, and data from the Chevron R.G. Jacobs-1, Goliad County, Texas (fig. 18), serve as another example.
In figure 18, Tertiary rocks shallower than 14,000 ft ( 4,270 m) all contain type III organic matter, and the expected increase in Cis+ bitumen for type III organic matter is evident at R0 =0.6 percent, as is a maximum in the bitumen coefficient at R0 =0.9 percent, and decreasing values at higher ranks. As is characteristic of type III organic matter, by R0=2.00 percent the Tertiary rocks have lost all hydrocarbon-generation capacity as shown by the low and decreasing hydrogen indices at those ranks. (The low hydrogen index for the sample at 3,000 ft [914 m] [R0 =0.5 percent] is from original depositional conditions and is not a result of organic-matter metamorphism.) At the top of the Lower Cretaceous section (wavy lines in total organic carbon and hydrogen index plots, fig. 18), depositional conditions different from those of the Tertiary rocks resulted in a marine type II organic matter in the deeper rocks. This is demonstrated by the elevated hydrogen index for the five Gulfian Series samples (dots below the wavy line, hydrogen index plot fig. 18). These elevated hydrogen index values at R0=1.7-3.0 percent (1) are from ground shales that were Soxhlet-extracted for 48 hours prior to Rock-Eval analysis, (2) are representative of hydrocarbon-generation potential indigenous only to the rock, and (3) clearly do not conform to the hypothesis of thermal destruction of Cis+ hydrocarbons by R0=1.35 percent.
The crosses at depths of 21,000 ft (6,400 m) and greater in figure 18 represent core samples from a low-porosity,
2.0
I-z ~ 3.0 cr: UJ a..
~ 4.0 UJ-
u z ~ 5.0 u UJ .....J u.. ~ 6.0 UJ !:: ~ 7.0 I->
1-z ~ 3.0 cr: UJ a..
~ 4.0 UJ-
u z ~ 5.0 u UJ .....J u.. ~ 6.0 UJ !:: ~ 7.0 I-
0
~
> •
c15+ BITUMEN, IN PARTS PER MILLION 0 0 0 0 0
0 0 0 0 0 0 0 0 0 0 0 0 0 0 0 q 0 0 0 0 N M '¢ Ln r-. N, cvi ..; L.C)
... ... p pT p ...
~ ... p !:::..T p p
... p • • • •
!:::.. • • • !:::.. !:::..
• • • •
• •
p .. p p ... ... p
Pp ... • •
!:::.. • • !:::.. !:::..
• • •
8.0 L__ __ _l_ _ _l___JL__.L_j__J____l__I_J_ ___ L___L.,_....l..,__j
0 0
0 000 0 0 0 0 0 000 0 0 0 0 N M-.tLn f'. q ~ ~
c15+ HYD!ROCARBONS, IN PARTS PER MILLION
EXPLANATION
• R. Jacobs-1
P R. Lowe-1
T Foerster-!
!:::.. B. Rogers-1
0 0 0 0 0 0 -.t' L.C)
Figure 17. Cis+ bitumen and Cis+ saturated plus aromatic hydrocarbons from Soxhlet-extracted deep rocks of Bertha Rogers-1, R.G. Jacobs-1, Ralph Lowe-1, and A.M. Foerster-! wellbores versus vitrinite reflectance (table 1). Data are from table 4.
low-permeability carbonate rock that was heavily oil stained as shown by residual oil saturation analyses (fig. 19) performed by Core Labs. This oil staining (1) causes the high bitumen coefficients (fig. 18) in rocks at Ra=4.25-6.5 percent and at present -day burial temperatures of 250°C-282°C and (2) provides incontrovertible evidence of the thermal stability of Cis+ hydrocarbons to extreme maturation ranks in highly pressurized, tight, fine-grained (closed-system) rocks. The data of figures 18 and 19 have been replicated by several laboratories other than those of the U.S. Geological Survey, Core Labs, and Chevron Oil Field Research.
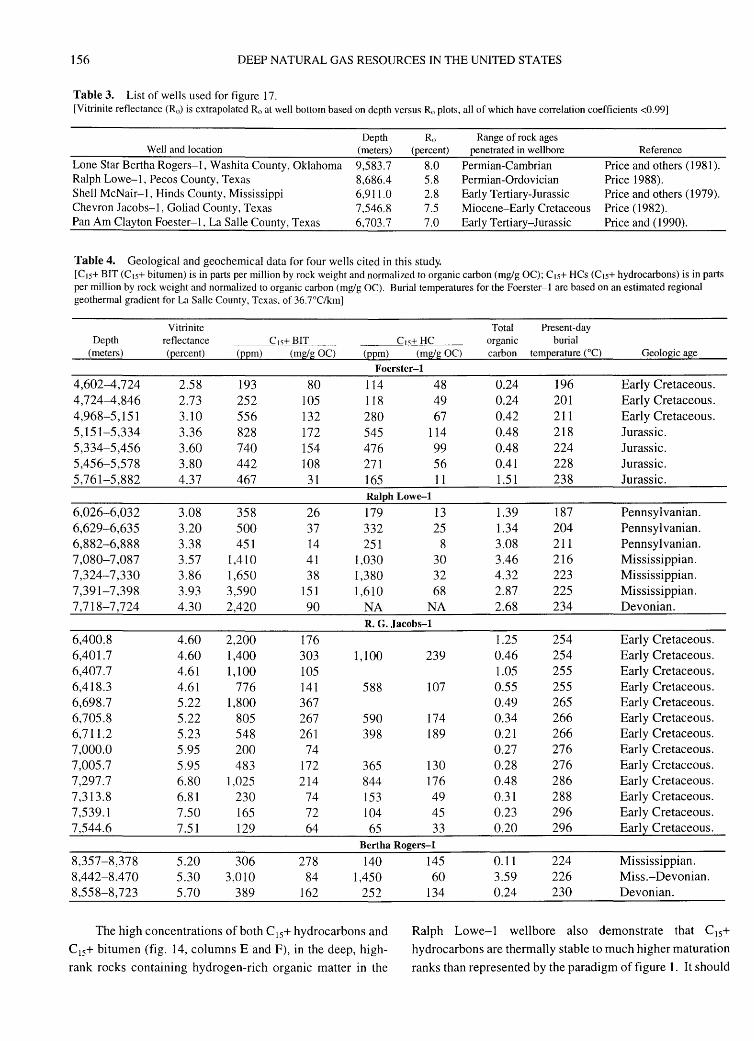
156 DEEP NATURAL GAS RESOURCES IN THE UNITED STATES
Table 3. List of wells used for figure 17. [Vitrinite reflectance (Ro) is extrapolated R0 at well bottom based on depth versus Ro plots, all of which have correlation coefficients <0.99]
Well and location
Lone Star Bertha Rogers-1, Washita County, Oklahoma Ralph Lowe-1, Pecos County, Texas Shell McNair-1, Hinds County, Mississippi Chevron J acobs-1, Goliad County, Texas Pan Am Clayton Foester-1, La Salle County, Texas
Depth (meters)
9,583.7 8,686.4 6,911.0 7,546.8 6,703.7
Ro (percent)
8.0 5.8 2.8 7.5 7.0
Table 4. Geological and geochemical data for four wells cited in this study.
Range of rock ages penetrated in wellbore
Permian-Cambrian Permian-Ordovician Early Tertiary-Jurassic Miocene-Early Cretaceous Early Tertiary-Jurassic
Reference
Price and others (1981). Price 1988). Price and others (1979). Price (1982). Price and (1990).
[C1s+ BIT (C1s+ bitumen) is in parts per million by rock weight and normalized to organic carbon (mg/g OC); C1s+ HCs (C1s+ hydrocarbons) is in parts per million by rock weight and normalized to organic carbon (mg/g OC). Burial temperatures for the Foerster- I are based on an estimated regional geothermal gradient for La Salle County, Texas, of 36.7°C/km]
Depth (meters)
4,602--4,724 4,724--4,846 4,968-5,151 5,151-5,334 5,334-5,456 5,456-5,578 5,761-5,882
6,026-6,032 6,629-6,635 6,882-6,888 7,080-7,087 7,324-7,330 7,391-7,398 7,718-7,724
6,400.8 6,401.7 6,407.7 6,418.3 6,698.7 6,705.8 6,711.2 7,000.0 7,005.7 7,297.7 7,313.8 7,539.1 7,544.6
8,357-8,378 8,442-8,4 70 8,558-8,723
Vitrinite reflectance (percent)
2.58 2.73 3.10 3.36 3.60 3.80 4.37
3.08 3.20 3.38 3.57 3.86 3.93 4.30
4.60 4.60 4.61 4.61 5.22 5.22 5.23 5.95 5.95 6.80 6.81 7.50 7.51
5.20 5.30 5.70
---=C1s+ BIT (ppm) (mg/g OC)
193 252 556 828 740 442 467
358 500 451
1,410 1,650 3,590 2,420
2,200 1,400 1,100
776 1,800
805 548 200 483
1,025 230 165 129
306 3,010
389
80 105 132 172 154 108
31
26 37 14 41 38
151 90
176 303 105 141 367 267 261
74 172 214
74 72 64
278 84
162
---=C1s+HC (ppm) (mg/g OC)
Foerster-1
114 118 280 545 476 271 165
48 49 67
114 99 56 11
Ralph Lowe-1
179 13 332 25 251 8
1,030 30 1,380 32 1,610 68
NA NA R. G. Jacobs-1
1,100
588
590 398
365 844 153 104 65
239
107
174 189
130 176 49 45 33
Bertha Rogers-1
140 1,450
252
145 60
134
Total Present-day organic burial carbon temperature (0 C)
0.24 0.24 0.42 0.48 0.48 0.41 1.51
1.39 1.34 3.08 3.46 4.32 2.87 2.68
1.25 0.46 1.05 0.55 0.49 0.34 0.21 0.27 0.28 0.48 0.31 0.23 0.20
0.11 3.59 0.24
196 201 211 218 224 228 238
187 204 211 216 223 225 234
254 254 255 255 265 266 266 276 276 286 288 296 296
224 226 230
Geologic age
Early Cretaceous. Early Cretaceous. Early Cretaceous. Jurassic. Jurassic. Jurassic. Jurassic.
Pennsy I van ian. Pennsylvanian. Pennsylvanian. Mississippian. Mississippian. Mississippian. Devonian.
Early Cretaceous. Early Cretaceous. Early Cretaceous. Early Cretaceous. Early Cretaceous. Early Cretaceous. Early Cretaceous. Early Cretaceous. Early Cretaceous. Early Cretaceous. Early Cretaceous. Early Cretaceous. Early Cretaceous.
Mississippian. Miss.-Devonian. Devonian.
The high concentrations of both C15+ hydrocarbons and
C 15+ bitumen (fig. 14, columns E and F), in the deep, high
rank rocks containing hydrogen-rich organic matter in the
Ralph Lowe-1 wellbore also demonstrate that C 15+ hydrocarbons are thermally stable to much higher maturation
ranks than represented by the paradigm of figure 1. It should
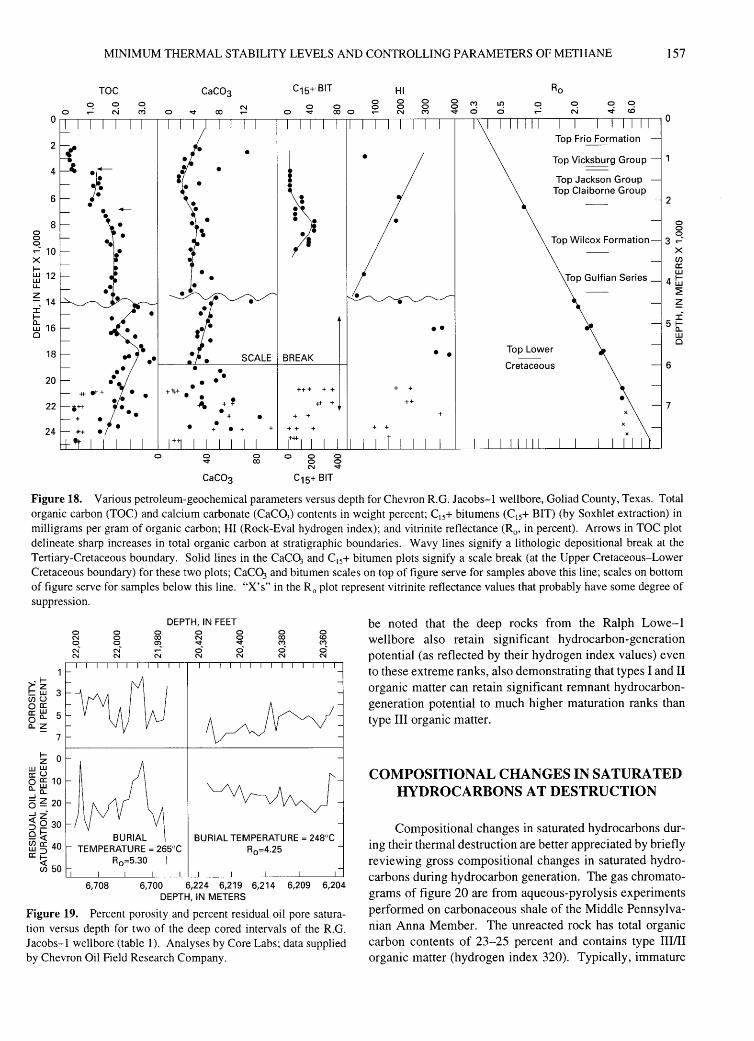
MINIMUM THERMAL STABILITY LEVELS AND CONTROLLING PARAMETERS OF METHANE 157
4
if 6 • 8
0 0 0 ...: 10 X f-t±l 12 L.l..
z -:. 14 I f-
fri 16 Q
18
20
• 22
24
0
•
• •• • • +¥ • •
.. + f .... . +
•
•
0 0 "<!"
0 coo
SCALE BREAK
•
0 00
+
+++ + +
++ +
+ +
0 0
+ +
HI 0 0 N
+ +
++
0 0 M
0 M
~ ci
••
• •
LD
ci 0 C'.i
0 0 ..,; cri
Top Vicksburg Group
Top Jackson Group Top Claiborne Group
Top Wilcox Formation
Top Lower
Cretaceous
Top Gulfian Series
•
2
0 0 0
3 ..... -X CJ) a: UJ
41:iJ ~
~ :i
5b:
6
7
UJ Q
Figure 18. Various petroleum-geochemical parameters versus depth for Chevron R.G. Jacobs-1 wellbore, Goliad County, Texas. Total organic carbon (TOC) and calcium carbonate (CaCO.,) contents in weight percent; Cis+ bitumens (Cis+ BIT) (by Soxhlet extraction) in milligrams per gram of organic carbon; HI (Rock-Eval hydrogen index); and vitrinite reflectance (R0 , in percent). Arrows in TOC plot delineate sharp increases in total organic carbon at stratigraphic boundaries. Wavy lines signify a lithologic depositional break at the Tertiary-Cretaceous boundary. Solid lines in the CaCO., and Cis+ bitumen plots signify a scale break (at the Upper Cretaceous-Lower Cretaceous boundary) for these two plots; CaCO:, and bitumen scales on top of figure serve for samples above this line; scales on bottom of figure serve for samples below this line. "X' s" in the R 0 plot represent vitrinite reflectance values that probably have some degree of suppression.
>-'!z !:: UJ 3 CJ)U oa:: ~ ~ 5 a..z
7
!z 0 UJUJ a::U ~ ffi 10 ...Ja.. 6 ~ 20 ....!z'
~ Q 30 9~ ~ ~ 40 a::f-~50
0 N 0 N, N
6,708
0 0 0 N' N
0 00 q N
DEPTH, IN FEET 0 0 0 0 N 0 00 <0 "<!" "<!" M M o' o' 0 0 N N N N
BURIAL TEMPERATURE = 248°C R0 =4.25
6, 700 6,224 6,219 6,214 6,209 6,204 DEiPTH, IN METERS
Figure 19. Percent porosity and percent residual oil pore saturation versus depth for two of the deep cored intervals of the R.G. J acobs-1 well bore (table 1 ). Analyses by Core Labs; data supplied by Chevron Oil Field Research Company.
be noted that the deep rocks from the Ralph Lowe-1 wellbore also retain significant hydrocarbon-generation potential (as reflected by their hydrogen index values) even to these extreme ranks, also demonstrating that types I and II organic matter can retain significant remnant hydrocarbongeneration potential to much higher maturation ranks than type III organic matter.
COMPOSITIONAL CHANGES IN SATURATED HYDROCARBONS AT DESTRUCTION
Compositional changes in saturated hydrocarbons during their thermal destruction are better appreciated by briefly reviewing gross compositional changes in saturated hydrocarbons during hydrocarbon generation. The gas chromatograms of figure 20 are from aqueous-pyrolysis experiments performed on carbonaceous shale of the Middle Pennsylvanian Anna Member. The unreacted rock has total organic carbon contents of 23-25 percent and contains type III/II organic matter (hydrogen index 320). Typically, immature

tO -y It:) ...
M:! y - r;() ~y y~ ... -
HI ;j (I II ~ y
tO
~~~
-N uo . .:. N u c
.~<c-
~
RAW IMMATURE
0 In M
o ''I'~ c ~ II II I "' II t;1
t ' r: I
-y 250°C BEGINNING HC GENERATION
-N
~
--0~, y( c
It:) ...
M~- lit:) r;o ............ y ....c .....
yY·- u y ·-·- 1, ~ r-11 \I 1111 1111 ,
0 N u c
In N u c
~ u ~= \1 ,/ 0
,, c
' ' I
lt)
0 M It:) -u c
275°C MIDDLE HC GENERATION
lt) N u c
333°C END HC GENERATION MATURE
In
0 c
Figure 20. Gas chromatograms of Cs+ saturated hydrocarbons generated by aqueous pyrolysis of carbonaceous shale from the Middle Pennsylvanian Anna Shale Member. Every fifth n-paraffin is labeled by n-C with its respective carbon number. N-paraffins are also labeled by arrows when necessary. Isoprenoid hydrocarbons are labeled by i-C with their respective carbon number. PR, pristane; PY, phytane; HC, hydrocarbon.
.......... Ul 00
ti tTl tTl '1j
z )> ...., c :;cl )> l' 0 )> C/.l
:;cl tTl C/.l 0 c :;cl (1 tTl C/.l
z ...., ::r: tTl c z ~ ti C/.l
~ ~ C/.l

MINIMUM THERMAL STABILITY LEVELS AND CONTROLLING PARAMETERS OF METHANE 159
(pre-hydrocarbon generation) saturated hydrocarbons have (with some variance due to organic-matter type) (fig. 20) (1) bimodal distributions in large naphthenic envelopes, (2) low concentrations of n-paraffins relative to adjacent isoprenoid hydrocarbons, (3) large biomarker peaks (in the carbon number range 26-32) relative to adjacent n-paraffins, (4) an irregular n-paraffin profile (distribution), and (5) low concentrations of C1s- hydrocarbons. During hydrocarbon generation, these characteristics progressively change (fig. 20), and gas chromatograms of mature saturated hydrocarbons have ( 1) small naphthenic envelopes with unimodal distributions, (2) n-paraffins with a regular profile and in high concentrations relative to both adjacent isoprenoid hydrocarbons and biomarker peaks, and (3) high concentrations of C14
hydrocarbons.
Changes in saturated hydrocarbons during thermal destruction are demonstrated by the gas chromatograms of figure 21 from aqueous-pyrolysis experiments on the shale of the Retort Member of the Lower Permian Phosphoria Formation and on a hydrogen-poor lignite. The Phosphoria shale sample, run at 350°C and 1,077 bars, is in the middle of main-stage saturated hydrocarbon-thermal destruction. As such, total Cs+ extractables have decreased to 83 mg/g rock from 161 mg/g of rock at the next lowest experimental level (333°C, 80.8 bars). In the gas chromatogram of the 350°C, 1,077-bar sample, the thermally labile isoprenoid hydrocarbons, especially pristane and phytane, are in greatly reduced concentrations relative to their adjacent n-paraffins (compare to the 333°C Anna Shale chromatogram, fig. 20). Furthermore, the concentration of each isoprenoid hydrocarbon decreases with increase in isoprenoid-hydrocarbon carbon number. Also, the naphthenic envelope is quite small, and the smooth logarithmic n-paraffin distribution suggests that a kinetic or thermodynamic (metastable?) equilibrium has been established within the n-paraffins. In another 350°C Phosphoria shale experiment, system pressure was decreased from 1,077 bars to 119 bars, thus illustrating the effect of increasing fluid pressure on retarding organic-matter metamorphism. The 119-bar sample is near the end of saturatedhydrocarbon thermal destruction, and Cs+ extractables have decreased to 31 mg/g rock from 83 mg/g rock in the 350°C, 1,077-bar sample. The isoprenoid-hydrocarbon peaks are in reduced concentrations; note the absence of pristane and phytane. The isoprenoid hydrocarbons, and all other peaks between the n-paraffins, decrease in concentration with increasing carbon number. The concentrations of the C2s+ nparaffins are also reduced in the 119-bar sample as compared to those in the gas chromatogram from the 1,077-bar sample, and there is almost no naphthenic envelope.
The lignite run at 350°C and 125 bars is at the end of C1s+ saturated-hydrocarbon thermal destruction. Comparison of the gas chromatogram of this sample with the chromatogram of the Phosphoria 350°C, 119-bar experiment demonstrates the effect of product escape on organic-matter metamorphism. The hydrogen-poor lignite (hydrogen index
of 55 for unreacted rock) has a low hydrocarbon-generation capacity as compared to the hydrogen-rich organic matter in the Phosphoria shale (hydrogen index of 450 in the unreacted rock). The 350°C, 125-bar lignite and 350°C, 119-bar Phosphoria Shale experiments were run essentially under the same conditions; however, the C1s+ saturated hydrocarbon concentration in the lignite experiment was 0.19 mg/g rock as compared to 3.85 mg/g rock in the Phosphoria shale experiment. The low concentration of saturated hydrocarbons (and total bitumen) in the lignite experiment allowed saturated-hydrocarbon thermal destruction to proceed further as compared to similar experiments with more organicrich rocks. As such, in the lignite chromatogram, ( 1) all C27+ saturated hydrocarbons have been thermally destroyed, (2) peaks other than the n-paraffins are in very small concentrations, (3) no naphthenic envelope is present, and (4) thenparaffins make up 95-99 percent of the sample.
In the 375°C, 132-bar experiment on the Phosphoria shale, the thermal deadline for C1s+ saturated hydrocarbons had been passed, and all C 14+ saturated hydrocarbons were destroyed.
Saturated hydrocarbons have the following characteristics during their thermal destruction as delineated by the aqueous-pyrolysis experiments of Wenger and Price (1991) and Price and Wenger ( 1991 ). The thermally unstable, 4-and 5-ringed naphthenic hydrocarbons crack first, followed by the isoprenoid hydrocarbons, and then the iso-alkanes. The n-paraffins are the most stable of the common saturated hydrocarbons. This fact was also noted by Sassen and Moore (1988) in their study of high-rank gas condensates from Upper Jurassic Smackover Formation reservoirs in the southeastern United States. Within any one compound group, as carbon number, or length of side chain, increases with increasing temperature, compound stability decreases. Thermally stressed saturated hydrocarbons are readily characterized by low or zero concentrations of pristane and phytane.
These observations regarding the relative thermal stability of the different saturated-hydrocarbon compound classes in the aqueous-pyrolysis experiments require discussion. Firstly, the naphthenes might be expected to undergo aromatization rather than simply to thermally crack, and to a limited extent this may have occurred. However, in the aqueous-pyrolysis experiments for all rocks C1s+ aromatichydrocarbon concentrations also strongly decreased in going from the maximum of C1s+ hydrocarbon generation (333°C) to hydrocarbon-thermal destruction (350°C). For example, C1s+ aromatic hydrocarbons for the Phosphoria shale decreased from 27.3 mg/g rock at 333°C to 7.93 mg/g rock at 350°C. Hence, a wholesale aromatization of naphthenes appears unlikely. Secondly, the observations about the relative thermal stability of the different saturated-hydrocarbon compound classes contradict Mango's (1990) conclusions that the naphthenes are the most stable saturated-hydrocarbon class. Mango's (1990) conclusions and discussion are
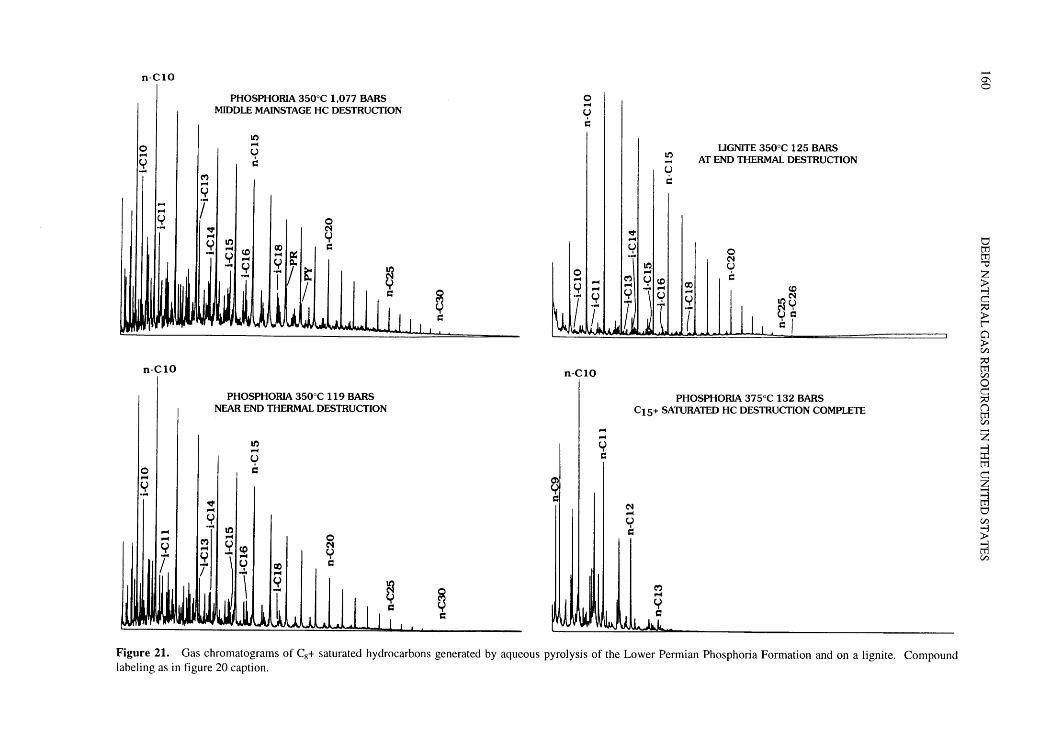
n-ClO
0 ...c
~
...c
...c
~
n-ClO
0 ...c
~
...c
...c
PHOSPHORIA 350°C 1,077 BARS MIDDLE MAINSTAGE HC DESTRUCTION
(") ...c y
l ~ ...c If)
Yl ...cleo .... y ...c
- ~
an ...c u c
IX Q.
0 N y c
PHOSPHORIA 350°C 119 BARS NEAR END THERMAL DESTRUCTION
~ ...c y .... an
...c
If) ...c u c
Yeo
I IIAIIU-IIIIVUAJ~l jlt ~
0 N ()
c
~ 11!1 .1.1 J I I~ '
~ c
0 c
0 ...c u t:
0 ...c ...c y ...c
1. ~
1\i JJ,.
n-ClO
0') y c
...c
...c y c
UGNITE 350°C 125 BARS If)
AT END THERMAL DESTRUCTION -y c
~ ...c
~ 0 N
an. u ...c c (") Yco ...c CX)
y 'u ...c co
Jl .l 1 y
ll_~ ~~ T cj
PHOSPHORIA 375°C 132 BARS C1s+ SATURATED HC DESTRUCTION COMPLETE
N ...c u t:
(") ...c
M~LJ Figure 21. Gas chromatograms of C8+ saturated hydrocarbons generated by aqueous pyrolysis of the Lower Permian Phosphoria Formation and on a lignite. Compound labeling as in figure 20 caption.
......... 0'1 0
0 ti1 ti1 '"0
z > ...., c: :::0 > l' Cl > C/)
:::0 ti1 C/)
0 c: :::0 () ti1 C/)
z ...., ::r:: ti1 c: z ~ 0 C/)
;; ti1 C/)
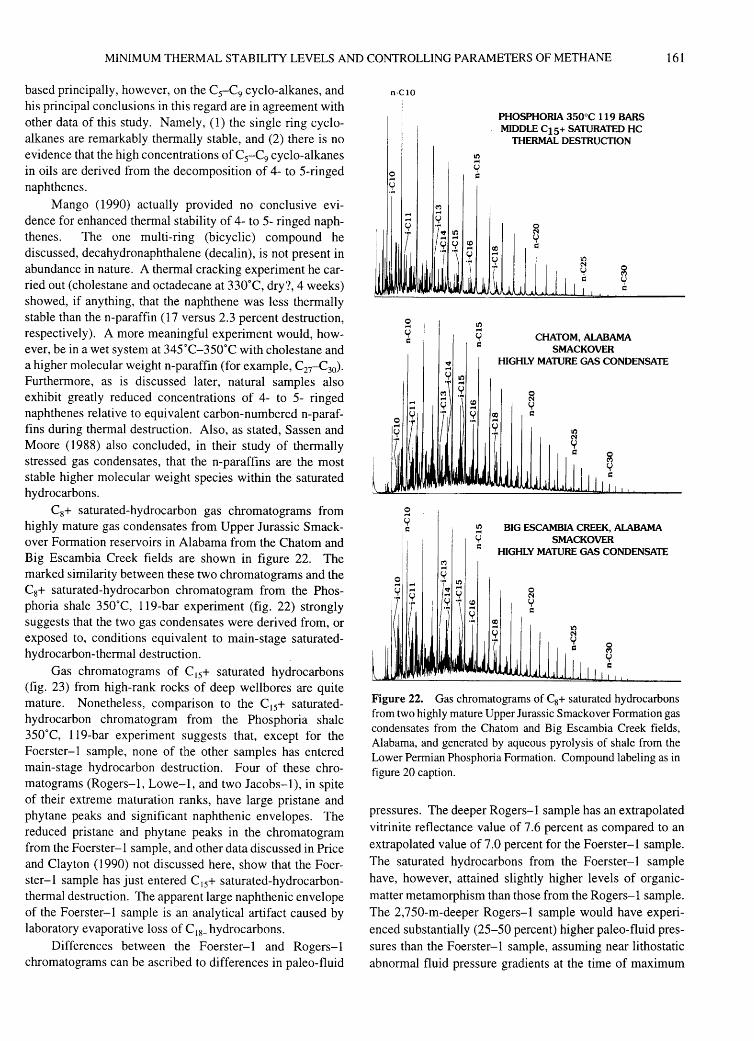
MINIMUM THERMAL STABILITY LEVELS AND CONTROLLING PARAMETERS OF METHANE 161
based principally, however, on the Cs-C9 cyclo-alkanes, and his principal conclusions in this regard are in agreement with other data of this study. Namely, (1) the single ring cycloalkanes are remarkably thermally stable, and (2) there is no evidence that the high concentrations of Cs-C9 cyclo-alkanes in oils are derived from the decomposition of 4- to 5-ringed naphthenes.
Mango (1990) actually provided no conclusive evidence for enhanced thermal stability of 4- to 5- ringed naphthenes. The one multi-ring (bicyclic) compound he discussed, decahydronaphthalene (decalin), is not present in abundance in nature. A thermal cracking experiment he carried out (cholestane and octadecane at 330°C, dry?, 4 weeks) showed, if anything, that the naphthene was less thermally stable than the n-paraffin (17 versus 2.3 percent destruction, respectively). A more meaningful experiment would, however, be in a wet system at 345°C-350°C with cholestane and a higher molecular weight n-paraffin (for example, C27-C30).
Furthermore, as is discussed later, natural samples also exhibit greatly reduced concentrations of 4- to 5- ringed naphthenes relative to equivalent carbon-numbered n-paraffins during thermal destruction. Also, as stated, Sassen and Moore (1988) also concluded, in their study of thermally stressed gas condensates, that the n-paraffins are the most stable higher molecular weight species within the saturated hydrocarbons.
C8+ saturated-hydrocarbon gas chromatograms from highly mature gas condensates from Upper Jurassic Smackover Formation reservoirs in Alabama from the Chatom and Big Escambia Creek fields are shown in figure 22. The marked similarity between these two chromatograms and the C8+ saturated-hydrocarbon chromatogram from the Phosphoria shale 350°C, 119-bar experiment (fig. 22) strongly suggests that the two gas condensates were derived from, or exposed to, conditions equivalent to main-stage saturatedhydrocarbon-thermal destruction.
Gas chromatograms of C1s+ saturated hydrocarbons (fig. 23) from high-rank rocks of deep wellbores are quite mature. Nonetheless, comparison to the C1s+ saturatedhydrocarbon chromatogram from the Phosphoria shale 350°C, 119-bar experiment suggests that, except for the Foerster- I sample, none of the other samples has entered main-stage hydrocarbon destruction. Four of these chromatograms (Rogers-1, Lowe-1, and two Jacobs-1), in spite of their extreme maturation ranks, have large pristane and phytane peaks and significant naphthenic envelopes. The reduced pristane and phytane peaks in the chromatogram from the Foerster-! sample, and other data discussed in Price and Clayton ( 1990) not discussed here, show that the Foerster- I sample has just entered C 1s+ saturated-hydrocarbonthermal destruction. The apparent large naphthenic envelope of the Foerster-1 sample is an analytical artifact caused by laboratory evaporative loss of C 18_ hydrocarbons.
Differences between the Foerster-1 and Rogers-1 chromatograms can be ascribed to differences in paleo-fluid
n-CIO
0
0 c
It)
0 c
It)
0 c
PHOSPHORIA 350°C 119 BARS MIDDLE c1s+ SAlURATED HC
THERMAL DESTRUCTION
CHATOM, ALABAMA SMACKOVER
HIGHLY MATURE GAS CONDENSATE
BIG ESCAMBIA CREEK, ALABAMA SMACKOVER
HIGHLY MATURE GAS CONDENSATE
Figure 22. Gas chromatograms of C8+ saturated hydrocarbons from two highly mature Upper Jurassic Smackover Formation gas condensates from the Chatom and Big Escambia Creek fields, Alabama, and generated by aqueous pyrolysis of shale from the Lower Permian Phosphoria Formation. Compound labeling as in figure 20 caption.
pressures. The deeper Rogers- I sample has an extrapolated vitrinite reflectance value of 7.6 percent as compared to an extrapolated value of 7.0 percent for the Foerster- I sample. The saturated hydrocarbons from the Foerster-! sample have, however, attained slightly higher levels of organicmatter metamorphism than those from the Rogers-1 sample. The 2,750-m-deeper Rogers-1 sample would have experienced substantially (25-50 percent) higher paleo-fluid pressures than the Foerster- I sample, assuming near lithostatic abnormal fluid pressure gradients at the time of maximum

162 DEEP NATURAL GAS RESOURCES IN THE UNITED STATES
n-C15
I I
~ ~ u =
I
PHOSPHORIA 350°C 119 BARS MIDDLE c15+ SATURATED HC
THERMAL DESTRUCTION
0 N u
t I
=
0 N u =
0 (")
u
=
R. JACOBS-1 7,544.2 m SAT HC's: 59ppm 29.5mg/gOC
Ro=7.5
R. LOWE-1 8,180.4-8,189.6 m SAT HC's: 850ppm 62.5mg/gOC
Ro=5.0
0 FOERSTER-1 6.613.8-6,703.7 m y SAT HC's: 62ppm 10.3mg/gOC c:: Ro= 7.0 JUST BEGINNING HC DESTRUCTION
n-C15
R. JACOBS-1 7,538.7 m SAT HC's: 93ppm 40.4mg/gOC
Ro=7.0
B. ROGERS-1 9,305.1-9,518.4 m SAT HC's: 70ppm 15.9mg/gOC
Ro=7.6
Figure 23. Gas chromatograms ofC15+ saturated hydrocarbons from deep rocks of the Rogers-1, Foerster-1, Lowe-1, and Jacobs- I wellbores (table 1) and generated by aqueous pyrolysis of the Lower Permian Phosphoria Formation. ~5+ saturated hydrocarbon concentrations are in parts per million and normalized to rock total organic carbon (mg/gOC), and vitrinite reflectance (R0 ) values (extrapolated or read; in percent) are given for each rock sample above the respective chromatogram. Compound labeling as in figure 20 caption.
heat flow for the two wells. Thus, the Foerster-1 sample could have achieved a higher level of organic-matter metamorphism than the Rogers-1 sample because of lower paleo-fluid pressures.
Data from high-rank rocks from deep wellbores demonstrate that Cis+ saturated hydrocarbons persist to extrapolated vitrinite reflectance values of about, or above, 7.6
percent in conditions of normal or low paleo-geothermal gradients, and probably to values slightly below 7.0 percent in conditions of very high paleo-geothermal gradients, because of the suppression effect that increasing fluid pressures have on organic-matter metamorphism. Furthermore, high concentrations of bitumen and Cis+ hydrocarbons (fig. 17) can persist to reflectances of 3.0-5.0 percent.

MINIMUM THERMAL STABILITY LEVELS AND CONTROLLING PARAMETERS OF METHANE 163
These conclusions relate, however, only to the high-rank persistence of hydrocarbons in highly pressurized, finegrained rocks (closed-chemical systems) that do not allow product escape. These conclusions have no bearing on either hydrocarbon-generation reactions, which occur at much lower ranks, or on the possible existence of commercial-oil deposits at high maturation ranks.
COMPOSITIONAL CHANGES IN AROMATIC HYDROCARBONS DURING DESTRUCTION
Aromatic hydrocarbons, similar to saturated hydrocarbons, compositionally evolve through main-stage hydrocarbon generation as demonstrated by C8+ aromatichydrocarbon gas chromatograms from aqueous-pyrolysis experiments on the Anna Shale (fig. 24). The chromatogram of the immature sample is dominated by one large peak (which elutes in the range of the alkylated benzenes) and has an unresolved naphtheno-aromatic hump on which there are few peaks of significant size. The chromatogram from the sample at commencement of hydrocarbon generation (250°C) has significant differences, in particular, a series of well-defined peaks on a large naphtheno-aromatic hump. Aromatic hydrocarbons from mature (333°C) samples (1) are biased toward lighter compounds, (2) have a greatly reduced unresolved (naphtheno-aromatic) hump, (3) have reduced-peak heights of higher molecular weight aromatic hydrocarbons, ( 4) are characterized by large concentrations of alkylated benzenes, alkylated naphthalenes, and alkylated phenanthrenes, (5) and have alkylated benzo- and dibenzothiophenes as the principal sulfur-bearing aromatic compounds.
Throughout hydrocarbon-thermal destruction, the aromatic hydrocarbons are both more complex and thermally stable than the saturated hydrocarbons, as shown by C8+ aromatic-hydrocarbon gas chromatograms from aqueouspyrolysis experiments on the Phosphoria shale (fig. 25). In these experiments, C8+ aromatic hydrocarbon concentrations decreased from a maximum value of 33.8 mg/g rock at the maximum of hydrocarbon generation (333°C, 80.8 bars) to 11.7 mg/g rock in the middle of main-stage hydrocarbonthermal destruction (350°C, 119 bars). In the 350°C, 119-bar chromatogram, the unresolved naphtheno-aromatic hump is small, and the chromatogram is dominated by large peaks of alkylated: benzenes, naphthalenes, benzothiophenes, dibenzothiophenes, and phenanthrenes. In the 375°C, 132-bar experiment, C 15+ saturated hydrocarbons were thermally destroyed (fig. 21); however, a suite of C 15+ aromatic hydrocarbons persists both in this experiment and in the 400°C, 144-bar experiment. These experimental data demonstrate that aromatic hydrocarbons are much more thermally stable than saturated hydrocarbons. The 375°C, 132-bar chromatogram of figure 25 is simpler than that of the 350°C, 119-bar experiment, in part because of the
ALKYLATED BENZENES
~
Figure 24. Gas chromatograms of Cg+ aromatic hydrocarbon generated by aqueous pyrolysis of carbonaceous shale from the Middle Pennsylvanian Anna Shale Member and from the unreacted (immature, vitrinite reflectance=0.25 percent) rock.
thermal destruction of the methylated benzothiophenes whose peaks no longer interfere with those of the methylated naphthalenes. The aromatic hump has also completely disappeared in the 375°C sample. The 400°C, 144-bar experiment (fig. 25) is equivalent to conditions of true rock metamorphism, yet a moderately complex distribution of aromatic hydrocarbons persists even under these conditions. In the 400°C experiment, aromatic hydrocarbons are dominated by both ( 1) parent compounds (for example, naphthalene, fluorene, phenanthrene, and dibenzothiophene) and (2)

~
~ = ALKYLATED ~ BENZ~ z
1 I ----,
QCil ~
r:l ~ ~~ f-4
~= = \V
;--METHYL: NAPHTHALENES AND ~ BENZOTHIOPHENES
DIMETHYL: NAPHTHLENES AND ~BENZOTHIOPHENES
~ TRIMETHYL: NAPHTHALENES AND I "'BENZOTIDOPHENES ~ ~
~~ o"l#.~o"l# oi fP o~~~#o~~~
0~~~~ ~~~!~~~~~'~) ~~ ~1J~~ ~~ "/~~ ~~~~
~i'#~~~~y.·· ~~~--Q\\ A"'""'~\""~~
lilt:~# ~HOSPHORIA 350°C 119 BARS
If 9 '"''~-"> il ~ f/1# ~~ I &.11 ~~ l. §.!1~ ~
rl ~,--,
if £~&!II 11 Jj[llti I~ CJ_~ Q'/t: p•
/1:'113 I~~-K
ALKYLATED BENZENES
\ I I
_..........--NAPHTHALENE 0
~ ~ ~ 6"1
~u lfl ~~~ ~~~~ ~~=~ !1 f/!1 f-4f-4 ~ ;: '!: 0 ~ ~=~ ~~ ~~~~ ~~~~ ~~fl4. I I ~~~i~~ll ;1 I s~i9aj ~~ ~ ~~L J1lr
..........-NAPHTHALENE
PHOSPHORIA 400°C 144 BARS
~ ~ ~ ~ ~ ~
PHOSPHORIA 425°C 160 BARS ROCK METAMORPIDSM
~ ~ ~ ~ ~ ~
i i I~ ~ (1 J
~ ~~ 9~ ~~ ~~ ~~ e~ ~I
Figure 25. Gas chromatograms of Cx+ aromatic hydrocarbons generated by aqueous pyrolysis of shale from the Lower Permian Phosphoria Formation in experiments that were
in the hydrocarbon thermal destructive phase.
.......... 0'1 +>-
tj trl tg z > ...., c :;:c:l > t""' 0 > Cl'.l
:;:c:l trl Cl'.l 0 c :;:c:l () trl Cl'.l
z ...., ::r: trl c z ~ tj Cl'.l
~ ~ Cl'.l
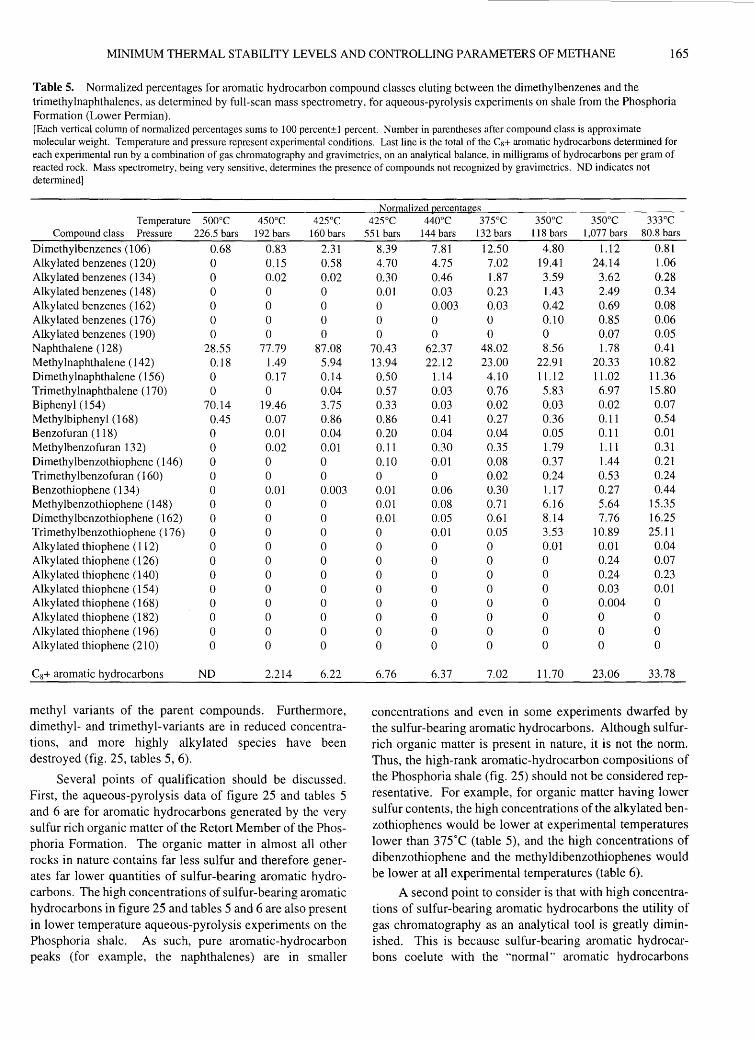
MINIMUM THERMAL STABILITY LEVELS AND CONTROLLING PARAMETERS OF METHANE 165
Table 5. Normalized percentages for aromatic hydrocarbon compound classes eluting between the dimethylbenzenes and the trimethylnaphthalenes, as determined by full-scan mass spectrometry, for aqueous-pyrolysis experiments on shale from the Phosphoria Formation (Lower Permian). [Each vertical column of normalized percentages sums to l 00 percent± I percent. Number in parentheses after compound class is approximate molecular weight. Temperature and pressure represent experimental conditions. Last line is the total of the Cs+ aromatic hydrocarbons determined for each experimental run by a combination of gas chromatography and gravimetries, on an analytical balance, in milligrams of hydrocarbons per gram of reacted rock. Mass spectrometry, being very sensitive, determines the presence of compounds not recognized by gravimetries. ND indicates not determined]
Temperature 500°C 450°C 425°C Compound class Pressure 226.5 bars 192 bars 160 bars
Dimethylbenzenes (106) 0.68 0.83 2.31 Alkylated benzenes (120) 0 0.15 0.58 Alky lated benzenes ( 134) 0 0.02 0.02 Alkylated benzenes (148) 0 0 0 Alkylated benzenes (162) 0 0 0 Alkylated benzenes (176) 0 0 0 Alky lated benzenes ( 190) 0 0 0 Naphthalene (128) 28.55 77.79 87.08 Methy1naphthalene (142) 0.18 1.49 5.94 Dimethy !naphthalene ( 156) 0 0.17 0.14 Trimethylnaphthalene (170) 0 0 0.04 Biphenyl (154) 70.14 19.46 3.75 Methylbiphenyl (168) 0.45 0.07 0.86 Benzofuran ( 118) 0 0.01 0.04 Methy1benzofuran 132) 0 0.02 0.01 Dimethylbenzothiophene (146) 0 0 0 Trimethylbenzofuran (160) 0 0 0 Benzothiophene (134) 0 0.01 0.003 Methylbenzothiophene (148) 0 0 0 Dime thy lbenzothiophene (162) 0 0 0 Trimethy1benzothiophene (176) 0 0 0 Alkylated thiophene (112) 0 0 0 Alkylated thiophene (126) 0 0 0 Alkylated thiophene (140) 0 0 0 Alkylated thiophene (154) 0 0 0 Alkylated thiophene (168) 0 0 0 Alky Ia ted thiophene ( 182) 0 0 0 Alkylated thiophene (196) 0 0 0 Alkylated thiophene (210) 0 0 0
C8+ aromatic hydrocarbons ND 2.214 6.22
methyl variants of the parent compounds. Furthermore, dimethyl- and trimethyl-variants are in reduced concentrations, and more highly alkylated species have been destroyed (fig. 25, tables 5, 6).
Several points of qualification should be discussed. First, the aqueous-pyrolysis data of figure 25 and tables 5 and 6 are for aromatic hydrocarbons generated by the very sulfur rich organic matter of the Retort Member of the Phosphoria Formation. The organic matter in almost all other rocks in nature contains far less sulfur and therefore generates far lower quantities of sulfur-bearing aromatic hydrocarbons. The high concentrations of sulfur-bearing aromatic hydrocarbons in figure 25 and tables 5 and 6 are also present in lower temperature aqueous-pyrolysis experiments on the Phosphoria shale. As such, pure aromatic-hydrocarbon peaks (for example, the naphthalenes) are in smaller
Normalized ~rcentages 425°C 440°C 375°C 350°C 350°C 333°C
551 bars 144 bars 132 bars 118 bars 1,077 bars 80.8 bars
8.39 7.81 12.50 4.80 1.12 0.81 4.70 4.75 7.02 19.41 24.14 1.06 0.30 0.46 1.87 3.59 3.62 0.28 0.01 0.03 0.23 1.43 2.49 0.34 0 0.003 0.03 0.42 0.69 0.08 0 0 0 0.10 0.85 0.06 0 0 0 0 0.07 0.05
70.43 62.37 48.02 8.56 1.78 0.41 13.94 22.12 23.00 22.91 20.33 10.82 0.50 1.14 4.10 11.12 11.02 11.36 0.57 0.03 0.76 5.83 6.97 15.80 0.33 0.03 0.02 0.03 0.02 0.07 0.86 0.41 0.27 0.36 0.11 0.54 0.20 0.04 0.04 0.05 0.11 0.01 0.11 0.30 0.35 1.79 1.11 0.31 0.10 0.01 0.08 0.37 1.44 0.21 0 0 0.02 0.24 0.53 0.24 0.01 0.06 0.30 1.17 0.27 0.44 0.01 0.08 0.71 6.16 5.64 15.35 0.01 0.05 0.61 8.14 7.76 16.25 0 0.01 0.05 3.53 10.89 25.11 0 0 0 0.01 0.01 0.04 0 0 0 0 0.24 0.07 0 0 0 0 0.24 0.23 0 0 0 0 0.03 0.01 0 0 0 0 0.004 0 0 0 0 0 0 0 0 0 0 0 0 0 0 0 0 0 0 0
6.76 6.37 7.02 11.70 23.06 33.78
concentrations and even in some experiments dwarfed by the sulfur-bearing aromatic hydrocarbons. Although sulfurrich organic matter is present in nature, it is not the norm. Thus, the high-rank aromatic-hydrocarbon compositions of the Phosphoria shale (fig. 25) should not be considered representative. For example, for organic matter having lower sulfur contents, the high concentrations of the alkylated benzothiophenes would be lower at experimental temperatures lower than 375°C (table 5), and the high concentrations of dibenzothiophene and the me thy ldibenzothiophenes would be lower at all experimental temperatures (table 6).
A second point to consider is that with high concentrations of sulfur-bearing aromatic hydrocarbons the utility of gas chromatography as an analytical tool is greatly diminished. This is because sulfur-bearing aromatic hydrocarbons coelute with the "normal" aromatic hydrocarbons
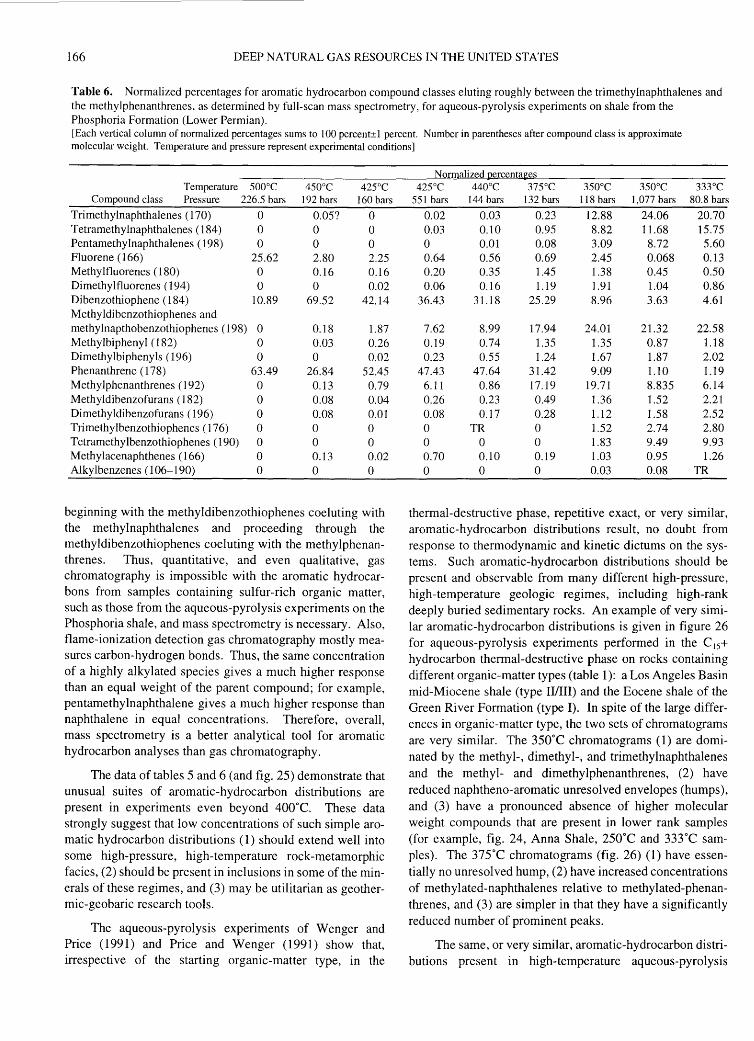
166 DEEP NATURAL GAS RESOURCES IN THE UNITED STATES
Table 6. Normalized percentages for aromatic hydrocarbon compound classes eluting roughly between the trimethylnaphthalenes and the methylphenanthrenes, as determined by full-scan mass spectrometry, for aqueous-pyrolysis experiments on shale from the Phosphoria Formation (Lower Permian). [Each vertical column of normalized percentages sums to 100 percent± I percent. Number in parentheses after compound class is approximate molecular weight. Temperature and pressure represent experimental conditions]
Temperature 500°C 450°C 425°C Compound class Pressure 226.5 bars 192 bars 160 bars
Trimethylnaphthalenes (170) 0 0.05? 0 Tetramethylnaphthalenes ( 184) 0 0 0 Pentamethylnaphthalenes ( 198) 0 0 0 Fluorene (166) 25.62 2.80 2.25 Methylfluorenes (180) 0 0.16 0.16 Dimethy lfluorenes ( 194) 0 0 0.02 Dibenzothiophene ( 184) 10.89 69.52 42.14 Methyldibenzothiophenes and methylnapthobenzothiophenes ( 198) 0 0.18 1.87 Methylbiphenyl (182) 0 0.03 0.26 Dimethylbiphenyls (196) 0 0 0.02 Phenanthrene (178) 63.49 26.84 52.45 Methylphenanthrenes (192) 0 0.13 0.79 Methyldibenzofurans (182) 0 0.08 0.04 Dimethyldibenzofurans (196) 0 0.08 0.01 Trimethylbenzothiophenes (176) 0 0 0 Tetramethylbenzothiophenes (190) 0 0 0 Methylacenaphthenes ( 166) 0 0.13 0.02 Alky I benzenes ( 106-190) 0 0 0
beginning with the methyldibenzothiophenes coeluting with the methylnaphthalenes and proceeding through the methyldibenzothiophenes coeluting with the methylphenanthrenes. Thus, quantitative, and even qualitative, gas chromatography is impossible with the aromatic hydrocarbons from samples containing sulfur-rich organic matter, such as those from the aqueous-pyrolysis experiments on the Phosphoria shale, and mass spectrometry is necessary. Also, flame-ionization detection gas chromatography mostly measures carbon-hydrogen bonds. Thus, the same concentration of a highly alkylated species gives a much higher response than an equal weight of the parent compound; for example, pentamethylnaphthalene gives a much higher response than naphthalene in equal concentrations. Therefore, overall, mass spectrometry is a better analytical tool for aromatic hydrocarbon analyses than gas chromatography.
The data of tables 5 and 6 (and fig. 25) demonstrate that unusual suites of aromatic-hydrocarbon distributions are present in experiments even beyond 400°C. These data strongly suggest that low concentrations of such simple aromatic hydrocarbon distributions ( 1) should extend well into some high-pressure, high-temperature rock-metamorphic facies, (2) should be present in inclusions in some of the minerals of these regimes, and (3) may be utilitarian as geothermic-geobaric research tools.
The aqueous-pyrolysis experiments of Wenger and Price (1991) and Price and Wenger (1991) show that, irrespective of the starting organic-matter type, in the
Normalized Qercentages 425°C 440°C 375°C 350°C 350°C 333°C
551 bars 144 bars 132 bars 118 bars 1,077 bars 80.8 bars
0.02 0.03 0.23 12.88 24.06 20.70 0.03 0.10 0.95 8.82 11.68 15.75 0 0.01 0.08 3.09 8.72 5.60 0.64 0.56 0.69 2.45 0.068 0.13 0.20 0.35 1.45 1.38 0.45 0.50 0.06 0.16 1.19 1.91 1.04 0.86
36.43 31.18 25.29 8.96 3.63 4.61
7.62 8.99 17.94 24.01 21.32 22.58 0.19 0.74 1.35 1.35 0.87 1.18 0.23 0.55 1.24 1.67 1.87 2.02
47.43 47.64 31.42 9.09 1.10 1.19 6.11 0.86 17.19 19.71 8.835 6.14 0.26 0.23 0.49 1.36 1.52 2.21 0.08 0.17 0.28 1.12 1.58 2.52 0 TR 0 1.52 2.74 2.80 0 0 0 1.83 9.49 9.93 0.70 0.10 0.19 1.03 0.95 1.26 0 0 0 0.03 0.08 TR
thermal-destructive phase, repetitive exact, or very similar, aromatic-hydrocarbon distributions result, no doubt from response to thermodynamic and kinetic dictums on the systems. Such aromatic-hydrocarbon distributions should be present and observable from many different high-pressure, high-temperature geologic regimes, including high-rank deeply buried sedimentary rocks. An example of very similar aromatic-hydrocarbon distributions is given in figure 26 for aqueous-pyrolysis experiments performed in the C 15+ hydrocarbon thermal-destructive phase on rocks containing different organic-matter types (table 1 ): a Los Angeles Basin mid-Miocene shale (type II/III) and the Eocene shale of the Green River Formation (type I). In spite of the large differences in organic-matter type, the two sets of chromatograms are very similar. The 350°C chromatograms (1) are dominated by the methyl-, dimethyl-, and trimethylnaphthalenes and the methyl- and dimethylphenanthrenes, (2) have reduced naphtheno-aromatic unresolved envelopes (humps), and (3) have a pronounced absence of higher molecular weight compounds that are present in lower rank samples (for example, fig. 24, Anna Shale, 250°C and 333°C samples). The 375°C chromatograms (fig. 26) (1) have essentially no unresolved hump, (2) have increased concentrations of methylated-naphthalenes relative to methylated-phenanthrenes, and (3) are simpler in that they have a significantly reduced number of prominent peaks.
The same, or very similar, aromatic-hydrocarbon distributions present in high-temperature aqueous-pyrolysis
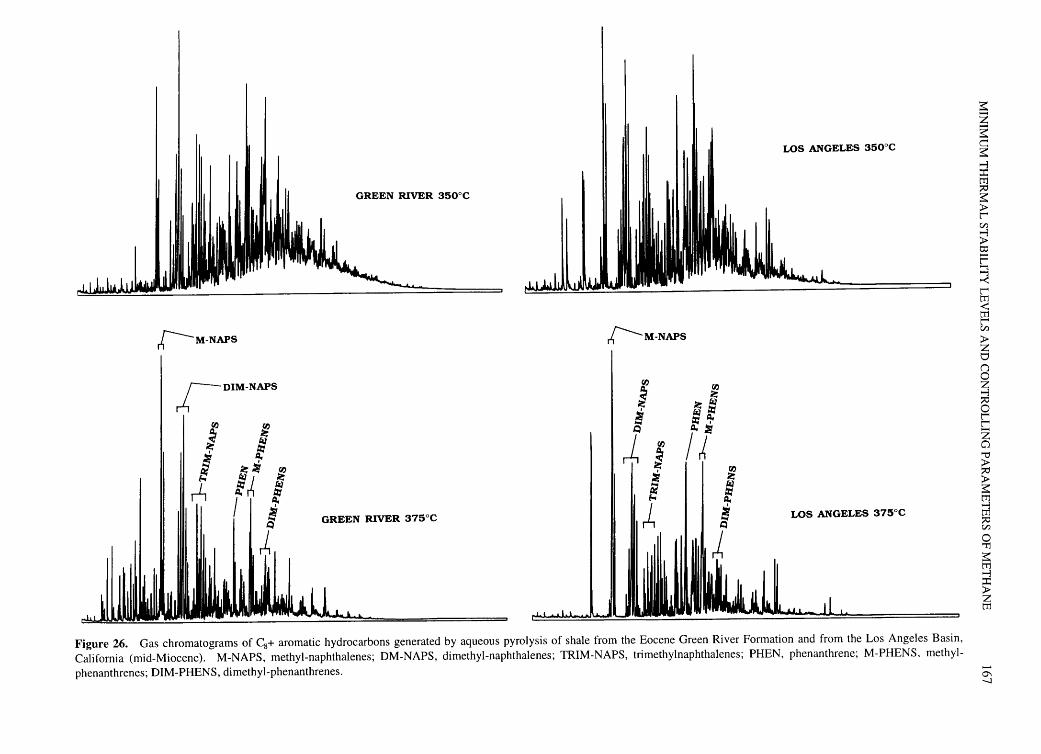
GREEN RIVER 350°C
;:---M-NAPS
rDIM-NAPS
I (IJ
~ ~ .... ~ ~
GREEN RIVER 375°C
{'--M-NAPS
(IJ
~ ! ~
(IJ
~ ! ~
~
~ ~~ ~t1. t1.~
~ ~ ~ t1.
! ~
LOS ANGELES 350°C
LOS ANGELES 375°C
Figure 26. Gas chromatograms of C8+ aromatic hydrocarbons generated by aqueous pyrolysis of shale from the Eocene Green River Formation and from the Los Angeles Basin,
California (mid-Miocene). M-NAPS, methyl-naphthalenes; OM-NAPS, dimethyl-naphthalenes; TRIM-NAPS, trimethylnaphthalenes; PHEN, phenanthrene; M-PHENS, methyl
phenanthrenes; DIM-PHENS, dimethyl-phenanthrenes.
~ z §: c ~ -3 ::r: tTl :::0 ~ > r C/.l -3 > ttl F =3 -< r tTl < tTl r C/.l
> z 0 (') 0 z ~ 0 r r z a 'i:l > :::0 > ~
~ :::0 C/.l
0 'Tl
~
~ ::r: > z tTl
.......... 0\ -.J
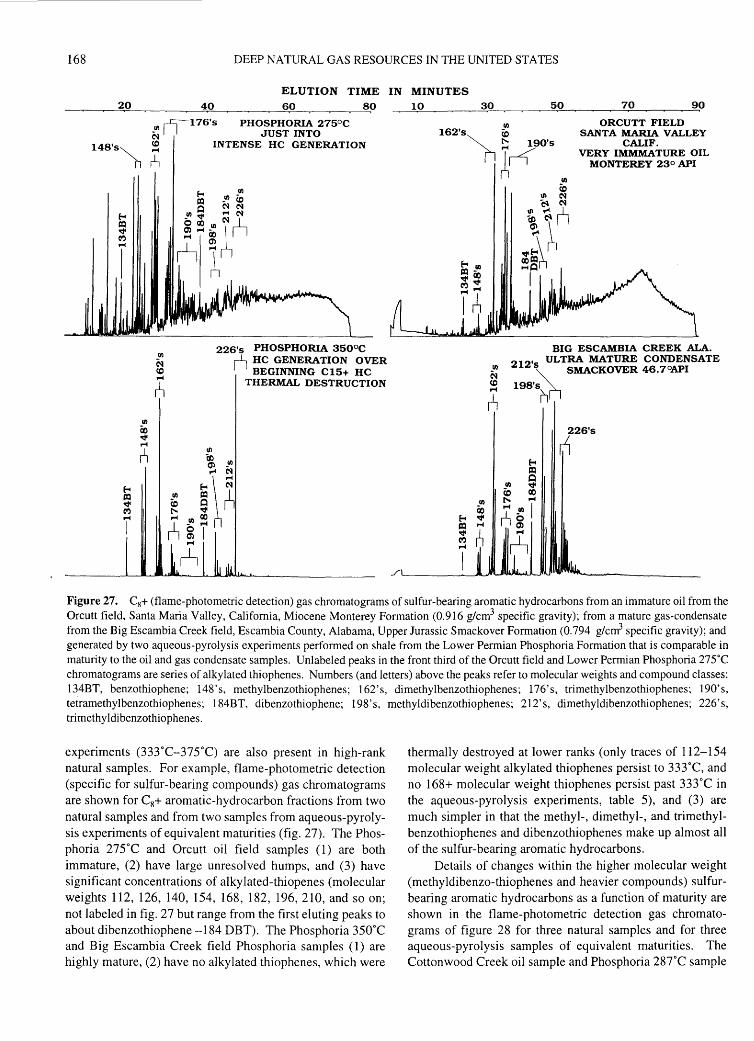
168 DEEP NATURAL GAS RESOURCES IN THE UNITED STATES
ELUTION TIME IN MINUTES 20 40 60 80
,c;-l76's PHOSPHORIA 275°C ~I I JUSTINTO
l48's~ ~ INTENSE HC GENERATION
226's PHOSPHORIA 350°C rl HC GENERATION OVER BEGINNING Cl5+ HC
THERMAL DESTRUCTION
10 30 50 70 90
Ul l62's eo
h~~90's ORCUTT FIELD
SANTA MARIA VALLEY CALIF.
VERY IMMMATURE OIL MONTEREY 23o API
BIG ESCAMBIA CREEK ALA.
212,5
ULTRA MATURE CONDENSATE Ul ~SMACKOVER 46.7°API ~
~ 1es·sn
226's
1.1
Figure 27. C8+ (flame-photometric detection) gas chromatograms of sulfur-bearing aromatic hydrocarbons from an immature oil from the Orcutt field, Santa Maria Valley, California, Miocene Monterey Formation (0.916 g/cm3 specific gravity); from a mature gas-condensate from the Big Escambia Creek field, Escambia County, Alabama, Upper Jurassic Smackover Formation (0.794 glcr:J specific gravity); and generated by two aqueous-pyrolysis experiments performed on shale from the Lower Permian Phosphoria Formation that is comparable in maturity to the oil and gas condensate samples. Unlabeled peaks in the front third of the Orcutt field and Lower Permian Phosphoria 275·c chromatograms are series of alkylated thiophenes. Numbers (and letters) above the peaks refer to molecular weights and compound classes: 134BT, benzothiophene; 148' s, methylbenzothiophenes; 162' s, dimethylbenzothiophenes; 176' s, trimethylbenzothiophenes; 190' s, tetramethylbenzothiophenes; 184BT, dibenzothiophene; 198' s, methyldibenzothiophenes; 212' s, dimethyldibenzothiophenes; 226' s, trimethyldibenzothiophenes.
experiments (333.C-375.C) are also present in high-rank natural samples. For example, flame-photometric detection (specific for sulfur-bearing compounds) gas chromatograms are shown for C8+ aromatic-hydrocarbon fractions from two natural samples and from two samples from aqueous-pyrolysis experiments of equivalent maturities (fig. 27). The Phosphoria 275·c and Orcutt oil field samples (1) are both immature, (2) have large unresolved humps, and (3) have significant concentrations of alkylated-thiopenes (molecular weights 112, 126, 140, 154, 168, 182, 196, 210, and so on; not labeled in fig. 27 but range from the first eluting peaks to about dibenzothiophene -184 DBT). The Phosphoria 35o·c and Big Escambia Creek field Phosphoria samples (1) are highly mature, (2) have no alkylated thiophenes, which were
thermally destroyed at lower ranks (only traces of 112-154 molecular weight alkylated thiophenes persist to 333·c, and no 168+ molecular weight thiophenes persist past 333·c in the aqueous-pyrolysis experiments, table 5), and (3) are much simpler in that the methyl-, dimethyl-, and trimethylbenzothiophenes and dibenzothiophenes make up almost all of the sulfur-bearing aromatic hydrocarbons.
Details of changes within the higher molecular weight (methyldibenzo-thiophenes and heavier compounds) sulfurbearing aromatic hydrocarbons as a function of maturity are shown in the flame-photometric detection gas chromatograms of figure 28 for three natural samples and for three aqueous-pyrolysis samples of equivalent maturities. The Cottonwood Creek oil sample and Phosphoria 28TC sample
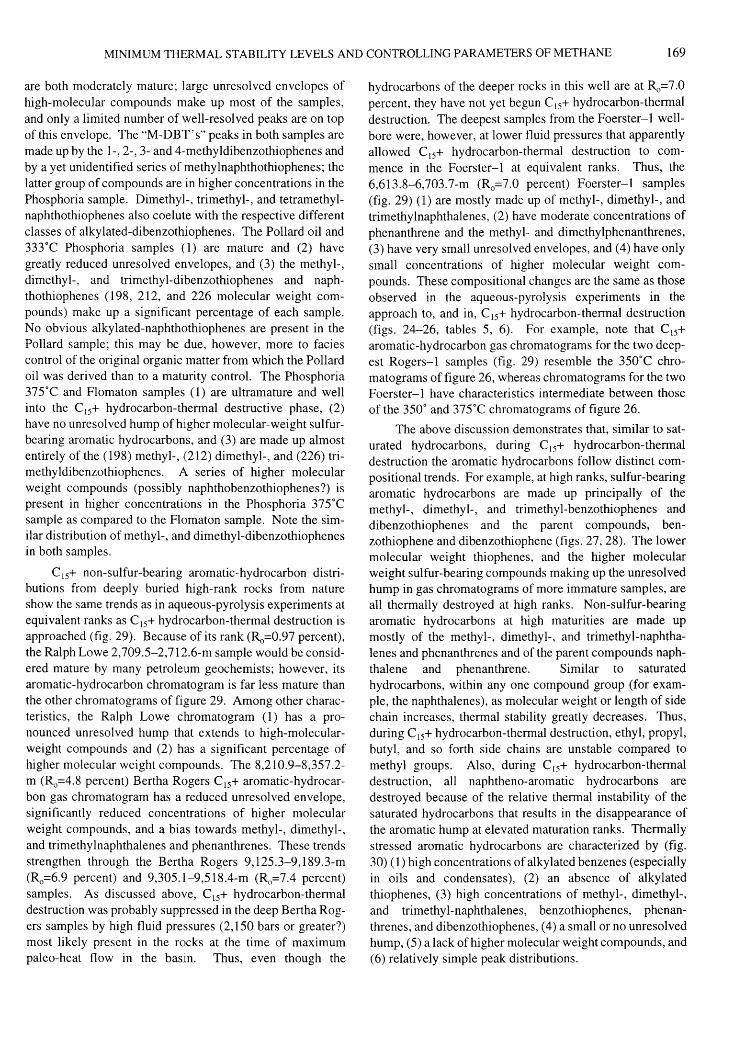
MINIMUM THERMAL STABILITY LEVELS AND CONTROLLING PARAMETERS OF METHANE 169
are both moderately mature; large unresolved envelopes of high-molecular compounds make up most of the samples, and only a limited number of well-resolved peaks are on top of this envelope. The "M-DBT's" peaks in both samples are made up by the 1-, 2-, 3- and 4-methyldibenzothiophenes and by a yet unidentified series of methylnaphthothiophenes; the latter group of compounds are in higher concentrations in the Phosphoria sample. Dimethyl-, trimethyl-, and tetramethylnaphthothiophenes also coelute with the respective different classes of alkylated-dibenzothiophenes. The Pollard oil and 333°C Phosphoria samples (1) are mature and (2) have greatly reduced unresolved envelopes, and (3) the methyl-, dimethyl-, and trimethyl-dibenzothiophenes and naphthothiophenes (198, 212, and 226 molecular weight compounds) make up a significant percentage of each sample. No obvious alkylated-naphthothiophenes are present in the Pollard sample; this may be due, however, more to facies control of the original organic matter from which the Pollard oil was derived than to a maturity control. The Phosphoria 375°C and Flomaton samples (1) are ultramature and well into the C1s+ hydrocarbon-thermal destructive phase, (2) have no unresolved hump of higher molecular-weight sulfurbearing aromatic hydrocarbons, and (3) are made up almost entirely of the (198) methyl-, (212) dimethyl-, and (226) trimethyldibenzothiophenes. A series of higher molecular weight compounds (possibly naphthobenzothiophenes?) is present in higher concentrations in the Phosphoria 375°C sample as compared to the Flomaton sample. Note the similar distribution of methyl-, and dimethyl-dibenzothiophenes in both samples.
C 1s+ non-sulfur-bearing aromatic-hydrocarbon distributions from deeply buried high-rank rocks from nature show the same trends as in aqueous-pyrolysis experiments at equivalent ranks as C 1s+ hydrocarbon-thermal destruction is approached (fig. 29). Because of its rank (R0=0.97 percent), the Ralph Lowe 2,709.5-2,712.6-m sample would be considered mature by many petroleum geochemists; however, its aromatic-hydrocarbon chromatogram is far less mature than the other chromatograms of figure 29. Among other characteristics, the Ralph Lowe chromatogram ( 1) has a pronounced unresolved hump that extends to high-molecularweight compounds and (2) has a significant percentage of higher molecular weight compounds. The 8,210.9-8,357.2-m (R0=4.8 percent) Bertha Rogers C 1s+ aromatic-hydrocarbon gas chromatogram has a reduced unresolved envelope, significantly reduced concentrations of higher molecular weight compounds, and a bias towards methyl-, dimethyl-, and trimethylnaphthalenes and phenanthrenes. These trends strengthen through the Bertha Rogers 9,125.3-9,189.3-m (R0=6.9 percent) and 9,305.1-9,518.4-m (R0=7.4 percent) samples. As discussed above, C 1s+ hydrocarbon-thermal destruction was probably suppressed in the deep Bertha Rogers samples by high fluid pressures (2,150 bars or greater?) most likely present in the rocks at the time of maximum paleo-heat flow in the basin. Thus, even though the
hydrocarbons of the deeper rocks in this well are at R0=7.0 percent, they have not yet begun C1s+ hydrocarbon-thermal destruction. The deepest samples from the Foerster-I wellbore were, however, at lower fluid pressures that apparently allowed C1s+ hydrocarbon-thermal destruction to commence in the Foerster-! at equivalent ranks. Thus, the 6,613.8-6,703.7-m (R0=7.0 percent) Foerster-! samples (fig. 29) (1) are mostly made up of methyl-, dimethyl-, and trimethylnaphthalenes, (2) have moderate concentrations of phenanthrene and the methyl- and dimethylphenanthrenes, (3) have very small unresolved envelopes, and (4) have only small concentrations of higher molecular weight compounds. These compositional changes are the same as those observed in the aqueous-pyrolysis experiments in the approach to, and in, C 1s+ hydrocarbon-thermal destruction (figs. 24-26, tables 5, 6). For example, note that C 1s+ aromatic-hydrocarbon gas chromatograms for the two deepest Rogers-1 samples (fig. 29) resemble the 350°C chromatograms of figure 26, whereas chromatograms for the two Foerster- I have characteristics intermediate between those of the 350° and 375°C chromatograms of figure 26.
The above discussion demonstrates that, similar to saturated hydrocarbons, during cl)+ hydrocarbon-thermal destruction the aromatic hydrocarbons follow distinct compositional trends. For example, at high ranks, sulfur-bearing aromatic hydrocarbons are made up principally of the methyl-, dimethyl-, and trimethyl-benzothiophenes and dibenzothiophenes and the parent compounds, benzothiophene and dibenzothiophene (figs. 27, 28). The lower molecular weight thiophenes, and the higher molecular weight sulfur-bearing compounds making up the unresolved hump in gas chromatograms of more immature samples, are all thermally destroyed at high ranks. Non-sulfur-bearing aromatic hydrocarbons at high maturities are made up mostly of the methyl-, dimethyl-, and trimethyl-naphthalenes and phenanthrenes and of the parent compounds naphthalene and phenanthrene. Similar to saturated hydrocarbons, within any one compound group (for example, the naphthalenes), as molecular weight or length of side chain increases, thermal stability greatly decreases. Thus, during C1s+ hydrocarbon-thermal destruction, ethyl, propyl, butyl, and so forth side chains are unstable compared to methyl groups. Also, during C15+ hydrocarbon-thermal destruction, all naphtheno-aromatic hydrocarbons are destroyed because of the relative thermal instability of the saturated hydrocarbons that results in the disappearance of the aromatic hump at elevated maturation ranks. Thermally stressed aromatic hydrocarbons are characterized by (fig. 30) (1) high concentrations of alkylated benzenes (especially in oils and condensates), (2) an absence of alkylated thiophenes, (3) high concentrations of methyl-, dimethyl-, and trimethyl-naphthalenes, benzothiophenes, phenanthrenes, and dibenzothiophenes, ( 4) a small or no unresolved hump, ( 5) a lack of higher molecular weight compounds, and (6) relatively simple peak distributions.

170 DEEP NATURAL GAS RESOURCES IN THE UNITED STATES
ELUTION TIME IN MINUTES 40 50 60 70
40
ffM-DDT's
,-L;----.-...DIM -DDT's
~TRIM-DDT's
PHOSPHORIA 287°C
~M-DBT'o ~DIM-DDT's
PHOSPORIA 333°C
TRIM-DDT's
j,
~M-DBT'o
PHOSPHORIA 375oc
ELUTION TIME IN MINUTES 50 60 70 80
~MDBT'o DIM- DDT's
~TRIM-DDT's
COTTONWOOD CREEK FIELD OIL
~DIM-DDT's
~TRIM-DDT's
M-DDT's
rl POLLARD FIELD OIL
~M-DDT's DIM-DDT's
~TRIM-DDT's
FLOMATON FIELD GAS CONDENSATE
90
Figure 28. Flame-photometric-detection gas chromatograms of high-molecular-weight sulfur-bearing aromatic hydrocarbons (roughly dibenzothiophene and higher eluting hydrocarbons) generated by three aqueous-pyrolysis experiments on shale from the Lower Permian Phosphoria shale and for two oils and one gas condensate of equivalent maturity to the shale. The Cottonwood Creek oil, Big Hom Basin, Washakie County, Wyoming, is produced from the Phosphoria Formation. The Pollard oil, Escambia County, Alabama, is produced from the Upper Cretaceous Tuscaloosa Formation. The Flomaton gas condensate, Escambia County, Alabama, is produced from the Upper Jurassic Norphlet Formation.
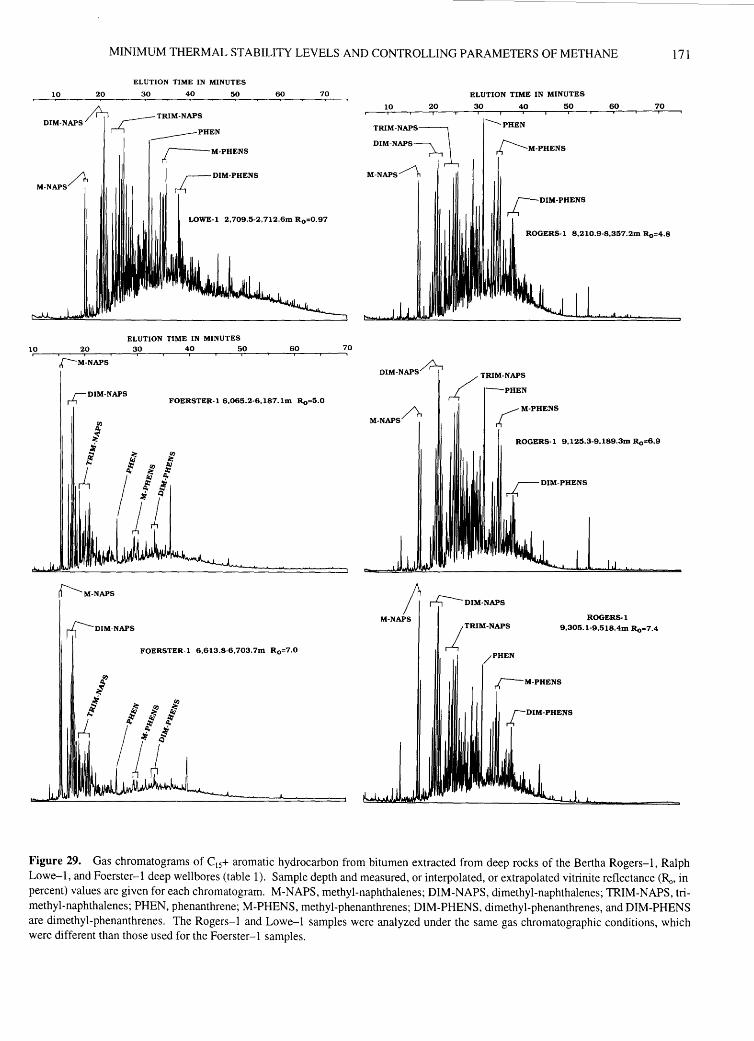
MINIMUM THERMAL STABILITY LEVELS AND CONTROLLING PARAMETERS OF METHANE
ELUTION TIME IN MINUTES
10 20 30 40 50 60
A r---- TRIM-NAPS DIM-NAPS ~
------PHEN
r-M-PHENS
70
10 20
TRIM-NAPS:--\
DIM-NAPS7 J,
ELUTION TIME IN MINUTES
30 40 50 60
PHEN
~M-PHENS
70
M-NAPS~ M-NAPS/),
10
~DIM-PHENS
ROGERS-1 8,210.9-8,357.2m Ro=4.8
ELUTION TIME IN MINUTES
20 30 40 50 60 70
.r--M-NAPS
rDIM-NAPS FOERSTER-1 6,065.2-6,187.1m Ro=5.0
DIM-NAPS~ /TRIM-NAPS
r4 PHEN
M-NAPS/'\ ~M-PHENS
ROGERS-I 9,125.3-9,189.3m Ro=6.9
ri---M-NAPS li ~DIM-NAPS M·NAPS
DIM-NAPS
FOERSTER-1 6,6·13.8-6,703.7m R 0 =7.0
iTRIM-NAPS
PHEN
ROGERS-1
9,305.1-9,518.4m Ro=7.4
~M-PHENS
171
Figure 29. Gas chromatograms of C15+ aromatic hydrocarbon from bitumen extracted from deep rocks of the Bertha Rogers-1, Ralph Lowe-1, and Foerster-1 deep wellbores (table 1). Sample depth and measured, or interpolated, or extrapolated vitrinite reflectance (Ro, in percent) values are given for each chromatogram. M-NAPS, methyl-naphthalenes; DIM-NAPS, dimethyl-naphthalenes; TRIM-NAPS, trimethyl-naphthalenes; PHEN, phenanthrene; M-PHENS, methyl-phenanthrenes; DIM-PHENS, dimethyl-phenanthrenes, and DIM-PHENS are dimethyl-phenanthrenes. The Rogers-1 and Lowe-1 samples were analyzed under the same gas chromatographic conditions, which were different than those used for the Foerster-1 samples.
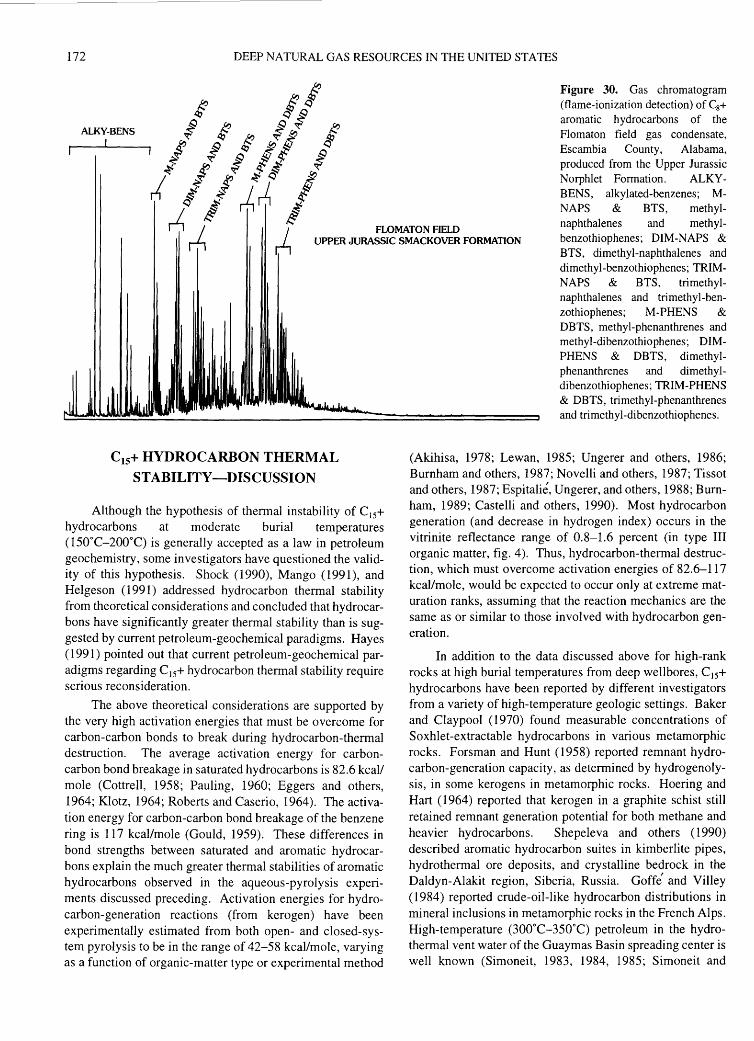
172 DEEP NATURAL GAS RESOURCES IN THE UNITED STATES
ALKY-BENS I
Figure 30. Gas chromatogram (flame-ionization detection) of Cs+ aromatic hydrocarbons of the Flomaton field gas condensate, Escambia County, Alabama, produced from the Upper Jurassic Norphlet Formation. ALKYBENS, alkylated-benzenes; M-NAPS & BTS, methyl-
FLOMATON FIELD naphthalenes and methyl-
UPPER JURASSIC SMACKOVER FORMATION benzothiophenes; DIM-NAPS & BTS, dimethyl-naphthalenes and dimethyl-benzothiophenes; TRIMNAPS & BTS, trimethylnaphthalenes and trimethyl-benzothiophenes; M-PHENS & DBTS, methyl-phenanthrenes and methyl-dibenzothiophenes; DIMPHENS & DBTS, dimethylphenanthrenes and dimethyldibenzothiophenes; TRIM-PHENS & DBTS, trimethyl-phenanthrenes and tri me thy 1-dibenzothi ophenes.
C15+ HYDROCARBON THERMAL STABILITY -DISCUSSION
Although the hypothesis of thermal instability of Cis+ hydrocarbons at moderate burial temperatures (150°C-200°C) is generally accepted as a law in petroleum geochemistry, some investigators have questioned the validity of this hypothesis. Shock (1990), Mango (1991), and Helgeson (1991) addressed hydrocarbon thermal stability from theoretical considerations and concluded that hydrocarbons have significantly greater thermal stability than is suggested by current petroleum-geochemical paradigms. Hayes (1991) pointed out that current petroleum-geochemical paradigms regarding Cis+ hydrocarbon thermal stability require serious reconsideration.
The above theoretical considerations are supported by the very high activation energies that must be overcome for carbon-carbon bonds to break during hydrocarbon-thermal destruction. The average activation energy for carboncarbon bond breakage in saturated hydrocarbons is 82.6 kcal/ mole (Cottrell, 1958; Pauling, 1960; Eggers and others, 1964; Klotz, 1964; Roberts and Caserio, 1964). The activation energy for carbon-carbon bond breakage of the benzene ring is 117 kcal/mole (Gould, 1959). These differences in bond strengths between saturated and aromatic hydrocarbons explain the much greater thermal stabilities of aromatic hydrocarbons observed in the aqueous-pyrolysis experiments discussed preceding. Activation energies for hydrocarbon-generation reactions (from kerogen) have been experimentally estimated from both open- and closed-system pyrolysis to be in the range of 42-58 kcal/mole, varying as a function of organic-matter type or experimental method
(Akihisa, 1978; Lewan, 1985; Ungerer and others, 1986; Burnham and others, 1987; Novelli and others, 1987; Tissot and others, 1987; Espitalie, Ungerer, and others, 1988; Burnham, 1989; Castelli and others, 1990). Most hydrocarbon generation (and decrease in hydrogen index) occurs in the vitrinite reflectance range of 0.8-1.6 percent (in type III organic matter, fig. 4). Thus, hydrocarbon-thermal destruction, which must overcome activation energies of 82.6-117 kcal/mole, would be expected to occur only at extreme maturation ranks, assuming that the reaction mechanics are the same as or similar to those involved with hydrocarbon generation.
In addition to the data discussed above for high-rank rocks at high burial temperatures from deep wellbores, Cis+ hydrocarbons have been reported by different investigators from a variety of high-temperature geologic settings. Baker and Claypool (1970) found measurable concentrations of Soxhlet-extractable hydrocarbons in various metamorphic rocks. Forsman and Hunt (1958) reported remnant hydrocarbon-generation capacity, as determined by hydrogenolysis, in some kerogens in metamorphic rocks. Hoering and Hart ( 1964) reported that kerogen in a graphite schist still retained remnant generation potential for both methane and heavier hydrocarbons. Shepeleva and others ( 1990) described aromatic hydrocarbon suites in kimberlite pipes, hydrothermal ore deposits, and crystalline bedrock in the Daldyn-Alakit region, Siberia, Russia. Goffe and Villey (1984) reported crude-oil-like hydrocarbon distributions in mineral inclusions in metamorphic rocks in the French Alps. High-temperature (300°C-350°C) petroleum in the hydrothermal vent water of the Guaymas Basin spreading center is well known (Simoneit, 1983, 1984, 1985; Simoneit and

MINIMUM THERMAL STABILITY LEVELS AND CONTROLLING PARAMETERS OF METHANE 173
others, 1984; Kawka and Simoneit, 1987; Simoneit and Kawka, 1987).
The above data allow the conclusion that not only methane but also C 15+ hydrocarbons are thermally stable in finegrained rocks to much higher maturation ranks than called for by current petroleum-geochemical paradigms (fig. 1). C15+ hydrocarbons apparently approach thermal destruction in the range of vitrinite reflectance=7.0-8.0 percent depending on basin variables. Methane clearly would be thermally stable to far higher temperatures and ranks than vitrinite reflectance of 7.0-8.0 percent. For example, it is well known among metamorphic petrologists that methane is thermally stable within the graphite-methane-water-carbon dioxide system to at least 800°C (fig. 31 ), and it is likely that methane survives to far higher temperatures, probably extending well into the mantle (Hal Helgeson, written commun., 1991).
Lastly, it must be noted that high to moderate concentrations of C 15+ hydrocarbons at extreme maturation ranks (R0=2.0-6.0 percent) and high burial temperatures (200°C-300°C or higher) for periods of geologic time as long as 300 million years would not be possible if organicmatter metamorphic reactions proceeded by first-order reaction kinetics. Thus, the very existence of such high-rank C 15+ hydrocarbons over long periods of geologic time seems to preclude the possibility that C 15+ hydrocarbon destruction reactions are first-order reactions.
CONCLUSIONS
1. By accepted paradigms in petroleum geochemistry, C15+ hydrocarbons are destroyed by vitrinite reflectance= 1.35 percent, C2+ hydrocarbons by R0 =2.00 percent, and methane by R0 =4.00 percent. In reality, however, (a) C 15+ hydrocarbons are thermally stable to ranks as high as R0=7.0-8.0 percent in deep, unsheared, petroleum basins; (b) hydrocarbon gases are thermally stable to even higher ranks, well into true rock metamorphism; and (c) methane is stable probably into mantle conditions. These hydrocarbon thermal stabilities carry no connotations, however, for the existence of conventional oil or gas deposits extending to those respective ranks, and such deposits may not necessarily be expected at those ranks.
2. C 15+ hydrocarbon thermal stability comes from several lines of evidence: (a) petroleum-geochemical analyses of ultradeep (7-10 km), high-rank (R
0=2.0-8.0 percent),
fine-grained rocks, analyses that demonstrate that moderate to high concentrations of C 15+ hydrocarbons survive to these ranks; (b) compositional changes in both the saturated and aromatic hydrocarbons in the approach to and during C15+ hydrocarbon-thermal destruction, changes that have been only occasionally observed in the deepest rocks of sedimentary basins; (c) long-established physical-chemical laws, which demonstrate that C15+ saturated, and especially aromatic, hydrocarbons are thermally stable species with high
UJ (/) <( :::c
80
a.. 60 (/) <( (.9 LL 0 1-z UJ u a: UJ a.. 40 UJ _J
0 ~
20
OL_ __ __J ____ ~==~~---=~----~----~--~
300 500 700 900 TEMPERATURE, IN oc
Figure 31. Phase diagram of gas species in equilibrium with graphite at a pressure of 1,000 bars. Modified from Winkler ( 1976).
bond energies; and (d) published data, which demonstrate that low concentrations of C15+ hydrocarbons persist into conditions of true rock metamorphism and other high-temperature settings.
3. According to paradigms of present-day petroleum geochemistry, the controlling parameters of organic-matter metamorphism are burial temperature and geologic time, that is, first-order reaction kinetics. These controlling parameters predict C 15+ hydrocarbon-thermal destruction by R0 =1.35 percent. This prediction is in strong contrast with observed C 15+ hydrocarbon thermal stability to R0=7.0-8.0 percent. Furthermore, it is maintained herein that no solid evidence exists that allows the conclusion that organic-matter metamorphism follows first-order reaction kinetics. Thus, it is concluded that the controlling parameters of organic-matter metamorphism, according to present-day petroleum-geochemical paradigms, must be at least partly in error.
4. Alternate controlling parameters of organic-matter metamorphism are hypothesized herein based on long-term research on the topic. Increase in burial temperature is the principal drive for the reactions, a conclusion in agreement with accepted models. Other controlling parameters and
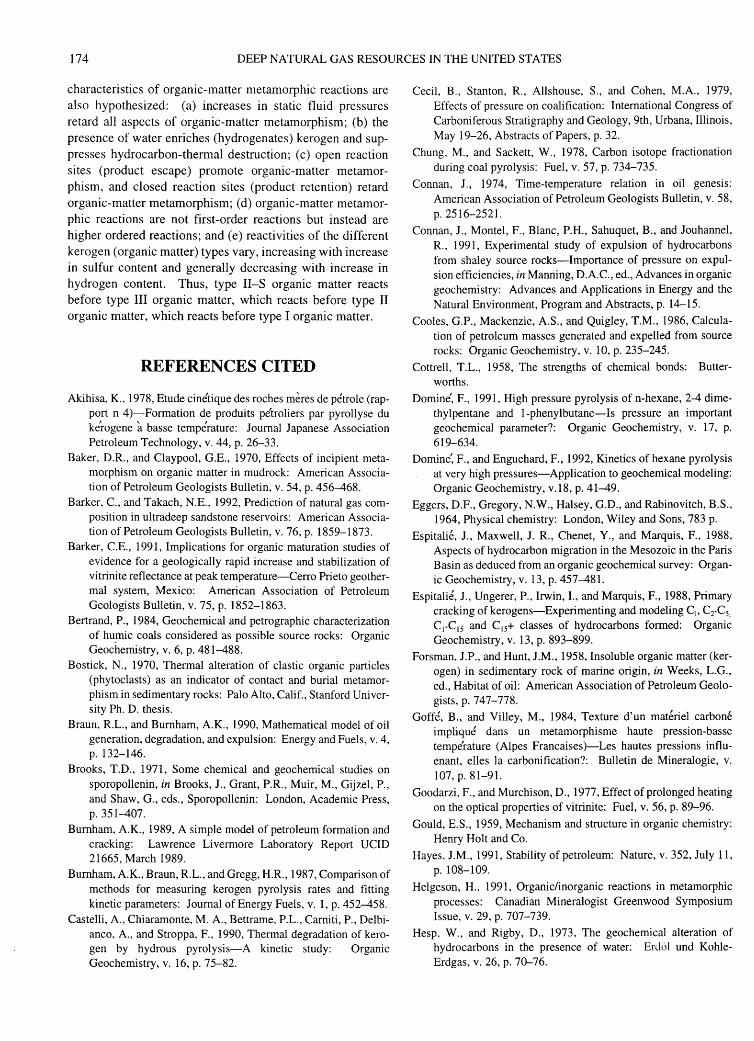
174 DEEP NATURAL GAS RESOURCES IN THE UNITED STATES
characteristics of organic-matter metamorphic reactions are
also hypothesized: (a) increases in static fluid pressures
retard all aspects of organic-matter metamorphism; (b) the
presence of water enriches (hydrogenates) kerogen and sup
presses hydrocarbon-thermal destruction; (c) open reaction
sites (product escape) promote organic-matter metamor
phism, and closed reaction sites (product retention) retard
organic-matter metamorphism; (d) organic-matter metamor
phic reactions are not first-order reactions but instead are
higher ordered reactions; and (e) reactivities of the different
kerogen (organic matter) types vary, increasing with increase
in sulfur content and generally decreasing with increase in
hydrogen content. Thus, type II-S organic matter reacts
before type III organic matter, which reacts before type II
organic matter, which reacts before type I organic matter.
REFERENCES CITED
Akihisa, K., 1978, Etude cinetique des roches meres de petrole (rapport n 4)-Formation de produits pe'troliers par pyrollyse du kerogene a basse temperature: Journal Japanese Association Petroleum Technology, v. 44, p. 26-33.
Baker, D.R., and Claypool, G.E., 1970, Effects of incipient metamorphism on organic matter in mudrock: American Association of Petroleum Geologists Bulletin, v. 54, p. 456-468.
Barker, C., and Takach, N.E., 1992, Prediction of natural gas composition in ultradeep sandstone reservoirs: American Association of Petroleum Geologists Bulletin, v. 76, p. 1859-1873.
Barker, C.E., 1991, Implications for organic maturation studies of evidence for a geologically rapid increase and stabilization of vitrinite reflectance at peak temperature-Cerro Prieto geothermal system, Mexico: American Association of Petroleum Geologists Bulletin, v. 75, p. 1852-1863.
Bertrand, P., 1984, Geochemical and petrographic characterization of hu_mic coals considered as possible source rocks: Organic Geochemistry, v. 6, p. 481-488.
Bostick, N., 1970, Thermal alteration of clastic organic particles (phytoclasts) as an indicator of contact and burial metamorphism in sedimentary rocks: Palo Alto, Calif., Stanford University Ph. D. thesis.
Braun, R.L., and Burnham, A.K., 1990, Mathematical model of oil generation, degradation, and expulsion: Energy and Fuels, v. 4, p. 132-146.
Brooks, T.D., 1971, Some chemical and geochemical studies on sporopollenin, in Brooks, J., Grant, P.R., Muir, M., Gijzel, P., and Shaw, G., eds., Sporopollenin: London, Academic Press, p. 351-407.
Burnham, A.K., 1989, A simple model of petroleum formation and cracking: Lawrence Livermore Laboratory Report UCID 21665, March 1989.
Burnham, A.K., Braun, R.L., and Gregg, H.R., 1987, Comparison of methods for measuring kerogen pyrolysis rates and fitting kinetic parameters: Journal of Energy Fuels, v. 1, p. 452-458.
Castelli, A., Chiaramonte, M.A., Bettrame, P.L., Carniti, P., Delbianco, A., and Stroppa, F., 1990, Thermal degradation of kerogen by hydrous pyrolysis-A kinetic study: Organic Geochemistry, v. 16, p. 75-82.
Cecil, B., Stanton, R., Allshouse, S., and Cohen, M.A., 1979, Effects of pressure on coalification: International Congress of Carboniferous Stratigraphy and Geology, 9th, Urbana, Illinois, May 19-26, Abstracts of Papers, p. 32.
Chung, M., and Sackett, W., 1978, Carbon isotope fractionation during coal pyrolysis: Fuel, v. 57, p. 734-735.
Connan, J., 1974, Time-temperature relation in oil genesis: American Association of Petroleum Geologists Bulletin, v. 58, p. 2516-2521.
Connan, J., Monte!, F., Blanc, P.H., Sahuquet, B., and Jouhannel, R., 1991, Experimental study of expulsion of hydrocarbons from shaley source rocks-Importance of pressure on expulsion efficiencies, in Manning, D.A.C., ed., Advances in organic geochemistry: Advances and Applications in Energy and the Natural Environment, Program and Abstracts, p. 14-15.
Cooles, G.P., Mackenzie, A.S., and Quigley, T.M., 1986, Calculation of petroleum masses generated and expelled from source rocks: Organic Geochemistry, v. 10, p. 235-245.
Cottrell, T.L., 1958, The strengths of chemical bonds: Butterworths.
Domine', F., 1991, High pressure pyrolysis of n-hexane, 2-4 dimethylpentane and 1-phenylbutane-Is pressure an important geochemical parameter?: Organic Geochemistry, v. 17, p. 619-634.
Domini, F., and Enguehard, F., 1992, Kinetics of hexane pyrolysis at very high pressures-Application to geochemical modeling: Organic Geochemistry, v.18, p. 41-49.
Eggers, D.F., Gregory, N.W., Halsey, G.D., and Rabinovitch, B.S., 1964, Physical chemistry: London, Wiley and Sons, 783 p.
Espitalie, J., Maxwell, J. R., Chenet, Y., and Marquis, F., 1988, Aspects of hydrocarbon migration in the Mesozoic in the Paris Basin as deduced from an organic geochemical survey: Organic Geochemistry, v. 13, p. 457-481.
Espitalie, J., Ungerer, P., Irwin, 1., and Marquis, F., 1988, Primary cracking of kerogens-Experimenting and modeling C1, CrC5•
C 1-C15 and C15+ classes of hydrocarbons formed: Organic Geochemistry, v. 13, p. 893-899.
Forsman, J.P., and Hunt, J.M., 1958, Insoluble organic matter (kerogen) in sedimentary rock of marine origin, in Weeks, L.G., ed., Habitat of oil: American Association of Petroleum Geologists, p. 747-778.
Goffe, B., and Villey, M., 1984, Texture d'un materiel carbone implique dans un metamorphisme haute pression-basse temperature (Alpes Francaises)-Les hautes pressions influenant, elles Ia carbonification?: Bulletin de Mineralogie, v. 107, p. 81-91.
Goodarzi, F., and Murchison, D., 1977, Effect of prolonged heating on the optical properties of vitrinite: Fuel, v. 56, p. 89-96.
Gould, E.S., 1959, Mechanism and structure in organic chemistry: Henry Holt and Co.
Hayes, J.M., 1991, Stability of petroleum: Nature, v. 352, July 11, p. 108-109.
Helgeson, H., 1991, Organic/inorganic reactions in metamorphic processes: Canadian Mineralogist Greenwood Symposium Issue, v. 29, p. 707-739.
Hesp, W., and Rigby, D., 1973, The geochemical alteration of hydrocarbons in the presence of water: Erdol und KohleErdgas, v. 26, p. 70-76.
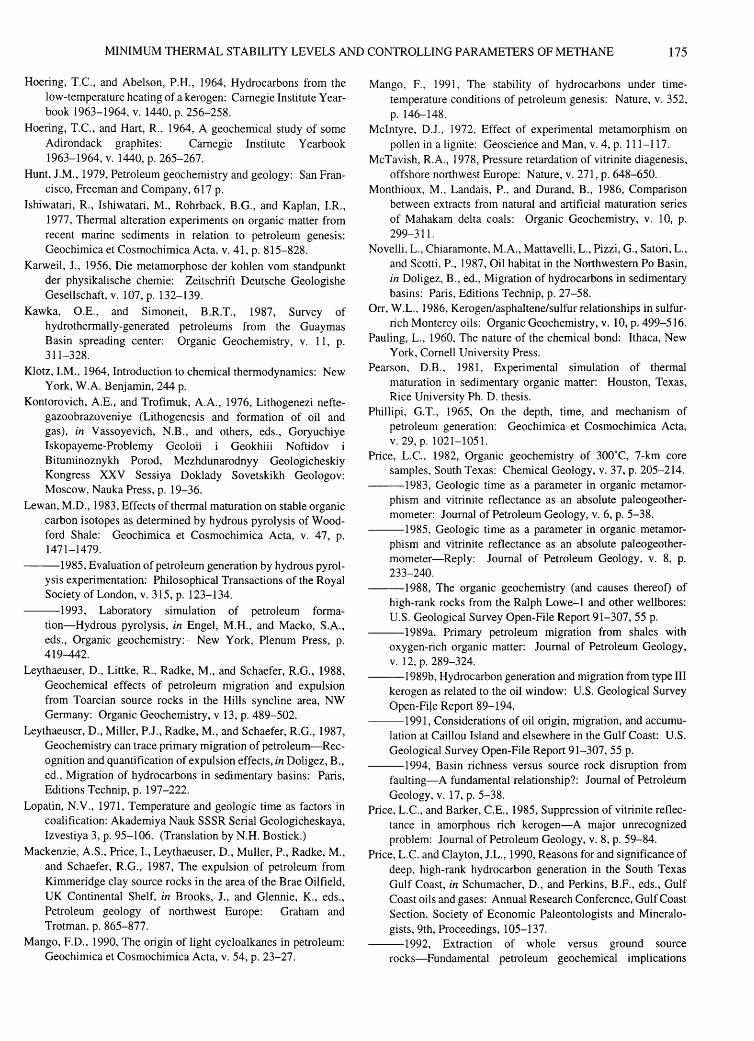
MINIMUM THERMAL STABILITY LEVELS AND CONTRQLLING PARAMETERS OF METHANE 175
Hoering, T.C., and Abelson, P.H., 1964, Hydrocarbons from the low-temperature heating of a kerogen: Carnegie Institute Yearbook 1963-1964,v. 1440,p.256-258.
Hoering, T.C., and Hart, R., 1964, A geochemical study of some Adirondack graphites: Carnegie Institute Yearbook 1963-1964,v. 1440,p. 265-267.
Hunt, J.M., 1979, Petroleum geochemistry and geology: San Francisco, Freeman and Company, 617 p.
Ishiwatari, R., Ishiwatari, M., Rohrback, B.G., and Kaplan, I.R., 1977, Thermal alteration experiments on organic matter from recent marine sediments in relation to petroleum genesis: Geochimica et Cosmochimica Acta, v. 41, p. 815-828.
Karweil, 1., 1956, Die metamorphose der kohlen vom standpunkt der physikalische chemie: Zeitschrift Deutsche Geologishe Gesellschaft, v. 107, p. 132-139.
Kawka, O.E., and Simoneit, B.R.T., 1987, Survey of hydrothermally-generated petroleums from the Guaymas Basin spreading center: Organic Geochemistry, v. 11, p. 311-328.
Klotz, I.M., 1964, Introduction to chemical thermodynamics: New York, W.A. Benjamin, 244 p.
Kontorovich, A.E., and Trofimuk, A.A., 1976, Lithogenezi neftegazoobrazoveniye (Lithogenesis and formation of oil and gas), in Vassoyevich, N.B., and others, eds., Goryuchiye Iskopayeme-Problemy Geoloii i Geokhiii Noftidov Bituminoznykh Porod, Mezhdunarodnyy Geologicheskiy Kongress XXV Sessiya Doklady Sovetskikh Geologov: Moscow, Nauka Press, p. 19-36.
Lewan, M.D., 1983, Effects of thermal maturation on stable organic carbon isotopes as determined by hydrous pyrolysis of Woodford Shale: Geochimica et Cosmochimica Acta, v. 47, p. 1471-1479.
---1985, Evaluation of petroleum generation by hydrous pyrolysis experimentation: Philosophical Transactions of the Royal Society of London, v. 315, p. 123-134.
---1993, Laboratory simulation of petroleum formation-Hydrous pyrolysis, in Engel, M.H., and Macko, S.A., eds., Organic geochemistry:- New York, Plenum Press, p. 419-442.
Leythaeuser, D., Littke, R., Radke, M., and Schaefer, R.G., 1988, Geochemical effects of petroleum migration and expulsion from Toarcian source rocks in the Hills syncline area, NW Germany: Organic Geochemistry, v 13, p. 489-502.
Leythaeuser, D., Miller, P.J., Radke, M., and Schaefer, R.G., 1987, Geochemistry can trace primary migration of petroleum-Recognition and quantification of expulsion effects, in Doligez, B., ed., Migration of hydrocarbons in sedimentary basins: Paris, Editions Technip, p. 197-222.
Lopatin, N.Y., 1971, Temperature and geologic time as factors in coalification: Akademiya Nauk SSSR Serial Geologicheskaya, lzvestiya 3, p. 95-106. (Translation by N.H. Bostick.)
Mackenzie, A.S., Price, 1., Leythaeuser, D., Muller, P., Radke, M., and Schaefer, R.G., 1987, The expulsion of petroleum from Kimmeridge clay source rocks in the area of the Brae Oilfield, UK Continental Shelf, in Brooks, 1., and Glennie, K., eds., Petroleum geology of northwest Europe: Graham and Trotman, p. 865-877.
Mango, F.D., 1990, The origin of light cycloalkanes in petroleum: Geochimica et Cosmochimica Acta, v. 54, p. 23-27.
Mango, F., 1991, The stability of hydrocarbons under timetemperature conditions of petroleum genesis: Nature, v. 352, p. 146-148.
Mcintyre, D.J., 1972, Effect of experimental metamorphism on pollen in a lignite: Geoscience and Man, v. 4, p. 111-117.
McTavish, R.A., 1978, Pressure retardation of vitrinite diagenesis, offshore northwest Europe: Nature, v. 271, p. 648-650.
Monthioux, M., Landais, P., and Durand, B., 1986, Comparison between extracts from natural and artificial maturation series of Mahakam delta coals: Organic Geochemistry, v. 10, p. 299-311.
Novelli, L., Chiaramonte, M.A., Mattavelli, L., Pizzi, G., Satori, L., and Scotti, P., 1987, Oil habitat in the Northwestern Po Basin, in Doligez, B., ed., Migration of hydrocarbons in sedimentary basins: Paris, Editions Technip, p. 27-58.
Orr, W.L., 1986, Kerogen/asphaltene/sulfur relationships in sulfurrich Monterey oils: Organic Geochemistry, v. 10, p. 499-516.
Pauling, L., 1960, The nature of the chemical bond: Ithaca, New York, Cornell University Press.
Pearson, D.B., 1981, Experimental simulation of thermal maturation in sedimentary organic matter: Houston, Texas, Rice University Ph. D. thesis.
Phillipi, G.T., 1965, On the depth, time, and mechanism of petroleum generation: Geochimica et Cosmochimica Acta, V. 29, p. 1021-1051.
Price, L.C., 1982, Organic geochemistry of 300°C, 7-km core samples, South Texas: Chemical Geology, v. 37, p. 205-214.
---1983, Geologic time as a parameter in organic metamorphism and vitrinite reflectance as an absolute paleogeothermometer: Journal of Petroleum Geology, v. 6, p. 5-38.
---1985, Geologic time as a parameter in organic metamorphism and vitrinite reflectance as an absolute paleogeothermometer-Reply: Journal of Petroleum Geology, v. 8, p. 233-240.
---1988, The organic geochemistry (and causes thereof) of high-rank rocks from the Ralph Lowe-1 and other wellbores: U.S. Geological Survey Open-File Report 91-307, 55 p.
---1989a, Primary petroleum migration from shales with oxygen-rich organic matter: Journal of Petroleum Geology, v. 12, p. 289-324.
---1989b, Hydrocarbon generation and migration from type III kerogen as related to the oil window: U.S. Geological Survey Open-File Report 89-194.
---1991, Considerations of oil origin, migration, and accumulation at Caillou Island and elsewhere in the Gulf Coast: U.S. Geological Survey Open-File Report 91-307, 55 p.
---1994, Basin richness versus source rock disruption from faulting-A fundamental relationship?: Journal of Petroleum Geology, v. 17, p. 5-38.
Price, L.C., and Barker, C.E., 1985, Suppression of vitrinite reflectance in amorphous rich kerogen-A major unrecognized problem: Journal of Petroleum Geology, v. 8, p. 59-84.
Price, L.C. and Clayton, J.L., 1990, Reasons for and significance of deep, high-rank hydrocarbon generation in the South Texas Gulf Coast, in Schumacher, D., and Perkins, B.F., eds., Gulf Coast oils and gases: Annual Research Conference, Gulf Coast Section, Society of Economic Paleontologists and Mineralogists, 9th, Proceedings, 105-137.
---1992, Extraction of whole versus ground source rocks-Fundamental petroleum geochemical implications

176 DEEP NATURAL GAS RESOURCES IN THE UNITED STATES
including oil-source rock correlation: Geochimica et Cosmochimica Acta, v. 56, p. 1213-1222.
Price, L.C., Clayton, J.L., and Rumen, L.L., 1979, Organic geochemistry of a 6.90 kilometer-deep well, Hinds County, Mississippi: Transactions Gulf Coast Geological Society, V. 29, p. 352-370.
---1981, Organic geochemistry of the 9.6 km Bertha Rogers #1, Oklahoma: Journal of Organic Geochemistry, v. 3, p. 59-77.
Price, L.C., Ging, T.G., Daws, T.A., Love, A.H., Pawlewicz, M.J., and Anders, D.E., 1984, Organic metamorphism in the Mississippian-Devonian Bakken shale North Dakota portion of the Williston Basin, in Woodward, J., Meissner, F.F., and Clayton, J.L., eds., Hydrocarbon source rocks of the greater Rocky Mountain Region: Denver, Rocky Mountain Association of Geologists, p. 83-113.
Price, L.C., and LeFever, J.A., 1992, Does Bakken horizontal drilling imply huge oil-resource bases in fractured shales?, in Schmoker, J., ed., Geological studies relevant to horizontal drilling, examples from Western North America: Rocky Mountain Association of Geologists, p. 199-214.
Price, L.C., and Wenger, L.M., 1991, The influence of pressure on petroleum generation and maturation as suggested by aqueous pyrolysis: Organic Geochemistry, v. 19, p. 141-159.
Quigley, T.M., and Mackenzie, A.S., 1988, The temperatures of oil and gas formation in the sub-surface: Nature, v. 333, p. 549-552.
Roberts, J.D., and Caserio, M.C., 1964, Basic principles of organic chemistry: Amsterdam, W.A. Benjamin, 1315 p.
Rogers, J., Suggate, R., Elphick, J., and Ross, J., 1962, Metamorphism of a lignite: Nature,v.l95,p.1078-1080.
Sagjo, Cs., 1980, Hydrocarbon generation in a super-thick Neogene sequence in south-east Hungary-A study of the extractable organic matter, in Douglas, A.G., and Maxwell, A.G., eds., Advances in organic geochemistry 1979: Great Britain, Pergamon, p. 103-113.
Sassen, R., and Moore, C. H., 1988, Framework of hydrocarbon generation and destruction in eastern Smackover trend: American Association of Petroleum Geologists Bulletin, v. 72, p. 649-663.
Shock, E., 1990, Geochemical considerations of the origin of organic compounds in hydrothermal systems: Origins of Life and Evolution ofthe Biosphere, v. 20, p. 331-367.
Shepeleva, N.N., Ogloblina, A.l., and Pikovskiy, Yu 1., 1990, Polycyclic aromatic hydrocarbons in carbonaceous material from the Daldyn-Alakit region, Siberian Platform: Geochemistry International, v. 28, 4, p. 98-107.
Sienko, M.J., and Plane, R.A., 1961, Chemistry: Toronto, Ont., McGraw-Hill, 623 p.
Simoneit, B.R.T., 1983, Organic-matter maturation and petroleum genesis-Geothermal versus hydrothermal, in The role of heat in the development of energy and mineral resources in the Northern Basin and Range Province: Davis, Calif., Geothermal Resources Council, Special Report 13, p. 215-241.
---1984, Hydrothermal effects on organic matter-High versus low temperature components: Organic Geochemistry, V. 6, p. 857-864.
---1985, Hydrothermal petroleum-Genesis, migration and deposition in Guaymas Basin, Gulf of California: Canadian Journal of Earth Sciences, v. 22, p. 1919-1929.
Simoneit, B.R.T. and Kawka, O.E., 1987, Hydrothermal petroleum from diatomites in the Gulf of California, in Brooks, J., and Fleet, A., eds., Marine petroleum source rock: Geological Society of London Special Publication 26, p. 217-228.
Simoneit, B.R.T., Philp, R.P., Jenden, P.D., and Galimov, E.M., 1984, Organic geochemistry of Deep Sea Drilling Project sediments from the Gulf of California-Hydrothermal effects on unconsolidated diatomooze: Organic Geochemistry, v. 7, p. 173-205.
Sokolov, V.A., Geodekyan, A.A., Grigoryev, C.G., Krems, A.Ya., Stroganov, V. A., Zorkin, L.M., Zeidelson, M.l., and Vainbaum, S. Ja., 1971, The new methods of gas surveys, gas investigations of wells and some practical results, in Boyle, R.W., ed., Geochemical exploration: Canadian Institute of Mining and Metallurgy Special Volume 11, p. 538-544.
Takach, N.E., Barker, C., and Kemp, M.K., 1987, Stability of natural gas in the deep subsurface-Thermo-dynamic calculation of equilibrium compositions: American Association of Petroleum Geologists Bulletin, v. 71, p. 322-333.
Talukdar, S., Gallango, 0., Vallejos, C., and Ruggiero, A., 1987, Observations on the primary migration of La Luna source rocks of the Maracaibo Basin, Venezuela, in Doligez, B., ed., Migration of hydrocarbons in sedimentary basins: Paris, Editions Technip, p. 59-77.
Teichmtiller, M., and Durand, B., 1983, Fluorescence microscopial rank studies on liptinites and vitrinites in peats and coals and comparison with results of the Rock-Eva! pyrolysis: International Journal of Coal Geology, v. 2, p. 197-230.
Tissot, B.P., Pelet, R., and Ungerer, P.H., 1987, Thermal history of sedimentary basins, maturation indices, and kinetics of oil and gas generation: American Association of Petroleum Geologists Bulletin, v. 71, p. 1445-1466.
Tissot, B.P., and Welte, D.H., 1984, Petroleum formation and occurrence: Berlin, Springer Verlag, 699 p ..
Ungerer, P., 1990, State of the art research in kinetic modeling of oil formation and expulsion: Organic Geochemistry, v. 16, p. 1-25.
Ungerer, P., Chenet, P.Y., Moretti, 1., Chiarelli, A., and Oudin, J.L., 1986, Modeling oil formation and migration in the southern part of the Suez rift, Egypt: Organic Geochemistry, v. 10, p. 247-260.
Ungerer, P., Doligez, B., Chenet, P.Y., Burrus, J., Bessis, F., Lefargue, E., Giroir, G., Heurn, 0., and Eggen, S., 1987, A 2-D model of basin scale petroleum migration by two-phase fluid flow application to some case studies, in Doligez, B., ed., Migration of hydrocarbons in sedimentary basins: Paris, Editions Technip, p. 415--456.
Wenger, L.M., and Price, L.C., 1991, Differential petroleum generation and maturation paths of the different organic matter types as determined by hydrous pyrolysis over a wide range of experimental temperatures, in Manning, D.A.C., ed., Advances in organic geochemistry: Advances and Applications in Energy and the Natural Environment, Program and Abstracts, p. 335-339.
Winkler, H.G.F., 1976, Petrogenesis of metamorphic rocks: New York, Springer Verlag, 334 p.
Zumberge, J.E., Sutton, C., Martin, S.J., and Worden, R.D., 1988, Determining oil generation kinetic parameters by using a fused quartz pyrolysis system: Energy and Fuels, V. 2, p. 264-266.

Origins, Characteristics, Evidence For, and Economic Viabilities of Conventional and Unconventional Gas Resource Bases
By Leigh C. Price
GEOLOGIC CONTROLS OF DEEP NATURAL GAS RESOURCES IN THE UNITED STATES
U.S. GEOLOGICAL SURVEY BULLETIN 2146-L
UNITED STATES GOVERNMENT PRINTING OFFICE, WASHINGTON: 1997
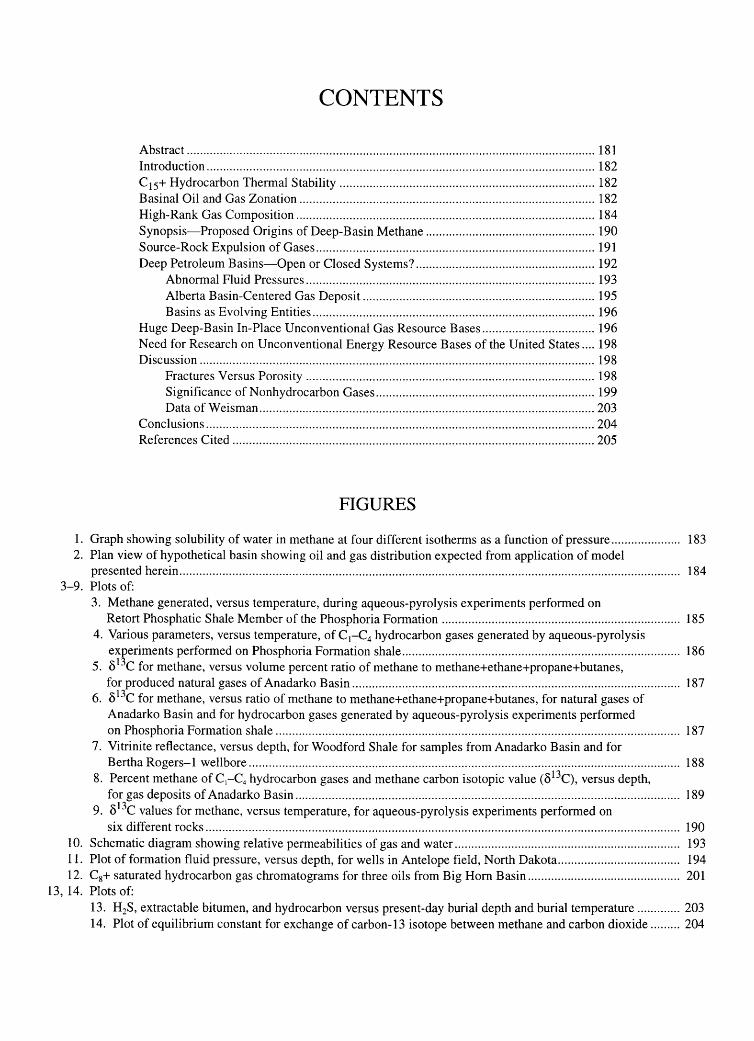
CONTENTS
Abstract ........................................................................................................................... 181 Introduction ..................................................................................................................... 182 C 15+ Hydrocarbon Thermal Stability ............................................................................. 182 Basinal Oil and Gas Zonation ......................................................................................... 182 High-Rank Gas Composition .......................................................................................... 184 Synopsis-Proposed Origins of Deep-Basin Methane ................................................... 190 Source-Rock Expulsion of Gases .................................................................................... 191 Deep Petroleum Basins-Open or Closed Systems? ...................................................... 192
Abnormal Fluid Pressures ....................................................................................... 193 Alberta Basin-Centered Gas Deposit ...................................................................... 195 Basins as Evolving Entities ..................................................................................... 196
Huge Deep-Basin In-Place Unconventional Gas Resource Bases .................................. 196 Need for Research on Unconventional Energy Resource Bases of the United States .... 198 Discussion ....................................................................................................................... 198
Fractures Versus Porosity ....................................................................................... 198 Significance of Nonhydrocarbon Gases .................................................................. 199 Data of Weisman ..................................................................................................... 203
Conclusions ..................................................................................................................... 204 References Cited ............................................................................................................. 205
FIGURES
1. Graph showing solubility of water in methane at four different isotherms as a function of pressure..................... 183 2. Plan view of hypothetical basin showing oil and gas distribution expected from application of model
presented herein....................................................................................................................................................... 184 3-9. Plots of:
3. Methane generated, versus temperature, during aqueous-pyrolysis experiments performed on Retort Phosphatic Shale Member of the Phosphoria Formation ........................................................................ 185
4. Various parameters, versus temperature, of C1-C4 hydrocarbon gases generated by aqueous-pyrolysis experiments performed on Phosphoria Formation shale .................................................................................... 186
5. o13C for methane, versus volume percent ratio of methane to methane+ethane+propane+butanes, for produced natural gases of Anadarko Basin ................................................................................................... 187
6. o13C for methane, versus ratio of methane to methane+ethane+propane+butanes, for natural gases of Anadarko Basin and for hydrocarbon gases generated by aqueous-pyrolysis experiments performed on Phosphoria Formation shale . . .. . . . . .. . . .. .. . . . .. . . . . . . . . . .. .. . ......... .. . ... . . . . .. .. . . . ............. .. . . . . .. . . . . ........... .. . . . . .. ... . .. . . . . .. . . . . . 187
7. Vitrinite reflectance, versus depth, for Woodford Shale for samples from Anadarko Basin and for Bertha Rogers-1 well bore.................................................................................................................................. 188
8. Percent methane of C1-C4 hydrocarbon gases and methane carbon isotopic value (o13C), versus depth, for gas deposits of Anadarko Basin.................................................................................................................... 189
9. o13C values for methane, versus temperature, for aqueous-pyrolysis experiments performed on six different rocks . . . . . . .. . . . . . . . . . . . . . . . . . . . . .. . . . . . . . . . . . . . . . . . . . . .. . . . . . . . . . . . . . . . . . . . . . . . . . . . . . . . . . . . . . . . . . . . .. . . . . . . . . . . . . . . . . . . . . . . . . . . .. . . . . . . . . . . . . . . . . . . 190
10. Schematic diagram showing relative permeabilities of gas and water .................................................................... 193 11. Plot of formation fluid pressure, versus depth, for wells in Antelope field, North Dakota..................................... 194 12. C8+ saturated hydrocarbon gas chromatograms for three oils from Big Hom Basin .............................................. 201
13, 14. Plots of: 13. H2S, extractable bitumen, and hydrocarbon versus present-day burial depth and burial temperature ............. 203 14. Plot of equilibrium constant for exchange of carbon-13 isotope between methane and carbon dioxide ......... 204

CONTENTS
TABLES
1. Geochemical data for Soxhlet-extracted rock samples of the Phosphoria Formation after aqueous pyrolysis and for kerogens isolated from those rocks ..................................................................................................................... 185
2. Average basin productivity of producible oil and oil-equivalent gas and total estimated ultimate recovery for different major basinal structural classes ....................................................................................................................... 192


Origins, Characteristics, Evidence For, and Economic Viabilities of Conventional and
Unconventional Gas Resource Bases
By Leigh C. Price
ABSTRACT
A strong zonation of oil and gas deposits exists in many petroleum basins, with only "dry" gas in deep-basin reservoirs and increasing amounts of oil at shallower depths. Also, both API gravity and gas-oil ratios of oil deposits decrease toward shallower depths on the basin shelves, away from the deep basin. Previously, this basinal hydrocarbon zonation has been taken as prima facie evidence that dry gas (methane) was being formed from the thermal destruction of Cis+ hydrocarbons (oil) in the deep basin; however, (1) the persistence of Cis+ hydrocarbons to great depths (7-10 km) and extreme maturation ranks (R0=5.0-7.0 percent) in petroleum basins and (2) methane carbon-isotopic compositions in the Anadarko Basin and from aqueous-pyrolysis experiments strongly argue against the above hypothesis of deep-basin methane resulting from Cis+ hydrocarbon thermal destruction. Instead, a model is favored wherein most deep-basin methane has simply been generated from kerogen during the Cis+ hydrocarbon generative phase. The invariably observed basinal zonation of hydrocarbons is hypothesized to result from condensation, buoyancy, and separation-migration processes.
In the deep basin, only methane remains in the gas phase due to high fluid pressures. The C2-C4 hydrocarbon gases are condensed into, and behave as, a liquid phase. With continued Cis+ hydrocarbon (and methane) generation in the deep basin, eventually all (or most) deep-basinal traps are filled to the spill point with methane, and all other fluids (oil, condensed C2-C4 hydrocarbon gases, and water) are displaced out of the deep basin to shallower traps on the stable shelves of petroleum basins by differential entrapment. These processes are driven by buoyancy differences within the fluids and because methane "rides over," or is found on top of, all other fluids in the deep basin.
Evidence suggests that water may have been flushed from some (many?) deep-basinal traps by methane, as hypothesized. Both carbon dioxide and hydrogen sulfide are present in abundance in some deep-basin gas reservoirs and
would have existed in those reservoirs for tens to hundreds of millions of years. Because these gases are highly soluble in water, their presence dictates that water is not in contact with such gas reservoirs. The absence of water in some deep-basinal gas reservoirs carries implications for the deepbasin gas resource base, two of the more important of which are that ( 1) hydrocarbon thermal-cracking reactions are promoted in these water-free environments, and (2) when water is introduced into such reservoirs during drilling and completion operations, in some cases significant reservoir damage could occur in a skin around the wellbore from the principles of two-phase-fluid flow and the Jamin effect. Such reservoir damage, if it occurs, could greatly harm gas productivities, which could lead to an underestimation of the recoverability and economic viability of certain deep-basin gas-resource bases and the condemnation of both individual wells and prospects.
As stated, it is hypothesized here that most deep-basinal gas deposits have originated from methane generation that accompanies Cis+ hydrocarbon generation in source rocks combined with condensation-buoyancy-separation-migration processes. Carbon-isotopic values of methane and carbon dioxide in some deep-basinal gas deposits demonstrate, however, that high-rank dry-gas deposits do exist which have originated from Cis+ hydrocarbon thermal destruction. Such deposits do appear to be unusual, however.
It is postulated that gas expulsion from the source rock, like oil expulsion, is significantly less efficient than generally perceived. It is also hypothesized that gas expulsion would be greatly facilitated by major faulting (with accompanying large-scale fracturing). Such faulting would physically disrupt source rocks (and the rocks adjacent to them) to allow gas to escape in significant volumes. Therefore, a "rule of thumb" concerning deep-gas deposits, is that large "conventional" deep-gas deposits (not tight gas, basin-centered gas, and so forth) should always be associated with major faults.
One of the hypotheses serving as a foundation for the preceding rule of thumb is that deep petroleum basins are
181

182 DEEP NATURAL GAS RESOURCES IN THE UNITED STATES
more of a "closed system," with regard to fluid flow and fluid expulsion from source rocks, than generally envisioned. Current petroleum geologic-geochemical thought generally models deep petroleum basins as open systems that allow efficient hydrocarbon expulsion and flow of deep-basin fluids to proceed, for the most part, unabated through geologic time. There is, however, strong evidence against this viewpoint, evidence that supports the proposition that deep basins are primarily closed systems in regard to fluid flow. If this latter viewpoint more closely approximates the natural system, then much more of the gas generated in deep basins will have been retained in the deep basins than previously perceived. This possibility carries the implication that much larger and much higher grade deep-basin gas-resource bases may exist than previously envisioned. In point of fact, monstrous in-place gas-resource bases have already been proven, such as coal-gas, tight-gas, basin-centered gas, Gulf Coast geopressured-geothermal gas, and so forth. The very existence of these various gas-resource bases validates the proposition that deep basins are much more of a closed system with regard to fluid flow than has been previously portrayed by some basinal models.
It is the principal recommendation of this paper that geologic-based engineering studies be instituted to ascertain if wider spread commercially viable production of such inplace unconventional gas-resource bases is possible. Significant production of such unconventional in-place gas (and oil) resource bases at this point may be the only avenue by which the United States can significantly curtail an increasing dependence on the Middle East for its energy needs.
INTRODUCTION
The important parameters controlling the generation of hydrocarbon gases and their accumulation must be understood to correctly assess the potential of both conventional and unconventional deep-basin gas-resource bases. Such an understanding necessitates discussion of a number of diverse geologic and geochemical topics.
A simplified model for the origin of methane in conventional gas deposits is that methane can (1) originate as biogenic methane, (2) be co generated with C15+ hydrocarbons in the source rock and move to a gas and oil or gas reservoir, (3) originate from in-reservoir thermal destruction of a deep oil deposit to a dry gas (principally methane) deposit, (4) originate from C15+ hydrocarbon destruction from the hydrocarbons remaining in deeply buried fine-grained rocks, (5) originate from remnant hydrocarbon-generation potential remaining on high-rank kerogen after mainstage C15+ hydrocarbon generation is mostly complete, or (6) originate from any combination of the above. Most deeply buried dry-gas deposits are thought to originate by in-reservoir conversion of oil to methane beginning at about vitrinite reflectance (R0 )
values of 0.9 percent (Tissot and Welte, 1984). Two facts
argue strongly against this hypothesis: (1) C 15+ hydrocarbons are thermally stable in deep-basinal situations to vitrinite reflectance values of 7.0-8.0 percent (Price, this volume), and (2) in the C 15+ hydrocarbon destructive phase both the C15+ hydrocarbons and the generated methane have distinct compositional and (or) carbon isotopic overprints, rarely observed in methane of deep-basin dry-gas deposits. These two facts thus suggest that there must be another process, or processes, responsible for the origin of deep-basin gas deposits. Such possible processes are examined herein.
C15+ HYDROCARBON THERMAL STABILITY
It is widely accepted in petroleum geochemistry that oil in deeply buried reservoirs begins to meaningfully thermally decompose to methane at R0 =0.9 percent and totally decomposes to methane (or other hydrocarbon gases) by R0 =1.35 percent and that this process is responsible for the formation of most deep-basin dry-gas deposits. Price (1993, this volume) demonstrated, however, that C 15+ hydrocarbons are thermally stable in nature to R0=7.0-8.0 percent. The large body of data supporting Price's conclusion strongly conflicts with a hypothetical model originally proposed to explain certain observations from nature, a model that predicts the total thermal destruction of C 15+ hydrocarbons by R0=1.35 percent. Given a contradiction between a large, internally consistent body of data and a hypothetical model, I lean toward reexamination of the model. It is thus a premise herein that, based on the data of Price (1993, this volume), the generally accepted model for the formation of dry-gas deposits may be erroneous. It is also hypothesized that processes other than C15+ hydrocarbon thermal destruction at R0=1.35 percent are responsible for the large body of convincing data, in the form of strongly delineated zonations of oil and gas versus maturation rank in petroleum basins, commonly cited as evidence to support the accepted model.
BASINAL OIL AND GAS ZONATION
A paucity of oil deposits in high-rank coarse-grained rocks is another persuasive and primary line of evidence, together with reduced hydrocarbon concentrations in finegrained rocks containing type III organic matter at R0=0.9 percent, supporting the hypothesis of C15+ hydrocarbon thermal instability in the vitrinite reflectance range of 0.9-1.35 percent. As discussed in Price (1991), however, this sparsity of oil deposits in high-rank rocks can be explained by two other processes.
First, during vertical oil migration and emplacement, abnormal fluid pressures of deep-basin rocks would prevent oil from entering such rocks. As such, oil would be

CONVENTIONAL AND UNCONVENTIONAL GAS RESOURCE BASES 183
vertically bypassed to shallower, hydrostatically pressured rocks during compaction, oil-expulsion, and emplacement processes. Secondly, as discussed in Price (this volume), increasing amounts of methane are cogenerated with C 15+ hydrocarbons through all stages of hydrocarbon generation, and significant amounts of methane are generated during the end stages of C15+ hydrocarbon generation. Also, in some cases, true high-rank methane ("dry gas") indeed is generated at great depths in some sedimentary basins by thermal destruction of C 15+ hydrocarbons (discussed following). Any methane streaming out of the deep basin from either source will displace oil from any deep-basin, high-rank reservoirs to shallower basinal depths by Gussow's (1954) principle of differential entrapment (buoyancy). It must be stressed that water will also be displaced from deep-basin reservoirs (even before oil, because of the buoyancy differences between water and oil) by Gussow's principle. Furthermore, methane gas has the ability to dissolve and transport water in solution (fig. 1), an ability that dramatically increases with increasing temperature. Thus, some (many?) deep-basin gas reservoirs may be expected to be water free. Any entry of gas into deep-basin oil reservoirs also causes asphaltene precipitation ("desasphaltening") from the oil onto the reservoir rock. Such asphaltenes in
0
0.8
0.4
0.3
a: 0.2 w I-::J a: 0.1 w a.. 0.08 (/)
2: 0.06 <( a: (.9 0.04 ~
0.03 ~-::J 0.02 iil => ..J 0 (/) 0.01 a: ~ 0.008
~ 0.006
0.004
0.003
0.002
PRESSURE, IN BARS 200 400 600 800 1 ,000 1 ,200 1,400
X X X
X
X
@ • 0
+ +
"4-
+f-
+ 100°C
• 150°C
0 2oooc
x 250°C
250°C
X X
X
2oooc
1oooc
+
+
X X
.. +
+
+
0. 00 1 '----'---'-------'------'-------'---'--'-----L---'-----'-------'--L--'--L___!---'--L_l____j___j__J.._J
0 2 4 6 8 10 12 14 16 18 20 22 PRESSURE, IN POUNDS PER SQUARE INCH
Figure 1. Solubility of water in methane at four different isotherms as a function of pressure. Data from Price and others (1983).
such a water-free environment would undergo enhanced maturation reactions because of the lack of water in the system (Price, this volume), resulting in a pyrobitumen char.
The end result of these processes is a strong basinal segregation of hydrocarbon fluids. Oil would be in reservoirs at shallow and moderate depths on the stable shelves of petroleum basins, and dry gas would be in deep-basin reservoirs, some of which would also contain a charred pyrobitumen. Furthermore, as discussed in Price (1980a), the oil deposits would also exhibit a zonation: Both gas-oil ratios and API gravities would greatly decrease with increasing distance from the basin center. Such decreases would be due to two causes. First, with increasing distance of secondary migration, lighter fractions (including hydrocarbon gases) would be progressively lost from oils. Second, the most distant oils from the deep basin would be the oils generated first by any given source rock. Oils generated later by the same source rock would be more mature, and contain higher percentages of lighter fractions, than the first-generated oils, and would be closer to the basin deeps than the first-generated oils. The end hydrocarbon distribution (fig. 2) in a basin would clearly appear to be due to thermal destruction of oil at high maturation ranks; however, this distribution could also be explained by other processes operative in petroleum basins, including those in which fluid buoyancy plays a key role. Furthermore, the hydrocarbon distribution shown in figure 2 will independently result from these processes irrespective of any contributions from C15+ hydrocarbon thermal destruction.
The C2-C4 hydrocarbon gases would also be flushed by methane from the deep-basin reservoirs in some basins. Salisbury (1968) discussed the strong zonation of oil and gas in Silurian and Devonian reservoirs of the West Texas Permian Basin. He noted that methane has a very low critical temperature as compared to the other (CrC4) hydrocarbon gases, and, thus, although methane is always in the gas phase under the pressure-temperature conditions of the West Texas Permian Basin deep-basin gas reservoirs, the C2-C4 hydrocarbon gases are condensed in the liquid phase. As such, the C2-C4 hydrocarbon gases in deep-basin reservoirs are subject to the same separation-migration phenomena as oil by Gussow's (1954) principle of differential entrapment. It is important to realize that such condensation-buoyancydriven hydrocarbon-gas migrations cause the zonation of dry gas deposits (high concentrations [98+ percent] of methane in the gas, relative to the other hydrocarbon gases) observed in many deep petroleum basins, irrespective of any contribution from the thermal destruction of C2+ hydrocarbons. A high concentration of methane (~98 percent) in a gas deposit by itself cannot be taken as absolute evidence of a high-rank origin for the methane. In fact, data discussed following strongly suggest that much (most?) dry gas in deep-basin reservoirs has originated from condensation-separationmigration processes, with no or little contribution from C 15+ hydrocarbon thermal-destruction reactions.

184 DEEP NATURAL GAS RESOURCES IN THE UNITED STATES
RIM
EXPLANATION
D Gasonly
[[[[[I] Oil pools with gas caps
Figure 2. Plan view of a hypothetical basin showing oil and gas distribution in any one formation expected from the application of the model presented herein. Contours are total sediment thickness in thousands of feet. Faults (shown by hachured lines) dip back into the deep basin and transport hydrocarbons from this area; hydrocarbons move from the faults into carrier beds, resulting in the hydrocarbon distribution shown in the figure. The dashed boundaries signify the approximate nature of this hydrocarbon distribution. API is API oil gravity, and GORis gas-oil ratio.
The proposition is easily tested if the lack of deep-basin, high-rank oil is due to buoyancy displacement by methane or to in-reservoir conversion of oil to high-rank methane. Methane gas has the capacity to dissolve C5+ hydrocarbons in solution (Price and others, 1983). Buoyancy displacement of oil by methane would still leave small, but measurable, concentrations of C 15+ hydrocarbons dissolved in dry-gas deposits. In-reservoir conversion of oil to high-rank methane should result, on the other hand, in the total destruction of C 15+ hydrocarbons. Cold trapping or filtration of a pressurized gas stream from a high-rank gas deposit would isolate any C15+ hydrocarbons dissolved in the methane, such that they could be quantitatively and qualitatively analyzed.
In point of fact, such an investigation has already been carried out. A senior petroleum geochemist, recently retired from a major oil company, informed me of a study he helped
carry out wherein dry gases from about 20 different highrank gas deposits from Texas and Oklahoma were analyzed by mass spectrometry for C5+ hydrocarbons. A full suite of oil components was found in all these gases. Analysis of the biomarkers showed all entrained oils to be "normal" and only moderately mature, with one exception, which showed slight thermal stress. The principal conclusion from that study was that only one of the "high-rank" gas deposits analyzed had any possible contribution of methane from the thermal destruction of higher molecular weight hydrocarbons.
Compaction, migration, emplacement processes, and gas flushing by buoyancy differences all displace oil (and C2-C4 hydrocarbon gases) from the deep basin. Thus, it is unlikely that large, deep-basin, high-rank oil deposits will be routinely discovered. Isolated cases of high-rank oil do, however, exist. Stahl (1974) described oil produced at 7,300 m (R0 =3.50 percent) by the Lonestar Baden-1 wellbore, Anadarko Basin, Oklahoma. Horsfield and others (1992) described an oil field discovered by the Saga Petroleum 2/ 4-14 wellbore at 4,300 min the North Sea, an oil field that lies beyond the postulated thermal deadline for C 15+ hydrocarbons. Vitrinite reflectance profiles have been extrapolated from Tertiary-Upper Cretaceous rocks containing type III organic matter in the Williston Basin to deeper oil-bearing carbonate reservoir rocks (Price and others, 1986, figs. 19-21). Such extrapolations lead to the conclusion that oil is produced in reservoirs on the American side of the Williston Basin at vitrinite reflectance values significantly above 1.35 percent.
HIGH-RANK GAS COMPOSITION
Data from both nature and aqueous-pyrolysis experiments of Wenger and Price (1991) and Price and Wenger (1992) provide insight to the relative control of hydrocarbon cracking versus condensation-buoyancy-migration processes on high-rank gas composition. In the aqueous pyrolysis experiments, different "rates" of methane generation are found ai experimental temperatures lower than about 320°C as compared to temperatures above 320°C (fig. 3). The rate of methane generation (slope of the curve versus temperature) decreases at the higher experimental temperatures, which are in the C 15+ hydrocarbon thermal destructive phase. The rate is lower at higher experimental temperatures because the Phosphoria Shale kerogen has lost almost all its capacity for hydrocarbon generation, as reflected by the kerogen's low atomic hydrogen to carbon ratios (table 1). Thus, in the thermal destructive phase, any hydrogen that is used to make methane, the most hydrogen rich of all hydrocarbons, must be scavenged from previously generated products, resulting in charring (formation of pyrobitumen) during hydrocarbon thermal destruction. Figure 3 also shows that first detectable onset of thermal destruction (break in the slope of the curve at 320°C) clearly overlies the maximum in
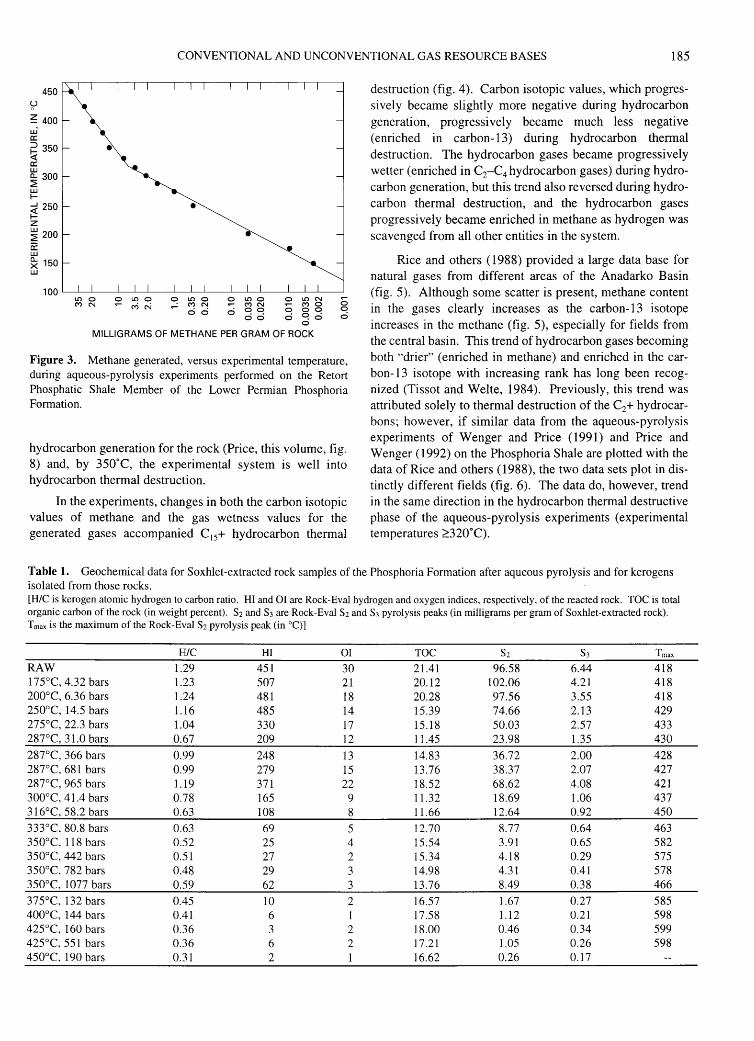
CONVENTIONAL AND UNCONVENTIONAL GAS RESOURCE BASES 185
450
~ 400 UJ-0::
::J 350 !;{ a: UJ
~ 300 UJ 1-....J 250 ~ z ~ 200 0: UJ
~ 150 UJ
I!) 0 0 I!) 0 ('I) N .- M N ~ ~ ~ 0
0 0 0 0 ci~ci ci
0 I!) 0 • ('I) N
.- ci ci 0 I!) 0 .- ('I) N
. 0 0 0 ..
0 0 0
MILLIGRAMS OF METHANE PER GRAM OF ROCK
Figure 3. Methane generated, versus experimental temperature, during aqueous-pyrolysis experiments performed on the Retort Phosphatic Shale Member of the Lower Permian Phosphoria Formation.
hydrocarbon generation for the rock (Price, this volume, fig. 8) and, by 350°C, the experimental system is well into hydrocarbon thermal destruction.
In the experiments, changes in both the carbon isotopic values of methane and the gas wetness values for the generated gases accompanied C 15+ hydrocarbon thermal
destruction (fig. 4 ). Carbon isotopic values, which progressively became slightly more negative during hydrocarbon generation, progressively became much less negative (enriched in carbon-13) during hydrocarbon thermal destruction. The hydrocarbon gases became progressively wetter (enriched in C2-C4 hydrocarbon gases) during hydrocarbon generation, but this trend also reversed during hydrocarbon thermal destruction, and the hydrocarbon gases progressively became enriched in methane as hydrogen was scavenged from all other entities in the system.
Rice and others ( 1988) provided a large data base for natural gases from different areas of the Anadarko Basin (fig. 5). Although some scatter is present, methane content in the gases clearly increases as the carbon-13 isotope increases in the methane (fig. 5), especially for fields from the central basin. This trend of hydrocarbon gases becoming both "drier" (enriched in methane) and enriched in the carbon-13 isotope with increasing rank has long been recognized (Tissot and Welte, 1984). Previously, this trend was attributed solely to thermal destruction of the C2+ hydrocarbons; however, if similar data from the aqueous-pyrolysis experiments of Wenger and Price ( 1991) and Price and Wenger (1992) on the Phosphoria Shale are plotted with the data of Rice and others (1988), the two data sets plot in distinctly different fields (fig. 6). The data do, however, trend in the same direction in the hydrocarbon thermal destructive phase of the aqueous-pyrolysis experiments (experimental temperatures ;::::320°C).
Table 1. Geochemical data for Soxhlet-extracted rock samples of the Phosphoria Formation after aqueous pyrolysis and for kerogens isolated from those rocks. [H/C is kerogen atomic hydrogen to carbon ratio. HI and 01 are Rock-Eval hydrogen and oxygen indices, respectively. of the reacted rock. TOC is total organic carbon of the rock (in weight percent). S2 and S3 are Rock-Eval S2 and S3 pyrolysis peaks (in milligrams per gram of Soxhlet-extracted rock). T max is the maximum of the Rock-Eval s2 pyrolysis peak (in °C)]
H/C HI 01 TOC s2 s3 Tmax
RAW 1.29 451 30 21.41 96.58 6.44 418 175°C, 4.32 bars 1.23 507 21 20.12 102.06 4.21 418 200°C, 6.36 bars 1.24 481 18 20.28 97.56 3.55 418 250°C, 14.5 bars 1.16 485 14 15.39 74.66 2.13 429 275°C, 22.3 bars 1.04 330 17 15.18 50.03 2.57 433 287°C, 31.0 bars 0.67 209 12 11.45 23.98 1.35 430 287°C, 366 bars 0.99 248 13 14.83 36.72 2.00 428 287°C, 681 bars 0.99 279 15 13.76 38.37 2.07 427 287°C. 965 bars 1.19 371 22 18.52 68.62 4.08 421 300°C. 41.4 bars 0.78 165 9 11.32 18.69 1.06 437 316°C, 58.2 bars 0.63 108 8 11.66 12.64 0.92 450 333°C, 80.8 bars 0.63 69 5 12.70 8.77 0.64 463 350°C, 118 bars 0.52 25 4 15.54 3.91 0.65 582 350°C, 442 bars 0.51 27 2 15.34 4.18 0.29 575 350°C. 782 bars 0.48 29 3 14.98 4.31 0.41 578 350°C, 1077 bars 0.59 62 3 13.76 8.49 0.38 466 375°C, 132 bars 0.45 10 2 16.57 1.67 0.27 585 400°C, 144 bars 0.41 6 1 17.58 1.12 0.21 598 425°C, 160 bars 0.36 3 2 18.00 0.46 0.34 599 425°C. 551 bars 0.36 6 2 17.21 1.05 0.26 598 450°C, 190 bars 0.31 2 1 16.62 0.26 0.17
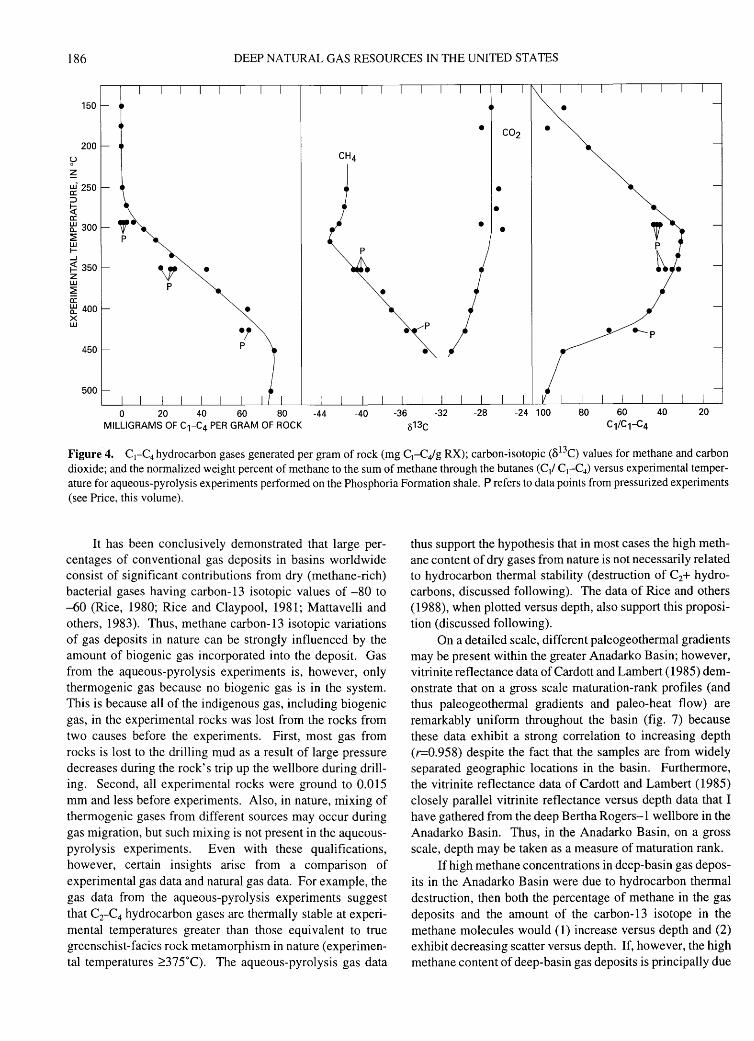
186 DEEP NATURAL GAS RESOURCES IN THE UNITED STATES
150
• • 200
~ ~ ~-250 • :J
~ • 0::
' ~ 300 ::iE p w
• • I- p ....J
~ 350
"' • z w p ::iE • ~ ~ 400 • X w
._p
450
500
0 20 40 60 80 -44 -40 -36 -32 -28 -24 100 80 60 40 20
MILLIGRAMS OF C1-C4 PER GRAM OF ROCK o13c c 1;c1-c4
Figure 4. C1-C4 hydrocarbon gases generated per gram of rock (mg C1-Cig RX); carbon-isotopic (813C) values for methane and carbon dioxide; and the normalized weight percent of methane to the sum of methane through the butanes (C/ C1-C4) versus experimental temperature for aqueous-pyrolysis experiments performed on the Phosphoria Formation shale. Prefers to data points from pressurized experiments (see Price, this volume).
It has been conclusively demonstrated that large percentages of conventional gas deposits in basins worldwide consist of significant contributions from dry (methane-rich) bacterial gases having carbon-13 isotopic values of -80 to -60 (Rice, 1980; Rice and Claypool, 1981; Mattavelli and others, 1983 ). Thus, methane carbon-13 isotopic variations of gas deposits in nature can be strongly influenced by the amount of biogenic gas incorporated into the deposit. Gas from the aqueous-pyrolysis experiments is, however, only thermogenic gas because no biogenic gas is in the system. This is because all of the indigenous gas, including biogenic gas, in the experimental rocks was lost from the rocks from two causes before the experiments. First, most gas from rocks is lost to the drilling mud as a result of large pressure decreases during the rock's trip up the well bore during drilling. Second, all experimental rocks were ground to 0.015 mm and less before experiments. Also, in nature, mixing of thermogenic gases from different sources may occur during gas migration, but such mixing is not present in the aqueouspyrolysis experiments. Even with these qualifications, however, certain insights arise from a comparison of experimental gas data and natural gas data. For example, the gas data from the aqueous-pyrolysis experiments suggest that CrC4 hydrocarbon gases are thermally stable at experimental temperatures greater than those equivalent to true greenschist-facies rock metamorphism in nature (experimental temperatures ~375°C). The aqueous-pyrolysis gas data
thus support the hypothesis that in most cases the high methane content of dry gases from nature is not necessarily related to hydrocarbon thermal stability (destruction of C2+ hydrocarbons, discussed following). The data of Rice and others (1988), when plotted versus depth, also support this proposition (discussed following).
On a detailed scale, different paleogeothermal gradients may be present within the greater Anadarko Basin; however, vitrinite reflectance data of Cardott and Lambert ( 1985) demonstrate that on a gross scale maturation-rank profiles (and thus paleogeothermal gradients and paleo-heat flow) are remarkably uniform throughout the basin (fig. 7) because these data exhibit a strong correlation to increasing depth (r=0.958) despite the fact that the samples are from widely separated geographic locations in the basin. Furthermore, the vitrinite reflectance data of Cardott and Lambert ( 1985) closely parallel vitrinite reflectance versus depth data that I have gathered from the deep Bertha Rogers-1 well bore in the Anadarko Basin. Thus, in the Anadarko Basin, on a gross scale, depth may be taken as a measure of maturation rank.
If high methane concentrations in deep-basin gas deposits in the Anadarko Basin were due to hydrocarbon thermal destruction, then both the percentage of methane in the gas deposits and the amount of the carbon-13 isotope in the methane molecules would (1) increase versus depth and (2) exhibit decreasing scatter versus depth. If, however, the high methane content of deep-basin gas deposits is principally due

CONVENTIONAL AND UNCONVENTIONAL GAS RESOURCE BASES 187
-50
-48
-46
-44
L.U z <( :::c tu -42 ~ u
(")
7o -40
+
• • .. • • • .. , • •
• • • • J;. • J;. • • •
• .: • .. \ .. -+e • •• •
•• •• • • • •
•• J;.+ ••
+
Figure 5. <3 13C for methane, versus volume percent ratio of methane to methane+ ethane+ propane +butanes
(C / C1-C4), for produced natural gases of the Anadarko Basin. Data from Rice and others (1988) .
•• c: EXPLANATION -38 •
• Central Basin
Ji. Sooner Trend •
-36 + Panhandle-Hugoton
-34
-32
-50
~ -46 0 1-0 ~
6 -42 co a: <( u L.U
~ -38 :::c 1-L.U
~
-34
•
1.0
100
0.9 0.8
FIELD OF DATA OF RICE AND OTHERS (1988)
HYDROCARBON GENERATION 300
250
398
~
377
90 80 70 60 VOLUME PERCENT METHANE
50
Figure 6. <313C for methane versus volume percent ratio of methane to methane+ethane+propane+butanes (C/ C1-C4) for produced natural gases of the Anadarko Basin (Rice and others, 1988) and for hydrocarbon gases generated in aqueous-pyrolysis experiments performed on the Phosphoria Formation shale. Numbers are experimental temperatures CC); arrows indicate trends in the experimental data.
0.7
to condensation-buoyancy-migration processes, then only the percentage of methane in the gas deposits would demonstrate a significant increase versus depth; methane carbon isotopes would not necessarily become heavier with increasing depth. Methane content would increase versus depth because increasing fluid pressure would cause increasing condensation of C2+ hydrocarbon gases into a liquid-oil phase. That liquid phase could then be displaced to shallower traps by Gussow's (1954) principle of differential entrapment as more methane entered the deeper reservoir. In figure 8, at depths of 3,657 m (12,000 ft) and deeper (and especially beyond 4,270 m, 14,000 ft), there is a pronounced trend of increasing methane content in the gases whether one chooses the dashed or solid envelope. Furthermore, below 4,270 m ( 14,000 ft), the amount of scatter in the data significantly decreases versus depth. At 3,657 m (12,000 ft) and deeper, however, the methane S13c values exhibit significant scatter and do not demonstrate a pronounced trend of becoming less negative with increase in depth. Thus, the data of figure 8 suggest that the characteristics of high-rank gas deposits in the deep Anadarko Basin are not related solely, or perhaps even significantly, to hydrocarbon thermal destruction. Furthermore, trends in the methane compositional data of figure 8 (with the exception of a few data

188 DEEP NATURAL GAS RESOURCES IN THE UNITED STATES
2
3
~ 4 w 1-w ~ 0 Q 5 z :r:' h:: ~ 6
7
8
9
N ci
\ \ \ \ \ \ Cardott and Lambert \ (1985)
\ \
' .. \ . \ \ . \ . + \~
\ \
't • \ . \.-•
\ \ \ \
/\ Bertha Rogers-1 \
* ~\ + +\ •
\ \ \ \
\+ \ -tl,
\ ,._ EXPLANATION +\
\ • Cardott and Lambert (1985) \
+ Bertha Rogers-! \
co ci
1.0 0 ~ N
0 tO
\ \
0 ci
MEAN VITRINITE REFLECTANCE, IN PERCENT
4,000
8,000
12,000
1-w w Ll..
16,000 ~
20,000
24,000
28,000
32,000
:r:' 1-Q._ w 0
Figure 7. Vitrinite reflectance, versus depth, for the Lower Mississippian and Upper Devonian Woodford Shale for samples from Anadarko Basin (dots and solid line) from the data of Cardott and Lambert (1985). Vitrinite reflectance data from Bertha Rogers-1 (crosses and dashed line) shown for comparison. The dashed line has a correlation coefficient of r:=0.989 to the crosses. The solid line has a correlation coefficient of r:=0.958 to the dots.
points indicated by arrows) behave as would be expected if condensation-buoyancy-migration processes were primarily responsible for the compositional characteristics of the deeply buried high-rank gases.
The three deep sample points (indicated by arrows, fig. 8) are exceptions to the trend of increasing methane content with increasing depth and may offer some insight into the natural system. First, the elevated amounts of C2+ hydrocarbons and moderately negative o13c values in these three samples both argue against an origin of these gases from hydrocarbon thermal destruction. Second, the model for gases of condensation, separation by buoyancy, and
migration as discussed above a priori assumes laterally continuous migration paths for the hydrocarbons. In such cases, after a trap is filled with methane, the displaced oil (including C2+ hydrocarbons condensed in the liquid phase) would migrate to a shallower trap, updip from the original trap. If, however, the original trap becomes isolated from a lateral migration path (a closed system) and has no updip outlet, then the trap would quickly become overpressured, could not accept more fluid migration into it, and could not expel fluids from it, thus retaining abnormally high concentrations of C2+ gases for the trap depth. If the sample set compiled by Rice and others (1988) is a valid representation of all gas deposits in the Anadarko Basin, and there is no reason to think that it is not, then by the preceding reasoning, most gas deposits in the basin would belong to laterally continuous migration paths (relatively open systems), and only a minority of gas deposits would be isolated closed systems. The deep (7 ,300 m, R0 =3.50 percent) oil deposit intersected by the Lonestar Baden-1 wellbore (Stahl, 1974) (discussed earlier) is another example of a closed or isolated trap that prevented gas flushing of reservoired C2+ hydrocarbons.
Comparison of carbon isotopes (fig. 9) of methanes generated in aqueous-pyrolysis experiments performed on rocks containing six different types of organic matter (see Price, this volume), table 1, to the data of Rice and others (1988) (figs. 5, 8) provides further insight into the natural system. Figure 9 shows that carbon isotopic values for methane from the different rocks at a given temperature vary widely. The Eocene Green River Shale (type I organic matter), the Los Angeles Basin mid-Miocene shale, and the lignite (type IV /III organic matter) are, however, atypical source rocks. The organic matter in shale from the Mississippian-Devonian Bakken Formation, the Phosphoria Shale (except for its highly sulfur rich nature), and the Pennsylvanian Anna Shale is more representative of a typical marine source rock. In the experimental temperature range over which Cis+ hydrocarbon generation occurs in these rocks (250°C-333°C), methane carbon isotopes range only from -43.3 to -40.0. Methane carbon isotopic experimental data from other source rocks are necessary before more trustworthy conclusions can be drawn. As a first approximation, however, let us expand the o13c range of values for methane from these three rocks slightly from -43.4 to -40.0 to a range of -44.5 to -39.0 and take this latter range of values as representative of methane carbon isotopic values for methane generated during mainstage Cis+ hydrocarbon generation from typical marine source rocks. These limits, when applied to the data of Rice and others (1988) (figs. 5, 8), permit several speculative hypotheses.
First, methane in figures 5 and 8 that has o13C values more negative than -44.5 either would be derived from unusual organic matter types or would be mixed with biogenic methane, and I prefer the second possibility. Schoell (1983, his fig. 1) tentatively set the range of o13c values for associated methane gas (methane cogenerated with oil) from
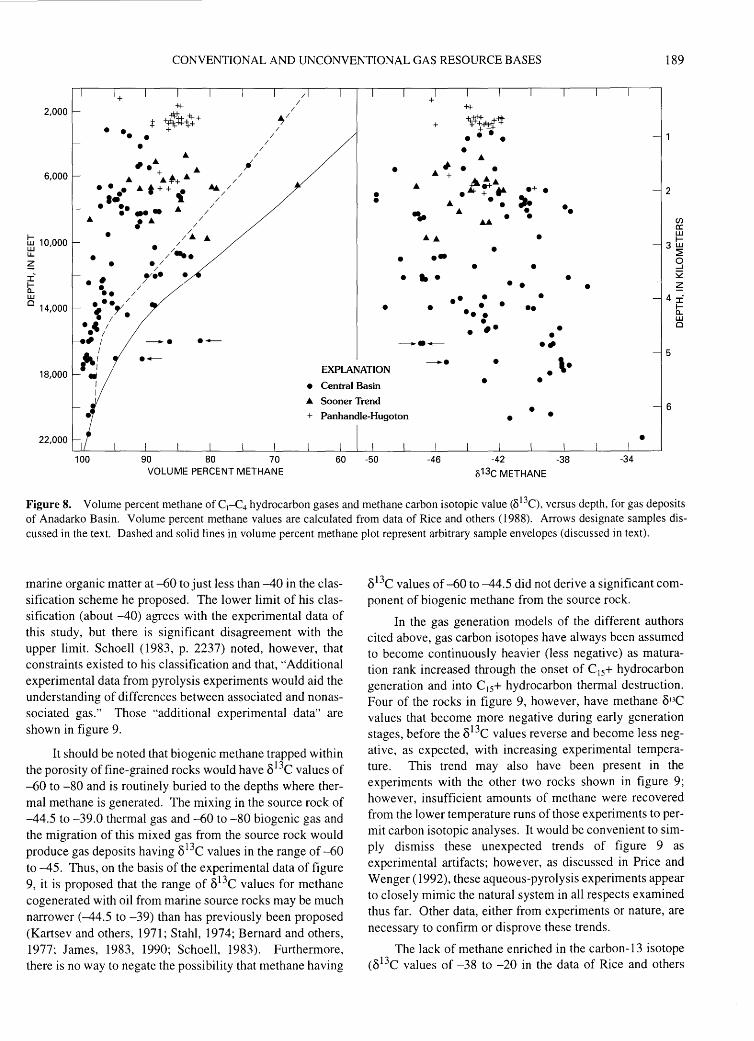
CONVENTIONAL AND UNCONVENTIONAL GAS RESOURCE BASES 189
2,000
6,000
ti:i 10,000 UJ 1.1..
z ::r:' h: UJ 0
14,000
+f·
+ ~:J:I:tt+ • •• • +
• /
"
•
--· ·-·-
/
/ /
/ ;/
/ /
/
• •
•
•
+
... • •• •••
•
--·----·
-++ «#-t-¢
-1;~ • • • •
• • •
• • •• • • • •• • • •
• • ••
•
• • •
• •
• • ·-•
2
(/) cr: UJ
3ti:i ~ 0 _J
S2 z
4 ::r:'
5
h: UJ 0
18,000 EXPLANATION • \• • Central Basin
.&. Sooner Trend
• • 6 • • •
22,000 • 100 90 80 70 60 -50 -46 -42 -38 -34
VOLUME PERCENT METHANE o13c METHANE
Figure 8. Volume percent methane ofC1-C4 hydrocarbon gases and methane carbon isotopic value (813C), versus depth, for gas deposits of Anadarko Basin. Volume percent methane values are calculated from data of Rice and others (1988). Arrows designate samples discussed in the text. Dashed and solid lines in volume percent methane plot represent arbitrary sample envelopes (discussed in text).
marine organic matter at -60 to just less than -40 in the classification scheme he proposed. The lower limit of his classification (about -40) agrees with the experimental data of this study, but there is significant disagreement with the upper limit. Schoell (1983, p. 2237) noted, however, that constraints existed to his classification and that, ·'Additional experimental data from pyrolysis experiments would aid the understanding of differences between associated and nonassociated gas." Those "additional experimental data" are shown in figure 9.
It should be noted that biogenic methane trapped within the porosity of fine-grained rocks would have 813C values of -60 to -80 and is routinely buried to the depths where thermal methane is generated. The mixing in the source rock of -44.5 to -39.0 thermal gas and -60 to -80 biogenic gas and the migration of this mixed gas from the source rock would produce gas deposits having 813C values in the range of -60 to -45. Thus, on the basis of the experimental data of figure 9, it is proposed that the range of 813C values for methane cogenerated with oil from marine source rocks may be much narrower (-44.5 to -39) than has previously been proposed (Kartsev and others, 1971; Stahl, 197 4; Bernard and others, 1977; James, 1983, 1990; Schoell, 1983). Furthermore, there is no way to negate the possibility that methane having
813C values of -60 to -44.5 did not derive a significant component of biogenic methane from the source rock.
In the gas generation models of the different authors cited above, gas carbon isotopes have always been assumed to become continuously heavier (less negative) as maturation rank increased through the onset of C 15+ hydrocarbon generation and into C 15+ hydrocarbon thermal destruction. Four of the rocks in figure 9, however, have methane 813C values that become more negative during early generation stages, before the 813C values reverse and become less negative, as expected, with increasing experimental temperature. This trend may also have been present in the experiments with the other two rocks shown in figure 9; however, insufficient amounts of methane were recovered from the lower temperature runs of those experiments to permit carbon isotopic analyses. It would be convenient to simply dismiss these unexpected trends of figure 9 as experimental artifacts; however, as discussed in Price and Wenger (1992), these aqueous-pyrolysis experiments appear to closely mimic the natural system in all respects examined thus far. Other data, either from experiments or nature, are necessary to confirm or disprove these trends.
The lack of methane enriched in the carbon-13 isotope (813C values of -38 to -20 in the data of Rice and others
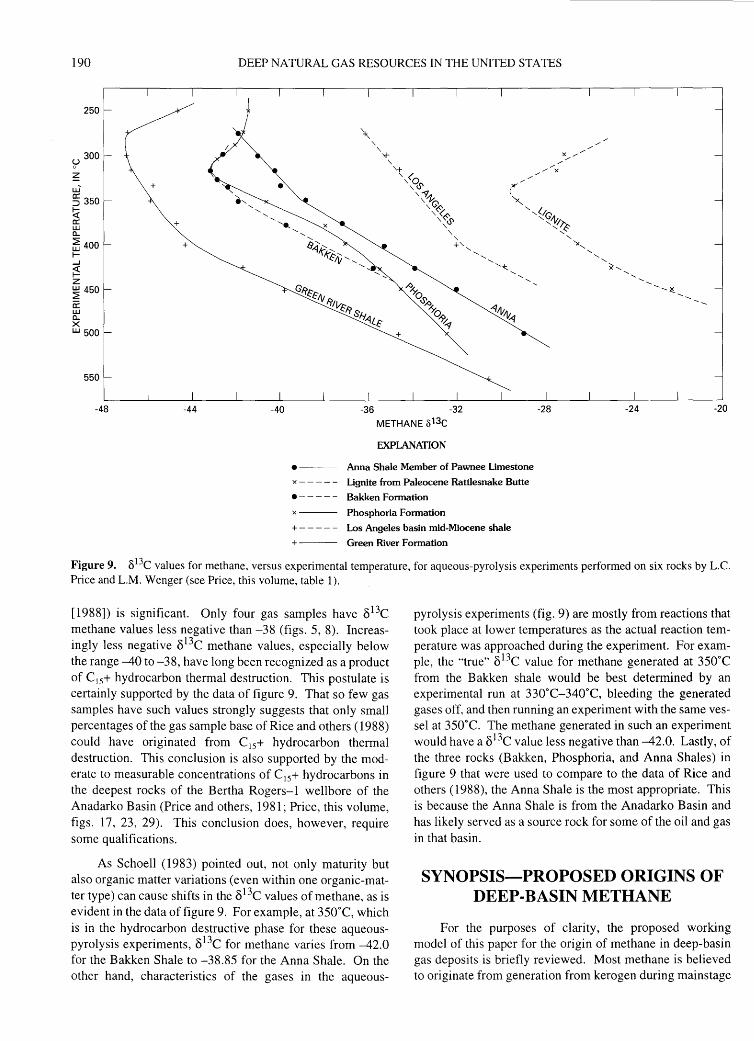
190 DEEP NATURAL GAS RESOURCES IN THE UNITED STATES
250
~ 300
~ u.i +
~ 350 ~ 0:: UJ [l.
~ 400 1-....J
~ z ~ 450 a: UJ [l.
>< UJ 500
550
-48 -44 -40 -36 -32 -28 -24 -20
METHANE o13c
EXPLANATION
• --- Anna Shale Member of Pawnee Limestone
x - - - - - Lignite from Paleocene Rattlesnake Butte
•----- Bakken Formation
x --- Phosphoria Formation
+- - - - - Los Angeles basin mid-Miocene shale
+ --- Green River Formation
Figure 9. 813C values for methane, versus experimental temperature, for aqueous-pyrolysis experiments performed on six rocks by L.C. Price and L.M. Wenger (see Price, this volume, table 1).
[1988]) is significant. Only four gas samples have 813c methane values less negative than -38 (figs. 5, 8). Increasingly less negative 813C methane values, especially below the range -40 to -38, have long been recognized as a product of C1s+ hydrocarbon thermal destruction. This postulate is certainly supported by the data of figure 9. That so few gas samples have such values strongly suggests that only small percentages of the gas sample base of Rice and others (1988) could have originated from C 1s+ hydrocarbon thermal destruction. This conclusion is also supported by the moderate to measurable concentrations of C1s+ hydrocarbons in the deepest rocks of the Bertha Rogers- I wellbore of the Anadarko Basin (Price and others, 1981; Price, this volume, figs. 17, 23, 29). This conclusion does, however, require some qualifications.
As Schoell (1983) pointed out, not only maturity but also organic matter variations (even within one organic-matter type) can cause shifts in the 813C values of methane, as is evident in the data of figure 9. For example, at 350°C, which is in the hydrocarbon destructive phase for these aqueouspyrolysis experiments, 813C for methane varies from -42.0 for the Bakken Shale to -38.85 for the Anna Shale. On the other hand, characteristics of the gases in the aqueous-
pyrolysis experiments (fig. 9) are mostly from reactions that took place at lower temperatures as the actual reaction temperature was approached during the experiment. For example, the "true" 813C value for methane generated at 350°C from the Bakken shale would be best determined by an experimental run at 330°C-340°C, bleeding the generated gases off, and then running an experiment with the same vessel at 350°C. The methane generated in such an experiment would have a 813C value less negative than -42.0. Lastly, of the three rocks (Bakken, Phosphoria, and Anna Shales) in figure 9 that were used to compare to the data of Rice and others ( 1988), the Anna Shale is the most appropriate. This is because the Anna Shale is from the Anadarko Basin and has likely served as a source rock for some of the oil and gas in that basin.
SYNOPSIS-PROPOSED ORIGINS OF DEEP-BASIN METHANE
For the purposes of clarity, the proposed working model of this paper for the origin of methane in deep-basin gas deposits is briefly reviewed. Most methane is believed to originate from generation from kerogen during mainstage
CONVENTIONAL AND UNCONVENTIONAL GAS RESOURCE BASES 191
Cis+ hydrocarbon generation. Methane carbon isotopes, from one organic matter type, so generated are expected to have a narrow ( -3 to -6) range; however, the trend of carbon isotopic values versus increase in maturation rank is unclear because experimental data in the early generation stages have trends opposite from those of previously proposed models. With increasing rank, increasing amounts of methane are generated. Significant amounts of methane are generated during the middle to last stages of hydrocarbon generation.
Significant contributions of biogenic methane also are likely present in many gas deposits that otherwise have a thermogenic origin. This biogenic methane is trapped in source rocks at shallow depths and then buried to much greater depths where it mixes in situ in the source rock with newly generated thermogenic methane and is expelled from the rock as a mixed gas. This process is probably more important than the mixing of thermogenic and biogenic methane from two separate sources to form gas deposits.
By the models of this paper, very little methane is believed to originate from thermal destruction of oil in a reservoir. In some basins, true high-rank methane deposits that have originated from CIs+ hydrocarbon thermal destruction do exist; however, such examples are unusual, and the methane of such deposits has distinct carbon-isotopic signatures. Furthermore, the methane of such deposits is thought mainly to have originated from thermal destruction of Cis+ hydrocarbons in fine-grained rocks.
It is believed that substantial amounts of high-rank methane are generated from kerogen in fine-grained rocks at high maturation levels after mainstage Cis+ hydrocarbon generation has occurred but while the kerogen still has low to moderate Rock-Eval hydrogen index values, which are remnant fro~ higher values. The maturation levels at which this generation is envisioned to occur range from R0 =4.0 or 5.0 percent to 7.0 or 8.0 percent.
SOURCE-ROCK EXPULSION OF GASES
It is a principal hypothesis of this paper that in-reservoir thermal destruction of C2+ hydrocarbons (and oil) has, with some exceptions, resulted in only a small percentage of the methane in deep-basin, high-rank dry-gas deposits. Instead, most dry-gas deposits are believed to originate by processes involving hydrocarbon condensation, buoyancy, and migration that act on hydrocarbon gases produced during main-stage oil generation in source rocks, gases that are possibly mixed with biogenic methane. If this indeed is the case, then understanding expulsion of hydrocarbon gases from source rocks could aid understanding the distribution of high-rank conventional and unconventional gas deposits in deep basins more so than predictions from regional
basinal maturity trends. Indeed, site-specific prediction for deep-basin, high-rank gas deposits may even be possible. Clearly hydrocarbon gases, especially methane, are much more mobile than oil. Thus, many constraints applicable to oil expulsion do not directly apply to gas expulsion; however, some of the same rules may at least partly apply.
Previously, most petroleum geochemists, including myself, considered hydrocarbon expulsion to be a very efficient process with the result that most generated hydrocarbons (75-95 percent in organic-rich rocks) were thought to migrate from their source rocks (Price, this volume). These conclusions were drawn because of the large decrease in the hydrocarbon-generation capacity of source rocks, as reflected by decreasing Rock-Eval hydrogen index values, as a given source rock was progressively buried deeper in a basin. These hydrogen index decreases are never matched, however, by numerically equivalent increases in either Soxhlet-extractable hydrocarbons or the Rock-Eval SI pyrolysis peak, both of which tend to exhibit rather constant values versus depth. Thus, we petroleum geochemists, by and large, concluded that hydrocarbon expulsion is very efficient because almost all generated hydrocarbons clearly leave the source rocks. As discussed by Price and LeFever ( 1992), however, very little, if any, of the oil in the conventional Mississippian mid-Madison reservoirs of the Williston Basin is from the Bakken shales. This fact leads to the hypothesis that hydrocarbon expulsion is actually quite inefficient, at least in this case. Furthermore, as discussed in Price and LeFever (1992), most generated hydrocarbons probably are lost to the drilling mud during the cutting chip or core trip up the well bore during drilling operations. Thus, the high apparent efficiencies of hydrocarbon expulsion previously called for are due in reality to efficient loss of generated hydrocarbons to drilling muds. A strong association of increasing basin richness regarding conventional oil deposits versus intensity of faulting in the hydrocarbon kitchens of deep basins was noted by Price (1994) (table 2). Price ( 1994) attributed this association as evidence of the absolute prerequisite that major faulting (with accompanying major fracturing) is necessary to physically disrupt organic-rich source rocks such that generated hydrocarbons can be freed for expulsion and form conventional oil deposits.
Even though gas is significantly more mobile than oil, it is possible, and perhaps probable, that significant faulting of mature and postmature source rocks is also necessary before highly efficient expulsion of generated hydrocarbon gases can occur. Thus, it is a hypothesis of this paper that a rule of thumb may exist regarding location and occurrence of deep-basin, high-rank conventional and nonconventional gas deposits. Such deposits, by the models developed in this paper, should always be associated with a major fault that has disrupted mature and postmature source rocks to allow expulsion of hydrocarbon gases. Structures not associated
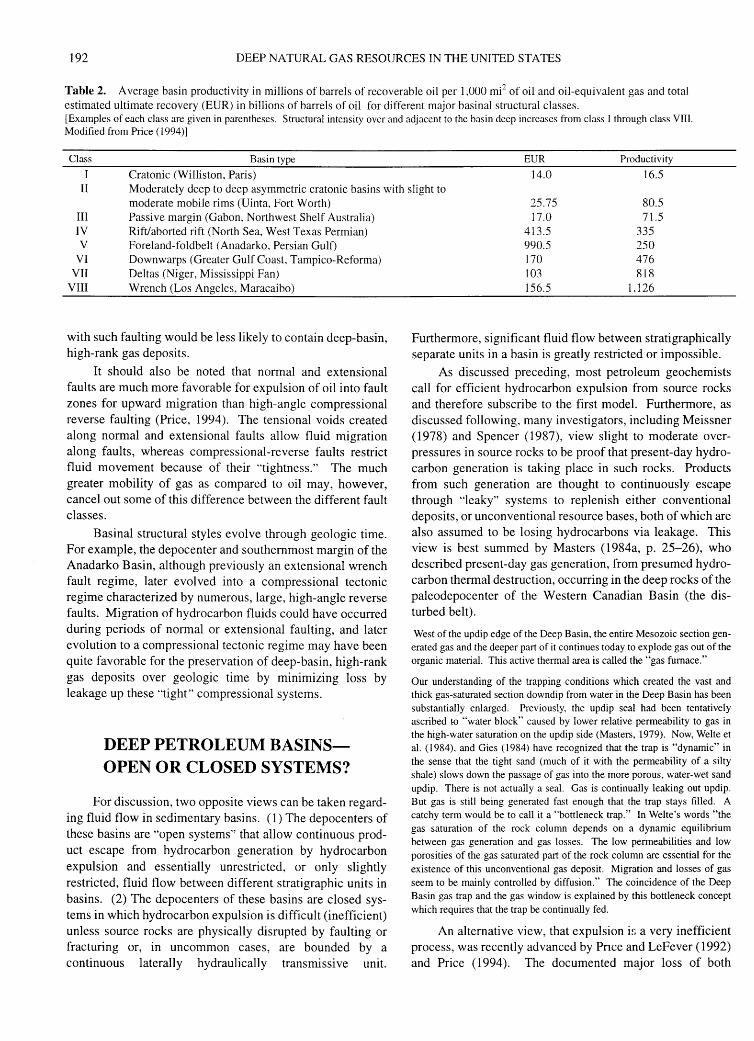
192 DEEP NATURAL GAS RESOURCES IN THE UNITED STATES
Table 2. Average basin productivity in millions of barrels of recoverable oil per 1,000 m(~ of oil and oil-equivalent gas and total estimated ultimate recovery (EUR) in billions of barrels of oil for different major basinal structural classes. [Examples of each class are given in parentheses. Structural intensity over and adjacent to the basin deep increases from class I through class VIII. Modified from Price (1994)]
Class Basin type EUR Productivity
I Cratonic (Williston, Paris) 14.0 16.5 II Moderately deep to deep asymmetric cratonic basins with slight to
moderate mobile rims (Uinta, Fort Worth) III Passive margin (Gabon. Northwest Shelf Australia) IV Rift/aborted rift (North Sea, West Texas Permian) v Foreland-foldbelt (Anadarko, Persian Gulf)
VI Downwarps (Greater Gulf Coast, Tampico-Reforma) VII Deltas (Niger, Mississippi Fan)
VIII Wrench (Los Angeles, Maracaibo)
with such faulting would be less likely to contain deep-basin, high-rank gas deposits.
It should also be noted that normal and extensional faults are much more favorable for expulsion of oil into fault zones for upward migration than high-angle compressional reverse faulting (Price, 1994). The tensional voids created along normal and extensional faults allow fluid migration along faults, whereas compressional-reverse faults restrict fluid movement because of their "tightness." The much greater mobility of gas as compared to oil may, however, cancel out some of this difference between the different fault classes.
Basinal structural styles evolve through geologic time. For example, the depocenter and southernmost margin of the Anadarko Basin, although previously an extensional wrench fault regime, later evolved into a compressional tectonic regime characterized by numerous, large, high-angle reverse faults. Migration of hydrocarbon fluids could have occurred during periods of normal or extensional faulting, and later evolution to a compressional tectonic regime may have been quite favorable for the preservation of deep-basin, high-rank gas deposits over geologic time by minimizing loss by leakage up these "tight" compressional systems.
DEEP PETROLEUM BASINSOPEN OR CLOSED SYSTEMS?
For discussion, two opposite views can be taken regarding fluid flow in sedimentary basins. (1) The depocenters of these basins are "open systems" that allow continuous product escape from hydrocarbon generation by hydrocarbon expulsion and essentially unrestricted, or only slightly restricted, fluid flow between different stratigraphic units in basins. (2) The depocenters of these basins are closed systems in which hydrocarbon expulsion is difficult (inefficient) unless source rocks are physically disrupted by faulting or fracturing or, in uncommon cases, are bounded by a continuous laterally hydraulically transmissive unit.
25.75 80.5 17.0 71.5
413.5 335 990.5 250 170 476 103 818 156.5 1.126
Furthermore, significant fluid flow between stratigraphically separate units in a basin is greatly restricted or impossible.
As discussed preceding, most petroleum geochemists call for efficient hydrocarbon expulsion from source rocks and therefore subscribe to the first model. Furthermore, as discussed following, many investigators, including Meissner (1978) and Spencer (1987), view slight to moderate overpressures in source rocks to be proof that present-day hydrocarbon generation is taking place in such rocks. Products from such generation are thought to continuously escape through "leaky" systems to replenish either conventional deposits, or unconventional resource bases, both of which are also assumed to be losing hydrocarbons via leakage. This view is best summed by Masters (1984a, p. 25-26), who described present-day gas generation, from presumed hydrocarbon thermal destruction, occurring in the deep rocks of the paleodepocenter of the Western Canadian Basin (the disturbed belt).
West of the updip edge of the Deep Basin, the entire Mesozoic section generated gas and the deeper part of it continues today to explode gas out of the organic material. This active thermal area is called the "gas furnace."
Our understanding of the trapping conditions which created the vast and thick gas-saturated section downdip from water in the Deep Basin has been substantially enlarged. Previously, the updip seal had been tentatively ascribed ro "water block'' caused by lower relative permeability to gas in the high-water saturation on the updip side (Masters, 1979). Now, Welte et al. (1984), and Gies (1984) have recognized that the trap is "dynamic" in the sense that the tight sand (much of it with the permeability of a silty shale) slows down the passage of gas into the more porous, water-wet sand updip. There is not actually a seal. Gas is continually leaking out updip. But gas is still being generated fast enough that the trap stays filled. A catchy term would be to call it a "bottleneck trap." In Welte's words "the gas saturation of the rock column depends on a dynamic equilibrium between gas generation and gas losses. The low permeabilities and low porosities of the gas saturated part of the rock column are essential for the existence of this unconventional gas deposit. Migration and losses of gas seem to be mainly controlled by diffusion." The coincidence of the Deep Basin gas trap and the gas window is explained by this bottleneck concept which requires that the trap be continually fed.
An alternative view, that expulsion i~ a very inefficient process, was recently advanced by Pnce and LeFever (1992) and Price (1994). The documented major loss of both
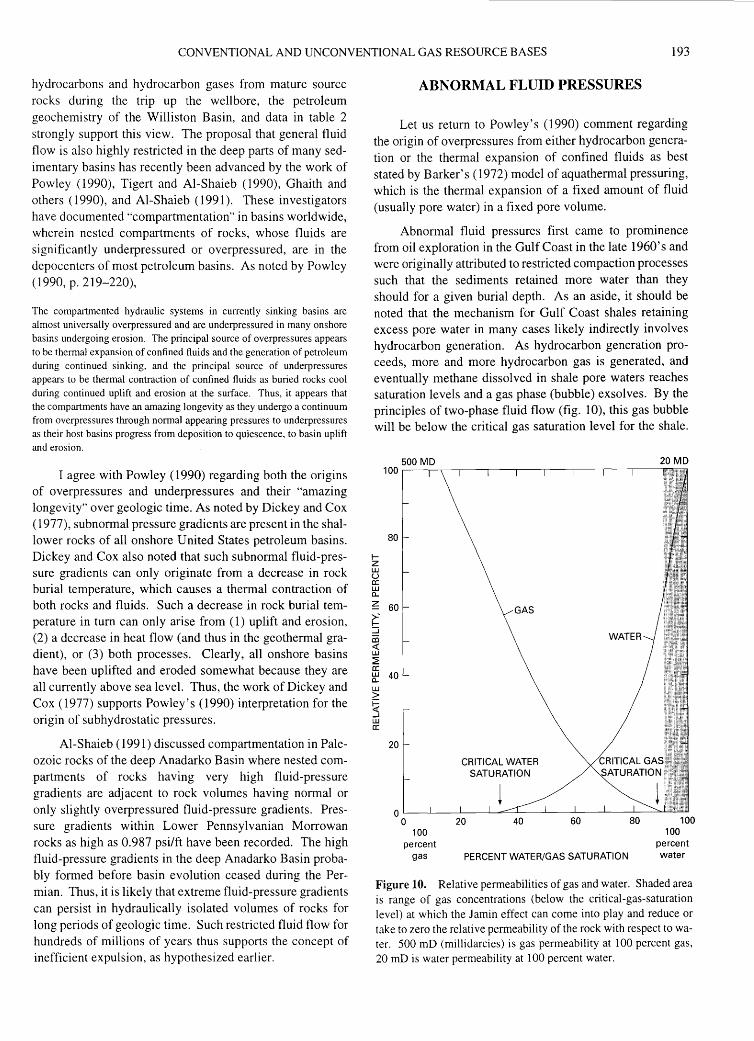
CONVENTIONAL AND UNCONVENTIONAL GAS RESOURCE BASES 193
hydrocarbons and hydrocarbon gases from mature source rocks during the trip up the wellbore, the petroleum geochemistry of the Williston Basin, and data in table 2 strongly support this view. The proposal that general fluid flow is also highly restricted in the deep parts of many sedimentary basins has recently been advanced by the work of Powley (1990), Tigert and Al-Shaieb (1990), Ghaith and others (1990), and Al-Shaieb (1991 ). These investigators have documented "compartmentation" in basins worldwide, wherein nested compartments of rocks, whose fluids are significantly underpressured or overpressured, are in the depocenters of most petroleum basins. As noted by Powley (1990, p. 219-220),
The compartmented hydraulic systems in currently sinking basins are almost universally overpressured and are underpressured in many onshore basins undergoing erosion. The principal source of overpressures appears to be thermal expansion of confined fluids and the generation of petroleum during continued sinking. and the principal source of underpressures appears to be thermal contraction of confined fluids as buried rocks cool during continued uplift and erosion at the surface. Thus, it appears that the compartments have an amazing longevity as they undergo a continuum from overpressures through normal appearing pressures to underpressures as their host basins progress from deposition to quiescence. to basin uplift and erosion.
I agree with Powley (1990) regarding both the origins of overpressures and underpressures and their "amazing longevity" over geologic time. As noted by Dickey and Cox ( 1977), subnormal pressure gradients are present in the shallower rocks of all onshore United States petroleum basins. Dickey and Cox also noted that such subnormal fluid-pressure gradients can only originate from a decrease in rock burial temperature, which causes a thermal contraction of both rocks and fluids. Such a decrease in rock burial temperature in tum can only arise from (1) uplift and erosion, (2) a decrease in heat flow (and thus in the geothermal gradient), or (3) both processes. Clearly, all onshore basins have been uplifted and eroded somewhat because they are all currently above sea level. Thus, the work of Dickey and Cox ( 1977) supports Pow ley's ( 1990) interpretation for the origin of subhydrostatic pressures.
Al-Shaieb (1991) discussed compartmentation in Paleozoic rocks of the deep Anadarko Basin where nested compartments of rocks having very high fluid-pressure gradients are adjacent to rock volumes having normal or only slightly overpressured fluid-pressure gradients. Pressure gradients within Lower Pennsylvanian Morrowan rocks as high as 0.987 psi/ft have been recorded. The high fluid-pressure gradients in the deep Anadarko Basin probably formed before basin evolution ceased during the Permian. Thus, it is likely that extreme fluid-pressure gradients can persist in hydraulically isolated volumes of rocks for long periods of geologic time. Such restricted fluid flow for hundreds of millions of years thus supports the concept of inefficient expulsion, as hypothesized earlier.
ABNORMAL FLUID PRESSURES
Let us return to Powley's (1990) comment regarding the origin of overpressures from either hydrocarbon generation or the thermal expansion of confined fluids as best stated by Barker's (1972) model of aquathermal pressuring, which is the thermal expansion of a fixed amount of fluid (usually pore water) in a fixed pore volume.
Abnormal fluid pressures first came to prominence from oil exploration in the Gulf Coast in the late 1960's and were originally attributed to restricted compaction processes such that the sediments retained more water than they should for a given burial depth. As an aside, it should be noted that the mechanism for Gulf Coast shales retaining excess pore water in many cases likely indirectly involves hydrocarbon generation. As hydrocarbon generation proceeds, more and more hydrocarbon gas is generated, and eventually methane dissolved in shale pore waters reaches saturation levels and a gas phase (bubble) exsolves. By the principles of two-phase fluid flow (fig. 10), this gas bubble will be below the critical gas saturation level for the shale.
I-z UJ u 0: UJ 0..
~ ~-::::J co <( UJ ~ 0: UJ 0.. UJ > ~ _I
UJ 0:
80
60
40
20
GAS
CRITICAL WATER SATURATION
oL_~ ____ L_ __ ~~~--~--~---L---L--~
100 100
percent water
0 100
percent gas
20 40 60 80
PERCENT WATER/GAS SATURATION
Figure 10. Relative permeabilities of gas and water. Shaded area is range of gas concentrations (below the critical-gas-saturation level) at which the Jamin effect can come into play and reduce or take to zero the relative permeability of the rock with respect to water. 500 mD (millidarcies) is gas permeability at 100 percent gas, 20 mD is water permeability at 100 percent water.
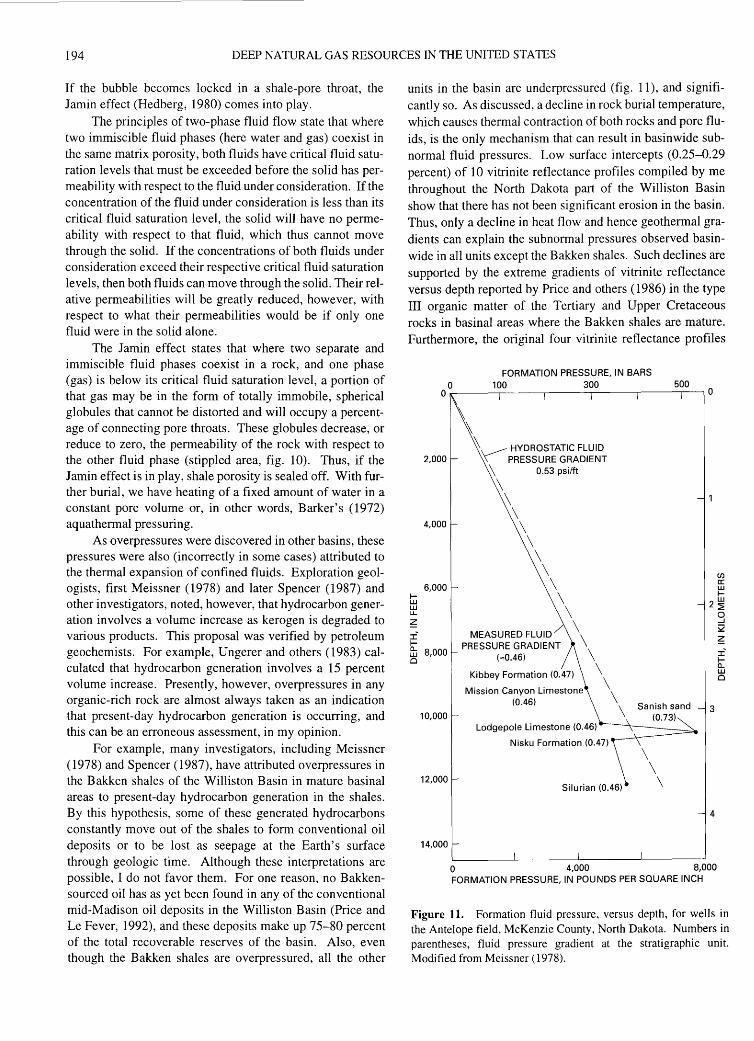
194 DEEP NATURAL GAS RESOURCES IN THE UNITED STATES
If the bubble becomes locked in a shale-pore throat, the Jamin effect (Hedberg, 1980) comes into play.
The principles of two-phase fluid flow state that where two immiscible fluid phases (here water and gas) coexist in the same matrix porosity, both fluids have critical fluid saturation levels that must be exceeded before the solid has permeability with respect to the fluid under consideration. If the concentration of the fluid under consideration is less than its critical fluid saturation level, the solid will have no permeability with respect to that fluid, which thus cannot move through the solid. If the concentrations of both fluids under consideration exceed their respective critical fluid saturation levels, then both fluids can move through the solid. Their relative permeabilities will be greatly reduced, however, with respect to what their permeabilities would be if only one fluid were in the solid alone.
The Jamin effect states that where two separate and immiscible fluid phases coexist in a rock, and one phase (gas) is below its critical fluid saturation level, a portion of that gas may be in the form of totally immobile, spherical globules that cannot be distorted and will occupy a percentage of connecting pore throats. These globules decrease, or reduce· to zero, the permeability of the rock with respect to the other fluid phase (stippled area, fig. 10). Thus, if the Jamin effect is in play, shale porosity is sealed off. With further burial, we have heating of a fixed amount of water in a constant pore volume or, in other words, Barker's (1972) aquathermal pressuring.
As overpressures were discovered in other basins, these pressures were also (incorrectly in some cases) attributed to the thermal expansion of confined fluids. Exploration geologists, first Meissner (1978) and later Spencer (1987) and other investigators, noted, however, that hydrocarbon generation involves a volume increase as kerogen is degraded to various products. This proposal was verified by petroleum geochemists. For example, Ungerer and others (1983) calculated that hydrocarbon generation involves a 15 percent volume increase. Presently, however, overpressures in any organic-rich rock are almost always taken as an indication that present-day hydrocarbon generation is occurring, and this can be an erroneous assessment, in my opinion.
For example, many investigators, including Meissner (1978) and Spencer (1987), have attributed overpressures in the Bakken shales of the Williston Basin in mature basinal areas to present-day hydrocarbon generation in the shales. By this hypothesis, some of these generated hydrocarbons constantly move out of the shales to form conventional oil deposits or to be lost as seepage at the Earth's surface through geologic time. Although these interpretations are possible, I do not favor them. For one reason, no Bakkensourced oil has as yet been found in any of the conventional mid-Madison oil deposits in the Williston Basin (Price and Le Fever, 1992), and these deposits make up 75-80 percent of the total recoverable reserves of the basin. Also, even though the Bakken shales are overpressured, all the other
units in the basin are underpressured (fig. 11), and significantly so. As discussed, a decline in rock burial temperature, which causes thermal contraction of both rocks and pore fluids, is the only mechanism that can result in basinwide subnormal fluid pressures. Low surface intercepts (0.25-0.29 percent) of 10 vitrinite reflectance profiles compiled by me throughout the North Dakota part of the Williston Basin show that there has not been significant erosion in the basin. Thus, only a decline in heat flow and hence geothermal gradients can explain the subnormal pressures observed basinwide in all units except the Bakken shales. Such declines are supported by the extreme gradients of vitrinite reflectance versus depth reported by Price and others ( 1986) in the type III organic matter of the Tertiary and Upper Cretaceous rocks in basinal areas where the Bakken shales are mature. Furthermore, the original four vitrinite reflectance profiles
fLU L.U u.
~ ::r:' fa.. L.U 0
2,000
4,000
6,000
FORMATION PRESSURE, IN BARS
~-----10~0----~------3~00 ____________ 5,00 ___ 0
\ ~
\....----HYDROSTATIC FLUID \\ PRESSURE GRADIENT
\ 0.53 psi/ft
\ \ \ \ \ \ \ \
(/) a: L.U f-\
\ 2~
MEASURED FLUID \\ PRESSURE GRADIENT \
("'0.46)
\
Lodgepole Limestone (0.46)
\ \ \
Silurian (0.46)
3
4
0 4,000 8,000 FORMATION PRESSURE, IN POUNDS PER SQUARE INCH
0 ...J
~
~ :::c' fa.. L.U 0
Figure 11. Formation fluid pressure, versus depth, for wells in the Antelope field, McKenzie County, North Dakota. Numbers in parentheses, fluid pressure gradient at the stratigraphic unit. Modified from Meissner (1978).
CONVENTIONAL AND UNCONVENTIONAL GAS RESOURCE BASES 195
of Price and others (1986) have been corroborated by six newer, unpublished profiles. Although the Williston Basin still is quite warm, present-day geothermal gradients would have to be at least doubled to account for the observed gradients. If paleo geothermal gradients were at least halved, all ongoing hydrocarbon generation would immediately stop, by any time-temperature-dependent hydrocarbon-generation model. Although the Bakken shales are overpressured, the pressure gradients in those shales are generally lower than gradients reported by Spencer ( 1987) for other Rocky Mountain basins and are lower still than those in coastal or offshore petroleum basins that are clearly at their maximal geothermal gradients. It is my interpretation that the current overpressures in the Bakken shales are lower than they were before basin cooling occurred. Furthermore, I also postulate that the current overpressures have been retained in the Bakken shales through geologic time because of the model advocated herein of restricted fluid movement and inefficient source-rock expulsion in the depocenters of petroleum basins, a model supported by the investigations of Powley and co-workers. In my opinion, moderate fluid overpressures (::;0.7-0.8 psi/ft) in organic-rich rocks are not necessarily explained only by present-day hydrocarbon generation. Such pressures can also be explained as due to decayed values from much higher paleo-fluid-pressure gradients that were the result of intense hydrocarbon generation at the time of maximal heat flow in a basin. Today's moderate fluid pressures would have been retained over geologic time because of the model of (closed system) limited fluid flow in deep petroleum basins as advocated herein. Indeed, the moderate fluid pressure gradients in the Bakken shales may be taken as further evidence of the model.
ALBERTA BASIN-CENTERED GAS DEPOSIT
The basin-centered gas deposit of the Western Canadian (Alberta) Basin depocenter is another case where investigators have called for present-day hydrocarbon generation and concurrent migration through an open hydrocarbon-generation system (Gies, 1984; Masters, 1984a, b), mainly because of petroleum-geochemical studies of Welte and others (1984) in the basin. This present-day hydrocarbon generation has been proposed in spite of the fact that the gas deposit is at subnormal pressures. Various other investigators, including Hacquebard and Donaldson ( 197 4 ), Hacque bard (1975), Magara (1986), Hutcheon and others (1980), Kalkreuth and McMechan (1988), and Tilley and others (1989), have provided evidence for, and (or) discussed, the extensive erosion that has taken place in the Western Canadian sedimentary basin. The amount of erosion increases on a trend southwestward from the Canadian plains, past the disturbed belt, into the present-day deep basin, and lastly into the ancestral deep basin (present-day Rocky Mountains). Evidence for this erosion comes from
studies of fluid inclusions, coal rank, shale and sandstone diagenesis and metamorphism, and vitrinite reflectance. Estimates of erosion range from 1,000 m of sediment or less from the Canadian plains to as much as 6,000 m of sediment from the Rocky Mountains. As an example, Hutcheon and others ( 1980) calculated that rocks in the Elk Valley and Mount Allan areas (southeastern British Columbia and southwestern Alberta), at present -day depths of 0-1,000 m, had paleotemperatures of 180°C-250°C.
Vitrinite-reflectance profiles from the Elmworth gas field and other areas of the present-day deep Alberta Basin have surface intercepts of Ra=0.7±0.1 percent. In the absence of erosion, regardless of time-temperature burial history considerations, vitrinite-reflectance profiles should have surface intercepts of R0 =0.25-0.29 percent. Whether one uses the vitrinite-reflectance paleothermometer of Price (1983) or of Barker and Pawlewicz (1986), surface intercepts of 0. 7±0.1 percent imply decreases in sediment burial temperatures of at least 100°C. No current functional petroleum-geochemical model of hydrocarbon generation allows significant continued hydrocarbon generation after decreases in burial temperatures of 100°C or more.
Hydrocarbon generation, by all currently accepted petroleum-geochemical models known to me, is driven principally by increases in burial temperature, with lesser contributions from other controlling parameters (such as geologic time), depending on the model. The dominant control of burial temperature is due to the progressively stronger bonds in kerogen that must be broken by increasingly higher burial temperatures for hydrocarbon generation to proceed. Thus, burial temperature decreases of 100°C would preclude any possibility of hydrocarbon generation continuing because, once the weaker bonds are broken at a given burial temperature, the bonds cannot be rejuvenated; they have been destroyed.
In my opinion, there are two other major flaws with the conclusion of Welte and others (1984) that present-day dry gas generation is occurring in the deep Alberta Basin. First, I am not aware of any investigators, other than Welte and others ( 1984 ), who call for significant hydrocarbon generation from underpressured rocks. Second, the very evidence that Welte and others ( 1984) call on to support their model of present-day methane generation and loss via updip diffusion to the surface is the evidence that conclusively demonstrates that their proposed model is flawed. Welte and others ( 1984) found that rocks at 2,350-2,450 m of burial, whether coal ( :::::80 percent total organic carbon) or shale (::::: 1.0 percent total organic carbon), had the same ethane concentration when normalized to rock total organic carbon (5-6x10⁴ nanograms of ethane per gram rock organic carbon). They interpreted these "equal concentrations" of ethane as due to diffusion in order to support their model. Diffusion of hydrocarbon gases occurs, however, in watersaturated rock porosity and has nothing to do with the organic carbon content of the rocks in which diffusion is
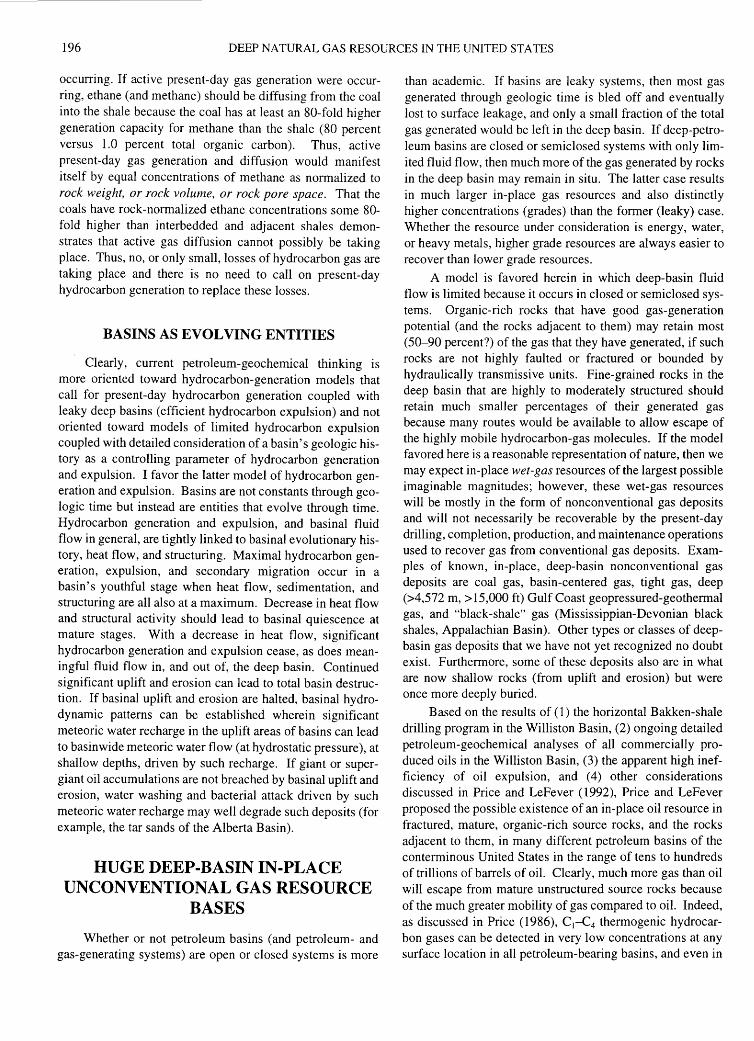
196 DEEP NATURAL GAS RESOURCES IN THE UNITED STATES
occurring. If active present-day gas generation were occurring, ethane (and methane) should be diffusing from the coal into the shale because the coal has at least an 80-fold higher generation capacity for methane than the shale (80 percent versus 1.0 percent total organic carbon). Thus, active present-day gas generation and diffusion would manifest itself by equal concentrations of methane as normalized to rock weight, or rock volume, or rock pore space. That the coals have rock-normalized ethane concentrations some 80-fold higher than interbedded and adjacent shales demonstrates that active gas diffusion cannot possibly be taking place. Thus, no, or only small, losses of hydrocarbon gas are taking place and there is no need to call on present-day hydrocarbon generation to replace these losses.
BASINS AS EVOLVING ENTITIES
Clearly, current petroleum-geochemical thinking is more oriented toward hydrocarbon-generation models that call for present-day hydrocarbon generation coupled with leaky deep basins (efficient hydrocarbon expulsion) and not oriented toward models of limited hydrocarbon expulsion coupled with detailed consideration of a basin's geologic history as a controlling parameter of hydrocarbon generation and expulsion. I favor the latter model of hydrocarbon generation and expulsion. Basins are not constants through geologic time but instead are entities that evolve through time. Hydrocarbon generation and expulsion, and basinal fluid flow in general, are tightly linked to basinal evolutionary history, heat flow, and structuring. Maximal hydrocarbon generation, expulsion, and secondary migration occur in a basin's youthful stage when heat flow, sedimentation, and structuring are all also at a maximum. Decrease in heat flow and structural activity should lead to basinal quiescence at mature stages. With a decrease in heat flow, significant hydrocarbon generation and expulsion cease, as does meaningful fluid flow in, and out of, the deep basin. Continued significant uplift and erosion can lead to total basin destruction. If basinal uplift and erosion are halted, basinal hydrodynamic patterns can be established wherein significant meteoric water recharge in the uplift areas of basins can lead to basinwide meteoric water flow (at hydrostatic pressure), at shallow depths, driven by such recharge. If giant or supergiant oil accumulations are not breached by basinal uplift and erosion, water washing and bacterial attack driven by such meteoric water recharge may well degrade such deposits (for example, the tar sands of the Alberta Basin).
HUGE DEEP-BASIN IN-PLACE UNCONVENTIONAL GAS RESOURCE
BASES
Whether or not petroleum basins (and petroleum- and gas-generating systems) are open or closed systems is more
than academic. If basins are leaky systems, then most gas generated through geologic time is bled off and eventually lost to surface leakage, and only a small fraction of the total gas generated would be left in the deep basin. If deep-petroleum basins are closed or semiclosed systems with only limited fluid flow, then much more of the gas generated by rocks in the deep basin may remain in situ. The latter case results in much larger in-place gas resources and also distinctly higher concentrations (grades) than the former (leaky) case. Whether the resource under consideration is energy, water, or heavy metals, higher grade resources are always easier to recover than lower grade resources.
A model is favored herein in which deep-basin fluid flow is limited because it occurs in closed or semi closed systems. Organic-rich rocks that have good gas-generation potential (and the rocks adjacent to them) may retain most (50-90 percent?) of the gas that they have generated, if such rocks are not highly faulted or fractured or bounded by hydraulically transmissive units. Fine-grained rocks in the deep basin that are highly to moderately structured should retain much smaller percentages of their generated gas because many routes would be available to allow escape of the highly mobile hydrocarbon-gas molecules. If the model favored here is a reasonable representation of nature, then we may expect in-place wet-gas resources of the largest possible imaginable magnitudes; however, these wet-gas resources will be mostly in the form of nonconventional gas deposits and will not necessarily be recoverable by the present-day drilling, completion, production, and maintenance operations used to recover gas from conventional gas deposits. Examples of known, in-place, deep-basin nonconventional gas deposits are coal gas, basin-centered gas, tight gas, deep (>4,572 m, > 15,000 ft) Gulf Coast geopressured-geothermal gas, and "black-shale" gas (Mississippian-Devonian black shales, Appalachian Basin). Other types or classes of deepbasin gas deposits that we have not yet recognized no doubt exist. Furthermore, some of these deposits also are in what are now shallow rocks (from uplift and erosion) but were once more deeply buried.
Based on the results of (I) the horizontal Bakken-shale drilling program in the Williston Basin, (2) ongoing detailed petroleum-geochemical analyses of all commercially produced oils in the Williston Basin, (3) the apparent high inefficiency of oil expulsion, and ( 4) other considerations discussed in Price and LeFever (1992), Price and LeFever proposed the possible existence of an in-place oil resource in fractured, mature, organic-rich source rocks, and the rocks adjacent to them, in many different petroleum basins of the conterminous United States in the range of tens to hundreds of trillions of barrels of oil. Clearly, much more gas than oil will escape from mature unstructured source rocks because of the much greater mobility of gas compared to oil. Indeed, as discussed in Price (1986), C1-C4 thermogenic hydrocarbon gases can be detected in very low concentrations at any surface location in all petroleum-bearing basins, and even in

CONVENTIONAL AND UNCONVENTIONAL GAS RESOURCE BASES 197
many petroleum-barren basins, by a variety of surfacegeochemical exploration methods. Such thermogenic hydrocarbon gases at the Earth's surface both (1) result from the much greater mobility of hydrocarbon gases compared to oil and (2) result in a substantial loss of generated hydrocarbon gases through geologic time. Source rocks are certainly more chemically open systems (easier product escape) with respect to hydrocarbon gases than to oils; however, in spite of this it is probable that monstrous, nonconventional, inplace gas resources also are present in different forms in different basins. These nonconventional in-place gas resources may parallel the nonconventional oil resource proposed by Price and LeFever (1992).
Examples of such large, nonconventional, in-place gas resources are the basin-centered gas deposits of the San Juan, Denver, and Western Canadian sedimentary basins (and yet undiscovered basin-centered gas deposits in other basins); known tight-sand gas deposits in various American onshore basins; coal-gas deposits actively being exploited in different American basins, especially the San Juan Basin; and the (currently noneconomic) geopressured-geothermal gas-resource base of the Gulf Coast (and other basins). That mud-gas logging values always dramatically increase when mature organic-rich rocks, and the rocks immediately adjacent to them, are penetrated by the drill bit is strong evidence of the ubiquity of such gas resources. These in-place gas resource bases are present in different forms: (1) gas dissolved in the high-temperature pore water of deep-basin sands and shales; (2) free-gas bubbles in concentrations below, at, or above the critical-gas-saturation levels for the stratigraphic units in which the gas bubbles reside; (3) small noneconomic traces or pockets (shows) of free gas dispersed throughout the rocks of sedimentary basins; ( 4) gases absorbed in coals; and (5) gases absorbed on the kerogen of shales or dissolved in free bitumen in mature source rocks. Furthermore, the sizes of the different in-place gas resource bases are, to say the least, very large. For example, Law and others (1989) estimated that the in-place gas resource of only the coarse-grained rocks in the Greater Green River Basin is between 3,611 and 6,837 TCF, and Masters (1984a) estimated that the in-place gas resource in the Canadian Alberta Basin (deep basin and adjacent foothills belt) is 3,600 TCF.
Although dispersed in-place hydrocarbon gas-resource bases in all probability exist, and their size may be beyond imaginable calculations, unless at least a small fraction of a resource base can be recovered, its existence and size are only of academic interest. It is my opinion that successful (economic) recovery of such unconventional gas resources is not solely a geologic problem but depends more on the development of new drilling, stimulation, production, and maintenance techniques that are applicable to the nonclassical characteristics of the particular nonconventional gasresource base under consideration. For example, experience with attempted economic recovery of the nonconventional oil resource of the self-sourced, fractured Bakken shales
clearly demonstrates that application of conventional drilling, completion, production, and maintenance techniques to that resource has not been successful. As another example, economic recovery of coal gas is only made possible by first producing substantial water from coals (and adjacent rocks). This greatly lowers formation fluid pressures and allows a free-gas phase to either form or increase in volume (or both). As such, the critical-gas-saturation level of the coal (fig. 1 0) is exceeded to a point that the permeability of the formation with respect to a free-gas phase is significantly increased. Formation of a free-gas phase allows the coal gas to flow toward the well bore in meaningful (economic) amounts. Attempted recovery of the coal-gas resource by conventional production techniques would only lead to economic failure and a condemnation of the resource as "uneconomic." It must be stressed that this principle also applies to other unconventional gas and oil resources.
For example, hundreds of millions of dollars have been spent to demonstrate that geopressured-geothermal gas in the Gulf Coast cannot be economically produced by producing sandstone brines from moderate depths of 3,048-4,572 m (10,000-15,000 ft) and bringing those brines to the Earth's surface for extraction of dissolved methane. It was predicted (Price, 1978a, b; Paul Jones, unpublished research) that such a recovery technique would not be economic. Economic recovery of an essentially infinite geopressured-geothermal gas resource appears possible, however, in the Gulf Coast from rocks at greater depths than those being utilized by the current geopressured-geothermal research effort. Deeper rocks ( 1) have more immobile free gas bubbles at or below critical-gas-saturation levels for those formations; (2) have much higher concentrations of hydrocarbon gases dissolved in sandstone and shale-pore water from the higher burial temperatures and higher (abnormal) fluid pressures at depth; and (3) are much further into intense hydrocarbon (and hydrocarbon gas) generation, thus providing more gas to be recovered. Economic recovery of the deep geopressured-geothermal gas resource can likely be accomplished by production techniques similar to those used to recover the dispersed gas resource from coals: removal of sufficient volumes of deep formation waters to greatly lower fluid pressure in deep formations and therefore greatly increase free gas mobility leading to an in situ recovery, as opposed to surface extraction, of the deep Gulf Coast geopressured gas-resource base (L.C. Price and Paul Jones, unpublished research).
As a last example of the nonclassical characteristics of the nonconventional gas resources let us assume that many deep, high-rank gas deposits are in water-free reservoirs (as discussed following). If this is the case, then introduction of any water to those rocks during drilling, completion, or maintenance operations would set the principles of twophase fluid flow and the Jamin effect into play. This, in turn, could create around the wellbore a skin effect of greatly reduced permeability with respect to gas, such that

198 DEEP NATURAL GAS RESOURCES IN THE UNITED STATES
the gas-productive capabilities immediately around the wellbore were greatly reduced or even destroyed, which in turn would destroy production economics. This could lead to a condemnation of the well and the prospect, and perhaps the play as a whole. It is thus a major recommendation of this paper that it is critical to determine (1) if some (many?) deep-basin reservoirs are water-free systems, and (2) if this is the case, whether extensive formation (skin) damage can occur around the wellbore in some water-free, deep-basin gas reservoirs as a result of introduction of water into them.
I conclude that essentially infinite, in-place, unconventional gas-resources can be proven from further geologic and geochemical research; however, evidence is sufficient that perhaps we can take these in-place hydrocarbon gasresources as a given. Research having more potential impact would be to determine if appropriate drilling, completion, stimulation, and maintenance techniques can be developed, techniques that are applicable to the different characteristics of the different unconventional, in-place gas-resource bases. Thus, I recommend that research be instituted to determine (1) the extent of the large in-place wet-gas resources known to be present; (2) the grade (concentration) of the various gas resources; and (3) the controlling parameters of the different nonconventional gas resources. If large, high-grade, in-place gas resources do exist, and in my considered scientific opinion they do, then economic recovery of such gas resources should become a research focus. Economic recovery of such gas resources will depend on the development of nonconventional drilling, completion, stimulation, production, and maintenance techniques that are uniquely applicable to the nonclassical characteristics of each of the different gas resources.
NEED FOR RESEARCH ON UNCONVENTIONAL ENERGY
RESOURCE BASES OF THE UNITED STATES
No matter which resource assessment model or published study is used, most of the large conventional American oil fields to be discovered have already been discovered, with possible exceptions of undiscovered North Slope (coastal), Santa Barbara Channel, and deep-water Gulf Coast fields. It is also well established that the Persian Gulf Basin contains the bulk of the world's conventionally producible oil. Even if another American Prudhoe Bay were discovered, it would only forestall the inevitable, an increasing dependence on the Middle East for American energy requirements. In my opinion, the only currently foreseeable chance the United States has to avoid this situation is to conduct research into the possible commercial productivities of our known, in-place nonconventional mobile gas (and oil, Price and LeFever, 1992) resources. Nonconventional gas resources-the basincentered gas deposits of the San Juan, Denver, and Western
Canadian Basins, and coal gas from numerous basins, but especially the San Juan Basin-already make significant contributions to energy needs of the United States. There is no apparent reason why properly designed research could not delineate the appropriate techniques that must be utilized for commercial recovery of other nonconventional gas and oil resources. Such research should not be designed and carried out from a conventional mind set because exploitation of unconventional gas and oil resources will be difficult or impossible to achieve by conventional thought patterns. As Masters (1984b, p. ix) noted, discussing the basin-centered Elm worth gas field of the Western Canadian Basin,
Finding a giant Deep Basin-type gas field is technologically relatively simple, although statistically very rare. Exploiting such a field, however, calls upon some of the most advanced reservoir technology available and requires an unusual amount of coordination between the geological and engineering arms of a company. It is virtually impossible for one man to have all the skills required to analyze, measure, and produce these low-permeability, high-damage reservoirs. so a chain-link team of specialists must be available. Few companies have built, or can hold together, such teams. Perhaps the most significant contribution of this memoir, in fact, is its description of the several areas of expertise that must necessarily bond together in the exploitation of a major Deep Basin-type gas field.
It must be stressed that, with the large-scale departure of the American major oil companies from domestic onshore exploration, funding of research regarding unconventional energy resources may have to come from elsewhere, such as the Federal Government and (or) institutions such as the Gas Research Institute or American Gas Association, all of whom have a vested interest in production of gas resources of the United States.
The United States still has a strong base of domestic independent oil-exploration companies, and in reality the expertise of these companies may be America's most valuable "energy resource," although with time this base also will erode. These companies historically have been the last true onshore "wildcatters," commonly having explorationists ready to aggressively pursue new exploration concepts or plays. For example, these companies played the key role in development of the coal-gas resource (along with an independent-minded American major, Amoco oil) and also played key roles in the attempted commercial recovery of fractured-shale oil resources of the Bakken shales in the Williston Basin and from other source rocks in other basins. If research were successful into optimum recovery techniques for unconventional gas and oil resources, American independent oil companies would aggressively pursue development of those resources.
DISCUSSION
FRACTURES VERSUS POROSITY
Price (this volume) provided evidence that methane is thermally stable to depths (maturation ranks) beyond those that can be reached by current drilling technology. Thus, the

CONVENTIONAL AND UNCONVENTIONAL GAS RESOURCE BASES 199
question as to the possible existence of conventional, or nonconventional, deep-basin, high-rank gas deposits partly centers on whether or not adequate porosity and permeability persist, at great depths and high ranks to hold such gas. The Tuscaloosa sandstones of the Tuscaloosa trend gas fields (Smith, 1985) are an example of abnormally high porosities and permeabilities (20-25 percent, 1-2 darcies), even though these sandstones have measured vitrinite reflectance values of 2.0-2.2 percent (Price, 1991 ). Furthermore, a similar example may be in the "Flex Trend" gas fields of offshore Texas. Possible controlling parameters and characteristics of deep-basin, high-rank sandstone porosities have been examined by other investigators on this project. It is unlikely, however, that our understanding of the deepbasinal processes that preserve or destroy porosity will be sufficient in the near future such that correct pre-drill, sitespecific predictions can routinely be made concerning highrank porosity preservation.
On the other hand, the question of porosity preservation to great depth and high ranks may be in part academic, depending on the role played by fractures, cracks, and the space between parting laminae of bedding. As noted by Price and LeFever (1992), the Bakken shales and adjacent rocks apparently contain between 100 and 250 billion barrels of generated oil, yet the porosities of those rocks range from 0 to 4 percent. It has been established that most of this Bakken-generated oil is in cracks, fractures, and parting laminae in the Bakken shales and adjacent rocks. It is possible that an analogous situation may exist with deep-basin gas, in that the bulk of the deep-basin gas may be similarly stored. All rocks are fractured to some extent, and different processes lead to the formation of fractures and cracks in rocks. For example, all onshore basins have been uplifted and cooled somewhat because they are now above sea level. Furthermore, in some of these basins heat flow has decreased greatly, such as, for example, on the northern rim of the San Juan Basin. During such cooling, thermal contraction of both rocks and pore fluids takes place, a contraction that would likely lead to development of tensional fractures in the cooling rocks. Once a deep-basin fracture or void formed by any such process, it might be quickly filled with gas, and this gas might keep the fracture open during subsequent geologic history. If deep-basin, high-rank gas is stored in significant volumes in fractures, parting laminae, and other nonclassical void volumes, rather than in rock porosity, then possible economic recovery of deep-basin, high-rank gas resources might in part hinge on geologic-engineering studies related to such nonclassical void volumes.
SIGNIFICANCE OF NONHYDROCARBON GASES
Carbon dioxide, hydrogen sulfide, and nitrogen are occasionally found in abundance in some gas fields in some basins. Furthermore, high concentrations of these
nonhydrocarbon gases have existed in some fields for long periods of geologic time. For example, such gases in deep traps of Western Canada would have been in those traps since Laramide (Cretaceous-Tertiary) deformation. Such gases in traps in the West Texas Permian and Anadarko basins would have been in those traps since at least the Permian. Both carbon dioxide and hydrogen sulfide strongly undergo association-disassociation reactions to ionic species (HS-, HC03-, C02=) that are extremely soluble in water. Therefore, both C02 and H2S in gas traps with a water leg would quickly be leached from the deposit and dissolved into the water phase over geologic time, probably on the order of 10,000-100,000 years. Thus, the existence of C02 or H2S in traps for tens to hundreds of millions of years dictates that ( 1) water is neither in the trap as a mobile phase nor in contact with the trap at the edge of the gas deposit and (2) such traps are closed systems with regard to fluid migration.
The absence of water in some (and possibly many) deep-basin gas traps has two important implications. First, as discussed in Price (this volume), the absence of water allows hydrocarbon thermal-destruction reactions to occur at lower temperatures than those under which such reactions normally take place with water in the system. Thus, C2+ hydrocarbon destruction and conversion to high-rank methane would be promoted in deep, water-free reservoirs. Second, as discussed above, when water is introduced into deepbasin, water-free gas reservoirs during drilling, completion, or maintenance operations, the productivity of the reservoir may be damaged or destroyed from a skin effect around the wellbore resulting from the principles of two-phase fluid flow and the J amin effect.
Thermochemical-sulfate reduction has been invoked to explain both high C02 and H2S concentrations in some gas deposits and also the origin of some of the high-rank gascondensate deposits of the Alabama-Florida panhandle area (Sassen and Moore, 1988; Claypool and Mancini, 1989). Close examination of the (1) origin of the hypothesis of thermochemical-sulfate reduction, (2) evidence for the hypothesis, and (3) geographic areas where it has been invoked to be operative strongly suggests, however, that the hypothesis has little basis in fact, even though it is commonly invoked by petroleum geochemists and geologists.
The hypothesis of thermochemical-sulfate reduction was first advanced by Orr (1974), in an elegant, welldocumented, and detailed discussion, to explain the presence of H2S and C02, sulfur content, and of Big Horn Basin oil sulfur isotopes, which become heavier (enriched in S34
) with increasing maturity. To both explain the observed variations in oil composition and support his hypothesis, Orr (1974) made three pivotal assumptions: (1) in-reservoir maturation of the oils (extensive thermal cracking of C 15+ hydrocarbons) throughout the basin at reservoir temperatures of 80°C-120°C, (2) no or minimal water washing or bacterial degradation in the oil reservoirs of the basin, and

200 DEEP NATURAL GAS RESOURCES IN THE UNITED STATES
(3) long-distance migration of an originally uniform oil, from a source to the west, to traps completely ringing the Big Horn Basin depocenter.
Regarding Orr's (1974) first assumption, the data of this study and of Price (1993a) both strongly suggest that in-reservoir maturation of oils (thermal destruction of C 1s+ hydrocarbons) at burial temperatures of 80°C-120°C is not possible. Furthermore, the hypothesis of widespread, lowtemperature (~120°C) in-reservoir maturation of oil has been fully discussed and dismissed by both Phillipi (1977) and Price (1980b), the principal conclusions of those studies being as follows: ( 1) The extreme variations in the physical characteristics of oils with increasing depth, variations cited as evidence to support the hypothesis of in-reservoir oil maturation, are better explained by crude-oil degradation (bacterial attack and water washing). (2) No firm evidence exists for in-reservoir maturation of oil. (3) Variations in maturity characteristics in undegraded oils are better explained as due to original variations inherited from hydrocarbon generation at different maturation ranks in the source rocks or to facies variations in the source rocks rather than to in-reservoir maturation.
Orr's (1974) second assumption that crude-oil degradation is at best minimal in the Big Horn Basin is, in my opinion, erroneous. Crude-oil degradation of many Big Horn Basin oils has been documented by a different investigators, including Todd (1963). Analysis of different Big Horn Basin oils by the U.S. Geological Survey (fig. 12) demonstrates decreased concentrations of lower molecular weight hydrocarbons and n-paraffins in some oils as compared to other "normal" Big Horn Basin oils. These decreases are due to water washing and bacterial attack. The reduced concentrations of C 1s- n-paraffins in the East Rozet and Prong Creek oils, as compared to those of normal oil from Cottonwood Creek (fig. 12), can only be due to biodegradation. Orr (1974) noted that the Pennsylvanian Tensleep Sandstone oil reservoirs in the Big Horn Basin crop out in the Big Horn Mountains where these reservoirs are subject to strong meteoric water recharge. More than 6,096 m (20,000 ft) of hydrodynamic head drives this meteoric water into the deep basin. The well-known inclined oil-water contacts in some of the Paleozoic reservoirs of the Big Horn Basin (Todd, 1963) are most probably due to the strong meteoric water flow throughout the basin. Orr's (197 4) assumption of no, or only minimum, oil degradation in the Big Horn Basin simply must be considered flawed given the optimum conditions for oil degradation in the basin and the fact that oil degradation is well documented there. Thus, his subsequent assumption (Orr, 1974, p. 2297) that, "Most of the oils are black asphaltic oils classed as chemically immature" that are then cracked to lighter oils is also flawed. Although not widely recognized in 1974, it is now well known that many (most?) "immature
oils" are actually degraded oils that originally were "mature'' oils.
The third assumption of long-distance migration of a "common-pool" compositionally uniform oil to the traps in the Big Horn Basin strongly contradicts actual oil distribution in the basin. As discussed in Price (1980a), Gussow (1954) and Partridge (1958) both noted that only the anticlines immediately adjacent to the depocenter of the Big Horn Basin contain oil. Anticlines nearer the mountains and removed from the depocenter, both in easterly and westerly directions, are oil barren, yet all the basinal anticlines have equivalent geologic histories. A west-to-east long-distance migration of oil would dictate that the westernmost anticlines removed from the basin deep be oil bearing, which they are not. On the other hand, a local origin of oil from the Big Horn Basin deep (Price, 1980c) would dictate that the oil be primarily in the anticlines ringing and immediately adjacent to the basin deep, which is the case.
Thus, although Orr (1974) elegantly presented his hypothesis of thermochemical-sulfate reduction using the Big Horn Basin as a model, he put unrealistic constraints on the Big Horn Basin to fit the requirements of his model. These constraints contradict known geologic and petroleumgeochemical features in this basin. Thus, in my opinion, the original type model (the Big Horn Basin) for thermochemical-sulfate reduction is, in point of fact, highly flawed.
Orr (1974) specifically detailed reaction schemes and expected products for thermochemical sulfate reduction; however, later investigations invoking the mechanism call for reaction schemes and products that are antithetic to Orr's (1974) original scheme. Furthermore, different investigators (Sassen and Moore, 1988; and Claypool and Mancini, 1989) working in the same geographic area have drawn different conclusions from both each other and Orr (1974) regarding the mechanism and its reaction products. For example, the sulfur-bearing hydrocarbons that Orr (1974) detailed as the reaction products from thermochemical-sulfate reduction are low-maturity compounds-mercaptans, thiaalkanes, cyclothiaalkanes, and thiophenes. As Orr (197 4, p. 2315) noted, "A major conclusion from this type of mechanism is that the organic-sulfur compounds in a high-temperature reservoir are not predominantly the thermally stable compounds which have survived the original oil." Also, he (p. 2316) noted that the enrichments in S34 and C13 that he observed in the Big Horn Basin oils would be due to different processes and that only increases in S34 would be due to thermochemical sulfate reduction. "The most likely mechanism for S34
enrichment requires sulfate, but sulfate availability presumably would have no direct effect on C13 enrichment."
Claypool and Mancini (1989, p. 920) called on thermochemical-sulfate reduction to explain the gas and gas-condensate compositions that they observed in Jurassic

\ ~ ""'" ""'" I
0 ""'" c
""'" 0 . .!. ""'" c \
i-1
CONVENTIONAL AND UNCONVENTIONAL GAS RESOURCE BASES 201
l.t)
""'" c
CX) > ""'" a.. • .!. a:
a..
0 C'll c
l.t) C'll c
EAST ROZET
0 M c
COTTONWOOD CREEK
0 C'll c
0 N c
l.t) C'll c
PRONG CREEK
l.t) C'll c
0 M c
Figure 12. C8+ saturated hydrocarbon gas chromatograms for three oils from Big Horn Basin. PR is pristane; PY is phytane; other isoprenoid hydrocarbons are labeled by i- and their respective carbon number; every fifth n-paraffin is labeled by n-and its respective carbon number. Other n-paraffins are labeled, by arrows if necessary.
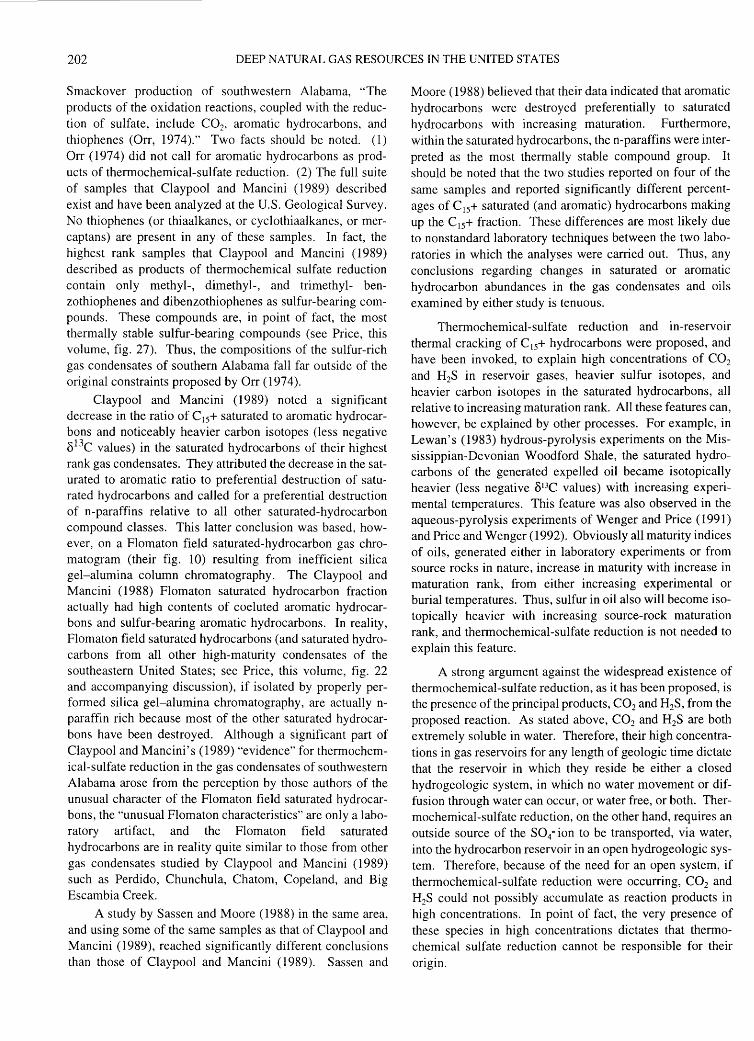
202 DEEP NATURAL GAS RESOURCES IN THE UNITED STATES
Smackover production of southwestern Alabama, "The products of the oxidation reactions, coupled with the reduction of sulfate, include C02, aromatic hydrocarbons, and thiophenes (Orr, 1974)." Two facts should be noted. (1) Orr ( 197 4) did not call for aromatic hydrocarbons as products of thermochemical-sulfate reduction. (2) The full suite of samples that Claypool and Mancini ( 1989) described exist and have been analyzed at the U.S. Geological Survey. No thiophenes (or thiaalkanes, or cyclothiaalkanes, or mercaptans) are present in any of these samples. In fact, the highest rank samples that Claypool and Mancini (1989) described as products of thermochemical sulfate reduction contain only methyl-, dimethyl-, and trimethyl- benzothiophenes and dibenzothiophenes as sulfur-bearing compounds. These compounds are, in point of fact, the most thermally stable sulfur-bearing compounds (see Price, this volume, fig. 27). Thus, the compositions of the sulfur-rich gas condensates of southern Alabama fall far outside of the original constraints proposed by Orr ( 197 4 ).
Claypool and Mancini (1989) noted a significant decrease in the ratio of C 1s+ saturated to aromatic hydrocarbons and noticeably heavier carbon isotopes (less negative 813C values) in the saturated hydrocarbons of their highest rank gas condensates. They attributed the decrease in the saturated to aromatic ratio to preferential destruction of saturated hydrocarbons and called for a preferential destruction of n-paraffins relative to all other saturated-hydrocarbon compound classes. This latter conclusion was based, however, on a Flomaton field saturated-hydrocarbon gas chromatogram (their fig. 10) resulting from inefficient silica gel-alumina column chromatography. The Claypool and Mancini (1988) Flomaton saturated hydrocarbon fraction actually had high contents of coeluted aromatic hydrocarbons and sulfur-bearing aromatic hydrocarbons. In reality, Flomaton field saturated hydrocarbons (and saturated hydrocarbons from all other high-maturity condensates of the southeastern United States; see Price, this volume, fig. 22 and accompanying discussion), if isolated by properly performed silica gel-alumina chromatography, are actually nparaffin rich because most of the other saturated hydrocarbons have been destroyed. Although a significant part of Claypool and Mancini's (1989) "evidence" for thermochemical-sulfate reduction in the gas condensates of southwestern Alabama arose from the perception by those authors of the unusual character of the Flomaton field saturated hydrocarbons, the "unusual Flomaton characteristics" are only a laboratory artifact, and the Flomaton field saturated hydrocarbons are in reality quite similar to those from other gas condensates studied by Claypool and Mancini (1989) such as Perdido, Chunchula, Chatom, Copeland, and Big Escambia Creek.
A study by Sassen and Moore (1988) in the same area, and using some of the same samples as that of Claypool and Mancini (1989), reached significantly different conclusions than those of Claypool and Mancini ( 1989). Sassen and
Moore (1988) believed that their data indicated that aromatic hydrocarbons were destroyed preferentially to saturated hydrocarbons with increasing maturation. Furthermore, within the saturated hydrocarbons, then-paraffins were interpreted as the most thermally stable compound group. It should be noted that the two studies reported on four of the same samples and reported significantly different percentages of C 1s+ saturated (and aromatic) hydrocarbons making up the C1s+ fraction. These differences are most likely due to nonstandard laboratory techniques between the two laboratories in which the analyses were carried out. Thus, any conclusions regarding changes in saturated or aromatic hydrocarbon abundances in the gas condensates and oils examined by either study is tenuous.
Thermochemical-sulfate reduction and in-reservoir thermal cracking of C 1s+ hydrocarbons were proposed, and have been invoked, to explain high concentrations of C02
and H2S in reservoir gases, heavier sulfur isotopes, and heavier carbon isotopes in the saturated hydrocarbons, all relative to increasing maturation rank. All these features can, however, be explained by other processes. For example, in Lewan's (1983) hydrous-pyrolysis experiments on the Mississippian-Devonian Woodford Shale, the saturated hydrocarbons of the generated expelled oil became isotopically heavier (less negative 813C values) with increasing experimental temperatures. This feature was also observed in the aqueous-pyrolysis experiments of Wenger and Price (1991) and Price and Wenger (1992). Obviously all maturity indices of oils, generated either in laboratory experiments or from source rocks in nature, increase in maturity with increase in maturation rank, from either increasing experimental or burial temperatures. Thus, sulfur in oil also will become isotopically heavier with increasing source-rock maturation rank, and thermochemical-sulfate reduction is not needed to explain this feature.
A strong argument against the widespread existence of thermochemical-sulfate reduction, as it has been proposed, is the presence of the principal products, C02 and H2S, from the proposed reaction. As stated above, C02 and H2S are both extremely soluble in water. Therefore, their high concentrations in gas reservoirs for any length of geologic time dictate that the reservoir in which they reside be either a closed hydrogeologic system, in which no water movement or diffusion through water can occur, or water free, or both. Thermochemical-sulfate reduction, on the other hand, requires an outside source of the S04= ion to be transported, via water, into the hydrocarbon reservoir in an open hydrogeologic system. Therefore, because of the need for an open system, if thermochemical-sulfate reduction were occurring, C02 and H2S could not possibly accumulate as reaction products in high concentrations. In point of fact, the very presence of these species in high concentrations dictates that thermochemical sulfate reduction cannot be responsible for their origin.

CONVENTIONAL AND UNCONVENTIONAL GAS RESOURCE BASES 203
With some exceptions, gas reservoirs that contain high concentrations of H2S and (or) especially C02 are most usually at high maturation ranks in basin deeps. This fact suggests that high concentrations of either or both C02 and H2S could be related to processes that occur in deep basins at high maturation ranks. For example, a review by Petroleum Information Corporation (1984) discussed both C02 release in sedimentary basins from volcanic intrusions into sedimentary rocks and C02 generation from volcanic, plutonic, or metamorphic intrusions or processes on carbonate rocks. Also, Le Tran (1972) demonstrated that high concentrations of H2S were generated at elevated maturation ranks from the sulfur-rich organic matter in the fine-grained rocks of the carbonate sequences of the southern Aquitaine Basin, France (fig. 13). It should be noted that the present-day burial depths and temperatures shown in figure 13 are not maximal for this area of the Aquitaine Basin. As summarized in Price (1983, p. 19-21), the southern Aquitaine Basin has been affected by a major orogeny, igneous intrusion, metamorphism, a highly elevated paleo-heat flow and subsequent significant erosion. The North Pyrenean fault (1) is a major crustal feature with more than 10,000 m of throw, (2) is thought to be a paleo-plate suture, (3) has been overthrust into the southern Aquitaine Basin, and ( 4) and is 5-10 km from the well that Le Tran ( 1972) studied in the giant Lacq gas field. Coustau and others (1969) carried out a detailed organic and inorganic geochemical study on the sediments of the southern Aquitaine Basin and found that paleotemperatures in this part of the basin were much higher than present-day burial temperatures. Coustau and others (1969, p. 84) concluded that Jurassic source rocks there had previously been exposed to temperatures as high as 300°C and stated, ''This early and very accentuated thermic evolution is, in our opinion, the most determining factor of the exclusive presence of gaseous hydrocarbons in the deep fields of the south of the Lacq Basin, in front of the Pyrenean chain."
Le Tran (1972) noted that (as of 1971) all known gas deposits with high concentrations of H2S are in carbonate sequences, the southern Aquitaine Basin and Upper Jurassic Smackover Formation (southeastern United States) being the most well-known examples. As discussed in Price (this volume), the latter area also has been subjected to extreme paleo-heat flows. Le Tran (1972) concluded that most of the H2S in gas deposits having high H2S concentrations originated from generation processes in fine-grained organic-rich rocks of carbonate sequences when such rocks were exposed to extreme maturation ranks. I concur completely with this hypothesis.
DATA OF WEISMAN
Weisman (1971) examined isotopic compositions of methane and carbon dioxide from the Sacramento Valley and West Texas Permian-Val Verde Basin gas fields, all of
3,000
(/)
ffi 4,000 1-w ~
~ :i 1-a.. w 0
5,000
6,000
0 20 40 60 80
EXPLANATION
• --- H2S/C (mg/g)
X ----- EXT HCS/C (mg/g)
+ --- HC GAS/C (mUg)
100
80
100
~ z w' a: ::> ~
120 ffi a.. ~ w 1-...J <( a:
140 ~
160
180
120
Figure 13. Increase in H2S sorbed on sediments in the southern Aquitaine Basin, France (stippled pattern). H2S/C is amount of sorbed H2S in milligrams per gram of organic carbon in the sediments; EXT HCS/C is milligrams of extractable bitumen per gram of organic carbon and is shown by the field of parallel lines; and HC GAS/C is milliliters of hydrocarbon gas per gram of organic carbon. All three variables are plotted versus present-day burial depth and present-day burial temperature. The boundary between Jurassic and Lower Cretaceous sediments is also shown. Modified from LeTran (1972).
which have been affected by igneous or volcanic activity. He recorded data that support his hypothesis that at very high temperatures (500°C-l ,200°C) carbon dioxide and methane equilibrate to each other (fig. 14) with respect to the carbon-13 isotope. His hypothesis is supported by data from aqueous-pyrolysis experiments (fig. 4), wherein at temperatures lower than those considered by Weisman (1971) values for both methane and carbon dioxide trend toward one another with increase in temperature. This feature could be due, however, to a strong control by the original organic matter and (or) by thermal decrepitation of calcite in the experimental rocks.
By measuring 813C values in associated methane and carbon dioxide and employing his 813C thermometer, Weisman ( 1971) documented strong increases in estimated paleotemperatures of gas fields toward intrusive plutonic
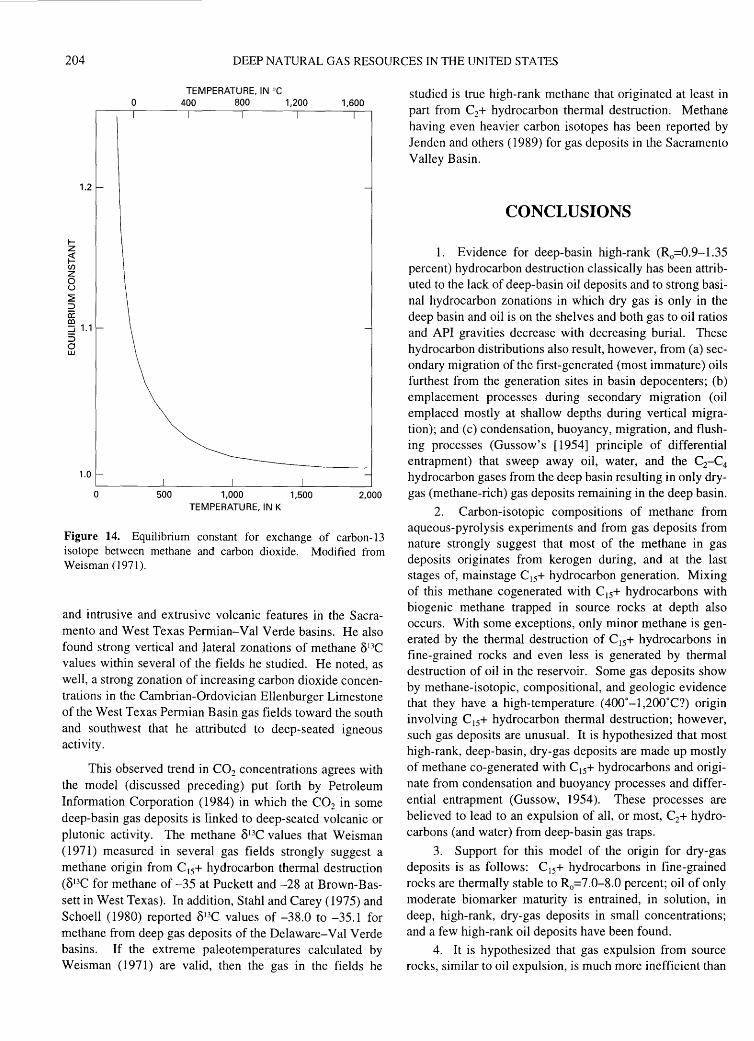
204 DEEP NATURAL GAS RESOURCES IN THE UNITED STATES
1-z ~ (J)
z 0 u ~ ::l a: co
1.2
::J 1.1 5 0 UJ
1.0
0
0
TEMPERATURE, IN oc 400 800 1 ,200 1,600
500 1 ,000 1,500 2,000 TEMPERATURE, IN K
Figure 14. Equilibrium constant for exchange of carbon-13 isotope between methane and carbon dioxide. Modified from Weisman (1971).
and intrusive and extrusive volcanic features in the Sacramento and West Texas Permian-Val Verde basins. He also found strong vertical and lateral zonations of methane 813C values within several of the fields he studied. He noted, as well, a strong zonation of increasing carbon dioxide concentrations in the Cambrian-Ordovician Ellenburger Limestone of the West Texas Permian Basin gas fields toward the south and southwest that he attributed to deep-seated igneous activity.
This observed trend in C02 concentrations agrees with the model (discussed preceding) put forth by Petroleum Information Corporation (1984) in which the C02 in some deep-basin gas deposits is linked to deep-seated volcanic or plutonic activity. The methane 813C values that Weisman ( 1971) measured in several gas fields strongly suggest a methane origin from C 15+ hydrocarbon thermal destruction (813C for methane of -35 at Puckett and -28 at Brown-Bassett in West Texas). In addition, Stahl and Carey (1975) and Schoell (1980) reported 813C values of -38.0 to -35.1 for methane from deep gas deposits of the Delaware-Val Verde basins. If the extreme paleotemperatures calculated by Weisman ( 1971) are valid, then the gas in the fields he
studied is true high-rank methane that originated at least in part from C2+ hydrocarbon thermal destruction. Methane having even heavier carbon isotopes has been reported by Jenden and others (1989) for gas deposits in the Sacramento Valley Basin.
CONCLUSIONS
1. Evidence for deep-basin high-rank (R0=0.9-1.35 percent) hydrocarbon destruction classically has been attributed to the lack of deep-basin oil deposits and to strong basinal hydrocarbon zonations in which dry gas is only in the deep basin and oil is on the shelves and both gas to oil ratios and API gravities decrease with decreasing burial. These hydrocarbon distributions also result, however, from (a) secondary migration of the first-generated (most immature) oils furthest from the generation sites in basin depocenters; (b) emplacement processes during secondary migration (oil emplaced mostly at shallow depths during vertical migration); and (c) condensation, buoyancy, migration, and flushing processes (Gussow's [1954] principle of differential entrapment) that sweep away oil, water, and the C2-C4
hydrocarbon gases from the deep basin resulting in only drygas (methane-rich) gas deposits remaining in the deep basin.
2. Carbon-isotopic compositions of methane from aqueous-pyrolysis experiments and from gas deposits from nature strongly suggest that most of the methane in gas deposits originates from kerogen during, and at the last stages of, mainstage C15+ hydrocarbon generation. Mixing of this methane cogenerated with C15+ hydrocarbons with biogenic methane trapped in source rocks at depth also occurs. With some exceptions, only minor methane is generated by the thermal destruction of C15+ hydrocarbons in fine-grained rocks and even less is generated by thermal destruction of oil in the reservoir. Some gas deposits show by methane-isotopic, compositional, and geologic evidence that they have a high-temperature (400°-1,200°C?) origin involving C15+ hydrocarbon thermal destruction; however, such gas deposits are unusual. It is hypothesized that most high-rank, deep-basin, dry-gas deposits are made up mostly of methane co-generated with C 15+ hydrocarbons and originate from condensation and buoyancy processes and differential entrapment (Gussow, 1954). These processes are believed to lead to an expulsion of all, or most, C2+ hydrocarbons (and water) from deep-basin gas traps.
3. Support for this model of the origin for dry-gas deposits is as follows: C 15+ hydrocarbons in fine-grained rocks are thermally stable to R0=7.0-8.0 percent; oil of only moderate biomarker maturity is entrained, in solution, in deep, high-rank, dry-gas deposits in small concentrations; and a few high-rank oil deposits have been found.
4. It is hypothesized that gas expulsion from source rocks, similar to oil expulsion, is much more inefficient than
CONVENTIONAL AND UNCONVENTIONAL GAS RESOURCE BASES 205
generally perceived, and thus it is believed that intense faulting and fracturing are necessary to physically disrupt source rocks so that significant expulsion of gases can occur. Thus, conventional deep-basin gas deposits should almost always be associated with major faulting. Normal and extensional faulting is most favorable for migration because of voids along the fault zones. Later evolution to compressional (high-angle reverse) faulting (such as in the Anadarko Basin in southern Oklahoma) is favorable for preservation of deep-basin gas deposits over geologic time.
5. Very large, in-place, nonconventional gas-resource bases have been proven, among which are basin-centered gas, coal gas, tight gas, black-shale gas, and Gulf Coast geopressured-geothermal gas. It is hypothesized that the existence of such unconventional gas-resource bases is primarily due to, and is direct evidence of, highly restricted (closed-system) fluid flow and inefficient hydrocarbon expulsion in deep sedimentary basins. Much of the rock volume of deep sedimentary basins is perceived to be an essentially closed system with respect to significant fluid flow once basinal evolution goes beyond the youthful stage to the mature stage and geothermal gradients decline. It is further hypothesized that these different nonconventional gas-resource bases may be both larger and of a higher grade than previously believed.
6. Additional geologic-geochemical studies to document the extent, grade, and characteristics of nonconventional gas resources would be useful. Geologic-based engineering studies to determine the appropriate techniques applicable to the nonclassical characteristics of each of these different gas resources would assist in economic recovery of these resources.
7. Cracks, fractures, parting laminae, and other such voids in deep-basin rocks may provide significant storage capacity and thus help to offset a general trend of decreasing porosity with increase in maturation rank (depth) in deep petroleum basins.
8. Both C02 and H2S are quickly (104-105 years) leached out of water-bearing deep-basin gas deposits because of their high aqueous solubilities. Thus, the presence of either of these two gases in deep-basin gas deposits dictates that such gas deposits contain no water and are closed systems with regard to fluid migration. The probability of water-free, deep-basin gas reservoirs has strong implications for enhanced thermal destruction of C 15+ hydrocarbons and possible formation (skin) damage around the wellbore during drilling, completion, and stimulation operations.
9. Although the hypothesis of thermochemical sulfate reduction has been proposed to explain high concentrations of carbon dioxide and (or) hydrogen sulfide in some highrank gas deposits, the hypothesis may be overstated. High concentrations of these nonhydrocarbon gases are believed instead to result from various high-rank processes that take place in deep petroleum basins, including plutonic activity,
volcanic intrusive and extrusive activity, and the tendency of carbonate-facies source rocks to generate significant amounts of hydrogen sulfide at very high maturation ranks.
REFERENCES CITED
Al-Shaieb, Z., 1991, Compartmentation, fluid pressure important in Anadarko exploration: Oil and Gas Journal, July 8, p. 52-55.
Barker, C., 1972, Aquathermal pressuring-Role of temperature in development of abnormal-pressure zones: American Association of Petroleum Geologists Bulletin, v. 56, p. 2068-2071.
Barker, C.E., and Pawlewicz, M.J., 1986, The correlation of vitrinite reflectance with maximum temperature in organic matter, in Buntebarth, G., and Stegna, L., eds., Paleogeothermics, Lecture Notes in Earth Sciences, v. 5: Springer-Verlag, p. 79-93.
Bernard, B.J., Brooks, J.M., and Sackett, W.M., 1977, A geochemical model for characterization of hydrocarbon gas sources: Annual Offshore Technology Conference, 9th, Preprints, v. 3, p. 435-438.
Cardott, B.J., and Lambert, M.W., 1985, Thermal maturation by vitrinite reflectance of Woodford Shale, Anadarko Basin, Oklahoma: American Association of Petroleum Geologists Bulletin, v. 69, p. 1982-1988.
Claypool, G.E., and Mancini, E.A., 1989, Geochemical relationships of petroleum in Mesozoic reservoirs to carbonate source rocks of Jurassic Smackover Formation, southwestern Alabama: American Association of Petroleum Geologists Bulletin, v. 73, p. 904-924.
Coustau, H., Gauthier, J., Kulbicki, G., and Winnock, E., 1969, Hydrocarbon distribution in the Aquitaine Basin of SW France, in Hepple, ed., The exploration for petroleum in Europe and North Africa: London, The Institute of Petroleum, p. 73-85.
Dickey, P.A., and Cox, W.C., 1977, Oil and gas reservoirs with subnormal pressures: American Association of Petroleum Geologists Bulletin, v. 61, p. 2134-2142.
Ghaith, A., Chen, W., and Ortoleva, P., 1990, Oscillatory methane release from shale source rock: Earth Science Reviews, v. 29, p. 241-248.
Gies, R.M., 1984, Case history for a major Alberta deep basin gas trap-The Cadomin Formation, in Masters, J.A., ed., Elmworth-Case study of a deep basin gas field: American Association of Petroleum Geologists Memoir 38, p. 35-47.
Gussow, W.C., 1954, Differential entrapment of oil and gas-A fundamental principle: American Association of Petroleum Geologists Bulletin, v. 38, p. 816-853.
Hacquebard, P.A., 1975, Correlation between coal rank, paleotemperature and petroleum occurrences in Alberta: Canadian Geological Survey Paper 751, part B, p. 5-8.
Hacquebard, P.A., and Donaldson, J. R., 197 4, Rank studies of coals in the Rocky Mountains and Inner Foothills Belt, Canada: Geological Society of American Special Paper 153, p. 75-94.
Hedberg, H.D., 1980, Methane generation and petroleum migration, in Roberts, W.H., and Cordell, R.J., eds., Problems of petroleum migration: American Association of Petroleum Geologists Studies in Geology 10, p. 179-206.
Horsfield, B., Schenk, H.J., Mills, N., and Welte, D.H., 1992, An investigation of the in-reservoir conversion of oil to

206 DEEP NATURAL GAS RESOURCES IN THE UNITED STATES
gas-Compositional and kinetic findings from closed-system programmed-temperature pyrolysis: Organic Geochemistry, v. 19, p. 191-204.
Hutcheon, 1., Oldershaw, A., and Ghent, E.D., 1980, Diagenesis of Cretaceous sandstones of the Kootenai Formation at Elk Valley (southeastern British Columbia) and Mt. Allan (southwestern Alberta): Geochimica et Cosmochimica Acta, v. 44, p. 1425-1435.
James, AT., 1983, Correlation of natural gas by use of carbon isotopic distribution between hydrocarbon components: American Association of Petroleum Geologists Bulletin, v. 67, p. 1176-1191.
---1990, Correlation of reservoired gases using the carbon isotopic compositions of wet gas components: American Association of Petroleum Geologists Bulletin, v. 74, p. 1141-1158.
Jenden, P.D., and Kaplan, I.R., 1989, Origin of natural gas in the Sacramento Basin, California, in Analysis of gases in the Earth's crust: Chicago, Gas Research Institute (Contract 5081-360-0533), p. A45-Al03.
Kalkreuth, W., and McMechan, M., 1988, Burial history and thermal maturity, Rocky Mountain Front Ranges, Foothills, and Foreland, East Central British Columbia and adjacent Alberta, Canada: American Association of Petroleum Geologists Bulletin,v.72,~ 1395-141Q
Kartsev, A.A., Vassoevich, N.B., Geodekian, A.A., Nerichev, S.G., and Sokolov, S.A., 1971, The principal stage in the formation of petroleum: World Petroleum Congress, 8th, Proceedings, v. 2,p.3-ll.
Law, B.E., Spencer, C.W., Charpentier, R.A., Crovelli, R.A., Mast, R.F., Dolton, G.L., and Wandrey, C.J., 1989, Estimates of gas resources in overpressured low-permeability Cretaceous and Tertiary sandstone reservoirs, Greater Green River Basin, Wyoming, Colorado, and Utah, in Gas resources of Wyoming: Wyoming Geological Association Field Conference, 40th, Guidebook, p. 36-62.
LeTran, K., 1972, Geochemical study of hydrogen sulfide absorbed in sediments, in Gaertner, H.R.V., and Bienner, F., eds., Advances in organic geochemistry 1971: New York, Pergamon Press, p. 717-726.
Lewan, M.D., 1983, Effects of thermal maturation on stable organic carbon isotopes as determined by hydrous pyrolysis of Woodford Shale: Geochimica et Cosmochimica Acta, v. 47, p. 1471-1479.
Magara, K., 1986, Thickness of removed sedimentary rocks, paleopore pressure, and paleotemperature, southwestern part of Western Canada basin: American Association of Petroleum Geologists Bulletin, v. 60, p. 554-565.
Masters, J.A., 1979, Deep basin gas trap, western Canada: American Association of Petroleum Geologists Bulletin, v. 63, p. 152-181.
---1984a, Lower Cretaceous oil and gas in western Canada, in Masters, J.A., ed., Elmworth-Case study of a deep basin gas field: American Association of Petroleum Geologists Memoir 38, p. 1-33.
---1984b, Elmworth-Case study of a deep basin gas field, in Masters, J.A., ed., Elmworth-Case study of a deep basin gas field: American Association of Petroleum Geologists Memoir 38, p. vii-ix.
Mattavelli, L., Ricchiuto, T., Grignani, D., and Schoell, M., 1983, Geochemistry and habitat of natural gases in Po Basin, northern
Italy: American Association of Petroleum Geologists Bulletin, v. 67,p. 2239-2254.
Meissner, F. F., 1978, Petroleum geology of the Bakken Formation, Williston Basin, North Dakota and Montana, in Rehrig, D., ed., 1978 Williston Basin Symposium: Billings, Mont., Montana Geological Society p. 207-227.
Orr, W.L., 1974, Changes in sulfur content and isotopic ratios of sulfur during petroleum maturation-Study of Big Hom Basin Paleozoic oils: American Association of Petroleum Geologists Bulletin, v. 58, p. 2295-2318.
Pantridge, J.F., 1958, Oil occurrence in Permian, Pennsylvanian and Mississippian rocks, Big Hom Basin, Wyoming, in Weeks, L.G., ed., Habitat of oil: Tulsa, Okla., American Association of Petroleum Geologists, p. 293-306.
Petroleum Information Corporation, 1984, Carbon dioxide and its application to enhanced oil recovery: Petroleum Frontiers, v. 2, no.l,p.l-63.
Phillipi, G.T., 1977, On the depth, time and mechanism of origin of the heavy to medium-gravity naphthenic crude oils: Geochimica et Cosmochimica Acta, v. 41, p. 33-52.
Powley, D.E., 1990, Pressures and hydrogeology in petroleum basins: Earth Science Reviews, v. 29, p. 215-226.
Price, L.C., 1978a, Crude oil and natural gas dissolved in deep, hot geothermal waters of petroleum basins-A possible significant new energy source, in Meriwether, J., ed., Proceedings: Conference on Geopressured-Geothermal Energy, 3rd, Lafayette, Louisiana, Nov. 16-18, 1977, v. 1, p. Gll67-Gl249.
---1978b, Crude oil and natural gas dissolved in deep, hot, geothermal waters of petroleum basins-A possible significant new energy source: American Association of Petroleum Geologists Bulletin, v. 62, p. 555-556.
---1980a, Shelf and shallow basin as related to hot-deep origin of petroleum: Journal of Petroleum Geology, v. 3, p. 91-116.
---1980b, Crude oil degradation as an explanation of the depth rule: Chemical Geology, v. 28, p. 1-30.
---1980c, Utilization and documentation of vertical oil migration in deep basins: Journal of Petroleum Geology, v. 2, p. 353-387.
---1982, Organic geochemistry of 300°C, 7-km core samples, south Texas: Chemical Geology, v. 37, p. 205-214.
---1983, Geologic time as a parameter in organic metamorphism and vitrinite reflectance as an absolute paleogeothermometer: Journal of Petroleum Geology, v. 6, p. 5-38.
---1986, A critical overview and proposed working model of surface geochemical exploration, in Davidson, M.J., ed., Unconventional methods in exploration for petroleum and natural gas, IV: Dallas, Texas, Southern Methodist University Press, p. 245-304.
---1991 , Considerations of oil origin, migration, and accumulation at Caillou Island and elsewhere in the Gulf Coast: U.S. Geological Survey Open-File Report 91-307, 55 p.
---1994, Basin richness versus source rock disruption from faulting-A fundamental relationship?: Journal of Petroleum Geology, v. 17, p. 5-38.
Price, L.C., Clayton, J.L., and Rumen, L.L., 1981, Organic geochemistry of the 9.6 km Bertha Rogers No. 1 well, Oklahoma: Organic Geochemistry, v. 3, p. 59-77.
Price, L.C., Daws, T., and Pawlewicz, M., 1986, Organic metamorphism in the Lower Mississippian-Upper Devonian Bakken
CONVENTIONAL AND UNCONVENTIONAL GAS RESOURCE BASES 207
Shales; Part I, Rock-Eval pyrolysis and vitrinite reflectance: Journal of Petroleum Geology, v. 9, p. 125-162.
Price, L.C., Ging, T.G., Daws, T.A., Love, A.H., Pawlewicz, M.J., and Anders, D.E., 1984, Organic metamorphism in the Mississippian-Devonian Bakken shale North Dakota portion of the Williston Basin, in Woodward, J., Meissner, F.F., and Clayton, J.L., eds., Hydrocarbon source rocks of the greater Rocky Mountain region: Denver, Rocky Mountain Association of Geologists, p. 83-113.
Price, L.C., and LeFever, J.A., 1992, Does Bakken horizontal drilling imply huge oil-resource bases in fractured shales? in Schmoker, 1., ed., Geological studies relevant to horizontal drilling, western North America: Denver, Rocky Mountain Association of Geologists, p. 199-214.
Price, L.C., and Wenger, L.M., 1992, The influence of pressure on petroleum generation and maturation as suggested by aqueous pyrolysis, in Advances in organic geochemistry 1991: Organic Geochemistry, v. 19, p. 141-159.
Price, L.C., Wenger, L.M., Ging, T. G., and Blount, C. W., 1983, Solubility of crude oil in methane as a function of pressure and temperature: Organic Geochemistry, v. 4, p. 201-221.
Rice, D.D., 1980, Chemical and isotopic evidence of the origins of natural gases in offshore Gulf of Mexico: Gulf Coast Geological Society Transactions, v. 30, p. 203-213.
Rice, D.D., and Claypool, G.E., 1981, Generation, accumulation, and resource potential of biogenic gas: American Association of Petroleum Geologists Bulletin, v. 65, p. 5-25.
Rice, D.D., Threlkeld, C.N., and Vuletich, A. K., 1988, Analyses of natural gases from Anadarko Basin, southwestern Kansas, Western Oklahoma, and Texas Panhandle: U.S. Geological Survey Open-File Report 88-391.
Salisbury, G.P., 1968, Natural gas in Devonian and Silurian rocks of Permian Basin, west Texas and southeast New Mexico, in Beebe, B.W., and Curtis, B.F., eds., Natural gases of North America: American Association of Petroleum Geologists Memoir 9, p. 1433-1445.
Sassen, R., and Moore, C.H., 1988, Framework of hydrocarbon generation and destruction in eastern Smackover trend: American Association of Petroleum Geologists Bulletin, v. 72, p. 649-663.
Schoell, M.T., 1980, The hydrogen and carbon isotopic composition of methane from natural gases of various origins: Geochemical et Cosmochimica Acta, v. 44, p. 649-661.
---1983, Genetic characterization of natural gases: American Association of Petroleum Geologists Bulletin, v. 67, p. 2225-2238.
Smith, G.W., 1985, Geology of the deep Tuscaloosa (Upper Cretaceous) gas trend in Louisiana, in Perkins, B.F., and Martin, G.B., eds., Proceedings: Annual Research Conference, Gulf
Coast Section, Society Economic Paleontologists and Mineralogists, 4th, p. 153-190.
Spencer, C.W., 1987, Hydrocarbon generation as a mechanism for overpressuring in Rocky Mountain region: American Association of Petroleum Geologists Bulletin, v. 71, p. 368-388.
Stahl, W., 1974, Carbon isotopic ratios of German natural gases in comparison with isotope data of gaseous hydrocarbons from other parts of the world, in Tissot, B., and Bienner, F., eds., Advances in organic geochemistry 1973: Paris, Editions Technip, p. 453-462.
Stahl, W.J., and Carey, B.D., 1975, Source-rock identification by isotope analyses of natural gases from fields in the Val Verde and Delaware Basins, west Texas: Chemical Geology, v. 16, p. 257-267.
Tigert, V., and Al-Shaieb, Z., 1990, Pressure seals-Their diagenetic banding patterns: Earth Science Reviews, v, 29, p. 227-240.
Tilley, B.J., Nesbitt, B.E., and Longstaffe, F.J., 1989, Thermal history of Alberta deep basin-Comparative study of fluid inclusion and vitrinite reflectance data: American Association of Petroleum Geologists Bulletin, v. 73, p. 1206-1222.
Tissot, B.P., and Welte, D.H., 1984, Petroleum formation and occurrence: New York, Springer-Verlag, 699 p.
Todd, T.W., 1963, Post-depositional history ofTensleep Sandstone (Pennsylvanian), Big Hom Basin, Wyoming: American Association of Petroleum Geologists Bulletin, v. 47, p. 599-616.
Ungerer, P., Behar, E., and Discamps, D.,1983, Tentative calculation of the overall volume expansion of organic matter during hydrocarbon genesis from geochemistry data-Implications for primary migration, in Bjoray, M., and others, eds., Advances in organic geochemistry 1981: Chichester, Wiley, p. 129-135.
Weisman, T.J., 1971, Stable carbon isotope investigation of natural gases from Sacramento and Delaware-Val Verde Basins-Possible igneous origins: American Association of Petroleum Geologists Bulletin, v. 55, p. 369.
Welte, D.H., Stoessinger, W., Schaefer, R.G., and Radke, M., 1984, Gas generation and migration in the deep basin of Western Canada, in Masters, J.A., ed., Elmworth-Case Study of a deep basin gas field: American Association of Petroleum Geologists Memoir 38, p. 1-33.
Wenger, L.M., and Price, L.C., 1991, Differential petroleum generation and maturation paths of the different organic matter types as determined by hydrous pyrolysis over a wide range of experimental temperatures, in Manning, D.A.C., ed., Advances in organic geochemistry: Advances and Applications in Energy and the Natural Environment, Program and Abstracts, p. 335-339.

Migration of Hydrocarbon and N onhydrocarbon Gases From the Deep CrustComposition, Flux, and Tectonic Setting
By Robert C. Burruss
GEOLOGIC CONTROLS OF DEEP NATURAL GAS RESOURCES IN THE UNITED STATES
U.S. GEOLOGICAL SURVEY BULLETIN 2146-M
UNITED STATES GOVERNMENT PRINTING OFFICE, WASHINGTON: 1997

CONTENTS
Abstract ........................................................................................................................... 211 Introduction ..................................................................................................................... 211 Gases in Deep Reservoirs and Metamorphic Rocks ....................................................... 211
Deep Reservoirs ...................................................................................................... 211 Fluids in Deep Crustal Rocks .................................................................................. 212 Gas Flux from Deep Crustal Levels ........................................................................ 213
Discussion and Significance ........................................................................................... 214 References Cited ............................................................................................................. 214
FIGURES
1. Plot of the fraction of total nonhydrocarbon gases versus reservoir temperature for all production from depths greater than 14,000 ft ........................................................................................................................................... 212
2. Plot of data from figure 1 plotted over a wide range of composition and subsurface temperature ................................. 213

Migration of Hydrocarbon and Nonhydrocarbon Gases From the Deep Crust-Composition, Flux,
and Tectonic Setting
By Robert C. Burruss
ABSTRACT
Hydrocarbon and nonhydrocarbon gases are generated in the deep crust by fluid-rock interactions. The trend of increasing nonhydrocarbon gas content with depth in most commercial reservoirs at depths of 14,000 ft (>4,270 m) or greater is consistent with the trend of compositions of fluid inclusions in metamorphic rocks buried to very great depth (>30,000 ft, >9,144 m). Methane is present and stable in graphite-bearing metasedimentary rocks at these great depths. The potential flux of gases from the deep crust can be estimated from the volume of water necessary to produce regionally extensive quartz vein systems in metamorphic terranes. These estimates are in the range of tens to hundreds of trillion cubic feet of methane in a single deeply buried, metamorphic terrane.
INTRODUCTION
The composition of nonhydrocarbon and hydrocarbon gases in deep > 14,000 ft (>4,270 m) natural gas reservoirs yields evidence of migration of gases from deep crustal levels of more than 30,000 ft (>9, 144 m) to shallower sedimentary levels. Any indication of migration of gases from great depth to drillable depths in sedimentary basins is significant for two reasons. First, it expands our knowledge of the source of gases beyond conventional concepts of gas generation, and second, the presence of nonhydrocarbon gases can have a significant impact on the economics of gas production from deep reservoirs.
Comparison of gas compositions in deep reservoirs with those of gases generated in the deep crust yields three types of information. First, the comparison can demonstrate if there are similarities between the gases in the two crustal regimes. Second, evidence for volumetric fluxes of nonhydrocarbon and hydrocarbon gases in metamorphic rocks presently exposed at the surface can be used to estimate the potential flux of gases to shallow crustal levels currently
accessible to the drill. Third, identification of crustal environments (tectonic and metamorphic terranes) that generate significant quantities of gas can be coupled with analysis of structural style and setting (Perry, this volume) to identify basins in which deep crustal sources may have contributed to the hydrocarbon resource base.
GASES IN DEEP RESERVOIRS AND METAMORPHIC ROCKS
DEEP RESERVOIRS
Initial analysis of trends in gas composition versus depth and reservoir lithology was performed on all available gas data in the NRG Associates Significant Field File (NRG Associates Inc., 1991) for reservoirs at depths of 14,000 ft or greater. This file contains gas data for 120 reservoirs: 44 from the Permian Basin, 38 from the Midcontinent (mostly Anadarko Basin), 15 from the Gulf Coast North, 14 from the Gulf Coast South, and 9 from basins in the Rocky Mountains region. If the fraction of total nonhydrocarbon gases is plotted as a function of reservoir temperature (to eliminate significant variations in geothermal gradient) (fig. 1), two trends are apparent. Trend A consists of gradually increasing nonhydrocarbon gas content with depth up to about 10 percent of total gas content and is common to both carbonate and sandstone reservoirs from all basins. Trend B consists of rapidly increasing nonhydrocarbon gas content with depth and is present in a small number of carbonate reservoirs with the exception of two cases. Trend A is due to fluid-rock interactions involving organic matter and dissolution and reprecipitation of carbonate cements. Trend B is present in carbonate reservoirs of the Permian Basin (Lower Ordovician Ellenberger Group) and carbonate and sandstone reservoirs in the Upper Jurassic Smackover Formation and related strata (Upper Jurassic Norphlet Formation) of the
211
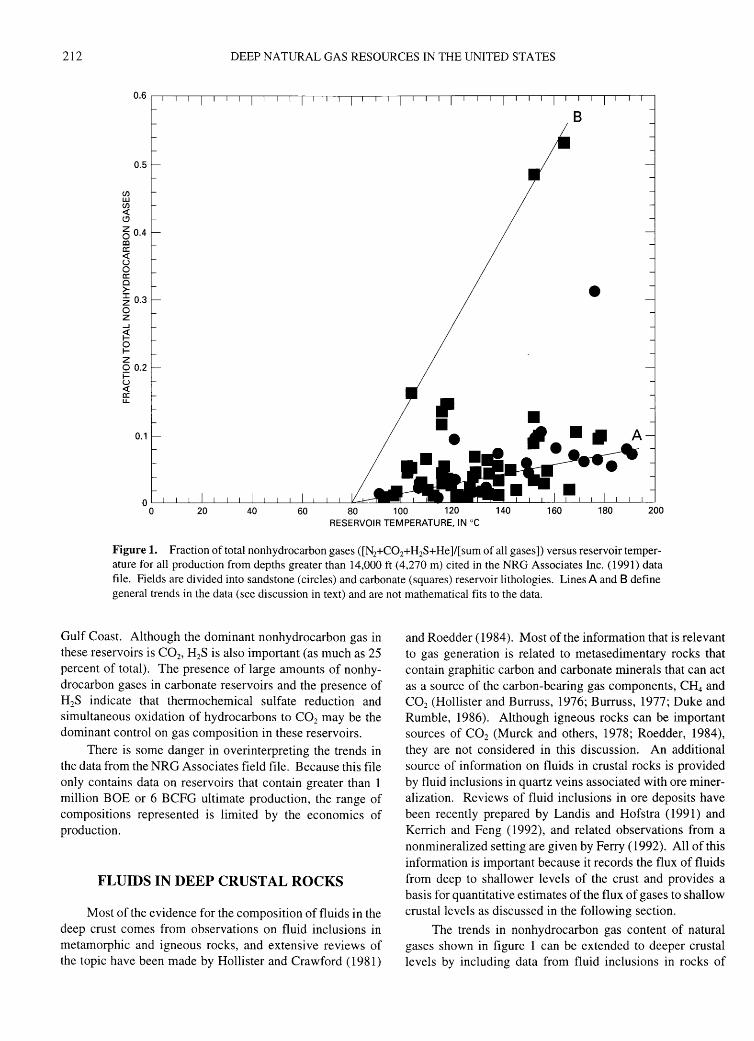
212 DEEP NATURAL GAS RESOURCES IN THE UNITED STATES
(/) UJ (/) <( (.!)
0.5
6 0.4 Ill 0: <( u 0 0: Cl >-~ 0.3 0 z _J
~ 0 1-z 0 0.2
B <( 0: LL
0.1
20 40 60 80 100 120 140 160 180 200 RESERVOIR TEMPERATURE, IN oc
Figure 1. Fraction of total nonhydrocarbon gases ([N2+C02+H2S+He]/[sum of all gases]) versus reservoir temperature for all production from depths greater than 14,000 ft ( 4,270 m) cited in the NRG Associates Inc. (1991) data file. Fields are divided into sandstone (circles) and carbonate (squares) reservoir lithologies. Lines A and B define general trends in the data (see discussion in text) and are not mathematical fits to the data.
Gulf Coast. Although the dominant nonhydrocarbon gas in these reservoirs is C02, H2S is also important (as much as 25 percent of total). The presence of large amounts of nonhydrocarbon gases in carbonate reservoirs and the presence of H2S indicate that thermochemical sulfate reduction and simultaneous oxidation of hydrocarbons to C02 may be the dominant control on gas composition in these reservoirs.
There is some danger in overinterpreting the trends in the data from the NRG Associates field file. Because this file only contains data on reservoirs that contain greater than 1 million BOE or 6 BCFG ultimate production, the range of compositions represented is limited by the economics of production.
FLUIDS IN DEEP CRUSTAL ROCKS
Most of the evidence for the composition of fluids in the deep crust comes from observations on fluid inclusions in metamorphic and igneous rocks, and extensive reviews of the topic have been made by Hollister and Crawford ( 1981)
and Roedder (1984). Most of the information that is relevant to gas generation is related to metasedimentary rocks that contain graphitic carbon and carbonate minerals that can act as a source of the carbon-bearing gas components, CH4 and C02 (Hollister and Burruss, 1976; Burruss, 1977; Duke and Rumble, 1986). Although igneous rocks can be important sources of C02 (Murck and others, 1978; Roedder, 1984), they are not considered in this discussion. An additional source of information on fluids in crustal rocks is provided by fluid inclusions in quartz veins associated with ore mineralization. Reviews of fluid inclusions in ore deposits have been recently prepared by Landis and Hofstra (1991) and Kerrich and Feng ( 1992), and related observations from a nonmineralized setting are given by Ferry (1992). All of this information is important because it records the flux of fluids from deep to shallower levels of the crust and provides a basis for quantitative estimates of the flux of gases to shallow crustal levels as discussed in the following section.
The trends in nonhydrocarbon gas content of natural gases shown in figure 1 can be extended to deeper crustal levels by including data from fluid inclusions in rocks of
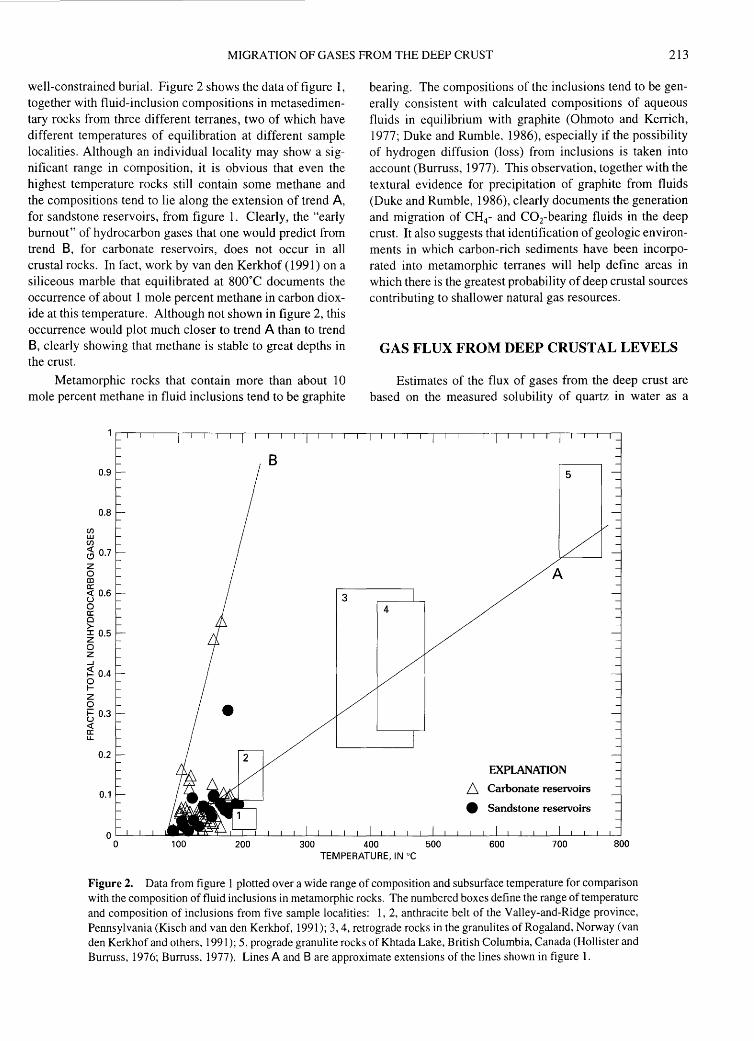
MIGRATION OF GASES FROM THE DEEP CRUST 213
well-constrained burial. Figure 2 shows the data of figure 1, together with fluid-inclusion compositions in metasedimentary rocks from three different terranes, two of which have different temperatures of equilibration at different sample localities. Although an individual locality may show a significant range in composition, it is obvious that even the highest temperature rocks still contain some methane and the compositions tend to lie along the extension of trend A, for sandstone reservoirs, from figure 1. Clearly, the "early burnout" of hydrocarbon gases that one would predict from trend 8, for carbonate reservoirs, does not occur in all crustal rocks. In fact, work by van den Kerkhof ( 1991) on a siliceous marble that equilibrated at 800°C documents the occurrence of about 1 mole percent methane in carbon dioxide at this temperature. Although not shown in figure 2, this occurrence would plot much closer to trend A than to trend 8, clearly showing that methane is stable to great depths in the crust.
Metamorphic rocks that contain more than about 10 mole percent methane in fluid inclusions tend to be graphite
(/) w (/)
0.9
0.8
~ 0.7 z 0 CD a: <{ 0.6 u 0 a: 0 >-:I: 0.5 z 0 z _J
~ 0.4 0 f-z 0 ~ 0.3 <{ a: u..
0.2
0.1
bearing. The compositions of the inclusions tend to be generally consistent with calculated compositions of aqueous fluids in equilibrium with graphite (Ohmoto and Kerrich, 1977; Duke and Rumble, 1986), especially if the possibility of hydrogen diffusion (loss) from inclusions is taken into account (Burruss, 1977). This observation, together with the textural evidence for precipitation of graphite from fluids (Duke and Rumble, 1986), clearly documents the generation and migration of CH4- and C02-bearing fluids in the deep crust. It also suggests that identification of geologic environments in which carbon-rich sediments have been incorporated into metamorphic terranes will help define areas in which there is the greatest probability of deep crustal sources contributing to shallower natural gas resources.
GAS FLUX FROM DEEP CRUSTAL LEVELS
Estimates of the flux of gases from the deep crust are based on the measured solubility of quartz in water as a
A
EXPLANATION
D Carbonate reservoirs
e Sandstone reservoirs
OL--1-----'-----'--__ ..._............,.____.____.L__,_____j____J____L_...J..._J..___JL_____l___j___J_---'----'-----'----'--__L_-'----'--L-...JL_____l__J____.L___J_---'---'----'---'---'---L__j'--J
0 100 200 300 400 500 600 700 800 TEMPERATURE, IN oc
Figure 2. Data from figure 1 plotted over a wide range of composition and subsurface temperature for comparison with the composition of fluid inclusions in metamorphic rocks. The numbered boxes define the range of temperature and composition of inclusions from five sample localities: 1, 2, anthracite belt of the Valley-and-Ridge province, Pennsylvania (Kisch and van den Kerkhof, 1991); 3, 4, retrograde rocks in the granulites ofRogaland, Norway (van den Kerkhof and others, 1991 ); 5, prograde granulite rocks of Khtada Lake, British Columbia, Canada (Hollister and Burruss, 1976; Burruss, 1977). Lines A and B are approximate extensions of the lines shown in figure 1.
214 DEEP NATURAL GAS RESOURCES IN THE UNITED STATES
function of temperature, pressure, and salinity, which can be translated into a quantity of quartz precipitated per volume of water in a vein system at a given depth in the crust. From the volume of quartz veins that can be measured in the field, we can estimate the volume of water necessary to form the vein system. The ratio of hydrocarbon and nonhydrocarbon gases to water can be determined from fluid-inclusion measurements (Burruss, 1981; van den Kerkhof, 1988; Landis and Hofstra, 1991). Therefore, we can estimate the volume of gases that is transported with the water that is necessary to form quartz veins at depth in a given tectonic setting.
An extensive series of studies by Kerrich and his students (see review paper, Kerrich and Feng, 1992, and references therein) documents the geochemical processes and tectonic setting of formation of "giant quartz vein systems," which in many cases have associated gold mineralization (see Goldfarb and others, 1991). In one example of a giant vein system, Kerrich and others (1987) estimated that 6x10¹⁸
g of aqueous fluid (6x10³ km3) deposited about 6x10¹⁵ g of quartz and in the process transported 3x10¹⁵ g of C02• This is 1,500 TCF of C02• Based on the range of methane to carbon dioxide ratios observed in fluid inclusions in quartz from one of these giant vein systems (1 :3-1:40 [Landis and Hofstra,1991] for "southern Alaska mesothermal veins," which are part of Kerrich' s "Cretaceous-Tertiary Coast Range Megalineament, Juneau belt, Alaska," which extends south into British Columbia, with similar observations made by Hollister and Burruss, 1976), a single giant vein system may transport on the order of 50-500 TCF of CH4 to shallow crustal levels. Twelve giant vein systems have been documented by Kerrich and Feng (1992), and they range in age and location from Late Archean (2,700-2,600 Ma) in the Canadian and Australian shields to Tertiary (38-27 Ma) in the Alps. These twelve are only the systems documented in the literature and are biased by the fact that they are now exhumed and exposed at the surface where they can be easily studied. Fluid fluxes of similar magnitude have been documented in recent work by Ferry (1992) in giant vein systems of more common dynamothermal metamorphic terranes.
DISCUSSION AND SIGNIFICANCE
Kerrich's giant quartz-vein systems are an important component of any consideration of deep crustal sources of hydrocarbon and nonhydrocarbon gases for several reasons. First, quartz veins are direct evidence of focused flow of fluids from deep to shallow crustal levels. Second, giant vein systems are present at convergent plate margins, especially those associated with transpressive tectonic regimes (Kerrich and Feng, 1992), a geologic environment in which major hydrocarbon accumulations are present. In fact, the giant vein systems may be the best evidence to support earlier suggestions of natural gas accumulations in "accretionary" terranes (Gwilliam and Cohen, 1986).
The association of giant vein systems and convergent, transpressive plate margins may have both positive and negative aspects for potential hydrocarbon gas accumulations. On the positive side, major gas accumulations are associated with such tectonic settings, for example, the deep Anadarko Basin of Oklahoma and Texas and the Arkoma Basin of Arkansas. On the negative side, convergent, transpressive tectonic regimes tend to have a component of very active vertical tectonism that can lead to rapid erosional exhumation of potential reservoir rocks and loss of accumulations. For example, there is a large amount of fluid inclusion evidence for methane generation and transport through the Alpine quartz veins, but any sedimentary cover that could have provided reservoirs has been stripped off this young terrane.
REFERENCES CITED
Burruss, R.C., 1977, Analysis of fluid inclusions in graphitic metamorphic rocks from Bryant Pond, Maine, and Khtada Lake, British Columbia-Thermodynamic basis and geologic interpretation of observed fluid compositions and molar volumes: Princeton, N.J., Princeton University Ph. D. dissertation.
---1981, Analysis of phase equilibria in C-0-H-S fluid inclusions, in Hollister, L.S., and Crawford, M.L., eds., Fluid inclusions-Applications to petrology: Mineralogical Association of Canada Short Course Notes, v. 6, p. 39-74.
Duke, E.F., and Rumble, D., III, 1986, Textural and isotopic variations in graphite from plutonic rocks, south-central New Hampshire: Contributions to Mineralogy and Petrology, v. 93, p. 409-419.
Ferry, J.M., 1992, Regional metamorphism of the Waits River Formation, eastern Vermont-Delineation of a new type of giant metamorphic hydrothermal system: Journal of Petrology, V. 33, p. 45-94.
Goldfarb, R.J., Snee, L.W., Miller, L.D., and Newberry, R.J., 1991, Rapid dewatering of the crust deduced from ages of mesothermal gold deposits: Nature, v. 354, p. 296-298.
Gwilliam, W.J., and Cohen, K.K., 1986, Deep source gas potential along west coast of North America [abs.]: American Association of Petroleum Geologists Bulletin, v. 70, p. 924.
Hollister, L.S., and Burruss, R.C., 1976, Phase equilibria in fluid inclusions from the Khtada Lake metamorphic complex: Geochimica et Cosmochimica Acta, v. 40, p. 163-175.
Hollister, L.S., and Crawford, M.L., eds., 1981, Fluid inclusions-Applications to petrology: Mineralogical Association of Canada Short Course Notes, v. 6.
Kerrich, R., and Feng, R., 1992, Archean geodynamics and the Abitibi-Pontiac collision-Implications for advection of fluids at transpressive collisional boundaries and the origin of giant quartz vein systems: Earth-Science Reviews, v. 32, p. 33-60.
Kerrich, R., Fryer, B. J., King, R. W., Willmore, L. M. and Van Hees, E., 1987, Crustal outgassing and LILE enrichment in major lithosphere structures, Archean Abitibi greenstone belt-Evidence on the source reservoir from strontium and carbon isotope tracers: Contributions to Mineralogy and Petrology, v. 97, pp. 156-168.

MIGRATION OF GASES FROM THE DEEP CRUST 215
Kisch, H.J., and van den Kerkhof, A.M., 1991, CJ-L-rich inclusions form quartz veins in the Valley-and-Ridge province and the anthracite fields of the Pennsylvania Appalachians: American Mineralogist, v. 76, p. 230-240.
Landis, G.P., and Hofstra, A. H .. 1991, Fluid inclusion gas chemistry as a potential minerals exploration tool-Case studies from Creede, CO, Jerritt Canyon, NV, Coeur d'Alene district, ID and MT, southern Alaska mesothermal veins, and mid-continent MVT's: Journal of Geochemical Exploration, v. 42, p. 25-59.
Murck, B.W., Burruss, R.C., and Hollister, L.S., 1978, Phase equilibria in fluid inclusions in ultramafic xenoliths: American Mineralogist, v. 63, p. 40-46.
NRG Associates Inc., 1988, The significant oil and gas fields of the United states (through December 31, 1988): Available from Nehring Associates, Inc., P.O. Box 1655, Colorado Springs, Colorado 80901.
Ohmoto, H., and Kerrich, D., 1977, Devolatilization equilibria in graphitic systems: American Journal of Science, v. 227, p. 1013-1044.
Roedder, E.,1984, Fluid inclusions: Mineralogical Society of America Reviews in Mineralogy, v. 12, 644 p.
Van den Kerkhof, A.M., 1988, The system C02-CH4-N2 in fluid inclusions-Theoretical modeling and geological applications: Amsterdam, Free University Press, 206 p.
---1991, Heterogeneous fluids in high-grade siliceous marbles of Pusula (SW Finland): Geologische Rundschau, v. 80, p. 249-258.
Van den Kerkhof, A.M., Touret, J.L.R., Maijer, C., and Jansen, J.B.H., 1991, Retrograde methane-dominated fluid inclusions from high-temperature granulites of Rogaland, southwestern Norway: Geochirnica et Cosmochimica Acta, v. 55, p. 2533-2544.

Deep Natural Gas Resources in the Eastern Gulf of Mexico
By Dudley D. Rice, Christopher J. Schenk, James W. Schmoker, James E. Fox, Jerry L. Clayton, Thaddeus S. Dyman, Debra K. Higley, C. William Keighin, Ben E. Law, and Richard M. Pollastro
GEOLOGIC CONTROLS OF DEEP NATURAL GAS RESOURCES IN THE UNITED STATES
U.S. GEOLOGICAL SURVEY BULLETIN 2146-N
UNITED STATES GOVERNMENT PRINTING OFFICE, WASHINGTON: 1997

CONTENTS
Abstract ........................................................................................................................... 219 Introduction ..................................................................................................................... 219 Geologic Framework ....................................................................................................... 220 Thermal Maturity ............................................................................................................ 221 Reservoir Characterization .............................................................................................. 223 Source Rocks ................................................................................................................... 225 Natural Gases .................................................................................................................. 226 Liquid Hydrocarbons ...................................................................................................... 226 Summary ......................................................................................................................... 227 References Cited ............................................................................................................. 228
FIGURES
1. Map of the study area in the eastern Gulf of Mexico showing major structural features, facies of Norphlet Formation, and location of Norphlet fields .................................................................................................. 220
2. Generalized north-south cross section of pre-Selma Group Jurassic and Cretaceous strata, southwestern Alabama ................................................................................................................................................ 221
3, 4. Plots of: 3. Equivalent vitrinite reflectance versus depth for five locations in the study area .................................................. 222 4. Vitrinite reflectance versus depth, Exxon State Lease 624 No. 1 well, Mobile Bay .............................................. 222
5. Diagram showing preliminary burial and thermal history reconstruction, Exxon State Lease 624 No. 1 well, Mobile Bay . . . . . . . .. . . . .. . . . . . . . . . . .. .. ... . . . . ... . .. .. . .. . . . . . . . .. . . . . .. .. . . . . . . . . ..... ... .. . . . . . . . . .. . ... ... . . ... . . . . . .. ......... .. .. . . .. . ... . . . . . . . .. ............... ....... 223
6. Plot of weight percent of clay minerals in bulk rock versus relative weight percent of illite in sandstones of the Norphlet Formation ..................................................................................................................................................... 224
7. Diagram showing preliminary interpretation of thermal maturity versus Norphlet Formation porosity for the study area ..................................................................................................................................................................... 224
8, 9. Plots of: 8. Methane 813C versus C2+ for gas samples from the study area .............................................................................. 226 9. Toluene to heptane ratios versus heptane to methylcyclohexane ratios for oils and condensates of
southwestern Alabama ........................................................................................................................................... 227

Deep Natural Gas Resources in the Eastern Gulf of Mexico 1
By Dudley D. Rice, Christopher J. Schenk, James W. Schmoker, James E. Fox, Jerry L. Clayton, Thaddeus S. Dyman, Debra K. Higley, C. William Keighin,
Ben E. Law, and Richard M. Pollastro
ABSTRACT
The deep reservoirs of the Upper Jurassic Norphlet Formation in the Gulf of Mexico contain large resources of gas in eolian sandstone reservoirs. Thermal maturity is a major control of these deep accumulations. Thermal gradients vary throughout the study area but are highest south of the Wiggins arch where the potential for deep gas is highest. Thermal modeling indicates that paleotemperatures were higher than present-day temperatures. At a given level of thermal maturity, porosity values for the Norphlet are significantly higher than those of most sandstones worldwide. These high values may be related to (1) early cementation and subsequent dissolution of evaporitic cements (carbonates, anhydrite, and halite), (2) inhibition of quartz diagenesis by chlorite clay cement, which is prevalent in offshore Mobile Bay, (3) overpressuring, ( 4) inhibition of diagenesis by the presence of hydrocarbons, and (5) the lack of pore fluid volume required to cement the sandstones.
The source for onshore Jurassic hydrocarbons is probably algal carbonate mudstone in the lower part of the Smackover Formation. These carbonate source rocks, however, are probably inadequate to charge the major accumulations of deep, dry gas in the Norphlet in the Mobile Bay area of offshore Alabama and Mississippi. Downdip, more distal, marine, type II kerogen-bearing facies of the undifferentiated Norphlet and Smackover interval are postulated to be the source for these offshore accumulations.
Gases in deep reservoirs of the Norphlet are distinguished by their dryness and by their enrichment in 13c, both of which indicate generation at high levels of thermal maturity (metagenesis). Gases in Jurassic reservoirs of the study area contain varying amounts of C02 and H2S that
1This paper was originally published, in slightly different form, in "Proceedings of the natural gas research and development contractors review meeting," edited by Rodney D. Malone, Harold Shoemaker, and Charles W. Byer, 1992, U.S. Department of Energy DOFJMETC 92/6125, p. 151-166.
have an inorganic origin and present problems in drilling, production, and marketing. Geochemical data indicate that liquids in deep Jurassic and Cretaceous reservoirs may have at least two sources. In addition, the condensates may have resulted from either (1) high-temperature cracking of heavier hydrocarbons or (2) evaporative fractionation.
INTRODUCTION
The United States depends on oil and gas as its major sources of energy; however, fewer wells are being drilled today in the United States, the discovery rate of new oil and gas accumulations is declining, and oil production is decreasing. Future supplies of domestic oil and gas will result from improved recovery of discovered hydrocarbons and the development of unconventional resources. One important and essentially undeveloped source of gas is from deep sedimentary basins.
The Gulf of Mexico is one of the Nation's most important provinces for discovered· and undiscovered hydrocarbons. In addition, it has an enormous volume of sedimentary rocks deeper than 15,000 ft (4,572 m) and the best potential for deep gas resources. Interesting statistics from the NRG Associates Significant Fields File (greater than 1 million barrels of oil equivalent [BOE]) are summarized for the deep (> 14,000 ft, >4,267 m) Gulf Coast Mesozoic producing region (NRG Associates, 1988). The Mesozoic producing region is important for deep gas and includes the East Texas, North Louisiana, and Mississippi salt basins, extending into southwest Alabama and the panhandle of Florida. One hundred and nine deep reservoirs in 97 fields are present in the Gulf Coast Mesozoic producing region, and the first discovery was in 1944. Although a tremendous volume of sedimentary rocks deeper than 15,000 ft is present, the number of significant deep reservoirs decreases with increasing depth. Fifty-eight percent of the significant deep reservoirs are classified as gas producing, and more deep oil reservoirs
219
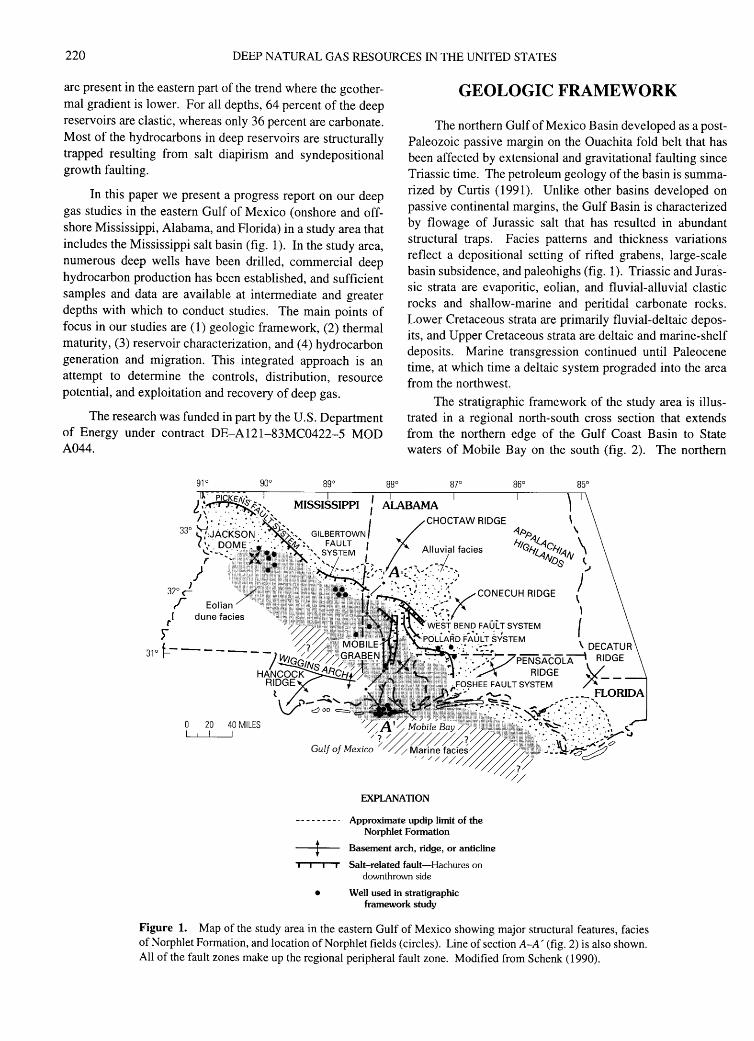
220 DEEP NATURAL GAS RESOURCES IN THE UNITED STATES
are present in the eastern part of the trend where the geothermal gradient is lower. For all depths, 64 percent of the deep reservoirs are clastic, whereas only 36 percent are carbonate. Most of the hydrocarbons in deep reservoirs are structurally trapped resulting from salt diapirism and syndepositional growth faulting.
In this paper we present a progress report on our deep gas studies in the eastern Gulf of Mexico (onshore and offshore Mississippi, Alabama, and Florida) in a study area that includes the Mississippi salt basin (fig. 1). In the study area, numerous deep wells have been drilled, commercial deep hydrocarbon production has been established, and sufficient samples and data are available at intermediate and greater depths with which to conduct studies. The main points of focus in our studies are ( 1) geologic framework, (2) thermal maturity, (3) reservoir characterization, and (4) hydrocarbon generation and migration. This integrated approach is an attempt to determine the controls, distribution, resource potential, and exploitation and recovery of deep gas.
The research was funded in part by the U.S. Department of Energy under contract DE-A121-83MC0422-5 MOD A044.
Eolian dune facies
20 40 MILES I I
GEOLOGIC FRAMEWORK
The northern Gulf of Mexico Basin developed as a postPaleozoic passive margin on the Ouachita fold belt that has been affected by extensional and gravitational faulting since Triassic time. The petroleum geology of the basin is summarized by Curtis (1991). Unlike other basins developed on passive continental margins, the Gulf Basin is characterized by flowage of Jurassic salt that has resulted in abundant structural traps. Facies patterns and thickness variations reflect a depositional setting of rifted grabens, large-scale basin subsidence, and paleo highs (fig. 1 ). Triassic and Jurassic strata are evaporitic, eolian, and fluvial-alluvial clastic rocks and shallow-marine and peritidal carbonate rocks. Lower Cretaceous strata are primarily fluvial-deltaic deposits, and Upper Cretaceous strata are deltaic and marine-shelf deposits. Marine transgression continued until Paleocene time, at which time a deltaic system prograded into the area from the northwest.
The stratigraphic framework of the study area is illustrated in a regional north-south cross section that extends from the northern edge of the Gulf Coast Basin to State waters of Mobile Bay on the south (fig. 2). The northern
EXPLANATION
I I
Approximate updip limit of the Norphlet Formation
Basement arch, ridge, or anticline
Salt-related fault-Hachures on downthrown side
• Well used in stratigraphic framework study
Figure 1. Map of the study area in the eastern Gulf of Mexico showing major structural features, facies of Norphlet Formation, and location of Norphlet fields (circles). Line of section A-A' (fig. 2) is also shown. All of the fault zones make up the regional peripheral fault zone. Modified from Schenk (1990).

DEEP NATURAL GAS RESOURCES IN EASTERN GULF OF MEXICO 221
A NORTH
Eutaw Formation
A' SOUTH
-r----1-----+---~-----r~~--~,_----~1---------+-DATUM
Figure 2. Generalized north-south cross section of pre-Selma Group Jurassic and Cretaceous strata, southwestern Alabama. The Jurassic-Cretaceous boundary is near the top of the Cotton Valley Group. Line of section is shown in figure 1. Modified from Keighin and Schenk (1992).
Formation 18,000 ~~~======~~~?
9,000
12,000
15,000
18,000
'1 TD 20,060 ft TD 18 915ft · TD 18,600 ft •
Norphlet Formation /'
TD 17,403 ft TD 18,997 ft Smackover Formation 21,000
Louann Salt
MOBILE GRABEN
CHOCTAW RIDGE WIGGINS ARCH MISSISSIPPI SALT BASIN
1500 FEET
0 L 6MILES
edge of the basin coincides with the regional peripheral fault zone, the northern limit of Triassic normal-fault rifting, and the northern limit of the Middle and Upper Jurassic Louann Salt. In a southerly direction, the section including the Upper Jurassic Norphlet Formation through Lower Cretaceous Trinity and Coahuila Groups thickens, whereas the remainder of the Cretaceous strata shows no major thickness trends. In addition, the Jurassic and Cretaceous section is more deeply buried to the south because of the prograding Tertiary deltaic section. An unpublished section parallel with the basin margin in Alabama illustrates thickness variations attributed to basement highs.
A map of the area shown in figure 1 was prepared using the ARC/INFO GIS system (Keighin and Schenk, 1992). At present, the map includes political boundaries and spatial coordinant data, geologic structures such as faults and salt domes, and oil and gas fields. Other features of known latitude and longitude, such as oil and gas wells greater than 10,000 ft, 15,000 ft, and 20,000 ft (3,048, 4,572, 6,096 m), are also included in the GIS file.
Carbonate rocks and sandstone of the Upper Jurassic Smackover and Norphlet Formations, respectively, are major reservoirs for hydrocarbons in the study area. Petroleum geology of the Jurassic section is discussed by Mancini
TD 22,165 ft
and Benson (1980), Mancini and others (1985), and Mink and others (1989, 1990). Three hydrocarbon trends that parallel the northern edge of the basin-oil, wet gas and condensate, and dry gas-have been identified. The oil trend is updip of the peripheral fault zone, the dry gas trend is south of the Wiggins arch and partly offshore, and the wet gas and condensate trend is between the oil and dry gas trends (fig. 1). The depth of production in these three trends increases in an offshore direction (fig. 2). The major part of the production in the oil and wet gas and condensate trends is from carbonate reservoirs of the Smackover Formation. Production in the dry gas trend is from eolian sandstones of the Norphlet Formation at depths greater than 20,000 ft (6,096 m), and potential gas resources in the Norphlet are large. Initial production was established in the State and Federal waters of Mobile Bay, offshore Alabama; the most productive wells to date have recently been tested in offshore Mississippi.
THERMAL MATURITY
Thermal maturity influences many processes critical to deep gas accumulation, including generation and migration of hydrocarbons and creation and preservation of reservoir

222 DEEP NATURAL GAS RESOURCES IN THE UNITED STATES
properties. Figure 3 represents a preliminary attempt to relate thermal maturity, as expressed by equivalent vitrinite reflectance (~eq) versus depth for five locations in the study area. The plots were derived from published and unpublished data that include vitrinite reflectance, bitumen reflectance, and Rock-Eval maximum-pyrolysis temperature (T max). The equivalent vitrinite reflectance versus depth relations for these five locations are subject to modification as additional data become available.
The equivalent vitrinite reflectance versus depth trends show that thermal maturity increases steadily with depth (fig. 3). Slopes are subparallel, except for curve 4. The steeper slope of curve 4 reflects the influence of the Jackson Dome, a Late Cretaceous subsurface igneous intrusion (fig. 1). At a given depth, equivalent vitrinite reflectance tends to decrease from south to north (curves 2 to 1 and 3 to 5).
Figure 4 is a vitrinite reflectance (R0 ) versus depth profile for the Exxon State Lease 624 No. 1 well in State waters of Mobile Bay, Alabama (fig. 1). The well was drilled to a total depth of22,166 ft (6,756 m) in the Louann Salt and produces dry gas from the Norphlet Formation. The vitrinite reflectance at the surface of about 0.2 percent indicates that the present depth of burial is maximum and that little or no erosion has occurred in this area. The data suggest that two regression lines are possible-a single straight regression line and a two-segment regression line with a bend in the profile at a depth of about 11,000 ft (3,352 m) and a vitrinite reflectance value of 1.2 percent. The maximum vitrinite reflectance at total depth of the well is 2.4 percent, based on a two-segment profile, and 3.7 percent, based on a straight profile.
Examination of other vitrinite reflectance profiles in Mississippi and Alabama indicates that the two-segment profile is probably more representative of the trend. In similarappearing profiles in the Rocky Mountain region, Law and others (1989) attributed the steeply sloping segment to convective heat-transfer processes related to the presence of abnormally high formation pressures and vertically flowing formation fluids. Other possible explanations include changes in type of organic matter and suppression of thermal maturity due to abnormally high formation pressure. The origin of the two-segment profile in the study area is uncertain and under investigation because thermal maturity is a dominant control of deep gas processes and accumulations.
A preliminary burial and thermal history reconstruction for strata in the Exxon State Lease 624 No. 1 well is shown in figure 5. Based on a present-day thermal gradient of 1.35°F/100 ft remaining constant through geologic time, the Louann Salt entered the oil window about 120 m.y. ago during deposition of the Trinity Group. With continued burial, the top of the oil window moved to stratigraphically younger units and is currently in the Cretaceous Fredericksburg and Washita Groups at a depth of about 10,200 ft. Preliminary thermal modeling of this well indicates, however, that the present-day thermal gradient of 1.35°F/100 ft or even higher
tLU
12,000
14,000
~ 16,000
I, b: 18,000 LU 0
20,000
22,000
5
2 4,000 L_____L_.L____L____L____L__j___L__I_L__L_jL...L_.J.......L _ _____Jc_______J _ _j
0.6 0.8 1.0 1.5 2.0 2.5 3.5
Figure 3. Equivalent vitrinite reflectance (Roeq) versus depth for five locations in the study area. Trends are (1) along border of Alabama and Florida Panhandle; (2) Mississippi and Alabama south of the Wiggins arch; (3) Mississippi salt basin; (4) east flank of Jackson Dome, Mississippi, and (5) Pickens-Gilbertown-Pollard fault zone near Mississippi-Alabama State line.
o~-~~-----.--------.--
tLU LU
5000
u.. 10,000 ~ £ t-o.. LU 0
15,000
20,000
0.1 1 VITRINITE REFLECTANCE, IN PERCENT
>-0:: <X: i= 0:: L.U 1-
en ::J 0 L.U u ~ w a: u
10
Figure 4. Vitrinite reflectance (R,J versus depth, Exxon State Lease 624 No. 1 well, Mobile Bay, Alabama. Solid straight line is regression of all vitrinite reflectance data; dashed segmented line is regression of shallow and deep data.
gradients of 1.4°F-1.5°F/100 ft as reported by Wilson and Tew ( 1985) are insufficient to achieve the measured level of thermal maturity. Therefore, paleotemperatures, at some time, were higher than present-day temperatures.
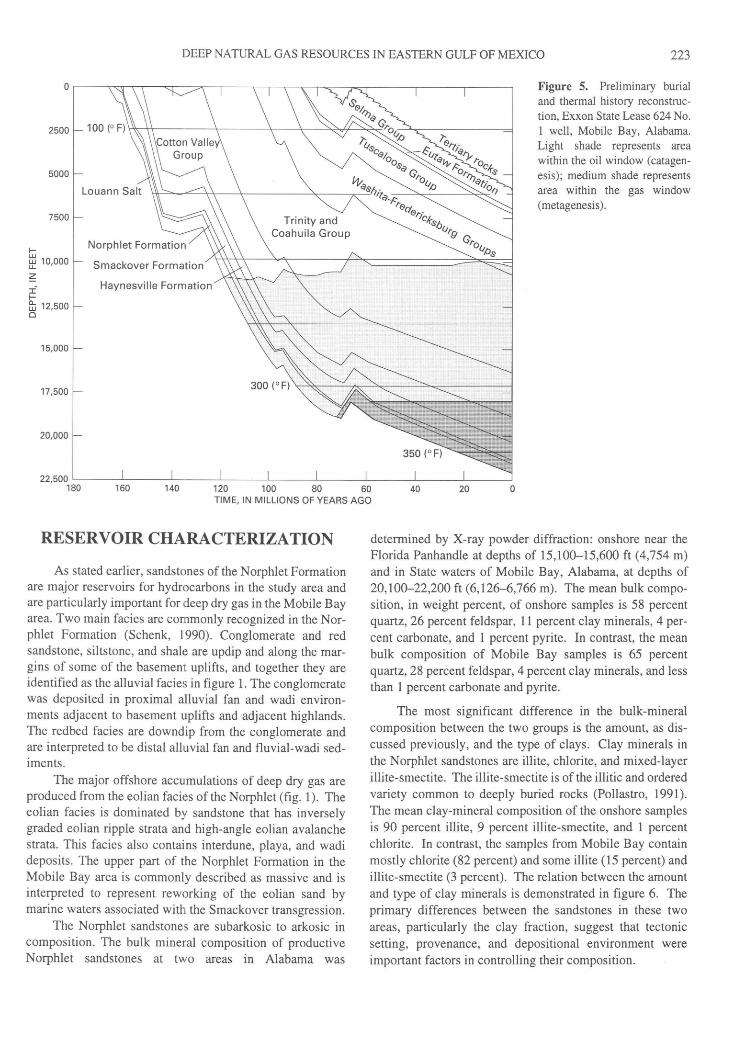
DEEP NATURAL GAS RESOURCES IN EASTERN GULF OF MEXICO 223
2500
5000
7500
1-
Figure 5. Preliminary burial and thermal history reconstruction, Exxon State Lease 624 No. 1 well, Mobile Bay, Alabama. Light shade represents area within the oil window (catagenesis); medium shade represents area within the gas window (metagenesis).
~ 10,000 Smackover Formation /\\\'&-----'>,.\----y~::::==::=::=::=::=:::::::::==:::::::S~~ ~ ::r:' 1-fb 12,500 0
15,000
17,500
20,000
Haynesville Formation
22,500 L__ __ _j_ ___ L__ __ __[__ __ _____l_ ___ L__ _ _ __j_ __ ____j ___ _j_ __ _
180 160 140 120 100 80 60 40 20 0 TIME, IN MILLIONS OF YEARS AGO
RESERVOIR CHARACTERIZATION
As stated earlier, sandstones of the Norphlet Formation are major reservoirs for hydrocarbons in the study area and are particularly important for deep dry gas in the Mobile Bay area. Two main facies are commonly recognized in the Norphlet Formation (Schenk, 1990). Conglomerate and red sandstone, siltstone, and shale are updip and along the margins of some of the basement uplifts, and together they are identified as the alluvial facies in figure 1. The conglomerate was deposited in proximal alluvial fan and wadi environments adjacent to basement uplifts and adjacent highlands. The redbed facies are downdip from the conglomerate and are interpreted to be distal alluvial fan and fluvial-wadi sediments.
The major offshore accumulations of deep dry gas are produced from the eolian facies of the Norphlet (fig. 1). The eolian facies is dominated by sandstone that has inversely graded eolian ripple strata and high-angle eolian avalanche strata. This facies also contains interdune, playa, and wadi deposits. The upper part of the Norphlet Formation in the Mobile Bay area is commonly described as massive and is interpreted to represent reworking of the eolian sand by marine waters associated with the Smackover transgression.
The Norphlet sandstones are subarkosic to arkosic in composition. The bulk mineral composition of productive Norphlet sandstones at two areas in Alabama was
determined by X-ray powder diffraction: onshore near the Florida Panhandle at depths of 15,100-15,600 ft (4,754 m) and in State waters of Mobile Bay, Alabama, at depths of 20,100-22,200 ft (6,126-6,766 m). The mean bulk composition, in weight percent, of onshore samples is 58 percent quartz, 26 percent feldspar, 11 percent clay minerals, 4 percent carbonate, and 1 percent pyrite. In contrast, the mean bulk composition of Mobile Bay samples is 65 percent quartz, 28 percent feldspar, 4 percent clay minerals, and less than 1 percent carbonate and pyrite.
The most significant difference in the bulk-mineral composition between the two groups is the amount, as discussed previously, and the type of clays. Clay minerals in the Norphlet sandstones are illite, chlorite, and mixed-layer illite-smectite. The illite-smectite is of the illitic and ordered variety common to deeply buried rocks (Pollastro, 1991). The mean clay-mineral composition of the onshore samples is 90 percent illite, 9 percent illite-smectite, and 1 percent chlorite. In contrast, the samples from Mobile Bay contain mostly chlorite (82 percent) and some illite (15 percent) and illite-smectite (3 percent). The relation between the amount and type of clay minerals is demonstrated in figure 6. The primary differences between the sandstones in these two areas, particularly the clay fraction, suggest that tectonic setting, provenance, and depositional environment were important factors in controlling their composition.

224 DEEP NATURAL GAS RESOURCES IN THE UNITED STATES
t3 20 0 a: ~ _l
::J OJ
~ 15 >-:s u fz ~ 10 a: LlJ a.. fI ~
~ 5
20 40 60 80 WEIGHT PERCENT ILLITE IN <2-llm CLAY
100
Figure 6. Weight percent of clay minerals in bulk rock versus relative weight percent of illite in sandstones of the Norphlet Formation. Note separation of samples from onshore and Mobile Bay areas.
The porosity of sandstone has been shown to correlate with time-temperature exposure (Schmoker and Gautier, 1988; Schmoker and Higley, 1991). A measure of integrated thermal history, such as vitrinite reflectance, is thus a useful parameter for empirical porosity prediction. Based on figure 3, equivalent vitrinite reflectance (Roeq) of the Norphlet Formation ranges from about 0.65 percent near the Pickens-Gilbertown-Pollard fault zone to 3.0 or higher in Federal waters offshore Alabama. Core-plug porosity data for the Norphlet Formation that span this range have been gathered from a number of locations. Preliminary interpretation suggests that, at a given level of thermal maturity, porosity of the Norphlet Formation is significantly higher than porosity of most other sandstones around the world.
Figure 7 is a sketch illustrating the higher than expected porosity values for the Norphlet. The "type curve" in this figure is a porosity-equivalent vitrinite reflectance curve considered to be representative of sandstones in general (Schmoker and Gautier, 1989). The hachured zone depicts the porosity range of the Norphlet Formation as a function of thermal maturity. The key point is that Norphlet porosities are high, as compared to typical sandstone, not just offshore but throughout the study area.
Preservation of sandstone porosity in Norphlet sandstones has been cited in the literature as a function of (1) overpressuring, (2) inhibition of diagenesis by the presence of hydrocarbons, (3) inhibition of quartz diagenesis by the presence of chlorite clay cement, ( 4) the general lack of pore fluid volume required to cement the sandstones with quartz following mechanical compaction, and (5) early cementation
t ~ U5 0 a: 0 a.. ~ 0 _l
RANGE OF NORPHLET POROSITY
TYPE CURVE FOR SANDSTONES
LOG Roeq _.
Figure 7. Preliminary interpretation of thermal maturity versus Norphlet Formation porosity for the study area. Porosity of Norphlet Formation is higher than porosities of sandstones in general (type curve from Schmoker and Gautier, 1989) if compared on basis of thermal maturity (equivalent vitrinite reflectance, ~q) over a wide range of thermal maturity.
and subsequent dissolution of evaporitic cements (carbonates, anhydrite, and halite). Each of these is discussed separately.
Overpressuring was cited by Dixon and others (1989) as acting to forestall compaction and preserve a few percent porosity in Norphlet sandstones. Compilations of pressure data for the present study illustrate that almost all onshore Norphlet fields are only slightly overpressured, the exception being a few fields proximal to the Jackson Dome. Offshore, overpressuring may be more important and may actually preserve a few percent of Norphlet sandstone porosity. The majority of Norphlet porosity onshore, however, is not due to overpressuring.
Dixon and others ( 1989) also concluded that diagenesis was inhibited by the presence of hydrocarbons in the pore spaces, resulting in porosity preservation. Many wells onshore, however, have encountered Norphlet sandstone

DEEP NATURAL GAS RESOURCES IN EASTERN GULF OF MEXICO 225
reservoirs that are water wet; little of the porous sandstone had ever contained hydrocarbons, questioning the general application of the role of hydrocarbons in preserving Norphlet porosity.
Chlorite clay has been cited as a cause of porosity preservation generally through the inhibition of quartz cementation, which then leaves pores relatively open (Thompson and Stancliffe, 1990). As discussed previously, chlorite is the dominant clay type in sandstones of the Mobile Bay area, although the total clay content is relatively low as compared to that of onshore sandstones. In this study, many examples of quartz cementation subsequent to chlorite growth have been documented; again, the general application of the role of chlorite in porosity preservation is suspect. Samples from offshore wells that contain abundant chlorite have, in some cases, contained quartz cement (Rice and others, 1992).
Ajdukiewicz and others (1991) concluded that pore fluid migration through Norphlet sandstones was inadequate to cement the sandstones with quartz and that this lack of cementation was the main reason for preservation of deep porosity. This concept deserves more study because Norphlet sandstones may have been somewhat isolated from fluid flow by the underlying Louann Salt. As was discussed for chlorite, however, many samples from both onshore and offshore wells contain quartz cement, indicating that fluids were moving through the Norphlet sandstone. Although the general application of this cause is suspect, the amount of pore fluids moving through the Norphlet may have been less than the amount moving through similar sandstones in other basins. More work, especially diagenetic modeling, is needed to focus on this problem.
Finally, several studies have focused on the dynamics of early evaporitic cements as a prime cause of excellent Norphlet porosity. The interpretation of the importance of early cements has polarized; Dixon and others (1989) concluded that early cements were of minor importance to deep porosity preservation, whereas Lock and Broussard (1989) believed that early cements were critical to porosity preservation. Our studies, as well as others, show that dolomite, calcite, anhydrite, and halite were early cements (Marzano and others, 1988) and that halite in particular is considered to be more significant in porosity preservation than has been generally realized (Hartman, 1968). Halite was observed in samples from several wells in the area extending from the Jackson Dome to southwestern Alabama. Halite is easily removed from core samples during normal preparation processes; in samples prepared with oil rather than water, more halite was observed (Rice and others, 1992). Thus, the amount of halite reported in core samples may be artificially low due to sample preservation. Halite probably formed before chlorite and before significant quartz cementation. It does not grow pseudomorphically within a pore system-that is, it does not peripherally replace framework minerals-so its removal leaves no trace of its former
presence, unlike carbonates or anhydrite. Studies continue on the significance of halite in porosity preservation.
To sum up, each of these five factors may be important locally, but focus is being placed on the regional aspects and the importance of the dynamics of early cementation and late dissolution as the main causes of porosity preservation in the Norphlet Formation.
SOURCE ROCKS
The productive area of the Norphlet Formation in the study area is characterized by oxidizing eolian and alluvial environments and transgressive marine depositional environments. Adequate hydrocarbon source rocks have not been identified in the Norphlet in its main productive area, south of the Wiggins arch.
The underlying Middle and Upper Jurassic Louann Salt forms a permeability barrier that seemingly rules out hydrocarbon migration into the Norphlet from older formations. The Norphlet is overlain by the Smackover Formation, which in turn is overlain by the Haynesville Formation. Evaporites in the lower part of the Haynesville Formation form an upper seal that appears to prevent hydrocarbon migration into the Norphlet-Smackover system from younger formations.
Perhaps because of a lack of other candidates, algal carbonate mudstones of the Smackover are commonly assumed to be the source rocks for hydrocarbons in Norphlet reservoirs (Sassen and others, 1987; Claypool and Mancini, 1989). This assumption is qualitative, however, and is not documented by mass-balance calculations. Measured total organic carbon values of selected Smackover samples from wells in Alabama rarely exceed 1.0 percent and more typically are 0.2-0.3 percent (Claypool and Mancini, 1989). The volume represented by these nonrandom samples is unknown but possibly is quite small.
Drilling results indicate that onshore Norphlet hydrocarbon potential is limited by adequate onshore source rocks. Many salt-related structures that have large closure are wet, and others have only a thin hydrocarbon column in the Norphlet (Bolin and others, 1989). Smackover production demonstrates that migrating oil and gas could reach these structures and that they are sealed. These circumstances suggest that the supply of hydrocarbons in onshore areas is generally insufficient to charge Norphlet traps.
In sharp contrast, offshore salt-related structures in the Norphlet contain very large volumes of hydrocarbons. Mancini and others (1987) estimated that the total reserves in State waters of Alabama range from 4.3 to 7.1 TCFG. T.J. Woods (Gas Research Institute, personal commun., 1992) estimated, on the basis of recent discoveries, that the gas resources of the Norphlet in the study area are tens of trillion cubic feet. The generalization can thus be made that the
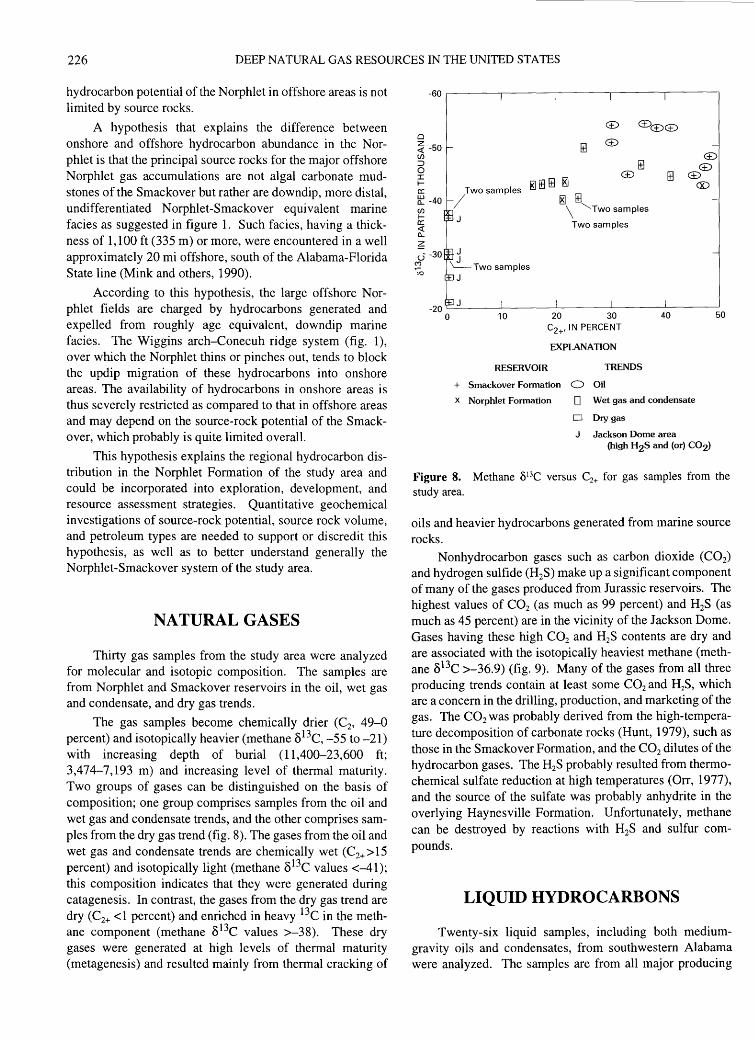
226 DEEP NATURAL GAS RESOURCES IN THE UNITED STATES
hydrocarbon potential of the Norphlet in offshore areas is not limited by source rocks.
A hypothesis that explains the difference between onshore and offshore hydrocarbon abundance in the Norphlet is that the principal source rocks for the major offshore Norphlet gas accumulations are not algal carbonate mudstones of the Smackover but rather are downdip, more distal, undifferentiated Norphlet -Smackover equivalent marine facies as suggested in figure 1. Such facies, having a thickness of 1,100 ft (335m) or more, were encountered in a well approximately 20 mi offshore, south of the Alabama-Florida State line (Mink and others, 1990).
According to this hypothesis, the large offshore Norphlet fields are charged by hydrocarbons generated and expelled from roughly age equivalent, downdip marine facies. The Wiggins arch-Conecuh ridge system (fig. 1), over which the Norphlet thins or pinches out, tends to block the updip migration of these hydrocarbons into onshore areas. The availability of hydrocarbons in onshore areas is thus severely restricted as compared to that in offshore areas and may depend on the source-rock potential of the Smackover, which probably is quite limited overall.
This hypothesis explains the regional hydrocarbon distribution in the Norphlet Formation of the study area and could be incorporated into exploration, development, and resource assessment strategies. Quantitative geochemical investigations of source-rock potential, source rock volume, and petroleum types are needed to support or discredit this hypothesis, as well as to better understand generally the Norphlet-Smackover system of the study area.
NATURAL GASES
Thirty gas samples from the study area were analyzed for molecular and isotopic composition. The samples are from Norphlet and Smackover reservoirs in the oil, wet gas and condensate, and dry gas trends.
The gas samples become chemically drier (C2, 49-0 percent) and isotopically heavier (methane o13C, -55 to -21) with increasing depth of burial (11,400-23,600 ft; 3,474-7,193 m) and increasing level of thermal maturity. Two groups of gases can be distinguished on the basis of composition; one group comprises samples from the oil and wet gas and condensate trends, and the other comprises samples from the dry gas trend (fig. 8). The gases from the oil and wet gas and condensate trends are chemically wet (C2+>15 percent) and isotopically light (methane o13C values <-41); this composition indicates that they were generated during catagenesis. In contrast, the gases from the dry gas trend are dry (C2+ <1 percent) and enriched in heavy 13c in the methane component (methane 813C values >-38). These dry gases were generated at high levels of thermal maturity (metagenesis) and resulted mainly from thermal cracking of
0
~-50 en :::)
0 :::c f-0:
~ -40 en f-0: <( a.. z u -30
M
00
Two samples
/ 181 IB \ '-....Two samples
Two samples
-20~----_J------~------~------~----~
0 1 0 20 30 40 50 C2+' IN PERCENT
EXPLANATION
RESERVOIR TRENDS
+ Smackover Formation 0 Oil
X Norphlet Formation 0 Wet gas and condensate
D Dry gas
J Jackson Dome area (high H2S and (or) C02)
Figure 8. Methane 813C versus C2+ for gas samples from the study area.
oils and heavier hydrocarbons generated from marine source rocks.
Nonhydrocarbon gases such as carbon dioxide (C02)
and hydrogen sulfide (H2S) make up a significant component of many of the gases produced from Jurassic reservoirs. The highest values of C02 (as much as 99 percent) and H2S (as much as 45 percent) are in the vicinity of the Jackson Dome. Gases having these high C02 and H2S contents are dry and are associated with the isotopically heaviest methane (methane o13c >-36.9) (fig. 9). Many of the gases from all three producing trends contain at least some C02 and H2S, which are a concern in the drilling, production, and marketing of the gas. The C02 was probably derived from the high-temperature decomposition of carbonate rocks (Hunt, 1979), such as those in the Smackover Formation, and the C02 dilutes of the hydrocarbon gases. The H2S probably resulted from thermochemical sulfate reduction at high temperatures (Orr, 1977), and the source of the sulfate was probably anhydrite in the overlying Haynesville Formation. Unfortunately, methane can be destroyed by reactions with H2S and sulfur compounds.
LIQUID HYDROCARBONS
Twenty-six liquid samples, including both mediumgravity oils and condensates, from southwestern Alabama were analyzed. The samples are from all major producing
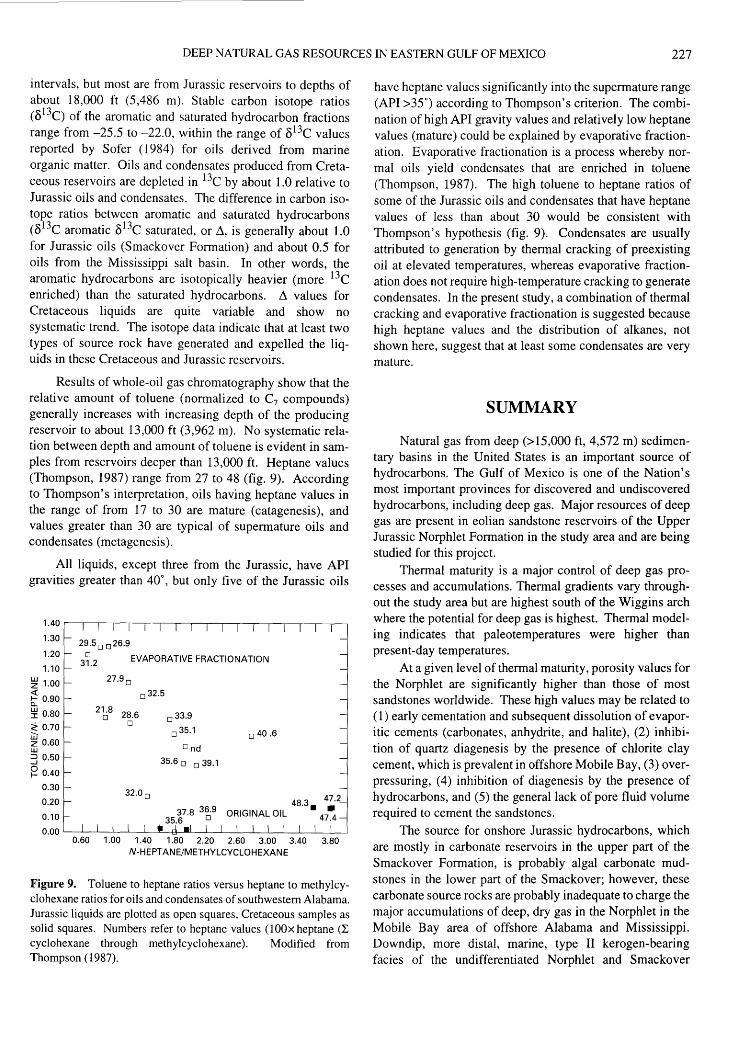
DEEP NATURAL GAS RESOURCES IN EASTERN GULF OF MEXICO 227
intervals, but most are from Jurassic reservoirs to depths of about 18,000 ft (5,486 m). Stable carbon isotope ratios (<513C) of the aromatic and saturated hydrocarbon fractions range from -25.5 to -22.0, within the range of <5 13C values reported by Sofer (1984) for oils derived from marine organic matter. Oils and condensates produced from Cretaceous reservoirs are depleted in 13C by about 1.0 relative to Jurassic oils and condensates. The difference in carbon isotope ratios between aromatic and saturated hydrocarbons (<5 13c aromatic <5 13c saturated, or ,1, is generally about 1.0 for Jurassic oils (Smackover Formation) and about 0.5 for oils from the Mississippi salt basin. In other words, the aromatic hydrocarbons are isotopically heavier (more 13C enriched) than the saturated hydrocarbons. Ll values for Cretaceous liquids are quite variable and show no systematic trend. The isotope data indicate that at least two types of source rock have generated and expelled the liquids in these Cretaceous and Jurassic reservoirs.
Results of whole-oil gas chromatography show that the relative amount of toluene (normalized to C7 compounds) generally increases with increasing depth of the producing reservoir to about 13,000 ft (3,962 m). No systematic relation between depth and amount of toluene is evident in samples from reservoirs deeper than 13,000 ft. Heptane values (Thompson, 1987) range from 27 to 48 (fig. 9). According to Thompson's interpretation, oils having heptane values in the range of from 17 to 30 are mature (catagenesis), and values greater than 30 are typical of supermature oils and condensates (metagenesis).
All liquids, except three from the Jurassic, have API gravities greater than 40°, but only five of the Jurassic oils
1. 40 r---.---.--------,---,-----,----,------,--,-,.-,---,--.---,----,-----,----,-----,--
1.30
1.20
1.10
~ 1.00 <( !i: 0.90
~ 0.80
~ 0.70
& 0.60 L.U
3 0.50
~ 0.40
0.30
0.20
0.10
29.5 0 0 26.9
3~. 2 EVAPORATIVE FRACTIONATION
27.90
0 32.5
2b8 28.6 O 33.9
0
o 35.1 O 40.6
0 nd
35.6 0 O 39.1
32.0 0 48 3 47.2 • • • 37.8 36·9 ORIGINAL OIL 47 _4 35.6 O
0. 00 L_____L___l_____l___j_____.J___~__g~____j-L__L___L___j_____L__L___j___L__J 0.60 1.00 1.40 1.80 2.20 2.60 3.00 3.40 3.80
N-HEPT ANE/METHYLCYCLOHEXANE
Figure 9. Toluene to heptane ratios versus heptane to methylcyclohexane ratios for oils and condensates of southwestern Alabama. Jurassic liquids are plotted as open squares, Cretaceous samples as solid squares. Numbers refer to heptane values (lOOx heptane (l: cyclohexane through methylcyclohexane). Modified from Thompson (1987).
have heptane values significantly into the supermature range (API >35°) according to Thompson's criterion. The combination of high API gravity values and relatively low heptane values (mature) could be explained by evaporative fractionation. Evaporative fractionation is a process whereby normal oils yield condensates that are enriched in toluene (Thompson, 1987). The high toluene to heptane ratios of some of the Jurassic oils and condensates that have heptane values of less than about 30 would be consistent with Thompson's hypothesis (fig. 9). Condensates are usually attributed to generation by thermal cracking of preexisting oil at elevated temperatures, whereas evaporative fractionation does not require high-temperature cracking to generate condensates. In the present study, a combination of thermal cracking and evaporative fractionation is suggested because high heptane values and the distribution of alkanes, not shown here, suggest that at least some condensates are very mature.
SUMMARY
Natural gas from deep(> 15,000 ft, 4,572 m) sedimentary basins in the United States is an important source of hydrocarbons. The Gulf of Mexico is one of the Nation's most important provinces for discovered and undiscovered hydrocarbons, including deep gas. Major resources of deep gas are present in eolian sandstone reservoirs of the Upper Jurassic Norphlet Formation in the study area and are being studied for this project.
Thermal maturity is a major control of deep gas processes and accumulations. Thermal gradients vary throughout the study area but are highest south of the Wiggins arch where the potential for deep gas is highest. Thermal modeling indicates that paleotemperatures were higher than present -day temperatures.
At a given level of thermal maturity, porosity values for the Norphlet are significantly higher than those of most sandstones worldwide. These high values may be related to (1) early cementation and subsequent dissolution of evaporitic cements (carbonates, anhydrite, and halite), (2) inhibition of quartz diagenesis by the presence of chlorite clay cement, which is prevalent in offshore Mobile Bay, (3) overpressuring, ( 4) inhibition of diagenesis by the presence of hydrocarbons, and (5) the general lack of pore fluid volume required to cement the sandstones.
The source for onshore Jurassic hydrocarbons, which are mostly in carbonate reservoirs in the upper part of the Smackover Formation, is probably algal carbonate mudstones in the lower part of the Smackover; however, these carbonate source rocks are probably inadequate to charge the major accumulations of deep, dry gas in the Norphlet in the Mobile Bay area of offshore Alabama and Mississippi. Downdip, more distal, marine, type II kerogen-bearing facies of the undifferentiated Norphlet and Smackover
228 DEEP NATURAL GAS RESOURCES IN THE UNITED STATES
interval are postulated to be the source for these offshore accumulations.
Gases in deep reservoirs of the Norphlet are distinguished by their dryness and by their enrichment in 13C, both of which indicate generation at high levels of thermal maturity (metagenesis). Gases in Jurassic reservoirs of the study area contain varying amounts of C02 and H2S, which have an inorganic origin and present problems in drilling, production, and marketing. Geochemical data indicate that liquids in deep Jurassic and Cretaceous reservoirs may have at least two sources. In addition, the condensates may have resulted from either (1) high-temperature cracking of heavier hydrocarbons or (2) evaporative fractionation.
REFERENCES CITED
Ajdukiewicz, J.M., Paxton, S.T., and Szabo, J.O., 1991, Deep porosity preservation in the Norphlet Formation, Mobile Bay, Alabama [abs.]: American Association of Petroleum Geologists Bulletin, v. 75, p. 533.
Bolin, D.E., Mann, S.D., Burroughs, D., Moore, H.E., Jr., and Powers, T.J., 1989, Petroleum atlas of southwestern Alabama: Geological Survey of Alabama Atlas 23, 218 p.
Claypool, G.E., and Mancini, E.A., 1989, Geochemical relationships of petroleum in Mesozoic reservoirs to carbonate source rocks of Jurassic Smackover Formation, southwest Alabama: American Association of Petroleum Geologists Bulletin, v. 73, p. 904-924.
Curtis, D.M., 1991, The northern Gulf of Mexico Basin, in Gluskoter, H.J., Rice, D.D., and Taylor, R.B., eds., Economic geology, U.S.: Geological Society of America, Boulder, Colorado, The Geology of North America, v. P-2A, p. 301-324.
Dixon, S.A., Summers, D.M., and Surdam, R.C., 1989, Diagenesis and preservation of porosity in the Norphlet Formation (Upper Jurassic), southern Alabama: American Association of Petroleum Geologists Bulletin, v. 73, p. 707-728.
Hartman, J.A., 1968, The Norphlet Formation, Pelahatchie field, Rankin County, Mississippi: Gulf Coast Association of Geological Societies Transactions, v. 18, p. 2-11.
Hunt, J.M., 1979, Petroleum geochemistry and geology: San Francisco, W.H. Freeman, 617 p.
Keighin, C.W., and Schenk, C.J., 1992, The ARC/INFO Geographic Information System applied to geologic investigations of the Norphlet Formation, Alabama and Mississippi [abs.]: U.S. Geological Survey Circular 1074, p. 41.
Law, B.E., Nuccio, V.F., and Barker, C.E., 1989, Kinky vitrinite reflectance well profiles-Evidence of paleopore pressure in low-permeability gas-bearing sequences in Rocky Mountain foreland basins: American Association of Petroleum Geologists Bulletin, v. 73, p. 999-1010.
Lock, B.E., and Broussard, S.W., 1989, The Norphlet reservoir in Mobile Bay; origins of deep porosity: Gulf Coast Association of Geological Societies Transactions, v. 39, p. 187-194.
Mancini, E.A., and Benson, D.J., 1980, Regional stratigraphy of Upper Jurassic Smackover carbonates of southwest Alabama:
Gulf Coast Association of Geological Societies Transactions, V. 30, p. 151-165.
Mancini, E.A., Mink, R.M., Bearden, B.L., and Hamilton, R.P., 1987, Recoverable natural gas reserves for the Jurassic Norphlet Formation, Alabama coastal area: Gulf Coast Association of Geological Societies Transactions, v. 37, p. 153-160.
Mancini, E.A., Mink, R.M., Bearden, B.L., and Wilkerson, R.P., 1985, Norphlet Formation (Upper Jurassic) of southwestern and offshore Alabama: American Association of Petroleum Geologists Bulletin, v. 69, p. 881-898.
Marzano, M.S., Pense, G.M., and Andronaco, P., 1988, A comparison of the Jurassic Norphlet Formation in Mary Ann field, Mobile Bay, Alabama, to onshore regional Norphlet trends: Gulf Coast Association of Geological Societies Transactions, v. 38, p. 85-100.
Mink, R.M., Bearden, B.L., and Mancini, E.A., 1989, Regional Jurassic geologic framework of Alabama coastal waters area and adjacent Federal waters area: Marine Geology, v. 90, p. 39-50.
Mink, R.M., Tew, B.H., Mann, S.D., Bearden, B.L., and Mancini, E.A., 1990, Norphlet and pre-Norphlet geologic framework of Alabama and panhandle Florida coastal waters area and adjacent Federal waters area: Geological Survey of Alabama Bulletin 140, 58 p.
NRG Associates Inc., 1988, The significant oil and gas fields of the United States (through June 30, 1988): Available from Nehring Associates, Inc., P.O. Box 1655, Colorado Springs, Colorado 80901.
Orr, W.L., 1977, Geologic and geochemical controls on the distribution of hydrogen sulfide in natural gas, in Campos, R., and Goni, J., eds., Advances in organic geochemistry 1977: Madrid, Empresa National Adaro de Investigaciones Mineras, v. 7, p. 571-597.
Pollastro, R.M., 1991, Composition, clay mineralogy, and diagenesis of the Simpson Group (Middle Ordovician), Grady County, Oklahoma: U.S. Geological Survey Bulletin 1866-H, 19 p.
Rice, D.D., Schenk, C.J., Schmoker, J.W., Fox, J.E., Clayton, J.L., Dyman, T.S., Higley, D.K., Keighin, C.W., Law, B.E., and Pollastro, R.M., 1992, in Malone, R.D., Shoemaker, Harold, and Byer, C.W., eds., Proceedings of the natural gas research and development contractors review meeting: U.S. Department of Energy DOE/METC 92/6125, p. 151-166.
Sassen, R., Moore, C.H., and Meendsen, F.C., 1987, Distribution of hydrocarbon source potential in the Jurassic Smackover Formation: Organic Geochemistry, v. 11, p. 379-383.
Schenk, C.J., 1990, Overview of eolian sandstone diagenesis, Upper Jurassic Denkman Sandstone Member of the Norphlet Formation, Mississippi and Alabama, in Fryberger, S.G., Krystinik, L.F., and Schenk, C.J., eds., Modern and ancient eolian deposits-Petroleum exploration and production: Denver, Rocky Mountain Section, SEPM, v. 20, 12 p.
Schmoker, J.W., and Gautier, D.L., 1988, Sandstone porosity as a function of thermal maturity: Geology, v. 16, p. 1007-1010.
---1989, Compaction of basin sediments: modeling based on time-temperature history: Journal of Geophysical Research, v.94,p. 7379-7386.

DEEP NATURAL GAS RESOURCES IN EASTERN GULF OF MEXICO 229
Schmoker, J.W., and Higley, D.K., 1991, Porosity trends of the Lower Cretaceous J sandstone, Denver Basin, Colorado: Journal of Sedimentary Petrology, v. 61, p. 909-920.
Sofer, Z., 1984, Stable carbon isotope compositions of crude oils: American Association of Petroleum Geologists Bulletin, v. 68, p. 31-49.
Thompson, A., and Stancliffe, R.J., 1990, Diagenetic controls on reservoir quality, eolian Norphlet Formation, South State Line
field, Mississippi, in Barwis, J.H., McPherson, J.G., and Studlick, J.R.L., eds., Sandstone petroleum reservoirs: New York, Springer-Verlag, p. 205-224.
Thompson, K.F.M., 1987, Fractionated aromatic petroleums and the generation of gas-condensates: Organic Geochemistry, v. 11, p. 573-590.
Wilson, G.V., and Tew, B.H., 1985, Geothermal data for southwest Alabama: State Oil and Gas Board of Alabama Oil and Gas Report 10, 125 p.


Assessment Methodology for Deep Natural Gas Resources
By G.L. Dolton and R.A. Crovelli
GEOLOGIC CONTROLS OF DEEP NATURAL GAS RESOURCES IN THE UNITED STATES
U.S. GEOLOGICAL SURVEY BULLETIN 2146-0
UNITED STATES GOVERNMENT PRINTING OFFICE, WASHINGTON: 1997

CONTENTS
Abstract ........................................................................................................................... 233 Introduction ..................................................................................................................... 233 Deposit Simulation .......................................................................................................... 234 Reservoir Performance .................................................................................................... 235 Analogy ........................................................................................................................... 235 Discovery Process and Finding Rates ............................................................................. 235 Mass Balance .................................................................................................................. 235 Areal or Volumetric Yield Methods ............................................................................... 236 Application of a Deposit Simulation Model-Hypothetical Play Example ................... 236 References Cited ............................................................................................................. 238
FIGURE
1. Oil and gas appraisal data form completed for hypothetical deep natural gas play ........................................................ 237
TABLES
1. Results of calculation of modeled deep natural gas play based on input in this report--conservative case ................... 238 2. Results of calculation of modeled deep natural gas play based on input in this report-optimistic case ....................... 238
Assessment Methodology for Deep Natural Gas Resources
By G.L. Dolton and R.A. Crovelli
ABSTRACT
Review and analysis of resource appraisal methodologies allows identification of several that are particularly suited for dealing with the more common types of deep gas occurrences. Choice of a particular method is ultimately dependent on the level of geologic and engineering data available and on an understanding of the geologic model for a subject occurrence, the objectives of the assessment, and the manpower and time resources available. The methodologies considered appropriate are deposit simulation, reservoir performance, discovery process and finding rate, mass balance, and volumetric or areal yield methods. An example of a deposit simulation is provided, showing sensitivity of various input parameters.
INTRODUCTION
The U.S. Geological Survey previously published an assessment of undiscovered recoverable oil and gas resources in the United States (Mast and others, 1989) but did not include unconventional resources. Deep natural gas resources were extrapolated by depth from known plays. In the present study, emphasis was placed on developing assessment methodologies that best deal with deep natural gas resources. In this paper, therefore, we (1) identify and develop quantitative resource assessment methods and models for evaluation of undiscovered deep gas resources, based on geologic models of occurrence and information developed through geologic research, and (2) present a modeled assessment of a hypothetical deep gas play in order to better understand the wide range of resources that results when geologic variables change.
Review and analysis of resource appraisal methodologies allows identification of methodologies for dealing with some of the more common types of deep gas occurrences. These methods are ultimately dependent on the level of geologic and engineering data available and on an understanding of the geologic model for specific deep gas occurrences, objectives of the assessment, and time and manpower resources available. One or more methodologies may be
appropriate in a given case, and the use of multiple methodologies allows independent checks. In general, we feel that methods which lead to assessment of accumulation sizes and numbers are preferable because they allow effective modeling for economic and supply purposes. At a play level, this approach has been used by various workers and is generally described by Baker and others ( 1984, p. 426).
Assessments of undiscovered oil and gas potentials for a group of geologically related, untested prospects can be effectively made from an estimate of the possible ranges in number and size of potential fields, assuming that the play exists, coupled with an evaluation of geologic risks that it might not exist. Field-size distributions are constructed from known-field reserves in geologically similar plays, from assessments of representative prospects in the play, or from simulations of distributions of the play's prospect areas, reservoir parameters and potential hydrocarbon relations** *The possible range of numbers of potential fields is estimated from counted and postulated numbers of untested prospects in conjunction with the success ratio, or from look-alike field densities.
Several underlying methods used in such assessments are discussed separately in the following section, as are more general approaches.
The general methods of assessment that probably are most appropriate to assessment of undiscovered resources of deep gas include (1) deposit simulation, (2) reservoir performance, (3) analogy, (4) discovery process and finding rate models, (5) mass balance models, and (6) volumetric and areal yield determinations. For a general review of overall methodologies and their characteristics, the reader is referred to White (1978), Dolton (1984), and Charpentier and Wesley (1986). These basic methods can be applied at various levels-basin, major stratigraphic unit, play, or prospect-and, to some degree, they overlap.
The specific assessment methodology employed depends to a large extent on the intended use of the assessment, time and manpower constraints, the geologic model used, and the geologic and engineering data available for synthesis and analysis. The level of assessment that is appropriate, whether at the basin, play, petroleum system, or other level, is likewise determined by these factors and the objectives of the assessment. Geologic information in our companion studies (chapters, this volume) indicates that many deep gas occurrences should be assessed at a play level utilizing a method that provides information on the size of
233

234 DEEP NATURAL GAS RESOURCES IN THE UNITED STATES
the deposits and their geologic characteristics, as well as an aggregate value, such that economic and supply studies can be made.
DEPOSIT SIMULATION
The deposit simulation method is a volumetric calculation of resources based on measurement or estimation of physical properties of the traps, reservoir rocks and fluids, and host environment in terms of temperatures, pressures, and fluid dynamics. This method has the advantage of working directly with the basic geologic properties of the accumulations and dealing with these properties in a rigorous, quantitative manner. It allows for simulation of the hydrocarbon deposit(s) through modeling of their geologic properties. Because the parameters are uncertain quantities, they are represented by estimates expressed as ranges of values with probabilities of occurrence (probability distributions). The approach therefore uses stochastic and probabilistic methods, as well as statistical methods. An example of input for this type of approach is shown in table 1 (later). A general resource assessment model using these inputs has been described by Canada Department of Energy, Mines, and Resources (1977), U.S. Department of Interior (1979), Dolton and others (1987), and Crovelli and Balay (1986, 1988, 1990).
The calculation of gas volume of a deposit is based on a fundamental reservoir engineering formula. Basic to calculation, therefore, is determination of reservoir volume. The dimension of this container is critical, whether it be a single homogeneous reservoir rock in a conventional trap, a compartment of lesser size within a larger heterogeneous reservoir, or a heterogeneous reservoir of great size associated with an unconventional basin-center gas occurrence.
The modeling of gas-saturated reservoir volumes is affected by various geometric constraints. White (1987) and Abrahamsen (1989) discussed some of these geometric considerations as they may be applied to reservoir thicknesses within closures. For example, reservoir thickness is a function not only of the available stratigraphic thickness of the reservoir unit and effective porosity within it but also of the position of the gas-water contact and the configuration and size of the trap and its fractional fill. Geometric considerations become particularly significant if available reservoir rock thickness is great relative to closure area (as in many fields in the gas-productive Lower Ordovician Ellenberger Group of the deep Permian Basin) or if dealing with small vertical closures, small fractional fill, or small areal trap sizes. If mapping is sufficient, thickness can be measured, or, alternatively, gross hydrocarbon-bearing reservoir volume can be calculated directly from planimetered areas (Pirson, 1950), thereby collapsing the variables of reservoir thickness, area, and trap fill into a single variable of hydrocarbon-occupied reservoir.
The internal physical characteristics of the reservoir that determine hydrocarbon volumes are porosity and water saturation. Porosity values used must meet an assigned threshold value to qualify as "effective porosity." It is important that this same minimum value be adhered to in terms of measurement of reservoir thickness and risking of attributes. Water saturation can be estimated directly (as in the input example) or determined using an algorithm that relates water saturation to the average porosity of the reservoir.
Adjustment for nonhydrocarbon gas volumes that may occupy pore space is made simply through introduction of an estimate of the fractional percentage of hydrocarbon gas. This adjustment is an especially important element in such deep gas areas as the Delaware-Val Verde Basin of West Texas and deep gas reservoirs of southwestern Wyoming and probably is important in many other deep gas basins.
It is essential to consider engineering factors, including estimation of the thermal and pressure conditions of the simulated reservoir and trap. In addition, it is necessary to calculate the compressibility factor of the gas (Z), based on known or estimated gas composition.
Adequate framing of the basic geologic model or models of occurrence is essential to assessment in terms of assignment of risk to the variables controlling the occurrence of gas and to the assessment of volume parameters. The rock and fluid characteristics identified and investigated in companion studies are critical and include physical properties of reservoirs such as thickness; distribution; porosity amount and variation; pore geometry and dimensions; trap types and dimensions; effectiveness of seals; physical environments of accumulations including depth, present and past thermal conditions, pressure regimes, and fluid dynamics; and saturations and properties of the involved fluids, their composition and physical state. Availability of data for these characteristics and their sufficient quantification ultimately determine the adequacy of results. Development of relevant databases is a requirement for assessment.
The simulation method provides not only an overall resource assessment but also a description of the individual accumulations in terms of their geologic characteristics and their contained gas, and it affords an easily updatable assessment record. It estimates resources in situ and does not tell the user directly about the recoverability or producing characteristics of the resources, although permitting use of known or estimated recovery factor. The method is flexible in that it allows the geologist to model the geologic conditions controlling the resource and allows for a range of resource values for uncertain and variable geologic conditions.
The actual production characteristics of reservoirs that lead to recoverability are best determined by engineering studies of the reservoir rock and fluids, including reservoir drive and pressure characteristics, reservoir rock
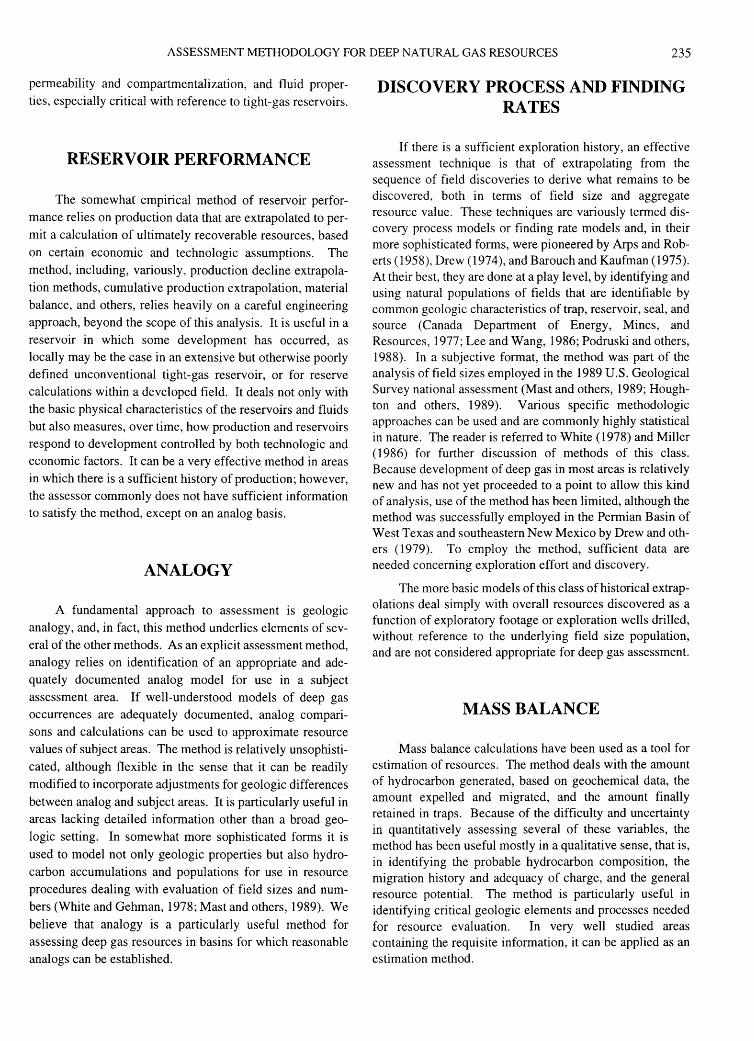
ASSESSMENT METHODOLOGY FOR DEEP NATURAL GAS RESOURCES 235
permeability and compartmentalization, and fluid properties, especially critical with reference to tight-gas reservoirs.
RESERVOIR PERFORMANCE
The somewhaf empirical method of reservoir performance relies on production data that are extrapolated to permit a calculation of ultimately recoverable resources, based on certain economic and technologic assumptions. The method, including, variously, production decline extrapolation methods, cumulative production extrapolation, material balance, and others, relies heavily on a careful engineering approach, beyond the scope of this analysis. It is useful in a reservoir in which some development has occurred, as locally may be the case in an extensive but otherwise poorly defined unconventional tight-gas reservoir, or for reserve calculations within a developed field. It deals not only with the basic physical characteristics of the reservoirs and fluids but also measures, over time, how production and reservoirs respond to development controlled by both technologic and economic factors. It can be a very effective method in areas in which there is a sufficient history of production; however, the assessor commonly does not have sufficient information to satisfy the method, except on an analog basis.
ANALOGY
A fundamental approach to assessment is geologic analogy, and, in fact, this method underlies elements of several of the other methods. As an explicit assessment method, analogy relies on identification of an appropriate and adequately documented analog model for use in a subject assessment area. If well-understood models of deep gas occurrences are adequately documented, analog comparisons and calculations can be used to approximate resource values of subject areas. The method is relatively unsophisticated, although flexible in the sense that it can be readily modified to incorporate adjustments for geologic differences between analog and subject areas. It is particularly useful in areas lacking detailed information other than a broad geologic setting. In somewhat more sophisticated forms it is used to model not only geologic properties but also hydrocarbon accumulations and populations for use in resource procedures dealing with evaluation of field sizes and numbers (White and Gehman, 1978; Mast and others, 1989). We believe that analogy is a particularly useful method for assessing deep gas resources in basins for which reasonable analogs can be established.
DISCOVERY PROCESS AND FINDING RATES
If there is a sufficient exploration history, an effective assessment technique is that of extrapolating from the sequence of field discoveries to derive what remains to be discovered, both in terms of field size and aggregate resource value. These techniques are variously termed discovery process models or finding rate models and, in their more sophisticated forms, were pioneered by Arps and Roberts (1958), Drew (1974), and Barouch and Kaufman (1975). At their best, they are done at a play level, by identifying and using natural populations of fields that are identifiable by common geologic characteristics of trap, reservoir, seal, and source (Canada Department of Energy, Mines, and Resources, 1977; Lee and Wang, 1986; Podruski and others, 1988). In a subjective format, the method was part of the analysis of field sizes employed in the 1989 U.S. Geological Survey national assessment (Mast and others, 1989; Houghton and others, 1989). Various specific methodologic approaches can be used and are commonly highly statistical in nature. The reader is referred to White (1978) and Miller (1986) for further discussion of methods of this class. Because development of deep gas in most areas is relatively new and has not yet proceeded to a point to allow this kind of analysis, use of the method has been limited, although the method was successfully employed in the Permian Basin of West Texas and southeastern New Mexico by Drew and others (1979). To employ the method, sufficient data are needed concerning exploration effort and discovery.
The more basic models of this class of historical extrapolations deal simply with overall resources discovered as a function of exploratory footage or exploration wells drilled, without reference to the underlying field size population, and are not considered appropriate for deep gas assessment.
MASS BALANCE
Mass balance calculations have been used as a tool for estimation of resources. The method deals with the amount of hydrocarbon generated, based on geochemical data, the amount expelled and migrated, and the amount finally retained in traps. Because of the difficulty and uncertainty in quantitatively assessing several of these variables, the method has been useful mostly in a qualitative sense, that is, in identifying the probable hydrocarbon composition, the migration history and adequacy of charge, and the general resource potential. The method is particularly useful in identifying critical geologic elements and processes needed for resource evaluation. In very well studied areas containing the requisite information, it can be applied as an estimation method.

236 DEEP NATURAL GAS RESOURCES IN THE UNITED STATES
AREAL OR VOLUMETRIC YIELD METHODS
These methods use basic geologic data and areas or volumes of rock for calculation of resources. Yields of hydrocarbons per unit of rock, obtained from analog areas, are used as the basis for calculation of resources in a subject area. The method can be used on a basin, play, or stratigraphic unit scale. The result is only as good as the analogy, which can be either internal or external, and the information regarding its hydrocarbons. Comparability factors are commonly used in modifying the yield factors to more closely model the subject area. If a strong analogy can be established, a useful estimate can be obtained in areas for which detailed geologic data may be lacking. These methods might be particularly useful in assessment of deep gas resources of some areas of the Rocky Mountains.
APPLICATION OF A DEPOSIT SIMULATION MODEL
HYPOTHETICAL PLAY EXAMPLE
Several of the preceding methods meet criteria for evaluation of undiscovered deep gas resources. If sufficient information is available concerning the geologic characteristics of known or suspected deposits of deep gas, we believe that a deposit simulation based on a geologic model of reservoir volume is effective. As discussed previously, this method is based on measurement of known or estimated physical properties of the traps, reservoir rocks and fluids, and host environment in terms of temperature, pressure, and fluid dynamics. It has the advantage of working with the basic geologic properties of the accumulations and dealing with them in a rigorous, quantitative manner, and it allows for simulation of the hydrocarbon deposit(s) through estimation of properties if data are lacking or incomplete.
The calculation of gas resources is based on a funda-mental reservoir engineering formula, expressed as
Gas volume (ft3)= 43,560 AxFxHxPorX( 1-Sw )(Pr/Tr)( 1/Z)(Tsc/ Psc)
where A=area of closure (acres) F=trap fill (decimal fraction) H=reservoir thickness (feet) Por=porosity (decimal fraction) Sw=water saturation (decimal fraction) Pr=original reservoir pressure (pounds per square inch) Tr=reservoir temperature (degrees Rankine) Psc=pressure, standard conditions (pounds per square
inch) Tsc=temperature (degrees Rankine) Z=gas compressibility factor.
Simulation of properties of the accumulation, or an aggregate of accumulations, requires that the parameters are represented as estimates expressed as ranges of values, accompanied by probabilities of occurrence (probability distributions), representing the natural geologic variability of geologic characteristics and our uncertainty about them. Hence, the values shown represent the range of possibilities that might be encountered at a randomly selected prospect within a population. The model can be used either at the scale of a single prospect or for an aggregate of prospects within a common geologic setting or play.
We present an example of a deep gas occurrence in a hypothetical basin and use of this model. Several basins in the United States meet the requirements for the conditions for this model including the Anadarko Basin, the Gulf Coast Basin, and several deep Rocky Mountain basins. This exercise is intended to demonstrate the use and flexibility of this model rather than to provide an actual assessment of recoverable resources. In this case, we assume a population of drillable prospects, which have been identified geologically or geophysically or are hypothesized to exist, that we believe have common geologic characteristics. We estimate that we are dealing with a sandstone reservoir in structural traps at depths ranging from 5,486 to 6,706 m (18,000-22,000 ft).
The input used for this example is shown in figure 1. In this case, we assume that the various play attributes for hydrocarbon occurrence have been met; hence, no risk has been assigned. If questionable, then a probability of occurrence of less than one would be assigned.
In the case of the prospect attributes, we believe that there is a possibility that they may not be present or favorable at a randomly selected prospect. For instance, we consider that, on an individual prospect basis or at a randomly selected prospect, the trapping mechanism or trapping configuration we envision has a 6 in 10 chance of existence (probability of trapping mechanism=0.6) and also that the necessary migration paths from source rocks to the trap have a 7 in 10 chance of existence (probability of hydrocarbon accumulation=0.7). Each attribute is assessed conditioned on the other attributes being favorable and also on the basis of being sufficient to meet the minimum values for hydrocarbon volume parameters of the deposits to be considered (indicated in the lower part of the form, fig. 1 ).
For the hydrocarbon volume parameters, we use the general characteristics and properties of deep gas deposits or occurrences, which are documented elsewhere in the companion chapters. In this case, we require minimum values to be area of closure=300 acres; reservoir thickness= 10 ft; effective porosity=5 percent; trap fill=10 percent; and hydrocarbon saturation=60 percent. The program FASPU (Crovelli and Balay, 1990) was used to calculate the estimates.
Results from calculation of the modeled play are shown in table 1. Several interesting relationships emerge from this calculation. First, a relatively modest amount of gas is calculated, given the given prospect areal sizes. This result is

ASSESSMENT METHODOLOGY FOR DEEP NATURAL GAS RESOURCES
PROBABILITY OF FAVORABLE ATTRIBUTE OR PRESENT
Hydrocarbon Source 1.0 ffl ()) ...... ::l Timing 1.0 ~ I-< ...... ...... Migration 1.0 -< :>-., (1j
Potential Reservoir Facies 1.0 ~
Marginal Play Probability 1.0
Trapping Mechanism 0.6 ffl ...... ()) u ......
()) ::l Effective Porosity (>3%) 1.0 o...a ffl 1-< Ojj
0.7 A::~ Hydrocarbon Accumulation
Conditional Deposit Probability 0.42
Sand X Reservoir Lithology
Carbonate
Gas 1.0 Hydrocarbon type
Oil 0 ffl I-<
~ ()) ......
Probability of equal to or greater than ()) s (1j I-< (1j 100 95 75 50 25 5 0 ~ e ()) s ::l Area of Closure (1000 acres) 0.3 0.4 0.9 1.7 3.0 4.6 6.2 0 > r::' Reservoir Thickness I 10 20 35 50 70 100 120 0
vertical closure (feet) ..0 I-< (1j u 0
Effective Porosity(%) I-< 5 5.2 6 8 10 14 20 "'d :>-l:
Trap Fill (%) 10 25 45 60 75 90 100
Reservoir Depth (1000 feet) 18 18.75 19.5 20 20.5 21.25 22
HC Saturation(%) 60 65 70 75 80 85 90
Number of drillable prospects 10 12 14 15 17 20 22 (a play characteristic)
Figure 1. Oil and gas appraisal data form completed for hypothetical deep natural gas play. Geologic variables: Pr (original reservoir pressure [psi])=0.46 psi/ft (depth)+l4.7 psi; Tr (reservoir temperature [·Rankine])=surface temperature+0.013./ft (depth)+515·; Z (gas compressibility factor)=l.2; gas recovery factor 0.80. From Crovelli and Balay (1988).
237
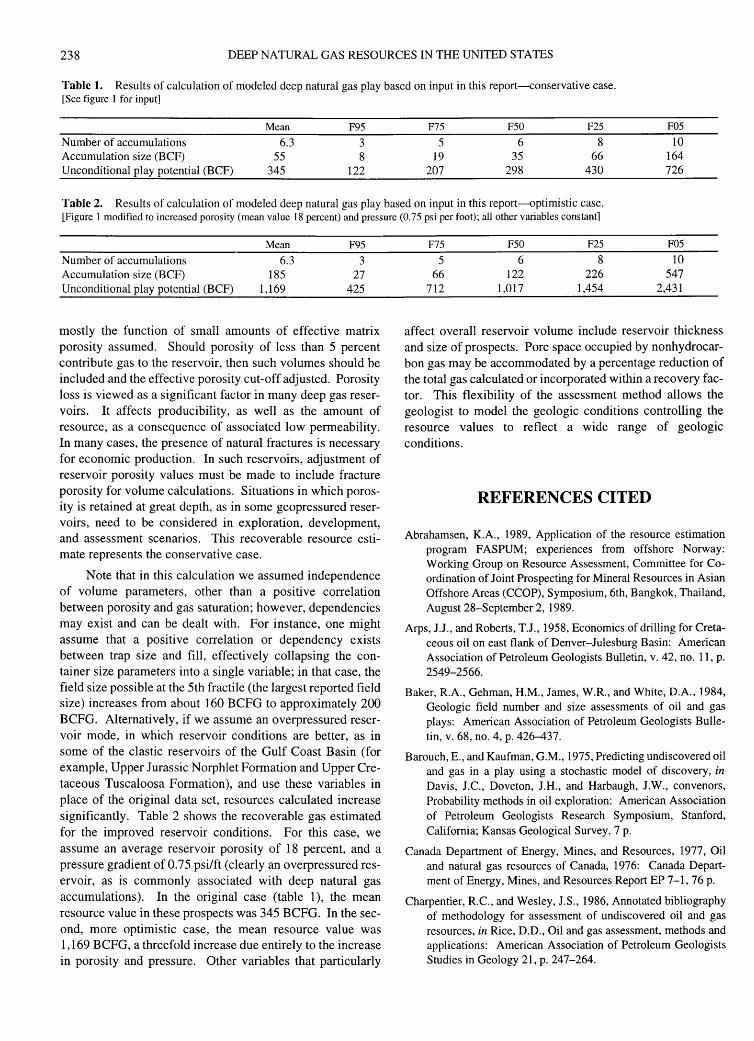
238 DEEP NATURAL GAS RESOURCES IN THE UNITED STATES
Table 1. Results of calculation of modeled deep natural gas play based on input in this report-conservative case. [See figure 1 for input]
Number of accumulations Accumulation size (BCF) Unconditional play potential (BCF)
Mean
6.3 55
345
F95
3 8
122
F75
5 19
207
F50
6 35
298
F25
8 66
430
F05
10 164 726
Table 2. Results of calculation of modeled deep natural gas play based on input in this report-optimistic case. [Figure 1 modified to increased porosity (mean value 18 percent) and pressure (0.75 psi per foot); all other variables constant]
Number of accumulations Accumulation size (BCF) Unconditional play potential (BCF)
Mean
6.3 185
1,169
F95
3 27
425
mostly the function of small amounts of effective matrix porosity assumed. Should porosity of less than 5 percent contribute gas to the reservoir, then such volumes should be included and the effective porosity cut-off adjusted. Porosity loss is viewed as a significant factor in many deep gas reservoirs. It affects producibility, as well as the amount of resource, as a consequence of associated low permeability. In many cases, the presence of natural fractures is necessary for economic production. In such reservoirs, adjustment of reservoir porosity values must be made to include fracture porosity for volume calculations. Situations in which porosity is retained at great depth, as in some geopressured reservoirs, need to be considered in exploration, development, and assessment scenarios. This recoverable resource estimate represents the conservative case.
Note that in this calculation we assumed independence of volume parameters, other than a positive correlation between porosity and gas saturation; however, dependencies may exist and can be dealt with. For instance, one might assume that a positive correlation or dependency exists between trap size and fill, effectively collapsing the container size parameters into a single variable; in that case, the field size possible at the 5th fractile (the largest reported field size) increases from about 160 BCFG to approximately 200 BCFG. Alternatively, if we assume an overpressured reservoir mode, in which reservoir conditions are better, as in some of the clastic reservoirs of the Gulf Coast Basin (for example, Upper Jurassic Norphlet Formation and Upper Cretaceous Tuscaloosa Formation), and use these variables in place of the original data set, resources calculated increase significantly. Table 2 shows the recoverable gas estimated for the improved reservoir conditions. For this case, we assume an average reservoir porosity of 18 percent, and a pressure gradient of 0.75 psi/ft (clearly an overpressured reservoir, as is commonly associated with deep natural gas accumulations). In the original case (table 1), the mean resource value in these prospects was 345 BCFG. In the second, more optimistic case, the mean resource value was 1,169 BCFG, a threefold increase due entirely to the increase in porosity and pressure. Other variables that particularly
F75
5 66
712
F50
6 122
1,017
F25
8 226
1,454
F05
10 547
2,431
affect overall reservoir volume include reservoir thickness and size of prospects. Pore space occupied by nonhydrocarbon gas may be accommodated by a percentage reduction of the total gas calculated or incorporated within a recovery factor. This flexibility of the assessment method allows the geologist to model the geologic conditions controlling the resource values to reflect a wide range of geologic conditions.
REFERENCES CITED
Abrahamsen, K.A., 1989, Application of the resource estimation program FASPUM; experiences from offshore Norway: Working Group on Resource Assessment, Committee for Coordination of Joint Prospecting for Mineral Resources in Asian Offshore Areas (CCOP), Symposium, 6th, Bangkok, Thailand, August 28-September 2, 1989.
Arps, J.J., and Roberts, T.J., 1958, Economics of drilling for Cretaceous oil on east flank of Denver-Julesburg Basin: American Association of Petroleum Geologists Bulletin, v. 42, no. 11, p. 2549-2566.
Baker, R.A., Gehman, H.M., James, W.R., and White, D.A., 1984, Geologic field number and size assessments of oil and gas plays: American Association of Petroleum Geologists Bulletin, v. 68, no. 4, p. 426-437.
Barouch, E., and Kaufman, G.M., 1975, Predicting undiscovered oil and gas in a play using a stochastic model of discovery, in Davis, J.C., Doveton, J.H., and Harbaugh, J.W., convenors, Probability methods in oil exploration: American Association of Petroleum Geologists Research Symposium, Stanford, California; Kansas Geological Survey, 7 p.
Canada Department of Energy, Mines, and Resources, 1977, Oil and natural gas resources of Canada, 1976: Canada Department of Energy, Mines, and Resources Report EP 7-1,76 p.
Charpentier, R.C., and Wesley, J.S., 1986, Annotated bibliography of methodology for assessment of undiscovered oil and gas resources, in Rice, D.D., Oil and gas assessment, methods and applications: American Association of Petroleum Geologists Studies in Geology 21, p. 247-264.

ASSESSMENT METHODOLOGY FOR DEEP NATURAL GAS RESOURCES 239
Crovelli, R.A., and Balay, R.H., 1986, FASP, an analytic resource appraisal program for petroleum play analysis: Computers and Geosciences, v. 12, no. 4B, p. 423-475.
1988, FASPUM metric version-Analytic petroleum resource appraisal microcomputer programs for play analysis using a reservoir-engineering model: U.S. Geological Survey OpenFile Report 87-414-A, 14 p.
1990, FASPU English and metric version-Analytic petroleum resource appraisal microcomputer programs for play analysis using a reservoir-engineering model: U.S. Geological Survey Open-File Report 90-509-B, 23 p.
Crovelli, R.A., Mast, R.F., Dolton, G.L., and Balay, R.H., 1989, Assessment methodology for estimation of undiscovered petroleum resources in play analysis of the United States and aggregation methods, in National assessment of undiscovered conventional oil and gas resources, USGS-MMS working paper: U.S. Geological Survey Open-File Report 88-373, p. 34-46.
Dolton, G.L., 1984, Basin assessment methods and approaches in the U.S. Geological Survey, in Masters, C.D., ed., Petroleum resource assessment: International Union of Geological Sciences Publication 17, p. 4-23.
Dolton, G.L., Bird, K.J., and Crovelli, R.A., 1987, Assessment of in-place oil and gas resources, in Bird, K.J., and Magoon, L.B., eds., Petroleum geology of the northern part of the Arctic National Wildlife Refuge, northeastern Alaska: U.S. Geological Survey Bulletin 1778, p. 277-298.
Drew, L.J., 1974, Estimation of petroleum exploration success and the effects of resource base exhaustion via a simulation model: U.S. Geological Survey Bulletin 1328, 25 p.
Drew, L.J., Root, D.H., and Bawiec, W.J., 1979, Estimating future rates of petroleum discoveries in the Permian Basin: Hydrocarbon Economics and Evaluation Symposium, 8th, Dallas, Texas, Proceedings of Petroleum Engineers-AIME, p. 101-109.
Houghton, J.C., Dolton, G.L., Mast, R.F., Masters, C.D., and Root, D.H., 1989, The estimation procedure for field size distributions in the U.S. Geological Survey's National oil and
Manuscript approved for publication July 7, 1995 Published in the Central Region, Denver, Colorado Graphics and photocomposition by Gayle M. Dumonceaux Edited by Judy Stoeser; completed for printing by Lorna Carter
14 U.S. GOVERNMENT PRINTING OFFICE: 1997 - 57 3-046 / 20069 REGION NO. 8
gas resource assessment, in National assessment of undiscovered conventional oil and gas resources, USGS-MMS working paper: U.S. Geological Survey Open-File Report 88-373, p. 51-86.
Lee, P.J., 1986, Evaluation of petroleum resources from pool size distributions, in Rice, D.O., ed., Oil and gas assessment, methods and applications: American Association of Petroleum Geologists Studies in Geology 21, p. 33-42.
Mast, R.F., Dolton, G.L., Crovelli, R.A., Root, D.H., Attanasi, E.D., Martin, P.E., Cooke, L.W., Carpenter, G.B., Pecora, W.C., and Rose, M.B., 1989, Estimates of undiscovered conventional oil and gas resources in the United States-A part of the Nation's energy endowment: U.S. Geological Survey and Minerals Management Service, 44 p.
Miller, B.M., 1986, Resource appraisal methods-Choice and outcome, in Rice, D.D., Oil and gas assessment, methods and applications: American Association of Petroleum Geologists Studies in Geology 21, p. 1-24.
Pirson S.J., 1950, Elements of reservoir engineering: McGrawHill, 441 p.
Podruski, J.A., Barclay, J.E., Hamblin, A.P., Lee, P.J., Osadetz, K.G., Procter, R.M., and Taylor, G.C., 1988, Part 1-Resource endowment, in Conventional oil resources of western Canada: Geological Survey of Canada Paper 87-26, p. 7-14.
U.S. Department of the Interior, Office of Mineral Policy and Research Analysis, 1979, Final report of the 105(b) economic and policy analysis: Washington, D.C., U.S. Government Printing Office, 145 p.
White, D.A., 1987, Methods of oil and gas prospect and play assessment course manual: Oil & Gas Consultants International.
White, D.A., and Gehman, H.M., 1978, Methods of estimating oil and gas resources: American Association of Petroleum Geologists Bulletin v. 63, no. 12, p. 2183-2192.