Genotype by Diabetes Interaction Effects on the Detection of Linkage of Glomerular Filtration Rate...
29
Genotype by Diabetes Interaction Effects on the Detection of Linkage of Glomerular Filtration Rate (GFR) to a Region on Chromosome 2q in Mexican Americans Sobha Puppala Ph.D 1 , Rector Arya Ph.D 2 , Farook Thameem Ph.D 3 , Nedal H. Arar Ph.D 3 , Kusum Bhandari M.D 2 , Donna M. Lehman Ph.D 2 , Jennifer Schneider B.A 1 , Sharon Fowler M.P.H 2 , Vidya S. Farook Ph.D 1 , Vincent P. Diego Ph.D 1 , Laura Almasy Ph.D 1 , John Blangero Ph.D 1 , Michael P. Stern M.D 2 , Ravindranath Duggirala Ph.D 1 and Hanna E. Abboud M.D 3 1 Department of Genetics, Southwest Foundation for Biomedical Research, San Antonio, TX 2 Division of Clinical Epidemiology, Department of Medicine, University of Texas Health Science Center at San Antonio, San Antonio, TX 3 Division of Nephrology, Department of Medicine, University of Texas Health Science Center, San Antonio, TX. Running title: Genotype by Diabetes Interaction effects on Glomerular Filtration Rate Received for publication 14 July 2006 and accepted in revised form 6 August 2007. Diabetes Publish Ahead of Print, published online September 27, 2007 Copyright American Diabetes Association, Inc., 2007
Transcript of Genotype by Diabetes Interaction Effects on the Detection of Linkage of Glomerular Filtration Rate...
Genotype by Diabetes Interaction Effects on the Detection of Linkage of Glomerular Filtration Rate (GFR) to a Region on Chromosome 2q in Mexican Americans
Sobha Puppala Ph.D1, Rector Arya Ph.D2, Farook Thameem Ph.D3, Nedal H. Arar Ph.D3, Kusum Bhandari M.D2, Donna M. Lehman Ph.D2, Jennifer Schneider B.A1, Sharon Fowler M.P.H2, Vidya S. Farook Ph.D1, Vincent P. Diego Ph.D1, Laura Almasy Ph.D1, John Blangero Ph.D1,
Michael P. Stern M.D2, Ravindranath Duggirala Ph.D1 and Hanna E. Abboud M.D3
1Department of Genetics, Southwest Foundation for Biomedical Research, San Antonio, TX 2 Division of Clinical Epidemiology, Department of Medicine, University of Texas Health
Science Center at San Antonio, San Antonio, TX 3 Division of Nephrology, Department of Medicine, University of Texas Health Science Center,
San Antonio, TX.
Running title: Genotype by Diabetes Interaction effects on Glomerular Filtration Rate
Received for publication 14 July 2006 and accepted in revised form 6 August 2007.
Diabetes Publish Ahead of Print, published online September 27, 2007
Copyright American Diabetes Association, Inc., 2007
Genotype by Diabetes Interaction effects on Glomerular Filtration Rate
ABSTRACT Objective Glomerular filtration rate (GFR) is used to assess the progression of renal disease. We performed linkage analysis to localize genes that influence GFR, using estimated GFR data from the San Antonio Family Diabetes/Gallbladder Study. We also examined the effect of genotype by diabetes interaction (G × DM) on the detection of linkage to address whether genetic effects on GFR differ in diabetics and non-diabetics. Research Design and Methods GFR (N = 453) was estimated using the recently recalculated Cockcroft-Gault (GFR-CGc) and the simplified Modification of Diet in Renal Disease (GFR-4VMDRDc) formulae. Both estimates of GFR exhibited significant heritabilities, but only GFR-CGc showed significant G × DM interaction. We therefore performed multipoint linkage analyses on both GFR measures using models that did not include G × DM interaction effects (Model 1), and that included G × DM interaction effects (Model 2, in the case of GFR-CGc). Results The strongest evidence for linkage (Model 1) of both GFR-CGc (LOD = 2.9) and GFR-4VMDRD (LOD = 2.6) occurred between markers D9S922 and D9S1120 on chromosome 9q. However, using Model 2, the strongest evidence for linkage of GFR-CGc on chromosome 2q was found near marker D2S427 (LODC = 3.3) compared to the LOD score of 2.7 based on Model 1. Potential linkages (LOD or LODC ≥1.2) were found only for GFR-CGc on chromosomes 3p, 3q, 4p, 8q, 11q and 14q. Conclusion We found a major locus on chromosome 2q that differentially influences GFR in diabetic and non-diabetic environments in the Mexican American population. Keywords: Renal function, linkage, variance components, genotype by diabetes interaction
2

Genotype by Diabetes Interaction effects on Glomerular Filtration Rate
Chronic kidney disease (CKD) and declining renal function causes end stage renal disease (ESRD), which are important health concerns for individuals with hypertension and diabetes. Diabetic nephropathy (DN) is the leading cause of CKD in patients starting renal replacement therapy and is associated with increased cardiovascular mortality (1). Hispanics are among the fastest-growing ethnic minority populations in the US, and are twice as likely to develop kidney failure as non-Hispanic whites largely due to the increased prevalence of diabetes mellitus. Mexican Americans also have a 6 fold increased risk of developing ESRD secondary to diabetes compared to Caucasians (2). Glomerular filtration rate (GFR) or creatinine clearance are frequently used as indicators to evaluate renal function.
DN and GFR are complex phenotypes that are influenced by genetic and environmental factors and their interactions. Several studies involving humans and animal models have provided evidence for genetic influences on susceptibility to DN or ESRD and their related phenotypes (3-4). The rate of progression of DN varies greatly among individuals. A part of this variability could be attributed to genetic influences. In fact, in recent years, various linkage studies have been performed to localize susceptibility genes related to ESRD and DN in populations such as Caucasians, Mexican Americans, African Americans, and Pima Indians (5-11). In addition, linkage studies have also been conducted to map loci that influence variation in renal function, using data from various ethnic groups and several measures of GFR such as serum creatinine, serum cystatin c, creatinine clearance, and formulae estimating GFR (Cockcroft-Gault [GFR-CG] and Modification of Diet in Renal Disease [GFR-MDRD] study equations) (12-18).
However, there is paucity of such genetic information in Mexican Americans, a population at high risk for type 2 diabetes
(DM) and its complications. Therefore, the purpose of the present study is: 1) to determine the heritability of estimates of GFR, 2) to identify susceptibility loci that influence variation in renal function using estimates of GFR and 3) to examine the effects of genotype by diabetes (G × DM) interaction on the detection of linkage of GFR in Mexican Americans.
RESEARCH DESIGN AND METHODS Study Population
The phenotypic and demographic information were collected from 741 individuals drawn from 39 large Mexican American families that were enrolled in the San Antonio Family Gallbladder Study (SAFGS), a follow-up and extension of the San Antonio Family Diabetes Study (SAFDS). These studies are collectively referred to as the San Antonio Family Diabetes/Gallbladder Study (SAFDGS). The recruitment for the SAFGS was conducted between 1998 and 2001 and the particulars of the SAFDGS recruitment and related material were detailed previously (19-20). Briefly, probands were recruited from a random sample of low-income Mexican American individuals who had been identified in the earlier San Antonio Heart Study as having type 2 diabetes. All first-, second-, and third degree relatives of ≥18 years were invited to participate in the study. Each participant in the study gave an informed consent. This study was approved by the Institutional Review Board, University of Texas Health Science Center, San Antonio, Texas. Phenotype Data
For the SAFGS, several metabolic, hemodynamic, anthropometric, and demographic variables were collected at the General Clinical Research Center (GCRC) Laboratory at the South Texas Veterans Health Care System, Audie L. Murphy Memorial Hospital Division, San Antonio, Texas, using standard procedures. The
3
Genotype by Diabetes Interaction effects on Glomerular Filtration Rate
collection of participant medical histories included information on medication status (e.g., anti-diabetic and anti-hypertensive medication). Blood samples were obtained after a 12-hour fast for assessment of various phenotypes including glucose, insulin, total cholesterol, triglycerides, and HDL cholesterol, and they were collected again 2 h after a standardized oral glucose load for plasma glucose. Diabetes status has been defined by both the 1999 criteria of the World Health Organization [i.e., fasting glucose levels ≥ 126 mg/dl and/or 2-hr glucose levels ≥ 200 mg/dl] (21). Participants who did not meet these criteria but who reported that they were under treatment with either oral anti-diabetic agents or insulin, and who gave a history of diabetes were also considered to have diabetes. The duration of diabetes for individuals who were diagnosed prior to our
study was estimated based on their self-reported age-at-onset information. Urine albumin was measured with an immunoturbidimetric method using the COBAS INTEGRA diagnostic reagent system that uses anti-albumin antibody specific to human albumin. Urine creatinine was measured using a kinetic alkaline picrate assay. The ratio of concentration of albumin (mg/dl) to creatinine (mg/dl) in random urine specimen (ACR) was used as an index of urinary albumin excretion (UAE). Albuminuria (micro or macro) was defined as an albumin (mg/dl) to creatinine (mg/dl) ratio (ACR) of ≥ 0.03. Serum samples were collected for estimation of creatinine (Scr), which was measured by alkaline picrate assay. The anthropometric data (height, weight, and waist circumference) were collected using standardized anthropometric protocols (22-23).
The following two recently recalculated GFR prediction equations (24) have been used for this study: the recalculated simplified 4-variable Modification of Diet in Renal Disease (MDRD) study equation (25)
and the Cockcroft-Gault equation (26) adjusted for body surface area and corrected for the bias in the MDRD data. Briefly, the recalculation was performed with serum creatinine levels calibrated to an enzymatic assay traceable to an isotope-dilution mass spectrometry assay. For the purpose of discussion, GFR recalculated by the 4-variable MDRD formula was referred to as GFR-4VMDRD and GFR estimated by the recalculated Cockcroft-Gault formula as GFR-CGc. The GFR-4VMDRD was estimated using the following equation: GFR = 175 × [Scr (mg/dL)]-1.154 × [Age (years)]-
0.203 × [0.742, if female]) × [1.212, if African American]. The GFR-CGc was estimated as follows: Creatinine clearance (Ccr) = 0.8 × [140-Age (years)] × [Weight (kg)] × [0.85, if female]) × 1.73/72 Scr × BSA (body surface area defined m2). In these prediction equations, GFR-4VMDRD and GFR-CGc are expressed as mL/min per 1.73 m2. For the genetic analyses, for both phenotypes, only values within ± 4 SDs from the mean were considered. The coefficients of skewness and kurtosis for GFR-CGc and GFR-4VMDRD were 0.48 and 0.54 and 0.48 and 0.86, respectively. When log transformed, the coefficients of skewness and kurtosis for GFR-CGc and GFR-4VMDRD were -0.60 and 0.90 and -0.42 and 1.43, respectively. Because the transformation increased kurtosis, we have used the original data for all genetic analyses. Genotype data and Genetic Map
The Center for Inherited Disease Research (CIDR) has performed a 10 cM genome scan using SAFDGS data. DNA was prepared from lymphocytes for genotyping. The CIDR performed genome scan using automated fluorescent microsatellite analysis and its marker set was composed primarily of trinucleotide and tetranucleotide repeats across the genome. The CIDR genetic map is similar to the genetic map provided by the Center for Genetics at Marshfield Medical
4
Genotype by Diabetes Interaction effects on Glomerular Filtration Rate
Research Foundation. For the present study, we used CIDR genotypic data on 382 highly polymorphic autosomal markers. The CIDR routinely checked for genotype errors and possible pedigree relationship errors. However, as an added precaution, the microsatellite marker data were used to further correct potential errors. The program PREST (27) was used to resolve pedigree discrepancies. The data were checked for Mendelian inconsistencies using the PEDSYS (28) programs INFER and GENTEST to eliminate typing errors. If the discrepancies continued to exist, the program SimWalk2
(29), which used Markov Chain Monte Carlo and simulated annealing algorithms to assign probabilities of mistyping to each genotype, was used to make decisions about the appropriate genotypes to blank (exclude).
Maximum likelihood techniques that account for pedigree structure were used to estimate allele frequencies. Frequency estimates obtained using samples containing related individuals can be significantly biased unless pedigree structure is taken into account
(30). For each genetic marker locus, the estimates of the allele frequencies and their standard errors were obtained using SOLAR
(31). To perform linkage analysis, we constructed sex-averaged genetic maps using our SAFDGS genotypic data and pedigree structures and the programs Multimap and CRI-map (32-33). The map distances between the marker loci were obtained by Kosambi's mapping function, and these maps were similar to the Marshfield genetic maps. Locus-specific IBDs were calculated using the program SOLAR (31), and multipoint IBD matrices given a number of genetic markers (map distance in Haldane cM) were estimated using Markov Chain Monte Carlo methods implemented in the program Loki (34). For the purpose comparison with other studies, we discussed the genetic locations of our linkage findings according to the Marshfield map.
Statistical Genetic Analyses To estimate heritabilities of GFR traits
and to test potential linkages between marker loci and GFR traits, variance components linkage techniques were used (35-36, 31). This approach uses information from all possible biological relationships simultaneously in an attempt to disentangle the genetic architecture of a quantitative trait. Linkage of a genetic location with a given trait (e.g., GFR-CG) was tested using a general variance components method, which allows for marker locus-specific effects, residual genetic effects, and random environmental effects. In our approach, the sampling unit is a pedigree, and the covariance matrix for a given pedigree (Ω) is given by: (Ω) = Πσ2
q + 2Φσ2g + Iσ2
e, where Π is a matrix with elements (πmij) providing the estimated proportion of alleles that individuals i and j share IBD at a marker (m) hypothesized to be linked to a quantitative trait locus (QTL); σ2
q is the additive genetic variance due to the marker locus; Φ is the kinship matrix; σ2
g is the genetic variance due to residual additive genetic effects; I is an identity matrix; and σ2
e is the variance due to random environmental effects. Both variance components and covariate effects were estimated simultaneously by maximum likelihood techniques. For example, the hypothesis of no linkage was tested by comparing the likelihood of a model in which the parameter h2 is estimated, but h2
q is constrained to a value of 0 with a model in which both h2 and h2
q are estimated where h2 = (σ2q + σ2
g)/ σ2p,
h2q = σ2
q/ σ2p, and σ2
p = σ2q + σ2
g + σ2e.
Twice the difference in the log-likelihoods of these models yields a test statistic that is asymptotically distributed as ½:½ mixture of χ2
1 and a point mass at 0, denoted by χ20,
where the degree of freedom is equal to the difference in the number of parameters estimated between the two competing models (37). After including all covariates for a given phenotype in the initial analysis, the null hypotheses of no ?influence of a given
5
Genotype by Diabetes Interaction effects on Glomerular Filtration Rate
covariate (e.g., diabetes covariate beta parameter = 0) were tested using likelihood ratio tests. Each of these tests involved comparison for a given parameter and had 1 degree of freedom. A statistically significant test (P < 0.05) was considered as evidence of a significant, non-zero estimate for a given parameter. After evaluating the significance of various covariate beta parameter estimates, variance component and significant covariate effects were estimated simultaneously in the final analysis. The following covariates were considered for the initial covariate screening analyses. For GFR-CGc, type 2 diabetes, duration of diabetes (i.e., log transformed), albuminuria (micro and macro), systolic blood pressure, and anti-hypertensive treatment with ACE inhibitors or AT1R antagonists were considered as covariates. For GFR-4VMDRD, all of the above covariates were used and body mass index (BMI = weight [kg]/height [m2]) was added. Since age and sex information were used for the definition of both traits, these covariates were not considered for the genetic analyses. Similarly, BMI was excluded as a covariate for GFR-CGc as its related information is used in the definition of this trait. LOD scores were obtained by converting the ln likelihood values into values of log10. The analyses of procedures are incorporated in the program SOLAR (31). Genotype by Environment interaction
We have extended the variance components approach to test for genotype by environment [G × E] (i.e., the two environmental exposure groups are diabetics and non-diabetic individuals) interaction using information from variance-covariance of GFR between relative pairs under different environments [i.e., diabetic and non-diabetic]
(38-41). Specifically, G × E interaction refers to the environmental (diabetic and non-diabetic) influences on the genes contributing to variation in GFR. In this interaction model, two things were modeled: a) diabetes-
status specific genetic variances (genetic variances in diabetic [DM] and non-diabetic [NDM] individuals, respectively) and b) a genetic correlation between groups of individuals living in different environments (i.e., DM-NDM pairs). In the absence of genotype by diabetes (G × DM) interaction, the genetic variances for GFR living in different exposure groups (DM and NDM) should be equal (i.e., σDM
= σNDM), and /or the genetic correlation (i.e., GFR) between DM and NDM pairs should be one (i.e., ρG (DM,
NDM) = 1). To estimate residual-environment-specific QTL effects, the variance components linkage model for individuals i and j can be defined as: COV(DM, NDM) = πmij σqDM σqNDM + 2 φij σgDM σgNDM ρg. If there is a significant QTL × diabetes interaction, the genetic variance of GFR attributable to the QTL for individuals living in different exposure groups (e.g., DM and NDM) will not be equal (σqDM ≠ σqNDM). In all G × E interaction models, the genetic and environmental variances were estimated as the genetic and environmental standard deviations, respectively. Since this G × E interaction technique had an additional QTL variance compared to the standard linkage model, we made correction for increase in degrees of freedom, and referred to it as the corrected LOD score (LODC). The corrected LOD score assumes that environment-specific QTL effects are independent under the null, and the corresponding test statistic is asymptotically distributed as a 1/4 : 1/2 : 1/4 mixture of χ2
2, χ21, and χ2
0. Although this
assumption may be overly conservative, we used the corrected LOD scores instead of the (uncorrected) observed LOD scores under the G × E interaction model for the presentation of our data.
Because the SAFDGS families were ascertained on diabetic probands, as a conservative approach, all genetic analyses were performed using SOLAR by correcting for the ascertainment by conditioning the
6
Genotype by Diabetes Interaction effects on Glomerular Filtration Rate
likelihood for the family data on the phenotype (i.e., GFR) of proband (30). To verify the findings from the multipoint linkage analyses (with and without G x DM interaction) we conducted simulation analyses to determine the trait-specific empirical P values using the following procedure (SOLAR). A fully informative marker was simulated, which was not linked to a given phenotype. For this marker, IBD information was calculated, and then linkage analysis was performed using the simulated genotypes and the observed phenotype data. For a given phenotype, we generated the empirical P values on the basis of LOD-score distribution obtained from the 100,000 replicates. In addition, to control for the overall false positive rate in the genomewide linkage analysis of a given phenotype, we employed an approach based on the work of Feingold et al. (42) as implemented in the program Gauss 5.0.29 (Aptech Systems, Inc.: Maple Valley, Washington), and estimated the genomewide P values for the strongest linkage findings (i.e., LOD ≥ 2.0). This approach takes into account the finite marker density in the linkage map utilized in the multipoint QTL screens and the mean recombination rate for the pedigreed population studied.
RESULTS Characteristics of 453 individuals with GFR data in SAFDGS families
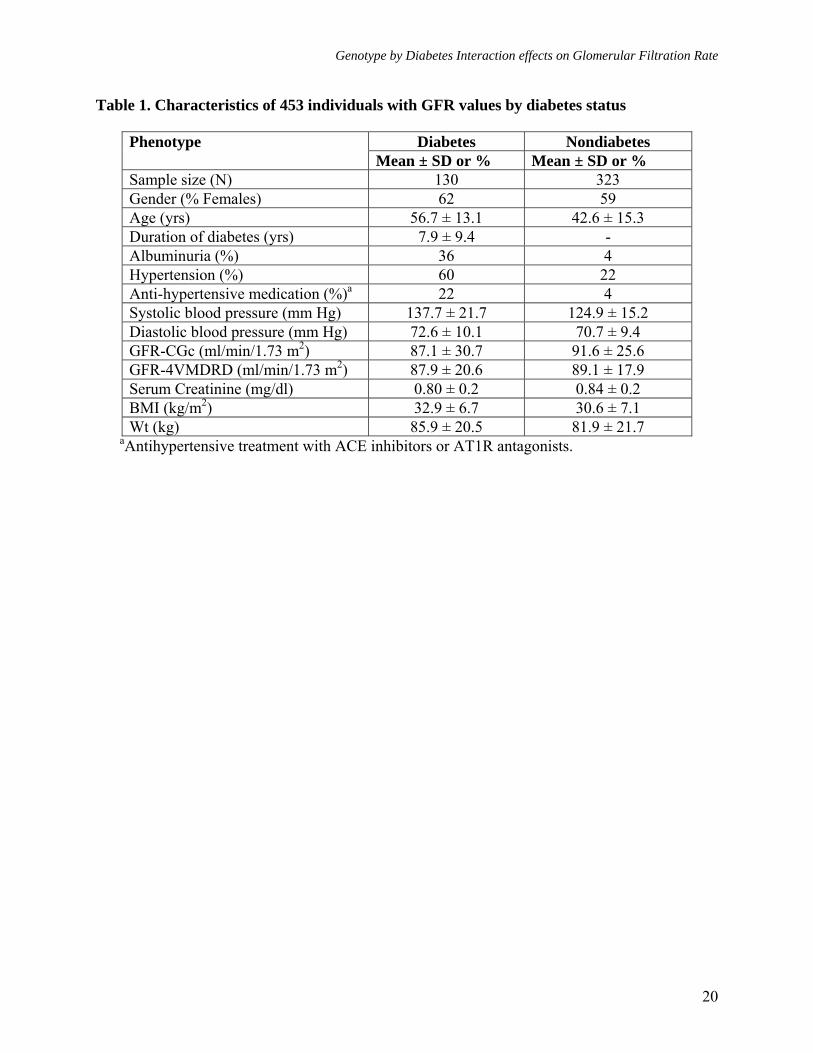
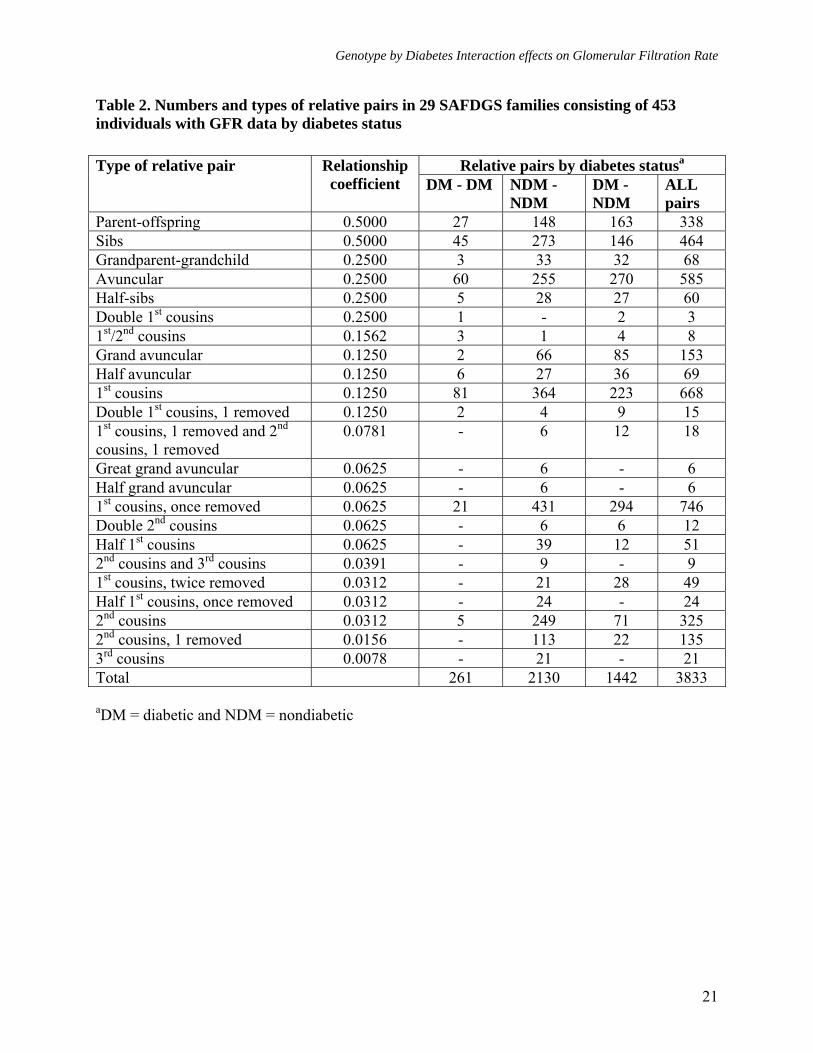
The clinical characteristics of 453 individuals for whom GFR and covariate data were available are reported in Table 1 by diabetes status. These individuals were distributed across 29 families. On average, there were 15.6 individuals in each family, and the average number of diabetic individuals per family was 4.5. As can be seen in Table 1, about 29% of the individuals were affected with DM. The 453 individuals generated 23 types of relative pairs, and there were 3,833 relative pairs (DM-DM = 261, DM-NDM = 1,442, and NDM-NDM = 2,130)
in our data (Table 2). About 60% of the subjects were females. The mean (± SD) age of the diabetic individuals at the clinic examination was 56.7 ± 13.1 years, compared with 42.6 ± 15.3 years for those without diabetes. Of the 130 diabetics, 27 subjects (21%) were clinically diagnosed at the time of their SAFDGS examination. The remaining
103 diabetics (79%) were diagnosed prior to the study, and their age-at-onset information was based on self-reporting. The mean age at onset for all 130 affecteds was 48.8 ± 12.9 years. The mean age at onset for the subjects diagnosed at the time of their SAFDGS clinic examination was 49.9 ± 14.2 years, compared with 48.5 ± 12.6 years for subjects diagnosed prior to the study. As can be seen in Table 1, on average, individuals with diabetes had higher systolic and diastolic blood pressure and were obese compared with those without diabetes. The individuals with diabetes were found with higher occurrence of albuminuria (36% of subjects with diabetes versus 4% without diabetes) and more of them were found to be treated with anti-hypertensive medication (22%) compared to the subjects without diabetes (4%). Heritability estimates for the two GFR phenotypes
Prior to conducting the linkage analyses, we estimated heritabilities (h2) for the two phenotypes, GFR-4VMDRD and GFR-CGc. These analyses involved trait-specific screening for significant covariate effects as described previously. All covariates were found to be significant (P ≤ 0.05), excepting albuminuria and hypertension medication status. However, anti-hypertensive medication was included in the genetic analyses since systolic blood pressure was used as a covariate irrespective of the hypertension medication status of an individual. After adjustment for the trait-specific covariates (i.e., GFR-CGc = diabetes, diabetes duration, systolic blood pressure, and anti-hypertensive medication; GFR-
7
Genotype by Diabetes Interaction effects on Glomerular Filtration Rate
4VMDRD = diabetes, diabetes duration, systolic blood pressure, anti-hypertensive medication, and BMI), the coefficients of kurtosis for GFR-CGc and GFR-4VMDRD residuals were 0.79 and 1.35, respectively. The overall heritability estimates including both diabetic and non-diabetic individuals were: GFR-CGc h2 (± SE) = 0.40 ± 0.09, P < 0.0001 and GFR-4VMDRD h2 (± SE) = 0.36 ± 0.09, P < 0.0001). The heritability profiles were more or less similar. The heritability estimates of GFR-CGc (adjusted for diabetes duration, systolic blood pressure, and hypertension medication) and GFR-4VMDRD (adjusted for diabetes duration, systolic blood pressure, hypertension medication, and BMI) were significant in diabetics: GFR-CGc h2 (± SE) = 0.54 ± 0.17, P = 0.0002 and GFR-4VMDRD h2 (± SE) = 0.43 ± 0.21, P = 0.0116). The estimates in non-diabetic individuals only were also significant: GFR-CGc h2 (± SE) = 0.56 ± 0.14, P < 0.0001 and GFR-4VMDRD h2 (± SE) = 0.36 ± 0.14, P = 0.0024). The correlation between GFR-CGc and GFR-4VMDRD measures
To our knowledge, the two estimates of GFR have not been validated in the Mexican American population. In the absence of such information, we have assessed the extent of concordance between these two measures for proper interpretation of the data. We conducted bivariate genetic analysis of these two estimates after adjusting for the trait-specific covariate effects to examine their phenotypic (ρP), genotypic (ρG), and environmental (ρE), correlations prior to conducting linkage analyses. All of the estimated correlations (± SE) were high and significant as follows: ρP = 0.79 ± 0.02, P < 0.0001, ρG = 0.80 ± 0.07, P < 0.0001, and ρE = 0.77 ± 0.04, P < 0.0001. However, the phenotypic and genetic correlations between the two phenotypes indicated that only 62-64% of the variation is commonly shared by GFR-4VMDRD and GFR-CGc. Thus, the two
estimates were correlated highly, but a sizable proportion of variance was distinct from each other, in turn suggesting the possibility of some loci differentially influencing these surrogate measures of GFR. Evidence for genotype-by-diabetes (G × DM) interaction effects on GFR-CGc
Following the estimation of heritabilities, we analyzed the data to detect G × DM interaction effects on variation in GFR measures, after adjusting for the trait-specific covariate effects. Of the two estimates of GFR, only the GFR-CGc exhibited significant G × DM interaction effects. The difference in genetic standard deviations of diabetic (σDM ± SE = 20.33 ± 3.62) and non-diabetic (σNDM
± SE = 18.17 ± 3.05) individuals was statistically not significant (P = 0.642). However, the genetic correlation (ρg (DM, NDM) = 0.53 ± 0.25, P = 0.034) between relative pairs discordant for diabetes was statistically different from 1 (P = 0.039), indicating that different genes might influence GFR-CGc in diabetic and non-diabetic individuals.Findings from multipoint linkage analyses
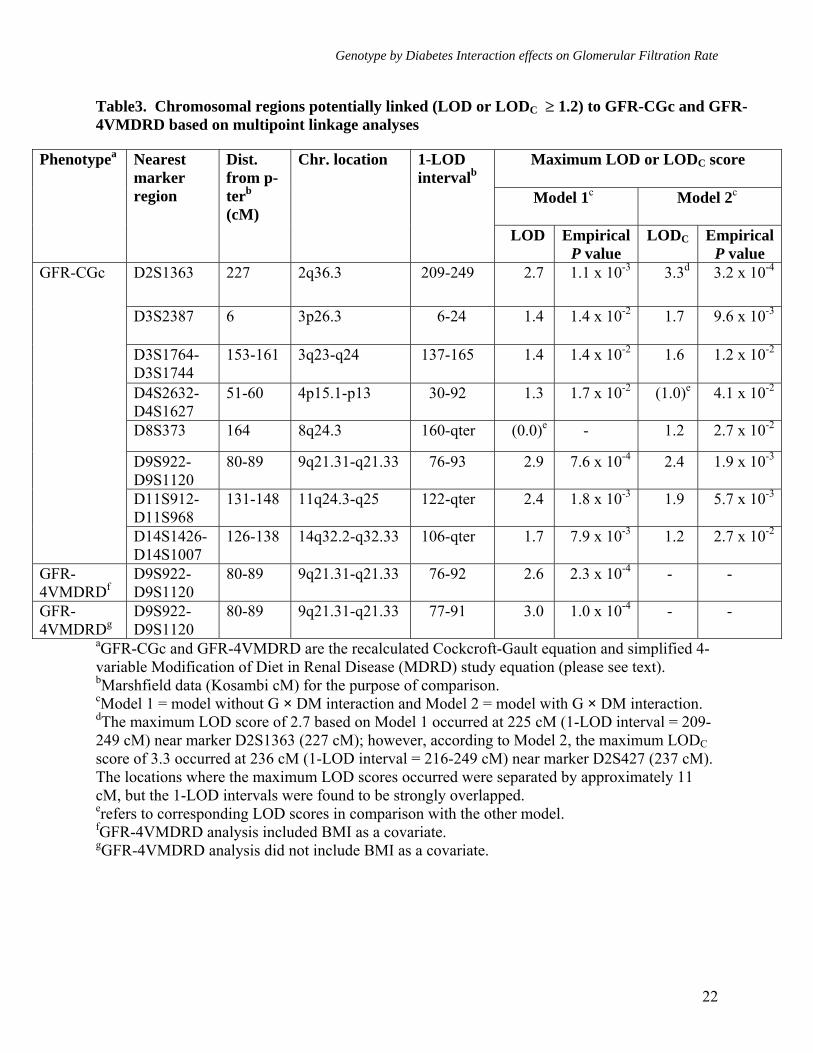
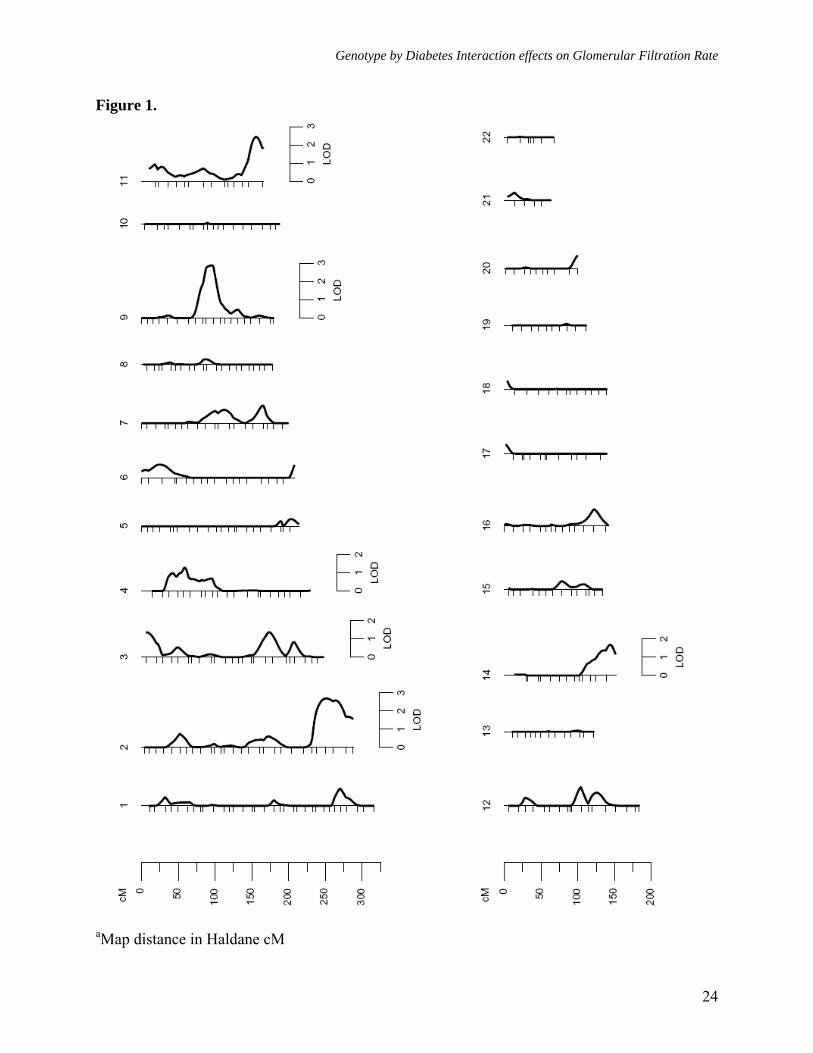
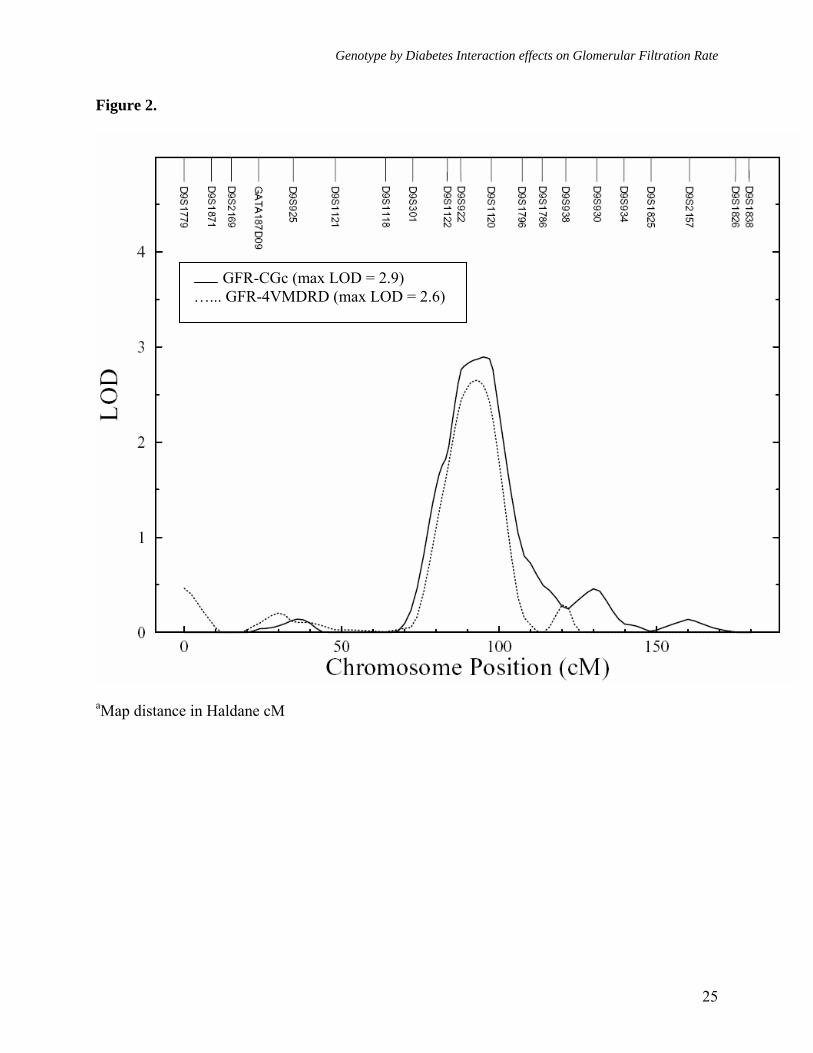
As reported above, both estimates of GFR exhibited significant heritabilities, but only GFR-CGc showed significant G × DM interaction. We therefore performed linkage analyses on both GFR measures, after adjusting for the trait-specific covariate effects, using models that did not include G × DM interaction effects (Model 1, both GFR-CGc and GFR-4VMDRD), and that included G × DM interaction effects (Model 2, only GFR-CGc). Using the standard linkage analysis (Model 1, without G × DM interaction), the strongest evidence for linkage of GFR-CGc (LOD = 2.9, empirical P = 7.6 x 10⁻⁴, genomewide P = 0.045) occurred at 86 cM in between markers D9S922 (80 cM) and D9S1120 (89 cM) on chromosome 9q and the 1-LOD support interval around the linkage peak spanned ~18 cM long region (76-93 cM) on Marshfield map (Table 3,
8
Genotype by Diabetes Interaction effects on Glomerular Filtration Rate
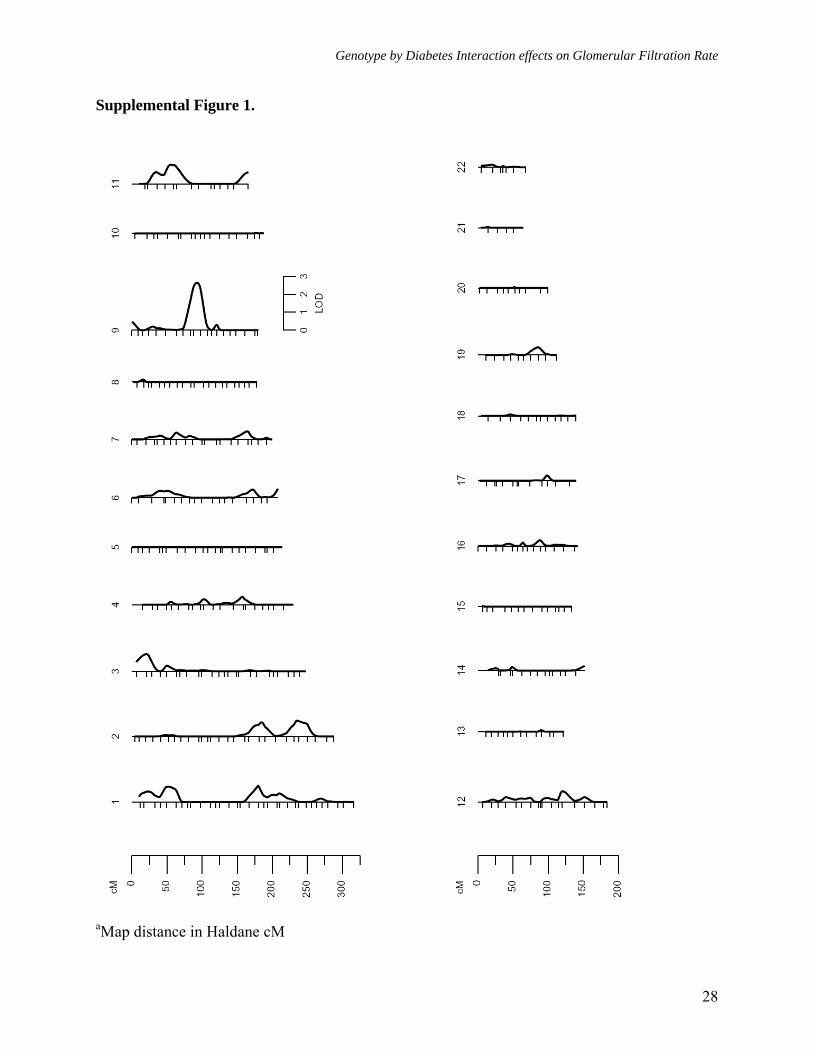
Figures 1 and 2). The strongest evidence for linkage of GFR-4VMDRD also occurred at the same location (LOD = 2.6, empirical P = 2.3 x 10⁻⁴, genomewide P = 0.083), and it slightly improved when adjustment for BMI was not made (LOD = 3.0, empirical P = 1.0 x 10⁻⁴, genomewide P = 0.031). For GFR-4VMDRD (with or without BMI as a covariate) there were no other loci that exhibited potential evidence for linkage (LOD ≥ 1.2) [Table 3, Supplemental Figures 1 and 2], while several loci were found for GFR-CGc with potential evidence for linkage on chromosomes 2q, 3p, 3q, 4p, 11q, and 14q (Table 3, Figure 1). For example, the second strongest evidence for linkage of GFR-CGc occurred near marker D2S1363 region on chromosome 2q (LOD = 2.7, empirical P = 1.1 x 10⁻³, genomewide P = 0.075). A genetic location between the markers D11S912 and D11S968 was also found to exhibit moderate evidence for linkage (LOD = 2.4, empirical P = 1.8 x 10⁻³, genomewide P = 0.139).
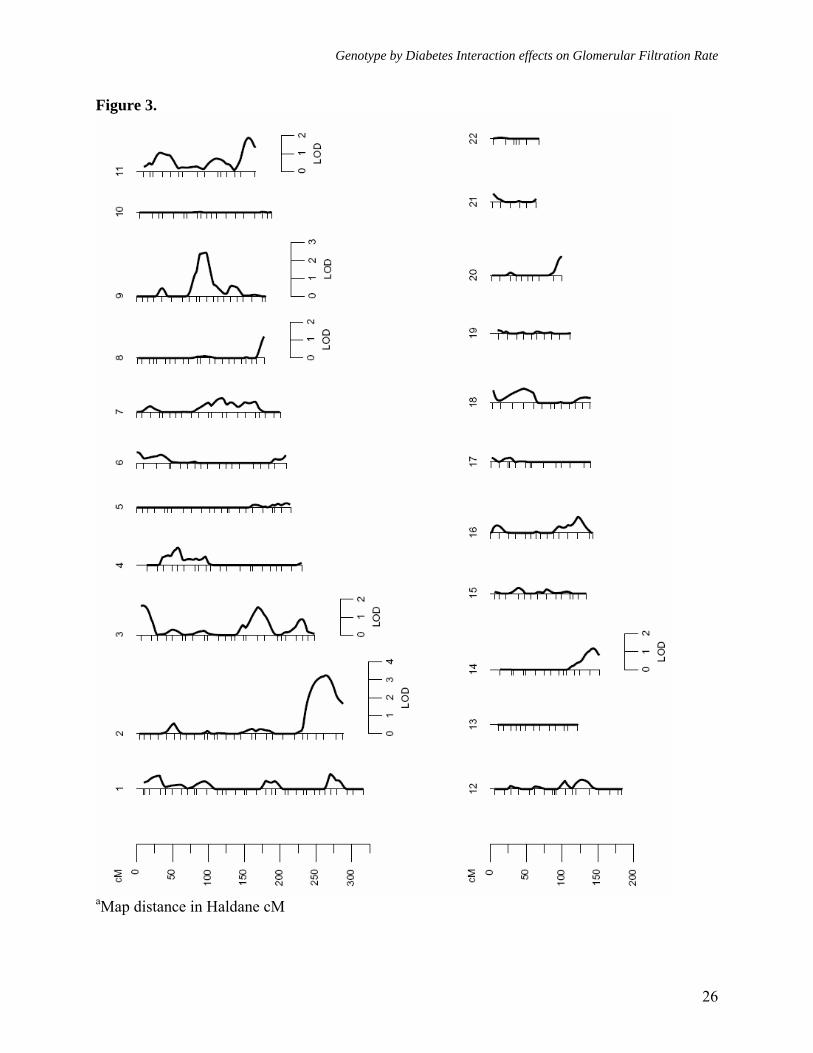
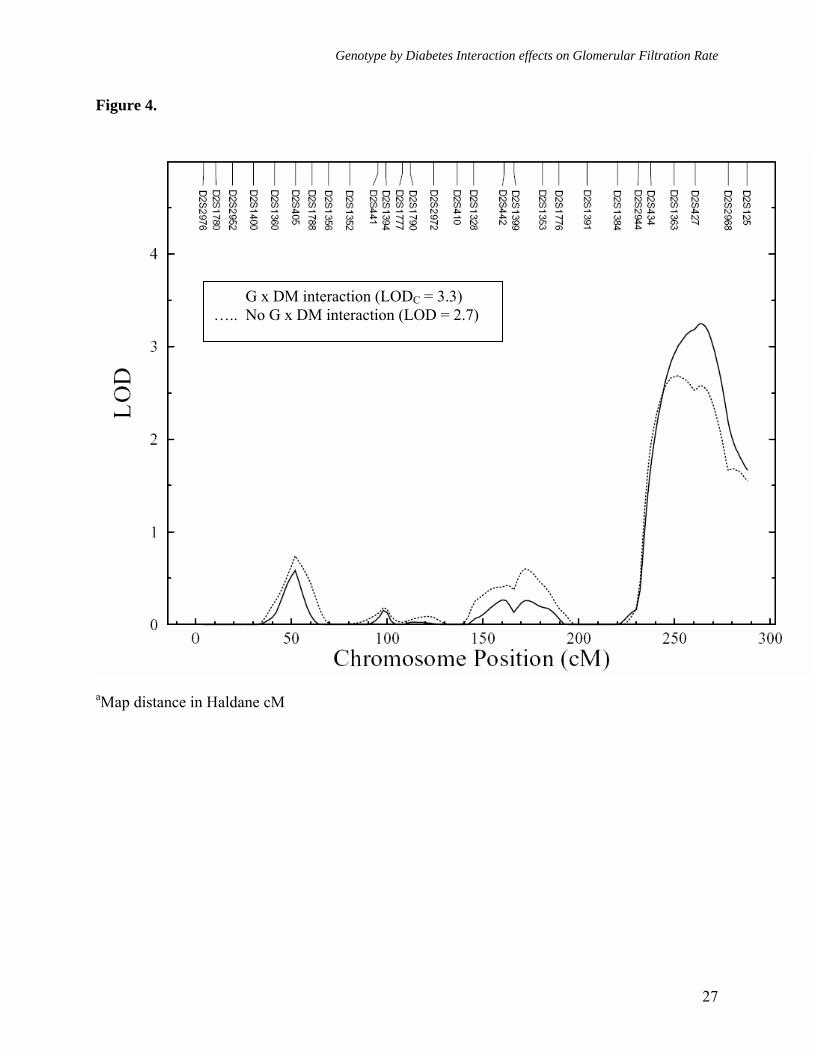
Following the detection of significant G × DM interaction effects, we performed multipoint linkage analysis of GFR-CGc phenotype using Model 2 (with G × DM interaction effects). After incorporating G × DM interaction, we found strongest evidence for linkage of GFR-CGc on chromosome 2q near marker D2S427 region, where the LOD score of 2.7 (near marker D2S1363) based on the standard linkage analysis (without G × DM interaction) improved greatly to an uncorrected LOD score of 3.8 (LOD corrected for additional degrees of freedom [LODC] = 3.3, empirical P = 3.2 x 10⁻⁴, genomewide P = 0.019) (Figures 3 and 4). Henceforth, only corrected LOD scores are discussed. As reported in table 3, it should be noted that the locations where the maximum LOD scores occurred based on Models 1 and 2 were separated by ~11 cM long region, but the 1-LOD support intervals were found to be strongly overlapped (Model 1: LOD = 2.7 at 225 cM [1-LOD interval = 209-249 cM] near
marker D2S1363 [227 cM] versus Model 2: LODC = 3.3 at 236 cM [1-LOD interval = 216-249 cM] near marker D2S427 [237 cM] on Marshfield map). Aside from the 2q chromosomal region, the 3p, 3q, 8q, 9q, 11q, and 14q chromosomal regions exhibited potential evidence for linkage (LODC ≥ 1.2) using Model 2 (Figure 3 and Table 3). However, only a few chromosomal regions (i.e., 3p, 3q, and 8q) exhibited some improvement in LOD scores. Importantly, the genetic location on chromosome 9q, where we had strong evidence for linkage of both measures of GFR using Model 1, failed to exhibit evidence for potential G × DM interaction influences on GFR-CGc (i.e., Model 1: LOD = 2.9, empirical P = 7.6 x 10⁻⁴, genomewide P = 0.045 versus Model 2: LOD = 2.4, empirical P = 1.9 x 10⁻³, genomewide P = 0.143). Overall, the implicated marker region on chromosome 2q appears to harbor a major susceptibility locus for variation in GFR-CGc in Mexican Americans, and it appears that the QTL at marker D2S1363/D2S427 region on chromosome 2q differentially influences the variation in GFR in diabetic and non-diabetic individuals.
The magnitude of difference in diabetes status-specific QTL effects at marker D2S427 region (σqDM ± SE = 12.16 ± 4.82 and σqNDM ± SE = 19.87 ± 2.39) appear to be appreciable. However, it failed to reach statistical significance (P = 0.194). The genetic standard deviations due to the QTL in each exposure group were estimated to be statistically different from 0 (σqDM = 12.16, P = 1.0 x 10⁻² and σqNDM = 19.87, P = 1.5 x 10-
5), in turn suggesting that the estimation of diabetes-specific (σqDM) effect size is imprecise based on the strength of the significance level, perhaps due to the smaller sample size of diabetic individuals compared to that of the non-diabetic individuals. DISCUSSION
The prevalence rates of type 2 diabetes (DM) and its complications including
9
Genotype by Diabetes Interaction effects on Glomerular Filtration Rate
diabetic nephropathy have been rapidly increasing, globally, especially in the western world. In the US, the occurrence of DM and its complications is high in minority populations such as the Mexican Americans, the largest sub-group of the US Hispanic population. Since these disease conditions are influenced by genetic and environmental factors and their interaction, numerous studies have attempted to localize susceptibility genes for nephropathy and its related conditions such as GFR in DM, although the specific genes that underlie such susceptibility have yet to be identified.
In this study, we used data from a Mexican American population that is at high risk for DM and its complications to examine the genetic determinants of GFR and to determine the influence of genotype by diabetes interaction on variation in GFR. We found that the phenotypes GFR-CGc and GFR-4VMDRD are significantly heritable (h2
= 40% and 36%, respectively) in this population, and that their heritability profiles are more or less similar. Given that the heritability estimates are population sample specific, several studies have found that GFR is under strong genetic influence. For example, GFR measured as GFR-CG and GFR-MDRD was reported to be heritable (38% and 44%) in Mennonites (43). The phenotypes GFR-CG and GFR-MDRD exhibited heritabilities of 29% and 46% in the Framingham Heart Study (44). Recently, Langefeld et al. (45) reported heritability of GFR to be 75% estimated according to the modified MDRD formula in Caucasians families. Another study on GFR estimated by the MDRD formula from multigenerational families in Utah reported a heritability (for three different GFR examinations) ranging from 37% to 42% (12). Thus, our GFR heritability findings are consistent with other heritability reports of GFR.
After determining that the GFR phenotypes are heritable, we performed
genome-wide multipoint linkage screening to identify susceptibility loci that influence variation in GFR and to examine the potential effects of genotype by diabetes (G × DM) interaction on the detection of linkage. The standard linkage analyses (without G × DM interaction effects) showed strong evidence for linkage of both GFR-CGc and GFR-4VMDRD to a genetic location on chromosome 9q in between markers D9S922 (80 cM, 9q21.31) and D9S1120 (89 cM, 9q21.33). In fact, the evidence for linkage to GFR-CGc (LOD = 2.9) or GFR-4VMDRD (without adjustment for BMI, LOD = 3.0) approximates genome-wide significance (46). For GFR-4VMDRD, we failed to find any other potential linkages, while GFR-CGc exhibited potential evidence for linkage on chromosomes 2q, 3p, 3q, 4p, 11q, and 14q. Since we observed that GFR-CGc exhibited significant G × DM interaction effects, we examined the effects of G × DM interaction on the detection of linkage for GFR-CGc. Using the G × DM interaction model, we found a corrected LOD of 3.3 near marker D2S427 on chromosome 2q37.1. The evidence for linkage was found with a suggestive LOD score of 2.7 (near marker D2S1363, 2q36.3) using the standard linkage analysis (without G × DM interaction); however, it improved greatly to a corrected LOD score of 3.3 using the G × DM interaction model. Although the model-specific LOD curves peaked at different locations separated by ~11 cM long region, the 1-LOD support intervals were found to be completely overlapping. The evidence for linkage of GFR to 2q chromosomal region based on G × DM interaction model is significant at the level of a genome-wide scan
(46). The 3p, 3q, 8q, 9q, 11q, and 14q chromosomal regions exhibited potential evidence for linkage of GFR-CGc, using the G × DM interaction model.
The ~18 cM long 1-LOD support interval region (76-93 cM) around the GFR
10
Genotype by Diabetes Interaction effects on Glomerular Filtration Rate
linkage peak (86 cM) on chromosome 9q is flanked by markers D9S1122 (9q21.13) and D9S777 (9q22.1) on the Marshfield map, and it contains approximately 52 genes (NCBI Build 36). Although there are no known genes for renal function in this region, several studies have implicated this region or its nearby chromosomal regions to contain susceptibility loci for diabetes related phenotypes. For example, some evidence for linkage of diabetic nephropathy and retinopathy in the Pima Indian population was found near markers D9S1120 (89 cM) and D9S910 (104 cM) (47), and this chromosomal region strongly overlaps with our 9q chromosomal region of interest. Using data from an African American population, a major susceptibility locus influencing hypertensive nephropathy was mapped to 9q31.2-q31.3 chromosomal region flanked by markers D9S172 (112 cM) and D9S105 (120 cM) (48). As reviewed by Arya et al. (49) and Cai et al. (50), several studies found genetic locations near marker D9S301 region (66 cM) that are linked with diabetes (Finnish and Chinese populations) or its correlates such as HDL cholesterol, a compound measure of adiposity and insulin, and fasting glucose (Mexican Americans) and fasting insulin (Pima Indians). Also, infantile nephronophthisis was reported to be linked to a genetic location near markers D9S280 (102 cM) and GGAT3G09 (117 cM) in a Bedouin kindred (51).
Given that the 1-LOD support intervals around the GFR linkage peaks obtained from models with (216-249 cM) or without (209-249 cM) G × DM interaction effects on chromosome 2q overlap strongly, the markers D2S2944 (210 cM, 2q34) and D2S2202 (249 cM, 2q37.2) flank the ~40 cM long critical region. Several studies reported linkages related to DM, ESRD, and GFR related phenotypes on chromosome 2q. However, the implicated 2q chromosomal region harboring the potential susceptibility
genes is broad, covering the chromosomal locations from 2q21.3 to 2q37.3 (6-7, 12, 52-57). Such a scenario could relate to the possibility of more than one susceptibility locus for DM, ESRD, and GFR on chromosome 2q. Of the linkage reports, the findings of GFR (estimated from serum cystatin C concentrations: GFR-CC) from the Joslin collection of families with DM appear to be interesting within the context of the present findings (7). These investigators found strong evidence for linkage (LOD = 4.1) of GFR-CC to a genetic location near marker D2S1384 region (at 202 cM with 195-213 Mb long 1-LOD support interval) in diabetic relative pairs. Importantly, the evidence for linkage (LOD = 4.5 and LODC = 3.9) of GFR-CC near the same marker region on chromosome 2q improved greatly in the total sample of both diabetic and non-diabetic individuals, when the model considered the G × DM interaction effects. This marker region is ~23 cM centromeric to the genetic location linked with GFR-CGc (i.e., standard linkage analysis), and its 1-LOD support interval slightly overlaps with the 1-LOD support interval found in our study. Given the uncertainties in the location estimates of QTLs for complex phenotypes across the studies, these two regions on chromosome 2q may correspond to the same putative QTL that influences variation in GFR in diabetic and non-diabetic individuals differentially.
Several studies identified some adjacent 2q chromosomal regions (2q35-q37.3) to contain DM susceptibility loci, and these regions are close to our 2q chromosomal region of interest. Importantly, Hanis et al. (57) found strong evidence for linkage of DM on chromosome 2q37.3 near marker D2S125 (260 cM) in a Mexican American population, called NIDDM1. Subsequently, Horikawa et al. (58) identified calpain 10 (CAPN10) gene in the NIDDM1 region by positional cloning. Some potential replications of this finding have been reported in populations such as
11

Genotype by Diabetes Interaction effects on Glomerular Filtration Rate
Caucasians (56). Also, Li et al (55) found some evidence for linkage of fasting plasma glucose concentrations near marker D2S434 (216 cM) region, which is not that far from our 2q chromosomal region of interest. Although our GFR linkage finding on chromosome 2q overlaps with the region(s) reported to be linked to DM in other studies, it should be noted that there is no evidence for linkage of DM in our data. As discussed earlier, all genetic analyses in this study included DM as a covariate. Importantly, we reported DM genomescan/linkage findings in our SAFDGS data twice [second time with increased sample size and a different genomescan data generated by CIDR)] (59-60), and found no evidence for linkage of DM to the location on chromosome 2q (i.e., NIDDM1 region). We repeated the linkage analysis of DM using the present data, and there was no evidence for linkage of DM (LOD = 0) at the genetic location where we found the strongest evidence for linkage of GFR-CGc. These findings together suggest that the 2q locus we identified is not likely to be a DM susceptibility locus, and that it has differential influence on GFR in diabetic and non-diabetic environments.
The 1-LOD support interval flanked by the markers D2S2944 and D2S2202 contains approximately 222 genes (NCBI Build 36). There are several positional candidate genes in this region with potential functional relevance to kidney diseases such as insulin receptor substrate 1 (IRS1) [MIM 147545], collagen type IV alpha-3 (COL4A3) [MIM 120070], collagen type IV alpha-4 (COL4A4) [MIM120131], protein-tyrosine phosphotase, receptor-type, N (PTPRN), a member of the protein tyrosine phosphatase (PTP) family [MIM 601773], and SMARCAL1 (SWI/SNF-related, matrix-associated, actin-dependent regulator of chromatin, subfamily A-like protein 1) [MIM 606622].
Of the other regions found to be linked to GFR-CGc, the evidence for linkage was suggestive at the genetic location between markers D11S912 (131 cM, 11q24.3) and D11S968 (148 cM, 11q25) on chromosome 11q. Several studies have implicated this region to contain susceptibility genes for diabetes and obesity related phenotypes (61-64). For example, the diabetes susceptibility locus found in the Pima population occurred between markers D11S4464 (123 cM, 11q24.1) and D11S912 (61), and the marker region D11S912 exhibited some evidence for linkage of diabetes in the Mexican American population (63). A significant evidence for linkage of autosomal dominant progressive nephropathy, with features of both focal segmental glomerulosclerosis (FSGS) and Alport syndrome (AS) was found near the marker D11S4464 on chromosome 11q24 region in an Asian Indian family (65).
A number of linkage studies have been performed to localize susceptibility genes for DN or its related phenotypes such as GFR, and Iyengar et al. (11) provided a brief summary of the DN linkage findings across the studies. We found modest evidence for linkage of GFR-CGc between markers D3S1764 (153 cM, 3q23) and D3S1744 (161 cM, 3q24) on chromosome 3q. Interestingly, the same D3S1744 marker was suggestively linked with GFR-CC in non-diabetic individuals in the Joslin data (7). In the Finnish population, a susceptibility locus for type 1 diabetic nephropathy was identified on chromosome 3q between markers D3S3606 [144 cM] and D3S3694 [154 cM] (66), and this interval strongly overlaps our 3q chromosomal region. Several nearby 3q chromosomal regions were reported to be linked to DN related phenotypes in populations such as Caucasian Americans [~166 cM] (67), African Americans [~135 cM] (5), and Pima Indians [~177 cM] (47). A positional candidate gene in this region is the angiotensin receptor 1 [AGTR1, 3q21-q25]
12
Genotype by Diabetes Interaction effects on Glomerular Filtration Rate
(MIM 106165). Of the regions found with the strongest evidence for linkage of DN (i.e., 7q21.3, 10p15.3, 14q23.1, and 18q22.3) in the FIND data, we found weak evidence for linkage of GFR-CGc (LOD = 0.7) at a location between markers D7S2212 (7q21.11) and D7S821 (7q21.3) in our data. Interestingly, in our SAFDGS data, this same marker region was significantly linked with the metabolic syndrome (as defined by NCEP/ATPIII criteria) (data not shown). It is possible that some loci such as the one on chromosome 7q21.11-q21.3 across the genome have potential common genetic influences on DM and GFR. Such traits that are genetically correlated could exhibit overlapping linkage profiles.
Although our linkage findings of the estimates of GFR in our study are interesting, there are some limitations. To identify the specific genetic determinants of renal function across the genome, we used phenotypic information from two common surrogate measures of GFR, instead of using data from direct measures of renal function such as iothalamate clearance. To our knowledge, the two estimates of GFR (i.e., GFR-CG and GFR-MDRD) have not been validated in the Mexican American population. Although there has been a continued dialogue about their relative accuracy (24, 68-69), these GFR estimates are reasonably accurate in samples from patients with CKD, especially the estimates from GFR-4VMDRD equation. These equations may underestimate GFR in individuals with normal kidney function such as those in the SAFDGS sample. In addition, as remarked by Stevens et al. (68), GFR-CG appears to be less accurate than the GFR-MDRD study formula in older and obese people. Given attention to such observations, we found that the two GFR estimates correlated in our data set, but a sizable proportion of variance was distinct from each other, in turn suggesting the possibility of
some loci differentially influencing these surrogate measures of GFR.
Obesity is a risk factor for kidney disease (70). We have included BMI as a covariate in the analysis of GFR-4VMDRD. However, incorporation of BMI as an additional covariate slightly attenuated the evidence for linkage (LOD = 2.6 with BMI as a covariate versus LOD = 3.0 without BMI as a covariate) on chromosome 9q. Such a scenario cautions about the problems of adjustment for genetically correlated traits as they relate to power to detect linkage, given that BMI is genetically correlated with GFR-4VMDRD in our data (data not shown). In regard to GFR-CGc, BMI was not considered as a covariate since related information was included in the GFR-CGc formula. We examined whether BMI and weight were linked to the genetic location on chromosome 2q where we found strong evidence for linkage of GFR-CGc, and found that the evidence for linkage of the two obesity measures was none or negligible (BMI, LOD = 0.08 and Weight, LOD = 0.05). These findings reassure that the major GFR-CGc linkage finding on chromosome 2q is not primarily an obesity locus.
The variance components approach has been shown to be sensitive to violations of the assumption of multivariate normal distribution. Although this approach is shown to be robust to such violations, particularly leptokurtosis could result in inflated type I-error rates (36,71). Based on data simulations, it has been shown that trait distributions with coefficient of kurtosis <2.0 appear not to result in grossly inflated type I error. In this study, after adjustment for the trait-specific covariates, the coefficients of kurtosis for GFR-CGc and GFR-4VMDRD residuals were 0.79 and 1.35, respectively. Thus, it is possible that the linkage findings from this study may have been slightly inflated. However, for proper interpretation of the data, our study provided the empirical P values
13
Genotype by Diabetes Interaction effects on Glomerular Filtration Rate
together with the genomewide P values for the strongest GFR linkage findings. Aside from the above issues, the issue of correction for multiple testing in regard to multiple correlated traits is not straightforward since the corresponding models are not independent, which is the case in this study. Therefore, no attempt was made to correct for multiple testing in regard to the correlated GFR measures. In reference to the G × DM interaction model utilized in this study, it is possible that such a model could reflect gene x gene interactions.
In summary, by conducting a genome-wide linkage scan for GFR susceptibility loci in Mexican Americans, we found strong evidence for susceptibility genes influencing GFR on chromosomes 2q and 9q. The linkage finding on chromosome 2q exhibited genome-wide significance, only after incorporating G × DM interaction effects. This putative gene appears to have differential influence on the variation in GFR in diabetic and non-diabetic individuals in the Mexican American population. The finding of a GFR susceptibility locus on chromosome 2q in the
Joslin family data with similar features of diabetes status-specific QTL effects on variation in GFR is promising. Confirmation of our findings in other populations is warranted. This study also provides potential evidence for linkage of GFR on chromosomes 3p, 3q, 4p, 8q, 11q and 14q. Future GFR gene discovery efforts on chromosomes 2q and 9q may help to pave the way for prevention and treatment of diabetic patients at risk for developing renal diseases. ACKNOWLEDGEMENTS
This study was supported by grants from the National Institute of Diabetes, Digestive and Kidney Diseases (DK53889, DK42273, and DK47482). We thank the nursing and dietetic care provided by the staff of the Frederic C. Bartter General Clinical Research Center (GCRC) at the South Texas Veterans HealthCare Systems - Audie Murphy Division, San Antonio, Texas, and CIDR for performing genome scan. We warmly thank the families from the SAFDGS for their kind generosity and cooperation in taking part in the study.
14

Genotype by Diabetes Interaction effects on Glomerular Filtration Rate
REFERENCES
1. Gross JL, de Azevedo MJ, Silveiro SP, Canani LH, Caramori ML, Zelmanovitz T: Diabetic Nephropathy: Diagnosis, Prevention, and Treatment. Diabetes Care 28(1):164-176, 2005
2. US Renal Data System: Annual data report: Atlas of End-Stage Renal Disease in the United States, Bethesda, MD, National Institute of Health, National Institute of Diabetes and Digestive and Kidney Diseases. USRDS, 2001
3. Freedman BI, Soucie JM, Stone SM, Pegram S: Familial clustering of end-stage renal disease in blacks with HIV-associated nephropathy. Am J Kidney Disease 34: 254-258, 1999
4. Brown DM, Provoost AP, Daly MJ, Lander ES, Jacob HJ: Renal disease susceptibility and hypertension under independent genetic control in the fawn-hooded rat. Nat Genet 12:44-1251, 1996
5. Bowden DW, Colicigno CJ, Langefeld CD, Sale MM, Williams A et al : A genome scan for diabetic nephropathy in African Americans. Kidney Int 66:1517-1526, 2004
6. Freedman BI, Bowden DW, Rich SS, Valis CJ, Sale MM, Hicks PJ, Langefeld CD: A genome scan for all-cause end-stage renal disease in African Americans. Nephrol Dial Transplant 20:712-718, 2005
7. Placha G, Poznik D, Rich SS, Warram JH, Krolewski JH: Genome scan findings in families with type 2 diabetes point to different genetic predispodition to elevated urinary albumin excretion and to impaired renal function. Diabetes 54 (SUPPL 1): A199, 2005
8. Freedman BI, Bowden BW, Rich SS, Appel RG: Genetic initiation of hypertensive and diabetic nephropathy. AM J Hypertens 11: 251-257, 1998
9. Krolewski, AS, Ng DP, Canani LH, Warram JH: Genetics of diabetic nephropathy: How far are we from finding susceptibility genes? Adv Nephrol Necker Hosp 31: 295-315, 2001
10. Iyengar SK, Fox KA, Schachere M, Manzoor F, Slaughter ME, Covic AM, Orloff SM, Hayden PS, Olson JM, Schelling JR, Sedor JR: Linakge analysis of candidate loci for end-stage renal disease due to diabetic nephropathy. J Am Soc Nephrol 14: S195-S201, 2003
11. Iyengar SK, Abboud HE, Goddard KA, Saad MF, Adler SG, Arar NH, Bowden DW, Duggirala R, Elston RC, Hanson RL, Ipp E, Kao WH, Kimmel PL, Klag MJ, Knowler WC, Meoni LA, Nelson RG, Nicholas SB, Pahl MV, Parekh RS, Quade SR, Rich SS, Rotter JI, Scavini M, Schelling JR, Sedor JR, Sehgal AR, Shah VO, Smith MW, Taylor KD, Winkler A, Zager PG, Freedman BI, on behalf of the Family Investigation of Nephropathy and Diabetes Research Group. Genome-wide scans for diabetic nephropathy and albuminuria in multiethnic populations: The Family Investigation of Nephropathy and Diabetes (FIND). Diabetes 56:1577-1585, 2007
12. Hunt SC, Coon H, Hasstedt SJ, Cawthon RM, Camp NJ, Wu LL, Hopkins PN: Linkage of serum creatinine and glomerular filtration rate to chromosome 2 in Utah pedigrees. Am J Hypertens 17: 511-515, 2004
13. DeWan AT, Arnett DK, Atwood LD, Province MA, Lewis CE, Hunt SC, Eckfeldt J: A genome scan for renal function among hypertensives: the HyperGEN study. Am J Hum Genet 68: 136-144, 2001
14. Cohn DH, Shohat T, Yahav M, Ilan T, Rechavi G, King L, Shohat M: A locus for an autosomal dominant form of progressive renal failure and hypertension at chromosome 1q21. Am J Hum Genet 67: 647-651, 2000
15. Placha G, Poznik GD, Dunn J, Smiles A, Krolewski B, Glew T, Puppala S, Schneider J, Rogus JJ, Rich SS, Duggirala R, Warram JH, Krolewski AS. A genome-wide linkage scan for genes
15
Genotype by Diabetes Interaction effects on Glomerular Filtration Rate
controlling variation in renal function estimated by serum cystatin C levels in extended families with type 2 diabetes. Diabetes 55:3358-3365, 2006
16. Turner ST, Kardia SL, Mosley TH, Rule AD, Boerwinkle E, de Andrade M. Influence of genomic loci on measures of chronic kidney disease in hypertensive sibships. J Am Soc Nephrol 17:2048-2055, 2006
17. Leon JM, Freedman BI, Miller MB, North KE, Hunt SC, Eckfeldt JH, Lewis CE, Kraja AT, Djoussé L, Arnett DK. Genome scan of glomerular filtration rate and albuminuria: the HyperGEN study. Nephro. Dial. Transplant 22:763-771, 2007
18. Chen G, Adeyemo AA, Zhou J, Chen Y, Doumatey A, Lashley K, Huang H, Amoah A, Agyenim-Boateng K, Eghan BA, Okafor G, Acheampong J, Oli J, Fasanmade O, Johnson T, Rotimi C. A genome-wide search for linkage to renal function phenotypes in West Africans with type 2 diabetes. Am J Kidney Dis 49:394-400, 2007
19. Duggirala R, Blangero J, Almasy L, Dyer TD, Williams KL, Leach RJ, O'Connell P, Stern MP: Linkage of type 2 diabetes mellitus and of age at onset to a genetic location on chromosome 10q in Mexican Americans. Am J Hum Genet 64:1127–1140, 1999.
20. Puppala S, Dodd GD, Fowler S, Arya R, Schneider J, Farook VS, Granato R, Dyer TD, Almasy L, Jenkinson CP, Diehl AK, Stern MP, Blangero J, Duggirala R: A genomewide search finds major susceptibility loci for gallbladder disease on Chromosome 1 in Mexican Americans. Am J Hum Genet 278:377-392. 2006
21. World Health Organization: Definition, diagnosis and classification of diabetes mellitus and its complications: report of a WHO consultation. Part I. Diagnosis and classification of diabetes mellitus (WHO: Geneva), 1999
22. Haffner SM, Stern MP, Hazuda HP, Pugh JA, Patterson JK: Do upper-body and centralized adiposity measure different aspects of regional body-fat distribution? Diabetes 36:43–50, 1987
23. Comuzzie AG, Blangero J, Mahaney MC, Mitchell BD, Hixson JE, Samollow PB, Stern MP, MacCluer JW: Major gene with sex-specific effects influences fat mass in Mexican Americans. Genet Epidemiol 12:475–488, 1995
24. Levey AS, Coresh J, Greene T, Stevens LA, Zhang YL, Hendriksen S, Kusek JW, Van Lente F; Chronic Kidney Disease Epidemiology Collaboration . Using standardized serum creatinine values in the modification of diet in renal disease study equation for estimating glomerular filtration rate. Ann Intern Med 145:247-254, 2006
25. Levey AS, Bosch JP, Lewis JP, Greene T, Rogers N, Roth D: A more accurate method to estimate glomerular filtration rate from serum creatinine: a new prediction equation. Modification of Diet in Renal Disease Study Group. Ann Intern Med. 130: 461-470, 1999
26. Cockcroft DW, Gault M: Prediction of creatinine clearance from serum creatinine. Nephron 16: 31-41, 1976
27. McPeek MS, Sun L: Statistical tests for detection of misspecified relationships by use of genome-screen data. Am J Hum Genet 66:1076–1094, 2000
28. Dyke B: PEDSYS: A pedigree data management system. San Antonio: Southwest Foundation for Biomedical Research. Dept.of Genetics, 1996.
29. Sobel E, Papp JC, Lange K: Detection and integration of genotyping errors in statistical genetics. Am J Hum Genet 70:496–508, 2002
30. Boehnke M, Lange K: Ascertainment and goodness of fit of variance component models for pedigree data. Prog Clin Biol Res 147:173–192, 1984
31. Almasy L, Blangero J: Multipoint quantitative-trait linkage analysis in general pedigrees. Am J Hum Genet 62: 1198-1211, 1998
16
Genotype by Diabetes Interaction effects on Glomerular Filtration Rate
32. Lander ES, Green P: Construction of multilocus genetic linkage maps in humans. Proc Natl Acad Sci U S A 84:2363-2367, 1987
33. Matise TC, Perlin M, Chakravarti A: Automated construction of genetic linkage maps using an expert system (MultiMap): a human genome linkage map. Nat Genet 6:384–390, 1994
34. Heath SC: Markov chain Monte Carlo methods for radiation hybrid mapping. J Comput Biol 4:505–515, 1997
35. Hopper J, and Matthews J: Extensions to multivariate normal models for pedigree analysis. Ann Hum Genet 46: 373-383, 1982
36. Amos CI: Robust variance components approach for assessing genetic linkage in pedigrees. Am J Hum Genet 54:535–543, 1994
37. Self S, Liang K: Asymptotic properties of maximum likelihood ratio tests under nonstandard conditions. J Am Statist Assoc 82: 605-610, 1987
38. Blangero J, MacCluer JW, Kammerer CM, Mott CE: Genetic analysis of apolipoprotein A-1 in two dietary environments. Am J Hum Genet 47:414-428, 1990
39. Towne B, Almasy L, Siervogel RM, Blangero J: Effects of genotype x sex interaction on linkage analysis of visual event-related evoked potentials. Genet Epidemiol 17 Suppl 1:S355-60, 1999
40. Martin LJ, Kissebah AH, Sonnenberg GE, Blangero J, Comuzzie AG; Metabolic Risk Complications of Obesity Genes Project: Genotype-by-smoking interaction for leptin levels in the Metabolic Risk Complications of Obesity Genes project. Int J Obes Relat Metab Disord 27(3): 334-340, 2003
41. Arya R, Dyer TD, Warren D, Jenkinson CP, Duggirala R, Almasy L: Effect of genotype-by-alcoholism interaction on linkage analysis of an alcoholism-related quantitative phenotype. BMC Genetics 6(suppl 1): S120, 2005
42. Feingold E, Brown PO, Siegmund D. Gaussian models for genetic linkage analysis using complete high-resolution maps of identity by descent. Am J Hum Genet 53:234-51, 1993
43. Duggirala R, Pergola PE, Williams K, Arya R, Crawford MH: Genetic determination of variation in the estimates of creatinine clearance and glomerular filtration rate in the Mennonites. J Am Soc Nephrol 11: A0777, 2000
44. Fox CS, Yang Q, Cupples LA, Guo CY, Larson MG, Leip EP, Wilson PW, Levy D: Genomewide linkage analysis to serum creatinine, GFR, and creatinine clearance in a community-based population: the Framingham Heart Study. J Am Soc Nephrol 15: 2457-2461, 2004
45. Langefeld CD, Beck SR, Bowden DW, Rich SS, Wagenknecht LE, Freedman BI: Heritability of GFR and albuminuria in Caucasians with type 2 diabetes mellitus. Am J Kidney Dis 43: 796-800, 2004
46. Lander E Kruglyak L: Genetic dissection of complex traits: guidelines for interpreting and reporting linkage results. Nature Genet 11:241-247, 1995
47. Imperatore G, Hanson RL, Pettitt DK, Kobes S, Bennet PH, Knowler WC: Sib-pair linkage analysis for susceptibility genes for microvascular complications among Pima Indians with type 2 diabetes. Pima Diabetes Genes Group. Diabetes 47:821-830, 1998
48. Chung KW, Ferrell RE, Ellis D, Barmada M, Moritz M, Finegold DN, Jaffe R, Vats A. African American hypertensive nephropathy maps to a new locus on chromosome 9q31-q32. Am J Hum Genet 73:420-429, 2003
49. Arya R, Duggirala R, Almasy L, Rainwater DL, Mahaney MC, Cole S, Dyer TD, Williams K, Leach RJ, Hixson JE, MacCluer JW, O'Connell P, Stern MP, Blangero J. Linkage of high-
17

Genotype by Diabetes Interaction effects on Glomerular Filtration Rate
density lipoprotein-cholesterol concentrations to a locus on chromosome 9p in Mexican Americans. Nat. Genet 30:102-105, 2002
50. Cai G, Cole SA, Freeland-Graves JH, MacCluer JW, Blangero J, Comuzzie AG. Genome-wide scans reveal quantitative trait Loci on 8p and 13q related to insulin action and glucose metabolism: the San Antonio Family Heart Study. Diabetes 53:1369-1374, 2004
51. Haider NB, Carmi R, Shalev H, Sheffield VC, Landau D. A Bedouin kindred with infantile nephronophthisis demonstrates linkage to chromosome 9 by homozygosity mapping. Am J Hum Genet 63:1404-1410, 1998
52. Freedman BI, Langefeld CD, Rich SS, Valis CJ, Sale MM, Williams AH, Brown WM, Beck SR, Hicks PJ, Bowden DW: A genome scan for ESRD in black families enriched for non-diabetic nephropathy. J Am Soc Nephrol 15:2719-2727, 2004
53. Busfield F, Duffy DL, Kesting JB, Walker SM, Lovelock PK, Good D, Tate H, Watego D, Marczak M, Hayman N et al. A genome wide search for type 2 diabetes-susceptibility genes in indigenous Australians. Am J Hum Genet 70:349-357, 2002
54. MoriY, Otabe S, Dina C, Yasuda K, Populaire C, Lecoeur C, Vatin V, Durand E, Hara K, Okada T et al. Genome-wide search for type 2 diabetes in Japanese affected sib-pairs confirms susceptibility genes on 3q, 15q, and 20q and identifies two new candidate loci on 7p and 11p. Diabetes 47:1164-1169, 2002
55. Li WD, Dong C, Li D, Garrigan C, Price RA. A quantitative trait locus influencing fasting plasma glucose in chromosome region 18q22-23. Diabetes 53:2487-2491, 2004
56. Elbein SC, Hoffman MD, Teng K, Leppert MF, Hassetedt SJ. A genome-wide search for type 2 diabetes susceptibility genes in Utah Caucasians. Diabetes 48:1175-1182, 1999
57. Hanis CL, Boerwinkle E, Chakraborty R, Ellsworth DL, Concannon P, Stirling B, Morrison VA, Wapelhorst B, Spielman RS, Gogolin-Ewens KJ, Shepard JM, Williams SR, Risch N, Hinds D, Iwasaki N, Ogata M, Omori Y, Petzold C, Rietzch H, Schröder HE, Schulze J, Cox NJ, Menzel S, Boriraj VV, Chen X, Lim LR, Lindner T, Mereu LE, Wang YQ, Xiang K, Yamagata K, Yang Y, Bell GI. A genome-wide search for human non-insulin-dependent (type 2) diabetes genes reveals a major susceptibility locus on chromosome 2. Nat. Genet 13:161-166, 1996
58. Horikawa Y, Oda N, Cox NJ, Li X, Orho-Melander M, Hara M, Hinokio Y, Lindner TH, Mashima H, Schwarz PE, del Bosque-Plata L, Horikawa Y, Oda Y, Yoshiuchi I, Colilla S, Polonsky KS, Wei S, Concannon P, Iwasaki N, Schulze J, Baier LJ, Bogardus C, Groop L, Boerwinkle E, Hanis CL, Bell GI. Genetic variation in the gene encoding calpain-10 is associated with type 2 diabetes mellitus. Nat. Genet 26:163-175, 2000
59. Duggirala R, Blangero J, Almasy L, Dyer TD, Williams KL, Leach RJ, O'Connell P, Stern MP. Linkage of type 2 diabetes mellitus and of age at onset to a genetic location on chromosome 10q in Mexican Americans. Am J Hum Genet 64:1127-1140, 1999
60. Hunt KJ, Lehman DM, Arya R, Fowler S, Leach RJ, Göring HH, Almasy L, Blangero J, Dyer TD, Duggirala R, Stern MP. Genome-wide linkage analyses of type 2 diabetes in Mexican Americans: the San Antonio Family Diabetes/Gallbladder Study. Diabetes 54:2655-2662, 2005
61. Hanson RL, Ehm MG, Pettitt DJ, Prochazka M, Thompson DB, Timberlake D, Foroud T, Kobes S, Baier L, Burns DK, Almasy L, Blangero J, Garvey WT, Bennett PH, Knowler WC. An autosomal genomic scan for loci linked to type II diabetes mellitus and body-mass index in Pima Indians. Am J Hum Genet 63:1130-1138, 1998
18

Genotype by Diabetes Interaction effects on Glomerular Filtration Rate
62. Atwood LD, Heard-Costa NL, Cupples LA, Jaquish CE, Wilson PW, D'Agostino RB. Genomewide linkage analysis of body mass index across 28 years of the Framingham Heart Study. Am J Hum Genet 71:1044-1050, 2002
63. Duggirala R, Almasy L, Blangero J, Jenkinson CP, Arya R, DeFronzo RA, Stern MP, O'Connell P; American Diabetes Association GENNID Study Group . Further evidence for a type 2 diabetes susceptibility locus on chromosome 11q. Genet Epidemiol 24:240-242, 2003
64. Arya R, Duggirala R, Jenkinson CP, Almasy L, Blangero J, O'Connell P, Stern MP. Evidence of a novel quantitative-trait locus for obesity on chromosome 4p in Mexican Americans Am J Hum Genet 74:272-282, 2004
65. Prakash S, Chung KW, Sinha S, Barmada M, Ellis D, Ferrell RE, Finegold DN, Randhawa PS, Dinda A, Vats A. Autosomal dominant progressive nephropathy with deafness: linkage to a new locus on chromosome 11q24. J Am Soc Nephrol 14:1794-1803, 2003
66. Österholm AM, He B, Pitkaniemi J, Albinsson L, Berg T, Sarti C, Tuomilehto J, Tryggvason K. Genome-wide scan for type 1 diabetic nephropathy in the Finnish population reveals suggestive linkage to a single locus on chromosome 3q. Kidney Int 71:140-145, 2007
67. Moczulski DK, Rogus JJ, Antonellis A, Warram JH, Krolewski AS. Major susceptibility locus for nephropathy in type 1 diabetes on chromosome 3q: results of novel discordant sib-pair analysis. Diabetes 47:1164-1169, 1998
68. Stevens LA, Coresh J, Greene T, Levey AS. Assessing kidney function--measured and estimated glomerular filtration rate. N Engl J Med 354:2473-2483, 2006
69. Herget-Rosenthal S, Bökenkamp A, Hofmann W. How to estimate GFR-serum creatinine, serum cystatin C or equations? Clin Biochem 40:153-161, 2007
70. Speckman RA, McClellan WM, Volkova NV, Jurkovitz CT, Satko SG, Schoolwerth AC, Freedman BI. Obesity is associated with family history of ESRD in incident dialysis patients. Am J Kidney Dis 48:50-58, 2006
71. Blangero J, Williams JT, Almasy L. Variance component methods for detecting complex trait loci. Adv Genet 42:151-181, 2001
19
Genotype by Diabetes Interaction effects on Glomerular Filtration Rate
Table 1. Characteristics of 453 individuals with GFR values by diabetes status
aAntihypertensive treatment with ACE inhibitors or AT1R antagonists.
Diabetes Nondiabetes Phenotype Mean ± SD or % Mean ± SD or %
Sample size (N) 130 323 Gender (% Females) 62 59 Age (yrs) 56.7 ± 13.1 42.6 ± 15.3 Duration of diabetes (yrs) 7.9 ± 9.4 - Albuminuria (%) 36 4 Hypertension (%) 60 22 Anti-hypertensive medication (%)a 22 4 Systolic blood pressure (mm Hg) 137.7 ± 21.7 124.9 ± 15.2 Diastolic blood pressure (mm Hg) 72.6 ± 10.1 70.7 ± 9.4 GFR-CGc (ml/min/1.73 m2) 87.1 ± 30.7 91.6 ± 25.6 GFR-4VMDRD (ml/min/1.73 m2) 87.9 ± 20.6 89.1 ± 17.9 Serum Creatinine (mg/dl) 0.80 ± 0.2 0.84 ± 0.2 BMI (kg/m2) 32.9 ± 6.7 30.6 ± 7.1 Wt (kg) 85.9 ± 20.5 81.9 ± 21.7
20
Genotype by Diabetes Interaction effects on Glomerular Filtration Rate
Table 2. Numbers and types of relative pairs in 29 SAFDGS families consisting of 453 individuals with GFR data by diabetes status
aDM = diabetic and NDM = nondiabetic
Relative pairs by diabetes statusaType of relative pair Relationship coefficient DM - DM NDM -
NDM DM - NDM
ALL pairs
Parent-offspring 0.5000 27 148 163 338 Sibs 0.5000 45 273 146 464 Grandparent-grandchild 0.2500 3 33 32 68 Avuncular 0.2500 60 255 270 585 Half-sibs 0.2500 5 28 27 60 Double 1st cousins 0.2500 1 - 2 3 1st/2nd cousins 0.1562 3 1 4 8 Grand avuncular 0.1250 2 66 85 153 Half avuncular 0.1250 6 27 36 69 1st cousins 0.1250 81 364 223 668 Double 1st cousins, 1 removed 0.1250 2 4 9 15 1st cousins, 1 removed and 2nd cousins, 1 removed
0.0781 - 6 12 18
Great grand avuncular 0.0625 - 6 - 6 Half grand avuncular 0.0625 - 6 - 6 1st cousins, once removed 0.0625 21 431 294 746 Double 2nd cousins 0.0625 - 6 6 12 Half 1st cousins 0.0625 - 39 12 51 2nd cousins and 3rd cousins 0.0391 - 9 - 9 1st cousins, twice removed 0.0312 - 21 28 49 Half 1st cousins, once removed 0.0312 - 24 - 24 2nd cousins 0.0312 5 249 71 325 2nd cousins, 1 removed 0.0156 - 113 22 135 3rd cousins 0.0078 - 21 - 21 Total 261 2130 1442 3833
21
Genotype by Diabetes Interaction effects on Glomerular Filtration Rate
Table3. Chromosomal regions potentially linked (LOD or LODC ≥ 1.2) to GFR-CGc and GFR-4VMDRD based on multipoint linkage analyses
aGFR-CGc and GFR-4VMDRD are the recalculated Cockcroft-Gault equation and simplified 4-variable Modification of Diet in Renal Disease (MDRD) study equation (please see text). bMarshfield data (Kosambi cM) for the purpose of comparison. cModel 1 = model without G × DM interaction and Model 2 = model with G × DM interaction. dThe maximum LOD score of 2.7 based on Model 1 occurred at 225 cM (1-LOD interval = 209-249 cM) near marker D2S1363 (227 cM); however, according to Model 2, the maximum LODC score of 3.3 occurred at 236 cM (1-LOD interval = 216-249 cM) near marker D2S427 (237 cM). The locations where the maximum LOD scores occurred were separated by approximately 11 cM, but the 1-LOD intervals were found to be strongly overlapped. erefers to corresponding LOD scores in comparison with the other model. fGFR-4VMDRD analysis included BMI as a covariate. gGFR-4VMDRD analysis did not include BMI as a covariate.
Maximum LOD or LODC score
Model 1c Model 2c
Phenotypea Nearest marker region
Dist. from p-terb (cM)
Chr. location 1-LOD intervalb
LOD Empirical P value
LODC Empirical P value
D2S1363 227 2q36.3 209-249 2.7 1.1 x 10⁻³ 3.3d 3.2 x 10⁻⁴
D3S2387 6 3p26.3 6-24 1.4 1.4 x 10⁻² 1.7 9.6 x 10⁻³
D3S1764-D3S1744
153-161 3q23-q24 137-165 1.4 1.4 x 10⁻² 1.6 1.2 x 10⁻²
D4S2632-D4S1627
51-60 4p15.1-p13 30-92 1.3 1.7 x 10⁻² (1.0)e 4.1 x 10⁻²
D8S373 164 8q24.3 160-qter (0.0)e - 1.2 2.7 x 10⁻²
D9S922-D9S1120
80-89 9q21.31-q21.33 76-93 2.9 7.6 x 10⁻⁴ 2.4 1.9 x 10⁻³
D11S912-D11S968
131-148 11q24.3-q25 122-qter 2.4 1.8 x 10⁻³ 1.9 5.7 x 10⁻³
GFR-CGc
D14S1426-D14S1007
126-138 14q32.2-q32.33 106-qter 1.7 7.9 x 10⁻³ 1.2 2.7 x 10⁻²
GFR-4VMDRDf
D9S922-D9S1120
80-89 9q21.31-q21.33 76-92 2.6 2.3 x 10⁻⁴ - -
GFR-4VMDRDg
D9S922-D9S1120
80-89 9q21.31-q21.33 77-91 3.0 1.0 x 10⁻⁴ - -
22
Genotype by Diabetes Interaction effects on Glomerular Filtration Rate
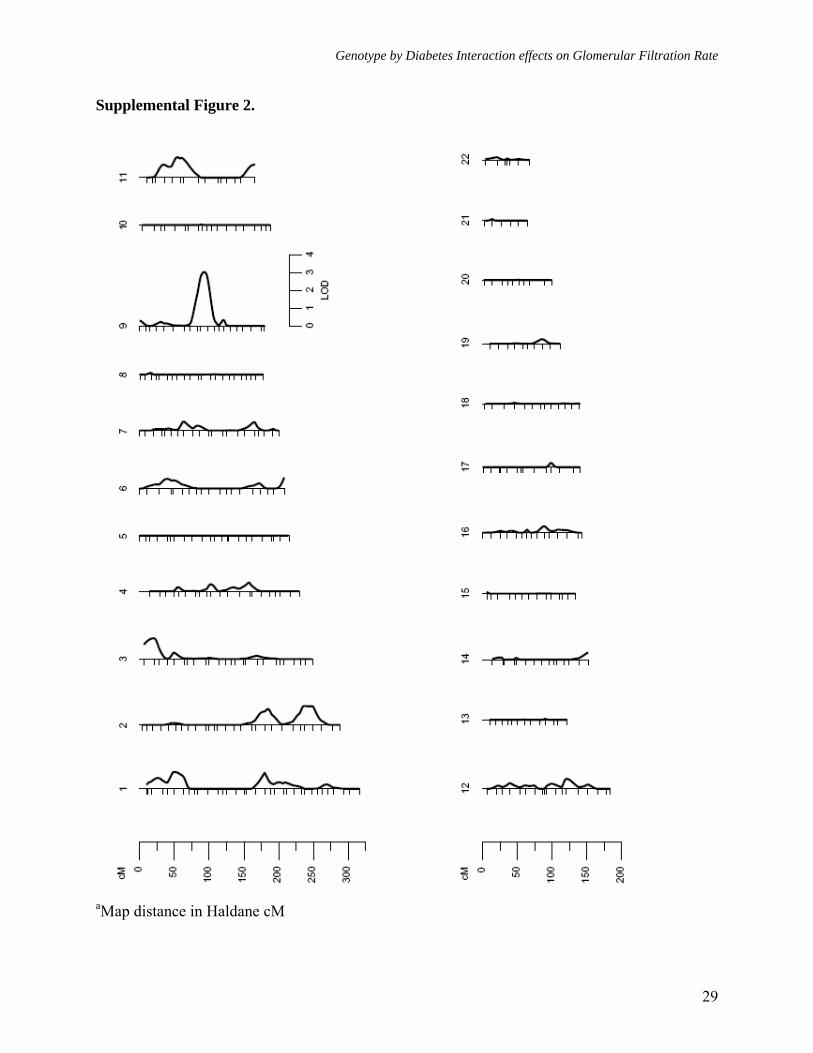
Figure legends: Figure 1. Multipoint linkage analysisa of GFR-CGc without G × DM interaction (Model 1) Figure 2. Multipoint linkagea profiles for GFR-4VMDRD and GFR- CGc (Model 1) on chromosome 9q Figure 3. Multipoint linkage analysisa of GFR-CGc with G × DM interaction (Model 2, only the LODC values are reported) Figure 4. Multipoint linkagea profiles for GFR-CGc on chromosome 2q obtained from Models 1 and 2 Supplement Figure 1. Multipoint linkage analysisa of GFR-4VMDRD (Model 1) with BMI as a covariate Supplement Figure 2. Multipoint linkage analysisa of GFR-4VMDRD (Model 1) without BMI as a covariate
23
Genotype by Diabetes Interaction effects on Glomerular Filtration Rate
Figure 1.
aMap distance in Haldane cM
24
Genotype by Diabetes Interaction effects on Glomerular Filtration Rate
Figure 2.
aMap distance in Haldane cM
GFR-CGc (max LOD = 2.9) …... GFR-4VMDRD (max LOD = 2.6)
25
Genotype by Diabetes Interaction effects on Glomerular Filtration Rate
Figure 3.
aMap distance in Haldane cM
26
Genotype by Diabetes Interaction effects on Glomerular Filtration Rate
Figure 4.
aMap distance in Haldane cM
G x DM interaction (LODC = 3.3) ….. No G x DM interaction (LOD = 2.7)
27
Genotype by Diabetes Interaction effects on Glomerular Filtration Rate
Supplemental Figure 1.
aMap distance in Haldane cM
28
Genotype by Diabetes Interaction effects on Glomerular Filtration Rate
Supplemental Figure 2.
aMap distance in Haldane cM
29