Genomic analyses across six cancer types identify basal-like breast cancer as a unique molecular...
12
Genomic Analyses across Six Cancer Types Identify Basal-like Breast Cancer as a Unique Molecular Entity Aleix Prat 1,2,3 , Barbara Adamo 3 , Cheng Fan 4 , Vicente Peg 5,6 , Maria Vidal 1,2,3 , Patricia Galva ´n 1 , Ana Vivancos 7 , Paolo Nuciforo 8 , He ´ctor G. Palmer 9 , Shaheenah Dawood 10 , Jordi Rodo ´n 3 , Santiago Ramony Cajal 5 , Josep Maria Del Campo 3 , Enriqueta Felip 3 , Josep Tabernero 3 & Javier Corte ´s 2,3 1 Translational Genomics Group, Vall d’Hebron Institute of Oncology (VHIO), Barcelona, Spain, 2 Breast Cancer Unit, Vall d’Hebron Institute of Oncology (VHIO), Barcelona, Spain, 3 Medical Oncology Department, Vall d’Hebron Institute of Oncology (VHIO), Barcelona, Spain, 4 Lineberger Comprehensive Cancer Center, University of North Carolina, Chapel Hill, USA, 5 Pathology Department, Vall d’Hebron University Hospital, Barcelona, Spain, 6 Morphological Sciences Department, Universitat Auto `noma de Barcelona, Spain, 7 Cancer Genomics Group, Vall d’Hebron Institute of Oncology (VHIO), Barcelona, Spain, 8 Molecular Oncology Group, Vall d’Hebron Institute of Oncology (VHIO), Barcelona, Spain, 9 Stem Cells and Cancer Group, Vall d’Hebron Institute of Oncology (VHIO), Barcelona, Spain, 10 Department of Medical Oncology, Dubai Hospital, U.A.E. To improve our understanding of the biological relationships among different types of cancer, we have characterized variation in gene expression patterns in a set of 1,707 samples representing 6 human cancer types (breast, ovarian, brain, colorectal, lung adenocarcinoma and squamous cell lung cancer). In the unified dataset, breast tumors of the Basal-like subtype were found to represent a unique molecular entity as any other cancer type, including the rest of breast tumors, while showing striking similarities with squamous cell lung cancers. Moreover, gene signatures tracking various cancer- and stromal-related biological processes such as proliferation, hypoxia and immune activation were found expressed similarly in different proportions of tumors across the various cancer types. These data suggest that clinical trials focusing on tumors with common profiles and/or biomarker expression rather than their tissue of origin are warranted with a special focus on Basal-like breast cancer and squamous cell lung carcinoma. C lassification and treatment of the majority of solid tumors is generally based on the tumor’s tissue of origin and histological appearance (e.g. squamous cell lung cancer). In some cancer types, identification of single molecular alterations has been found to be very useful in the clinical setting due to its ability to predict treatment efficacy. For example, epidermal growth factor receptor (EGFR) mutations predict benefit from anti- EGFR drugs in lung adenocarcinoma 1 , amplification of epidermal growth factor receptor type 2 (HER2) predicts benefit from anti-HER2 drugs in breast cancer 2 , Kirsten rat sarcoma viral oncogene homolog (KRAS) mutations predict lack of benefit from anti-EGFR drugs in colorectal cancer 3 and BRCA1 mutations predict benefit from poly (ADP-ribose) polymerase 1 (PARP1) inhibitors in ovarian cancer 4 . Thus, searching for novel biomarkers, drug targets and better classification algorithms to individualize treatment of cancer patients is an area of active preclinical and clinical research. In recent years, The Cancer Genome Atlas (TCGA) project has improved our understanding of the molecular alterations occurring in glioblastoma multiforme 5,6 , high grade serous ovarian cancer 7 , colorectal cancer 8 , squam- ous cell lung cancer 9 and breast cancer 10 and many other cancer types are being evaluated. In addition, these studies have revealed that particular molecular alterations such as TP53 mutations, MYC amplifications or CDKN2A deletions can occur in subsets of tumors of different cancer types. In fact, TCGA breast cancer project has observed that breast tumors of the Basal-like subtype share many genetic alterations with high-grade serous ovarian cancers, including TP53, RB1 and BRCA1 loss, CCNE1 and MYC amplifications, and high expression of HIF1-a/ARNT, MYC and FOXM1 gene signatures 10,11 . Overall, these data suggest that particular treatment strategies could be effective in tumors with similar genetic alterations and/or gene expression profiles regardless of the tumor’s tissue of origin 11,12 . Indeed, the observed benefit of anti-HER2 therapy in HER2-amplified breast and gastric cancers supports this hypothesis 13,14 . OPEN SUBJECT AREAS: CANCER DIAGNOSTIC MARKERS Received 30 September 2013 Accepted 3 December 2013 Published 18 December 2013 Correspondence and requests for materials should be addressed to A.P. ([email protected]) SCIENTIFIC REPORTS | 3 : 3544 | DOI: 10.1038/srep03544 1
Transcript of Genomic analyses across six cancer types identify basal-like breast cancer as a unique molecular...
Genomic Analyses across Six CancerTypes Identify Basal-like Breast Cancer asa Unique Molecular EntityAleix Prat1,2,3, Barbara Adamo3, Cheng Fan4, Vicente Peg5,6, Maria Vidal1,2,3, Patricia Galvan1,Ana Vivancos7, Paolo Nuciforo8, Hector G. Palmer9, Shaheenah Dawood10, Jordi Rodon3,Santiago Ramony Cajal5, Josep Maria Del Campo3, Enriqueta Felip3, Josep Tabernero3 & Javier Cortes2,3
1Translational Genomics Group, Vall d’Hebron Institute of Oncology (VHIO), Barcelona, Spain, 2Breast Cancer Unit, Vall d’HebronInstitute of Oncology (VHIO), Barcelona, Spain, 3Medical Oncology Department, Vall d’Hebron Institute of Oncology (VHIO),Barcelona, Spain, 4Lineberger Comprehensive Cancer Center, University of North Carolina, Chapel Hill, USA, 5PathologyDepartment, Vall d’Hebron University Hospital, Barcelona, Spain, 6Morphological Sciences Department, Universitat Autonoma deBarcelona, Spain, 7Cancer Genomics Group, Vall d’Hebron Institute of Oncology (VHIO), Barcelona, Spain, 8Molecular OncologyGroup, Vall d’Hebron Institute of Oncology (VHIO), Barcelona, Spain, 9Stem Cells and Cancer Group, Vall d’Hebron Institute ofOncology (VHIO), Barcelona, Spain, 10Department of Medical Oncology, Dubai Hospital, U.A.E.
To improve our understanding of the biological relationships among different types of cancer, we havecharacterized variation in gene expression patterns in a set of 1,707 samples representing 6 human cancertypes (breast, ovarian, brain, colorectal, lung adenocarcinoma and squamous cell lung cancer). In the unifieddataset, breast tumors of the Basal-like subtype were found to represent a unique molecular entity as anyother cancer type, including the rest of breast tumors, while showing striking similarities with squamous celllung cancers. Moreover, gene signatures tracking various cancer- and stromal-related biological processessuch as proliferation, hypoxia and immune activation were found expressed similarly in differentproportions of tumors across the various cancer types. These data suggest that clinical trials focusing ontumors with common profiles and/or biomarker expression rather than their tissue of origin are warrantedwith a special focus on Basal-like breast cancer and squamous cell lung carcinoma.
Classification and treatment of the majority of solid tumors is generally based on the tumor’s tissue of originand histological appearance (e.g. squamous cell lung cancer). In some cancer types, identification of singlemolecular alterations has been found to be very useful in the clinical setting due to its ability to predict
treatment efficacy. For example, epidermal growth factor receptor (EGFR) mutations predict benefit from anti-EGFR drugs in lung adenocarcinoma1, amplification of epidermal growth factor receptor type 2 (HER2) predictsbenefit from anti-HER2 drugs in breast cancer2, Kirsten rat sarcoma viral oncogene homolog (KRAS) mutationspredict lack of benefit from anti-EGFR drugs in colorectal cancer3 and BRCA1 mutations predict benefit frompoly (ADP-ribose) polymerase 1 (PARP1) inhibitors in ovarian cancer4. Thus, searching for novel biomarkers,drug targets and better classification algorithms to individualize treatment of cancer patients is an area of activepreclinical and clinical research.
In recent years, The Cancer Genome Atlas (TCGA) project has improved our understanding of the molecularalterations occurring in glioblastoma multiforme5,6, high grade serous ovarian cancer7, colorectal cancer8, squam-ous cell lung cancer9 and breast cancer10 and many other cancer types are being evaluated. In addition, thesestudies have revealed that particular molecular alterations such as TP53 mutations, MYC amplifications orCDKN2A deletions can occur in subsets of tumors of different cancer types. In fact, TCGA breast cancer projecthas observed that breast tumors of the Basal-like subtype share many genetic alterations with high-grade serousovarian cancers, including TP53, RB1 and BRCA1 loss, CCNE1 and MYC amplifications, and high expression ofHIF1-a/ARNT, MYC and FOXM1 gene signatures10,11. Overall, these data suggest that particular treatmentstrategies could be effective in tumors with similar genetic alterations and/or gene expression profiles regardlessof the tumor’s tissue of origin11,12. Indeed, the observed benefit of anti-HER2 therapy in HER2-amplified breastand gastric cancers supports this hypothesis13,14.
OPEN
SUBJECT AREAS:CANCER
DIAGNOSTIC MARKERS
Received30 September 2013
Accepted3 December 2013
Published18 December 2013
Correspondence andrequests for materials
should be addressed toA.P. ([email protected])
SCIENTIFIC REPORTS | 3 : 3544 | DOI: 10.1038/srep03544 1

To help better understand the relationships among different typesof cancer, we have compared head-to-head variation in global geneexpression patterns in a dataset of 1,707 samples representing 6human cancer types.
ResultsCombined microarray dataset. To study the relationships amongdifferent cancer types, we combined expression data of 17,987 genesand 1,707 samples representing 6 cancer types (glioblastoma multi-forme [GBM]5,6, high-grade serous ovarian carcinoma [OVARIAN]7,lung cancer adenocarcinoma [LUAD], squamous cell lung carcinoma[SQCLC]9, colorectal adenocarcinoma [CCR]8 and breast cancer10) ofthe TCGA project (Fig. 1A). The cancer type with the highest geneexpression variability was ovarian cancer with 9.1% of the genesshowing an interquartile range of expression above 3-fold, followedclosely by breast cancer (8.9%), LUAD (8.8%) and SQCLC (8.3%).CCR (4.6%) and GBM (4.5%) showed the lowest gene expressionvariability, suggesting that these two cancer types are biologicallymore homogenous.
Global gene expression landscape. To assess the global landscape ofexpression in the unified dataset, we performed principal compo-nents analysis (PCA)15. Brain, colorectal and breast cancer explainedmost of the gene expression variation displayed by the Principal
Components 1 and 2 (PC1 and PC2) with samples of ovariancancer, LUAD and SQCLC showing various levels of intermediatePC1 and PC2 scores (Fig. 1B). Strikingly, a subgroup of breastcancers almost entirely composed of the Basal-like subtype (in redcolor), as determined by the PAM50 subtype predictor, showedsignificant higher PC2 scores than the rest of breast tumors (i.e.Luminal/HER2-enriched/Normal-like) and were found close toovarian cancers, SQCLCs and LUADs (Fig. 1B). Similar PC1versus PC2 results were obtained from an independent geneexpression-based microarray dataset of 153 samples representingbreast cancer, LUAD, SQCLC and CRC (Suppl. Fig. 1).
To better understand the biological significance of PC1 and PC2,we evaluated the top-300 genes having the largest positive and nega-tive weights for both PCs (Fig. 1C and Supplemental Data). Geneweights are indicative of the relative contribution of each gene to theprincipal components. For PC1, the top-300 genes having the largestpositive weight were found enriched for neuron differentiation (e.g.neuronal cell adhesion molecule [NRCAM] and N-cadherin[CDH2]), gliogenesis (e.g. SRY [sex determining region Y]-box 11[SOX11]), cell-cell signaling (e.g. synaptotagmin IV [SYT4]) andsynaptogenesis (e.g. neurexin 1 [NRXN1]), whereas the top-300genes having the largest negative weight were found enriched fortight junctions (e.g. claudin-3 [CLDN3]), epithelial cell differenti-ation (i.e. FOXA1) and extracellular matrix (e.g. collagen, type XII,
Figure 1 | Combined gene expression microarray-based dataset of 1,707 samples representing 6 different cancer types from The Cancer Genome AtlasProject (TCGA; http://cancergenome.nih.gov/). (A) Microarray samples analyzed from each cancer type (number of samples and color identification).
(B) Principal component 1 and 2 (PC1 and PC2) loading plot using the 3,486 most variable genes. Samples have been colored based on their cancer type,
except for Basal-like breast tumors (n 5 98) that are colored in red. Weights of each gene for each PC can be found in Supplemental Data. (C)
Correlations between PC1 or PC2 scores and expression of selected genes in the entire dataset. (D) Consensus average linkage clustering matrix for k 5 3
to k 5 6 of all samples and the 3,486 most variables genes. The colored bar above the matrix identifies the various cancer types represented in each k group.
A single cancer type is shown in the bar if .98% of the samples of each k group are from that particular cancer type. Orange, GBM; Dark blue, OVARIAN;
Light blue, CCR; Grey, SQCLC; Green, BREAST; Violet, LUAD; Red, Basal-like breast cancer.
www.nature.com/scientificreports
SCIENTIFIC REPORTS | 3 : 3544 | DOI: 10.1038/srep03544 2
alpha 1 [COL12A1]). For PC2, the top-300 genes having the largestpositive weight were found enriched for serine proteases (e.g. kallik-rein-related peptidase 7 [KLK7]), drug metabolism (i.e. CYP3A7)and chemokines (e.g. interleukin-8 [IL8]), whereas the top-300 geneshaving the largest negative weight were found enriched for responseto hormone stimulus (e.g. estrogen receptor [ESR1] and GATA3),cell adhesion (e.g. claudin-8 [CLDN8]) and extracellular matrix (e.g.fibronectin 1 [FN1]). Similar biological findings were obtained whenthe top-100, top-200 and top-400 genes were evaluated (data notshown).
Testing the molecular uniqueness of Basal-like breast cancer. Theprevious results suggested that Basal-like breast cancer is molecularlydistinct from the other cancer types, including the rest of breasttumors. To test the level of uniqueness of Basal-like breast tumors,we performed consensus average linkage hierarchical clustering of allsamples (n 5 1,707) and the 3,486 most variable genes (Fig. 1D). Theconsensus clustering method provides quantitative and visualstability evidence for estimating the number of unsupervisedclasses in a dataset16. The results showed that clustering stabilityincreased for k 5 2 to k 5 7 (Suppl. Fig. 2). Strikingly, Basal-likebreast cancer was identified as an unsupervised class at k 5 5 beforecolorectal cancer was separated from both lung cancer types (i.e. at k5 6) and before both lung cancer types were separated from eachother (i.e. at k 5 7). Overall, this result suggests that Basal-like breastcancer is a reproducible and robust cancer type.
Expression of gene signatures corresponding to human DNAregions. Somatic copy number aberrations (CNAs) in breast cancerare associated with expression in ,40% of genes17. To estimate thestatus of CNAs in our combined dataset, we evaluated the expressionof 326 gene sets corresponding to each human chromosome and eachcytogenetic band with at least one gene. These gene lists were
obtained from the C1-positional gene sets of the MolecularSignature Database (Broad Institute; http://www.broadinstitute.org/gsea/msigdb/), and are helpful in identifying effects related tochromosomal deletions or amplifications.
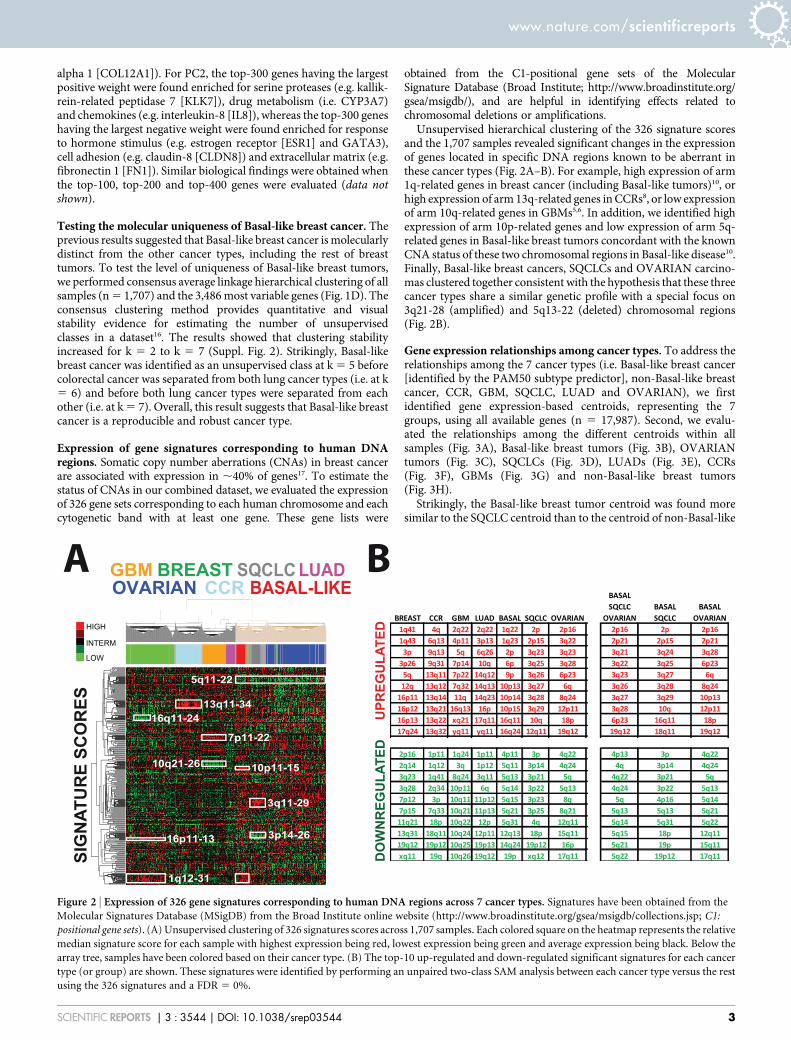
Unsupervised hierarchical clustering of the 326 signature scoresand the 1,707 samples revealed significant changes in the expressionof genes located in specific DNA regions known to be aberrant inthese cancer types (Fig. 2A–B). For example, high expression of arm1q-related genes in breast cancer (including Basal-like tumors)10, orhigh expression of arm 13q-related genes in CCRs8, or low expressionof arm 10q-related genes in GBMs5,6. In addition, we identified highexpression of arm 10p-related genes and low expression of arm 5q-related genes in Basal-like breast tumors concordant with the knownCNA status of these two chromosomal regions in Basal-like disease10.Finally, Basal-like breast cancers, SQCLCs and OVARIAN carcino-mas clustered together consistent with the hypothesis that these threecancer types share a similar genetic profile with a special focus on3q21-28 (amplified) and 5q13-22 (deleted) chromosomal regions(Fig. 2B).
Gene expression relationships among cancer types. To address therelationships among the 7 cancer types (i.e. Basal-like breast cancer[identified by the PAM50 subtype predictor], non-Basal-like breastcancer, CCR, GBM, SQCLC, LUAD and OVARIAN), we firstidentified gene expression-based centroids, representing the 7groups, using all available genes (n 5 17,987). Second, we evalu-ated the relationships among the different centroids within allsamples (Fig. 3A), Basal-like breast tumors (Fig. 3B), OVARIANtumors (Fig. 3C), SQCLCs (Fig. 3D), LUADs (Fig. 3E), CCRs(Fig. 3F), GBMs (Fig. 3G) and non-Basal-like breast tumors(Fig. 3H).
Strikingly, the Basal-like breast tumor centroid was found moresimilar to the SQCLC centroid than to the centroid of non-Basal-like
Figure 2 | Expression of 326 gene signatures corresponding to human DNA regions across 7 cancer types. Signatures have been obtained from the
Molecular Signatures Database (MSigDB) from the Broad Institute online website (http://www.broadinstitute.org/gsea/msigdb/collections.jsp; C1:
positional gene sets). (A) Unsupervised clustering of 326 signatures scores across 1,707 samples. Each colored square on the heatmap represents the relative
median signature score for each sample with highest expression being red, lowest expression being green and average expression being black. Below the
array tree, samples have been colored based on their cancer type. (B) The top-10 up-regulated and down-regulated significant signatures for each cancer
type (or group) are shown. These signatures were identified by performing an unpaired two-class SAM analysis between each cancer type versus the rest
using the 326 signatures and a FDR 5 0%.
www.nature.com/scientificreports
SCIENTIFIC REPORTS | 3 : 3544 | DOI: 10.1038/srep03544 3

breast cancer (Fig. 3B). Concordant with this, 55% of Basal-likebreast tumors were found more similar (i.e. lower distances) toSQCLCs than to non-Basal-like breast cancers. When compared tothe different intrinsic subtypes of breast cancer, 76%, 72% and 17% ofBasal-like breast tumors were found more similar to SQCLC than toLuminal A, Luminal B and HER2-enriched breast tumors, respect-ively. Interestingly, Basal-like breast tumors were found more similarto both lung cancer types and to non-Basal-like breast cancers than toOVARIAN tumors (Fig. 3B).
To determine the biological processes in common between Basal-like breast cancers and SQCLC, we identified genes whose expressionis found significantly expressed in both cancer types compared toluminal cancers (Luminal A and B tumors combined). Among thetop 300 up-regulated genes (False Discover Rate 5 0%) in Basal-likebreast cancer and SQCLC, we identified genes involved in ectoder-mal differentiation (e.g. keratin 5, 14 and 17), inflammatory response(i.e. chemokine [C-X-C motif] ligand 1 [CXCL1] and CXCL3) andcell cycle (e.g. cyclin E1 [CCNE1] and centromere protein A[CENPA]). Among the top 300 down-regulated genes, we identifiedgenes involved in the response to hormone stimulus (e.g. estrogenreceptor [ESR1] and GATA3), mammary gland development (e.g.prolactin receptor [PRLR] and ERBB4) and microtubule-based pro-cess (e.g. kinesin family member 12 [KIF12] and microtubule-assoc-iated protein tau [MAPT]). This data is concordant with thehistological appearance and the immunohistochemical expressionof ER, keratins 5/6 and the proliferation-related biomarker Ki67 ina Basal-like breast tumor, a SQCLC with a Basal-like profile and abreast Luminal A tumor (Fig. 4).
Multiclass tumor prediction. To identify genes that are distinctive ofeach cancer type, including Basal-like breast cancer, we performedClaNC, a nearest centroid-based classifier that balances the numberof genes per class (Fig. 5A). A 126-gene signature (18 genes per cancertype) was established from the smallest gene set with the lowest crossvalidation and prediction error (2.0%) (Fig. 5B). Among the variouscancer types, Basal-like breast cancers and SQCLCs showed thehighest prediction error (7.1% and 15.6%), and the majority ofmisclassified SQCLCs (n 5 5, 71.4%) were identified as Basal-likebreast cancer. Of note, two previously identified diagnostic biomar-kers of serous ovarian cancer (Wilm’s tumor [WT]-1)18 and lungadenocarcinoma (thyroid nuclear factor 1 [TITF-1])19 were foundin the 18-gene list of these two cancer types (Fig. 5C).
Common patterns of gene expression across cancer types. Althougheach cancer type is molecularly distinct, we sought to identify groups
of genes (i.e. gene signatures) with independent patterns of variation.To accomplish this, we clustered all samples with the 3,486 mostvariable genes (Fig. 6) and identified 19 gene clusters of at least 10genes and an intraclass correlation coefficient .0.70 (SupplementalData). Among them, we identified gene signatures tracking lympho-cyte activation/infiltration (e.g. CD8A and CD2), ectodermaldevelopment (e.g. keratin 6B and 15), interleukin-8 pathway (e.g.IL8 and CXCL1), tight junctions (e.g. claudin-3 and occludin),proliferation (e.g. budding uninhibited by benzimidazoles 1 homo-log [BUB1] and CENPA) and interferon-response pathways (e.g.STAT1 and interferon-induced protein with tetratricopeptide repeats1 [IFIT1]) (Fig. 6).
Common patterns of gene signature expression across cancertypes. Similar to the previous analysis, we determined the expres-sion scores of 329 gene signatures (or modules)20 in all samples,including 115 previously published signatures, and then performedan unsupervised hierarchical clustering (Fig. 7). Thirteen clusters ofat least 5 signatures and an intraclass correlation coefficient .0.70were identified. These groups of gene signatures were found to trackvarious types of biological processes/features likely coming from thetumor cell, the microenvironment or both. Interestingly, the expres-sion of signatures tracking microenvironment-related (e.g. lympho-cyte activation/infiltration) biological processes were found to be lesscancer type specific than the expression of gene signatures trackingtumor-related biological processes (e.g. proliferation).
To illustrate the overlap among cancer types regarding theexpression of a single signature, we evaluated 6 previously identifiedgene signatures that are known to track various cancer-related andstromal/microenviroment-related biological processes related tobreast cancer biology21,47–51. The results showed that high expressionof these signatures (i.e. the top 20% expressers in the unified dataset)occurs across all cancer types, albeit with different proportions(Fig. 8). Of note, the TP53 signature21, which was trained in a prev-iously reported breast cancer dataset, predicted TP53 somatic muta-tions in the combined TCGA dataset (area under the receiveroperating characteristic curve 5 0.782; Suppl. Fig. 3). Moreover,the scores of the previously reported PTEN-loss signature werefound correlated with INPP4B (correlation coefficient 5 20.424,p-value , 0.0001) and phospho-4E-BP1 (correlation coefficient 5
0.368, p-value , 0.0001) protein expression in the TCGA breastcancer dataset (Suppl. Fig. 4).
Breast cancer intrinsic subtyping of non-breast tumors. To evalu-ate if the breast cancer ‘intrinsic’ profiles (Luminal A, Luminal B,
Figure 3 | Transcriptomic relationships among cancer types. Relationships have been determined by calculating the Euclidean distances of each sample
to each of the 7 centroids, which represent each cancer type, using all genes of the unified dataset. Clustering has been performed after median
centering the Euclidean distances of each sample. The following genomic relationships among cancer types are shown based on the following subsets of
patients: (A) all patients (ALL); (B) basal-like breast cancer (BASAL-LIKE); (C) ovarian cancer (OVARIAN); (D) squamous cell lung cancer (SQCLC);
(E) lung adenocarcinoma (LUAD); (F) colorectal adenocarcinoma (CCR); (G) glioblastoma multiforme (GBM); (H) non-Basal-like breast cancer
(BREAST).
www.nature.com/scientificreports
SCIENTIFIC REPORTS | 3 : 3544 | DOI: 10.1038/srep03544 4

HER2-enriched and Basal-like) can be identified in non-breasttumors, we performed breast cancer intrinsic subtyping of non-breast cancer types using the PAM50 and Claudin-low subtypepredictors22,23. Interestingly, all the breast cancer ‘intrinsic’ profileswere identified albeit with different proportions (Table 1). Forexample, the Basal-like profile was identified in 55% and 53% ofSQCLC and ovarian cancers, respectively, whereas virtually allcolorectal cancers (99%), and most lung adenocarcinomas (59%)
showed the HER2-enriched profile. Of note, 28% of ovariancancers and 24% of SQCLC tumors also showed the HER2-enriched profile. Finally, the Claudin-low profile was identified in20% and 16% of SQCLCs and LUADs, respectively.
To provide further evidence, we performed breast cancer intrinsicsubtyping of non-breast cancer types in two independent datasets(Suppl. Fig. 5 and 6). First, we evaluated a publicly available micro-array dataset (GSE23768) that includes 153 samples of breast cancer
Figure 4 | Immunohistochemical (IHC) and PAM50 gene expression analyses of a Basal-like breast cancer, a SQCLC with a Basal-like profile and aLuminal A breast cancer. Hematoxylin/eosine (H/E); Estrogen receptor (ER) expression; Keratin 5/6 (KRT5/6) expression; Proliferation-related Ki-67
expression. Each colored square on the heatmap below the IHC images represents the relative transcript abundance (in log2 space) of each PAM50
gene with highest expression being red, lowest expression being green and average expression being black.
www.nature.com/scientificreports
SCIENTIFIC REPORTS | 3 : 3544 | DOI: 10.1038/srep03544 5

(n 5 84), CCR (n 5 26), SQCLC (n 5 22) and LUAD (n 5 21)24
(Suppl. Fig. 5). Similar to previous results, 92.3% and 7.7% of allCCRs were identified as HER2-enriched and Basal-like, and 59.1%and 27.3% of SQCLCs were identified as Basal-like and Claudin-low,respectively.
Finally, we evaluated PAM50 gene expression in a dataset fromVall d’Hebron Institute of Oncology that includes 125 formalin-fixedparaffin-embedded tumor samples of breast cancer (n 5 53) andCCR (n 5 72) (Suppl. Fig. 6). Similar to previous results, 88.9%and 11.1% of all CCRs were identified as HER2-enriched andBasal-like, respectively. Of note, ERBB2 was not found overexpressedin these CRCs HER2-enriched tumors, except for 1 case (1.4%),which we found highly amplified in HER2 by FISH (ratio gene/chro-mosome 5 7.23) (Suppl. Fig. 7).
DiscussionIn this study, we have evaluated global gene expression data of 6human cancer types from the TCGA project, and made the followingobservations. First, a group of breast cancers, virtually all of the Basal-like subtype, have a unique and distinct profile as the profile of any of
the other cancer types, including the rest of breast tumors. Second,although Basal-like breast tumors and high grade serous ovarian car-cinomas may share similar genetic alterations10, our transcriptomicanalyses show that the majority of Basal-like tumors are more similarto SQCLCs than to high grade serous ovarian carcinomas and the restof breast tumors. Indeed, when compared with each breast cancerintrinsic subtype, ,70% Basal-like tumors were found more similarto SQCLC than Luminal A and B breast tumors. Third, we identifiedcancer type specific genes and confirmed the association of WT-1 andTITF-1 expression with the identification of serous ovarian cancer andLUAD, respectively. Finally, we provided evidence that distinct genesignatures can be found expressed regardless of the cancer type. Forexample, we identified the Basal-like breast cancer profile in themajority of SQCLC and ovarian cancers, whereas the HER2-enrichedbreast cancer profile was found expressed in a subset of ovarian can-cers and SQCLCs and the majority of LUADs and CCRs.
The observation that Basal-like breast cancer is remarkably differentfrom the rest of breast tumors argues for two distinct cells of origin inthe mammary gland25. In fact, ducts and lobules in the normal humanbreast are lined by two cell layers, an inner/luminal cell population
Figure 5 | Identification of a cancer type-specific 126-gene signature. (A) Clustering of the 126-gene scores obtained after Classification by Nearest
Centroids (ClaNC) analysis. Discriminative genes are shown in red and in green color. (B) Training error of the 126-gene signature across the 7 cancer-
types. (C) Genes whose high (red) or low (green) expression define each cancer type. Gene Symbols are shown first, followed by the Entrez GeneIDs.
www.nature.com/scientificreports
SCIENTIFIC REPORTS | 3 : 3544 | DOI: 10.1038/srep03544 6

that expresses luminal keratins such as keratins 8, 18 and 19 as well asBCL2, MUC1 and estrogen receptor, and a distinct outer cell layer,named the basal layer, which is composed of cells that exhibit featuresof both epithelial and smooth muscle cells such as expression of
keratins 5, 14 and 17, smooth muscle actin and p63. However, basalkeratins are also expressed in a subpopulation of luminal cells26,27 andpreclinical mouse work has shown conflicting data regarding the cellof origin of Basal-like breast tumors28–31 (i.e. luminal progenitor versus
Figure 6 | Unsupervised hierarchical clustering of 7 different cancer types and the 3,486 most variable genes. (A) Tumor samples have been ordered
based on the consensus clustering matrix (Fig. 1D). Each colored square on the heatmap represents the relative median transcript abundance (in log2
space) for each sample with highest expression being red, lowest expression being green and average expression being black. (B) Expression of selected
gene clusters tracking several cancer-related biological processes. Clusters were selected based on the following criteria: at least 10 genes and an
intraclass correlation coefficient .0.70. Colored bars to the right identify the locations of the selected clusters. The gene list of the 19 gene clusters
identified can be found in Supplemental Data. Gene symbols and Entrez GeneIDs are shown on the right.
www.nature.com/scientificreports
SCIENTIFIC REPORTS | 3 : 3544 | DOI: 10.1038/srep03544 7

bipotent progenitor/stem cell). In any case, our observation that themajority of Basal-like tumors are more similar to SQCLC than to therest of breast tumors, especially to the luminal tumors, suggests thatthe cell of origin of Basal-like breast tumors has similar features andlocation, in an epithelial layer, as the cell of origin of SQCLCs, which isthe basal cell present in the airway basal lamina32.
The transcriptomic similarities observed here between Basal-like breast cancers and SQCLCs are also found at the DNA level.
Indeed, the most frequently mutated genes in Basal-like breasttumors (i.e. TP53, PIK3CA and RB1) are also found in the top10 significantly mutated genes in SQCLC. Of note, the most fre-quently mutated gene in both tumors types is TP53 with a pre-valence of ,80%. In addition, both cancer types also share manyfocal regions of DNA amplification or deletion (SupplementalData). Among 28 significant focal DNA regions of amplificationin Basal-like breast cancer identified in the TCGA breast cancer
Figure 7 | Unsupervised hierarchical clustering of the 7 different cancer types and 329 gene signature scores. (A) 329 gene signatures and all tumor
samples. Each colored square on the heatmap represents the relative signature score (in log2 space) for each sample with highest expression
being red, lowest expression being green and average expression being black. On the right, selected signature groups were selected. Black bars to the right
identify the approximate locations of the selected groups. The signature scores of each sample can be found in Supplemental Data.
www.nature.com/scientificreports
SCIENTIFIC REPORTS | 3 : 3544 | DOI: 10.1038/srep03544 8

project10, 7 (25%) are also found in SQCLC: 8q24.21 (e.g. MYC),8p11.23 (e.g. FGFR1), 7p11.2 (e.g. EGFR), 12p13.33 (e.g. FOXM1),15q26.3 (e.g. ALDH1A3), 21q21.1 (e.g. miRNA-let-7c), 11q13.3(e.g. FGF3 and FGF4). Among 36 significant focal DNA regionsof deletion in Basal-like breast cancer, 13 (36%) are also found inSQCLC such as 10q23.31 (e.g. PTEN), 10q26.3 (e.g. INPP5A),
11q25 (e.g. ATM), 4p16.3 (e.g. INPP4B), 9p21.3 (e.g. CDKN2Aand CDKN2B) and 5q11.2 (e.g. RAD17). Finally, at the clinicallevel, both cancer types have a poor prognosis with a high pro-pensity for metastatic spread33–35. In terms of treatment response,both show high sensitivity to platinum-based therapies36,37
although resistant disease easily emerges38.
Figure 8 | Expression of 6 selected gene signatures (SIGN) representing various cancer-related biological processes in the unified dataset. For each gene
signature, samples have been rank ordered based on their gene signature score (red, black and green represent above, equal and below the median score).
Samples from each cancer type are shown below the gene signature score heatmap. Percentages of samples present in the top 20% expressers in the
entire dataset are shown on the left. PROLIF, proliferation; EMT, epithelial to mesenchymal transition; TP53MUT, P53 mutation.
Table 1 | Breast cancer intrinsic subtyping of non-breast cancer types*
N Basal-like Claudin-low HER2-E Luminal A Luminal B Normal-like P-value*
CCR 220 1% 0% 99% 0% 0% 0% 0.172CCR_CIN 88 0% 0% 100% 0% 0% 0%CCR_Invasive 61 0% 0% 100% 0% 0% 0%CCR_MSI/CIMP 71 3% 1% 96% 0% 0% 0%GBM 202 0% 100% 0% 0% 0% 0% -GBM_Classical 54 0% 100% 0% 0% 0% 0%GBM_Mesenchymal 58 0% 100% 0% 0% 0% 0%GBM_Neural 33 0% 100% 0% 0% 0% 0%GBM_Proneural 57 0% 100% 0% 0% 0% 0%OVARIAN 489 53% 8% 28% 0% 5% 6% ,0.001OVARIAN_Differentiated 135 57% 0% 27% 0% 4% 13%OVARIAN_Immunoreactive 107 48% 1% 40% 0% 11% 0%OVARIAN_Mesenchymal 109 44% 26% 21% 1% 4% 5%OVARIAN_Proliferative 138 62% 7% 24% 0% 2% 6%SQCLC 122 55% 20% 24% 0% 0% 1% 0.004SQCLC_Basal 32 78% 13% 9% 0% 0% 0%SQCLC _Classical 45 47% 13% 40% 0% 0% 0%SQCLC _Primitive 19 47% 26% 26% 0% 0% 0%SQCLC _Secretory 26 46% 38% 12% 0% 0% 4%LUAD 127 8% 16% 59% 9% 2% 6% ,0.001LUAD_Magnoid 40 15% 5% 63% 8% 8% 3%LUAD_Squamoid 43 9% 37% 53% 0% 0% 0%LUAD_Bronchioid 44 0% 5% 61% 20% 0% 14%Total 1707 26% 17% 30% 14% 9% 4% -
*, HER2-E, HER2-enriched. CCR, colorectal cancer; CIN, chromosomal instability; MSI/CIMP, microsatellite instability (MSI) located primarily in the right colon and frequently associated with the CpGisland methylator phenotype (CIMP); GBM, glioblastoma multiforme; SQCLC, squamous cell lung cancer; LUAD, lung adenocarcinoma. P-values have been obtained by performing a Chi-square test of thesubtype distribution within each cancer type.
www.nature.com/scientificreports
SCIENTIFIC REPORTS | 3 : 3544 | DOI: 10.1038/srep03544 9

The TGCA breast cancer project has previously found commongenetic alterations between Basal-like breast cancer and high-gradeserous ovarian carcinomas10,11. Concordant with this, we observedthat most ovarian cancers show a Basal-like profile and are moresimilar to Basal-like breast cancer than to the other cancer typesevaluated; conversely, Basal-like breast tumors are more similar toboth lung cancers and non-Basal-like breast cancer than to ovariancancer. The potential explanation for this non-reciprocity despitethat serous ovarian cancers and Basal-like breast tumors share manyalterations at the DNA level is currently unknown but might well berelated to the fact that the cell of origins of these two tumor typesmight have different biological functions and/or epigenetic programsin its respective organ. Although targeting a similar genetic alterationin two different cancer types might be a successful strategy in somecases (i.e. HER2 amplification in HER21 gastric and breast can-cers)12,13, tumor cell context might also be important in other casesas highlighted by the limited response observed so far to BRAFinhibitors of BRAF (V600E) mutated colorectal cancers comparedto BRAF-mutated melanomas39.
Despite the differences in global gene expression profiles, ovariancancer does have a similar prevalence of TP53 mutations and RB1 asBasal-like breast cancer and SQCLC. In addition, the three cancertypes also share 3 focal regions of DNA amplification (8q24.21,12p13.33 and 15q26.3) and 10 focal regions of DNA deletion(2q22.1, 2q37.3, 5q11.2, 9p21.3, 10q23.31, 10q26.3, 11q25, 16p13.3,18q23 and 19p13.3) (Supplemental Data). Interestingly, ourexpression analysis of DNA chromosomal regions and cytogenicbands has also identified the 5q13-22 region as a commonly deletedacross the three cancer types. Interestingly, this DNA region containsBRCA1-dependent DNA repair genes such as RAD17, RAD50 andRAP80, and its deletion has been shown to increase sensitivity to aPARP inhibitor and carboplatin in preclinical models of Basal-likebreast cancer40.
Over the years, the intrinsic subtypes of breast cancer (Luminal A,Luminal B, HER2-enriched and Basal-like) have shown significantdifferences in terms of survival, response to therapies and dissem-ination patterns33. Identification of these ‘intrinsic’ profiles in non-breast cancer types revealed interesting associations. For example,virtually all CRCs in the TCGA and in two independent datasets wereidentified as HER2-enriched despite ERBB2 not being overexpressedor amplified8,41. This result suggests that another oncogene or drivermight be inducing a similar activation of the downstream signalingpathways, including MAPK/RAS pathways, in a similar manner asERBB2. Interestingly, we have previously shown that the HER2-enriched subtype can be identified in HER2-nonamplified breastcancers (especially within the so-called triple-negative disease), andthese tumors tend to show high expression of EGFR42. Anotherinteresting observation has been the identification of the LuminalA and B breast cancer ‘intrinsic’ profiles in 11% of lung adeno-carcinomas, suggesting that these tumors are enriched for estrogenreceptor-regulated biological processes. Interestingly, substantialpreclinical evidence supports a role for hormonal influence on lungcancer43,44, and treatment with estrogen plus progestin in women hasshown to increase deaths from lung cancer45.
Although we could identify common pattern of gene (or sig-nature) expression across different cancer types, each cancer type(including Basal-like breast cancer) is a unique molecular entitywhen global gene expression analyses are performed. This promptedus to identify a robust 126-gene signature (18 genes per cancer type)that can identify the 6 cancer types. Interestingly, the list includedknown cancer type specific biomarkers such WT-1 (for serousovarian cancer) and TITF-1 (for lung adenocarcinoma). Other bio-markers somewhat related to specific cancer types were keratin 20(KRT20) for CRCs, prolactin receptor (PRLR) for non-Basal-likebreast cancers, forkhead box C1 (FOXC1) for Basal-like breast can-cers, tumor protein p63 (TP63, also known as TP73L) for SQCLCs,
various surfactant associated proteins (SFTPA2, SFTPC and SFTPD)for LUADs and oligodendrocyte transcription factor 2 (OLIG2) forGBMs.
To conclude, molecular screening for specific alterations in thetumor cells and/or the tumor microenviroment such as DNA muta-tions, DNA amplifications and RNA and protein expression, isbecoming commonplace in many parts of the world46. Patients whosetumor has a specific biological alteration that might be inhibited by anovel biological drug are being incorporated in early phase clinicaltrials regardless of the cancer type. Indeed, a subset of gastric andbreast cancers showing amplification of HER2 benefit from anti-HER2 therapies13,14. At the same time, various cancer types benefitfrom anti-angiogenic (i.e. bevacizumab) and immune enhancers(PD-L1 antibody)47,48. Although this strategy shows promise as evid-ence by the results of some studies, it is still unknown how best toapproach it. Our data argues in favor of targeting common molecularalterations of the tumor and/or the microenvironment regardless ofthe tumor’s tissue of origin with a special focus on Basal-like breastand squamous cell lung cancer.
MethodsGene expression data from TCGA. All gene expression microarray data is publiclyavailable and can be obtained from the TCGA portal (https://tcga-data.nci.nih.gov/tcga/). We evaluated a total of 1,580 samples from published cancer types from TCGAincluding glioblastoma multiforme5,6 (GBM, n 5 202), high-grade serous ovariancarcinoma7 (named here ovarian cancer, n 5 489), breast cancer10 (n 5 547),colorectal cancer8 (CCR, n 5 220) and squamous cell lung carcinoma9 (SQCLC, n 5
122). In addition, we also included 127 unpublished samples from the TCGA lungadenocarcinoma (LUAD) project that are already publicly available in the TCGAportal for a total of 1,707 samples. Of note, all microarrays were performed at theUniversity of North Carolina (UNC) under the same protocol and platform (AgilentTechnology, Santa Clara, CA). Briefly, 1 to 2 ug of total RNA sample and StratageneUniversal Human Reference were amplified and labeled using Agilent’s Low RNAInput Linear Amplification Kit. The total yield of amplified RNA (aRNA) and Cy dyeincorporation was measured by NanoDrop. Sample and reference 7–10 ug of each)were co-hybridized to a Custom Agilent 244K Gene Expression Microarray. Arrayswere scanned on an Agilent Scanner and probe information was obtained withAgilent’s Feature Extraction Software.
All microarray data was downloaded from the UNC UMD website (https://genome.unc.edu/). The probes or genes for all analyses were filtered by requiring thelowess normalized intensity values in both sample and control to be .10. The nor-malized log2 ratios (Cy5 sample/Cy3 control) of probes mapping to the same gene(Entrez ID as defined by the manufacturer) were averaged to generate independentexpression estimates of a total of 17,987 genes. No significant batch effects based onthe microarray chip barcode were observed (Suppl. Fig. 8–9).
Gene expression signatures. In the unified dataset, we evaluated 329 gene signaturesusing the gene lists and algorithms previously described20,21,23,49–51. In addition, weevaluated the percentage of tumors within a cancer type that falls within the top-20%expressers in the unified dataset for the following gene sigantures: a TP53 mutationsignature21, a VEGF13-hypoxia signature49, an immune cell signature19, a 11-geneproliferation signature23, a PTEN loss signature50 and an epithelial-to-mesenchymaltransition (EMT) signature51.
To identify the breast cancer ‘intrinsic’ subtype in non-breast tumors (Luminal A,Luminal B, HER2-enriched, Basal-like, Claudin-low and Normal-like), we used thePAM50 intrinsic subtype classifier23 and the Claudin-low subtype predictor22 aftergene centering the combined dataset onto the breast cancer dataset. To ensure sub-typing of non-breast cancers was correctly implemented, we compared the subtypecalls obtained in breast cancers compared to the subtype calls provided in the TCGAbreast cancer datasets.
Subtype identification. For all cancer types, except LUAD, we used the subtype callsas provided in each TCGA publication5–9. For LUADs, we used the tumor centroidsprovided in Wilkerson et al.52 and assigned a subtype call (Bronchioid, magnoid andsquamoid) for each LUAD using Single Sample Predictor (SSP).
Immunohistochemical (IHC) analyses. We selected 3 tumors representing a Basal-like breast cancer, a SQCLC with a PAM50 Basal-like profile and a Luminal A breastcancer. To confirm the intrinsic subtype of the two breast tumors and the Basal-likeprofile of the lung cancer, we performed expression analyses of the 50 PAM50 genes(and 5 house-keeping genes) using the nCounter Nanostring platform after purifying,100 ng of total RNA from the same tumor block where IHC analyses wereperformed. Immunohistochemical staining using the avidin-biotin-peroxidasetechnique was performed for each antibody. Five- micrometer-thick sections were cutfrom the tissue specimens and placed on poly-L-lysine–coated glass slides. Sectionswere deparaffined by xylene and rehydrated in graded alcohol. Endogenousperoxidase was blocked by immersing the sections in 0.1% hydrogen peroxidase in
www.nature.com/scientificreports
SCIENTIFIC REPORTS | 3 : 3544 | DOI: 10.1038/srep03544 10

absolute methanol for 20 min. For antigen retrieval, the tissue sections were heated ina pressure cooker in citric acid monohydrate 10 mM, pH 6.0, for 5 min, and thenincubated with the primary antibody at room temperature. IHC was performed withBenchmark XT (Ventana Medical Systems, Inc, Tucson, AZ). The primary antibodiesand dilutions used were: anti-ER (Ventana Medical Systems, prediluted), anti-Ki-67(Ventana Medical Systems, prediluted), anti-CK5/6 (Biocare, prediluted). All slideswere hematoxylin counterstained, dehydrated, and mounted. Omitting the primaryantibody performed negative controls.
Evaluation of two independent gene expression-based datasets. The first dataset isa publicly available microarray dataset (GSE23768, Affymetrix Human Exon 1.0 STArray)24 that includes 153 samples of breast cancer (n 5 84), CCR (n 5 26), SQCLC(n 5 22) and LUAD (n 5 21). Normalized data was obtained from Gene ExpressionOmnibus, and only the most variable probes (i.e. highest inter-quartile range) for eachgene were considered for further analyses.
The second dataset is an in-house dataset of VHIO that includes 53 formalin-fixedparaffin-embedded (FFPE) breast samples representing all the subtypes and 72primary untreated FFPE CCRs. We performed expression analyses of 49 of the 50PAM50 genes (and 5 house-keeping genes) using the nCounter Nanostring platformafter purifying ,100 ng of total RNA.
Statistical analysis. From the combined microarray dataset, we selected the mostvariable genes within each cancer-type (breast, ovarian, LUAD, SQCLC, GBM andCCR) by selecting 3,486 genes with an interquartile range (i.e. difference between theupper and lower quartiles), which is a measure of statistical dispersion, of at least 3-fold (Supplemental Data). To estimate the ‘distance’ of each sample to each cancertype centroid, we calculated the Euclidean distance using SSP. Differences between‘distances’ of each sample to two centroids were used to determine the grade ofsimilarity.
All microarray cluster analyses were displayed using Java Treeview version 1.1.4r2and can be found in supplemental materials. Average-linkage hierarchical clusteringwas performed using Cluster v3.053. Biologic analysis of microarray data was per-formed with DAVID annotation tool (http://david.abcc.ncifcrf.gov/)54. Only signifi-cant (p , 0.001) Gene Ontology enrichments are shown in the text. Consensusclustering plus (http://bioc.ism.ac.jp/2.6/bioc/html/ConsensusClusterPlus.html)16
and principal complement plots of gene expression data were performed using R(http://cran.r-project.org).
1. Lynch, T. J. et al. Activating Mutations in the Epidermal Growth Factor ReceptorUnderlying Responsiveness of Non–Small-Cell Lung Cancer to Gefitinib. NewEngl J Med 350, 2129–2139 (2004).
2. Baselga, J. et al. Pertuzumab plus Trastuzumab plus Docetaxel for MetastaticBreast Cancer. New Engl J Med 366, 109–119 (2012).
3. Tejpar, S. et al. Association of KRAS G13D Tumor Mutations With Outcome inPatients With Metastatic Colorectal Cancer Treated With First-LineChemotherapy With or Without Cetuximab. J Clin Oncol 30, 3570–3577 (2012).
4. Fong, P. C. et al. Poly(ADP)-Ribose Polymerase Inhibition: Frequent DurableResponses in BRCA Carrier Ovarian Cancer Correlating With Platinum-FreeInterval. J Clin Oncol 28, 2512–2519 (2010).
5. Network, T. C. G. A. Comprehensive genomic characterization defines humanglioblastoma genes and core pathways. Nature 455, 1061–1068 (2008).
6. Verhaak, R. et al. Integrated genomic analysis identifies clinically relevantsubtypes of glioblastoma characterized by abnormalities in PDGFRA, IDH1,EGFR, and NF1. Cancer cell 19, (2010).
7. Network, T. C. G. A. Integrated genomic analyses of ovarian carcinoma. Nature474, 609–615 (2011).
8. Network, T. C. G. A. Comprehensive molecular characterization of human colonand rectal cancer. Nature 487, 330–337 (2012).
9. Network, T. C. G. A. Comprehensive genomic characterization of squamous celllung cancers. Nature 489, 519–525 (2012).
10. Network, T. C. G. A. Comprehensive molecular portraits of human breast tumors.Nature 490, 61–70 (2012).
11. Ellis, M. J. & Perou, C. M. The Genomic Landscape of Breast Cancer as aTherapeutic Roadmap. Cancer Discov 3, 27–34 (2013).
12. Cortes, J. et al. New Approach to Cancer Therapy Based on a Molecularly DefinedCancer Classification. CA Cancer J Clin (2013 In Press).
13. Bang, Y.-J. et al. Trastuzumab in combination with chemotherapy versuschemotherapy alone for treatment of HER2-positive advanced gastric or gastro-oesophageal junction cancer (ToGA): a phase 3, open-label, randomisedcontrolled trial. Lancet 376, 687–697 (2010).
14. Baselga, J. et al. Phase II Study of Efficacy, Safety, and Pharmacokinetics ofTrastuzumab Monotherapy Administered on a 3-Weekly Schedule. J Clin Oncol23, 2162–2171 (2005).
15. Ringner, M. What is principal component analysis? Nat Biotech 26, 303–304(2008).
16. Wilkerson, M. D. & Hayes, D. N. ConsensusClusterPlus: a class discovery toolwith confidence assessments and item tracking. Bioinformatics 26, 1572–1573(2010).
17. Curtis, C. et al. The genomic and transcriptomic architecture of 2,000 breasttumours reveals novel subgroups. Nature 486, 346–352 (2012).
18. Goldstein, N. S., Bassi, D. & Uzieblo, A. WT1 Is an Integral Component of anAntibody Panel to Distinguish Pancreaticobiliary and Some Ovarian EpithelialNeoplasms. Am J Clin Pathol 116, 246–252 (2001).
19. Anagnostou, V. K. et al. Molecular classification of nonsmall cell lung cancer usinga 4-protein quantitative assay. Cancer 118, 1607–1618 (2012).
20. Fan, C. et al. Building prognostic models for breast cancer patients using clinicalvariables and hundreds of gene expression signatures. BMC Med Genomics 4, 3(2010).
21. Troester, M. et al. Gene expression patterns associated with p53 status in breastcancer. BMC Cancer 6, 276 (2006).
22. Prat, A. et al. Phenotypic and Molecular Characterization of the Claudin-lowIntrinsic Subtype of Breast Cancer. Breast Cancer Res 12, R68 (2010).
23. Parker, J. S. et al. Supervised Risk Predictor of Breast Cancer Based on IntrinsicSubtypes. J Clin Oncol 27, 1160–1167 (2009).
24. Kan, Z. et al. Diverse somatic mutation patterns and pathway alterations in humancancers. Nature 466, 869–873 (2010).
25. Prat, A. & Perou, C. M. Mammary development meets cancer genomics. Nat Med15, 842 (2009).
26. Gusterson, B., Ross, D., Heath, V. & Stein, T. Basal cytokeratins and theirrelationship to the cellular origin and functional classification of breast cancer.Breast Cancer Res 7, 143–148 (2005).
27. Rakha, E. A., Reis-Filho, J. S. & Ellis, I. O. Basal-Like Breast Cancer: A CriticalReview. J Clin Oncol 26, 2568–2581 (2008).
28. Liu, X. et al. Somatic loss of BRCA1 and p53 in mice induces mammary tumorswith features of human BRCA1-mutated basal-like breast cancer. Proc Nat AcadSci USA 104, 12111–12116 (2007).
29. Molyneux, G. et al. BRCA1 Basal-like Breast Cancers Originate from LuminalEpithelial Progenitors and Not from Basal Stem Cells. Cell stem cell 7, 403–417(2010).
30. Chaffer, C. L. & Weinberg, R. A. Cancer Cell of Origin: Spotlight on LuminalProgenitors. Cell stem cell 7, 271–272 (2010).
31. Lim, E. et al. Aberrant luminal progenitors as the candidate target population forbasal tumor development in BRCA1 mutation carriers. Nat Med 15, 907 (2009).
32. Sutherland, K. D. & Berns, A. Cell of origin of lung cancer. Mol Oncol 4, 397–403(2010).
33. Scaltriti, M. et al. Cyclin E amplification/overexpression is a mechanism oftrastuzumab resistance in HER21 breast cancer patients. Proc Nat Acad Sci USA108, 3761–3766 (2011).
34. Harrell, J. et al. Genomic analysis identifies unique signatures predictive of brain,lung, and liver relapse. Breast Cancer Res Treat 132, 523–535 (2012).
35. Ou, S. H. I., Zell, J. A., Ziogas, A. & Anton-Culver, H. Prognostic factors forsurvival of stage I nonsmall cell lung cancer patients. Cancer 110, 1532–1541(2007).
36. Silver, D. P. et al. Efficacy of Neoadjuvant Cisplatin in Triple-Negative BreastCancer. J Clin Oncol 28, 1145–1153 (2010).
37. Martin, M. et al. Genomic predictors of response to doxorubicin versus docetaxelin primary breast cancer. Breast Cancer Res Treat 128, 127–136 (2011).
38. Balko, J. et al. Profiling of residual breast cancers after neoadjuvant chemotherapyidentifies DUSP4 deficiency as a mechanism of drug resistance. Nat Med 18,1052–1059 (2013).
39. Prahallad, A. et al. Unresponsiveness of colon cancer to BRAF(V600E) inhibitionthrough feedback activation of EGFR. Nature 483, 100–103 (2012).
40. Weigman, V. et al. Basal-like Breast cancer DNA copy number losses identifygenes involved in genomic instability, response to therapy, and patient survival.Breast Cancer Res Treat 133, 865–880 (2012).
41. Sclafani, F. et al. HER2 in high-risk rectal cancer patients treated in EXPERT-C, arandomized phase II trial of neoadjuvant capecitabine and oxaliplatin (CAPOX)and chemoradiotherapy (CRT) with or without cetuximab. Ann Oncol (2013 InPress).
42. Prat, A. et al. Molecular Characterization of Basal-Like and Non-Basal-LikeTriple-Negative Breast Cancer. Oncologist 18, 123–133 (2013).
43. Stabile, L. P. et al. Combined Targeting of the Estrogen Receptor and theEpidermal Growth Factor Receptor in Non–Small Cell Lung Cancer ShowsEnhanced Antiproliferative Effects. Cancer Res 65, 1459–1470 (2005).
44. Marquez-Garban, D. C., Chen, H.-W., Goodglick, L., Fishbein, M. C. & Pietras,R. J. Targeting Aromatase and Estrogen Signaling in Human Non-Small Cell LungCancer. Ann N Y Acad Sci 1155, 194–205 (2009).
45. Chlebowski, R. T. et al. Oestrogen plus progestin and lung cancer inpostmenopausal women (Women’s Health Initiative trial): a post-hoc analysis ofa randomised controlled trial. Lancet 374, 1243–1251 (2009).
46. Rodon, J. et al. Molecular prescreening to select patient population in early clinicaltrials. Nat Rev Clin Oncol 9, 359–366 (2012).
47. Braghiroli, M. I., Sabbaga, J. & Hoff, P. M. Bevacizumab: overview of the literature.Expert Review of Anticancer Therapy 12, 567–580 (2012).
48. Brahmer, J. R. et al. Safety and Activity of Anti–PD-L1 Antibody in Patients withAdvanced Cancer. New Engl J Med 366, 2455–2465 (2012).
49. Hu, Z. et al. A compact VEGF signature associated with distant metastases andpoor outcomes. BMC Med 7, 9 (2009).
50. Saal, L. H. et al. Poor prognosis in carcinoma is associated with a gene expressionsignature of aberrant PTEN tumor suppressor pathway activity. Proc Natl AcadSci U S A 104, 7564–7569 (2007).
www.nature.com/scientificreports
SCIENTIFIC REPORTS | 3 : 3544 | DOI: 10.1038/srep03544 11

51. Taube, J. H. et al. Core epithelial-to-mesenchymal transition interactome gene-expression signature is associated with claudin-low and metaplastic breast cancersubtypes. Proc Natl Acad Sci U S A 107, 15449–15454 (2010).
52. Wilkerson, M. D. et al. Differential Pathogenesis of Lung AdenocarcinomaSubtypes Involving Sequence Mutations, Copy Number, ChromosomalInstability, and Methylation. PLoS ONE 7, e36530 (2012).
53. Eisen, M. B., Spellman, P. T., Brown, P. O. & Botstein, D. Cluster analysis anddisplay of genome-wide expression patterns. Proc Natl Acad Sci U S A 95,14863–14868 (1998).
54. Dennis, G. et al. DAVID: database for annotation, visualization, and Integrateddiscovery. Genome Biol 4, R60 (2003).
AcknowledgmentsThis work was supported by funds from the ROCHE Spanish Grant for TranslationalResearch (A.P.) and Instituto de Salud Carlos III - PI11/00917 (J.T.).
Author contributionsA.P., B.A. and J.C. contributed to experimental design. A.P., V.P. and P.G. were responsiblefor performing experiments. A.P., B.A., V.P. and C.F. contributed to data analysis. A.P.,B.A., C.F., V.P., M.V., P.G., S.D., A.V., J.R., H.G.P., P.N., S.R.C., J.M.D., E.F., J.T. and J.C.contributed to manuscript preparation.
Additional informationSupplementary information accompanies this paper at http://www.nature.com/scientificreports
Competing financial interests: A.P. reports an uncompensated advisory role forNanostring Technologies.
How to cite this article: Prat, A. et al. Genomic Analyses across Six Cancer Types IdentifyBasal-like Breast Cancer as a Unique Molecular Entity. Sci. Rep. 3, 3544; DOI:10.1038/srep03544 (2013).
This work is licensed under a Creative Commons Attribution-NonCommercial-NoDerivs 3.0 Unported license. To view a copy of this license,
visit http://creativecommons.org/licenses/by-nc-nd/3.0
www.nature.com/scientificreports
SCIENTIFIC REPORTS | 3 : 3544 | DOI: 10.1038/srep03544 12