Values of Customer Reliability - Australian Energy Regulator

Nature GeNetics VOLUME 46 | NUMBER 1 | JANUARY 2014 77
With the increased availability of high-resolution sequence information, genome-wide association (GWA) studies have become feasible in a number of species1–8. The vast majority of these studies are conducted in human populations, where it is difficult to provide strong evidence for the functional involvement of unknown genes that are identified using GWA. Here we used the model organism Arabidopsis thaliana to combine high-throughput confocal microscopy imaging of traits at the cellular level, GWA and expression analyses to identify genomic regions that are associated with developmental cell–type traits. We identify and characterize a new F-box gene, KUK, that regulates meristem and cell length. We further show that polymorphisms in the coding sequence are the major causes of KUK allele–dependent natural variation in root development. This work demonstrates the feasibility of GWA using cellular traits to identify causal genes for basic biological processes such as development.
GWA has the potential to identify previously uncharacterized genes that underlie basic biological processes. The model organism A. thaliana has been shown to be highly suitable for GWA, as a large number of natural isogenic lines are available that allow very powerful GWA approaches7. However, although several studies have identified candidate loci7,9 or genes that are implicated in specific biological processes10,11, finding new regulatory genes and providing strong evidence of their causality has been more difficult. We reasoned that biometric measurements of organ development at the cellular level could survey more specific processes than those at the whole-organ or organismal scale, as is commonly used in quantitative genetics. Furthermore, a model system with a large number of mapped bio-logical pathways and the availability of diverse sets of genome-wide data should facilitate a more accurate prediction of GWA candidate genes by employing this prior knowledge12. The Arabidopsis root meets these requirements very well because one of the densest cell type–specific transcriptome maps has been produced for this organ13. Most importantly, it is amenable to high-throughput phenotyping
of cellular features14, and a large number of high-density genotyped genomes are available from isogenic Arabidopsis populations all over the world15.
To accurately assess traits at the cellular level, we acquired high-resolution images of root tips from more than 1,500 Arabidopsis seed-lings of 201 accessions (Supplementary Table 1) using automated confocal microscopy and a custom growth chamber (Supplementary Fig. 1). We focused on three traits with the potential to provide insight into the control of cell proliferation and differentiation: the length of the meristem zone (the part of the root in which cells divide), the length of the elongation zone (the part of the root in which rapid longitudinal elongation and early differentiation takes place) and the length of mature cortical cells (Fig. 1a–d and Supplementary Table 2). Interestingly, meristem and cell length were highly positively correlated (R2 = 0.92), whereas the length of the elongation zone was slightly negatively correlated to both of these other traits (R2 = −0.63 and R2 = −0.60, respectively) (Fig. 1e–g and Supplementary Table 3), indicating a tight coordination of cell proliferation in the meristem and subsequent differentiation.
Having obtained this large-scale compendium of cellular traits (Supplementary Tables 2 and 4), we conducted GWA mapping using a mixed model algorithm16,17, which has been shown to correct popu-lation structure confounding18, and SNP data from the 250K SNP chip7,15,19. To exclude false positives, we used the very conservative Bonferroni testing correction with a threshold of 0.1 (10% false posi-tives expected), which corresponds to an uncorrected P value of 4.65 × 10⁻⁷. Even though we conducted independent GWA analyses for all traits, the significantly associated SNP for meristem length (at posi-tion 22244990 on chromosome 1) was most highly associated with variation in mature-cell length (Fig. 2 and Supplementary Table 5). We hypothesized that a common regulator of meristem and cell length would be causal for this peak.
To assess genetic diversity at this locus, we evaluated the allele frequency of the most significantly associated SNP. In our set of lines, the A allele that is associated with a longer meristem and longer cells was present in 63.5% of the accessions, and the minor G allele that is associated with a shorter meristem and shorter cells
Genome-wide association study using cellular traits identifies a new regulator of root development in ArabidopsisMónica Meijón1,2, Santosh B Satbhai1, Takashi Tsuchimatsu1 & Wolfgang Busch1
1Gregor Mendel Institute of Molecular Plant Biology, Austrian Academy of Sciences, Vienna, Austria. 2Present address: Regional Institute for Research and Agro-Food Development (SERIDA), Forest Research Program, ‘La Mata’ Experimental Station, Grado-Asturias, Spain. Correspondence should be addressed to W.B. ([email protected]).
Received 18 July; accepted 11 October; published online 10 November 2013; corrected online 26 November 2013 (details online); doi:10.1038/ng.2824
l e t t e r snp
g©
2014
Nat
ure
Am
eric
a, In
c. A
ll rig
hts
rese
rved
.

78 VOLUME 46 | NUMBER 1 | JANUARY 2014 Nature GeNetics
l e t t e r s
showed a 36.5% frequency (Supplementary Fig. 2a). In the RegMap panel, the largest set of accessions that has been densely genotyped using the 250K SNP chip15, this distribution is 58% and 42%, respectively (Supplementary Fig. 2b). Although there is no apparent pat-tern of geographical distribution of the alleles (Supplementary Fig. 3), we found that many accessions with the G allele shared an extended haplotype spanning more than 30 kb, in contrast to accessions with the A allele (Supplementary Figs. 2b and 4a–c). Using two different methods to perform selection scans, we
found that the extended haplotype of this region was indeed an out-lier in the genome-wide distribution of selection statistics scores (Supplementary Fig. 4d–g). This is consistent with a scenario of a recent selective sweep. However, because the peak of selection signals
is relatively large, it is not possible to conclude whether the target of selection is related to the GWA peak for the traits we studied. To evalu-ate whether other traits are significantly asso-ciated with this genome region, we queried the mixed model–based association results of a recent study that conducted GWA on a large number of diverse traits7. However, no asso-ciations below a P =10−4, which is two orders of magnitude less stringent than the thresh-old used in our study, were found for the 10-kb region centered on the most signifi-cantly associated SNP (at position 22244990 on chromosome 1) from our study.
Next we set out to determine which gene in proximity to this highly associated genomic region underlies the variation. We assumed that the expression of genes involved in pathways that cause this variation should be enriched in tissues exhibiting the traits. Both meristem length and cell length are outcomes of developmental processes that occur in the root tip. We thus determined the expression
a
Mature cell length
Elongation zone length
Meristem zone length
100 µm
b0.010
0.008
0.006
0.004
0.002
0
50 100 150 200 250 300Average length of themeristem zone (µm)
Den
sity
Den
sity
c0.004
Average length of theelongation zone (µm)
0.003
0.002
0.001
0
200 400 600 800 1,000
Den
sity
Average length of amature cortical cell (µm)
50 100 150 200 250 300
d0.010
0.008
0.006
0.004
0.002
0
Length of elongationzone (µm)
e300
250
200
150
200 400 600 800
Leng
th o
f mer
iste
mzo
ne (
µm)
300
250
200
150
600Length of mature cortical
cell (µm)
100 150 300 450
f
Leng
th o
f mer
iste
mzo
ne (
µm)
800
600
400
200
Length of mature corticalcell (µm)
Leng
th o
f elo
ngat
ion
zone
(µm
)
g
100 150 300 450 600
Figure 1 Root traits at the cellular level. (a) Overview of the cellular traits used in this study. Shown is a median longitudinal optical section of an exemplary root (Col-0 accession) not used in this study (an example from the actual data set used is shown in supplementary Fig. 1). Cells highlighted in different colors belong to different tissue types. Arrows indicate the traits used in this study. (b–d) General density curves superimposed on histograms of the three traits. The data shown are the trait averages for the 201 accessions. (e–g) Correlations among traits. Red dots indicate trait values; the blue to yellow gradient indicates the density of the trait value data points.
6
–log
10 P
–log
10 P
–log
10 P
543210
6
5
4
3
2
1
0
6543210
654321
a
b
c
d
0 8 16 24 16 160 08 8 0 8 0 8
0 8 16 24 16 160 08 8 0 8 0 8
0 8 16 24 16 160 08 8 0 8 0 8
Meristem zone length
Elongation zone length
Mature cell length
Mb
Mb
Mb
AT
1G60
320
AT
1G60
370
AT
1G60
400
AT
1G60
390
AT
1G60
380
AT
1G60
360
AT
1G60
350
AT
1G60
340
AT
1G60
330
22235000 22245000
22240000 22250000
5′
3′
3′
5′
Figure 2 GWA data. (a–c) Manhattan plots of GWA results for cellular traits. The chromosomes are depicted in different colors. The horizontal dash-dot line corresponds to a nominal P < 0.05 significance threshold after Bonferroni correction. (d) The genomic region surrounding a significant GWA peak for meristem length. Top, −log10 P values of association of the SNPs. Bottom, gene models in genomic regions. The x axis represents the position on chromosome 1.
npg
© 2
014
Nat
ure
Am
eric
a, In
c. A
ll rig
hts
rese
rved
.

Nature GeNetics VOLUME 46 | NUMBER 1 | JANUARY 2014 79
l e t t e r s
of all genes in the 10-kb region surrounding the GWA peak (Fig. 2d) by quantitative RT-PCR (qRT-PCR). Only one gene, encoding an uncharacterized F-box protein (At1g60370), was preferentially expressed in the root tip (25-fold enrichment), whereas the other five genes were expressed preferentially in the mature part of the root (Fig. 3a). Another assumption we made was that the expression of a good candidate gene might be altered in accessions with a longer mer-istem and longer mature cells (Bur-0 and Wa-1) relative to accessions with a shorter meristem and shorter cells (Uk-1 and Ak-1). We tested this assumption using qRT-PCR and also included the reference acces-sion Col-0 as an intermediate case. Whereas most of the genes showed a very low correlation with the trait (R2 = 0.02–0.17; Supplementary Fig. 5), expression of the F-box gene showed a very high correlation with both associated traits (meristem zone length (R2 = 0.94) and mature-cell length (R2 = 0.88)) (Fig. 3b–d). This suggests that the
F-box gene is the causal gene and that its expression level determines meristem and cell length. However, there remained the possibility that this correlation was due to an enlarged expression domain in longer meristems. To rule out this possibility, we obtained a transfer DNA (T-DNA) insertion line in which the T-DNA was located in the 5′ UTR (Supplementary Fig. 6). We found that expression of the F-box gene, but not expression of the surrounding genes, was altered in this line (Supplementary Fig. 7). Expression of the F-box gene was downregu-lated more than 2.7-fold as compared to the wild-type line. Consistent with our hypothesis that expression of the F-box gene determines the length of the meristem and mature cells, we found that the lengths of both the meristem and mature cells were significantly decreased in the mutant line (Fig. 3e,h,i). Not unexpectedly, the growth rate of the mutant line was lower than that of the wild-type line (Fig. 3j,k). On the basis of the mutant phenotype, we named the gene KURZ
100 µm 100 µm 100 µm35S::Wa-1
(Col)kuk-1 Col-0
e f g
35S::Wa-1(Uk) 35S::Wa-1(Col)kuk-1Uk-1 Wa-1Col-05 mm
k
b2.00
1.80
1.60
1.40
1.20
1.00
Uk-1
Ak-1
Col-0
Wa-
1Bur
-0
0.80
0.60
0.40
0.20
0
Rel
ativ
e ex
pres
sion
bb
ab
aa
a3.0
***
2.5
2.0
1.5
Rel
ativ
e ex
pres
sion
1.0
0.5
0
At1g6
0340
At1g6
0350
At1g6
0360
At1g6
0370
At1g6
0380
At1g6
0390
Root tipMature zone
2.00
R2 = 0,93711.50
1.00
0.50
00 100
Meristem zone length (µm)200 300
c
Rel
ativ
e ex
pres
sion
2.00
R2 = 0,88481.50
1.00
0.50
00 100Mature cell length (µm)
200 300
d
Rel
ativ
e ex
pres
sion
350
250
150
500
h
Meristem zone length
µm
350
250
150
500
i
Mature cell length
µm
6
3
2
1
0
Uk-1
35S::Wa-1
(Uk)
35S::Wa-1
(Col)W
a-1
Col-0
kuk-1
j4
5
Root growth rate
mm
per
24
h
Figure 3 The role of KUK. (a) The expression of genes surrounding the association peak in the root tip and mature zone as quantified by qRT-PCR. Expression levels were normalized to the root tip for each gene separately. Error bars, s.e.m. ***P < 0.001 (n = 3) as determined by Student’s t-test. (b) Gene expression of KUK (At1g60370) in accessions displaying extreme meristem lengths (Uk-1 and Ak-1, short; Bur-0 and Wa-1, long) as measured by qRT-PCR. Expression levels were normalized to expression in Col-0. Error bars, s.e.m. The letters a and b indicate significant differences between mRNA expression levels (determined by analysis of variance (ANOVA) and Tukey test as post hoc analyses; P < 0.05, n = 3). (c,d) Scatter plot of gene expression and meristem zone length (c) and mature-cell length (d) in accessions displaying extreme meristem lengths (Uk-1 and Ak-1, short; Bur-0 and Wa-1, long). The lines represent the results of linear regression. R2, coefficient of determination of the linear regression. (e–g) Cellular root architecture of kuk-1 (e), wild-type Col-0 (f) and 35SøKUK from Wa-1 in Col-0 background (35Sø Wa-1(Col-0)) (g) plants. The images were taken at 3 d after plating (DAP). The meristematic part of a cortex cell file is highlighted in red. One exemplary mature cortical cell is highlighted in blue. Images were fused from multiple adjacent z stacks. To visualize the median longitudinal section of each root, the image was reconstructed from different z slices. (h–j) Box plots of the phenotypes of Uk-1 (n = 11), kuk-1 (n = 17), Col-0 (n = 14), 35SøKUK from Wa-1 in Uk-1 background (35SøWa-1(Uk-1); n = 10), Wa-1 (n = 10) and 35SøKUK from Wa-1 in Col-0 background (35SøWa-1(Col-0); n = 14) plants. Shown are box plots for meristem zone length (h), mature cell length (i; n = 10) and average root growth rate (mm per 24 h) (j; n = 16). The two whiskers correspond to the first and third quartile. The thick line indicates the median. The statistical significances of the plots in h–j are as shown in supplementary table 7. (k) Representative seedlings 7 DAP that were grown on different plates or sectors of the same plate at the same time (measurements of all individuals are shown in supplementary table 6).
npg
© 2
014
Nat
ure
Am
eric
a, In
c. A
ll rig
hts
rese
rved
.
80 VOLUME 46 | NUMBER 1 | JANUARY 2014 Nature GeNetics
l e t t e r s
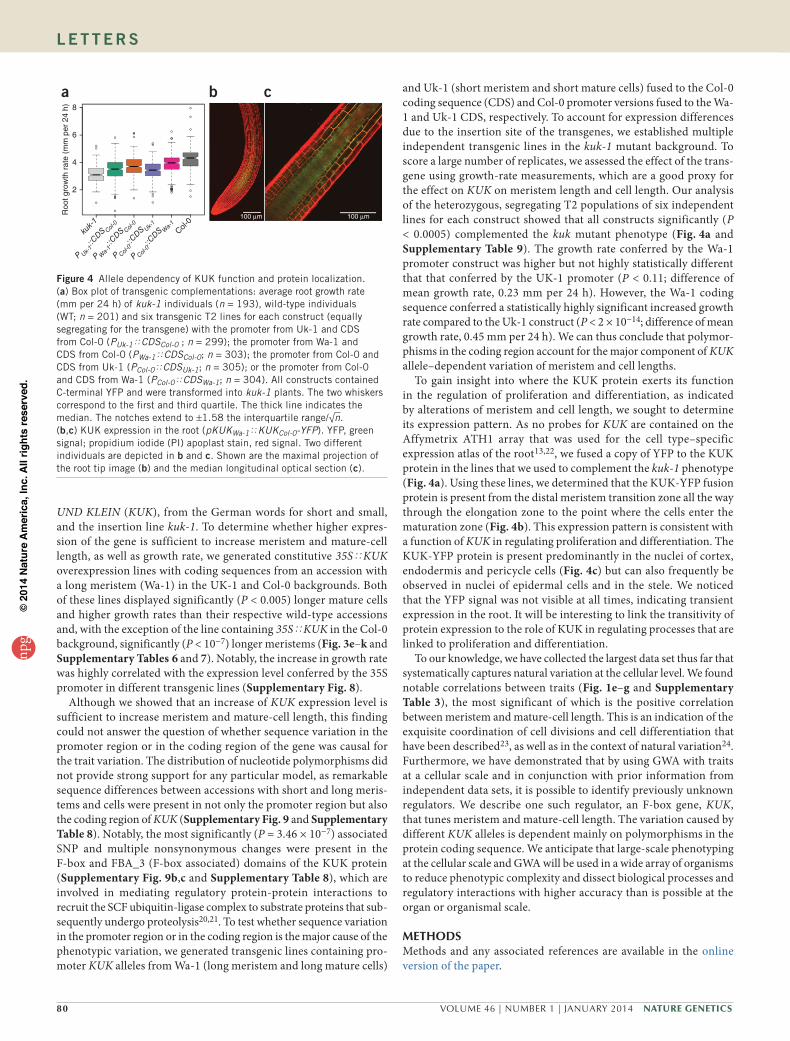
UND KLEIN (KUK), from the German words for short and small, and the insertion line kuk-1. To determine whether higher expres-sion of the gene is sufficient to increase meristem and mature-cell length, as well as growth rate, we generated constitutive 35SøKUK overexpression lines with coding sequences from an accession with a long meristem (Wa-1) in the UK-1 and Col-0 backgrounds. Both of these lines displayed significantly (P < 0.005) longer mature cells and higher growth rates than their respective wild-type accessions and, with the exception of the line containing 35SøKUK in the Col-0 background, significantly (P < 10−7) longer meristems (Fig. 3e–k and Supplementary Tables 6 and 7). Notably, the increase in growth rate was highly correlated with the expression level conferred by the 35S promoter in different transgenic lines (Supplementary Fig. 8).
Although we showed that an increase of KUK expression level is sufficient to increase meristem and mature-cell length, this finding could not answer the question of whether sequence variation in the promoter region or in the coding region of the gene was causal for the trait variation. The distribution of nucleotide polymorphisms did not provide strong support for any particular model, as remarkable sequence differences between accessions with short and long meris-tems and cells were present in not only the promoter region but also the coding region of KUK (Supplementary Fig. 9 and Supplementary Table 8). Notably, the most significantly (P = 3.46 × 10⁻⁷) associated SNP and multiple nonsynonymous changes were present in the F-box and FBA_3 (F-box associated) domains of the KUK protein (Supplementary Fig. 9b,c and Supplementary Table 8), which are involved in mediating regulatory protein-protein interactions to recruit the SCF ubiquitin-ligase complex to substrate proteins that sub-sequently undergo proteolysis20,21. To test whether sequence variation in the promoter region or in the coding region is the major cause of the phenotypic variation, we generated transgenic lines containing pro-moter KUK alleles from Wa-1 (long meristem and long mature cells)
and Uk-1 (short meristem and short mature cells) fused to the Col-0 coding sequence (CDS) and Col-0 promoter versions fused to the Wa-1 and Uk-1 CDS, respectively. To account for expression differences due to the insertion site of the transgenes, we established multiple independent transgenic lines in the kuk-1 mutant background. To score a large number of replicates, we assessed the effect of the trans-gene using growth-rate measurements, which are a good proxy for the effect on KUK on meristem length and cell length. Our analysis of the heterozygous, segregating T2 populations of six independent lines for each construct showed that all constructs significantly (P < 0.0005) complemented the kuk mutant phenotype (Fig. 4a and Supplementary Table 9). The growth rate conferred by the Wa-1 promoter construct was higher but not highly statistically different that that conferred by the UK-1 promoter (P < 0.11; difference of mean growth rate, 0.23 mm per 24 h). However, the Wa-1 coding sequence conferred a statistically highly significant increased growth rate compared to the Uk-1 construct (P < 2 × 10⁻¹⁴; difference of mean growth rate, 0.45 mm per 24 h). We can thus conclude that polymor-phisms in the coding region account for the major component of KUK allele–dependent variation of meristem and cell lengths.
To gain insight into where the KUK protein exerts its function in the regulation of proliferation and differentiation, as indicated by alterations of meristem and cell length, we sought to determine its expression pattern. As no probes for KUK are contained on the Affymetrix ATH1 array that was used for the cell type–specific expression atlas of the root13,22, we fused a copy of YFP to the KUK protein in the lines that we used to complement the kuk-1 phenotype (Fig. 4a). Using these lines, we determined that the KUK-YFP fusion protein is present from the distal meristem transition zone all the way through the elongation zone to the point where the cells enter the maturation zone (Fig. 4b). This expression pattern is consistent with a function of KUK in regulating proliferation and differentiation. The KUK-YFP protein is present predominantly in the nuclei of cortex, endodermis and pericycle cells (Fig. 4c) but can also frequently be observed in nuclei of epidermal cells and in the stele. We noticed that the YFP signal was not visible at all times, indicating transient expression in the root. It will be interesting to link the transitivity of protein expression to the role of KUK in regulating processes that are linked to proliferation and differentiation.
To our knowledge, we have collected the largest data set thus far that systematically captures natural variation at the cellular level. We found notable correlations between traits (Fig. 1e–g and Supplementary Table 3), the most significant of which is the positive correlation between meristem and mature-cell length. This is an indication of the exquisite coordination of cell divisions and cell differentiation that have been described23, as well as in the context of natural variation24. Furthermore, we have demonstrated that by using GWA with traits at a cellular scale and in conjunction with prior information from independent data sets, it is possible to identify previously unknown regulators. We describe one such regulator, an F-box gene, KUK, that tunes meristem and mature-cell length. The variation caused by different KUK alleles is dependent mainly on polymorphisms in the protein coding sequence. We anticipate that large-scale phenotyping at the cellular scale and GWA will be used in a wide array of organisms to reduce phenotypic complexity and dissect biological processes and regulatory interactions with higher accuracy than is possible at the organ or organismal scale.
MeTHodsMethods and any associated references are available in the online version of the paper.
a b c
100 µm 100 µm
P Uk-1::CDS
Col-0
P Wa-1::CDS
Col-0
P Col-0::CDS
Uk-1
P Col-0::CDS
Wa-1
Roo
t gro
wth
rat
e (m
m p
er 2
4 h)
kuk-1
Col-0
2
4
6
8
Figure 4 Allele dependency of KUK function and protein localization. (a) Box plot of transgenic complementations: average root growth rate (mm per 24 h) of kuk-1 individuals (n = 193), wild-type individuals (WT; n = 201) and six transgenic T2 lines for each construct (equally segregating for the transgene) with the promoter from Uk-1 and CDS from Col-0 (PUk-1øCDSCol-0 ; n = 299); the promoter from Wa-1 and CDS from Col-0 (PWa-1øCDSCol-0; n = 303); the promoter from Col-0 and CDS from Uk-1 (PCol-0øCDSUk-1; n = 305); or the promoter from Col-0 and CDS from Wa-1 (PCol-0øCDSWa-1; n = 304). All constructs contained C-terminal YFP and were transformed into kuk-1 plants. The two whiskers correspond to the first and third quartile. The thick line indicates the median. The notches extend to ±1.58 the interquartile range/√n. (b,c) KUK expression in the root (pKUKWa-1øKUKCol-0-YFP). YFP, green signal; propidium iodide (PI) apoplast stain, red signal. Two different individuals are depicted in b and c. Shown are the maximal projection of the root tip image (b) and the median longitudinal optical section (c).
npg
© 2
014
Nat
ure
Am
eric
a, In
c. A
ll rig
hts
rese
rved
.

Nature GeNetics VOLUME 46 | NUMBER 1 | JANUARY 2014 81
l e t t e r s
Note: Any Supplementary Information and Source Data files are available in the online version of the paper.
AcknoWledgMenTSWe are grateful for assistance in the GWA analysis and access to software from A. Korte, Ü. Seren, B. Vilhjalmsson and M. Nordborg and for technical assistance from B. Wohlrab and C. Göschl. We thank P. Benfey, T. Greb, M. Nordborg, L. Valledor, A. Korte, D. Filiault and members of the Busch laboratory for valuable discussions and critical reading of the manuscript. We thank V. Nizhynska, P. Korte and M. Nordborg (Gregor Mendel Institute, Vienna, Austria) for donating seeds for natural accession, S. Waidmann, P. Sánchez and J. Agustí (Gregor Mendel Institute, Vienna, Austria) for materials and advice on vectors and cloning and T. Friese for manuscript editing. This research was supported by funds from the Austrian Academy of Science through the Gregor Mendel Institute and a European Molecular Biology Organization (EMBO) long-term fellowship to T.T.
AUTHoR conTRIBUTIonST.T. carried out the population genetic analyses. S.B.S. performed the experiments with the transgenic KUK lines. M.M. performed the phenotyping, trait quantification, qRT-PCRs and cloning. W.B. conducted KUK-YFP reporter line analyses. W.B. and M.M. conceived the experiments, analyzed the data and wrote the paper.
coMPeTIng FInAncIAl InTeReSTSThe authors declare no competing financial interests.
Reprints and permissions information is available online at http://www.nature.com/reprints/index.html.
1. Parker, C.C., Sokoloff, G., Cheng, R. & Palmer, A.A. Genome-wide association for fear conditioning in an advanced intercross mouse line. Behav. Genet. 42, 437–448 (2012).
2. Jordan, K.W. et al. Genome-wide association for sensitivity to chronic oxidative stress in Drosophila melanogaster. PLoS ONE 7, e38722 (2012).
3. Mu, J. et al. Plasmodium falciparum genome-wide scans for positive selection, recombination hot spots and resistance to antimalarial drugs. Nat. Genet. 42, 268–271 (2010).
4. Tian, F. et al. Genome-wide association study of leaf architecture in the maize nested association mapping population. Nat. Genet. 43, 159–162 (2011).
5. Huang, X. et al. Genome-wide association studies of 14 agronomic traits in rice landraces. Nat. Genet. 42, 961–967 (2010).
6. Gregersen, V.R. et al. Genome-wide association scan and phased haplotype construction for quantitative trait loci affecting boar taint in three pig breeds. BMC Genomics 13, 22 (2012).
7. Atwell, S. et al. Genome-wide association study of 107 phenotypes in Arabidopsis thaliana inbred lines. Nature 465, 627–631 (2010).
8. Klein, R.J. et al. Complement factor H polymorphism in age-related macular degeneration. Science 308, 385–389 (2005).
9. Li, Y., Huang, Y., Bergelson, J., Nordborg, M. & Borevitz, J.O. Association mapping of local climate-sensitive quantitative trait loci in Arabidopsis thaliana. Proc. Natl. Acad. Sci. USA 107, 21199–21204 (2010).
10. Chao, D.Y. et al. Genome-wide association studies identify heavy metal ATPase3 as the primary determinant of natural variation in leaf cadmium in Arabidopsis thaliana. PLoS Genet. 8, e1002923 (2012).
11. Baxter, I. et al. A coastal cline in sodium accumulation in Arabidopsis thaliana is driven by natural variation of the sodium transporter AtHKT1;1. PLoS Genet. 6, e1001193 (2010).
12. Ideker, T., Dutkowski, J. & Hood, L. Boosting signal-to-noise in complex biology: prior knowledge is power. Cell 144, 860–863 (2011).
13. Brady, S.M. et al. A high-resolution root spatiotemporal map reveals dominant expression patterns. Science 318, 801–806 (2007).
14. Busch, W. et al. A microfluidic device and computational platform for high-throughput live imaging of gene expression. Nat. Methods 9, 1101–1106 (2012).
15. Horton, M.W. et al. Genome-wide patterns of genetic variation in worldwide Arabidopsis thaliana accessions from the RegMap panel. Nat. Genet. 44, 212–216 (2012).
16. Kang, H.M. et al. Efficient control of population structure in model organism association mapping. Genetics 178, 1709–1723 (2008).
17. Yu, J. et al. A unified mixed-model method for association mapping that accounts for multiple levels of relatedness. Nat. Genet. 38, 203–208 (2006).
18. Seren, Ü. et al. GWAPP: a web application for genome-wide association mapping in Arabidopsis. Plant Cell 24, 4793–4805 (2012).
19. Brachi, B. et al. Linkage and association mapping of Arabidopsis thaliana flowering time in nature. PLoS Genet. 6, e1000940 (2010).
20. Skowyra, D., Craig, K.L., Tyers, M., Elledge, S.J. & Harper, J.W. F-box proteins are receptors that recruit phosphorylated substrates to the SCF ubiquitin-ligase complex. Cell 91, 209–219 (1997).
21. Bai, C. et al. SKP1 connects cell cycle regulators to the ubiquitin proteolysis machinery through a novel motif, the F-box. Cell 86, 263–274 (1996).
22. Birnbaum, K. et al. A gene expression map of the Arabidopsis root. Science 302, 1956–1960 (2003).
23. Dello Ioio, R. et al. A genetic framework for the control of cell division and differentiation in the root meristem. Science 322, 1380–1384 (2008).
24. Mouchel, C.F., Briggs, G.C. & Hardtke, C.S. Natural genetic variation in Arabidopsis identifies BREVIS RADIX, a novel regulator of cell proliferation and elongation in the root. Genes Dev. 18, 700–714 (2004).
npg
© 2
014
Nat
ure
Am
eric
a, In
c. A
ll rig
hts
rese
rved
.

Nature GeNetics doi:10.1038/ng.2824
oNLINe MeTHodsPlant material and growth conditions. We used 201 different accessions of A. thaliana from different geographic origins (Supplementary Table 1). These accessions were part of the RegMap panel15. Seeds were obtained by grow-ing the parental generation of all lines used side by side in the same growth chambers under the same conditions. The seeds were surface sterilized in 2.8% hypochlorite for 4 min and washed three times in MonoQ sterile water. They were then stratified for 72 h at 4 °C in water and darkness and put to grow on our custom Confocal Chamber System (CCs) (Supplementary Fig. 1). The seeds were grown for 3 d in vertically oriented CCs containing 1× Murashige and Skoog (MS) salt mixture, 1% (wt/vol) sucrose and 0.8% (wt/vol) agar. To provide a sterile environment for the CCs and prevent them from drying out, we embedded the CCs into conventional agar plates (Supplementary Fig. 1a). The plates containing the CCs were incubated at 22 °C under long-day conditions (16 h light, 8 h dark). Every CC contained eight different accessions with four seeds per accession. Each CC setup was replicated and imaged at a different time to account for circadian effects. A total of eight individuals per accession were analyzed, except in rare cases in which one or two individuals were incorrectly imaged or damaged during sample prepara-tion (Supplementary Table 2).
The T-DNA line from the Salk collection25 was obtained from the European Arabidopsis Stock Center (NASC). The T-DNA insertion in the Salk line SALK_147194C (kuk-1) was confirmed using PCR with the prim-ers listed in Supplementary Table 10 and according to http://signal.salk.edu/tdnaprimers.2.html. DNA was extracted from young leaves by the CTAB method26.
Confocal microscopy. A LSM 700 Axio Observer.Z1 confocal microscope (Zeiss) with a motorized stage was used for confocal image acquisition. Before imaging, roots were stained with 10 µg/ml PI for 2 min directly on the CCs. Then a coverslip was attached, and the CC was mounted onto the confocal microscope. As a first step, the positions of all root tips were marked by the user in the ZEN2010 software. Then, around all positions, six additional tiles (two in the x dimension and three in the y dimension) were scheduled using the tiling feature of ZEN2010. Image acquisition was thus automatically conducted by the ZEN2010 software, eventually yielding multiple three-dimensional image stacks (20 slices) for each root covering the whole root tip up to the maturation zone. The PI dye was excited by a 488-nm diode laser and detected, collecting light from wavelengths between 620 and 700 nm for the confo-cal microscopy work in which no fluorescent protein was imaged. For the KUK-YFP images, the specimen was excited by a 488-nm diode laser. PI was detected by collecting light with wavelengths above 560 nm, and YFP was collected by measuring below 555 nm. Images were processed and analyzed using Fiji software27.
Root measurements. The root measurements at the cellular level were taken as illustrated in Figure 1a. The size of the meristem was measured from the qui-escent center to the onset of the rapid longitudinal cell expansion in the cortex tissue (meristem zone length). The size of the elongation zone was measured from the onset of cell expansion to its cessation (elongation zone length). The cell length of fully elongated cells (mature-cell length) was measured in the cortex tissue layer. For every measurement, eight biological replicates per accession were performed, except in some rare case in which an individual was damaged during imaging preparation (Supplementary Table 2 lists the number of replicates used for each accession).
For the root measurements at the cellular level that involved the KUK-related transgenic overexpression lines (Fig. 3h,i), the measurements of the images were conducted in a blinded fashion (i.e., the images were randomly labeled, and the genotype of a particular plant on an image was unknown to the person measuring the traits).
The root growth rate was defined as root length difference between two images of the same plant acquired at T0 and T0 + 24 h. Plants were scanned while growing over 5 d on vertical plates starting 3 d after imbibition (DAP). The lengths of a root were measured from those pictures using Fiji software27. The average growth rate is the average of the growth rates on 4 consecutive days measured in 24-h intervals.
GWA mapping. The average trait value of the biological replicates for each accession was taken for GWA analysis. The GWA analysis was performed in the GWAPP web interface using the mixed model algorithm method18. To correct for multiple testing, a Bonferroni correction with a threshold of 0.1 was applied, which corresponds to an uncorrected P value of 4.65 × 10⁻⁷.
Selection scans. For selection scans, we used the 250K SNP data set15 for the 201 accessions that were also used for phenotyping (Supplementary Table 1). We used the Arabidopsis lyrata genome to obtain information about the ances-tral state for each SNP28. Selection scans were performed using two statistics: the integrated haplotype score (iHS)29 and the weighted iHS (WiHS)30. The iHS statistic compares the extended haplotype homozygosity between derived and ancestral alleles by controlling the derived allele frequency of each SNP. We used the R package rehh to perform the iHS scan31. WiHS is a modified version of iHS that accounts for population structure or unequal relatedness between individuals by weighting the contribution of each to the statistic based on its uniqueness30. We used the python implementation provided at the web-site of the Schmid Laboratory (http://evoplant.uni-hohenheim.de/). As the WiHS scan requires the genetic distance between SNPs, we employed a previ-ous estimate of recombination rate along chromosomes to convert physical distance to genetic distance15. Similarly to ref. 15, we first calculated the iHS and WiHS for each SNP and then split the genome into 10-kb windows and used the maximum score from the iHS and WiHS scans for each window as the test statistic. We then calculated the empirical P values of the window, including the GWA peak in the genome-wide distributions of both statistics.
Transgenic lines. Plasmids were constructed using in-Fusion cloning tech-nology (Clontech). cDNA from Wa-1 and Uk-1 was used as the template for amplification of the KUK coding sequence using the primers listed in Supplementary Table 11. These fragments were placed under the constitutive CaMV 35S promoter in a pGREEN-derived binary vector32 using multisite in-Fusion cloning technology. For transgenic complementation experiments, genomic DNA and cDNA from Wa-1 and Uk-1 was used as a template for amplification of the KUK promoter and CDS, respectively, using the prim-ers listed in Supplementary Table 11. Different combinations of promoters and CDS fragments were cloned using the multisite in-Fusion system in a pGREEN-derived binary vector in which a YFP reporter protein was previ-ously added to generate C-terminal fusions with YFP that included a targeting sequence for the endoplasmatic reticulum. Constructs were transformed into plants (Col-0, Wa-1, Uk-1 and kuk-1) using the Agrobacterium tumefaciens flo-ral dipping method33. Expression assays of transformed plants and the number of the copies of transgenes were performed by qRT-PCR.
Quantitative expression analyses. Gene expression was evaluated by qRT-PCR. RNA was isolated from root tips (~1 mm) from seedlings at 3 DAP using the RNeasy Plant mini kit (Qiagen) and treated with RNAse-free DNase (Qiagen) following the manufacturer’s instructions. The RevertAid Reverse Transcriptase kit (Fermentas) was used for first-strand cDNA synthesis to obtain cDNA as a template for qRT-PCR. qRT-PCR was performed as follows: 10 ng cDNA or genomic DNA, 5 pM of each primer and SensiMix SYBR Green & Fluorescein (Peqlab) were mixed and amplified in either an iQ5 and or a MyiQ Real-Time-PCR system (Bio-Rad). Three technical replicates for each transcript and biological situation (we did three biological replicates per assay) were analyzed using Prism software (Bio-Rad iQ5). Relative quantifi-cations were performed for all experiments, and β-tubulin (At5g62690) was used as an internal reference. Genomic DNA was extracted from young leaves of transformed and wild-type plants using the CTAB method26. All primer sequences are listed in Supplementary Table 12.
Data analyses. For the trait correlation density diagrams, the R function smoothScatter was used. For statistical analyses of gene expression and traits among several genotypes, one-way ANOVA was performed, and Tukey test was subsequently used as a multiple comparison procedure. The significance level was set at α = 0.05 for the ANOVA and Tukey tests. Binary compari-sons between wild-type and mutant lines were performed using Student’s t-test. In all cases, the data used for statistical tests followed the linear model
npg
© 2
014
Nat
ure
Am
eric
a, In
c. A
ll rig
hts
rese
rved
.

Nature GeNeticsdoi:10.1038/ng.2824
assumptions: independence, normality (Shapiro-Wilk test) and homoscedas-ticity (Bartlett test).
For the analyses of the complementation assays (Fig. 4a and Supplementary Table 9), we needed to apply a different statistical procedure. Because of Mendelian segregation within the T2 lines and construct-specific effects in different groups, the assumptions for ANOVA and Tukey’s HSD were violated (i.e., the values within the groups did not have equal variances and were not normally distributed). Additionally, there were different numbers of individu-als in each group. We thus conducted a Welch’s unequal variance t-test on the ranked data as proposed34. We did this for all possible comparisons and conducted a correction for multiple testing using the Benjamini and Hochberg method35.
All statistical analyses were done in the R environment (R Development Core Team, 2010).
27. Schindelin, J. et al. Fiji: an open-source platform for biological-image analysis. Nat. Methods 9, 676–682 (2012).
28. Hu, T.T. et al. The Arabidopsis lyrata genome sequence and the basis of rapid genome size change. Nat. Genet. 43, 476–481 (2011).
29. Voight, B.F., Kudaravalli, S., Wen, X. & Pritchard, J.K. A map of recent positive selection in the human genome. PLoS Biol. 4, e72 (2006).
30. Günther, T. & Schmid, K.J. Improved haplotype-based detection of ongoing selective sweeps towards an application in Arabidopsis thaliana. BMC Res. Notes 4, 232 (2011).
31. Gautier, M. & Vitalis, R. rehh: an R package to detect footprints of selection in genome-wide SNP data from haplotype structure. Bioinformatics 28, 1176–1177 (2012).
32. Hellens, R.P., Edwards, E.A., Leyland, N.R., Bean, S. & Mullineaux, P.M. pGreen: a versatile and flexible binary Ti vector for Agrobacterium-mediated plant transformation. Plant Mol. Biol. 42, 819–832 (2000).
33. Weigel, D. & Glazebrook, J. In planta transformation of Arabidopsis. CSH Protoc. 2006, pii: pdb.prot4668 (2006).
34. Ruxton, G.D. The unequal variance t-test is an underused alternative to Student’s t-test and the Mann-Whitney U test. Behav. Ecol. 17, 688–690 (2006).
35. Benjamini, Y. & Hochberg, Y. Controlling the false discovery rate—a practical and powerful approach to multiple testing. J. R. Stat. Soc., B 57, 289–300 (1995).
25. Alonso, J.M. et al. Genome-wide insertional mutagenesis of Arabidopsis thaliana. Science 301, 653–657 (2003).
26. Murray, M.G. & Thompson, W.F. Rapid isolation of high molecular weight plant DNA. Nucleic Acids Res. 8, 4321–4325 (1980).
npg
© 2
014
Nat
ure
Am
eric
a, In
c. A
ll rig
hts
rese
rved
.

ERRATA
Erratum: Genome-wide association study using cellular traits identifies a new regulator of root development in ArabidopsisMónica Meijón, Santosh B Satbhai, Takashi Tsuchimatsu & Wolfgang BuschNat. Genet.; doi:10.1038/ng.2824; corrected online 26 November 2013
In the version of this article initially published online, there was an error in the final paragraph of the main text. Specifically, the phrase “previ-ously known regulators” should have appeared as “previously unknown regulators.” The error has been corrected for the print, PDF and HTML versions of this article.
nature genetics
npg
© 2
013
Nat
ure
Am
eric
a, In
c. A
ll rig
hts
rese
rved
.
Copyright © 2022 FDOKUMEN