Genome-wide association scans identified CTNNBL1 as a novel gene for obesity
11
Genome-wide association scans identified CTNNBL1 as a novel gene for obesity Yong-Jun Liu 1 , Xiao-Gang Liu 1,2 , Liang Wang 1,2 , Christian Dina 6 , Han Yan 1,2 , Jian-Feng Liu 1 , Shawn Levy 5 , Christopher J. Papasian 1 , Betty M. Drees 1 , James J. Hamilton 1 , David Meyre 6 , Jerome Delplanque 6 , Yu-Fang Pei 2 , Lei Zhang 2 , Robert R. Recker 4 , Philippe Froguel 6,7 and Hong-Wen Deng 1,2,3,4, 1 School of Medicine, University of Missouri—Kansas City, Kansas City, MO 64108, USA, 2 The Key Laboratory of Biomedical Information Engineering of Ministry of Education and Institute of Molecular Genetics, School of Life Science and Technology, Xi’an Jiaotong University, Xi’an 710049, P. R. China, 3 Laboratory of Molecular and Statistical Genetics, College of Life Sciences, Hunan Normal University, Changsha, Hunan 410081, P. R. China, 4 Osteoporosis Research Center, Creighton University, Omaha, NE 68131, USA, 5 Vanderbilt Microarray Shared Resource, Vanderbilt University, Nashville, TN 37232, USA, 6 CNRS-8090-Institute of Biology, Pasteur Institute, Lille, France and 7 Genomic Medicine, Hammersmith Hospital, Imperial College London, London, UK Received August 26, 2007; Revised and Accepted March 4, 2008 Obesity is a major public health problem with strong genetic determination; however, the genetic factors underlying obesity are largely unknown. In this study, we performed a genome-wide association scan for obesity by examining approximately 500 000 single-nucleotide polymorphisms (SNPs) in a sample of 1000 unrelated US Caucasians. We identified a novel gene, CTNNBL1, which has multiple SNPs associated with body mass index (BMI) and fat mass. The most significant SNP, rs6013029, achieved experiment-wise P-values of 2.69 3 10 27 for BMI and of 4.99 3 10 28 for fat mass, respectively. The SNP rs6013029 minor allele T confers an average increase in BMI and fat mass of 2.67 kg/m 2 and 5.96 kg, respectively, compared with the alternative allele G. We further genotyped the five most significant CTNNBL1 SNPs in a French case–control sample comprising 896 class III obese adults (BMI 40 kg/m 2 ) and 2916 lean adults (BMI < 25 kg/m 2 ). All five SNPs showed consistent associations with obesity (8.83 3 10 23 < P < 6.96 3 10 24 ). Those subjects who were homozygous for the rs6013029 T allele had 1.42-fold increased odds of obesity compared with those without the T allele. The protein structure of CTNNBL1 is homologous to b-catenin, a family of pro- teins containing armadillo repeats, suggesting similar biological functions. b-Catenin is involved in the Wnt/ b-catenin-signaling pathway which appears to contribute to maintaining the undifferentiated state of pre- adipocytes by inhibiting adipogenic gene expression. Our study hence suggests a novel mechanism for the development of obesity, where CTNNBL1 may play an important role. Our study also provided supportive evidence for previously identified associations between obesity and INSIG2 and PFKP, but not FTO. INTRODUCTION Obesity is a serious public health problem associated with an increased risk of type 2 diabetes mellitus, hypertension, coron- ary heart disease and certain cancers (1). The prevalence of obesity is increasing at an alarming rate; recent data show that 65% of the adult population in the USA are overweight, and 31% are obese (2). Body mass index (BMI, weight/height 2 , kg/m 2 ) is the most widely used phenotype for the assessment of obese status. According to the World Health Organization, individuals with a BMI 25 kg/m 2 are considered overweight, and those with a BMI 30 kg/m 2 are obese. To whom correspondence should be addressed at: Department of Basic Medical Science and Department of Orthopedic Surgery, University of Missouri—Kansas City, 2411 Holmes Street, Room M3-C03, Kansas City, MO 64108-2792, USA. Tel: þ1 8162355354; Fax: þ1 8162356517; Email: [email protected] # The Author 2008. Published by Oxford University Press. All rights reserved. For Permissions, please email: [email protected] Human Molecular Genetics, 2008, Vol. 17, No. 12 1803–1813 doi:10.1093/hmg/ddn072 Advance Access published on March 5, 2008
-
Upload
independent -
Category
Documents
-
view
2 -
download
0
Transcript of Genome-wide association scans identified CTNNBL1 as a novel gene for obesity

Genome-wide association scans identifiedCTNNBL1 as a novel gene for obesity
Yong-Jun Liu1, Xiao-Gang Liu1,2, Liang Wang1,2, Christian Dina6, Han Yan1,2, Jian-Feng Liu1,
Shawn Levy5, Christopher J. Papasian1, Betty M. Drees1, James J. Hamilton1, David Meyre6,
Jerome Delplanque6, Yu-Fang Pei2, Lei Zhang2, Robert R. Recker4, Philippe Froguel6,7
and Hong-Wen Deng1,2,3,4,�
1School of Medicine, University of Missouri—Kansas City, Kansas City, MO 64108, USA, 2The Key Laboratory of
Biomedical Information Engineering of Ministry of Education and Institute of Molecular Genetics, School of Life
Science and Technology, Xi’an Jiaotong University, Xi’an 710049, P. R. China, 3Laboratory of Molecular and
Statistical Genetics, College of Life Sciences, Hunan Normal University, Changsha, Hunan 410081, P. R. China,4Osteoporosis Research Center, Creighton University, Omaha, NE 68131, USA, 5Vanderbilt Microarray Shared
Resource, Vanderbilt University, Nashville, TN 37232, USA, 6CNRS-8090-Institute of Biology, Pasteur Institute, Lille,
France and 7Genomic Medicine, Hammersmith Hospital, Imperial College London, London, UK
Received August 26, 2007; Revised and Accepted March 4, 2008
Obesity is a major public health problem with strong genetic determination; however, the genetic factorsunderlying obesity are largely unknown. In this study, we performed a genome-wide association scan forobesity by examining approximately 500 000 single-nucleotide polymorphisms (SNPs) in a sample of 1000unrelated US Caucasians. We identified a novel gene, CTNNBL1, which has multiple SNPs associated withbody mass index (BMI) and fat mass. The most significant SNP, rs6013029, achieved experiment-wiseP-values of 2.69 3 1027 for BMI and of 4.99 3 1028 for fat mass, respectively. The SNP rs6013029 minorallele T confers an average increase in BMI and fat mass of 2.67 kg/m2 and 5.96 kg, respectively, comparedwith the alternative allele G. We further genotyped the five most significant CTNNBL1 SNPs in a Frenchcase–control sample comprising 896 class III obese adults (BMI � 40 kg/m2) and 2916 lean adults (BMI <25 kg/m2). All five SNPs showed consistent associations with obesity (8.83 3 1023 < P < 6.96 3 1024). Thosesubjects who were homozygous for the rs6013029 T allele had 1.42-fold increased odds of obesity comparedwith those without the T allele. The protein structure of CTNNBL1 is homologous to b-catenin, a family of pro-teins containing armadillo repeats, suggesting similar biological functions. b-Catenin is involved in the Wnt/b-catenin-signaling pathway which appears to contribute to maintaining the undifferentiated state of pre-adipocytes by inhibiting adipogenic gene expression. Our study hence suggests a novel mechanism forthe development of obesity, where CTNNBL1 may play an important role. Our study also provided supportiveevidence for previously identified associations between obesity and INSIG2 and PFKP, but not FTO.
INTRODUCTION
Obesity is a serious public health problem associated with anincreased risk of type 2 diabetes mellitus, hypertension, coron-ary heart disease and certain cancers (1). The prevalence ofobesity is increasing at an alarming rate; recent data show that
�65% of the adult population in the USA are overweight, and31% are obese (2). Body mass index (BMI, weight/height2,kg/m2) is the most widely used phenotype for the assessmentof obese status. According to the World Health Organization,individuals with a BMI � 25 kg/m2 are considered overweight,and those with a BMI � 30 kg/m2 are obese.
�To whom correspondence should be addressed at: Department of Basic Medical Science and Department of Orthopedic Surgery, University ofMissouri—Kansas City, 2411 Holmes Street, Room M3-C03, Kansas City, MO 64108-2792, USA. Tel: þ1 8162355354; Fax: þ1 8162356517;Email: [email protected]
# The Author 2008. Published by Oxford University Press. All rights reserved.For Permissions, please email: [email protected]
Human Molecular Genetics, 2008, Vol. 17, No. 12 1803–1813doi:10.1093/hmg/ddn072Advance Access published on March 5, 2008

The strong genetic determination of human obesity has beenestablished by twin, family and adoption studies, which indi-cate a minimum heritability of 40% for obesity (3). Duringthe past decade, more than 60 genome-wide linkage scanstudies and hundreds of candidate gene association studieshave been published, but the results are largely inconsistent/inconclusive (4). Until now, none of the candidate genes/genomic regions identified has been found to explain .10%of variation in any obesity phenotypes. This leaves the specificgenetic factors underlying obesity largely unknown.
Rapid advancements have made it feasible and timely topursue powerful genome-wide association (GWA) studies(5). GWA is a hypothesis-free approach that scans the entirehuman genome to identify novel genes/genome regions withmodest effects on human complex diseases/traits. A numberof GWA studies have reported novel findings for complex dis-eases, such as type 2 diabetes (6–9), inflammatory boweldisease (10,11) and prostate cancer (12,13). Several GWAstudies have also found novel genes that may underlieobesity risk, such as INSIG2 (14,15), FTO (16–18) andPFKP (16), though their functional importance awaitsfurther validation studies.
In this study, we performed a GWA to search for novelgenes for obesity. Using Affymetrix 500K single-nucleotidepolymorphism (SNP) arrays, we successfully genotyped andanalyzed a total of 379 319 SNPs for 1000 unrelated USCaucasian subjects from whom we obtained both BMI andbody fat mass data. We identified a novel gene, CTNNBL1[catenin (cadherin-associated protein), b-like 1], on chromoso-mal region 20q11.23, associated with both BMI and fat mass.The significance of CTNNBL1 was further replicated in anindependent case–control sample comprising 896 class IIIobese adults (BMI � 40 kg/m2) and 2916 lean adults(BMI , 25 kg/m2) of French Caucasian origin.
RESULTS
GWA scans in the US Caucasian sample
The top signal of association for BMI was observed for SNPrs7001819 (P ¼ 1.53 � 1027), and the nearest gene isFDFT1 (farnesyl-diphosphate farnesyltransferase 1).However, this SNP did not show any association with fatmass. Multiple SNPs within the CTNNBL1 gene were foundto be strongly associated with both BMI and fat mass. Giventhe strong associations observed for CTNNBL1, we focusedour subsequent analyses on this gene. We list in Tables 1and 2 the eight SNPs within the CTNNBL1 gene achievingat least nominally significant associations (P , 0.05). It canbe seen that the minor allele frequency (MAF) of the geno-typed SNPs is quite comparable between our own data setand the HapMap CEU database (19,20). The three SNPs(s6013029, rs16986921 and rs6020712) achievedexperimental-wise P-values of 2.69 � 1027, 5.88 � 1027
and 7.92 � 1027, respectively, for BMI (being the second tofourth most significant SNPs for BMI). Notably, these threeSNPs were also the top three most significant SNPs for fatmass, with P-values of 4.99 � 1028, 6.54 � 1028 and1.20 � 1027, respectively (Tables 1 and 2). To assess potentialpopulation stratification, we calculated the overall genomic T
ab
le1.
Ass
oci
atio
nre
sult
sin
the
US
Cau
casi
ansa
mple
:in
form
atio
non
the
SN
Ps
of
the
CT
NN
BL
1gen
esh
ow
ing
asso
ciat
ions
wit
hB
MI
and
fat
mas
sin
US
Cau
casi
ans
SN
PP
osi
tion
Role
All
elea
MA
Fb
MA
Fc
Raw
P-v
alue
GC
-corr
ecte
dP
-val
ue
FD
Rq
val
ue
EIG
EN
ST
RA
TP
-val
ue
BM
IF
atm
ass
BM
IF
atm
ass
BM
IF
atm
ass
BM
IF
atm
ass
rs6013029
35832994
Intr
on
7G
/T0.0
60.0
52.6
9�
10
27
4.9
9�
10
28
5.1
1�
10
27
1.1
1�
10
27
0.0
65
0.0
27
1.3
9�
10
26
4.8
0�
10
27
rs16986921
35815935
Intr
on
4C
/T0.0
60.0
55.8
8�
10
27
6.5
4�
10
28
1.0
8�
10
26
1.4
3�
10
27
0.1
02
0.0
28
1.7
3�
10
26
5.6
3�
10
27
rs6020712
35820026
Intr
on
5G
/A0.0
70.0
57.9
2�
10
27
1.2
0�
10
27
1.4
3�
10
26
2.5
5�
10
27
0.1
17
0.0
33
5.0
4�
10
26
1.4
4�
10
26
rs6020846
35839081
Exon/i
ntr
on
boundar
yA
/G0.0
80.0
72.4
5�
10
25
7.0
1�
10
26
3.8
0�
10
25
1.2
1�
10
25
0.4
13
0.3
41
1.2
1�
10
25
9.1
6�
10
25
rs6020395
35772738
Intr
on
1G
/C0.0
60.0
73.4
6�
10
25
7.7
1�
10
26
5.2
8�
10
25
1.3
3�
10
25
0.4
94
0.3
45
3.1
3�
10
24
2.2
2�
10
25
rs16986890
35759937
Intr
on
1A
/G0.0
80.0
71.4
1�
10
24
3.1
1�
10
25
2.0�
10
24
5.0
0�
10
25
0.6
95
0.5
26
2.3
9�
10
24
1.5
0�
10
24
rs6096781
35960629
Pro
mote
rT
/C0.0
90.0
80.0
14
0.0
034
0.0
16
0.0
044
0.8
66
0.8
72
0.0
23
0.0
011
rs6020339
35765409
Intr
on
1T
/C0.3
70.3
20.0
31
0.0
071
0.0
35
0.0
087
0.8
69
0.8
81
0.0
06
0.0
021
aT
he
seco
nd
alle
lere
pre
sents
the
min
or
alle
leof
each
locu
s.bM
AF
calc
ula
ted
inth
eU
SC
auca
sian
sam
ple
.cM
AF
report
edfo
rC
auca
sian
sin
the
publi
cdat
abas
eof
Hap
Map
CE
U.
FD
Rq
val
ues
less
than
0.0
5ar
ein
bold
.
1804 Human Molecular Genetics, 2008, Vol. 17, No. 12
control (GC) correction factors for BMI and fat mass, whichwere 1.05 and 1.06, respectively, implying that potential popu-lation stratification in this US Caucasian population, if present,should be minimal. The GC-corrected P-values and false dis-covery rate (FDR) q values (calculated on the basis ofGC-corrected P-values) are also shown in Tables 1 and 2.For readers’ convenience, we list in Supplementary Material,Table S1 the relevant information for all the genotypedSNPs for CTNNBL1. We also imputed untyped and/ormissing SNPs at this region. The imputation algorithm,which uses the LD and haplotype structure from all themarkers of HapMap database (19,21) to infer the genotypesat untyped loci in our individuals, was implemented in theprogram IMPUTE (22). The association data for the imputedSNPs are presented in Supplementary Material, Table S2.
Using the confidence interval method (23) implemented inHaploview (24) and our own genotype data, we plotted theLD and haplotype structure of the CTNNBL1 gene (Fig. 1).The gene forms three major haplotype blocks (blocks 1–3).The most significant SNP rs6013029 is in weak LD withsome of the other SNPs.
The SNP rs6013029, with a polymorphism of G!T nucleo-tide change, is located in the intron 7 of CTNNBL1. The BMIand fat mass distribution in different genotypes are shown inFigure 2. The subjects of homozygous TT have higher BMIand fat mass than those of homozygous GG. The analyses ofallele effects showed that the risk allele T confers 9.8%higher BMI (2.67 kg/m2) and 24.1% higher fat mass (5.96 kg)than the alternative allele G. Using quantitative geneticsmethods, we calculated the genetic variance that rs6013029may explain, which were 0.029 and 0.042, respectively, forBMI and fat mass. We then calculated the power of identifyingthe estimated genetic variances using Genetic Power Calculator(25). At the significance level of 4.2 � 1027, the power of thisstudy to identify the reported effect sizes was 64.3 and 93.2%,respectively, for BMI and fat mass. We further calculated theprobability of replicating the identified effect sizes using themethods proposed by Killeen (26). Assuming that replicationstudies have the same number of subjects as the originalGWA and that they have similar levels of sampling error, theprobabilities of replicating the identified effect sizes will beas high as 99.9% for both BMI and fat mass.
To determine the inter-relationship between these eight sig-nificant SNPs within the CTNNBL1 gene and to investigatewhether the association signals detected by these SNPs arefrom the same or distinct functional variants, we performedconditional association analyses for the seven SNPs usingthe genotype at the most significant SNP rs6013029 as thecovariate to adjust for BMI and fat mass. As shown inFigure 3, all seven SNPs had universal and significant lossassociation signals, as reflected by the evident drop of2log10(P) values. This suggests that the associations ofthese eight SNPs may come from the same functionalvariant of the gene, which is in strong LD with rs6013029and influences BMI and fat mass. We also performed con-ditional analyses in reverse by using the seven SNPs as covari-ates to see whether any of these SNPs could eliminate theassociation of rs6013029. The P-values obtained were 0.003and 0.002, respectively, for BMI and fat mass, suggestingthat these seven SNPs may explain only a portion of the vari-ance that is attributable to rs6013029.
Using the FASTSNP program, we investigated the potentialfunctions of these eight SNPs. According to the program, fourSNPs (rs6013029, rs6020712, rs16986890 and rs6020339) arepotential transcription factor-binding sites and hence may havea role in transcription regulation. A G!T change atrs6013029, a G!A change at rs6020712 and an A!Gchange at rs16986890 may result in the elimination of thebinding sites for transcription factor Oct-1, CdxA and SRY,respectively, whereas an A!G change at rs6020339 mayproduce a change in the binding site from CdxA to Pbx-1 orAP-1. The other three intronic SNPs (i.e. rs6096781,rs6020846 and rs6020395) and a promoter SNP, rs6096781,are without known function.
The CTNNBL1 gene is located at the chromosome region20q, which showed strong linkage to obesity phenotypes inour previous genome-wide linkage scan studies (27); LODscores of 1.55 and 3.31 were obtained for BMI and fat mass,respectively, at this region (Table 3). This region containstwo other candidate genes, FLJ42133 and NNAT, whoseSNPs also achieved highly suggestive associations for fatmass in the current GWA study (P-values of 1026 to 1025).The region 5q35, achieving an LOD score of 2.04 for BMIin our earlier linkage scan (27), contains two genes,SH3PXD2B and SLIT3, whose SNPs achieved P-values of1025 to 1024 for BMI in this GWA study.
Several recent GWA studies identified novel genes for obesity,such as INSIG2 on chromosome 2q14.1 (14), FTO on 16q12 (16–18), and PFKP on 10p15 (16). The associations of INSIG2 andPFKP with obesity were also observed in this study, as reflectedby P-values achieved for the SNPs within/around each gene(Table 4). However, the association of the FTO gene withobesity could not be replicated in this study sample.
For potential stratification of our sample, when 200 ran-domly selected unlinked SNPs were used to cluster our sub-jects, under all the assigned values (i.e. 2, 3 and 4) for theassumed number of population strata, k, all 1000 subjectswere tightly clustered together, implying no population strati-fication. When 2000 and 6000 SNPs were used, under all theassigned values of k, the vast majority (.98%) of the subjectswere tightly clustered together, with the exception of only sixsubjects, suggesting that there is essentially no population
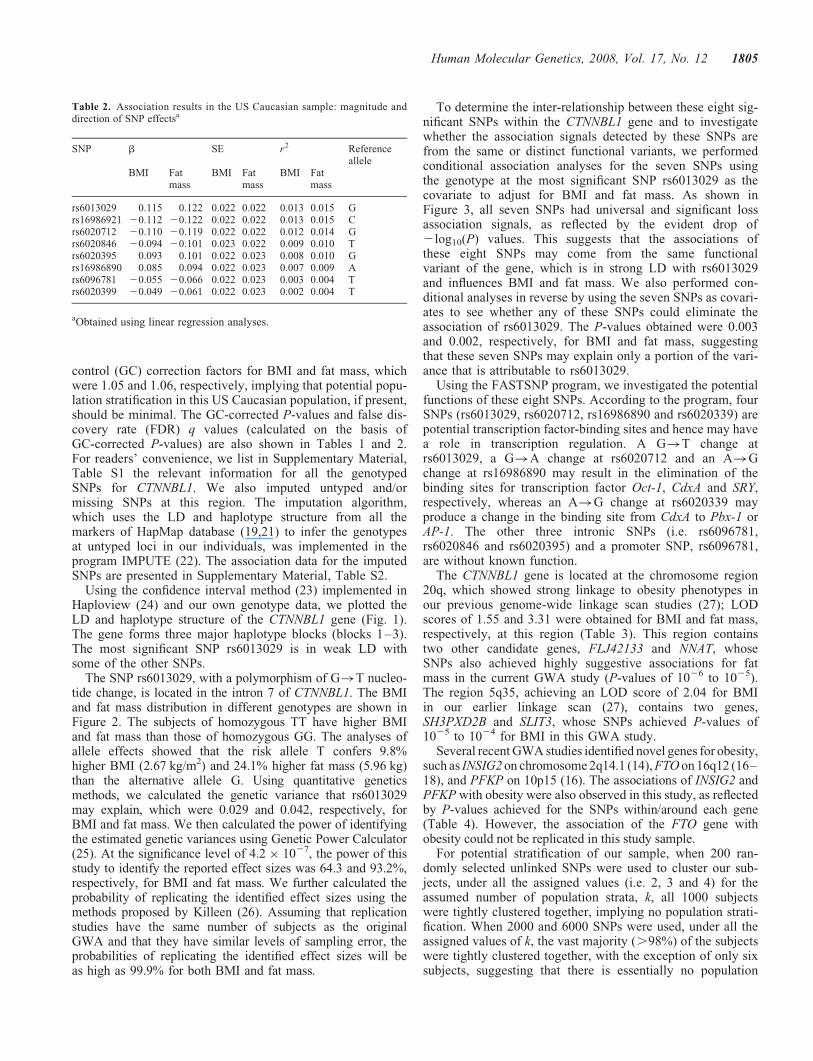
Table 2. Association results in the US Caucasian sample: magnitude anddirection of SNP effectsa
SNP b SE r2 Referenceallele
BMI Fatmass
BMI Fatmass
BMI Fatmass
rs6013029 0.115 0.122 0.022 0.022 0.013 0.015 Grs16986921 20.112 20.122 0.022 0.022 0.013 0.015 Crs6020712 20.110 20.119 0.022 0.022 0.012 0.014 Grs6020846 20.094 20.101 0.023 0.022 0.009 0.010 Trs6020395 0.093 0.101 0.022 0.023 0.008 0.010 Grs16986890 0.085 0.094 0.022 0.023 0.007 0.009 Ars6096781 20.055 20.066 0.022 0.023 0.003 0.004 Trs6020399 20.049 20.061 0.022 0.023 0.002 0.004 T
aObtained using linear regression analyses.
Human Molecular Genetics, 2008, Vol. 17, No. 12 1805

stratification in this sample. These six subjects do not haveextreme BMI or fat mass values. This analysis indicates thatthese six subjects have little contribution to the overall associ-ation results. Moreover, we re-performed association analysesafter excluding these six subjects and obtained very similarresults (data not shown).
To further guard against potential population stratificationthat could not be identified by the structured associationmethod (28), we performed association analyses using theprincipal component analysis method implemented in EIGEN-STRAT (29). The P-values obtained in EIGENSTRAT ana-lyses were quite comparable with the raw P-values (Tables 1
and 2). Supplementary Material, Figure S1 shows the toptwo principal components in this study sample.
We examined the distribution of P-values for all 379 319SNPs analyzed using quantile–quantile (Q–Q) plots forBMI and fat mass (Fig. 4). It can be seen that the observedP-values matched the expected P-values under the null distri-butions over the range of 1 , 2log10(P) , 4.0 for both BMIand fat mass. An excess of low P-value is observed at2log10(P) of 4.0 for both traits. Departure of distribution atthe extreme tail suggests that the associations identified arelikely due to true variants rather than potential biases suchas genotyping error.
Figure 1. Association signals for all genotyped SNPs in the CTNNBL1 gene in US Caucasians. The empty diamonds represent association signals for BMI andthe filled diamonds represent association signals for fat mass. The Y axis is 2log10(P) values. The haplotype block maps were constructed using our own geno-type data showing pairwise LD (D0).
1806 Human Molecular Genetics, 2008, Vol. 17, No. 12

Replication studies in a French case–control sample
To confirm our GWA findings obtained in the US Caucasianpopulation, we genotyped the five most significant CTNNBL1SNPs (rs6013029, rs16986921, rs6020712, rs6020846 andrs6020395) in 896 class III obese adults (BMI � 40 kg/m2)and 2916 lean adults (BMI , 25 kg/m2) of French Caucasianorigin. The P-values of logistic regression analysis and OR(95% CI) for each SNP are provided in Table 5. It can beseen that all five SNPs showed strong associations withobesity (8.83 � 1023 , P , 6.96 � 1024). Those subjectswho were homozygous for allele T at SNP rs6013029 had1.42-fold increased odds of obesity compared with those sub-jects not carrying the T allele. Since the threshold of signifi-cance for follow-up regional replication analysis should be
less stringent (i.e. larger P-values) than that of initial GWAscans, the association results obtained in this French case–control sample provide very strong replication evidencesupporting the GWA findings in US Caucasians.
DISCUSSION
In this study, we identified a novel gene, CTNNBL1, which hasmultiple SNPs associated with BMI and fat mass. In the USCaucasian sample, the minor allele T of the most significantSNP (rs6013029) confers an average increase in BMI andfat mass of 2.67 kg/m2 and 5.96 kg, respectively, comparedwith the alternative allele G. In the French case–controlsample, those subjects who were homozygous for thers6013029 allele T had a 1.42-fold increased odds of obesitywhen compared with those not carrying the T allele. Theother four significant SNPs (rs16986921, rs6020712,rs6020846 and rs6020395) showed consistency in sign forthe association with BMI and fat mass. The importance ofchromosome region 20q11, which harbors the CTNNBL1gene, was also highlighted in our previous genome-widelinkage scan study (27). Moreover, several other groups alsofound linkages to obesity at this region (4).
The sequence, gene structure and expression pattern ofCTNNBL1 were recently characterized (30), but its biologicalfunctions remain largely unknown. The human CTNNBL1gene contains 16 exons and 15 introns spanning .178 kb(30). CTNNBL1 mRNA is detectable in all tissues, but isespecially abundant in skeletal muscle (a major site forenergy metabolism), placenta, heart, spleen, testes andthyroid (30). A number of motifs in the CTNNBL1 sequenceare characteristic of transcription factors. Further, theCTNNBL1 protein has structural similarities to the family ofproteins containing armadillo repeats, a structural motif orig-inally identified in the Drosophila melanogaster segmentpolarity gene product armadillo, the ortholog of mammalianb-catenin (30). On the basis of this structural homology,CTNNBL1 may also possess similar functions of b-catenin,which not only regulates cell-to-cell adhesion as a proteininteracting with cadherin but also functions as a componentof the Wnt-signaling pathway (30–32). The Wnt-signalingpathway is conserved in various organisms and plays import-ant roles in development, cellular proliferation and differen-tiation. Studies demonstrate that the Wnt/b-catenin-signalingpathway appears to operate to maintain the undifferentiatedstate of pre-adipocytes by inhibiting adipogenic gene
Figure 3. The results of association tests for BMI and fat mass before and afteradjusting for genotype of rs6013029. (A) Results of association analyses forBMI. (B) Results of association analyses for fat mass. Filled squares representassociation signals in original association analyses. Empty diamonds representassociation signals after adjusting genotype at the rs6013029 as a covariate.
Figure 2. BMI (kg/m2) and fat mass (kg) distribution in different genotype groups of rs6013029 in US Caucasians.
Human Molecular Genetics, 2008, Vol. 17, No. 12 1807

expression (33). In addition, b-catenin may also influence themagnitude and potential of intestinal nutrient absorptionthrough the metabolic learning process, as the physiologicaldifferentiation zone of enterocytes is linked to the b-cateninsystem (34). Our association finding here for CTNNBL1,together with structural homology between CTNNBL1 andb-catenin and the functional relevance of the Wnt/b-cateninpathway on adipogenesis, may suggest a novel hypotheticalmechanism by which CTNNBL1 contributes to the develop-ment of obesity. Interestingly, the TCL7L2 (transcriptionfactor 7-like 2) gene which was repeatedly associated with dia-betes (6–9,35) can regulate proglucagon in enteroendocrinecells via the Wnt-signaling pathway. Further studies showedTCF7L2 can substantially influence normal birth weight vari-ation (36).
Several recent GWA studies reported association findingsfor obesity and related phenotypes. The first GWA forobesity was published in 2006 (14), in which the INSIG2gene was associated with BMI in the Framingham HeartStudy participants, and the association was replicated in fourseparate sample populations including Western Europeans,African Americans and children. In the current study, weobtained P-values of 0.007 and 0.009 for two INSIG2 SNPs.In view of the fact that P-values for replication studiesshould not be as stringent as those for GWA studies, ourstudy provides supportive evidence for association betweenINSIG2 and obesity. Nevertheless, the association betweenINSIG2 and obesity has been inconsistent. Some independentstudies (37,38) could not replicate this association, althoughothers studies (39,40) found this INSIG2 polymorphism mayincrease the risk for obesity in already overweight individuals.Overall, US Caucasian subjects studied here were overweight
(BMI of 28.92 kg/m2 for males and 27.29 kg/m2 for females),which may partially explain the associations observed forINSIG2 in this study sample. The association of the FTOgene with obesity was recently identified by several GWAstudies (16–18), but this association could not be replicatedin the present study, suggesting that this association mightbe heterogeneous across population samples.
GWA studies of complex diseases are still in their earlystages and many GWA findings await further studies to vali-date or refute. From classical probability theory, the prob-ability of replication for a specific association may decreasewith increasing number of independent GWA studies. Thisis because the likelihood that a specific association can bereplicated by multiple GWA studies is the product of thepower of each study. Thus, the probability of replication ishigh only when all the studies have very high power. Manyother factors, such as differential LD and allele frequenciesacross populations, small sample sizes and potential popu-lation stratification, may also significantly influence thechance of replicating GWA results (41). Therefore, statisticalreplication may not always be easy, even for functional vari-ants in well-designed studies. Meta-analysis is a useful toolfor synthesizing data and exploring potential heterogeneity(42,43). Bayesian approaches (44) or complementary conceptssuch as Bayesian false-positive report probability (45,46) mayalso help assess the credibility of an association identified.However, meta-analysis and Bayesian analyses require datasharing among different research groups, which is notalways easy to obtain in the research community. Functionalmolecular and cellular studies are essential for validatingand illuminating the functional relevance of the genes uncove-red in population studies. It is critical that validation of
Table 3. Comparison of the results of our earlier linkage scan (27) and current GWA study in US Caucasians
Results of our earlier linkage scan Results of the current GWAPhenotype Genomic region LOD score SNP Associated gene Cytoband P-value
BMI 5q35 2.04 rs13356223 SH3PXD2B 5q35.1 5.91 � 1025
rs10077897 SH3PXD2B 5q35.1 1.39 � 1024
rs13436547 SH3PXD2B 5q35.1 4.27 � 1024
rs17734503 SLIT3 5q35.1 4.80 � 1024
rs12654448 SLIT3 5q35.1 5.92 � 1024
Fat mass 20p11–q13 3.31 rs6013029 CTNNBL1 20q11.23 4.99 � 1028
rs16986921 CTNNBL1 20q11.23 6.54 � 1028
rs6020712 CTNNBL1 20q11.23 1.20 � 1027
rs7363432 FLJ42133 20q11.23 3.51 � 1026
rs6095722 FLJ42133 20q11.23 1.74 � 1025
Table 4. Comparison of the published GWA studies for obesity and the current study
Results of the published GWA Results of current GWASNP Associated gene Cytoband P-value Reference SNP Associated gene Cytoband P-value
rs75666015 INSIG2 2q14.1 0.0026 (14) rs2012693 INSIG2 2q14.1 0.007rs7566605 INSIG2 2q14.1 0.009
rs9930506 FTO 16q12 8.6 � 1027 (17) .0.50rs9939609 FTO 16q12 ,0.001 (16) .0.50rs6602024 PFKP 10p15 4.9 � 1026 (17) rs2388395 PFKP 10p15 1.4 � 1024
rs2388399 PFKP 10p15 4.2 � 1024
rs2388397 PFKP 10p15 4.8 � 1024
1808 Human Molecular Genetics, 2008, Vol. 17, No. 12

preliminary associations can be achieved in additional samplesbefore follow-up molecular and cellular studies.
Potential population stratification may cause false-positive/negative association results (47), but the probability is low inthis study. First, our study cohort for the initial GWA camefrom a US mid-west Caucasian population, living in Omaha,NE, USA, and its surrounding areas. This US Caucasian popu-lation is relatively homogenous due to a fairly stable popu-lation in which Caucasians have predominated as the majorethnic group in this area for an extended period. In addition,we found that the genotypic and allelic frequencies of the sig-nificant SNPs in our sample are very similar to those reportedin the typical and representative Caucasian samples used in theHapMap CEU. Our subpopulation analysis indicated that.98% of the subjects consistently clustered together as asingle group, suggesting no significant population substructurein our sample. Moreover, genome control factors for BMI andfat mass are quite close to 1.0. To further guard against poten-tial population stratification, we performed principal com-ponent analysis implemented in EIGENSTRAT (29).
In summary, we identified a novel gene, CTNNBL1, associ-ated with BMI and fat mass through a GWA study in a USCaucasian population. The significance of this gene was
further replicated in a large French adult case–controlsample. The functional relevance of CTNNBL1 on obesity isstill unclear. Because of structural homology betweenCTNNBL1 and b-catenin, and the functional relevance ofWnt/b-catenin pathway on adipogenesis, we propose a novelhypothetical mechanism underlying obesity, in whichCTNNBL1 may play an important role. Further functionalstudies including knockout and overexpression models ofCTNNBL1 are necessary to validate its significance to obesity.
MATERIALS AND METHODS
Subjects and phenotypes
The study was approved by the Institutional Review Boardinvolved. Signed informed consent documents were obtainedfrom all study participants before they entered the study.
US Caucasian sample. This sample contains 1000 unrelatedadults, which was randomly identified from our establishedand expanding genetic repertoire currently containing morethan 6000 subjects. All of the chosen subjects were USCaucasians of Northern European origin living in Omaha,NE, USA, and its surrounding areas. They were normalhealthy subjects defined by a comprehensive suite of exclusioncriteria (48). Briefly, subjects with chronic diseases and con-ditions involving vital organs (heart, lung, liver, kidney andbrain) and severe endocrine, metabolic or nutritional diseasesthat might affect fat metabolism were excluded from thisstudy.
BMI was calculated as body weight (in kilograms) dividedby the square of height (in meters). Weight was measured inlight indoor clothing without shoes, using a calibratedbalance beam scale, and height was measured using a cali-brated stadiometer. Body fat mass was measured withHologic 4500 DEXA machines. The short-term reproducibility(coefficient of variation) of BMI and fat mass measurements ison average 0.2 and 1.1%, respectively. The general relevantcharacteristics of the study subjects are shown in Table 6.Measurement of body fat mass by DEXA is considered tobe highly accurate and gold standard (49). The correlationbetween BMI and fat mass was 0.85 (P , 0.01) in this sample.
French case–control sample. This sample contained 896 adultcases and 2916 adult controls of French Caucasian origin (seeTable 6 for characteristics of the sample). This sample wasused in a recent prominent GWA study (18), in which theFTO gene was found to contribute to obesity. The caseswere class III obese adults defined by a BMI � 40 kg/m2.The controls were lean adults defined by a BMI , 25 kg/m2.The obese individuals were recruited through a multimediacampaign run by the CNRS UMR8090 and the Departmentof Nutrition of the Paris Hotel Dieu Hospital. The controlswere members of three cohorts: a cohort of middle-aged,lean adults comprising (DESIR) (n ¼ 2041) volunteersrecruited from 10 health examination centers in thewestern-central part of France; one sample of 382 controlsthat were recruited along with the cases in the multimediacampaign by the CNRS UMR8090; 493 lean young adultsfrom the Haguenau study.
Figure 4. Q–Q plots for BMI (A) and fat mass (B) association 2log10(P)values for the US Caucasian sample and P-values expected under the null dis-tribution for the GWA SNPs.
Human Molecular Genetics, 2008, Vol. 17, No. 12 1809

Genotyping
Affymetrix 500K SNPs in 1000 US Caucasians. Genomic DNAwas extracted from whole human blood using a commercialisolation kit (Gentra systems, Minneapolis, MN, USA) follow-ing the protocols detailed in the kit. Before advancing to thegenotyping step, the measurements of DNA concentrationwere double-checked by pico-green analysis that can detectfluorescent signal enhancement of PicoGreenw dsDNA Quan-titation Reagent, which selectively binds to dsDNA (50,51).Genotyping with the Affymetrix Mapping 250K Nsp andAffymetrix Mapping 250K Sty arrays was performed at theVanderbilt Microarray Shared Resource at Vanderbilt Univer-sity Medical Center, Nashville, TN, USA, using the standardprotocol recommended by the manufacturer. Briefly, foreach array, 250 ng of genomic DNA was digested witheither Nsp1 or Sty1 and ligated to adapters that recognizethe cohesive four base pair overhangs. A generic primer thatrecognizes the ligated adapter sequence was used to amplifythe ligation products in a polymerase chain reaction. Theamplified DNA was assayed by agarose gel electrophoresisto verify an average size distribution of 250–1500 bp. Theamplified DNA was purified per the manufacturer’s protocoland quantitated by absorbance at 260 and 280 nm. Ninetymicrograms of purified DNA was fragmented with DNaseIand visualized on a 4% agarose gel. Samples with fragmentdistributions ,180 bp were hybridized to the appropriatearray (Nsp or Sty). Arrays were stained, washed andscanned per the manufacturer’s protocol using immunopurestrepavidin (Pierce, Milwaukee, WI, USA), biotinylated anti-streptavidin antibody (Vector Labs, Burlingame, CA, USA)and R-phycoerythrin strepavidin (Invitrogen, Carlsbad, CA,USA). Fluorescence intensities were quantitated using anAffymetrix array scanner 30007G. Data management and ana-lyses were performed using Affymetrix GeneChip OperatingSystem. Genotyping calls were determined from the fluor-escent intensities using the DM algorithm with a 0.33
P-value setting (52) as well as the B-RLMM algorithm (53).DM calls were used for quality control, and the B-RLMMcalls were used for all subsequent data analysis. B-RLMMclustering was performed with 94 samples per cluster.
The final average BRLMM call rate across the entire samplereached the high level of 99.14%. However, out of the initialfull set of 500 568 SNPs, we discarded 32 961 SNPs withsample call rate ,95%, another 36 965 SNPs with allelefrequencies deviating from Hardy–Weinberg equilibrium(P , 0.001) and 51 323 SNPs with minor allele frequencies(MAF) ,1%. Therefore, the final SNP set maintained in thesubsequent analyses contained 379 319 SNPs, yielding anaverage marker spacing of �7.9 kb throughout the humangenome.
Replication genotyping in French Caucasians. The five mostsignificant SNPs within the CTNNBL1 gene (rs6013029,rs16986921, rs6020712, rs6020846 and rs6020395) were gen-otyped in the French case–control sample. These SNPs weregenotyped using an allelic discrimination assay-by-designTaqMan method on ABI 7900 (Applied Biosystems).Among the total 3812 subjects, 266 subjects were excludeddue to the low genotyping call rate. The average genotypingrate was 96%. The genotyping error rate was assessed byrandomly re-genotyping 200 participants. The concordancerate was 100% for all the five SNPs.
Statistical analysis
Initial GWA in US Caucasians. GWA statistical analyses,including single-marker association analyses and haplotypeassociation analyses, were performed using HelixTree5.3.1 (Golden Helix, Bozeman, MT, USA). The associationtests performed in the screen were allele-wised, that is,t-tests of one-degree of freedom. In association analyses,age, age2, sex, age-by-sex interaction and age2-by-sex
Table 5. Replication studies in French adult case–control sample
SNP Allelea Obese Control MAF (case, control) OR (95% CI) P-value
rs6013029 G/T 2.669 877 0.072, 0.052 1.42 (1.14–1.77) 7.80 � 1024
rs16986921 C/T 2.669 877 0.070, 0.051 1.38 (1.11–1.72) 1.96 � 1023
rs6020712 G/A 2.669 877 0.072, 0.052 1.43 (1.15–1.72) 6.96 � 1024
rs6020846 A/G 2.669 877 0.080, 0.062 1.32 (1.07–1.62) 4.03 � 1023
rs6020395 G/C 2.669 877 0.077, 0.061 1.29 (1.04–1.58) 8.83 � 1023
aThe second allele represents the minor allele of each locus. Replication analyses compare genotype frequencies in obese and lean individuals usinglogistic regression under an additive model. The OR is the odds ratio of the risk allele.
Table 6. Basic characteristics of the subjects
US Caucasian sample French adult case–control sample
Trait Male (n ¼ 500) Female (n ¼ 500) Status Age (years) BMI (kg/m2) Males%Age (years) 59.7 (+14.9) 58.1 (+15.8) Cases 44.0 (+12.0) 47.0 (+7.5) 30Height (m) 1.77 (+0.07) 1.64 (+0.06) Controls 51.0 (+10.0) 22.8 (+2.0) 40Weight (kg) 89.07 (+15.44) 71.38 (+15.88)BMI (kg/m2) 28.92 (+4.30) 27.29 (+5.98)Fat mass (kg) 23.46 (+8.88) 26.92 (+10.33)
1810 Human Molecular Genetics, 2008, Vol. 17, No. 12

interaction were included as covariates to adjust the BMI andfat mass data.
The LD patterns of the interested genes were analyzedand plotted using the Haploview program (24) and our owngenotype data. To explore potential functions of the significantSNPs identified, we used the FASTSNP (function analysis andselection tool for SNPs) program (http://fastsnp.ibms.sinica.edu.tw) that analyzes SNP functions on the basis of up-to-dateinformation extracted from 11 external bioinformatic data-bases at query time (54).
We calculated an FDR-based q value to measure the statisti-cal significance at the genome-wide level for the associationresults. Bonferroni correction is overly conservative formultiple-testing adjustment in a GWA study since it doesnot take into account the intrinsic correlations between alarge number of tests, which is caused by the extensive LDamong SNP markers genome-wide. The FDR-based q valueis a method that strikes a delicate balance between keepingmeaningful results and maintaining a low rate of false-positivefindings. There are multiple versions of FDR (55,56). In thisstudy, we adopted the method proposed by Storey and Tibshir-ani (56) and used the related software QVALUE (http://geno-mine.org/qvalue/) to calculate q values. A range of tuningparameters (l), from 0 to 0.95 with a step of 0.05, werescreened, and the optimal l was picked using the smoothermethod (56) to minimize the mean squared error of the esti-mates. We used an FDR threshold of q ¼ 0.05 to control thegenome-wide significance of the identified markers, whichmeans that among all the markers called significant by thisstandard, only ,5% of these may be truly ‘null’ on average.Therefore, our selection process for the most significantmarkers/genes based on the P-values and FDR q value wasstringent yet also took into account a reasonable dynamicrange of significance levels to allow for more interestingleads (such as multiple significant markers from a singlegene) to emerge.
To facilitate interpretation of the results, we defined as ‘highlysuggestive’ associations those markers with raw P-values,0.001. We compared our GWA results with several publishedGWA studies for obesity and related phenotypes. In addition,we compared the highly suggestive association results achievedhere with our previous linkage findings (27).
To detect population stratification that may lead to spuriousassociation results, we used the structured association method(28) to investigate the potential substructure of our sample. Toensure the robustness of our results, we performed nine inde-pendent analyses under each combination of two conditions,the assumed number of population strata, k, which was set at2, 3 and 4, respectively, and the three different sets of unlinkedmarkers selected randomly genome-wide, which contains 200,2000 and 6000 markers, respectively. To further guard againstpotential population stratification that cannot be identified bySTRUCTURE (28), we performed analyses using the principalcomponent analysis method implemented in EIGENSTRAT(29). We also calculated the overall GC correction factorsand the GC-corrected P-values.
To investigate whether the identified associations are due topotential biases (e.g. genotyping error), we examined the dis-tribution of P-values for all 379 319 SNPs analyzed in oursample using Q–Q plots.
Replication analyses in the French case–control sample. Weused logistic regression analyses to test association in case–controls under an additive model, and Pearson’s x2 for thegeneral association model. The P-values for replication areone-sided because we test the specific hypothesis of increasedfrequency of alleles in these SNPs in obese adults.
SUPPLEMENTARY MATERIAL
Supplementary Material is available at HMG Online.
ACKNOWLEDGEMENTS
We wish to thank Dr Beverley Balkau and the DESIR consor-tium as well as Dr Claire Levy-Marchal, who recruited a pro-portion of the French study lean controls. We thankEmmanuelle Durand, Jerome Delplanque and Stefan Gagetfor the technical support on replication SNP genotyping inthe French case–control sample.
Conflict of Interest statement. None declared.
FUNDING
Collection of the US Caucasian sample was partially sup-ported by grants from NIH (R01 AR050496-01, R21AG027110, R01 AG026564 and P50 AR055081). The studyalso benefited from grants from National Science Foundationof China, Huo Ying Dong Education Foundation, HuNan Pro-vince, Xi’an Jiaotong University and the Ministry of Edu-cation of China. The recruitment of French obese cases wassupported by both Assistance-Publique Hopitaux de Parisand Centre National de la Recherche Scientifique.
REFERENCES
1. Kopelman, P.G. (2000) Obesity as a medical problem. Nature, 404,635–643.
2. Ogden, C.L., Carroll, M.D., Curtin, L.R., McDowell, M.A., Tabak, C.J.and Flegal, K.M. (2006) Prevalence of overweight and obesity in theUnited States, 1999–2004. JAMA, 295, 1549–1555.
3. Bell, C.G., Walley, A.J. and Froguel, P. (2005) The genetics of humanobesity. Nat. Rev. Genet., 6, 221–234.
4. Rankinen, T., Zuberi, A., Chagnon, Y.C., Weisnagel, S.J., Argyropoulos,G., Walts, B., Perusse, L. and Bouchard, C. (2006) The human obesitygene map: the 2005 update. Obesity, 14, 529–644.
5. Hirschhorn, J.N. and Daly, M.J. (2005) Genome-wide association studiesfor common diseases and complex traits. Nat. Rev. Genet., 6, 95–108.
6. Wellcome Trust Case Control Consortium. (2007) Genome-wideassociation study of 14,000 cases of seven common diseases and 3,000shared controls. Nature, 447, 661–678.
7. Saxena, R., Voight, B.F., Lyssenko, V., Burtt, N.P., de Bakker, P.I., Chen,H., Roix, J.J., Kathiresan, S., Hirschhorn, J.N., Daly, M.J. et al. (2007)Genome-wide association analysis identifies loci for type 2 diabetes andtriglyceride levels. Science, 316, 1331–1336.
8. Scott, L.J., Mohlke, K.L., Bonnycastle, L.L., Willer, C.J., Li, Y., Duren,W.L., Erdos, M.R., Stringham, H.M., Chines, P.S., Jackson, A.U. et al.(2007) A genome-wide association study of type 2 diabetes in Finnsdetects multiple susceptibility variants. Science, 316, 1341–1345.
9. Sladek, R., Rocheleau, G., Rung, J., Dina, C., Shen, L., Serre, D., Boutin, P.,Vincent, D., Belisle, A., Hadjadj, S. et al. (2007) A genome-wide associationstudy identifies novel risk loci for type 2 diabetes. Nature, 445, 881–885.
10. Duerr, R.H., Taylor, K.D., Brant, S.R., Rioux, J.D., Silverberg, M.S.,Daly, M.J., Steinhart, A.H., Abraham, C., Regueiro, M., Griffiths, A. et al.
Human Molecular Genetics, 2008, Vol. 17, No. 12 1811

(2006) A genome-wide association study identifies IL23R as aninflammatory bowel disease gene. Science, 314, 1461–1463.
11. Hampe, J., Franke, A., Rosenstiel, P., Till, A., Teuber, M., Huse, K.,Albrecht, M., Mayr, G., De, L.V., Briggs, J. et al. (2007) A genome-wideassociation scan of nonsynonymous SNPs identifies a susceptibilityvariant for Crohn disease in ATG16L1. Nat. Genet., 39, 207–211.
12. Gudmundsson, J., Sulem, P., Manolescu, A., Amundadottir, L.T.,Gudbjartsson, D., Helgason, A., Rafnar, T., Bergthorsson, J.T.,Agnarsson, B.A., Baker, A. et al. (2007) Genome-wide association studyidentifies a second prostate cancer susceptibility variant at 8q24. Nat.
Genet., 39, 631–637.13. Yeager, M., Orr, N., Hayes, R.B., Jacobs, K.B., Kraft, P., Wacholder, S.,
Minichiello, M.J., Fearnhead, P., Yu, K., Chatterjee, N. et al. (2007)Genome-wide association study of prostate cancer identifies a second risklocus at 8q24. Nat. Genet., 39, 645–649.
14. Herbert, A., Gerry, N.P., McQueen, M.B., Heid, I.M., Pfeufer, A., Illig, T.,Wichmann, H.E., Meitinger, T., Hunter, D., Hu, F.B. et al. (2006) Acommon genetic variant is associated with adult and childhood obesity.Science, 312, 279–283.
15. Lyon, H.N., Emilsson, V., Hinney, A., Heid, I.M., Lasky-Su, J., Zhu, X.,Thorleifsson, G., Gunnarsdottir, S., Walters, G.B., Thorsteinsdottir, U.et al. (2007) The association of a SNP upstream of INSIG2 with body
mass index is reproduced in several but not all cohorts. PLoS Genet., 3,e61.
16. Frayling, T.M., Timpson, N.J., Weedon, M.N., Zeggini, E., Freathy, R.M.,Lindgren, C.M., Perry, J.R., Elliott, K.S., Lango, H., Rayner, N.W. et al.(2007) A common variant in the FTO gene is associated with body massindex and predisposes to childhood and adult obesity. Science, 316,889–894.
17. Scuteri, A., Sanna, S., Chen, W.M., Uda, M., Albai, G., Strait, J., Najjar,S., Nagaraja, R., Orru, M., Usala, G. et al. (2007) Genome-wideassociation scan shows genetic variants in the FTO gene are associatedwith obesity-related traits. PLoS Genet., 20, e115.
18. Dina, C., Meyre, D., Gallina, S., Durand, E., Korner, A., Jacobson, P.,Carlsson, L.M., Kiess, W., Vatin, V., Lecoeur, C. et al. (2007) Variationin FTO contributes to childhood obesity and severe adult obesity. Nat.
Genet., 39, 724–726.19. The International HapMap Consortium. (2003) The International
HapMap Project. Nature, 426, 789–796.20. Frazer, K.A., Ballinger, D.G., Cox, D.R., Hinds, D.A., Stuve, L.L., Gibbs,
R.A., Belmont, J.W., Boudreau, A., Hardenbol, P., Leal, S.M. et al. (2007)A second generation human haplotype map of over 3.1 million SNPs.Nature, 449, 851–861.
21. Frazer, K.A., Ballinger, D.G., Cox, D.R., Hinds, D.A., Stuve, L.L., Gibbs,R.A., Belmont, J.W., Boudreau, A., Hardenbol, P., Leal, S.M. et al. (2007)A second generation human haplotype map of over 3.1 million SNPs.Nature, 449, 851–861.
22. Marchini, J., Howie, B., Myers, S., McVean, G. and Donnelly, P. (2007) Anew multipoint method for genome-wide association studies byimputation of genotypes. Nat. Genet., 39, 906–913.
23. Gabriel, S.B., Schaffner, S.F., Nguyen, H., Moore, J.M., Roy, J.,Blumenstiel, B., Higgins, J., DeFelice, M., Lochner, A., Faggart, M. et al.(2002) The structure of haplotype blocks in the human genome. Science,296, 2225–2229.
24. Barrett, J.C., Fry, B., Maller, J. and Daly, M.J. (2005) Haploview: analysisand visualization of LD and haplotype maps. Bioinformatics, 21,263–265.
25. Purcell, S., Cherny, S.S. and Sham, P.C. (2003) Genetic Power Calculator:design of linkage and association genetic mapping studies of complextraits. Bioinformatics, 19, 149–150.
26. Killeen, P.R. (2005) An alternative to null-hypothesis significance tests.Psychol. Sci., 16, 345–353.
27. Zhao, L.J., Xiao, P., Liu, Y.J., Xiong, D.H., Shen, H., Recker, R.R. andDeng, H.W. (2007) A genome-wide linkage scan for quantitative trait lociunderlying obesity related phenotypes in 434 Caucasian families. Hum.Genet., 121, 145–148.
28. Pritchard, J.K. and Rosenberg, N.A. (1999) Use of unlinked geneticmarkers to detect population stratification in association studies.Am. J. Hum. Genet., 65, 220–228.
29. Price, A.L., Patterson, N.J., Plenge, R.M., Weinblatt, M.E., Shadick, N.A.and Reich, D. (2006) Principal components analysis corrects forstratification in genome-wide association studies. Nat. Genet., 38,904–909.
30. Jabbour, L., Welter, J.F., Kollar, J. and Hering, T.M. (2003) Sequence, genestructure, and expression pattern of CTNNBL1, a minor-class intron-containing gene—evidence for a role in apoptosis. Genomics, 81, 292–303.
31. Kikuchi, A. (2000) Regulation of beta-catenin signaling in the Wntpathway. Biochem. Biophys. Res. Commun., 268, 243–248.
32. Moon, R.T., Bowerman, B., Boutros, M. and Perrimon, N. (2002) Thepromise and perils of Wnt signaling through beta-catenin. Science, 296,1644–1646.
33. Ross, S.E., Hemati, N., Longo, K.A., Bennett, C.N., Lucas, P.C.,Erickson, R.L. and MacDougald, O.A. (2000) Inhibition of adipogenesisby Wnt signaling. Science, 289, 950–953.
34. Schmitz, G. and Langmann, T. (2006) Metabolic learning in the intestine:adaptation to nutrition and luminal factors. Horm. Metab. Res., 38,452–454.
35. Grant, S.F., Thorleifsson, G., Reynisdottir, I., Benediktsson, R.,Manolescu, A., Sainz, J., Helgason, A., Stefansson, H., Emilsson, V.,Helgadottir, A. et al. (2007) Variant of transcription factor 7-like 2(TCF7L2) gene confers risk of type 2 diabetes. A genome-wideassociation study identifies novel risk loci for type 2 diabetes. Nature, 445,881–885.
36. Freathy, R.M., Weedon, M.N., Bennett, A., Hypponen, E., Relton, C.L.,Knight, B., Shields, B., Parnell, K.S., Groves, C.J., Ring, S.M. et al.
(2007) Type 2 diabetes TCF7L2 risk genotypes alter birth weight: a studyof 24,053 individuals. Am. J. Hum. Genet., 80, 1150–1161.
37. Dina, C., Meyre, D., Samson, C., Tichet, J., Marre, M., Jouret, B., Charles,M.A., Balkau, B. and Froguel, P. (2007) Comment on ‘A common geneticvariant is associated with adult and childhood obesity’. Science, 315, 187.
38. Loos, R.J., Barroso, I., O’Rahilly, S. and Wareham, N.J. (2007) Commenton ‘A common genetic variant is associated with adult and childhoodobesity’. Science, 315, 187.
39. Hall, D.H., Rahman, T., Avery, P.J. and Keavney, B. (2006) INSIG-2promoter polymorphism and obesity related phenotypes: association studyin 1428 members of 248 families. BMC Med. Genet., 7, 83.
40. Rosskopf, D., Bornhorst, A., Rimmbach, C., Schwahn, C., Kayser, A.,Kruger, A., Tessmann, G., Geissler, I., Kroemer, H.K. and Volzke, H.(2007) Comment on ‘A common genetic variant is associated with adultand childhood obesity’. Science, 315, 187.
41. Colhoun, H.M., McKeigue, P.M. and Davey, S.G. (2003) Problems ofreporting genetic associations with complex outcomes. Lancet, 361,865–872.
42. Ioannidis, J.P., Patsopoulos, N.A. and Evangelou, E. (2007) Heterogeneityin meta-analyses of genome-wide association investigations. PLoS ONE,2, e841.
43. Evangelou, E., Maraganore, D.M. and Ioannidis, J.P. (2007)Meta-analysis in genome-wide association datasets: strategies andapplication in Parkinson disease. PLoS ONE, 2, e196.
44. Chanock, S.J., Manolio, T., Boehnke, M., Boerwinkle, E., Hunter, D.J.,Thomas, G., Hirschhorn, J.N., Abecasis, G., Altshuler, D., Bailey-Wilson,J.E. et al. (2007) Replicating genotype-phenotype associations. Nature,447, 655–660.
45. Wacholder, S., Chanock, S., Garcia-Closas, M., El Ghormli, L. andRothman, N. (2004) Assessing the probability that a positive report isfalse: an approach for molecular epidemiology studies. J. Natl CancerInst., 96, 434–442.
46. Wakefield, J. (2007) A Bayesian measure of the probability of falsediscovery in genetic epidemiology studies. Am. J. Hum. Genet., 81,208–227.
47. Deng, H.W. (2001) Population admixture may appear to mask, change orreverse genetic effects of genes underlying complex traits. Genetics, 159,1319–1323.
48. Deng, H.W., Deng, H., Liu, Y.J., Liu, Y.Z., Xu, F.H., Shen, H., Conway,T., Li, J.L., Huang, Q.Y., Davies, K.M. and Recker, R.R. (2002) Agenomewide linkage scan for quantitative-trait loci for obesityphenotypes. Am. J. Hum. Genet., 70, 1138–1151.
49. Bray, B.A., Bouchard, C. and James, W.P. Handbook of obesity (1997)Marcel Dekker, NY.
50. Ahn, S.J., Costa, J. and Emanuel, J.R. (1996) PicoGreen quantitation ofDNA: effective evaluation of samples pre- or post-PCR. Nucleic AcidsRes., 24, 2623–2625.
51. Singer, V.L., Jones, L.J., Yue, S.T. and Haugland, R.P. (1997)Characterization of PicoGreen reagent and development of afluorescence-based solution assay for double-stranded DNA quantitation.Anal. Biochem., 249, 228–238.
1812 Human Molecular Genetics, 2008, Vol. 17, No. 12

52. Di, X., Matsuzaki, H., Webster, T.A., Hubbell, E., Liu, G., Dong, S.,Bartell, D., Huang, J., Chiles, R., Yang, G. et al. (2005) Dynamic modelbased algorithms for screening and genotyping over 100 K SNPs onoligonucleotide microarrays. Bioinformatics, 21, 1958–1963.
53. Rabbee, N. and Speed, T.P. (2006) A genotype calling algorithm foraffymetrix SNP arrays. Bioinformatics, 22, 7–12.
54. Yuan, H.Y., Chiou, J.J., Tseng, W.H., Liu, C.H., Liu, C.K., Lin, Y.J.,Wang, H.H., Yao, A., Chen, Y.T. and Hsu, C.N. (2006) FASTSNP: an
always up-to-date and extendable service for SNP function analysis andprioritization. Nucleic Acids Res., 34, W635–W641.
55. Benjamini, Y. (1995) Controlling the false discovery rate: a practical andpowerful approach to multiple testing. J. R. Stat. Soc. Ser. B, 57,289–300.
56. Storey, J.D. and Tibshirani, R. (2003) Statistical significance forgenomewide studies. Proc. Natl Acad. Sci. USA, 100,9440–9445.
Human Molecular Genetics, 2008, Vol. 17, No. 12 1813