Genome sequence, comparative analysis and haplotype structure of the domestic dog
17
© 2005 Nature Publishing Group Genome sequence, comparative analysis and haplotype structure of the domestic dog Kerstin Lindblad-Toh 1 , Claire M Wade 1,2 , Tarjei S. Mikkelsen 1,3 , Elinor K. Karlsson 1,4 , David B. Jaffe 1 , Michael Kamal 1 , Michele Clamp 1 , Jean L. Chang 1 , Edward J. Kulbokas III 1 , Michael C. Zody 1 , Evan Mauceli 1 , Xiaohui Xie 1 , Matthew Breen 5 , Robert K. Wayne 6 , Elaine A. Ostrander 7 , Chris P. Ponting 8 , Francis Galibert 9 , Douglas R. Smith 10 , Pieter J. deJong 11 , Ewen Kirkness 12 , Pablo Alvarez 1 , Tara Biagi 1 , William Brockman 1 , Jonathan Butler 1 , Chee-Wye Chin 1 , April Cook 1 , James Cuff 1 , Mark J. Daly 1,2 , David DeCaprio 1 , Sante Gnerre 1 , Manfred Grabherr 1 , Manolis Kellis 1,13 , Michael Kleber 1 , Carolyne Bardeleben 6 , Leo Goodstadt 8 , Andreas Heger 8 , Christophe Hitte 9 , Lisa Kim 7 , Klaus-Peter Koepfli 6 , Heidi G. Parker 7 , John P. Pollinger 6 , Stephen M. J. Searle 14 , Nathan B. Sutter 7 , Rachael Thomas 5 , Caleb Webber 8 , Broad Institute Genome Sequencing Platform* & Eric S. Lander 1,15 Here we report a high-quality draft genome sequence of the domestic dog (Canis familiaris), together with a dense map of single nucleotide polymorphisms (SNPs) across breeds. The dog is of particular interest because it provides important evolutionary information and because existing breeds show great phenotypic diversity for morphological, physiological and behavioural traits. We use sequence comparison with the primate and rodent lineages to shed light on the structure and evolution of genomes and genes. Notably, the majority of the most highly conserved non-coding sequences in mammalian genomes are clustered near a small subset of genes with important roles in development. Analysis of SNPs reveals long-range haplotypes across the entire dog genome, and defines the nature of genetic diversity within and across breeds. The current SNP map now makes it possible for genome-wide association studies to identify genes responsible for diseases and traits, with important consequences for human and companion animal health. Man’s best friend, Canis familiaris, occupies a special niche in genomics. The unique breeding history of the domestic dog provides an unparalleled opportunity to explore the genetic basis of disease susceptibility, morphological variation and behavioural traits. The position of the dog within the mammalian evolutionary tree also makes it an important guide for comparative analysis of the human genome. The history of the domestic dog traces back at least 15,000 years, and possibly as far back as 100,000 years, to its original domestication from the grey wolf in East Asia 1–4 . Dogs evolved through a mutually beneficial relationship with humans, sharing living space and food sources. In recent centuries, humans have selectively bred dogs that excel at herding, hunting and obedience, and in this process have created breeds rich in behaviours that both mimic human behaviours and support our needs. Dogs have also been bred for desired physical characteristics such as size, skull shape, coat colour and texture 5 , producing breeds with closely delineated morphologies. This evolu- tionary experiment has produced diverse domestic species, harbour- ing more morphological diversity than exists within the remainder of the family Canidae 6 . As a consequence of these stringent breeding programmes and periodic population bottlenecks (for example, during the World Wars), many of the ,400 modern dog breeds also show a high prevalence of specific diseases, including cancers, blindness, heart disease, cataracts, epilepsy, hip dysplasia and deafness 7,8 . Most of these diseases are also commonly seen in the human population, and clinical manifestations in the two species are often similar 9 . The high prevalence of specific diseases within certain breeds suggests that a limited number of loci underlie each disease, making their genetic dissection potentially more tractable in dogs than in humans 10 . Genetic analysis of traits in dogs is enhanced by the close relationship between humans and canines in modern society. ARTICLES 1 Broad Institute of Harvard and MIT, 320 Charles Street, Cambridge, Massachusetts 02141, USA. 2 Center for Human Genetic Research, Massachusetts General Hospital, 185 Cambridge Street, Boston, Massachusetts 02114, USA. 3 Division of Health Sciences and Technology, Massachusetts Institute of Technology, Cambridge, Massachusetts 02139, USA. 4 Program in Bioinformatics, Boston University, 44 Cummington Street, Boston, Massachusetts 02215, USA. 5 Department of Molecular Biomedical Sciences, College of Veterinary Medicine, North Carolina State University, 4700 Hillsborough Street, Raleigh, North Carolina 27606, USA. 6 Department of Ecology and Evolutionary Biology, University of California, Los Angeles, California 90095, USA. 7 National Human Genome Research Institute, National Institutes of Health, 50 South Drive, MSC 8000, Building 50, Bethesda, Maryland 20892-8000, USA. 8 MRC Functional Genetics, University of Oxford, Department of Human Anatomy and Genetics, South Parks Road, Oxford OX1 3QX, UK. 9 UMR 6061 Genetique et Developpement, CNRS—Universite ´ de Rennes 1, Faculte ´ de Me ´decine, 2, Avenue Leon Bernard, 35043 Rennes Cedex, France. 10 Agencourt Bioscience Corporation, 500 Cummings Center, Suite 2450, Beverly, Massachusetts 01915, USA. 11 Children’s Hospital Oakland Research Institute, 5700 Martin Luther King Jr Way, Oakland, California 94609, USA. 12 The Institute for Genomic Research, Rockville, Maryland 20850, USA. 13 Computer Science and Artificial Intelligence Laboratory, Cambridge, Massachusetts 02139, USA. 14 The Wellcome Trust Sanger Institute, The Wellcome Trust Genome Campus, Hinxton, Cambridge CB10 1SA, UK. 15 Whitehead Institute for Biomedical Research, 9 Cambridge Center, Cambridge, Massachusetts 02142, USA. *A list of participants and affiliations appears at the end of the paper. Vol 438|8 December 2005|doi:10.1038/nature04338 803
-
Upload
independent -
Category
Documents
-
view
0 -
download
0
Transcript of Genome sequence, comparative analysis and haplotype structure of the domestic dog

© 2005 Nature Publishing Group
Genome sequence, comparative analysisand haplotype structure of the domesticdogKerstin Lindblad-Toh1, Claire M Wade1,2, Tarjei S. Mikkelsen1,3, Elinor K. Karlsson1,4, David B. Jaffe1,Michael Kamal1, Michele Clamp1, Jean L. Chang1, Edward J. Kulbokas III1, Michael C. Zody1, Evan Mauceli1,Xiaohui Xie1, Matthew Breen5, Robert K. Wayne6, Elaine A. Ostrander7, Chris P. Ponting8, Francis Galibert9,Douglas R. Smith10, Pieter J. deJong11, Ewen Kirkness12, Pablo Alvarez1, Tara Biagi1, William Brockman1,Jonathan Butler1, Chee-Wye Chin1, April Cook1, James Cuff1, Mark J. Daly1,2, David DeCaprio1, Sante Gnerre1,Manfred Grabherr1, Manolis Kellis1,13, Michael Kleber1, Carolyne Bardeleben6, Leo Goodstadt8, Andreas Heger8,Christophe Hitte9, Lisa Kim7, Klaus-Peter Koepfli6, Heidi G. Parker7, John P. Pollinger6, Stephen M. J. Searle14,Nathan B. Sutter7, Rachael Thomas5, Caleb Webber8, Broad Institute Genome Sequencing Platform*& Eric S. Lander1,15
Here we report a high-quality draft genome sequence of the domestic dog (Canis familiaris), together with a dense mapof single nucleotide polymorphisms (SNPs) across breeds. The dog is of particular interest because it provides importantevolutionary information and because existing breeds show great phenotypic diversity for morphological, physiologicaland behavioural traits. We use sequence comparison with the primate and rodent lineages to shed light on the structureand evolution of genomes and genes. Notably, the majority of the most highly conserved non-coding sequences inmammalian genomes are clustered near a small subset of genes with important roles in development. Analysis of SNPsreveals long-range haplotypes across the entire dog genome, and defines the nature of genetic diversity within andacross breeds. The current SNP map now makes it possible for genome-wide association studies to identify genesresponsible for diseases and traits, with important consequences for human and companion animal health.
Man’s best friend, Canis familiaris, occupies a special niche ingenomics. The unique breeding history of the domestic dog providesan unparalleled opportunity to explore the genetic basis of diseasesusceptibility, morphological variation and behavioural traits. Theposition of the dog within the mammalian evolutionary tree alsomakes it an important guide for comparative analysis of the humangenome.
The history of the domestic dog traces back at least 15,000 years,and possibly as far back as 100,000 years, to its original domesticationfrom the grey wolf in East Asia1–4. Dogs evolved through a mutuallybeneficial relationship with humans, sharing living space and foodsources. In recent centuries, humans have selectively bred dogs thatexcel at herding, hunting and obedience, and in this process havecreated breeds rich in behaviours that both mimic human behavioursand support our needs. Dogs have also been bred for desired physicalcharacteristics such as size, skull shape, coat colour and texture5,
producing breeds with closely delineated morphologies. This evolu-tionary experiment has produced diverse domestic species, harbour-ing more morphological diversity than exists within the remainder ofthe family Canidae6.
As a consequence of these stringent breeding programmes andperiodic population bottlenecks (for example, during the WorldWars), many of the ,400 modern dog breeds also show a highprevalence of specific diseases, including cancers, blindness, heartdisease, cataracts, epilepsy, hip dysplasia and deafness7,8. Most ofthese diseases are also commonly seen in the human population, andclinical manifestations in the two species are often similar9. The highprevalence of specific diseases within certain breeds suggests that alimited number of loci underlie each disease, making their geneticdissection potentially more tractable in dogs than in humans10.
Genetic analysis of traits in dogs is enhanced by the closerelationship between humans and canines in modern society.
ARTICLES
1Broad Institute of Harvard and MIT, 320 Charles Street, Cambridge, Massachusetts 02141, USA. 2Center for Human Genetic Research, Massachusetts General Hospital,185 Cambridge Street, Boston, Massachusetts 02114, USA. 3Division of Health Sciences and Technology, Massachusetts Institute of Technology, Cambridge, Massachusetts02139, USA. 4Program in Bioinformatics, Boston University, 44 Cummington Street, Boston, Massachusetts 02215, USA. 5Department of Molecular Biomedical Sciences, Collegeof Veterinary Medicine, North Carolina State University, 4700 Hillsborough Street, Raleigh, North Carolina 27606, USA. 6Department of Ecology and Evolutionary Biology,University of California, Los Angeles, California 90095, USA. 7National Human Genome Research Institute, National Institutes of Health, 50 South Drive, MSC 8000, Building50, Bethesda, Maryland 20892-8000, USA. 8MRC Functional Genetics, University of Oxford, Department of Human Anatomy and Genetics, South Parks Road, Oxford OX1 3QX,UK. 9UMR 6061 Genetique et Developpement, CNRS—Universite de Rennes 1, Faculte de Medecine, 2, Avenue Leon Bernard, 35043 Rennes Cedex, France. 10AgencourtBioscience Corporation, 500 Cummings Center, Suite 2450, Beverly, Massachusetts 01915, USA. 11Children’s Hospital Oakland Research Institute, 5700 Martin Luther King JrWay, Oakland, California 94609, USA. 12The Institute for Genomic Research, Rockville, Maryland 20850, USA. 13Computer Science and Artificial Intelligence Laboratory,Cambridge, Massachusetts 02139, USA. 14The Wellcome Trust Sanger Institute, The Wellcome Trust Genome Campus, Hinxton, Cambridge CB10 1SA, UK. 15WhiteheadInstitute for Biomedical Research, 9 Cambridge Center, Cambridge, Massachusetts 02142, USA.*A list of participants and affiliations appears at the end of the paper.
Vol 438|8 December 2005|doi:10.1038/nature04338
803

© 2005 Nature Publishing Group
Through the efforts of the American Kennel Club (AKC) and similarorganizations worldwide, extensive genealogies are easily accessiblefor most purebred dogs. With the exception of human, dog is themost intensely studied animal in medical practice, with detailedfamily history and pathology data often available8. Using geneticresources developed over the past 15 years11–16, researchers havealready identified mutations in genes underlying ,25 mendeliandiseases17,18. There are also growing efforts to understand the geneticbasis of phenotypic variation such as skeletal morphology10,19.
The dog is similarly important for the comparative analysis ofmammalian genome biology and evolution. The four mammaliangenomes that have been intensely analysed to date (human20–22,chimpanzee23, mouse24 and rat25) represent only one clade(Euarchontoglires) out of the four clades of placental mammals.The dog represents the neighbouring clade, Laurasiatheria26. It thusserves as an outgroup to the Euarchontoglires and increases the totalbranch length of the current tree of fully sequenced mammaliangenomes, thereby providing additional statistical power to search forconserved functional elements in the human genome24,27–33. It alsohelps us to draw inferences about the common ancestor of the twoclades, called the boreoeutherian ancestor, and provides a bridge tothe two remaining clades (Afrotheria and Xenarthra) that should behelpful for anchoring low-coverage genome sequence currently beingproduced from species such as elephant and armadillo28.
Here we report a high-quality draft sequence of the dog genomecovering ,99% of the euchromatic genome. The completeness,nucleotide accuracy, sequence continuity and long-range connec-tivity are extremely high, exceeding the values calculated forthe recent draft sequence of the mouse genome24 and reflectingimproved algorithms, higher-quality data, deeper coverage andintrinsic genome properties. We have also created a tool for theformal assessment of assembly accuracy, and estimate that .99% ofthe draft sequence is correctly assembled.
We also report an initial compendium of SNPs for the dogpopulation, containing .2.5 million SNPs derived primarily frompartial sequence comparison of 11 dog breeds to a referencesequence. We characterized the polymorphism rate of the SNPsacross breeds and the long-range linkage disequilibrium (LD) ofthe SNPs within and across breeds.
We have analysed these data to study genome structure, geneevolution, haplotype structure and phylogenetics of the dog. Our keyfindings include:†The evolutionary forces molding the mammalian genome differamong lineages, with the average transposon insertion rate beinglowest in dog, the deletion rate being highest in mouse and thenucleotide substitution rate being lowest in human.†Comparison between human and dog shows that ,5.3% of thehuman genome contains functional elements that have been underpurifying selection in both lineages. Nearly all of these elements areconfined to regions that have been retained in mouse, indicatingthat they represent a common set of functional elements acrossmammals.† Fifty per cent of the most highly conserved non-coding sequence inthe genome shows striking clustering in ,200 gene-poor regions,most of which contain genes with key roles in establishing ormaintaining cellular identity, such as transcription factors or axonguidance receptors.† Sets of functionally related genes show highly similar patterns ofevolution in the human and dog lineages. This suggests that weshould be careful about interpreting accelerated evolution inhuman relative to mouse as representing human-specific innovations(for example, in genes involved in brain development), becausecomparable acceleration is often seen in the dog lineage.†Analysis across the entire genome of the sequenced boxer andacross 6% of the genome in ten additional breeds shows that linkagedisequilibrium (LD) within breeds extends over distances of severalmegabases, but LD across breeds only extends over tens of kilobases.
These LD patterns reflect two principal bottlenecks in dog history:early domestication and recent breed creation.†Haplotypes within breeds extend over long distances, with ,3–5alleles at each locus. Portions of these haplotypes, as large as100 kilobases (kb), are shared across multiple breeds, although theyare present at widely varying frequencies. The haplotype structuresuggests that genetic risk factors may be shared across breeds.†The current SNP map has sufficient density and an adequatewithin-breed polymorphism rate (,1/900 base pairs (bp) betweenbreeds and ,1/1,500 bp within breeds) to enable systematic associa-tion studies to map genes affecting traits of interest. Genotyping of,10,000 SNPs should suffice for most purposes.†The genome sequence can be used to select a small collection ofrapidly evolving sequences, which allows nearly complete resolutionof the evolutionary tree of nearly all living species of Canidae.
Generating a draft genome sequence
We sequenced the genome of a female boxer using the whole-genome shotgun (WGS) approach22,24 (see Methods and Supplemen-tary Table S1). A total of 31.5 million sequence reads, providing,7.5-fold sequence redundancy, were assembled with an improvedversion of the ARACHNE program34, resulting in an initial assembly(CanFam1.0) used for much of the analysis below, and an updatedassembly (CanFam2.0) containing minor improvements (Table 1and Supplementary Table S2).Genome assembly. The recent genome assembly spans a totaldistance of 2.41 Gb, consisting of 2.38 Gb of nucleotide sequencewith the remaining 1% in captured gaps. The assembly has extremelyhigh continuity. The N50 contig size is 180 kb (that is, half of all basesreside in a contiguous sequence of 180 kb or more) and the N50supercontig size is 45.0 Mb (Table 1). In particular, this means thatmost genes should contain no sequence gaps and that most caninechromosomes (mean size 61 Mb) have nearly all of their sequenceordered and oriented within one or two supercontigs (Supplemen-tary Table S2). Notably, the sequence contigs are,50-fold larger thanthe earlier survey sequence of the standard poodle16.
The assembly was anchored to the canine chromosomes using datafrom both radiation hybrid and cytogenetic maps11,13,14. Roughly97% of the assembled sequence was ordered and oriented on thechromosomes, showing an excellent agreement with the two maps.There were only three discrepancies, which were resolved by obtain-ing additional fluorescence in situ hybridization (FISH) data fromthe sequenced boxer. The 3% of the assembly that could not beanchored consists largely of highly repetitive sequence, includingeight supercontigs of 0.5–1.0 Mb composed almost entirely ofsatellite sequence.
The nucleotide accuracy and genome coverage of the assembly ishigh (Supplementary Table S3). Of the bases in the assembly,98% have quality scores exceeding 40, corresponding to an errorrate of less than 1024 and comparable to the standard for thefinished human sequence35. When we directly compared the assem-bly to 760 kb of finished sequence (in regions where the boxer is
Table 1 | Assembly statistics for CanFam1.0 and 2.0
CanFam1.0 CanFam2.0
N50 contig size 123 kb 180 kbN50 supercontig size 41.2 Mb 45.0 MbAssembly size (total bases) 2.360 Gb 2.385 GbNumber of anchored supercontigs 86 87Percentage of genome in anchored supercontigs 96 97Sequence in anchored bases 2.290 Gb 2.309 GbPercentage of assembly in gaps 0.9 0.8Estimated genome size* 2.411 Gb 2.445 GbPercentage of assembly in ‘certified regions’,
without assembly inconsistency99.3 99.6
*Includes anchored bases, spanned gaps (21 Mb in CanFam1.0, 18 Mb in CanFam2.0) andcentromeric sequence (3 Mb for each chromosome).
ARTICLES NATURE|Vol 438|8 December 2005
804

© 2005 Nature Publishing Group
homozygous, to eliminate differences attributable to polymorphisms;see below), we found that the draft genome sequence covers 99.8% ofthe finished sequence and that bases with quality scores exceeding40 have an empirical error rate of 2 £ 1025 (Supplementary Table S3).Explaining the high sequence continuity.The dog genome assemblyhas superior sequence continuity (180 kb) than the WGS assembly ofthe mouse genome (25 kb) obtained several years ago24. At least threefactors contribute to the higher connectivity of the dog assembly (seeSupplementary Information). First, we used a new version ofARACHNE with improved algorithms. Assembling the dog genomewith the previous software version decreased N50 contig size from180 kb to 61 kb, and assembling the mouse genome with the newversion increased N50 contig size from 25 kb to 35 kb. Second, theamount of recently duplicated sequence is roughly twofold lower indog than mouse (Supplementary Table S4); this improves contiguitybecause sequence gaps in both organisms tend to occur in recentlyduplicated sequence. Third, the dog sequence data has both higherredundancy (7.5-fold versus 6.5-fold) and higher quality (in terms ofread length, pairing rate and tight distribution of insert sizes) com-pared with mouse. The contig size for the dog genome drops by about32% when the data redundancy is decreased from 7.5-fold to 6.5-fold. A countervailing influence is that the dog genome containspolymorphism, whereas the laboratory mouse is completely inbred.Assembly certification. Although ‘quality scores’ have been devel-oped to indicate the nucleotide accuracy of a draft genomesequence36, no analogous measures have been developed to reflectthe long-range assembly accuracy. We therefore sought to developsuch a measure on the basis of two types of internal inconsistencies(see Supplementary Information). The first is haplotype incon-sistency, involving clear evidence of three or more distinct haplotypeswithin an assembled region from a single diploid individual. Thesecond is linkage inconsistency, involving a cluster of reads for whichthe placement of the paired-end reads is illogical. This includescases in which: (1) one end cannot be mapped to the region, (2) thelinkage relationships are inconsistent with the sequence withincontigs, or (3) distance constraints imply overlap between non-overlapping sequence contigs. The linkage inconsistency tests aremost powerful when read pairs are derived from clone librarieswith tight constraints on insert size. A region of assembly isdefined as ‘certified’ if it is free of inconsistencies, and is otherwise‘questionable’.
Approximately 99.6% of the assembly resides in certified regions,with the N50 size of certified regions being ,12 Mb or about one-fifth of a chromosome. The remaining questionable regions aretypically small (most are less than 40 kb), although there are ahandful of regions of several hundred kilobases (SupplementaryFig. S1 and Supplementary Tables S5, S6). The questionable regionstypically contain many inconsistencies, probably reflecting mis-assembly or overcollapse owing to segmental duplication. Chromo-somes 2, 11 and 16 have 1.0–2.0% of their sequence in questionableregions. The certified and questionable regions are annotated inthe public release of the dog genome assembly. With the conceptof assembly certification, the scientific community can haveappropriate levels of confidence in the draft genome sequence.
Genome landscape and evolution
Our understanding of the evolutionary processes that shapemammalian genomes has greatly benefited from the comparativeanalysis of sequenced primate21,23 and rodent24,25 genomes. However,the rodent genome is highly derived relative to that of the commonancestor of the eutherian mammals. As the first extensive sequencefrom an outgroup to the clade that includes primates and rodents, thedog genome offers a fresh perspective on mammalian genome evol-ution. Accordingly, we examined the rates and correlations of large-scale rearrangement, transposon insertion, deletion and nucleotidedivergence across three major mammalian orders (primates, rodentsand carnivores).
Conserved synteny and large-scale rearrangements. We createdmulti-species synteny maps from anchors of unique, unambiguouslyaligned sequences (see Supplementary Information), showingregions of conserved synteny among dog, human, mouse and ratgenomes. Approximately 94% of the dog genome lies in regions ofconserved synteny with the three other species (SupplementaryFigs S2–S4 and Supplementary Table S7).
Given a pair of genomes, we refer to a ‘syntenic segment’ as aregion that runs continuously without alterations of order andorientation, and a ‘syntenic block’ as a region that is contiguous intwo genomes but may have undergone internal rearrangements.Syntenic breakpoints between blocks reflect primarily interchromo-somal exchanges, and breakpoints between syntenic segments reflectintrachromosomal rearrangements. In the analysis below, we focuson syntenic segments of at least 500 kb.
We identified a total of 391 syntenic breakpoints across dog,human, mouse and rat genomes (Fig. 1 and SupplementaryFigs S2, S5). With data for multiple species, it is possible to assignevents to specific lineages (Fig. 1 and Supplementary Table S8). Wecounted the total number of breakpoints along the human, dog,mouse and rat lineages, with the values for each rodent lineagereflecting all breakpoints since the common ancestor with human(Fig. 1). The total number of breakpoints in the human lineage issubstantially smaller than in the dog, mouse or rat lineages (83 versus100, 161 or 176, respectively). However, there are more intra-chromosomal breakpoints in the human lineage than in dog (52versus 33).
Although the overall level of genomic rearrangement has beenmuch higher in rodent than in human, comparison with dog showsthat there are regions where the opposite is true. In particular, of themany intrachromosomal rearrangements previously observedbetween human chromosome 17 and the orthologous mouse
Figure 1 | Conserved synteny among the human, dog, mouse and ratgenomes. a, Diagram of syntenic blocks (.500 kb) along dogchromosomes (Chr) 15, 16 and 31, with colours indicating the chromosomecontaining the syntenic region in other species. Synteny breakpoints wereassigned to one of five lineages: dog (D), human (H), mouse (M), rat (R) orthe common rodent ancestor (Ro). b, Lineage-specific intrachromosomaland interchromosomal breaks displayed on phylogenetic trees.Intrachromosomal breaks are seen more frequently in the human lineagethan in mouse and rat, whereas interchromosomal breaks are somewhatmore common in dog and considerably more common in rodents than inhumans.
NATURE|Vol 438|8 December 2005 ARTICLES
805

© 2005 Nature Publishing Group
sequence24, most have occurred in the human lineage (see Supple-mentary Information). Human chromosome 17 is rich in segmentalduplications and gene families21, which may contribute to itsgenomic fragility37,38.Genomic insertion and deletion. The euchromatic genome of thedog is ,150 Mb smaller than in mouse, and ,500 Mb smaller thanin human. The smaller total size is reflected at the local level, with100-kb blocks of conserved synteny in dog corresponding to regionsfor which the median size is ,3% larger in mouse and ,15% largerin human.
To understand the balance of forces that determine genome size,we studied the alignments of the human, mouse and dog genomes(Fig. 2). In particular, we identified the lineage-specific interspersedrepeats within each genome, which consist of particular families ofshort interspersed elements (SINEs), long interspersed elements(LINEs) and other transposable elements that are readily recognizedby sequence analysis (Supplementary Tables S9, S10). The remainingsequence was annotated as ‘ancestral’, consisting of both ancestralunique sequence and ancestral repeat sequence; these two categorieswere combined because the power to recognize ancient transposon-derived sequences degrades with repeat age, particularly in therapidly diverging mouse lineage24.
This comparative analysis indicates that different forces accountfor the smaller genome sizes in dog and mouse relative to human.The smaller size of the dog genome is primarily due to the presence ofsubstantially less lineage-specific repeat sequence in dog (334 Mb)than in human (609 Mb) or mouse (954 Mb). This reflects a loweractivity of endogenous retroviral and DNA transposons (,26,000extant copies in dog versus ,183,000 in human), as well as the factthat the SINE element in dog is smaller than in human (although ofsimilar length to that in mouse). As a consequence, the totalproportion of repetitive elements (both lineage-specific and ances-tral) recognizable in the genome is lower for dog (34%) than formouse (40%) or human (46%). In contrast, the smaller size of themouse genome is primarily due to a higher deletion rate. Specifically,the amount of extant ‘ancestral sequence’ is much lower in mouse(1,474 Mb) than in human (2,216 Mb) or dog (1,997 Mb). Assumingan ancestral genome size of 2.8 Gb (ref. 24) and also that deletionsoccur continuously, we suggest that the rate of genomic deletion inthe rodent lineage has been approximately 2.5-fold higher than in the
dog and human lineages (see Supplementary Information). As aconsequence, the human genome shares ,650 Mb more ancestralsequence with dog than with mouse, despite our more recentcommon ancestor with the latter.Active SINE family. Despite its relatively low proportion of trans-posable element-derived sequence, the dog genome contains a highlyactive carnivore-specific SINE family (defined as SINEC_Cf; RepBaserelease 7.11)16. The element is so active that many insertion sites arestill segregating polymorphisms that have not yet reached fixation.Of ,87,000 young SINEC_Cf elements (defined by low divergencefrom the consensus sequence), nearly 8% are heterozygous within thedraft genome sequence of the boxer. Moreover, comparison of theboxer and standard poodle genome sequences reveals more than10,000 insertion sites that are bimorphic, with thousands morecertain to be segregating in the dog population16,39. In contrast, thenumber of polymorphic SINE insertions in the human genome isestimated to be fewer than 1,000 (ref. 40).
The biological effect of these segregating SINE insertions isunknown. SINE insertions can be mutagenic through direct disrup-tion of coding regions or through indirect effects on regulation andprocessing of messenger RNAs39. Such SINE insertions have alreadybeen shown to be responsible for two diseases in dog: narcolepsyand centronuclear myopathy41,42. It is conceivable that the geneticvariation resulting from these segregating SINE elements has pro-vided important raw material for the selective breeding programmesthat have produced the wide phenotypic variations among moderndog breeds16,43.Sequence composition. The human and mouse genomes differmarkedly in sequence composition, with the human genome havingslightly lower average GþC content (41% versus 42% in mouse) butmuch greater variation across the genome. The dog genome closelyresembles the human genome in its distribution of GþC content(Fig. 3a; Spearman’s rho ¼ 0.85 for dog–human and 0.76 for dog–mouse comparisons), even if we consider only nucleotides that can bealigned across all three species (Supplementary Fig. S6). The widerdistribution of GþC content in human and dog is thus likely toreflect the boreoeutherian ancestor44,45, with the more homogeneouscomposition in rodents having arisen primarily through lineage-specific changes in substitution patterns46,47 rather than deletion ofsequences with high GþC content.Rate of nucleotide divergence. We estimated the mean nucleotidedivergence rates in 1-Mb windows along the dog, human and mouselineages on the basis of alignments of all ancestral repeats, using theconsensus sequence for the repeats as a surrogate outgroup (Fig. 3b;see also Supplementary Information).
The dog lineage has diverged more rapidly than the humanlineage (median relative divergence rate of 1.18, longer branch lengthin 95% of windows), but at only half the rate of the mouse lineage(median relative rate of 0.48, shorter branch length in 100% ofwindows). The absolute divergence rates are somewhat sensitive tothe evolutionary model used and the filtering of alignment artefacts(data not shown), but the relative rates appear to be robust and areconsistent with estimates from smaller sequence samples withmultiple outgroups28,48,49. The lineage-specific divergence rates(human , dog , mouse) are probably explained by differencesin metabolic rates50,51 or generation times52,53, but the relativecontributions of these factors remain unclear49.Correlation in nucleotide divergence. As seen in other mammaliangenomes23–25, the average nucleotide divergence rate across 1-Mbwindows varies significantly across the dog genome (coefficient ofvariation 0.11, compared with 0.024 expected under a uniformdistribution). This regional variation shows significant correlationin orthologous windows across the dog, human and mouse genomes,but the strength of the correlation seems to decrease with totalbranch length (pair-wise correlation for orthologous 1-Mb windows:Spearman’s rho ¼ 0.49 for dog–human and 0.24 for dog–mousecomparisons). Lineage-specific variation in the regional divergence
Figure 2 | Venn diagram showing the total lengths of aligned and uniquesequences in the euchromatic portions of the dog, human and mousegenomes. Lengths shown in Mb, as inferred from genome-wide BLASTZalignments (see Methods and Supplementary information). Overlappingpartitions represent orthologous ancestral sequences. Each lineage-specificpartition is further split into the total length of sequence classified as eitherlineage-specific interspersed repeats (red) or ancestral sequence (black). Thelatter is assumed to primarily represent ancestral sequences deleted in thetwo other species.
ARTICLES NATURE|Vol 438|8 December 2005
806
© 2005 Nature Publishing Group
rates may be coupled with changes in factors such as sequencecomposition or chromosomal position23,54. Consistent with this,the ratios of lineage-specific divergence rates in orthologous win-dows are positively correlated with the ratios of current GþC contentin the same windows (Spearman’s rho ¼ 0.16 for dog–human, 0.24for dog–mouse).Male mutation bias. Comparison of autosomal and X chromosomesubstitution rates can be used to estimate the relative mutation ratesin the male and female germ lines (a), because the X chromosome ispresent in females twice as often as in males. Using the lineage-specific rates from ancestral repeats, we estimate a as 4.8 for thelineage leading to human, and 2.8 for the lineages leading to bothmouse and dog. These values fall between recent estimates frommurids24,25 and from hominids23, and suggest that male mutationbias may have increased in the lineage leading to humans.Mutational hotspots and chromosomal fission. Genome compari-sons of human with both chicken55 and chimpanzee23 have previouslyrevealed that sequences close to a telomere tend to have increaseddivergence rates and G þ C content relative to interstitial sequences.It has been unclear whether these increases are inherent character-istics of the subtelomeric sequence itself or derived characteristicscausally connected with its chromosomal position. We find a similarincrease in both divergence (median increase 15%, P , 1025; Mann-Whitney U-test) and GþC content (median increase 9%, P , 1029)for subtelomeric regions along the dog lineage, with a sharp increasetowards the telomeres (Supplementary Fig. S7).
This phenomenon is manifested at other synteny breaks, not onlythose at telomeres. We also observed a significant increase indivergence and GþC content in interstitial regions that are sites ofsyntenic breakpoints54,56 (Supplementary Fig. S7). These propertiestherefore seem correlated with the susceptibility of regions tochromosomal breakage.
Proportion of genome under purifying selection
One of the striking discoveries to emerge from the comparison of thehuman and mouse genomes21,24 was the inference that ,5.2% of thehuman genome shows greater-than-expected evolutionary conserva-tion (compared with the background rate seen in ancestral repeatelements, which are presumed to be nonfunctional). This proportiongreatly exceeds the 1–2% that can be explained by protein-codingregions alone. The extent and function of the large fraction of non-coding conserved sequence remain unclear57, but this sequence islikely to include regulatory elements, structural elements and RNAgenes.Low turnover of conserved elements. We repeated the analysis ofconserved elements using the human and dog genomes. Briefly, the
analysis involves calculating a conservation score SHD, normalized bythe regional divergence rate, for every 50-bp window in the humangenome that can be aligned to dog. The distribution of conservationscores for all genomic sequences is compared to the distribution inancestral repeat sequences (which are presumed to diverge at thelocal neutral rate), showing a clear excess of sequences with highconservation scores. By subtracting a scaled neutral distribution fromthe total distribution, one can estimate the distribution of conserva-tion scores for sequences under purifying selection. Moreover, for agiven sequence with conservation score SHD, one can also assign aprobability P selection(SHD) that the sequence is under purifyingselection (see ref. 24 and Supplementary Information).
The human–dog genome comparison indicates that ,5.3% of thehuman genome is under purifying selection (Fig. 4a), which isequivalent to the proportion estimated from human–rodent analysis.The obvious question is whether the bases conserved between humanand dog coincide with the bases conserved between humans androdents25,58. Because the conservation scores do not unambiguouslyassign sequences as either selected or neutral (but instead only assignprobability scores for selection), we cannot directly compare theconserved bases. We therefore devised the following alternativeapproach.
We repeated the human–dog analysis, dividing the 1462 Mb oforthologous sequence between human and dog into those regionswith (812 Mb) or without (650 Mb) orthologous sequence in mouse(Fig. 2). The first set shows a clear excess of conservation relativeto background, corresponding to ,5.2% of the human genome(Fig. 4b). In contrast, the second set shows little or no excessconservation, corresponding to at most 0.1% of the human genome(Fig. 4c). This implies that hardly any of the functional elementsconserved between human and dog have been deleted in the mouselineage (see also Supplementary Information).
The results strongly suggest that there is a common set offunctional elements across all three mammalian species, correspond-ing to ,5% of the human genome (,150 Mb). These functionalelements reside largely within the 812 Mb of ancestral sequencecommon to human, mouse and dog. If we eliminate ancestral repeatelements within this shared sequence as largely non-functional, mostfunctional elements can be localized to 634 Mb, and constituteapproximately 24% of this sequence.
It should be noted that the estimate of ,5% pertains to conservedelements across distantly related mammals. It is possible that thereare additional weakly constrained or recently evolved elementswithin narrow clades (for example, primates) that can only bedetected by genomic sequencing of more closely related species29.Clustering of highly conserved non-coding elements. We next
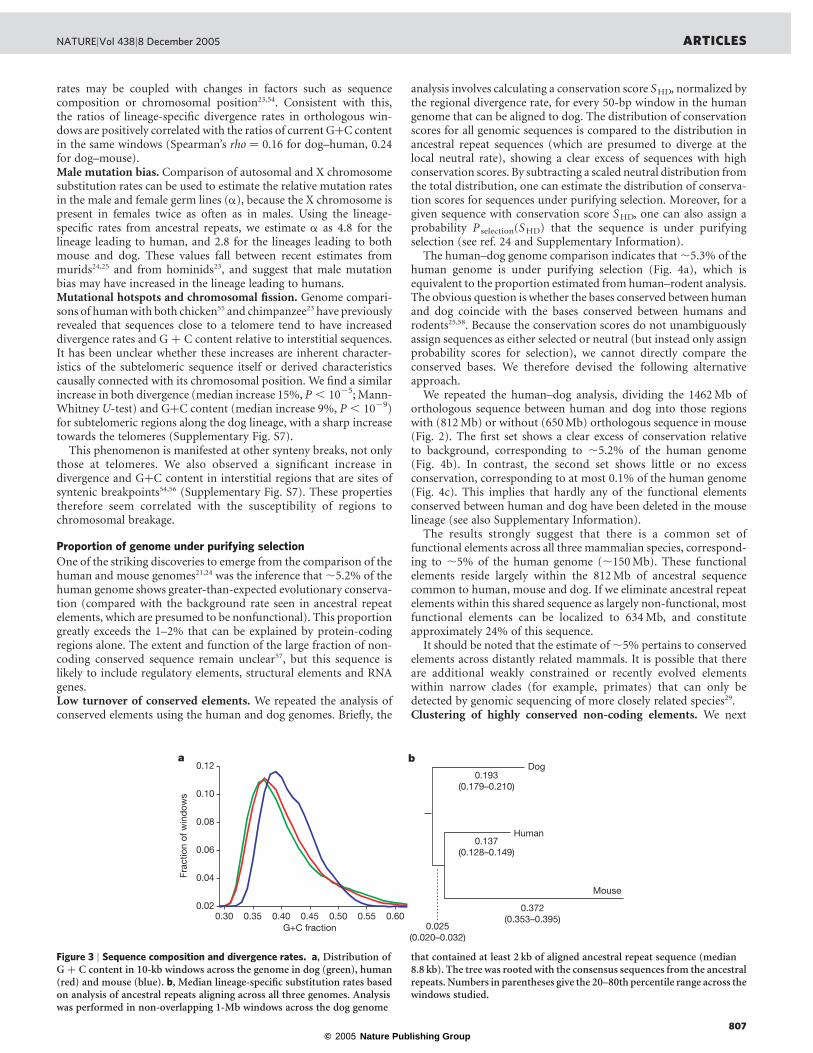
Figure 3 | Sequence composition and divergence rates. a, Distribution ofG þ C content in 10-kb windows across the genome in dog (green), human(red) and mouse (blue). b, Median lineage-specific substitution rates basedon analysis of ancestral repeats aligning across all three genomes. Analysiswas performed in non-overlapping 1-Mb windows across the dog genome
that contained at least 2 kb of aligned ancestral repeat sequence (median8.8 kb). The tree was rooted with the consensus sequences from the ancestralrepeats. Numbers in parentheses give the 20–80th percentile range across thewindows studied.
NATURE|Vol 438|8 December 2005 ARTICLES
807

© 2005 Nature Publishing Group
explored the distribution of conserved non-coding elements (CNEs)across mammalian genomes. For this purpose, we calculated aconservation score SHMD based on simultaneous conservationacross all three species (see Methods). We defined highly conservednon-coding elements (HCNEs) to be 50-bp windows that do notoverlap coding regions and for which P selection(SHMD), theprobability of being under purifying selection given the conserva-tion score, is at least 95%. We identified ,140,000 such windows(6.5 Mb total sequence), comprising ,0.2% of the human genomeand representing the most conserved ,5% of all mammalianCNEs.
The density of HCNEs shows striking peaks when plotted in 1-Mbwindows across the genome (Fig. 4d and Supplementary Figs S8 andS9), with 50% lying in 204 regions that span less than 14% of thehuman genome (Supplementary Table S11). These regions aregenerally gene-poor, together containing only ,6% of all protein-coding sequence.
The genes contained within these gene-poor regions are ofparticular interest. At least 182 of the 204 regions contain geneswith key roles in establishing or maintaining cellular ‘state’. At least156 of the regions contain one or, in a few cases, several transcriptionfactors involved in differentiation and development59. Another 26regions contain a gene important for neuronal specialization andgrowth, including several axon guidance receptors. The proportionof developmental regulators is far greater than expected by chance(P , 10231; see Supplementary Information).
We then tested whether the HCNEs within these regions tend tocluster around the genes encoding regulators of development.Analysis of the density of HCNEs in the intronic and intergenicsequences flanking every gene in the 204 regions revealed that the197 genes encoding developmental regulators show an average of,10-fold enrichment for HCNEs relative to the full set of 1,285 genes
in the regions (Fig. 4e and Supplementary Fig. S10). The enrichmentsometimes extends into the immediately flanking genes.
We note that the 204 regions include nearly all of the recentlyidentified clusters of conserved elements between distantly relatedvertebrates such as chicken and pufferfish55,59–62. For example, theyoverlap 56 of the 57 large intervals containing conserved non-codingsequence identified between human and chicken55. The mammaliananalysis, however, detects vastly more CNEs (.100-fold moresequence than with pufferfish59 and 2–3-fold more than withchicken) and identifies many more clusters. The limited sensitivityof these more distant vertebrate comparisons may reflect the diffi-culty of aligning short orthologous elements across such largeevolutionary distances or the emergence of mammal-specific regu-latory elements. In any case, mammalian comparative analysis maybe a more powerful tool for elucidating the regulatory controls acrossthese important regions.
Although the function of conserved non-coding elements isunknown, on the basis of recent studies59,63–66 it seems likely thatmany regulate gene expression. If so, the above results suggest that,50% of all mammalian HCNEs may be devoted to regulating ,1%of all genes. In fact, the distribution may be even more skewed, asthere are additional genomic regions with only slightly lower HCNEdensity than the 204 studied above (Supplementary Fig. S8). All ofthese regions clearly merit intensive investigation to assess indicatorsof regulatory function. We speculate that these regions may harbourcharacteristic chromatin structure and modifications that are poten-tially involved in the establishment or maintenance of cellular state.
Genes
Accurate identification of the protein-coding genes in mammaliangenomes is essential for understanding the human genome, includ-ing its cellular components, regulatory controls and evolutionary
Figure 4 | Conservation of orthologous sequence between human anddog. a, Histogram of conservation scores, S, for all 50-bp windows acrossthe human genome with at least 20 bases of orthologous sequence aligningto the dog genome, for all aligning sequences (red) and for ancestral repeatsequence only (blue). b, Conservation scores for the subset of windows thatalso have at least 20 bases of orthologous sequence aligning to the mousegenome. c, Conservation scores of the complementary subset of windowslacking such orthologous sequence in mouse. d, Density of 50-bp windowsnot overlapping known coding regions, for which Pselection(S) . 95%, basedon comparisons between human and dog (HD), human and mouse (HM),or between human, mouse and dog (HMD), and the density of known genes,all in 1-Mb sliding windows across human chromosome 3. e, Enrichment of
HCNEs in the immediate neighbourhood of genes encoding developmentalregulators in the 204 highly conserved regions. The histogram shows themedian number of HCNE bases in the intronic and surrounding intergenicsequence, for the 197 known or putative development regulators (indicatedby top of red bar) and for all of the 1,285 genes (blue bar). The histogram iscentred at the 5 0 -end of the gene (marked 0) and each bin corresponds to halfof the normalized distance to the flanking consecutive upstream genes(marked 21, 22 and 23) or consecutive downstream genes (1, 2 and 3) asindicated. The sequences surrounding the developmental genes are typicallylonger, have more HCNE sequence and have a higher density of HNCEsequence than other genes in the regions (see Supplementary Information).
ARTICLES NATURE|Vol 438|8 December 2005
808
© 2005 Nature Publishing Group
constraints. The number of protein-coding genes in human has beena topic of considerable debate, with estimates steadily falling from,100,000 to 20,000–25,000 over the past decade21,22,67–70. We ana-lysed the dog genome in order to refine the human gene catalogueand to assess the evolutionary forces shaping mammals. (In theGenes section, ‘gene’ refers only to a protein-coding gene.)Gene predictions in dog and human. We generated gene predictionsfor the dog genome using an evidence-based method (see Sup-plementary Information). The resulting collection contains 19,300dog gene predictions, with nearly all being clear homologues ofknown human genes.
The dog gene count is substantially lower than the ,22,000-genemodels in the current human gene catalogue (EnsEMBL build 26).For many predicted human genes, we find no convincing evidence ofa corresponding dog gene. Much of the excess in the human genecount is attributable to spurious gene predictions in the humangenome (M. Clamp, personal communication).Gene duplications. Gene duplication is thought to contributesubstantially to functional innovation69,71. We identified 216 geneduplications that are specific to the dog lineage and 574 that arespecific to the human lineage, using the synonymous substitutionrate K S as a distance metric and taking care to discard likelypseudogenes. (The CanFam 2.0 assembly contains approximately24 additional gene duplications, mostly olfactory receptors.) Humangenes are thus 2.7-fold more likely to have undergone duplicationthan are dog genes over the same time period. This may reflectincreased repeat-mediated segmental duplication in the humanlineage72.
Although gene duplication has been less frequent in dog thanhuman, the affected gene classes are very similar. Prominent amongthe lineage-specific duplicated genes are genes that function inadaptive immunity, innate immunity, chemosensation and repro-duction, as has been seen for other mammalian genomes24,25,69,71.Reproductive competition within the species and competitionagainst parasites have thus been major driving forces in gene familyexpansion.
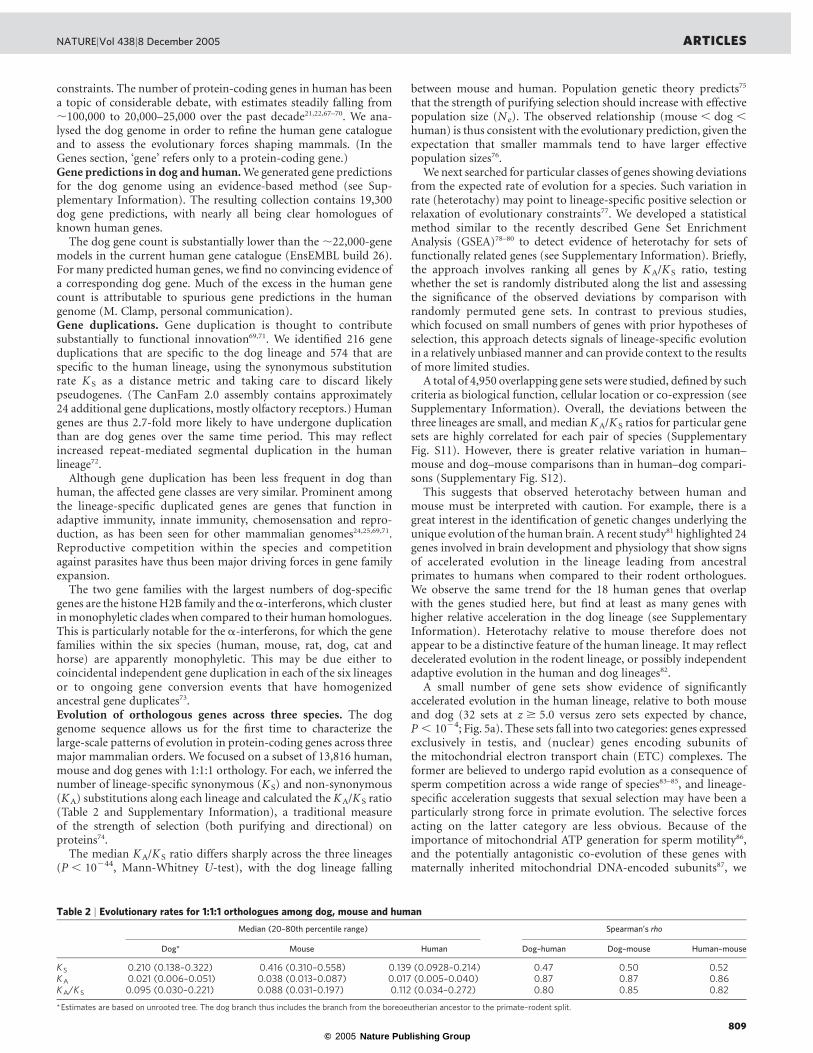
The two gene families with the largest numbers of dog-specificgenes are the histone H2B family and the a-interferons, which clusterin monophyletic clades when compared to their human homologues.This is particularly notable for the a-interferons, for which the genefamilies within the six species (human, mouse, rat, dog, cat andhorse) are apparently monophyletic. This may be due either tocoincidental independent gene duplication in each of the six lineagesor to ongoing gene conversion events that have homogenizedancestral gene duplicates73.Evolution of orthologous genes across three species. The doggenome sequence allows us for the first time to characterize thelarge-scale patterns of evolution in protein-coding genes across threemajor mammalian orders. We focused on a subset of 13,816 human,mouse and dog genes with 1:1:1 orthology. For each, we inferred thenumber of lineage-specific synonymous (KS) and non-synonymous(KA) substitutions along each lineage and calculated the KA/KS ratio(Table 2 and Supplementary Information), a traditional measureof the strength of selection (both purifying and directional) onproteins74.
The median KA/KS ratio differs sharply across the three lineages(P , 10244, Mann-Whitney U-test), with the dog lineage falling
between mouse and human. Population genetic theory predicts75
that the strength of purifying selection should increase with effectivepopulation size (Ne). The observed relationship (mouse , dog ,human) is thus consistent with the evolutionary prediction, given theexpectation that smaller mammals tend to have larger effectivepopulation sizes76.
We next searched for particular classes of genes showing deviationsfrom the expected rate of evolution for a species. Such variation inrate (heterotachy) may point to lineage-specific positive selection orrelaxation of evolutionary constraints77. We developed a statisticalmethod similar to the recently described Gene Set EnrichmentAnalysis (GSEA)78–80 to detect evidence of heterotachy for sets offunctionally related genes (see Supplementary Information). Briefly,the approach involves ranking all genes by KA/KS ratio, testingwhether the set is randomly distributed along the list and assessingthe significance of the observed deviations by comparison withrandomly permuted gene sets. In contrast to previous studies,which focused on small numbers of genes with prior hypotheses ofselection, this approach detects signals of lineage-specific evolutionin a relatively unbiased manner and can provide context to the resultsof more limited studies.
A total of 4,950 overlapping gene sets were studied, defined by suchcriteria as biological function, cellular location or co-expression (seeSupplementary Information). Overall, the deviations between thethree lineages are small, and median KA/KS ratios for particular genesets are highly correlated for each pair of species (SupplementaryFig. S11). However, there is greater relative variation in human–mouse and dog–mouse comparisons than in human–dog compari-sons (Supplementary Fig. S12).
This suggests that observed heterotachy between human andmouse must be interpreted with caution. For example, there is agreat interest in the identification of genetic changes underlying theunique evolution of the human brain. A recent study81 highlighted 24genes involved in brain development and physiology that show signsof accelerated evolution in the lineage leading from ancestralprimates to humans when compared to their rodent orthologues.We observe the same trend for the 18 human genes that overlapwith the genes studied here, but find at least as many genes withhigher relative acceleration in the dog lineage (see SupplementaryInformation). Heterotachy relative to mouse therefore does notappear to be a distinctive feature of the human lineage. It may reflectdecelerated evolution in the rodent lineage, or possibly independentadaptive evolution in the human and dog lineages82.
A small number of gene sets show evidence of significantlyaccelerated evolution in the human lineage, relative to both mouseand dog (32 sets at z $ 5.0 versus zero sets expected by chance,P , 1024; Fig. 5a). These sets fall into two categories: genes expressedexclusively in testis, and (nuclear) genes encoding subunits ofthe mitochondrial electron transport chain (ETC) complexes. Theformer are believed to undergo rapid evolution as a consequence ofsperm competition across a wide range of species83–85, and lineage-specific acceleration suggests that sexual selection may have been aparticularly strong force in primate evolution. The selective forcesacting on the latter category are less obvious. Because of theimportance of mitochondrial ATP generation for sperm motility86,and the potentially antagonistic co-evolution of these genes withmaternally inherited mitochondrial DNA-encoded subunits87, we
Table 2 | Evolutionary rates for 1:1:1 orthologues among dog, mouse and human
Median (20–80th percentile range) Spearman’s rho
Dog* Mouse Human Dog–human Dog–mouse Human–mouse
KS 0.210 (0.138–0.322) 0.416 (0.310–0.558) 0.139 (0.0928–0.214) 0.47 0.50 0.52KA 0.021 (0.006–0.051) 0.038 (0.013–0.087) 0.017 (0.005–0.040) 0.87 0.87 0.86KA/KS 0.095 (0.030–0.221) 0.088 (0.031–0.197) 0.112 (0.034–0.272) 0.80 0.85 0.82
*Estimates are based on unrooted tree. The dog branch thus includes the branch from the boreoeutherian ancestor to the primate–rodent split.
NATURE|Vol 438|8 December 2005 ARTICLES
809

© 2005 Nature Publishing Group
propose that sexual selection may also be the primary force behindthe rapid evolution of the primate ETC genes. Given the ubiquitousrole of mitochondrial function, however, such sexual selection mayhave led to profound secondary effects on physiology88.
We found no gene sets with comparably strong evidence for dog-specific accelerated evolution. There is, however, a small excess of setswith moderately high acceleration scores (19 sets at z $ 3.0 versus 5sets expected by chance, P , 0.02; Fig. 5b). These sets, which areprimarily related to metabolism, may contain promising candidatesfor follow-up studies of molecular adaptation in carnivores.
Polymorphism and haplotype structure in the domestic dog
The modern dog has a distinct population structure with hundredsof genetically isolated breeds, widely varying disease incidence anddistinctive morphological and behavioural traits89,90. Unlocking thefull potential of the dog genome for genetic analysis requires a denseSNP map and an understanding of the structure of genetic variationboth within and among breeds.Generating a SNPmap. We generated a SNP map of the dog genomecontaining .2.5 million distinct SNPs mapped to the draft genomesequence, corresponding to an average density of approximatelyone SNP per kb (Table 3). The SNPs were discovered in threecomplementary ways (see Supplementary Information). (1) Weidentified SNPs within the sequenced boxer genome (set 1;,770,000 SNPs) by searching for sites at which alternative allelesare supported by at least two independent reads each. We tested asubset (n ¼ 40 SNPs) by genotyping and confirmed all as hetero-zygous sites. (2) We compared the 1.5£ sequence from the standardpoodle16 with the draft genome sequence from the boxer (set 2;,1,460,000 SNPs). (3) We generated shotgun sequence data fromnine diverse dog breeds (,100,000 reads each, 0.02£ coverage), fourgrey wolves and one coyote (,22,000 reads each, 0.004£ coverage)and compared it to the boxer (set 3; ,440,000 SNPs). We tested asubset (n ¼ 1,283 SNPs) by genotyping and confirmed 96% as truepolymorphisms.
The SNP rate between the boxer and any of the different breeds isone SNP per ,900 bp, with little variation among breeds (Table 3).The only outlier (,1/790 bp) is the Alaskan malamute, which is theonly breed studied that belongs to the Asian breed cluster91. The greywolf (,1/580 bp) and coyote (,1/420 bp) show greater variationwhen compared with the boxer, supporting previous evidence of abottleneck during dog domestication, whereas that the SNP rate islower in the grey wolf than in the coyote reflects the closer relation-ship of the grey wolf to the domestic dog1–3,92 (see section ‘Resolvingcanid phylogeny’).
The observed SNP rate within the sequenced boxer assembly is,1/3,000 bp. This underestimates the true heterozygosity owing tothe conservative criterion used for identifying SNPs within the boxerassembly (requiring two reads containing each allele); correctingfor this leads to an estimate of ,1/1,600 bp (see SupplementaryInformation). This low rate reflects reduced polymorphism within abreed, compared with the greater variation of ,1/900 bp betweenbreeds.
To assess the utility of the SNPs for dog genetics, we genotyped asubset from set 3a (n ¼ 1,283) in 20 dogs from each of ten breeds(Supplementary Table S16). Within a typical breed, ,73% of theSNPs were polymorphic. The polymorphic SNPs have minor allelefrequencies that are approximately evenly distributed between 5%and 50% (allele frequencies less than 5% are not reliable with only 40chromosomes sampled). In addition, the SNPs from sets 2 and 3 havea roughly uniform distribution across the genome (Fig. 6a, see belowconcerning set 1). The SNP map thus has high density, evendistribution and high cross-breed polymorphism, indicating that itshould be valuable for genetic studies.Expectations for linkage disequilibrium and haplotype structure.Modern dog breeds are the product of at least two populationbottlenecks, the first associated with domestication from wolves(,7,000–50,000 generations ago) and the second resulting fromintensive selection to create the breed (,50–100 generations ago).This population history should leave distinctive signatures on thepatterns of genetic variation both within and across breeds. We mightexpect aspects of both the long-range LD seen in inbred mouse strains,with strain-specific haplotypes extending over multiple megabases,and the short-range LD seen in humans, with ancestral haplo-type blocks typically extending over tens of kilobases. Specifically,
Figure 5 | Gene sets showing accelerated evolution along the human anddog lineages. a, Distribution of acceleration scores along the human lineagerelative to both mouse and dog, observed for 4,950 gene sets (red). Theexpected distribution based on 10,000 randomized trials is shown in blue.The dotted line shows the acceleration score for which the probability ofobserving even a single set by random chance (out of the 4,950 sets tested) isless than 1%. In fact, 32 sets show acceleration scores on the human lineageexceeding this threshold. b, The observed (red) and expected (blue)distribution of acceleration scores for the dog lineage, relative to bothhuman and mouse.
Table 3 | SNPs discovered in dogs, wolves and coyotes compared to theboxer assembly
Set number Breed or species Number ofSNPs
SNP rate(one per x bases)
1 Boxer versus boxer 768,948 3,004 (observed)1,637 (corrected)
2 Boxer versus poodle 1,455,007 8943a Boxer versus breeds*
German shepherd 45,271 900Rottweiler 44,097 917Bedlington terrier 44,168 913Beagle 42,572 903Labrador retriever 40,730 926English shepherd 40,935 907Italian greyhound 39,390 954Alaskan malamute 45,103 787Portuguese water dog 45,457 896
Total distinct SNPs 373,382 9003b Boxer versus Canids†
China grey wolf 12,182 580Alaska grey wolf 13,888 572India grey wolf 14,510 573Spanish grey wolf 10,349 587California coyote 20,270 417
Total distinct SNPs 71,3813 Set 3 total distinct SNPs 441,441Total Total distinct SNPs 2,559,519
*Based on ,100,000 sequence reads per breed.†Based on ,20,000 sequence reads per wolf.
ARTICLES NATURE|Vol 438|8 December 2005
810

© 2005 Nature Publishing Group
long-range LD would be expected within dog breeds and short-rangeLD across breeds.
Preliminary evidence of long-range LD within breeds has beenreported90. Five genome regions were examined (,1% of thegenome) in five breeds using ,200 SNPs with high minor allelefrequency. LD seemed to extend 10–100-fold further in dog than inhuman, with relatively few haplotypes per breed.
With the availability of a genome sequence and a SNP map, wesought to undertake a systematic analysis of LD and haplotypestructure in the dog genome.Haplotype structure within the boxer assembly. We first analysedthe structure of genetic variation within the sequenced boxer genomeby examining the distribution of the ,770,000 SNPs detectedbetween homologous chromosomes. Strikingly, the genome is amosaic of long, alternating regions of near-total homozygosity andhigh heterozygosity (Fig. 6b, c), with observed SNP rates of ,14 perMb and ,850 per Mb, respectively. (The latter is close to that seenwithin breeds and is indistinguishable when one corrects for theconservative criterion used to identify SNPs within the boxerassembly; see Supplementary Information.) The homozygousregions have an N50 size of 6.9 Mb and cover 62% of the genome,and the heterozygous regions have an N50 size of 1.1 Mb and cover
38% of the genome. The results imply that the boxer genome islargely comprised of vast haplotype blocks. The long stretches ofhomozygosity indicate regions in which the sequenced boxer genomecarries the same haplotype on both chromosomes. The proportion ofhomozygosity (,62%) reflects the limited haplotype diversity withinbreeds.Long-range haplotypes in different breeds. We sought to determinewhether the striking haplotype structure seen in the boxer genome isrepresentative of most dog breeds. To this end, we randomly selectedten regions of 15 Mb each (,6% of the genome) and examinedlinkage disequilibrium in these regions in a collection of 224 dogs,consisting of 20 dogs from each of ten breeds and one dog from eachof 24 additional breeds (see Supplementary Tables S17–S19).
The ten breeds were chosen to represent all four clusters describedin ref. 91. The selected breeds have diverse histories, with varyingpopulation size and bottleneck severity. For example, the Basenji is anancient breed from Africa that has a small breeding population in theUnited States descending from dogs imported in the 1930s–1940s(refs 93, 94). The Irish wolfhound suffered a severe bottleneck twocenturies ago, with most dogs today being descendents of a single dogin the early 1800s (refs 5, 94). In contrast, the Labrador retriever andgolden retriever have long been, and remain, extremely popular dogs
Figure 6 | The distribution of SNPs is fairly uniform across breeds, butnon-uniform within the sequenced boxer assembly. a, SNPs acrosschromosome 3, generated by comparing the boxer assembly withWGS readsfromnine breeds. b, The SNPs on chromosome 3 of the boxer assembly showan uneven distribution (plotted in 500-kb windows). Note that boxer SNPswere identified using a more conservative method, lowering the observed
SNP rate by roughly twofold. c, An alternating pattern of large homozygous(light blue,,62%of genome;N50 size 6.9Mb) and large heterozygous (darkblue ,38% of genome; N50 size 1.1Mb) blocks indicates large identical ordivergent haplotypes across the boxer genome. White indicates centromericsequence.
NATURE|Vol 438|8 December 2005 ARTICLES
811

© 2005 Nature Publishing Group
(with ,150,000 and ,50,000 new puppies registered annually,respectively). They have not undergone such recent severe bottle-necks, but some lines have lost diversity because of the repeated use ofpopular sires89. The Glen of Imaal terrier represents the opposite endof the popularity spectrum, with fewer than 100 new puppiesregistered with the American kennel Club each year.
The 224 dogs were genotyped for SNPs across each of the tenregions, providing 2,240 cases in which to assess long-range LD. TheSNPs (n ¼ 1,219; Supplementary Table S19) were distributed alongthe regions to measure the fall-off of genetic correlation, with higherdensity at the start of the region and lower densities at furtherdistances (Fig. 7a). In 645 cases, we also examined the first 10 kb in
Figure 7 | Homozygous regions and linkage disequilibrium are nearly100-fold longer within dog breeds than across the dog or humanpopulations. a, Sampling design for ten random regions of 15Mb each,used to assess the haplotype structure of ,6% of the genome (seeSupplementary Information). For each region, we examined the first 10 kbthrough resequencing and dense genotyping. To detect long haplotypes, wegenotyped SNPs distributed throughout the next 1Mb and sampled SNPs atintervals of 1Mb for the next 14Mb. In total we genotyped 1,219 SNPsacross the ten regions in a collection of 224 dogs (20 dogs from each of 10breeds and one dog from each of 24 breeds). b, Conditional on a dog beinghomozygous for the initial 10-kb region (n ¼ 245), we assessed theprobability that the dog was homozygous for all SNPs within a givendistance. The average proportion remaining homozygous is compared forthe various breeds (green), for the boxer when sampled in the same ways asthe breeds (blue) and for the boxer using all SNPs found in the genomesequence (red). About 50% of the individuals seem to be homozygousthroughout 1Mb both in the boxer and other breeds, indicating that other
breeds have comparable long-range homozygosity. c, Linkagedisequilibrium (LD) as a function of distance is shown as the r2 statisticwithin individual breeds (red), across various breeds (blue) and a humanpopulation (black) taken from the CEPH collection genotyped as part of theENCODE component of the International HapMap Project118. For theoverall dog and human populations, LD falls rapidly, reaching the baselinelevel seen for unlinked loci by,200 kb. In contrast, LD for individual breedsfalls initially but then stays at a moderately high level across severalmegabases. d, The LD curves are broadly similar for most breeds, but theproportion of long-range LD is correlated with known breed history. e, Theobserved within-breed LD curve (averaged across breeds) is well fitted by asimple model with a domestication bottleneck 10,500 generations ago and abreed-creation bottleneck occurring 50 generations ago (see SupplementaryInformation). f, LD curves for individual dog breeds can be fitted by modelswith different breed-creation bottlenecks. The poorest fit is obtained for theakita, the breeding history of which is known to involve two separate breed-creation bottlenecks.
ARTICLES NATURE|Vol 438|8 December 2005
812
© 2005 Nature Publishing Group
greater detail by denser genotyping (with ,2 SNPs per kb) in 405cases and complete resequencing in 240 cases. The resequencing datayielded a heterozygosity rate of ,1 SNP per 1,500 bp, essentiallyequivalent to the rate seen in the sequenced boxer genome.
On the basis of examining the first 10 kb, we found that ,38% ofinstances seem to be completely homozygous and that all dogs seemto be homozygous for at least one of the ten regions. We thenmeasured the distance over which homozygosity persisted. Ofinstances homozygous in the initial 10-kb segment, 46% werehomozygous across 1 Mb and 17% were still homozygous across10 Mb (Fig. 7b). The fall-off in homozygosity is essentially identicalto that seen in the boxer genome, provided that the boxer data aresampled in an equivalent manner (see Supplementary Information).This indicates that the long-range haplotype structure seen in theboxer is typical of most dog breeds, although the precise haplotypesvary with breed and the locations of homozygous regions varybetween individuals.
We also assessed long-range correlations by calculating r 2,a traditional measure of LD, across the 15-Mb regions. The r2
curve representing the overall dog population (one dog from eachof 24 breeds) drops rapidly to background levels. This is in sharpcontrast to the r2 curves within each breed. Within breeds, LD isbiphasic, showing a sharp initial drop within ,90 kb followed by anextended shoulder that gradually declines to the background(unlinked) level by 5–15 Mb in most breeds (Fig. 7c). The basicpattern is similar in all ten regions (Supplementary Fig. S13) and inall breeds (Fig. 7d). (Labrador retrievers show the shortest LD,probably due to their mixed aetiology and large population size.)
The biphasic r2 curves within each breed thus consist of twocomponents (Fig. 7e), at scales differing by ,100-fold. The firstcomponent matches the fall-off in the general dog population and islikely to represent the short-range de-correlation of local haplotypeblocks in the ancestral dog population. The second componentrepresents long-range breed-specific haplotypes (Fig. 8a). Notably,the first component falls off nearly twice as quickly as the LD in thehuman population (,200 kb), and the second component falls offslightly slower than seen in laboratory mouse strains95.Modelling the effects of population history. We tested thisinterpretation by performing mathematical simulations on a dogpopulation that underwent an ancient bottleneck and recent breed-creation bottlenecks, using the coalescent approach96 (see Sup-plementary Information). Our experimental results were well fittedby models assuming an ancient bottleneck (effective domesticatedpopulation size 13,000, inbreeding coefficient F ¼ 0.12) occurring,9,000 generations ago (corresponding to ,27,000 years) andsubsequent breed-creation bottlenecks of varying intensities occur-ring 30–90 generations ago97 (Supplementary Fig. S14). The modelclosely reproduces the observed r2 curves and the observed poly-morphism rates within breeds, among breeds and between dog andgrey wolf. The model also yields estimates of breed-specific bottle-necks that are broadly consistent with known breed histories. Forexample, Labrador retrievers, and to a lesser extent golden retrieversand English springer spaniels, show less severe bottlenecks.
Deterministically modelled results (Fig. 7e, f) indicate that asimple, two-bottleneck model provides a close fit to the data forthe breeds. They do not rule out a more complex population history,such as multiple domestication events, low levels of continuing geneflow between domestic dog and grey wolf97,98 or multiple bottleneckswithin breeds. Notably, the akita yields the poorest fit to the model,with an r2 curve that appears to be triphasic. This may reflect theinitial creation of the breed as a hunting dog in Japan ,450generations ago, and a consecutive bottleneck associated with itsintroduction into the United States during the 1940s (ref. 99).Haplotype diversity. We next studied haplotype diversity within andamong breeds, using the dense genotypes from the 10-kb regions.Across the 645 cases examined, there is an average of ,10 distincthaplotypes per region. Within a breed, we typically see four of
these haplotypes, with the average frequency of the most commonhaplotype being 55% and the average frequency of the two mostcommon being 80% (Fig. 8c and Supplementary Fig. S18). Thehaplotypes and their frequencies differ sharply across breeds. None-theless, 80% of the haplotypes seen with a frequency of at least 5%in one breed are found in other breeds as well (SupplementaryTable S26). This extends previous observations of haplotype sharingacross breeds90. In particular, the inclusion of all SNPs with a minorallele frequency $5% across all breeds provides a more accuratepicture of haplotype sharing, because the analysis includes haplo-types that are rare within a single breed but more common across thepopulation.
We then inferred the ancestral haplotype block structure in theancestral dog population (before the creation of modern breeds) bycombining the data across breeds and applying methods similar tothose used for haplotype analysis in the human genome100 (seeSupplementary Information). In the 10-kb regions studied, one ortwo haplotype blocks were typically observed. Additional data across100-kb regions suggest that the ancestral blocks have an average sizeof ,10 kb. The blocks typically have ,4–5 distinct haplotypesacross the entire dog population (Fig. 8b). The overall situationclosely resembles the structure for the human genome, althoughwith slightly smaller block size (Supplementary Figs S15–S19 andSupplementary Table S24–26).Ancestral and breed-specific haplotypes. A clear picture of thepopulation genetic history of dogs emerges from the results detailedabove:†The ancestral dog population had short-range LD. The haplotypeblocks were somewhat shorter than in modern humans (,10 kbversus ,20 kb in human), consistent with the dog population beingsomewhat older than the human population (,9,000 generationsversus ,4,000 generations). Haplotype blocks at large distances wereessentially uncorrelated (Fig. 8a).†Breed creation introduced tight breed-specific bottlenecks, at leastfor the breeds examined. From the great diversity of long-rangehaplotype combinations carried in the ancestral population, thefounding chromosomes emerging from the bottleneck representedonly a small subset. These became long-range breed-specific haplo-types (Fig. 8a).†Although the breed-specific bottlenecks were tight, they did notcause massive random fixation of individual haplotypes. Only 13%of the small ancestral haplotypes are monomorphic within a typicalbreed, consistent with the estimated inbreeding coefficient of ,12%.Across larger regions ($100 kb), we observed no cases of completefixation within a breed (Supplementary Fig. S20).†There is notable sharing of 100-kb haplotypes across breeds, with,60% seen in multiple breeds although with different frequencies.On average, the probability of sampling the same haplotype on twochromosomes chosen from different breeds is roughly twofold lowerthan for chromosomes chosen within a single breed (SupplementaryFig. S21).Implications for genetic mapping. These results have importantimplications for the design of dog genetic studies. Although earlyefforts focused on cross-breeding of dogs for linkage analysis101–103, itis now clear that within-breed association studies offer specificadvantages in the study of both monogenic and polygenic diseases.First, they use existing dogs coming to medical attention and do notrequire the sampling of families with large numbers of affectedindividuals. Such studies should be highly informative, becausedog breeds have retained substantial genetic diversity. Moreover,they will require a much lower density of SNPs than comparablehuman association studies, because the long-range LD within breedsextends ,50-fold further than in humans90,104,105.
Whereas human association studies require .300,000 evenlyspaced SNPs100,106,107, the fact that LD extends over at least 50-foldgreater distances in dog suggests that dog association studies wouldrequire perhaps ,10,000 evenly spaced SNPs. To estimate the
NATURE|Vol 438|8 December 2005 ARTICLES
813

© 2005 Nature Publishing Group
Figure 8 | Two bottlenecks, one old and one recent, have shaped thehaplotype structure and linkage disequilibrium of canine breeds.a, Modern haplotype structure arose from key events in dog breedinghistory. The domestic dog diverged from wolves 15,000–100,000 yearsago97,119, probably through multiple domestication events98. Recent dogbreeds have been created within the past few hundred years. Bothbottlenecks have influenced the haplotype pattern and LD of current breeds.(1) Before the creation of modern breeds, the dog population had the short-range LD expected on the basis of its large size and time since thedomestication bottleneck. (2) In the creation of modern breeds, a smallsubset of chromosomes was selected from the pool of domestic dogs. Thelong-range patterns that happened to be carried on these chromosomesbecame common within the breed, thereby creating long-range LD. (3) Inthe short time since breed creation, these long-range patterns have not yetbeen substantially broken down by recombination. Long-range haplotypes,however, still retain the underlying short-range ancestral haplotype blocksfrom the domestic dog population, and these are revealed when oneexamines chromosomes across many breeds. b, c, Distribution of ancestralhaplotype blocks in a 10-kb window on chromosome 6 at ,31.4Mb across
24 breeds (b) and within four breeds (c). Ancestral haplotype blocks are5–15 kb in size (which is shorter than the ,25-kb blocks seen in humans)and are shared across breeds. Typical blocks show a spectrum of ,5haplotypes, with one common major haplotype. Blocks were defined usingthe modified four-gamete rule (see Supplementary Information) and eachhaplotype (minor allele frequency (maf) . 3%) within a block was given aunique colour. d, e, Distribution of breed-derived haplotypes across a 10-kbwindow on chromosome 6 at ,31.4Mb across 24 breeds (d) and withinfour breeds (e). Each colour denotes a distinct haplotype (maf . 3%) across11 SNPs in the 10-kb window for each of the analysed dogs. Pairs ofhaplotypes have an average of 3.7 differences. Most haplotypes can bedefinitively identified on the basis of homozygosity within individual dogs.Grey denotes haplotypes that cannot be unambiguously phased owing torare alleles or missing data. Within each of the four breeds shown, there are2–5 haplotypes, with one or two major haplotypes accounting for themajority of the chromosomes. Across the 24 breeds, there are a total of sevenhaplotypes. All but three are seen in multiple breeds, although at varyingfrequencies.
ARTICLES NATURE|Vol 438|8 December 2005
814

© 2005 Nature Publishing Group
number of SNPs required, we generated SNP sets from ten 1-Mbregions by coalescent simulations using the bottleneck parametersthat generate SNP rates and LD curves equivalent to the actual data(Supplementary Fig. S14 and Supplementary Table S20). We thenselected individual SNPs as ‘disease alleles’ and tested our abilityto map them by association analysis with various marker densities(Fig. 9a).
For disease alleles causing a simple mendelian dominant trait withhigh penetrance and no phenocopies, there is overwhelming powerto map the locus (Fig. 9a). Using ,15,000 evenly spaced SNPs and alog likelihood odds ratio (LOD score) score threshold of 5, theprobability of detecting the locus is over 99% given a collection of100 affected and 100 unaffected dogs. (The LOD score thresholdcorresponds to a false positive rate of 3% loci per genome.)
For a multigenic trait, the power to detect disease alleles dependson several factors, including the relative risk conferred by the allele,the allele frequency and the interaction with other alleles. Weinvestigated a simple model of an allele that increases risk by amultiplicative factor (l) of 2 or 5 (see Supplementary Information).Using the above SNP density and LOD score threshold, the power todetect a locus with a sample of 100 affected and 100 unaffected dogs is97% for l ¼ 5 and 50% for l ¼ 2 (Fig. 9b, c). Although initialmapping will be best done by association within breeds, subsequentfine-structure mapping to pinpoint the disease gene will probablybenefit from cross-breed comparison. Given the genetic relationshipsacross breeds described above, it is likely that the same risk allele willbe carried in multiple breeds. By comparing risk-associated haplo-types in multiple breeds, it should be possible to substantially narrowthe region containing the gene.
Resolving canid phylogeny
The dog family, Canidae, contains 34 closely related species thatdiverged within the last ,10 million years1. Resolving the evolution-ary relationships of such closely related taxa has been difficultbecause a great quantity of genomic sequence is typically requiredto yield enough informative nucleotide sites for the unambiguousreconstruction of phylogenetic trees. We sought to streamline theprocess of evolutionary reconstruction by exploiting our knowledgeof the dog genome to select genomic regions that would maximizethe amount of phylogenetic signal per sequenced base. Specifically,we sought regions of rapidly evolving, unique sequence.
We first compared the coding regions of 13,816 dog genes withhuman–dog–mouse 1:1:1 orthologues to find those with high neutralevolutionary divergence (comparing KS and KA/KS). We selected 12exons (8,080 bp) for sequencing, based on the criteria that theirsequences (1) are consistent with the known phylogeny of human,
dog, mouse and rat, (2) have a high percentage of bases ($15%) thatare informative for phylogenetic reconstruction in the human, dog,mouse and rat phylogenies, and (3) could be successfully amplified inall canids. The chosen exons contain 3.3-fold more substitutions thanrandom exonic sequence. Using our SNP database, we also evaluatedintrons to identify those with high variation between dog and coyote.We selected four introns (3,029 bp) that contained ,5-fold moreSNPs than the background frequency. We sequenced these exons andintrons (11,109 bp) in 30 out of 34 living wild canids, and wecombined the data with additional sequences (3,839 bp) from recentstudies3,92.
The resulting evolutionary tree has a high degree of statisticalsupport (Fig. 10), and uniquely resolves the topology of the dog’sclosest relatives. Grey wolf and dog are most closely related (0.04%and 0.21% sequence divergence in nuclear exon and intronsequences, respectively), followed by a close affiliation with coyote,golden jackal and Ethiopian wolf, three species that can hybridizewith dogs in the wild (Fig. 10). Closest to this group are the dhole andAfrican wild dog, two species with a uniquely structured meat-slicingtooth, suggesting that this adaptation was later lost. The moleculartree supports an African origin for the wolf-like canids, as the twoAfrican jackals are the most basal members of this clade. The twoother large groupings of canids are (1) the South American canids,which are clearly rooted by the two most morphologically divergentcanids, the maned wolf and bush dog; and (2) the red fox-like canids,which are rooted by the fennec fox and Blanford’s fox, but now alsoinclude the raccoon dog and bat-eared fox with higher support.Together, these three clades contain 93% of all living canids. The greyfox lineage seems to be the most primitive and suggests a NorthAmerican origin of the living canids about 10 million years ago1.
These results demonstrate the close kinship of canids. Theirlimited sequence divergence suggests that many molecular toolsdeveloped for the dog (for example, expression microarrays) willbe useful for exploring adaptation and evolutionary divergence inother canids as well.
Conclusions
Genome comparison is a powerful tool for discovery. It can revealunknown—and even unsuspected—biological functions, by siftingthe records of evolutionary experiments that have occurred over 100years or over 100 million years. The dog genome sequence illustratesthe range of information that can be gleaned from such studies.
Mammalian genome analysis is helping to develop a global pictureof gene regulation in the human genome. Initial comparison withrodents revealed that ,5% of the human genome is under purifyingselection, and that the majority of this sequence is not protein-
Figure 9 | Power to detect a disease locus by association mapping. OneSNP was designated as a disease allele under one of three genetic models: (a)simple mendelian dominant, (b) fivefold multiplicative increase in risk and(c) twofold multiplicative increase in risk. SNP genotypes acrosssurrounding chromosomal regions of 1Mb were simulated, using thecoalescent model corresponding to observed within-breed variation (seetext). Diploid genotypes across the chromosomal region were thengenerated for 100 affected and 100 unaffected dogs, based on the diseasemodel, and association analysis was performed to detect the presence of the
disease allele. The distribution of the maximum LOD score across the 1-Mbregion is shown for analyses based on multi-SNP haplotypes (solid lines)with SNP densities equivalent to a genome-wide map with a total of 7,500(red), 15,000 (green) or 30,000 (blue) SNPs. Dotted curves show the nulldistribution for a genome-wide search in which no disease locus is present(see Supplementary Information). A LOD score of 5 corresponds to ,3%chance of a false positive across the genome. For this threshold, the power todetect a disease allele that increases risk by twofold using haplotype analysisand a map with 15,000 SNPs is ,50%.
NATURE|Vol 438|8 December 2005 ARTICLES
815

© 2005 Nature Publishing Group
coding. The dog genome is now further clarifying this picture, as ourdata suggest that this ,5% represents functional elements commonto all mammals. The distribution of these elements relative to genes ishighly heterogeneous, with roughly half of the most highly conservednon-coding elements apparently devoted to regulating ,1% ofhuman genes; these genes have important roles in development,and understanding the regulatory clusters that surround them mayreveal how cellular states are established and maintained. In recentpapers32,108, the dog genome sequence has been used to greatlyexpand the catalogue of mammalian regulatory motifs in promotersand 3
0-untranslated regions. The dog genome sequence is also being
used to substantially revise the human gene catalogue. Despite theseadvances, it is clear that mammalian comparative genomics is still inits early stages. Progress will be markedly accelerated by the avail-ability of many additional mammalian genome sequences, initiallywith light coverage28 but eventually with near-complete coverage.
In addition to its role in studies of mammalian evolution, the doghas a special role in genomic studies because of the unparalleledphenotypic diversity among closely related breeds. The dog is atestament to the power of breeding programmes to select naturallyoccurring genetic variants with the ability to shape morphology,physiology and behaviour. Genome comparison within and acrossbreeds can reveal the genes that underlie such traits, informing basicresearch on development and neurobiology. It can also identifydisease genes that were carried along in breeding programmes.Potential benefits include insights into disease mechanism, and thepossibility of clinical trials in disease-affected dogs to accelerate newtherapeutics that would improve health in both dogs and humans.The SNP map of the dog genome confirms that dog breeds showthe long-range haplotype structure expected from recent intensivebreeding. Moreover, our analysis shows that the current collection of.2.5 million SNPs should be sufficient to allow association studies of
Figure 10 | Phylogeny of canid species. The phylogenetic tree is based on,15 kb of exon and intron sequence (see text). Branch colours identify thered-fox-like clade (red), the South American clade (green), the wolf-likeclade (blue) and the grey and island fox clade (orange). The tree shown wasconstructed using maximum parsimony as the optimality criterion and isthe single most parsimonious tree. Bootstrap values and bayesian posteriorprobability values are listed above and below the internodes, respectively;dashes indicate bootstrap values below 50% or bayesian posteriorprobability values below 95%. Horizontal bars indicate indels, with thenumber of indels shown in parentheses if greater than one. Underlined
species names are represented with corresponding illustrations. (Copyrightpermissions for illustrations are listed in the Supplementary Information.)Divergence time, in millions of years (Myr), is indicated for three nodes asdiscussed in ref. 1. For scientific names and species descriptions of canids,see ref. 119. A tree based on bayesian inference differs from the tree shown intwo respects: it groups the raccoon dog and bat-eared fox as sister taxa, andgroups the grey fox and island fox as basal to the clade containing these sistertaxa. However, neither of these topological differences is strongly supported(see text and Supplementary Information).
ARTICLES NATURE|Vol 438|8 December 2005
816

© 2005 Nature Publishing Group
nearly any trait in any breed. Realizing the full power of dog geneticsnow awaits the development of appropriate genotyping tools, such asmultiplex ‘SNP chips’109—this is already underway. For millennia,dogs have accompanied humans on their travels. It is only fitting thatthe dog should also be a valued companion on our journeys ofscientific discovery.
METHODSDetailed descriptions of all methods are provided in the SupplementaryInformation. Links to all of the data can be obtained via the Broad Institutewebsite (http://www.broad.mit.edu/tools/data.html).WGS sequencing and assembly. Approximately 31.5 million sequence readswere derived from both ends of inserts (paired-end reads) from 4-, 10-, 40- and200-kb clones, all prepared from primary blood lymphocyte DNA from a singlefemale boxer. This particular animal was chosen for sequencing because it hadthe lowest heterozygosity rate among ,120 dogs tested at a limited set of loci;subsequent analysis showed that the genome-wide heterozygosity rate in thisboxer is not substantially different from other breeds91. The assembly was carriedout using an interim version of ARACHNE2þ (http://www.broad.mit.edu/wga/).Genome alignment and comparison. Synteny maps were generated usingstandard methods24 from pair-wise alignments of repeat masked assembliesusing PatternHunter110 on CanFam2.0. All other comparative analyses wereperformed on BLASTZ/MULTIZ111,112 genome-wide alignments obtained fromthe UCSC genome browser (http://genome.ucsc.edu), based on CanFam1.0.Known interspersed repeats were identified and dated using RepeatMasker andDateRepeats113. The numbers of orthologous nucleotides were counted directlyfrom the alignments using human (hg17) as the reference sequence for alloverlaps except the dog–mouse overlap, for which pair-wise (CanFam1.0, mm5)alignments were used.Divergence rate estimates. Orthologous ancestral repeats were excised from thegenome alignment and realigned with the corresponding RepBase consensususing ClustalW. Nucleotide divergence rates were estimated from concatenatedrepeat alignments using baseml with the REV substitution model114. Ortholo-gous coding regions were excised from the genome alignments using theannotated human coding sequences (CDS) from Ensembl and the UCSCbrowser Known Genes track (October 2004) as reference. KA and KS wereestimated for each orthologue triplet using codeml with the F3 £ 4 codonfrequency model and no additional constraints.Detection and clustering of sequence conservation. Pair-wise conservationscores and the fraction of orthologous sequences under purifying selection wereestimated as in ref. 24. The three-way conservation score SHMD was defined asSHMD ¼ ðp2 uÞ=
ffiffiffiffiffiffiffiffiffiffiffiffiffiffiffiffiffiffiffiffiffiffiffiðuð12 uÞ=n
p; where n is the number of nucleotides aligned
across all three genomes (human, mouse, dog) for each non-overlapping 50-bpwindow with more than 20 aligned bases, p is the fraction of nucleotides identicalacross all three genomes, and u is the mean identity of ancestral repeats within500 kb of the window. HCNEs were defined as windows with SHMD . 5.4 thatdid not overlap a coding exon, as defined by the UCSC Known Genes track, andHCNE clusters were defined as all runs of overlapping 1-Mb intervals (50-kb stepsize) across the human genome with HCNE densities in the 90th percentile.Gene set acceleration scores. Gene annotation was performed on CanFam1.0. Aset of 13,816 orthologous human, mouse and dog genes were identified andcompiled into 4,950 gene sets containing genes related by functional annotationsor microarray gene expression data. For each gene set S, the acceleration scoreA(S) along a lineage is defined by (1) ranking all genes based on KA/KS within alineage, (2) calculating the rank-sum statistic for the set along each lineage(denoted adog(S), amouse(S), ahuman(S)), (3) calculating the rank-sum forthe lineage minus the maximum rank-sum the other lineages, for example,ahuman(S)–max(adog(S), amouse(S)) and (4) converting this rank-sum differenceto a z-score by comparing it to the mean and standard deviation observed in10,000 random sets of the same size. The expected number of sets at a givenz-score threshold was estimated by repeating steps (1)–(4) 10,000 times forgroups of 4,950 randomly permuted gene sets.SNP discovery. The SNP discovery was performed on CanFam2.0. Set 1 SNPswere discovered by comparison of the two haplotypes derived from the boxerassembly using only high-quality discrepancies supported by two reads. SNPs insets 2 and 3 were discovered by aligning reads or contigs to the boxer assemblyand using the SSAHA SNP algorithm115.Haplotype structure. The SNPs within the sequenced boxer genome(CanFam2.0) were assigned to homozygous or heterozygous regions using aViterbi algorithm116. To determine whether the haplotype structure seen in theboxer is representative of most dog breeds, we randomly selected ten regions of15 Mb each (,6% of the CanFam2.0 genome) and examined the extent ofhomozygosity and linkage disequilibrium in these regions in a collection of 224
dogs, consisting of 20 dogs from each of 10 breeds (akita, basenji, bullmastiff,English springer spaniel, Glen of Imaal terrier, golden retriever, Irish wolfhound,Labrador retriever, pug and rottweiler) and one dog from each of 24 additionalbreeds (see Supplementary Information). For each instance in which a dog washomozygous in a particular 10-kb region, we measured the distance fromthe beginning of the 10-kb region to the first heterozygous SNP in the adjoining100-kb, 1-Mb and 15-Mb data. This distance was used as the extent ofhomozygosity. The boxer sequence was sampled in an identical manner to theactual breed data. Linkage disequilibrium (represented by r2) across the ten15-Mb regions was assessed using Haploview117.
Received 9 August; accepted 11 October 2005.
1. Wayne, R. K. et al. Molecular systematics of the Canidae. Syst. Biol. 46,622–-653 (1997).
2. Vila, C. et al. Multiple and ancient origins of the domestic dog. Science 276,1687–-1689 (1997).
3. Bardeleben, C., Moore, R. L. & Wayne, R. K. Isolation and molecular evolutionof the selenocysteine tRNA (Cf TRSP) and RNase P RNA (Cf RPPH1) genes inthe dog family, Canidae. Mol. Biol. Evol. 22, 347–-359 (2005).
4. Savolainen, P., Zhang, Y. P., Luo, J., Lundeberg, J. & Leitner, T. Geneticevidence for an East Asian origin of domestic dogs. Science 298, 1610–-1613(2002).
5. American Kennel Club. The Complete Dog Book (eds Crowley, J. & Adelman, B.)(Howell Book House, New York, 1998).
6. Wayne, R. K. Limb morphology of domestic and wild canids: the influence ofdevelopment on morphologic change. J. Morphol. 187, 301–-319 (1986).
7. Ostrander, E. A., Galibert, F. & Patterson, D. F. Canine genetics comes of age.Trends Genet. 16, 117–-123 (2000).
8. Patterson, D. Companion animal medicine in the age of medical genetics. J. Vet.Intern. Med. 14, 1–-9 (2000).
9. Sargan, D. R. IDID: inherited diseases in dogs: web-based information forcanine inherited disease genetics. Mamm. Genome 15, 503–-506 (2004).
10. Chase, K. et al. Genetic basis for systems of skeletal quantitative traits:principal component analysis of the canid skeleton. Proc. Natl Acad. Sci. USA99, 9930–-9935 (2002).
11. Breen, M. et al. Chromosome-specific single-locus FISH probes allowanchorage of an 1800-marker integrated radiation-hybrid/linkage map of thedomestic dog genome to all chromosomes. Genome Res. 11, 1784–-1795 (2001).
12. Breen, M., Bullerdiek, J. & Langford, C. F. The DAPI banded karyotype of thedomestic dog (Canis familiaris) generated using chromosome-specific paintprobes. Chromosome Res. 7, 401–-406 (1999).
13. Breen, M. et al. An integrated 4249 marker FISH/RH map of the caninegenome. BMC Genomics 5, 65 (2004).
14. Hitte, C. et al. Facilitating genome navigation: survey sequencing and denseradiation-hybrid gene mapping. Nature Rev. Genet. 6, 643–-648 (2005).
15. Li, R. et al. Construction and characterization of an eightfold redundantdog genomic bacterial artificial chromosome library. Genomics 58, 9–-17(1999).
16. Kirkness, E. F. et al. The dog genome: survey sequencing and comparativeanalysis. Science 301, 1898–-1903 (2003).
17. Sutter, N. & Ostrander, E. Dog star rising: The canine genetic system. NatureRev. Genet. 5, 900–-910 (2004).
18. Galibert, F., Andre, C. & Hitte, C. Dog as a mammalian genetic model [inFrench]. Med. Sci. (Paris) 20, 761–-766 (2004).
19. Pollinger, J. P. et al. Selective sweep mapping of genes with large phenotypiceffects. Genome Res. doi:10.1101/gr.4374505 (in the press).
20. Sachidanandam, R. et al. A map of human genome sequence variationcontaining 1.42 million single nucleotide polymorphisms. Nature 409, 928–-933(2001).
21. Lander, E. S. et al. Initial sequencing and analysis of the human genome. Nature409, 860–-921 (2001).
22. Venter, J. C. et al. The sequence of the human genome. Science 291, 1304–-1351(2001).
23. The Chimpanzee Sequencing and Analysis Consortium. Initial sequence of thechimpanzee genome and comparison with the human genome. Nature 437,69–-87 (2005).
24. Mouse Genome Sequencing Consortium. Initial sequencing and comparativeanalysis of the mouse genome. Nature 420, 520–-562 (2002).
25. Rat Genome Sequencing Project Consortium. Genome sequence of the BrownNorway rat yields insights into mammalian evolution. Nature 428, 493–-521(2004).
26. Murphy, W. J. et al. Molecular phylogenetics and the origins of placentalmammals. Nature 409, 614–-618 (2001).
27. Thomas, J. W. et al. Comparative analyses of multi-species sequences fromtargeted genomic regions. Nature 424, 788–-793 (2003).
28. Margulies, E. H. et al. An initial strategy for the systematic identification offunctional elements in the human genome by low-redundancy comparativesequencing. Proc. Natl Acad. Sci. USA 102, 4795–-4800 (2005).
29. Boffelli, D. et al. Phylogenetic shadowing of primate sequences to findfunctional regions of the human genome. Science 299, 1391–-1394 (2003).
NATURE|Vol 438|8 December 2005 ARTICLES
817
© 2005 Nature Publishing Group
30. Bejerano, G. et al. Ultraconserved elements in the human genome. Science 304,1321–-1325 (2004).
31. Eddy, S. R. A model of the statistical power of comparative genome sequenceanalysis. PLoS Biol. 3, e10 (2005).
32. Xie, X. et al. Systematic discovery of regulatory motifs in human promotersand 3 0 UTRs by comparison of several mammals. Nature 434, 338–-345(2005).
33. Dermitzakis, E. T. et al. Comparison of human chromosome 21 conservednongenic sequences (CNGs) with the mouse and dog genomes shows thattheir selective constraint is independent of their genic environment. GenomeRes. 14, 852–-859 (2004).
34. Jaffe, D. B. et al. Whole-genome sequence assembly for mammalian genomes:Arachne 2. Genome Res. 13, 91–-96 (2003).
35. International Human Genome Sequencing Consortium. Finishing theeuchromatic sequence of the human genome. Nature 431, 931–-945 (2004).
36. Richterich, P. Estimation of errors in “raw” DNA sequences: a validation study.Genome Res. 8, 251–-259 (1998).
37. Bailey, J. A., Baertsch, R., Kent, W. J., Haussler, D. & Eichler, E. E. Hotspots ofmammalian chromosomal evolution. Genome Biol. 5, R23 (2004).
38. Andelfinger, G. et al. Detailed four-way comparative mapping and gene orderanalysis of the canine ctvm locus reveals evolutionary chromosomerearrangements. Genomics 83, 1053–-1062 (2004).
39. Wang, W. & Kirkness, E. F. Short interspersed elements (SINEs) are a majorsource of canine genomic diversity. Genome Res. doi:10.1101/gr.3765505 (inthe press).
40. Mamedov, I. Z., Arzumanyan, E. S., Amosova, A. L., Lebedev, Y. B. & Sverdlov,E. D. Whole-genome experimental identification of insertion/deletionpolymorphisms of interspersed repeats by a new general approach. NucleicAcids Res. 33, e16 (2005).
41. Lin, L. et al. The sleep disorder canine narcolepsy is caused by a mutation inthe hypocretin (orexin) receptor 2 gene. Cell 98, 365–-376 (1999).
42. Pele, M., Tiret, L., Kessler, J. L., Blot, S. & Panthier, J. J. SINE exonic insertion inthe PTPLA gene leads to multiple splicing defects and segregates with theautosomal recessive centronuclear myopathy in dogs. Hum. Mol. Genet. 14,1417–-1427 (2005).
43. Fondon, J. W. III & Garner, H. R. Molecular origins of rapid and continuousmorphological evolution. Proc. Natl Acad. Sci. USA 101, 18058–-18063 (2004).
44. Galtier, N. & Mouchiroud, D. Isochore evolution in mammals: a human-likeancestral structure. Genetics 150, 1577–-1584 (1998).
45. Belle, E. M., Duret, L., Galtier, N. & Eyre-Walker, A. The decline of isochores inmammals: an assessment of the GC content variation along the mammalianphylogeny. J. Mol. Evol. 58, 653–-660 (2004).
46. Bird, A. P. DNA methylation and the frequency of CpG in animal DNA. NucleicAcids Res. 8, 1499–-1504 (1980).
47. Antequera, F. & Bird, A. Number of CpG islands and genes in human andmouse. Proc. Natl Acad. Sci. USA 90, 11995–-11999 (1993).
48. Cooper, G. M., Brudno, M., Green, E. D., Batzoglou, S. & Sidow, A. Quantitativeestimates of sequence divergence for comparative analyses of mammaliangenomes. Genome Res. 13, 813–-820 (2003).
49. Hwang, D. G. & Green, P. Bayesian Markov chain Monte Carlo sequenceanalysis reveals varying neutral substitution patterns in mammalian evolution.Proc. Natl Acad. Sci. USA 101, 13994–-14001 (2004).
50. Martin, A. P. & Palumbi, S. R. Body size, metabolic rate, generation time, andthe molecular clock. Proc. Natl Acad. Sci. USA 90, 4087–-4091 (1993).
51. Gillooly, J. F., Allen, A. P., West, G. B. & Brown, J. H. The rate of DNAevolution: effects of body size and temperature on the molecular clock. Proc.Natl Acad. Sci. USA 102, 140–-145 (2005).
52. Laird, C. D., McConaughy, B. L. & McCarthy, B. J. Rate of fixation of nucleotidesubstitutions in evolution. Nature 224, 149–-154 (1969).
53. Li, W. H., Tanimura, M. & Sharp, P. M. An evaluation of the molecular clockhypothesis using mammalian DNA sequences. J. Mol. Evol. 25, 330–-342(1987).
54. Webber, C. & Ponting, C. P. Hot spots of mutation and breakage in dog andhuman chromosomes. Genome Res. doi:10.1101/gr.3896805 (in the press).
55. International Chicken Genome Sequencing Consortium. Sequence andcomparative analysis of the chicken genome provide unique perspectives onvertebrate evolution. Nature 432, 695–-716 (2004).
56. Marques-Bonet, T. & Navarro, A. Chromosomal rearrangements are associatedwith higher rates of molecular evolution in mammals. Gene 353, 147–-154(2005).
57. Miller, W., Makova, K. D., Nekrutenko, A. & Hardison, R. C. Comparativegenomics. Annu. Rev. Genomics Hum. Genet. 5, 15–-56 (2004).
58. Smith, N. G., Brandstrom, M. & Ellegren, H. Evidence for turnover of functionalnoncoding DNA in mammalian genome evolution. Genomics 84, 806–-813(2004).
59. Woolfe, A. et al. Highly conserved non-coding sequences are associated withvertebrate development. PLoS Biol. 3, e7 (2005).
60. Ovcharenko, I. et al. Evolution and functional classification of vertebrate genedeserts. Genome Res. 15, 137–-145 (2005).
61. Walter, K., Abnizova, I., Elgar, G. & Gilks, W. R. Striking nucleotide frequencypattern at the borders of highly conserved vertebrate non-coding sequences.Trends Genet. 21, 436–-440 (2005).
62. Siepel, A. et al. Evolutionarily conserved elements in vertebrate, insect, worm,and yeast genomes. Genome Res. 15, 1034–-1050 (2005).
63. Nobrega, M. A., Ovcharenko, I., Afzal, V. & Rubin, E. M. Scanning human genedeserts for long-range enhancers. Science 302, 413 (2003).
64. Kimura-Yoshida, C. et al. Characterization of the pufferfish Otx2 cis-regulatorsreveals evolutionarily conserved genetic mechanisms for vertebrate headspecification. Development 131, 57–-71 (2004).
65. Uchikawa, M., Ishida, Y., Takemoto, T., Kamachi, Y. & Kondoh, H. Functionalanalysis of chicken Sox2 enhancers highlights an array of diverse regulatoryelements that are conserved in mammals. Dev. Cell 4, 509–-519 (2003).
66. de la Calle-Mustienes, E. et al. A functional survey of the enhancer activity ofconserved non-coding sequences from vertebrate Iroquois cluster gene deserts.Genome Res. 15, 1061–-1072 (2005).
67. Daly, M. J. Estimating the human gene count. Cell 109, 283–-284 (2002).68. Hogenesch, J. B. et al. A comparison of the Celera and Ensembl predicted gene
sets reveals little overlap in novel genes. Cell 106, 413–-415 (2001).69. Emes, R. D., Goodstadt, L., Winter, E. E. & Ponting, C. P. Comparison of the
genomes of human and mouse lays the foundation of genome zoology. Hum.Mol. Genet. 12, 701–-709 (2003).
70. Ewing, B. & Green, P. Analysis of expressed sequence tags indicates 35,000human genes. Nature Genet. 25, 232–-234 (2000).
71. Wolfe, K. H. & Li, W. H. Molecular evolution meets the genomics revolution.Nature Genet. 33 (suppl.), 255–-265 (2003).
72. Bailey, J. A., Liu, G. & Eichler, E. E. An Alu transposition model for the originand expansion of human segmental duplications. Am. J. Hum. Genet. 73,823–-834 (2003).
73. Hughes, A. L. The evolution of the type I interferon gene family in mammals.J. Mol. Evol. 41, 539–-548 (1995).
74. Hurst, L. D. The Ka/Ks ratio: diagnosing the form of sequence evolution. TrendsGenet. 18, 486 (2002).
75. Ohta, T. Near-neutrality in evolution of genes and gene regulation. Proc. NatlAcad. Sci. USA 99, 16134–-16137 (2002).
76. Demetrius, L. Directionality theory and the evolution of body size. Proc. Biol. Sci.267, 2385–-2391 (2000).
77. Fay, J. C. & Wu, C. I. Sequence divergence, functional constraint, andselection in protein evolution. Annu. Rev. Genomics Hum. Genet. 4, 213–-235(2003).
78. Brunet, J. P., Tamayo, P., Golub, T. R. & Mesirov, J. P. Metagenes and molecularpattern discovery using matrix factorization. Proc. Natl Acad. Sci. USA 101,4164–-4169 (2004).
79. Mootha, V. K. et al. PGC-1a-responsive genes involved in oxidativephosphorylation are coordinately downregulated in human diabetes. NatureGenet. 34, 267–-273 (2003).
80. Subramanian, A. et al. Gene set enrichment analysis: a knowledge-basedapproach for interpreting genome-wide expression profiles. Proc. Natl Acad. Sci.USA 102, 15545–-15550 (2005).
81. Dorus, S. et al. Accelerated evolution of nervous system genes in the origin ofHomo sapiens. Cell 119, 1027–-1040 (2004).
82. Saetre, P. et al. From wild wolf to domestic dog: gene expression changes inthe brain. Brain Res. Mol. Brain Res. 126, 198–-206 (2004).
83. Wyckoff, G. J., Wang, W. & Wu, C. I. Rapid evolution of male reproductivegenes in the descent of man. Nature 403, 304–-309 (2000).
84. Birkhead, T. R. & Pizzari, T. Postcopulatory sexual selection. Nature Rev. Genet.3, 262–-273 (2002).
85. Dorus, S., Evans, P. D., Wyckoff, G. J., Choi, S. S. & Lahn, B. T. Rate ofmolecular evolution of the seminal protein gene SEMG2 correlates with levelsof female promiscuity. Nature Genet. 36, 1326–-1329 (2004).
86. Ruiz-Pesini, E. et al. Correlation of sperm motility with mitochondrial enzymaticactivities. Clin. Chem. 44, 1616–-1620 (1998).
87. Zeh, J. A. & Zeh, D. W. Maternal inheritance, sexual conflict and themaladapted male. Trends Genet. 21, 281–-286 (2005).
88. Grossman, L. I., Wildman, D. E., Schmidt, T. R. & Goodman, M. Acceleratedevolution of the electron transport chain in anthropoid primates. Trends Genet.20, 578–-585 (2004).
89. Ostrander, E. A. & Kruglyak, L. Unleashing the canine genome. Genome Res. 10,1271–-1274 (2000).
90. Sutter, N. B. et al. Extensive and breed-specific linkage disequilibrium in Canisfamiliaris. Genome Res. 12, 2388–-2396 (2004).
91. Parker, H. G. et al. Genetic structure of the purebred domestic dog. Science304, 1160–-1164 (2004).
92. Bardeleben, C., Moore, R. L. & Wayne, R. K. A molecular phylogeny of theCanidae based on six nuclear loci. Mol. Phylogenet. Evol. 37, 815–-831 (2005).
93. Fogel, B. The Encyclopedia of the Dog (D.K. Publishing, New York, 1995).94. Wilcox, B. & Walkowicz, C. The Atlas of Dog Breeds of the World (T.H.F.
Publications, Neptune City, New York, 1995).95. Frazer, K. A. et al. Segmental phylogenetic relationships of inbred mouse
strains revealed by fine-scale analysis of sequence variation across 4.6 mb ofmouse genome. Genome Res. 14, 1493–-1500 (2004).
96. Hudson, R. R. in Oxford Surveys in Evolutionary Biology Vol. 7 (eds Futuyma, D.& Antonovics, J.) 1–-44 (Oxford Univ. Press, Oxford, 1990).
97. Vila, C., Seddon, J. & Ellegren, H. Genes of domestic mammals augmented bybackcrossing with wild ancestors. Trends Genet. 21, 214–-218 (2005).
ARTICLES NATURE|Vol 438|8 December 2005
818

© 2005 Nature Publishing Group
98. Leonard, J. A. et al. Ancient DNA evidence for Old World origin of New Worlddogs. Science 298, 1613–-1616 (2002).
99. Kajiwara, N. & Japanese Kennel Club in Akita (eds Kariyabu, T. &Kaluzniacki, S.) 1–-103 (Japan Kennel Club, Tokyo, 1998).
100. Gabriel, S. B. et al. The structure of haplotype blocks in the human genome.Science 296, 2225–-2229 (2002).
101. Werner, P., Raducha, M. G., Prociuk, U., Henthorn, P. S. & Patterson, D. F.Physical and linkage mapping of human chromosome 17 loci to dogchromosomes 9 and 5. Genomics 42, 74–-82 (1997).
102. Todhunter, R. J. et al. Power of a Labrador Retriever-Greyhound pedigree forlinkage analysis of hip dysplasia and osteoarthritis. Am. J. Vet. Res. 64,418–-424 (2003).
103. Sidjanin, D. J. et al. Canine CNGB3 mutations establish cone degeneration asorthologous to the human achromatopsia locus ACHM3. Hum. Mol. Genet. 11,1823–-1833 (2002).
104. Lou, X. Y. et al. The extent and distribution of linkage disequilibrium in amulti-hierarchic outbred canine pedigree. Mamm. Genome 14, 555–-564 (2003).
105. Hyun, C. et al. Prospects for whole genome linkage disequilibrium mapping indomestic dog breeds. Mamm. Genome 14, 640–-649 (2003).
106. Cardon, L. R. & Abecasis, G. R. Using haplotype blocks to map human complextrait loci. Trends Genet. 19, 135–-140 (2003).
107. Tsui, C. et al. Single nucleotide polymorphisms (SNPs) that map to gaps in thehuman SNP map. Nucleic Acids Res. 31, 4910–-4916 (2003).
108. Lewis, B. P., Burge, C. B. & Bartel, D. P. Conserved seed pairing, often flankedby adenosines, indicates that thousands of human genes are microRNAtargets. Cell 120, 15–-20 (2005).
109. Syvanen, A. C. Toward genome-wide SNP genotyping. Nature Genet. 37(suppl.), S5–-10 (2005).
110. Ma, B., Tromp, J. & Li, M. PatternHunter: faster and more sensitive homologysearch. Bioinformatics 18, 440–-445 (2002).
111. Schwartz, S. et al. Human-mouse alignments with BLASTZ. Genome Res. 13,103–-107 (2003).
112. Blanchette, M. et al. Aligning multiple genomic sequences with the threadedblockset aligner. Genome Res. 14, 708–-715 (2004).
113. Smit, A. F. A. & Green, P. RepeatMasker (http://ftp.genome.washington.edu/RM/RepeatMasker.html).
114. Yang, Z., Goldman, N. & Friday, A. Comparison of models for nucleotidesubstitution used in maximum-likelihood phylogenetic estimation. Mol. Biol.Evol. 11, 316–-324 (1994).
115. Ning, Z., Cox, A. J. & Mullikin, J. C. SSAHA: a fast search method for largeDNA databases. Genome Res. 11, 1725–-1729 (2001).
116. Viterbi, A. J. Error bounds for convolutional codes and an asymptoticallyoptimal decoding algorithm. IEEE Trans. Inform. Process. 13, 260–-269 (1967).
117. Barrett, J. C., Fry, B., Maller, J. & Daly, M. J. Haploview: analysis andvisualization of LD and haplotype maps. Bioinformatics 21, 263–-265(2005).
118. The International HapMap Consortium. The International HapMap Project.Nature 426, 789–-796 (2003).
119. Macdonald, D. W. & Sillero-Zubiri, C. in Biology and Conservation of Canids(eds Macdonald, D. W. & Sillero-Zubiri, C.) 1–-30 (Oxford Univ. Press, Oxford,2004).
Supplementary Information is linked to the online version of the paper atwww.nature.com/nature.
Acknowledgements We are indebted to the canine research community, and inparticular D. Patterson, G. Acland and K. G. Lark, whose vision and researchconvinced the NIH of the importance of generating a canine genome sequence.We also thank all those who shared insights at the Dog Genome Communitymeetings, including G. Acland, G. D. Aguirre, M. Binns, U. Giger, P. Henthorn,F. Lingaas, K. Murphy and P. Werner. We thank our many colleagues (G. Acland,G. D. Aguirre, C. Andre, N. Fretwell, G. Johnson, K. G. Lark and J. Modiano), aswell as the dog owners and breeders who provided us with samples. We thankcolleagues at the UCSC browser for providing data (such as BLASTZalignments), A. Smit for providing the RepeatMasker annotations used in ouranalyses and N. Manoukis for providing Unix machines for the phylogeneticanalyses. Finally, we thank L. Gaffney and K. Siang Toh for editorial andgraphical assistance. The genome sequence and analysis was supported in partby the National Human Genome Research Institute. The radiation hybrid mapwas supported in part by the Canine Health Foundation. Sample collection wassupported in part by the Intramural Research Program of the National HumanGenome Research Institute and the Canine Health Foundation.
Author Information The draft genome sequence has been deposited in publicdatabases under NCBI accession codes AAEX01000000 (CanFam1.0) andAAEX02000000 (CanFam2.0). SNPs have been deposited in the dbSNPdatabase (http://www.ncbi.nlm.nih.gov/projects/SNP/). Reprints andpermissions information is available at npg.nature.com/reprintsandpermissions.The authors declare no competing financial interests. Correspondence andrequests for materials should be addressed to K.L.T. ([email protected]) orE.S.L. ([email protected]).
Broad Sequencing Platform members Jennifer Baldwin1, Adal Abebe1, Amr Abouelleil1, Lynne Aftuck1, Mostafa Ait-zahra1, Tyler Aldredge1,Nicole Allen1, Peter An1, Scott Anderson1, Claudel Antoine1, Harindra Arachchi1, Ali Aslam1, Laura Ayotte1, Pasang Bachantsang1, Andrew Barry1,Tashi Bayul1, Mostafa Benamara1, Aaron Berlin1, Daniel Bessette1, Berta Blitshteyn1, Toby Bloom1, Jason Blye1, Leonid Boguslavskiy1,Claude Bonnet1, Boris Boukhgalter1, Adam Brown1, Patrick Cahill1, Nadia Calixte1, Jody Camarata1, Yama Cheshatsang1, Jeffrey Chu1,Mieke Citroen1, Alville Collymore1, Patrick Cooke1, Tenzin Dawoe1, Riza Daza1, Karin Decktor1, Stuart DeGray1, Norbu Dhargay1,Kimberly Dooley1, Kathleen Dooley1, Passang Dorje1, Kunsang Dorjee1, Lester Dorris1, Noah Duffey1, Alan Dupes1,Osebhajajeme Egbiremolen1, Richard Elong1, Jill Falk1, Abderrahim Farina1, Susan Faro1, Diallo Ferguson1, Patricia Ferreira1, Sheila Fisher1,Mike FitzGerald1, Karen Foley1, Chelsea Foley1, Alicia Franke1, Dennis Friedrich1, Diane Gage1, Manuel Garber1, Gary Gearin1,Georgia Giannoukos1, Tina Goode1, Audra Goyette1, Joseph Graham1, Edward Grandbois1, Kunsang Gyaltsen1, Nabil Hafez1,Daniel Hagopian1, Birhane Hagos1, Jennifer Hall1, Claire Healy1, Ryan Hegarty1, Tracey Honan1, Andrea Horn1, Nathan Houde1,Leanne Hughes1, Leigh Hunnicutt1, M. Husby1, Benjamin Jester1, Charlien Jones1, Asha Kamat1, Ben Kanga1, Cristyn Kells1,Dmitry Khazanovich1, Alix Chinh Kieu1, Peter Kisner1, Mayank Kumar1, Krista Lance1, Thomas Landers1, Marcia Lara1, William Lee1,Jean-Pierre Leger1, Niall Lennon1, Lisa Leuper1, Sarah LeVine1, Jinlei Liu1, Xiaohong Liu1, Yeshi Lokyitsang1, Tashi Lokyitsang1, Annie Lui1,Jan Macdonald1, John Major1, Richard Marabella1, Kebede Maru1, Charles Matthews1, Susan McDonough1, Teena Mehta1, James Meldrim1,Alexandre Melnikov1, Louis Meneus1, Atanas Mihalev1, Tanya Mihova1, Karen Miller1, Rachel Mittelman1, Valentine Mlenga1, Leonidas Mulrain1,Glen Munson1, Adam Navidi1, Jerome Naylor1, Tuyen Nguyen1, Nga Nguyen1, Cindy Nguyen1, Thu Nguyen1, Robert Nicol1, Nyima Norbu1,Choe Norbu1, Nathaniel Novod1, Tenchoe Nyima1, Peter Olandt1, Barry O’Neill1, Keith O’Neill1, Sahal Osman1, Lucien Oyono1,Christopher Patti1, Danielle Perrin1, Pema Phunkhang1, Fritz Pierre1, Margaret Priest1, Anthony Rachupka1, Sujaa Raghuraman1,Rayale Rameau1, Verneda Ray1, Christina Raymond1, Filip Rege1, Cecil Rise1, Julie Rogers1, Peter Rogov1, Julie Sahalie1, Sampath Settipalli1,Theodore Sharpe1, Terrance Shea1, Mechele Sheehan1, Ngawang Sherpa1, Jianying Shi1, Diana Shih1, Jessie Sloan1, Cherylyn Smith1,Todd Sparrow1, John Stalker1, Nicole Stange-Thomann1, Sharon Stavropoulos1, Catherine Stone1, Sabrina Stone1, Sean Sykes1,Pierre Tchuinga1, Pema Tenzing1, Senait Tesfaye1, Dawa Thoulutsang1, Yama Thoulutsang1, Kerri Topham1, Ira Topping1, Tsamla Tsamla1,Helen Vassiliev1, Vijay Venkataraman1, Andy Vo1, Tsering Wangchuk1, Tsering Wangdi1, Michael Weiand1, Jane Wilkinson1, Adam Wilson1,Shailendra Yadav1, Shuli Yang1, Xiaoping Yang1, Geneva Young1, Qing Yu1, Joanne Zainoun1, Lisa Zembek1 & Andrew Zimmer1
Affiliation for participants: 1Broad Institute of Harvard and MIT, 320 Charles Street, Cambridge, Massachusetts 02141, USA.
NATURE|Vol 438|8 December 2005 ARTICLES
819