Genome of the marsupial Monodelphis domestica reveals innovation in non-coding sequences
12
ARTICLES Genome of the marsupial Monodelphis domestica reveals innovation in non-coding sequences Tarjei S. Mikkelsen 1,2 , Matthew J. Wakefield 3 , Bronwen Aken 4 , Chris T. Amemiya 5 , Jean L. Chang 1 , Shannon Duke 6 , Manuel Garber 1 , Andrew J. Gentles 7,8 , Leo Goodstadt 9 , Andreas Heger 9 , Jerzy Jurka 8 , Michael Kamal 1 , Evan Mauceli 1 , Stephen M. J. Searle 4 , Ted Sharpe 1 , Michelle L. Baker 10 , Mark A. Batzer 11 , Panayiotis V. Benos 12 , Katherine Belov 13 , Michele Clamp 1 , April Cook 1 , James Cuff 1 , Radhika Das 14 , Lance Davidow 15 , Janine E. Deakin 16 , Melissa J. Fazzari 17 , Jacob L. Glass 17 , Manfred Grabherr 1 , John M. Greally 17 , Wanjun Gu 18 , Timothy A. Hore 16 , Gavin A. Huttley 19 , Michael Kleber 1 , Randy L. Jirtle 14 , Edda Koina 16 , Jeannie T. Lee 15 , Shaun Mahony 12 , Marco A. Marra 20 , Robert D. Miller 10 , Robert D. Nicholls 21 , Mayumi Oda 17 , Anthony T. Papenfuss 3 , Zuly E. Parra 10 , David D. Pollock 18 , David A. Ray 22 , Jacqueline E. Schein 20 , Terence P. Speed 3 , Katherine Thompson 16 , John L. VandeBerg 23 , Claire M. Wade 1,24 , Jerilyn A. Walker 11 , Paul D. Waters 16 , Caleb Webber 9 , Jennifer R. Weidman 14 , Xiaohui Xie 1 , Michael C. Zody 1 , Broad Institute Genome Sequencing Platform*, Broad Institute Whole Genome Assembly Team*, Jennifer A. Marshall Graves 16 , Chris P. Ponting 9 , Matthew Breen 6,25 , Paul B. Samollow 26 , Eric S. Lander 1,27 & Kerstin Lindblad-Toh 1 We report a high-quality draft of the genome sequence of the grey, short-tailed opossum (Monodelphis domestica). As the first metatherian (‘marsupial’) species to be sequenced, the opossum provides a unique perspective on the organization and evolution of mammalian genomes. Distinctive features of the opossum chromosomes provide support for recent theories about genome evolution and function, including a strong influence of biased gene conversion on nucleotide sequence composition, and a relationship between chromosomal characteristics and X chromosome inactivation. Comparison of opossum and eutherian genomes also reveals a sharp difference in evolutionary innovation between protein-coding and non-coding functional elements. True innovation in protein-coding genes seems to be relatively rare, with lineage-specific differences being largely due to diversification and rapid turnover in gene families involved in environmental interactions. In contrast, about 20% of eutherian conserved non-coding elements (CNEs) are recent inventions that postdate the divergence of Eutheria and Metatheria. A substantial proportion of these eutherian-specific CNEs arose from sequence inserted by transposable elements, pointing to transposons as a major creative force in the evolution of mammalian gene regulation. Metatherians (‘marsupials’) comprise one of the three major groups of modern mammals and represent the closest outgroup to the euthe- rian (‘placental’) mammals (Supplementary Fig. 1). Metatherians and eutherians diverged ,180 million years (Myr) ago, long before the radiation of the extant eutherian clades ,100 Myr ago 1,2 . Although the metatherian lineage originally radiated from North *Lists of participants and affiliations appear at the end of the paper. 1 Broad Institute of MIT and Harvard, 7 Cambridge Center, Cambridge, Massachusetts 02142, USA. 2 Division of Health Sciences and Technology, Massachusetts Institute of Technology, Cambridge, Massachusetts 02139, USA. 3 Bioinformatics Division, The Walter & Eliza Hall Institute of Medical Research, 1G Royal Parade, Parkville Victoria 3050, Australia. 4 The Wellcome Trust Sanger Institute, Wellcome Trust Genome Campus, Hinxton, Cambridge CB10 1SA, UK. 5 Molecular Genetics Program, Benaroya Research Institute at Virginia Mason, 1201 Ninth Avenue, Seattle, Washington 98101, USA. 6 Department of Molecular Biomedical Sciences, College of Veterinary Medicine, North Carolina State University, 4700 Hillsborough Street, Raleigh, North Carolina 27606, USA. 7 Stanford University School of Medicine, P060 Lucas Center, Stanford, California 94305, USA. 8 Genetic Information Research Institute, 1925 Landings Drive, Mountain View, California 94043, USA. 9 MRC Functional Genetics Unit, Department of Physiology, Anatomy and Genetics, University of Oxford, South Parks Road, Oxford OX1 3QX, UK. 10 Department of Biology, Center for Evolutionary and Theoretical Immunology, University of New Mexico, Albuquerque, New Mexico 87131, USA. 11 Department of Biological Sciences, Biological Computation and Visualization Center, Center for Bio-Modular Multi-Scale Systems, Louisiana State University, 202 Life Sciences Building, Baton Rouge, Louisiana 70803, USA. 12 Department of Computational Biology, University of Pittsburgh, 3501 Fifth Avenue, Suite 3064, BST3, Pittsburgh, Pennsylvania 15260, USA. 13 Faculty of Veterinary Science, University of Sydney, New South Wales 2006, Australia. 14 Department of Radiation Oncology, Duke University Medical Center, Box 3433, Durham, North Carolina 27710, USA. 15 Department of Molecular Biology, Hughes Medical Institute, Massachusetts General Hospital, and Department of Genetics, Harvard Medical School, Boston, Massachusetts 02114, USA. 16 ARC Centre for Kangaroo Genomics, Research School of Biological Sciences, The Australian National University, Canberra, ACT 2601, Australia. 17 Department of Medicine (Hematology) and Molecular Genetics, Albert Einstein College of Medicine, Ullmann 911, 1300 Morris Park Avenue, Bronx, New York 10461, USA. 18 Department of Biochemistry and Molecular Genetics, University of Colorado Health Sciences Center, MS 8101, 12801 17th Avenue, Aurora, Colorado 80045, USA. 19 John Curtin School of Medical Research, The Australian National University, Canberra, ACT 0200, Australia. 20 Genome Sciences Centre, British Columbia Cancer Agency, 570 West 7th Avenue, Vancouver, British Columbia V5Z 4S6, Canada. 21 Department of Pediatrics, Research Center Children’s Hospital of Pittsburgh, 3460 Fifth Avenue, Room 2109, Rangos, Pittsburgh, Pennsylvania 15213, USA. 22 Department of Biology, West Virginia University, Morgantown, West Virginia 26505, USA. 23 Department of Genetics and Southwest National Primate Research Center, Southwest Foundation for Biomedical Research, San Antonio, Texas 78245, USA. 24 Center for Human Genetic Research, Massachusetts General Hospital, 185 Cambridge Street, Boston, Massachusetts 02114, USA. 25 Center for Comparative Medicine and Translational Research, North Carolina State University, 4700 Hillsborough Street, Raleigh, North Carolina 27606, USA. 26 Department of Veterinary Integrative Biosciences, Texas A&M University, 4458 TAMU, College Station, Texas 77843, USA. 27 Whitehead Institute for Biomedical Research, 9 Cambridge Center, Cambridge, Massachusetts 02142, USA. Vol 447 | 10 May 2007 | doi:10.1038/nature05805 167 Nature ©2007 Publishing Group
Transcript of Genome of the marsupial Monodelphis domestica reveals innovation in non-coding sequences

ARTICLES
Genome of the marsupial Monodelphisdomestica reveals innovation innon-coding sequencesTarjei S. Mikkelsen1,2, Matthew J. Wakefield3, Bronwen Aken4, Chris T. Amemiya5, Jean L. Chang1, Shannon Duke6,Manuel Garber1, Andrew J. Gentles7,8, Leo Goodstadt9, Andreas Heger9, Jerzy Jurka8, Michael Kamal1,Evan Mauceli1, Stephen M. J. Searle4, Ted Sharpe1, Michelle L. Baker10, Mark A. Batzer11, Panayiotis V. Benos12,Katherine Belov13, Michele Clamp1, April Cook1, James Cuff1, Radhika Das14, Lance Davidow15, Janine E. Deakin16,Melissa J. Fazzari17, Jacob L. Glass17, Manfred Grabherr1, John M. Greally17, Wanjun Gu18, Timothy A. Hore16,Gavin A. Huttley19, Michael Kleber1, Randy L. Jirtle14, Edda Koina16, Jeannie T. Lee15, Shaun Mahony12,Marco A. Marra20, Robert D. Miller10, Robert D. Nicholls21, Mayumi Oda17, Anthony T. Papenfuss3, Zuly E. Parra10,David D. Pollock18, David A. Ray22, Jacqueline E. Schein20, Terence P. Speed3, Katherine Thompson16,John L. VandeBerg23, Claire M. Wade1,24, Jerilyn A. Walker11, Paul D. Waters16, Caleb Webber9,Jennifer R. Weidman14, Xiaohui Xie1, Michael C. Zody1, Broad Institute Genome Sequencing Platform*,Broad Institute Whole Genome Assembly Team*, Jennifer A. Marshall Graves16, Chris P. Ponting9,Matthew Breen6,25, Paul B. Samollow26, Eric S. Lander1,27 & Kerstin Lindblad-Toh1
We report a high-quality draft of the genome sequence of the grey, short-tailed opossum (Monodelphis domestica). As thefirst metatherian (‘marsupial’) species to be sequenced, the opossum provides a unique perspective on the organization andevolution of mammalian genomes. Distinctive features of the opossum chromosomes provide support for recent theoriesabout genome evolution and function, including a strong influence of biased gene conversion on nucleotide sequencecomposition, and a relationship between chromosomal characteristics and X chromosome inactivation. Comparison ofopossum and eutherian genomes also reveals a sharp difference in evolutionary innovation between protein-coding andnon-coding functional elements. True innovation in protein-coding genes seems to be relatively rare, with lineage-specificdifferences being largely due to diversification and rapid turnover in gene families involved in environmental interactions. Incontrast, about 20% of eutherian conserved non-coding elements (CNEs) are recent inventions that postdate the divergenceof Eutheria and Metatheria. A substantial proportion of these eutherian-specific CNEs arose from sequence inserted bytransposable elements, pointing to transposons as a major creative force in the evolution of mammalian gene regulation.
Metatherians (‘marsupials’) comprise one of the three major groupsof modern mammals and represent the closest outgroup to the euthe-rian (‘placental’) mammals (Supplementary Fig. 1). Metatherians
and eutherians diverged ,180 million years (Myr) ago, long beforethe radiation of the extant eutherian clades ,100 Myr ago1,2.Although the metatherian lineage originally radiated from North
*Lists of participants and affiliations appear at the end of the paper.
1Broad Institute of MIT and Harvard, 7 Cambridge Center, Cambridge, Massachusetts 02142, USA. 2Division of Health Sciences and Technology, Massachusetts Institute ofTechnology, Cambridge, Massachusetts 02139, USA. 3Bioinformatics Division, The Walter & Eliza Hall Institute of Medical Research, 1G Royal Parade, Parkville Victoria 3050,Australia. 4The Wellcome Trust Sanger Institute, Wellcome Trust Genome Campus, Hinxton, Cambridge CB10 1SA, UK. 5Molecular Genetics Program, Benaroya Research Institute atVirginia Mason, 1201 Ninth Avenue, Seattle, Washington 98101, USA. 6Department of Molecular Biomedical Sciences, College of Veterinary Medicine, North Carolina State University,4700 Hillsborough Street, Raleigh, North Carolina 27606, USA. 7Stanford University School of Medicine, P060 Lucas Center, Stanford, California 94305, USA. 8Genetic InformationResearch Institute, 1925 Landings Drive, Mountain View, California 94043, USA. 9MRC Functional Genetics Unit, Department of Physiology, Anatomy and Genetics, University ofOxford, South Parks Road, Oxford OX1 3QX, UK. 10Department of Biology, Center for Evolutionary and Theoretical Immunology, University of New Mexico, Albuquerque, New Mexico87131, USA. 11Department of Biological Sciences, Biological Computation and Visualization Center, Center for Bio-Modular Multi-Scale Systems, Louisiana State University, 202 LifeSciences Building, Baton Rouge, Louisiana 70803, USA. 12Department of Computational Biology, University of Pittsburgh, 3501 Fifth Avenue, Suite 3064, BST3, Pittsburgh,Pennsylvania 15260, USA. 13Faculty of Veterinary Science, University of Sydney, New South Wales 2006, Australia. 14Department of Radiation Oncology, Duke University MedicalCenter, Box 3433, Durham, North Carolina 27710, USA. 15Department of Molecular Biology, Hughes Medical Institute, Massachusetts General Hospital, and Department of Genetics,Harvard Medical School, Boston, Massachusetts 02114, USA. 16ARC Centre for Kangaroo Genomics, Research School of Biological Sciences, The Australian National University,Canberra, ACT 2601, Australia. 17Department of Medicine (Hematology) and Molecular Genetics, Albert Einstein College of Medicine, Ullmann 911, 1300 Morris Park Avenue, Bronx,New York 10461, USA. 18Department of Biochemistry and Molecular Genetics, University of Colorado Health Sciences Center, MS 8101, 12801 17th Avenue, Aurora, Colorado 80045,USA. 19John Curtin School of Medical Research, The Australian National University, Canberra, ACT 0200, Australia. 20Genome Sciences Centre, British Columbia Cancer Agency, 570West 7th Avenue, Vancouver, British Columbia V5Z 4S6, Canada. 21Department of Pediatrics, Research Center Children’s Hospital of Pittsburgh, 3460 Fifth Avenue, Room 2109,Rangos, Pittsburgh, Pennsylvania 15213, USA. 22Department of Biology, West Virginia University, Morgantown, West Virginia 26505, USA. 23Department of Genetics and SouthwestNational Primate Research Center, Southwest Foundation for Biomedical Research, San Antonio, Texas 78245, USA. 24Center for Human Genetic Research, Massachusetts GeneralHospital, 185 Cambridge Street, Boston, Massachusetts 02114, USA. 25Center for Comparative Medicine and Translational Research, North Carolina State University, 4700Hillsborough Street, Raleigh, North Carolina 27606, USA. 26Department of Veterinary Integrative Biosciences, Texas A&M University, 4458 TAMU, College Station, Texas 77843,USA. 27Whitehead Institute for Biomedical Research, 9 Cambridge Center, Cambridge, Massachusetts 02142, USA.
Vol 447 | 10 May 2007 | doi:10.1038/nature05805
167Nature ©2007 Publishing Group

America, only one extant species can be found there (the Virginiaopossum), whereas all other species are found in South America(including more than 65 species of opossums and shrew opossums)and Australasia (,200 species, including possums, kangaroos, koalasand many small insectivores and carnivores)3.
All sequenced mammalian genomes until now have come fromeutherian species. Although metatherians and eutherians (together,‘therians’) share many ancient mammalian characteristics, they haveeach evolved distinctive morphological and physiological traits.Metatherians are particularly noted for the birth of young at a veryearly stage of development, followed by a lengthy and complex lacta-tional period. Genomic analysis will help reveal the genetic innova-tions that underlie the distinctive traits of each lineage4–6.
Equally important, metatherian genomes can shed light on thehuman genome. Comparative analysis of eutherians has greatlyimproved our understanding of the architecture and functionalorganization of mammalian genomes7–10. Identification of sequenceelements thought to be under purifying selection, on the basis ofcross-species sequence conservation, has led to increasingly refinedinventories of protein-coding genes11,12, proximal and distal regula-tory elements13,14 and putative RNA genes15. Yet, we still know rela-tively little about the evolutionary dynamics of these and otherfunctional elements: how stable is the complement of protein-codinggenes? How rapidly do regulatory sequences appear and disappear?From what substrate do they evolve?
Comparison of the human genome with genomes from distantoutgroups such as birds (divergence ,310 Myr ago) or fish(,450 Myr ago) has provided valuable information. When similaritybetween sequences from such distantly related genomes can bedetected, it surely signals functional importance; but the high spe-cificity of these signals16 is offset by dramatically reduced sensitiv-ity10,17,18. Simulations have shown that the feasibility of aligningorthologous genomic sequences declines rapidly once their meangenetic distance exceeds 1 substitution per site19. The genome ofchicken, the most closely related non-mammalian amniote genomeavailable, is separated from the human genome by approximately 1.7substitutions per site in orthologous, neutrally evolving sequences20.Even moderately constrained functional elements may therefore bedifficult to detect. In contrast, metatherian mammals are well posi-tioned to address this issue: because unconstrained regions of theirgenomes are separated from that of human by only ,1 substitutionper site (see below), most orthologous, constrained sequence shouldbe readily aligned.
Here we report the first high-quality draft of a metatherian genomesequence, which was derived from a female, grey, short-tailed opos-sum—Monodelphis domestica. The species was chosen chiefly onthe availability and utility of the organism for research purposes.M. domestica is a small rapidly breeding South American speciesthat has been raised in pedigreed colonies for more than 25 yearsand developed as one of only two laboratory bred metatherians21,22.M. domestica is being actively used as a model system for investi-gations in mechanisms of imprinting23–25, immunogenetics26–28, neu-robiology, neoplasia and developmental biology (reviewed in ref. 6).For example, newborn opossums are remarkable in that they can healcomplete transections of the spinal cord29. Elucidation of the molecu-lar mechanisms underlying this ability promise important insightsrelevant to regenerative medicine concerning spinal cord or peri-pheral nerve injuries. Other than human, M. domestica is also theonly mammal known in which ultraviolet radiation is a completecarcinogen for malignant melanoma30, and this has led to its estab-lishment as a unique neoplasia model. All of these investigations willdirectly benefit from the development of genomic resources for thisspecies.
Below we describe the generation of the draft sequence of theopossum genome, analyse its large-scale characteristics, and compareit to previously sequenced amniote genomes. Our key findingsinclude:
$ The distinctive features of the opossum genome provide aninformative test of current models of genome evolution and supportthe hypothesis that biased gene conversion has a key role in deter-mining overall nucleotide composition.
$ The evolution of random inactivation of the X chromosome ineutherians correlates with acquisition of X-inactive-specific tran-script (XIST), elevation in long interspersed element (LINE)/L1 den-sity and suppression of large-scale rearrangements.
$ The opossum genome seems to contain 18,000–20,000 protein-coding genes, the vast majority of which have eutherian orthologues.Lineage-specific genes largely originate from expansion and rapidturnover in gene families involved in immunity, sensory perceptionand detoxification.
$ Identification of orthologues of highly divergent immune genesand a novel T-cell receptor isotype challenge previous claims thatmetatherians possess a ‘primitive’ immune system.
$ Of the non-coding sequences conserved among eutherians,,20% seem to have evolved after the divergence from metatherians.Of protein-coding sequences conserved among eutherians, only,1% seems to be absent in opossum.
$ At least 16% of eutherian-specific conserved non-coding ele-ments are clearly derived from transposons, implicating these ele-ments as an important creative force in mammalian evolution.
Extensions to these findings, as well as additional topics, arereported in a series of companion papers31–41.
Genome assembly and single nucleotide polymorphism discovery
We sequenced the genome of a partially inbred female opossum usingthe whole-genome shotgun (WGS) method7,42. The resulting WGSassembly has a total length of 3,475 megabases (Mb), consistent withsize estimates based on flow cytometry (,3.5–3.6 Gb; SupplementaryNotes 1–2 and Supplementary Fig. 2). Approximately 97% of theassembled sequence has been anchored to eight large autosomesand one sex chromosome on the basis of genetic markers mappedby linkage analysis38 or fluorescence in situ hybridization43 (FISH;Supplementary Note 3). The draft genome sequence has high con-tinuity, coverage and accuracy (Table 1; Supplementary Note 4 andSupplementary Tables 1–7).
To enable genetic mapping studies of opossum, we also created alarge catalogue of candidate single nucleotide polymorphisms(SNPs). We identified ,775,000 SNPs within the sequenced indi-vidual by analysing assembled sequence reads. We identified an addi-tional ,510,000 SNPs by generating and comparing ,300,000sequence reads from three individuals from distinct, partiallyoutbred laboratory stocks maintained at the Southwest Foundationfor Biomedical Research (San Antonio, Texas)22,44 (Supplemen-tary Note 5). The SNP rates between the different stocks range from
Table 1 | Genome assembly characteristics
WGS assembly (monDom5)Number of sequence reads 38.8 3 10
6
Sequence redundancy (Q20 bases) 6.83
Contig length (kb; N50*) 108
Scaffold length (Mb; N50) 59.8Anchored bases in the assembly (Mb) 3,412
Estimated euchromatic genome size{ (Mb) 3,475
Integration of physical mapping dataScaffolds anchored on chromosomes 216
Fraction of genome in anchored and oriented scaffolds (%) 91
Fraction of genome in anchored, but unoriented, scaffolds (%) 6
Quality controlBases with quality score $40 (%) 98
Empirical error rate for bases with quality score $40{ (%) 3 3 1025
Empirical euchromatic sequence coverage{ (%) 99
Bases in regions with low probability of structural error1 (%) 98
* N50 is the size x such that 50% of the assembly reside in contigs/scaffolds of length at least x.{ Includes anchored bases and spanned gaps (,2%).{Based on comparison with 1.66 Mb of finished bacterial artificial chromosome (BAC)sequence.1 Based on ARACHNE assembly certification (see Supplementary Note 4).
ARTICLES NATURE | Vol 447 | 10 May 2007
168Nature ©2007 Publishing Group
1 per 360 to 1 per 140 bases and correlate with the distance betweentheir geographical origins (Supplementary Table 8–10 and Supple-mentary Fig. 3).
The data from this study, including the draft genome assembly andSNPs, are freely available on our website (http://www.broad.mit.edu/mammals/opossum/) and have been deposited in appropriate publicdatabases.
Genome landscape
The opossum genome has certain unusual properties that provide anopportunity to test recent models of genome evolution. The opossumautosomes are extremely large: they range from 257 Mb to 748 Mb,with the smallest being larger than the largest chromosome prev-iously sequenced in any amniote (human chromosome 1). In con-trast, the X chromosome is only ,76 Mb long; this is substantiallyless than the size of the X chromosome in any sequenced eutherian.Studies of G-banding and chromosome painting have also shownthat karyotypes and basic chromosomal organization are extraord-inarily conserved throughout Metatheria, even between the distantlyrelated American and Australasian lineages (,55–80 Myr ago)5,45.Sequence composition. Recent analyses have uncovered two majortrends in the evolution of sequence composition in amniote gen-omes: first, most modern lineages seem to be experiencing a gradualdecline in total G1C content relative to their common ancestors46;second, the local rate of recombination is positively correlated withlocal G1C content and, even more strongly, with the local density ofCpG dinucleotides20,47. These observations have led to a proposedmodel48 whereby sequence composition reflects the balance betweena genome-wide, (A1T)-biased mutation process and a localizedrecombination-mediated (G1C)-biased gene conversion process.This model predicts that the sequence composition of a genomicregion is a function of its historical rate of recombination, with thefrequency of hypermutable CpG dinucleotides being a particularlysensitive indicator.
The opossum genome fits the predictions of this model well (seealso refs 34, 35). Current linkage data38 show that the average recom-bination rate for the autosomes (,0.2–0.3 cM Mb21) is lower than inother sequenced amniotes (0.5–.3 cM Mb21). Consistent with theproposed model, the mean autosomal G1C content (37.7%) is alsolower than in other sequenced amniotes (40.9–41.8%) and, in par-ticular, the mean autosomal density of CpGs (0.9%) is twofold lowerthan in other amniotes (1.7–2.2%). Because large-scale patterns ofrecombination seem to be relatively stable in the absence of chromo-somal rearrangements49,50, the stability of the opossum karyotypesuggests that the majority of the genome has experienced low re-combination rates over an extended period. Indeed, the sequencecomposition is also more homogeneous than seen in other amniotes(Fig. 1).
The subtelomeric regions of autosomes are notable outliers withrespect to sequence composition in the opossum genome, provid-ing additional support for the biased gene conversion hypothesis.Cytological studies in opossum51,52 suggest that the rate of chiasmataformation (and hence meiotic recombination) is relatively uniformacross each autosome in males, whereas it is strongly biased to sub-telomeric regions in females. Consistent with a higher sex-averagedrate of recombination, mean G1C-content (41.6%) and CpG density(1.9%) are significantly elevated within ,10 Mb of the chromosomeends (Supplementary Fig. 4).
Similarly, the very short X chromosome also supports the biasedgene conversion hypothesis. Although few linkage data are currentlyavailable for opossum X chromosome, the average effective recom-bination rate must be at least 0.44 cM Mb21, and thus larger than forthe autosomes. (This estimate follows from the requirement of atleast one meiotic crossover per bivalent in the female germ-line53,54.)The mean G1C content (40.9%) and CpG density (1.4%) of theX chromosome are substantially higher than for any of the autosomes(Supplementary Table 11). The opossum pattern is thus the oppositeof that seen in eutherians, in which the X chromosome has lowrecombination and low G1C content and CpG density (Table 2).Segmental duplication. In human and other eutherians, segmentalduplications (defined as pairs of regions with $90% sequence sim-ilarity over $1 kb) are associated with chromosomal fragility andsyntenic breakpoints55,56. The relative karyotypic stability of meta-therians therefore indicated that they might have a low proportion ofsegmental duplications.
The overall proportion of segmental duplication in opossum(1.7%) is indeed substantially lower than in other sequencedamniotes (2.5–5.3%). The segmental duplications are also relativelyshort: only 22 exceed 100 kb in opossum as compared with 483 inhuman (Supplementary Table 12). Additionally, the segmentalduplications are more locally distributed: 76% are intrachromosomal(versus 46% for human) and the median distance between relatedduplications is 175 kb (versus 2.2 Mb for human). We find no indica-tion that correction for over-collapsed duplications in the assembly
G+C fraction
Frac
tion
of 1
0-kb
win
dow
s
0.30 0.35 0.40 0.45 0.50 0.55 0.60
0.14
0.12
0.10
0.08
0.06
0.04
0.02
0
Figure 1 | Sequence composition in the opossum genome. Distribution ofG1C content in 10-kb windows across the genome in opossum (blue),human (red), mouse (black), dog (green) and chicken (purple).
Table 2 | Comparative analysis of genome landscape in opossum and otheramniotes
Opossum Human Mouse Dog Chicken
Euchromatic genome size (Mb) 3,475 2,880 2,550 2,330 1,050
KaryotypeHaploid number 9 23 20 39 33
Autosomal size range (Mb) 258–748 47–247 61–197 27–125 5–201
X chromosome size (Mb) 76 155 167 127 NASegmental duplications
Autosomal (%) 1.7 5.2 5.3 2.5 10.4Intrachromosomal duplications (%) 76 46 84 ND NDMedian length between
duplications (Mb)0.18 2.2 1.6 0.33 0.03
X chromosome (%) 3.3 4.1 13 1.7 NAInterspersed repeats (%)
Total 52.2 45.5 40.9 35.5 9.4LINE/non-LTR retrotransposon 29.2 20.0 19.6 18.2 6.5SINE 10.4 12.6 7.2 10.2 NAEndogenous retrovirus 10.6 8.1 9.8 3.7 1.3DNA transposon 1.7 2.8 0.8 1.9 0.8
G1C content (%)Autosomal 37.7 40.9 41.8 41.1 41.5X chromosome 40.9 39.5 39.2 40.2 NA
CpG content (%)Autosomal 0.9 2.0 1.7 2.2 2.1X chromosome 1.4 1.7 1.2 1.9 NA
Recombination rate (cM Mb21)Autosomal* ,0.2–0.3 1–2 0.5–1 1.3–3.4{ 2.5–21
X chromosome{ $0.441 0.8 0.3 ND NA
NA, not applicable; ND, no or insufficient data.* Range of chromosome-averaged recombination rates.{ See Æhttp://www.vgl.ucdavis.edu/research/canine/projects/linkage_map/data/æ{ Estimated as 2/3 of the female rate.1 See text.
NATURE | Vol 447 | 10 May 2007 ARTICLES
169Nature ©2007 Publishing Group

would significantly alter these estimates (Supplementary Note 6 andSupplementary Table 13).Transposable elements. Metatherian transposable elements largelybelong to families also found in eutherians, but can be divided intomore than 500 subfamilies, many of which are lineage specific (cata-logued in Repbase57). At least 52% of the opossum genome can berecognized as transposable elements and other interspersed repeats(Table 2)33,35, which is more than in any of the other sequencedamniotes (34–43%). Notably, the opossum genome is significantly en-riched in non-long terminal repeat (LTR) retrotransposons (LINEs,29%), comprising copies of various LINE subfamilies. Given the lowabundance of segmental duplications, accumulation of transposableelements seems to be the primary reason for the relatively large opos-sum genome size. The total euchromatic sequence that is not re-cognized as transposable elements is rather similar in opossum andhuman (1638 Mb versus 1568 Mb, respectively). The enrichment ofLINEs may be related to the overall low recombination rate in opos-sum, inasmuch as studies of eutherian genomes have shown thatLINEs occur at elevated densities in regions with low local recombina-tion rates47.
Conserved synteny
Identification of syntenic segments between related genomes canfacilitate reconstruction of chromosomal evolution and identifica-tion of orthologous functional elements. Starting from nucleotide-level, reciprocal-best alignments (‘synteny anchors’), we found thatthe opossum and human genomes can be subdivided (at a resolutionof 500 kb) into 510 collinear segments with an N50 length (size x suchthat 50% of the assembly is in units of length at least x) of 19.7 Mb,which cover 93% of the opossum genome (Supplementary Fig. 5). Iflocal rearrangements are disregarded, these segments can be furthergrouped into 372 blocks of large-scale, conserved synteny.
Extending this analysis to additional eutherians (mouse, rat anddog), with chicken as an additional outgroup, we created a high-resolution synteny map that reveals 616 blocks of conserved syntenyacross the five fully sequenced mammals (Supplementary Note 7,Supplementary Figs 6–7 and Supplementary Table 14). Because themajority of synteny breakpoints between human, mouse, rat and dogare clearly lineage specific (see also ref. 10), genomic regions that were
probably contiguous in the last common boreoeutherian ancestorcan be inferred by parsimony (Supplementary Note 8). We foundthat the mammalian synteny blocks can be used to infer 43 connectedgroups in the ancestral boreoeutherian genome (Supplementary Fig.8). In fact, the largest 30 groups cover 95% of the human genome (seealso ref. 58).
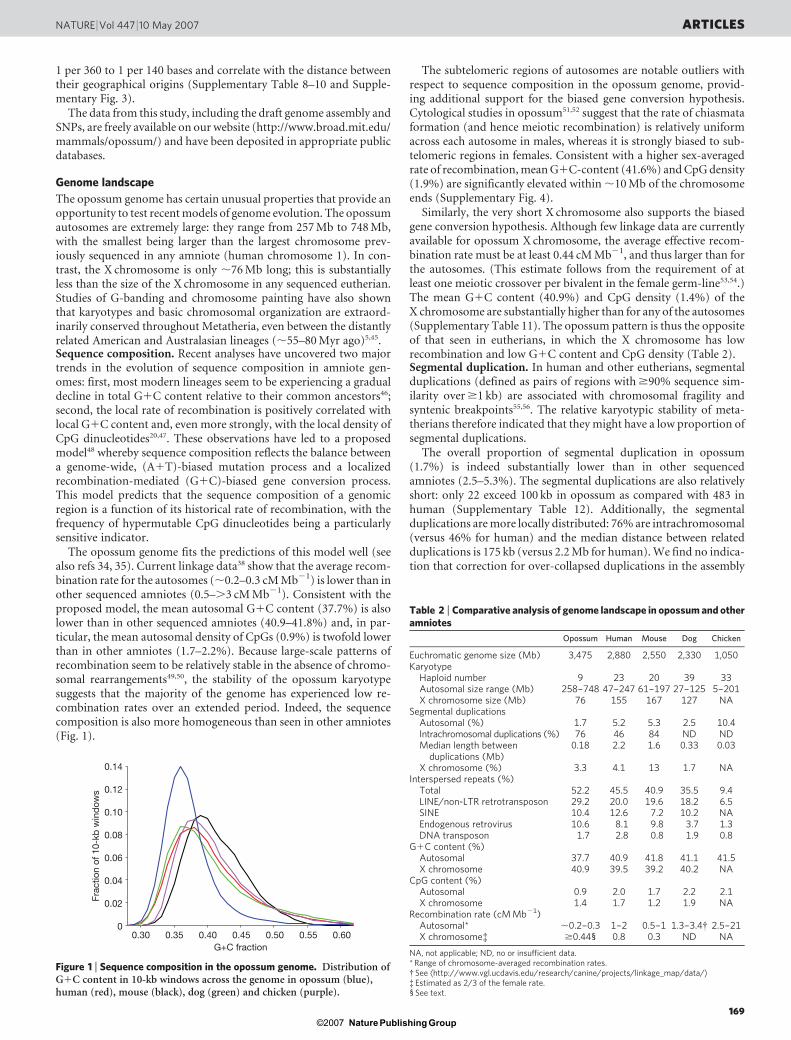
The resulting synteny map can be used to clarify chromosomalrearrangements during early mammalian evolution. For example,limited comparative mapping previously revealed that the eutherianX chromosome contains an ‘X-conserved region’ (XCR) that corre-sponds to the ancestral therian X chromosome, and an ‘X-addedregion’ (XAR), which was translocated from an autosome after thesplit from Metatheria59,60. The exact extent of the XCR has beenunclear, however, owing to unclear synteny with non-mammalianout-groups at its boundary61. Using our high-resolution synteny mapwe can now confidently map the XAR–XCR fusion point to 46.85 Mbon human chromosome band Xp11.3 (Fig. 2).
X chromosome inactivation
In opossum and other metatherian mammals, dosage compensationfor X-linked genes is achieved through inactivity of the paternallyderived X chromosome in females62. In contrast, eutherian dosagecompensation involves inactivation of the paternal X chromosomeat spermatogenesis, reactivation in the early embryo, followedby random and clonally stable inactivation of one of the twoX chromosomes in each cell of female embryos63. The random in-activation step is controlled by a complex locus known as theX inactivation centre (XIC). In the early female embryo, the non-coding XIST gene is transcribed from the XIC and coats one chro-mosome, in cis, to initiate silencing of the majority of its genes. It hasbeen proposed that paternal X chromosome inactivation representsthe ancestral therian dosage compensation system, and that randomX chromosome inactivation is a recent innovation in the eutherianlineage64,65. The opossum genome sequence provides the first oppor-tunity to test major hypotheses about the evolution of this system.No XIST homologue in opossum. We searched all assembled andunassembled opossum WGS sequence for homology to the humanand mouse XIC non-coding genes but, in agreement with a recentreport66, did not find any significant alignments. (In particular, we
80
70
60
50
40
30
20
10
8070605040302010 15014013012011010090
Chr X: 73.2–73.4Chr X: 71.7–72.2Chr 7: 52.4–53.1 Chr X: 55.5Chr Un: 6.0–6.5*
CLCN5PAGE4PAGE1
GAGE8LMO6PRAF2
KCND1HDAC6
WASRBM3
SLC38A5SSX3SSX5
ZNF630ZNF81ZNF21
CFPRGN UBE1ZNF157
ZNF41RP2CHST7 UPRTKIAA2022 ABCB7SLC16A2XIST ZCCHC13CHIC1CDX4
Chr X: 26.2–26.3
Human Chr X
Op
ossu
m p
ositi
on (M
b)
(Mb)
Opossumchromosomes
47
XUn
Figure 2 | Opossum–human synteny for the X chromsome. The dot plotshows correspondence between the human chromosome (Chr) X andopossum chromosomes at a resolution of 300 kb. Expanded views, at aresolution of 50 kb, of the XAR–XCR fusion and the XIC are shown on the
bottom left and right, respectively. In the XIC region, the closest contig onthe distal flank (*) was not anchored in the monDom5 assembly (seeMethods), but has been subsequently mapped near UPRT (opossumX chromosome ,55 Mb) by FISH40.
ARTICLES NATURE | Vol 447 | 10 May 2007
170Nature ©2007 Publishing Group

found no match to the highly conserved 150-bp region overlappingthe critical exon 4 of XIST; this region is so strongly conserved in theEutheria that it should be readily detectable if present40.) Analysis ofsynteny in the regions surrounding the eutherian XIC also revealedthat it has been disrupted by large-scale rearrangements (Fig. 2)40,41.In eutherians, the XIC is flanked by the ancient protein-coding genesCDX4–CHIC1 on one side and SLC16A2–RNF12 on the other side. Inboth chicken and frog these four genes are clustered in autosomalXIC homologous regions (which do not contain homologues of theXIC non-coding genes66). On the opossum X chromosome, however,these two pairs of genes are separated by ,29 Mb (compared with,750 Kb in human). Taken together, the evidence strongly suggeststhat XIST is specific to eutherians40,41,66.The Lyon repeat hypothesis. LINE/L1 elements are of particularinterest to the study of X chromosome inactivation. These transpos-able elements have been proposed to act as ‘boosters’ for the spread ofX chromosome inactivation in cis from the XIC (reviewed in ref. 67).This hypothesis is supported in part by the observation that inhuman, LINE/L1 density is significantly elevated in the XCR(33%), where nearly all genes are inactivated, but approximates theautosomal density in the XAR (19%), where many genes escapeinactivation (Fig. 3)61,68. In mouse, we found that the LINE/L1 den-sity is elevated in both the XCR (35%) and the XAR (32%), which isconsistent with the observation that genes that escape inactivation onthe human XAR are often inactivated in mouse69. As previouslyobserved in human68, the LINE/L1 elevation in mouse is particularlydramatic among recent, lineage-specific subfamilies (SupplementaryFig. 9).
In contrast to human and mouse, the LINE/L1 density on theopossum X chromosome (22%) is significantly lower than in theeutherian XCR, and is in fact slightly less than in the autosomal regionshomologous to the eutherian XAR (23%). This difference betweenmetatherian and eutherian X chromosomes is not readily explained byany simple correlation between LINE/L1 density, recombination ormutation rates. We therefore conclude that LINE/L1 density isunlikely to be a critical factor for X chromosome inactivation in themetatherian lineage, and that the approximately twofold increase onthe eutherian X chromosome may be directly related to the acquisitionof XIST and random X chromosome inactivation.Suppression of large-scale rearrangements. Comparative analyseshave revealed that the structure of the human X chromosome hasremained essentially unchanged since the eutherian radiation10,20,61. Apossible reason is that the requirement for XIST transcripts to spreadacross the chromosome from a central location has led to selectionagainst structural rearrangements. For example, translocation ofLINE/L1-poor XAR segments into the XCR could potentially disruptinactivation at more distal loci. Consistent with this hypothesis, oursynteny map reveals that the XAR and XCR homologous regions haveexperienced several major rearrangements both in the opossum lin-eage (,15 lineage-specific synteny breakpoints) and in the eutherianlineage before the eutherian radiation (,9 lineage-specific break-points; Supplementary Table 15). The low rate of rearrangementsin the human lineage is therefore unlikely to be due to functions or
sequences that were present on the ancestral therian X chromosome,or in early eutherian evolution.
We note that unlike in human, the mouse X chromosome hasexperienced several rearrangements (with 15 lineage-specific syntenybreakpoints), such that the XAR and XCR are no longer two separatesegments. This would be consistent with the more comprehensiveinactivation in the mouse imposing weaker constraints on rearrange-ment. Although little is known about the extent of X chromosomeinactivation in dog or rat, their X chromosomes are also consistentwith this hypothesis. The dog X chromosome is collinear with humanand is enriched for LINE/L1 only in the XCR (33.4% versus 16.8%for the XAR). The rat X chromosome has accumulated ,4 lineage-specific synteny breakpoints after the divergence from mouse61, andis similarly enriched for LINE/L1 in both the XCR (36.7%) and theXAR (34.5%).
Genes
The gene content of metatherian and eutherian genomes provideskey information about biological functions. We analysed the genecontent of the opossum genome and compared it with that of thehuman genome. We focused on instances of rapid divergence andduplication of protein-coding genes, which have led to lineage-spe-cific gene complements70.Gene catalogue. We generated an initial catalogue of 18,648 pre-dicted protein-coding genes and 946 non-coding genes (primarilysmall nuclear RNA, small nucleolar RNA, microRNA and ribosomalRNA) in opossum34 (Supplementary Note 9 and SupplementaryData). Regularly updated annotations can be obtained from publicdatabases (http://www.ensembl.org and http://genome.ucsc.edu).
We next characterized orthology and paralogy relationshipsbetween predicted protein-coding genes in opossum and human11
(Table 3). We could identify unambiguous human orthologues for15,320 (82%) of the opossum predicted genes, with 12,898 caseshaving a single copy in each species (1:1 orthologues). Notably, weidentified orthologues of key T-cell lineage markers such as CD4 andCD8, which had not been successfully identified by cloning inmetatherian species39. Most (2,704) of the remaining genes arehomologous to human genes, but could not be assigned to ortholo-gous groups with certainty.
A small number (624) of predicted opossum genes have no clearhomologue among the human gene predictions. Inspection revealedthat most of these are short (median length of 120 amino acids,compared with 445 for 1:1 orthologues) and probably originate frompseudogenes or spurious open reading frames. Only eight currentlyhave strong evidence of representing functional genes without homo-logues in humans (Supplementary Table 16). These include CPD-photolyase, which is part of an ancestral photorepair system stillactive in opossum71, malate synthase72 and inosine/uridine hydro-lase. The latter two are ancient genes not previously identified in amammalian species.
Conversely, approximately ,1,100 current gene predictions fromhuman have no clear homologue in the initial opossum catalogue(Supplementary Data). Of these, ,620 can be at least partially
60
LIN
E/L
1 d
ensi
ty (%
)
50403020100
A XAR XCR A XAR XCR A XAR XCR
Opossum Human Mouse
Figure 3 | Enrichment of LINE/L1 correlates with random X chromosomeinactivation. Box plot of LINE/L1 density in 500-kb intervals across theautosomes (A), the X-added region (XAR) and its homologous regions inopossum, and the X conserved region (XCR). Red bar, median; box edges,25th and 75th percentiles; whiskers, range.
Table 3 | Opossum and human gene predictions and projected gene counts
Protein-coding genes Opossum
Initial predictions 18,648
Orthologues in human* 15,320
1:1 12,898
Many:1 1,016
1:Many 451
Many:Many 582
Homologues in human, but unclear orthology{ 2,704
No predicted homologues in human 624
Projected total{ 18,000–20,000
* Includes some cases where multiple transcripts have inconsistent phylogenies, or where thepredicted orthologue is a putative pseudogene.{ Includes members of highly duplicated gene families.{Accounting for missed annotations in opossum and removal of probable pseudogenes.
NATURE | Vol 447 | 10 May 2007 ARTICLES
171Nature ©2007 Publishing Group

aligned to the opossum genome and may not have been annotated asgenes owing to imperfections in the draft assembly or high sequencedivergence. In particular, manual re-annotation identified ortholo-gues of several rapidly evolving cytokines39. The remaining predic-tions are dominated by gene families known to have undergoneexpansion and rapid evolution in the human lineage, such asb-defensins and cancer-testis antigens. On the basis of our compar-ison, we conclude that the opossum genome probably contains,18,000–20,000 protein-coding genes, with the vast majority havingeutherian orthologues.Divergence rates among orthologues. We calculated the synonym-ous substitution rate (KS; substitutions that do not result in aminoacid change because of codon redundancy) of 1:1 opossum–humanorthologues to approximate the unconstrained divergence ratebetween the species7,10. The median value of KS is 1.02. Consistentwith expectation, this value is substantially smaller than the chicken–human KS value (1.7), with the ratio being very close to the ratio ofprior estimates of the divergence times for the two lineages(,180 Myr ago for opossum and ,310 Myr ago for chicken).
Notably, the median KS for orthologues located on the XCR issignificantly elevated relative to orthologues located on autosomesin both species (1.2 versus 1.0; P , 1023; see also refs 34, 35). This isthe opposite to what is observed within Eutheria10, but is consistentwith the expectation that the higher G1C-content and recombina-tion rate on the opossum X chromosome relative to its autosomesimplies a higher rate of mutation47. A similar elevation can also bedetected in subtelomeric regions34.Innovation and turnover in gene families. We next studied theevolution of gene family expansions in the metatherian lineage.The opossum gene catalogue contains 2,743 (15%) genes that haveprobably been involved in one or more duplication or gene conver-sion event since the last common ancestor with eutherian mammals,as inferred from low KS between the copies (median 5 0.41). Thenumber of duplications is one-third fewer than the number ofhuman lineage-specific duplications (4,037; 20%), which may reflectthe lower rate of segmental duplication in the opossum genome.
We found a large number of lineage-specific copies of genesinvolved in sensory perception, such as the c-crystallin family ofeye lens proteins73, and taste, odorant74 and pheromone receptors.Other major lineage-specific duplications were found in the rapidlyevolving KRAB zinc-finger family, and in genes related to toxindegradation and dietary adaptations, including cytochrome P450and various gastric enzymes (see also ref. 34).
Innovation in the innate and adaptive immune systems is visiblethrough substantial duplication or gene conversion involving theleukocyte receptor and natural killer complexes, immunoglobulins,type I interferons and defensins32,39. The opossum genome also con-tains a new T-cell receptor isotype that is expressed early in ontogeny,before conventional T-cell receptors, and may provide early immunefunction in the altricial young37.
The opossum also shows some surprising gene family expansionsthat are without precedent in other vertebrates. Notable among theseare multiple duplications of the nonsense-mediated decay factorsSMG5 and SMG6, and the pre-mRNA splicing factors, KIAA1604and PRP18. The opossum genome also harbours two adjacent para-logous copies of DNA (cytosine-5)-methyltransferase 1 (DNMT1),which catalyses methylation of CpG dinucleotides. It will be inter-esting to discover if specialized functions have been adopted by theseparalogous genes.
The patterns of evolution among duplicated genes largely mirrorthose observed in eutherians34,70. The set of opossum paraloguesis strongly biased towards recent duplications (KS , 0.1) and in gen-eral have accumulated a disproportionately high number of non-synonymous mutations (Fig. 4). The median intraspecies ratio ofnonsynonymous to synonymous substitution rates (KA/KS) betweenparalogues is 0.51, which is sixfold higher than the interspecies ratioseen for 1:1 orthologues (0.086). This is consistent with the rapid
gene birth and death model75, which predicts that duplicated geneseither undergo functional divergence in response to positive selectionor rapidly degenerate owing to lack of evolutionary benefit.
Conserved sequence elements
The most surprising discovery to emerge from comparative analysesof eutherian genomes is the finding that the majority of evolution-arily conserved sequence does not represent protein-coding genes,but rather are conserved non-coding elements (CNEs)7,10. The opos-sum genome provides a well-positioned outgroup to study the originand evolution of these elements.
For simplicity, we will refer to sequence elements as ‘amnioteconserved elements’ if they are conserved between chicken and atleast one of opossum or human; ‘eutherian conserved elements’ ifthey are conserved between human and at least one of mouse, rat ordog; and ‘eutherian-specific elements’ if they are eutherian conservedsequence absent from both opossum and chicken. (‘Metatherian-specific elements’ surely also exist, but cannot be identified withoutadditional metatherian genomes.)Loss of amniote conserved elements in mammals. We first studiedthe extent to which amniote conserved elements have been lost inthe human lineage. We focused on ,133,000 conserved intervalsbetween opossum and chicken (68 Mb), ,50% of which overlapsprotein-coding regions (Supplementary Data).
Nearly all (97.5%) of these amniote conserved elements can bealigned to the human genome (Fig. 5a). We reasoned that some ofthe remainder might be orthologous to sequence that lies within gapsin the current human assembly, or which had been missed by theinitial genome-wide alignment. We therefore repeated the analysis,focusing only on amniote elements present in opossum and occur-ring in ‘ungapped intervals’ (that is, syntenic intervals betweenhuman and opossum that have no sequence gaps); the ungappedintervals contain 63% of all conserved elements.
We found that 99.0% of amniote elements in ungapped intervalscould be unambiguously aligned to the human genome. The remain-ing 1.0% of amniote elements could not be found even by a moresensitive alignment algorithm (Fig. 5b), and thus seem to have beenlost in the human lineage.
Pro
por
tion
of g
enes
(%)
0.00 0.50 1.00 1.50KA/KS
ImmunityKRAB/ZnFDetoxificationReproductionOlfactionAll opossum in-paralogues1:1 orthologues
100
75
50
25
0
Figure 4 | Cumulative distribution of KA/KS values for duplicated genes.Estimates are shown for pairs of genes duplicated in opossum(in-paralogues) in the most common functional categories: immunity,KRAB zinc finger (ZnF) transcription factors, detoxification (includingcytochrome P450, sulphotransferases), reproduction (includingvomeronasal receptors, lipocalins and b-seminoproteins) and olfaction. Thetotal distributions for opossum in-paralogues and opossum–human 1:1orthologues are shown for comparison.
ARTICLES NATURE | Vol 447 | 10 May 2007
172Nature ©2007 Publishing Group

We also performed the converse analysis, by aligning the humanand chicken genomes to identify amniote conserved elements poten-tially lost in opossum. The results were similar, with 99.4% of ele-ments in ungapped intervals being readily aligned to opossum.
We conclude that the vast majority of amniote conserved elementsencode such fundamental functions that they cannot be lost in eithereutherians or metatherians. Nonetheless, the small fractions thathave been lost correspond to more than 1,400 elements in total; itwill be interesting to investigate their function and the consequenceof their loss. Notably, although protein-coding sequence comprises50% of all amniote conserved elements, they comprise only 4% of theelements lost in one of the lineages.Eutherian-specific conserved elements. We next explored theappearance of novel conserved elements in the lineage leading fromthe common therian ancestor to the boreoeutherian ancestor, whichcould shed light on the origin of such elements in general. We identifieda collection of eutherian conserved elements that cover 104 Mb (3.7%)of the human genome, using the phylo-HMM approach14; ,29% ofthem overlap protein-coding sequence (Supplementary Data).
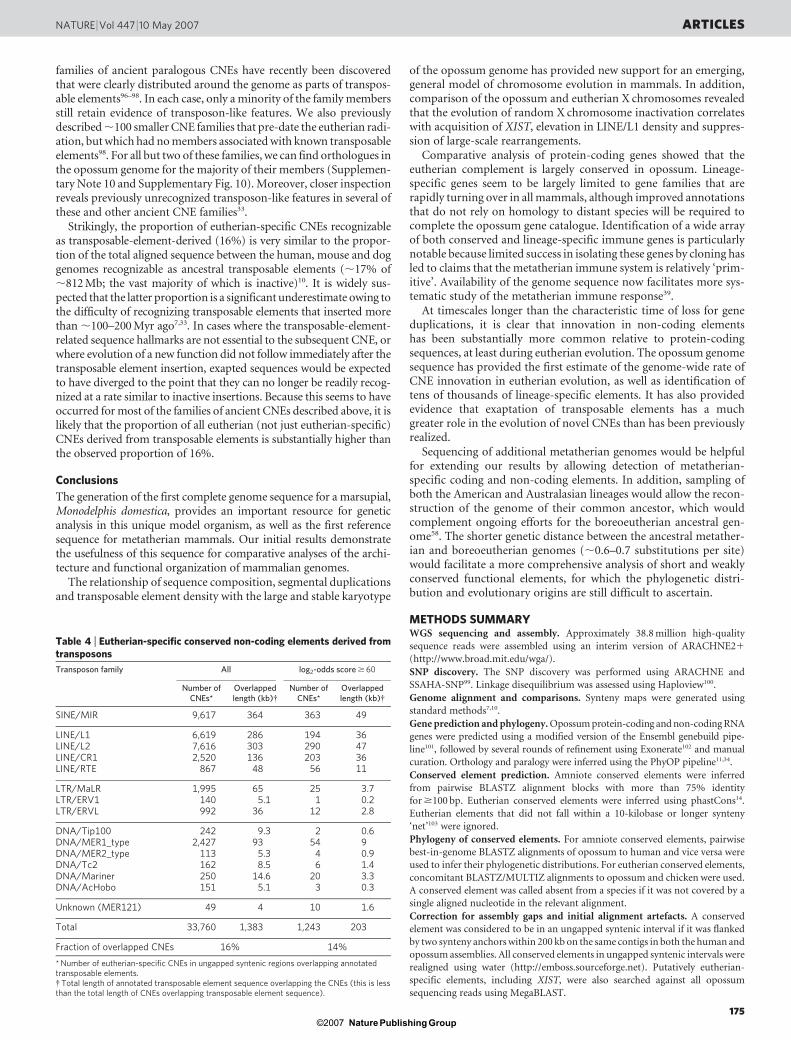
Only a small proportion of human conserved protein-codingsequences could not be aligned to the opossum genome (1.1% inungapped regions; Fig. 5c). In contrast, a much larger proportionof human non-coding elements seem to be eutherian specific (20.5%in ungapped regions). Taking the results from ungapped syntenicintervals as a conservative estimate for the proportion of totalinnovation, we conclude that approximately 14.8 Mb (1.1% of30 Mb of coding sequence and 20.5% of 74 Mb of CNEs) of theeutherian conserved elements are eutherian specific.
The amount of apparent innovation is highest among short andmoderately conserved elements (median length of 37 bp; medianlog2-odds score 5 22), probably reflecting, in part, that shorter ele-ments may more readily diverge beyond recognition (see also refs 36,76). Nonetheless, substantial innovation is apparent even amongelements that are relatively long and unambiguously conservedwithin Eutheria. For example, the proportion of eutherian-specificelements is 8.1% among CNEs with log2-odds score $ 60, which havea median length of 197 bp (Fig. 5d).Lineage-specific CNEs correspond to functional elements. Toestablish the biological relevance of lineage-specific CNEs, we exam-ined the overlap of eutherian and amniote CNEs with two disparatesets of experimentally identified functional elements. If the euther-ian-specific CNEs were enriched for false-positive predictions, wewould expect them to be substantially under-represented amongthese functional elements.
We first considered a set of known human microRNAs(miRNAs)77. Of the 51 miRNAs that overlap amniote CNEs, onlyone (hsa-mir-194-1; ref. 78) seems to have been lost in opossum(Fig. 5e). (The mature form of this miRNA is identical to a secondconserved miRNA, hsa-mir-194-2, which does have an opossumorthologue; this apparent redundancy may have made it more sus-ceptible to lineage-specific loss.) Of the 183 miRNAs that overlapeutherian CNEs in ungapped syntenic regions, 27 (15%) correspondto eutherian-specific elements (Supplementary Data). An example isan 87-bp eutherian-specific CNE corresponding to hsa-mir-28; it haspreviously been detected by northern blot analysis in human andmouse, but not in any non-mammalian species79.
a
c
Amnioteelements Type
Phylogenetic distribution (Mb)
Present in all Lost in human
All(chicken–opossum)
Ungapped(chicken–opossum)
ProteinCNE
ProteinCNE
33.532.4
22.020.4
0.091.59
0.010.40
Eutherianelements Type
Phylogenetic distribution (Mb)
AmniotesEutheria+ chicken
Ungapped
ProteinCNE
ProteinCNE
22.4520.96
17.6015.76
0.481.38
0.050.38
Eutheria+ opossum
Eutheria-specific
6.2230.39
4.4221.05
0.9621.40
0.259.60
Ungapped(log2-odds score ≥60)
ProteinCNE
12.6211.59
0.010.16
1.939.50
0.051.87
All(chicken–human)
ProteinCNE
30.531.3
——
Ungapped(chicken–human)
ProteinCNE
19.216.8
——
Lost in opossum
——
——
0.501.57
0.020.22
All
Normalized Smith–Waterman score2.01.0 4.03.0 5.0
Frac
tion
of e
lem
ents
Frac
tion
of e
lem
ents
b
d
0
Normalized Smith–Waterman score
2.01.0 4.03.0 5.00
MdHsGg
MdHsMmCf
e f
MouseDog
OpossumChicken
hsa-mir-215 hsa-mir-194-1
Chr 1 218,357,900 218,358,100 218,358,300 218,358,500
MouseDog
OpossumChicken
Chr 18 59,117,000 59,118,000 59,119,000 59,120,000
DNase HS 12023_4
0.25
0.20
0.15
0.10
0.05
0
0.30
0.25
0.20
0.15
0.10
0.05
0
0.30
Figure 5 | Lineage-specific conserved sequence elements. a, Phylogeneticdistribution of amniote conserved elements. b, Distribution for alignmentscores of amniote elements, represented by opossum (human), to ungappedsyntenic intervals in the human (opossum) genome, for shared (purple) andlineage-specific (orange) elements, and randomly permuted sequences of thesame length and base composition (green). Ungapped syntenic intervals areflanked by two synteny anchors (white) and contain no assembly gaps(inset). Md, Monodelphis domestica; Hs, Homo sapiens; Gg, Gallusgallus. c, Phylogenetic distribution of eutherian conserved elements.d, Distribution of alignment scores for eutherian CNEs (log2-odds
score $ 60), represented by human, to ungapped syntenic intervals in theopossum genome, for shared (blue) and eutherian-specific (red) elements,and randomly permuted sequences of the same length and base composition(green). The bimodal distribution of scores confirms that highly conservedeutherian-specific elements have no significant homology in the syntenicopossum sequence. Mm, Mus musculus; Cf, Canis familiaris. e, The miRNAhsa-mir-194-1 corresponds to an amniote CNE lost in opossum (orange). Itis flanked by an unrelated amniote miRNA that is present in opossum(purple). f, A eutherian-specific CNE in the intron of the BCL2 gene (red)overlaps a DNase hypersensitive site in human lymphocytes (black).
NATURE | Vol 447 | 10 May 2007 ARTICLES
173Nature ©2007 Publishing Group

We next considered a genome-wide set of DNase hypersensitive sitesfrom human lymphocytes, which represent a variety of putative reg-ulatory elements80. Of the 290 sites that overlap amniote CNEs presentin human, none overlaps instances that are lost in opossum. Of the2,041 sites that overlap eutherian CNEs in ungapped syntenic regions,407 (20%) exclusively overlap eutherian-specific elements (Supplem-entary Data). An example is a 269-bp eutherian-specific CNE inintron 2 of the apoptosis regulator BCL2, which overlaps a DNasehypersensitive site, suggesting it has a cis-regulatory function (Fig. 5f).
The fraction of eutherian CNEs overlapping DNase hypersensitivesites that are eutherian specific is strikingly similar to the fraction ofall conserved non-coding sequence that is eutherian specific (20.5%).The fraction of miRNAs that correspond to eutherian-specific CNEsis slightly lower (15%), which is consistent with their higher averageconservation scores. In particular, the results provide strong evidencethat the majority of eutherian-specific CNEs are likely to be genuinefunctional elements.Lineage-specific CNEs associated with key developmental genes.We next explored the distribution of lineage-specific CNEs across thehuman genome. Overall, there is a strong regional correlationbetween the density of eutherian CNEs shared with opossum andthe density of eutherian-specific CNEs (Spearman’s r 5 0.82 for1-Mb windows; Fig. 6). The densities of amniote CNEs present orlost in opossum are also positively correlated (Spearman’s r 5 0.30).
Previous studies have shown that both eutherian and amnioteCNEs are enriched in certain large, gene-poor regions surroundinggenes that have key roles in development, primarily encoding tran-scription factors, morphogens and axon guidance receptors10,81,82.For example, 35% of all eutherian CNEs and 49% of all amnioteCNEs (in ungapped syntenic regions) lie within the 204 largest clus-ters of CNEs in the human genome (described in ref. 10). The ,240key developmental genes in these regions have relatively low ratesof amino acid divergence (median KA/KS 5 0.03) and show littleevidence of lineage-specific loss or duplications. In contrast, wefound that the rate of gain and loss of CNEs in the same regions isonly moderately (,30%) lower than elsewhere in the genome.Indeed, we identified more than 37,000 lineage-specific CNEs inthese developmentally important regions.
Because experimental studies of CNEs in these regions have fre-quently uncovered cis-regulatory functions affecting the nearby develop-mental genes16,82–85, the substantial innovations in these regions arecandidates for genetic changes underlying differential morphologicaland neurological evolution in mammalian lineages. This pattern wouldbe consistent with the notion that modification of regulatory networkshas been a major force in the evolution of animal diversity86–88.Eutherian-specific CNEs derived from transposable elements. Ingeneral, each eutherian-specific element must have arisen by one ofthree mechanisms: (1) divergence of an ancestral functional element
to such an extent that its similarity is no longer detectable; (2)duplication of an ancestral functional element giving rise to an ele-ment without a 1:1 orthologue in other clades; or (3) evolution of anovel functional element from sequence that was absent or non-functional in the ancestral genome.
The first mechanism is not likely to account for most of the euther-ian-specific CNE sequence, at least among those with high conser-vation scores—if an ancient functional element underwent suchrapid divergence at some point in the eutherian lineage that it is nolonger detectable, then there should be concomitant ‘loss’ of anamniote conserved element. But, lineage-specific loss seems to berelatively rare for both amniote elements, as shown above, and foreutherian elements10.The majority of eutherian-specific conservedelements therefore probably arose after the metatherian divergence,either by adaptive evolution of new or previously non-functionalsequence, or by duplication of ancestral elements.
One intriguing source for eutherian-specific CNEs is transposableelements. A number of researchers have argued that transposableelements offer an obvious and ideal substrate for the evolution oflineage-specific functions89–93. Transposable elements contain a vari-ety of functional subunits that can be exapted and modified by thehost genome89,91, and they can mediate duplication of existing CNEsto distant genomic locations through transduction or chimaerism92.Individual instances of CNEs derived from transposable elementshave been described previously14,94,95. However, these cases togethercomprise only a trivial fraction of the CNEs in the human genome. Ithas thus been unclear whether the evolution of CNEs from transpos-able elements represents a general mechanism or a rare exception.
When we examined the set of eutherian-specific CNEs, we found astriking overlap with transposable elements. In ungapped syntenicintervals, at least 16% of eutherian-specific CNEs overlap currentlyrecognized transposable elements in human. The fraction is similar(14%) if we focus only on the most highly conserved elements(phylo-HMM log2-odds score) $ 60, see above). The overlappingtransposable elements originate from most major transposon fam-ilies found in eutherians (Table 4), and are not clearly differentiatedfrom other CNEs in terms of distribution across the genome. Thisimplies that transposable-element-mediated evolution has been asignificant creative force in the emergence of recent CNEs. The factthat sequences from transposable elements themselves can be iden-tified within these CNEs also implies that exaptation of at least aportion of the transposable element, rather than simply incidentaltransduction of adjacent sequence, has been a frequent occurrence.
In contrast, the eutherian CNEs that are present in opossum (andthus are more ancient) only rarely show overlap with recognizabletransposable elements (,0.7%). We speculate that many of theseCNEs also arose from transposable elements, but that they are difficultto recognize as such owing to substantial divergence. In fact, three large
EutherianTherianAmniote
182.7 182.8 182.9 183.0 183.1 183.2
SOX2
(Mb)
SA
TB1
WN
T5A
FEZ
2
FOX
P1
RO
BO
1/2
GB
E1
IGS
F4D
ZB
TB20
LSA
MP
EP
HB
1
ZIC
1/4
SH
OX
2
EV
I1
SO
X2
LPP
Figure 6 | Lineage-specific CNEs near key developmental genes. Thedensities of eutherian CNEs present (blue) or absent (red) in opossum areplotted in 1-Mb sliding windows across human chromosome 3. Peaks in thedistributions often correspond to key developmental genes. The expanded
view shows positions of amniote CNEs (purple), eutherian CNEs notoverlapping amniote CNEs (blue) and eutherian-specific CNEs (red) acrossa 500-kb gene desert surrounding the SOX2 transcription factor gene. Oneamniote CNE present in human has been lost in opossum (orange).
ARTICLES NATURE | Vol 447 | 10 May 2007
174Nature ©2007 Publishing Group
families of ancient paralogous CNEs have recently been discoveredthat were clearly distributed around the genome as parts of transpos-able elements96–98. In each case, only a minority of the family membersstill retain evidence of transposon-like features. We also previouslydescribed ,100 smaller CNE families that pre-date the eutherian radi-ation, but which had no members associated with known transposableelements98. For all but two of these families, we can find orthologues inthe opossum genome for the majority of their members (Supplemen-tary Note 10 and Supplementary Fig. 10). Moreover, closer inspectionreveals previously unrecognized transposon-like features in several ofthese and other ancient CNE families33.
Strikingly, the proportion of eutherian-specific CNEs recognizableas transposable-element-derived (16%) is very similar to the propor-tion of the total aligned sequence between the human, mouse and doggenomes recognizable as ancestral transposable elements (,17% of,812 Mb; the vast majority of which is inactive)10. It is widely sus-pected that the latter proportion is a significant underestimate owing tothe difficulty of recognizing transposable elements that inserted morethan ,100–200 Myr ago7,33. In cases where the transposable-element-related sequence hallmarks are not essential to the subsequent CNE, orwhere evolution of a new function did not follow immediately after thetransposable element insertion, exapted sequences would be expectedto have diverged to the point that they can no longer be readily recog-nized at a rate similar to inactive insertions. Because this seems to haveoccurred for most of the families of ancient CNEs described above, it islikely that the proportion of all eutherian (not just eutherian-specific)CNEs derived from transposable elements is substantially higher thanthe observed proportion of 16%.
Conclusions
The generation of the first complete genome sequence for a marsupial,Monodelphis domestica, provides an important resource for geneticanalysis in this unique model organism, as well as the first referencesequence for metatherian mammals. Our initial results demonstratethe usefulness of this sequence for comparative analyses of the archi-tecture and functional organization of mammalian genomes.
The relationship of sequence composition, segmental duplicationsand transposable element density with the large and stable karyotype
of the opossum genome has provided new support for an emerging,general model of chromosome evolution in mammals. In addition,comparison of the opossum and eutherian X chromosomes revealedthat the evolution of random X chromosome inactivation correlateswith acquisition of XIST, elevation in LINE/L1 density and suppres-sion of large-scale rearrangements.
Comparative analysis of protein-coding genes showed that theeutherian complement is largely conserved in opossum. Lineage-specific genes seem to be largely limited to gene families that arerapidly turning over in all mammals, although improved annotationsthat do not rely on homology to distant species will be required tocomplete the opossum gene catalogue. Identification of a wide arrayof both conserved and lineage-specific immune genes is particularlynotable because limited success in isolating these genes by cloning hasled to claims that the metatherian immune system is relatively ‘prim-itive’. Availability of the genome sequence now facilitates more sys-tematic study of the metatherian immune response39.
At timescales longer than the characteristic time of loss for geneduplications, it is clear that innovation in non-coding elementshas been substantially more common relative to protein-codingsequences, at least during eutherian evolution. The opossum genomesequence has provided the first estimate of the genome-wide rate ofCNE innovation in eutherian evolution, as well as identification oftens of thousands of lineage-specific elements. It has also providedevidence that exaptation of transposable elements has a muchgreater role in the evolution of novel CNEs than has been previouslyrealized.
Sequencing of additional metatherian genomes would be helpfulfor extending our results by allowing detection of metatherian-specific coding and non-coding elements. In addition, sampling ofboth the American and Australasian lineages would allow the recon-struction of the genome of their common ancestor, which wouldcomplement ongoing efforts for the boreoeutherian ancestral gen-ome58. The shorter genetic distance between the ancestral metather-ian and boreoeutherian genomes (,0.6–0.7 substitutions per site)would facilitate a more comprehensive analysis of short and weaklyconserved functional elements, for which the phylogenetic distri-bution and evolutionary origins are still difficult to ascertain.
METHODS SUMMARYWGS sequencing and assembly. Approximately 38.8 million high-quality
sequence reads were assembled using an interim version of ARACHNE21
(http://www.broad.mit.edu/wga/).
SNP discovery. The SNP discovery was performed using ARACHNE and
SSAHA-SNP99. Linkage disequilibrium was assessed using Haploview100.
Genome alignment and comparisons. Synteny maps were generated using
standard methods7,10.
Gene prediction and phylogeny. Opossum protein-coding and non-coding RNA
genes were predicted using a modified version of the Ensembl genebuild pipe-
line101, followed by several rounds of refinement using Exonerate102 and manual
curation. Orthology and paralogy were inferred using the PhyOP pipeline11,34.
Conserved element prediction. Amniote conserved elements were inferred
from pairwise BLASTZ alignment blocks with more than 75% identity
for $100 bp. Eutherian conserved elements were inferred using phastCons14.
Eutherian elements that did not fall within a 10-kilobase or longer synteny
‘net’103 were ignored.
Phylogeny of conserved elements. For amniote conserved elements, pairwise
best-in-genome BLASTZ alignments of opossum to human and vice versa were
used to infer their phylogenetic distributions. For eutherian conserved elements,
concomitant BLASTZ/MULTIZ alignments to opossum and chicken were used.
A conserved element was called absent from a species if it was not covered by a
single aligned nucleotide in the relevant alignment.
Correction for assembly gaps and initial alignment artefacts. A conserved
element was considered to be in an ungapped syntenic interval if it was flanked
by two synteny anchors within 200 kb on the same contigs in both the human and
opossum assemblies. All conserved elements in ungapped syntenic intervals were
realigned using water (http://emboss.sourceforge.net). Putatively eutherian-
specific elements, including XIST, were also searched against all opossum
sequencing reads using MegaBLAST.
Table 4 | Eutherian-specific conserved non-coding elements derived fromtransposons
Transposon family All log2-odds score $ 60
Number ofCNEs*
Overlappedlength (kb){
Number ofCNEs*
Overlappedlength (kb){
SINE/MIR 9,617 364 363 49
LINE/L1 6,619 286 194 36
LINE/L2 7,616 303 290 47
LINE/CR1 2,520 136 203 36
LINE/RTE 867 48 56 11
LTR/MaLR 1,995 65 25 3.7LTR/ERV1 140 5.1 1 0.2LTR/ERVL 992 36 12 2.8
DNA/Tip100 242 9.3 2 0.6DNA/MER1_type 2,427 93 54 9
DNA/MER2_type 113 5.3 4 0.9DNA/Tc2 162 8.5 6 1.4DNA/Mariner 250 14.6 20 3.3DNA/AcHobo 151 5.1 3 0.3
Unknown (MER121) 49 4 10 1.6
Total 33,760 1,383 1,243 203
Fraction of overlapped CNEs 16% 14%
* Number of eutherian-specific CNEs in ungapped syntenic regions overlapping annotatedtransposable elements.{Total length of annotated transposable element sequence overlapping the CNEs (this is lessthan the total length of CNEs overlapping transposable element sequence).
NATURE | Vol 447 | 10 May 2007 ARTICLES
175Nature ©2007 Publishing Group

Full Methods and any associated references are available in the online version ofthe paper at www.nature.com/nature.
Received 5 December 2006; accepted 3 April 2007.
1. Kumar, S. & Hedges, S. B. A molecular timescale for vertebrate evolution. Nature392, 917–920 (1998).
2. Woodburne, M. O., Rich, T. H. & Springer, M. S. The evolution of tribospheny andthe antiquity of mammalian clades. Mol. Phylogenet. Evol. 28, 360–385 (2003).
3. Tyndale-Biscoe, C. H. Life of Marsupials (CSIRO Publishing, Collingwood, Victoria,2005).
4. Wakefield, M. J. & Graves, J. A. M. Marsupials and monotremes sort genometreasures from junk. Genome Biol. 6, 218 (2005).
5. Graves, J. A. M. & Westerman, M. Marsupial genetics and genomics. TrendsGenet. 18, 517–521 (2002).
6. Samollow, P. B. Status and applications of genomic resources for the gray, short-tailed opossum, Monodelphis domestica, an American marsupial model forcomparative biology. Aust. J. Zool. 54, 173–196 (2006).
7. Mouse Genome Sequencing Consortium. Initial sequencing and comparativeanalysis of the mouse genome. Nature 420, 520–562 (2002).
8. Rat Genome Sequencing Project Consortium. Genome sequence of the BrownNorway rat yields insights into mammalian evolution. Nature 428, 493–521 (2004).
9. Chimpanzee Sequencing and Analysis Consortium. Initial sequence of thechimpanzee genome and comparison with the human genome. Nature 437,69–87 (2005).
10. Lindblad-Toh, K. et al. Genome sequence, comparative analysis and haplotypestructure of the domestic dog. Nature 438, 803–819 (2005).
11. Goodstadt, L. & Ponting, C. P. Phylogenetic reconstruction of orthology, paralogy,and conserved synteny for dog and human. PLoS Comput. Biol. 2, e133 (2006).
12. Clamp, M. et al. Gene content of the human genome. Nature (submitted).13. Xie, X. et al. Systematic discovery of regulatory motifs in human promoters and 39
UTRs by comparison of several mammals. Nature 434, 338–345 (2005).
14. Siepel, A. et al. Evolutionarily conserved elements in vertebrate, insect, worm, andyeast genomes. Genome Res. 15, 1034–1050 (2005).
15. Pedersen, J. S. et al. Identification and classification of conserved RNA secondarystructures in the human genome. PLoS Comput. Biol. 2, e33 (2006).
16. Nobrega, M. A., Ovcharenko, I., Afzal, V. & Rubin, E. M. Scanning human genedeserts for long-range enhancers. Science 302, 413 (2003).
17. Ovcharenko, I., Stubbs, L. & Loots, G. G. Interpreting mammalian evolution usingFugu genome comparisons. Genomics 84, 890–895 (2004).
18. Prabhakar, S. et al. Close sequence comparisons are sufficient to identify humancis-regulatory elements. Genome Res. 16, 855–863 (2006).
19. Margulies, E. H. et al. An initial strategy for the systematic identification offunctional elements in the human genome by low-redundancy comparativesequencing. Proc. Natl Acad. Sci. USA 102, 4795–4800 (2005).
20. Hillier, L. W. et al. Sequence and comparative analysis of the chicken genomeprovide unique perspectives on vertebrate evolution. Nature 432, 695–716 (2004).
21. VandeBerg, J. L. The gray short-tailed opossum (Monodelphis domestica) as amodel didelphid species for genetic research. Aust. J. Zool. 37, 235–247 (1990).
22. VandeBerg, J. L. in UFAW Handbook on the Management of Laboratory Animals.Vol. 1 Terrestrial Vertebrates (eds Poole, T. & English, P.) 193–209 (BlackwellScience, Oxford, 1999).
23. Murphy, S. K. & Jirtle, R. L. Imprinting evolution and the price of silence. Bioessays25, 577–588 (2003).
24. Rapkins, R. W. et al. Recent assembly of an imprinted domain from non-imprintedcomponents. PLoS Genet. 2, e182 (2006).
25. Weidman, J. R. et al. Phylogenetic footprint analysis of IGF2 in extant mammals.Genome Res. 14, 1726–1732 (2004).
26. Deakin, J. E. et al. Evolution and comparative analysis of the MHC Class IIIinflammatory region. BMC Genomics 7, 281 (2006).
27. Deakin, J. E., Olp, J. J., Graves, J. A. & Miller, R. D. Physical mapping ofimmunoglobulin loci IGH@, IGK@, and IGL@ in the opossum (Monodelphisdomestica). Cytogenet. Genome Res. 114, 94H (2006).
28. Belov, K. et al. Reconstructing an ancestral mammalian immune supercomplexfrom a marsupial major histocompatibility complex. PLoS Biol. 4, e46 (2006).
29. Wintzer, M. et al. Strategies for identifying genes that play a role in spinal cordregeneration. J. Anat. 204, 3–11 (2004).
30. VandeBerg, J. L. et al. Genetic analysis of ultraviolet radiation-induced skinhyperplasia and neoplasia in a laboratory marsupial model (Monodelphisdomestica). Arch. Dermatol. Res. 286, 12–17 (1994).
31. Baker, M. L. et al. Analysis of a set of Australian northern brown bandicootexpressed sequence tags with comparison to the genome sequence of the southAmerican grey short-tailed opossum. BMC Genom. 8, 50 (2007).
32. Belov, K. et al. Characterization of the opossum immune genome provides insightsinto the evolution of the mammalian immune system. Genome Res. doi:10.1101/gr.6121807 (2007).
33. Gentles,A.J. et al. Evolutionarydynamics of transposableelements inthe short-tailedopossum Monodelphis domestica. Genome Res. doi:10.1101/gr.6070707 (2007).
34. Goodstadt, L., Heger, A., Webber, C. & Ponting, C. P. An analysis of the genecomplement of a marsupial Monodelphis domestica: Evolution of lineage-specificgenes and giant chromosomes. Genome Res. doi:10.1101/gr.6093907 (2007).
35. Gu, W. et al. Phylogenetic detection, population genetics, and distribution ofactive SINEs in the genome of Monodelphis domestica. Genedoi:10.1016/j.gene.2007.02.028 (2007).
36. Mahony, S., Corcoran, D. L., Feingold, E. & Benos, P. V. Regulatory conservation ofprotein coding and miRNA genes in vertebrates: lessons from the opossumgenome. Genome Biol. (in the press).
37. Parra, Z. E. et al. A new T-cell receptor discovered in marsupials. Proc. Natl Acad.Sci. USA (submitted).
38. Samollow, P. B. et al. A microsatellite-based, physically anchored linkage map for thegray, short-tailed opossum (Monodelphis domestica). Chromosome Res. advanceonline publication, doi:10.1007/s10577-007-1123-4 (25 February 2007).
39. Wong, E. S., Young, L. J., Papenfuss, A. T. & Belov, K. In silico identification ofopossum cytokine genes suggests the complexity of the marsupial immunesystem rivals that of eutherian mammals. Immunome Res. 2, 4 (2006).
40. Hore, T., Koina, E., Wakefield, M. J. & Graves, J. A. M. The region homologous tothe X-chromosome inactivation centre has been disrupted in marsupial andmonotreme mammals. Chromosome Res. 15, 147–161 (2007).
41. Davidow, L. S. et al. The search for a marsupial XIC reveals a break with vertebratesynteny. Chromosome Res. 15, 137–146 (2007).
42. Venter, J. C. et al.Thesequence of the humangenome.Science 291,1304–1351(2001).43. Duke, S. E. et al. Integrated cytogenetic BAC map of the genome of the gray short-
tailed opossum, Monodelphis domestica. Chromosome Res. advance onlinepublication, doi:10.1007/s10577-007-1131-4 (6 April 2007).
44. VandeBerg, J. L. The laboratory opossum (Monodelphis domestica) in laboratoryresearch. ILAR J. 38, 4–12 (1997).
45. Rens, W. et al. Karyotype relationships between distantly related marsupials fromSouth America and Australia. Chromosome Res. 9, 301–308 (2001).
46. Belle, E. M., Duret, L., Galtier, N. & Eyre-Walker, A. The decline of isochores inmammals: an assessment of the GC content variation along the mammalianphylogeny. J. Mol. Evol. 58, 653–660 (2004).
47. Jensen-Seaman, M. I. et al. Comparative recombination rates in the rat, mouse,and human genomes. Genome Res. 14, 528–538 (2004).
48. Duret, L., Eyre-Walker, A. & Galtier, N. A new perspective on isochore evolution.Gene 385, 71–74 (2006).
49. Dumas, D. & Britton-Davidian, J. Chromosomal rearrangements and evolution ofrecombination: comparison of chiasma distribution patterns in standard androbertsonian populations of the house mouse. Genetics 162, 1355–1366 (2002).
50. Myers, S. et al. A fine-scale map of recombination rates and hotspots across thehuman genome. Science 310, 321–324 (2005).
51. Hope, R. M. Selected features of marsupial genetics. Genetica 90, 165–180 (1993).52. Sharp, P. J. & Hayman, D. L. An examination of the role of chiasma frequency in the
genetic system of marsupials. Heredity 60, 77–85 (1988).53. Holm, P. B. Ultrastructural analysis of meiotic recombination and chiasma
formation. Tokai J. Exp. Clin. Med. 11, 415–436 (1986).54. Samollow, P. B. et al. First-generation linkage map of the gray, short-tailed
opossum, Monodelphis domestica, reveals genome-wide reduction in femalerecombination rates. Genetics 166, 307–329 (2004).
55. Bailey, J. A. et al. Hotspots of mammalian chromosomal evolution. Genome Biol. 5,R23 (2004).
56. Webber, C. & Ponting, C. P. Hotspots of mutation and breakage in dog and humanchromosomes. Genome Res. 15, 1787–1797 (2005).
57. Jurka, J. et al. Repbase Update, a database of eukaryotic repetitive elements.Cytogenet. Genome Res. 110, 462–467 (2005).
58. Ma, J. et al. Reconstructing contiguous regions of an ancestral genome. GenomeRes. 16, 1557–1565 (2006).
59. Kohn, M. et al. Wide genome comparisons reveal the origins of the human Xchromosome. Trends Genet. 20, 598–603 (2004).
60. Graves, J. A. Sex chromosome specialization and degeneration in mammals. Cell124, 901–914 (2006).
61. Ross, M. T. et al. The DNA sequence of the human X chromosome. Nature 434,325–337 (2005).
62. Cooper, D. W., Johnston, P. G., Graves, J. A. & Watson, J. M. X-inactivation inmarsupials and monotremes. Sem. Dev. Biol. 4, 117–128 (1993).
63. Heard, E. Recent advances in X-chromosome inactivation. Curr. Opin. Cell Biol. 16,247–255 (2004).
64. Wakefield, M. J., Keohane, A. M., Turner, B. M. & Graves, J. A. Histoneunderacetylation is an ancient component of mammalian X chromosomeinactivation. Proc. Natl Acad. Sci. USA 94, 9665–9668 (1997).
65. Reik, W. & Lewis, A. Co-evolution of X-chromosome inactivation and imprinting inmammals. Nature Rev. Genet. 6, 403–410 (2005).
66. Duret, L. et al. The Xist RNA gene evolved in eutherians by pseudogenization of aprotein-coding gene. Science 312, 1653–1655 (2006).
67. Lyon, M. F. Do LINEs have a role in X–chromosome inactivation? J. Biomed.Biotechnol. 2006, 59746 (2006).
68. Bailey, J. A., Carrel, L., Chakravarti, A. & Eichler, E. E. Molecular evidence for arelationship between LINE-1 elements and X chromosome inactivation: the Lyonrepeat hypothesis. Proc. Natl Acad. Sci. USA 97, 6634–6639 (2000).
69. Disteche, C. M., Filippova, G. N. & Tsuchiya, K. D. Escape from X inactivation.Cytogenet. Genome Res. 99, 36–43 (2002).
70. Emes, R. D., Goodstadt, L., Winter, E. E. & Ponting, C. P. Comparison of thegenomes of human and mouse lays the foundation of genome zoology. Hum. Mol.Genet. 12, 701–709 (2003).
ARTICLES NATURE | Vol 447 | 10 May 2007
176Nature ©2007 Publishing Group

71. Kato, T. Jr et al. Cloning of a marsupial DNA photolyase gene and the lack ofrelated nucleotide sequences in placental mammals. Nucleic Acids Res. 22,4119–4124 (1994).
72. Kondrashov, F. A. et al. Evolution of glyoxylate cycle enzymes in Metazoa:evidence of multiple horizontal transfer events and pseudogene formation. Biol.Direct 1, 31 (2006).
73. Wistow, G. et al. cN-crystallin and the evolution of the bc-crystallin superfamily invertebrates. FEBS J. 272, 2276–2291 (2005).
74. Grus, W. E., Shi, P., Zhang, Y. P. & Zhang, J. Dramatic variation of the vomeronasalpheromone receptor gene repertoire among five orders of placental andmarsupial mammals. Proc. Natl Acad. Sci. USA 102, 5767–5772 (2005).
75. International Human Genome Sequencing Consortium. Finishing the euchromaticsequence of the human genome. Nature 431, 931–945 (2004).
76. Dermitzakis, E. T. & Clark, A. G. Evolution of transcription factor binding sites inMammalian gene regulatory regions: conservation and turnover. Mol. Biol. Evol.19, 1114–1121 (2002).
77. Griffiths-Jones, S. et al. miRBase: microRNA sequences, targets and genenomenclature. Nucleic Acids Res. 34 (database issue), D140–D144 (2006).
78. Michael, M. Z. et al. Reduced accumulation of specific microRNAs in colorectalneoplasia. Mol. Cancer Res. 1, 882–891 (2003).
79. Lagos-Quintana, M., Rauhut, R., Lendeckel, W. & Tuschl, T. Identification of novelgenes coding for small expressed RNAs. Science 294, 853–858 (2001).
80. Crawford, G. E. et al. Genome-wide mapping of DNase hypersensitive sites usingmassively parallel signature sequencing (MPSS). Genome Res. 16, 123–131 (2006).
81. Sandelin, A. et al. Arrays of ultraconserved non-coding regions span the loci of keydevelopmental genes in vertebrate genomes. BMC Genom. 5, 99 (2004).
82. Woolfe, A. et al. Highly conserved non-coding sequences are associated withvertebrate development. PLoS Biol. 3, e7 (2005).
83. Bailey, P. J. et al. A global genomic transcriptional code associated with CNS-expressed genes. Exp. Cell Res. 312, 3108–3119 (2006).
84. de la Calle-Mustienes, E. et al. A functional survey of the enhancer activity ofconserved non-coding sequences from vertebrate Iroquois cluster gene deserts.Genome Res. 15, 1061–1072 (2005).
85. Pennacchio, L. A. et al. In vivo enhancer analysis of human conserved non-codingsequences. Nature 444, 499–502 (2006).
86. Carroll, S. B. Evolution at two levels: on genes and form. PLoS Biol. 3, e245 (2005).87. Davidson, E. H. & Erwin, D. H. Gene regulatory networks and the evolution of
animal body plans. Science 311, 796–800 (2006).88. Stathopoulos, A. & Levine, M. Genomic regulatory networks and animal
development. Dev. Cell 9, 449–462 (2005).89. Britten, R. J. Mobile elements inserted in the distant past have taken on important
functions. Gene 205, 177–182 (1997).90. Britten, R. J. & Davidson, E. H. Gene regulation for higher cells: a theory. Science
165, 349–357 (1969).91. Brosius, J. Genomes were forged by massive bombardments with retroelements
and retrosequences. Genetica 107, 209–238 (1999).92. Kazazian, H. H. Jr. Mobile elements: drivers of genome evolution. Science 303,
1626–1632 (2004).93. Marino-Ramirez, L., Lewis, K. C., Landsman, D. & Jordan, I. K. Transposable
elements donate lineage-specific regulatory sequences to host genomes.Cytogenet. Genome Res. 110, 333–341 (2005).
94. Cooper, G. M. et al. Distribution and intensity of constraint in mammaliangenomic sequence. Genome Res. 15, 901–913 (2005).
95. Silva, J. C. et al. Conserved fragments of transposable elements in intergenicregions: evidence for widespread recruitment of MIR- and L2-derived sequenceswithin the mouse and human genomes. Genet. Res. 82, 1–18 (2003).
96. Bejerano, G. et al. A distal enhancer and an ultraconserved exon are derived from anovel retroposon. Nature 441, 87–90 (2006).
97. Nishihara, H., Smit, A. F. & Okada, N. Functional noncoding sequences derivedfrom SINEs in the mammalian genome. Genome Res. 16, 864–874 (2006).
98. Xie, X., Kamal, M. & Lander, E. S. A family of conserved noncoding elementsderived from an ancient transposable element. Proc. Natl Acad. Sci. USA 103,11659–11664 (2006).
99. Ning, Z., Cox, A. J. & Mullikin, J. C. SSAHA: a fast search method for large DNAdatabases. Genome Res. 11, 1725–1729 (2001).
100. Barrett, J. C., Fry, B., Maller, J. & Daly, M. J. Haploview: analysis and visualization ofLD and haplotype maps. Bioinformatics 21, 263–265 (2005).
101. Birney, E. et al. Ensembl 2006. Nucleic Acids Res. 34 (database issue), D556–D561(2006).
102. Slater, G. S. & Birney, E. Automated generation of heuristics for biologicalsequence comparison. BMC Bioinformatics 6, 31 (2005).
103. Kent, W. J. et al. Evolution’s cauldron: duplication, deletion, and rearrangement in themouse and human genomes. Proc. Natl Acad. Sci. USA 100, 11484–11489 (2003).
Supplementary Information is linked to the online version of the paper atwww.nature.com/nature.
Acknowledgements Generation of the Monodelphis domestica sequence at theBroad Institute of MIT and Harvard was supported by grants from the NationalHuman Genome Research Institute (NHGRI). For work from other members of theOpossum Genome Sequencing Consortium, we acknowledge the support of theNational Institutes of Health (NHGRI, NIAID, NLM), the National ScienceFoundation, the Robert J. Kleberg Jr and Helen C. Kleberg Foundation, the State ofLouisiana Board of Regents Support Fund, State of Colorado support funds, thePittsburgh Foundation, TATRC/DoD, the UK Medical Research Council and theAustralian Research Council. We thank colleagues at the UCSC genome browserfor providing data (BLASTZ/MULTIZ alignments, synteny nets, and annotations).We thank L. Gaffney for assistance in preparing the manuscript and figures, andJ. Danke for flow cytometry data.
Author Information All analysed data sets can be obtained from http://www.broad.mit.edu/mammals/opossum/. This Monodelphis domesticawhole-genome shotgun project has been deposited at DDBJ/EMBL/GenBankunder NCBI accession code AAFR00000000. SNPs have been deposited in thedbSNP database (http://www.ncbi.nlm.nih.gov/projects/SNP/). Reprints andpermissions information is available at www.nature.com/reprints. The authorsdeclare no competing financial interests. Correspondence and requests formaterials should be addressed to K.L.-T. ([email protected]), T.S.M.([email protected]) and E.S.L. ([email protected]).
Broad Institute Genome Sequencing Platform members Jennifer Baldwin1, AmrAbdouelleil1, Jamal Abdulkadir1, Adal Abebe1, Brikti Abera1, Justin Abreu1, StChristophe Acer1, Lynne Aftuck1, Allen Alexander1, Peter An1, Erica Anderson1, ScottAnderson1, Harindra Arachi1, Marc Azer1, Pasang Bachantsang1, Andrew Barry1, TashiBayul1, Aaron Berlin1, Daniel Bessette1, Toby Bloom1, Jason Blye1, Leonid Boguslavskiy1,Claude Bonnet1, Boris Boukhgalter1, Imane Bourzgui1, Adam Brown1, Patrick Cahill1,Sheridon Channer1, Yama Cheshatsang1, Lisa Chuda1, Mieke Citroen1, AlvilleCollymore1, Patrick Cooke1, Maura Costello1, Katie D’Aco1, Riza Daza1, Georgius DeHaan1, Stuart DeGray1, Christina DeMaso1, Norbu Dhargay1, Kimberly Dooley1, ErinDooley1, Missole Doricent1, Passang Dorje1, Kunsang Dorjee1, Alan Dupes1, RichardElong1, Jill Falk1, Abderrahim Farina1, Susan Faro1, Diallo Ferguson1, Sheila Fisher1,Chelsea D. Foley1, Alicia Franke1, Dennis Friedrich1, Loryn Gadbois1, Gary Gearin1,Christina R. Gearin1, Georgia Giannoukos1, Tina Goode1, Joseph Graham1, EdwardGrandbois1, Sharleen Grewal1, Kunsang Gyaltsen1, Nabil Hafez1, Birhane Hagos1,Jennifer Hall1, Charlotte Henson1, Andrew Hollinger1, Tracey Honan1, Monika D.Huard1, Leanne Hughes1, Brian Hurhula1, M. Erii Husby1, Asha Kamat1, Ben Kanga1,Seva Kashin1, Dmitry Khazanovich1, Peter Kisner1, Krista Lance1, Marcia Lara1, WilliamLee1, Niall Lennon1, Frances Letendre1, Rosie LeVine1, Alex Lipovsky1, Xiaohong Liu1,Jinlei Liu, Shangtao Liu1, Tashi Lokyitsang1, Yeshi Lokyitsang1, Rakela Lubonja1, AnnieLui1, Pen MacDonald1, Vasilia Magnisalis1, Kebede Maru1, Charles Matthews1, WilliamMcCusker1, Susan McDonough1, Teena Mehta1, James Meldrim1, Louis Meneus1, OanaMihai1, Atanas Mihalev1, Tanya Mihova1, Rachel Mittelman1, Valentine Mlenga1, AnnaMontmayeur1, Leonidas Mulrain1, Adam Navidi1, Jerome Naylor1, Tamrat Negash1, ThuNguyen1, Nga Nguyen1, Robert Nicol1, Choe Norbu1, Nyima Norbu1, Nathaniel Novod1,Barry O’Neill1, Sahal Osman1, Eva Markiewicz1, Otero L. Oyono1, Christopher Patti1,Pema Phunkhang1, Fritz Pierre1, Margaret Priest1, Sujaa Raghuraman1, Filip Rege1,Rebecca Reyes1, Cecil Rise1, Peter Rogov1, Keenan Ross1, Elizabeth Ryan1, SampathSettipalli1, Terry Shea1, Ngawang Sherpa1, Lu Shi1, Diana Shih1, Todd Sparrow1, JessicaSpaulding1, John Stalker1, Nicole Stange-Thomann1, Sharon Stavropoulos1, CatherineStone1, Christopher Strader1, Senait Tesfaye1, Talene Thomson1, Yama Thoulutsang1,Dawa Thoulutsang1, Kerri Topham1, Ira Topping1, Tsamla Tsamla1, Helen Vassiliev1,Andy Vo1, Tsering Wangchuk1, Tsering Wangdi1, Michael Weiand1, Jane Wilkinson1,Adam Wilson1, Shailendra Yadav1, Geneva Young1, Qing Yu1, Lisa Zembek1, DanniZhong1, Andrew Zimmer1 & Zac Zwirko1
Broad Institute Whole Genome Assembly Team members David B. Jaffe1, PabloAlvarez1, Will Brockman1, Jonathan Butler1, CheeWhye Chin1, Sante Gnerre1 & IainMacCallum
Affiliation for participants: 1Broad Institute of MIT and Harvard, 7 Cambridge Center,Cambridge, Massachusetts 02142, USA.
NATURE | Vol 447 | 10 May 2007 ARTICLES
177Nature ©2007 Publishing Group

METHODSWGS sequencing and assembly. Approximately 38.8 million high-quality
sequence reads were derived from paired-end reads of 4- and 10-kb plasmids,
fosmid and BAC clones, prepared from primary tissue DNA from a single female
opossum. The reads were assembled using an interim version of ARACHNE21
(http://www.broad.mit.edu/wga/). No comparative data were used in the assem-
bly process. An intermediate assembly (monDom4) was used for the majority of
the analyses reported here. The most recent version (monDom5) has identical
sequence content and scaffold structure, but includes additional FISH data as
described in Supplementary Note 2.
SNP discovery. The SNP discovery was performed using ARACHNE by com-
parison of the two haplotypes derived from the opossum assembly using only
high-quality discrepancies supported by two or more reads each. Sequence reads
from three additional individuals were also aligned to the reference assembly,
and SNPs were discovered using SSAHA-SNP99. Linkage disequilibrium was
assessed using Haploview100.
Genome alignment and comparisons. The assembly versions used in all com-
parative analyses were hg17 or hg18 (human), mm8 (mouse), rn4 (rat), canFam2
(dog), monDom4 or monDom5 (opossum) and galGal3 (chicken). The number
of aligned nucleotides was counted directly from unfiltered, pairwise BLASTZ
alignments (obtained from http://genome.ucsc.edu). Synteny maps were gener-
ated using standard methods7,10, starting from 320,000 reciprocal-best syntenic
anchors identified by PatternHunter104 (see Supplementary Note 7). Reconstruc-
tion of the boreoeutherian ancestral karyotype is described in Supplementary
Note 8.
Gene prediction and phylogeny. Opossum protein-coding and non-coding
RNA genes were predicted using a modified version of the Ensembl genebuild
pipeline101, followed by several rounds of refinement using Exonerate102 and
manual curation. Orthology and paralogy were inferred using the PhyOP pipe-
line with all predicted opossum and human (Ensembl v40) gene transcripts as
input and KS as the distance metric11,34. Coding regions were aligned according to
their amino acid sequences using BLASTP. KA and KS were estimated using the
codeml program105, with default settings and the F3X4 codon frequency model.
Functional categories were identified using the Gene Ontology106.
Conserved element prediction. Amniote conserved elements were inferred
directly from pairwise BLASTZ alignments of chicken to opossum or human.
Every alignment block with more than 75% identity for $100 bp was classified as
an amniote conserved element. Eutherian conserved elements were inferred
using phastCons14 on BLASTZ/MULTIZ107,108 alignments of human to mouse,
rat and dog. The nonconserved model was fitted to fourfold degenerate sites
from 15,900 human RefSeqs projected onto the same alignments, using phyloFit
and REV. A separate model was fitted for the X chromosome. The scaling para-
meter for the conserved model was estimated by phastCons. Target coverage and
expected element length were set to 12.5% and 12 bp, respectively. Predicted
eutherian conserved elements that did not fall within a 10-kb or longer synteny‘net’103 between human, mouse and dog were ignored. The coding status of each
element was inferred from $1 nucleotide overlap with entries in the UCSC
human ‘known genes’ track109. Proportions are reported out of the total length
of the elements considered. Eutherian CNEs were classified as transposable-
element-derived if they showed more than 20% nucleotide overlap (med-
ian 5 100% for all elements, 54% for elements with log2-odds score $ 60) with
human RepeatMasker annotations.
Phylogeny of conserved elements. For amniote conserved elements, pairwise
best-in-genome BLASTZ alignments of opossum to human and vice versa were
used to infer their phylogenetic distributions. For eutherian conserved elements,
concomitant BLASTZ/MULTIZ alignments to opossum and chicken were used.
A conserved element was called absent from a species if it was not covered by a
single aligned nucleotide in the relevant BLASTZ alignment.
Correction for assembly gaps and initial alignment artefacts. A conserved
element was considered to be in an ungapped syntenic interval if it was flanked
by two PatternHunter synteny anchors within 200-kb of each other on the same
contigs in both the human and opossum assemblies. All conserved elements
(represented by human or opossum, as appropriate) in ungapped syntenic inter-vals were realigned to the unmasked genome sequence (in opossum or human)
using the water program (http://emboss.sourceforge.net) with default para-
meters and a gap extension penalty of 4. A randomly permuted version of each
element was also realigned. For amniote conserved elements, only the longest
interval with $75% identity from within the originating alignment block (see
above) was realigned. Amniote elements were called lost, and eutherian elements
were called eutherian-specific if their Smith–Waterman realignment score,
divided by the length of the element, did not exceed the corresponding score
for the permuted element plus one. (Conservatively calling an element found if
its score simply exceeded the score of the permuted element resulted in 15% of
eutherian CNEs in ungapped regions and 8% of those with log2-odds score $ 60
being called eutherian-specific.) Putatively eutherian-specific elements, includ-
ing XIST, were also searched against all opossum sequencing reads using dis-
contiguous MegaBLAST.
104. Ma, B., Tromp, J. & Li, M. PatternHunter: faster and more sensitive homologysearch. Bioinformatics 18, 440–445 (2002).
105. Yang, Z. PAML: a program package for phylogenetic analysis by maximumlikelihood. Comput. Appl. Biosci. 13, 555–556 (1997).
106. Ashburner, M. et al. Gene ontology: tool for the unification of biology. NatureGenet. 25, 25–29 (2000).
107. Blanchette, M. et al. Aligning multiple genomic sequences with the threadedblockset aligner. Genome Res. 14, 708–715 (2004).
108. Schwartz, S. et al. Human-mouse alignments with BLASTZ. Genome Res. 13,103–107 (2003).
109. Hsu, F. et al. The UCSC known genes. Bioinformatics 22, 1036–1046(2006).
doi:10.1038/nature05805
Nature ©2007 Publishing Group