Genome Biology - Zurich Open Repository and Archive
43
Zurich Open Repository and Archive University of Zurich Main Library Strickhofstrasse 39 CH-8057 Zurich www.zora.uzh.ch Year: 2013 The physical map of wheat chromosome 1BS provides insights into its gene space organization and evolution Raats, Dina ; Frenkel, Zeev ; Krugman, Tamar ; Dodek, Itay ; Sela, Hanan ; Šimková, Hana ; Magni, Federica ; Cattonaro, Federica ; Vautrin, Sonia ; Bergès, Hélène ; Wicker, Thomas ; Keller, Beat ; Leroy, Philippe ; Philippe, Romain ; Paux, Etienne ; Doležel, Jaroslav ; Feuillet, Catherine ; Korol, Abraham ; Fahima, Tzion Abstract: BACKGROUND: The wheat genome sequence is an essential tool for advanced genomic re- search and improvements. The generation of a high-quality wheat genome sequence is challenging due to its complex 17 Gb polyploid genome. To overcome these diffculties, sequencing through the con- struction of BAC-based physical maps of individual chromosomes is employed by the wheat genomics community. Here, we present the construction of the frst comprehensive physical map of chromosome 1BS, and illustrate its unique gene space organization and evolution. RESULTS: Fingerprinted BAC clones were assembled into 57 long scafolds, anchored and ordered with 2,438 markers covering 83% of chromosome 1BS. The BAC-based chromosome 1BS physical map and gene order of the orthologous regions of model grass species were consistent, providing strong support for the reliability of the chromo- some 1BS assembly. Chromosome 1BS gene space spans the entire length of the chromosome arm, with 76% of the genes organized in small gene-islands, accompanied by a two fold increase in gene density from the centromere to the telomere. CONCLUSIONS: This study provides new evidence on common and chromosome-specifc features in the organization and evolution of the wheat genome, including a non-uniform distribution of gene density along the centromere-telomere axis, abundance of non-syntenic genes, the degree of colinearity with other grass genomes, and a non-uniform size expansion along the centromere-telomere axis, compared with other model cereal genomes. The high quality physical map constructed in this study provides a solid basis for the assembly of a reference sequence of chromosome 1BS and for breeding applications. DOI: https://doi.org/10.1186/gb-2013-14-12-r138 Posted at the Zurich Open Repository and Archive, University of Zurich ZORA URL: https://doi.org/10.5167/uzh-88009 Journal Article Accepted Version Originally published at: Raats, Dina; Frenkel, Zeev; Krugman, Tamar; Dodek, Itay; Sela, Hanan; Šimková, Hana; Magni, Federica; Cattonaro, Federica; Vautrin, Sonia; Bergès, Hélène; Wicker, Thomas; Keller, Beat; Leroy, Philippe; Philippe, Romain; Paux, Etienne; Doležel, Jaroslav; Feuillet, Catherine; Korol, Abraham; Fahima, Tzion (2013). The physical map of wheat chromosome 1BS provides insights into its gene space organization and evolution. Genome Biology, 14(12):R138. DOI: https://doi.org/10.1186/gb-2013-14-12-r138
-
Upload
khangminh22 -
Category
Documents
-
view
1 -
download
0
Transcript of Genome Biology - Zurich Open Repository and Archive
Zurich Open Repository andArchiveUniversity of ZurichMain LibraryStrickhofstrasse 39CH-8057 Zurichwww.zora.uzh.ch
Year: 2013
The physical map of wheat chromosome 1BS provides insights into its genespace organization and evolution
Raats, Dina ; Frenkel, Zeev ; Krugman, Tamar ; Dodek, Itay ; Sela, Hanan ; Šimková, Hana ; Magni,Federica ; Cattonaro, Federica ; Vautrin, Sonia ; Bergès, Hélène ; Wicker, Thomas ; Keller, Beat ;
Leroy, Philippe ; Philippe, Romain ; Paux, Etienne ; Doležel, Jaroslav ; Feuillet, Catherine ; Korol,Abraham ; Fahima, Tzion
Abstract: BACKGROUND: The wheat genome sequence is an essential tool for advanced genomic re-search and improvements. The generation of a high-quality wheat genome sequence is challenging dueto its complex 17 Gb polyploid genome. To overcome these difficulties, sequencing through the con-struction of BAC-based physical maps of individual chromosomes is employed by the wheat genomicscommunity. Here, we present the construction of the first comprehensive physical map of chromosome1BS, and illustrate its unique gene space organization and evolution. RESULTS: Fingerprinted BACclones were assembled into 57 long scaffolds, anchored and ordered with 2,438 markers covering 83%of chromosome 1BS. The BAC-based chromosome 1BS physical map and gene order of the orthologousregions of model grass species were consistent, providing strong support for the reliability of the chromo-some 1BS assembly. Chromosome 1BS gene space spans the entire length of the chromosome arm, with76% of the genes organized in small gene-islands, accompanied by a two fold increase in gene densityfrom the centromere to the telomere. CONCLUSIONS: This study provides new evidence on commonand chromosome-specific features in the organization and evolution of the wheat genome, including anon-uniform distribution of gene density along the centromere-telomere axis, abundance of non-syntenicgenes, the degree of colinearity with other grass genomes, and a non-uniform size expansion along thecentromere-telomere axis, compared with other model cereal genomes. The high quality physical mapconstructed in this study provides a solid basis for the assembly of a reference sequence of chromosome1BS and for breeding applications.
DOI: https://doi.org/10.1186/gb-2013-14-12-r138
Posted at the Zurich Open Repository and Archive, University of ZurichZORA URL: https://doi.org/10.5167/uzh-88009Journal ArticleAccepted Version
Originally published at:Raats, Dina; Frenkel, Zeev; Krugman, Tamar; Dodek, Itay; Sela, Hanan; Šimková, Hana; Magni, Federica;Cattonaro, Federica; Vautrin, Sonia; Bergès, Hélène; Wicker, Thomas; Keller, Beat; Leroy, Philippe;Philippe, Romain; Paux, Etienne; Doležel, Jaroslav; Feuillet, Catherine; Korol, Abraham; Fahima, Tzion(2013). The physical map of wheat chromosome 1BS provides insights into its gene space organizationand evolution. Genome Biology, 14(12):R138.DOI: https://doi.org/10.1186/gb-2013-14-12-r138

This Provisional PDF corresponds to the article as it appeared upon acceptance. Copyedited andfully formatted PDF and full text (HTML) versions will be made available soon.
The physical map of wheat chromosome 1BS provides insights into its genespace organization and evolution
Genome Biology 2013, 14:R138 doi:10.1186/gb-2013-14-12-r138
Dina Raats ([email protected])Zeev Frenkel ([email protected])
Tamar Krugman ([email protected])Itay Dodek ([email protected])
Hanan Sela ([email protected])Hana ¿imková ([email protected])
Federica Magni ([email protected])Federica Cattonaro ([email protected])
Sonia Vautrin ([email protected])Hélène Bergès ([email protected])
Thomas Wicker ([email protected])Beat Keller ([email protected])
Philippe Leroy ([email protected])Romain Philippe ([email protected])
Etienne Paux ([email protected])Jaroslav Dole¿el ([email protected])
Catherine Feuillet ([email protected])Abraham Korol ([email protected])Tzion Fahima ([email protected])
ISSN 1465-6906
Article type Research
Submission date 16 July 2013
Acceptance date 13 December 2013
Publication date 20 December 2013
Article URL http://genomebiology.com/2013/14/12/R138
This peer-reviewed article can be downloaded, printed and distributed freely for any purposes (seecopyright notice below).
Genome Biology
© 2013 Raats et al.This is an open access article distributed under the terms of the Creative Commons Attribution License (http://creativecommons.org/licenses/by/2.0), which
permits unrestricted use, distribution, and reproduction in any medium, provided the original work is properly cited.

Articles in Genome Biology are listed in PubMed and archived at PubMed Central.
For information about publishing your research in Genome Biology go to
http://genomebiology.com/authors/instructions/
Genome Biology
© 2013 Raats et al.This is an open access article distributed under the terms of the Creative Commons Attribution License (http://creativecommons.org/licenses/by/2.0), which
permits unrestricted use, distribution, and reproduction in any medium, provided the original work is properly cited.

The physical map of wheat chromosome 1BS
provides insights into its gene space organization and evolution
Dina Raats1,† Email: [email protected]
Zeev Frenkel1,† Email: [email protected]
Tamar Krugman1 Email: [email protected]
Itay Dodek1 Email: [email protected]
Hanan Sela1,2 Email: [email protected]
Hana Šimková3 Email: [email protected]
Federica Magni4 Email: [email protected]
Federica Cattonaro4 Email: [email protected]
Sonia Vautrin5 Email: [email protected]
Hélène Bergès5 Email: [email protected]
Thomas Wicker6 Email: [email protected]
Beat Keller6 Email: [email protected]
Philippe Leroy7 Email: [email protected]
Romain Philippe7 Email: [email protected]
Etienne Paux7 Email: [email protected]

Jaroslav Doležel3 Email: [email protected]
Catherine Feuillet7 Email: [email protected]
Abraham Korol1*,† * Corresponding author Email: [email protected]
Tzion Fahima1*,† * Corresponding author Email: [email protected]
1 Institute of Evolution and Department of Evolutionary and Environmental Biology, University of Haifa, Haifa, Israel
2 The Institute for Cereal Crops Improvement, Tel-Aviv University, Tel Aviv, Israel
3 Centre of the Region Haná for Biotechnological and Agricultural Research, Institute of Experimental Botany, Olomouc, Czech Republic
4 Instituto di Genomica Applicata, Udine, Italy
5 INRA-CNRGV, Plant Genomic Resource Center, Castanet Tolosan, France
6 Institute of Plant Biology, University of Zurich, Zurich, Switzerland
7 INRA, Genetics, Diversity and Ecophysiology of Cereals, Clermont-Ferrand, France
† Equal contributors.
Abstract
Background
The wheat genome sequence is an essential tool for advanced genomic research and improvements. The generation of a high-quality wheat genome sequence is challenging due to its complex 17 Gb polyploid genome. To overcome these difficulties, sequencing through the construction of BAC-based physical maps of individual chromosomes is employed by the wheat genomics community. Here, we present the construction of the first comprehensive physical map of chromosome 1BS, and illustrate its unique gene space organization and evolution.

Results
Fingerprinted BAC clones were assembled into 57 long scaffolds, anchored and ordered with 2,438 markers covering 83% of chromosome 1BS. The BAC-based chromosome 1BS physical map and gene order of the orthologous regions of model grass species were consistent, providing strong support for the reliability of the chromosome 1BS assembly. Chromosome 1BS gene space spans the entire length of the chromosome arm, with 76% of the genes organized in small gene-islands, accompanied by a two-fold increase in gene density from the centromere to the telomere.
Conclusions
This study provides new evidence on common and chromosome-specific features in the organization and evolution of the wheat genome, including a non-uniform distribution of gene density along the centromere-telomere axis, abundance of non-syntenic genes, the degree of colinearity with other grass genomes, and a non-uniform size expansion along the centromere-telomere axis, compared with other model cereal genomes. The high quality physical map constructed in this study provides a solid basis for the assembly of a reference sequence of chromosome 1BS and for breeding applications.
Background
Wheat (Triticum aestivum L; Poaceae) provides nearly 20% of the world’s daily food supply, as measured by calorie intake [1]. The wheat genome sequence is the essential tool for advanced genomic research and improvements that will enable growers to meet the increasing demands for high-quality food and feed produced in an environmentally sensitive, sustainable, and profitable manner. The generation of high-quality reference genome sequence for bread wheat is a challenge as it has a complex hexaploid (2n = 6x = 42) genome, 17 Gb in size, which consists of more than 80% of repetitive elements [2]. The polyploidy and the repetitive nature of the wheat genome are barriers to the high-quality assembly of whole-genome shotgun sequences. The International Wheat Genome Sequencing Consortium (IWGSC; [3]), established with the goal to fully sequence the wheat genome [4], has adopted chromosome-by-chromosome sequencing strategy with the construction of bacterial artificial chromosome (BAC)-based physical maps as a necessary intermediate step. The current study is part of the European TriticeaeGenome FP7 project [5], which was established to construct physical maps of group 1 and 3 chromosomes of wheat and barley [6].
The ability to sort out individual wheat chromosomes by flow cytometry has been a key to the success in reducing the complexity of wheat genome analysis. This approach has made it possible to develop chromosome-specific BAC libraries using aneuploid lines of the model wheat genotype ‘Chinese Spring’ (CS) [7-9]. Nowadays, chromosome and chromosome-arm-specific BAC libraries are available for all wheat chromosomes [9]. Physical maps of individual wheat chromosomes and chromosome arms can be established via various fingerprinting technologies (e.g. [10,11]). BAC clones are typically digested with restriction enzymes which produce a specific pattern of DNA fragments (“bands” hereafter) for each BAC clone. These DNA patterns (referred to as fingerprints) are then used to find significant overlaps between BAC clones and to arrange them into physical BAC-contigs. In the current study we have used the high information content fingerprinting (HICF) method that produces

particularly diverse fingerprint patterns [10]. FingerPrintedContigs (FPC) [12] has been the contig assembly program used in several grass genome projects (e.g. [13-15]). However, the application of FPC is limited when dealing with complex genomes, such as wheat and barley. Due to the high level of repetitive DNA in wheat genome, the criteria that FPC uses for BAC contig assembly often result in very short contigs and unreliable assembly. Moreover, the presence of repetitive or poorly fingerprinted “questionable” clones (Q-clones) can lead to false overlaps and thus wrongly assembled contigs. Linear Topological Contig (LTC) is a novel analytical program for contig assembly that was developed by Frenkel et al. [16] and is available at the Institute of Evolution website [17], University of Haifa. LTC has several major advantages over the standard FPC software [12] that are crucial for the assembly of complex genomes, such as wheat. The algorithms implemented in LTC facilitate the construction of longer and more reliable BAC-contigs, as compared to FPC. LTC provides a visual representation of significant clone overlaps as a network of parallel clone connections, thus allowing straightforward identification of Q-clones and Q-overlaps (overlaps that are not confirmed by multiple paralleled connections). LTC improves contig assembly by breaking branching contigs into linear structures that do not contradict the one-dimensional linear organization of the chromosome. End-to-end merging strategy can then be applied to combine linear contigs into long scaffolds. This strategy is enabling to obtain a correct orientation and ordering of contigs within scaffolds along the chromosome, and thereby reduce the anchoring efforts. In the current study, the 1BS physical map was constructed using the LTC program and the BAC-contig assemblies obtained by LTC and FPC were compared.
Once a physical map is assembled, the BAC contigs are usually anchored with molecular markers to high density genetic maps. In wheat, however, recombination-based mapping cannot provide the necessary resolution to anchor a physical map, due to the uneven distribution of crossing-over events along the chromosomes and the strong long-distance suppressing effect of the centromeres on recombination [18-21]. Cytogenetic stocks in wheat (e.g. ditelosomic lines and chromosome deletion lines) have been used for mapping and anchoring of BAC contigs [22]. However, these stocks provide limited resolution due to large deletion sizes (average deletion bin ~35 Mb) and the inability to order markers within a given bin [22]. A significant level of colinearity between Poaceae genomes [23,24] has made it possible to infer gene content and gene order for Triticeae by comparing them with completely sequenced model grass species using the conserved synteny-based GenomeZipper approach [25,26]. Compilation of synteny information from the completely sequenced genomes of model grasses such as rice (Oryza sativa; [14]), sorghum (Sorghum bicolor; [15]) and Brachypodium (Brachypodium distachyon; [13]) has made it possible to deduce a hypothetical gene order in the syntenic regions of grass species for which no reference genome is available. This comparative genomic strategy has been shown to be efficient in BAC-based physical mapping of barley genome [27].
The estimated length of the short arm of wheat chromosome 1B (1BS) is ~314 Mb [8,28], which is larger than the size of the complete Brachypodim genome (270 Mb) and represents 1.9% of the entire hexaploid wheat genome. This chromosome arm carries various disease and pest-resistance genes, and storage protein genes that directly affect grain quality [19,29], as well as many other economically important genes [30].
Here we present the final assembly and analysis of the physical map of 1BS chromosome of bread wheat, with comprehensive corresponding genomic resources including: (1) a deep-coverage BAC library; (2) a high information content BAC fingerprint (HICF) dataset; (3)
assembled BAC contigs subsequently elongated to scaffolds with LTC program; (4) a transcriptional map based on wheat NimbleGen 40 K unigene microarray; and (5) sequence-based marker datasets, including shotgun sequences of 1BS [31], BAC-end sequences (BESs), and a genetic marker dataset used to infer contig position and orientation with respect to the model grass reference genomes. The construction of the 1BS physical map and the corresponding resources provide a solid base for BAC-by-BAC sequencing of this chromosome arm, as well as vital support for ongoing and future projects of map-based cloning of genes and quantitative trait loci (QTLs) mapped to 1BS. Moreover, the constructed physical map of chromosome 1BS provides an insight into its unique gene space organization and evolution.
Results
Automated physical map assembly
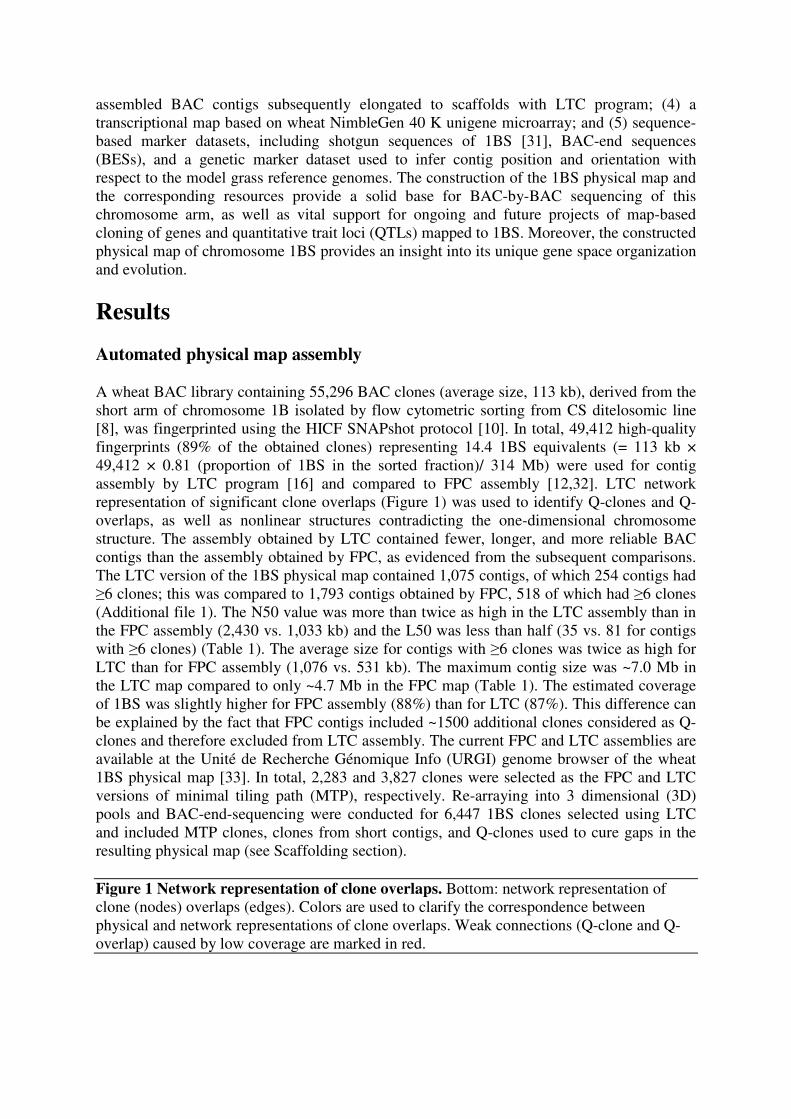
A wheat BAC library containing 55,296 BAC clones (average size, 113 kb), derived from the short arm of chromosome 1B isolated by flow cytometric sorting from CS ditelosomic line [8], was fingerprinted using the HICF SNAPshot protocol [10]. In total, 49,412 high-quality fingerprints (89% of the obtained clones) representing 14.4 1BS equivalents (= 113 kb × 49,412 × 0.81 (proportion of 1BS in the sorted fraction)/ 314 Mb) were used for contig assembly by LTC program [16] and compared to FPC assembly [12,32]. LTC network representation of significant clone overlaps (Figure 1) was used to identify Q-clones and Q-overlaps, as well as nonlinear structures contradicting the one-dimensional chromosome structure. The assembly obtained by LTC contained fewer, longer, and more reliable BAC contigs than the assembly obtained by FPC, as evidenced from the subsequent comparisons. The LTC version of the 1BS physical map contained 1,075 contigs, of which 254 contigs had ≥6 clones; this was compared to 1,793 contigs obtained by FPC, 518 of which had ≥6 clones (Additional file 1). The N50 value was more than twice as high in the LTC assembly than in the FPC assembly (2,430 vs. 1,033 kb) and the L50 was less than half (35 vs. 81 for contigs with ≥6 clones) (Table 1). The average size for contigs with ≥6 clones was twice as high for LTC than for FPC assembly (1,076 vs. 531 kb). The maximum contig size was ~7.0 Mb in the LTC map compared to only ~4.7 Mb in the FPC map (Table 1). The estimated coverage of 1BS was slightly higher for FPC assembly (88%) than for LTC (87%). This difference can be explained by the fact that FPC contigs included ~1500 additional clones considered as Q-clones and therefore excluded from LTC assembly. The current FPC and LTC assemblies are available at the Unité de Recherche Génomique Info (URGI) genome browser of the wheat 1BS physical map [33]. In total, 2,283 and 3,827 clones were selected as the FPC and LTC versions of minimal tiling path (MTP), respectively. Re-arraying into 3 dimensional (3D) pools and BAC-end-sequencing were conducted for 6,447 1BS clones selected using LTC and included MTP clones, clones from short contigs, and Q-clones used to cure gaps in the resulting physical map (see Scaffolding section).
Figure 1 Network representation of clone overlaps. Bottom: network representation of clone (nodes) overlaps (edges). Colors are used to clarify the correspondence between physical and network representations of clone overlaps. Weak connections (Q-clone and Q-overlap) caused by low coverage are marked in red.

Table 1 Statistics for 1BS contigs with more than five BAC clones assembled by FPC
and LTC programs and scaffolds assembled by LTC Contigs with ≥6 clones FPC contigs LTC contigs LTC scaffolds
Average clone number in contigs 65.8 133.3 565.5 Maximal clone number 580 868 2587 Average contig size (kb)* 531 1076 4564 Maximal contig size (kb)* 4681 7006 20881 N50 (kb)* 1033 2430 8515 L50 81 35 11 N90 (kb)* 250 670 2260 L90 292 115 34 Coverage in length (Mb, % of 1BS)* 275 (88%) 273 (87%) 260 (83%)
*Calculated based on the number of clones, mean clone length, and coverage.
Physical scaffolding of 1BS BAC contigs
The initial LTC assembly was performed with a Sulston score cut-off of 10-15-10-33, excluding Q-clones and Q-overlaps. In total, 36,635 clones (74% of 49,412) were assembled into 1,075 reliable contigs with ≥2 clones (254 of which had ≥6 clones). Manual contig elongation and end-to-end merging by LTC was then employed to obtain a chain of contigs referred to as scaffolds hereafter (Figure 2). This procedure was conducted with a less stringent cut-off (10-15) and also used Q-clones and Q-overlaps for curing gaps in the assembly. In total, 1,057 BAC contigs were merged into 57 scaffolds consisting of 32,231 clones. This number represents 87% of the clones included in the initial LTC contig assembly and an additional ~300 clones that were not included at that stage (e.g. Q-clones) but were subsequently proved to contribute to the scaffold assembly. Scaffold sizes varied from 1.2 to 20.8 Mb with an average of 4.5 Mb (N50 = 8.5 Mb; L50 = 11 scaffolds, Table 1 and Figure 3). These scaffolds cover ~260 Mb, which correspond to 83% of 1BS arm. Obviously, integration of contigs into scaffolds simplified the orientation of the contigs relative to the centromere-telomere axis and greatly facilitated the anchoring of the physical map by fewer markers and with higher confidence compared to the orientation and anchoring of individual contigs.
Figure 2 LTC scaffolding by end-to-end merging and comparison to FPC contig assembly. (a) LTC scaffold with 730 clones, resulting from merging of five contigs, is shown at the top of the figure by linear representation. The five FPC contigs that cover the corresponding region are displayed underneath. The gray lines connect to the start points of the corresponding BACs. The blue (Ctg31) and the green (Ctg34) FPC contigs demonstrate two cases of false merging of unrelated contigs by Q-clones that were resolved in the LTC scaffold assembly. (b) Network representation of the contigs Ctg31 (blue) and Ctg34 (green) assembly by LTC. The vertices correspond to clones; edges correspond to significant clone overlaps. It can be seen that the contigs’ parts excluded from the LTC scaffold are connected by only a single Q-clone, while the LTC true assembly is validated by multiple connections that exist between other clones of these two contigs.
Figure 3 Comparison of contig lengths of FPC and LTC assemblies and scaffolding. FPC contigs are marked in green, LTC contigs in red, and LTC scaffolds in blue. Only the longest 100 contigs are shown for each assembly. LTC-based contigs are longer than FPC contigs. The 57 constructed LTC-based scaffolds covered approximately 83% of the entire 1BS.

Physical contig and scaffold assemblies were partially validated using PCR-based molecular markers: the presence of a PCR marker in adjacent MTP clones provides confirmation for the physical overlap of the clones. In MTP clones selected by LTC, adjacent clones are noticeably overlapped (Sulston score <10-15, indicating >30% shared bands; that is, on average, >30% of physical length overlaps). In fact, we found an average of ~2.4 positive MTP clones for each marker, indicating that the level of the actual MTP clone overlaps is even higher than expected by the theoretical predictions.
Establishment of marker resources and assignment of markers to contigs and scaffolds
Integration of gene-derived markers into 1BS physical contigs and scaffolds was achieved by hybridization of BAC DNA of the 57 3D 1BS MTP pools (6,447 clones) to a NimbleGen 40 K expression array containing 39,179 wheat unigenes developed by Rustenholz et al. [34]. After signal quantification, normalization and data deconvolution, 1,063 unigenes were unambiguously assigned to 1,568 1BS clones (Additional file 2) from the scaffolds representing 262 Mb of 1BS. The clone position of a random sample of 82 markers obtained based on this hybridization strategy was confirmed by PCR.
One of the strategies used for anchoring BAC contigs was to employ PCR markers developed from the 1BS sequence data, as well as publicly available markers. We have developed a large number of primer pairs that can be converted to PCR markers for 1BS mapping using 454 sequence data of sorted 1BS chromosomes [35] and 1BS BES generated in the current study. The 1BS gene-related sequences, identified by the GenomeZipper approach [35], were used to construct 361 gene-related primer pairs (Additional file 3). In addition 40 primer pairs for gene-related markers (Additional file 3) were designed based on homology with barley unigenes [36]. Insertion-sequence-based polymorphism (ISBP) and simple sequence repeat (SSR) markers were developed by analysing 727 Mb of 1BS 454 sequence and 9 Mb of BES of the MTP clones with the IsbpFinder and SSRDesign perl scripts [37]. Primer pairs for 44,729 high-quality ISBP markers and 10,543 SSR markers were constructed and are now available for mapping on chromosome 1BS (Additional file 3). Using BES, primer pairs for 4,035 ISBPs and 819 SSRs were developed (Additional file 3). The advantage of using BES-based markers is that their position in the corresponding 1BS contig is already known. As a proof of concept, we have assigned 102 newly developed and publicly available PCR markers (15 SSRs, 16 ISBP, and 71 EST-based) to 32 BAC contigs corresponding to ~18 Mb of 1BS (Additional file 2). The anchoring of 32 contigs with these markers was verified by PCR amplifications of 65 individual MTP clones. These 32 contigs were incorporated into 23 scaffolds covering 161.9 Mb of 1BS. Thus, the scaffolding strategy made it possible to anchor 51% (161.9 of 314 Mb) of 1BS DNA by means of only 102 PCR markers.
Finally, in silico anchoring of the sequences to particular BACs, based on unambiguous sequence similarities, enabled us to assign markers to contigs and scaffolds covering 237 Mb (75% of 314 Mb) of the 1BS chromosome. BAC-end sequencing of 6,447 1BS MTP clones yielded 12,894 sequences, with a total size of 9 Mb that represent 3% of 1BS and provide an average of one sequence tag for every 25 kb. Non-repeat masked BES were aligned with 1,776 1BS Illumina survey sequence contigs [31] obtained due to similarity (e-value <10-25) with unigene sequences, which gave signals in the NimbleGen hybridization (Additional file 4). In total, 1,641 (11.96 Mb) of Illumina contigs were integrated into the 1BS physical map based on very high similarity (>600 bp and at least 99% sequence identity) with non-repeat masked BES of the MTP clones and homology with the group 1 GenomeZipper (Additional
files 2 and 5). A comparison of 1BS BES (after repeat masking) to group 1S GenomeZipper revealed homology to 244 (e-value <10-10) gene sequences (1.9% of BESs), which made it possible to integrate these clones to a 1BS physical map based on the 1S zipper position.
Chromosome 1BS deletion bin mapping
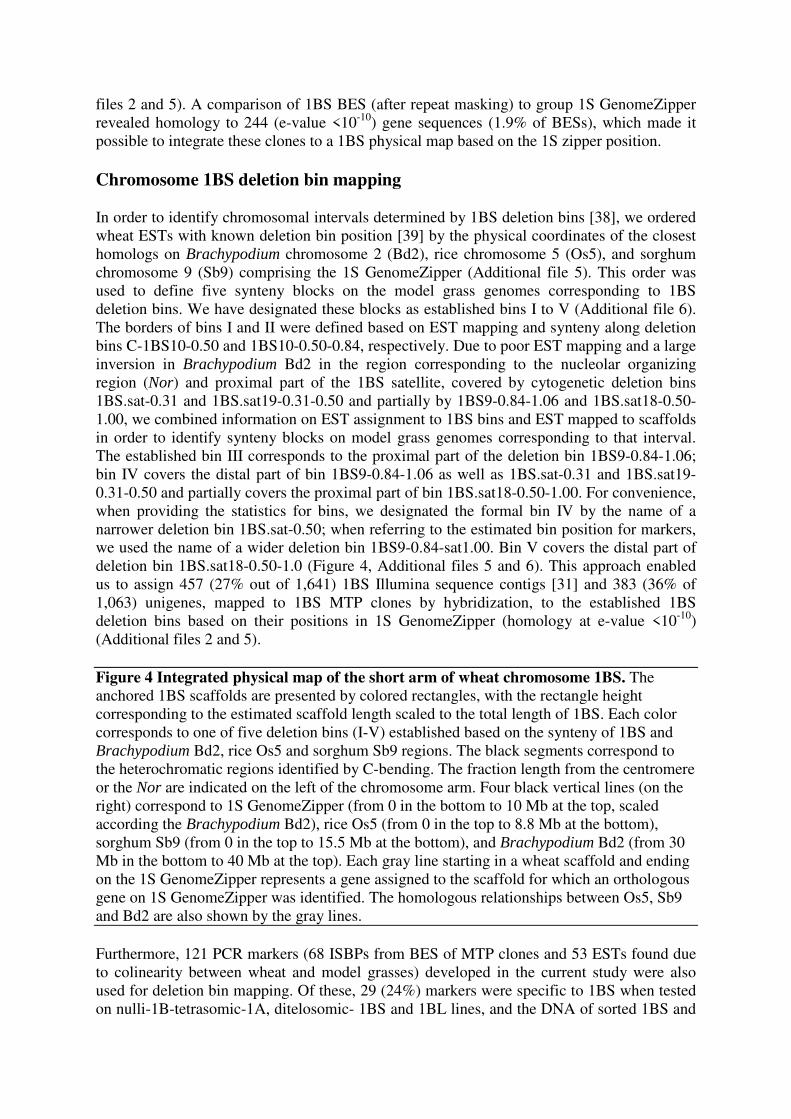
In order to identify chromosomal intervals determined by 1BS deletion bins [38], we ordered wheat ESTs with known deletion bin position [39] by the physical coordinates of the closest homologs on Brachypodium chromosome 2 (Bd2), rice chromosome 5 (Os5), and sorghum chromosome 9 (Sb9) comprising the 1S GenomeZipper (Additional file 5). This order was used to define five synteny blocks on the model grass genomes corresponding to 1BS deletion bins. We have designated these blocks as established bins I to V (Additional file 6). The borders of bins I and II were defined based on EST mapping and synteny along deletion bins C-1BS10-0.50 and 1BS10-0.50-0.84, respectively. Due to poor EST mapping and a large inversion in Brachypodium Bd2 in the region corresponding to the nucleolar organizing region (Nor) and proximal part of the 1BS satellite, covered by cytogenetic deletion bins 1BS.sat-0.31 and 1BS.sat19-0.31-0.50 and partially by 1BS9-0.84-1.06 and 1BS.sat18-0.50-1.00, we combined information on EST assignment to 1BS bins and EST mapped to scaffolds in order to identify synteny blocks on model grass genomes corresponding to that interval. The established bin III corresponds to the proximal part of the deletion bin 1BS9-0.84-1.06; bin IV covers the distal part of bin 1BS9-0.84-1.06 as well as 1BS.sat-0.31 and 1BS.sat19-0.31-0.50 and partially covers the proximal part of bin 1BS.sat18-0.50-1.00. For convenience, when providing the statistics for bins, we designated the formal bin IV by the name of a narrower deletion bin 1BS.sat-0.50; when referring to the estimated bin position for markers, we used the name of a wider deletion bin 1BS9-0.84-sat1.00. Bin V covers the distal part of deletion bin 1BS.sat18-0.50-1.0 (Figure 4, Additional files 5 and 6). This approach enabled us to assign 457 (27% out of 1,641) 1BS Illumina sequence contigs [31] and 383 (36% of 1,063) unigenes, mapped to 1BS MTP clones by hybridization, to the established 1BS deletion bins based on their positions in 1S GenomeZipper (homology at e-value <10-10) (Additional files 2 and 5).
Figure 4 Integrated physical map of the short arm of wheat chromosome 1BS. The anchored 1BS scaffolds are presented by colored rectangles, with the rectangle height corresponding to the estimated scaffold length scaled to the total length of 1BS. Each color corresponds to one of five deletion bins (I-V) established based on the synteny of 1BS and Brachypodium Bd2, rice Os5 and sorghum Sb9 regions. The black segments correspond to the heterochromatic regions identified by C-bending. The fraction length from the centromere or the Nor are indicated on the left of the chromosome arm. Four black vertical lines (on the right) correspond to 1S GenomeZipper (from 0 in the bottom to 10 Mb at the top, scaled according the Brachypodium Bd2), rice Os5 (from 0 in the top to 8.8 Mb at the bottom), sorghum Sb9 (from 0 in the top to 15.5 Mb at the bottom), and Brachypodium Bd2 (from 30 Mb in the bottom to 40 Mb at the top). Each gray line starting in a wheat scaffold and ending on the 1S GenomeZipper represents a gene assigned to the scaffold for which an orthologous gene on 1S GenomeZipper was identified. The homologous relationships between Os5, Sb9 and Bd2 are also shown by the gray lines.
Furthermore, 121 PCR markers (68 ISBPs from BES of MTP clones and 53 ESTs found due to colinearity between wheat and model grasses) developed in the current study were also used for deletion bin mapping. Of these, 29 (24%) markers were specific to 1BS when tested on nulli-1B-tetrasomic-1A, ditelosomic- 1BS and 1BL lines, and the DNA of sorted 1BS and

1AS chromosomes. These markers, together with 15 1BS-specific SSRs from the GrainGenes database [40], were assigned to one of nine 1BS deletion bins: C-1BS-0.35, 1BS1-0.35-0.50, 1BS10-0.50-0.54, 1BS20-0.54-0.84, 1BS9-0.84-1.06, 1BS.sat-0.31, 1BS.sat19-0.31-0.50, 1BS.sat18-0.50-0.52, and 1BS.sat4-0.52-1.00 [38] (Additional file 2).
Anchoring, ordering and orientation of 1BS physical contigs and scaffolds
The ordering and orientation of BAC contigs and scaffolds along 1BS arm was carried out based on the assumption that wheat and sequenced model grass genomes share extensive collinear relationships. The constructed large 1BS segments (e.g. 2–20.8 Mb scaffolds, average 4.5 Mb) enabled us to test and validate this assumption. The closest homologous gene sequences shared between Brachypodium Bd2, rice Os5 and sorghum Sb9 and orthologous to 1BS were ordered using the GenomeZipper approach [25,26,35]. The observed similarity of gene orders in orthologous intervals was extrapolated to define the order of 457 1BS gene-containing Illumina sequence contigs [31] and 383 unigenes mapped to 1BS by the NimbleGen microarray hybridization approach. The 1BS BAC contigs to which gene-derived markers were assigned were ordered according to the positions of the closest homologs in the 1S GenomeZipper (Figure 4, Additional files 2 and 5). Using this approach, we were able to anchor 53 of the 57 (93%) 1BS scaffolds to the 1S GenomeZipper and to 1BS deletion bin map. Five contigs and two scaffolds (3% of clones) were anchored to 1BS deletion bin map only, based on mapping with ISBP and SSR marker data. The anchored physical map of 1BS includes 189 of 254 (74%) contigs with ≥6 clones, covering 241.1 Mb (77.4%) of the chromosome (Figure 4 and Table 2). This map contains 2,438 markers, 903 of which were mapped physically and 1,535 were mapped in silico, with an average density of 10 markers per 1 Mb. The position on group 1S GenomeZipper was identified for 620 (24%) of these markers. The final 1BS physical map is available at the wheat genome browser of the URGI website [33].
Table 2 Scaffolds and markers distribution along the short arm of wheat chromosome
1B, according to deletion bins and bins established due to synteny with model grass
genomes Wheat1BS deletion
bins Established wheat 1BS
deletion bins Assigned scaffolds
(Mb) No. of
markers Marker Density
(Marker/Mb)
1BS.sat18-0.50-1.0* V 26.8 340 12.7 1BS.sat5-1.06-0.50 IV 62.2 585 9.4 1BS9-0.84-1.06* III 47.4 423 8.9 1BS10-0.50-0.84 II 35.3 369 10.5 C-1BS10-0.50 I 69.4 724 10.4 Total in scaffolds 241.1 2438 10.1 In BAC clones** 501 Total in scaffolds and in BAC clones 2939
*Deletion bins partly covered by bin IV as shown on Figure 1. ** BAC clones that were not included in scaffolds.
The development of the anchored 1BS physical map enabled us to compare the gene order in 1BS and in orthologous intervals of the model grass genomes. The global and local gene orders established for 1BS were found to be similar to those of corresponding homologous genes in Bd2, Os5 and Sb9. In total, 73.3% of the gene-related markers mapped to 1BS were in the same order as the homologous genes in the orthologous regions of at least two of the three utilized model grass genomes (Figure 4, Additional file 5). Nevertheless, some
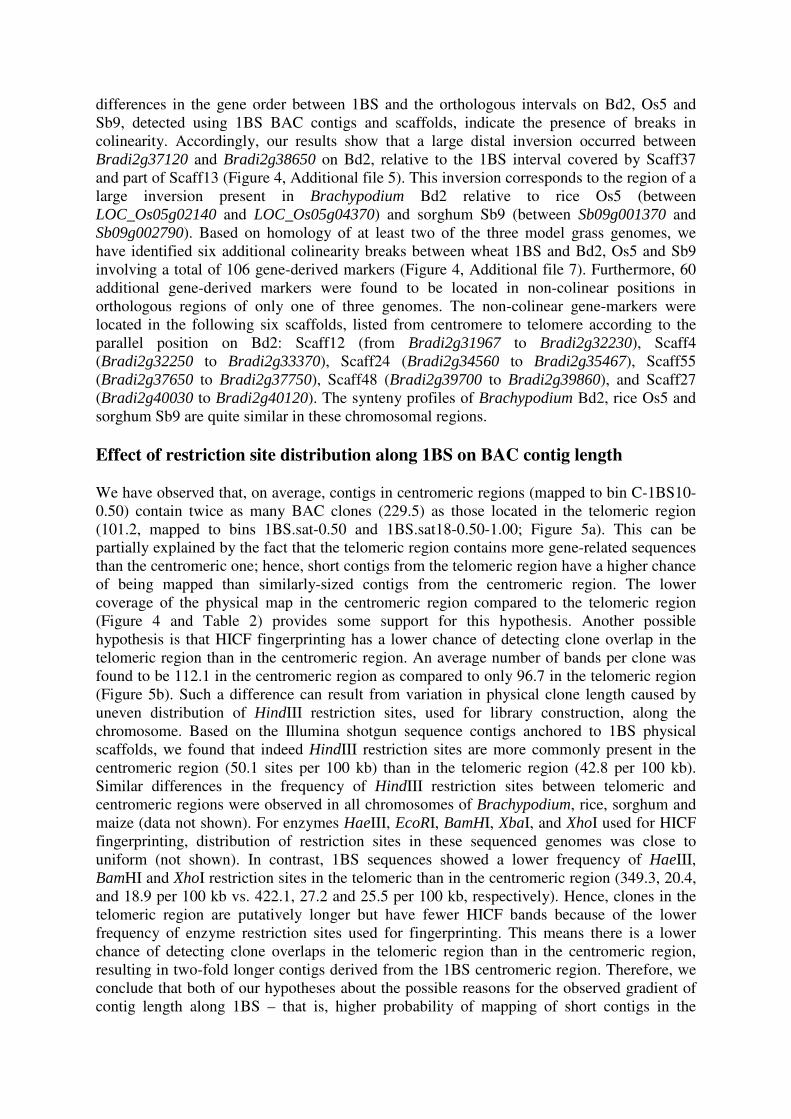
differences in the gene order between 1BS and the orthologous intervals on Bd2, Os5 and Sb9, detected using 1BS BAC contigs and scaffolds, indicate the presence of breaks in colinearity. Accordingly, our results show that a large distal inversion occurred between Bradi2g37120 and Bradi2g38650 on Bd2, relative to the 1BS interval covered by Scaff37 and part of Scaff13 (Figure 4, Additional file 5). This inversion corresponds to the region of a large inversion present in Brachypodium Bd2 relative to rice Os5 (between LOC_Os05g02140 and LOC_Os05g04370) and sorghum Sb9 (between Sb09g001370 and Sb09g002790). Based on homology of at least two of the three model grass genomes, we have identified six additional colinearity breaks between wheat 1BS and Bd2, Os5 and Sb9 involving a total of 106 gene-derived markers (Figure 4, Additional file 7). Furthermore, 60 additional gene-derived markers were found to be located in non-colinear positions in orthologous regions of only one of three genomes. The non-colinear gene-markers were located in the following six scaffolds, listed from centromere to telomere according to the parallel position on Bd2: Scaff12 (from Bradi2g31967 to Bradi2g32230), Scaff4 (Bradi2g32250 to Bradi2g33370), Scaff24 (Bradi2g34560 to Bradi2g35467), Scaff55 (Bradi2g37650 to Bradi2g37750), Scaff48 (Bradi2g39700 to Bradi2g39860), and Scaff27 (Bradi2g40030 to Bradi2g40120). The synteny profiles of Brachypodium Bd2, rice Os5 and sorghum Sb9 are quite similar in these chromosomal regions.
Effect of restriction site distribution along 1BS on BAC contig length
We have observed that, on average, contigs in centromeric regions (mapped to bin C-1BS10-0.50) contain twice as many BAC clones (229.5) as those located in the telomeric region (101.2, mapped to bins 1BS.sat-0.50 and 1BS.sat18-0.50-1.00; Figure 5a). This can be partially explained by the fact that the telomeric region contains more gene-related sequences than the centromeric one; hence, short contigs from the telomeric region have a higher chance of being mapped than similarly-sized contigs from the centromeric region. The lower coverage of the physical map in the centromeric region compared to the telomeric region (Figure 4 and Table 2) provides some support for this hypothesis. Another possible hypothesis is that HICF fingerprinting has a lower chance of detecting clone overlap in the telomeric region than in the centromeric region. An average number of bands per clone was found to be 112.1 in the centromeric region as compared to only 96.7 in the telomeric region (Figure 5b). Such a difference can result from variation in physical clone length caused by uneven distribution of HindIII restriction sites, used for library construction, along the chromosome. Based on the Illumina shotgun sequence contigs anchored to 1BS physical scaffolds, we found that indeed HindIII restriction sites are more commonly present in the centromeric region (50.1 sites per 100 kb) than in the telomeric region (42.8 per 100 kb). Similar differences in the frequency of HindIII restriction sites between telomeric and centromeric regions were observed in all chromosomes of Brachypodium, rice, sorghum and maize (data not shown). For enzymes HaeIII, EcoRI, BamHI, XbaI, and XhoI used for HICF fingerprinting, distribution of restriction sites in these sequenced genomes was close to uniform (not shown). In contrast, 1BS sequences showed a lower frequency of HaeIII, BamHI and XhoI restriction sites in the telomeric than in the centromeric region (349.3, 20.4, and 18.9 per 100 kb vs. 422.1, 27.2 and 25.5 per 100 kb, respectively). Hence, clones in the telomeric region are putatively longer but have fewer HICF bands because of the lower frequency of enzyme restriction sites used for fingerprinting. This means there is a lower chance of detecting clone overlaps in the telomeric region than in the centromeric region, resulting in two-fold longer contigs derived from the 1BS centromeric region. Therefore, we conclude that both of our hypotheses about the possible reasons for the observed gradient of contig length along 1BS – that is, higher probability of mapping of short contigs in the

telomeric part and higher information content of HICF fingerprinting in the centromeric region – fit the data.
Figure 5 Gradient of contig length along the 1BS chromosome. (a) Proportions of contigs with different lengths (Mb) among the ones mapped to the centromeric part of 1BS (deletion bin C-1BS10-0.50, indicated by blue color) compared to contigs mapped to the telomeric region (deletion bins 1BS.sat5-1.06-0.50 and 1BS.sat18-0.50-1.0, indicated in red); (b) Differences in clone band number distributions between centromeric (blue) and telomeric (red) regions. Based on BAC-end sequences, we concluded that such differences are caused by the information content of fingerprinting rather than by physical clone length (see text).
Scaling of wheat 1BS arm based on physical map
Chromosome 1BS BAC contigs and scaffolds anchored to 1S GenomeZipper and deletion bins made it possible to scale 1BS relative to Brachypodium Bd2 and to estimate 1BS deletion bin sizes. Considering the coverage of 1BS by anchored contigs (77.4%), the physical size, LW, of wheat 1BS arm corresponding to a segment on Bd2 with length, LB, can be estimated as: LW ~ 1/0.774 × L1BS/L1S(Bd2) × LB, where L1BS = 314 Mb is the length of 1BS, and L1S(Bd2) ~ 10 Mb is the length of the Bd2 segment corresponding to the entire 1BS arm. Based on cytological estimates [38], C-1BS10-0.50, 1BS10-0.50-0.84, 1BS9-0.84-1.06, 1BS.sat-0.31, 1BS.sat19-0.31-0.50 and 1BS.sat18-0.50-1.00 comprise approximately 33, 22, 11, 10, 7 and 17% of 1BS, respectively. Due to the uncertain identification of the corresponding intervals on group 1S GenomeZipper for deletion bins 1BS.sat-0.31 and 1BS.sat19-0.31-0.50, we combined all data obtained for these bins and parts of bins 1BS9-0.84-1.06 and 1BS.sat18-0.50-1.00 to deletion bin IV designated as 1BS.sat-0.50 and comprising ~27% of 1BS length (Figure 4; for markers from bin IV, we assign a wider bin position 1BS9-0.84-sat1.00 because bin IV also covers parts of 1BS9-0.84-1.06 and 1BS.sat18-0.50-1.00; see above). Our estimates of bin sizes, based on the scaffolds anchored to these bins, are consistent with the proportions of their length estimated cytologically (Table 2). A comparison of 1BS size with Bd2 reveals an average of 30-fold expansion in the wheat chromosome relative to Brachypodium. We have estimated the relative physical distances between the contigs by their position within deletion bins along 1BS and compared them with the relative distances of the orthologous region on Brachypodium Bd2. This comparison reveals a non-uniform distribution of expansion along 1BS from the centromere to the telomere: the increase in size was twice as high in the telomeric part (~45×) than in the centromeric part (~20×) (Figure 4). This finding contrasts with the uniform expansion in chromosomes 3B of wheat [41] and 3DS of Aegilops tauschii [42] when compared to rice, but is consistent with the non-uniform expansion obtained by comparing rice and sorghum, where sorghum genome size increase was entirely accounted for by the increase in the proximal heterochromatic regions [15].
Gene space organization along chromosome 1BS: Estimation of 1BS gene
content
Hybridization of NimbleGen 40 K microarray with 3D pooled MTP clones of 1BS revealed 3,878 unigenes that were putatively mapped to 1BS. For these unigenes, at least two positive MTP clone pools per unigene, corresponding to coordinates of specific clone(s) address on the physical contig, were identified and confirmed by the maximum likelihood method (see Materials and Methods). The probability of obtaining ≥2 positive pools for a unigene by chance alone is very low (0.006). Moreover, the availability of two known coordinates

simplifies the process of obtaining the physical position of these unigenes on 1BS by PCR screening of the 3D pools, especially for unigenes from the intersection of two or more MTP clones. Wicker at el. [35] estimated that the total number of 1BS genes is 3,664 based on alignment of the 727 Mb of 454 sequence data of 1BS flow-sorted chromosomes against 25,468 Brachypodium genes that have DNA homology support from rice and sorghum. The exact proportion of 1BS genes on the NimbleGen 40 K chip is generally unknown. Nevertheless, the similarity of the estimates for 1BS gene content obtained by analyzing the whole-chromosome 454 sequence data and the hybridization results suggest that gene content of 1BS is in the range of ~3600–3800 genes. The correspondence of these independent estimates is indeed very good, especially considering that it is impossible to distinguish between genes and pseudogenes (gene fragments and non-functional gene copies) in the short-read data sets or by the microarray hybridization used in the current study. Full sequencing and ordering of non-repetitive chromosomal fraction is required to resolve gene/pseudogene presence and evolutionary dynamics.
Two-fold increase in gene content towards 1BS telomere
We have investigated the 1BS gene space organization by estimating the distribution of mapped unigenes along 1BS. For this analysis, we considered the 721 unigenes that have only one possible clone address on one of the 160 long 1BS contigs (covering 239.3 Mb, 76.2% of 1BS), thereby avoiding potential inaccuracy caused by Q-clones. Mapping of these 721 loci to 1BS contigs resulted in their assignment to five established 1BS deletion bins defined by corresponding segments on 1S GenomeZipper (Table 2, Additional files 2 and 5). Examination of gene space organization along the five deletion bins of chromosome 1BS revealed that gene density per unit length of physical map increased from an average of 2.5 genes/Mb in the centromeric region to 5.9 genes/Mb in the telomeric region (Figure 6).
Figure 6 Gene density distribution along the short arm of wheat chromosome 1B. The anchored 1BS scaffolds are presented by colored rectangles. The scaffold length is scaled to the total length of 1BS. Each color corresponds to one of five deletion bins (I-V) established based on the synteny of 1BS and Brachypodium Bd2, rice Os5 and sorghum Sb9 regions. The black segments correspond to the heterochromatic regions identified by C-bending. The fraction length from the centromere, or the Nor, is indicated below the chromosome arm. The proportion of syntenic genes blue bars) and of non-syntenic genes (pink bars and the percentage within) is shown for each deletion bin. The density of isolated genes (green bars) and of genes organized in islands (yellow bars) are shown for each deletion bin. The proportions of genes organized in islands per deletion bin are shown as percentages within the yellow bars.
Mapping of the unigenes to 1BS contigs enabled us to evaluate the level of synteny between 1BS and orthologous regions of Brachypodium Bd2, rice Os5 and sorghum Sb9. Out of 721 genes mapped to 1BS scaffolds, 329 (45%), 266 (37%) and 256 (36%) were found to be syntenic on Bd2, Os5 and Sb9, respectively (Additional file 5). The percentage of synteny of 1BS with Bd2 was higher than with Os5 and Sb9, which confirms that Brachypodium is closer to wheat than rice and sorghum [13,43]. The proportion of 1BS syntenic genes is much lower than that reported for 3B (58% and 65% for rice and Brachypodium, respectively [34]). Furthermore, the proportion of non-syntenic genes, based on comparisons of 1BS with Bd2, Os5 and Sb9, increased from 42% in the centromeric bin C-1BS10-0.50 to 58% in the telomeric bin 1BS.sat18-0.50-1.00 covering the proximal part of 1BS satellite (Figure 6).

To further explore the pattern of gene distribution along 1BS chromosome, we tested for the presence of gene clustering. Assuming random gene distribution, 721 unigenes should be uniformly distributed along large scaffolds (with length >1 Mb) covering 253 Mb. To test whether this assumption fits our data, we subdivided these long contigs into 1,000 non-overlapping “intervals” and scored the number of unigenes in each interval. If the gene distribution is random, the expected number of intervals (each of which is 0.253 Mb in length, corresponding to more than two clone lengths) with zero, one, and two or more unigenes, will be 1000 · (1–0.001)721 = 486.1, 1000 · 721 · 0.001 (1–0.001)720 = 350.4 and 1,000-486.1-350.4 =163.5, respectively. We consider two genes to belong to a gene island if the physical distance between them is not more than a single-clone length. Hence, if two unigenes are found in the same clone or in a pair of significantly overlapping clones, they will be considered as members of the same gene island. In total, we found 189 of 0.253 Mb intervals with only one unigene and 182 with two and more unigenes, i.e. gene islands, covering approximately 55.9 Mb. The total length of empty segments amounts to 589.9 intervals (=1000-189-221.1) of 0.253 Mb. Comparing the observed distribution of intervals with zero, one, and ≥2 unigenes (589.9, 189 and 221.1) with the expected distribution under the assumption of random distribution (486.1, 350.4 and 163.5) enabled us to conclude that gene distribution along 1BS chromosome is not random (χ2 = 178.5, d.f. = 2, p-value < 10-10) with an excess of gene-rich regions (composed of 2–20 genes, Figure 7). Gene clustering into many of the small islands found here in chromosome 1BS is in general agreement with the gene organization found in chromosome 3B [34,41,44], as well as for Aegilops tauschii, the diploid progenitor of the wheat D genome [45,46].
Figure 7 Comparison of observed versus expected numbers of 253 kb length 1BS intervals containing no, single, or at least a pair of genes. The total number of considered chromosomal intervals is 1000. The observed number of intervals with a single gene was calculated as the number of genes at a distance of at least 253 kb/2 from other genes. The number of intervals with ≥ 2 genes (observed) was calculated as the total length covered by gene islands (including additional left 253 kb/2 from the left-most gene and additional right 253 kb/2 from the right-most gene) divided by the length of the interval. The expected numbers of intervals were calculated based on binomial distribution (see text for more details). The figure demonstrates that genes tend to be clustered within 1BS: the observed proportion of single genes is about half as low as expected under the random gene distribution hypothesis.
Discussion
The huge size (17 Gb) of the bread wheat genome, its polyploid nature and the extremely high proportion (>80%) of repetitive elements, present a challenge to the construction of a reliable reference genome sequence for wheat. Therefore, the IWGSC has approached sequencing through the construction of BAC-based physical maps of individual chromosome arms. The significance of physical map integration in whole genome sequencing of large cereal genomes was recently demonstrated for barley [27]. Following the IWGSC chromosome-by-chromosome approach, we have constructed the first complete physical map of chromosome arm 1BS and studied its gene space organization and evolution.

Significant increase in BAC scaffold length by LTC adaptive clustering strategy
We constructed a physical map of 1BS arm by fingerprinting and contig assembly of 49,412 BAC clones (17× of 1BS). We used the LTC [16] program for contig assembly and scaffolding and compared LTC and FPC assemblies [12,32]. The LTC adaptive clustering strategy developed in our group dramatically improved the 1BS physical map assembly and resulted in half as many contigs (which were, therefore, twice as long) compared to those constructed by FPC. Moreover, the LTC program enabled us to elongate 254 BAC contigs and to merge them into only 57 very long scaffolds (average size 4.5 Mb, maximal size 20.8 Mb) with an N50 value that was more than eight-fold higher than the one obtained in FPC assembly (8,515 kb vs. 1,033 kb). A comparison of wheat chromosome physical maps published to date (e.g. 1AS [47], 1AL [48], 1BS (this study) and 1BL [49]) clearly shows that LTC assemblies of BAC contigs are approximately twice as long as those obtained by FPC. Furthermore, while the assembly of 3B contains 1,036 contigs (~800 Mb, 80% of 3B [22]), the 1BS assembly contains only 57 scaffolds, which represent more than 83% (260 Mb) of 1BS. Similar differences can be observed when comparing the final assembly of 1BS with that of 1AS [47], 1AL [48], or 1BL [49].
Comparative genomics as a strategy for assembly, validation and contig anchoring
The high coverage (77.4% of 1BS) of the physical map, assembled and anchored in the current study, was achieved using several complementary strategies: (i) merging of contigs into scaffolds by LTC program; (ii) marker assignment to contigs and anchoring to 1BS deletion bins; and (iii) comparative genomics based on synteny between wheat and model grass genomes. This approach resulted in the anchoring of 53 1BS LTC scaffolds, covering 243.1 Mb of 1BS, to deletion bins and to 1S GenomeZipper. The 1BS physical map was further enhanced by integrating the information from 1,641 Illumina survey sequence contigs [31] and 12,894 BES. In total, 2,438 markers were placed on the anchored physical map, most of which (87.5%) are gene-related markers integrated by direct molecular (PCR & microarray) or in silico analyses (Table 2). In addition to providing valuable genetic information, these markers were extremely useful for validating the LTC assembly based on synteny with fully sequenced model grass genomes: Brachypodium, rice and sorghum using the GenomeZipper approach [25,26]. We found that 73.3% of the gene-related markers mapped to 1BS BAC clones and arranged in scaffolds were in the same order as the homologous genes in the orthologous regions of model grass genomes. The consistency in gene order observed between 1BS physical map and the orthologous regions in model grass genomes verifies the reliability of the LTC scaffold assembly based on end-to-end merging of contigs.
The synteny-based integration of wheat BAC contigs using sequence information of model grass genomes was especially helpful for regions with limited resolution of wheat genetic maps due to suppressed recombination in the centromeric and subcentromeric regions of 1BS. The genetic maps of the short arms of B genome chromosomes of wheat are derived almost exclusively from recombination in the distal 25–30% of their physical length [18]. Furthermore, SSR mapping showed that 60% of 1BS is represented by only ~2% of the genetic map [50]. In the current study, a total of 1,366 gene-related markers were located in regions with low recombination frequency, thus representing genes with limited accessibility based on genetic mapping. Anchoring scaffolds to 1BS deletion bins and 1S GenomeZipper

enabled us to overcome the limitations imposed by meiotic mapping. Moreover, the anchored physical map enabled us to identify the exact physical position of 1,074 gene-related markers in low recombination regions, and 553 genes in high recombination regions (62% of mapped gene-related markers in total) for which no homologous sequences in the orthologous regions of model grass genomes were identified. Map-based cloning studies of important wheat genes (e.g. Gpc-B1; [51,52] and Yr36; [53]) have shown that orthologs for the targeted wheat genes were lacking in rice within otherwise well preserved colinear genome segments. Several classes of genes that are either unique to wheat (e.g. end-use quality) or rapidly evolve (such as disease resistance (R)-genes) [54], will likely be among those that have no matched homologs in the model grass genomes. It is believed that gene distribution along chromosome arms with no regions that are devoid of genes is common for wheat chromosomes, as was shown by microarray hybridization-based mapping and sequence homology studies of chromosomes 3B [22] and 1BS (current study). Our 1BS physical map provides a rich source of gene-related markers for map-based cloning of genes, even in low-recombination regions. Nevertheless, complementary strategies, such as radiation hybrid mapping or genome-wide association analysis may be required, in addition to the 1BS physical map, for gene identification and gene isolation studies.
Gene space organization of 1BS chromosome
The current physical map served as a basis for transcriptional mapping of 1BS achieved by hybridizing the NimbleGen 40 K wheat unigene microarray with 1BS MTP BAC pools. The obtained transcriptional map contained 721 loci, which were used to study the gene space organization and evolution along 1BS. The transcriptional map confirmed that the gene space spans the entire length of 1BS, and displays a gradient of gene density with a two-fold increase from the centromere to the telomere. Furthermore, 76% of the genes were organized in small gene islands composed of two or three genes. A similar pattern of increase in gene density from proximal to distal regions of 1BS arm was inferred by Peng et al. [39], who mapped ESTs to 1BS deletion bins. Choulet et al. [41] and Rustenlolz et al. [34] reported on a similar gradient of gene density along wheat chromosome 3B. Gene density in many grass genomes increases overall from the proximal towards the distal regions of chromosome arms. This gradient is heterogeneous and regions of higher and lower gene density are superimposed on it. In fact, such gradients were observed in all of the grass genomes sequenced to date [45].
Higher gene density estimates were obtained by restriction fragment length polymorphisms (RFLP) hybridization with ESTs than by microarray hybridization of BAC clones for the telomeric bins of chromosome 3B [44]. This difference was explained by the inability of microarray hybridization to detect tandemly duplicated genes. Similarly, gene density in 1BS telomeric bins was also higher when estimated by RFLP hybridization with ESTs [39] than for the microarray results obtained in the current study (normalized gene densities: 1.6 vs. 1.3 per Mb, respectively). These findings suggest that our analysis may have underestimated the gene density in the telomeric part of 1BS, and an even steeper density gradient may be expected from the centromere to the telomere of 1BS.
We have further estimated gene distribution along 1BS, keeping in mind the limitation of hybridization methods for detecting tandemly duplicated genes, and the inability to distinguish between functional genes and pseudogenes. Considering the full coverage of chromosome 1BS by BAC contigs, the distribution of the 721 loci mapped in the current study by hybridization to deletion bins, and the estimated gene number in 1BS (3,664 and

3,878 obtained in Wicker et al. [35] and in the current study), the expected gene density could be extrapolated to the entire set of 1BS genes. The resulting density range was one gene per 99–105 kb for the centromeric bin C-1BS10-0.50, which is higher than the estimated density in the proximal bins for chromosome 3B (one gene per 184 kb) obtained by sequencing of 18.2 Mb of BAC contigs [41]. An analysis of 11 Mb of BES data for chromosome 3AS resulted in an estimate of one gene per 123 kb [55], while density of one gene per 162 kb was found from recently sequenced DNA of flow-sorted chromosome 5A [56]. Therefore, gene density appears to be higher in 1BS than in other wheat chromosomes for which gene content was estimated.
A comparative analysis between the unigenes identified on wheat chromosome 1BS and their homologs on Brachypodium Bd2, rice Os5, and sorghum Sb9 revealed a slightly higher level of synteny with Brachypodium, as expected based on more recent divergence. The proportion of unigenes mapped to 1BS that were non-syntenic in model grass genomes was 55–65% compared to only 35–42% of genes mapped to 3B [34], 23–30% to 3A [55], and 20–45% to 1AL, 1BL and 1DL [35]. Our results support Wicker et al. [35] recent findings that 1BS chromosome has accumulated an extremely high proportion of non-syntenic genes compared to other group 1 wheat and barley chromosomes. Wicker et al. [35] found that the proportion of syntenic versus non-syntenic genes in 1BS was 1:5, compared to 1:2 for 1AS and even less for the long arms of group 1 chromosomes (1:1.2 to 1:1.6). They suggested that most of the non-syntenic genes are pseudogenes, although more than half of the non-syntenic genes are still actively transcribed. In fact, 68% of the transcript clusters obtained for barley transcriptome were so-called low-confidence genes, due to the lack of homology to the genes of model grasses and the lack of support from gene family clustering [27]. Rustenholz et al. [34] reported that 89% of the unigenes, both syntenic and non-syntenic, mapped to 3B are actively transcribed. Although the bona fide genes and the pseudogenes are undistinguishable in our analysis of 1BS, many of them may represent fast-evolving genes (e.g. R-genes) that are species-specific and therefore unique to wheat.
Despite the considerable degree of conservation in gene order and content between chromosome 1BS and the orthologous regions on Brachypodium Bd2, rice Os5 and sorghum Sb9, distinct genomic rearrangements were identified. The anchoring of ESTs that had previously been mapped to 1BS deletion bins [39] into two 1BS large scaffolds confirms that wheat, rice and sorghum share the same order of gene markers and that chromosome inversion in the region between Bradi2g37120 and Bradi2g38650 is present only in Brachypodium Bd2. Most of the perturbations in the gene order in wheat 1BS relative to the orthologous chromosome regions of other grasses were small inversions and transpositions of gene blocks, with some non-colinear genes interspersed among the conserved blocks. These differences in gene order between 1BS and other grass chromosomes may reflect structural, chromosomal (inversions and transpositions) and gene space (single-gene duplications and deletions) evolution. The 1BS non-colinear genes with only one homologue in the orthologous region of the three model grass genomes were interspersed within colinear gene blocks. Perturbation in the order of these genes may also be caused by a limited mapping resolution and by the fact that our analysis considered only gene-related markers with unique positions. These non-colinear genes probably reflect duplicated genes or gene fragments that moved due to transposable element (TE) activities [35,57]. While we cannot trace evolutionary events that have led to the absence of colinearity for that fraction of gene-related markers, our results illustrate the fact that true evolutionary relationships can be revealed only if more than two species are compared [43,58].

The anchored physical map of chromosome 1BS enabled us to trace the distribution patterns of genomic components along its centromere-telomere axis. Our analysis revealed a slightly higher proportion of syntenic unigenes in the centromeric and pericentromeric regions of 1BS, while the density of non-syntenic unigenes was more than two-fold higher towards subtelomeric and telomeric parts. The majority of genes on 1BS showed a tendency to cluster in small gene islands, reflecting a non-homogeneous expansion of the chromosome, which is a common feature of large and repetitive genomes, such as maize and wheat [41,59]. Furthermore, a non-uniform expansion in 1BS chromosome size was identified relative to model grass chromosomes (e.g. Bd2), with an expansion in the sub-telomeric part that was twice as high as that in the centromeric region of 1BS. Variation of genome size in grasses is caused mainly by the accumulation or loss of TEs. The gene island formation is explained by non-random insertion or preferential deletion of TEs in gene-rich regions [41,45]. Choulet et al. [41] proposed more active mechanisms of gene island formation, which involve gene duplication and translocation. A similar pattern of non-syntenic gene distribution, with a two-fold increase towards the telomeric parts, was found in chromosome 3B [34]. However, in contrast to 1BS, the increase in size of 3B was found to be homogenous along proximal and distal regions [41].
The non-uniform expansion of 1BS, together with the extremely high accumulation of non-syntenic genes by 1BS discussed above, suggests that the evolutionary forces that shaped the wheat genome may differ between different chromosomes of the same genome. Interestingly, the GC content (44.7%) of 1BS BES shows a uniform distribution along the centromere-telomere axis, similar to the GC content reported for other wheat chromosomes [60]. Such GC values are expected for TE-rich sequences. Another characteristic that we found to be unique for 1BS is the non-uniform distribution of restriction sites of some of the enzymes used in HIFC fingerprinting, which presumably resulted in shorter contigs in the telomeric regions as compared to centromeric ones. This sequence composition of 1BS is distinct from other cereal genomes for which BAC physical maps were constructed, such as Brachypodium, rice, sorghum and maize.
Wheat genome asymmetry and patterns of evolution in chromosome 1BS
Allopolyploid wheat species harbour considerable genetic diversity, with levels that differ between the three genomes (reviewed in [61]). The B genome is the largest among the three wheat subgenomes [8] with the largest number of genes, as estimated by shotgun sequencing (38,000, 36,000 and 28,000 genes for B, D and A genomes, respectively [62]). The B genome exhibits higher polymorphism, a higher proportion of repetitive DNA, and a lower synteny level than the A and D genomes of wheat [61,63,64].
The evidence presented here exhibits unique patterns of 1BS evolution that differ even from other B-genome chromosomes (e.g. 3B). These lines of evidence include: (i) a relatively large gene space, as reflected by a considerably higher number and density of gene-markers; (ii) accumulation of an extremely high proportion of non-syntenic genes; (iii) a non-uniform size expansion along the centromere-telomere axis; (iv) a non-uniform distribution of BAC contig length, with longer contigs in the centromeric region; and (v) a non-uniform distribution of restriction sites (e.g. HaeIII used for HICF) along the centromeric-telomeric axis. Although we do not currently have a complete picture of the forces that have shaped the structure and evolution of chromosome 1BS, there is reason to believe that these patterns are influenced by selection pressure varying with recombination rates (e.g. [65]). The most striking characteristic of 1BS, revealed here, is the steep gradient in the genomic features along the

centromere-telomere axis, which is associated with the gradient in recombination rate. This association is illustrated by the fact that 95% of the meiotic map of 1BS (e.g. [50]) is represented by only 34% (82 Mb) of the scaffolds, anchored in the current study to the sub-telomeric and telomeric regions of 1BS. The 45-fold increase in genome size near the telomere, relative to model grass genomes, compared to the only 20-fold expansion near the centromere, is probably associated with the remarkably high recombination rate at the telomeric region of 1BS. Other studies have shown that intergenic regions and non-coding parts of genes rapidly evolved by TE insertions and deletions caused by illegitimate recombination, double-strand break repair and unequal crossing-over [57].
In the current study, we found that the dramatic accumulation of non-syntenic genes (most likely pseudogenes) on 1BS, as compared with other studied wheat chromosomes, was much more pronounced in the telomeric region. Pseudogenes tend to evolve much faster than functional genes and therefore represent the possibility of more rapid genome evolution [66]. We propose that 1BS may play an important role as a potential reservoir of useful variation for selection and adaptation. The unique characteristics of 1BS structure are in agreement with the evidence accumulated over the last decade in allopolyploid wheat indicating that genomic asymmetry is more prevalent in this species than previously thought [61].
A striking example of the primary role of the B genome’s adaptation to stress is provided by the fact that the number of functional R-gene loci [67], and R-gene analogs (RGAs) [68], mapped to the B genome, is twice as high as that of A or D genomes. 1BS is known to harbour numerous R-genes, including five functional stripe rust R-genes (Yr10, Yr15, Yr24, Yr26 and YrH52; [69]). Plant R-genes were found to be organized in clusters of duplicated genes (e.g. [66,70,71]). A high number of pseudogenes in clusters may not be directly involved in resistance, but may provide raw material from which new gene variants can emerge [66]. Therefore, the large excess of non-syntenic genes and pseudogenes in 1BS compared to the other chromosomal arms analyzed so far may reflect 1BS’s “prospective” role in the evolution of wheat tolerance to biotic and abiotic stresses.
Conclusions
Integration of physical contigs into long LTC scaffolds provided the orientation of the contigs within the scaffolds and facilitated the anchoring of the 1BS physical map. The physical map of wheat chromosome 1BS presented here is comprised of only 57 long BAC scaffolds, which cover 83% of 1BS’s length. This is the most comprehensive map for chromosome 1BS, with the highest amount of gene-related markers, spanning regions with both high and low recombination. This map enabled us to obtain new evidence showing that mechanisms of evolution within the wheat genome may differ at the level of specific chromosomes. The excess of non-syntenic 1BS genes probably represents a reservoir of non-functional genes (pseudogenes) that serve as raw material for rapid generation of new functional genes in response to biotic and abiotic challenges. The physical map developed in the current study provides a solid basis for the production of a high-quality reference sequence of 1BS. A detailed study of DNA sequence of 1BS chromosome, together with other wheat chromosomes, will lead to further progress in our understanding of the evolution of wheat, its biology underlying the genetic plasticity and, consequently, its improvement using modern molecular biology tools.

Materials and methods
Purification of 1BS arms by flow cytometric sorting
Liquid suspensions of intact mitotic chromosomes were prepared from a double-ditelosomic line (2n = 40 + 2 t 1BS + 2 t 1BL) of T. aestivum L. cv. CS according to [72]. The samples were stained by DAPI, and both the short (1BS) and the long (1BL) arms maintained in the line as telocentric chromosomes were purified simultaneously by flow cytomeric sorting [73]. The 1BS arms were sorted in batches of 200,000 into 320 µl of 1.5 × IB buffer [74]. The purity of sorted fractions was checked regularly by fluorescent in situ hybridization (FISH) using probes for telomeric repeat and GAA repeat [28].
Construction of BAC libraries
A 1BS-specific BAC library was constructed according to Šimková et al. [75]. Briefly, isolated high-molecular-weight (HMW) DNA was partially digested with HindIII. DNA of particular size fractions (100–200 kb) was ligated into HindIII-digested dephosphorylated pIndigoBAC-5 vector (Epicentre, Madison, WI, USA). The recombinant vector was used to transform Escherichia coli MegaX DH10B-competent cells (Invitrogen, Carlsbad, CA, USA). The 1BS-specific BAC library coded as TaaCsp1BShA, was ordered into 384-well plates filled with 75 µl freezing medium consisting of 2YT, 6.6% glycerol and 12.5 µg/ml chloramphenicol. Average insert size was estimated based on an analysis of 200 randomly selected BAC clones [28].
Fingerprinting reaction and data processing
BAC DNA samples were extracted from the 1BS BAC library and fingerprinted using the HICF SNaPshot protocol [10] with some modifications [22]. Peak areas, peak heights, and fragment sizes in each BAC fingerprint profile were collected by the ABI Data Collection program. High-quality fingerprints were obtained using the GeneMapper [76] and FPB software [77] for peak data extraction, removal of background and vector-related bands, and detection of cross-contaminations of clones. For each clone, the obtained band sizes of all four colors were multiplied by 30, affined, and united into a single list to fit FPC input data format.
BAC contig assembly
High-quality fingerprinted BACs were assembled into contigs using the following tools: (i) the FPC program [12,32] according to TriticeaeGenome consortium guidelines, and (ii) the LTC program [16]. Automatic FPC assembly was conducted with the following parameters: tolerance 12 (corresponding to 0.4 bp), gel length 54,000 (= (500–50) × 4 × 30), and maximal rate of Q-clones equal to 10%. Initial clustering was performed with a Sulston score cut-off of 10-75. Contigs with >10% of Q-clones were reassembled with an increasing cut-off stringency of up to 10-84. The resulting contigs were automatically end-to-end merged with a cut-off of 10-45 or higher and at least 50 common bands in ending clones. LTC assembly was conducted semi-automatically with the following parameters: gel length 60,000 (=500 × 4 × 30), tolerance 12, and a total number of different bands for Sulston score calculation 2,250 (= (500–50) × 4 × 30/ (2 × 12)). A network of significant clone overlaps was constructed using a Sulston cut-off of 10-15. Q-overlaps were excluded at a cut-off of 10-15 and Q-clones were

excluded at a cut-off of 10-25 [16]. An additional set of Q-clones was excluded at a cut-off 10-
30 to split large group of highly overlapping clones. Another set of Q-clones was excluded manually to split groups of overlapping clones into contigs with linear topology. Clones with >500 highly significant (<10-50) overlaps were also excluded. After excluding the Q-clones and Q-overlaps LTC contigs were assembled automatically with a stringency cut-off of 10-15.
Establishing Minimal Tiling Paths (MTP)
For FPC contigs, MTP clones were selected by FPC with the following parameters: Min FPC Overlap = 30, From End = 30 and Min Shared bands = 12. For comparison, LTC-based MTP clones were also selected for FPC contigs (see Results). For LTC contigs, MTP clones were obtained using LTC program with a natural requirement of significant clone overlap for adjacent MTP clones (at a cut-off of 10-15–10-33 corresponding to ~30–50% of shared bands, depending on clone lengths). A list of MTP clones for LTC contigs was complemented by clones that can potentially be used for contig elongation and merging (see Results). The extended list of MTP clones was re-arrayed into 3D pools and BAC-end sequenced.
Construction of 1BS physical scaffolds
LTC contigs confirmed by significant parallel clone overlaps were manually assembled into scaffolds by the LTC program. Contig elongation and end-to-end merging were conducted at cut-offs of up to 10-15 using Q-clones and Q-overlaps excluded in the previous LTC analysis. Identifying the ending clones is a critical point in contig elongation because they have a higher chance than internal clones of overlapping with clones that are not included in the contig. Constructing a consensus band map is more difficult for the contig ends, where the average coverage is lower than in the middle of the contig. In contrast to FPC, the scaffold assembly of LTC does not rely on band map and clone-end coordinates. Instead, identification of contig ends is based on overlaps with MTP clones selected by LTC. Thus, several clones at each of the contig ends are characterized as contig-ending clones [16]. LTC selects the best contig elongations based on the significance of clone overlaps, validated by parallel clone overlaps. In the case that elongation is not validated by parallel overlaps, LTC selects the most significant clone overlaps. If the difference in significances between the overlap corresponding to “the best elongation” and “the next one to the best” is less than five orders of magnitude, then both variants are considered possible. In such cases, elongation is not performed until additional validating data has been obtained for clarification (e.g. molecular markers). A detailed example of contig elongation is presented in Additional file 8.
MTP rearraying and 3D pooling
MTP rearraying and 3D pooling was performed as described by Paux et al. [22]. Briefly, the 6,447 clones of the MTP were selected from the TaaCsp1BShA BAC library and rearranged into 17 384-well plates containing LB medium with 12.5 µg/ml chloramphenicol and 6% glycerol. Validation of the new coordinates was done with defined PCR markers. Three-dimensional pools (column pools: 1 to 24; raw pools: A to P; and plate pools: P1 to P17) of the MTP were created and organized into a single 96-well plate that contained 56 DNA samples. DNA was then produced from each pool using the rolling circle amplification method [78] with modifications [22]. The construction of the pools was validated by PCR, as described in [22], with three 1BS-specific markers (Additional file 2).

BAC end sequencing
BAC-end sequencing was conducted using 6,447 1BS MTP clones. Sequencing reactions were set up using Big Dye Terminator chemistry (Applied Biosystems, Foster City, CA, USA) according to the manufacturer’s instructions. Both ends of each BAC were sequenced using universal M13 forward (5′-CAGGAAACAGCTATGACC-3′) and reverse (5′-TGTAAAACGACGGCCAGT-3′) primers on 3730xl DNA Analyzer (Applied Biosystems). Chromatogram traces were base-called and scored for quality using Phred [79].
Scanning of 3D MTP pools using wheat unigene microarray
The 57 1BS 3D MTP pools were scanned by hybridization with wheat NimbleGen 40 K unigene microarray as described in [45]. Briefly, the DNA samples of the 57 MTP 3D pools were sonicated to obtain 500 and 2,000 bp fragments, then labeled using the NimbleGen Dual-Color DNA labeling kit (Roche, NimbleGen) and hybridized with NimbleGen microarray INRA_GDEC_T.aestivum_NimbleGen_12x40K_unigenes_chip_v2 [80] accession number [A-MEXP-2314]. Each gene was represented on the chip by three probes marked by two fluorescent dyes. Hybridization and washing of the arrays were performed according to the manufacturer’s procedure (Roche NimbleGen). The arrays were scanned using the InnoScan 900AL scanner (Innopsys). Data were extracted from scanned images using NimbleScan 2.5 software (Roche NimbleGen). Only unigenes with unambiguous addresses (plate, row, and column coordinates, or those that have coordinates corresponding to overlapping clones) were assigned to 1BS clones and contigs. The strategy used for detecting unigenes putatively present on 1BS, is described in Additional file 9.
Construction of 1S GenomeZipper as a reference for anchoring physical 1BS
contigs
Chromosome 1BS of wheat is homologous to the Brachypodium Bd2 region between genes Bradi2g30410 through Bradi2g40150, rice Os5 between genes LOC_Os05g01020 through LOC_Os05g15630, and sorghum Sb9 between genes Sb09g000200 through Sb09g008190 [35]. Brachypodium contains 600 genes in the 1S syntenic region (after filtering for TE sequences and possible annotation artifacts [35]). To account for genes that might have been moved out of this region in Brachypodium, we added (“zipped in”) those Brachypodium genes whose homologues lie in the group 1 syntenic region in both rice and sorghum (as described by [25]). Brachypodium contains an inversion between Bradi2g38650 and Bradi2g37120 compared to rice Os5 and sorghum Sb9. Thus, for our analysis, we inverted the order of genes between these positions in the Brachypodium reference zipper.
Identification and in silico mapping of Illumina sequence contigs
Unigene sequences that gave signals in the NimbleGen microarray hybridization were used for BLASTN searches against the assembly of 1BS Illumina survey sequences obtained from the URGI website [31]. The Illumina sequences that produced hits of at least 200 bp with 90% sequence identity and contained a gene sequence with the closest homolog in the reference 1S GenomeZipper were integrated on the 1BS physical map. Additional sequences were added to the 1BS physical map by BLASTN of all BAC-ends of the anchored contigs. Because most BAC-ends are repetitive, only Illumina contigs with very high similarity of more than 600 bp and at least 99% sequence identity were used.

Defining 1S GenomeZipper segments corresponding to 1BS deletion bins
The intervals orthologous to 1BS deletion bins [38] were identified on 1S GenomeZipper, using ESTs physically mapped to 1BS deletion bins by RFLP hybridization [39]. The closest homologs of ESTs mapped to deletion bins were found by BLAST (e-value < 10-10) on group 1S GenomeZipper and ordered according to their zipper position (Additional file 6).
Development of PCR-based marker resources
PCR-based markers were developed using 454 sequence data of flow-sorted 1BS arms [35] and BES data of 1BS MTP clones produced in the current study. These 1BS sequences were screened for repeats using cross-match software [81] searching in the TREP databank [82]. The repeats were used to develop primer pairs for ISBP markers using IsbpFinder perl script [37]. Primer pairs for SSR markers were developed by SSRDesign perl script [37]. In addition, gene-based markers were developed using barley unigenes [36] that showed synteny with rice Os5 as queries in BLASTN analysis against the 454 reads of sorted 1BS chromosomes. The reads from 1BS 454 sequences that matched barley unigenes were assembled separately for each unigene using Phrap [83]. The assembled 454 contigs were again blasted against the barley unigenes, and the longest matching fragment was used for primer development. The same procedure was used to develop markers based on Brachypodium coding sequences from 1S GenomeZipper [35] (Brachypodium coding sequences were obtained from Phytozome [84]). The Primer3 software [85] was used for primer design.
Plant materials and DNA extraction
Prior to BAC library screening, the quality of the PCR-based markers (SSR, EST and ISBP) was assessed on the genomic DNA of the reference donor line CS, the nulli-1B-tetrasomic-1A, ditelosomic- 1BS and 1BL lines provided by the Wheat Genetics Resource Center, Kansas State University, USA, and on DNA of flow-sorted 1BS and 1AS chromosome arms, provided by the Institute of Experimental Botany, Olomouc, Czech Republic. The set of 15 deletion lines of chromosome 1BS was used for marker assignment to deletion bins. Plant genomic DNA was extracted using ArchivePure DNA Cell/Tissue MiniKit, (5 PRIME, Hamburg, Germany).
SSR, ISBP and EST marker analysis
ISBP and EST screening of the 1BS MTP pools and DNA of deletion lines was performed using standard PCR and electrophoresis protocols (Additional file 10). For SSRs, PCR reactions with the M13 protocol [86] were carried out as described in Additional file 10 in a final volume of 15 µl with 200 µM of each dNTP, 500 nM of M13 primer dye-labeled at its 5′-end (Applied Biosystems), 50 nM of the forward M13-tailed primer, 500 nM of the reverse primer, 0.2 U of Taq polymerase (DreamTaq, Fermentas) with 1X of its appropriate buffer and 25 ng of template DNA. PCR amplification was conducted with the touch-down procedure. Amplified products were visualized and analyzed by an ABI 3130xl Genetic Analyzer and GeneMapper v4.0 software (Applied Biosystems).

LTC program availability and data deposition
The LTC program may be downloaded from the website of the Institute of Evolution, University of Haifa [17]. The 1BS BAC library is available through the Centre National de Resources Genomiques Vegetales (CNRGV), Toulouse, France [87]. The Genome browser of the physical map of the wheat chromosome 1BS and marker data is available at the URGI website [33]. All the NimbleGen array design and all microarray data have been deposited to ArrayExpress [80] under accession numbers [A-MEXP-2314] for the wheat NimbleGen 40 K unigene design, and [E-MTAB-1912] for the wheat NimbleGen 40 K unigene hybridization experiment. The Roche 454 sequences of the 1BS sorted chromosome are accessible at the European Bioinformatics Institute (EBI) short-read archive under the accession number ERP000446. Illumina sequences of wheat sorted chromosomes are available under request at the URGI website [31]. The BES data set is available at The EMBL-European Bioinformatics Institute genome survey sequence under accession numbers HG752437-HG763829 [88].
Abbreviations
BAC, Bacterial Artificial Chromosome; BES, BAC-End Sequence; BLAST, Basic Local Alignment Search Tool; CS, Triticum aestivum cv Chinese Spring; EBI, European Bioinformatics Institute; EST, Expressed Sequence Tag; FISH, Fluorescent In Situ Hybridization; FPC, Finger-Printed Contigs; HICF, High-Information-Content Fingerprinting; HMW, High Molecular Weight; ISBP, Insertion Site-Based Polymorphism; IWGSC, International Wheat Genome Sequencing Consortium; LTC, Linear Topological Contig; MTP, Minimal Tiling Path; Nor, Nucleolar Organizing Region; Q, Questionable; QTL, Quantitative Trait Loci; R, Resistance; RFLP, Restriction Fragment Length Polymorphisms; RGA, Resistance Gene Analogs; SSR, Single-Sequence Repeats; TE, Transposable Elements.
Competing interests
The authors declare that they have no competing interests.
Authors’ contributions
DR and ZF carried out the physical mapping, the anchoring of the physical map to 1BS deletion bins and 1S GenomeZipper, the comparative genomics and gene space analyses as well as drafting the manuscript. ZF and AK developed the LTC program and implemented it in the scaffolding of BAC contigs. DR, TF and ID produced the PCR marker data. HS developed primer pairs for gene-based markers using 1BS 454 sequences. HŠ and JD sorted the 1BS chromosomes and produced the 1BS BAC library. FM and FC produced the HICF fingerprints of the entire 1BS BAC library and BES of MTP clones. SV and HB handled the 1BS BAC library and produced the 3D MTP pools. TW and BK produced the GenomeZipper of the wheat chromosome 1BS. FL developed primer pairs for ISBP and SSR markers based on 454 sequences of 1BS. RP, EP, TK and CF conducted the 1BS MTP pool hybridization on the wheat NimbleGen 40 K unigene microarray and analyzed the hybridization results, and provided perl scripts for primer pairs development. AK and TF acquired the funding, supervised all the analyses and drafted the manuscript. All authors read and approved the final manuscript.

Authors’ information
Dina Raats and Zeev Frenkel are first authors Abraham Korol and Tzion Fahima are senior authors
Acknowledgements
The authors wish to thank the International Wheat Genome Sequencing Consortium for generating the wheat chromosome survey sequences and making them available to us for analysis. This work was supported by the European Community’s Seventh Framework Programme TriticeaeGenome (grant agreement n FP7-212019), the Israel Science Foundation (ISF) grants #205/08, #800/10, ISF equipment grants #1478/04 and #1719/08 and Binational Agricultural Research and Development Fund (BARD) grant #3873/06. Dina Raats is grateful for the Eshkol Fellowship awarded by the Israeli Ministry of Science. The authors thank Olga Gurevich for her skillful assistance in marker analysis.
References
1. The Food and Agriculture organization of United Nations. [http://www.fao.org/index_en.htm].
2. Dvorak J: Triticeae genome structure and evolution. In Genetics and Genomics of the Triticeae. Edited by Feuillet C, Muehlbauer G. USA: Springer; 2009:685–711.
3. The International Wheat Genome Sequencing Consortium. [http://www.fao.org/index_en.htm].
4. Feuillet C, Eversole K: Physical mapping of the wheat genome: a coordinated effort to
lay the foundation for genome sequencing and develop tools for breeders. Isr J Plant Sci 2007, 55:307–313.
5. The Triticeaegenome Consortium. [www.triticeaegenome.org].
6. Feuillet C, Stein N, Rossini L, Praud S, Mayer K, Schulman A, Eversole K, Appels R: Integrating cereal genomics to support innovation in the Triticeae. Funct Integr Genomics 2012, 12:573–583.
7. Šafář J, Bartoš J, Janda J, Bellec A, Kubaláková M, Valarik M, Pateyron S, Weiserova J, Tuskova R, Číhalíková J: Dissecting large and complex genomes: flow sorting and BAC
cloning of individual chromosomes from bread wheat. Plant J 2004, 39:960–968.
8. Šafář J, Šimková H, Kubaláková M, Číhalíková J, Suchankova P, Bartoš J, Doležel J: Development of chromosome-specific BAC resources for genomics of bread wheat. Cytogenet Genome Res 2010, 129:211–223.
9. Doležel J, Vrána J, Šafář J, Bartoš J, Kubaláková M, Šimková H: Chromosomes in the
flow to simplify genome analysis. Func Integr Genomics 2012, 12:397–416.

10. Luo MC, Thomas C, You FM, Hsiao J, Ouyang S, Buell CR, Malandro M, McGuire PE, Anderson OD, Dvorak J: High-throughput fingerprinting of bacterial artificial
chromosomes using the snapshot labeling kit and sizing of restriction fragments by capillary electrophoresis. Genomics 2003, 82:378–389.
11. Philippe R, Choulet F, Paux E, van Oeveren J, Tang J, Wittenberg AH, Janssen A, van Eijk MJ, Stormo K, Alberti A: Whole genome profiling provides a robust framework for
physical mapping and sequencing in the highly complex and repetitive wheat genome. BMC Genomics 2012, 13:47.
12. Soderlund C, Humphray S, Dunham A, French L: Contigs built with fingerprints,
markers, and FPC V4. 7. Genome Res 2000, 10:1772–1787.
13. International Brachypodium Initiative: Genome sequencing and analysis of the model
grass Brachypodium distachyon. Nature 2010, 463:763–768.
14. International Rice Genome Sequencing Project: The map-based sequence of the rice
genome. Nature 2005, 436:793–800.
15. Paterson AH, Bowers JE, Bruggmann R, Dubchak I, Grimwood J, Gundlach H, Hellsten U, Mitros T, Poliakov A: The Sorghum bicolor genome and the diversification of grasses. Nature 2009, 457:551–556.
16. Frenkel Z, Paux E, Mester D, Feuillet C, Korol A: LTC: a novel algorithm to improve
the efficiency of contig assembly for physical mapping in complex genomes. BMC Bioinformatics 2010, 11:584.
17. The Institute of Evolution, University of Haifa. [http://evolution.haifa.ac.il/images/LTC_HU-site_7Oct%202013.zip].
18. Lukaszewski A, Curtis C: Physical distribution of recombination in B-genome
chromosomes of tetraploid wheat. Theor Appl Genet 1993, 86:121–127.
19. Erayman M, Sandhu D, Sidhu D, Dilbirligi M, Baenziger P, Gill KS: Demarcating the
gene-rich regions of the wheat genome. Nucleic Acids Res 2004, 32:3546–3565.
20. Mezard C: Meiotic recombination hotspots in plants. Biochem Soc Trans 2006, 34:531–534.
21. Saintenac C, Falque M, Martin OC, Paux E, Feuillet C, Sourdille P: Detailed
recombination studies along chromosome 3B provide new insights on crossover distribution in wheat (Triticum aestivum L.). Genetics 2009, 181:393–403.
22. Paux E, Sourdille P, Salse J, Saintenac C, Choulet F, Leroy P, Korol A, Michalak M, Kianian S, Spielmeyer W: A physical map of the 1-gigabase bread wheat chromosome
3B. Science 2008, 322:101.
23. Moore G, Devos K, Wang Z, Gale M: Cereal genome evolution: grasses, line up and
form a circle. Curr Biol 1995, 5:737–739.

24. Bolot S, Abrouk M, Masood-Quraishi U, Stein N, Messing J, Feuillet C, Salse J: The
‘inner circle’of the cereal genomes. Curr Opin Plant Biol 2009, 12:119–125.
25. Mayer KFX, Taudien S, Martis M, Šimková H, Suchánková P, Gundlach H, Wicker T, Petzold A, Felder M, Steuernagel B, Scholz U, Graner A, Platzer M, Doležel J, Stein N: Gene content and virtual gene order of barley chromosome 1H. Plant Physiol 2009, 151:496–505.
26. Mayer KFX, Martis M, Hedley PE, Šimková H, Liu H, Morris JA, Steuernagel B, Taudien S, Roessner S, Gundlach H, Kubaláková M, Suchánková P, Murat F, Felder M, Nussbaumer T, Graner A, Salse J, Endo TR, Sakai H, Tanaka T, Itoh T, Sato K, Platzer M, Matsumoto T, Scholz U, Doležel J, Waugh R, Stein N: Unlocking the barley genome by
chromosomal and comparative genomics. Plant Cell 2011, 23(4):1249–1263.
27. International Barley Genome Sequencing Consortium (IBSC), Mayer KF, Waugh R, Brown JW, Schulman A, Langridge P, Platzer M, Fincher GB, Muehlbauer GJ, Sato K, Close TJ, Wise RP, Stein N: A physical, genetic and functional sequence assembly of the barley
genome. Nature 2012, 491:711–716.
28. Janda J, Safar J, Kubalakova M, Bartos J, Kovarova P, Suchankova P, Pateyron S, Cihalikova J, Sourdille P, Simkova H: Advanced resources for plant genomics: a BAC
library specific for the short arm of wheat chromosome 1B. Plant J 2006, 47:977–986.
29. Sandhu D, Champoux JA, Bondareva SN, Gill KS: Identification and physical
localization of useful genes and markers to a major gene-rich region on wheat group 1S chromosomes. Genetics 2001, 157:1735–1747.
30. The SHIGEN - SHared Information of GENetic resources. [http://www.shigen.nig.ac.jp].
31. The Unité de Recherche Génomique Info (URGI). [urgi.versailles.inra.fr/Species/Wheat/Sequence-Repository].
32. Soderlund C, Longden I, Mott R: FPC: a system for building contigs from restriction
fingerprinted clones. Comput Appl Biosci 1997, 13:523–535.
33. The 1BS genome browser at URGI. [http://urgi.versailles.inra.fr/gb2/gbrowse/wheat_phys_pub/].
34. Rustenholz C, Choulet F, Laugier C, Šafář J, Šimková H, Doležel J, Magni F, Scalabrin S, Cattonaro F, Vautrin S, Bellec A, Bergès H, Feuillet C, Paux E: A 3000-loci transcription
map of chromosome 3B unravels the structural and functional features of gene islands in hexaploid wheat. Plant Physiol 2011, 157:1596–1608.
35. Wicker T, Mayer KFX, Gundlach H, Martis M, Steuernagel B, Scholz U, Šimková H, Kubaláková M, Choulet F, Taudien S, Platzer M, Feuillet C, Fahima T, Budak H, Doležel J, Keller B, Stein N: Frequent gene movement and pseudogene evolution is common to the
large and complex genomes of wheat, barley, and their relatives. Plant Cell 2011, 5:1706–1718.

36. The Harvest database. [www.harvest-web.org].
37. Paux E, Faure S, Choulet F, Roger D, Gauthier V, Martinant JP, Sourdille P, Balfourier F, Le PMC, Chauveau A, Cakir M, Gandon B, Feuillet C: Insertion site-based polymorphism
markers open new perspectives for genome saturation and marker-assisted selection in wheat. Plant Biotechnol J 2010, 8:196–210.
38. Endo TR, Gill BS: The deletion stocks of common wheat. J Hered 1996, 87:295–307.
39. Peng J, Zadeh H, Lazo G, Gustafson J, Chao S, Anderson O, Qi L, Echalier B, Gill B, Dilbirligi M: Chromosome bin map of expressed sequence tags in homoeologous group 1
of hexaploid wheat and homoeology with rice and Arabidopsis. Genetics 2004, 168:609.
40. The GrainGenes database. [http://wheat.pw.usda.gov/GG2/index.shtml].
41. Choulet F, Wicker T, Rustenholz C, Paux E, Salse J, Leroy P, Schlub S, Le Paslier MC, Magdelenat G, Gonthier C: Megabase level sequencing reveals contrasted organization
and evolution patterns of the wheat gene and transposable element spaces. Plant Cell 2010, 22:1686–1701.
42. Fleury D, Luo MC, Dvorak J, Ramsay L, Gill BS, Anderson OD, You FM, Shoaei Z, Deal KR, Langridge P: Physical mapping of a large plant genome using global high-
information-content-fingerprinting: the distal region of the wheat ancestor Aegilops tauschii chromosome 3DS. BMC Genomics 2010, 11:382.
43. Bossolini E, Wicker T, Knobel PA, Keller B: Comparison of orthologous loci from
small grass genomes Brachypodium and rice: implications for wheat genomics and grass genome annotation. Plant J 2007, 49:704–717.
44. Rustenholz C, Hedley PE, Morris J, Choulet F, Feuillet C, Waugh R, Paux E: Specific
patterns of gene space organisation revealed in wheat by using the combination of barley and wheat genomic resources. BMC Genomics 2010, 11:714.
45. Gottlieb A, Müller HG, Massa AN, Wanjugi H, Deal KR, You FM, Xu X, Gu YQ, Luo MC, Anderson OD: Insular organization of gene space in grass genomes. PLoS One 2013, 8:e54101.
46. Massa AN, Wanjugi H, Deal KR, O'Brien K, You FM, Maiti R, Chan AP, Gu YQ, Luo MC, Anderson OD: Gene space dynamics during the evolution of Aegilops tauschii, Brachypodium distachyon, Oryza sativa, and Sorghum bicolor genomes. Mol Biol Evol 2011, 28:2537–2547.
47. Breen J, Wicker T, Shatalina M, Frenkel Z, Bertin I, Phillippe R, Spielmeyer W, Doležel J, Šimková H, Scalabrin S, Vautrin S, Bergès H, Paux E, Fahima T, Korol A, Feuillet C, Keller B: A physical map of the short arm of wheat chromosome1A. 8 2013, 11:e80272.
48. Lucas SJ, Akpınar BA, Kantar M, Weinstein Z, Aydınoğlu F, Šafář J, Šimková H, Frenkel Z, Korol A, Magni F, Cattonaro F, Vautrin S, Bellec A, Berges H, Doležel J, Budak H: Physical mapping integrated with syntenic analysis to characterize the gene space of
the long arm of wheat chromosome 1A. PLOS ONE 2013, 8(4):e59542.

49. Philippe R, Paux E, Bertin I, Sourdille P, Choulet F, Laugier C, Šimková H, Šafář J, Bellec A, Vautrin S, Frenkel V, Cattonaro F, Scalabrin S, Martis M, Mayer K, Korol A, Bergès H, Doležel J, Feuillet C: A high density physical map of chromosome 1BL
advances evolutionary studies, map-based cloning and sequencing in wheat. Genome Biol 2013, 14:R64.
50. Sourdille P, Singh S, Cadalen T, Brown-Guedira G, Gay G, Qi L, Qi LL, Dufour P, Murigneux A, Bernard M: Microsatellite-based deletion bin system for the establishment
of genetic-physical map relationships in wheat (Triticum aestivum L.). Funct Integr Genomics 2004, 4:12–25.
51. Uauy C, Brevis JC, Chen X, Khan I, Jackson L, Chicaiza O, Distelfeld A, Fahima T, Dubcovsky J: High-temperature adult-plant (HTAP) stripe rust resistance gene Yr36 from Triticum turgidum ssp. dicoccoides is closely linked to the grain protein content locus Gpc-B1. Theor Appl Genet 2005, 112:97–105.
52. Uauy C, Distelfeld A, Fahima T, Blechl A, Dubcovsky J: A NAC gene regulating
senescence improves grain protein, zinc, and iron content in wheat. Science 2006, 314:1298–1301.
53. Fu D, Uauy C, Blechl A, Epstein L, Chen XM, Distelfeld A, Sela H, Fahima T, Dubcovsky J: A novel kinase-START gene confers temperature-dependent resistance to wheat stripe rust. Science 2009, 323:1357–1360.
54. Leister D, Kurth J, Laurie DA, Yano M, Sasaki T, Devos K, Graner A, Schulze-Lefert P: Rapid reorganization of resistance gene homologues in cereal genomes. Proc Natl Acad Sci U S A 1998, 95:370–375.
55. Sehgal S, Li W, Rabinowicz P, Chan A, Šimková H, Doležel J, Gill B: Chromosome
arm-specific BAC end sequences permit comparative analysis of homoeologous chromosomes and genomes of polyploid wheat. BMC Plant Biol 2012, 12:64.
56. Vitulo N, Albiero A, Forcato C, Campagna D, Da lPF, Bagnaresi P, Colaiacovo M, Faccioli P, Lamontanara A, Šimková H: First survey of the wheat chromosome 5A
composition through a next generation sequencing approach. PLoS One 2011, 6:e26421.
57. Wicker T, Buchmann JP, Keller B: Patching gaps in plant genomes results in gene
movement and erosion of colinearity. Genome Res 2010, 20:1229–1237.
58. Feuillet C, Penger A, Gellner K, Mast A, Keller B: Molecular evolution of receptor-like
kinase genes in hexaploid wheat. Independent evolution of orthologs after polyploidization and mechanisms of local rearrangements at paralogous loci. Plant Physiol 2001, 125:1304–1313.
59. Kronmiller BA, Wise RP: Computational finishing of large sequence contigs reveals
interspersed nested repeats and gene islands in the rf1-associated region of maize. Plant Physiol 2009, 151:483–495.

60. Paux E, Roger D, Badaeva E, Gay G, Bernard M, Sourdille P, Feuillet C: Characterizing
the composition and evolution of homoeologous genomes in hexaploid wheat through
BAC‐‐‐‐end sequencing on chromosome 3B. Plant J 2006, 48:463–474.
61. Feldman M, Levi AA, Fahima T, Korol A: Genomic asymmetry in allopolyploid
plants: wheat as a model. J Exp Bot 2012, 63:5045–5059.
62. Brenchley R, Spannagl M, Pfeifer M, Barker GLA, D’Amore R, Allen AM, McKenzie N, Kramer M, Kerhornou A, Bolser D: Analysis of the bread wheat genome using whole-
genome shotgun sequencing. Nature 2012, 491:705–710.
63. Akhunov ED, Akhunova AR, Linkiewicz AM, Dubcovsky J, Hummel D, Lazo G, Chao S, Anderson OD, David J, Qi L: Synteny perturbations between wheat homoeologous
chromosomes caused by locus duplications and deletions correlate with recombination rates. Proc Natl Acad Sci U S A 2003, 100:10836.
64. Gill KS, Gill BS, Endo TR, Taylor T: Identification and high-density mapping of gene-
rich regions in chromosome group 1 of wheat. Genetics 1996, 144:1883–1891.
65. Gaut BS, Wright SI, Rizzon C, Dvorak J, Anderson LK: Recombination: an
underappreciated factor in the evolution of plant genomes. Nature Rev Genet 2007, 8:77–84.
66. Michelmore RW, Meyers BC: Clusters of resistance genes in plants evolve by
divergent selection and a birth-and-death process. Genome Res 1998, 8:1113–1130.
67. Peng J, Ronin Y, Fahima T, Röder MS, Li Y, Nevo E, Korol A: Domestication
quantitative trait loci in Triticum dicoccoides, the progenitor of wheat. Proc Natl Acad Sci U S A 2003, 100:2489–2494.
68. Maleki L, Faris JD, Bowden RL, Gill BS, Fellers JP: Physical and genetic mapping of
wheat kinase analogs and NBS-LRR resistance gene analogs. Crop Sci 2003, 43:660–670.
69. Chen XM: Epidemiology and control of stripe rust [Puccinia striiformis f. sp. tritici] on wheat. Can J Plant Pathol 2005, 27:314–337.
70. Wicker T, Yahiaoui N, Keller B: Illegitimate recombination is a major evolutionary
mechanism for initiating size variation in plant resistance genes. Plant J 2007, 51:631–641.
71. Wicker T, Yahiaoui N, Keller B: Contrasting rates of evolution in Pm3 loci from three
wheat species and rice. Genetics 2007, 177:1207–1216.
72. Vrána J, Kubaláková M, Šimková H, Číhalíková J, Lysák MA, Doležel J: Flow sorting
of mitotic chromosomes in common wheat (Triticum aestivum L.). Genetics 2000, 156(4):2033–2041.
73. Kubalakova M, Vrana J, Cihalikova J, Simkova H, Dolezel J, Kubálaková M, Vrána J, Číhalíková J, Šimková H, Doležel K: Flow karyotyping and chromosome sorting in bread
wheat (Triticum aestivum L.). Theor Appl Genet 2002, 8:1362–1372.
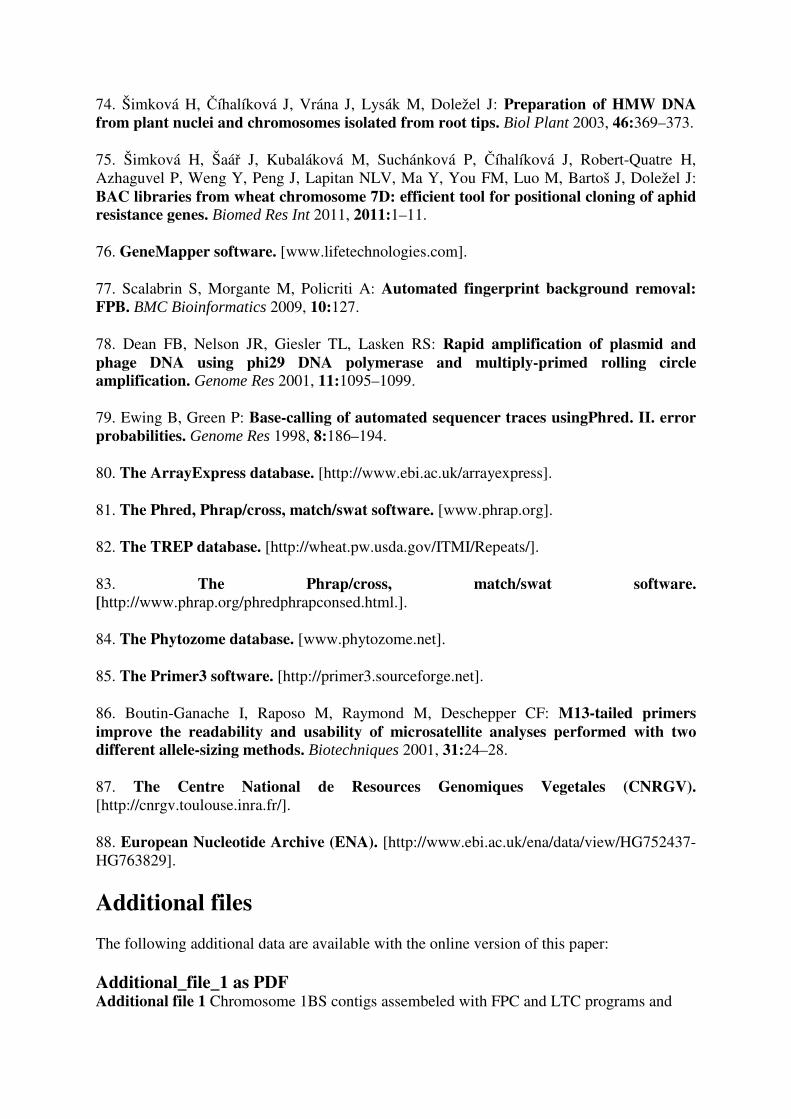
74. Šimková H, Číhalíková J, Vrána J, Lysák M, Doležel J: Preparation of HMW DNA
from plant nuclei and chromosomes isolated from root tips. Biol Plant 2003, 46:369–373.
75. Šimková H, Šaář J, Kubaláková M, Suchánková P, Číhalíková J, Robert-Quatre H, Azhaguvel P, Weng Y, Peng J, Lapitan NLV, Ma Y, You FM, Luo M, Bartoš J, Doležel J: BAC libraries from wheat chromosome 7D: efficient tool for positional cloning of aphid resistance genes. Biomed Res Int 2011, 2011:1–11.
76. GeneMapper software. [www.lifetechnologies.com].
77. Scalabrin S, Morgante M, Policriti A: Automated fingerprint background removal:
FPB. BMC Bioinformatics 2009, 10:127.
78. Dean FB, Nelson JR, Giesler TL, Lasken RS: Rapid amplification of plasmid and
phage DNA using phi29 DNA polymerase and multiply-primed rolling circle amplification. Genome Res 2001, 11:1095–1099.
79. Ewing B, Green P: Base-calling of automated sequencer traces usingPhred. II. error
probabilities. Genome Res 1998, 8:186–194.
80. The ArrayExpress database. [http://www.ebi.ac.uk/arrayexpress].
81. The Phred, Phrap/cross, match/swat software. [www.phrap.org].
82. The TREP database. [http://wheat.pw.usda.gov/ITMI/Repeats/].
83. The Phrap/cross, match/swat software.
[http://www.phrap.org/phredphrapconsed.html.].
84. The Phytozome database. [www.phytozome.net].
85. The Primer3 software. [http://primer3.sourceforge.net].
86. Boutin-Ganache I, Raposo M, Raymond M, Deschepper CF: M13-tailed primers
improve the readability and usability of microsatellite analyses performed with two different allele-sizing methods. Biotechniques 2001, 31:24–28.
87. The Centre National de Resources Genomiques Vegetales (CNRGV). [http://cnrgv.toulouse.inra.fr/].
88. European Nucleotide Archive (ENA). [http://www.ebi.ac.uk/ena/data/view/HG752437-HG763829].
Additional files
The following additional data are available with the online version of this paper:
Additional_file_1 as PDF Additional file 1 Chromosome 1BS contigs assembeled with FPC and LTC programs and

resulting scaffolds assembled by LTC. Table that contains the number of clones per contig and the number of contigs in each category for contigs with 2 to >400 clones obtained by FPC and LTC programs and classified by their sizes.
Additional_file_2 as XLSX Additional file 2 List of 2939 markers mapped to 1BS BAC clones. Table listing the marker name, the marker type, the name of the deletion bin, the ID of the BAC clones and the name of the physical contigs to which the marker is assigned to, for the 2939 markers assigned to the physical map of the wheat chromosome 1BS.
Additional_file_3 as XLSX Additional file 3 Puptative markers developed for 1BS chromosome. Contains seven tables, designated as Tables a–f: (a) Primer pairs for wheat 1BS chromosome gene-related markers developed based on homology of 1BS sequences with Brachypodium Bd2; (b) Primer pairs for wheat 1BS chromosome gene-related markers developed based on homology of 1BS sequences with Barley 1H unigenes; (c) Primer pairs for ISBP markers developed based on 1BS chromosome 454 sequencing reads; (d) Primer pairs for SSR markers developed based on 1BS chromosome 454 sequencing reads; (e) Primer pairs for ISBP markers developed for 1BS chromosome BES; (f) Primer pairs for SSR markers developed for 1BS chromosome BES.
Additional_file_4 as TXT Additional file 4 List of 1,776 1BS Illumina contigs. Contains a list of 1,776 1BS Illumina contigs in fasta format. These 1,776 1BS Illumina survey sequence contigs [31] obtained due to similarity (e-value < 10-25) with unigene sequences that gave signals in the NimbleGen hybridization.
Additional_file_5 as XLSX Additional file 5 1S GenomeZipper. Table that shows the homology between Brachypodium Bd2, rice Os5, and sorghum Sb9 and markers mapped to wheat chromosome 1BS BAC clones and the established 1BS deletion bins. Gene-derived markers of different types mapped with these positions on clones and contigs with corresponding homologous genes from orthologous regions of the three model grass genomes Brachypodium Bd2, rice Os5, and sorghum Sb9 as well as deletion bin position are presented.
Additional_file_6 as PDF Additional file 6 Delimitation of the syntenic regions of the wheat 1BS chromosome in Brachypodium Bd2, rice Os5 and sorghum Sb9. Contains a text describing the method used to identify chromosomal segments corresponding to 1BS chromosome deletion bins based on comparative genomic approach and a table with genes from Bd2, Os5 and Sb9 that delimited the borders of wheat deletion bins.
Additional_file_7 as XLSX Additional file 7 Six major colinearity breaks between 1BS of wheat and Bd2, Os5 and Sb9. Table that contains the markers mapped to LTC contigs, their deletion bin position, and the corresponding genes from model grass genomes Brachypodium, rice, and sorghum.
Additional_file_8 as PDF Additional file 8 Scaffolding by end-to-end merging. Text file describing the method of

contig elongation by end-to-end merging using LTC program and Figures that illustrate that process.
Additional_file_9 as PDF Additional file 9 Normalization and data deconvolution of the MTP Pool Data obtained by hybridization with NimbleGen 40 K unigene microarray. Text file that describes the two methods used for normalization and deconvolution of data obtained by hybridization of the 1BS MTP 3D pools with NimbleGen 40 K unigene microarray
Additional_file_10 as PDF Additional file 10 SSR, ISBP, and EST marker analysis. Text file that describes the methods used for PCR reactions.

Figure 1

a
b
Figure 2

0
5
10
15
20
1 3 5 7 9 11 13 15 17 19 21 23 25 27 29 31 33 35 37 39 41 43 45 47 49 51 53 55 57 59 61 63 65 67 69 71 73 75 77 79 81 83 85 87 89 91 93 95 97 99
len
gth
(M
b)
scaffold /contig number (sorted by length)
LTC Scaffolds
LTC contigs
FPC contigs
Figure 3
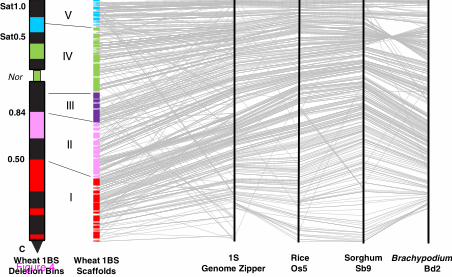
C
0.50
0.84
Nor
Sat0.5
Sat1.0
Sorghum
Sb9Wheat 1BS
Scaffolds
1S
Genome Zipper
Rice
Os5Brachypodium
Bd2
V
IV
III
II
I
Wheat 1BS
Deletion Bins Figure 4

0
40
20
30
10
Perc
en
tag
e o
f co
ntig
sa
Length of contig (Mb) by zones
<1 1-2 2-3 3-4 4-5 >6
240
220
200
180
160
140
120
100
80
60
40
20
040 60 80 100 120 140 160 180
b
Nu
mb
er
of clo
nes
Number of bands in cloneFigure 5
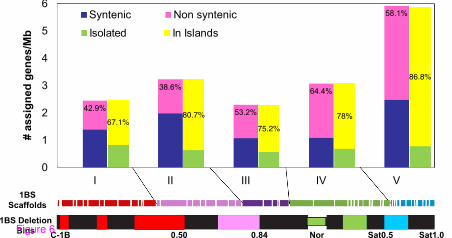
38.6%
67.1%
80.7%
75.2%
86.8%
Figure 6

0
100
200
300
400
500
600
1 ≤2
Nu
mb
er
of
ch
rom
oso
ma
l in
terv
als
Number of genes per chromosomal interval (of 0.25 Mblength)
expected observed
0
Figure 7

Additional files provided with this submission:
Additional file 1: 8520867571033530_add1.pdf, 34Khttp://genomebiology.com/imedia/7631844831166318/supp1.pdfAdditional file 2: 8520867571033530_add2.xlsx, 127Khttp://genomebiology.com/imedia/1657383566116631/supp2.xlsxAdditional file 3: 8520867571033530_add3.xlsx, 15267Khttp://genomebiology.com/imedia/2133941295116631/supp3.xlsxAdditional file 4: 8520867571033530_add4.txt, 13473Khttp://genomebiology.com/imedia/1900426754116631/supp4.txtAdditional file 5: 8520867571033530_add5.xlsx, 362Khttp://genomebiology.com/imedia/1592299368116631/supp5.xlsxAdditional file 6: 8520867571033530_add6.pdf, 34Khttp://genomebiology.com/imedia/2126630110116631/supp6.pdfAdditional file 7: 8520867571033530_add7.xlsx, 32Khttp://genomebiology.com/imedia/6341789801166318/supp7.xlsxAdditional file 8: 8520867571033530_add8.pdf, 493Khttp://genomebiology.com/imedia/2041516522116631/supp8.pdfAdditional file 9: 8520867571033530_add9.pdf, 90Khttp://genomebiology.com/imedia/6144128761166318/supp9.pdfAdditional file 10: 8520867571033530_add10.pdf, 35Khttp://genomebiology.com/imedia/1300931420116631/supp10.pdf