Genetics and mapping of new isozyme loci in Vicia faba L using trisomics
7
Theor Appl Genet (1995) 91:783-789 Springer-Verlag 1995 A. M. Torres Z. Satovic J. Canovas S. Cobos J. I. Cubero Genetics and mapping of new isozyme loci in Vicia faba L. using trisomics Received: 6 February 1995 ! Accepted: 12 May 1995 Abstract Polymorphism in ten enzyme systems (ACO, ACP, AAT, EST, FK, ME, NAG, PRX, 6PGD, and SOD) in Vicia faba L. was analyzed, revealing 13 loci, six of which have not been reported before. Inheritance, genet- ics, possible location, and linkage analysis were studied in 13 different F 2 populations trisomic for four of the six chro- mosomes (nos. 3, 4, 5, and 6) of the species. Each of these loci exhibited typical Mendelian inheritance except for those involved in the trisomic chromosome. Five loci have been assigned to a specific chromosome: Est-2 to chromo- some 3, Fk-2 to chromosome 4, Prx-1 to chromosome 5, and Sod-1 and Pgd-p to chromosome 6. Nag-1 and Pgd-c displayed a linkage of 22.8 cM indicating a clear homol- ogy with chromosome 5 of garden pea on which both mark- ers are syntenic. Key words Viciafaba Isozyme - Trisomic Mapping Introduction It is widely recognized that the development of a linkage map of any species provides a valuable tool in many areas of plant genetics and breeding. Genes coding for enzymes have made important contributions to the construction of such maps in different crops. Such has not been the case Communicated by J. W. Snape A. M. Torres ([]) J. Canovas S. Cobos C.I.D.A., Departamento de Mejora y Agronomfa, Aptdo. 4240, 14080 C6rdoba, Spain Z. Satovic Department of Plant Breeding, Genetics and Biometrics, Faculty of Agriculture, 41000 Zagreb, Croatia J. I. Cubero Departamento de Gen6tica, E.T.S.I.A.M., Aptdo 3048, 14080 C6rdoba, Spain in Vicia faba because, in comparison with other pulse crops, faba bean has been the focus of little effort in this area and few isozyme loci have contributed to the prelim- inary map of the species. Most of the isoenzymatic poly- morphisms in this species have been used in evolutionary and taxonomic studies (Ladizinsky 1975; Yamamoto 1975, 1979; Yamamoto and Plitmann 1980; Polignano and Son- nante 1992), inbred-line recognition (Gates and Boulter 1979, 1980), cultivar identification (Bassiri and Rouhani 1977; Kaser and Steiner 1983), and outcrossing-rate esti- mation (Peat and Adham 1984; Carre et al. 1991; Suso and Moreno 1995). Although most of these authors described genetic variation, no information on the inheritance of the observed isozymes was reported. Prior to 1990 details of the inheritance of only seven isozyme loci was available (Gates and Boulter 1979; Suso and Moreno 1982; 1986; Peat and Adham 1984; Mancini et al. 1989). Recently, new isozyme loci have been identified (Torres et al. 1993a; Suso et al. 1993) and some linkage groups including isozyme markers have also been established. However, up to now only three isozyme loci have been clearly associated with a specific chromosome (Van de Ven et al. 1991; Torres et al. 1993a). The cytological tools available in faba bean for assign- ing genes and linkage groups to their respective chromo- somes is limited to translocation stocks (Sj6din 1971) and primary trisomics (Cabrera and Mart~n 1989; Cabrera et al. 1989). To-date, five of a possible six primary trisomics have been characterized by our group (Martfn and Barcel6 1984), and these offer useful tools to enhance the map in V.faba. In the present study we report the inheritance, ge- netics, and linkage of 13 isozyme loci in faba bean, six of them described for the first time: aconitate hydratase (Aco-1), fructokinase (Fk-2), malic enzyme (Me-4), beta- N-acetyl-glucosaminidase (Nag-l), peroxidase (Prx-3), and 6-phosphogluc0nate dehydrogenase (Pgd-c). Primary trisomics have been used to establish the chromosomal lo- cation of some of the loci. Both positive and negative re- sults on linkage and chromosomal location will provide new information useful for the construction of a more com- plete map of the species.
-
Upload
independent -
Category
Documents
-
view
1 -
download
0
Transcript of Genetics and mapping of new isozyme loci in Vicia faba L using trisomics

Theor Appl Genet (1995) 91:783-789 �9 Springer-Verlag 1995
A. M . T o r r e s �9 Z . S a t o v i c �9 J. C a n o v a s �9 S. C o b o s J. I. C u b e r o
Genetics and mapping of new isozyme loci in Vicia faba L. using trisomics
Received: 6 February 1995 ! Accepted: 12 May 1995
A b s t r a c t Polymorphism in ten enzyme systems (ACO, ACP, AAT, EST, FK, ME, NAG, PRX, 6PGD, and SOD) in Vicia faba L. was analyzed, revealing 13 loci, six of which have not been reported before. Inheritance, genet- ics, possible location, and linkage analysis were studied in 13 different F 2 populations trisomic for four of the six chro- mosomes (nos. 3, 4, 5, and 6) of the species. Each of these loci exhibited typical Mendelian inheritance except for those involved in the trisomic chromosome. Five loci have been assigned to a specific chromosome: Est-2 to chromo- some 3, Fk-2 to chromosome 4, Prx-1 to chromosome 5, and Sod-1 and Pgd-p to chromosome 6. Nag-1 and Pgd-c displayed a linkage of 22.8 cM indicating a clear homol- ogy with chromosome 5 of garden pea on which both mark- ers are syntenic.
Key words Viciafaba �9 Isozyme - Trisomic �9 Mapping
Introduction
It is widely recognized that the development of a linkage map of any species provides a valuable tool in many areas of plant genetics and breeding. Genes coding for enzymes have made important contributions to the construction of such maps in different crops. Such has not been the case
Communicated by J. W. Snape
A. M. Torres ([]) �9 J. Canovas �9 S. Cobos C.I.D.A., Departamento de Mejora y Agronomfa, Aptdo. 4240, 14080 C6rdoba, Spain
Z. Satovic Department of Plant Breeding, Genetics and Biometrics, Faculty of Agriculture, 41000 Zagreb, Croatia
J. I. Cubero Departamento de Gen6tica, E.T.S.I.A.M., Aptdo 3048, 14080 C6rdoba, Spain
in Vicia faba because, in comparison with other pulse crops, faba bean has been the focus of little effort in this area and few isozyme loci have contributed to the prelim- inary map of the species. Most of the isoenzymatic poly- morphisms in this species have been used in evolutionary and taxonomic studies (Ladizinsky 1975; Yamamoto 1975, 1979; Yamamoto and Plitmann 1980; Polignano and Son- nante 1992), inbred-line recognition (Gates and Boulter 1979, 1980), cultivar identification (Bassiri and Rouhani 1977; Kaser and Steiner 1983), and outcrossing-rate esti- mation (Peat and Adham 1984; Carre et al. 1991; Suso and Moreno 1995). Although most of these authors described genetic variation, no information on the inheritance of the observed isozymes was reported. Prior to 1990 details of the inheritance of only seven isozyme loci was available (Gates and Boulter 1979; Suso and Moreno 1982; 1986; Peat and Adham 1984; Mancini et al. 1989). Recently, new isozyme loci have been identified (Torres et al. 1993a; Suso et al. 1993) and some linkage groups including isozyme markers have also been established. However, up to now only three isozyme loci have been clearly associated with a specific chromosome (Van de Ven et al. 1991; Torres et al. 1993a).
The cytological tools available in faba bean for assign- ing genes and linkage groups to their respective chromo- somes is limited to translocation stocks (Sj6din 1971) and primary trisomics (Cabrera and Mart~n 1989; Cabrera et al. 1989). To-date, five of a possible six primary trisomics have been characterized by our group (Martfn and Barcel6 1984), and these offer useful tools to enhance the map in V. faba. In the present study we report the inheritance, ge- netics, and linkage of 13 isozyme loci in faba bean, six of them described for the first time: aconitate hydratase (Aco-1), fructokinase (Fk-2), malic enzyme (Me-4), beta- N-acetyl-glucosaminidase (Nag-l), peroxidase (Prx-3), and 6-phosphogluc0nate dehydrogenase (Pgd-c). Primary trisomics have been used to establish the chromosomal lo- cation o f some of the loci. Both positive and negative re- sults on linkage and chromosomal location will provide new information useful for the construction of a more com- plete map of the species.

784
Table 1 Parental lines used for the crosses, the number of progeny tested and the segre- gating isozyme loci scored
Female parent
Vf 6
Male parent
F1 trisomic chromo- some
2 V 2 VI
33 III 33 IV 76 V
108 V 108 VI 159 IV 159 V 159 VI 166 IV 166 V 166 VI
F2 popula- lation size
F2 no, of trisomic plants
Segregating isozyme loci
45 10 38 3 19 4 48 11 50 8 40 3 40 9 35 6 44 5 54 15 52 18 38 6 36 7
Aat-1, Aco-2, Prx-1, Sod-1 Aat-2, Aco-1, Prx-1, Sod-1 Est-1, Est-2, Nag-l, Pgd-p, Pgd-c, Prx-3 Est-1, Est-2, Nag-l, Pgd-p, Pgd-c, Prx-3 Me-4, Est-2, Pgd-p, sod-1 Acp-1, Pgd-p Pgd-p Acp-2, Fk-2, Pgd-p, Prx-1, Prx-3, Sod-1 Acp-2, Fk-2, Pgd-p, Prx-1, Prx-3, Sod-1 Acp-2, Fk-2, Pgd-p, Prx-1, Prx-3, Sod-1 Pgd-c, Sod-1 Pgd-c, Sod-1 Pgd-c, Sod-1
Materials and methods
Thirteen F 2 populations, derived from plants trisomic for chromo- somes III, IV, V, and VI (T3, T4, T5, and T6), were scored for allo- zyme phenotypes (Table 1). Primary trisomics where obtained by crossing Vf6 (an asynaptic line used always as the female parent) with six different pollen parents, all of them from the collection of genetic variants at the E.T.S.I.A.M. (Escuela T6cnica Superior de In- genieros Agrdnomos y Montes) in Cdrdoba. The F 1 plants with 2n+ 1 chromosomes were identified by studying meiotic metaphase and characterized as outlined by Martfn and B arcel6 (1984). Crosses were made, and progenies were grown, in the greenhouse to avoid inter- ference by insects.
Most of the isozyme analyses were performed on extracts from young leaves. Nevertheless, for several systems other organs, such as roots or seeds, were tested in order to improve band resolution and to optimize banding patterns. Thus for FK, NAG and PRX, healthy root tips were used in the F2 screening.
Horizontal starch-gel electrophoresis was performed on 12% starch gels according to Gottlieb (1973). Samples of leaves or root tissue were extracted in 2-3 drops of tris-maleate buffer, pH 8. In the case of peroxidase isozymes, the buffer did not contain 2-mercap- toethanol. Three different gel systems were used. System I consist- ed of tris-citrate/lithium borate buffer, pH 8 (Selander et al. 1971), System II of histidine buffer, pH 6.5 (Cardy et al. 1980), and System III of citrate/N-(3 aminopropyl- morpholine) buffer, pH 6.1 (Clay- ton and Tretiak 1972). Slices from system-I gels were stained for: aspartate aminotransferase (AAT; E.C. 2.6.1.1), beta-N-acetyl-glu- cosaminidase (NAG; E.C. 3.2.1.30), malic enzyme (ME; E.C. 1.1.1.40), peroxidase (PRX; E.C. 1.11.1.7), and superoxide dismu- tase (SOD; E.C. 1.15.1.1). System-II gels were used for: aconitate hydratase (ACO; E.C. 4.2.1.3), fructokinase (FK; E.C. 2.7.1.4), and 6-phosphogluconate dehydrogenase (PGD; E.C. 1.1.1.44). Finally, acid phosphatase (ACP; E.C. 3.1.3.2) and esterase (EST; E.C. 3.1.1.-) were stained in slices from System-III gels. Most of the assay solutions were prepared according to standard recipes (Wen- del and Weeden 1990) except for NAG (Weeden and Marx 1987) and FK (Muelbauer et al. 1989). Enzymes were named using the nomen- clature proposed by the International Union of Biochemists (1984) and different isozymes (products of different genes) were designat- ed as indicated by Weeden (1988).
When the marker under study was located on a trisomic chromo- some the normal co-dominant ratio was modified due to the presence of the extra chromosome. Thus, in order to locate a specific isozyme locus on its respective chromosome, the goodness-of-fit to the 1:2:1 segregation ratio or to the "critical ratio" were tested by chi-square analysis (see Discussion).
The chi-square test for homogeneity of data from different F 2 families was carried out according to the procedure described by
Mather (1957). Data were pooled when homogeneous and used for the final linkage and inheritance test. Linkage between loci was ex- amined using a contingency chi-square test. Recombination fractions were estimated using maximum-likelihood formulae as applied by the LINKAGE-1 program (Suiter et al. 1983), and justified using the threshold LOD>3 achieved by the MAPMAKER program (Lander et al. 1987).
Results
P o l y m o r p h i s m was present for 13 of the 28 i sozymes re- so lved in the ten enzyme systems. The resul ts ob ta ined for each enzyme sys tem are summar ized in Table 2 and ex- p l a ined be low:
A C R As repor ted p rev ious ly (Torres et al. 1993 a), this enzyme sys tem exhib i ted two anodal zones of activity. In the presen t s tudy only the most s lowly migra t ing form (Acp-2) was po lymorph ic in crosses 6x10⁸ and 6x159. The A C P ac t iv i ty was so intense that in some fami l ies (e.g. 6x10⁸ T6) the ac t iv i ty bands merged together, and the three poss ib le var iants could not be c lear ly d is t inguished. Thus, these data were omi t ted f rom the analysis . Segrega t ion ra- t ios in 6x159 T4 and 6x159 T6 did not fit e i ther the nor- mal or the cr i t ical rat ios. Some of the F 2 ind iv idua ls could have been misc lass i f i ed for the reason desc r ibed above. Never the less , p rogenies 6x10⁸ T5 and 6x159 T5 were c lear ly r e so lved and the segrega t ion pat tern did fit the 1:2:1 rat io expec ted for a s ingle nuclear gene. As the data f rom both fami l ies were homogeneous , and the poo led data fit the rat io expec ted for d ia l le l ic inher i tance, these resul ts were inc luded in the l inkage analysis .
AAT. AAT act iv i ty was tested in both leaf and root t issues. L e a f extracts y i e lded bet ter reso lu t ion than roots a l though the band ing pat tern was similar. Three i sozyme loci were r e so lved as out l ined in a previous s tudy (Torres et al. 1993 a), but only Aat-2 showed var ia t ion in cross 6x2 (Fig. 1) whereas 6x2 T5 segrega t ion did not fit e i ther the co -dom- inant or the t r i somic ratio. In contrast , ind iv idua ls f rom 6x2

Table 2 Goodness-of-fi t to disomic and trisomic ratios of the isozyme loci studied
785
Isozyme Trisomic Cross Popu- Chi 2 for Chi 2 for loci a chromo- lation hetero- disomic
some size geneity ratio
Chi 2 for trisomic ratio
2n 2 n + I ( R C A ) b 2 n + I ( R C C A ) ~
Odds ratio (2n + 1/2 n)
Acp-2 IV 6 x 159 35 (4)~ g 8.49* 7.31" Acp-2 V 6 x 10⁸ 38 (1) u 0.11 Acp-2 V 6 x 159 44 (1) 1.64 Acp-2 V 82 0.85 (df2) 0.93 Acp-2 VI 6 x 159 52 (4) 6.58* 12.51" Aat-2 V 6 x 2 45 (4) 6.60* 9.70* Aat-2 VI 6 • 2 38 (1) 0.89 Aco-2 V 6 x 2 45 (1) 1.09 Aco-2 VI 6 x 2 38 (1) 0.11 Fk-2 IV 6 x 159 33 (2) e 10.21" 0.75 2.68 Fk-2 V 6 • 159 43 (1) 0.21 Fk-2 VI 6 x 159 54 (1) 1.26 Me-4 V 6 x 76 49 (1) 4.92 Est-1 IlI 6 x 33 19 (1) 2.26 Est-1 IV 6 x 33 48 (1)~ 1.79 Est-2 III 6 x 33 19 (3) ~ 5.21 0.60 1.79 Est-2 IV 6 x 33 48 (1) 0.79 Est-2 V 6 x 76 48 (1) 5.13 Nag-i III 6 x 33 19 (1) 3.00 Nag-1 IV 6 x 33 48 (1) 1.50 Pgd-p III 6 x 33 19 (1) 4.37 Pgd-p IV 6 x 159 35 (4) 11.23" 3.97 Pgd-p IV 6 x 33 48 (1) 3.67 Pgd-p IV 83 11.60 (df2)* 3.87 Pgd-p V 6 x 10⁸ 40 (1) 0.95 Pgd-p V 6 • 159 44 (1) 0.50 Pgd-p V 6 x 76 49 (1) 0.02 Pgd-p V 133 0.85 (df4) 0.61 Pgd-p VI 6 x 10⁸ 40 (2) 8.55* 0.21 0.64 Pgd-p VI 6 x 159 54 (3) 5.41 1.85 0.04 Pgd-p VI 94 0.79 (df2) 13.49" 0.78 0.11 Pgd-c III 6 x 33 19 (1) 0.47 Pgd-c IV 6 x 166 52 (1) 0.12 Pgd-c IV 6 x 33 48 (1) 0.33 Pgd-c IV 100 0.39 (df2) 0.06 Pgd-c V 6 x 166 38 (1) 1.16 Pgd-c VI 6 x 166 26 (1) 3.56 Prx-1 IV 6 x 159 34 (1) 1.94 Prx-1 V 6 x 159 44 (3) 5.59 0.98 0.91 Prx-1 V 6 x 2 45 (2) 7 .71 ' 1.82 3.43 Prx-1 V 89 0.59 (df2) 12.96" 1.81 3.57 Prx-1 VI 6 x 159 54 (4) 6.15" 9.46* Prx-1 VI 6 x 2 38 (1) 1.16 Prx-1 VI 92 5.89 (df2) 1.57 Prx-3 III 6 x 33 19 (1) 0.89 Prx-3 IV 6 • 159 34 (4) 6.71" 17.55" 0.01 Prx-3 IV 6 x 33 48 (1) 4.50 Prx-3 IV 82 8.97 (df 2)* 2.49 Prx-3 V 6 x 159 43 (1) 1.70 Prx-3 VI 6 x 159 41 (1) 1.00 Sod-1 IV 6 x 159 35 (1) 4.89 Sod-1 IV 6 x 166 52 (1) 2.77 Sod-1 IV 87 4.52 (df2) 2.79 Sod-1 V 6 x 159 44 (1) 2.32 Sod-1 V 6 x 166 38 (1) 0.95 Sod-1 V 6 x 2 45 (1) 0.60 Sod-1 V 6 x 76 49 (1) 1.65 Sod-1 V 176 4.68 (df6) 0.81 Sod-1 VI 6 • 159 41 (5) h 4.32 5.67 Sod-1 VI 6 x 166 36 (3) 2.44 1.72 0.26 Sod-1 VI 6 x 2 38 (2) 14.42" 1.01 1.83 Sod-1 VI 115 8.54 (df4) 11.07" 2.71
7.36*
73.15" 17.00'
27.75*
22.38*
2.44
0.38
12.59
430.54
16.95
9.28
a Isozymes in bold, pooled data from the different families trisomic for a specific locus b RCA, random chromosome association ~ RCCA, random complete chromatid association d (1), F 2 families that fit the typical Mendelian segregation ratio ~(2), F 2 families that fit the trisomic ratio
(3), F 2 families that fit both the normal and the trisomic ratio hg(4), F2 families that did not fit neither the normal nor the trisomic ratio
(5), F 2 families that fit both the normal and the trisomic ratio considering random chromatid association due to the existance of a trisomic recessive (aaa) individual
786
Fig. 1 Faba-bean aspartate aminotransferase patterns demonstrat- ing variation in the isozyme Aat-2. Phenotype designations are: H heterozygous; S slow; F fast. Heterozygous individuals have three bands, indicating that the isozyme is dimeric. The anode is at the top of the figure
T6 showed typical Mendelian segregation. The faba-bean soaked-pollen extract (Weeden and Gottlieb 1980) con- tained only the less-anodal AAT (Aat-3) indicating the cy- toplasmic nature of this locus.
ACO. Isozyme analysis for ACO was done on extracts from leaves, roots and seeds. Similar banding patterns were re- solved with these different organs, but leaf zymograms gave the more intense bands. Two anodal zones of activ- ity were observed in leaf extracts of V.faba. The less-ano- dal isozyme was designated Aco-2 and scored in cross 6x2. The active form of this locus behaved as a monomer and gave a good fit to the expected 1:2:1 ratio.
FK. FK was analyzed in both roots and seeds, but root ex- tracts yielded the best resolution. Five zones of activity were observed. Only the second anodal zone, designated as Fk-2, was polymorphic in cross 6x159. The two-banded zymotype of the heterozygous individuals suggested that Fk-2 is functionally monomeric. A normal Mendelian seg- regation was observed at this locus in 6x159 T5 and T6. Nevertheless, a good fit to the critical ratio was observed in the family 6• T4 indicating that the locus is located on chromosome 4.
ME. Four zones of bands were observed in anodal slices. The three most-anodal bands were monomorphic and stained very poorly. The less-mobile zone, designated as Me-4, produced the darkest bands on the gel and was poly- morphic in 6x76. The segregation ratio in the family 6x76 T5 did not differ significantly from the expected disomic ratio.
EST. Several zones of EST were detected in both anodal and cathodal slices. The two most-anodal esterases (Est-1 and Est-2) were polymorphic in cross 6x33, while 6x76 showed variation only for Est-2. The monomeric nature of
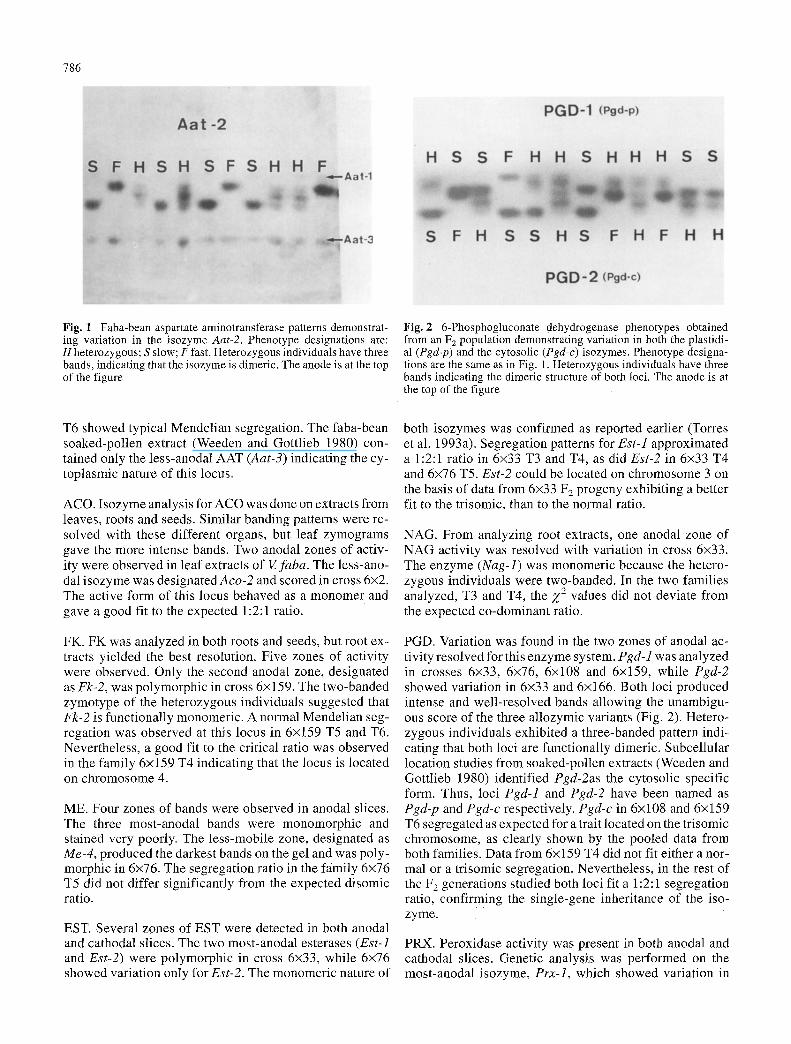
Fig. 2 6-Phosphogluconate dehydrogenase phenotypes obtained from an F 2 population demonstrating variation in both the plastidi- al (Pgd-p) and the cytosolic (Pgd-c) isozymes. Phenotype designa- tions are the same as in Fig. 1. Heterozygous individuals have three bands indicating the dimeric structure of both loci. The anode is at the top of the figure
both isozymes was confirmed as reported earlier (Torres et al. 1993a). Segregation patterns for Est-1 approximated a 1:2:1 ratio in 6x33 T3 and T4, as did Est-2 in 6x33 T4 and 6x76 T5. Est-2 could be located on chromosome 3 on the basis of data from 6x33 F 2 progeny exhibiting a better fit to the trisomic, than to the normal ratio.
NAG. From analyzing root extracts, one anodal zone of NAG activity was resolved with variation in cross 6x33. The enzyme (Nag-l) was monomeric because the hetero- zygous individuals were two-banded. In the two families analyzed, T3 and T4, the Z 2 values did not deviate from the expected co-dominant ratio.
PGD. Variation was found in the two zones of anodal ac- tivity resolved for this enzyme system. Pgd-1 was analyzed in crosses 6x33, 6x76, 6x10⁸ and 6• while Pgd-2 showed variation in 6x33 and 6x166. Both loci produced intense and well-resolved bands allowing the unambigu- ous score of the three allozymic variants (Fig. 2). Hetero- zygous individuals exhibited a three-banded pattern indi- cating that both loci are functionally dimeric. Subcellular location studies from soaked-pollen extracts (Weeden and Gottlieb 1980) identified Pgd-2as the cytosolic specific form. Thus, loci Pgd-1 and Pgd-2 have been named as Pgd-p and Pgd-c respectively. Pgd-c in 6x10⁸ and 6x159 T6 segregated as expected for a trait located on the trisomic chromosome, as clearly shown by the pooled data from both families. Data from 6x159 T4 did not fit either a nor- mal or a trisomic segregation. Nevertheless, in the rest of the F 2 generations studied both loci fit a 1:2:1 segregation ratio, confirming the single-gene inheritance of the i so- zyme.
PRX. Peroxidase activity was present in both anodal and cathodal slices. Genetic analysis was performed on the most-anodal isozyme, Prx-1, which showed variation in
787
LOD=0.96, and in 6x33 T4 r=0.18 with a LOD=5.88. When the data were pooled a recombination fraction of 0.21 with a LOD=6.50 was obtained. The homogeneity of the recom- bination fractions from these families was tested as pro- posed by Morton (1956). Since the obtained value of Z 2 (1 df)=l.57 is clearly non-significant, the recombination fraction of 0.21 (or 22.79 cM using Kosambi 's mapping function) from pooled data is a good estimation of the link- age intensity.
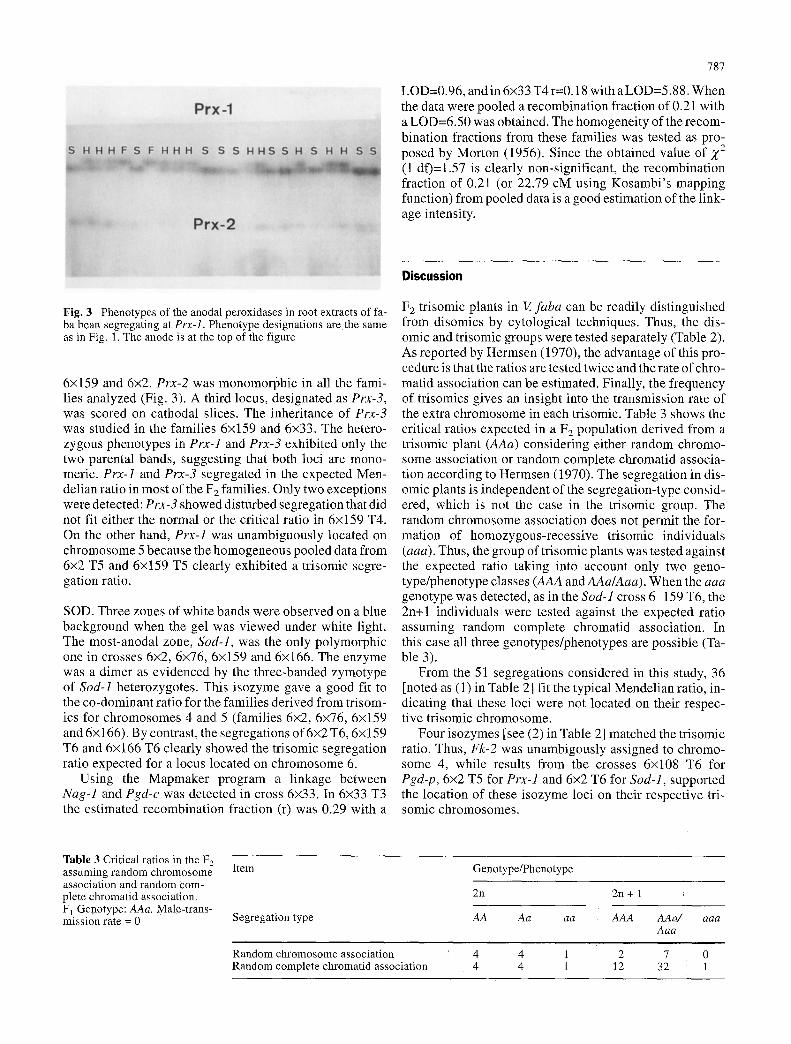
Fig. 3 Phenotypes of the anodal peroxidases in root extracts of fa- ba bean segregating at Prx-1. Phenotype designations are the same as in Fig. 1. The anode is at the top of the figure
6x159 and 6x2. Prx-2 was monomorphic in all the fami- lies analyzed (Fig. 3). A third locus, designated as Prx-3, was scored on cathodal slices. The inheritance of Prx-3 was studied in the families 6x159 and 6x33. The hetero- zygous phenotypes in Prx-1 and Prx-3 exhibited only the two parental bands, suggesting that both loci are mono- meric. Prx-1 and Prx-3 segregated in the expected Men- delian ratio in most of the F 2 families. Only two exceptions were detected: Prx-3 showed disturbed segregation that did not fit either the normal or the critical ratio in 6x159 T4. On the other hand, Prx-1 was unambiguously located on chromosome 5 because the homogeneous pooled data from 6x2 T5 and 6x159 T5 clearly exhibited a trisomic segre- gation ratio.
SOD. Three zones of white bands were observed on a blue background when the gel was viewed under white light. The most-anodal zone, Sod-l , was the only polymorphic one in crosses 6x2, 6x76, 6x159 and 6x166. The enzyme was a dimer as evidenced by the three-banded zymotype of Sod-1 heterozygotes. This isozyme gave a good fit to the co-dominant ratio for the families derived from trisom- ics for chromosomes 4 and 5 (families 6x2, 6x76, 6x159 and 6x166). By contrast, the segregations of 6• T6, 6x159 T6 and 6x166 T6 clearly showed the trisomic segregation ratio expected for a locus located on chromosome 6.
Using the Mapmaker program a linkage between Nag-1 and Pgd-c was detected in cross 6x33. In 6• T3 the estimated recombination fraction (r) was 0.29 with a
Discussion
F 2 trisomic plants in V. faba can be readily distinguished from disomics by cytological techniques. Thus, the dis- omic and trisomic groups were tested separately (Table 2). As reported by Hermsen (1970), the advantage of this pro- cedure is that the ratios are tested twice and the rate of chro- matid association can be estimated. Finally, the frequency of trisomics gives an insight into the transmission rate of the extra chromosome in each trisomic. Table 3 shows the critical ratios expected in a F 2 population derived from a trisomic plant (AAa) considering either random chromo- some association or random complete chromatid associa- tion according to Hermsen (1970). The segregation in dis- omic plants is independent of the segregation-type consid- ered, which is not the case in the trisomic group. The random chromosome association does not permit the for- mation of homozygous-recessive trisomic individuals (aaa). Thus, the group of trisomic plants was tested against the expected ratio taking into account only two geno- type/phenotype classes (AAA and AAa/Aaa). When the aaa genotype was detected, as in the Sod-1 cross 6 159 T6, the 2n+l individuals were tested against the expected ratio assuming random complete chromatid association. In this case all three genotypes/phenotypes are possible (Ta- ble 3).
From the 51 segregations considered in this study, 36 [noted as (1) in Table 2] fit the typical Mendelian ratio, in- dicating that these loci were not located on their respec- tive trisomic chromosome.
Four isozymes [see (2) in Table 2] matched the trisomic ratio. Thus, Fk-2 was unambigously assigned to chromo- some 4, while results from the crosses 6x10⁸ T6 for Pgd-p, 6x2 T5 for Prx-1 and 6x2 T6 for Sod-l, supported the location of these isozyme loci on their respective tri- somic chromosomes.
Table 3 Critical ratios in the F 2 assuming random chromosome association and random com- plete chromatid association. F 1 Genotype: AAa. Male-trans- mission rate = 0
Item Genotype/Phenotype
2n 2n + 1
Segregation type AA Aa aa AAA AAa/ aaa Aaa
Random chromosome association : 4 4 1 2 7 0 Random complete chromatid association 4 4 1 12 32 : 1

788
In four cases, and due to the relatively small size of some families (6• T3 for Est-2, 6x159 T6 for Pgd-p, 6• T5 for Prx-1 and 6x166 T6 for Sod-l), the segregation of isozyme loci fits both the normal and the trisomic ratio [see (3) in Table 2]. In these cases the odds ratio, comparing the probability that the locus is located on the trisomic chro- mosome with the probability that is not located on the tri- somic chromosome, was calculated. Odds ratios indicate how many times one hypothesis is more probable than the other. A similar method, known as LOD scoring (Lander and Botstein 1989), was used in the linkage analysis. Our results showed that the odds ratio in the four families men- tioned above clearly supported the hypothesis of trisomy (Table 2), confirming the location of Pgd-p, Prx-1, and Sod-1 on chromosomes 6, 5, and 6, respectively, as men- tioned above, and indicating the location of Est-2 on chro- mosome 3. In the case of Est-2 (in 6x33 T3), the results did not directly assign this locus to chromosome 3; this hy- pothesis was however supported by the fact that the homo- zygous recessive trisomic (aaa) was not observed and the odds ratio was more than 12 in favour of trisomy (Table 2). Nevertheless, further analyses with a larger population size are necessary to confirm this hypothesis.
In the case of Sod-1 (6x159 T6) the data fit both the nor- mal and the trisomic ratio. In addition to this, a homozy- gous-recessive trisomic individual (aaa) was detected in this cross, and the odds ratio considering random complete chromatid association was in favour of disomy. Neverthe- less, results from 6• and the odds ratio in 6• strongly supported the hypothesis of trisomy (Table 2). Since the data from the three previously mentioned families were ho- mogeneous, and the pooled data perfectly fit the critical ratio, the final conclusion was that Sod-1 was located on chromosome 6.
As shown by Torres et al. (1993 a) the isozyme locus Tpi-1 shares the same linkage group with the 45s riboso- mal gene array (Rrn) and can be associated with the large metacentric chromosome (Chromosome 1) possessing the nucleotar-organizer region. As Pgd-2 (=Pgd-c) proved to be tightly linked to Tpi-1 (Torres et al. 1993b) it could be concluded that Pgd-c and Nag-1 are located on chromo- some 1. The same linkage was reported by Weeden and Wolko (1990) in pea where Nag-1 and Pgd-c where tightly linked. The subcellular compartmentation analysis per- formed in our study, and the highly conserved subcellular distribution among taxa (Weeden 1988), demonstrate the homology of both loci indicating that the linkage has also been conserved in Vicia.
Another example of a linkage conservation between the two species (Prx-1 and Acp-1) has been recently reported (Torres et al. 1993a). In faba bean these two linkage groups have been located on different chromosomes (the present study has shown that Prx-1 lies on chromosome 5) while in pea, the four loci share the same linkage group on chro- mosome 5. This could be interpreted as evidence for a chro- mosome rearrangement between faba bean and pea which occurred during evolution from a common ancestor. How- ever, further analysis of a family segregating for all the iso- zymes involved is needed to comfirm this hypothesis.
Altogether, five new isozyme loci have been assigned to a specific chromosome in V. faba and one new linkage group has been clearly established. The fact that most of the markers analyzed so far seem to segregate indepen- dently (except for Nag-1 and Pgd-c), even after having been located on the same chromosome (Pgd-p and Sod-l), is not at all surprising. Considering the enormous size of the V. faba genome, linkage between such a small number of characters is unlikely. The study of additional allozymic variants in wider faba-bean crosses, and the inclusion of RAPD and RFLP markers in our analysis, will allow us to identify new linkage groups that have so far escaped sta- tistical detection.
Acknowledgements We are indebted to Dr. N. F. Weeden for his valuable comments and suggestions which have helped in improv- ing the manuscript. Z. Satovic was supported by a fellowship from the C.LH.E.A.M. Instituto Agron6mico Mediterr~ineo de Zaragoza. This work was supported by the following projects: CICYT (AGF92- 1003), INIA (SC93-0078) and CAMAR (CT91-0117).
References
Bassiri A, Rouhani I (1977) Identification of broad-bean cultivars based on isoenzyme patterns. Euphytica 26:279-286
Cabrera A, Martfn A (1989) Analysis of genetic linkage in faba bean (Viciafaba L.). FABIS Newslett 24:3-5
Cabrera A, Cubero JI, Martfn A (1989) Genetic mapping using tri- somics in Viciafaba L. FABIS Newslett 23:5-7
Cardy B J, Stuber CW, Goodman MM (1980) Techniques for starch- gel electrophoresis of enzymes from maize (Zea mays L.). De- partment of statistics, Mimeo Series, North Carolina State Uni- versity, Raleigh
Carre S, Tasei JN, Mesquida J, Le Guen J (1991) Estimate of out- crossing rate between two lines of field beans (Viciafaba) in var- ious conditions with isozymic markers. In: 6th Int Syrup Pollina- tion, 27-31 August 1990. Research Centre for Insect Pollination and Beekeeping and International Society for Horticultural Sci- ence, Tilburg, Netherlands, pp 354-358
Clayton JW, Tretiak DN (1972) Amino-citrate buffers for pH con- trol in starch-gel electrophoresis. J Fish Res Board Can 29: 1169-I 172
Gates P, Boulter D (1979) The use of seed isoenzymes as an aid to the breeding of field beans (Vicia faba L.). New Phytol 83: 783-791
Gates R Bou!ter D (1980) The use of pollen isoenzymes as an aid to the breeding of field beans (Vicia faba L.). New Phytol 84: 501-504
Gottlieb LD (1973) Enzyme differentiation and phylogeny in Clark- ia franciscana, C. rubicunda and C. amoena. Evolution 27: 205-214
Hermsen JB (1970) Basic information for the use of primary trisom- ics in genetics and breeding research. Euphytica 19:125-140
International Union of Biochemistry Nomenclature Committee (IUB) (1984) Enzyme Nomenclature. Academic Press, New York
Kaser HR, Steiner AM (1983) Subspecific classification of Viciafa- ba L. by protein and isozyme patterns. FABIS Newslett 7:19-20
Ladizinsky G (1975) Seed-protein electrophoresis of the wild and cultivated species of section Faba of Vicia. Euphytica 24: 785-788
Lander ES, Botstein D (1989) Mapping Mendelian factors underly- ing quantitative traits using RFLP linkage groups. Genetics 121:185-199
Lander ES, Green P, Abrahamson J, Barlow A, Daly M J, Lincoln SE, Newburg L (1987) MAPMAKER; an interactive computer pro- gram for constructing genetic linkage maps of experimental and natural populations. Genomics 1 : 174

Mancini R, De Pace C, Scarascia GT, Delre V, Vitori D (1989) Iso- zyme gene markers in Vicia faba L. Theor Appl Genet 77:657-667
Martfn A, Barcel6 P (1984) The cytology and morphology of Vicia faba trisomics. In: Chapman GR Tarawai SA (eds) Systems for cytogenetic analysis in Vicia faba L. Martinus Nijhoff, The Hague, pp 63-76
Mather K (1957). The measurement of linkage in heredity, 3rd edn. Methuen, London
Morton NE (1956) Sequential tests for the detection of linkage. Am J Hum Genet 7:277-318
Muehlbauer FJ, Weeden NF, Hoffman DL (1989) Inheritance and linkage relationships of morphological and isozyme loci in len- til (Lens Miller). J Hered 80:298-303
Peat WE, Adham JY (1984) The use of isozyme genes as markers in the population genetics of Viciafaba L. In: Chapman GP, Taraw- ai SA (eds) Systems for eytogenetic analysis in Viciafaba L. Ad- vances in Agricultural Biotechnology vol II. M. Nijhoff, Dor- drecht, The Netherlands, pp 109-117
Polignano GB, Sonnante G (1992). Characterization of faba-bean populations by isoenzyme patterns of GOT and PGI. FABIS Newslett 31:12-16
Selander RK, Smith MH, Yang SY, Johnson WE, Gentry JB (1971) Biochemical polymorphism and systematics in the genus Per- omyscus. I. Variation in the old-field mouse (Peromyscus poIi- onotus). Univ Texas Publ 7103:49-90
Sj6din J (1971) Induced translocation in Vicia faba L. Herditas 68:1-34
Suiter K, Wendel J,Case J (1983) LINKAGE-l: a Pascal computer program for the detection and analysis of genetic linkage. J Hered 74:203-204
Suso M J, Moreno MT (1982) Genetic control of electrophoretic var- iants of glutamate oxalacetate transaminase (GOT) in Viciafaba L. FABIS Newslett 5:14
Suso MJ, Moreno MT (1995) Outcrossing rate in two faba-bean cul- tivars under dryland conditions in Spain. Can J Plant Sci 75 (in press)
Suso M J, Moreno MT (1986). Isoenzymatic polymorphism of super- oxidase dismutase (SOD) in Viciafaba and its systematic impli- cation. FABIS Newslett 16:3-5
789
Suso MJ, Moreno MT, Cubero JI (1993) New isozyme markers in Viciafaba: inheritance and linkage. Plant Breed 111:170-172
Torres AM, Weeden NF, Martfn A (1993 a) Linkage among Isozyme, RFLP and RAPD markers in Vicia faba. Theor Appl Genet 85:937-945
Torres AM, Mill~in T, Cabrera A, Cubero JI (1993b) Establecimien- to de nuevos grupos de ligamiento en Viciafaba. XXVIII. Jorna- das Luso-Espanholas de Gendtica, Universidade do Algarve, Fa- ro, Portugal, p 169
Van de Ven WTG, Waugh R, Duncan N, Ramsay G, Dow N, y Pow- el W (1991) Development of a genetic linkage map in Viciafa- ba using molecular and biochemical techniques. Asp Appl Biol 27:49-54
Weeden NF (1988) A suggestion for the nomenclature of isozyme loci. Pisum Newslett 20:44-45
Weeden NF, Gottlieb LD (1980) Isolation of cytoplasmic enzymes from pollen. Plant Physiol 66:400-403
Weeden NF, Marx GA (1987) Further genetic analysis and linkage relationships of isozyme loci in the pea. J Hered 78:153-159
Weeden NF, Wolko B (1990) Linkage map for the garden pea (Pi- sum sativum) based on molecular markers. In: O'Brien SJ (ed) Locus maps of complex genomes, genetic maps, 5th edn., book 6, Plants. Cold Spring Harbor Laboratory, Cold Spring Harbor, New York, pp 106-112
Wendel JF, Weeden NF (1990) Visualization and interpretation of plant isozymes. In: Soltis DE, Soltis PS (eds) Isozymes in plant biology. Dioscorides Press, Portland, Oregon, pp 5-45
Yamamoto K (1975) Estimation of genetic homogeneity by isozymes from interspecific hybrids of Vicia. I. Amylase isozyme patterns in the hybrid progenies between Vicia pilosa and Vicia macro- carpa. Jpn J Breed 25:60-64
Yamamoto K (1979) Estimation of genetic homogeneity by isozymes from interspecific hybrids of Vicia. II. Amylase isozyme patterns in the hybrid progenies between Vicia amphicarpa and V. mac- rocarpa. Jpn J Breed 29:59-65
Yamamoto K, Plitmann U (1980) Isozyme polymorphism in species of the genus Vicia (Leguminosae). Jpn J Genetics 55:151-164