Consistency of population genetics parameters estimated from isozyme and RAPDs dataset in species of...
8
458 American Journal of Botany 96(2): 458–465. 2009. In many developing countries, arid and semiarid ecosystems suffer from serious environmental degradation and biodiversity impoverishment. Climatic changes and human activities have resulted in deforestation, overgrazing, soil erosion, loss of fertility, and a predisposition to periodic drought and famine. One key genus of these threatened arid ecosystems is Prosopis (Leguminosae, Mimosoideae), with several species in many Latin American countries representing, both ecologically and economically ideal, multipurpose trees. Prosopis planting programs are currently based on pheno- typically selected, plus trees from natural stands (Akindele and Olutayo, 2007). However, phenotypic selection might yield nonsignificant results if the additive genetic component ( V A ) of phenotypic variance ( V P ) is low. Estimating the heritability ( h 2 = V A / V P ) of selectable traits is traditionally based on sib analysis or parent–offspring regression. These approaches are difficult to implement when generation intervals are long and genealogical information is absent, as is the case for forest tree natural populations. In addition, in Prosopis, controlled crosses are difficult to practice because of the small size and high num- ber of flowers per inflorescence. Consequently, little is known about the genetic components of quantitative variation of de- sirable traits in these species. For most purposes, selected plus trees of Prosopis were sampled from wild populations (Verga, 2000; Verga, et al., 2005) where pedigrees are frequently un- known. Usually plus trees must be healthy, mature, or old trees of “good shape” (straight and nonbranched trunk) and well de- veloped (Verga, et al., 2005). It is assumed that all plus trees are genetically unrelated but, in forest trees, deviations from this assumption lead to greater inbreeding and loss of genetic gain (Thomas et al., 2002). With information about the relationships between individu- als within a population, heritability may be estimated by com- paring the phenotypic variation within and between family groups. Traditionally, relationships are calculated from pedi- gree records (Jacquard, 1974; Cannings and Thompson, 1981). However, recent theoretical advancements based on DNA pro- filing techniques have been proposed to estimate relatedness ( r) among individuals without pedigree information (Morton et al., 1971; Lynch, 1988; Queller and Goodnight, 1989; Ritland, 1996a; Lynch and Ritland, 1999; Wang, 2002; Milligan, 2003). Thus, marker-inferred relatedness provides a valuable resource for further inference of genetic parameters, namely heritability of quantitative traits, in natural populations (Ritland, 1996a, b; Ritland and Ritland, 1996; Mousseau et al., 1998; Thomas et al., 2000, 2002; Klaper et al., 2001). These in situ inferences have proven their utility in simple natural layouts, where family structure was known (e.g., nonoverlapping generations, popula- tion consisting of nonrelated, full sib, and half-sib individuals) (Thomas et al., 2002; Wilson et al., 2003). 1 Manuscript received 28 February 2008; revision accepted 23 July 2008. This research was supported by funding from Agencia Nacional de Promociones Científicas y Tecnológicas (ANPCyT) BID 1728 OC/AR, PICT 32064 and PICT 00426, Universidad de Buenos Aires (EX 321 and EX 201), CONICET PIP 5122 to B.O.S., C.B. and J.C.V. Travel from Facultad de Ciencias Exactas y Naturales, Universidad de Buenos Aires to INRA-Orleans of B.O.S. and J.C.V. was supported by project II-0266-FA (GEMA, Genética de la Madera), coordinated by Ph. Rozenberg, and Fundación para Investigaciones Biológicas Aplicadas (FIBA). 6 Author for correspondence (e-mail: [email protected]) doi:10.3732/ajb.0800074 CONSISTENCY BETWEEN MARKER- AND GENEALOGY-BASED HERITABILITY ESTIMATES IN AN EXPERIMENTAL STAND OF PROSOPIS ALBA (LEGUMINOSAE) 1 Cecilia Bessega, 2,3,6 Beatriz O. Saidman, 2,3 María R. Darquier, 2 Mauricio Ewens, 4 Leopoldo Sánchez, 5 Phillipe Rozenberg, 5 and Juan C. Vilardi 2,3 2 Departamento de Ecología, Genética y Evolución, Facultad de Ciencias Exactas y Naturales, Universidad de Buenos Aires, Ciudad Universitaria, Pabellón 2, 1428, Buenos Aires, Argentina; 3 Consejo Nacional de Investigaciones Científicas y Técnicas (CONICET), Av. Rivadavia 1917, Buenos Aires, Argentina; 4 Estación Experimental Fernández, Departamento de Robles, Santiago del Estero, Argentina; and 5 Unité Amélioration Génétique et Physiologie Forestières, BP 20619, Ardon, 45166 Olivet Cedex, France Prosopis represents a valuable forest resource in arid and semiarid regions. Management of promising species requires informa- tion about genetic parameters, mainly the heritability ( h 2 ) of quantitative profitable traits. This parameter is traditionally estimated from progeny tests or half-sib analysis conducted in experimental stands. Such an approach estimates h 2 from the ratio of between- family/total phenotypic variance. These analyses are difficult to apply to natural populations of species with a long life cycle, overlapping generations, and a mixed mating system, without genealogical information. A promising alternative is the use of molecular marker information to infer relatedness between individuals and to estimate h 2 from the regression of phenotypic simi- larity on inferred relatedness. In the current study we compared h 2 of 13 quantitative traits estimated by these two methods in an experimental stand of P. alba, where genealogical information was available. We inferred pairwise relatedness by Ritland’s method using six microsatellite loci. Relatedness and heritability estimates from molecular information were highly correlated to the values obtained from genealogical data. Although Ritland’s method yields lower h 2 estimates and tends to overestimate genetic correlations between traits, this approach is useful to predict the expected relative gain of different quantitative traits under selec- tion without genealogical information. Key words: Fabaceae; heritability; Leguminosae; molecular markers; Prosopis alba; quantitative traits.
-
Upload
independent -
Category
Documents
-
view
6 -
download
0
Transcript of Consistency of population genetics parameters estimated from isozyme and RAPDs dataset in species of...
458
American Journal of Botany 96(2): 458–465. 2009.
In many developing countries, arid and semiarid ecosystems suffer from serious environmental degradation and biodiversity impoverishment. Climatic changes and human activities have resulted in deforestation, overgrazing, soil erosion, loss of fertility, and a predisposition to periodic drought and famine. One key genus of these threatened arid ecosystems is Prosopis (Leguminosae , Mimosoideae), with several species in many Latin American countries representing, both ecologically and economically ideal, multipurpose trees.
Prosopis planting programs are currently based on pheno-typically selected, plus trees from natural stands ( Akindele and Olutayo, 2007 ). However, phenotypic selection might yield nonsignifi cant results if the additive genetic component ( V A ) of phenotypic variance ( V P ) is low. Estimating the heritability ( h 2 = V A / V P ) of selectable traits is traditionally based on sib analysis or parent – offspring regression. These approaches are diffi cult to implement when generation intervals are long and genealogical information is absent, as is the case for forest tree natural populations. In addition, in Prosopis , controlled crosses
are diffi cult to practice because of the small size and high num-ber of fl owers per infl orescence. Consequently, little is known about the genetic components of quantitative variation of de-sirable traits in these species. For most purposes, selected plus trees of Prosopis were sampled from wild populations ( Verga, 2000 ; Verga, et al., 2005 ) where pedigrees are frequently un-known. Usually plus trees must be healthy, mature, or old trees of “ good shape ” (straight and nonbranched trunk) and well de-veloped ( Verga, et al., 2005 ). It is assumed that all plus trees are genetically unrelated but, in forest trees, deviations from this assumption lead to greater inbreeding and loss of genetic gain ( Thomas et al., 2002 ).
With information about the relationships between individu-als within a population, heritability may be estimated by com-paring the phenotypic variation within and between family groups. Traditionally, relationships are calculated from pedi-gree records ( Jacquard, 1974 ; Cannings and Thompson, 1981 ). However, recent theoretical advancements based on DNA pro-fi ling techniques have been proposed to estimate relatedness ( r ) among individuals without pedigree information ( Morton et al., 1971 ; Lynch, 1988 ; Queller and Goodnight, 1989 ; Ritland, 1996a ; Lynch and Ritland, 1999 ; Wang, 2002 ; Milligan, 2003 ). Thus, marker-inferred relatedness provides a valuable resource for further inference of genetic parameters, namely heritability of quantitative traits, in natural populations ( Ritland, 1996a, b ; Ritland and Ritland, 1996 ; Mousseau et al., 1998 ; Thomas et al., 2000, 2002 ; Klaper et al., 2001 ). These in situ inferences have proven their utility in simple natural layouts, where family structure was known (e.g., nonoverlapping generations, popula-tion consisting of nonrelated, full sib, and half-sib individuals) ( Thomas et al., 2002 ; Wilson et al., 2003 ).
1 Manuscript received 28 February 2008; revision accepted 23 July 2008. This research was supported by funding from Agencia Nacional de
Promociones Cient í fi cas y Tecnol ó gicas (ANPCyT) BID 1728 OC/AR, PICT 32064 and PICT 00426, Universidad de Buenos Aires (EX 321 and EX 201), CONICET PIP 5122 to B.O.S., C.B. and J.C.V. Travel from Facultad de Ciencias Exactas y Naturales, Universidad de Buenos Aires to INRA-Orleans of B.O.S. and J.C.V. was supported by project II-0266-FA (GEMA, Gen é tica de la Madera), coordinated by Ph. Rozenberg, and Fundaci ó n para Investigaciones Biol ó gicas Aplicadas (FIBA).
6 Author for correspondence (e-mail: [email protected])
doi:10.3732/ajb.0800074
CONSISTENCY BETWEEN MARKER- AND GENEALOGY-BASED HERITABILITY ESTIMATES IN AN EXPERIMENTAL STAND OF
PROSOPIS ALBA (LEGUMINOSAE) 1
Cecilia Bessega, 2,3,6 Beatriz O. Saidman, 2,3 Mar í a R. Darquier , 2 Mauricio Ewens , 4 Leopoldo S á nchez , 5 Phillipe Rozenberg , 5 and Juan C. Vilardi 2,3
2 Departamento de Ecolog í a, Gen é tica y Evoluci ó n, Facultad de Ciencias Exactas y Naturales, Universidad de Buenos Aires, Ciudad Universitaria, Pabell ó n 2, 1428, Buenos Aires, Argentina; 3 Consejo Nacional de Investigaciones Cient í fi cas y T é cnicas
(CONICET), Av. Rivadavia 1917, Buenos Aires, Argentina ; 4 Estaci ó n Experimental Fern á ndez, Departamento de Robles, Santiago del Estero, Argentina; and 5 Unit é Am é lioration G é n é tique et Physiologie Foresti è res, BP 20619, Ardon, 45166 Olivet
Cedex, France
Prosopis represents a valuable forest resource in arid and semiarid regions. Management of promising species requires informa-tion about genetic parameters, mainly the heritability ( h 2 ) of quantitative profi table traits. This parameter is traditionally estimated from progeny tests or half-sib analysis conducted in experimental stands. Such an approach estimates h 2 from the ratio of between-family/total phenotypic variance. These analyses are diffi cult to apply to natural populations of species with a long life cycle, overlapping generations, and a mixed mating system, without genealogical information. A promising alternative is the use of molecular marker information to infer relatedness between individuals and to estimate h 2 from the regression of phenotypic simi-larity on inferred relatedness. In the current study we compared h 2 of 13 quantitative traits estimated by these two methods in an experimental stand of P. alba , where genealogical information was available. We inferred pairwise relatedness by Ritland ’ s method using six microsatellite loci. Relatedness and heritability estimates from molecular information were highly correlated to the values obtained from genealogical data. Although Ritland ’ s method yields lower h 2 estimates and tends to overestimate genetic correlations between traits, this approach is useful to predict the expected relative gain of different quantitative traits under selec-tion without genealogical information.
Key words: Fabaceae; heritability; Leguminosae; molecular markers; Prosopis alba ; quantitative traits.
459Bessega et. al. — Marker-based heritability estimates in PROSOPIS ALBA February 2009]
length) of the upper leafl et ( Fig. 1B ). These morphology traits were chosen because, although they vary substantially within and among populations, they are important for species identifi cation ( Burkart, 1976 ; Pasiecznik et al., 2004).
In each individual, nine repeats of PEL, NLP, PIL, SPL, and NPI were ob-tained involving three different canopy regions. Ninety repeats were obtained of LEL, LEL/LEW, LEF, LEX, LEX/LEA, involving 10 leafl ets from nine pin-nae sampled from three different regions of the canopy. All leafl et measures were obtained with the software HOJA1.1 (available from A. Verga, [email protected]).
Microsatellite data — Six microsatellites have been developed for Prosopis chilensis , and cross-species amplifi cation has been reported (Mottuora et al., 2005). We characterized the genotypes of our sample of 142 individuals using all six microsatellites (Mo05, Mo07; Mo08, Mo09, Mo13 and Mo16).
Leaves were collected from each tree in March 2006 and were silica-gel preserved. DNA was extracted using DNA easy plant mini kit (Qiagen, Valen-cia, California, USA), and samples were placed in a – 20 ° freezer until analysis. The PCR amplifi cations were carried out in a 50- μ L reaction volume containing 10 – 30 ng DNA, 0.6 uM each primer, 0.2 mM dNTPs, 0.3 U Taq DNA poly-merase (Invitrogen, Carlsbad, California, USA), and 1.5 mM MgCl 2 . A PRO-GENE Techne thermalcycler (Techne Cambridge Ltd., Duxford Cambridge, UK.) was used for amplifi cations, where the cycling profi le was initial denatur-ation at 94 ° C for 5 min followed by 30 cycles at 94 ° for 45 s denaturation, primer-specifi c annealing temperature (56 ° – 59 ° ) for 45 s and at 72 ° C for 45 s extension; and a fi nal extension step at 72 ° for 10 min. Seven microliters of PCR product were separated by electrophoresis in a Model S2 apparatus (Gibco BRL Sequencing System, Life Technologies (Gaithersburg, Maryland, USA)) through 6% (w/v) polyacrylamide gel containing 5 M urea in 1 × TBE buffer (89 mM Tris, 89 mM boric acid, 2 mM EDTA, pH 8). A 10-bp DNA Ladder (Invit-rogen) size marker was included twice in each electrophoresis run. Gels were stained with silver nitrate ( Bassam et al., 1991 ).
Genetic variabilty estimates — Individual patterns of microsatelites were converted into population allelic frequencies. As null alleles were suspected in some loci, allelic frequency estimation and comparison between observed and Hardy – Weinberg expected heterozygote frequencies were computed by the maximum likelihood method described in Kalinowski and Taper (2006) . The Hardy – Weinberg test for heterozygote defi ciency was performed by Monte Carlo randomization as described by Guo and Thompson (1992) and the U test statistic described by Rousset and Raymond (1995) with the program ML-Null-Freq (available at website http://www.montana.edu/kalinowski). From esti-mated allelic frequencies, variability was quantifi ed by the unbiased expected heterozygosity ( H ) ( Nei, 1978 ).
In certain conditions, marker-based inferences may be the only method available to obtain results within reasonable time and effort, especially when dealing with forest tree species characterized by costly experimental layouts and lengthy matu-rations. However, these marker-based inference methodologies have several shortcomings: (1) the estimation of relationship is indirect; (2) coeffi cients of relatedness ( r ) do not provide enough information to fully reconstruct a genealogy (i.e., par-ent – offspring and full sib relationships are mixed up); (3) preci-sion and accuracy of different relatedness estimators are affected by allele frequencies and departures from linkage equilibrium; (4) variance of r tends to be low in naturally outbreeding tree species; and (5) variation of r must be uncorrelated with varia-tion at quantitative trait loci (QTL) ( Ritland, 1996b ).
The availability of some experimental stands of Prosopis species with a family layout gives the opportunity to test the quality of the inference provided by marker-based methodol-ogy that might be used in future estimations of genetic pa-rameters in natural populations without any genealogical information.
The objectives of the present paper were to compare the esti-mates of relatedness inferred using molecular markers with those based on family records and the estimates of heritabilities in-ferred from molecular markers with those obtained from classical quantitative methods based on pedigreed data. To properly test the suitability of the marker-based method to estimate heritabil-ity, we chose 13 traits involving leaf morphology, spine length, and tree biomass with the expectation of covering a large range of heritability values. The validity of using genetic markers in-stead of genealogy information for heritability estimations in natural stands where pedigrees are unknown is discussed.
MATERIALS AND METHODS
Study population — Prosopis alba is an important nitrogen-fi xing tree adapted to the semiarid regions of northwestern Argentina. The population ana-lyzed was a progeny trial established in 1990, 10 km from Santiago del Estero, Argentina (27 ° 45 ′ S; 64 ° 15 ′ W) ( Felker et al., 2001 ). This trial was established from seeds collected from 57 individual trees (half sib families) from eight northwestern Argentine sites (A ñ atuya, Castelli, Gato Colorado, Ibarreta, Pinto, Quimili, Rio Dulce Irrigation district, and Sumampa). The experimental design was a randomized complete block comprising 57 families, seven replicates, and four trees per replicate (with a 4 × 4 m spacing). The total planting material was 1596 individual trees, of which 1289 still survived in 1999. For the last 10 years, this stand was affected by natural conditions without any silvicultural care. For this study, we sampled 142 individuals belonging to 32 different fami-lies that had kept their original identifi cation label. The number of trees per family varied between 3 and 12.
Morphometric data — Three biomass traits and 10 leaf morphology traits were analyzed. Height (HEI) and trunk diameter (TDI) (basal diameter at 20 cm above the ground) were scored in the fi eld. Biomass (BMS) of each tree was estimated using the regression equation BMS = log wt = 2.7027 ⋅ log TDI − 1.1085 (Felker et al., 1989), where log wt is the logarithm of fresh weight (kg) and log TDI is the logarithm of TDI (cm).
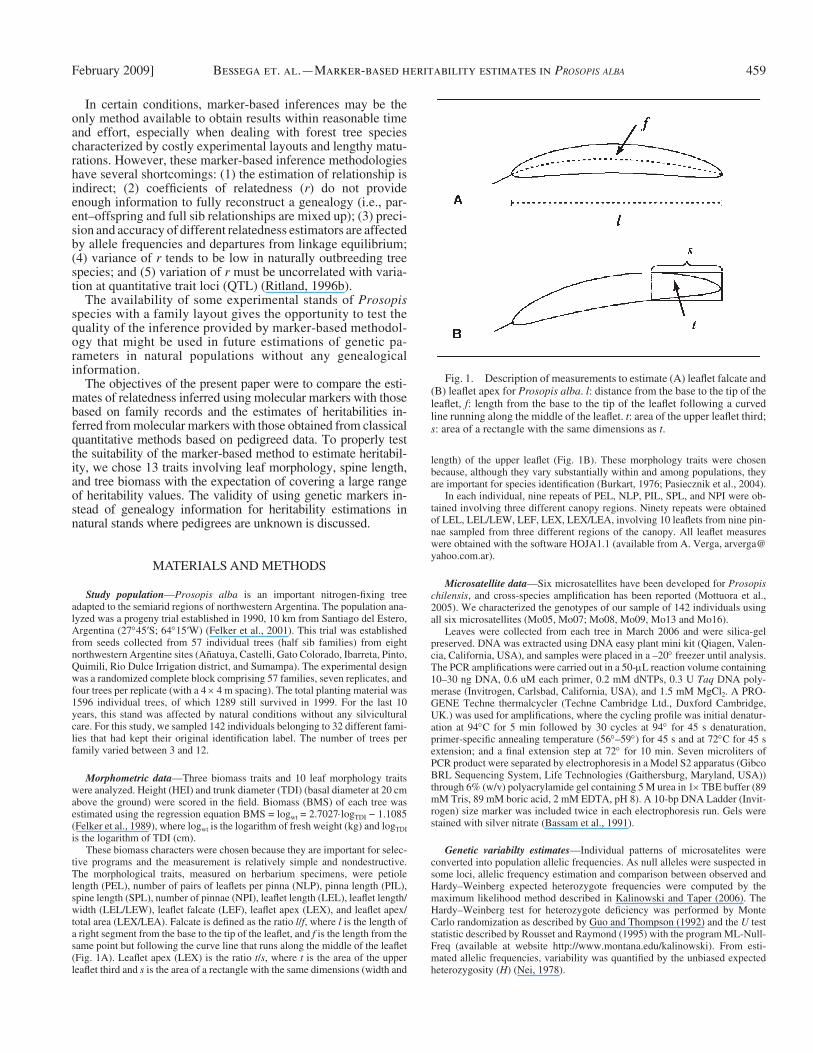
These biomass characters were chosen because they are important for selec-tive programs and the measurement is relatively simple and nondestructive. The morphological traits, measured on herbarium specimens, were petiole length (PEL), number of pairs of leafl ets per pinna (NLP), pinna length (PIL), spine length (SPL), number of pinnae (NPI), leafl et length (LEL), leafl et length/width (LEL/LEW), leafl et falcate (LEF), leafl et apex (LEX), and leafl et apex/total area (LEX/LEA). Falcate is defi ned as the ratio l / f , where l is the length of a right segment from the base to the tip of the leafl et, and f is the length from the same point but following the curve line that runs along the middle of the leafl et ( Fig. 1A ). Leafl et apex (LEX) is the ratio t / s , where t is the area of the upper leafl et third and s is the area of a rectangle with the same dimensions (width and
Fig. 1. Description of measurements to estimate (A) leafl et falcate and (B) leafl et apex for Prosopis alba . l : distance from the base to the tip of the leafl et, f : length from the base to the tip of the leafl et following a curved line running along the middle of the leafl et. t : area of the upper leafl et third; s : area of a rectangle with the same dimensions as t .

460 American Journal of Botany [Vol. 96
RESULTS
Microsatellites — The loci analyzed showed between three to seven active alleles. In four of six loci, individuals without any band were observed thus indicating the presence of null alleles. Furthermore, signifi cant heterozygote defi ciency was observed, which could also be attributable to the presence of null alleles. Allelic frequencies were estimated taking into account possible bias from the presence of null alleles ( Table 1 ). Expected heterozygosity varied among loci between 0.20 and 0.76. F IS estimates were positive and highly signifi cant in four of the six loci analyzed.
Of 15 pairwise combinations of loci, four showed signifi cant or highly signifi cant gametic disequilibrium ( Table 2 ), two of them were matrixwide signifi cant after applying Bonferroni ’ s correction.
Relatedness estimates — Two pairwise relatedness matrices were obtained. The fi rst one represented genealogical informa-tion, and its elements had three alternative values: r = 1 for in-dividuals with themselves, r = 0.25 for different individuals of the same half sib family, and r = 0 for individuals from different families. The second matrix was obtained by Ritland ’ s method from molecular marker data.
The correlation between these matrices ( r = 0.17, excluding the relatedness of each individual with itself, or r = 0.56, in-cluding the diagonal with these data) was highly signifi cant ac-cording to Mantel test ( P = 0, based on 10 000 permutations).
Quantitative traits — All genotyped individuals were mea-sured for all quantitative traits ( Table 3 ). In almost all cases the within-family component of variance was higher than the be-tween-family component. The differences among families eval-uated through the Fisher ( F ) statistics as F = MS b /MS w (between mean square on within mean square) were signifi cant or highly signifi cant in all cases.
Assuming that families were composed of half sibs, herita-bility estimates were obtained for each trait by the conventional quantitative approach ( Table 4 , col. 1). Heritability estimates were signifi cant or highly signifi cant for all traits. The confi -dence limits are rather symmetrical ( Table 4 ); the standard er-rors of estimated h 2 (calculated according to Lynch and Walsh, 1998 , p. 568) were similar for all traits (0.35 ± 0.01) and were not correlated ( r = − 0.27, P = 0.38) with h 2 values. In several cases, h 2 was higher than 1, which could be attributable to ac-tual within-family relatedness higher than expected, with the presence in the cohort of some full sibs and selfs and/or to geo-graphical association within fraternal groups.
For spines and leaf traits, where we had several measure-ments for each individual, we estimated the components of phe-notypic variance between families, between individuals within families, between different canopy regions within individuals, and the residual. The percentage of variance between families and between individuals within families was similar, averaging ≈ 20% each of the total variance. The highest component was the residual ( ≈ 50%), while the minimum variance component corresponded to different canopy regions/individuals ( ≈ 10%).
Heritabilities estimated by the regression method from pedi-gree-based relatedness yielded results consistent with the ANOVA-based estimates ( Table 4 ), although the former esti-mates were smaller. According to the permutation test for these regression estimates, heritability was nonsignifi cant for SPL, signifi cant for HEI and BMS, and highly signifi cant for all the
Heritability and relatedness — Heritabilities were estimated by three methods. Method 1 was a conventional analysis of variance (ANOVA), assuming that the sampled individuals represent different groups of half sib families. In this case, we used an unbalanced generalized linear model (GLM), y ij = µ + f i + e j , where y ij is an observation of the trait for an individual tree of family i in the environment j , μ is the overall mean, f i represents random family effects, and e j is the random residual error. Block effects could not be included because in the surviving stand several families were present in single blocks. Variance components were esti-mated by restricted maximum likelihood (REML). For a half sib design, herita-bilities were estimated as h 2 = 4 σ b
2 ÷ ( σ b2
+ σ 2w ), where σ b
2 denotes the estimated variance between families and σ
w2 is the within-family variance component. Heri-
tabilities were considered signifi cant whenever the ANOVA yielded signifi cant differences among families. Confi dence intervals for h 2 estimations were ob-tained following Lynch and Walsh (1998 , p. 563).
Methods 2 and 3 were based on a linear model, where narrow-sense herita-bility ( h 2 ) is estimated by regressing pairwise phenotypic similarity ( Z ij ) on pairwise relatedness ( r ij ) ( Ritland, 1996a ). According to this model,
hZ r
rij ij
ij
2
2=
cov( , )
var( )Act ,
where Act var( r ij ) is the actual variance of relatedness, as in Ritland (2000) , and phenotypic correlation ( Z ij ) between individuals i and j given by:
ZY U Y U
Viji j=− −( )( ) ,
where Y gives the individual trait value, and U and V are, respectively, the cor-responding mean and variance of the sample.
In method 2, within-family relatedness ( r ij ) was assumed to be 0.25, as ex-pected from a cohort of half sib siblings, and between-family relatedness zero as expected from unrelated families. In method 3, however, r ij estimates were based on Ritland ’ s (1996a) estimation method. For individuals i and j with genotypes A r A s and A t A u , respectively, r ij was estimated as
[(δ δ ) / ] [(δ δ ) / ] 1ˆ
4( 1)rt ru r st su s
ij
p pr
n
+ + + −=−
,
where n is the number of alleles, δ rt is 0 if A r ≠ A t or δ rt is 1 if A r = A t , p r is the fre-quency of the allele A r in the population as estimated from the sample and so on.
For multiple locus estimates, r ij corresponds to the sum of locus-specifi c estimates, each weighted by ( n − 1) ( Ritland and Travis, 2004 ).
Pairwise Ritland relatedness estimates were computed using HERINAT, a Visual Fortran program designed ad hoc (available from author, [email protected]).
The signifi cance of heritability estimates based on the regression models 2 and 3 were obtained by a Mantel permutation test between the matrix of pheno-typic similarities ( Z ij ) and the matrix of estimated relatedness ( r ij ). Confi dence intervals for heritability estimates obtained from molecular marker inferred re-latedness were obtained empirically from 100 bootstrapped pseudoreplicates of the original data over individuals. Standard errors of h 2 were estimated using eq. 3 in Ritland (1996b) .
The reliability of the regression models was tested by Spearman rank cor-relation and regression analysis of heritability estimates by methods 2 and 3 on the estimates based on the unbalanced ANOVA of method 1.
Genetic correlations between traits were estimated by two methods. The fi rst was based on the correlation between trait family averages as suggested in Lynch and Walsh (1998) . The second one is based on a linear model for the covariance between traits ( Ritland, 1996b ) in which
rAA
A A12
12
1 2
=νν ν
,
where ν A12 is the additive covariance between the two traits and ν A1 and ν A2 the corresponding genetic variances. The sign of the genetic correlation obtained from this method should be the same as the genetic covariance ( ν A12 ), since the denominator is positive by defi nition. In cases where heritability estimates were negative, the denominator cannot be solved and the genetic correlation was con-sidered as unavailable information.
Analysis of variance, regressions and Mantel tests were conducted using the packages nlme , lmer , and ape of program R (R Development Core Team, 2007).

461Bessega et. al. — Marker-based heritability estimates in PROSOPIS ALBA February 2009]
Genetic correlations — Of 78 pairwise estimates of genetic correlations obtained from family trait averages, 26 were sig-nifi cant or highly signifi cant ( Table 5 ). After a sequential Bon-ferroni ’ s test, six of them were matrixwide signifi cant and eight were matrixwide highly signifi cant. More than half of the cor-relations between leaf traits (19/36) were signifi cant or highly signifi cant. The linear model based on estimated relatedness al-lowed estimation of the genetic correlations for 36 trait pairs, whereas the remaining 42 cases involved traits with negative heritability estimates. The estimates of genetic correlations ob-tained from this method are in general higher (in absolute val-ues) than those obtained from the former (Student ’ s test for paired samples: t = 4.91; P = 2 × 10 − 5 ), and in many cases (13/36) Ritland ’ s estimates were outside the range 1 to − 1.
DISCUSSION
Different molecular marker-based methods for quantitative genetic analyses have been developed to provide a means for examining genetic variation in natural populations ( Lynch, 1988 ; Queller and Goodnight, 1989 ; Ritland, 1996a ; Mousseau et al ., 1998 ; Lynch and Ritland, 1999 ; Wang, 2002 ; Milligan, 2003 ; Hardy, 2003 ; Garant and Kuruuk , 2005 ; Ritland, 2005 ). A relatively simple approximation is based on the estimation of pairwise relatedness using genetic markers ( Lynch, 1988 ; Queller and Goodnight, 1989 ; Li et al., 1993 ; Ritland, 1996a ; Lynch and Ritland, 1999 ; Wang, 2002 ; Hardy, 2003 ; Milligan, 2003 ). In long-lived plants with mixed mating systems such as forest tree species, where pedigrees are complex, pairwise-based analyses have the advantage over other approaches in that they can incorporate variable levels of relatedness ( Ritland and Ritland, 1996 ; Andrew et al., 2005 ).
Prosopis alba , a promising forest species native to central Ar-gentina, is a valuable natural resource in arid and semiarid regions. The success of selection programs to improve quantitative traits of economic importance depends on the extent of additive genetic variance. However, information about the genetic basis of quanti-tative variation in natural populations of species of Prosopis is still scarce ( Cony, 1996 ; Felker et al., 2001 ). Previous studies of mat-ing system and genetic structure have shown a mixed mating sys-tem in a natural population of P. alba , with about 28% of selfi ng ( Bessega et al., 2000 ). Accordingly, most natural populations of P. alba have signifi cant homozygote excess ( Ferreyra et al., 2007 ).
other characters. As with the ANOVA approach, this method also yielded h 2 estimates higher than unity.
Marker-based relatedness yielded estimates of h 2 that were lower than the values obtained from any of the two former methods ( Table 4 ). Only six marker-based estimates were sig-nifi cant or highly signifi cant, and three were of borderline sig-nifi cance, according to the permutation test. The confi dence intervals obtained from bootstrap resampling were rather nar-row and consistent with the other estimation methods, while several h 2 estimates were higher than 1. Standard error was 0.29 for all traits because this depends only on the variance of relat-edness and sampling size. This value is slightly lower than those estimated from ANOVA as indicated.
In spite of the differences in h 2 estimates among the three methods, there was consistency in the ranking of estimates ob-tained from the different methods ( Fig. 2 ). To test this trend, we performed Spearman rank correlation tests that showed a highly signifi cant correlation of marker based h 2 estimates with both ANOVA (rho = 0.615, P = 0.028) and regression (rho = 0.857, P = 0.0002) methods. A linear regression analysis comparing regression and ANOVA h 2 estimates ( Fig. 2 ) indicated that when relatedness was assigned from family records, 88% of the variance could be explained by the regression ( P = 0), and the slope was b = 0.91 (CI = 0.69 – 1.13). When relatedness was estimated from molecular markers, 55% of the variance was explained by the regression ( P = 0.004), with slope b = 0.68 (CI = 0.28 – 1.10). Although the accuracy of marker-based h 2 estimate is lower than that obtained from pedigree-based relatedness, the confi dence intervals overlap, and in both cases they include the expected slope value of b =1.
Table 1. Allele frequencies, range of allele size (bp), number of individuals analyzed ( N ), expected ( H e ) and observed ( H o ) heterozygosities, and fi xation index ( F IS ) for Prosopis alba .
Alleles
Locus
Mo 08 Mo 13 Mo 16 Mo 09 Mo 07 Mo 05
Null — — 0.047 0.029 0.165 0.1121 0.047 0.270 0.120 0.027 0.140 0.0232 0.178 0.102 0.402 0.055 0.061 0.8183 0.395 0.062 0.196 0.890 0.007 0.0074 0.351 0.551 0.094 — 0.007 0.0405 0.022 0.015 0.112 — 0.500 — 6 0.007 — 0.029 — 0.018 — 7 — — — — 0.101 — Range 200 – 220 210 – 240 140 – 170 200 – 250 180 – 210 210 – 220 N 138 137 138 137 136 135 He 0.686 0.609 0.761 0.203 0.689 0.316 Ho 0.384 0.620 0.710 0.153 0.390 0.111 F IS 0.440*** − 0.019 0.067 0.246** 0.434*** 0.649***
Notes: ** P < 0.01; *** P < 10 − 6
Table 2. Probability of gametic disequilibrium between the loci analyzed for Prosopis alba .
Locus Mo 08 Mo 13 Mo 16 Mo 09 Mo 07 Mo 05
Mo 08 — Mo 13 0.385 — Mo 16 0.122 0.144 — Mo 09 0.018 0.003 a 0.589 — Mo 07 0.010 0.093 0.003 a 0.195 — Mo 05 0.474 0.066 0.115 0.099 0.864 —
Note: Boldface denotes signifi cant disequilibrium at individual level. a Matrixwide signifi cant applying Bonferroni ’ s correction.

462 American Journal of Botany [Vol. 96
and genetic variances. In fact, for marker-based estimations, genetic correlation r A12 (see Materials and Methods) is defi ned as the ratio between genetic covariance and the geometric mean between genetic variances of each trait. In this expression, the denominator (square root of ν A1 × ν A2 ) is closer to the smallest value between ν A1 and ν A2. Consequently, the smaller the de-nominator, the higher the r A12 estimated.
This study should be considered as a preliminary approach given the fact that some assumptions inherent to this marker-based method might not have been entirely fulfi lled. First, there was a homozygote excess for four of the six microsatellite loci under study. This could be partially explained by the presence of null alleles in the corresponding loci. However, this hypoth-esis cannot be fully tested with this pedigree, given that pollina-tors are unknown. Furthermore, gametic phase equilibrium could not be assumed for all the loci combinations. Finally, the absence of genetic mapping resources for this pedigree and the set of traits under study did not allow inferences to be made on the eventual linkage between markers and quantitative traits.
According to Ritland (1996b) , 2 – 10 loci, each with 10 al-leles, would be needed for adequate estimation of pairwise re-latedness. In our case, the number of alleles fell below the desired threshold of 10, with 3 – 7 alleles per locus (if null alleles are not considered). Concerning the number of loci, though still insuffi cient, it was within previous recommendations. Undoubt-edly, a larger number of highly polymorphic markers would be
The suitability of marker-based method to estimate heritabil-ity in a forest species has been tested for wood density in radiata pine by Kumar and Richardson (2005) . Our paper evaluates this methodology and compares the results of heritability estimates by Ritland ’ s (1996b) methods using many quantitative traits in a natural provenance of P. alba . This study involves the only available experimental stand with known pedigree and poten-tial source of breeding material of P. alba . The most relevant result of this study was the general consistency between classi-cal estimates of heritability and those obtained from molecular measures. All signifi cant estimates obtained from the latter method, corresponding to leaf morphology traits, also yielded signifi cant estimates under the other two alternative classical methods. No negative estimates under Ritland ’ s method were found to be signifi cant. However, biomass traits like height and diameter yielded nonsignifi cant estimates under the new method. Although classical methods revealed signifi cant ge-netic variability for these traits, they are known to have low to intermediate heritabilities for an ample range of forest species ( Rweyongeza et al., 2005 ; Zas and Fern á ndez-L ó pez, 2005).
The estimates of genetic correlations between traits obtained from family information and marker-inferred relatedness indi-cated that the second method produces an upward bias, with higher estimates of correlations wherever they can be estimated. The possible cause of this overestimation of genetic correla-tions may be attributed to the underestimation of heritabilities
Table 3. Basic statistics, components of phenotypic variance, and Fisher ( F ) test of signifi cance of between family differences for the quantitative traits analyzed.
Trait (unit) Acronym Mean (SD)
Variance component
F Between families Within families
Height (m) HEI 5.00 (0.09) 0.17 1.00 1.71*Basal Diameter (cm) TDI 19.17 (0.60) 97.02 410.60 1.98**Biomass (Kg) BMS 310.52 (41.03) 1.6 10 7 1 10 8 1.65*Petiole length (mm) PEL 26.71 (0.71) 30.33 42.10 4.17***Pair of leafl ets/Pinna NLP 35.03 (0.45) 7.34 21.47 2.41***Pinna length (mm) PIL 95.86 (1.57) 160.72 204.95 4.19***Spine length (mm) SPL 2.77 (0.42) 7.17 18.30 2.68***Number of pinnae NPI 2.41 (0.05) 0.16 0.18 4.47***Leafl et length (mm) LEL 7.97 (0.18) 0.02 0.02 5.10***Leafl et length/width LEL/LEW 4.99 (0.07) 0.50 0.23 10.02***Leafl et falcate LEF 0.934 (0.003) 4 10 − 4 7 10 − 4 4.02***Leafl et apex LEX 0.960 (0.005) 1.5 10 − 3 1.9 10 − 3 4.20***Leafl et apex/total area LEX/LEA 0.209 (0.002) 1 10 − 4 2 10 − 4 2.96***
Notes: F = MSb/MSw, where MSb = between-family mean square, MSw = within-family mean square;* 0.01 ≤ P < 0.05; ** 0.001 ≤ P < 0.01; *** P < 0.001
Table 4. Genealogy- and marker-based heritability estimates for Prosopis alba . Confi dence intervals (95%) are indicated in parentheses.
Trait ANOVA Regression Molecular markers
Height (m) 0.57 (0.36 – 0.81) * 0.42* 0.15 (0.08 – 0.23)Basal Diameter (cm) 0.76 (0.52 – 1.00)** 0.65** − 0.29 ( − 0.32 – − 0.20)Biomass (Kg) 0.5 (0.32 – 0.77) * 0.35* − 0.22 ( − 0.24 – − 0.17)Petiole length (mm) 1.76 (1.45 – 1.95)** 1.29** 0.34 (0.19 – 0.43)Pair of leafl ets/Pinna 1.02 (0.76 – 1.25)** 0.76** 0.61 (0.50 – 0.69) + Pinna length (mm) 1.76 (1.46 – 1.96)** 1.33** 0.81 (0.71 – 0.91)**Spine length (cm) 1.13 (0.89 – 1.39)** 1.01 0.42 (0.38 – 0.53) + Number of Pinnae 1.84 (1.54 – 2.04)** 1.47** 1.36 (1.29 – 1.44)**Leafl et length (cm) 1.97 (1.71 – 2.20) ** 1.71** 0.35 (0.26 – 0.57) + Leafl et length/width 2.74 (2.51 – 2.89)** 2.58** 1.69 (1.59 – 1.92)**Leafl et falcate 1.58 (1.41 – 1.91)** 1.79** 1.06 (1.02 – 1.16)**Leafl et apex 1.79 (1.46 – 1.96)** 1.24** 0.48 (0.40 – 0.63)*Leafl et apex/total area 1.23 (1.01 – 1.52)** 1.33** 1.03 (0.91 – 1.14)**
Notes: + 0.05 ≤ P < 0.10; * 0.01 ≤ P < 0.05; ** P < 0.01. Methods for signifi cance and confi dence interval estimation described in the text.

463Bessega et. al. — Marker-based heritability estimates in PROSOPIS ALBA February 2009]
underestimation (rather than overestimation) of h 2 because sim-ilarities between related individuals alleged to different fami-lies would be attributed to nongenetic causes. In the case of marker-inferred relatedness, none of these issues would affect the estimates of h 2 because no prior assumptions of relatedness were made.
There might be a third cause for an upward bias that would affect both marker-based and pedigree-based h 2 estimates: the occurrence of geographical association within fraternal groups. When the experimental orchard was planted, a randomized com-plete block design had been applied ( Felker et al., 2001 ). Each block comprised four contributions per family, planted together with 4 × 4 m spacing, thus sharing a common environment. Dif-ferences in environmental factors between family sets could have been somehow exacerbated in the current experimental layout because several blocks and families were lost, with re-sulting gaps increasing environmental differences among the surviving family sets. Because of that, low but highly signifi cant correlation occurred between relatedness and geographical dis-tances demonstrated by Mantel tests ( r = − 0.10, P = 0 and r = − 0.08, P = 0.001, respectively, for genealogical or marker in-ferred relatedness, with 1000 permutations). Therefore, if rela-tives shared environments, some of the phenotypic resemblance between them could have been caused by common growing conditions. It should be noted, however, that in natural condi-tions this situation would be rare for outbreeding species, and relatives may not be found in such compact clusters. In that sense, the microsatellite analysis needed for marker-based infer-ences could serve as well to visualize the spatial distribution of relatives in the population under study and, therefore, indicate
desirable, making this study a fi rst attempt to validate this in situ inference methodology.
As a general feature, heritability estimates obtained from marker-based estimated relatedness were lower than those ob-tained form genealogical data. Ritland (1996b) has already pointed out the risk of underestimation due to larger than ex-pected sampling variation of molecular relationships as the re-gression variable. The author corrects this bias, at least partially, by using the actual variance of relatedness, which gives less-biased estimates of the population variance for relatedness. In our case, the actual variance of relatedness estimated from mo-lecular markers was similar to the sampling variance of related-ness based on family information (0.002), but there might be other reasons behind the difference between marker-based and pedigree-based h 2 estimates.
Biased heritability estimates may be attributed to sampling sizes. Small number of families and individuals may result in increased estimate errors. However, it is not expected that this effect will produce the same bias for all analyzed traits as seems to be the case for ANOVA estimates, which in most cases pro-duced h 2 estimates higher than one. Moreover, confi dence inter-vals and standard errors for h 2 are acceptable and are quite similar for ANOVA and marker-based estimates.
A second factor is connected to the assumed relatedness be-tween family members. As crosses are not controlled, pedigree-based h 2 estimates may be upwardly biased as a consequence of the presence of full sibs and selfs within fraternal groups. As stated, selfi ng was already detected at least in one natural popu-lation of this species ( Bessega et al ., 2000 ) and is as high as 28%. Moreover, in the present paper, we detected homozygote excess (positive and signifi cant F IS ) in four of six microsatellite loci, which may be at least partially explained by inbreeding. An additional error source in the traditional approach is the as-sumption that individuals from different families are unrelated (i.e., r = 0). However, the consequence would have been an
Fig. 2. Comparison of heritability estimates for Prosopis alba ob-tained by the regression method with the classical ANOVA method. Open squares correspond to estimates based on pairwise relationships from fam-ily records and full circles to pairwise relationships estimated by Ritland method.
Table 5. Signifi cant pairwise genetic correlations between quantitative traits estimated from the correlation between trait family means with their confi dence intervals (CI) and the corresponding estimate from the linear model ( Ritland, 1996b ) based on molecular marker information for Prosopis alba .
Trait pair Family mean CI Ritland
HEI BMS 0.527* 0.220 – 0.740 1.003HEI TDI 0.630*** 0.360 – 0.800 1.44BMS TDI 0.907*** 0.820 – 0.950 0.994BMS PEL 0.35 0.005 – 0.625 0.842TDI PEL 0.41 0.076 – 0.666 1.281PEL PIL 0.573** 0.280 – 0.768 1.097PEL NPI − 0.568** − 0.765 – − 0.273 0.361PEL LEL 0.654*** 0.396 – 0.817 NAPEL LEL/LEW 0.609** 0.331 – 0.790 − 0.655PEL LEX − 0.606** − 0.788 – − 0.326 NANLP PIL 0.41 0.069 – 0.662 NANLP NPI 0.456* 0.128 – 0.694 NANLP SPL − 0.458* − 0.695 – − 0.130 NAPIL LEL 0.737*** 0.523 – 0.864 NAPIL LEL/LEW 0.652*** 0.392 – 0.815 − 0.772PIL LEX − 0.497* − 0.721 – − 0.180 NAPIL SPL − 0.41 − 0.661 – − 0.067 0.228NPI LEL − 0.694*** − 0.839 – − 0.455 NANPI LEL/LEW − 0.513* − 0.731 – − 0.200 0.128NPI LEX 0.577** 0.286 – 0.771 NALEL LEL/LEW 0.772*** 0.579 – 0.883 NALEL LEX − 0.713*** − 0.850 – − 0.484 NALEL/LEW LEX/LEA − 0.4 − 0.659 – − 0.064 NALEL/LEW LEX − 0.497* − 0.721 – − 0.179 NALEF LEX/LEA − 0.491* − 0.717 – − 0.173 NALEX/LEA LEX 0.604** 0.323 – 0.787 NA
Notes: * Highly signifi cant at individual level; ** matrix wide signifi cant; *** matrix wide highly signifi cant.
464 American Journal of Botany [Vol. 96
Ferreyra , L. I. , C. Bessega , J. C. Vilardi , and B. O. Saidman . 2007 . Consistency of population genetics parameters estimated from isozyme and RAPDs dataset in species of genus Prosopis (Leguminosae, Mimosoidae). Genetica 131 : 217 – 230 .
Garant , D. , and L. E. B. Kuruuk . 2005 . How to use molecular data to measure evolutionary parameters in wild populations. Molecular Ecology 14 : 1843 – 1859 .
Guo , S. W. , and E. A. Thompson . 1992 . Performing the exact test of Hardy – Weinberg proportions for multiple alleles. Biometrics 48 : 361 – 372 .
Hardy , O. J. 2003 . Estimation of pairwise relatedness between individu-als and characterization of isolation-by-distance processes using dom-inant genetic markers. Molecular Ecology 12 : 1577 – 1588 .
Jacquard , A. 1974 . The genetic structure of populations, Springer, Berlin, Germany.
Kalinowski , S. T. , and M. L. Taper . 2006 . Maximum likelihood estima-tion of the frequency of null alleles at microsatellite loci. Conservation Genetics 7 : 991 – 995 .
Klaper , R. , K. Ritland , T. A. Mousseau , and M. D. Hunter . 2001 . Heritability of phenolic in Quercus laevis inferred using mo-lecular markers. Journal of Heredity 92 : 421 – 426 .
Kumar , S. , and T. E. Richardson . 2005 . Inferring relatedness and heri-tability using molecular markers in radiata pine. Molecular Breeding 15 : 55 – 64 .
Li , C. C. , D. E. Weeks , and A. Chakravarti . 1993 . Similarity of DNA fi ngerprints due to chance and relatedness. Human Heredity 43 : 45 – 52 .
Lynch , M. 1988 . Estimation of relatedness by DNA fi ngerprinting. Molecular Biology and Evolution 5 : 584 – 599 .
Lynch , M. , and K. Ritland . 1999 . Estimation of pairwise relatedness with molecular markers. Genetics 152 : 1753 – 1766 .
Lynch , M. , and B. Walsh . 1998 . Genetics and analysis of quantitative traits, Sinauer, Sunderland, Massachusetts, USA.
Milligan , B. G. 2003 . Maximum-likelihood estimation of relatedness. Genetics 163 : 1153 – 1167 .
Morton , N. E. , S. Yee , D. E. Harris , and R. Lew . 1971 . Bioassay of kin-ship. Theoretical Population Biology 2 : 507 – 524 .
Mottuora , M. C. , R. Finkeldey , A. R. Verga , and O. Gailing . 2005 . Development and characterization of microsatellite markers for Prosopis chilensis and Prosopis fl exuosa and cross-species ampli-fi cation. Molecular Ecology Notes 5 : 487 – 489 .
Mousseau , T. A. , K. Ritland , and D. D. Heath . 1998 . A novel method for estimating heritability using molecular markers. Heredity 80 : 218 – 224 .
Nei , M. 1978 . Estimation of average heterozygosity and genetic distance from a small number of individuals. Genetics 89 : 583 – 590 .
Pasiecznik , N. M. , P. J. C. Harris , and S. J. Smith . 2004 . Identifying tropical Prosopis species. A fi eld guide. HDRA, Coventry, UK.
Queller , D. C. , and K. F. Goodnight . 1989 . Estimating relatedness using genetic markers. Evolution 43 : 258 – 275 .
R Development Core Team . 2007 . R: A language and environment for statistical computing. R Foundation for Statistical Computing, Vienna, Austria. Website http://www.R-project.org.
Ritland , K. 1996a . Estimators of pairwise relatedness and individual in-breeding coeffi cients. Genetical Research 67 : 175 – 185 .
Ritland , K. 1996b . A marker-based method for inferences about quanti-tative inheritance in natural populations. Evolution 50 : 1062 – 1073 .
Ritland , K. 2000 . Marker-inferred relatedness as a tool for detecting heritability in nature. Molecular Ecology 9 : 1195 – 1204 .
Ritland , K. 2005 . Multilocus estimation of pairwise relatedness with dominant markers. Molecular Ecology 14 : 3157 – 3165 .
Ritland , K. , and C. Ritland . 1996 . Inferences about quantitative inheri-tance based on natural population structure in the yellow monkey-fl ower, Mimulus guttatus. Evolution 50 : 1074 – 1082 .
Ritland , K. , and S. Travis . 2004 . Inferences involving individual coef-fi cients of relatedness and inbreeding in natural populations of Abies. Forest Ecology and Management 197 : 171 – 180 .
Rousset , F. , and M. Raymond . 1995 . Testing heterozygote excess and defi ciency. Genetics 140 : 1413 – 1419 .
whether inheritance inferences are pertinent or not, and if there would be a risk of overestimation.
In sum, the two most plausible causes for upward bias in ANOVA h 2 estimates for most traits may be the underestima-tion of relatedness and spatial covariance within family groups. The lower marker-based h 2 estimates with respect to those ob-tained from ANOVA may be due to two main causes. The fi rst is that assumptions of relatedness within and between family groups are not expected to produce overestimations of h 2 by this method. The second is that relatedness is inferred indi-rectly, and a bias may occur as a consequence of a limited num-ber of available molecular loci and alleles.
However, although the marker-based h 2 estimates are lower than those obtained from genealogical data, there is a highly signifi cant correlation between estimates from the different ap-proaches applied here; and the confi dence interval of the regres-sion slope of marker-inferred on ANOVA-estimated h 2 contains the expected value of one. This result suggests that, although the absolute values of marker-based h 2 may not be quantita-tively accurate, these estimates are useful to rank the traits ac-cording to their actual differences in the proportion of additive variance. As stated by Ritland and Ritland (1996) for micro-structured populations, with higher number of marker loci and proper sampling strategies, the precision and accuracy of this method might be greatly increased.
According to our results, marker-based estimates are more accurate for traits with high h 2 values. With low or moderate h 2 traits, the risk of retrieving nonsignifi cant results must be evalu-ated with higher number of markers. Our results are therefore promising given the outlined limitations of this preliminary study and may encourage the development of more molecular markers for this methodology, not only for P. alba but also for other profi table, related species of Prosopis to provide useful information to screen natural populations for their valuable ge-netic diversity in conservation and breeding programs.
LITERATURE CITED
Akindele , A. , and O. Olutayo . 2007 . Quantitative variations in the growth of progeny seedlings of Prosopis africana (Guill., Perrott. And Rich.) plus trees in Nigeria. African Journal of Biotechnology 6 : 359 – 363 .
Andrew , R. L. , R. Peakall , I. R. Wallis , J. T. Wood , E. J. Knight , and W. J. Foley . 2005 . Marker-based quantitative genetics in the wild?: The heritability and genetic correlation of chemical defenses in Eucalyptus. Genetics 171 : 1989 – 1998 .
Bassam , B. J. , G. Caetano-Anoll é s , and P. M. Greshoff . 1991 . Fast and sensitive silver staining of DNA in polyacrylamide gels. Analytical Biochemistry 196 : 80 – 84 .
Bessega , C. , L. Ferreyra , N. Julio , S. Montoya , B. O. Saidman , and J. C. Vilardi . 2000 . Mating system parameters in species of genus Prosopis (Leguminosae) . Hereditas 132 : 19 – 27 .
Burkart , A. 1976 . A monograph of the genus Prosopis (Leguminosae sub-fam. Mimosoidae). Journal of the Arnold Arboretum 57 : 219 – 525 .
Cannings , C. , and A. Thompson . 1981 . Genealogical and genetic struc-ture. Cambridge University Press, Cambridge, Massachusetts, USA.
Cony , M. 1996 . Genetic variability in Prosopis fl exuosa D.C., a na-tive tree of the Monte phytogeographic province, Argentina. Forest Ecology and Management 87 : 41 – 49 .
Felker , P. , C. Lopez , C. Soulier , J. Ochoa , R. Abdala , and M. Ewens . 2001 . Genetic evaluation of Prosopis alba (algarrobo) in Argentina for cloning elite trees. Agroforestry Systems 53 : 65 – 76 .
Felker , P. , D. Smith , C. Wiesman , and R. L. Bingham . 1989 . Biomass production of Prosopis alba clones at 2 non-irrigated fi eld sites in semi-arid south Texas. Forest Ecology and Management 29 : 135 – 150 .

465Bessega et. al. — Marker-based heritability estimates in PROSOPIS ALBA February 2009]
Rweyongeza , D. M. , F. C. Yeh , and N. K. Dhir . 2005 . Heritability and correlations for biomass production and allocation in white spruce seedlings. Silvae Genetica 54 : 4 – 5 .
Thomas , S. C. , D. W. Coltman , and M. Pemberton . 2002 . The use of marker based relationship information to estimate the heritability of body weight in a natural population: A cautionary tale. Journal of Evolutionary Biology 15 : 92 – 99 .
Thomas , S. C. , J. M. Pemberton , and W. G. Hill . 2000 . Estimating variance components in natural populations using inferred relation-ships. Heredity 84 : 427 – 436 .
Verga , A. 2000 . Recursos gen é ticos, mejoramiento y conservaci ó n de especies del g é nero Prosopis . In Carlos A. Norverto [ed.], Mejores á rboles para m á s forestadores, 205 – 221. Secretar í a de Agricultura, Ganader í a, Pesca y Alimentos (SAGPyA), Buenos Aires, Argentina.
Verga , A. , M. Mottuora , M. Melchiore , J. Jouseau , C. Carranza , M. Ledesma , D. Recalde , and L. Tomalino . 2005 . El proyecto algarrobo del INTA. Revista de informaci ó n sobre investigaci ó n y de-sarrollo agropecuario. Revista Idia XXI 8 : 195 – 200 .
Wang , J. 2002 . An estimator for pairwise relatedness using molecular markers. Genetics 160 : 1203 – 1215 .
Wilson , A. J. , G. McDonald , H. K. Moghadam , C. M. Herbinger , and M. M. Ferguson . 2003 . Marker-assisted estimation of quantitative genetic parameters in rainbow trout, Oncorhynchus mykiss. Genetics Research 81 : 145 – 156 .
Zas , R. , and J. Fern á ndez-L ó pez . 2005 . Juvenile genetic parameters and genotypic stability of Pinus pinaster Ait. open-pollinated fami-lies under different water and nutrient regimes. Forest Science 51 : 165 – 174 .