Development of locally-adapted faba bean cultivars for organic conditions in Germany through a...
12
Development of locally-adapted faba bean cultivars for organic conditions in Germany through a participatory breeding approach Participatory breeding of faba bean for organic conditions Lamiae Ghaouti Werner Vogt-Kaute Wolfgang Link Received: 4 July 2007 / Accepted: 15 October 2007 / Published online: 30 January 2008 Ó The Author(s) 2008 Abstract Organic farming requires cultivars that are specifically adapted to this low input cropping system. Hence, organic farmers and scientists joined in a participatory breeding approach to develop region-specific genotypes of spring faba bean for organic conditions in Germany. A set of 49 genotypes with contrasting degrees of heterozygosity and het- erogeneity was used in field trials across five locations in Germany during 3 years 2004, 2005 and 2006. The material involved 18 inbred lines, their 18 polycross progenies, one blend of inbred lines, one blend of polycross progenies, one blend of hybrids and ten checks. Inbred lines are uniform, thus giving the option to be specifically adapted; whereas the polycross progenies and synthetics (Syn-1; predicted from the inbred lines and polycross progenies performance) are partly heterogeneous and heterozy- gous, thus giving the option to evolve. Agronomic performance was assessed and a ‘‘personal appreci- ation’’ score of the material was assigned to each genotype by each partner. This personal appreciation was strongly influenced by biotic and abiotic con- straints faced by the crop in each location and by the expected grain yield of the genotypes. Uniformity was apparently appreciated by organic farmers. In all locations, the highest yielding inbred line yielded slightly better than the predicted highest yielding synthetic. However, this slight disadvantage of the synthetic is very likely to disappear if the synthetic (Syn-1) is propagated during successive generations. Keywords Faba bean Inbred lines Local breeding Organic farming Participatory plant breeding Synthetic cultivars Abbreviations CK Checks GLA German Land Appraisal HB Hybrid blend IL Inbred line LB Inbred lines blend PP Polycross progenies PB Polycross progeny blend Introduction Organic farming is increasingly gaining interest in Europe. In Germany, organic agricultural area occupied 2.3% of the total agricultural area in 1998 and reached L. Ghaouti W. Link (&) Department of Crop Sciences, Georg-August University, Von Siebold-Str. 8, 37075 Go ¨ttingen, Germany e-mail: [email protected] L. Ghaouti e-mail: [email protected] W. Vogt-Kaute Naturland-Verband fu ¨r naturgema ¨ßen Landbau e.V., Kleinhadernerweg 1, 82166 Gra ¨felfing, Germany e-mail: [email protected] 123 Euphytica (2008) 162:257–268 DOI 10.1007/s10681-007-9603-3
-
Upload
independent -
Category
Documents
-
view
1 -
download
0
Transcript of Development of locally-adapted faba bean cultivars for organic conditions in Germany through a...
Development of locally-adapted faba bean cultivars fororganic conditions in Germany through a participatorybreeding approach
Participatory breeding of faba bean for organic conditions
Lamiae Ghaouti Æ Werner Vogt-Kaute ÆWolfgang Link
Received: 4 July 2007 / Accepted: 15 October 2007 / Published online: 30 January 2008
� The Author(s) 2008
Abstract Organic farming requires cultivars that
are specifically adapted to this low input cropping
system. Hence, organic farmers and scientists joined
in a participatory breeding approach to develop
region-specific genotypes of spring faba bean for
organic conditions in Germany. A set of 49 genotypes
with contrasting degrees of heterozygosity and het-
erogeneity was used in field trials across five
locations in Germany during 3 years 2004, 2005
and 2006. The material involved 18 inbred lines, their
18 polycross progenies, one blend of inbred lines, one
blend of polycross progenies, one blend of hybrids
and ten checks. Inbred lines are uniform, thus giving
the option to be specifically adapted; whereas the
polycross progenies and synthetics (Syn-1; predicted
from the inbred lines and polycross progenies
performance) are partly heterogeneous and heterozy-
gous, thus giving the option to evolve. Agronomic
performance was assessed and a ‘‘personal appreci-
ation’’ score of the material was assigned to each
genotype by each partner. This personal appreciation
was strongly influenced by biotic and abiotic con-
straints faced by the crop in each location and by the
expected grain yield of the genotypes. Uniformity
was apparently appreciated by organic farmers. In all
locations, the highest yielding inbred line yielded
slightly better than the predicted highest yielding
synthetic. However, this slight disadvantage of the
synthetic is very likely to disappear if the synthetic
(Syn-1) is propagated during successive generations.
Keywords Faba bean � Inbred lines �Local breeding � Organic farming �Participatory plant breeding � Synthetic cultivars
Abbreviations
CK Checks
GLA German Land Appraisal
HB Hybrid blend
IL Inbred line
LB Inbred lines blend
PP Polycross progenies
PB Polycross progeny blend
Introduction
Organic farming is increasingly gaining interest in
Europe. In Germany, organic agricultural area occupied
2.3% of the total agricultural area in 1998 and reached
L. Ghaouti � W. Link (&)
Department of Crop Sciences, Georg-August University,
Von Siebold-Str. 8, 37075 Gottingen, Germany
e-mail: [email protected]
L. Ghaouti
e-mail: [email protected]
W. Vogt-Kaute
Naturland-Verband fur naturgemaßen Landbau e.V.,
Kleinhadernerweg 1, 82166 Grafelfing, Germany
e-mail: [email protected]
123
Euphytica (2008) 162:257–268
DOI 10.1007/s10681-007-9603-3
4.8% in 2002. For comparison, the share of organic
farming area in total agricultural area was 1.7% in
France and 8.7% in Austria in 2002 (Eurostat 2002).
According to EU Regulation 2092/91 modified in
2005, organic production refrains from using agro-
chemical inputs such as mineral fertilizers, pesticides
and herbicides. Consequently, diseases, weeds and
availability of nitrogen are often major constraints for
an adequate productivity in organic farming.
The major crops grown in the organic farming
system in Germany are cereals; they occupied 23% of
the organic acreage in 2004. Faba bean (Vicia faba
L.) as a grain legume crop has a considerable
potential and fits well to the organic requirements.
It produces its own nitrogen supply in addition to
supplying a nitrogen reserve for the following crops
in the rotation. Faba bean was found to have the
highest amount of total nitrogen residues among
legume crops reaching 100 kg/ha (Kaul et al. 1996).
Faba bean can serve as break for cereal rotation
systems, decreasing diseases, energy costs and CO2
output. It improves additionally soil physical condi-
tions and soil fertility (Hebblethwaite 1983).
However, faba bean is one of the smallest crops in
Germany. Its acreage was 16,000 hectares whereas
the acreage of pea was 121,500 hectares (FAO 2005).
The assets of faba bean seem to be nevertheless
considered in organic farming, since compared to the
other crops, this crop is rather concentrated in organic
farming. In 2004, 39% of the area devoted to faba
bean was organic (ZMP 2004).
Faba bean is a partially allogamous crop with a
degree of cross fertilization averaging 30–60% (Bond
and Poulsen 1983; Link 1990; Link et al. 1994b).
Due to its partial allogamy, Bond in 1982 has
stated that breeding the partially heterotic and
heterogeneous synthetic cultivars is more advanta-
geous than breeding line cultivars. A synthetic
cultivar is a special kind of a population cultivar. It
is produced by open pollination of selected compo-
nents during a limited number of generations. The
number of components is restricted and the com-
ponenets are usually selected based on their per se
performance and their combining ability (Becker
1988). The mixture of the components is called
collectively Syn-0, and the first offspring from Syn-0
is called collectively Syn-1. Breeding synthetic
cultivars was repeatedly recommended to increase
yield and yield stability of faba beans (Ebmeyer
1987; Link et al. 1994a; Stelling et al. 1994a). In the
past decade, superior and important faba bean
cultivars like ‘‘Scirocco’’ and ‘‘Fuego’’ were popula-
tion cultivars or synthetics.
In the case of faba bean, it is questionable whether
the apparent superiority of synthetics over lines holds
true in the organic context.
In Western Europe, organic farming relies on the
improvements achieved by conventional breeding.
However, the use of modern cultivars in the organic
context does not imply that these are the best
cultivars for the organic cropping system. Indeed,
organic production is similar to marginal areas
production with heterogeneous environments, large
diversity of farmers’ needs and lack of specifically
adapted cultivars (Desclaux 2005). A major intention
of organic farming is to use locally bred and adapted
rather than generally adapted cultivars.
To meet the complexity of the organic farming
requirements, participatory breeding involving the
organic farmers themselves in the breeding process
was proposed (Desclaux 2005). Anyway, with the
very restricted area of organic farming the private
sector is probably not investing much in regional
let alone participatory and local breeding.
In addition to a specific adaptation of cultivars,
organic farming principles give high priority to
genetic diversity offering the possibility of local
evolution. However, a contradiction exists between
high genetic diversity within a cultivar and its
potential to prove a specific, local adaptation. From
a set of genotpypes, only one genotype can be best
adapted to a given environment. This best genotype
holds no or little genetic diversity and is a too small
basis to realize a meaningful local evolution. If
diversity is sought, inclusion of further, less well-
adapted genotypes into the cultivar of choice is
inevitable. Thus, an increase of diversity causes a
decrease in specificity of adaptation. This contradic-
tion is true as long as genotype 9 environment
interactions exist. Inbred lines are single genotypes,
thus holding a potential to be specifically and locally
adapted to the one or other environment; whereas
synthetics are genetically diverse and give the
possibility to locally adapt and evolve over time
(Tigerstedt 1994). Faba bean inbred lines were shown
to be on average lower performing than their
corresponding synthetics (Stelling et al. 1994b).
Nevertheless, our hypothesis is that, due to the higher
258 Euphytica (2008) 162:257–268
123

genetic variance between inbred lines than between
synthetics, the locally best adapted inbred line may
outperform the locally best adapted synthetic.
The objective of this study was to combine the
efforts of organic farmers, partners in an organic
association and scientists in a participatory breeding
approach to simultaneously study the contradiction
between diversity and specificity of adaptation and to
determine the most adequate type of spring faba bean
cultivars fitting the requirements of a set of organic
farms in Germany.
Material and methods
Breeding material and experimental design
A set of 18 inbred lines (IL) was derived from
eighteen old and new European spring faba bean
cultivars. They were developed via single seed
descent for at least six generations. Through open
pollination among these 18 inbred lines, 18 polycross
progenies (PP) were produced as described by Fleck
and Ruckenbauer (1989). One inbred lines blend
(LB) was created by blending equal numbers of seed
from each inbred line and correspondingly, a poly-
cross progenies blend (PB) was established. From a
set of 54 F1-hybrids produced from the 18 lines, a
blend of F1-hybrids (HB) was constituted. The
previous five entries (IL, PP, LB, PB and HB) are
different regarding their genotypic structure but share
a common genetic background. Furthermore, 10 checks
(CK), mainly recent European spring faba bean culti-
vars were used. The identity of the inbred lines and the
checks was described elsewhere (Ghaouti 2007). Alto-
gether, the material consisted of 49 genotypes which
were tested in five locations in Germany during 3 years
(2004, 2005 and 2006). The trials were laid out as lattice
design with two replicates. The plot size was 7.2 m2
with 40 seeds/m2. The intra row spacing was 10.7 cm
and the inter row spacing was 37.5 cm. The trials
were sown in the end of March and harvested in the
end of August.
The project area
The testing sites involved four organic locations and
a conventional one in Germany. Three organic
locations licensed by Naturland association were
organic farms, located at Trondel (54�200 N;
10�300 E), Ramsthal (51�080 N; 10�040 E) and Will-
mering (49�150 N; 12�400 E). The remaining two
locations belong to the Department of Crop Sciences:
Deppoldshausen (organic nursery) and Reinshof
(conventional nursery) with the coordinate
(51�310 N; 09�550 E). Deppoldshausen is located
25 km North of Reinshof. In the conventional nursery
Reinshof, one replicate was treated with agrochem-
ical inputs (pesticides, insecticides and fungicides).
The different geographical positions of the locations
were chosen to cover a wide diversity of agro-
ecological conditions. Trondel is located near the
coast of the Baltic Sea. It is characterized by a
relatively mild climate where the temperatures are
rarely below 0 degrees. It has the highest summer
daylength and a high German Land Appraisal (GLA;
Rust 2006; Fig. 1). The German Land Appraisal is a
soil fertility index varying on a scale from 0
(minimum soil fertility) to 100 (maximum soil
fertility). Reinshof and Deppoldshausen are very
different for their GLA and altitude (Fig. 1). Depp-
oldshausen, due to its high altitude, is colder on
average by one degree compared to Reinshof and has
a low GLA. Ramsthal and Willmering are located in
the South East of Germany. These two farms are
located in relatively high altitudes and the quality of
their soils is poor (Fig. 1). Willmering has the highest
temperature amplitude (Table 1) which may consti-
tute a stress for spring bean. The general pattern of
precipitation was similar for all the five locations.
Drought stress is rather taking place in June during
flowering and the location Ramsthal was the most
prone to drought stress (Fig. 2).
In the organic farms as well as in the experimental
locations, the crop rotation followed was winter
cereal–legume.
Participatory approach and measurements
Three organic farmers were involved in this research.
Each partner (farmer or scientist) was involved in his
location for the activities given below.
(a) Trial management. Farmers followed their nor-
mal management practices. For the conventional
location (Reinshof), herbicides, fungicides and
insecticides were used in only one replicate.
Euphytica (2008) 162:257–268 259
123

(b) Scoring onset of flowering (FLW, day from
January 1), plant height (HEI, cm), disease
incidence scored on the basis of the visual scale
reported by Bernier et al. (1984); Botrytis and/
or Aschochyta, which were the only diseases
appearing in these experiments (DI, score 1–9;
1: healthy and 9: totally infested), lodging
(LOD, score 1–9; 1: fully upright, 9 = totally
lodging), biomass yield (BM, 1: low biomass, 9:
high biomass) and end of maturity (MAT, day
from January 1).
(c) Visual estimation of yield at maturity (YE, score
1–9; 1: lowest yielding, 9: highest yielding).
(d) Personal appreciation of the material through a
visual score (PA, score 1–9; 1: fully disliked, 9:
fully appreciated). The development plant stage
and the criteria of evaluation were chosen by
each partner independently.
The scoring of YE was essential to define whether
and to which extent grain yield contributes to PA.
After combine harvesting, grain yield (Y, t/ha) and
thousand grain weight (TGW, g) were measured and
grain status (GS, score 1–9; 1: healthy grains, 9: fully
infected grains) was visually estimated for each plot
entry. The incidence of Aschochyta symptoms on the
seeds was evaluated as grain status.
Statistical analyses
Data analysis was based on PLABSTAT (Utz 1991)
as follows: First, the individual trials (one location in
1 year) were analyzed according to their lattice
design. Following Cochran and Cox (1992), the
resultant lattice adjusted entry means were used for
(1) analyses of variance for each location across the
3 years and for (2) a combined analysis of variance
across the five locations and the 3 years. A mixed
model was used where the years (Y) were random
and the factors genotypes (G) and locations (L) were
fixed.
The relationship between the five genotype 9 loca-
tion interaction (GL) effects of each genotype and the
genotype’s mean performance for grain yield was
studied using the results of the combined analysis of
variance across locations and years.
Correlations among the genotypes of the trait
‘‘personal appreciation’’ with the other scored traits
were estimated for each location. Besides, the
personal appreciation data of the locations were
correlated to compare the rankings established by
Trö.
Dep.
Rei.
Ram.
Wil.
GLA (index, 0 – 100)Day length (h; June 21)
evobarete
m(edutitl
Alevel
aes)
Fig. 1 Day length at 21st June, altitude and GLA (German
Land Appraisal; 0 = minimum soil fertility; 100 = maximum
soil fertility) of the five studied locations
Table 1 Mean, maximal (max), minimal (min) and average
amplitude of daily temperatures across the 3 years during
spring bean growing season (April–August) for each location
(DWD 2006)
Locations Temperature
Mean �C Max �C Min �C Amplitude �C
Trondel 12.4 16.3 8.4 7.9
Deppoldshausen 11.5 17.0 6.0 11.0
Reinshof 12.5 18.0 7.0 11.0
Ramsthal 13.1 18.6 7.5 11.2
Willmering 11.8 18.1 5.5 12.6
110
2030405060708090
100
March April May June July August
Month
Pre
cip
itat
ion
mm
Rei. and Dep. Ram. Wil.Trö.
Fig. 2 Amount of precipitation in each location for each
month of spring bean growing season (data are means across
the 3 years 2004–2006) (DWD 2006)
260 Euphytica (2008) 162:257–268
123

each partner. Data presented below are averaged
across the 3 years. For statistical significance, *is
used to indicate significance at 5% level of error
probability and **at 1% level of error probability.
Prediction of the yield performance of synthetics
in the first generation
In this study case, the parental components for the
prospected synthetic cultivars were inbred lines.
From eighteen inbred lines, 2.6 9 105 synthetic
cultivars are possible to generate, with synthetics
based on 2–18 parents. It is crucial to determine the
optimum size (i.e. optimum number of components)
of the synthetics and to predict their performance.
The performance of a synthetic with k components
in the first generation Syn-1(k) is predicted as follows
(Ederer and Link 1992):
Syn1ðkÞ �1
k
Xk
i¼1Si þ
k � 1
k
m
m� 1Pi � Sið Þ
� �;
where k is the number of components in a synthetic
variety, m is the number of components in the
polycross (m = 18 in our case), Si is the performance
of the inbred line i and Pi is the performance of the
polycross-progeny of the inbred line i. This predic-
tion is based on assumptions as described by Link and
Ederer (1992) and Link and Ederer (1993).
Based on the yield performance of the inbred lines
and their polycross progenies, the highest performing
synthetics in generation Syn-1 were predicted for
each location, and compared to the highest yielding
inbred line.
Results and discussion
Performance levels at the locations were significantly
different (Table 2). Maximum yield was realized in the
conventional location Reinshof. This result was
expected since Reinshof has a high GLA and the plots
in this location were relatively free from pests, diseases
and weeds. Yield performance in the treated replicate
and in the non treated replicate was not significantly
different. Symptoms of two foliar diseases were
detected in the five locations: Ascochyta fabae and
Botrytis fabae, and one seed disease, Ascochyta fabae.
The score of disease incidence reflected the joint foliar
incidence of Botrytis and Aschochyta whereas the
grain status score reflected the incidence of As-
chochyta on harvested seed. Regarding the GLA and
the DI, Trondel appears to be the best organic location.
Genotypes in Trondel were higher yielding than in the
three other organic locations and showed very little
disease symptoms. Although the genotypes grew
relatively tall, they were on average the least lodging
compared to all other locations. Ramsthal was charac-
terized by a low GLA, highest disease incidence and
drought stress during flowering time. Genotypes in
Ramsthal were on average early flowering with the
smallest height due to the drought, and thus achieving
the lowest yield. Willmering was the latest flowering
and the earliest maturing location. The duration of
flowering and the pod filling period were the shortest in
this location; this may have contributed to the low yield
observed. The highest lodging scores were recorded in
Willmering. The plots in Deppoldshausen were the
latest maturing.
The difference between the genotypes was highly
significant for grain yield and flowering time (Table 3).
Locations and location 9 year interactions were the
largest sources of variation for both traits. For grain
yield, the variance of the genotype 9 environment
interactions (GL+GY+GYL) was larger than the
genotypic variance. Genotype 9 location interactions
were the strongest components of the joint geno-
type 9 environment interactions and contributed
more than half as much as the genotypes to the yield
variation. Urgent need to improve yield stability of
faba bean in conventional farming is well-known (e.g.,
Dantuma et al. 1983; Bond et al. 1993). In the organic
context yield instability is supposed to be even larger
since G 9 E is not buffered by agrochemical inputs.
Large genotype 9 environment interactions for grain
yield in low input environments were observed in other
crops such as barley (Ceccarelli et al. 2003) and rice
(Courtois et al. 2001). Here, for all other agronomic
traits, all sources of variations were as well significant
and genotype 9 location interactions were as well the
largest component of the genotype 9 environment
interactions (details not shown).
The location Trondel was taken as an example to
illustrate the pattern of the genotypes’ grain yield
distribution (Fig. 3). The genotypes distribution was
distinct according to the genotypic structure. Inbred
lines performed less than the polycross progenies in
Trondel as well as on average across locations. It
never occurred that, in Trondel or in any single
Euphytica (2008) 162:257–268 261
123
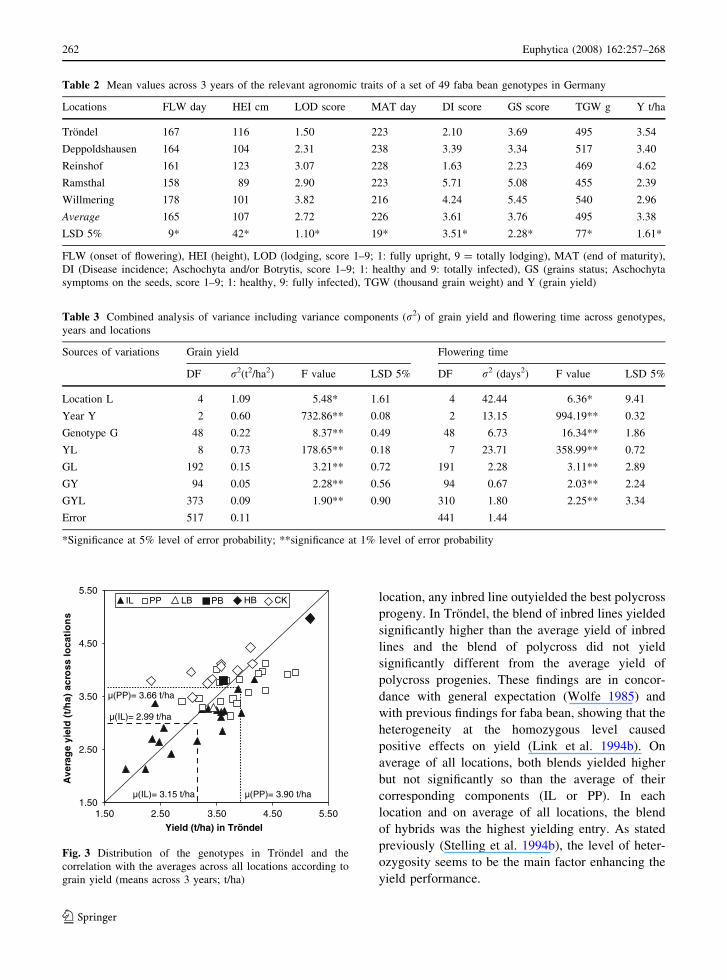
location, any inbred line outyielded the best polycross
progeny. In Trondel, the blend of inbred lines yielded
significantly higher than the average yield of inbred
lines and the blend of polycross did not yield
significantly different from the average yield of
polycross progenies. These findings are in concor-
dance with general expectation (Wolfe 1985) and
with previous findings for faba bean, showing that the
heterogeneity at the homozygous level caused
positive effects on yield (Link et al. 1994b). On
average of all locations, both blends yielded higher
but not significantly so than the average of their
corresponding components (IL or PP). In each
location and on average of all locations, the blend
of hybrids was the highest yielding entry. As stated
previously (Stelling et al. 1994b), the level of heter-
ozygosity seems to be the main factor enhancing the
yield performance.
Table 2 Mean values across 3 years of the relevant agronomic traits of a set of 49 faba bean genotypes in Germany
Locations FLW day HEI cm LOD score MAT day DI score GS score TGW g Y t/ha
Trondel 167 116 1.50 223 2.10 3.69 495 3.54
Deppoldshausen 164 104 2.31 238 3.39 3.34 517 3.40
Reinshof 161 123 3.07 228 1.63 2.23 469 4.62
Ramsthal 158 89 2.90 223 5.71 5.08 455 2.39
Willmering 178 101 3.82 216 4.24 5.45 540 2.96
Average 165 107 2.72 226 3.61 3.76 495 3.38
LSD 5% 9* 42* 1.10* 19* 3.51* 2.28* 77* 1.61*
FLW (onset of flowering), HEI (height), LOD (lodging, score 1–9; 1: fully upright, 9 = totally lodging), MAT (end of maturity),
DI (Disease incidence; Aschochyta and/or Botrytis, score 1–9; 1: healthy and 9: totally infected), GS (grains status; Aschochyta
symptoms on the seeds, score 1–9; 1: healthy, 9: fully infected), TGW (thousand grain weight) and Y (grain yield)
Table 3 Combined analysis of variance including variance components (r2) of grain yield and flowering time across genotypes,
years and locations
Sources of variations Grain yield Flowering time
DF r2(t2/ha2) F value LSD 5% DF r2 (days2) F value LSD 5%
Location L 4 1.09 5.48* 1.61 4 42.44 6.36* 9.41
Year Y 2 0.60 732.86** 0.08 2 13.15 994.19** 0.32
Genotype G 48 0.22 8.37** 0.49 48 6.73 16.34** 1.86
YL 8 0.73 178.65** 0.18 7 23.71 358.99** 0.72
GL 192 0.15 3.21** 0.72 191 2.28 3.11** 2.89
GY 94 0.05 2.28** 0.56 94 0.67 2.03** 2.24
GYL 373 0.09 1.90** 0.90 310 1.80 2.25** 3.34
Error 517 0.11 441 1.44
*Significance at 5% level of error probability; **significance at 1% level of error probability
1.50
2.50
3.50
4.50
5.50
1.50 2.50 3.50 4.50 5.50
Yield (t/ha) in Tröndel
sn
oitacol
ssorca
)ah/t(
dleiye
garevA
µ(PP)= 3.90 t/haµ(IL)= 3.15 t/ha
µ(PP)= 3.66 t/ha
µ(IL)= 2.99 t/ha
IL PP HBLB PB CK
Fig. 3 Distribution of the genotypes in Trondel and the
correlation with the averages across all locations according to
grain yield (means across 3 years; t/ha)
262 Euphytica (2008) 162:257–268
123

The superiority of the polycross progenies over the
inbred lines for yield performance held true in each
single location (Table 4). On average, the polycross
progeny yielded 0.67 t/ha higher than the inbred lines
which corroborated previous findings on faba bean
(Link et al. 1994b; Stelling et al. 1994b). The variance
among inbred lines in each location and on average of
all locations was larger than the variance among the
polycross progenies. In each single location and on
average of all locations, yield performance of poly-
cross progenies was positively, markedly and
significantly correlated with yield of their inbred lines.
On average across locations, the correlation between
the inbred lines and their polycross progenies for yield
performance amounted r = 0.63**. Fleck and Ruck-
enbauer (1989) found as well that a significant
correlation (r = 0.51**) existed between the inbred
lines and their polycross progenies in faba bean. The
inbred lines and their polycross progenies constituted
as well two distinct groups according to the interaction
pattern of their yield performance with the locations
(Fig. 4). Interaction effects of the inbred lines with the
locations were generally larger than those of the
polycross progenies. For instance, the inbred line IL 12
(MarisBead/1) interacted highly with the locations; it
yielded in Reinshof 0.74 t/ha more than expected from
general means and 0.94 t/ha less than this in Willmer-
ing. Overall, it was the second least yielding genotype.
A genotype that shows a high positive GL effect with a
location is specifically adapted to this location (IL 12
seems to be specifically adapted to Reinshof), whereas
a genotype with a little or zero GL effects shows a
stable performance across the locations. The inbred
lines tend to be more specifically adapted and specif-
ically misadapted to single locations, whereas their
polycross progenies are more stable, thus confirming
our hypothesis. Heterozygous and heterogeneous
entries were found to interact less with environments
than inbred lines in faba bean (Link et al. 1994a) as
well as in other crops such as barley (Einfeldt et al.
2005), rapeseed (Becker and Leon 1988) and maize
(Schnell and Becker 1986).
The main objective of this study was to compare two
categories of cultivars in local organic conditions;
inbred line cultivar and synthetic cultivar. For all
locations, the optimum size of synthetics was found to
be m = 4 components. This optimum size of synthetic
was the result of a compromise between reducing the
inbreeding depression by increasing the number of
components and increasing gain from selection by
decreasing the number of components (Becker 1988;
Gallais 1992). With 18 inbred lines as potential
components for synthetics of size four, here 3060
possible synthetics Syn-1(4) were possible to establish.
Selection based on yield performance
The analysis of the best inbred lines in each location
showed (Table 5) that the inbred line IL 1 (Maya/2)
was specifically adapted to both Trondel and
Table 4 Mean values and
phenotypic variances of the
18 inbred lines and their 18
polycross progenies; and
their correlations
*Significance at 5% level of
error probability;
**significance at 1% level
of error probability
Locations Inbred lines Polycross progenies r (IL, PP)
Mean Phenotypic Mean Phenotypic
t/ha r2 t2/ha2 t/ha r2 t2/ha2
Trondel 3.15 0.53 3.90 0.29 0.55*
Deppoldshausen 2.92 0.49 3.75 0.24 0.57*
Reinshof 4.08 0.32 4.97 0.21 0.73**
Ramthal 2.22 0.39 2.48 0.32 0.57*
Willmering 2.58 0.46 3.21 0.22 0.71**
Average 2.99 0.44 3.66 0.26 0.63**
-1.50
-1.00
-0.50
0.00
0.50
1.00
1.50
2.00
Yield (t/ha) across years and locations
GL
eff
ect
(t/h
a)
IL 12 IL PP
µ(IL)=2.99 t/ha µ(PP)=3.66 t/ha
2.50 3.00 3.50 4.00 4.50
Fig. 4 Mean yield of the 18 IL and eighteen PP (averages across
years and locations; x-axis) versus G 9 L interaction effects of
these genotypes with the five locations (y-axis). Values from
combined ANOVA across years and locations (cf. text)
Euphytica (2008) 162:257–268 263
123
Ramsthal. The three other locations had each a
different specifically adapted inbred line, IL 4 (Styria
343), IL 10 (L1_MxCEx/19) and IL 14 (Music/1). In
each location, the best inbred line was one of the four
components of the best Syn-1(4). This result is
expected since the yield performance of the inbred
lines was positively correlated to the yield perfor-
mance of their corresponding polycross progenies
and thus to their contribution to the best synthetic
cultivar. The best synthetics among the locations
were established from 12 different components out of
the available 18. The best synthetics covered a large
diversity of the available components confirming that
the locations had indeed different environments. In
each location, the synthetics were predicted to yield
on average higher than the inbred lines which is in
concordance with the theoretical expectations estab-
lished by Gallais (1992). This superiority is mainly
due to the partial heterosis expressed in the synthet-
ics. However, the comparison between the actually
highest yielding inbred line and the predicted to be
highest yielding Syn-1(4) as identified in each
location turned out in favor of the inbred line in
each location. Again in each location, the highest
yielding inbred line and the highest yielding synthetic
were higher yielding than the highest yielding check
entry, albeit nowhere significantly so. Nevertheless,
taking averages across locations, the highest yielding
check (Bilbo) significantly outyielded the highest
yielding inbred line (Maya/2; details not shown).
Checks were released cultivars derived from formal
breeding. Apparently such cultivars are not necessar-
ily best adapted to single locations, but showed up as
superior when ranking is based on means across a
range of locations.
A cross validation test was performed to verify (1)
whether the best inbred line is indeed best in a given
location, (2) whether the best Syn-1(4) is indeed best
in a given location and (3) whether the best inbred
line is indeed outyielding the best synthetic in a given
location. The data of each of the 3 years in a given
location were partitioned into two subsets; calibration
set (mean across 2 years) and validation set (the
residual third year).
(1) Initially, the highest yielding inbred line from the
mean of 2 years data was identified and the third
year was retained to test whether the predicted
best inbred line was indeed best in the third year.
Three validation sets were available in each
location and 15 validation sets were available
among all five locations. The best inbred line
predicted from the calibration set was accepted as
indeed ‘‘best’’ if in the validation test, it was the
highest or second highest yielding, i.e. based on a
ratio of two out of 18 (11.11%). The result of this
analysis revealed that in 10 out of 15 cases (67%),
the predicted to be best inbred line from the
calibration set was best or second best in the
validation set.
(2) The same analysis was done for the best Syn-
1(4) but for the validation, the best Syn-1(4)
predicted from the calibration set was consid-
ered to be indeed ‘‘best’’ if it ranked in the
validation set among the 340 highest yielding
Syn-1(4) out of 3,060. This represents the same
ratio as for the inbred lines (11.11%). The result
showed that the predicted to be best Syn-1(4)
was always ‘‘best’’ in the validation set. A
second, stricter validation threshold 80/3,060
(2.61%) gave a similar result as the result of the
validation test of the best inbred lines with
11.11% threshold: in 10 cases out of 15, the
predicted to be best Syn-1(4) was ranked among
the 80 best in the validation set.
(3) In each location, the highest yielding inbred line
and the highest yielding Syn-1(4) from the mean
of each 2 years data were identified and their
performance was checked and compared in the
residual third year. In 10 cases out of 15, the
predicted to be best inbred line yielded higher
than the predicted to be best Syn-1(4). The
average difference across all 15 cases was about
3% in favor of the inbred lines.
Cross validation data confirmed our results since,
(1) in most cases the best inbred line and the best
synthetic could be well enough predicted and since
(2) it is more likely that the best inbred line outyields
the best synthetic than the opposite.
It is worthwhile to stress that the apparent
superiority in yield performance of the locally best
inbred line over the locally best synthetic was not
marked. Furthermore, it must be stressed that the
synthetics were predicted for the generation Syn-1.
The panmictic index and thus yield of a synthetic is
expected to increase with further generation of
propagation (Busbice 1969; Link 1990). Stelling
264 Euphytica (2008) 162:257–268
123

et al. (1994b) observed in faba bean a yield increase
from the first to the second generation of synthetics of
1–8%. This expected heterotic increase of yield of the
best synthetic in the second generation may cancel
the small advantage of the highest yielding inbred
line.
Moreover, as shown above, the prediction of the
synthetics’ performance is more reliable than the
prediction of the inbred lines’ performance. There-
fore, in spite of the finding that the locally highest
yielding line tended to be superior over the locally
best synthetic, this finding was only corroborated in
75% of the cases by cross validation. Besides, in the
long term the synthetics have a great local advantage
through their genetic heterogeneity which is their
genetic adaptability.
Selection based on farmers criteria
The visual estimation of yield in the field by each
partner (farmer or scientist) was highly correlated to
the realized grain yield after harvesting. The corre-
lation between visually estimated yield and realized
yield ranked from 0.44** to 0.70** in the five single
locations and amounted on average to r = 0.60**.
Farmers were more or less successful in identifying
the highest yielding genotypes.
All partners based their appreciation of the geno-
types to a large extent on their score of visual
estimation of yield (YE, Table 6). Yield constituted
for all partners an important trait. The correlation of
personal appreciation and visual estimation of yield
reflects the weight that each partner attributed
intentionally to grain yield in his personal appreci-
ation. For instance, the farmer in Trondel has given a
high weight to the estimated yield when assigning his
personal appreciation (r = 0.84**). However, the
correlation between his personal appreciation and
combine harvest yield was not high in spite of been
significant (r = 0.42**; Table 6).
Personal appreciation was strongly influenced by
biotic and abiotic constraints faced by the crop in
each location. As diseases were more frequent in
Deppoldshausen, Ramsthal and Willmering
(Table 2), higher appreciation scores were given to
genotypes with little diseases symptoms and healthy
seeds. In Trondel, the correlation between personal
appreciation and grain status was due to the fact that
the farmer has favored genotypes that suffered less
from the severe drought stress which happened in the
year 2006 in this location. In the conventional
Table 5 Average yield performance of the inbred lines and the synthetics Syn-1(4), and yield performance and identity of the best
inbred line and the best Syn-1(4) in each location
Locations Average
Y of 18 IL
Average Y
of 3060 Syn-1(4)
Y of the best IL Y of the
best Syn-1(4)
Idendity of
best IL
Idendity of best
Syn-1(4) components
(t/ha)
Trondel 3.15 3.74 4.78 4.47 1 1; 18; 15; 17
Deppoldshausen 2.92 3.58 4.27 4.19 4 18; 4; 10; 6
Reinshof 4.08 4.79 5.42 5.39 10 10; 11; 3; 4
Ramsthal 2.22 2.43 3.50 3.07 1 1; 6; 5; 10
Willmering 2.58 3.08 3.91 3.73 14 14; 1; 3; 7
Table 6 Correlation coefficients of personal appreciation score with the agronomic traits
FLW HEI LOD MAT DI BM YE Y GS TGW
Trondel 0.44** 0.67** – 0.43** – – 0.84** 0.42** -0.29* -0.37**
Deppoldshausen -0.55** 0.38** – – -0.32* 0.61** 0.59** 0.52** -0.44** 0.47**
Reinshof -0.51** -0.49** -0.54** – – – 0.60** 0.48** – 0.38**
Ramthal 0.42** 0.79** -0.30* 0.32* -0.35* 0.71** 0.68** 0.49** -0.53** -0.29*
Willmering – 0.39** – – -0.34* 0.34* 0.66** 0.36* -0.42** -0.37**
*Significance at 5% level of error probability; **significance at 1% level of error probability; – non significant coefficient of
correlation
Euphytica (2008) 162:257–268 265
123
location Reinshof, short genotypes were favored due
to the high lodging pressure in this location. Tall
genotypes were favored by all partners in organic
locations. The scoring decisions of the farmer in
Ramsthal resulted from a compromise between tall
and less lodging genotypes. Early flowering and
maturing material was favored in Reinshof and
Deppoldshausen and late flowering and maturing
material was favored in Trondel and Ramsthal. In the
organic locations Deppoldshausen, Ramsthal and
Willmering, genotypes with high biomass were most
appreciated apparently because they outcompeted
weeds. The incidence of weeds was very low in
Trondel and absent in Reinshof due to the weed
management (herbicides or manual weeding). Farm-
ers favored small seeded genotypes whereas in
Deppoldshausen and Reinshof, big seeded genotypes
were the most appreciated. This maybe due to the
high yield of big seeded types recorded only in
Reinshof and Deppoldshausen. The selection criteria
used by farmers were neither unusual nor unexpected.
They translated mainly their requirements according
to their agro-ecological conditions. This result corrob-
orated the findings of other participatory researches
(Ceccarelli et al. 2000). Correlations of the scores of
personal appreciation in each location showed that the
scores in both Deppoldshausen and Reinshof were
significantly and positively correlated (r = 0.46**)
which is apparently due to the scoring achieved by the
same partner in both locations. The scores of personal
appreciation in Reinshof were significantly and neg-
atively correlated to the ones in Trondel (r = -
0.48**). In the other cases, the scores of personal
appreciation were independent. This independency
reflects partly genuine differences between farmers’
appreciations and partly the large interaction between
genotypes and location, the latter being the basic
motivation for local and participatory breeding.
Admittedly, strictly local breeding may not be
economically feasible. However, a combination of
regional and participatory breeding should be ana-
lysed further. The large genotype 9 location
interactions contributed to the development of several
regional breeding programs such the development of
regional breeding programs for wheat in Australia
(Banziger and Cooper 2001).
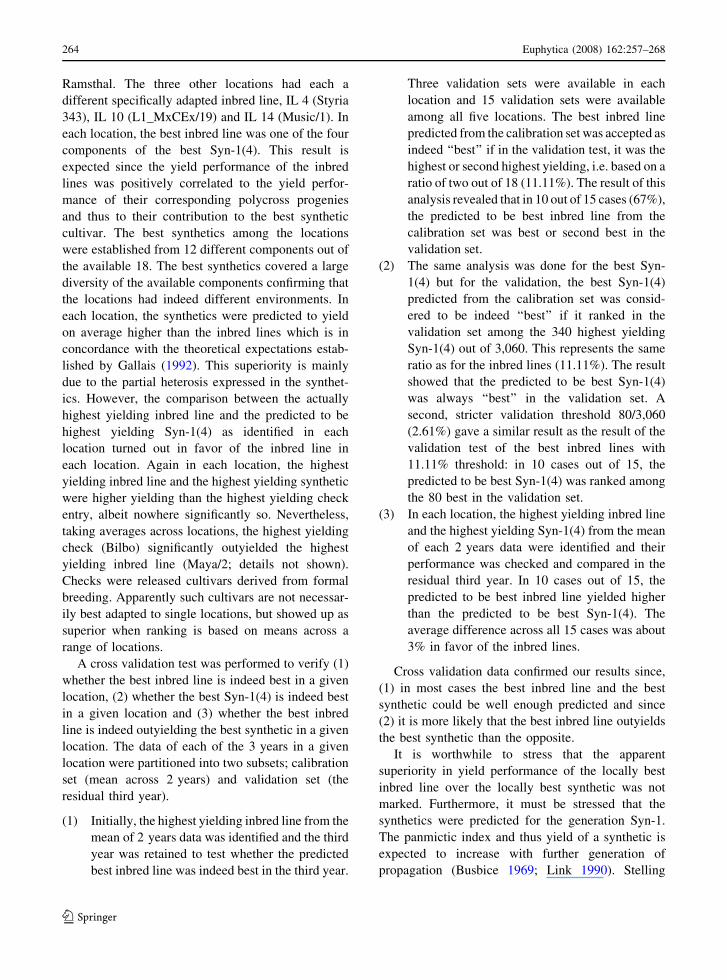
Eighteen superior genotypes out of N = 49 were
identified in each location according to yield perfor-
mance in a first instance, and to the personal
appreciation scores in a second instance. The contri-
bution of the different genotypic structure to the
superior genotypes was assessed. In all locations, the
18 superior genotypes according to yield performance
and to personal appreciation scores included the
hybrids blend entry. Inbred lines blend and the
polycross progenies blend never ranked among these
superior genotypes. Checks contributed similarly to
the highest yielding (23%) and to the most appreciated
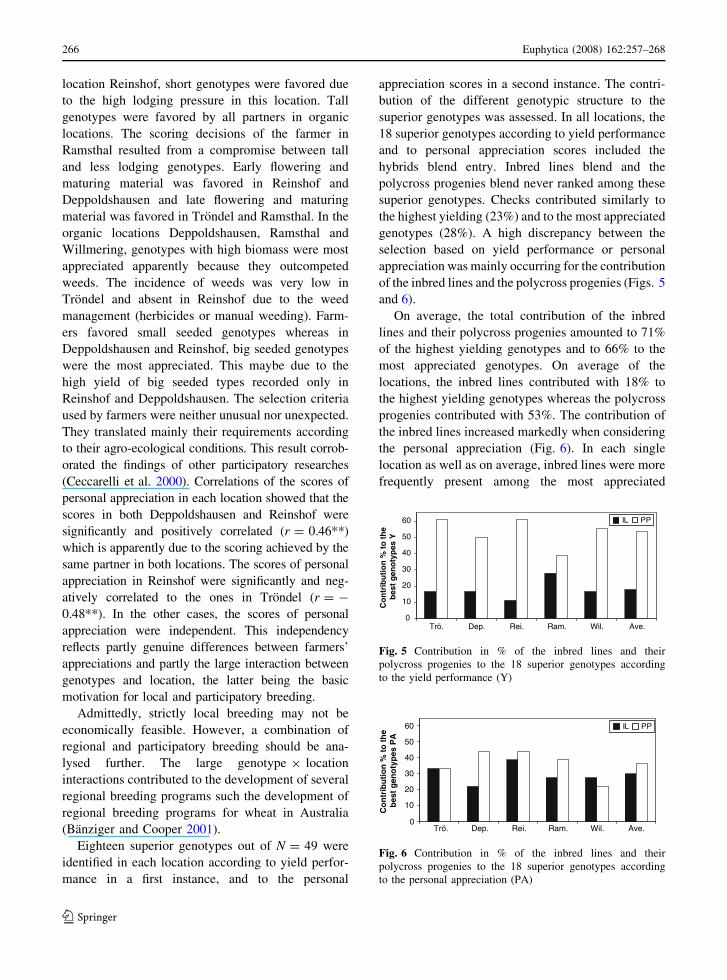
genotypes (28%). A high discrepancy between the
selection based on yield performance or personal
appreciation was mainly occurring for the contribution
of the inbred lines and the polycross progenies (Figs. 5
and 6).
On average, the total contribution of the inbred
lines and their polycross progenies amounted to 71%
of the highest yielding genotypes and to 66% to the
most appreciated genotypes. On average of the
locations, the inbred lines contributed with 18% to
the highest yielding genotypes whereas the polycross
progenies contributed with 53%. The contribution of
the inbred lines increased markedly when considering
the personal appreciation (Fig. 6). In each single
location as well as on average, inbred lines were more
frequently present among the most appreciated
0
10
20
30
40
50
60
Trö.
Co
ntr
ibu
tio
n %
to
th
e b
est
gen
oty
pes
Y
IL PP
Dep. Rei. Ram. Wil. Ave.
Fig. 5 Contribution in % of the inbred lines and their
polycross progenies to the 18 superior genotypes according
to the yield performance (Y)
0
10
20
30
40
50
60
Trö.
Co
ntr
ibu
tio
n %
to
th
e b
est
gen
oty
pes
PA
IL PP
Dep. Rei. Ram. Wil. Ave.
Fig. 6 Contribution in % of the inbred lines and their
polycross progenies to the 18 superior genotypes according
to the personal appreciation (PA)
266 Euphytica (2008) 162:257–268
123

genotypes than among the highest yielding geno-
types. In each location, the highest yielding inbred
line ranked among the most appreciated genotypes.
Organic farmers apparently did not disfavor homo-
geneity. Compared to the yield selection, farmers
increased the contribution of the (homogeneous)
inbred lines and decreased the contribution of the
(heterogeneous) polycross progenies to the most
appreciated genotypes. Uniformity was apparently
appreciated by organic farmers and heterozygous and
heterogeneous material seemed to be appreciated not
due to its genotypic structure but due to its visible
high yield performance.
Results of this study have been obtained on farmer’s
field under organic and local conditions. Large genetic
differences were detected that will be of immediate
benefit to farmers at no additional costs. On request of
the farmers, we gave them the Syn-0(4) of the best Syn-
1(4) according to their personal appreciation to con-
tinue the synthetic propagation and use it for their own
purposes. The outcome of this study illustrated how the
combined efforts of farmers and breeders in a local
breeding approach led to new insight and to very
suitable genotypes for organic farming.
Acknowledgements Our thanks are due to the farmers A.
Hausladen (Willmering), G. Neder (Ramsthal) and H. Untiedt
(Trondel) for their very valuable contributions. Sowing and
harvesting was achieved faultlessly by Agrostat Company.
Finally, we thank BMELV (Bundesministeriums fur
Ernahrung, Landwirtschaft und Verbraucherschutz) for
financing this research.
Open Access This article is distributed under the terms of the
Creative Commons Attribution Noncommercial License which
permits any noncommercial use, distribution, and reproduction
in any medium, provided the original author(s) and source are
credited.
References
Banziger M, Cooper M (2001) Breeding for low input conditions
and consequences for participatory plant breeding: Examples
from tropical maize and wheat. Euphytica 122:503–519
Becker H (1988) Breeding synthetic varieties of crop plants.
Plant Genet Breed Rev 1:31–54
Becker HC, Leon J (1988) Stability analysis in plant breeding.
Plant Breed 101:1–23
Bernier CC, Hanounik SB, Hussein MM, Mohamed HA (1984)
Field manual of common faba bean diseases in the Nile
Valley. ICARDA, Syria
Bond DA (1982) The development and performance of syn-
thetic varieties of Vicia faba L. In: Hawtin G, Webb C
(eds) Faba bean improvement. pp 41–51
Bond DA, Poulsen MH (1983) Pollination. In: Hebblethwaite
PD (ed) The Faba Bean (Vicia faba L.). Butterworths,
London, pp 77–101
Bond DA, Jellis GJ, Rowland GG, Le Guen J, Robertson LD,
Khalil SA, Li-Juan L (1993) Present status and future
strategy in breeding faba beans (Vicia faba L.) for resis-
tance to biotic and abiotic stresses. Euphytica 73:151–166
Busbice TH (1969) Inbreeding in synthetic varieties. Crop Sci
9:601–604
Ceccarelli S, Grando S, Tutliwer R et al (2000) A methodo-
logical study on participatory barley breeding. I. Selection
phase. Euphytica 111:91–104
Ceccarelli S, Grando S, Singh M et al (2003) A methodological
study on participatory barley breeding. I. Response to
selection. Euphytica 133:185–200
Cochran WG, Cox GM (1992) Experimental designs, 2nd edn.
John Wiley and Sons (eds.), Inc. New York
Courtois B, Bartholome B, Chaudhary D et al (2001) Com-
paring farmers and breeders rankings in varietal selection
for low-input environments: a case study of rainfed rice in
eastern India. Euphytica 122:537–550
Dantuma G, E.von Kittlitz M Frauen DA Bond (1983) Yield,
yield stability and measurements of morphological and
phenological characters of faba bean (Vicia faba L.)
varieties grown in a wide range of environments in
Western Europe. Z Pflanzenzuchtg 90:85–105
Desclaux D (2005) Participatory plant breeding methods for
organic cereals. In: Proceedings of the COST SUSVAR/
ECO-PB, Workshop on Organic Plant Breeding Strategies
and the Use of Molecular Markers, Lammerts Van Bueren
ET, Ostergard H (eds) pp 17–23
DWD (Deutscher Wetterdienst) (2006) http://www.dwd.de.
Cited Feb 2007
Ebmeyer E (1987) Zur Bedeutung der Ertragsicherheit in der
zuchtung von Ackerbohnen. Vortr Pflanzenzuchtg
12:168–179
Ederer E, Link W (1992) The polycross-test as a step in
breeding partially allogamous crops. Theoretical consid-
erations. Proc. XIIIth EUCARPIA Congress, 6–11 July,
Angers, France, Book of Poster Abstracts, pp 543–544
Einfeldt CHP, Ceccarelli S, Grando S et al (2005) Heterosis
and mixing effect in Barley under drought stress. Plant
Breed 124:350–355
Eurostat (Statistical Office of the European Communities)
(2002) http://www.epp.eurostat.ec.europa.eu/portal/page?
_pageid=1090,30070682,1090_30298591&_dad=portal&_
schema=PORTAL. Cited Feb 2007
FAO (Food and Agriculture Organization) (2005) http://www.
faostat.fao.org. Cited Feb 2007
Fleck A, Ruckenbauer P (1989) Der Polycrosstest als me-
thodischer Schritt in der Fababohnenzuchtung
(experimentelle Ergebnisse). Die Bodenkultur 40:61–72
Gallais A (1992) Pourquoi faire des varietes synthetiques?
Agronomie 12:601–609
Ghaouti L (2007) Comparison of pure line cultivars with synthetic
cultivars in local breeding of faba bean (Vicia faba L.) for
organic farming. PhD thesis, University of Gottingen,
Euphytica (2008) 162:257–268 267
123

Germany. Available at http://www.resolver.sub.uni-
goettingen.de/purl/?webdoc-1572
Hebblethwaite PD (1983) Background, physiology and breed-
ing. In: Hebblethwaite PD (ed) The faba bean (Vicia fabaL.). Butterworths, London, pp 3–22
Kaul HP, Aufhammer W, Wagner W (1996) Dry matter and
nitrogen accumulation and residues of oil and crop protein
crops. Eur J Agrono 5:137–147
Link W (1990) Autofertility and rate of cross-fertilization:
crucial characters for breeding synthetic varieties in faba
bean (Vicia faba L.). Theor Appl Genet 79:713–717
Link W, Ederer W (1993) The concept of varietal ability for
partially allogamous crops. Plant Breed 110:1–8
Link W, Stelling D, Ebmeyer E (1994a) Yield stability in faba
bean, Vicia faba L. 1. Variation among inbred lines. Plant
Breed 112:24–29
Link W, Stelling D, Ebmeyer E (1994b) Factors determining
the performance of synthetics in Vicia faba L. 1. Heter-
ogeneity, heterozygosity, and degree of cross fertilization.
Euphytica 75:77–84
Rust, Insa I (2006) Amendment of the ‘‘German land appraisal’’
(Reichsbodenschatzung) in consideration of climatic condi-
tions. PhD thesis, University of Gottingen, Germany [in
German]. Available at http://www.webdoc.sub.gwdg.
de/diss/2006/rust/
Schnell FW, Becker HC (1986) Yield and yield stability in a
balanced system of widely differing population structures
in Zea mays L. Plant Breed 97:30–38
Stelling D, Link W, Ebmeyer E (1994a) Yield stability in faba
bean, Vicia faba L.2. Effect of heterozygosity and heter-
ogeneity. Plant Breed 112:30–39
Stelling D, Link W, Ebmeyer E (1994b) Factors determining
the performance of synthetics in Vicia faba L. 2. Syn-
generation. Euphytica 75:85–93
Tigerstedt PMA (1994) Adaptation, variation and selection in
marginal areas. Euphytica 77:171–174
Utz HF (1991) A computer program for statistical analysis of
plant breeding experiments. Institute of Plant Breeding,
Seed Science and Population Genetics. University of
Hohenheim
Wolfe MS (1985) The current status and prospects of multilane
cultivars and variety mixtures for disease resistance. Ann
Rev Phytopathol 23:251–273
ZMP (Zentrale Markt- und Preisberichtstelle GmbH) (2004)
http://www.zmp.de/. Cited Feb 2007
268 Euphytica (2008) 162:257–268
123