Agro-morphological Variation and Nutritional Qualitative Trait Screening among Field bean (Vicia...
23
Legume Genomics and Genetics (online), 2014, Vol. 4 http://lgg.biopublisher.ca © 2014 BioPublisher, an online publishing platform of Sophia Publishing Group. All Rights Reserved. Sophia Publishing Group (SPG), founded in British Columbia of Canada, is a multilingual publisher.
Transcript of Agro-morphological Variation and Nutritional Qualitative Trait Screening among Field bean (Vicia...
Legume Genomics and Genetics (online), 2014, Vol. 4
http://lgg.biopublisher.ca
© 2014 BioPublisher, an online publishing platform of Sophia Publishing Group. All Rights Reserved.Sophia Publishing Group (SPG), founded in British Columbia of Canada, is a multilingual publisher.
Legume Genomics and Genetics (online), 2014, Vol. 4
http://lgg.biopublisher.ca
© 2014 BioPublisher, an online publishing platform of Sophia Publishing Group. All Rights Reserved.Sophia Publishing Group (SPG), founded in British Columbia of Canada, is a multilingual publisher.
PublisherSophia Publishing Group
Edited byEditorial Team of Legume Genomics and Genetics
Email:[email protected]:http://lgg.biopublisher.ca
Address:11388 Stevenston Hwy,
PO Box 96016,
Richmond, V7A 5J5, British Columbia, Canada
Legume Genomics and Genetics is committed to publishing grain/forage legume studies, as well as
research on model legume plants such as Lotus japonicus and Medicago truncatula. The aims are to
feature innovative research findings in the basic and applied fields of legume biology. Topics
include (but are not limited to) genome structure, genome-scale analysis, comparative and
functional genomics, proteomics and epigenomics, gene discovery and function, gene expression
and evolution, as well as legume genetics from the molecular level to whole plant level.
BioPublisher, operated by Sophia Publishing Group (SPG), is an international
Open Access publishing platform that publishes scientific journals in the field
of life science. Sophia Publishing Group (SPG), founded in British Columbia
of Canada, is a multilingual publisher.
All the articles published in Legume Genomics and Genetics are Open Access,
and are distributed under the terms of the Creative Commons Attribution
License, which permits unrestricted use, distribution, and reproduction in any
medium, provided the original work is properly cited.
BioPublisher uses CrossCheck service to identify academic plagiarism through
the world’s leading plagiarism prevention tool, iParadigms, and to protect the
original authors' copyrights.

Legume Genomics and Genetics, 2014, Vol.5http://lgg.biopublisher.ca
1
Latest Content
Assessment of Genetic Divergence in among Yard Long Bean (Vigna unguiculata subsp. sesquipedalis [L.])
Genotypes 1-3
Siva vavilapalli, Celine V.A., Vahab A.M
Legume Genomics and Genetics, 2014, Vol. 5, No. 1
Genetic Divergence Analysis in Vegetable cowpea (Vigna unguiculata subsp. unguiculata [L.]) Genotypes 4-6
Siva vavilapalli, Celine V.A., Sreelathakumai I.
Legume Genomics and Genetics, 2014, Vol. 5, No. 2
Agro-morphological Variation and Nutritional Qualitative Trait Screening among Field bean (Vicia faba L. var
minor) 7-24
Khalil Khamassi, Ian J. Makay, Mohamed B. Ali, Salah Rezgui, Donal O' sullivan, Fayçal Ben Jeddi
Legume Genomics and Genetics, 2014, Vol. 5, No. 3
Legume Genomics and Genetics 2014, Vol. 5, No. 3, 7-24http://lgg.biopublisher.ca
7
Research Report Open Access
Agro-morphological Variation and Nutritional Qualitative Trait Screeningamong Field Bean (Vicia faba L. var minor)
Khalil Khamassi1,2 , Ian J. Makay2 , Mohamed B. Ali4 , Salah Rezgui1 , Donal O' sullivan2,3 , Fayçal Ben Jeddi11 University of Carthage, National Agronomic Institute of Tunisia (INAT), Laboratory of horticultural Sciences, Tunisia2 National Institute of Agricultural Botany (NIAB) Huntingdon Road Cambridge CB3 0LE, UK3 School of Agriculture, Policy and Development, University of Reading, Whiteknights, P O Box 237, Reading, UK4 Agronomy Department College of Agriculture Assiut University, Egypt
Corresponding author email: [email protected], AuthorsLegume Genomics and Genetics, 2014, Vol.5, No.3 doi: 10.5376/lgg.2014.05.0003Received: 21 Apr., 2014Accepted: 16 May., 2014Published: 16 Jun., 2014© 2014 Khamassi et al., This is an open access article published under the terms of the Creative Commons Attribution License, which permits unrestricted use,distribution, and reproduction in any medium, provided the original work is properly cited.Preferred citation for this article:Khamassi et al., 2014, Agro-morphological Variation and Nutritional Qualitative Trait Screening among Field Bean (Vicia faba L. var minor), LegumeGenomics and Genetics, Vol.5, No.3, 7-24 (doi: 10.5376/lgg.2014.05.0003)
Abstract A study of three local populations and ninety seven Tunisian field bean (Vicia faba L. var minor) derived F4 breeding
lines originating from an old heterogeneous population maintained at INAT was carried out. Agro-morphological variability based on
the internationally recognized descriptors of the International Union for protection of new varieties (UPOV, 2002) and Biodiversity
international, (IBPGR, 1985) was used to characterize this collection, targeting traits of interest for breeders such as white hilum,
white flower color, determinate growth habit, and precocity while assessing the potential of progenitors that could be useful for both
local and international breeding programs. Three white hilum lines, a unique determinate growth habit line and a unique uncommon
trait: anthocyanin spotted seed was identified. Precocity for flowering time is 10 days for some lines. Cluster analysis of quantitative
traits divided the collection into three groups. Several lines were promising material for pod production and growth habit. Further
studies, especially at the molecular level, are required to compare this collection to international diversity and to map the interesting
traits for breeding purposes.
Keywords Faba bean;, Vicia faba L.; Agro-morphological traits; Phenotypic; Clustering
IntroductionFaba beans are one of the most grown and consumedgrain food legumes in Tunisia as well as othercountries in North Africa and Middle East. The fieldbean with small seed type (Vicia faba L. var minor),principally used for animal feeding, is considered asan alternative to soybean in the diet of dairy cows,especially in countries where soya beans have highcosts of supply (Gous, 2011; Tufarelli et al., 2012).Grain legume production is declining while costs areincreasing. There is also a high GMO contaminationrisk for soya bean (Martini et al., 2008). Field beansrequire the development of large collections of highquality varieties in order to offer greater choices to themarket. However, research in faba beans is still facingsome difficulties, especially related to geneticisolation within the genus Vicia, tolerating noexchange genes with other species of the same genus,and previous attempts at interspecific hybridizationhave failed (Hebblethwaite, 1983; Ramsey and
Pickersgill, 1986; Le Guen and Duc, 1992; Duc, 1997;Zeid et al., 2003). Consequently, faba bean breeding isbased only on natural diversity within the species oron artificial mutagenesis (Hebblethwaite, 1983; Linket al., 1995; Duc, 1997). Partial allogamy of thisspecie plays a role in maintaining genetic diversity,with natural outcrossing ranging from 2% to 84% andan average of 32% (Bond and Poulsen, 1983), yet itcan play a negative role in maintaining pure lines andin variety conservation. For this reason, it is necessaryto collect, conserve, characterize and efficientlymaintain local populations (Burton, 1978; Terzopouloset al., 2003). Terzoupolous et al. (2008) argued that itis important to study the diversity of the richMediterranean gene pool to identify the germplasmgroups from which inbred lines can be derived.Numerous investigations have been conducted usingmorphological traits, allowing Polignano andSpagnoletti Zeuli (1985) and Suso et al. (1993) toclassify the studied collections. Terzopouloset et al.

Legume Genomics and Genetics 2014, Vol. 5, No. 3, 7-24http://lgg.biopublisher.ca
8
(2003) evaluated a collection of 55 Greecepopulations, divided them into 5 groups andrecommended the number of pods per plant, thenumber of ovules and seeds per pod, and the numberof branches per plant as the most relevant traits to beused for population classification under dry and lowfertility soils (Terzopouloset et al., 2003). Naguib(2000) evaluated morphological characters foridentification of faba bean varieties by means ofqualitative characters, e.g., pod color, seed coat colorand hilum color along with quantitative traitsincluding leaflet characters, number of flowers, plantheight and pod characters. He concluded that thesedescriptors could be used for discrimination amongthe studied faba bean genotypes. In Tunisia, someefforts have been initiated to investigate variability inlocal faba beans populations (Ouji et al., 2012) andlandraces (Yahia et al., 2012) based on morphology.Only, Three commercial field bean varieties (Bacchar,Badii and Najah), locally selected by the NationalInstitute of Agricultural Research of Tunisia (INRAT),in addition to a new variety (Saber02) selected by theNational Agronomic Institute of Tunis (INAT), arecommercialized. However, Tunisia is one of thecenters of diversity of Vicia faba L. and the availablelocal diversity has not been adequately sampled. Theaim of this study is to screen agro-morphologically aset of lines created by mass selection from an originalpopulation of field bean (Vicia faba L. Var minor).This is therefore one of the pioneering studies tocharacterize the INAT collection and identify lineswith interesting traits. Duc et al. (2004) found that thevc-gene, which controls levels of the anti-nutritionalvicine and convicine compounds, was closely linked(10 cM) to the hilum color gene. Hence; a furtherobjective of this study is to establish whether whitehilum in any of the studied lines is associated withlow vicine and convicine levels. Whereas the whiteflower is indicative of the absence of tannins in theseed coat by a mutation of one of the twocomplementary gene controlling absence of tannin andwhite flower (Bond, 1976; Cabrera, 1988; Crofton andBond, 1998; Gutierrez et al., 2008) were focusedwithin this collection. This initial screening is the firststep prior to carry out costly genotyping to supplyINAT and International faba beans breeding programswith new sources of diversity.
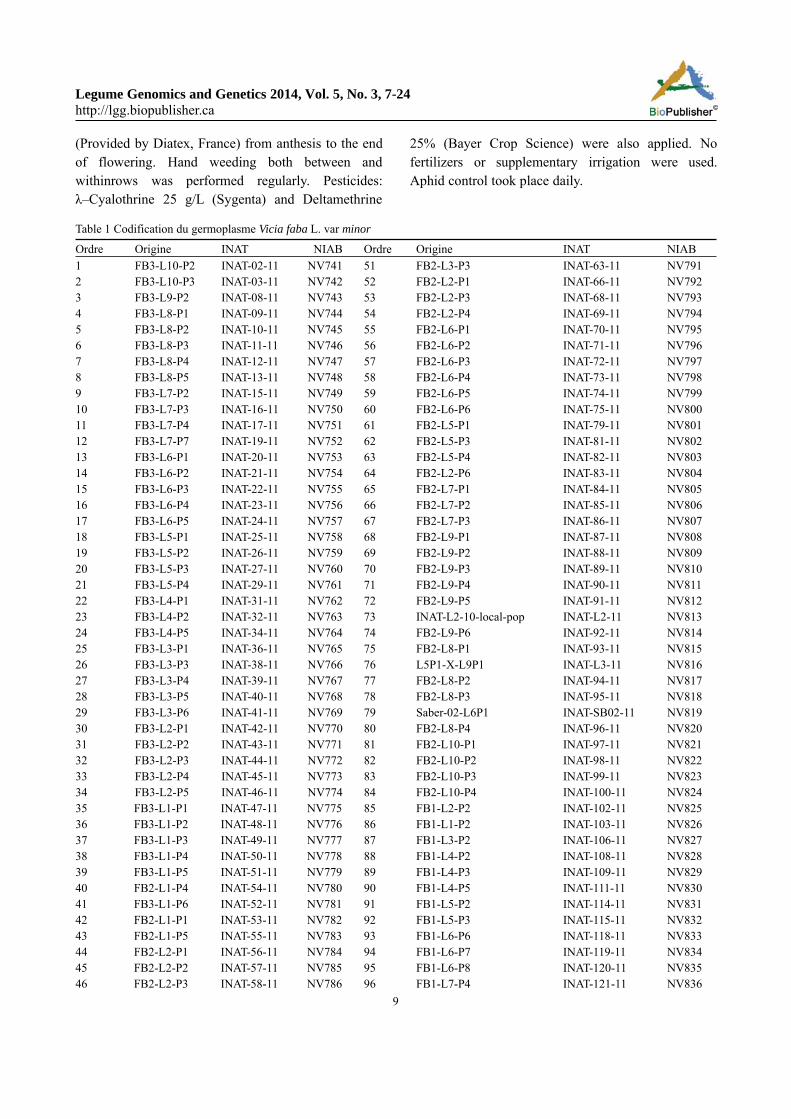
1 Materials and Methods1.1 Plant materials historyThe research material involves ninety seven F4 linesof field beans (Vicia faba var. minor L.) and threeregistered local cultivars used as controls (Table 1).The lines originated from a local population ‘F75’collected during the seventies which are conserved inthe INAT Gene Bank. Initially, this population wassown in a large field which allowed the selection ofsome interesting and distinguishable individuals basedon agronomical and morphological traits,complimented by protein content analysis and seeddescriptors. This process led to the creation of tensub-populations. Seeds from each sub-populationwere sown in separate rows in three separatedrandomized blocks and allowed to open pollinate.Some crossing between rows within and betweenblocks was inevitable. Seeds were harvested fromeach plant separately and given a unique identifierrelated to its original row and block. After thissubdivision, each single plant within each line wassown in a single row in an insect-proof covered tunneland each row was considered as a line. The currentexperiment entails a first screening after one cycle ofpurification to characterize the lines in comparisonwith three local cultivars.
1.2 Field experimental conditionsThe field experiment was carried out at the NationalAgronomic Institute of Tunis (INAT), Tunis,(36°49’50’’N and 10°10’58’’W and altitude of 10 m)during the 2009/2010 growing season in a heavy claysoil. All lines and controls were sown on November25th. Each line is represented by one row 2 m longwith 1m between rows and a 35 cm inter-plantdistance within each row. Five plants within each rowwere selected to represent each line while theremained were discarded. The phenotyped plantswithin each line were considered as the subset tocontinue purification through single seed descentapproach (SSD). The subsequent lines progeny weregenotyped using a recent validated KASP-SNP assay(Cottage et al. 2013) and results will be publishedlater separately. A set of 12 qualitative morphologicaltraits and 20 quantitative traits were scored (Table 1).Each row was covered by a 1.3m tall insect-proof net
Legume Genomics and Genetics 2014, Vol. 5, No. 3, 7-24http://lgg.biopublisher.ca
9
(Provided by Diatex, France) from anthesis to the endof flowering. Hand weeding both between andwithinrows was performed regularly. Pesticides:λ–Cyalothrine 25 g/L (Sygenta) and Deltamethrine
25% (Bayer Crop Science) were also applied. Nofertilizers or supplementary irrigation were used.Aphid control took place daily.
Table 1 Codification du germoplasme Vicia faba L. var minor
Ordre Origine INAT NIAB Ordre Origine INAT NIAB
1 FB3-L10-P2 INAT-02-11 NV741 51 FB2-L3-P3 INAT-63-11 NV7912 FB3-L10-P3 INAT-03-11 NV742 52 FB2-L2-P1 INAT-66-11 NV7923 FB3-L9-P2 INAT-08-11 NV743 53 FB2-L2-P3 INAT-68-11 NV7934 FB3-L8-P1 INAT-09-11 NV744 54 FB2-L2-P4 INAT-69-11 NV7945 FB3-L8-P2 INAT-10-11 NV745 55 FB2-L6-P1 INAT-70-11 NV7956 FB3-L8-P3 INAT-11-11 NV746 56 FB2-L6-P2 INAT-71-11 NV7967 FB3-L8-P4 INAT-12-11 NV747 57 FB2-L6-P3 INAT-72-11 NV7978 FB3-L8-P5 INAT-13-11 NV748 58 FB2-L6-P4 INAT-73-11 NV7989 FB3-L7-P2 INAT-15-11 NV749 59 FB2-L6-P5 INAT-74-11 NV79910 FB3-L7-P3 INAT-16-11 NV750 60 FB2-L6-P6 INAT-75-11 NV80011 FB3-L7-P4 INAT-17-11 NV751 61 FB2-L5-P1 INAT-79-11 NV80112 FB3-L7-P7 INAT-19-11 NV752 62 FB2-L5-P3 INAT-81-11 NV80213 FB3-L6-P1 INAT-20-11 NV753 63 FB2-L5-P4 INAT-82-11 NV80314 FB3-L6-P2 INAT-21-11 NV754 64 FB2-L2-P6 INAT-83-11 NV80415 FB3-L6-P3 INAT-22-11 NV755 65 FB2-L7-P1 INAT-84-11 NV80516 FB3-L6-P4 INAT-23-11 NV756 66 FB2-L7-P2 INAT-85-11 NV80617 FB3-L6-P5 INAT-24-11 NV757 67 FB2-L7-P3 INAT-86-11 NV80718 FB3-L5-P1 INAT-25-11 NV758 68 FB2-L9-P1 INAT-87-11 NV80819 FB3-L5-P2 INAT-26-11 NV759 69 FB2-L9-P2 INAT-88-11 NV80920 FB3-L5-P3 INAT-27-11 NV760 70 FB2-L9-P3 INAT-89-11 NV81021 FB3-L5-P4 INAT-29-11 NV761 71 FB2-L9-P4 INAT-90-11 NV81122 FB3-L4-P1 INAT-31-11 NV762 72 FB2-L9-P5 INAT-91-11 NV81223 FB3-L4-P2 INAT-32-11 NV763 73 INAT-L2-10-local-pop INAT-L2-11 NV81324 FB3-L4-P5 INAT-34-11 NV764 74 FB2-L9-P6 INAT-92-11 NV81425 FB3-L3-P1 INAT-36-11 NV765 75 FB2-L8-P1 INAT-93-11 NV81526 FB3-L3-P3 INAT-38-11 NV766 76 L5P1-X-L9P1 INAT-L3-11 NV81627 FB3-L3-P4 INAT-39-11 NV767 77 FB2-L8-P2 INAT-94-11 NV81728 FB3-L3-P5 INAT-40-11 NV768 78 FB2-L8-P3 INAT-95-11 NV81829 FB3-L3-P6 INAT-41-11 NV769 79 Saber-02-L6P1 INAT-SB02-11 NV81930 FB3-L2-P1 INAT-42-11 NV770 80 FB2-L8-P4 INAT-96-11 NV82031 FB3-L2-P2 INAT-43-11 NV771 81 FB2-L10-P1 INAT-97-11 NV82132 FB3-L2-P3 INAT-44-11 NV772 82 FB2-L10-P2 INAT-98-11 NV82233 FB3-L2-P4 INAT-45-11 NV773 83 FB2-L10-P3 INAT-99-11 NV82334 FB3-L2-P5 INAT-46-11 NV774 84 FB2-L10-P4 INAT-100-11 NV82435 FB3-L1-P1 INAT-47-11 NV775 85 FB1-L2-P2 INAT-102-11 NV82536 FB3-L1-P2 INAT-48-11 NV776 86 FB1-L1-P2 INAT-103-11 NV82637 FB3-L1-P3 INAT-49-11 NV777 87 FB1-L3-P2 INAT-106-11 NV82738 FB3-L1-P4 INAT-50-11 NV778 88 FB1-L4-P2 INAT-108-11 NV82839 FB3-L1-P5 INAT-51-11 NV779 89 FB1-L4-P3 INAT-109-11 NV82940 FB2-L1-P4 INAT-54-11 NV780 90 FB1-L4-P5 INAT-111-11 NV83041 FB3-L1-P6 INAT-52-11 NV781 91 FB1-L5-P2 INAT-114-11 NV83142 FB2-L1-P1 INAT-53-11 NV782 92 FB1-L5-P3 INAT-115-11 NV83243 FB2-L1-P5 INAT-55-11 NV783 93 FB1-L6-P6 INAT-118-11 NV83344 FB2-L2-P1 INAT-56-11 NV784 94 FB1-L6-P7 INAT-119-11 NV83445 FB2-L2-P2 INAT-57-11 NV785 95 FB1-L6-P8 INAT-120-11 NV83546 FB2-L2-P3 INAT-58-11 NV786 96 FB1-L7-P4 INAT-121-11 NV836
Legume Genomics and Genetics 2014, Vol. 5, No. 3, 7-24http://lgg.biopublisher.ca
10
Continuing Table 1
Ordre Origine INAT NIAB Ordre Origine INAT NIAB
47 FB2-L2-P4 INAT-59-11 NV787 97 FB1-L6-P2 INAT-124-11 NV83748 FB2-L2-P5 INAT-60-11 NV788 98 FB1-L6-P3 INAT-125-11 NV83849 FB2-L3-P1 INAT-61-11 NV789 99 FB1-L10-P1 INAT-126-11 NV83950 FB2-L3-P2 INAT-62-11 NV790 100 FB1-L10-P2 INAT-127-11 NV840
1.3 MeasurementsAll traits (Table 2) were measured and recorded usingrecommended scales in accordance with the
International Union for the Protection of NewVarieties (UPOV, 2002) and (Biodiversityinternational, IBPGR, 1985) faba bean descriptors.
Table 2 Morphological traits used for the description of the field bean lines and controls
Trait Abbreviation Scale
Stipule spot SSP 1 ‘abscent’ ; 9 ‘precence’Lodging LOD 3 ‘weak;5 ‘medium’;7 ‘strong’Leaflet width LEW 3 ‘narrow’;5 ‘medium’;7 ‘broad’Leaflet: position of maximum width LPW 1 ‘towards tip’ ;2’at middle’;3 ‘towards base’StemAnthocyanine pigmentation SAP 3 ‘weak;5 ‘medium’;7 ‘strong’Growth type of plants (habit) GWHColour of melanin spot of Wing CMS 1 ‘abscent’ ; 9 ‘precence’Melanin spot of standard (streaks) MSS 0‘absence ’.3‘slight’;5 ‘moderate’;7 ‘intense’Anthocyanin coloration of standard ACS 1 ‘abscent’ ; 9 ‘precence’Total Number of nodes TNN --------Branching BRG --------100-Seed weight 100-SW GTotal Number of pods per plant TNP --------Time of flowering (50% of the plants with at least onefloweropened)
NDF Days
Number of days for first pod setting NDP DaysNumber of days to maturity NDM DaysLeaf Area: one leaf in the 5th flowering node LAR (cm2/leaf)Pod angles PAG °Standard lenght STL (cm)Nbre of leflets /fifth flowring node leaf Nrefol ------Number of pods with 4 seed (NP4S) NP4S ------Number of pods with 3 seed (NP3S) NP3S ------Number of pods with 2 seed (NP2S) NP2S ------Number of pods with 1 seed (NP1S) NP1S ------Seedyield per plant SYP seed/plantHilumcolour HLC 1 ‘abscent’ ; 9 ‘precence’Pod Shape PShfinal plant height (cm) FHP (cm)Branching from the main stem Brg ------Main stem width DTM (cm)Total Seed yield per plant TSP
Note: MS: mean square; CV: coefficient of variation; SD: standard deviation; R2: coefficient of determination; ns: not significant; *:significant at p <0.05; ** highly significant p <0.01; ***: very highly significant p <0.001; na: not applicable; FPH: final plant height (cm);TNN: total Number of nodes; LA: leaf area: one leaf in the 5th flowering node; MSW:Main stem width; StL: Standard length; Br: branching;FT: flowering time of flowering (50% of the plants with at least one opened flower); NDM: number of days to maturity; TNP: total numberof pods per plant; PA: pod angles; NL: number of leaflets; NP4S: number of pods with 4 seeds; NP3S: number of pods with 3 seeds; NP2S:number of pods with 2 seeds; NP1S: number of pods with 1 seed; TSP: total seeds per plant; HLC: hilum color; PSh: pod shape; SW:100-seed weight

Legume Genomics and Genetics 2014, Vol. 5, No. 3, 7-24http://lgg.biopublisher.ca
11
1.4 Statistical AnalysisSimple descriptive statistics (e.g., mean andcoefficient of variation) were used to comparevariation among the lines. Analysis of variance(ANOVA) was also carried out. Means were comparedusing least significant difference (LSD) test. Allcomputations were carried out in Genstat 14.0 (Payneet al., 2007). Hierarchical clustering of theninety-seven breeding lines and the three controlswere based on the phenotypic traits using Euclideandistances. A dendrogram was created using Ward’smethod (1964) implemented in the Xlstat (2012)software.
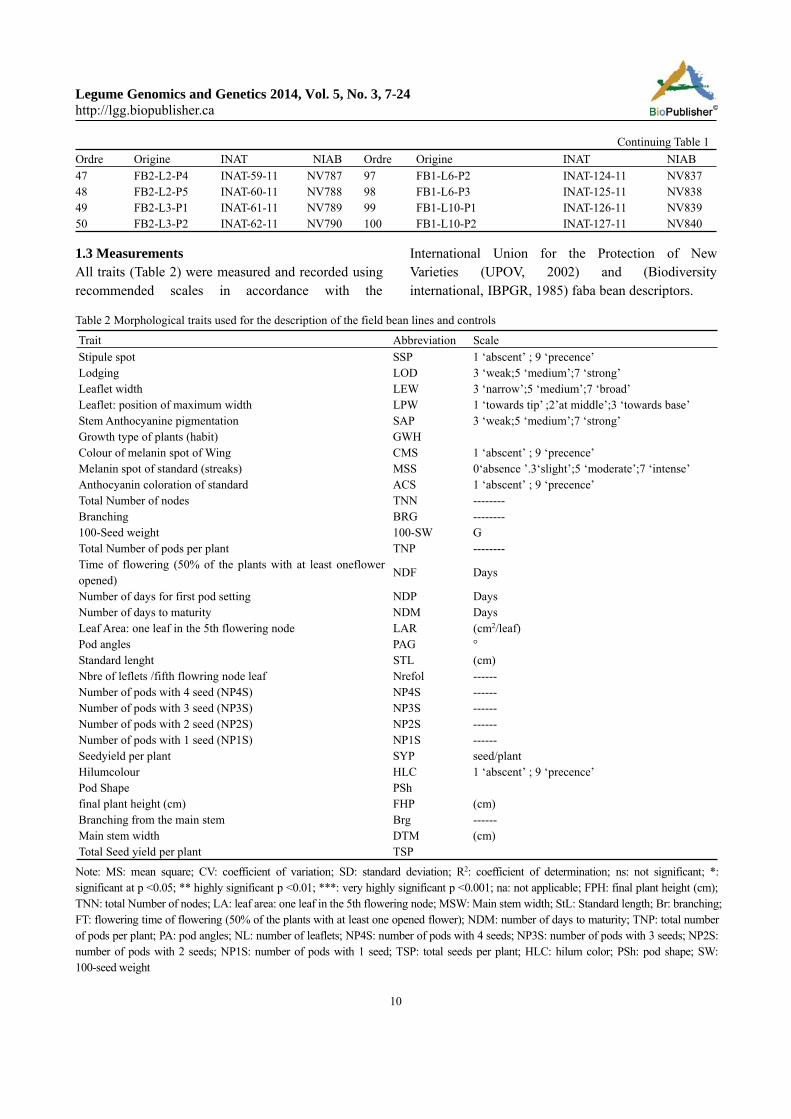
2 Results2.1 Qualitative traitsThere was no variation for stipule spot pigmentation;all lines and controls were spotted. All lines had lowor moderately low susceptibility to lodging. Leafletshape was mostly intermediate for 76% of lines whichhave SSP type 1, while 21.6% had narrow leafletswith Lpmw type 2 and only 4.1% had large leafletswith LPW type 3 on the UPOV scale (UPOV, 2002).The two controls NV813 ‘INAT-L2’ and ‘INAT-saber02’ had intermediate leaflet shape while NV819‘INAT-L3’ had narrow type. Stem anthocyaninpigmentation showing two contrasting colors at thefour leaf stage which were confirmed at flowering
time (Figure 1). To sum up, 72% of the lines and the 3controls varieties had green stem withoutpigmentation or with only slight pigmented (Table 3and Figure 1); which correspond to scores 1, 2 and 3on the UPOV scale. 38% of lines had intenseanthocyanin pigmentation on their stem (Table 3)corresponding to UPOV scores of 5, 6; 7 and 8(Figure 1). All the anthocyanin pigmented stems hadalso pigmented flower standards.
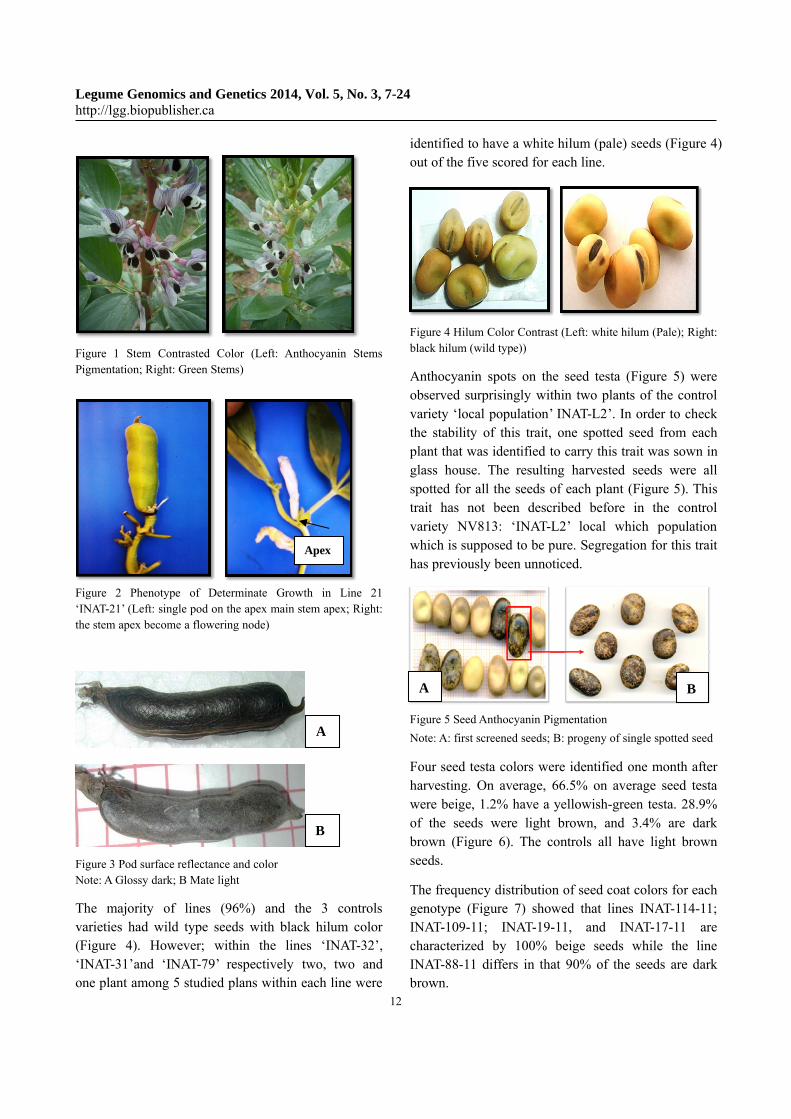
Determinate growth habit was identified in a singleplant of the five scored within line 'INAT-21'(FB3-L6-P2); a single flower flags the main stem andbranches apex at the end of flowering time.Furthermore, it is visible after flowering thanks to thepresence of single pod at the apex instead of avegetative node (Figure 2). All other lines and thethree controls had indeterminate growth.
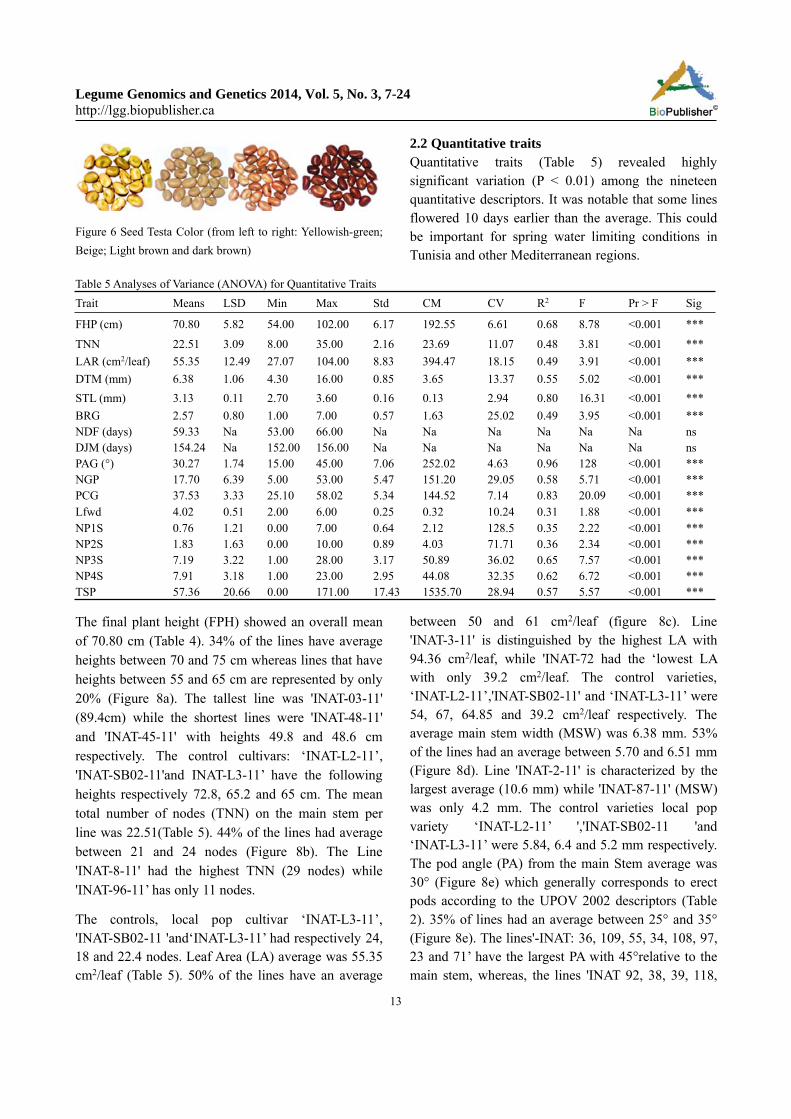
All lines and controls had wild type common flowercolor and flower standards with intense anthocyaninstreaks (purple pigment) and a dark melanin spot ontheir wings. The Intensity of the flower standardstreaks did not vary. Pod surface reflectance, and podcolor at maturity did vary (Table 4). All controls and54% of the lines had glossy dark pods (Figure 3)compared to 46% with a matt surface and a light color(Figure 3).
Table 3 Classification of lines according to the stem anthocyanin pigmentation intensity
AnthocyanicPigmentation Lines ’ INAT –X‘
Abscent or weak
Control NV813-L2(pop-local). NV816-L3 (pure line) NV819 L4 (saber02)
Lines :INAT –X(72%)
23.27.40.49.68.69.74.75.82.87.91.21.22.24.25.36.41.56.70.71.72.81.85.88.89.92.97.99.100.102.103.108.114.124.16.17.20.26.29.31.34.38.39.42.47.54.57.58.59.60.63.73.79.84.86.90.93.94.95.96.98.109.111.118.120.121.125.126.127
IntenseINAT –X(38%)
2.8.9.10.19.32.43.44.45.46.48.50.52.53.55.61.66.83.106.115.119.15.51.3.11.12.62
Table 4 Classification of Lines According to the Intensity of Anthocyanin
Pod surface reflectancean pod color
Lignées ’ INAT –X
glossydark
Control L2 (pop-local). L3 (pure line). L4 (saber02)
LinesINAT –X(54%)
2.8.10.12.13.21.23.29.34.40.42.44.45.46.47.48.49.50.51.53. 55. 56. 57. 60. 61.62.63. 66. 71. 72. 74. 75. 81. 86. 87. 88.89.94. 99. 100. 102. 103. 108. 111. 114.118. 119.120. 121. 124.125.126
MatteLight
INAT –X(46%)
3.9.11.15.16.17.19 .20.22.24.25.26.27.31.32.36.38.39.41.43.54.52.58.59.68.69.70.73.79.82.83.84.85.90.91.92.93.95 .96.97.98.106.109.115.127
Legume Genomics and Genetics 2014, Vol. 5, No. 3, 7-24http://lgg.biopublisher.ca
12
Figure 1 Stem Contrasted Color (Left: Anthocyanin StemsPigmentation; Right: Green Stems)
Figure 2 Phenotype of Determinate Growth in Line 21‘INAT-21’ (Left: single pod on the apex main stem apex; Right:the stem apex become a flowering node)
Figure 3 Pod surface reflectance and colorNote: A Glossy dark; B Mate light
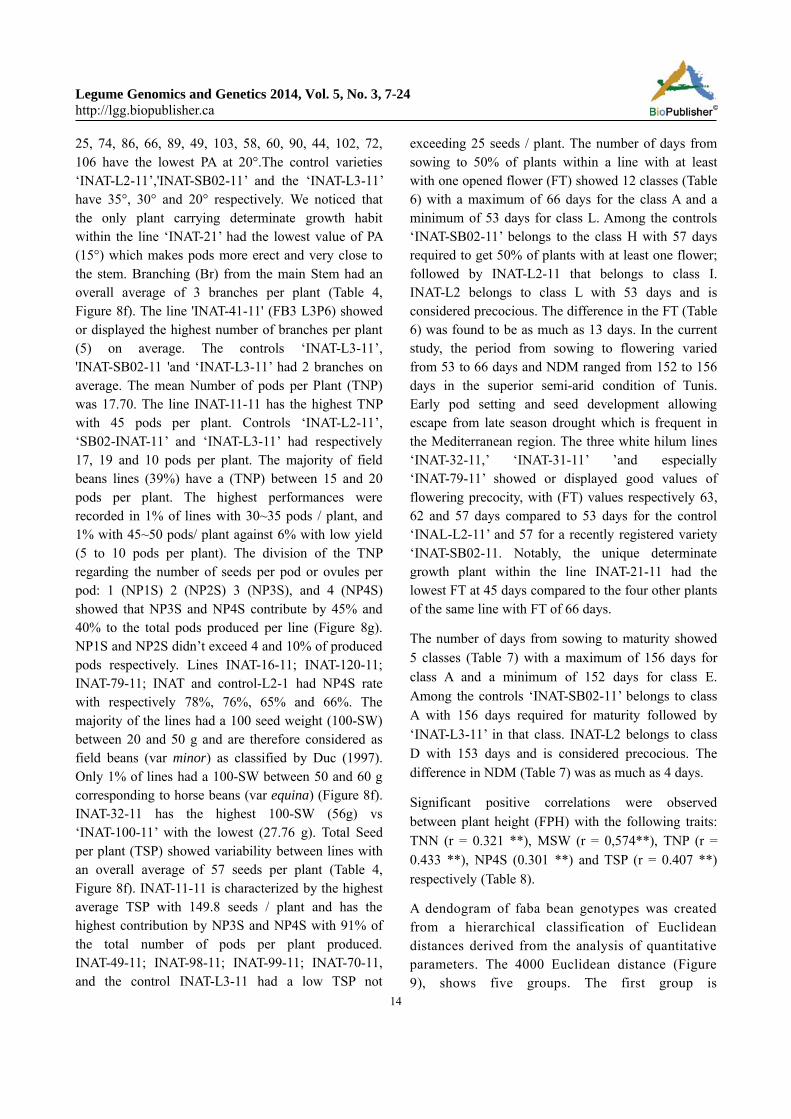
The majority of lines (96%) and the 3 controlsvarieties had wild type seeds with black hilum color(Figure 4). However; within the lines ‘INAT-32’,‘INAT-31’and ‘INAT-79’ respectively two, two andone plant among 5 studied plans within each line were
identified to have a white hilum (pale) seeds (Figure 4)out of the five scored for each line.
Figure 4 Hilum Color Contrast (Left: white hilum (Pale); Right:black hilum (wild type))
Anthocyanin spots on the seed testa (Figure 5) wereobserved surprisingly within two plants of the controlvariety ‘local population’ INAT-L2’. In order to checkthe stability of this trait, one spotted seed from eachplant that was identified to carry this trait was sown inglass house. The resulting harvested seeds were allspotted for all the seeds of each plant (Figure 5). Thistrait has not been described before in the controlvariety NV813: ‘INAT-L2’ local which populationwhich is supposed to be pure. Segregation for this traithas previously been unnoticed.
Figure 5 Seed Anthocyanin Pigmentation
Note: A: first screened seeds; B: progeny of single spotted seed
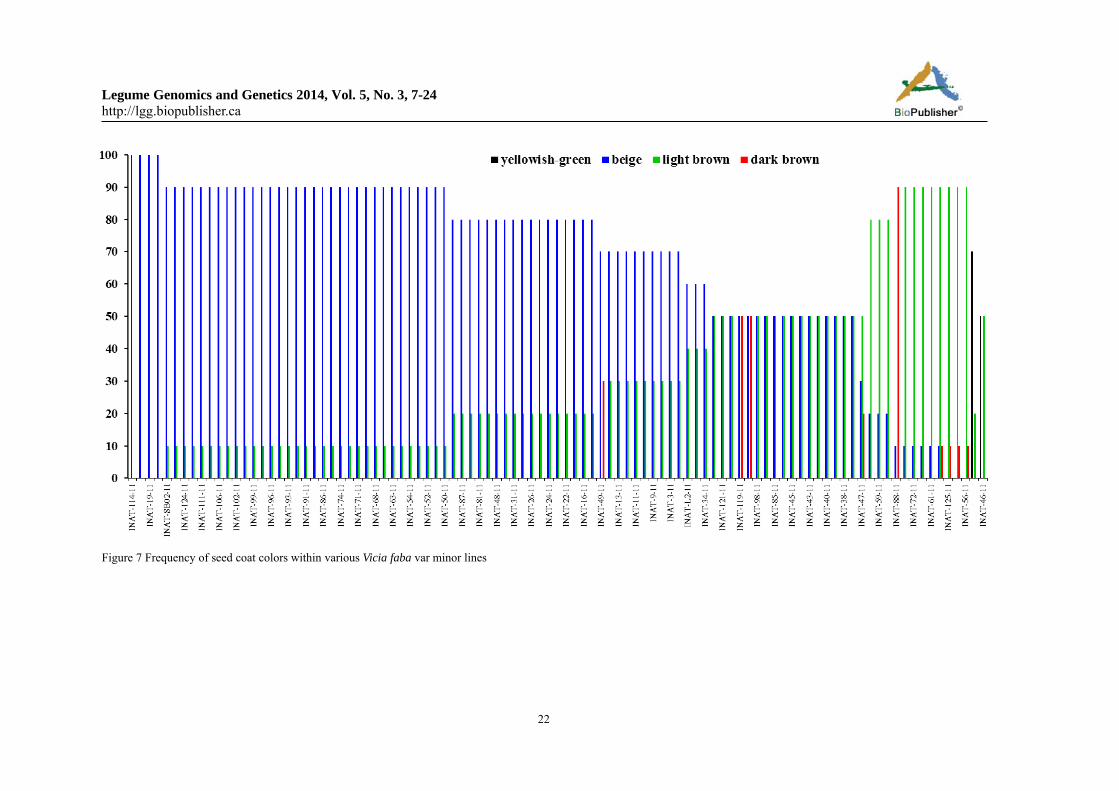
Four seed testa colors were identified one month afterharvesting. On average, 66.5% on average seed testawere beige, 1.2% have a yellowish-green testa. 28.9%of the seeds were light brown, and 3.4% are darkbrown (Figure 6). The controls all have light brownseeds.
The frequency distribution of seed coat colors for eachgenotype (Figure 7) showed that lines INAT-114-11;INAT-109-11; INAT-19-11, and INAT-17-11 arecharacterized by 100% beige seeds while the lineINAT-88-11 differs in that 90% of the seeds are darkbrown.
Apex
A
B
A B
Legume Genomics and Genetics 2014, Vol. 5, No. 3, 7-24http://lgg.biopublisher.ca
13
Figure 6 Seed Testa Color (from left to right: Yellowish-green;
Beige; Light brown and dark brown)
2.2 Quantitative traitsQuantitative traits (Table 5) revealed highlysignificant variation (P < 0.01) among the nineteenquantitative descriptors. It was notable that some linesflowered 10 days earlier than the average. This couldbe important for spring water limiting conditions inTunisia and other Mediterranean regions.
Table 5 Analyses of Variance (ANOVA) for Quantitative Traits
Trait Means LSD Min Max Std CM CV R2 F Pr > F Sig
FHP (cm) 70.80 5.82 54.00 102.00 6.17 192.55 6.61 0.68 8.78 <0.001 ***
TNN 22.51 3.09 8.00 35.00 2.16 23.69 11.07 0.48 3.81 <0.001 ***
LAR (cm2/leaf) 55.35 12.49 27.07 104.00 8.83 394.47 18.15 0.49 3.91 <0.001 ***
DTM (mm) 6.38 1.06 4.30 16.00 0.85 3.65 13.37 0.55 5.02 <0.001 ***
STL (mm) 3.13 0.11 2.70 3.60 0.16 0.13 2.94 0.80 16.31 <0.001 ***
BRG 2.57 0.80 1.00 7.00 0.57 1.63 25.02 0.49 3.95 <0.001 ***NDF (days) 59.33 Na 53.00 66.00 Na Na Na Na Na Na nsDJM (days) 154.24 Na 152.00 156.00 Na Na Na Na Na Na nsPAG (°) 30.27 1.74 15.00 45.00 7.06 252.02 4.63 0.96 128 <0.001 ***NGP 17.70 6.39 5.00 53.00 5.47 151.20 29.05 0.58 5.71 <0.001 ***PCG 37.53 3.33 25.10 58.02 5.34 144.52 7.14 0.83 20.09 <0.001 ***Lfwd 4.02 0.51 2.00 6.00 0.25 0.32 10.24 0.31 1.88 <0.001 ***NP1S 0.76 1.21 0.00 7.00 0.64 2.12 128.5 0.35 2.22 <0.001 ***NP2S 1.83 1.63 0.00 10.00 0.89 4.03 71.71 0.36 2.34 <0.001 ***NP3S 7.19 3.22 1.00 28.00 3.17 50.89 36.02 0.65 7.57 <0.001 ***NP4S 7.91 3.18 1.00 23.00 2.95 44.08 32.35 0.62 6.72 <0.001 ***TSP 57.36 20.66 0.00 171.00 17.43 1535.70 28.94 0.57 5.57 <0.001 ***
The final plant height (FPH) showed an overall meanof 70.80 cm (Table 4). 34% of the lines have averageheights between 70 and 75 cm whereas lines that haveheights between 55 and 65 cm are represented by only20% (Figure 8a). The tallest line was 'INAT-03-11'(89.4cm) while the shortest lines were 'INAT-48-11'and 'INAT-45-11' with heights 49.8 and 48.6 cmrespectively. The control cultivars: ‘INAT-L2-11’,'INAT-SB02-11'and INAT-L3-11’ have the followingheights respectively 72.8, 65.2 and 65 cm. The meantotal number of nodes (TNN) on the main stem perline was 22.51(Table 5). 44% of the lines had averagebetween 21 and 24 nodes (Figure 8b). The Line'INAT-8-11' had the highest TNN (29 nodes) while'INAT-96-11’ has only 11 nodes.
The controls, local pop cultivar ‘INAT-L3-11’,'INAT-SB02-11 'and‘INAT-L3-11’ had respectively 24,18 and 22.4 nodes. Leaf Area (LA) average was 55.35cm2/leaf (Table 5). 50% of the lines have an average
between 50 and 61 cm2/leaf (figure 8c). Line'INAT-3-11' is distinguished by the highest LA with94.36 cm2/leaf, while 'INAT-72 had the ‘lowest LAwith only 39.2 cm2/leaf. The control varieties,‘INAT-L2-11’,'INAT-SB02-11' and ‘INAT-L3-11’ were54, 67, 64.85 and 39.2 cm2/leaf respectively. Theaverage main stem width (MSW) was 6.38 mm. 53%of the lines had an average between 5.70 and 6.51 mm(Figure 8d). Line 'INAT-2-11' is characterized by thelargest average (10.6 mm) while 'INAT-87-11' (MSW)was only 4.2 mm. The control varieties local popvariety ‘INAT-L2-11’ ','INAT-SB02-11 'and‘INAT-L3-11’ were 5.84, 6.4 and 5.2 mm respectively.The pod angle (PA) from the main Stem average was30° (Figure 8e) which generally corresponds to erectpods according to the UPOV 2002 descriptors (Table2). 35% of lines had an average between 25° and 35°(Figure 8e). The lines'-INAT: 36, 109, 55, 34, 108, 97,23 and 71’ have the largest PA with 45°relative to themain stem, whereas, the lines 'INAT 92, 38, 39, 118,
Legume Genomics and Genetics 2014, Vol. 5, No. 3, 7-24http://lgg.biopublisher.ca
14
25, 74, 86, 66, 89, 49, 103, 58, 60, 90, 44, 102, 72,106 have the lowest PA at 20°.The control varieties‘INAT-L2-11’,'INAT-SB02-11’ and the ‘INAT-L3-11’have 35°, 30° and 20° respectively. We noticed thatthe only plant carrying determinate growth habitwithin the line ‘INAT-21’ had the lowest value of PA(15°) which makes pods more erect and very close tothe stem. Branching (Br) from the main Stem had anoverall average of 3 branches per plant (Table 4,Figure 8f). The line 'INAT-41-11' (FB3 L3P6) showedor displayed the highest number of branches per plant(5) on average. The controls ‘INAT-L3-11’,'INAT-SB02-11 'and ‘INAT-L3-11’ had 2 branches onaverage. The mean Number of pods per Plant (TNP)was 17.70. The line INAT-11-11 has the highest TNPwith 45 pods per plant. Controls ‘INAT-L2-11’,‘SB02-INAT-11’ and ‘INAT-L3-11’ had respectively17, 19 and 10 pods per plant. The majority of fieldbeans lines (39%) have a (TNP) between 15 and 20pods per plant. The highest performances wererecorded in 1% of lines with 30~35 pods / plant, and1% with 45~50 pods/ plant against 6% with low yield(5 to 10 pods per plant). The division of the TNPregarding the number of seeds per pod or ovules perpod: 1 (NP1S) 2 (NP2S) 3 (NP3S), and 4 (NP4S)showed that NP3S and NP4S contribute by 45% and40% to the total pods produced per line (Figure 8g).NP1S and NP2S didn’t exceed 4 and 10% of producedpods respectively. Lines INAT-16-11; INAT-120-11;INAT-79-11; INAT and control-L2-1 had NP4S ratewith respectively 78%, 76%, 65% and 66%. Themajority of the lines had a 100 seed weight (100-SW)between 20 and 50 g and are therefore considered asfield beans (var minor) as classified by Duc (1997).Only 1% of lines had a 100-SW between 50 and 60 gcorresponding to horse beans (var equina) (Figure 8f).INAT-32-11 has the highest 100-SW (56g) vs‘INAT-100-11’ with the lowest (27.76 g). Total Seedper plant (TSP) showed variability between lines withan overall average of 57 seeds per plant (Table 4,Figure 8f). INAT-11-11 is characterized by the highestaverage TSP with 149.8 seeds / plant and has thehighest contribution by NP3S and NP4S with 91% ofthe total number of pods per plant produced.INAT-49-11; INAT-98-11; INAT-99-11; INAT-70-11,and the control INAT-L3-11 had a low TSP not
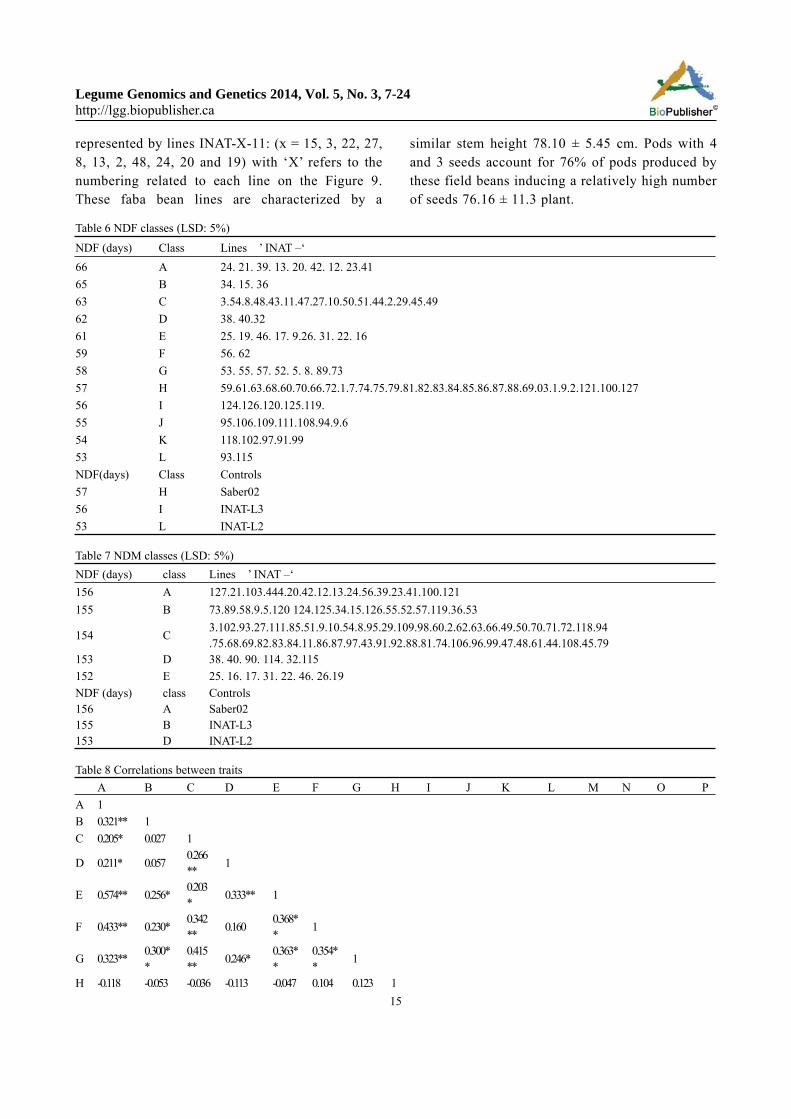
exceeding 25 seeds / plant. The number of days fromsowing to 50% of plants within a line with at leastwith one opened flower (FT) showed 12 classes (Table6) with a maximum of 66 days for the class A and aminimum of 53 days for class L. Among the controls‘INAT-SB02-11’ belongs to the class H with 57 daysrequired to get 50% of plants with at least one flower;followed by INAT-L2-11 that belongs to class I.INAT-L2 belongs to class L with 53 days and isconsidered precocious. The difference in the FT (Table6) was found to be as much as 13 days. In the currentstudy, the period from sowing to flowering variedfrom 53 to 66 days and NDM ranged from 152 to 156days in the superior semi-arid condition of Tunis.Early pod setting and seed development allowingescape from late season drought which is frequent inthe Mediterranean region. The three white hilum lines‘INAT-32-11,’ ‘INAT-31-11’ ’and especially‘INAT-79-11’ showed or displayed good values offlowering precocity, with (FT) values respectively 63,62 and 57 days compared to 53 days for the control‘INAL-L2-11’ and 57 for a recently registered variety‘INAT-SB02-11. Notably, the unique determinategrowth plant within the line INAT-21-11 had thelowest FT at 45 days compared to the four other plantsof the same line with FT of 66 days.
The number of days from sowing to maturity showed5 classes (Table 7) with a maximum of 156 days forclass A and a minimum of 152 days for class E.Among the controls ‘INAT-SB02-11’ belongs to classA with 156 days required for maturity followed by‘INAT-L3-11’ in that class. INAT-L2 belongs to classD with 153 days and is considered precocious. Thedifference in NDM (Table 7) was as much as 4 days.
Significant positive correlations were observedbetween plant height (FPH) with the following traits:TNN (r = 0.321 **), MSW (r = 0,574**), TNP (r =0.433 **), NP4S (0.301 **) and TSP (r = 0.407 **)respectively (Table 8).
A dendogram of faba bean genotypes was createdfrom a hierarchical classification of Euclideandistances derived from the analysis of quantitativeparameters. The 4000 Euclidean distance (Figure9), shows five groups. The first group is
Legume Genomics and Genetics 2014, Vol. 5, No. 3, 7-24http://lgg.biopublisher.ca
15
represented by lines INAT-X-11: (x = 15, 3, 22, 27,8, 13, 2, 48, 24, 20 and 19) with ‘X’ refers to thenumbering related to each line on the Figure 9.These faba bean lines are characterized by a
similar stem height 78.10 ± 5.45 cm. Pods with 4and 3 seeds account for 76% of pods produced bythese field beans inducing a relatively high numberof seeds 76.16 ± 11.3 plant.
Table 6 NDF classes (LSD: 5%)
NDF (days) Class Lines ’ INAT –‘
66 A 24. 21. 39. 13. 20. 42. 12. 23.41
65 B 34. 15. 36
63 C 3.54.8.48.43.11.47.27.10.50.51.44.2.29.45.49
62 D 38. 40.32
61 E 25. 19. 46. 17. 9.26. 31. 22. 16
59 F 56. 62
58 G 53. 55. 57. 52. 5. 8. 89.73
57 H 59.61.63.68.60.70.66.72.1.7.74.75.79.81.82.83.84.85.86.87.88.69.03.1.9.2.121.100.127
56 I 124.126.120.125.119.
55 J 95.106.109.111.108.94.9.6
54 K 118.102.97.91.99
53 L 93.115
NDF(days) Class Controls
57 H Saber02
56 I INAT-L3
53 L INAT-L2
Table 7 NDM classes (LSD: 5%)
NDF (days) class Lines ’ INAT –‘
156 A 127.21.103.444.20.42.12.13.24.56.39.23.41.100.121
155 B 73.89.58.9.5.120 124.125.34.15.126.55.52.57.119.36.53
154 C3.102.93.27.111.85.51.9.10.54.8.95.29.109.98.60.2.62.63.66.49.50.70.71.72.118.94.75.68.69.82.83.84.11.86.87.97.43.91.92.88.81.74.106.96.99.47.48.61.44.108.45.79
153 D 38. 40. 90. 114. 32.115
152 E 25. 16. 17. 31. 22. 46. 26.19
NDF (days) class Controls156 A Saber02155 B INAT-L3153 D INAT-L2
Table 8 Correlations between traits
A B C D E F G H I J K L M N O P
A 1
B 0.321** 1
C 0.205* 0.027 1
D 0.211* 0.0570.266**
1
E 0.574** 0.256*0.203*
0.333** 1
F 0.433** 0.230*0.342**
0.1600.368**
1
G 0.323**0.300**
0.415**
0.246*0.363**
0.354**
1
H -0.118 -0.053 -0.036 -0.113 -0.047 0.104 0.123 1

Legume Genomics and Genetics 2014, Vol. 5, No. 3, 7-24http://lgg.biopublisher.ca
16
Continuing table 8
A B C D E F G H I J K L M N O P
I 0.479** 0.290** 0.052 0.1020.378**
0.362**
0.389**
-0.048
1
J -0.028 0.174 -0.030 0.199* 0.063 0.046 0.004 0.175 0.108 1
K 0.235* 0.252* 0.062 0.0670.264**
0.052 -0.186-0.085
0.068-0.075
1
L 0.301** 0.126 0.181 0.056 0.1360.700**
0.113 0.0480.364**
0.095 0.106 1
M 0.287** 0.1770.300**
0.203*0.307**
0.797**
0.306**
0.127 0.153 0.028 -0.029 0.197* 1
N 0.382** 0.240* 0.244* 0.0580.397**
0.584**
0.456**
0.0470.312**
-0.059
0.000 0.1460.435**
1
O 0.339** 0.157 0.250* 0.0140.409**
0.528**
0.330**
-0.028
0.213*-0.103
0.087 0.1910.317**
0.734**
1
P 0.407** 0.1950.314**
0.1610.313**
0.972**
0.283**
0.1100.359**
.0066 0.055 0.806**0.718**
0.446**
0.400** 1
Note: A: final plant height (cm); B: Number of nodes; C: Branching; D: 100-seed weight (g); E: mother stem diameter (mm); F: pods
per plant; G: early flowering (days); H: Maturity seeds (days); I: Living in the 5th leaf node flowering (cm2/feuille); J: Tilting pods
(degree); K: the standard lengths (cm); L: pods to 4 seeds; M: 3 seed pods; N: cloves 2 seeds; O: 1-seeded pods; P: seeds per plant; *:
significant at p <0.05. ** highly significant p <0.01
Table 9 clustering according to traits similarity
Groupes FHP TNN BRG PCGDT
MTNP NDF NDM LAR PAG
ST
L
NG4
S
NG3
S
NG2
S
NG
1SSYP
G1 : 12
lignées
µ 78.40 24.07 2.98 39.77 7.49 24.48 64.42 154.42 67.85 29.08 3.15 9.87 9.48 3.30 1.80 76.32
σ 5.29 2.07 0.41 3.58 1.31 3.55 1.44 1.44 10.59 4.44 0.22 3.41 2.46 1.06 1.12 10.75
G2 : 31
lignées
µ 70.63 22.20 2.38 36.39 6.23 19.95 57.67 154.30 54.64 31.62 3.13 8.97 8.33 1.84 0.81 64.75
σ 5.12 2.52 0.34 4.38 0.47 2.85 3.21 0.83 6.55 5.93 0.17 2.77 2.56 0.63 0.40 9.39
G3 : 1
lignéeµ 82.80 23 3.8 47.80 7.1 45.6 64 154 63.22 26 3.42 17.2 24.8 3 0.6 150
G4: 30
lignées
µ 70.41 22.58 2.74 40.37 6.45 15.66 61.24 154.03 54.00 32.69 3.12 4.07 7.08 6.11 1.66 50.60
σ 5.40 1.88 0.68 6.17 0.76 1.93 3.69 1.32 8.73 8.14 0.16 0.35 1.88 2.24 0.64 6.13
G5: 26
lignées
µ 67.28 21.68 2.31 34.72 5.92 12.35 56 154.24 50.75 25.52 3.16 3.98 5.78 4.81 1.31 40.64
σ 5.27 2.77 0.45 3.96 0.61 2.55 2.36 0.76 4.79 5.94 0.15 0.20 1.62 1.44 0.59 8.62
Note: FPH:Final plant height (cm); TNN: Total Number of nodes; LA: Leaf Area: one leaf in the 5th flowering node; MSW: Main
stem width; StL: Standard length; BR: Branching; FT: Time of flowering (50% of the plants with at least one opened flower; NDM:
Number of days to maturity; TNP: Total Number of pods per plant; PA: Pod angles; NP4S: number of pods with 4 seeds; NP3S:
number of pods with 3 seeds; NP2S: number of pods with 2 seeds; NP1S: number of pods with 1 seed; TSP: total number of seeds
per plant
Group 2 is formed by the INAT-X-11 with X: 21, 10,47, 43, 79, 83, 82, 96, 123 and 63, 93, 57, 83, 91, 26,119, 124, 61 , 56 and 126, 81, 109, 55, 62, 92, 84, 111,66, 120, and the control INAT-SBR02-11 andINAT-L2-11are classified together into the third groupwith total pods and seeds per plant, respectively, 19.95± 2.85 pods and 64.75 ± 9.39 seeds. These lines had incommon an NP4S that represents 57% of the totalproduced pods. Group 3 is only formed by
INAT-11-11 and is distinguished on production ofpods per plant and higher seed yield with respectively45.6 pods / plant and 149.8 seeds per plant. Group 4clusters lines 25, 9, 16, 51, 50, 46, 17, 45 and 44, 38,41, 40, 72, 69, 52, 121, 68, 75, 39, 29, 97, 71 , 127, 42,23, 108, 36, and the two-line INAT 31-11 andINAT-32-11 identified as segregating for hilum color.These lines have in common a number of pods with 2and 3 seeds more representative.
Legume Genomics and Genetics 2014, Vol. 5, No. 3, 7-24http://lgg.biopublisher.ca
17
Group 5 is formed by the INAT-11-X lines with X:
115, 58, 118, 74,86, 93, 89, 60, 103, 106, 102, 90, 100,
88, 73, 114, 94, 59 , 87, 96, 49, 99, 70, 98, and
11-INAT-sbrx It is characterized by the lowest pod
yield at 12.35 ± 2.55 and the lowest number of seeds
per plant (40.64 ± 8.62) (Table 9).
3 DiscussionThe lines studied are important for their potential usein field bean pre-breeding programs and as a source ofdiversity. The lines represent the F4 generation afterselection that occurred mainly in open pollinationconditions. In this case outcrossing is inevitable.Unfortunately, information regarding the pattern ofgenetic diversity is not available on this set ofbreeding lines. In order to evaluate these lines anagro-morphological characterization was carried outas the starting point for selecting improved individuals.The results of this study indicated that there is geneticvariability among the 97 lines and the three controls.This variability could be utilized in a breedingprogram. Indeed, the lines carry some targetedqualitative traits such as determinate growth habit;characterized by a terminal inflorescence in the top ofthe stem. This is known to greatly decrease thenumber of flowering nodes after the beginning offlowering Huyghe (1998). Moreover, it has aconsiderable effect on reducing plant height andlodging and also promotes better partition ofassimilates between vegetative and reproductivegrowth and increases the harvest index (Avila et al.,2007). This trait is relevant according to Nadal et al.(2005) in facilitating crop management andmechanical harvesting. Several faba bean mutationsfor this trait are due to a single gene (Sjodin, 1971;Filipetti, 1986; Avilla et al., 2006). A diagnostic SCARmarker developed by (Avilla et al., 2006) has beenrecently transformed into a SNP marker by Cottage etal. (2012). The second trait of interest; the white hilumcharacter occurs at low frequency in the collection.Hilum colour is a simple Mendelian trait controlled bya single recessive gene with maternal control (Sirks,1931). Faba bean consumers have a preference forwhite hilum. Hence, this could be a valid target forselection in its own right. Moreover, Duc et al. (2004)and Duc et al. (1989) isolated a faba bean line with
20-fold less vicine and convicine than the wild-typeaverage. The low vicine-convicine (LVC) trait isinherited as a simple recessive Mendelian character(designated vc-) and was shown to be linked incoupling phase in the studied background (“line 1268”)to the colorless hilum character (Gutierrez et al., 2006).Thus, breeding with the vc- mutations should bestraightforward, as well as both economically andsocially beneficial. Some LVC cultivars have beenreleased by INRA and are marketed by RAGT, butthey are few in number and are not yet widely grownoutside their home country. Other breeders havestarted to exploit the vc- allele in their breedingprograms (Khamassi et al., 2013). Another traitidentified by this screening is spotted testa (Figure 8).This trait, rarely observed in faba bean germplasm,gives another empirical indication of the greatmorphological diversity present in this smallcollection. It may also be of interest as a phenotypictrait which could be used to identify a future marketsegment, in much the same way as variegated testamarkings define the “pinto” and “borlotto” marketclasses in Phaseolus bean. Further studies bygenotyping and chemical analysis are needed. All theINAT collection lines had a colored flower (linkedwith tannin level). This result is in agreement withthose of Oujiet al. (2011) and Yahia et al. (2012) whofound only the colored wild type flower in Tunisianfaba bean populations. The pod shape varies withinsome lines and between cultivars. This trait is aquality selection criterion which depends on thestandards of the validation board and on consumerdemand but we found no studies in which this trait isdiscussed for Vicia faba. All the lines are low ormoderately susceptible to lodging and would thereforebe acceptable for breeding because stem strength orability to stand is important to in harvesting(Gnanasambandam et al., 2012). The stiff-stem trait isone of the targeted traits in faba beans and iscontrolled by a single recessive gene (Frauen and Sass,1989). Seed coat color was mainly beige to brown asfound by Ricciardi (1985) and in contrast to Duke etal. (1995) who showed the dominance of green color.Leaf area reflects the size of the leaves and has a widevariability (Lawes, 1980; Polignano et al., 1987).According to Robertson and El-Sherbeeny (1991)
Legume Genomics and Genetics 2014, Vol. 5, No. 3, 7-24http://lgg.biopublisher.ca
18
selection should favor lines with small to medium leafarea to maximize photosynthesis efficiency. The sameauthor reported that breeders are in the process ofcollecting various resources, demonstrating thevariability of this character, to select those withreduced leaf surfaces to get a higher leaf area index.Lawes (1980) reported Vicia faba L withindeterminate growth habit and which have sometimesvery large values of leaf area may engender orproduce shading resulting in competition forassimilates between plants thereby limiting thepotential yield. The angle of the pods from the stemaxis is important for the mechanization of harvesting.This should be less than 90°, preferably the podsshould be as upright as possible Lawes et al. (1983).Regarding branching, the results are in agreement withSilim and Saxena (1992), Al-bariri and Shtaya (2013)and Karakoy et al. (2013) who all found widevariability of primary branching among Vicia faba.Such variation could be due to differential response toenvironmental conditions. Likewise, previous studiesin grain legumes presented this trait as very sensitiveto seed density and affected by both environmentaland genetic control (Huyghe, 1998). According toHuyghe et al. (1994), a negative correlation wasnoticed occasionally between the main stemnutritional contribution to the yield and the branchescontribution. Further studies on genotyping are neededto increase knowledge of branching pattern as this traithas nutritional effects. Some genes were discovered insome other grain legumes such as soybean (Glycinemax L. Merr). Indeed, two independent genes Br1 andBr2 which act on branching were discovered (Nelson,1996). In white lupin, the number of first–orderbranches is modified by the presence of a genecontrolling determinate growth habit Julier andHuyghe (1993). Considering the total number of seedproduced pod per plant, Lopez-Bellido et al. (2005)reported that this trait is a more important target forselection than the number of fertile nodes or thenumber of pods per fertile node and is generallycorrelated with yield. Moreover it is positivelycorrelated with plant density (Salih, 1989; Evans,1980; Stringi et al., 1986). Stutzel and Aufhammer(1992) reported that the number of pods per squaremeter was the most important factor correlated with
seed yield. The large number of plants per squaremeter compensates for the decrease in the number ofpods resulting from inter plant competition(Lopez-Bellido et al., 2005). Suso et al., (1996)reported significant differences in the number of seedsper pod among twelve genotypes of faba bean.Li-Juan et al. (1993) showed that the number of seedsper pod varies on average from 1.7 to 2.9 in acollection of 1500 accessions from different provincesof China. Abdelmola and Abuanja (2007) reported thatthe number of seeds per pod is influenced by geneticand environmental factors. The 100-SW is considereda major criterion for classification of botanicalvarieties of Vicia faba L. (Muratova, 1931; Duke,1997). Duke (1997) reported that faba bean (Viciafaba L. var major) has a 100-SW greater than or equalto 100 g, field bean (Vicia faba L. var minor) was lessthan 50 g, while types with medium seed size (Viciafaba L. var equina) have a 100-SW between 50 and100 g. This parameter varies significantly inPalestinians landraces of Vicia faba L. between 35.67and 239 g (Al-Bariri and Shtaya, 2013). Keneni et al.(2005) found an average of 42.31 g 100-SW amongEthiopian beans. Abbes et al. (2007) showed that the100-SW varies in faba bean Tunisian varieties from45.93 to 68.88 g. Whereas, Karakoyet al. (2013) foundlarge variability in this trait, ranging from 13.80 to166.75 within mixed collection of Turkish landracesand varieties. Correlation coefficients for theagro-morphological traits revealed some associationsthat agree with some previous studies; Bianco et al.(1979) showed a positive correlation between thenumber of seeds and plant height in field beans.Ulukan et al. (2003) reported the direct and indirecteffects of plant height, the number of pods per plantand number of seeds per pod on the biological yield infaba bean with a coefficient of determination (R2
=0.636). The same authors found a positivecorrelation between seed production and plant heighton the one hand and between 100-seed weight, seedweight per plant and biological yield. Fikreselassie(2012) found a significant positive correlationbetween the number of seeds per plant in Vicia faba L.with plant height (r = 0.734) and number of pods perplant (r = 0.654). In this study NP3S and NP4S werefound to have a highly significant contribution to the
Legume Genomics and Genetics 2014, Vol. 5, No. 3, 7-24http://lgg.biopublisher.ca
19
development of the number of seeds per plant withcoefficients (r = 0.806) and (r= 0.718) respectively.These are so highly correlated with the TNP.Fikreselassie (2012) showed that plants which shedthe greatest number of pods per plant produce moreseeds. Thus, selection for the number of pods providesa significant improvement in seed yield. Thedendrogram shows a phenotypic variability inperspective agronomic performance that may reflectthe degry of heterozygocity due to previousoutcrossing between these lines of Vicia faba L. varminor. Division of genotypes into groups (Table 8)will facilitate future work for the selection anddevelopment of new varieties. However, this firstclustering will be more significant when it will becompleted by the degree of purity of the samecollection using SNP genotyping.
The present work constitutes a first step in describinggenetic variability in the INAT collection. Theidentified lines with recessive qualitative trait arequite interesting, such white hilum, determinategrowth habit, and spotted seed; this last trait can beuseful as morphological trait during breedingexercises. We envisage in the future complementingthe present study with a genotypic survey on onesingle selected seed progeny of this collection bygenotyping with SNP (single nucleotidepolymorphism) markers validated by Cottage et al. (inpreparation) in order to better understand the geneticand genomic organization of this set of lines andcheck its purity. Consequently, this study is a first stepfor identify interesting lines as targets for subsequentcostly analysis such as the study of the genetic linkagebetween while hilum and low vicine and convicnecontent (anti-nutritional compound in the seed) allelevc- by HPLC.
ReferencesAguilera-Diaz C., and Recalme-Manrique L., 1995, Effects of
plant density and inorganic nitrogen fertilizer on field
beans (Vicia faba), Journal of Agricultural Science, 125:
87-93
http://dx.doi.org/10.1017/S0021859600074530
Avila C.M., Atienza S.G., Moreno M.T., and Torres A.M., 2007,
Development of a new diagnostic marker for growth habit
selection in faba bean (Vicia faba L.) breeding, Theoretical
and Applied Genetics 115(8): 1075-1082
http://dx.doi.org/10.1007/s00122-007-0633-y
Avila C.M., Nadal S., Moreno M.T., and Torres A.M., 2006,
Development of a simple PCR-based marker for the
determination of growth habit in Vicia faba. L. Using a
candidate gene approach, Molecular Breeding 17:185-190
http://dx.doi.org/10.1007/s11032-005-4075-4
Benachour K., Kamel L., and Michaël T., 2007, Rôle des
abeilles sauvages et domestiques (Hymenoptera: Apoidea)
dans la pollinisation de la fève (Vicia faba L. var. major)
(Fabaceae) en région de Constantine (Algérie). Annales de
la Société Entomologique de France 43: 213-219
http://dx.doi.org/10.1080/00379271.2007.10697513
Bond D.A., 1976, Field bean, Vicia faba (Legumillosae
papilionatae). In: Simmonds, N.W. (Ed.), Evolution of
Crop Plants. Longman, London, UK. pp.179-182
Bond D.A., and Poulsen M.H., 1983, Pollination. In: ed. P.D.
Hebblethwaite, The Faba Bean. Butterworth, London, pp.
77-101
Brown A.H.D., and Briggs J.D., 1991, Sampling strategies for
genetic variation in ex-situ collections of endangered plant
species, In: Falk D.A., and Holsinger K.E., (eds.),
Genetics and conservation of rare plants. Oxford
University Press, New York: 99-119
Cabrera A., 1988, Inheritance of flower color in Vicia faba L.,
FABIS Newsletter, 22: 2-7
Crofton G.R.A., and Bond D.A., 1998, A review on the
genetics of seed coat colour and hilum colour in field
beans (Vicia faba L.) with comments on some implications
of national listing and certification, Plant Varieties And
Seeds, 11: 97-100
Duc G., 1997, Faba bean (Vicia faba L.), Field Crops Research,
53: 99-109
http://dx.doi.org/10.1016/S0378-4290(97)00025-7
Duc G., Sixdenier G., Lila M., and Furstoss V., 1989, Search of
genetic variability for vicine and convicine content in
Vicia faba L. A first report of a gene which codes for
nearly zero-vicine and zero-convicine contents. In: Recent
advances of research in antinutritionnal Factors in legumes
seeds, J. Huisman, A.S.M. J.F.B. Van der Poel, I.E. Liener
(Eds) Pudoc, Wageningen, Netherlands (Pbs), pp.305-313
Duc G., Marget P., Page D., Domoney C., 2004, Facile
breeding markers to lower contents of vicine and
convicine in faba bean seeds and trypsin inhibitors in pea
seeds, In: Muzquiz M., Hill G.D., Cuadrado C., Pedrosa
M.M., Burbano C., (eds), Recent advances of research in
Legume Genomics and Genetics 2014, Vol. 5, No. 3, 7-24http://lgg.biopublisher.ca
20
antinutritional factors in legume seeds and oilseeds.
Wageningen Academic Publishers, Wageningen,
pp281-285
Evans L.T., 1980, The natural history of crop yield, American
Scientist, 68: 388-397
Filippetti A., 1986, Inheritance of determinate growth habit
induced in Vicia faba L. major by ethyl methane
sulphonate (EMS), Fabis News, 15:12-14
Frauen M., and Sass O., 1989, Inheritance and performance of
the stiff-strawed mutant in Vicia faba L. In Proceedings of
XII EUCARPIA Congress, Göttingen, Germany, pp.13-18
Gnanasambandam A., Paull J., Torres A., Kaur S., Leonforte T.,
Zong X., Yang T., and Materne M., 2012, Impact of
Molecular Technologies on Faba Bean (Vicia faba L.),
Breeding Strategies Agronomy, 132-166
Gous R.M., 2011, Evaluation of faba beans (Vicia faba cv Fiord)
as a protein source for broilers, South Africain Journal of
plant Animal Science, 41(2): 71-78
Gutierrez N., Avila C.M., Moreno M.T., and Torres A.M., 2008,
Development of SCAR markers linked to zt-2, one of the
genes controlling absence of tannins in faba bean,
Australian Journal of Agricultural Research 59: 62-68
http://dx.doi.org/10.1071/AR07019
Hebblethwaite P.D., 1983, In: Hebblethwaite P.D., (Ed.), the
Faba Bean. Butterworths, London.UK. pp.573
Huyghe C., Julier B., Harzic N., and Papineau J., 1994, Yield
and yield components of indeterminate autumn-sown
white lupin (Lupinus albus) cv. Lunoble, European Journal
of Agronomy, 3: 145-152
Huyghe C., 1993, Growth of white lupin seedlings during the
rosette stage as affected by seed size, Agronomie, 13:
145-153
http://dx.doi.org/10.1051/agro:19930209
Huyghe C., Harzic N., Julier B., and Papineau J., 1994,
Comparison of determinate and indeterminate
autumn-sown white lupins under the western European
climate, In: Dracup M., Palta J. (Eds.), Proceedings of the
First Australian Lupin Technical Symposium, DAWA,
Perth, Australia, pp.123-128
Huyghe C., 1998, Genetics and genetic modifications of plant
architecture in grain legumes: a review, Agronomie, 18:
383-411
http://dx.doi.org/10.1051/agro:19980505
Khamassi K., Ben Jeddi F., Hobbs D., Irigoyen J., Stoddard F.,
O’Sullivan D.M., and Jones H., 2013, A baseline study of
vicine-convicine levels in faba bean (Vicia faba L.)
germplasm, Plant Genetic Resources News Archive,
11(03): 250-257
http://dx.doi.org/10.1017/S1479262113000105
Keneni G., Mussa J., Tezera W., and Getnet D., 2005, Extent
and pattern of genetic diversity for morpho-agronomic
traits in Ethiopian highland pulse landraces II. Faba bean
(Vicia faba L.). Genetic Resources and Crop Evolution, 52:
551-561
http://dx.doi.org/10.1007/s10722-003-6022-8
Link W., Dixkens C., Singh M., and Schwall M., 1995, Genetic
diversity in European and Mediterranean faba bean
germplasm revealed by RAPD markers, Theoretical and
Applied Genetics, 90: 27-32
http://dx.doi.org/10.1007/BF00220992
Lopez-Bellido F.J., Lopez-Bellido L., Lopez-Bellido R.J., 2005,
Competition, growth and yield of faba bean. European
Journal of Agronomy, the Journal of the European Society
for Agronomy, 23(4): 359-378
Martini A., Migliorini P., Lorenzini G., Lotti C., Rosi Bellière
S., Squilloni S., Riccio F., Giorgetti A., and Casini M.,
2008, Production of grain legume crops alternative to soya
bean and their use in organic dairy production. In the 6th
IFOAM Organic World Congress, Modena, Italy
Nadal S., Cabello A., Flores F., and Moreno M.T., 2005, Effect
of growth habit on agronomic characters in faba bean,
Agriculturae Conspectus Scientificus, 70(2): 43-47
Naguib N.A., 2000, Morphological and chemical identification
of new varieties of some field crops, Ph. D. Thesis,
Faculty of Agric. Ain Shams University
Nelson R., 1996, The inheritance of a branching type in
soybean, Crop Science 36: 1150-1152
http://dx.doi.org/10.2135/cropsci1996.0011183X00360005
0014x
Ouji A., Rouaissi M., Raoudha A., and E.L. Gazzah M., 2010,
The use of reproductive vigor descriptors in studying
genetic variability in nine Tunisian faba beans, African
Journal of Biotechnology, 10: 896-904
Pilbeam C.J., Aktase J.K., Hebblethwaite P.D., and Wright S.D.,
1992, Yield production in two contrasting form of
spring-sown faba bean in relation to water supply, Field
Crops Research, 29: 273-287
http://dx.doi.org/10.1016/0378-4290(92)90030-D
Polignano G.B., Spagnoletti Zeuli P.L., 1985, Variation and
covariation in Vicia faba L. populations of Mediterranean
origins, Euphytica, 34: 659-668
http://dx.doi.org/10.1007/BF00035401
Legume Genomics and Genetics 2014, Vol. 5, No. 3, 7-24http://lgg.biopublisher.ca
21
Payne R.W., D.A. Murray, S.A. Harding, D.B. Baird, and
Soutar D.M., 2007, Genstat for Windows (10th Edition)
Introduction. VSN International, Hemel Hempstead
Ramsay G.R., and Pickersgill B., 1986, Interspecific
hybridisation between Vicia faba and other species of
Vicia: approaches delaying embryo abortion, Biol.
Zentralbl 105: 171-179
Robertson L.D., and EL-Sherbeeny M., 1991, Distribution of
discreetly scored descriptors in a pure line faba bean
(Vicia faba L.) germplasm collection, Euphytica, 57:
83-92
Ruggiero C., Stefania D.P., and Massimo F., 1999, Plant and
soi*l resistance to water flow in faba bean (Vicia faba L.
major Harz.). Plant Soil, 210: 219-231
http://dx.doi.org/10.1023/A:1004690101953
Salih F.A., 1989, Effect of sowing date and plant population per
hill on faba bean (Vicia faba) yield, FABIS Newsletter, 23:
15-19
Silim S.N., and Saxena M.C., 1992, Comparative performance
of some faba bean (Vicia faba L.) cultivars of
contrasting plant types. 2. Growth and development in
relation to yield. Journal of Agricultural Science 118:
333-342
http://dx.doi.org/10.1017/S0021859600070702
Sirks M.J., 1931, Beitrage zu einer genotypischen analyse der
ackerbohne Vicia faba L., Genetika, 13: 210-631
Stützel H., and Aufhammer W., 1992, Grain yield in
determinate and indeterminate cultivars of Vicia faba with
different plant distribution patterns and population
densities, The Journal of Agricultural Science, 118:
343-352
http://dx.doi.org/10.1017/S0021859600070714
Stringi L., Sarno R., Amato G., and Cristina L., 1986, Effects of
plant density on Vicia faba L. eqzcina and Vicia faba L.
minor in a semiarid environment in Southern Italy, FABIS
Newsletter, 15: 42-45
Suso M.J., Moreno M.T., and Cubero J.I., 1993, New isozyme
markers in Vicia faba: inheritance and linkage. Plant
Breeding 40: 105-111
Torres A.M., Avila C.M., Gutierrez N., Palomino C., Moreno
M.T., and Cubero J.I., 2010, Marker-assisted selection in
faba bean (Vicia faba L.). Field Crops Research,
115:243-252
http://dx.doi.org/10.1016/j.fcr.2008.12.002
Tufarelli V., Khan R.U., and Laudadio V., 2012, Evaluating the
suitability of field beans as a substitute for soybean meal
in early-lactating dairy cow: production and metabolic
responses, Journal of Animal Science, 83(2): 136-40
http://dx.doi.org/10.1111/j.1740-0929.2011.00934.x
Terzopoulos P.J., Kaltsikes P.J., and Bebeli P.J., 2003,
Collection, evaluation and classification of Greek
population of faba bean (Vicia faba L.), Genetic Resources
and Crop Evolution, 50: 373-381
http://dx.doi.org/10.1023/A:1023962618319
Terzopoulos P.J., and Bebeli P.J., 2008, Genetic diversity of
Mediterranean faba bean (Vicia faba L.) with ISSR
markers, Field Crops Research, 108: 39-44
http://dx.doi.org/10.1016/j.fcr.2008.02.015
Terzopoulos P.J., Kaltsikes P.J., and Bebeli P.J., 2004,
Characterization of Greek populations of faba bean (Vicia
faba L.) and their evaluation using a new parameter,
Genetic Resources and Crop Evolution, 51: 655-662
http://dx.doi.org/10.1023/B:GRES.0000024654.89373.c2
Yahia Y., Guetat A., Walid E., Ferchichi A., Yahia H., and
Loumerem M., 2012, Analysis of agromorphological
diversity of southern Tunisia faba bean (Vicia faba L.)
germplasm, African Journal of Biotechnology 11(56):
11913-11924
Witcombe J.R., 1981, Genetic resources of faba beans. In:
Hawtin G. and Webb C. (eds), Faba Bean Improvement.
ICARDA, Aleppo, Syria, pp. 1-13
Zeid M., Schon C.C., and Link W., 2003, Genetic diversity in
recent elite faba bean lines using AFLP markers,
Theoretical and Applied Genetics, 107: 1304-1314
http://dx.doi.org/10.1007/s00122-003-1350-9
Legume Genomics and Genetics 2014, Vol. 5, No. 3, 7-24http://lgg.biopublisher.ca
22
Figure 7 Frequency of seed coat colors within various Vicia faba var minor lines

Legume Genomics and Genetics 2014, Vol. 5, No. 3, 7-24http://lgg.biopublisher.ca
23
A. FPH B. TNN C. LARd D. DTM
E. PAG F. Brg G. NGP H. NP4S
I. PH J. TNN K. 100-sw
Figure 8 Quantitative traits distribution
4,88 5,70 6,51 7,33 8,15 8,97 9,78 10,600
10
20
30
40
50
60
Dis
trib
uti
on (
%) X = 6,38 mm

Legume Genomics and Genetics 2014, Vol. 5, No. 3, 7-24http://lgg.biopublisher.ca
24
Figure 9 The dendrogram based on Euclidean distances and Ward method