Genetic variation of the Turnip mosaic virus population of Vietnam: A case study of founder,...
12
Virus Research 171 (2013) 138–149 Contents lists available at SciVerse ScienceDirect Virus Research journa l h o me pag e: www.elsevier.com/locate/virusres Genetic variation of the Turnip mosaic virus population of Vietnam: A case study of founder, regional and local influences Huy Duc Nguyen a,b , Hoa Thi Nhu Tran a,c , Kazusato Ohshima a,b,∗ a Laboratory of Plant Virology, Department of Applied Biological Sciences, Faculty of Agriculture, Saga University, 1-banchi, Honjo-machi, Saga 840-8502, Japan b The United Graduate School of Agricultural Sciences, Kagoshima University, 1-21-24, Kagoshima 890-0065, Japan c The Research Center for Tropical Plant Pathology, Faculty of Agronomy, Hanoi University of Agriculture, Gia Lam, Hanoi, Viet Nam a r t i c l e i n f o Article history: Received 15 September 2012 Received in revised form 13 November 2012 Accepted 16 November 2012 Available online 29 November 2012 Keywords: Turnip mosaic virus Potyvirus Genetic variation Population Evolution Vietnam Southeast Asia a b s t r a c t Turnip mosaic virus (TuMV) is one of the most important viruses infecting a wide range of plant species, primarily from the family Brassicaceae. Thirty TuMV isolates were collected from Brassica and Raphanus plants in Vietnam during 2006–2008. Host reaction studies showed that many of the isolates belonged to Brassica/Raphanus (BR) host-infecting type. Sequence-based phylogenetic and population genetic anal- yses were made of the complete polyprotein gene sequences, and of four non-recombinogenic regions of those sequences (i.e. genes of the helper-component proteinase protein, protein 3, nuclear inclusion b protein and coat protein). These were used to assess the subpopulation differentiation and divergence between Vietnamese TuMV populations and those of nearby Asian countries. Nine inter- and intralineage recombination type patterns were identified in the genomes of the Vietnamese isolates, of which seven were novel. All the Vietnamese non-recombinant isolates fell into the world-B group of TuMV and clus- tered with Chinese isolates. The estimates of genetic differentiation and gene flow reveal that the TuMV populations of Vietnam, China and Japan are genetically linked but have clear local founder effects. This, the first population genetic study of a TuMV population in Southeast Asia, indicates the importance of such studies for providing the scientific basis of control strategies. © 2012 Elsevier B.V. All rights reserved. 1. Introduction Studies of the genetic structure of populations of plant RNA viruses are important for understanding the evolution of virus/host interactions (García-Arenal et al., 2001; Gibbs et al., 2008; Gibbs and Ohshima, 2010), because plant RNA viruses are very variable enabling them to adapt rapidly to new or resistant hosts (Tsompana et al., 2005; Ohshima et al., 2010). There are several reports on the genetic structure of potyvirus populations, notably those on Potato virus Y (PVY) (Ogawa et al., 2008, 2012; Karasev et al., 2011), Soybean mosaic virus (SMV) (Seo et al., 2009), Tobacco vein banding mosaic virus (TVBMV) (Zhang et al., 2011), Zucchini yellow mosaic virus (ZYMV) (Lecoq et al., 2009) and Turnip mosaic virus (TuMV) (Ohshima et al., 2002; Tomimura et al., 2004; Tomitaka and Ohshima, 2006). These reports showed that virus populations have been shaped by selection, founder effects and genetic recom- bination. ∗ Corresponding author at: Laboratory of Plant Virology, Department of Applied Biological Sciences, Faculty of Agriculture, Saga University, 1-banchi, Honjo-machi, Saga 840-8502, Japan. Tel.: +81 952 28 8730; fax: +81 952 28 8709. E-mail address: [email protected] (K. Ohshima). TuMV infects a wide range of plant species, most from the family Brassicaceae (Walsh and Jenner, 2002). TuMV belongs to the genus Potyvirus. This is the largest genus of the largest family of plant RNA viruses, the Potyviridae (Gibbs and Ohshima, 2010; King et al., 2012). TuMV, like other potyviruses, is transmitted by aphids in the non-persistent manner. Potyviruses have flexuous filamentous par- ticles 700–750 nm long, each of which contains a single copy of the genome, which is a single-stranded positive sense RNA molecule of about 9800 nucleotides. This is translated into one large polypro- tein which hydrolyzes itself into at least 10 proteins (King et al., 2012). Furthermore, an overlapping pretty interesting Potyviridae ORF (PIPO) exists in the +2 reading frame within the protein 3 (P3 protein) encoding region (Chung et al., 2008). Previous studies have shown that the different TuMV subpop- ulations have probably emerged from the more ancient Eurasian subpopulations, such as those found in the Mediterranean region, including Southeast Europe, Asia Minor and mid-Eurasia (Ohshima et al., 2002; Tomimura et al., 2004; Korkmaz et al., 2008; Farzadfar et al., 2009). In these regions, Brassicaceae crops are an important component of local agriculture; in Europe, the crops are mostly Brassica species; and in Asia Minor, both Brassica and Raphanus species are important. Furthermore, the studies (Ohshima et al., 2002; Tomimura et al., 2003, 2004; Tomitaka and Ohshima, 2006) have shown that TuMV isolates are of four host-infecting types; 0168-1702/$ – see front matter © 2012 Elsevier B.V. All rights reserved. http://dx.doi.org/10.1016/j.virusres.2012.11.008
-
Upload
independent -
Category
Documents
-
view
1 -
download
0
Transcript of Genetic variation of the Turnip mosaic virus population of Vietnam: A case study of founder,...

Go
Ha
b
c
a
ARR1AA
KTPGPEVS
1
viaeetP2bm(ahb
BS
0h
Virus Research 171 (2013) 138– 149
Contents lists available at SciVerse ScienceDirect
Virus Research
journa l h o me pag e: www.elsev ier .com/ locate /v i rusres
enetic variation of the Turnip mosaic virus population of Vietnam: A case studyf founder, regional and local influences
uy Duc Nguyena,b, Hoa Thi Nhu Trana,c, Kazusato Ohshimaa,b,∗
Laboratory of Plant Virology, Department of Applied Biological Sciences, Faculty of Agriculture, Saga University, 1-banchi, Honjo-machi, Saga 840-8502, JapanThe United Graduate School of Agricultural Sciences, Kagoshima University, 1-21-24, Kagoshima 890-0065, JapanThe Research Center for Tropical Plant Pathology, Faculty of Agronomy, Hanoi University of Agriculture, Gia Lam, Hanoi, Viet Nam
r t i c l e i n f o
rticle history:eceived 15 September 2012eceived in revised form3 November 2012ccepted 16 November 2012vailable online 29 November 2012
eywords:urnip mosaic virus
a b s t r a c t
Turnip mosaic virus (TuMV) is one of the most important viruses infecting a wide range of plant species,primarily from the family Brassicaceae. Thirty TuMV isolates were collected from Brassica and Raphanusplants in Vietnam during 2006–2008. Host reaction studies showed that many of the isolates belonged toBrassica/Raphanus (BR) host-infecting type. Sequence-based phylogenetic and population genetic anal-yses were made of the complete polyprotein gene sequences, and of four non-recombinogenic regionsof those sequences (i.e. genes of the helper-component proteinase protein, protein 3, nuclear inclusionb protein and coat protein). These were used to assess the subpopulation differentiation and divergencebetween Vietnamese TuMV populations and those of nearby Asian countries. Nine inter- and intralineage
otyvirusenetic variationopulationvolutionietnamoutheast Asia
recombination type patterns were identified in the genomes of the Vietnamese isolates, of which sevenwere novel. All the Vietnamese non-recombinant isolates fell into the world-B group of TuMV and clus-tered with Chinese isolates. The estimates of genetic differentiation and gene flow reveal that the TuMVpopulations of Vietnam, China and Japan are genetically linked but have clear local founder effects. This,the first population genetic study of a TuMV population in Southeast Asia, indicates the importance ofsuch studies for providing the scientific basis of control strategies.
. Introduction
Studies of the genetic structure of populations of plant RNAiruses are important for understanding the evolution of virus/hostnteractions (García-Arenal et al., 2001; Gibbs et al., 2008; Gibbsnd Ohshima, 2010), because plant RNA viruses are very variablenabling them to adapt rapidly to new or resistant hosts (Tsompanat al., 2005; Ohshima et al., 2010). There are several reports onhe genetic structure of potyvirus populations, notably those onotato virus Y (PVY) (Ogawa et al., 2008, 2012; Karasev et al.,011), Soybean mosaic virus (SMV) (Seo et al., 2009), Tobacco veinanding mosaic virus (TVBMV) (Zhang et al., 2011), Zucchini yellowosaic virus (ZYMV) (Lecoq et al., 2009) and Turnip mosaic virus
TuMV) (Ohshima et al., 2002; Tomimura et al., 2004; Tomitakand Ohshima, 2006). These reports showed that virus populations
ave been shaped by selection, founder effects and genetic recom-ination.∗ Corresponding author at: Laboratory of Plant Virology, Department of Appliediological Sciences, Faculty of Agriculture, Saga University, 1-banchi, Honjo-machi,aga 840-8502, Japan. Tel.: +81 952 28 8730; fax: +81 952 28 8709.
E-mail address: [email protected] (K. Ohshima).
168-1702/$ – see front matter © 2012 Elsevier B.V. All rights reserved.ttp://dx.doi.org/10.1016/j.virusres.2012.11.008
© 2012 Elsevier B.V. All rights reserved.
TuMV infects a wide range of plant species, most from the familyBrassicaceae (Walsh and Jenner, 2002). TuMV belongs to the genusPotyvirus. This is the largest genus of the largest family of plantRNA viruses, the Potyviridae (Gibbs and Ohshima, 2010; King et al.,2012). TuMV, like other potyviruses, is transmitted by aphids in thenon-persistent manner. Potyviruses have flexuous filamentous par-ticles 700–750 nm long, each of which contains a single copy of thegenome, which is a single-stranded positive sense RNA molecule ofabout 9800 nucleotides. This is translated into one large polypro-tein which hydrolyzes itself into at least 10 proteins (King et al.,2012). Furthermore, an overlapping pretty interesting PotyviridaeORF (PIPO) exists in the +2 reading frame within the protein 3 (P3protein) encoding region (Chung et al., 2008).
Previous studies have shown that the different TuMV subpop-ulations have probably emerged from the more ancient Eurasiansubpopulations, such as those found in the Mediterranean region,including Southeast Europe, Asia Minor and mid-Eurasia (Ohshimaet al., 2002; Tomimura et al., 2004; Korkmaz et al., 2008; Farzadfaret al., 2009). In these regions, Brassicaceae crops are an importantcomponent of local agriculture; in Europe, the crops are mostly
Brassica species; and in Asia Minor, both Brassica and Raphanusspecies are important. Furthermore, the studies (Ohshima et al.,2002; Tomimura et al., 2003, 2004; Tomitaka and Ohshima, 2006)have shown that TuMV isolates are of four host-infecting types;
Resea
[sis[cRbtgt(bwp
2actsoTThtgrsptT
TT
ca
H.D. Nguyen et al. / Virus
(B)]-host type isolates infected Brassica plants latently and occa-ionally and did not infect Raphanus plants, [B]-host type isolatesnfected many of Brassica plants systemically causing mosaic of theystemically infected leaves but did not infect Raphanus plants,B(R)]-host type isolates infected many Brassica plants systemi-ally causing mosaic of systemically infected leaves but infectedaphanus plants occasionally, and [BR]-host type isolates infectedoth Brassica and Raphanus plants systemically causing mosaic ofhe uninoculated leaves. Moreover, phylogenetic analyses usingene sequences of different virus isolates collected from aroundhe world revealed four main TuMV genogroups called basal-BBrassica), basal-BR (Brassica/Raphanus), Asian-BR and world-B. Theasal-B cluster of (B) or B-host type isolates was most variable,as paraphyletic, and was isolated from both non- and Brassicaceaelants.
Although TuMV was recently reported in Vietnam (Ha et al.,008), little data on the incidence of TuMV and its biologicalnd molecular characteristics are available in Southeast Asianountries. Recent studies of the genetic structures of TuMV popula-ions in East Asia were made using partial genome sequences, andhowed that recent Chinese and Japanese TuMV isolates are partf the same population but are a discrete lineage (Tan et al., 2004;omitaka and Ohshima, 2006). Here, we report the occurrence ofuMV in Vietnam of the Southeast Asian region from Brassicaceaeosts, all cultivated Brassica and Raphanus crops, together withhe full genomic sequences of 30 of the isolates. Data from fullenomic sequence and polyprotein encoding region was used forecombination and phylogenetic analyses, and for the estimation of
ubpopulation differentiation and divergence between Vietnameseopulations and those in other East Asian countries. We have madehese comparisons using the genomic sequences of c. 135 isolates ofuMV collected mostly from Eurasia, and discuss what they revealable 1urnip mosaic virus isolates collected in Vietnam.
Isolate Original host Location (city, province/district) Symptom
VIET15 Raphanus sativus Van Giang, Hung Yen M
VIET56 Brassica juncea Moc Chau, Son La M
VIET58 B. juncea Moc Chau, Son La M
VIET65 R. sativus Gia Lam, Ha Noi M
VIET66 R. sativus Gia Lam, Ha Noi M
VIET73 R. sativus Van Giang, Hung Yen M
VIET79 R. sativus Cam Giang, Hai Duong M
VIET80 R. sativus Cam Giang, Hai Duong M
VIET82 R. sativus Ban Me Thuot, Dak Lak M
VIET83 R. sativus Ban Me Thuot, Dak Lak M
VIET89 R. sativus Ban Me Thuot, Dak Lak M
VIET138 B. juncea Thanh Long, Thua Thien Hue M, S
VIET153 B. juncea Hoi An, Quang Nam M
VIET158 B. juncea Gia Lam, Ha Noi M
VIET159 B. juncea –, Lang Son M
VIET160 B. juncea Huu Lung, Lang Son M
VIET164 B. juncea Thuong Tin, Ha Tay M, S
VIET166 B. juncea Thuong Tin, Ha Tay M
VIET167 B. juncea Gia Lam, Ha Noi M
VIET169 B. juncea Vo Cuong, Bac Ninh M
VIET170 B. juncea Vo Cuong, Bac Ninh M
VIET172 B. juncea Gia Lam, Ha Noi M
VIET173 B. juncea Viet Yen, Bac Giang M
VIET174 B. juncea Viet Yen, Bac Giang M
VIET175 B. juncea Viet Yen, Bac Giang M
VIET176 B. juncea Vu Thu, Thai Binh M
VIET177 B. juncea Vu Thu, Thai Binh M, S
VIET178 B. juncea Nam Truc, Nam Dinh M, S
VIET179 B. juncea Nam Truc, Nam Dinh M
VIET180 B. juncea Viet Yen, Bac Giang M
a M, mosaic; S, stunting.b Host type B; Brassica, isolates infected B. rapa cv. Hakatasuwari systemically giving m
vs. Akimasari and Taibyo-sobutori (Japanese radish) systemically giving mosaic symptond infected R. sativus cvs. Akimasari and Taibyo-sobutori only occasionally.
rch 171 (2013) 138– 149 139
about the changes that have occurred during east Asia-wide evo-lution and migration of TuMV populations. Our analyses provide apreliminary definition of the geographical structure of TuMV popu-lations in Vietnam, China and Japan, and indicate that it is stronglyinfluenced by founder effects.
2. Materials and methods
2.1. Virus isolates
The Brassicaceae crop-producing areas of Vietnam, includingNorthwest, Northeast, Red river delta, North central coast, Southcentral coast and Central highlands regions, were surveyed dur-ing the growing seasons of 2006–2008. All collected sampleswere tested by direct double antibody sandwich enzyme-linkedimmunosorbent assay (DAS-ELISA) (Clark and Adams, 1977).
Details of the Vietnamese TuMV isolates, their place of origin,original host plant, symptom on collected plant, year of isolation,and host type are shown in Table 1, together with details of theisolates used in the analyses and for which complete genomicsequences have already been reported (Table S1). The Northeastregion in Vietnam is one of major areas of Brassicaceae crop pro-duction.
All the isolates were inoculated to Chenopodium quinoa andserially cloned through single lesions at least three times. Thisprocedure is essential as field collected isolates are often mix-tures. They were propagated in Brassica rapa cv. Hakatasuwari orNicotiana benthamiana plants. Plants infected systemically with
each of the TuMV isolates were homogenized in 0.01 M potas-sium phosphate buffer (pH 7.0), and the isolates were mechanicallyinoculated to young plants of Brassica chinensis cv. Choyo, Brassicajuncea cv. Hakarashina, Brassica napus cv. Otsubu, Brassica rapa cv.on collected planta Year of collection Host typeb Accession No.
2006 B(R) AB7472862007 B AB7472872007 BR AB7472882007 BR AB7472892007 B AB7472902007 BR AB7472912007 BR AB7472922007 B AB7472932007 B(R) AB7472942007 B AB7472952007 BR AB7472962007 B(R) AB7472972007 B(R) AB7472982007 B(R) AB7472992007 B AB7473002007 B AB7473012007 B AB7473022007 B AB7473032007 B AB7473042007 B AB7473052007 B(R) AB7473062007 B AB7473072007 B AB7473082007 B AB7473092007 B(R) AB7473102007 B(R) AB7473112008 B AB7473122008 B(R) AB7473132008 B(R) AB7473142008 B(R) AB747315
osaic symptoms. Host type BR; these isolates infected both B. rapa and R. sativusms. Host type B(R); isolates infected B. rapa systemically giving mosaic symptoms

1 Resea
HSnEsw
2
TetwvuUPaJfiprtesTBl(
2
tyScatmpthstotNurfwCtaporp9tb((M
40 H.D. Nguyen et al. / Virus
akatasuwari, Brassica oleracea var. capitata cvs. Ryozan 2-go andhinsei, Brassica pekinensis cvs. Nozaki 1-go and Kyoto 3-go, and B.apus cv. Norin-32go, Eruca sativa cv. Odyssey and Lactuca sativa cv.mrap 231, as well as to Raphanus sativus cvs. Akimasari, Taibyo-obutori and Everest. Inoculated plants were kept for at least 4eeks in a glasshouse at 25 ◦C.
.2. Viral RNA and sequencing
We determined the genomic sequences from 30 isolates ofuMV representing different parts of Vietnam. The viral RNAs werextracted from TuMV-infected B. rapa cv. Hakatasuwari or N. ben-hamiana leaves using Isogen (Nippon Gene, Japan). The RNAsere reverse transcribed by PrimeScript® Moloney murine leukemia
irus (MMLV) reverse transcriptase (Takara, Japan) and amplifiedsing high-fidelity PlatinumTM Pfx DNA polymerase (Invitrogen,SA). The reverse transcription and polymerase chain reaction (RT-CR) products were separated by electrophoresis in agarose gelsnd purified using the QIAquick Gel Extraction Kit (Qiagen K.K.apan). Sequences from each isolate were determined using four tove overlapping independent RT-PCR products to cover the com-lete genome. The sequences of the RT-PCR products of adjacentegions of the genome overlapped by at least 200 bp to ensurehat they were from the same genome and were not from differ-nt components of a genome mixture. Each RT-PCR product wasequenced by primer walking in both directions using a BigDyeerminator v3.1 Cycle Sequencing Ready Reaction kit (Appliediosystems, USA) and an Applied Biosystems 310 Genetic Ana-
yzer. Sequence data were assembled using BioEdit version 5.0.9Hall, 1999).
.3. Recombination analyses
The genomic sequences of 135 isolates were used for evolu-ionary analyses (Tables 1 and S1). Two sequences of Japaneseam mosaic virus (JYMV) (Fuji and Nakamae, 1999, 2000), one ofcallion mosaic virus (ScMV) (Chen et al., 2002) and one of Nar-issus yellow stripe virus (NYSV) (Chen et al., 2003) were used tolign the TuMV genomic sequences as BLAST searches had shownhem to be the sequences in the international sequence databases
ost closely and consistently related to those of TuMV; TuMVrotein 1 (P1) genes were more closely related to those of JYMVhan ScMV, whereas for some other genomic regions betweenelper-component proteinase protein (HC-Pro) and nuclear inclu-ion b protein (NIb) sequence it was the converse, except thathe TuMV coat protein (CP) gene is most closely related to thatf NYSV. We therefore aligned all 135 P1 sequences with those ofwo JYMV isolates as the outgroup, the CP sequences with that ofYSV, and the remaining sequences with those of JYMV and ScMVsing CLUSTAL X2 (Larkin et al., 2007). However, this procedureesulted in some gaps that were not in multiples of 3 nts. There-ore the amino acid sequences corresponding to individual regionsere aligned with the appropriate outgroups shown above usingLUSTAL X2 with TRANSALIGN (kindly supplied by Georg Weiller)o maintain the degapped alignment of the encoded amino acidsnd then the aligned subsequences were reassembled to form com-lete sequences 9309 nt long. To check the junctions between 5′
r 3′ untranslated region (UTR) and P1 or CP protein encodingegions, aligned 5′ and 3′ UTR sequences were joined with theolyprotein sequences of each isolate. This produced sequences605 nucleotides long excluding the 35 nucleotides that were usedo design the primer for RT-PCR amplification. Putative recom-
ination breakpoints in all sequences were identified using RDPMartin and Rybicki, 2000), GENECONV (Sawyer, 1999), BOOTSCANSalminen et al., 1995), MAXCHI (Maynard-Smith, 1992), CHI-AERA (Posada and Crandall, 2001) and SISCAN programs (Gibbs
rch 171 (2013) 138– 149
et al., 2000) implemented in the RDP3 software package (Martinet al., 2010) and also the original PHYLPRO version 1 (Weiller,1998) and SISCAN version 2 (Gibbs et al., 2000) programs. First, wechecked for incongruent relationships using the programs imple-mented in RDP3. These analyses were done using default settingsfor the different detection programs and a Bonferroni corrected P-value cut-off of 0.05 or 0.01, and then all isolates that had beenidentified as likely recombinants by the programs in RDP3, sup-ported by three different methods with an associated P-value of>1.0 × 10⁻⁶, were re-checked using the original PHYLPRO version1 and SISCAN version 2, not only with all nucleotide sites, butalso with synonymous and non-synonymous sites separately. Wechecked 100 and 50 nucleotides slices of all sequences for evi-dence of recombination using these programs. These analyses alsoassessed which non-recombinant sequences had regions that werethe closest to the regions of the recombinant sequences and henceindicated the likely lineages that provided those regions of therecombinant genomes. For convenience, we called them ‘parentalisolates’ of recombinants. Having examined all sites with an associ-ated P-value of <1 × 10⁻⁶ (i.e. the most likely recombination sites),the intralineage recombinants (parents from the same major lin-eage) were retained and the interlineage recombinants (parentsfrom different major lineages) removed by treating the identi-fied recombination sites as missing data in subsequent analyses.The aligned 5′ and 3′ UTR sequences were added to the ends ofthe polyprotein sequences to reassemble nearly complete genomicsequences, which were then assessed again for evidence of recom-bination, especially for recombination sites in the UTRs. Finally,TuMV sequences were also aligned without an outgroup sequence,and directly checked for evidence of recombination using the pro-grams.
2.4. Phylogenetic analyses
The polyprotein encoding sequences of the 135 TuMV isolates,together with those of one NYSV, two JYMV and one ScMV isolates,as outgroup, were aligned, as described above using CLUSTAL X2with TRANSALIGN. The phylogenetic relationships of the alignedsequences were inferred by the maximum likelihood method (ML)implemented in PhyML version 2.4.4 (Guindon and Gascuel, 2003)using the general time reversible (GTR) scheme of substitution witha gamma distribution (�4) model of site rates variation (GTR + �4).The best-fit model of nucleotide substitutions for each dataset wasdetermined using jModeltest 0.1.1 (Posada, 2008). For ML analy-ses, branch support was evaluated by the bootstrap method basedon 1000 pseudoreplicates. The calculated trees were displayed byTREEVIEW (Page, 1996). The nucleotide and amino acid similaritieswere estimated using the Kimura two-parameter method (Kimura,1980) and the Dayhoff PAM 001 matrix (Schwarz and Dayhoff,1979), and the within-population diversities were assessed usingMEGA version 5 (Tamura et al., 2011).
2.5. Genetic differentiation and measurement of gene flow
Genetic differentiation between populations was examined bythree permutation-based statistical tests, Ks*, Z and Snn (Hudson,2000). The extent of genetic differentiation or the level of gene flowbetween populations was measured by estimating FST (the inter-populational component of genetic variation or the standardizedvariance in allele frequencies across populations) using DnaSP ver-sion 5.0 (Librado and Rozas, 2009). The absolute value of FST ranges
from 0 to 1 for undifferentiated to fully differentiated populations.Normally, an absolute value of FST > 0.33 suggests infrequent geneflow, while absolute value of FST < 0.33 suggests frequent gene flow(Librado and Rozas, 2009; Wei et al., 2009).
H.D. Nguyen et al. / Virus Research 171 (2013) 138– 149 141
F tudy;
s
2
m(aHtp
3
3i
s5itaactscbh
ifSTwr
ig. 1. Location of the sampling sites of Turnip mosaic virus isolates used in this sampling sites.
.6. Population demography analyses
DnaSP version 5.0 (Librado and Rozas, 2009) was used to esti-ate Tajima’s D (Tajima, 1989), Fu and Li’s D* and F* statistical tests
Fu and Li, 1993), and haplotype diversity. Tajima’s D, Fu and Li’s D*nd F* tests hypothesize that all mutations are selectively neutral.aplotype diversity refers to the frequency and number of haplo-
ypes in the population. Nucleotide diversity estimates the averageairwise differences among sequences.
. Results
.1. Biological and molecular characteristics of the Vietnamesesolates
A total of 183 samples collected during the 2006–2008 growingeasons were tested by DAS-ELISA using the antiserum to isolate9 J (Ohshima et al., 1996, 2002). Of those tested, 139 plants (76%)
ncluding B. juncea (mustard) and R. sativus (radish) were foundo be infected with TuMV. No infection was detected in B. oler-cea var. capitata (cabbage), B. oleracea var. gongylodes (kohlrabi)nd B. oleracea vars botrytis (cauliflower). Viruses were found inommercial fields as well as in home gardens. When many symp-omatic plants were found in a field or in a home garden, only someamples were randomly chosen for DAS-ELISA detection. We onlyollected symptomatic plants in the present study, thus there mighte plants which were latently infected by TuMV in the fields andome gardens.
A total of 30 TuMV isolates collected in Vietnam were examinedn this study; two from the Northwest, six from the Northeast, 17rom Red river delta, one from the North central coast, one from the
outh central coast and three from the Central highlands (Fig. 1 andable 1), thus isolates were collected from most parts of Vietnamhere Brassicaceae crops are cultivated. Nine were isolated fromadish and 21 were from mustard.
maps of (A) Asia including China and Japan (B) Vietnam, where dots indicate the
All the Vietnamese isolates from radish and mustard infectedB. juncea cv. Hakarashina and B. rapa cv. Hakatasuwari plants butdid not infect B. oleracea var. capitata cvs. Ryozan 2-go and Shin-sei. The isolates from radish did not always infect Japanese radish(R. sativus cvs. Akimasari and Taibyo-soubutori), and those frommustard only occasionally infected them. Because there is no localradish cultivar in Vietnam and Chinese radish cultivars are mostwidely grown (H.D. Nguyen, unpublished information), Chineseradish (R. sativus cv. Everest) was inoculated with the Vietnameseisolates and found to be susceptible to most isolates producingmosaic symptoms (data not shown). This indicates the importanceof using local cultivars for inoculation tests.
The 30 full genomes sequenced in this study were analyzed,as well as 105 full genomic TuMV sequences obtained from thepublic DNA sequence databases. All the genomes of Vietnamese iso-lates of TuMV were 9798 nucleotides excluding 5′ end 35 nt primersequences; the regions encoding the P1, HC-Pro, P3, PIPO, 6Kda1 protein (6K1), cylindrical inclusion (CI), 6Kda 2 protein (6K2),genome linked viral protein (VPg), nuclear inclusion a-proteinaseprotein (NIa-Pro), NIb and CP proteins were 1086, 1374, 1065, 177,156, 1932, 159, 576, 729, 1551 and 864 nucleotides long respec-tively, and, for most analyses, the 5′ end primer sequences wereomitted leaving only the region encoding the polyprotein.
All of the motifs reported for different potyvirus encoded pro-teins were found. The new genomic sequences determined in thisstudy are available in DDBJ/EMBL/GenBank databases with Acces-sion Codes AB747286–AB747315.
3.2. Recombination analysis
The polyprotein-encoding gene sequences of 30 Vietnamese iso-
lates and 105 sequences obtained from the public DNA sequencedatabases were assessed for evidence of recombination.Eight unequivocal recombination sites were found in thegenome of 14 Vietnamese isolates (Table 2 and Fig. 2). These

142 H.D. Nguyen et al. / Virus Research 171 (2013) 138– 149
Table 2Recombination sites in Vietnamese Turnip mosaic virus genomes.
Protein encoding regionand recombination sitea
Isolate Parental isolate Type of recombinantb Programsdetected byc
P-Valued Z-Valuee
P1nt 776 VIET82
VIET83VIET89VIET15VIET65VIET66VIET73
VIET159 × HRDVIET159 × HRDVIET159 × HRDVIET159 × HRDVIET159 × HRDVIET159 × HRDVIET159 × HRD
wB × ABR (interlineage)wB × ABR (interlineage)wB × ABR (interlineage)wB × ABR (interlineage)wB × ABR (interlineage)wB × ABR (interlineage)wB × ABR (interlineage)
RGBMCSRSOPRGBMCSRSOPRGBMCSRSOPRGBMCSRSOPRGBMCSRSOPRGBMCSRSOPRGBMCSRSOP
3.58 × 10−45
3.36 × 10−45
3.82 × 10−45
8.96 × 10−79
1.44 × 10−77
8.12 × 10−76
4.87 × 10−74
6.766.576.577.707.707.707.00
HC-Pront 1511nt 1631nt 2499
VIET166VIET159VIET79
VIET153 × VIET172YAL018 J × HZ6VIET173 × VIET172
wB × wB (intralineage)wB × wB (intralineage)wB × wB (intralineage)
RGBMCSRSO
RBMCSRSO
RGBMCSRSO
1.51 × 10⁻²⁷
1.99 × 10⁻²⁴
5.50 × 10⁻²⁸
5.353.763.43
P3nt 3461nt 3534
VIET169VIET159VIET167
VIET164 × VIET158HZ6 × YAL018 JCHZJ26A × VIET158
wB × wB (intralineage)wB × wB (intralineage)wB × wB (intralineage)
RGBMCSRSO
RGBMCSRSO
RGBMCSRSO
2.27 × 10⁻¹⁷
1.03 × 10⁻¹⁹
5.66 × 10⁻³¹
4.723.765.74
CInt 5536 (tentative) VIET176 VIET80 × BJ-C4 wB × wB (intralineage) RMCSR 3.07 × 10⁻¹³ <3.00
VPgnt 5989 VIET160
VIET164VIET153 × VIET175VIET153 × VIET175
wB × wB (intralineage)wB × wB (intralineage)
RBCSRSO
RBMCSRSO
5.57 × 10−09
1.21 × 10−074.454.47
CPnt 8907 VIET82
VIET83VIET89
CHL13 × HZ6CHL13 × HZ6CHL13 × HZ6
ABR × wB (interlineage)ABR × wB (interlineage)ABR × wB (interlineage)
RGBMSRSOPRGBMSRSOPRGBMSRSOP
5.48 × 10−39
5.48 × 10−39
5.84 × 10−39
6.636.636.63
a Recombination sites detected in the TuMV genomes by the recombination detecting programs (listed in column 5), from the aligned sequences of the likely recombinantand its ‘parental isolates’. The nucleotide position shows locations of individual genes numbered as in UK1 genome (Jenner et al., 2000).
b wB, world-B; ABR, Asian-BR.c Recombinant isolates identified by the recombination detecting programs: R (RDP), G (GENECONV), B (BOOTSCAN), M (MAXCHI), C (CHIMAERA) and SR (SISCAN) programs
in RDP3 software (programs greater than P-values 1.0 × 10⁻⁶ are listed), SO (SISCAN total nucleotide site analysis) in original SISCAN version 2 and P (PHYLPRO) programs.The analyses were done using default settings and a Bonferroni-corrected P-values cut-off of 0.05 or 0.01 in RDP3 software.
d The reported P-value is for the program in bold type and underlined in RDP3 and is the greatest P-value among the isolates calculated for the region in question.e Both of the parental isolates of the recombination sites had Z-values greater than 3 in total nucleotide site analysis in So of the SISCAN version 2 program; thus lower
Z-value of one of the parents identified are shown.
Fig. 2. Recombination maps of Turnip mosaic virus genomes of Vietnamese isolates; the estimated nucleotide positions of the recombination sites are shown relative to the5′ end of the genome using numbering of the sequence of the UK1 isolate (Jenner et al., 2000). The vertical arrows show estimated recombination sites. The orange, green andgray boxes indicate, respectively, basal-BR, Asian-BR and world-B parents. Bold and thin vertical lines show ‘clear’ and ‘tentative’ recombination sites; ‘clear recombinationsites’ were those detected by four or more different programs and two or more types of method, whilst ‘tentative recombination sites’ were those detected by three orfewer programs and only one or two types of method. The recombination sites newly identified in the present study (acronyms in red) or those identified in earlier studies(acronyms in black) are separately listed. Some isolates with each recombination pattern, and previously found in Chinese and Japanese population, are also shown.

Resea
wTGgwe(aPaPginsbwtlanR
F(5o((
H.D. Nguyen et al. / Virus
ere located in the P1, HC-Pro, P3, VPg and CP encoding regions.hey were supported by clear P-values (<1 × 10⁻⁶) in the RDP,ENECONV, BOOTSCAN, MAXCHI, CHIMAERA and SISCAN pro-rams of the RDP3 software. One tentative recombination siteas found in the genome of VIET176 isolate located in the CI
ncoding region; this recombination site gave P-values in the RDP1.33 × 10−7), MAXCHI (3.07 × 10⁻¹³), CHIMAERA (5.60 × 10⁻¹⁰)nd SISCAN (5.29 × 10⁻⁶) programs but did not give significant-values (<1 × 10⁻³) in the BOOTSCAN and GENECONV in RDP3,nd was not detected by original SISCAN (Z-value, <3.0) and PHYL-RO programs. Thus nine recombination patterns were identified inenomes from the Vietnamese population. Two recombinants werenterlineage and the remaining seven were intralineage recombi-ants with world-B and Asian-BR parents. Six of the recombinationites (nt 1511, 1631, 2499, 3461, 3534, 5536) had not been foundefore. The two interlineage recombination sites (nt 776, 8907),hich were in the P1 and CP encoding regions were identical to
wo found in earlier studies of Asian (Chinese and Japanese) popu-
ations (Ohshima et al., 2002, 2007; Tomitaka and Ohshima, 2006),nd the remaining one recombination site (an intralineage site att 5989) had also been found before in an east European (Czechepublic) population (Ohshima et al., 2007).ig. 3. Maximum-likelihood tree calculated from the polyprotein sequences of 33 isolatesOhshima et al., 2007) had been discarded. Numbers at each node indicate bootstrap perce0 are shown) in maximum-likelihood tree. Horizontal branch length is drawn to scale wf Japanese yam mosaic virus (JYMV) (Fuji and Nakamae, 1999, 2000), one of Scallion mosChen et al., 2003) were used as the outgroup. The isolates collected in China (acronyms iacronyms in black) are separately listed. For the detailed of isolates, refer Tables 1 and S
rch 171 (2013) 138– 149 143
3.3. Phylogenetic relationships
Phylogenetic trees were initially calculated from the genomesequences of the 135 isolates, including all of the recombinantsidentified in this study. However, the resulting trees had poor boot-strap support for some lineages, as found previously (Ohshimaet al., 2002, 2007). Therefore, the trees were recalculated from thegenomic sequences of only the 33 isolates that were not recom-binants. The relationships of these isolates were investigated byML and the resulting tree is shown in Fig. 3. It partitioned most ofthe sequences into the same four major consistent genetic groups:basal-B, basal-BR, Asian-BR and world-B, as reported previously(Ohshima et al., 2002, 2007). Fifteen out of 30 Vietnamese iso-lates (50%) were non-recombinants and fell into world-B group.The world-B group further split into three subgroups; East Europe,worldwide and Asia. All the Vietnamese non-recombinant isolatesfell into the Asia subgroup and clustered with Chinese isolates.Basal-BR and Asian-BR non-recombinants which had previously
been found in Japanese and Chinese population respectively werenot found in Vietnamese population.To check this conclusion in more detail we, therefore, con-structed phylogenetic trees of 118–129 non-recombinant isolates
of Turnip mosaic virus, after recombinants identified in this study and earlier studyntages based on 1000 psuedoreplicates (only percentages greater than and equal toith the bar indicating 0.1 nt replacements per site. The homologous two sequencesaic virus (ScMV) (Chen et al., 2002) and one of Narcissus yellow stripe virus (NYSV)n green), Japan (acronyms in blue), Vietnam (acronyms in red) and other countries1.
1 Resea
urctbieT
3
pwvw0t0
TG
o
44 H.D. Nguyen et al. / Virus
sing the genomic regions that gave the least evidence ofecombination (HC-Pro, P3, NIb and CP encoding regions) which weall the non-recombinogenic regions (Fig. S1). These trees showedhat none of the Vietnamese isolates had regions from basal-B orasal-BR parental lineages, whereas some Chinese and Japanese
solates had genomic regions that came from basal-BR group par-nts, as indicated in earlier studies (Tomitaka and Ohshima, 2006;omitaka et al., 2007; Wang et al., 2009).
.4. Similarity and diversity
The similarities of the sequences, both nucleotide and encodedolyprotein, of basal-B, basal-BR, Asian-BR and world-B genomesere calculated. The within group arithmetic means of all indi-
idual pairwise distances between isolates of the Asian-BR and
orld-B groups were 0.10552 and 0.10092 in nucleotide and.02591 and 0.03950 in amino acid sequences respectively. In con-rast, the similarities between the isolates in basal-B group were.15828 in nucleotide and 0.04946 in amino acid sequences. Thus
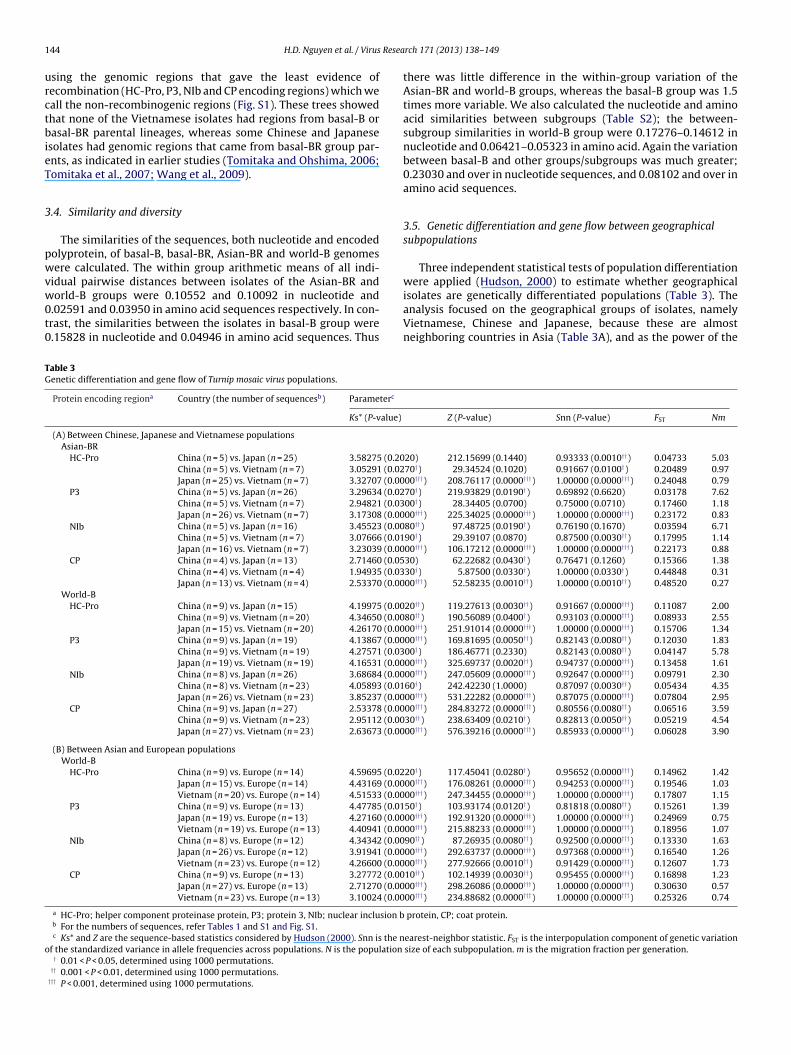
able 3enetic differentiation and gene flow of Turnip mosaic virus populations.
Protein encoding regiona Country (the number of sequencesb) Parameterc
Ks* (P-value)
(A) Between Chinese, Japanese and Vietnamese populationsAsian-BR
HC-Pro China (n = 5) vs. Japan (n = 25) 3.58275 (0.20China (n = 5) vs. Vietnam (n = 7) 3.05291 (0.02Japan (n = 25) vs. Vietnam (n = 7) 3.32707 (0.00
P3 China (n = 5) vs. Japan (n = 26) 3.29634 (0.02China (n = 5) vs. Vietnam (n = 7) 2.94821 (0.03Japan (n = 26) vs. Vietnam (n = 7) 3.17308 (0.00
NIb China (n = 5) vs. Japan (n = 16) 3.45523 (0.00China (n = 5) vs. Vietnam (n = 7) 3.07666 (0.01Japan (n = 16) vs. Vietnam (n = 7) 3.23039 (0.00
CP China (n = 4) vs. Japan (n = 13) 2.71460 (0.05China (n = 4) vs. Vietnam (n = 4) 1.94935 (0.03Japan (n = 13) vs. Vietnam (n = 4) 2.53370 (0.00
World-BHC-Pro China (n = 9) vs. Japan (n = 15) 4.19975 (0.00
China (n = 9) vs. Vietnam (n = 20) 4.34650 (0.00Japan (n = 15) vs. Vietnam (n = 20) 4.26170 (0.00
P3 China (n = 9) vs. Japan (n = 19) 4.13867 (0.00China (n = 9) vs. Vietnam (n = 19) 4.27571 (0.03Japan (n = 19) vs. Vietnam (n = 19) 4.16531 (0.00
NIb China (n = 8) vs. Japan (n = 26) 3.68684 (0.00China (n = 8) vs. Vietnam (n = 23) 4.05893 (0.01Japan (n = 26) vs. Vietnam (n = 23) 3.85237 (0.00
CP China (n = 9) vs. Japan (n = 27) 2.53378 (0.00China (n = 9) vs. Vietnam (n = 23) 2.95112 (0.00Japan (n = 27) vs. Vietnam (n = 23) 2.63673 (0.00
(B) Between Asian and European populationsWorld-B
HC-Pro China (n = 9) vs. Europe (n = 14) 4.59695 (0.02Japan (n = 15) vs. Europe (n = 14) 4.43169 (0.00Vietnam (n = 20) vs. Europe (n = 14) 4.51533 (0.00
P3 China (n = 9) vs. Europe (n = 13) 4.47785 (0.01Japan (n = 19) vs. Europe (n = 13) 4.27160 (0.00Vietnam (n = 19) vs. Europe (n = 13) 4.40941 (0.00
NIb China (n = 8) vs. Europe (n = 12) 4.34342 (0.00Japan (n = 26) vs. Europe (n = 12) 3.91941 (0.00Vietnam (n = 23) vs. Europe (n = 12) 4.26600 (0.00
CP China (n = 9) vs. Europe (n = 13) 3.27772 (0.00Japan (n = 27) vs. Europe (n = 13) 2.71270 (0.00Vietnam (n = 23) vs. Europe (n = 13) 3.10024 (0.00
a HC-Pro; helper component proteinase protein, P3; protein 3, NIb; nuclear inclusion bb For the numbers of sequences, refer Tables 1 and S1 and Fig. S1.c Ks* and Z are the sequence-based statistics considered by Hudson (2000). Snn is the n
f the standardized variance in allele frequencies across populations. N is the population
† 0.01 < P < 0.05, determined using 1000 permutations.†† 0.001 < P < 0.01, determined using 1000 permutations.††† P < 0.001, determined using 1000 permutations.
rch 171 (2013) 138– 149
there was little difference in the within-group variation of theAsian-BR and world-B groups, whereas the basal-B group was 1.5times more variable. We also calculated the nucleotide and aminoacid similarities between subgroups (Table S2); the between-subgroup similarities in world-B group were 0.17276–0.14612 innucleotide and 0.06421–0.05323 in amino acid. Again the variationbetween basal-B and other groups/subgroups was much greater;0.23030 and over in nucleotide sequences, and 0.08102 and over inamino acid sequences.
3.5. Genetic differentiation and gene flow between geographicalsubpopulations
Three independent statistical tests of population differentiationwere applied (Hudson, 2000) to estimate whether geographical
isolates are genetically differentiated populations (Table 3). Theanalysis focused on the geographical groups of isolates, namelyVietnamese, Chinese and Japanese, because these are almostneighboring countries in Asia (Table 3A), and as the power of theZ (P-value) Snn (P-value) FST Nm
20) 212.15699 (0.1440) 0.93333 (0.0010††) 0.04733 5.0370†) 29.34524 (0.1020) 0.91667 (0.0100†) 0.20489 0.9700†††) 208.76117 (0.0000†††) 1.00000 (0.0000†††) 0.24048 0.7970†) 219.93829 (0.0190†) 0.69892 (0.6620) 0.03178 7.6200†) 28.34405 (0.0700) 0.75000 (0.0710) 0.17460 1.1800†††) 225.34025 (0.0000†††) 1.00000 (0.0000†††) 0.23172 0.8380††) 97.48725 (0.0190†) 0.76190 (0.1670) 0.03594 6.7190†) 29.39107 (0.0870) 0.87500 (0.0030††) 0.17995 1.1400†††) 106.17212 (0.0000†††) 1.00000 (0.0000†††) 0.22173 0.8830) 62.22682 (0.0430†) 0.76471 (0.1260) 0.15366 1.3830†) 5.87500 (0.0330†) 1.00000 (0.0330†) 0.44848 0.3100†††) 52.58235 (0.0010††) 1.00000 (0.0010††) 0.48520 0.27
20††) 119.27613 (0.0030††) 0.91667 (0.0000†††) 0.11087 2.0080††) 190.56089 (0.0400†) 0.93103 (0.0000†††) 0.08933 2.5500†††) 251.91014 (0.0000†††) 1.00000 (0.0000†††) 0.15706 1.3400†††) 169.81695 (0.0050††) 0.82143 (0.0080††) 0.12030 1.8300†) 186.46771 (0.2330) 0.82143 (0.0080††) 0.04147 5.7800†††) 325.69737 (0.0020††) 0.94737 (0.0000†††) 0.13458 1.6100†††) 247.05609 (0.0000†††) 0.92647 (0.0000†††) 0.09791 2.3060†) 242.42230 (1.0000) 0.87097 (0.0030††) 0.05434 4.3500†††) 531.22282 (0.0000†††) 0.87075 (0.0000†††) 0.07804 2.9500†††) 284.83272 (0.0000†††) 0.80556 (0.0080††) 0.06516 3.5930††) 238.63409 (0.0210†) 0.82813 (0.0050††) 0.05219 4.5400†††) 576.39216 (0.0000†††) 0.85933 (0.0000†††) 0.06028 3.90
20†) 117.45041 (0.0280†) 0.95652 (0.0000†††) 0.14962 1.4200†††) 176.08261 (0.0000†††) 0.94253 (0.0000†††) 0.19546 1.0300†††) 247.34455 (0.0000†††) 1.00000 (0.0000†††) 0.17807 1.1550†) 103.93174 (0.0120†) 0.81818 (0.0080††) 0.15261 1.3900†††) 192.91320 (0.0000†††) 1.00000 (0.0000†††) 0.24969 0.7500†††) 215.88233 (0.0000†††) 1.00000 (0.0000†††) 0.18956 1.0790††) 87.26935 (0.0080††) 0.92500 (0.0000†††) 0.13330 1.6300†††) 292.63737 (0.0000†††) 0.97368 (0.0000†††) 0.16540 1.2600†††) 277.92666 (0.0010††) 0.91429 (0.0000†††) 0.12607 1.7310††) 102.14939 (0.0030††) 0.95455 (0.0000†††) 0.16898 1.2300†††) 298.26086 (0.0000†††) 1.00000 (0.0000†††) 0.30630 0.5700†††) 234.88682 (0.0000†††) 1.00000 (0.0000†††) 0.25326 0.74
protein, CP; coat protein.
earest-neighbor statistic. FST is the interpopulation component of genetic variationsize of each subpopulation. m is the migration fraction per generation.

Resea
ta
msZdonhCr
TN
Tbb
H.D. Nguyen et al. / Virus
ests increases as the subpopulation size also increases and thesere the largest geographical groupings covered in the present study.
In the Asian-BR group, the null hypothesis was rejected for theajority of comparisons, with all the test statistics (KS*, Z, and Snn)
upported by P-values less than 0.05. Only in some cases the KS*, and Snn statistics were not significant. The failure of the tests toifferentiate the two geographical groups may be attributed to lackf statistical power. However, most of other test statistics were sig-
ificant for the comparisons, supporting the conclusion that thereas been partial genetic differentiation between the Vietnamese,hinese and Japanese geographical groups in agreement with theesults of the phylogenetic analyses (Fig. S1). Namely, the absoluteable 4eutrality tests of each Turnip mosaic virus population.
Protein encoding regiona and country nb Ta
(A) Chinese, Japanese and Vietnamese populationsAsian-BR
HC-ProChina 5 −0Japan 25 −1Vietnam 7 1.
P3China 5 −0Japan 26 −1Vietnam 7 1.
NIbChina 5 −0Japan 16 −0Vietnam 7 −0
CPChina 4 −0Japan 13 −1Vietnam 4 1.
World-BHC-Pro
China 9 −0Japan 15 −0Vietnam 20 −0
P3China 9 −0Japan 19 −0Vietnam 19 −0
NIbChina 8 −1Japan 26 −2Vietnam 23 −1
CPChina 9 −1Japan 27 −2Vietnam 23 −1
PolyproteinVietnam 15 −0
(B) European populationsWorld-B
HC-ProPoland 4 −0UK 4 0.
P3Poland 3 NDUK 4 −0
NIbPoland 4 0.UK 4 −0
CPPoland 4 0.UK 4 −0
ajima’s D test compares the nucleotide diversity with the proportion of polymorphic sitased on the differences between the numbers of singletons (mutations appearing only oased on the differences between the number of singletons and the average number of na HC-Pro, helper component proteinase protein, P3, protein 3, NIb, nuclear inclusion b
b The number of sequences.c Not determined. The number of sequences was less than four isolates because one iso† P < 0.05.†† P < 0.01.
rch 171 (2013) 138– 149 145
values of FST were smaller than 0.33, indicating that the gene flowof TuMV populations between Vietnam, China and Japan were fre-quent in most of protein encoding regions, the only exception beingthe CP encoding region, where comparisons between Vietnameseand Chinese/Japanese isolates gave values greater than 0.33. How-ever, the gene flow between China and Japan seems to be morefrequent than between those countries and Vietnam.
In the world-B group, all the values of FST were smaller than
0.33, indicating that the gene flow of TuMV populations betweenVietnam, China and Japan were frequent. The smaller values of FSTwere seen in all four protein encoding regions. The values of FSTwere the smallest between China and Vietnam in all four proteinjima’s D Fu and Li’s D* Fu and Li’s F*
.63139 −0.63139 −0.68532
.92660† −2.62744† −2.82820†
54363 0.97184 1.21783
.62215 −0.62215 −0.67523
.83537† −2.33249 −2.5592884380 1.32611 1.59546
.72045 −0.72045 −0.75033
.96453 −1.22268 −1.32024
.81734 −0.81734 −0.79606
.87890 −0.94922 −1.01629
.76968 −2.03877 −2.2693786133 1.30789 1.58501
.48432 −0.53221 −0.58533
.83024 −1.11001 −1.18974
.16900 −0.21796 −0.23720
.19375 −0.18653 −0.21170
.82492 −1.18001 −1.25131
.04508 0.19785 0.14576
.00796 −1.10071 −1.20539
.03745† −2.81582† −3.02177†
.34435 −1.19949 −1.46206
.18468 −1.09289 −1.25299
.31499†† −3.38344†† −3.57982††
.56482 −1.19468 −1.53754
.39358 −0.51760 −0.55695
.83333 −0.83333 −0.8974524153 0.14492 0.17328
c ND ND.07240 −0.17860 −0.16964
59727 0.71694 0.74904.29977 −0.29977 −0.31893
37113 0.54862 0.55263.18114 −0.18114 −0.18471
es, which are expected to be equal under selective neutrality. Fu and Li’s D* test isnce among the sequences) and the total number of mutations. Fu and Li’s F* test is
ucleotide differences between pairs of sequences.protein, CP, coat protein.
late in Poland, had recombination site in P3 encoding region (Ohshima et al., 2007).

146H
.D.
Nguyen
et al.
/ V
irus R
esearch 171 (2013) 138– 149
Table 5Haplotype and nucleotide diversities of subpopulations in Turnip mosaic virus groups.
Group and country Protein encoding regiona
Polyprotein HC-Pro P3 NIb CP
nb Hc �d n H � n H � n H � n H �
(A) Chinese, Japanese and Vietnamese populationsAll groups
Asia 20 1.000 ± 0.016 0.0819 ± 0.0017 85 1.000 ± 0.002 0.1171 ± 0.0034 91 1.000 ± 0.002 0.1355 ± 0.0042 92 0.999 ± 0.002 0.0870 ± 0.0031 87 1.000 ± 0.002 0.0511 ± 0.0036China 4 1.000 ± 0.177 0.1186 ± 0.0025 16 1.000 ± 0.022 0.1280 ± 0.0047 16 1.000 ± 0.022 0.1493 ± 0.0057 14 1.000 ± 0.027 0.0937 ± 0.0040 14 1.000 ± 0.001 0.0754 ± 0.0042Japan 1 NDe ND 42 1.000 ± 0.005 0.1056 ± 0.0037 49 1.000 ± 0.004 0.1278 ± 0.0046 48 1.000 ± 0.004 0.0887 ± 0.0033 46 1.000 ± 0.005 0.0535 ± 0.0037Vietnam 15 1.000 ± 0.024 0.0511 ± 0.0014 27 0.997 ± 0.011 0.1054 ± 0.0038 26 0.994 ± 0.013 0.1210 ± 0.0046 30 0.993 ± 0.012 0.0768 ± 0.0034 27 1.000 ± 0.010 0.0393 ± 0.0036
Basal-BRAsia 1 ND ND 4 1.000 ± 0.177 0.0695 ± 0.0050 6 1.000 ± 0.096 0.0533 ± 0.0044 7 1.000 ± 0.076 0.0555 ± 0.0039 7 1.000 ± 0.076 0.0365 ± 0.0042
China 2 1.000 ± 0.500 0.0992 ± 0.0085 2 1.000 ± 0.500 0.0840 ± 0.0089 1 ND ND 1 ND NDJapan 1 ND ND 2 1.000 ± 0.500 0.0992 ± 0.0085 4 1.000 ± 0.177 0.0515 ± 0.0053 6 1.000 ± 0.096 0.0493 ± 0.0038 6 1.000 ± 0.096 0.0368 ± 0.0043
Asian-BRAsia 2 1.000 ± 0.500 0.0164 ± 0.0013 37 0.998 ± 0.007 0.0241 ± 0.0029 38 0.999 ± 0.006 0.0356 ± 0.0041 28 0.992 ± 0.013 0.0218 ± 0.0026 21 1.000 ± 0.015 0.0195 ± 0.0030
China 2 1.000 ± 0.500 0.0164 ± 0.0013 5 1.000 ± 0.126 0.0225 ± 0.0029 5 1.000 ± 0.126 0.0287 ± 0.0038 5 1.000 ± 0.126 0.0246 ± 0.0029 4 1.000 ± 0.177 0.0145 ± 0.0032Japan 25 1.000 ± 0.011 0.0226 ± 0.0029 26 1.000 ± 0.011 0.0247 ± 0.0034 16 1.000 ± 0.022 0.0195 ± 0.0025 13 1.000 ± 0.030 0.0191 ± 0.0030Vietnam 7 0.952 ± 0.096 0.0189 ± 0.0021 7 0.952 ± 0.096 0.0209 ± 0.0025 7 0.857 ± 0.137 0.0167 ± 0.0018 4 1.000 ± 0.177 0.0043 ± 0.0018
World-BAsia 17 1.000 ± 0.020 0.0508 ± 0.0014 44 1.000 ± 0.005 0.0611 ± 0.0035 49 0.999 ± 0.004 0.0743 ± 0.0044 57 1.000 ± 0.003 0.0433 ± 0.0034 59 1.000 ± 0.003 0.0199 ± 0.0035
China 2 1.000 ± 0.500 0.0389 ± 0.0021 9 1.000 ± 0.052 0.0584 ± 0.0042 9 1.000 ± 0.052 0.0756 ± 0.0052 8 1.000 ± 0.063 0.0361 ± 0.0033 9 1.000 ± 0.052 0.0270 ± 0.0039Japan 15 1.000 ± 0.024 0.0472 ± 0.0036 19 1.000 ± 0.017 0.0600 ± 0.0050 26 1.000 ± 0.011 0.0242 ± 0.0029 27 1.000 ± 0.010 0.0138 ± 0.0032Vietnam 15 1.000 ± 0.024 0.0511 ± 0.0014 20 1.000 ± 0.016 0.0612 ± 0.0036 19 0.994 ± 0.019 0.0746 ± 0.0043 23 1.000 ± 0.013 0.0340 ± 0.0032 23 1.000 ± 0.013 0.0227 ± 0.0034
(B) European populationsAll groups
Europe 7 1.000 ± 0.076 0.1443 ± 0.0024 23 1.000 ± 0.013 0.1557 ± 0.0046 26 1.000 ± 0.011 0.1856 ± 0.0056 25 1.000 ± 0.011 0.1310 ± 0.0041 25 1.000 ± 0.011 0.0777 ± 0.0048Czech Republic 1 ND ND 2 1.000 ± 0.500 0.1678 ± 0.0111 2 1.000 ± 0.500 0.1992 ± 0.0137 2 1.000 ± 0.500 0.0542 ± 0.0059 2 1.000 ± 0.500 0.0756 ± 0.0097Germany 2 1.000 ± 0.500 0.1809 ± 0.0115 2 1.000 ± 0.500 0.2210 ± 0.0144 1 ND ND 2 1.000 ± 0.500 0.0843 ± 0.0102Greece 2 1.000 ± 0.500 0.2181 ± 0.0126 2 1.000 ± 0.500 0.2238 ± 0.0145 2 1.000 ± 0.500 0.1960 ± 0.0112 2 1.000 ± 0.500 0.1016 ± 0.0112Italy 3 1.000 ± 0.272 0.1555 ± 0.0034 5 1.000 ± 0.126 0.1852 ± 0.0075 8 1.000 ± 0.063 0.1954 ± 0.0077 8 1.000 ± 0.063 0.1501 ± 0.0056 7 1.000 ± 0.076 0.0932 ± 0.0066Poland 2 1.000 ± 0.500 0.0045 ± 0.0007 4 1.000 ± 0.177 0.0857 ± 0.0061 3 1.000 ± 0.272 0.1149 ± 0.0085 4 1.000 ± 0.177 0.0996 ± 0.0057 4 1.000 ± 0.177 0.0630 ± 0.0062Russia 1 ND ND 2 1.000 ± 0.500 0.0292 ± 0.0046 2 1.000 ± 0.500 0.0179 ± 0.0179 2 1.000 ± 0.500 0.1251 ± 0.0090 1 ND NDUK 4 1.000 ± 0.177 0.0269 ± 0.0032 4 1.000 ± 0.177 0.0307 ± 0.0040 4 1.000 ± 0.177 0.0191 ± 0.0026 4 1.000 ± 0.177 0.0093 ± 0.0025
Basal-BEurope 1 ND ND 4 1.000 ± 0.177 0.1329 ± 0.0072 5 1.000 ± 0.126 0.1352 ± 0.0076 5 1.000 ± 0.126 0.1157 ± 0.0060 4 1.000 ± 0.177 0.0768 ± 0.0072Italy 1 ND ND 3 1.000 ± 0.272 0.1593 ± 0.0087 5 1.000 ± 0.126 0.1513 ± 0.0080 5 1.000 ± 0.126 0.1408 ± 0.0064 4 1.000 ± 0.177 0.0919 ± 0.0077
Basal-BREurope 2 1.000 ± 0.500 0.0887 ± 0.0031 3 1.000 ± 0.272 0.1155 ± 0.0074 3 1.000 ± 0.272 0.1045 ± 0.0080 3 1.000 ± 0.272 0.0389 ± 0.0041 3 1.000 ± 0.272 0.0314 ± 0.0051
Italy 2 1.000 ± 0.500 0.0887 ± 0.0031 2 1.000 ± 0.500 0.1262 ± 0.0096 3 1.000 ± 0.271 0.1580 ± 0.0098 3 1.000 ± 0.272 0.0933 ± 0.0063 3 1.000 ± 0.272 0.0558 ± 0.0068World-B
Europe 3 1.000 ± 0.001 0.1393 ± 0.0013 16 1.000 ± 0.022 0.1117 ± 0.0043 16 1.000 ± 0.022 0.1279 ± 0.0052 15 1.000 ± 0.024 0.0823 ± 0.0038 16 1.000 ± 0.022 0.0496 ± 0.0042Czech Republic 1 ND ND 2 1.000 ± 0.500 0.1678 ± 0.0111 2 1.000 ± 0.500 0.1992 ± 0.0137 2 1.000 ± 0.500 0.0545 ± 0.0059 2 1.000 ± 0.500 0.0756 ± 0.0097Poland 2 1.000 ± 0.500 0.0045 ± 0.0007 4 1.000 ± 0.177 0.0857 ± 0.0061 3 1.000 ± 0.272 0.1149 ± 0.0085 4 1.000 ± 0.177 0.0996 ± 0.0057 4 1.000 ± 0.177 0.0630 ± 0.0062Russia 1 ND ND 2 1.000 ± 0.500 0.0292 ± 0.0046 2 1.000 ± 0.500 0.0179 ± 0.0179 2 1.000 ± 0.500 0.1251 ± 0.0090 1 ND NDUK 4 1.000 ± 0.177 0.0269 ± 0.0032 4 1.000 ± 0.177 0.0307 ± 0.0040 4 1.000 ± 0.177 0.0191 ± 0.0026 4 1.000 ± 0.177 0.0093 ± 0.0025
a HC-Pro, helper component proteinase protein, P3, protein 3, NIb, nuclear inclusion b protein, CP, coat protein.b The number of sequences.c Haplotype diversity.d Nucleotide diversity was estimated by the average pairwise difference between sequences in a sample, based on all sites.e Not determined.

Resea
eVgbtblAr
adBscCst
3
Tsandasttgagaosiw
s(ahsvHlgadeV0iiVpgCdaad
H.D. Nguyen et al. / Virus
ncoding regions, indicating that the gene flow between China andietnam in the world-B group is the most frequent. As the world-Broup contains many European countries, genetic differentiationsetween Asian and European populations were also analyzed. Allhe values of FST were smaller than 0.33 but greater than the valuesetween Asian countries, indicating less gene flow of TuMV popu-
ations between Asian and European countries than those withinsian countries. The results are in agreement with the phylogeneticelationships of each population (Figs. 3 and S1).
The statistical tests of population differentiation were alsopplied to estimate whether geographical isolates are geneticallyifferentiated populations, considering the original host plants,rassica and Raphanus, of the isolates (Table S3). Most of other testtatistics were significant for the comparisons, supporting the con-lusion that there has been gene flow between the Vietnamese,hinese and Japanese geographical groups, especially between theubpopulations from the same original hosts, in agreement withhe results of the phylogenetic analyses (Fig. S1).
.6. Levels and patterns of intraspecific polymorphism
The patterns of molecular diversity were evaluated usingajima’s D, Fu and Li’s D* and F* statistical test at segregatingites (Table 4), and haplotype diversity and nucleotide diversityt all sites (Table 5). The statistical tests are expected to haveegative values for background selection, genetic hitchhiking andemographic expansion, and the negative values indicate that
population maintained low frequency polymorphism. Becauseelection events such as genetic hitchhiking and background selec-ion affect relatively small fractions of the genome, a multilocusrend of negative statistical values would indicate that demo-raphic forces are acting on the population (Tajima, 1989; Heynd Harris, 1999; Tsompana et al., 2005). For the majority ofeographical groups across the genome values of Tajima’s D, Fund Li’s D* and F* statistical test are negative, indicating theccurrence of recent TuMV population expansions. Particularly, Ftatistical tests supported demographic expansion of the Japanesesolates in two of four protein encoding regions of Asian-BR and
orld-B groups.Haplotype and nucleotide diversities of Asian and European
ubpopulations in TuMV phylogenetic groups were comparedTable 5). The haplotype diversity in most groups analyzed had
value of 1.000. In most cases, haplotype diversity values areigh and nucleotide diversity values are low. Nucleotide diver-ities of Europe in the all genogroups showed greater diversityalues than those of Asia in all the protein encoding regions ofC-Pro, P3, NIb and CP, nonetheless the number of European iso-
ates used for the calculations is small. We assume that theseenetic differences indicate that the European populations of TuMVre the oldest. Furthermore, the analysis of within-subpopulationiversities between the Asian countries in Asian-BR group, HC-Proncoding region (0.0225 in China, 0.0226 in Japan and 0.0189 inietnam), P3 encoding region (0.0287 in China, 0.0247 in Japan and.0209 in Vietnam), NIb encoding region (0.0246 in China, 0.0195
n Japan and 0.0167 in Vietnam) and CP encoding region (0.0145n China, 0.0191 in Japan and 0.0043 in Vietnam), showed thatietnamese subpopulation is smaller. In contrast, within subpo-ulation diversities in all the protein encoding regions of world-Broup in Vietnamese subpopulation were greater than those ofhinese and Japanese subpopulations, suggesting that there was
ifferent evolution in world-B and Asian-BR groups in Asia. Over-ll, the deviations from the neutral equilibrium model for the fournalyzed genes, together with the combination of high haplotypeiversity and overall lack of nucleotide diversity within individualrch 171 (2013) 138– 149 147
geographical groups are consistent with a model of recent popula-tion expansion events.
4. Discussion
There are fewer studies of the genetic structure and variabilityof plant viruses than of human and animal viruses. Here, we utilizedmolecular population genetics techniques to characterize the evo-lution of a plant RNA virus. Studies of the population structures ofseveral potyviruses have shown some details of genetic variationsat regional or global scales (Ohshima et al., 2002; Tomimura et al.,2003, 2004; Moreno et al., 2004; Tomitaka and Ohshima, 2006;Ogawa et al., 2008, 2012; Lecoq et al., 2009; Seo et al., 2009; Joannonet al., 2010; Zhang et al., 2011). In this study, the full genomicsequences of 30 TuMV isolates from Vietnam located in SoutheastAsia were determined and the genetic variability of populationswas compared to those of nearby Asian countries. Our resultsshowed that (1) TuMV is widely distributed in Vietnam, (2) sevennovel recombination patterns were present in the Vietnamese pop-ulation of TuMV, (3) non-recombinant Vietnamese isolates werefrom the world-B group and clustered with Chinese isolates, (4)the world-B group isolates dominate the Vietnamese populationand (5) there was evidence of frequent gene flow between TuMVisolates from Vietnam and other Asian countries.
In studies of plant virus evolution it is very important to clonethe viral isolates being studied before they are sequenced. TuMVisolates were generally cloned by single lesion isolations in the ear-lier and present studies because of the high frequency of mixedinfections in the field, not only with other viruses, especially CMV,but also other isolates of the same virus (approximately 2% inKyushu, Japan) (Tomitaka and Ohshima, 2006). It is consideredthat mutations occur in each infected plant so that each contains a“mutant cloud” or “quasispecies” (Roossinck, 2008) of slightly dif-ferent genomes within a single population. However, each fieldisolate may also contain mixtures of populations, even when thevirus has been transmitted by aphids. Thus, biological cloning ismandatory when attempting to analyze recombinational eventsand the genetic structure of populations (Ohshima et al., 2002;Moreno et al., 2004). In our study, we found very few mismatchesin the sequences between the overlapping RT-PCR products afterthe virus populations had been cloned by single lesion isolations.
Recombination is an important source of genetic variation notonly for TuMV (Ohshima et al., 2002, 2007) but also for the otherpotyvirus species (Gibbs and Ohshima, 2010). We report here thatwe have found recombination patterns in Vietnamese TuMV thathave not been found before in isolates from European and Asiancountries (Fig. 2). Non-recombinants from the world-B group weremostly found in the Vietnamese TuMV population (50%) and alsothe Chinese TuMV population. The most frequent type of recombi-nant in the Vietnamese population is intralineage recombinants ofworld-B parents (eight intralineage recombinants out of 30 isolates,26.6%). Most of the recombination sites were unique to Vietnam,and not found in Chinese and Japanese populations in the ear-lier studies (Tomimura et al., 2003; Ohshima et al., 2007; Wanget al., 2009). One recombination site nt 5989 seems to be iden-tical to the site previously found in Czech Republic population(Ohshima et al., 2007). Therefore, a total of 73% of Vietnamesepopulation has world-B parents and this group is dominant in Viet-nam around 2006–2008. On the other hand, non-recombinants ofAsian-BR and basal-BR lineages were not found in the Vietnamesepopulation, although they have already been found in Chinese
and Japanese population. Two interlineage recombinant type pat-terns of Asian-BR and world-B parents were found in Vietnam,and one of two patterns was identical to the Japanese population,indicating that such isolates may be now geographically dispersed
1 Resea
it
ntecAobpagaai(
aamTspgwatiabpJ
aaembedcpdnei
pebwgrotciu
A
As
48 H.D. Nguyen et al. / Virus
n Asian countries and there may have been founder effects duringhe establishment of the subpopulations in Asia.
The genetic differentiation analyses together with the phyloge-etic analyses reveal that TuMV has a structure in Asian countrieshat is partially congruent with geography (Table 3 and Fig. S1),ven though gene flow of the TuMV populations between Asianountries was frequent, especially between China and Japan ofsian-BR group isolates. This pattern might reflect characteristicsf TuMV transmission and the physical and quarantine barriersetween Asian countries. TuMV is transmitted by aphids in a non-ersistent manner and they are able to only carry the virus for
short time. The sea, country-dependent agriculture crops androwing conditions of crops may form an obstacle for the spread ofphids, and thus limit spread of the virus. Physical obstacles havelso been reported to be a reason responsible for the strain local-zation of Rice yellow mottle virus (Traore et al., 2005) and TVBMVZhang et al., 2011).
Phylogenetic trees represent the evolutionary relationshipsmong populations. Our phylogenetic trees from partial genomicnd polyprotein regions showed that there are at least fourajor groups and three subgroups in the world population of
uMV (Fig. 3). All the Vietnamese non-recombinant world-B groupequences clustered with BJ-C4 and Lu2 of Chinese isolates in theolyprotein phylogenetic tree (Fig. 3). Of course, we cannot distin-uish whether the Vietnamese isolates originated in Vietnam orere introduced from other countries on one or more occasions
nd then spread. It is clear that Vietnamese and Chinese popula-ions had strong evolutionary relationships in the past. However,t is possible that TuMV has been introduced to Vietnam via China,lthough we cannot exclude the possibility that TuMV could haveeen introduced from Vietnam into China. The results are sup-orted by the analysis of gene flow between Vietnam, China and
apan subpopulations (Table 5).Some subpopulations of basal-BR and Asian-BR groups of TuMV
re probably recently emerged (Tomimura et al., 2003; Tomitakand Ohshima, 2006). However, our present analysis showed novidence of a Vietnam-specific emergent TuMV population andost (73%) of non-recombinants and intralineage recombinants
elonged to world-B group, and the subpopulation might havexisted for a relatively long time. Therefore, the increasing inci-ence of TuMV in Vietnamese Brassicaceae crops result fromhanged agronomic factors, such as increased and widespreadlanting of more susceptible cultivars. Interestingly, TuMV was notetected in some Brassicaceae production areas in Vietnam (dataot shown). Although the reason for this is not clear; local differ-nces in cultivars and geographical environments including climaten Southeast Asia may account for this situation.
In conclusion, our evolutionary studies have shown that TuMVopulations in Vietnam, China and Japan were partial discrete lin-ages confined to individual districts, although these may haveeen modified subsequently by clinal genetic drift. As shown in thisork, the introduction of new isolates and the appearance of new
enetic types not only by recombination but also by mutation, rep-esent a high potential risk, and should be considered in the designf efficient control strategies. This study shows for the first timehe genetic structure of the TuMV population in a Southeast Asiaountry, and illustrates that, when designing control strategies, its important to understand the genetic structure of the virus pop-lation at different geographic scales; country, region and locality.
cknowledgements
We thank Hiroki Takeshita, Yasuhiro Tomitaka, Sadayukikaishi, Ryoko Koga (Saga University), Giang Ha (Hanoi Univer-ity of Agriculture) and Chung Van Phan (Dak Lak) for their careful
rch 171 (2013) 138– 149
technical assistance, and Adrian Gibbs (Canberra) for very kindlyreading the manuscript. This work was in part funded by Saga Uni-versity and supported by JSPS KAKENHI Grant Numbers 18405022and 24405026.
Appendix A. Supplementary data
Supplementary data associated with this article can befound, in the online version, at http://dx.doi.org/10.1016/j.virusres.2012.11.008.
References
Chen, J., Chen, J.P., Langeveld, S.A., Derks, A.F.L.M., Adams, M.J., 2003. Molecularcharacterization of carla- and potyviruses from Narcissus in China. Journal ofPhytopathology 151, 26–29.
Chen, J., Zheng, H.Y., Chen, J.P., Adams, M.J., 2002. Characterisation of a potyvirusand a potexvirus from Chinese scallion. Archives of Virology 147, 683–693.
Chung, B.Y.-W., Miller, W.A., Atkins, J.F., Firth, A.E., 2008. An overlapping essentialgene in the Potyviridae. Proceedings of the National Academy of Sciences of theUnited States of America 105, 5897–5902.
Clark, M.F., Adams, A.N., 1977. Characteristics of the microplate method of enzyme-linked immunosorbent assay for the detection of plant viruses. Journal ofGeneral Virology 34, 475–483.
Farzadfar, S., Tomitaka, Y., Ikematsu, M., Golnaraghi, A., Pourrahim, R., Ohshima,K., 2009. Molecular characterisation of Turnip mosaic virus isolates from Brassi-caceae weeds. European Journal of Plant Pathology 124, 45–55.
Fu, Y.X., Li, W.H., 1993. Statistical tests of neutrality of mutations. Genetics 133,693–709.
Fuji, S., Nakamae, H., 1999. Complete nucleotide sequence of the genomic RNA of aJapanese yam mosaic virus, a new potyvirus in Japan. Archives of Virology 144,231–240.
Fuji, S., Nakamae, H., 2000. Complete nucleotide sequence of the genomic RNAof a mild strain of Japanese yam mosaic potyvirus. Archives of Virology 145,635–640.
García-Arenal, F., Fraile, A., Malpica, J.M., 2001. Variability and genetic structure ofplant virus populations. Annual Review of Phytopathology 39, 157–186.
Gibbs, A.J., Ohshima, K., 2010. Potyviruses and the digital revolution. Annual Reviewof Phytopathology 48, 205–223.
Gibbs, A.J., Gibbs, M., Ohshima, K., García-Arenal, F., 2008. More about plant virusevolution; past, present and future. In: Domingo, E., Parrish, C.R., Holland, J.J.(Eds.), Origin and Evolution of Viruses. , 2nd ed. Elsevier Academic Press, London,UK, pp. 229–250.
Gibbs, M.J., Armstrong, J.S., Gibbs, A.J., 2000. Sister-scanning: a Monte Carlo pro-cedure for assessing signals in recombinant sequences. Bioinformatics 16,573–582.
Guindon, S., Gascuel, O., 2003. A simple fast and accurate algorithm to estimate largephylogenies by miximum likelihood. Systematic Biology 52, 696–704.
Ha, C., Revill, P., Harding, R.M., Vu, M., Dale, J.L., 2008. Identification and sequenceanalysis of potyviruses infecting crops in Vietnam. Archives of Virology 153,45–60.
Hall, T.A., 1999. BioEdit: a user-friendly biological sequence alignment editor andanalysis program for Windows 95/98/NT. Nucleic Acids Symposium Series 41,95–98.
Hey, J., Harris, E., 1999. Population bottlenecks and patterns of human polymor-phism. Molecular Biology and Evolution 16, 1423–1426.
Hudson, R.R., 2000. A new statistic for detecting genetic differentiation. Genetics155, 2011–2014.
Jenner, C.E., Sanchez, F., Nettleship, S.B., Foster, G.D., Ponz, F., Walsh, J.A., 2000.The cylindrical inclusion gene of Turnip mosaic virus encodes a pathogenicdeterminant to the brassica resistance gene TuRB01. Molecular Plant-MicrobeInteractions 13, 1102–1108.
Joannon, B., Lavigne, C., Lecoq, H., Desbiez, C., 2010. Barriers to gene flow betweenemerging populations of Watermelon mosaic virus in southeastern France. Phy-topathology 100, 1373–1379.
Karasev, A.V., Hu, X., Brown, C.J., Kerlan, C., Nikolaeva, O.V., Crosslin, J.M., Gray, S.M.,2011. Genetic diversity of the ordinary strain of Potato virus Y (PVY) and originof recombinant PVY strains. Phytopathology 101, 778–785.
Kimura, M., 1980. A simple method for estimating evolutionary rates of basesubstitutions through comparative studies of nucleotide sequences. Journal ofMolecular Evolution 16, 111–120.
King, A.M.Q., Adams, M.J., Carstens, E.B., Lefkowitz, E.J., 2012. Virus Taxonomy: NinthReport of the International Committee on Taxonomy of Viruses. Elsevier Aca-demic Press, San Diego, CA, USA.
Korkmaz, S., Tomitaka, Y., Onder, S., Ohshima, K., 2008. Occurrence and molecularcharacterization of Turkish isolates of Turnip mosaic virus. Plant Pathology 57,
1155–1162.Larkin, M.A., Blackshields, G., Brown, N.P., Chenna, R., McGettigan, P.A., McWilliam,H., Valentin, F., Wallace, I.M., Wilm, A., Lopez, R., Thompson, J.D., Gibson, T.J.,Higgins, D.G., 2007. CLUSTAL W and CLUSTAL X version 2.0. Bioinformatics 23,2947–2948.
Resea
L
L
M
M
M
M
O
O
O
O
O
O
P
P
P
R
S
H.D. Nguyen et al. / Virus
ecoq, H., Wipf-Scheibel, C., Chandeysson, C., Lê Van, A., Fabre, F., Desbiez, C., 2009.Molecular epidemiology of Zucchini yellow mosaic virus in France: an historicaloverview. Virus Research 141, 190–200.
ibrado, P., Rozas, J., 2009. DnaSP v5: a software for comprehensive analysis of DNApolymorphism data. Bioinformatics 25, 1451–1452.
artin, D., Rybicki, E., 2000. RDP: detection of recombination amongst alignedsequences. Bioinformatics 16, 562–563.
artin, D.P., Lemey, P., Lott, M., Moulton, V., Posada, D., Lefeuvre, P., 2010. RDP3: aflexible and fast computer program for analyzing recombination. Bioinformatics26, 2462–2463.
aynard-Smith, J., 1992. Analyzing the mosaic structure of genes. Journal of Molec-ular Evolution 34, 126–129.
oreno, I.M., Malpica, J.M., Diaz-Pendon, J.A., Moriones, E., Fraile, A., García-Arenal, F., 2004. Variability and genetic structure of the populationof watermelon mosaic virus infecting melon in Spain. Virology 318,451–460.
gawa, T., Nakagawa, A., Hataya, T., Ohshima, K., 2012. The genetic structure ofpopulations of Potato virus Y in Japan; based on the analysis of 20 full genomicsequences. Journal of Phytopathology 160, 661–673.
gawa, T., Tomitaka, Y., Nakagawa, A., Ohshima, K., 2008. Genetic structure of apopulation of Potato virus Y inducing potato tuber necrotic ring spot diseasein Japan; comparison with North American and European populations. VirusResearch 131, 199–212.
hshima, K., Tanaka, M., Sako, N., 1996. The complete nucleotide sequence of turnipmosaic virus RNA Japanese strain. Archives of Virology 141, 1991–1997.
hshima, K., Akaishi, S., Kajiyama, H., Koga, R., Gibbs, A.J., 2010. Evolutionary tra-jectory of turnip mosaic virus populations adapting to a new host. Journal ofGeneral Virology 91, 788–801.
hshima, K., Tomitaka, Y., Wood, J.T., Minematsu, Y., Kajiyama, H., Tomimura, K.,Gibbs, A.J., 2007. Patterns of recombination in turnip mosaic virus genomicsequences indicate hotspots of recombination. Journal of General Virology 88,298–315.
hshima, K., Yamaguchi, Y., Hirota, R., Hamamoto, T., Tomimura, K., Tan, Z.,Sano, T., Azuhata, F., Walsh, J.A., Fletcher, J., Chen, J., Gera, A., Gibbs, A.J.,2002. Molecular evolution of Turnip mosaic virus: evidence of host adaptation,genetic recombination and geographical spread. Journal of General Virology 83,1511–1521.
age, R.D.M., 1996. Treeview: an application to display phylogenetic treeson personal computer. Computer Applications in the Bioscience 12,357–358.
osada, D., 2008. jModelTest: phylogenetic model averaging. Molecular Biology andEvolution 25, 1253–1256.
osada, D., Crandall, K.A., 2001. Evaluation of methods for detecting recom-bination from DNA sequences: computer simulations. Proceedings of theNational Academy of Sciences of the United States of America 98,13757–13762.
oossinck, M.J., 2008. Mutant clouds and bottleneck events in plant virus evolution.
In: Domingo, E., Parrish, C.R., Holland, J.J. (Eds.), Origin and Evolution of Viruses.2nd ed. Elsevier Academic Press, London NW1 7BY, UK, pp. 251–258.alminen, M.O., Carr, J.K., Burke, D.S., McCutchan, F.E., 1995. Identification of break-points in intergenotypic recombinants of HIV type 1 by Bootscanning. AIDSResearch and Human Retroviruses 11, 1423–1425.
rch 171 (2013) 138– 149 149
Sawyer, S.A., 1999. GENECONV: a computer package for the statisticaldetection of gene conversion. Distributed by the Author. Depart-ment of Mathematics, Washington University, St Louis. Available from:http://www.math.wustl.edu/∼sawyer
Schwarz, R., Dayhoff, M., 1979. Matrices for detecting distant relationships. In: Day-hoff, M. (Ed.), Atlas of Protein Sequences. Nat. Biomed. Res. Found, WashingtonDC. USA, pp. 353–358.
Seo, J.K., Ohshima, K., Lee, H.G., So, M., Choi, H.S., Lee, S.H., Sohn, S.H., Kim, K.H.,2009. Molecular variability and genetic structure of the population of Soybeanmosaic virus based on the analysis of complete genome sequences. Virology 393,91–103.
Tajima, F., 1989. Statistical methods to test for nucleotide mutation hypothesis byDNA polymorphism. Genetics 123, 585–595.
Tamura, K., Peterson, D., Peterson, N., Stecher, G., Nei, M., Kumar, S., 2011. MEGA5:molecular evolutionary genetics analysis using maximum likelihood, evolu-tionary distance, and maximum parsimony methods. Molecular Biology andEvolution 28, 2731–2739.
Tan, Z., Wada, Y., Chen, J., Ohshima, K., 2004. Inter- and intralineage recombinantsare common in natural populations of Turnip mosaic virus. Journal of GeneralVirology 85, 2683–2696.
Tomimura, K., Gibbs, A.J., Jenner, C.E., Walsh, J.A., Ohshima, K., 2003. The phylogenyof Turnip mosaic virus; comparisons of 38 genomic sequences reveal a Eurasianorigin and a recent ‘emergence’ in east Asia. Molecular Ecology 12, 2099–2111.
Tomimura, K., Spak, J., Katis, N., Jenner, C.E., Walsh, J.A., Gibbs, A.J., Ohshima, K.,2004. Comparisons of the genetic structure of populations of Turnip mosaic virusin West and East Eurasia. Virology 330, 408–423.
Tomitaka, Y., Ohshima, K., 2006. A phylogeographic study of the Turnip mosaic viruspopulation in East Asia reveals an ‘emergent’ lineage in Japan. Molecular Ecology15, 4437–4457.
Tomitaka, Y., Yamashita, T., Ohshima, K., 2007. The genetic structure of populationsof Turnip mosaic virus in Kyushu and central Honshu, Japan. Journal of GeneralPlant Pathology 73, 197–208.
Traore, O., Sorho, F., Pinel, A., Abubakar, Z., Banwo, O., Maley, J., Hebrard, E., Winter,S., Sere, Y., Konate, G., Fargette, D., 2005. Processes of diversification and dis-persion of Rice yellow mottle virus inferred from large-scale and high-resolutionphylogeographical studies. Molecular Ecology 14, 2097–2110.
Tsompana, M., Abad, J., Purugganan, M., Moyer, J.W., 2005. The molecular populationgenetics of the Tomato spotted wilt virus (TSWV) genome. Molecular Ecology 14,53–66.
Walsh, J.A., Jenner, C.E., 2002. Turnip mosaic virus and the quest for durable resis-tance. Molecular Plant Pathology 3, 289–300.
Wang, H.Y., Liu, J.L., Gao, R., Chen, J., Shao, Y.H., Li, X.D., 2009. Complete genomicsequence analyses of Turnip mosaic virus basal-BR isolates from China. VirusGenes 38, 421–428.
Wei, T., Huang, T.-S., McNeil, J., Laliberte, J.-F., Hong, J., Nelson, R.S., Wang, A., 2009.Sequential recruitment of the endoplasmic reticulum and chloroplasts for plantpotyvirus replication. Journal of Virology 84, 799–809.
Weiller, G.F., 1998. Phylogenetic profiles: a graphical method for detecting geneticrecombinations in homologous sequences. Molecular Biology and Evolution 15,326–355.
Zhang, C.L., Gao, R., Wang, J., Zhang, G.M., Li, X.D., Liu, H.T., 2011. Molecular variabilityof Tobacco vein banding mosaic virus populations. Virus Research 158, 188–198.