Pinus contorta invasion in the Chilean Patagonia: local patterns in a global context
Upload
uni-goettingenCategory
view
0download
0
ORIGINAL PAPER
Genetic structure and association mapping of adaptiveand selective traits in the east Texas loblolly pine(Pinus taeda L.) breeding populations
Vikram E. Chhatre & Thomas D. Byram & David B. Neale &
Jill L. Wegrzyn & Konstantin V. Krutovsky
Received: 31 July 2012 /Revised: 6 March 2013 /Accepted: 21 March 2013 /Published online: 27 April 2013# Springer-Verlag Berlin Heidelberg 2013
Abstract First-generation selection (FGS) and second-generation selection (SGS) breeding populations of loblollypine from east Texas were studied to estimate the geneticdiversity, population structure, linkage disequilibrium (LD),signatures of selection and association of breeding traits with agenome-wide panel of 4,264 single nucleotide polymor-phisms (SNPs). Relatively high levels of observed (Ho=0.178–0.198) and expected (He=0.180–0.198) heterozygosi-ties were observed in all populations. The amount of inbreed-ing was very low with many populations exhibiting a slightexcess of heterozygotes. The population structure was weak,but FST indicated more pronounced differentiation in the SGSpopulations. As expected for outcrossing natural populations,the genome-wide LD was low, but marker density was insuf-ficient to deduce the decay rate. Numerous associations werefound between various phenotypic traits and SNPs, but only afew remained significant after false positive correction.Signatures of diversifying and balancing selection were found
in markers representing important biological functions. Theseresults present the first step in the application of marker-assisted selection (MAS) to the Western Gulf Forest TreeImprovement Program (WGFTIP) for loblolly pine and willcontribute to the knowledgebase necessary for genomic selec-tion technology.
Keywords Association mapping . Adaptive traits .
Breeding . Genomic variation . Genome-wide linkagedisequilibrium . Loblolly pine . Pinus taeda . Populationstructure . SNPs
Introduction
Understanding the molecular basis of phenotypic variationis one of the most important goals in genetics as well ashaving direct application in breeding. During the last
Communicated by R. Sederoff
V. E. ChhatreGenetics Graduate Program, Texas A&M University,College Station, TX 77843, USA
V. E. Chhatre : T. D. Byram :K. V. Krutovsky (*)Department of Ecosystem Science and Management,Texas A&M University, College Station, TX 77843-2138, USAe-mail: [email protected]
K. V. Krutovskye-mail: [email protected]
T. D. ByramWestern Gulf Forest Tree Improvement Program,Texas Forest Service, College Station, TX 77843, USA
D. B. Neale : J. L. WegrzynDepartment of Plant Sciences, University of California,Davis, CA 95616, USA
K. V. KrutovskyDepartment of Forest Genetics and Forest Tree Breeding,Büsgen-Institute, Georg-August-University of Göttingen, 37077,Göttingen, Germany
K. V. KrutovskyGenome Research and Education Center,Siberian Federal University, 50a/2 Akademgorodok,Krasnoyarsk 660036, Russia
K. V. KrutovskyVavilov Institute of General Genetics,Russian Academy of Sciences, Moscow 119333, Russia
Tree Genetics & Genomes (2013) 9:1161–1178DOI 10.1007/s11295-013-0624-x
decade, a large number of genetic association studies haveattempted to unravel the complex relationship between ge-netic and phenotypic variation in humans, crops and domes-tic animals (Hardy and Singleton 2009; Goddard and Hayes2009; Rafalski 2010; Ingvarsson and Street 2011; Neale andKremer 2011; Stranger et al. 2011; Besenbacher et al. 2012;Al-Maskri et al. 2012; Khan and Korban 2012; Kloth et al.2012; Mir et al. 2012; Soto-Cerda and Cloutier 2012).Forest tree breeding could also benefit greatly from knowl-edge of causative genetic variation underlying phenotypictraits of economic and ecological importance. Despite thetremendous potential for use of such genomic data in breed-ing forest tree species, particularly conifers, application ofsuch data in practical breeding programs has been limited.Marker-assisted selection (MAS) is particularly promisingfor conifers due to the hurdles faced by traditional breedingmethods, such as complexity of genomes, long generationtimes resulting in delayed expression of economically desir-able traits and the polygenic control of most traits. Theprospect of the application of MAS is beginning to growas more genomic studies and efforts to sequence severalconifer genomes shed light on the genetic architecture oftraits in these important species (Neale and Kremer 2011;Khan and Korban 2012; Krutovsky et al. 2012; Ritland2012).
In the southeastern United States, loblolly pine (Pinustaeda L., Family: Pinaceae), is one of the most importantcommercial crops. Highly valued for timber and pulp, lob-lolly pine has been a subject of several major tree improve-ment programs including the Western Gulf Forest TreeImprovement Program (WGFTIP) hosted by the TexasForest Service and located at Texas A&M University.Breeding and management efforts over the last several dec-ades, through these programs, have contributed to greatimprovements in loblolly pine productivity (Todd et al.1995; Byram et al. 2005a,b; McKeand et al. 2006a,b).New techniques based on genome-wide SNP genotypinghave become available and greatly improved our under-standing of the genetic basis of variation for several eco-nomically important traits in conifers (see Neale and Kremer2011; González-Martínez et al. 2011; Harfouche et al. 2012;Parchman et al. 2012; Ritland 2012 for review). Traitsstudied have included growth, form, chemical and physio-logical wood properties, disease resistance, drought toler-ance and cold-hardiness.
During the last decade, a number of candidate–geneassociation mapping studies in conifers have attempted todescribe causative functional genetic polymorphisms under-lying complex traits of economic and ecological importance.The initial study in loblolly pine identified quantitative traitloci (QTLs) for wood properties (Sewell et al. 2000).Subsequent studies have described QTLs for chemical andphysical wood properties in loblolly pine (Sewell et al.
2002; Brown et al. 2003), SNPs in candidate genes fordrought stress response in loblolly pine (González-Martínez et al. 2006, 2007), cold-hardiness in Douglas fir[Pseudotsuga menziesii (Mirb.) Franco var. menziesii](Eckert et al. 2009a), wood quality traits and gene expres-sion in white spruce (Picea glauca) (Beaulieu et al. 2011)and growth and wood chemistry in maritime pine (Pinuspinaster Aiton.) (Lepoittevin et al. 2011). SNPs in candidategenes related to drought and osmotic stress have been alsoidentified in angiosperm forest tree species, such as sessileoak (Quercus robur) and pedunculate oak (Q. petraea)(Homolka et al. 2012). Wegrzyn et al. (2010) used SNPsrepresenting 40 candidate genes to study complex traitscontrolling lignocellulosic biosynthesis in black cottonwood(Populus trichocarpa).
Recently, genome-wide studies, not limited by candidategenes, identified SNPs associated with (a) resistance tofusiform rust (Quesada et al. 2010), (b) metabolites (Eckertet al. 2012), (c) water use efficiency in loblolly pine, (animportant phenotypic trait related to adaptation in treesgrowing in drought-prone climate; Cumbie et al. 2011),and (d) cone serotiny in lodgepole pine representing a keyadaptive trait in a variety of pine species (Parchman et al.2012). Furthermore, high density genetic linkage maps ofloblolly pine have been created (Eckert et al. 2009b, 2010a;Echt et al. 2011), and the dissection of QTL marker traitassociations has been done in specific pedigrees (see alsoRitland et al. 2011 for review).
Despite these important advances, MAS and genomicselection (GS) have seen only limited implementation inloblolly pine breeding. One factor responsible for this is alimited knowledge of the extent of linkage disequilibrium(LD) in natural and breeding populations of conifers. Due tothe lack of physical map, only a handful of studies havereported the extent of LD in natural populations. Estimatesfrom several genome regions in loblolly pine (Brown et al.2004), Douglas fir (Krutovsky and Neale 2005), Europeanaspen (Ingvarsson 2005), Norway spruce (Heuertz et al.2006) and aspen (Kelleher et al. 2012) suggest a relativelyrapid breakdown of LD within a few hundred base pairs.While these observations are in agreement with the limitedLD expected in predominantly cross pollinated plants, nogenome wide estimates of LD exist for most forest treesincluding conifers. One of objectives of our study is toprovide such an estimate.
Furthermore, the WGFTIP breeding material representsthe western boundary of the natural distribution of loblollypine. As east Texas populations routinely experience envi-ronmental extremes of drought and summer heat, it offersthe possibility that adaptive genes will show signs of naturalselection and be more readily detectable. The objectives ofthis study were to estimate standard genetic diversity param-eters, population structure, relatedness between individuals
1162 Tree Genetics & Genomes (2013) 9:1161–1178

and genome-wide LD in the WGFTIP populations. This in-formation was used to identify markers associated with phe-notypes important for the breeding program. Additionally,markers were identified contributing to extremely low or highdifferentiation of populations as outliers, which may exhibitsignatures of natural selection.
Materials and methods
Plant material
The natural range of loblolly pine, extending over the entiresoutheastern United States from Delaware to Texas (Fig. 1),occupies a wide range of geographical terrains, experiencesa variety of climatic and environmental conditions, andharbors high levels of natural genetic variation (e.g.,Schmidtling 2007; Xu et al. 2008). Populations from eastTexas represent the western boundary of this natural distribu-tion. In addition, it includes a uniquely isolated Southwest-most pine population, known as the “Lost Pines” of centralTexas (Bastrop and Fayette Counties) representing putativeremnants of a former continuous refugial population(Al-Rabab’ah and Williams 2004).
The germplasm studied here was phenotypically selectedfrom natural stands and plantations from east Texas and westLouisiana for the WGFTIP breeding program. These FGSwere grafted for preservation and bred after achieving repro-ductive maturity. Progeny tests were established with theseeds to evaluate parents and to create the populations, fromwhich the subsequent or SGS populations were selected(Lowe and van Buijtenen 1980). To understand the geneticdifferences among selections of diverse origin, the FGS andthe SGS breeding populations were further divided into sub-populations based on their county of origin (hereafter called
“populations”). Counties that had too few individuals formeaningful population statistics were combined based ongeographical proximity into single populations. This classifi-cation system resulted in 18 FGS populations. If individuals inSGS had both parents from the same county, they weregrouped in one population named after the county. If theparents came from different counties, they were grouped intoa population based on geographical proximity of theircounties of origin. In both FGS and SGS, there were individ-uals of unknown origin classified as such into a separatepopulation. A total of six SGS populations were defined inthe data set. Combined, the FGS and SGS populations consistof 1,041 individuals.
To study the partitioning of genetic variation in the SGS,genotyping was also carried out for two progeny tests from asubset of the FGS parents. The first was a controlled-pollinated progeny test of 16 parents crossed in two discon-nected modified half-diallels (a total 481 trees includingparents and progeny in the IPC Test, Table 2). The secondprogeny test consisted of 193 clonally replicated individuals(Clonal Test, Table 2). The total number of trees studied inboth FGS and SGS populations and progeny tests was 1,706(Table 2).
Loblolly pine is widely distributed on both sides of theMississippi River Valley. In order to understand the effect ofthis discontinuity on population structure and genetic distinct-ness of the east Texas populations, two outlier populations,Livingston Parish, LA (LP) and Pearl River County, MS (PR),from east of the discontinuity were also analyzed.
Phenotypes for association mapping originated from theWGFTIP progeny testing program. Traits analyzed includedheight, diameter at breast height (DBH), volume, rust resis-tance, wood specific gravity and stem forking index (Loweand van Buijtenen 1991). Progeny test designs varied but, ingeneral, included evaluation of control-pollinated full-sib
0 200 400 km
Gulf of Mexico
Atlantic Ocean
Texas
Longitude (W)
Latit
ude
(N)
−100 −95 −90 −85 −80 −75
26
28
30
32
34
36
38
40
Pinus taedaStudy areaOutlier populations
Fig. 1 Loblolly pine(Pinus taeda L.) distributionand the origin (east Texascounties/Louisiana parishes)of the first-generation selection(FGS) and second-generationselection (SGS) populationsused by the Western Gulf ForestTree Improvement Program(WGFTIP) in this study
Tree Genetics & Genomes (2013) 9:1161–1178 1163

families for the FGS and polymix crosses of parents in theSGS populations. All families were represented at two ormore field locations with from 10 to 50 replications, andonly data from plantings significant at the 0.1 level forfamily differences were used.
Best Linear Unbiased Prediction (BLUP) breeding valuesfor height, volume, and DBH were calculated using a mixedlinear model for the parents and their progeny included in thecontrolled-pollinated progeny test series (IPC). Standardmeasurements of height, DBH and volume were availablefor the individuals in the clonal test measured at age five.Descriptions of the various phenotypes are given in Table 1.
High density SNP assay
A high density SNP genotyping assay was used to genotype all1,706 trees. Eckert et al. (2010a) described the unigene basedresequencing, SNP discovery and selection to design thisgenotyping assay. A brief description of the assay was alsogiven by Quesada et al. (2010). Originally, the SNPs werediscovered via resequencing of unigene based amplicons in apanel of 18 megagametophytes (representing haploid tissuein conifers) in the research initiative dubbed ADEPT2(Allele Discovery of Economic Pine Traits; http://dendrome.ucdavis.edu/NealeLab/adept2). More than 23,000 SNPswere discovered in amplicons representing ~7,000 uniquegenes, withmost genes only partially amplified and sequenced.A subset of 7,216 SNPs were used to develop the IlluminaInfinium SNP genotyping assay (Illumina, San Diego, CA,USA) that was subsequently used by the Conifer TranslationalGenomics Network (http://dendrome.ucdavis.edu/ctgn) forgenotyping trees from several conifer breeding programs.BeadStudio ver. 3.1.3.0 software (Illumina) was used to selecta total of 5,379 SNPs based on quality and reliability of thegenotyping calls for final analysis. Of these, 4,264 SNPs were
found to be polymorphic in the current study populations. Theindividual tree SNP genotype and phenotype data used in thisstudy are available at the TreeGenes Data Repository underaccession number TGDR006 (https://dendrome.ucdavis.edu/tgdr/index.php?acc=TGDR006).
Population genetic summary statistics
Population genetic summary statistics were estimated for theFGS and SGS populations using the GENEPOP programversion 4.01 (Rousset 2008). Individual tree observed het-erozygosity was estimated for all 1,706 trees at 4,264 poly-morphic loci. Single locus and multilocus estimates ofobserved (Ho) and expected (He) heterozygosities were es-timated for individual populations. Inbreeding was estimat-ed using Weir and Cockerham’s estimate (Weir andCockerham 1984) of Wright’s FIS (Wright 1978). All lociwere tested for significant departure from Hardy–Weinbergequilibrium by using a Markov chain method with5,000 iterations in GENEPOP and the Haldane’s exact test(Haldane 1954). Degree of differentiation between indi-vidual populations representing hierarchical structurewas estimated as both single-locus and multilocus FST
(Weir and Cockerham 1984), excluding populations withuncertain origin.
Population genetic differentiation was also studied via (1)regressing spatial and genetic distances for 391 trees geno-typed for 4194 SNPs polymorphic in 18 FGS populationsfrom east Texas and west Louisiana with known geographicposition (Angelina, Bastrop, Cherokee, Hardin, Houston,Jasper, Liberty, Nacogdoches, Newton, Orange, Panola,Polk, Sabine, San Augustine, Trinity, and Tyler Countiesin Texas and Beauregard, and Vernon Parishes inLouisiana); (2) calculating the pairwise standard geneticdistance D (Nei 1972) between all FGS and SGS populations
Table 1 Phenotypic traits abbreviations and descriptions as used in the Western Gulf Forest Tree Improvement Program (WGFTIP)
Trait abbreviation Trait description
HEIGHT BV BLUP breeding value for height
DBH BV BLUP breeding value for diameter at breast height
VOL BV BLUP breeding value for volume
AVEBV Breeding value for planted tree volume as percentage of progeny test average
AVERUST Phenotypic infection level for fusiform rust incidence
AVEST Phenotypic stem straightness based on subjective 1 to 4 score
AVEFK Phenotypic forking levels based on a binary score on each tree for the presence or absence of forking in the main bole
SI Breeding value for height growth as percentage change in site index to progeny test average
POLY BV Breeding value for planted tree volume as percentage of progeny test average
POLY SI Breeding value for height growth as percentage change in site index to progeny test average
POLY SPGR Phenotypic wood specific gravity
POLY ST Phenotypic stem straightness based on subjective 1 to 4 score
POLY FK Phenotypic forking levels based on a binary score on each tree for the presence or absence of forking in the main bole.
1164 Tree Genetics & Genomes (2013) 9:1161–1178

based on all 4,264 polymorphic SNPs; and (3) presenting aconsensus Neighbor-Joining Tree (NJT) with bootstrap valuesbased on 1,000 pairwise standard genetic distance matrices and1,000 bootstrap genotype sets of 4,264 SNPs.
Regression analysis and Mantel test were used to analyzewhether genetic differentiation between populations correlateswith geographic distance using the SPAGEDI v.1.2 software(Hardy and Vekemans 2002) and the PGMAN software by SaúlLozano-Fuentes (Department of Microbiology, Immunologyand Pathology, Colorado State University, Fort Collins, CO80523, USA). The pairwise Euclidian distances were calculatedfrom the Universal Transverse Mercator (UTM) latitude andlongitude coordinates using the Franson CoordTrans v.2.2 soft-ware (http://franson.com/coordtrans) and were used as meas-ures of geographic distances. Genetic differentiation betweenpopulations was calculated as genetic distanceD, and as FST/(1−FST), which approximates relationships between genetic andgeographic distance better than ordinary FST (Rousset 1997).
To visualize phylogenetic relationships between popula-tions, the consensus NJT based on Nei’s (1972) geneticdistance and 1,000 bootstraps was generated using thePHYLIP software package (http://evolution.genetics.washington.edu/phylip.html).
Population structure and kinship analysis
The selectively neutral population structure was analyzed using aBayesian model based clustering method implemented in the
STRUCTURE software (Pritchard et al. 2000). This analysis requiresselectively neutral polymorphic unlinked markers. Unlinkedmarkers were selected for this analysis using linkage mappinginformation available for 1,288 SNP markers in our set of 4,264SNPs that were mapped in an earlier study (Eckert et al. 2010a;the TreeGenes CMap database accession TG091 on http://den-drome.ucdavis.edu/cmap).Markers putatively under divergent orbalancing selection based on FSToutlier analysis (explained laterinMaterials andmethods)were also excluded from considerationfor STRUCTURE analysis. From the total of 964 remainingmarkerswith mapping information, ten evenly spaced synonymous and/or noncoding SNPs per linkage group (LG) were randomlyselected. These markers were unlikely to be in LD with eachother based on the relatively rapid LD decay in conifers. Thefinal SNP dataset used to analyze the population structure thuscontained 120 markers from 12 LGs. Clusters 1 through 12 weretested with five replications for each value of putative K clustersand the log probability of data was estimated. The initial105 steps were discarded as burn-in to allow the runparameters to attain convergence, after which data werecollected for an additional 105 steps. Using the rate ofchange of log likelihood, the ad hoc statistic ΔK describedby Evanno et al. (2005) was estimated using the STRUCTURE
HARVESTER software (Earl and vonHoldt 2012). Further, themembership coefficients for the most optimal number of
clusters based on this analysis were permuted using theGreedy algorithm tomatch the various replicates for that valueof K as closely as possible. This was done using the
CLUMPP software (Jakobsson and Rosenberg 2007).Finally, the membership assignments of individuals in vari-ous clusters was visualized using a plotting function in theDISTRUCT software (Rosenberg 2004).
Association analysis and gene annotation
The association between SNPs and traits were tested usingTASSEL (Bradbury et al. 2007) and a general linear model(GLM) with population structure (Qmatrix) and a mixed linearmodel (MLM)with population structure (Qmatrix) and kinship(Kmatrix) factored in. Inferred population structure and kinshipcoefficients were accounted for in theMLM to remove spuriousassociations resulting from neutral processes such as geneticdrift and coancestry. Individual association tests were per-formed between each SNP marker and phenotype, and uncor-rected significant associations were noted. Multiple testingcorrection based on Storey (2002) was applied to the P valuesto obtain corrected Q coefficients indicating truly significantassociations. Full-length contig sequences were obtained forthe markers remaining after correction for multiple testing fromthe DiversiTree database (http://dendrome.ucdavis.edu/DiversiTree), and their annotations were performed using theBlastX protocol (http://blast.ncbi.nlm.nih.gov/Blast.cgi) withthe NCBI Genbank protein databases. The most significantprotein homologies based on this search are reported.
Genome-wide linkage disequilibrium
Linkage phase of the SNP genotypes in the current study wasunknown. Therefore, haplotypes for individual LGs were in-ferred using a Bayesian coalescent prior approach (Stephens etal. 2001). Each LG included ~100markers. A physical map forloblolly pine is still unavailable, therefore previously reportedflow cytometry based estimates of genome size in loblolly pine(O’Brien et al. 1996) were used to convert the linkage mapdistance into approximate physical locations of individualmarkers along the chromosome. These approximate locationswere then used to reconstruct haplotypes using the FASTPHASE
software (Scheet and Stephens 2006). Once the haplotypeswere inferred, LD between pairs of markers were estimatedusing the GOLD software (Abecasis and Cookson 2000).Pairwise estimates of the LD parameter r2 were obtained andplotted against pairwise physical distance (Kb) betweenmarkers to observe the rate of LD decay.
Search for signatures of selection using FST outliers
The FST outlier approach (Beaumont and Nichols 1996;Beaumont and Balding 2004) as implemented in the
Tree Genetics & Genomes (2013) 9:1161–1178 1165

LOSITAN software (Antao et al. 2008) was used to search forloci under selection pressure. Coalescent simulations usingthe island model (Strobeck 1987) to generate the theoreticaldistribution of FST and to reveal outlier loci with unusuallyhigh or low differentiation were performed following anal-yses described by Beaumont and Nichols (1996) and theFDIST2 program (Beaumont and Balding 2004). Because wewere interested in detecting natural selection, only 463individuals from the FGS populations, which could be pos-itively identified as originating from natural stands, wereused for this analysis. The LOSITAN program was used tovisualize the expected confidence intervals for FST vs. He
(expected heterozygosity) distribution computed by theFDIST2 program under an island model of migration withneutral markers (Antao et al. 2008). LOSITAN was run firstusing 105 simulations and all SNPs to estimate the meanneutral FST. After the first run, all loci that were outside the95 % confidence intervals were removed, and the meanneutral FST was recomputed using 5×10⁵ simulations andonly the putative neutral loci that were not removed. A secondand final run of LOSITAN, using all loci, was then conductedusing the last computed mean. This procedure lowers the biason the estimation of the mean neutral FST by removing themostextreme loci from the estimation. All loci were present in thelast run, and their estimated selection status was reported. SNPswith FST above or below thresholds were identified as candi-dates for directional or balancing selection, respectively. Full-length contig sequences containing these candidate SNPs wereobtained from the DiversiTree database (http://dendrome.ucdavis.edu/DiversiTree). The Genbank databases werethen searched for homologs to these sequences using theBlastX tool. Potential biological functions were noted basedon the annotations for the amino acid sequences.
Results
Genetic diversity and differentiation
Moderately high levels of genetic diversity were found in allstudy populations as expected for highly outcrossing plants(Table 2). The level of observed genetic diversity may also beupwardly biased given that only the most polymorphic SNPswere originally selected for the SNP genotyping assay. Theobserved and expected multilocus heterozygosities in popula-tions ranged from 0.178 to 0.199 with an average of 0.189 and0.188, respectively (Table 2). Inbreeding was not detected inmost populations with an average FIS=−0.004 and −0.013 inthe FGS and SGS populations, respectively, indicating a slightexcess of heterozygotes. This tendency was a bit more pro-nounced in the SGS populations. Negative fixation indiceswere observed in almost all populations. Because conifersexhibit high inbreeding depression, very low inbreeding rates
are to be expected and are in accordance with previouslyreported findings. Excess of heterozygotes could also beexpected in the SGS populations from non-random matingamong high performing parents, frequently from differentstands. When FST was estimated globally for the FGS andSGS populations (Table 3), the SGS were found to have muchhigher differentiation (0.053) than the FGS populations(0.003), possibly reflecting an increased number of relatedindividuals in the advanced-generation population. Whenmultilocus heterozygosity was estimated for individual trees,most trees ranged between 0.14 and 0.18 (Fig. 2). Some trees
Table 2 Genetic diversity estimates in the loblolly pine first-genera-tion selection (FGS) and second-generation selection (SGS)populations
Population Size Ho He FIS
FGS
Angelina 41 0.198 0.198 0.001
Bastrop 10 0.178 0.180 0.008
Beauregard (LA) 8 0.192 0.190 −0.009
Cherokee 14 0.187 0.188 0.005
Hardin 8 0.186 0.188 0.007
Houston 10 0.183 0.185 0.013
Jasper 80 0.189 0.187 −0.011
Liberty 6 0.183 0.185 0.011
Nacogdoches 21 0.189 0.190 0.005
Newton 49 0.189 0.190 0.004
Orange 11 0.188 0.186 −0.013
Panola 11 0.190 0.185 −0.025
Polk 57 0.190 0.189 −0.006
Sabine 13 0.187 0.186 −0.005
San Augustine 7 0.193 0.187 −0.029
Trinity 6 0.191 0.187 −0.019
Tyler 32 0.189 0.188 −0.002
Vernon (LA) 7 0.197 0.194 −0.013
Mixed 14 0.189 0.188 −0.009
Unknown 58 0.197 0.199 0.010
Averagea 23 0.189 0.188 −0.004
SGS
Clonal Test 193 0.188 0.177 −0.061
IPC Test 481 0.186 0.183 −0.017
Livingston (LA) 84 0.183 0.195 0.061
Panola 11 0.197 0.185 −0.068
Pearl River (MS) 79 0.188 0.192 0.021
Polk 17 0.189 0.187 −0.012
Mixed 264 0.186 0.187 0.009
Unknown 114 0.185 0.189 0.018
Averagea 144 0.189 0.187 −0.013
Total (FGS + SGS) 1706
a Not counting unknown and mixed samples
1166 Tree Genetics & Genomes (2013) 9:1161–1178

showed extremely low heterozygosity ranging from 0.02 to0.1, whereas a few trees showed heterozygosities as high as0.25.
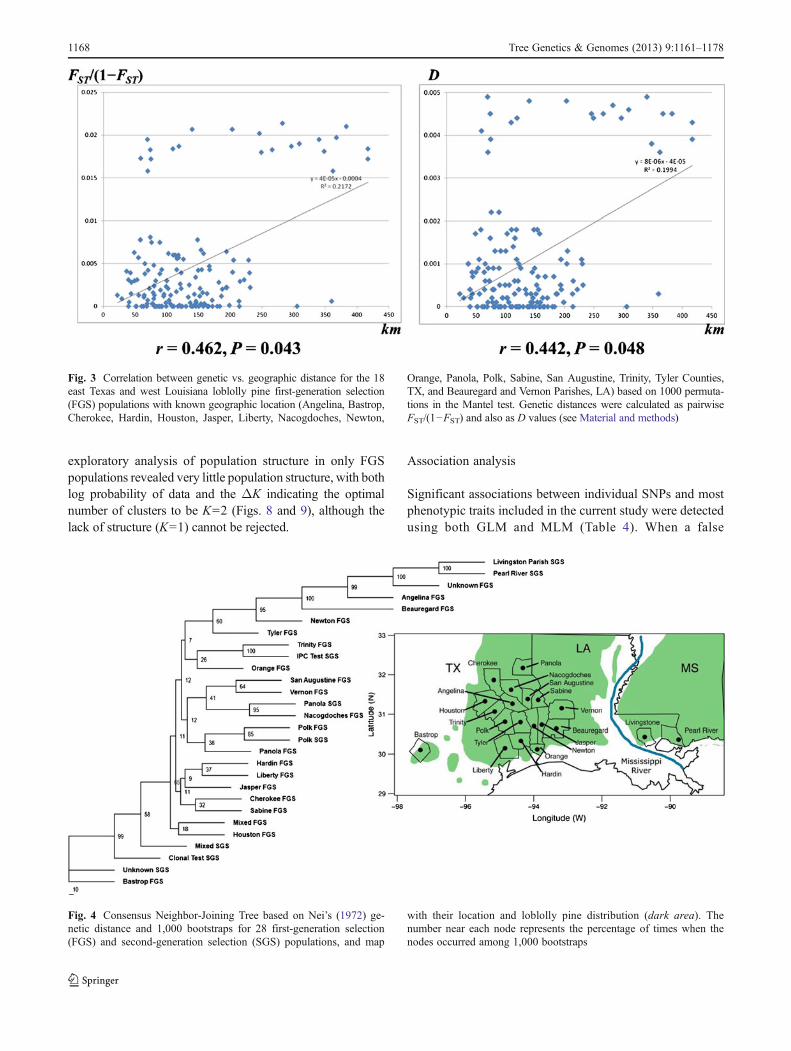
Significant correlation between spatial and genetic distan-ces was found for the 18 FGS populations with known geo-graphic locations (Angelina, Bastrop, Cherokee, Hardin,Houston, Jasper, Liberty, Nacogdoches, Newton, Orange,Panola, Polk, Sabine, San Augustine, Trinity, Tyler Countiesand Beauregard, and Vernon Parishes; r=0.462, P=0.043 forFST/(1−FST) and r=0.442, P=0.048 for D; Fig. 3). Theobtained NJT is also consistent with geographic locations ofpopulations (Fig. 4). It revealed a few significant clusters withbootstrap values of more than 50 %, and the phylogenetic treetopography mostly followed geographic location.
Population structure
Loblolly pine over much of its natural range has a continuousdistribution. The only major geographic barrier is theMississippi River Valley, which coincides with observed dif-ferentiation between eastern and western populations(Schmidtling et al. 1999; Al-Rabab’ah and Williams 2002;Soltis et al. 2006). Recent analysis based on a larger set ofmarkers also supports this view (Eckert et al. 2010a).Considering the extent of population differentiation reportedby Eckert et al. (2010a,b) and Cumbie et al. (2011), very littlepopulation structure in theWGFTIP populations was expected.Based on Bayesian analysis of putative clusters K=1 throughK=12 for all trees (including two outlier populations sampledfrom east of Mississippi), the log probability of the data
seemed to begin stabilizing at K=5. The standard deviationamong independent iterations of the STRUCTURE runs foreach putative cluster started increasing with K=6. The highestvalue of the estimated ΔK parameter indicated that the opti-mum number of clusters was K=2 (Fig. 5), however, as point-ed out by Eckert et al. (2010a, p. 973), the use ofΔK to choosean optimal value of K=2 is difficult because ΔK in this casecompares the lack of structure (K=1) to some structure (K=2and more). The second highest value of ΔK indicated theoptimal number of clusters to be K=5.
There was a statistically significant correlation of Q valuesfor K=2 with longitude (Pearson's product–moment correla-tion r=0.194, P=0.000002; Spearman's rank correlation r=0.224, P=0.00000004), which was similar to the east–westtrends demonstrated by Eckert et al. (2010a; Fig. S5). Asvisualized in Fig. 6, where bar plots are arranged in order fromeast to west (not by longitude), the eastern most trees clearlyshow more similarity than do the more western trees. The twooutlier samples (Livingston Parish, LA and Pearl River, MS),which fall to the east of Mississippi River Valley, distinctlyexhibited most of their membership in the cluster to which, therest of the “west” trees did not belong. With the assignmentprobability barplot set for K=5, similar results for these sam-ples from Louisiana were observed. The rest of the sampleshad mixed assignments for all five clusters, and no definitivepatterns of cluster memberships could be detected.
The largest genetic distances were also observed betweenthe outlier population from east of the Mississippi RiverValley and those from the study area (D=0.009–0.027,mean=0.018) compared to distances only between popula-tions from the study area (D=0.002–0.020, mean=0.011;see also Fig. 4).
To further quantify population structure for the WGFTIPpopulations, we excluded the outlier samples and carried outanalysis for the remaining 20 populations. The log probabilityof data suggested the optimal number of clusters to be K=5(Fig. 5). However theΔK estimator suggested a value ofK=4to be optimal (Figs. 5 and 7), thus dropping one cluster incomparison to the analysis with outlier samples. Further
Table 3 Global FST and FIS estimates in the loblolly pine first-gener-ation selection (FGS) and second-generation selection (SGS)populations
Population FST FIS
FGS 0.003 −0.003
SGS 0.053 −0.025
FST Distribution
Loci
0.0 0.1 0.2 0.3 0.4
0
100
200
300
400
500
F IS Distribution
Loci
0.5 0.0 0.5 1.0
0
50
100
150
200
250
300
Individual Tree Heterozygosity
Tree
s
0.05 0.10 0.15 0.20
0
20
40
60
80
Fig. 2 Distributions of individual tree heterozygosity, FST and FIS values for 20 first- and second-generation selection populations (FGS and SGS)
Tree Genetics & Genomes (2013) 9:1161–1178 1167
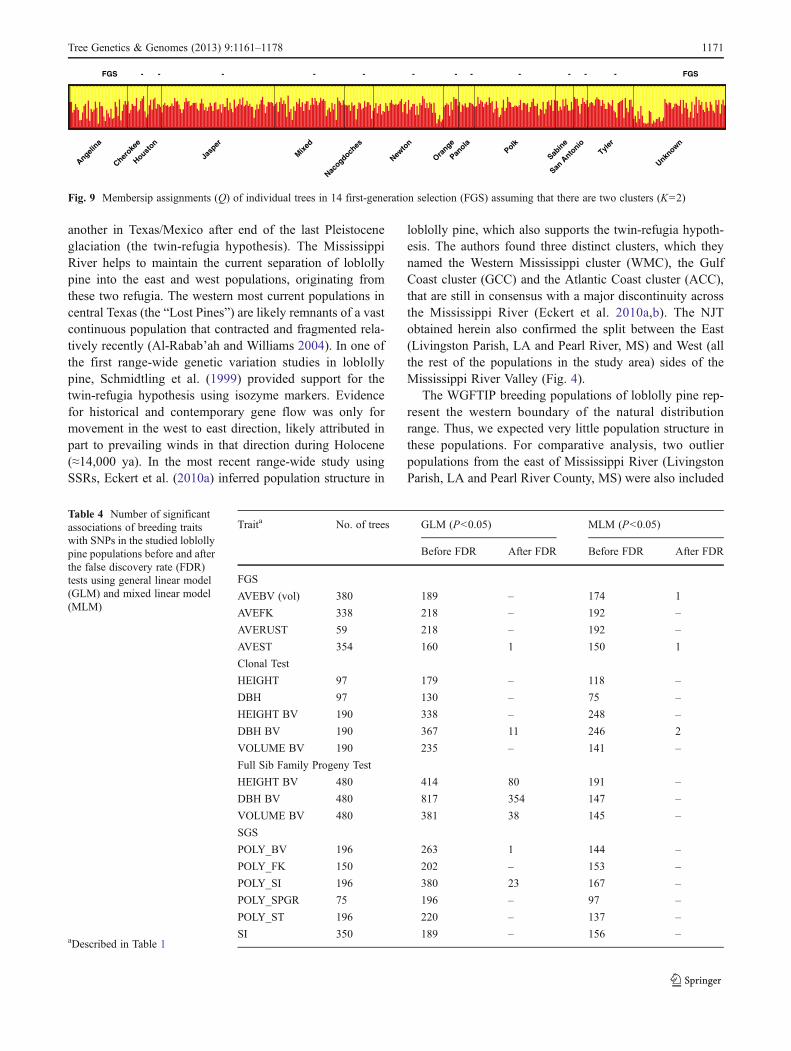
exploratory analysis of population structure in only FGSpopulations revealed very little population structure, with bothlog probability of data and the ΔK indicating the optimalnumber of clusters to be K=2 (Figs. 8 and 9), although thelack of structure (K=1) cannot be rejected.
Association analysis
Significant associations between individual SNPs and mostphenotypic traits included in the current study were detectedusing both GLM and MLM (Table 4). When a false
Fig. 3 Correlation between genetic vs. geographic distance for the 18east Texas and west Louisiana loblolly pine first-generation selection(FGS) populations with known geographic location (Angelina, Bastrop,Cherokee, Hardin, Houston, Jasper, Liberty, Nacogdoches, Newton,
Orange, Panola, Polk, Sabine, San Augustine, Trinity, Tyler Counties,TX, and Beauregard and Vernon Parishes, LA) based on 1000 permuta-tions in the Mantel test. Genetic distances were calculated as pairwiseFST/(1−FST) and also as D values (see Material and methods)
Fig. 4 Consensus Neighbor-Joining Tree based on Nei’s (1972) ge-netic distance and 1,000 bootstraps for 28 first-generation selection(FGS) and second-generation selection (SGS) populations, and map
with their location and loblolly pine distribution (dark area). Thenumber near each node represents the percentage of times when thenodes occurred among 1,000 bootstraps
1168 Tree Genetics & Genomes (2013) 9:1161–1178

discovery rate (FDR) of 0.05 was applied, most associationswere no longer significant. In general, more associationsremained significant after the false positive correction usingthe GLM than the MLM. For example, the post-FDR sig-nificant loci for the GLM ranged from 1 to 38, whereas thatfor the MLM ranged between 1 and 2. For clonally replicat-ed individuals, the post-FDR associations were significantonly when using GLM model. When kinship was taken intoaccount, none remained significant, implicating relatednessof individuals in the outcome of false associations.
Annotations for all post-FDR significant loci are partlysummarized in Table 5. For some SNP loci, no significantsimilarity was found with any protein records in the data-bases. The remaining loci showed homology to variousproteins from Arabidopsis sp. and Populus sp. involved ina variety of biological functions. These functions includedtransmembrane molecular transportation, transcription, de-hydrogenation, reduction and glutamate synthesis.
Genome wide LD
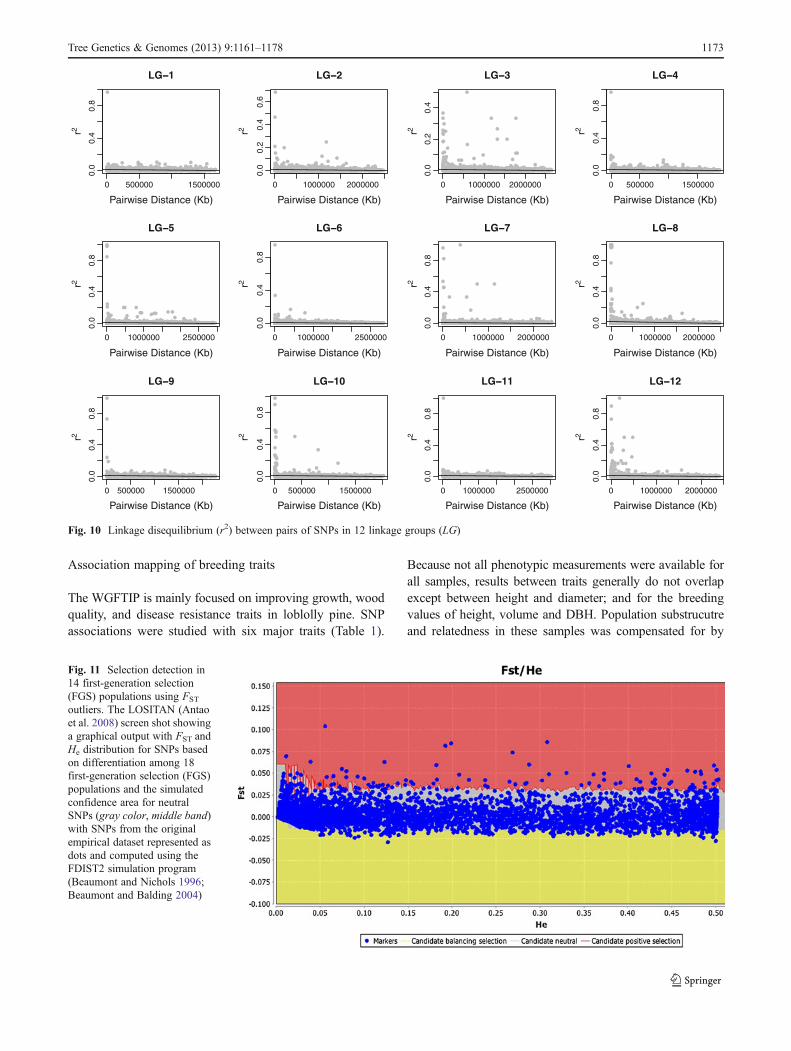
One of the recent dense loblolly pine linkage maps wasbased on the set of SNPs used in this study and includes1,634 SNPs mapped in 12 LGs. Lengths of the 12 LGsranged from 100 to 177.7 cM with 117±18 SNPs per LG
and an average distance of 1.2±1.1 cM between SNPs(Eckert et al. 2010a, p. 970; the TreeGenes CMap databaseaccession TG091 on http://dendrome.ucdavis.edu/cmap).Most of these SNPs (1,288 SNPs representing 1,240 sup-posedly unique genes) were also genotyped and poly-morphic in our current study. Both linkage mappinginformation and calculated LD values were available for70–108 SNPs per LG. Haplotypes for these SNPs wereinferred using the coalescent prior method (Stephens et al.2001; Scheet and Stephens 2006). These haplotypes wereused to calculate genome-wide LD (r2). Figure 10 showspairwise LD values plotted against inferred distance inter-vals separating SNPs in individual LGs. The large majorityof pairwise LD values were less than 0.1 demonstrating lackof or weak LD at both short and long distance intervals.There were several cases where the pairwise LD estimatesreached highly significant values close to r2=1 at shortdistances. However, in a few cases, the high LD estimatesrepresented markers separated by large intervals of up to100 Mb or more. There could be several possible explan-ations for such strong LD between markers such as hiddenpopulation substructure, non-random mating, mappingerrors or epistasis. The significant linear LD decay wasobserved in all LGs, but a physical map and more SNPswill be needed to precisely estimate the rate of LD decay.
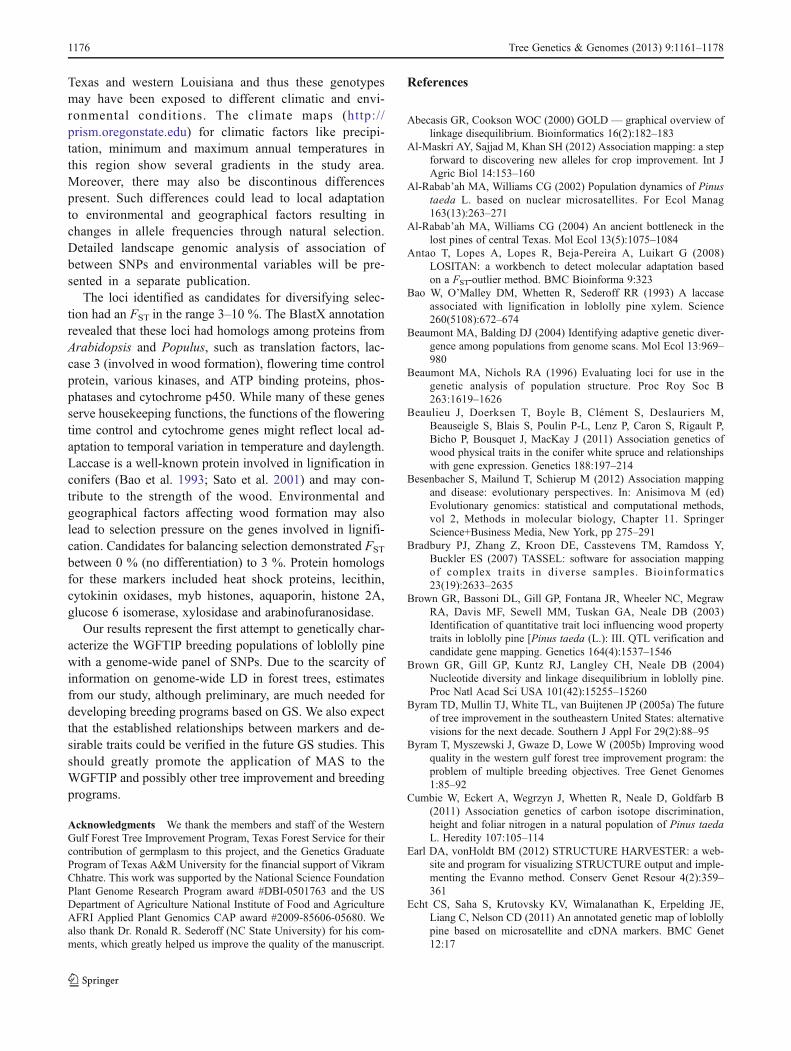
FST outliers
From a set of 4,264 SNP markers, 49 and 377 were identi-fied as candidates for diversifying and balancing selection,respectively. The false positive correction using an FDR of0.05 was directly implemented through LOSITAN software,thus no additional false positive corrections were needed.Figure 11 shows the 95 % threshold around the region ofneutrality and identifies outlier markers putatively underselection. A distribution of individual locus FST estimatesis also presented in Fig. 2.
BlastX annotations are detailed for candidates under di-versifying and balancing selection, respectively (Tables 6and 7). The diversifying selection candidates were homolo-gous to proteins and enzymes involved in various functionsin model and non-model organisms such as Arabidopsis andPopulus. These functions included housekeeping tasks suchas transcription and translation, wood formation (laccase),photosynthetic electron transport (cytochrome P450),
2223
0022
0000
2180
0021
6000
2140
0021
2000
1 2 3 4 5 6 7 8 9 10 11 12
02
510
1520
2527
Number of clusters (K)
log(
Pr)
of D
ata
K
Arrows indicate optimal K
Kln(PrK)
Fig. 5 Log probability of K clusters calculated for K=1 to K=12clusters for trees from 20 first-generation selection (FGS) and sec-ond-generation selection (SGS) populations
West East
Fig. 6 Individual tree membership assignments barplots (Q values) obtained for K=2 and arranged West to East (Pearson's product–momentcorrelation of Q values with longitude r=0.194, P=0.000002; Spearman's rank correlation r=0.224, P=0.00000004)
Tree Genetics & Genomes (2013) 9:1161–1178 1169

transmembrane protein transport and flowering time control.Some examples of proteins homologous to candidates ofbalancing selection were lecithin, cytokinin oxidases, heatshock proteins, histones, aquaporins, ligases and arabinofur-anosidases from Arabidopsis and Populus. Homologies toproteins of unknown function or predicted hypotheticalproteins were also found.
Discussion
Genetic diversity in the WGFTIP populations
This study represents the first attempt to analyze the popu-lation genetic variation, structure and differentiation of theWGFTIP east Texas breeding populations using genome-wide genetic markers. The FGS populations represent thevariation in original natural stands and plantations from eastTexas and allow detection of geographic patterns as well assignatures of natural selection. Variation in the SGS popu-lations is a subset of the variation from the FGS populationsand represents the variation captured and structured in theadvanced-generation breeding program. The current study isthe first attempt to develop data on molecular genetic vari-ation for large number of trees also measured for multiple
traits. Associating genetic and phenotypic variation providesan opportunity for genetic dissection of complex traits anddeveloping genetic tools for current tree breeding and forfuture GS (e.g., Harfouche et al. 2012; Resende et al.2012a,b; Zapata-Valenzuela et al. 2012).
Standard measures of genetic diversity showed moderateto high levels of genetic variation in all populations studied.To some extent, this variation is biased due to the way theSNPs were chosen. As biallelic markers, SNPs are inherent-ly less variable than microsatellites or simple sequencerepeats (SSR). However, because the SNPs used in thisstudy were preselected as highly polymorphic during theSNP discovery stage, measures of expected and observedheterozygosity may be upwardly biased. However, compar-isons among populations in the study are still valid.
Most populations showed similar levels of observed andexpected heterozygosity, but a trend to heterozygote excesswas observed in both FGS and SGS, which can be explainedby balancing selection in favor of heterozygotes. This trendwas especially pronounced in the SGS populations where itcould also result from non-random mating of unrelated indi-viduals and additional selection for traits associated withoverdominance and heterosis effects. This finding is alsoconsistent with the known inbreeding depression in loblollypine (Williams and Savolainen 1996; Williams 2009). Theinbred progeny mostly die at early stages of development,which deflates the observed level of inbreeding. The globalestimates of FIS were negative for both FGS and SGS pop-ulations (Table 3), but more negative in the SGS populationsthan in the FGS, likely due to the reasons described above.
Population structure and differentiation
The natural distribution of loblolly pine extends over a largearea with varying climatic and soil features. Because itoccupies wide areas on both sides of the Mississippi River,its current population structure may be defined by theMississippi River Valley, also called the Mississippi Riverdiscontinuity (Schmidtling et al. 1999; Soltis et al. 2006).There is empirical evidence to support this view. The currentpattern of loblolly pine differentiation is also explained bythe historic origin and migration of loblolly pine from twomain refugia, one in the Florida/Caribbean region and
G1A
ng
elin
a-
Ch
ero
kee
-
Ho
ust
on
-
Jasp
er
-
Mix
ed
-
Nac
og
do
ches
-
New
ton
-
Ora
ng
e
-
Pan
ola
-
Po
lk
-
Sab
ine
-
San
An
ton
io
-
Tyl
er
G1
Un
kno
wn
G2
CL
Tes
t
-
IPC
-
Mix
ed
-
Pan
ola
-
Po
lk
G2
Un
kno
wn
Fig. 7 Membersip assignments (Q) of individual trees in 20 first-generation selection (FGS) and second-generation selection (SGS) populationsassuming that there are four clusters (K=4)
7210
071
000
7000
069
000
6800
067
000
1 2 3 4 5 6 7 8 9 10 11 12
020
4070
100
120
150
Number of clusters K
log(
Pr)
of D
ata
K
Arrow indicates optimal K Kln(PrK)
Fig. 8 Log probability ofK-clusters calculated forK=1 toK=12 clustersfor trees from 14 first-generation selection (FGS) populations
1170 Tree Genetics & Genomes (2013) 9:1161–1178
another in Texas/Mexico after end of the last Pleistoceneglaciation (the twin-refugia hypothesis). The MississippiRiver helps to maintain the current separation of loblollypine into the east and west populations, originating fromthese two refugia. The western most current populations incentral Texas (the “Lost Pines”) are likely remnants of a vastcontinuous population that contracted and fragmented rela-tively recently (Al-Rabab’ah and Williams 2004). In one ofthe first range-wide genetic variation studies in loblollypine, Schmidtling et al. (1999) provided support for thetwin-refugia hypothesis using isozyme markers. Evidencefor historical and contemporary gene flow was only formovement in the west to east direction, likely attributed inpart to prevailing winds in that direction during Holocene(≈14,000 ya). In the most recent range-wide study usingSSRs, Eckert et al. (2010a) inferred population structure in
loblolly pine, which also supports the twin-refugia hypoth-esis. The authors found three distinct clusters, which theynamed the Western Mississippi cluster (WMC), the GulfCoast cluster (GCC) and the Atlantic Coast cluster (ACC),that are still in consensus with a major discontinuity acrossthe Mississippi River (Eckert et al. 2010a,b). The NJTobtained herein also confirmed the split between the East(Livingston Parish, LA and Pearl River, MS) and West (allthe rest of the populations in the study area) sides of theMississippi River Valley (Fig. 4).
The WGFTIP breeding populations of loblolly pine rep-resent the western boundary of the natural distributionrange. Thus, we expected very little population structure inthese populations. For comparative analysis, two outlierpopulations from the east of Mississippi River (LivingstonParish, LA and Pearl River County, MS) were also included
FGS
Angelina
-
Cheroke
e
-
Houston
-
Jasp
er
-
Mixed
-
Nacogdoch
es
-
Newto
n
-
Orange
-
Panola
-
Polk
-
Sabin
e
-
San A
ntonio
-
Tyler
FGS
Unknown
Fig. 9 Membersip assignments (Q) of individual trees in 14 first-generation selection (FGS) assuming that there are two clusters (K=2)
Table 4 Number of significantassociations of breeding traitswith SNPs in the studied loblollypine populations before and afterthe false discovery rate (FDR)tests using general linear model(GLM) and mixed linear model(MLM)
aDescribed in Table 1
Traita No. of trees GLM (P<0.05) MLM (P<0.05)
Before FDR After FDR Before FDR After FDR
FGS
AVEBV (vol) 380 189 – 174 1
AVEFK 338 218 – 192 –
AVERUST 59 218 – 192 –
AVEST 354 160 1 150 1
Clonal Test
HEIGHT 97 179 – 118 –
DBH 97 130 – 75 –
HEIGHT BV 190 338 – 248 –
DBH BV 190 367 11 246 2
VOLUME BV 190 235 – 141 –
Full Sib Family Progeny Test
HEIGHT BV 480 414 80 191 –
DBH BV 480 817 354 147 –
VOLUME BV 480 381 38 145 –
SGS
POLY_BV 196 263 1 144 –
POLY_FK 150 202 – 153 –
POLY_SI 196 380 23 167 –
POLY_SPGR 75 196 – 97 –
POLY_ST 196 220 – 137 –
SI 350 189 – 156 –
Tree Genetics & Genomes (2013) 9:1161–1178 1171
in the population structure analysis. As our results show, thenumber of clusters ranged between K=4 (ΔK) and K=5(log(Pr|K)) when all 22 populations including the outliersamples were analyzed. These results are consistent with thefindings of Eckert et al. (2010a,b), Quesada et al. (2010),and Cumbie et al. (2011), which included samples from bothsides of Mississippi River Valley. When only the WGFTIPFGS and SGS populations were considered, our analysissuggested K=4 as the optimal number of clusters (Figs. 5and 7). Thus, for further analysis, we assumed K=4 as thenumber of clusters correctly defining the population struc-ture in all 20 populations.
The selection and breeding in the SGS populations mayhave created some additional subpopulation structure. Totest this, we set up an exploratory STRUCTURE analysisonly with the FGS populations. As our results demonstrated(Figs. 5, 6, 7 and 9), the maximum number of clusters in theFGS population is K=2, if not even K=1 (lack of structure).Thus, the population structure in the natural populationsappears to be weak. This demonstration is further supportedby the FST index of population differentiation. Figure 2ashows the distribution of FST across all SNP loci. A largemajority of loci have an FST of between 0 and 0.05. The
global estimates in FGS and SGS populations (Table 3)showed that FST ranged between 0.003 (FGS) and 0.053(SGS). Thus, the population differentiation is very weak inboth generations, although the SGS group is more differen-tiated than the FGS most likely due to nonrandom matingthat was used to generate the former.
Significant correlation found between spatial and geneticdistances is a signature of isolation-by-distance (IBD), aneffect that plays an important role in genetic differentiationof continuous populations (Fig. 3). The obtained NJT is alsoin consensus with geographic locations of populations, al-though most of east Texas populations did not form well-supported nodes or clusters, except the Bastrop (Lost Pines),Angelina, Newton, Trinity and a few other populations(Fig. 4). The easternmost populations Livingston Parish,LA, and Pearl River County, MS, from the east side of theMississippi Valey were well separated from east Texas pop-ulations from the west side of the Mississippi Valey, al-though nearest to them populations Beauregard andNewton populations were positioned intermediately be-tween them on one side and all others on another, whichcould be a result of gene flow from Livingston Parish andPearl River populations.
Table 5 Proteins in Arabidopsis and Populus highly homologous to the loci with SNPs significantly associated with breeding traits in the studiedloblolly pine populations
Trait SNPa Arabidopsis Populus E value
AVEBV 2-2151-02-39 Unknown Hypothetical protein 4.64×10−101
AVEST 2-2691-01-163 Phosphoribulokinase/uridine kinase Predicted protein 2.84×10−40
DBH BVb UMN-4383-01-585 No significant hits Arginine methyltransferease 1.84×10−96
DBH BVc CL1052Contig1-03-62 GTPase/nitric oxide synthase No significant hits 3.49×10−108
CL3539Contig1-01-309 VHS domain-containing protein Predicted protein 1.62×10−105
UMN-4754-01-56 No significant hits Plant synaptotagmin 2.57×10⁻⁶
POLY BV 2-4655-02-206 Glycosyl hydrolase family 17 Predicted protein 1.93×10⁻³⁴
0-3073-01-29 Transmembrane protein transporter Predicted protein 5.09×10−69
CL342Contig1-04-36 Chloroplast transketolase Predicted protein 0
UMN-CL319Contig1-03-132 No significant hits Tubulin alpha-1 chain 0
UMN-188-01-55 Phloem protein and carbohydrate binding No significant hits 7.34×10⁻⁹
CL560Contig1-03-132 No significant hits Tubulin alpha-1 chain 0
0-5610-01-123 Oligopeptide transport protein Predicted protein 8.38×10−142
0-5786-01-210 Kinase family protein Predicted protein 4.26×10−48
POLY SIb CL1018Contig1-04-64 DNA binding/transcription factor Transcription factor 1.49×10⁻⁶
POLY SIc 2-3016-01-162 Extracellular lipase 3 (EXL3) Predicted protein 6.94×10⁻³¹
2-2156-01-246 Zinc finger protein Predicted protein 9.51×10⁻²²
0-12766-01-87 Methyltransferase No significant hits 3.98×10⁻³⁵
CL2194Contig1-05-95 Dehydrogenase/reductase Predicted protein 1.81×10−132
SI + POLY SI 0-1867-02-70 Ferredoxin-dep glutamate synthase 1 Predicted protein 4.41×10−134
0-15106-02-380 Pseudouridylate synthase-like No significant hits 4.11×10−74
a SNPs that had significant P values after false positive correction (FDR=0.05)b General linear modelcMixed linear model
1172 Tree Genetics & Genomes (2013) 9:1161–1178
Association mapping of breeding traits
The WGFTIP is mainly focused on improving growth, woodquality, and disease resistance traits in loblolly pine. SNPassociations were studied with six major traits (Table 1).
Because not all phenotypic measurements were available forall samples, results between traits generally do not overlapexcept between height and diameter; and for the breedingvalues of height, volume and DBH. Population substrucutreand relatedness in these samples was compensated for by
0 500000 1500000
0.0
0.4
0.8
LG 1
Pairwise Distance (Kb)
r2
0 1000000 2000000
0.0
0.2
0.4
0.6
LG 2
Pairwise Distance (Kb)
r2
0 1000000 2000000
0.0
0.2
0.4
LG 3
Pairwise Distance (Kb)
r2
0 500000 1500000
0.0
0.4
0.8
LG 4
Pairwise Distance (Kb)
r2
0 1000000 2500000
0.0
0.4
0.8
LG 5
Pairwise Distance (Kb)
r2
0 1000000 2500000
0.0
0.4
0.8
LG 6
Pairwise Distance (Kb)
r2
0 1000000 2000000
0.0
0.4
0.8
LG 7
Pairwise Distance (Kb)
r2
0 1000000 2000000
0.0
0.4
0.8
LG 8
Pairwise Distance (Kb)
r2
0 500000 1500000
0.0
0.4
0.8
LG 9
Pairwise Distance (Kb)
r2
0 500000 1500000
0.0
0.4
0.8
LG 10
Pairwise Distance (Kb)
r2
0 1000000 2500000
0.0
0.4
0.8
LG 11
Pairwise Distance (Kb)
r2
0 1000000 2000000
0.0
0.4
0.8
LG 12
Pairwise Distance (Kb)
r2
Fig. 10 Linkage disequilibrium (r2) between pairs of SNPs in 12 linkage groups (LG)
Fig. 11 Selection detection in14 first-generation selection(FGS) populations using FST
outliers. The LOSITAN (Antaoet al. 2008) screen shot showinga graphical output with FST andHe distribution for SNPs basedon differentiation among 18first-generation selection (FGS)populations and the simulatedconfidence area for neutralSNPs (gray color, middle band)with SNPs from the originalempirical dataset represented asdots and computed using theFDIST2 simulation program(Beaumont and Nichols 1996;Beaumont and Balding 2004)
Tree Genetics & Genomes (2013) 9:1161–1178 1173

using theQmatrix for K=4 and Kmatrix describing substruc-ture and kinship, respectively. These matrices were includedin the association tests to identify and exclude the spurious
associations arising because of relatedness.While a number ofsignificant associations were initially found, very fewremained significant after false positive correction with a
Table 6 Protein homologies of SNP loci, tentative candidates for diversifying selection based on FST outlier analysis
SNP locus FST Organism Protein BlastX E value
0-14730-01-354 0.033 Arabidopsis/Populus Translation initiation factor 1.68×10⁻¹⁴
0-17517-01-207 0.038 Picea sitchensis Unknown protein 2.18×10−75
0-17456-01-158 0.037 Picea sitchensis Unknown protein 1.71×10−72
2-1343-01-219 0.042 Arabidopsis Laccase 3 protein 9.58×10−49
0-14826-01-190 0.046 Arabidopsis Kinase family protein 4.82×10−74
CL1259Contig1-03-443 0.054 Picea sitchensis Flowering time control protein-like 6.77×10⁻²¹
2-85-02-402 0.040 Arabidopsis Phosphatase 2C 8.67×10−55
CL4462Contig1-03-501 0.053 Arabidopsis/Populus Cytochrome P450 6.03×10⁻³³
0-9148-01-911 0.051 Picea sitchensis Unknown protein 1.20×10−87
2-9295-01-158 0.049 Oryza sp. Cytochrome P450 1.85×10−38
CL1744Contig1-03-94 0.049 Arabidopsis/Populus Leucine rich protein/pred. protein 9.56×10−144
0-8621-01-206 0.058 Arabidopsis/Populus Binding protein/pred. protein 3.01×10⁻¹⁹
0-14826-01-316 0.055 Arabidopsis/Populus Protein kinase/pred. protein 4.82×10−74
2-9773-01-151 0.074 Arabidopsis/Populus ATP binding/NBS-LRR resistance 6.39×10⁻²²
0-13500-01-494 0.104 Arabidopsis/Vitis ATPase 8×10−53
0-527-01-261 0.082 Arabidopsis/Populus Transmembrane kinase/pred. protein 6.86×10⁻²²
0-12929-01-346 0.063 Vitis/Populus Protein kinase/predicted kinase 3.23×10−142
0-18781-02-263 0.086 Pinus taeda TIR-NBS-LRR disease resistance protein 1.48×10−44
Table 7 Protein homologies of SNP loci, tentative candidates for balancing selection based on FST outlier analysis
SNP locus FST Organism Protein BlastX E Value
0-10631-02-260 0 Arabidopsis/Populus HSP70T-2/predicted protein 3.53×10−78
0-11439-02-181 0 Arabidopsis/Populus F-box family protein 4.48×10−85
0-15789-01-116 0 Arabidopsis MATE efflux family protein 1.73×10⁻⁷
0-16369-01-101 0 Arabidopsis/Populus Hypothetical protein 4.95×10−44
0-16872-01-359 0 Arabidopsis/Populus Lecithin/predicted protein 8.65×10−57
0-18588-02-86 0.01 Arabidopsis/Populus Hypothetical protein 1.51×10⁻³⁵
0-18590-01-137 0 Arabidopsis/Populus Coronitive insensitive/F-box protein 2.34×10−103
0-1872-01-105 0 Populus Cytokinin oxidase 7.53×10−79
0-2039-01-90 0 Arabidopsis/Populus Ubiquitin ligase/pred. protein 1.42×10⁻³²
0-7572-01-292 0.03 Populus Cytochrome P450 1.63×10−37
0-9047-02-56 0.01 Arabidopsis/Populus ATP binding/NBS LRR resistance 1.54×10−87
0-9890-01-421 0.01 Arabidopsis Dehydrogenase reductase 5.21×10−81
2-10140-02-345 0.01 Vitis/Picea Peroxisomal biogenesis/unknown 2.25×10−79
2-10350-01-486 0.01 Arabidopsis DNAJ heat shock protein 3.14×10−40
2-10484-01-147 0 Populus Single MYB histone 7.70×10⁻¹¹
2-1823-02-489 0 Arabidopsis/Populus Glucose 6 isomerase/predicted 2.16×10−91
CL2367Contig1-01-104 0 Arabidopsis/Populus PCBE reductase 6.48×10⁻²⁴
UMN-2024-01-435 0 Vitis Histone 2A variant 5×10−40
0-6268-02-53 0 Arabidopsis/Populus Histone deacetylase 2.44×10−128
0-11034-01-36 0 Populus Chromatin remodeling subunit 2.71×10⁻⁷
CL1445Contig1-02-95 0 Arabidopsis/Populus PIP2/aquaporin protein 1.62×10−56
0-6952-01-236 0 Arabidopsis Arabinofuranosidase/xylosidase 1.69×10−42
1174 Tree Genetics & Genomes (2013) 9:1161–1178

FDR of 0.05 (Table 4). The traits, for which at least one locusremained significant after the less tolerant MLM correction,included traits related to volume and stem straightness(AVEBV and AVEST in the FGS), and DBH (in the clonaltest). In order to use this information in MAS programs, theexact physical location of these markers in the genome as wellas information on their precise biological role would be desir-able. It is expected that a loblolly pine reference genomesequence will become available soon allowing these relation-ships to be verified and better characterized.
Despite these limitations, annotations obtained from theGenbank protein databases provided tantalizing hints atputative biological roles for these genes. Annotations ofthe significantly associated markers revealed homologieswith a variety of proteins and enzymes from model andnon-model plant species involved in important biologicalfunctions (see Table 5 for details of these annotations).Some of the most interesting proteins that appear to behomologous to significant markers in the present study werevarious kinases, transmembrane transporters, lipases, tubu-lins, transcription factors, methyltransferases, dehydro-genases and reductases, etc. This information will becomemore applicable in breeding programs as denser linkagemaps, actual physical maps, and complete genome sequen-ces become available in pines.
Genome wide LD
With some limitations, our study is one of the first inconifers and particularly in loblolly pine to providegenome-wide estimates of LD in natural populations. Thefew reports currently available in conifers, demonstrated arelatively fast LD decay within a few hundred base pairs.These estimates were mostly based on short coding regionsof the genome (e.g., Brown et al. 2004; Krutovsky andNeale 2005; Heuertz et al. 2006; see also Gupta et al.2005 and González-Martínez et al. 2011 for review).However, these reports were not genome-wide, and a recentgenome-wide study in mostly non-coding regions ofCryptomeria japonica (Cupressaceae) demonstrated thatLD was extensive and did not decay even at a distance of100 Kb (Moritsuka et al. 2012). In contrast, a recentgenome-wide study in aspen (Kelleher et al. 2012) demon-strated a relatively rapid LD decay with distance along genecontaining regions. Although both species in these studiesare forest trees, the two species are very different and moredata will be needed to make general conclusions.
Our LD estimates were based on markers distributedover all 12 LGs and can be considered as genome-wideestimates. However, some limitations of these estimatesshould be noted. First, the sampling of these markers,although genome-wide, was neither comprehensive norrandom, and thus, some ascertainment bias may exist.
The SNPs represent a subset of unigenes selected from arelatively small sample of individuals and do not necessarilyrepresent variation of the entire genome or for the species. Asecond limitation is that physical distances between markerswere inferred indirectly via linkage mapping data and flowcytometry estimates for the genome sizes of the loblolly pinechromosomes (O’Brien et al. 1996). Therefore, the distancebetween markers was an approximation.
As our results demonstrated, the pairwise LD betweenmarkers was mostly weak (r2<0.1) over both shorter andlonger distance intervals. Rapid LD decay was observed inall LGs, but due to the limited number of mapped markers(from 70 to 108 markers per LG) the map density was notsufficient to observe the true rate of LD decay. Nevertheless,several instances of cosegregation were observed betweenmarkers separated by up to 1,000,000 Kb distance (LDvalues of up to r2=1). Most such occurrences, however,involved markers more closely spaced (Fig. 10). As dis-cussed earlier, there could be several explanations for suchhigh LD estimates between these markers, e.g., mappingerrors, family structure, and epistasis. We speculate thatthe first two possibilities are more likely for two reasons,e.g., the linkage map is based on segregation of markers in arelatively small segregating family, thus the mapping datamay not be accurate. Moreover, a few errors in mappingwere detected when markers that supposedly belong to thesame gene were mapped very far from each other in a LG oreven in the different LGs. For instance, SNPs 2-5567-01-539 and 2-5567-01-55 that supposedly belong to the samegene were mapped at positions 19.0 and 62.3 cM, respec-tively, in LG 5. Similarly SNPs 0-12068-01-229 and 0-12068-01-625 that also supposedly belong to the same genewere mapped in entirely diferent LGs (LG-7 and LG-2 atpositions 37.5 and 92.4 cM, respectively). This could be astrong evidence for errors in assignment of SNPs to onegene while the SNPs belong to a pair of highly homologousgenes or paralogs whose sequences were erroneously clus-tered together in a single alignment during SNP discovery inthe ADEPT2 study. Secondly, we are aware of the presenceof family structure in the current set of populations.Although epistasis is still a possibility, its verification willbecome possible only after the physical map is completed,and the information on precise biological functions of themarkers involved becomes available.
Selection detection
In the FGS populations, the multilocus FST showed very lowpopulation differentiation. However, a number of markersaccounted for very high or very low FST. Such allele fre-quency differences between populations could be a sign oflocal adaptation. The 26 source Counties/Parishes for theFGS populations are spread throughout the vast areas of east
Tree Genetics & Genomes (2013) 9:1161–1178 1175
Texas and western Louisiana and thus these genotypesmay have been exposed to different climatic and envi-ronmental conditions. The climate maps (http://prism.oregonstate.edu) for climatic factors like precipi-tation, minimum and maximum annual temperatures inthis region show several gradients in the study area.Moreover, there may also be discontinous differencespresent. Such differences could lead to local adaptationto environmental and geographical factors resulting inchanges in allele frequencies through natural selection.Detailed landscape genomic analysis of association ofbetween SNPs and environmental variables will be pre-sented in a separate publication.
The loci identified as candidates for diversifying selec-tion had an FST in the range 3–10 %. The BlastX annotationrevealed that these loci had homologs among proteins fromArabidopsis and Populus, such as translation factors, lac-case 3 (involved in wood formation), flowering time controlprotein, various kinases, and ATP binding proteins, phos-phatases and cytochrome p450. While many of these genesserve housekeeping functions, the functions of the floweringtime control and cytochrome genes might reflect local ad-aptation to temporal variation in temperature and daylength.Laccase is a well-known protein involved in lignification inconifers (Bao et al. 1993; Sato et al. 2001) and may con-tribute to the strength of the wood. Environmental andgeographical factors affecting wood formation may alsolead to selection pressure on the genes involved in lignifi-cation. Candidates for balancing selection demonstrated FST
between 0 % (no differentiation) to 3 %. Protein homologsfor these markers included heat shock proteins, lecithin,cytokinin oxidases, myb histones, aquaporin, histone 2A,glucose 6 isomerase, xylosidase and arabinofuranosidase.
Our results represent the first attempt to genetically char-acterize the WGFTIP breeding populations of loblolly pinewith a genome-wide panel of SNPs. Due to the scarcity ofinformation on genome-wide LD in forest trees, estimatesfrom our study, although preliminary, are much needed fordeveloping breeding programs based on GS. We also expectthat the established relationships between markers and de-sirable traits could be verified in the future GS studies. Thisshould greatly promote the application of MAS to theWGFTIP and possibly other tree improvement and breedingprograms.
Acknowledgments We thank the members and staff of the WesternGulf Forest Tree Improvement Program, Texas Forest Service for theircontribution of germplasm to this project, and the Genetics GraduateProgram of Texas A&M University for the financial support of VikramChhatre. This work was supported by the National Science FoundationPlant Genome Research Program award #DBI-0501763 and the USDepartment of Agriculture National Institute of Food and AgricultureAFRI Applied Plant Genomics CAP award #2009-85606-05680. Wealso thank Dr. Ronald R. Sederoff (NC State University) for his com-ments, which greatly helped us improve the quality of the manuscript.
References
Abecasis GR, Cookson WOC (2000) GOLD — graphical overview oflinkage disequilibrium. Bioinformatics 16(2):182–183
Al-Maskri AY, Sajjad M, Khan SH (2012) Association mapping: a stepforward to discovering new alleles for crop improvement. Int JAgric Biol 14:153–160
Al-Rabab’ah MA, Williams CG (2002) Population dynamics of Pinustaeda L. based on nuclear microsatellites. For Ecol Manag163(13):263–271
Al-Rabab’ah MA, Williams CG (2004) An ancient bottleneck in thelost pines of central Texas. Mol Ecol 13(5):1075–1084
Antao T, Lopes A, Lopes R, Beja-Pereira A, Luikart G (2008)LOSITAN: a workbench to detect molecular adaptation basedon a FST-outlier method. BMC Bioinforma 9:323
Bao W, O’Malley DM, Whetten R, Sederoff RR (1993) A laccaseassociated with lignification in loblolly pine xylem. Science260(5108):672–674
Beaumont MA, Balding DJ (2004) Identifying adaptive genetic diver-gence among populations from genome scans. Mol Ecol 13:969–980
Beaumont MA, Nichols RA (1996) Evaluating loci for use in thegenetic analysis of population structure. Proc Roy Soc B263:1619–1626
Beaulieu J, Doerksen T, Boyle B, Clément S, Deslauriers M,Beauseigle S, Blais S, Poulin P-L, Lenz P, Caron S, Rigault P,Bicho P, Bousquet J, MacKay J (2011) Association genetics ofwood physical traits in the conifer white spruce and relationshipswith gene expression. Genetics 188:197–214
Besenbacher S, Mailund T, Schierup M (2012) Association mappingand disease: evolutionary perspectives. In: Anisimova M (ed)Evolutionary genomics: statistical and computational methods,vol 2, Methods in molecular biology, Chapter 11. SpringerScience+Business Media, New York, pp 275–291
Bradbury PJ, Zhang Z, Kroon DE, Casstevens TM, Ramdoss Y,Buckler ES (2007) TASSEL: software for association mappingof complex traits in diverse samples. Bioinformatics23(19):2633–2635
Brown GR, Bassoni DL, Gill GP, Fontana JR, Wheeler NC, MegrawRA, Davis MF, Sewell MM, Tuskan GA, Neale DB (2003)Identification of quantitative trait loci influencing wood propertytraits in loblolly pine [Pinus taeda (L.): III. QTL verification andcandidate gene mapping. Genetics 164(4):1537–1546
Brown GR, Gill GP, Kuntz RJ, Langley CH, Neale DB (2004)Nucleotide diversity and linkage disequilibrium in loblolly pine.Proc Natl Acad Sci USA 101(42):15255–15260
Byram TD, Mullin TJ, White TL, van Buijtenen JP (2005a) The futureof tree improvement in the southeastern United States: alternativevisions for the next decade. Southern J Appl For 29(2):88–95
Byram T, Myszewski J, Gwaze D, Lowe W (2005b) Improving woodquality in the western gulf forest tree improvement program: theproblem of multiple breeding objectives. Tree Genet Genomes1:85–92
Cumbie W, Eckert A, Wegrzyn J, Whetten R, Neale D, Goldfarb B(2011) Association genetics of carbon isotope discrimination,height and foliar nitrogen in a natural population of Pinus taedaL. Heredity 107:105–114
Earl DA, vonHoldt BM (2012) STRUCTURE HARVESTER: a web-site and program for visualizing STRUCTURE output and imple-menting the Evanno method. Conserv Genet Resour 4(2):359–361
Echt CS, Saha S, Krutovsky KV, Wimalanathan K, Erpelding JE,Liang C, Nelson CD (2011) An annotated genetic map of loblollypine based on microsatellite and cDNA markers. BMC Genet12:17
1176 Tree Genetics & Genomes (2013) 9:1161–1178

Eckert AJ, Bower AD, Wegrzyn JL, Pande B, Jermstad KD, KrutovskyKV, St Clair JB, Neale DB (2009a) Association genetics of coastalDouglas Fir (Pseudotsuga menziesii var. menziesii, Pinaceae): I.Cold-hardiness related traits. Genetics 182(4):1289–1302
Eckert AJ, Pande B, Ersoz ES, Wright MH, Rashbrook VK, NicoletCM, Neale DB (2009b) High-throughput genotyping and map-ping of single nucleotide polymorphisms in loblolly pine (Pinustaeda L.). Tree Genet Genomes 5(1):225–234
Eckert AJ, van Heerwaarden J, Wegrzyn JL, Nelson CD, Ross-Ibarra J,González-Martínez SC, Neale DB (2010a) Patterns of populationstructure and environmental associations to aridity across therange of loblolly pine [Pinus taeda (L.), Pinaceae]. Genetics185(3):969–982
Eckert AJ, Bower AD, González-Martínez SC, Wegrzyn JL, Coop G,Neale DB (2010b) Back to nature: ecological genomics of loblol-ly pine ([Pinus taeda], Pinaceae). Mol Ecol 19(17):3789–3805
Eckert AJ, Wegrzyn JL, CumbieWP, Goldfarb B, Huber DA, Tolstikov V,Fiehn O, Neale DB (2012) Association genetics of the loblolly pine([Pinus taeda], Pinaceae) metabolome. New Phytol 193:890–902
Evanno G, Regnaut S, Goudet J (2005) Detecting the number ofclusters of individuals using the software structure: a simulationstudy. Mol Ecol 14:2611–2620
Goddard ME, Hayes BJ (2009) Mapping genes for complex traits indomestic animals and their use in breeding programmes. Nat RevGenet 10:381–391
González-Martínez SC, Ersoz E, Brown GR, Wheeler NC, Neale DB(2006) DNA sequence variation and selection of tag single-nucleotide polymorphisms at candidate genes for drought-stressresponse in Pinus taeda L. Genetics 172(3):1915–1926
González-Martínez SC, Wheeler NC, Ersoz E, Nelson CD, Neale DB(2007) Association genetics in Pinus taeda L.: I. Wood propertytraits. Genetics 175(1):399–409
González-Martínez SC, Dillon S, Garnier-Géré PH, Krutovsky KV,Alía R, Burgarella C, Eckert AJ, Garcia MR, Grivet D, HeuertzM, Jaramillo-Correa JP, Lascoux M, Neale DB, Savolainen O,Tsumura Y, Vendramin GG (2011) Patterns of nucleotide diversityand association mapping. In: Plomion C, Bousquet J, Kole C (eds)Ch. 6 in Genetics, genomics and breeding of conifers. CRC Press,Science Publishers, Enfield, pp 239–275
Gupta PK, Rustgi S, Kulwal PL (2005) Linkage disequilibrium andassociation studies in higher plants: present status and futureprospects. Plant Mol Biol 57(4):461–485
Haldane J (1954) An exact test for randomness of mating. J Genet52:631–635
Hardy J, Singleton A (2009) Genome wide association studies andhuman disease. New Eng J Med 360:1759–1768
Hardy OJ, Vekemans X (2002) SPAGeDi: a versatile computer pro-gram to analyse spatial genetic structure at the individual orpopulation levels. Mol Ecol Notes 2:618–620
Harfouche A, Meilan R, Kirst M, Morgante M, Boerjan W, Sabatti M,Mugnozza GS (2012) Accelerating the domestication of foresttrees in a changing world. Trends Plant Sci 17(2):64–72
Heuertz M, De Paoli E, Källman T, Larsson H, Jurman I, Morgante M,Lascoux M, Gyllenstrand N (2006) Multilocus patterns of nucle-otide diversity, linkage disequilibrium and demographic history ofNorway spruce (Picea abies [L.] Karst). Genetics 174:2095–2105
Homolka A, Eder T, Kopecky D, Berenyi M, Burg K, Fluch S (2012)Allele discovery of ten candidate drought-response genes inAustrian oak using a systematically informatics approach based on454 amplicon sequencing. BMC Res Notes 5:175. doi:10.1186/1756-0500-5-175
Ingvarsson PK (2005) Nucleotide Polymorphism and linkage disequi-librium within and among natural populations of European aspen(Populus tremula L., Salicaceae). Genetics 169(2):945–953
Ingvarsson PK, Street NR (2011) Association genetics of complextraits in plants. New Phytol 189:909–922
Jakobsson M, Rosenberg NA (2007) CLUMPP: a cluster matching andpermutation program for dealing with label switching and multi-modality in analysis of population structure. Bioinformatics23(14):1801–1806
Kelleher CT, Wilkin J, Zhuang J, Cortés AJ, Quintero ÁLP, GallagherTF, Bohlmann J, Douglas CJ, Ellis BE, Ritland K (2012) SNPdiscovery, gene diversity, and linkage disequilibrium in wildpopulations of Populus tremuloides. Tree Genet Genomes.doi:10.1007/s11295-012-0467-x (online first)
Khan MA, Korban SS (2012) Association mapping in forest trees andfruit crops. J Exp Bot. doi:10.1093/jxb/ers105 (online first)
Kloth KJ, Thoen MPM, Bouwmeester HJ, Jongsma MA, Dicke M(2012) Association mapping of plant resistance to insects. TrendsPlant Sci 17(5):311–319
Krutovsky KV, Neale DB (2005) Nucleotide diversity and linkagedisequilibrium in cold-hardiness- and wood quality-related candi-date genes in Douglas-fir. Genetics 171(4):2029–2041
Krutovsky KV, Vaganov EA, Chubugina IV, Oreshkova NV,Tretyakova IN, Tyazhelova TV (2012) Complex genome se-quencing: preliminary data of Siberian larch complete genomede novo sequencing. Microsymposium I: computational and ex-perimental genomics. The 8th International Conference on theBioinformatics of Genome Regulation and Structure\SystemsBiology, June 25–29, 2012, Novosibirsk, Russia, p. 53 (http://conf.nsc.ru/files/conferences/BGRSSB2012/130321/Program_BGRS_SB_24_06_12.pdf)
Lepoittevin C, Harvengt L, Plomion C, Garnier-Géré P (2011)Association mapping for growth, straightness and wood chemis-try traits in the Pinus pinaster Aquitaine breeding population.Tree Genet Genomes 8:113–126
Lowe WJ, van Buijtenen JP (1980) Tree improvement philosophy andstrategy for the western gulf forest tree improvement program.Proceedings of the 16th North American quantitative forest geneticsgroup workshop, Coeur D’Alene, Idaho, August 6–8, pp 43–50
Lowe WJ, van Buijtenen JP (1991) Progeny test data summariza-tion procedures in the western gulf forest tree improvementprogram. In Proceedings of the Southern Forest TreeImprovement Conference, Knoxville, Tennessee, June 17–20,pp 303–312
McKeand SE, Jokela EA, Huber DA, Byram TD, Allen HL, Li B,Mullin TJ (2006a) Performance of improved genotypes of loblol-ly pine across different soils, climates, and silvicultural inputs. ForEcol Manag 227:178–184
McKeand SE, Abt RC, Lee Allen H, Li B, Catts GP (2006b) What are thebest loblolly pine genotypes worth to landowners? J For 104(7):325–358
Moritsuka E, Hisataka Y, Tamura M, Uchiyama K, Watanabe A,Tsumura Y, Tachida H (2012) Extended linkage disequilibriumin non-coding regions in a conifer, Cryptomeria japonica.Genetics 190(3):1145–1148
Mir RR, Zaman-Allah M, Sreenivasulu N, Trethowan R, Rajeev VK(2012) Integrated genomics, physiology and breeding approachesfor improving drought tolerance in crops. Theor Appl Genet125(4):625–645
Neale DB, Kremer A (2011) Forest tree genomics: growing resourcesand applications. Nat Rev Genet 12(2):111–122
Nei M (1972) Genetic distance between populations. Am Nat106:283–292
O’Brien I, Smith D, Gardner R, Murray B (1996) Flow cytomet-ric determination of genome size in Pinus. Plant Sci115(1):91–99
Parchman TL, Gompert Z, Mudge J, Schilkey FD, Benkman CW,Buerkle CA (2012) Genome-wide association genetics of anadaptive trait in lodgepole pine. Mol Ecol 21:2991–3005
Pritchard J, Stephens M, Donnelly P (2000) Inference of populationstructure using multilocus genotype data. Genetics 155:945–959
Tree Genetics & Genomes (2013) 9:1161–1178 1177
Quesada T, Gopal V, Cumbie WP, Eckert AJ, Wegrzyn JL, Neale DB,Goldfarb B, Huber DA, Casella G, Davis JM (2010) Associationmapping of quantitative disease resistance in a natural populationof loblolly pine [Pinus taeda (L.)]. Genetics 186(2):677–686
Rafalski AJ (2010) Association genetics in crop improvement. CurrOpin Plant Biol 13(2):174–180
Resende MFR Jr, Muñoz P, Resende MDV, Garrick DJ, Fernando RL,Davis JM, Jokela EJ, Martin TA, Peter GF, Kirst M (2012a)Accuracy of genomic selection methods in a standard dataset ofloblolly pine [Pinus taeda (L.)]. Genetics 190:1503–1510
Resende MDV, Resende MFR, Sansaloni CP, Petroli CD, MissiaggiaAA, Aguiar AM, Abad JM, Takahashi EK, Rosado AM, FariaDA, Pappas GJ, Kilian A, Grattapaglia D (2012b) Genomicselection for growth and wood quality in Eucalyptus: capturingthe missing heritability and accelerating breeding for complextraits in forest trees. New Phytol 194:116–128
Ritland K (2012) Genomics of a phylum distant from flowering plants:conifers. Tree Genet Genomes 8:573–582
Ritland K, Krutovsky K, Tsumura Y, Pelgas B, Isabel N, Bousquet J(2011) Genetic mapping in conifers. In: Plomion C, Bousquet J,Kole C (eds) Ch. 5 in Genetics, Genomics and Breeding ofConifers. CRC Press, Science Publishers, Enfield, pp 196–238
Rosenberg NA (2004) Distruct: a program for the graphical display ofpopulation structure. Mol Ecol Notes 4(1):137–138
Rousset F (1997) Genetic differentiation and estimation of gene flow fromF-statistics under isolation by distance. Genetics 145:1219–1228
Rousset F (2008) GENEPOP 4.01: a complete re-implementation ofthe genepop software for windows and linux. Mol Ecol Resour8(1):103–106
Sato Y, Wuli B, Sederoff R, Whetten R (2001) Molecular cloning andexpression of eight laccase cDNAs in loblolly pine [Pinus taeda(L.)]. J Plant Res 114:147–155
Scheet P, Stephens M (2006) A fast and flexible statistical model forlarge-scale population genotype data: applications to inferringmissing genotypes and haplotypic phase. Am J Hum Genet78(4):629–644
Schmidtling RC (2007) Genetic variation in the southern pines: evo-lution, migration and adaptation following the Pleistocene. In:Kabrick JM, Dey DC, Gwaze D (eds) Shortleaf pine restorationand ecology in the Ozarks: Proceedings of a symposium; 2006November 7–9; Springfield, MO. Gen. Tech. Rep. NRS-P-15.U.S. Department of Agriculture, Forest Service, NorthernResearch Station, Newtown Square, pp 28–32
Schmidtling RC, Carroll E, LaFarge T (1999) Allozyme diversity ofselected and natural loblolly pine populations. Silvae Genetica48(1):35–45
Sewell MM, Bassoni DL, Megraw RA, Wheeler NC, Neale DB (2000)Identification of QTLs influencing wood property traits in loblolly
pine [Pinus taeda (L.)]: I. Physical wood properties. Theor ApplGenet 101:1273–1281
Sewell MM, Davis MF, Tuskan GA, Wheeler NC, Elam CC, BassoniDL, Neale DB (2002) Identification of QTLs influencing woodproperty traits in loblolly pine [Pinus taeda (L.)]: II. Chemicalwood properties. Theor Appl Genet 104:214–222
Soltis DE, Morris AB, McLachlan JS, Manos PS, Soltis PS (2006)Comparative phylogeography of unglaciated eastern NorthAmerica. Mol Ecol 15(14):4261–4293
Soto-Cerda BJ, Cloutier S (2012) Association mapping in plantgenomes. Chapter 3 in Genetic diversity in plants, Edited byMahmut Çalişkan. InTech, pp. 29–54
Stephens M, Smith NJ, Donnelly P (2001) A new statistical method forhaplotype reconstruction from population data. Am J Hum Genet68:978–989
Storey JD (2002) A direct approach to false discovery rates. J Roy StatSoc B 64:479–498
Stranger BE, Stahl EA, Raj T (2011) Progress and promise of genome-wide association studies for human complex trait genetics.Genetics 187:367–383
Strobeck C (1987) Average number of nucleotide differences in asample from a single subpopulation: a test for population subdi-vision. Genetics 117(1):149–153
Todd D, Pait J, Hodge J (1995) The impact and value of tree improve-ment in the south. In Proceedings of 23rd Southern Forest TreeImprovement Conference, Asheville, NC, June 20–22, 1995, pp7–16. Southern Forest Tree Improvement Committee.
Weir B, Cockerham C (1984) Estimating F-statistics for the analysis ofpopulation structure. Evolution 38:1358–1370
Wegrzyn JL, Eckert AJ, Choi M, Lee JM, Stanton BJ, Sykes R, DavisMF, Tsai CJ, Neale DB (2010) Association genetics of traitscontrolling lignin and cellulose biosynthesis in black cottonwood(Populus trichocarpa, Salicaceae) secondary xylem. New Phytol188:515–532
Williams CG (2009) Conifer reproductive biology. Springer ISBN978-1-4020-9601-3
Williams CG, Savolainen O (1996) Inbreeding depression in conifers:implications for breeding strategy. Forest Sci 42(1):102–117
Wright S (1978) Variability within and among natural populations,volume 4. University of Chicago Press, Chicago
Xu S, Tauer CG, Nelson CD (2008) Genetic diversity within andamong populations of shortleaf pine (Pinus echinata Mill.)and loblolly pine (Pinus taeda L.). Tree Genet Genomes4:859–868
Zapata-Valenzuela J, Isik F, Maltecca C, Wegrzyn J, Neale D,McKeand S, Whetten R (2012) SNP markers trace familial link-ages in a cloned population of Pinus taeda—prospects for ge-nomic selection. Tree Genet Genomes 8(6):1307–1318
1178 Tree Genetics & Genomes (2013) 9:1161–1178
Copyright © 2022 FDOKUMEN