Genetic diversity within Lablab purpureus and the application of gene-specific markers from a range...
18
Genetic diversity within Lablab purpureus and the application of gene-specific markers from a range of legume species S. C. Venkatesha 1 , M. Byre Gowda 1 , P. Mahadevu 1 , A. Mohan Rao, D.-J. Kim 2 , T. H. N. Ellis 3 and M. R. Knox 3 * 1 University of Agricultural Sciences, GKVK Campus, Bangalore 560065 Karnataka, India, 2 International Institute of Tropical Agriculture (IITA), C/O Biosciences Eastern and Central Africa (BECA). PO Box 30709, Nairobi, Kenya and 3 John Innes Centre, Colney Lane, Norwich, NR4 7UH, UK Received 15 August 2006; Accepted 20 October 2006 Abstract Molecular markers have been used to study genetic diversity within a set of Lablab purpureus accessions collected from the southern states of India. Amplified fragment length polymorph- ism (AFLP) molecular marker studies using a total of 78 L. purpureus accessions with nine primer combinations showed there was very little genetic diversity within the L. purpureus accessions from the southern Indian germplasm collection as compared to a set of 15 acces- sions from other international germplasm collections that included African accessions. The set of 15 were selected from a random amplified length polymorphism (RAPD) marker study and chosen on the basis of widest genetic distance. Further molecular analysis with poly- merase chain reaction (PCR) markers from 97 expressed sequence tag (EST) and gene-specific primer pairs, designed from a range of legume sequences, concurred with the AFLP analyses. Both of these approaches provide a wealth of markers for diversity and mapping studies. The 97 sequence-specific primer pairs tested in L. purpureus resulted in 70% amplification suc- cess, with 44% of primer pairs amplifying single bands and 10% double bands. Markers gen- erated from these EST and genomic sequences provide useful cross-reference to comparative legume genomics that will potentially have long-term benefit to legume plant breeding. Keywords: AFLP; gene-specific markers; genetic diversity; Lablab purpureus; legumes; Medicago truncatula Introduction Grain legumes are important food and forage crops globally (Graham and Vance, 2003). Although legumes, consumed either as dried grain or fresh vegetables, are low in sulphur-containing amino acids, this is counterba- lanced by the presence of many other beneficial nutri- tional and health factors (Champ et al., 2002). In combination with cereals, vegetables and fruits, legumes contribute towards balanced and healthy human nutrition, providing protein, carbohydrate, essential vitamins and oils, trace elements and fibre (Champ et al., 2002). Additionally, legumes are a source of high-quality animal fodder (Graham and Vance, 2003), and interact symbiotically with rhizobia, providing nitrogenated soils. Lablab purpureus (L.) Sweet (Dolichos lablab, hyacinth bean) is an important legume, cultivated throughout the tropics and subtropics. It is mostly grown for human con- sumption and animal forage (Murphy and Colucci, 1999), and is widely used as an intercrop in India and Australia (Pengelly and Maass, 2001; Maass et al., 2005). It is a versa- tile crop, able to be cultivated in a range of climates and soil types and is relatively drought tolerant. In addition to a food *Corresponding author. E-mail: [email protected] q NIAB 2007 ISSN 1479-2621 Plant Genetic Resources: Characterization and Utilization 5(3); 154–171 DOI: 10.1017/S1479262107835659
-
Upload
uhsbagalkot -
Category
Documents
-
view
0 -
download
0
Transcript of Genetic diversity within Lablab purpureus and the application of gene-specific markers from a range...
Genetic diversity within Lablab purpureusand the application of gene-specific markersfrom a range of legume species
S. C. Venkatesha1, M. Byre Gowda1, P. Mahadevu1, A. Mohan Rao,D.-J. Kim2, T. H. N. Ellis3 and M. R. Knox3*1University of Agricultural Sciences, GKVK Campus, Bangalore 560065 Karnataka, India,2International Institute of Tropical Agriculture (IITA), C/O Biosciences Eastern and Central
Africa (BECA). PO Box 30709, Nairobi, Kenya and 3John Innes Centre, Colney Lane,
Norwich, NR4 7UH, UK
Received 15 August 2006; Accepted 20 October 2006
AbstractMolecular markers have been used to study genetic diversity within a set of Lablab purpureus
accessions collected from the southern states of India. Amplified fragment length polymorph-
ism (AFLP) molecular marker studies using a total of 78 L. purpureus accessions with nine
primer combinations showed there was very little genetic diversity within the L. purpureus
accessions from the southern Indian germplasm collection as compared to a set of 15 acces-
sions from other international germplasm collections that included African accessions.
The set of 15 were selected from a random amplified length polymorphism (RAPD) marker
study and chosen on the basis of widest genetic distance. Further molecular analysis with poly-
merase chain reaction (PCR) markers from 97 expressed sequence tag (EST) and gene-specific
primer pairs, designed from a range of legume sequences, concurred with the AFLP analyses.
Both of these approaches provide a wealth of markers for diversity and mapping studies.
The 97 sequence-specific primer pairs tested in L. purpureus resulted in 70% amplification suc-
cess, with 44% of primer pairs amplifying single bands and 10% double bands. Markers gen-
erated from these EST and genomic sequences provide useful cross-reference to comparative
legume genomics that will potentially have long-term benefit to legume plant breeding.
Keywords: AFLP; gene-specific markers; genetic diversity; Lablab purpureus; legumes; Medicago truncatula
Introduction
Grain legumes are important food and forage crops
globally (Graham and Vance, 2003). Although legumes,
consumed either as dried grain or fresh vegetables, are
low in sulphur-containing amino acids, this is counterba-
lanced by the presence of many other beneficial nutri-
tional and health factors (Champ et al., 2002). In
combination with cereals, vegetables and fruits, legumes
contribute towards balanced and healthy human nutrition,
providing protein, carbohydrate, essential vitamins and
oils, trace elements and fibre (Champ et al., 2002).
Additionally, legumes are a source of high-quality
animal fodder (Graham and Vance, 2003), and interact
symbiotically with rhizobia, providing nitrogenated soils.
Lablab purpureus (L.) Sweet (Dolichos lablab, hyacinth
bean) is an important legume, cultivated throughout the
tropics and subtropics. It is mostly grown for human con-
sumption and animal forage (Murphy and Colucci, 1999),
and is widely used as an intercrop in India and Australia
(Pengelly and Maass, 2001; Maass et al., 2005). It is a versa-
tile crop, able to be cultivated in a range of climates and soil
types and is relativelydrought tolerant. In addition to a food* Corresponding author. E-mail: [email protected]
q NIAB 2007ISSN 1479-2621
Plant Genetic Resources: Characterization and Utilization 5(3); 154–171DOI: 10.1017/S1479262107835659
crop, L. purpureus is often grown as a weed suppressor,
a soil erosion retardant and as green manure (Liu, 1996;
Murphy and Colucci, 1999; Pengelly and Maass, 2001).
Traditional, ‘classical’, breeding, involving exotic and
indigenous varieties from southern India, has successfully
produced photo-insensitive, high-yielding, determinate
L. purpureus lines that can be grown all year round (Maha-
devu and Byre Gowda, 2005). Further breeding objectives
would combine characteristics like photo-insensitivity and
yield with other desirable attributes, such as improved
fragrance, togetherwith pest and disease resistance (Maha-
devu and Byre Gowda, 2005). Some legume crops, as is
also the case for non-legume crops, have a relatively
narrow genetic base (Udupa et al., 1993; Kochert et al.,
1996; Ladizinsky, 1998). The use of inter-species crosses
to produce lines with desirable traits, such as yield
improvement or disease resistance, has been one way to
overcome the genetic bottleneck of crop plant domesti-
cation (Ladizinsky, 1998; Winter et al., 2000; Rao et al.,
2003; Gur and Zamir, 2004). This breeding approach, of
inter- or wide intra-specific crosses, can benefit from
good genetic maps with robust markers anchored to
reference genomes, such as are available from comparative
genetic maps.
Previous studies of diversity within the L. purpureus spp.
and sub-species using RAPD (random amplified length
polymorphism) (Liu, 1996) and AFLP (amplified fragment
length polymorphism) (Maass et al., 2005) suggest that
there is considerable molecular variation from accessions
found in collections that comprise lines from Africa, Asia
and Europe, and that these lines could provide useful
and desired traits if incorporated into breeding strategies.
In addition to this molecular diversity, L. purpureus also
has diverse phenotypic characters (Basavarajappa and
Byre Gowda, 2000; Pengelly and Maass, 2001; Maass,
2006), reflected in their different growth habits, that have
served to provide cultivars fitted to specific environments.
Yield losses can be as much as 70% in any 1 year from
pests and diseases (M. Byre Gowda, unpublished obser-
vations), and this low productivity problem is not unique
to L. purpureus but also applies to other legumes
(Udupa et al., 1993; Kochert et al., 1996; Graham and
Vance, 2003; Rao et al., 2003). The introgression of alleles
from diverse germplasm may provide some opportunities
to control yield instability.
Isozymes and RFLP (restriction fragment length poly-
morphism) (nuclear and plastid) as well as polymerase
chain reaction (PCR)-based markers [RAPD, simple
sequence repeat (SSR), AFLP and single nucleotide poly-
morphism (SNP)] have been used to analyse germplasm
(Palmer et al., 1985; Karp et al., 1996; Lu et al., 1996; Mba
and Tohme, 2005). The use of AFLP is advantageous as it
has no need for sequence information from the
genotypes being analysed, a multiplex of reproducible
bands is generated; AFLP is robust and can be automated
for high-throughput large-scale studies. Other sequence-
based markers do require prior information and, where
sequence data are limited for a given species, taxonomically
close relatives can provide useful data. For L. purpureus
there are few sequences available, but there is a vast
amount of sequence data available from related legume
species. Comparative mapping within the legume crop
and model species (Zhu et al., 2005) provides evidence
that this wealth of sequence data can be used for genetic
analysis even in neglected legume species such as
L. purpureus, especially given that this genome aligns well
with Vigna radiata (mungbean) (Humphry et al., 2002).
The aim of the present study was to characterize the
genetic diversity within regional L. purpureus from
southern India in comparison with lines from inter-
national germplasm collections. Two molecular marker
types, AFLP, and gene sequence-specific PCR-based mar-
kers from a range of legumes, were used and tested
within subsets of L. purpureus accessions. This diversity
study approach has the potential to define population
structure as an aid to identifying useful marker alleles
in association with L. purpureus traits such as fragrance
and pathogen resistance.
Materials and methods
Plant material
Experiments in this study involved 78 L. purpureus acces-
sions (Table 1) from various sources: (1) GL x, from the Uni-
versity of Agricultural Sciences (UAS), Bangalore, India,
including those accessions collected from the southern
Indian states of Karnataka, Andhra Pradesh and Tamil
Nadu (Fig. 1); (2) accessions from international collections:
those from the Australian Tropical Crops Genetic Resources
Centre (ATCGRC), are prefixedwith CPI, cv. Highworth and
cv. Rongai were also obtained from ATCGRC; and those
from the International LivestockResearch Institute, Ethiopia,
are prefixed with ILRI. Individuals from a range of legume
species (Medicago truncatula Jemalong, Glycine max,
Vigna unguiculata, and Pisum sativum JI15 from the John
Innes Centre germplasm collection) were included where
necessary for some experiments.
DNA preparation
A standardized DNA preparation method (Ellis et al., 1984)
was used for all legumes. L. purpureus DNA was prepared
using the standardized method but included a heating step
at 378C for 10min after addition of sodium dodecylsulphate
(SDS), and nucleic acid was not spooled but recovered by
Genetic diversity within Lablab purpureus 155
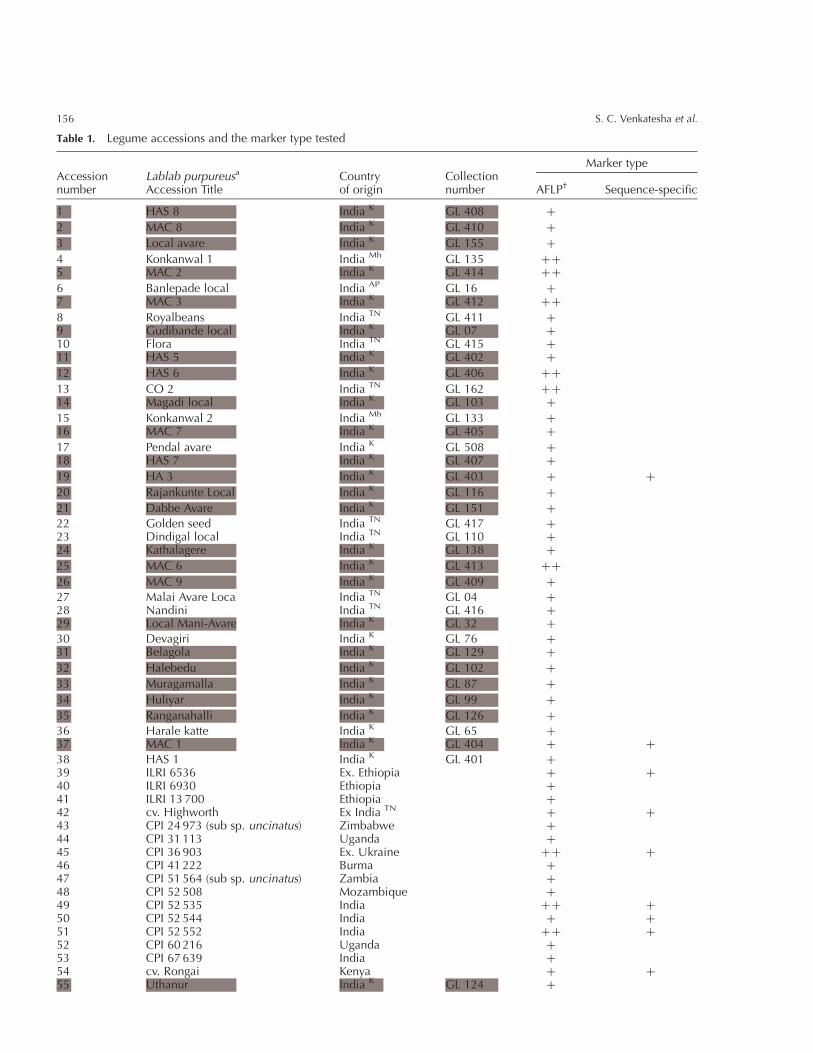
Table 1. Legume accessions and the marker type tested
Accessionnumber
Lablab purpureusa
Accession TitleCountryof origin
Collectionnumber
Marker type
AFLP† Sequence-specific
1 HAS 8 India K GL 408 þ
2 MAC 8 India K GL 410 þ
3 Local avare India K GL 155 þ
4 Konkanwal 1 India Mh GL 135 þþ5 MAC 2 India K GL 414 þþ
6 Banlepade local India AP GL 16 þ7 MAC 3 India K GL 412 þþ
8 Royalbeans India TN GL 411 þ9 Gudibande local India K GL 07 þ10 Flora India TN GL 415 þ11 HAS 5 India K GL 402 þ
12 HAS 6 India K GL 406 þþ
13 CO 2 India TN GL 162 þþ14 Magadi local India K GL 103 þ
15 Konkanwal 2 India Mh GL 133 þ16 MAC 7 India K GL 405 þ
17 Pendal avare India K GL 508 þ18 HAS 7 India K GL 407 þ
19 HA 3 India K GL 403 þ þ
20 Rajankunte Local India K GL 116 þ
21 Dabbe Avare India K GL 151 þ
22 Golden seed India TN GL 417 þ23 Dindigal local India TN GL 110 þ24 Kathalagere India K GL 138 þ
25 MAC 6 India K GL 413 þþ
26 MAC 9 India K GL 409 þ
27 Malai Avare Local India TN GL 04 þ28 Nandini India TN GL 416 þ29 Local Mani-Avare India K GL 32 þ
30 Devagiri India K GL 76 þ31 Belagola India K GL 129 þ
32 Halebedu India K GL 102 þ
33 Muragamalla India K GL 87 þ
34 Huliyar India K GL 99 þ
35 Ranganahalli India K GL 126 þ
36 Harale katte India K GL 65 þ37 MAC 1 India K GL 404 þ þ
38 HAS 1 India K GL 401 þ39 ILRI 6536 Ex. Ethiopia þ þ40 ILRI 6930 Ethiopia þ41 ILRI 13 700 Ethiopia þ42 cv. Highworth Ex India TN þ þ43 CPI 24 973 (sub sp. uncinatus) Zimbabwe þ44 CPI 31 113 Uganda þ45 CPI 36 903 Ex. Ukraine þþ þ46 CPI 41 222 Burma þ47 CPI 51 564 (sub sp. uncinatus) Zambia þ48 CPI 52 508 Mozambique þ49 CPI 52 535 India þþ þ50 CPI 52 544 India þ þ51 CPI 52 552 India þþ þ52 CPI 60 216 Uganda þ53 CPI 67 639 India þ54 cv. Rongai Kenya þ þ55 Uthanur India K GL 124 þ
S. C. Venkatesha et al.156
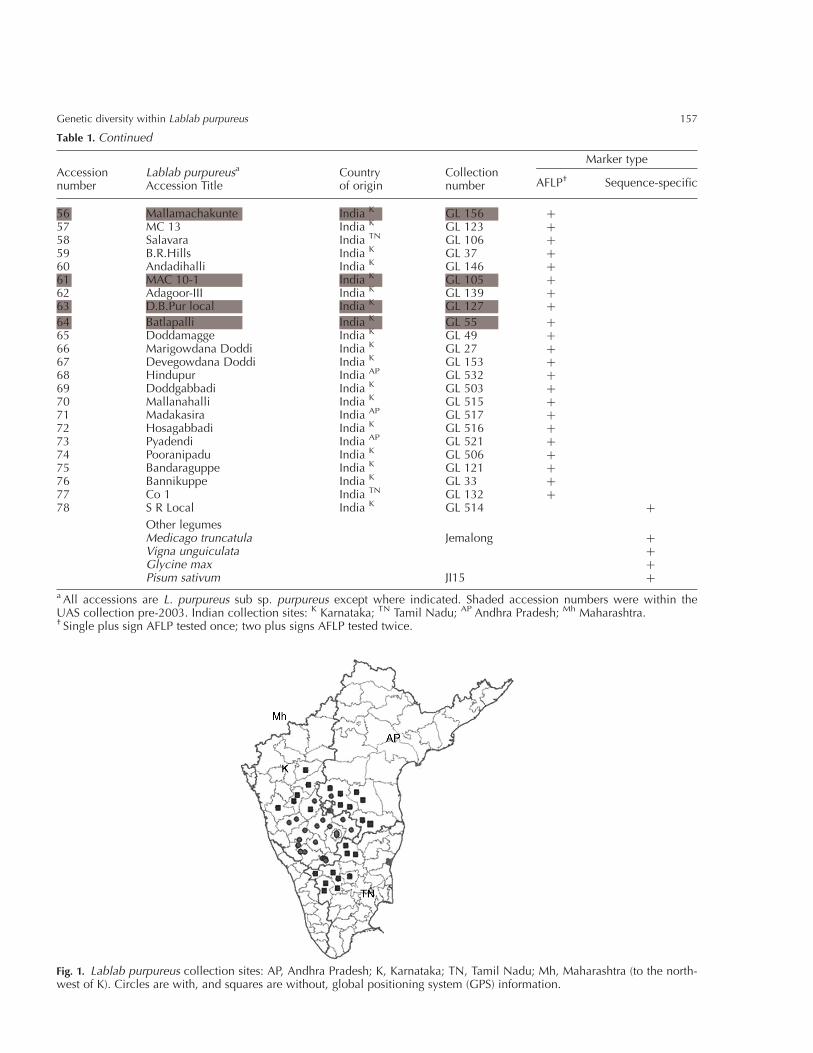
Table 1. Continued
Accessionnumber
Lablab purpureusa
Accession TitleCountryof origin
Collectionnumber
Marker type
AFLP† Sequence-specific
56 Mallamachakunte India K GL 156 þ57 MC 13 India K GL 123 þ58 Salavara India TN GL 106 þ59 B.R.Hills India K GL 37 þ60 Andadihalli India K GL 146 þ61 MAC 10-1 India K GL 105 þ62 Adagoor-III India K GL 139 þ63 D.B.Pur local India K GL 127 þ
64 Batlapalli India K GL 55 þ65 Doddamagge India K GL 49 þ66 Marigowdana Doddi India K GL 27 þ67 Devegowdana Doddi India K GL 153 þ68 Hindupur India AP GL 532 þ69 Doddgabbadi India K GL 503 þ70 Mallanahalli India K GL 515 þ71 Madakasira India AP GL 517 þ72 Hosagabbadi India K GL 516 þ73 Pyadendi India AP GL 521 þ74 Pooranipadu India K GL 506 þ75 Bandaraguppe India K GL 121 þ76 Bannikuppe India K GL 33 þ77 Co 1 India TN GL 132 þ78 S R Local India K GL 514 þ
Other legumesMedicago truncatula Jemalong þVigna unguiculata þGlycine max þPisum sativum JI15 þ
a All accessions are L. purpureus sub sp. purpureus except where indicated. Shaded accession numbers were within theUAS collection pre-2003. Indian collection sites: K Karnataka; TN Tamil Nadu; AP Andhra Pradesh; Mh Maharashtra.† Single plus sign AFLP tested once; two plus signs AFLP tested twice.
Fig. 1. Lablab purpureus collection sites: AP, Andhra Pradesh; K, Karnataka; TN, Tamil Nadu; Mh, Maharashtra (to the north-west of K). Circles are with, and squares are without, global positioning system (GPS) information.
Genetic diversity within Lablab purpureus 157
pellet after each ethanol precipitation. All DNApreparations
were assessed on agarose and were all taken to an approxi-
mate concentration of 0.5mg/ml.
Diversity analysis: molecular markers
AFLPAFLP using EcoRI and Mse I digestion was carried
out as described by Vos et al. (1995) initially with
three primer combinations: EcoRIþCAT/Mse IþGTG,
EcoRIþCAA/Mse IþGTG, EcoRIþCAG/Mse IþGTG and
tested with accessions 1–53 (Table 1). A second AFLP
series using six primer combinations – EcoRIþCAT/Mse I
þGCC, EcoRIþCAG/Mse IþGTG, EcoRIþCAA/Mse I þ
GTG, EcoRIþCAT/Mse IþGTG, EcoRIþCAG/Mse IþGCC,
EcoRIþCAA/Mse IþGCC was carried out on a further batch
of accessions that included 12 accessions from the initial
AFLP (those with two plus signs, Table 1). The reasoning
behind the choice of primer combinationswas that the results
from the initial set of three primer combinations confirmed
that there was limited genetic diversity within the UAS acces-
sions. As therewere constraints on the number of accessions/
gel (limited to a maximum of 60), andmanymore accessions
to test, the second set of six primer combinations was tested
using accessions that included a few from the previous test
plus an additional set. This strategy tested whether or not
the limited genetic diversity within the UAS accessions
observed initially was primer combination specific.
The unlabelled AFLP products were run out on 4.5%
polyacrylamide gel electrophoresis (PAGE) at 1550V for
1.5 h and silver stained (Bassam and Caetano-Anolles,
1993). Bands were scored by four individuals per gel.
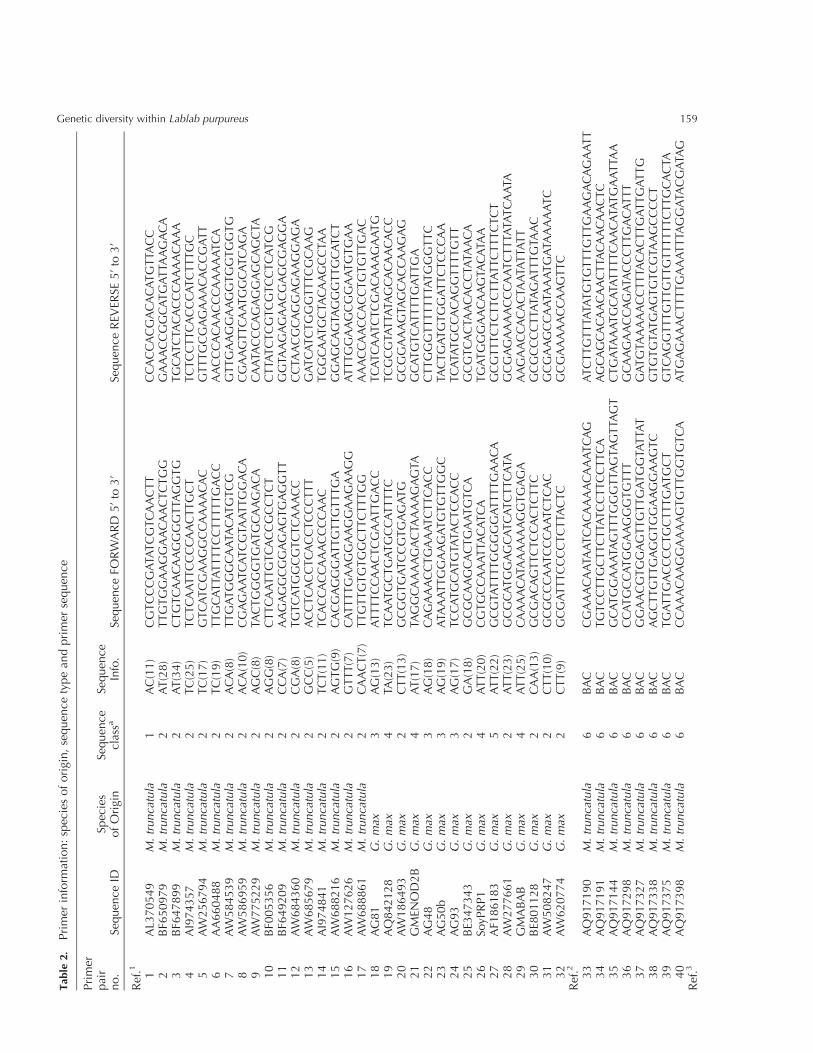
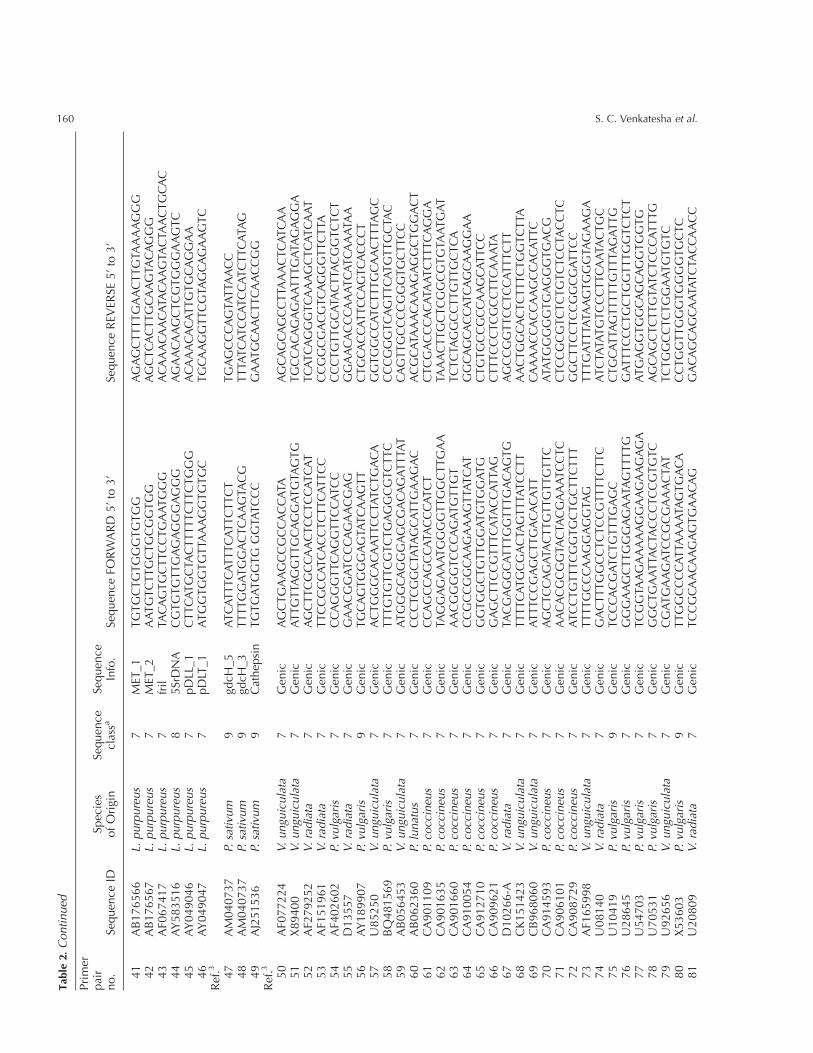
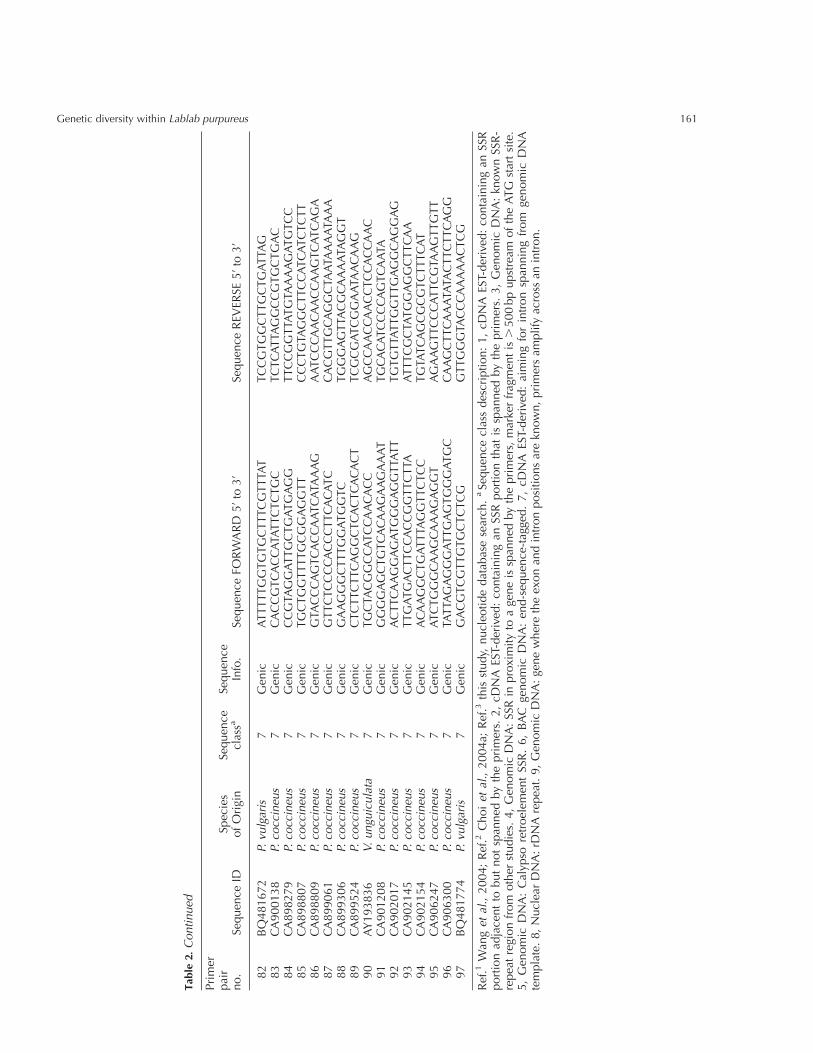
Sequence-specific PCR markersThe primer pairs for sequence-specific markers were
designed from a range of legume species and are listed in
Table 2 as follows: (1) a set of 32 SSR markers (primer
pairs 1–32) from EST or gene sequences (Wang et al.,
2004), 17 of the 32 were designed from M. truncatula
and 15 from G. max; (2) a set of primers designed from
eight M. truncatula BAC (bacterial artificial chromosome)
genomic sequences (primer pairs 33–40, Choi et al.,
2004a). A set of 57 primer pairs were designed from
nucleotide sequences from database searches as follows
(Table 2): six primer pairs (41–46) from L. purpureus
sequences, five of which were EST and one spanned the
5.8S rRNA transcription unit; three (primer pairs 47–49)
were P. sativum gene sequences; primer pairs 50–97
comprise 45 EST and 3 genomic sequences, designed
from a range of legumes within the Phaseoleae tribe.
PCR conditions were as follows: 0.1mmol/l of each
forward and reverse primer, 200mmol/l each dNTP, 1U
of Taq DNA polymerase (Invitrogen, Paisley, UK) and
the appropriate reaction buffers, 20–50 ng of DNA, in a
20ml volume. For all species and all primer combinations
the following touch-down cycling regime was used:
948C/3min; (948C/30 s; 508C/30 s; 728C/60 s) repeat for
10 cycles reducing the annealing temperature by 0.58C/
cycle; (948C/30 s; 458C/30 s; 728C/60 s) repeat 30 cycles;
728C/10min; 128C/30min. PCR products (10ml of each)
were visualized on 1.5% agarose for amplification. In
the search for polymorphic differences, unlabelled PCR
products from a few primer pairs were visualized from
4.5% PAGE gels after silver staining, as above for AFLP.
Data analysis
All gels were scored manually, independently by more
than one individual and data were input into Excel
(Microsoft) spreadsheets. The band data, for both marker
types, was scored as a 1/0 (presence/absence) matrix.
Genetic diversity was assessed using the PHYLIP
version 3.5 package (http://evolution.gs.washington.edu.
phylip.html) within which GENDIST was used for the
calculationof distancematrices usingNei’s genetic distance
(D); these distance matrices were used as the basis for
calculating the principal component analyses with Minitab
version 13. (www.minitab.com).
Results
AFLP diversity analysis
The genetic diversity of 53 L. purpureus accessions (Table
1, 1–53) assessed from 151 AFLP markers from three
primer combinations can be seen as a principal com-
ponent analysis (PCA) plot (Fig. 2). This figure shows
that there is very little genetic diversity within a set of
38 UAS L. purpureus accessions from the UAS germplasm
collection in Bangalore (24 previously within the collec-
tion plus 14 new additions from more recent plant collec-
tion expeditions) compared to a more diverse set of 15
accessions (Table 1, 39–53), that included some from
Africa. The more diverse set of 15 CPI and ILRI acces-
sions, from the two International collections, were
chosen on the basis of the widest genetic distance from
a RAPD marker study (Liu, 1996). The principal com-
ponent analysis of Fig. 2 showed that the first principal
component accounts for 78% of the variance of the
AFLP scoring data; the second and third components
account for 11% and 4% of the variance. The limited
diversity within the UAS L. purpureus accessions, cap-
tured in the first two dimensions of the data, can be
seen as a tight cluster of points (within the small rec-
tangle, Fig. 2); in contrast there is generally a wide scatter
S. C. Venkatesha et al.158
Table
2.Pri
mer
info
rmat
ion:
spec
ies
of
ori
gin,
sequen
cety
pe
and
pri
mer
sequen
ce
Pri
mer
pai
rno.
Sequen
ceID
Spec
ies
of
Ori
gin
Sequen
cecl
assa
Sequen
ceIn
fo.
Sequen
ceFO
RW
AR
D5’to
3’
Sequen
ceR
EVER
SE5’to
3’
Ref
.1
1A
L370549
M.trunca
tula
1A
C(1
1)
CG
TC
CC
GA
TATC
GTC
AA
CTT
CC
AC
CA
CG
AC
AC
ATG
TTA
CC
2B
F650979
M.trunca
tula
2A
T(2
8)
TTG
TG
GA
AG
GA
AC
AA
CTC
TG
GG
AA
AC
CG
GC
ATG
ATTA
AG
AC
A3
BF6
47899
M.trunca
tula
2A
T(3
4)
CTG
TC
AA
CA
AG
GG
GTTA
GG
TG
TG
CA
TC
TAC
AC
CC
AA
AA
CA
AA
4A
I974357
M.trunca
tula
2TC
(25)
TC
TC
AA
TTC
CC
CA
AC
TTG
CT
TC
TC
CTTC
AC
CC
ATC
TTTG
C5
AW
256794
M.trunca
tula
2TC
(17)
GTC
ATC
GA
AG
GC
CA
AA
AC
AC
GTTTG
CG
AG
AA
AC
AC
CG
ATT
6A
A660488
M.trunca
tula
2TC
(19)
TTG
CA
TTA
TTTTC
CTTTTTG
AC
CA
AC
CC
AC
AA
CC
CA
AA
AA
TC
A7
AW
584539
M.trunca
tula
2A
CA
(8)
TTG
ATG
GG
CA
ATA
CA
TG
TC
GG
TTG
AA
GG
AA
GG
TG
GTG
GTG
8A
W586959
M.trunca
tula
2A
CA
(10)
CG
AG
AA
TC
ATC
GTA
ATTG
GA
CA
CG
AA
GTTC
AA
TG
GC
ATC
AG
A9
AW
775229
M.trunca
tula
2A
GC
(8)
TAC
TG
GG
GTG
ATG
CA
AG
AC
AC
AA
TAC
CC
AG
AG
GA
GC
AG
CTA
10
BF0
05356
M.trunca
tula
2A
GG
(8)
CTTC
AA
TTG
TC
AC
CG
CC
TC
TC
TTA
TC
TC
GTC
GTC
CTC
ATC
G11
BF6
49209
M.trunca
tula
2C
CA
(7)
AA
GA
GG
CG
GA
GA
GTG
AG
GTT
GG
TAA
GA
GA
AC
GA
GC
GA
GG
A12
AW
684360
M.trunca
tula
2C
GA
(8)
TG
TC
ATG
GC
GTC
TC
AA
AC
CC
CTA
AC
GC
AG
GA
GA
AG
GA
GA
13
AW
685679
M.trunca
tula
2G
CC
(5)
AC
CTC
AC
CTC
AC
CTC
CC
TTT
GA
TC
ATC
TG
GG
TTTC
GC
AA
G14
AI9
74841
M.trunca
tula
2TC
T(1
1)
TC
AC
CA
CC
AA
AC
CC
CA
AC
TG
GC
AA
TG
CTA
CA
AG
CC
TAA
15
AW
688216
M.trunca
tula
2A
GTG
(9)
CA
CG
AG
GG
ATTG
TTG
TTTG
AG
GA
GC
AG
TAG
GG
TTG
CA
TC
T16
AW
127626
M.trunca
tula
2G
TTT(7
)C
ATTTTG
AA
GG
AA
GG
AA
GA
AG
GA
TTTG
GA
AG
CG
GA
ATG
TG
AA
17
AW
688861
M.trunca
tula
2C
AA
CT(7
)TTG
TTG
TG
TG
GC
TTC
TTTG
GA
AA
CC
AA
CC
AC
CTG
TG
TTG
AC
18
AG
81
G.max
3A
G(1
3)
ATTTTC
CA
AC
TC
GA
ATTG
AC
CTC
ATC
AA
TC
TC
GA
CA
AA
GA
ATG
19
AQ
842128
G.max
4TA
(23)
TC
AA
TG
CTG
ATG
CC
ATTTTC
TC
GC
GTA
TTA
TAG
CA
CA
AC
AC
C20
AW
186493
G.max
2C
TT(1
3)
GC
GG
TG
ATC
CG
TG
AG
ATG
GC
GG
AA
AG
TAG
CA
CC
AA
GA
G21
GM
ENO
D2B
G.max
4A
T(1
7)
TAG
GC
AA
AA
GA
CTA
AA
AG
AG
TAG
CA
TG
TC
ATTTTG
ATTG
A22
AG
48
G.max
3A
G(1
8)
CA
GA
AA
CC
TG
AA
ATC
TTC
AC
CC
TTG
GG
TTTTTTTA
TG
GG
TTC
23
AG
50b
G.max
3A
G(1
9)
ATA
AA
TTG
GA
AG
ATG
TG
TTG
GC
TAC
TG
ATG
TG
GA
TTC
TC
CC
AA
24
AG
93
G.max
3A
G(1
7)
TC
CA
TG
CA
TG
TATA
CTC
CA
CC
TC
ATA
TG
CC
AC
AG
GTTTTG
TT
25
BE3
47343
G.max
2G
A(1
8)
GC
GC
AA
GC
AC
TG
AA
TG
TC
AG
CG
TC
AC
TAA
CA
CC
TATA
AC
A26
SoyP
RP1
G.max
4A
TT(2
0)
CG
TG
CC
AA
ATTA
CA
TC
ATG
ATG
GG
AA
CA
AG
TAC
ATA
A27
AF1
86183
G.max
5A
TT(2
2)
GC
GTA
TTTTG
GG
GG
ATTTTG
AA
CA
GC
GTTTC
TC
TTC
TTA
TTC
TTTC
TC
T28
AW
277661
G.max
2A
TT(2
3)
GC
GC
ATG
GA
GC
ATC
ATC
TTC
ATA
GC
GA
GA
AA
AC
CC
AA
TC
TTTA
TATC
AA
TA29
GM
AB
AB
G.max
4A
TT(2
5)
CA
AA
AC
ATA
AA
AA
AG
GTG
AG
AA
AG
AA
CC
AC
AC
TAA
TATTA
TT
30
BE8
01128
G.max
2C
AA
(13)
GC
GA
CA
GTTC
TC
CA
CTC
TTC
GC
GC
CC
CTTA
TAG
ATTTG
TAA
C31
AW
508247
G.max
2C
TT(1
0)
GC
GC
CC
AA
TC
CC
AA
TC
TC
AC
GC
GA
AG
CC
AA
TAA
ATG
ATA
AA
AA
TC
32
AW
620774
G.max
2C
TT(9
)G
CG
ATTTC
CC
CTC
TTA
CTC
GC
GA
AA
AA
CC
AA
GTTC
Ref
.2
33
AQ
917190
M.trunca
tula
6B
AC
CG
AA
AC
AA
TAA
TC
AC
AA
AA
CA
AA
TC
AG
ATC
TTG
TTTA
TATG
TG
TTTG
TTG
AA
GA
CA
GA
ATT
34
AQ
917191
M.trunca
tula
6B
AC
TG
TC
CTTG
CTTC
TTA
TC
CTTC
CTTC
AA
GC
AG
CA
CA
AC
AA
CTTA
CA
AC
AA
CTC
35
AQ
917144
M.trunca
tula
6B
AC
GC
ATG
GA
AA
TAG
TTTG
GG
TTA
GTA
GTTA
GT
CTG
ATA
AA
TG
CA
TATTTTC
AA
CA
TATG
AA
TTA
A36
AQ
917298
M.trunca
tula
6B
AC
CC
ATG
CC
ATG
GA
AG
GG
TG
TTT
GC
AA
GA
AC
CA
GA
TAC
CC
TTG
AC
ATTT
37
AQ
917327
M.trunca
tula
6B
AC
GG
AA
CG
TG
GA
GTTG
TTG
ATG
GTA
TTA
TG
ATG
TAA
AA
AC
CTTTA
CA
CTTG
ATTG
ATTG
38
AQ
917338
M.trunca
tula
6B
AC
AG
CTTG
TTG
AG
GTG
GA
AG
GA
AG
TC
GTG
TG
TATG
AG
TG
TC
GTA
AG
CC
CC
T39
AQ
917375
M.trunca
tula
6B
AC
TG
ATTG
AC
CC
CTG
CTTTG
ATG
CT
GTC
AG
GTTTG
TTG
TTG
TTTTTTC
TTG
CA
CTA
40
AQ
917398
M.trunca
tula
6B
AC
CC
AA
AC
AA
GG
AA
AA
GTG
TTG
GTG
TC
AA
TG
AG
AA
AC
TTTTG
AA
ATTTA
GG
ATA
CG
ATA
GR
ef.3
Genetic diversity within Lablab purpureus 159
Table
2.Continued
Pri
mer
pai
rno.
Sequen
ceID
Spec
ies
of
Ori
gin
Sequen
cecl
assa
Sequen
ceIn
fo.
Sequen
ceFO
RW
AR
D5’to
3’
Sequen
ceR
EVER
SE5’to
3’
41
AB
176566
L.purpureus
7M
ET_1
TG
TG
CTG
TG
GG
TG
TG
GA
GA
GC
TTTTG
AA
CTTG
TAA
AA
GG
G42
AB
176567
L.purpureus
7M
ET_2
AA
TG
TC
TTG
CTG
CG
GTG
GA
GC
TC
AC
TTG
CA
AG
TAC
AG
GG
43
AF0
67417
L.purpureus
7fr
ilTA
CA
GTG
CTTC
CTG
AA
TG
GG
AC
AA
AC
AA
CA
TAC
AA
GTA
CTA
AC
TG
CA
C44
AY
583516
L.purpureus
85Sr
DN
AC
GTG
TG
TTG
AG
AG
GG
AG
GG
AG
AA
CA
AG
CTC
GTG
GG
AA
GTC
45
AY
049046
L.purpureus
7pD
LL_1
CTTC
ATG
CTA
CTTTTTC
TTC
TG
GG
AC
AA
AC
AC
ATTG
TG
CA
GG
AA
46
AY
049047
L.purpureus
7pD
LT_1
ATG
GTG
GTG
TTA
AA
GG
TG
TG
CTG
CA
AG
GTTC
GTA
GC
AG
AA
GTC
Ref
.3
47
AM
040737
P.sativu
m9
gdcH
_5A
TC
ATTTC
ATTTC
ATTC
TTC
TTG
AG
CC
CA
GTA
TTA
AC
C48
AM
040737
P.sativu
m9
gdcH
_3TTTTG
GA
TG
GA
CTC
AA
GTA
CG
TTTA
TC
ATC
CA
TC
CA
TC
TTC
ATA
G49
AJ2
51536
P.sativu
m9
Cat
hep
sin
TG
TG
ATG
GTG
GG
TATC
CC
GA
ATG
CA
AC
TTC
AA
CC
GG
Ref
.3
50
AF0
77224
V.ungu
iculata
7G
enic
AG
CTG
AA
GC
CG
CC
AC
CA
TAA
GC
AG
CA
GC
CTTA
AA
CTC
ATC
AA
51
X89400
V.ungu
iculata
7G
enic
ATTG
TTA
GG
TTG
CA
GG
ATG
TAG
TG
TG
CC
AC
AG
AG
AA
TTTG
ATA
GA
GG
A52
AF2
79252
V.radiata
7G
enic
AG
CTTC
GC
CA
AC
TC
CTC
CA
TC
AT
TC
ATC
AG
GG
TC
AA
AG
CTC
ATC
AA
T53
AF1
51961
V.radiata
7G
enic
TTC
CG
CC
ATC
AC
CTC
TTC
ATTC
CC
CG
GC
GA
CG
TC
AG
GG
TTC
TTA
54
AF4
02602
P.vu
lgaris
7G
enic
CC
AG
GG
TTC
AG
GTTC
CA
TC
CC
CC
TG
TTG
CA
TAC
TTA
CG
GTC
TC
T55
D13557
V.radiata
7G
enic
GA
AC
GG
ATC
CC
AG
AA
CG
AG
GG
AA
CA
CC
CA
AA
TC
ATC
AA
ATA
A56
AY
189907
P.vu
lgaris
9G
enic
TG
CA
GTG
GG
AG
TATC
AA
GTT
CTG
CA
CC
ATTC
CA
GTC
AC
CC
T57
U85250
V.ungu
iculata
7G
enic
AC
TG
GG
CA
CA
ATTC
CTA
TC
TG
AC
AG
GTG
GC
CA
TC
TTTG
CA
AC
TTTA
GC
58
BQ
481569
P.vu
lgaris
7G
enic
TTTG
TG
TTC
GTC
TG
AG
GC
GTC
TTC
CC
CG
GG
TC
AG
TTC
ATG
TTG
CTA
C59
AB
056453
V.ungu
iculata
7G
enic
ATG
GG
CA
GG
GA
GC
GA
CA
GA
TTTA
TC
AG
TTG
CC
CC
GG
GTG
CTTC
C60
AB
062360
P.lunatus
7G
enic
CC
CTC
GG
CTA
TAG
CA
TTG
AA
GA
CA
CG
CA
TAA
AC
AA
AG
AG
GC
TG
GA
CT
61
CA
901109
P.co
ccineu
s7
Gen
icC
CA
GC
CA
GC
CA
TAC
CC
ATC
TC
TC
GA
CC
CA
CA
TAA
TC
TTTC
AG
GA
62
CA
901635
P.co
ccineu
s7
Gen
icTA
GG
AG
AA
ATG
GG
GTTG
GC
TTG
AA
TAA
AC
TTG
CTC
GG
CG
TG
TAA
TG
AT
63
CA
901660
P.co
ccineu
s7
Gen
icA
AC
GG
GG
TC
CC
AG
ATG
TTG
TTC
TC
TAG
GC
CTTG
TTG
CTC
A64
CA
910054
P.co
ccineu
s7
Gen
icC
CG
CC
GG
CA
AG
AA
AG
TTA
TC
AT
GG
CA
GC
AC
CA
TC
AG
CA
AG
GA
A65
CA
912710
P.co
ccineu
s7
Gen
icG
GTG
GC
TG
TTG
GA
TG
TG
GA
TG
CTG
TG
CC
GC
CA
AG
CA
TTC
C66
CA
909621
P.co
ccineu
s7
Gen
icG
AG
CTTC
CG
TTTC
ATA
CC
ATTA
GC
TTTC
CC
TC
GC
CTTC
AA
ATA
67
D10266-A
V.radiata
7G
enic
TAC
GA
GG
CA
TTTG
GTTTG
AC
AG
TG
AG
CC
GG
TTC
CTC
CA
TTTC
TT
68
CK
151423
V.ungu
iculata
7G
enic
TTTTC
ATG
CG
AC
TAG
TTTA
TC
CTT
AA
CTG
GC
AC
TC
TTTC
TG
GTC
TTA
69
CB
968060
V.ungu
iculata
7G
enic
ATTTC
CG
AG
CTTG
AC
AC
ATT
CA
AA
AC
CA
CC
AA
GC
CA
CA
TTC
70
CA
914593
P.co
ccineu
s7
Gen
icA
GC
TC
CA
GA
TAC
TTG
TTG
TTG
TTC
ATA
TG
GG
GG
TG
AG
GG
TG
AC
G71
CA
906101
P.co
ccineu
s7
Gen
icA
AC
AC
GC
GG
TAC
TAC
GA
AA
TC
CTC
CTC
CG
CG
TC
TC
TG
TC
TC
CTA
CC
TC
72
CA
908729
P.co
ccineu
s7
Gen
icA
TC
CTG
TTTC
GG
TG
CTG
CTTC
TTT
GG
CTTC
CTC
CG
GC
GA
TTC
C73
AF1
65998
V.ungu
iculata
7G
enic
TTTTG
CC
CA
AG
GA
GG
TAG
TTTG
ATTTA
TAA
GTG
GG
TAG
AA
GA
74
U08140
V.radiata
7G
enic
GA
CTTTG
GC
CTC
TC
CG
TTTTC
TTC
ATC
TATA
TG
TC
CC
TTC
AA
TAC
TG
C75
U10419
P.vu
lgaris
9G
enic
TC
CC
AC
GA
TC
TG
TTTG
AG
CC
TG
CA
TTA
GTTTTTG
TTTA
GA
TTG
76
U28645
P.vu
lgaris
7G
enic
GG
GA
AG
CTTG
GG
AG
AA
TAG
TTTTG
GA
TTTC
CC
TG
CTG
GTTTG
GTC
TC
T77
U54703
P.vu
lgaris
7G
enic
TC
GG
TAA
GA
AA
AA
GG
AA
GA
AG
AG
AA
TG
AG
GTG
GC
AG
CA
GG
TG
GTG
78
U70531
P.vu
lgaris
7G
enic
GG
CTG
AA
TTA
CTA
CC
CTC
CG
TG
TC
AG
CA
GC
TC
TTG
TATC
TC
CC
ATTTG
79
U92656
V.ungu
iculata
7G
enic
CG
ATG
AA
GA
TC
CG
CG
AA
AC
TAT
TC
TG
GC
CTC
TG
GA
ATG
TG
TC
80
X53603
P.vu
lgaris
9G
enic
TTG
GC
CC
CA
TTA
AA
ATA
GTG
AC
AC
CTG
GTTG
GG
TG
GG
GTG
CTC
81
U20809
V.radiata
7G
enic
TC
CG
CA
AC
AA
GA
GTG
AA
CA
GG
AC
AG
CA
GC
AA
TATC
TAC
CA
AC
C
S. C. Venkatesha et al.160
Table
2.Continued
Pri
mer
pai
rno.
Sequen
ceID
Spec
ies
of
Ori
gin
Sequen
cecl
assa
Sequen
ceIn
fo.
Sequen
ceFO
RW
AR
D5’to
3’
Sequen
ceR
EVER
SE5’to
3’
82
BQ
481672
P.vu
lgaris
7G
enic
ATTTTTG
GTG
TG
CTTTC
GTTTA
TTC
CG
TG
GC
TTG
CTG
ATTA
G83
CA
900138
P.co
ccineu
s7
Gen
icC
AC
CG
TC
AC
CA
TATTC
TC
TG
CTC
TC
ATTA
GG
CC
GTG
CTG
AC
84
CA
898279
P.co
ccineu
s7
Gen
icC
CG
TAG
GA
TTG
CTG
ATG
AG
GTTC
CG
GTTA
TG
TAA
AA
GA
TG
TC
C85
CA
898807
P.co
ccineu
s7
Gen
icTG
CTG
GTTTTG
CG
GA
GG
TT
CC
CTG
TAG
GC
TTC
CA
TC
ATC
TC
TT
86
CA
898809
P.co
ccineu
s7
Gen
icG
TAC
CC
AG
TC
AC
CA
ATC
ATA
AA
GA
ATC
CC
AA
CA
AC
CA
AG
TC
ATC
AG
A87
CA
899061
P.co
ccineu
s7
Gen
icG
TTC
TC
CC
CA
CC
CTTC
AC
ATC
CA
CG
TTG
CA
GG
CTA
ATA
AA
ATA
AA
88
CA
899306
P.co
ccineu
s7
Gen
icG
AA
GG
GC
TTTG
GA
TG
GTC
TG
GG
AG
TTA
CG
CA
AA
ATA
GG
T89
CA
899524
P.co
ccineu
s7
Gen
icC
TC
TTC
TTC
AG
GC
TC
AC
TC
AC
AC
TTC
GC
GA
TC
GG
AA
TAA
CA
AG
90
AY
193836
V.ungu
iculata
7G
enic
TG
CTA
CG
GC
CA
TC
CA
AC
AC
CA
GC
CA
AC
CA
AC
CTC
CA
CC
AA
C91
CA
901208
P.co
ccineu
s7
Gen
icG
GG
GA
GC
TG
TC
AC
AA
GA
AG
AA
AT
TG
CA
CA
TC
CC
CA
GTC
AA
TA92
CA
902017
P.co
ccineu
s7
Gen
icA
CTTC
AA
GG
AG
ATG
GG
AG
GTTA
TT
TG
TG
TTA
TTG
GTTG
AG
GC
AG
GA
G93
CA
902145
P.co
ccineu
s7
Gen
icTTG
ATG
AC
TTC
CA
CC
GG
TTC
TTA
ATTTC
GC
TATG
GA
GG
CTTC
AA
94
CA
902154
P.co
ccineu
s7
Gen
icA
CA
AG
GC
TG
ATTTA
GG
TTC
TC
CTG
TATC
AG
CG
CG
TC
TTTC
AT
95
CA
906247
P.co
ccineu
s7
Gen
icA
TC
TG
GG
CA
AG
CA
AA
GA
GG
TA
GA
AG
TTC
CC
ATTC
GTA
AG
TTG
TT
96
CA
906300
P.co
ccineu
s7
Gen
icTA
TTA
GA
GG
GA
TTG
AG
TG
GG
ATG
CC
AA
GC
TTC
AA
ATA
TAC
TTC
TTC
AG
G97
BQ
481774
P.vu
lgaris
7G
enic
GA
CG
TC
GTTG
TG
CTC
TC
GG
TTG
GG
TAC
CC
AA
AA
AC
TC
G
Ref
.1W
anget
al.,
2004;
Ref
.2C
hoiet
al.,
2004a;
Ref
.3th
isst
udy,
nucl
eoti
de
dat
abas
ese
arch
.aSe
quen
cecl
ass
des
crip
tion:
1,
cDN
AES
T-der
ived
:co
nta
inin
gan
SSR
port
ion
adja
cent
tobut
not
span
ned
by
the
pri
mer
s.2,
cDN
AES
T-der
ived
:co
nta
inin
gan
SSR
port
ion
that
issp
anned
by
the
pri
mer
s.3,
Gen
om
icD
NA
:kn
ow
nSS
R-
repea
tre
gion
from
oth
erst
udie
s.4,
Gen
om
icD
NA
:SS
Rin
pro
xim
ity
toa
gene
issp
anned
by
the
pri
mer
s,m
arke
rfr
agm
ent
is.
500
bp
upst
ream
of
the
ATG
star
tsi
te.
5,
Gen
om
icD
NA
:C
alyp
sore
troel
emen
tSS
R.
6,
BA
Cge
nom
icD
NA
:en
d-s
equen
ce-t
agge
d.
7,
cDN
AES
T-der
ived
:ai
min
gfo
rin
tron
span
nin
gfr
om
genom
icD
NA
tem
pla
te.
8,
Nucl
ear
DN
A:
rDN
Are
pea
t.9,
Gen
om
icD
NA
:ge
ne
wher
eth
eex
on
and
intr
on
posi
tions
are
know
n,
pri
mer
sam
pli
fyac
ross
anin
tron.
Genetic diversity within Lablab purpureus 161
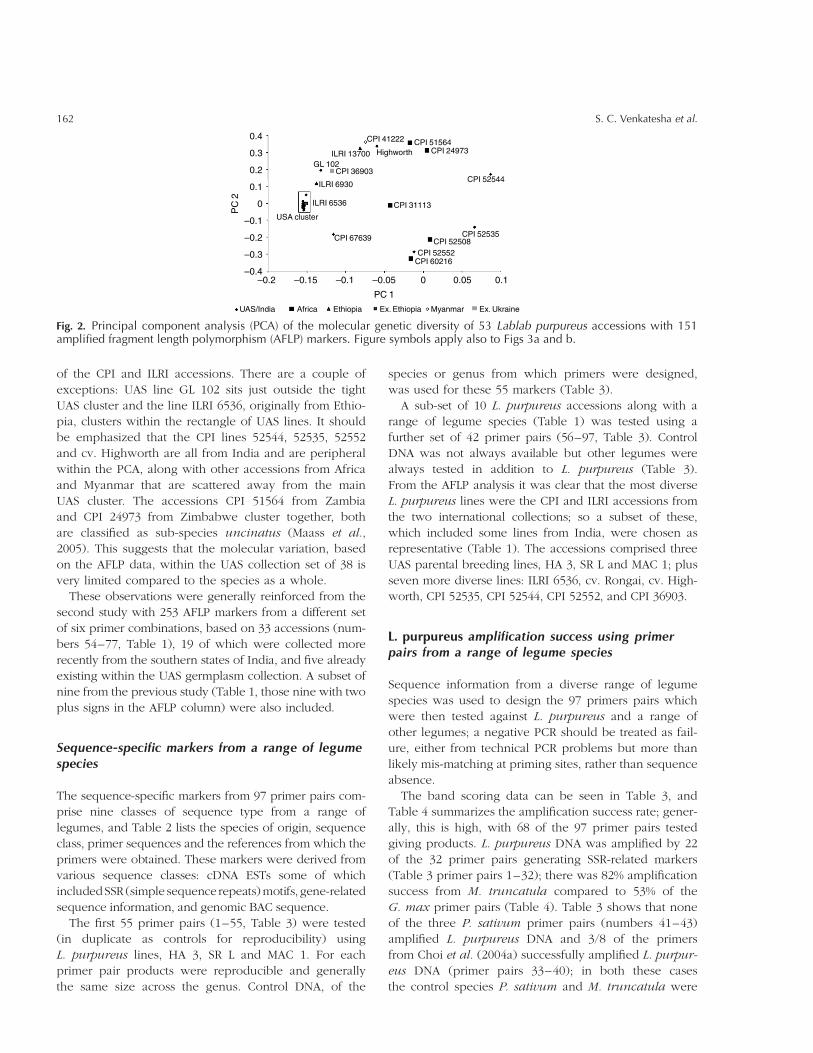
of the CPI and ILRI accessions. There are a couple of
exceptions: UAS line GL 102 sits just outside the tight
UAS cluster and the line ILRI 6536, originally from Ethio-
pia, clusters within the rectangle of UAS lines. It should
be emphasized that the CPI lines 52544, 52535, 52552
and cv. Highworth are all from India and are peripheral
within the PCA, along with other accessions from Africa
and Myanmar that are scattered away from the main
UAS cluster. The accessions CPI 51564 from Zambia
and CPI 24973 from Zimbabwe cluster together, both
are classified as sub-species uncinatus (Maass et al.,
2005). This suggests that the molecular variation, based
on the AFLP data, within the UAS collection set of 38 is
very limited compared to the species as a whole.
These observations were generally reinforced from the
second study with 253 AFLP markers from a different set
of six primer combinations, based on 33 accessions (num-
bers 54–77, Table 1), 19 of which were collected more
recently from the southern states of India, and five already
existing within the UAS germplasm collection. A subset of
nine from the previous study (Table 1, those nine with two
plus signs in the AFLP column) were also included.
Sequence-specific markers from a range of legumespecies
The sequence-specific markers from 97 primer pairs com-
prise nine classes of sequence type from a range of
legumes, and Table 2 lists the species of origin, sequence
class, primer sequences and the references from which the
primers were obtained. These markers were derived from
various sequence classes: cDNA ESTs some of which
includedSSR (simple sequence repeats)motifs, gene-related
sequence information, and genomic BAC sequence.
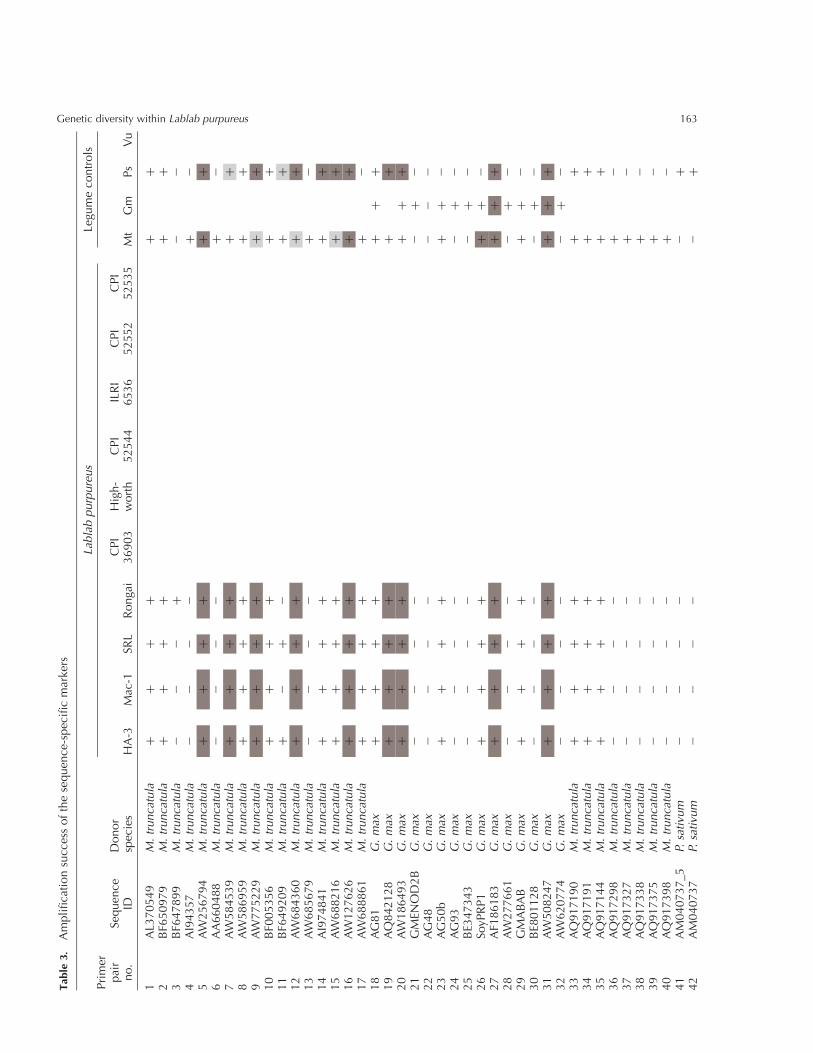
The first 55 primer pairs (1–55, Table 3) were tested
(in duplicate as controls for reproducibility) using
L. purpureus lines, HA 3, SR L and MAC 1. For each
primer pair products were reproducible and generally
the same size across the genus. Control DNA, of the
species or genus from which primers were designed,
was used for these 55 markers (Table 3).
A sub-set of 10 L. purpureus accessions along with a
range of legume species (Table 1) was tested using a
further set of 42 primer pairs (56–97, Table 3). Control
DNA was not always available but other legumes were
always tested in addition to L. purpureus (Table 3).
From the AFLP analysis it was clear that the most diverse
L. purpureus lines were the CPI and ILRI accessions from
the two international collections; so a subset of these,
which included some lines from India, were chosen as
representative (Table 1). The accessions comprised three
UAS parental breeding lines, HA 3, SR L and MAC 1; plus
seven more diverse lines: ILRI 6536, cv. Rongai, cv. High-
worth, CPI 52535, CPI 52544, CPI 52552, and CPI 36903.
L. purpureus amplification success using primerpairs from a range of legume species
Sequence information from a diverse range of legume
species was used to design the 97 primers pairs which
were then tested against L. purpureus and a range of
other legumes; a negative PCR should be treated as fail-
ure, either from technical PCR problems but more than
likely mis-matching at priming sites, rather than sequence
absence.
The band scoring data can be seen in Table 3, and
Table 4 summarizes the amplification success rate; gener-
ally, this is high, with 68 of the 97 primer pairs tested
giving products. L. purpureus DNA was amplified by 22
of the 32 primer pairs generating SSR-related markers
(Table 3 primer pairs 1–32); there was 82% amplification
success from M. truncatula compared to 53% of the
G. max primer pairs (Table 4). Table 3 shows that none
of the three P. sativum primer pairs (numbers 41–43)
amplified L. purpureus DNA and 3/8 of the primers
from Choi et al. (2004a) successfully amplified L. purpur-
eus DNA (primer pairs 33–40); in both these cases
the control species P. sativum and M. truncatula were
Fig. 2. Principal component analysis (PCA) of the molecular genetic diversity of 53 Lablab purpureus accessions with 151amplified fragment length polymorphism (AFLP) markers. Figure symbols apply also to Figs 3a and b.
S. C. Venkatesha et al.162
Table
3.A
mpli
fica
tion
succ
ess
of
the
sequen
ce-s
pec
ific
mar
kers
Pri
mer
pai
rno.
Sequen
ceID
Donor
spec
ies
Lablabpurpureus
Legu
me
contr
ols
HA
-3M
ac-1
SRL
Ronga
iC
PI
36903
Hig
h-
wort
hC
PI
52544
ILR
I6536
CPI
52552
CPI
52535
Mt
Gm
Ps
Vu
1A
L370549
M.trunca
tula
þþ
þþ
þþ
2B
F650979
M.trunca
tula
þþ
þþ
þþ
3B
F647899
M.trunca
tula
22
2þ
22
4A
I94357
M.trunca
tula
22
22
þ2
5A
W256794
M.trunca
tula
þþ
þþ
þþ
6A
A660488
M.trunca
tula
22
22
þ2
7A
W584539
M.trunca
tula
þþ
þþ
þþ
8A
W586959
M.trunca
tula
þþ
þþ
þþ
9A
W775229
M.trunca
tula
þþ
þþ
þþ
10
BF0
05356
M.trunca
tula
þþ
þþ
þþ
11
BF6
49209
M.trunca
tula
þ2
þ2
þþ
12
AW
684360
M.trunca
tula
þþ
þþ
þþ
13
AW
685679
M.trunca
tula
22
22
þ2
14
AI9
74841
M.trunca
tula
þþ
þþ
þþ
15
AW
688216
M.trunca
tula
þþ
þþ
þþ
16
AW
127626
M.trunca
tula
þþ
þþ
þþ
17
AW
688861
M.trunca
tula
þþ
þþ
þ2
18
AG
81
G.max
þþ
þþ
þþ
þ19
AQ
842128
G.max
þþ
þþ
þþ
20
AW
186493
G.max
þþ
þþ
þþ
þ21
GM
ENO
D2B
G.max
22
22
2þ
222
AG
48
G.max
22
22
22
223
AG
50b
G.max
þþ
þþ
þþ
224
AG
93
G.max
22
22
2þ
225
BE3
47343
G.max
22
22
2þ
226
SoyP
RP1
G.max
þþ
þþ
þþ
227
AF1
86183
G.max
þþ
þþ
þþ
þ28
AW
277661
G.max
22
22
2þ
229
GM
AB
AB
G.max
þþ
þþ
þþ
230
BE8
01128
G.max
22
22
2þ
231
AW
508247
G.max
þþ
þþ
þþ
þ32
AW
620774
G.max
22
22
2þ
233
AQ
917190
M.trunca
tula
þþ
þþ
þþ
34
AQ
917191
M.trunca
tula
þþ
þþ
þþ
35
AQ
917144
M.trunca
tula
þþ
þþ
þþ
36
AQ
917298
M.trunca
tula
22
22
þ2
37
AQ
917327
M.trunca
tula
22
22
þ2
38
AQ
917338
M.trunca
tula
22
22
þ2
39
AQ
917375
M.trunca
tula
22
22
þ2
40
AQ
917398
M.trunca
tula
22
22
þ2
41
AM
040737_5
P.sativu
m2
22
22
þ42
AM
040737
P.sativu
m2
22
22
þ
Genetic diversity within Lablab purpureus 163
Table
3.Continued
Pri
mer
pai
rno.
Sequen
ceID
Donor
spec
ies
Lablabpurpureus
Legu
me
contr
ols
HA
-3M
ac-1
SRL
Ronga
iC
PI
36903
Hig
h-
wort
hC
PI
52544
ILR
I6536
CPI
52552
CPI
52535
Mt
Gm
Ps
Vu
43
AJ2
51536_5
P.sativu
m2
22
22
þ44
AB
176566
L.purpureus
22
22
2þ
245
AB
176567
L.purpureus
þþ
þþ
2þ
246
AF0
67417
L.purpureus
þþ
þþ
2þ
247
AY
583516
L.purpureus
þþ
þþ
þþ
þ48
AY
049046
L.purpureus
þþ
þþ
þþ
þ49
AY
049047
L.purpureus
þþ
þþ
þþ
þ50
AF0
77224
V.ungu
iculata
þþ
þþ
þþ
þþ
51
X89400
V.ungu
iculata
þþ
þþ
þþ
þþ
52
AF2
79252
V.radiata
þþ
þþ
þþ
þþ
53
AF1
51961
V.radiata
þþ
þþ
þþ
þþ
54
AF4
02602
P.vu
lgaris
þþ
þþ
þþ
þþ
55
D13557
V.radiata
þþ
þþ
þþ
þþ
56
AY
189907
P.vu
lgaris
þþ
þ2
2þ
22
þþ
þ57
U85250
V.ungu
iculata
22
22
22
22
22
þ58
BQ
481569
P.vu
lgaris
22
22
22
22
22
259
AB
056453
V.ungu
iculata
22
22
22
22
22
260
AB
062360
P.lunatus
þþ
þ2
þþ
þþ
þþ
þ61
CA
901109
P.co
ccineu
s2
22
22
22
22
2þ
62
CA
901635
P.co
ccineu
s2
22
22
22
22
22
63
CA
901660
P.co
ccineu
sþ
þþ
þþ
þþ
þþ
þþ
64
CA
910054
P.co
ccineu
s2
22
22
22
22
22
65
CA
912710
P.co
ccineu
s2
22
22
22
22
22
66
CA
909621
P.co
ccineu
s2
þþ
22
þ2
2þ
þ2
67
D10266
V.radiata
2þ
þþ
þþ
þþ
þþ
þ68
CK
151423
V.ungu
iculata
þþ
þþ
þþ
þþ
þþ
þ
69
CB
968060
V.ungu
iculata
þþ
þþ
þþ
þþ
þþ
þ
70
CA
914593
P.co
ccineu
sþ
þþ
þþ
þþ
þþ
þþ
71
CA
906101
P.co
ccineu
sþ
þþ
þþ
þþ
þþ
þþ
72
CA
908729
P.co
ccineu
sþ
þþ
þþ
þþ
þþ
þþ
73
AF1
65998
V.ungu
iculata
þþ
þþ
þþ
þþ
þþ
þ74
U08140
V.radiata
þþ
þþ
2þ
þþ
þþ
þ75
U10419
P.vu
lgaris
þþ
þþ
2þ
þþ
þþ
þ76
U28645
P.vu
lgaris
þþ
þ2
2þ
2þ
þþ
þ77
U54703
P.vu
lgaris
þþ
þþ
2þ
þ2
þþ
þ78
U70531
P.vu
lgaris
þþ
þ2
2þ
þþ
þ2
þ79
U92656
V.ungu
iculata
22
22
22
22
22
þ80
X53603
P.vu
lgaris
þþ
þþ
þþ
þþ
þþ
þ81
U20809
V.radiata
þþ
þ2
2þ
þþ
þþ
þ82
BQ
481672
P.vu
lgaris
þþ
þ2
2þ
þþ
þþ
þ
S. C. Venkatesha et al.164
Table
3.Continued
Pri
mer
pai
rno.
Sequen
ceID
Donor
spec
ies
Lablabpurpureus
Legu
me
contr
ols
HA
-3M
ac-1
SRL
Ronga
iC
PI
36903
Hig
h-
wort
hC
PI
52544
ILR
I6536
CPI
52552
CPI
52535
Mt
Gm
Ps
Vu
83
CA
900138
P.co
ccineu
s2
22
22
22
22
22
84
CA
898279
P.co
ccineu
sþ
þþ
22
þþ
2þ
þþ
85
CA
898807
P.co
ccineu
sþ
þþ
22
þþ
2þ
þþ
86
CA
898809
P.co
ccineu
sþ
þþ
þþ
þþ
þþ
þþ
87
CA
899061
P.co
ccineu
sþ
þþ
22
þþ
þþ
þþ
88
CA
899306
P.co
ccineu
sþ
þþ
22
þþ
2þ
þþ
89
CA
899524
P.co
ccineu
sþ
þþ
þ2
þþ
þþ
þþ
90
AY
193836
V.ungu
iculata
þþ
þ2
2þ
þ2
þþ
þ91
CA
901208
P.co
ccineu
sþ
þþ
2þ
þþ
þþ
þþ
92
CA
902017
P.co
ccineu
sþ
þþ
þþ
þþ
þþ
þþ
93
CA
902145
P.co
ccineu
sþ
þ2
þ2
þþ
þþ
þþ
94
CA
902154
P.co
ccineu
sþ
þþ
þ2
þþ
þþ
þþ
95
CA
906247
P.co
ccineu
sþ
22
þ2
2þ
þþ
þþ
96
CA
906300
P.co
ccineu
s2
22
22
22
22
2þ
97
BQ
481774
P.vu
lgaris
þþ
þ2
2þ
þþ
þþ
þ
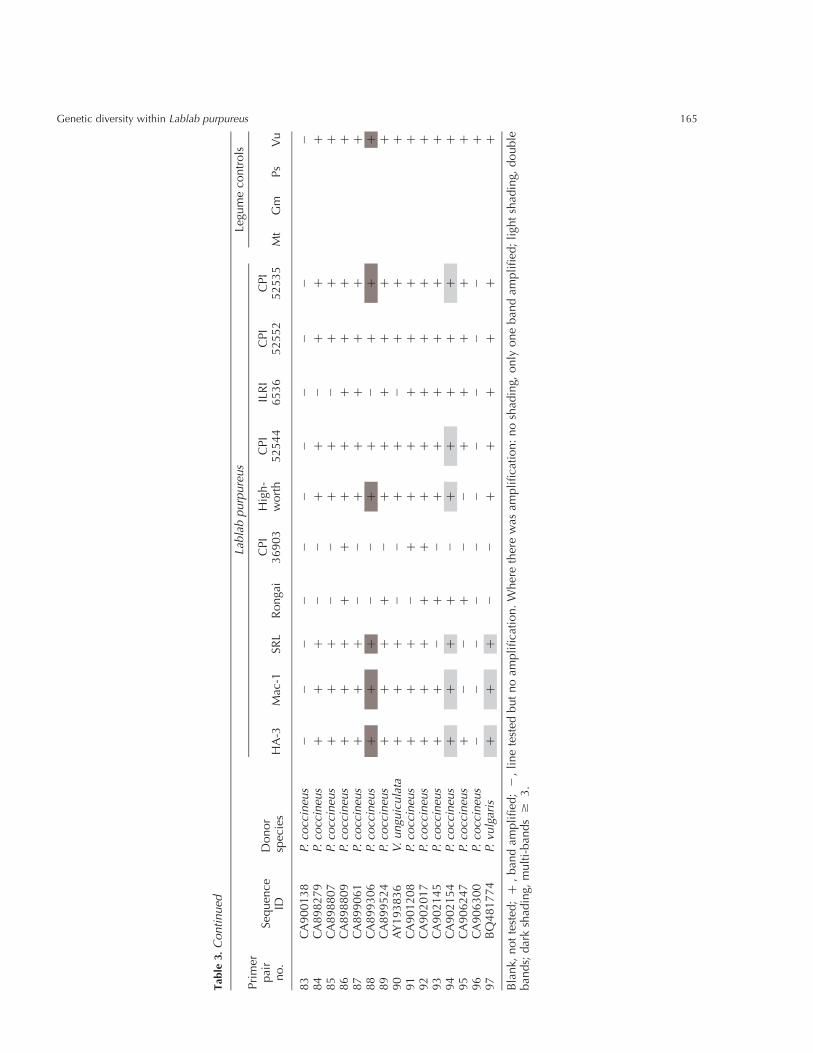
Bla
nk,
not
test
ed;þ
,ban
dam
pli
fied
;2
,li
ne
test
edbut
no
ampli
fica
tion.
Wher
eth
ere
was
ampli
fica
tion:
no
shad
ing,
only
one
ban
dam
pli
fied
;li
ght
shad
ing,
double
ban
ds;
dar
ksh
adin
g,m
ult
i-ban
ds$
3.
Genetic diversity within Lablab purpureus 165
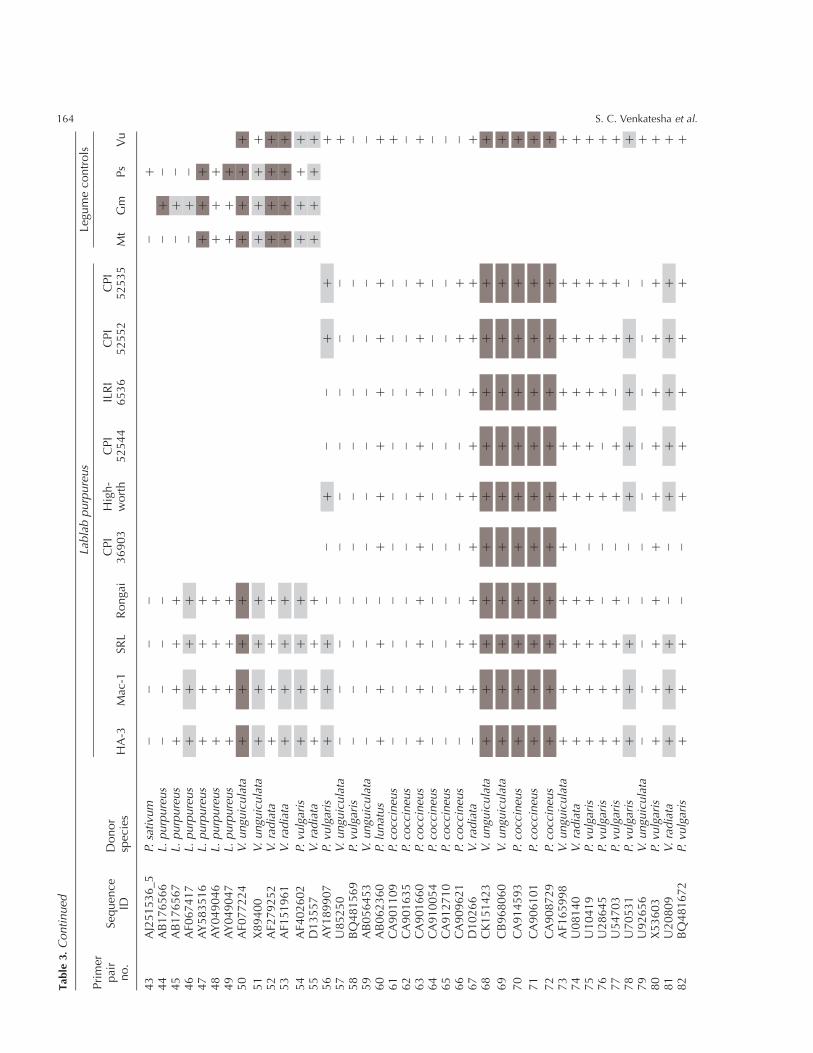
amplified, and the expected band size obtained, with all
the primer pairs tested (Table 3). For the 48 primer pairs
from sequence classes 7 and 9 (Table 2), designed from a
variety of legumes of the Phaseoleae tribe (primer pairs
50–97, Table 3), 79% gave amplification products with
L. purpureus: 48% being single and 17% double band
amplifications (Table 4).
There are only a few L. purpureus sequences in the
nucleotide databases. Of the six L. purpureus primer pairs
tested (44–49, Table 3), four produced a single band, one
a doublet, and one failed to amplify from L. purpureus
DNA. The one failure may have been due to the region
chosen for primer design coinciding with an exon/intron
boundary, and this may also explain some of the failed
amplifications from other primer sets. Amplification of
G. max using the set of six L. purpureus-derived primer
pairs resulted in two cases each of single, doublet or
multi-band patterns (Table 3); four of the six gave either
the same size band on 1.5% agarose or a reasonably
strong band of a similar size as L. purpureus. This corre-
sponds to 67% of L. purpureus primer sequences able to
amplify G. max. Similarly, in the other two species where
a single band of the same size was produced, as assessed
on 1.5% agarose, 33% of L. purpureus primer pairs ampli-
fiedM. truncatula (48 and 49, Table 3) and 17% amplified
P. sativum (48, Table 3). The L. purpureusDNA primer pair
47 (Table 3) amplified a fragment that corresponds to 5.8S
rRNA sequence flanked by internal spacer sequences, and
produced a multiple band pattern from the three other
legumes tested (Table 3).
One assumption from scoring the agarose gels was that
similar band sizes across those legumes tested were
amplifications from orthologous genomic sequences.
Where there was amplification with L. purpureus DNA
(Table 4) 43/68 (63%) primer pairs produced a single
band and each of these was regarded as allelic to the
others. From examination of 1.5% agarose gels, in 25 of
the 43 cases the amplification product was the same
band size with at least one of the other legumes tested.
Double bands were found in 9 of the 68 and in three
cases this doublet was shared with at least one other
legume (Table 4). Sixteen primer pairs gave a multi-
band pattern (Table 4) and in all cases the L. purpureus
pattern was generally identical but on occasion a band
was sometimes missing/gained from one or other of the
four lines tested. The multi-band pattern generated with
L. purpureus was never the same as any of the other
legumes. This suggests a degree of non-specific amplifi-
cation and any polymorphic marker from this type of
reaction is much like a RAPD (Williams et al., 1990).
In one case the G. max AF186183 (number 27, Table 3)
primer pair gave a multi-band/smear pattern over the
size 150–500 bp range in L. purpureus, M. truncatula,
P. sativum and G. max. From the database, AF186183
contains sequence related to (but incomplete) the
Calypso-2-1 retroelement (normally c. 11 kb) found in
abundance in G. max (Wright and Voytas, 2002). This
primer pair spans a region within the polyprotein of
Calypso; the smear very likely comes about from the
repetitive nature of the retroelement amplified from
AF186183, so generating many copies. This sequence
information could be adapted to obtain SSAP (sequence
specific amplified polymorphism) markers (Ellis et al.,
1998) as a valuable addition to molecular marker types
transferable between legumes.
Polymorphism within L. purpureus from sequence-specific markers
Single or a few base changes would not be obvious from
1.5% agarose and further testing using more stringent con-
ditions (3% agarose), the use of PAGE or SSCP (single
strand conformational polymorphism), or sequencing
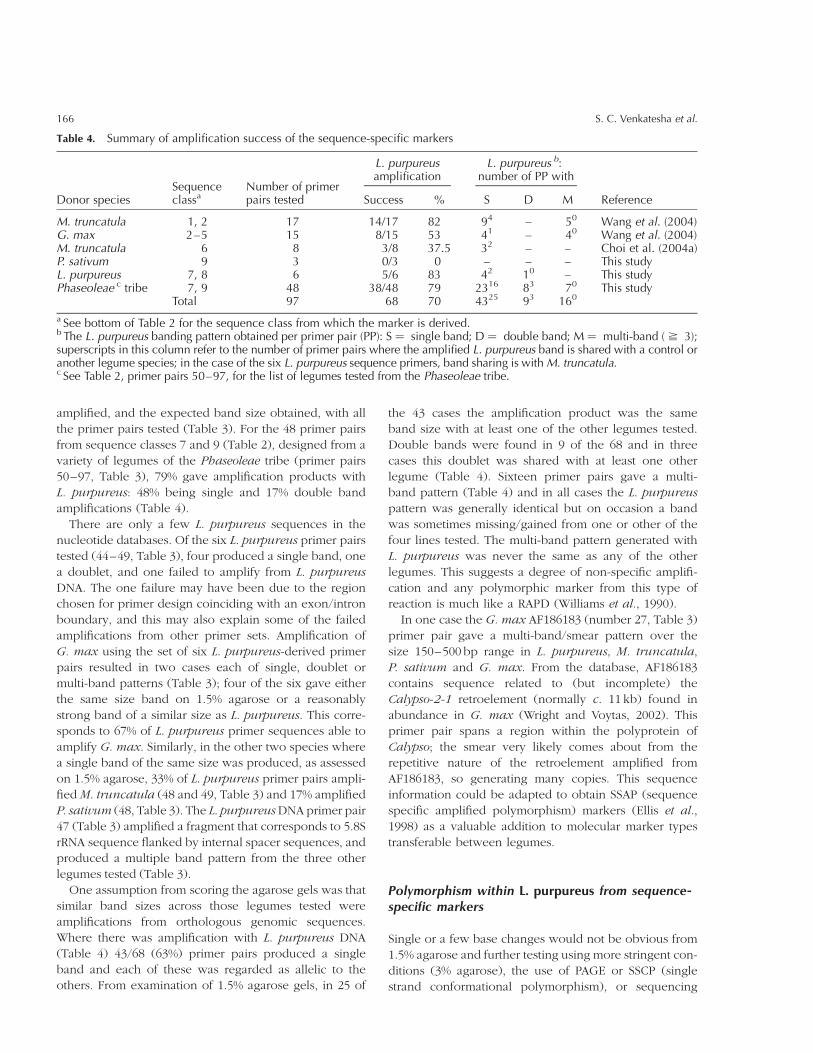
Table 4. Summary of amplification success of the sequence-specific markers
Sequenceclassa
Number of primerpairs tested
L. purpureusamplification
L. purpureus b:number of PP with
Donor species Success % S D M Reference
M. truncatula 1, 2 17 14/17 82 94 – 50 Wang et al. (2004)G. max 2–5 15 8/15 53 41 – 40 Wang et al. (2004)M. truncatula 6 8 3/8 37.5 32 – – Choi et al. (2004a)P. sativum 9 3 0/3 0 – – – This studyL. purpureus 7, 8 6 5/6 83 42 10 – This studyPhaseoleae c tribe 7, 9 48 38/48 79 2316 83 70 This study
Total 97 68 70 4325 93 160
a See bottom of Table 2 for the sequence class from which the marker is derived.b The L. purpureus banding pattern obtained per primer pair (PP): S ¼ single band; D ¼ double band; M ¼ multi-band ( ^ 3);superscripts in this column refer to the number of primer pairs where the amplified L. purpureus band is shared with a control oranother legume species; in the case of the six L. purpureus sequence primers, band sharing is with M. truncatula.c See Table 2, primer pairs 50–97, for the list of legumes tested from the Phaseoleae tribe.
S. C. Venkatesha et al.166
would be required to resolve polymorphisms. Where a
single band only was amplified with L. purpureus and
that was also shared with the control legume or another
legume, i.e. the same size assessed on agarose (Table 3),
about one-third (5/13, Table 4) were from primer pairs
generating SSR-containing markers (sequence classes
1–4, Table 2) compared to two-thirds (20/30, Table 4)
from the non-SSR containing EST and genomic DNA
sources (sequence classes 6–9, Table 2).
From the primer pairs that did amplify L. purpureusDNA
(Table 3) there were no obvious polymorphic differences,
i.e. no co-dominant markers, between the three L. purpur-
eus parental lines, HA 3, MAC 1 and SR L used in crosses
for breeding purposes, and cv. Rongai on agarose gels
(primer pairs 1–55). However, there were a few cases
within the primer pairs 56–97where at least one L. purpur-
eus failed to amplify (Table 3), this could be technical fail-
ure of PCR but these were consistent observations. These
dominant polymorphisms correspond to mismatch at the
primer binding sites, in which case SNPs or length variants
could be pursued as markers. Some of the successful
primer combinations gave a multi-band pattern with
L. purpureus and a number have been tested on PAGE
and visualized using silver stain. There were few poly-
morphic differences, but these also appear to be dominant
markers: much like those generated using AFLP. The five
L. purpureus specific primers (Table 3, 45–49) that
successfully amplified were tested using both 1.5% and
3% agarose; all band sizes were identical in the four lines.
Diversity of L. purpureus in relation to cowpea as anoutgroup
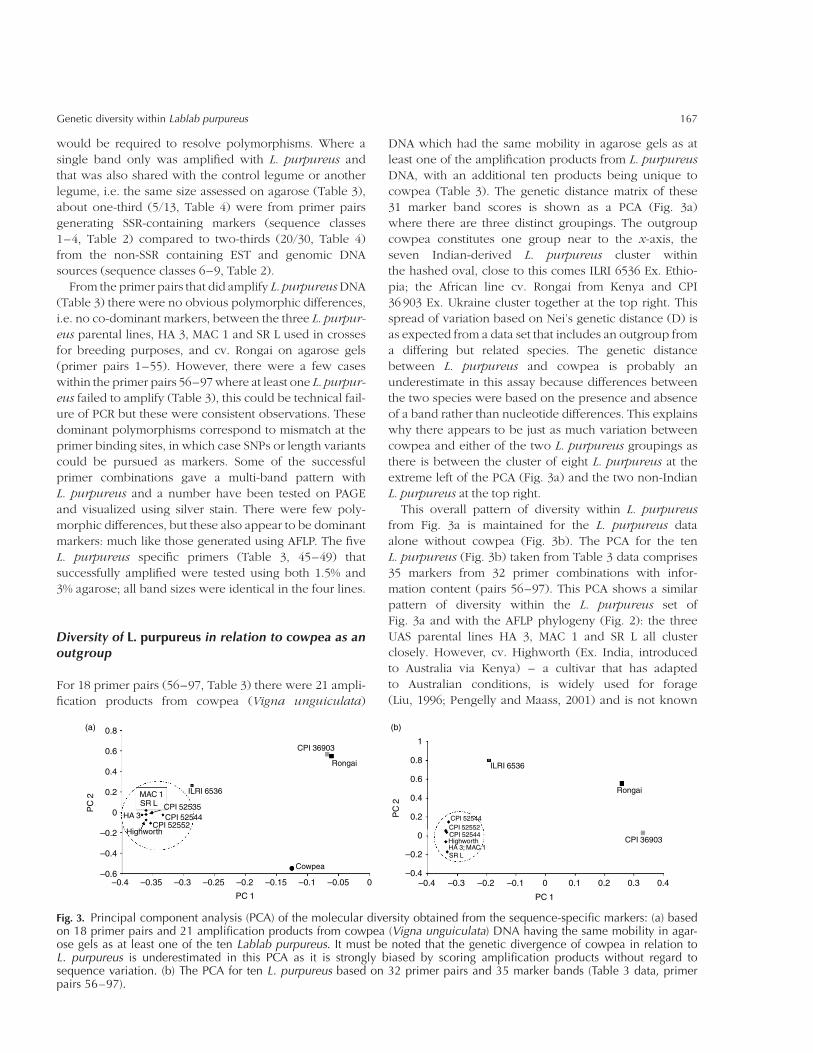
For 18 primer pairs (56–97, Table 3) there were 21 ampli-
fication products from cowpea (Vigna unguiculata)
DNA which had the same mobility in agarose gels as at
least one of the amplification products from L. purpureus
DNA, with an additional ten products being unique to
cowpea (Table 3). The genetic distance matrix of these
31 marker band scores is shown as a PCA (Fig. 3a)
where there are three distinct groupings. The outgroup
cowpea constitutes one group near to the x-axis, the
seven Indian-derived L. purpureus cluster within
the hashed oval, close to this comes ILRI 6536 Ex. Ethio-
pia; the African line cv. Rongai from Kenya and CPI
36 903 Ex. Ukraine cluster together at the top right. This
spread of variation based on Nei’s genetic distance (D) is
as expected from a data set that includes an outgroup from
a differing but related species. The genetic distance
between L. purpureus and cowpea is probably an
underestimate in this assay because differences between
the two species were based on the presence and absence
of a band rather than nucleotide differences. This explains
why there appears to be just as much variation between
cowpea and either of the two L. purpureus groupings as
there is between the cluster of eight L. purpureus at the
extreme left of the PCA (Fig. 3a) and the two non-Indian
L. purpureus at the top right.
This overall pattern of diversity within L. purpureus
from Fig. 3a is maintained for the L. purpureus data
alone without cowpea (Fig. 3b). The PCA for the ten
L. purpureus (Fig. 3b) taken from Table 3 data comprises
35 markers from 32 primer combinations with infor-
mation content (pairs 56–97). This PCA shows a similar
pattern of diversity within the L. purpureus set of
Fig. 3a and with the AFLP phylogeny (Fig. 2): the three
UAS parental lines HA 3, MAC 1 and SR L all cluster
closely. However, cv. Highworth (Ex. India, introduced
to Australia via Kenya) – a cultivar that has adapted
to Australian conditions, is widely used for forage
(Liu, 1996; Pengelly and Maass, 2001) and is not known
Fig. 3. Principal component analysis (PCA) of the molecular diversity obtained from the sequence-specific markers: (a) basedon 18 primer pairs and 21 amplification products from cowpea (Vigna unguiculata) DNA having the same mobility in agar-ose gels as at least one of the ten Lablab purpureus. It must be noted that the genetic divergence of cowpea in relation toL. purpureus is underestimated in this PCA as it is strongly biased by scoring amplification products without regard tosequence variation. (b) The PCA for ten L. purpureus based on 32 primer pairs and 35 marker bands (Table 3 data, primerpairs 56–97).
Genetic diversity within Lablab purpureus 167
to be cultivated in India – clusters very closely with
the UAS lines in this sequence-specific marker analysis,
compared to more distantly in the AFLP analysis (Fig. 2).
The three other Indian accessions, CPI lines 52535, 52552
and 52544 cluster in this Indian section of the plot
(Fig. 3b). The Ex. Ethiopian line ILRI 6536 tends to be
consistently within or just peripheral to the major L. pur-
pureus cluster in all the tests (Figs 2 and 3a, b); in contrast,
the Ex. Ukraine line CPI 36 903 tends to be distant to the
Indian accessions. The three UAS parental breeding lines,
SR L, HA 3 and MAC 1, always cluster tightly together
regardless of the marker assay.
Discussion
AFLP and sequence-specific markers: generaloverview
Two marker types were used in this study, AFLP and
sequence-specific markers. These different approaches
address variation in different components of the genome,
so differences in their behaviour may be informative.
Many plant phylogenetic studies have been carried out
using AFLP (Mba and Tohme, 2005), and this marker
method provides a rapid and reproducible banding pat-
tern that gives an indication of relatedness and diversity
within a species. The AFLP marker analysis provides geno-
typically distinct groupings within related species; mol-
ecular data from this type of marker are described by
Karp et al. (1996) as ‘arbitrary indicators of diversity’.
AFLP, however, is not the ideal marker for diversity ana-
lyses, mostly because AFLP polymorphic bands are gen-
erally dominant markers; where for each marker only
one allele is apparent. Also, co-migration of coincident
rather than allelic bands may introduce errors; these dif-
ficulties have not deterred its use in phylogenetics (Karp
et al., 1996; Mba and Tohme, 2005).
Many of the markers from the 97 sequence-specific
primer pairs (Table 2), on the other hand, are from
coding regions of known conserved genes. When gene-
related markers are co-dominant they indicate allelic
variation providing information not unlike RFLPs. As they
generally represent conserved coding regions, gene-
related markers are transferable within and between
species and genus (Karp et al., 1996); when mis-matching
at the priming site occurs, these will be dominant markers.
Diversity analysis of L. purpureus from the twomarker types
All of the genera studied here are within the Papilionoi-
deae sub-family that contains most of the cultivated crop
legumes (Young et al., 2003). L. purpureus along with
Vigna spp. and Phaseolus spp. are in the Phaseoleae
tribe (Lackey, 1981), a member of the Millettoid clade
(Cronk et al., 2006). This clade also includes the sub-
tribe Glycinineae, of which G. max is a member
(Lackey, 1981). Pea, which is within the Vicieae tribe, and
Medicago within the Trifolieae tribe (Doyle, 1995; Wojcie-
chowski, 2003), are members of the Galegoid clade
(Cronk et al., 2006). In this study sequence-specific markers
from species representing the three tribes, Phaseoleae
(including sub-tribe Glycinineae), Vicieae and Trifolieae
were tested for L. purpureus DNA amplification.
Assessments of relatedness within a species would be
expected to have broad agreement of groupings no
matter which marker type is employed, provided it is
reliable and reproducible. In fact, the two marker types,
AFLP and sequence-specific, used in this diversity anal-
ysis resulted in broad agreement even though differing
genomic regions were examined and fewer L. purpureus
accessions were tested with the gene-related markers.
The diversity analysis using AFLP markers clearly
showed that there was limited genetic variation within
the UAS and locally collected L. purpureus germplasm
from the southern states of India compared to the
genus as a whole. Limited genetic diversity at the molecu-
lar level is not uncommon within some germplasm stocks
of legumes (chickpea: Udupa et al., 1993; Winter et al.,
2000; pigeonpea: Rao et al., 2003; peanut: Kochert et al.,
1996). However, the AFLP did manage to distinguish
between Indian cultivars and breeding stock held
within the UAS collection, and the other Indian acces-
sions held within the Australian (ATCGRC) collection
(Fig. 2: accessions CPI 52544, CPI 52535, CPI 52552).
But the sequence-specific primer pairs failed to do this
(Fig. 3b), all seven Indian accessions that comprised
UAS and CPI/ILRI lines, clustered together with this
marker type.
In both diversity analyses the non-Indian accessions
were more distinct (Figs 2 and 3a, b), and this was
quite marked, but dependent on the markers used to
score the data – see differences between Figs 3a and
3b for cv. Rongai and CPI 36903. Compared to AFLP,
the sequence-specific marker type seems to be assessing
diversity within more conserved regions of the genome.
Apart from the commonly cultivated accessions, more
genetically diverse lines within L. purpureus species do
exist and are available for integration of exotic alleles.
Amplification success of sequence-specific markersfrom a range of legume species
The sharing of markers within the legumes for compara-
tive and quantitative trait loci (QTL) mapping have been
S. C. Venkatesha et al.168
documented (Young et al., 2003; Zhu et al., 2005) and
considerable conservation and synteny between model
and crop genomes have been found (Young et al.,
2003; Choi et al., 2004b; Kalo et al., 2004; Zhu et al.,
2005). In QTL-mapping, RFLP markers within the QTL
regions, conferring the greatest effect on seed weight,
in both cowpea and mungbean, had the same order
(Fatokun et al., 1992). In a further QTL analysis, an
orthologous seed weight gene of soybean was found
to be shared with cowpea and mungbean (Maughan
et al., 1996). Similarly, Timmerman-Vaughan et al.
(1996) found the genomic regions containing seed
weight QTLs in cowpea, mungbean and pea, to be
highly conserved. Together these three studies suggest
conservation of orthologous genes within these four
species for the polygenic seed weight trait. RFLP
linkage mapping showed mungbean and common
bean (P. vulgaris) to have a high degree of synteny com-
pared to either of these two species with soybean
(Boutin et al., 1995). A study of co-linearity between
mungbean and L. purpureus (Humphry et al., 2002),
using a common set of 65 RFLP, showed there was a
high degree of conservation in marker order across 10
of the 11 linkage groups of mungbean, corresponding
to 15 L. purpureus groups.
This study centred on L. purpureus diversity, and the
potential use of sequence-specific markers from species
related to L. purpureus. The results suggest that there is
a good source of legume-related sequences in databases
readily available for L. purpureus diversity and genome
analysis. The data presented here also agree with recent
primer transferability studies involving L. purpureus
(Wang et al., 2004). The transferability of EST-based
SSR markers from M. truncatula to G. max was 55%,
compared to 28% the other way round. Wang et al.
(2004) attributed this to the twofold genome size differ-
ence between these species, which are distantly related
and are within differing legume tribes (Doyle, 1995).
Similarly, in our study, 67% of L. purpureus primer
pairs amplified G. max compared to 53% in the other
direction. The G. max genome is substantially duplicated
(Young et al., 2003), and it is thought that it has under-
gone considerable rearrangement during its diploidiza-
tion from an ancient polyploid (Boutin et al., 1995).
These factors, coupled with the degree of relatedness
and genome size differences, may explain the lower
amplification rate of G. max sequence-specific primer
pairs to Medicago and L. purpureus.
In this study, 82% of M. truncatula and 53% of G. max
(Table 4) amplified L. purpureus. The figure of 82% ampli-
fication success is biased, as the 17 Medicago EST-based
SSR primer pairs (Table 4) tested in this study were
chosen at the suggestion of the authors of the Wang et al.
(2004) paper and known to previously amplify
L. purpureus. Amplification of L. purpureus from 3/8
(37.5%) primer pairs (all M. truncatula sequences) from
Choi et al. (2004a), gives a figure consistent with the 36%
reported byWang et al. (2004). This degree of amplification
success using heterologous primer pairs is also in
agreement with other studies using genic SSRs from
M. truncatula, the success rates for amplification of pea,
faba bean and chickpea were 37.6%, 40% and 36.6%,
respectively (Gutierrez et al., 2005).
The same set of 15 G. max primers was used in both
this study and that of Wang et al. (2004). In this
study 53% of G. max primer pairs amplified L. purpureus
(Table 4) compared to 23% in Wang et al. (2004);
single bands were amplified in 26.5% (4/15, Table 4) of
cases – more in keeping with the Wang et al. (2004)
result – and 26.5% gave multiple bands; there were no
cases of double bands (Table 4).
The P. sativum primers failed in L. purpureus. These
plants are from distantly related genera and differ mark-
edly in genome size, so this lack of success with a
small sample of primers is not surprising, given the suc-
cess rate of the Medicago primers. Though L. purpureus
and M. truncatula are from different tribes, their haploid
genome size is similar, 3.68 £ 108 and 4.66 £ 108 bp,
respectively (http://www.rbgkew.org.uk/cval).
The 48 sequence-specific primer pairs 50–97 (Table 3)
successfully generated amplification products from L.
purpureus in 79% of cases, with 65% being single/
double band amplifications: the donor species were
Vigna unguiculata, V. radiata, Phaseolus vulgaris, P.
lunatus and P. coccineus (Table 3). All of these species
have genomes of a similar size (c. 5 £ 108–8 £ 108 bp;
http://www.rbgkew.org.uk/cval) and all are relatively
closely related within the Phaseoleae tribe. This high
rate of amplification success between L. purpureus and
these closely related species is of a similar order to that
found by Eujayl et al. (2004) where 74% of EST-derived
SSR primer pairs from M. truncatula gave amplification
of the expected band size in at least one other Medicago
species.
The amplification success of the six sequence-specific
markers from L. purpureus to G. max, M. truncatula
and P. sativum was 67%, 33% and 17%, based on single
band amplification.
Molecular marker analyses, genotyping and phenotyp-
ing of germplasm, together with the incorporation of
exotic and underutilized germplasm into breeding pro-
grammes, offers new potential for enhancing desired
traits in breeding programmes. In this study we have
shown that molecular markers can be used successfully
to understand the genetic structure of the germplasm of
L. purpureus, and identified a series of sequence-specific
markers that potentially could be used in L. purpureus
genetic mapping analyses.
Genetic diversity within Lablab purpureus 169

Acknowledgements
The authors thank the participants of the 2003 course, Mol-
ecular Marker Techniques for Crop Improvement, who
obtained the AFLP data for the diversity analysis and
whose names can be found at: http://www.
kirkhousetrust.org/projects/2003_10_Bangalore/course_-
participants.
We thank: B. Pengelly, B. Maass and R. Koebner for their
active participation during the 2003 course; B. Maass for
helpful comments on this manuscript; M. L. Wang for
useful information regarding primer choice for part of the
sequence-specific analysis; theKirkhouse Trust for funding
the project with collaboration from the John Innes Centre,
which is supported by a grant in aid from the Biotechnol-
ogy and Biological Sciences Research Council, UK; and
the University of Agricultural Sciences, Bangalore. N. Ellis
acknowledges the support of FP6 EU project, Grain
Legumes (FOOD-CT-2004-506223).
References
Basavarajappa PS and Byre Gowda M (2000) Genetic divergenceamong field bean (Lablab purpureus L. Sweet) cultivars ofSouthern Karnataka. Indian Journal of Plant GeneticResources 13: 134–137.
Bassam BJ and Caetano-Anolles G (1993) Silver staining of DNAin polyacrylamide gels. Applied Biochemistry and Biotech-nology 42: 181–188.
Boutin SR, Young ND, Olson TC, Yu ZH, Shoemaker RC and Val-lejos CE (1995) Genome conservation among 3 legumegenera detected with DNA markers. Genome 38: 928–937.
Champ MM-J, Anderson JW and Bach-Knudsen K-E (eds) (2002)Pulses and human health. British Journal of Nutrition 88(Suppl 3): S237–S319.
Choi H-K, Kim D, Uhm T, Limpens E, Lim H, Mun J-H, Kalo P,Penmetsa RV, Seres A, Kulikova O, Roe BA, Bisseling T,Kiss GB and Cook DR (2004a) A sequence-based geneticmap of Medicago truncatula and comparison of markercolinearity with M. sativa. Genetics 166: 1463–1502.
Choi H-K, Mun J-H, Kim D-J, Zhu H, Baek J-M, Mudge J, Roe B,Ellis N, Doyle J, Kiss GB, Young ND and Cook DR (2004b)Estimating genome conservation between crop and modellegume species. Proceedings of the National Academy ofSciences, USA 101: 15289–15294.
Cronk Q, Ojeda I and Pennington RT (2006) Legume compara-tive genomics: progress in phylogenetics and phyloge-nomics. Current Opinion in Plant Biology 9: 99–103.
Doyle JJ (1995) DNA data and legume phylogeny: a progressreport. In: Crisp M and Doyle JJ (eds) Advances inLegume Systematics 7: Phylogeny. London: Royal BotanicGardens, Kew, pp. 11–30.
Ellis THN, Davies DR, Castleton JA and Bedford ID (1984) Theorganization and genetics of rDNA length variants inpeas. Chromosoma 91: 74–81.
Ellis THN, Poyser SJ, Knox MR, Vershinin AV and Ambrose MJ(1998) Polymorphism of insertion sites of Ty1-copia classretrotransposons and its use for linkage and diversity anal-ysis in pea. Molecular and General Genetics 260: 9–19.
Eujayl I, Sledge MK, Wang L, May GD, Chekhovskiy K, Zwonit-zer JC and Mian MAR (2004) Medicago truncatula EST-SSRsreveal cross-species genetic markers for Medicago spp.Theoretical and Applied Genetics 108: 414–422.
Fatokun CA, Menanciohautea DI, Danesh D and Young ND (1992)Evidence for orthologous seed weight genes in cowpea andmung bean based on RFLP mapping. Genetics 132: 841–846.
Graham PH and Vance CP (2003) Legumes: importance andconstraints to greater use. Plant Physiology 131: 872–877.
Gur A and Zamir D (2004) Unused natural variation can lift yieldbarriers in plant breeding. PLoS Biology 2: 1610–1615.
Gutierrez MV, Patto MCV, Huguet T, Cubero JI, Moreno MT andTorres AM (2005) Cross-species amplification of Medicagotruncatula microsatellites across three major pulse crops.Theoretical and Applied Genetics 110: 1210–1217.
Humphry ME, Konduri V, Lambrides CJ, Magner T, McIntyre CL,Aitken EAB and Liu CJ (2002) Development of a mungbean(Vigna radiata) RFLP linkage map and its comparison withlablab (Lablab purpureus) reveals a high level of colinear-ity between the two genomes. Theoretical and AppliedGenetics 105: 160–166.
Kalo P, Seres A, Taylor SA, Jakab J, Kevei Z, Kereszt A, Endre G,Ellis THN and Kiss GB (2004) Comparative mappingbetween Medicago sativa and Pisum sativum. MolecularGenetics and Genomics 272: 235–246.
Karp A, Seberg O and Buiatti M (1996) Molecular techniques inthe assessment of botanical diversity. Annals of Botany 78:143–149.
Kochert G, Halward T and Stalker HT (1996) Genetic variationin peanut and its implications in plant breeding. In: Pick-ersgill B and Lock JM (eds) Advances in Legume Systema-tics 8: Legumes of Economic Importance. London: RoyalBotanic Gardens, Kew, pp. 19–30.
Lackey JA (1981) Tribe 10. Phaseoleae DC. In: Polhill RM andRaven PH (eds) Advances in Legume Systematics, Part 1.London: Royal Botanic Gardens, Kew, pp. 301–306.
Ladizinsky G (1998) Plant Evolution under Domestication.London: Kluwer Academic Publishers.
Liu CJ (1996) Genetic diversity and relationships among Lablabpurpureus genotypes evaluated using RAPD as markers.Euphytica 90: 115–119.
Lu J, Knox MR, Ambrose MJ, Brown JKM and Ellis THN (1996)Comparative analysis of genetic diversity in pea assessedby RFLP- and PCR-based methods. Theoretical and AppliedGenetics 93: 1103–1111.
Maass BL (2006) Changes in seedmorphology, dormancy and ger-mination from wild to cultivated hyacinth bean germplasm(Lablab purpureus: Papilionoideae). Genetic Resources andCrop Evolution 53: 1127–1135.
Maass BL, Jamnadass RH, Hanson J and Pengelly BC (2005)Determining sources of diversity in cultivated and wildLablab purpureus related to provenance of germplasm byusing amplified fragment length polymorphism. GeneticResources and Crop Evolution 52: 683–695.
Mahadevu P and Byre Gowda M (2005) Genetic improvement ofDolichos bean (Lablab purpureus (L.) Sweet) through useof exotic and indigenous germplasm. Indian Journal ofPlant Genetic Resources 18: 47–48.
Maughan PJ, Maroof MAS and Buss GR (1996) Molecular-markeranalysis of seed weight: genomic locations, gene action, andevidence for orthologous evolution among three legumespecies. Theoretical and Applied Genetics 93: 574–579.
Mba C and Tohme J (2005) Use of AFLP markers in surveys ofplant diversity. Methods in Enzymology 395: 177–201.
S. C. Venkatesha et al.170
Murphy AM and Colucci PE (1999) A tropical forage solution topoor quality ruminant diets: a review of Lablab purpureus.Livestock Research for Rural Development 11: 1–17.
Palmer JD, Jorgensen RA and Thompson WF (1985) ChloroplastDNA variation and evolution in Pisum – patterns of changeand phylogenetic analysis. Genetics 109: 195–213.
Pengelly BC and Maass BL (2001) Lablab purpureus (L.) Sweet –diversity, potential use and determination of a core collec-tion of this multi-purpose tropical legume. GeneticResources and Crop Evolution 48: 261–272.
Rao NK, Reddy LJ and Bramel PJ (2003) Potential of wild speciesfor genetic enhancement of some semi-arid food crops.Genetic Resources and Crop Evolution 50: 707–721.
Timmerman-Vaughan GM, McCallum JA, Frew TJ, Weeden NFand Russell AC (1996) Linkage mapping of quantitative traitloci controlling seedweight in pea (Pisum sativum L). Theor-etical and Applied Genetics 93: 431–439.
Udupa SM, Sharma A, Sharma RP and Pai RA (1993) Narrowgenetic variability in Cicer arietinum L. as revealed byRFLP analysis. Journal of Plant Biochemistry and Biotech-nology 2: 83–86.
Vos P, Hogers R, Bleeker M, Reijans M, Vandelee T, Hornes M,Frijters A, Pot J, Peleman J, Kuiper M and Zabeau M(1995) AFLP – a new technique for DNA fingerprinting.Nucleic Acids Research 23: 4407–4414.
Wang ML, Gillaspie AG, Newman ML, Dean RE, Pittman RN,Morris JB and Pederson GA (2004) Transfer of simplesequence repeat (SSR) markers across the legume family
for germplasm characterization and evaluation. Plant Gen-etic Resources 2: 107–119.
Williams JGK, Kubelik AR, Livak KJ, Rafalski JA and Tingey SV(1990) DNA polymorphisms amplified by arbitrary primersare useful as genetic markers. Nucleic Acids Research 18:6531–6535.
Winter P, Benko-Iseppon AM, Huttel B, Ratnaparkhe M, Tullu A,Sonnante G, Pfaff T, Tekeoglu M, Santra D, Sant VJ, RajeshPN, Kahl G and Muehlbauer FJ (2000) A linkage map of thechickpea (Cicer arietinum L.) genome based on recombi-nant inbred lines from a C. arietinum £ C. reticulatumcross: localization of resistance genes for fusarium wiltraces 4 and 5. Theoretical and Applied Genetics 101:1155–1163.
Wojciechowski MF (2003) Reconstructing the phylogeny oflegumes (Leguminosae): an early 21st century perspective.In: Klitgaard BB and Bruneau A (eds) Advances in LegumeSystematics, Part 10, Higher Level Systematics. London:Royal Botanic Gardens, Kew, pp. 5–35.
Wright DA and Voytas DF (2002) Athila4 of Arabidopsis andCalypso of soybean define a lineage of endogenous plantretroviruses. Genome Research 12: 122–131.
Young ND, Mudge J and Ellis THN (2003) Legume genomes:more than peas in a pod. Current Opinion in Plant Biology6: 199–204.
Zhu HY, Choi HK, Cook DR and Shoemaker RC (2005) Bridgingmodel and crop legumes through comparative genomics.Plant Physiology 137: 1189–1196.
Genetic diversity within Lablab purpureus 171