Dismounting, conserving, displaying ships (con P. Puma, E. Remotti, 2009)
Journal of Mammalogy, 93(4):989–1000, 2012
Genetic diversity, population structure, and movements of mountainlions (Puma concolor) in Texas
JOSEPH D. HOLBROOK,* RANDY W. DEYOUNG, JAN E. JANECKA, MICHAEL E. TEWES, RODNEY L. HONEYCUTT, AND
JOHN H. YOUNG
Caesar Kleberg Wildlife Research Institute, Texas A&M University–Kingsville, Kingsville, TX 78363, USA (JDH, RWD,MET)Department of Veterinary Integrative Biosciences, College of Veterinary Medicine and Biomedical Sciences, Texas A&MUniversity, College Station, TX 77843, USA (JEJ)Natural Science Division, Pepperdine University, Malibu, CA 90263, USA (RLH)Texas Parks and Wildlife Department, 4200 Smith School Road, Austin, TX 78612, USA (JHY)Present address of JDH: Department of Fish and Wildlife Sciences, P.O. Box 441136, University of Idaho, Moscow, ID83844-1136, USA
* Correspondent: [email protected]
Knowledge of population boundaries and long-distance movements is important for wildlife conservation. We used
genetic tools to investigate genetic diversity, population structure, and movements of mountain lions (Pumaconcolor) in Texas. We amplified 11 microsatellite loci for 245 individuals collected during 1985–2010 from Texas
and New Mexico. Bayesian clustering and values of FST suggested a partitioning of mountain lions into 3
genetically differentiated groups, New Mexico, western Texas, and southern Texas. New Mexico and western
Texas exhibited moderate levels of genetic diversity (expected heterozygosity [HE]¼ 0.61 and 0.58, respectively),
whereas diversity in southern Texas was lower (HE¼ 0.47). Southern Texas displayed elevated genetic structure
when compared to western Texas and New Mexico (FST¼ 0.102–0.148), whereas the comparison between New
Mexico and western Texas revealed less subdivision (FST ¼ 0.056). We documented long-distance movement
among regions, and New Mexico and western Texas were sources for putative dispersers we sampled outside
known populations. Differences in genetic structure and diversity between southern and western Texas support the
designation of separate management units. Southern Texas appears isolated and further investigation is needed to
determine the current population status. Mountain lion populations in New Mexico and western Texas may be
important for future recolonization into portions of the southern United States.
Key words: Bayesian clustering, genetic diversity, genetic structure, long-distance movement, mountain lion, Pumaconcolor, Texas
� 2012 American Society of Mammalogists
DOI: 10.1644/11-MAMM-A-326.2
The distribution of mountain lions (Puma concolor) in North
America has reduced over the last 200 years (Anderson et al.
2010; Logan and Sweanor 2001). In Texas, mountain lions are
on the periphery of the distribution in both the United States
and North America. Populations were historically distributed
throughout the state, but census size and geographic distribu-
tion have declined over time. Today, breeding populations are
known to persist primarily in the Trans-Pecos and South Texas
Plain ecoregions of western and southern Texas, respectively
(Schmidly 2004).
Similar to many states in the United States, the decline of
mountain lions in Texas is attributed to predator control and
loss of habitat (Logan and Sweanor 2001). Livestock ranching
was an important industry in Texas during the late 1800s to
mid-1900s and predator removal was widely practiced, thus
contributing to the decline of mountain lion populations
(Lehmann 1969; Wade et al. 1984). Additionally, mountain
lion habitat in central and southern Texas became increasingly
fragmented during the past century due to agricultural
practices, urbanization, and energy development.
Mountain lions are not formally managed in Texas,
receiving the designated status of a nongame or varmint
w w w . m a m m a l o g y . o r g
989
species since 1970 (Harveson et al. 1996; Russ 1996).
Furthermore, harvest reporting is not required by law.
Examination of the limited data available suggests that
populations in both western and southern Texas are restricted
by low survival (Harveson 1997; Young et al. 2010) and low
reproductive rates (Harveson 1997; Pittman et al. 2000). A
preliminary genetic analysis found that mountain lions in
southern Texas have low levels of genetic diversity and appear
to be isolated from those in western Texas (Walker et al. 2000).
Mountain lions occur at low densities, exhibit large home
ranges, display elusive behavior, inhabit rough terrain, and are
cryptically colored (Logan and Sweanor 2001). These factors
make traditional census methods (e.g., mark–recapture or
transects) prohibitively expensive and logistically difficult,
particularly for surveys at large spatial extents. Additionally,
because harvest reporting is not required in Texas, managers
are unable to use harvest as a demographic index to monitor
population trends (e.g., Anderson and Lindzey 2005). Alter-
natives to conventional methods such as genetic tools are
useful to circumvent the challenges with monitoring wildlife
populations (DeYoung and Honeycutt 2005). Accordingly,
genetic data have been increasingly used to study populations
of solitary, highly mobile carnivores (e.g., Haag et al. 2010;
Spong et al. 2000). For mountain lions, genetic data have been
used to delineate population boundaries and management units
(e.g., Anderson et al. 2004; Ernest et al. 2003; Loxterman
2011; McRae et al. 2005). Genetic data also have been used to
identify long-distance movements among populations (Frantz
et al. 2006; Wasser et al. 2008), which can provide an objective
means of establishing habitat priorities and conservation
protocols (Beier 2010; LaRue and Nielsen 2008). Knowledge
of source populations and dispersal corridors is important to
develop management actions that mediate mountain lion-
human conflicts (Thompson and Jenks 2010), which are
increasingly more common in suburban landscapes (Beier
2010).
Historical persecution, habitat loss, and unregulated harvest
have provoked questions regarding the viability of mountain
lion populations in Texas (Russ 1996). The overall goal of this
study was to use genetic data to provide insights into
population structure and movements of mountain lions in
Texas and adjacent populations in New Mexico. Our specific
objectives were to estimate genetic diversity, characterize
population genetic structure, identify dispersal among known
populations, and assign population of origin to putative long-
distance dispersers sampled outside known populations.
Information from this study will expand on previous genetic
analyses of Texas mountain lions, provide much-needed
information on the current status of mountain lions in Texas,
and identify source populations that are providing dispersers
into historical range.
MATERIALS AND METHODS
Study area.—We conducted this study throughout New
Mexico, western Texas, and southern Texas (Fig. 1), but our
main focus was on Texas. New Mexico exhibits a large
gradient in elevation and topography with environments
ranging from brush and cacti (Cactus spp.)–dominated
deserts, pinyon-pine (Pinus spp.) and juniper (Juniperus spp.)
woodlands, to upland forests dominated by mixed conifers
(Bailey 1980). Western Texas is primarily a desert environment
dominated by shrubs, cacti, and grasses with a few isolated
mountain ranges where trees such as oak (Quercus spp.),
juniper, and pine (Pinus spp.) are abundant (Bailey 1980).
Southern Texas is characterized as an arid environment
exhibiting low elevations, mild topography, and dense woody
vegetation (e.g., huisache [Acacia farnesiana], granjeno [Celtisehrenbergiana], and honey mesquite [Prosopis glandulosa])
interspersed with grasses.
Sample collection and DNA analysis.—We obtained
mountain lion tissue samples from Texas and New Mexico
during 1985–2010. Samples from Texas were donated by
hunters and trappers, sampled from roadkills, or collected when
marking individuals during previous research (Harveson 1997).
Tissue samples from New Mexico were provided by the
Museum of Southwestern Biology, Division of Genomic
Resources (MSB 58960–58963, 92685, 142863, 142867–
142871, 142873, 142878, 142882, 142884–142887, 142890,
142891, 142893, 142896, 142901, 142902, 142909–142911,
142913, 142923, 142928, 145874, and 157080). Tissue was
frozen, dried, or placed in lysis buffer (Longmire et al. 1997)
until DNA extraction. We used a commercial kit (Qiagen
DNeasy tissue kit; Qiagen, Valencia, California) to extract
DNA from all tissue samples. We initiated the polymerase
chain reaction to amplify 11 microsatellite loci (FCA008,
FCA035, FCA043, FCA077, FCA082, FCA090, FCA096,
FCA132, FCA133, FCA176, and FCA205) described by
Menotti-Raymond et al. (1999). We amplified all loci
individually in 10-ll reaction volumes containing 5 ll of
AmpliTaq Gold PCR Master Mix (Applied Biosystems, Foster
City, California), 0.24 lM of each primer, and 10–50 ng of
DNA. We used a touchdown polymerase chain reaction profile
with thermal conditions consisting of an initial denaturation at
948C for 10 min, 20 cycles of 948C for 30 s, 628C for 30 s,
618C for 30 s, 608C for 30 s, and 728C for 60 s, followed by 30
cycles of 948C for 30 s, 558C for 90 s, and 728C for 60 s, with a
final extension of 608C for 10 min. We used electrophoresis on
an ABI 3130xl DNA analyzer (Applied Biosystems) for
fragment separation, and determined genotypes with
GeneMapper version 4.0 (Applied Biosystems). All sample
sets injected on the DNA analyzer had a positive and negative
control. We randomly selected and reanalyzed 10% of
individuals to calculate the genotyping error rate.
Genetic diversity and Hardy–Weinberg equilibrium.—We
computed estimates of genetic diversity for the overall sample,
as well as for each of the 3 geographic regions (Fig. 1).
Geographic regions were designated based on ecoregion and
adequate sample size. We used the computer program Arlequin
version 3.5 (Excoffier and Lischer 2010) to estimate mean
observed heterozygosity (HO), expected heterozygosity (HE—
Nei 1987), and number of alleles per locus (A). We estimated
990 Vol. 93, No. 4JOURNAL OF MAMMALOGY

mean allelic richness (Ar) using HP-RARE version 1.0
(Hurlbert 1971; Kalinowski 2005). We tested Hardy–
Weinberg expectations using FIS (Weir and Cockerham
1984), and assessed statistical significance (2-sided) by
comparing the observed value against a null value derived
from 1,023 permutations of alleles among individuals. We
computed and tested FIS using Arlequin version 3.5 (Excoffier
and Lischer 2010).
Genetic associations with distance.—We implemented 2
approaches to evaluate genetic associations across a gradient of
Euclidean distance. First, we spatially grouped individuals by
county, or combined geographically proximate individuals
from .1 county to maintain n � 5 (New Mexico: Bernalillo–
San Miguel, Dona Ana, Grant–Catron, Hidalgo, and Socorro–
Sierra–Lincoln; Texas: LaSalle–McMullen–Kleberg–Live
Oak, Maverick–Kinney–Webb, Brewster–Pecos, Culberson–
Hudspeth, Jeff Davis–Reeves, Presidio, and Terrell–Val
Verde). We computed pairwise FST (Weir and Cockerham
1984) among all county pairs; FST is the proportion of genetic
diversity explained by allele frequency differences among
groupings (Holsinger and Weir 2009). We used regression to
test for a relationship between the estimates of FST/(1 � FST)
and Euclidean distance (Rousset 1997). We computed the
standard error of the slope by jackknifing over loci and
assessed statistical significance by permuting locations among
groups 1,000 times, which is equivalent to a Mantel test (Hardy
and Vekemans 2002).
Second, we used spatial autocorrelation to explore the spatial
extent of population structure. At the individual level,
autocorrelation analyses describe the correlation between
average gene frequencies of a pair of individuals (Hardy and
Vekemans 1999; Scribner et al. 2005). We used Moran’s I(Hardy and Vekemans 1999) as the measure of autocorrelation
because of its robust performance (Epperson 2004). We
computed mean Moran’s I-values for all pairs of individuals
within 15 Euclidean distance classes. We used 15 classes with
FIG. 1.—Distribution of mountain lions (Puma concolor) sampled (n¼ 245) throughout Texas and New Mexico during 1985–2010. Triangles
represent individuals sampled from known populations (n¼ 237), and stars indicate potential dispersers sampled outside known populations (n¼ 8).
Information for each disperser is associated with the numbers next to stars: 1¼PC001, Bossier City, Louisiana; 2¼PC003, Kerr County, Texas; 3¼PC004, Fisher County, Texas; 4¼ PC042, Deaf Smith County, Texas; 5¼ PC123, Edwards County, Texas; 6¼ PC163, Real County, Texas; 7¼PC164, Kimble County, Texas; and 8¼ PC165, Sutton County, Texas. We grouped individuals from known populations based on ecoregion and
sample size for analyses (dotted lines separate groups): New Mexico (n¼ 31), western Texas (n¼ 178), and southern Texas (n¼ 28).
August 2012 991HOLBROOK ET AL.—GENETICS OF MOUNTAIN LIONS IN TEXAS
a large and equal number of pairs (i.e., 1,864) to ensure precise
estimates of Moran’s I, and low coefficient of variation within
each class (Hardy and Vekemans 2009). We tested the
statistical significance (2-sided) of Moran’s I for each distance
class by comparing observed values to a randomized value
computed from 1,000 permutations of individual locations. We
calculated the standard error of Moran’s I by jackknifing over
loci. We used the program SPAGeDi version 1.3 (Hardy and
Vekemans 2002) to perform regression and spatial autocorre-
lation analyses.
Genetic structure.—To further examine population genetic
structure, we implemented traditional genetic differentiation
methods as well as Bayesian clustering. We used the county
groupings and the 3 regions to compute pairwise and overall
FST (Weir and Cockerham 1984) using the computer program
Arlequin version 3.5 (Excoffier and Lischer 2010). We tested
statistical significance (2-sided) by comparing the observed
value to a null value derived from 1,023 permutations of
genotypes among groups (i.e., counties or regions).
We applied 2 Bayesian clustering algorithms that incorpo-
rate spatial locations. We employed the algorithm implemented
in Geneland (Guillot et al. 2005a, 2005b) version 3.2.4 using
program R version 2.11.1 (R Development Core Team 2011).
This model uses a Markov chain Monte Carlo approach to infer
genetic discontinuities among georeferenced genotypes. We
evaluated 1–8 possible genetic clusters (K), with 8 independent
runs for each K. We implemented the spatial model with 10 km
of uncertainty, because spatial coordinates of some sample
locations were approximate (i.e., not taken with a global
positioning system). We assumed allele frequencies to be
correlated and used 100,000 Markov chain Monte Carlo
iterations while recording 1,000 (thinning¼ 100). We selected
K using the mode of the maximized posterior probability.
Second, we applied the Bayesian algorithm described by
Corander et al. (2003) using BAPS version 5. This approach
uses stochastic optimization to infer the posterior mode of
genetic structure in the data. We implemented the spatial
clustering of individuals (Corander et al. 2008b) and explored
K ¼ 1–8, with 8 independent runs for each K. We selected Kbased on the partitioning of individuals that maximized the log
marginal likelihood. The optimal partition of individuals in
Geneland and BAPS should minimize Hardy–Weinberg and
linkage disequilibrium within clusters.
We also employed a nonspatial Bayesian clustering
algorithm implemented in the computer program structureversion 2.2 (Pritchard et al. 2000). This model uses a Markov
chain Monte Carlo to infer genetic clusters and assign
individuals to ancestral populations while minimizing Hardy–
Weinberg and linkage disequilibrium within clusters (Pritchard
et al. 2000). The algorithm also estimates ancestry proportions
(q-values) to each genetic cluster for each individual. We
selected the admixture model and assumed allele frequencies
were correlated (Falush et al. 2003). We performed 100,000
Markov chain Monte Carlo burn-in repetitions to reduce initial
configuration effects, followed by 500,000 Markov chain
Monte Carlo repetitions of data collection. We explored 1–8
genetic clusters, with 8 independent runs for each K to evaluate
consistency. We calculated the arithmetic mean and standard
deviation of the log probability of the data (Ln P(D)) across
runs for each K to identify the plateau and determine the
optimal number of clusters (Pritchard et al. 2007). We also
calculated the DK statistic (Evanno et al. 2005) and used
ancestry proportions (i.e., q-values) as an index (Pritchard et al.
2007) to inform the selection of K.
Assigning origin to dispersers.—We used Bayesian
clustering and assignment tests to determine origin for
dispersers among known populations, and potential dispersers
sampled outside known populations. We used mean q-values
(over 8 runs) from the structure analyses and geographic
locations to identify long-distance movement among known
populations. We defined long distance as movement from
western Texas to southern Texas or vice versa, and southern
Texas to New Mexico or vice versa (i.e., �200 km). Similar to
previous studies (e.g., Latch et al. 2006, 2008), we considered
individuals residents of a cluster if q . 0.75 and admixed if q¼0.25–0.75.
Next, we used 3 Bayesian assignment methods to assign
origin to the potential dispersers sampled outside known
populations. When reference populations are known a priori,
assignment methods provide a more explicit way to discern
genetic origins. In all analyses we considered the 3 regions
(western Texas, southern Texas, and New Mexico) as reference
populations, and the potential dispersers as unknowns. First,
we used the modified assignment approach of Rannala and
Mountain (1997) in GeneClass version 2 (Piry et al. 2004).
This approach provides likelihood ratio scores for each
unknown individual to each reference population (Piry et al.
2004), and we used scores . 85% to indicate assignment.
Second, we employed the assignment methods implemented in
structure version 2.2 (Falush et al. 2003) and BAPS version 5
(Corander et al. 2003). For both analyses we assumed that K¼3, corresponding to the regional reference populations. We
employed the USEPOPINFO option in structure (Falush et al.
2003), and executed 100,000 Markov chain Monte Carlo burn-
in and 500,000 data collecting repetitions. We assumed allele
frequencies were correlated, no admixture, and updated
frequencies with only reference populations. Because results
of this analysis can be sensitive to the a priori assigned
migration rate (MIGPRIOR), we analyzed the data using a
range of values (i.e., 0.001–0.10) as suggested by Pritchard et
al. (2007). The choice of MIGPRIOR did not substantially
influence results, thus we only present results using MIGP-
RIOR ¼ 0.05 (default value). Because we incorporated prior
population information (USEPOPINFO) and assumed no
admixture among reference populations, more certainty is
associated with assignments compared to admixture analyses.
Thus, we used a more stringent q-value (q . 0.85) to indicate
genetic assignment (Frantz et al. 2006). Finally, we employed
the trained clustering methodology (Corander et al. 2006,
2008a) in BAPS (Corander et al. 2003). We explored the
assignment of each unknown individual to regional reference
populations, one-by-one. To evaluate the strength of assign-
992 Vol. 93, No. 4JOURNAL OF MAMMALOGY
ment to each cluster we multiplied by 2 the absolute value of
change in the log marginal likelihood (i.e., Bayes factor—
Corander et al. 2009) of individual i being assigned to the
alternative cluster j. Values of 0 indicate the assigned reference
population, and movement to another population with a change
� 6 suggests substantial support for assignment (Kass and
Raftery 1995). A change � 2 indicates poor assignment
support.
RESULTS
Genetic data.—We successfully genotyped 245 mountain
lions (57% males, 39% females, and 4% had no sex
information) at 11 microsatellite loci (Fig. 1). A total of 237
genotypes were obtained from known populations in Texas and
New Mexico, and 8 were from presumed long-distance
dispersers; 1 each from Kerr, Fisher, Deaf Smith, Edwards,
Kimble, Sutton, and Real counties, Texas, and Bossier City,
Louisiana. Positive and negative polymerase chain reaction
controls were consistent and did not exhibit any contamination.
Our genotyping error rate was ,1%.
Estimates of mean HO, HE, A, and Ar were moderate for
New Mexico and western Texas as well as the total sample
(Table 1). However, point estimates of genetic diversity for
southern Texas were 10–25% lower than for western Texas and
New Mexico. Hardy–Weinberg equilibrium tests indicated that
the 3 regions did not statistically deviate from expectations;
however, the total sample exhibited substantial deviation
(Table 1).
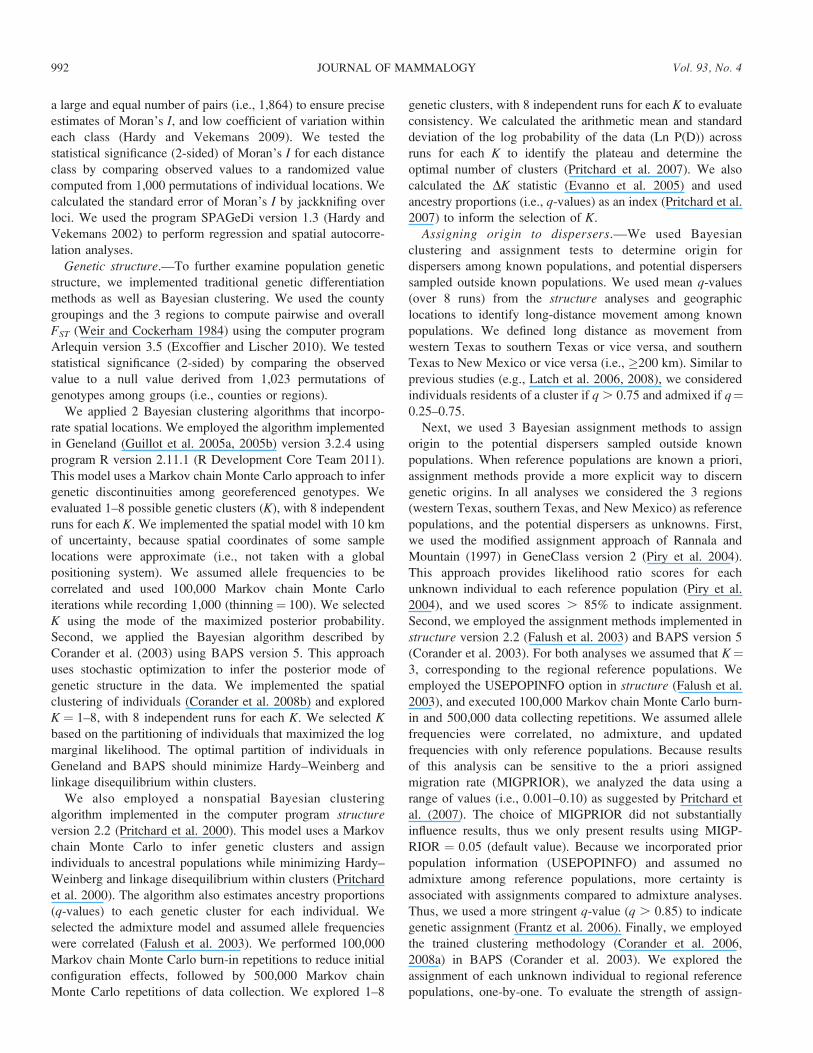
Genetic associations with distance.—We observed a
positive relationship (slope ¼ 0.0000002, SE ¼ 0.00000007,
P , 0.001) between genetic and Euclidean distance (Fig. 2),
which indicated a significant pattern of isolation by distance.
Euclidian distance accounted for about half of the variation in
genetic distance (R2¼ 0.49). Within the southern Texas region,
most pairwise comparisons involving the western county group
(Maverick–Kinney–Webb) followed an isolation-by-distance
pattern. However, comparisons including the eastern county
group (LaSalle–McMullen–Kleberg–Live Oak) produced
greater FST values than the predicted relationship (Fig. 2).
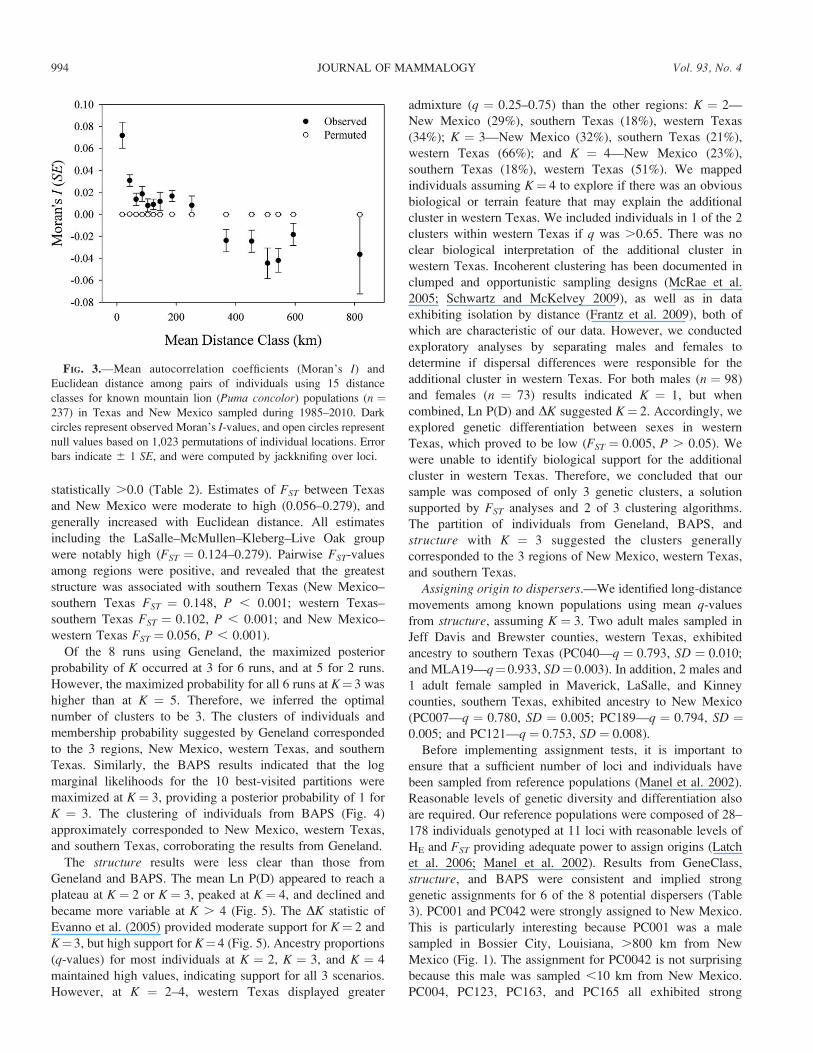
Analyses of spatial autocorrelation (Fig. 3) indicated
statistically significant positive autocorrelation for the first 9
distance classes (~20–250 km), with the exception of class 5
(~105 km). Moran’s I-values in the 1st (~20 km) and 2nd
(~40 km) distance class were greater or equal to the expected
value for 2nd cousins. We observed negative autocorrelation
between distance classes 10–15 (~370–820 km), substantiating
the presence of an isolation-by-distance pattern. Together,
regression and spatial autocorrelation provided evidence for an
isolation-by-distance cline, regional-level genetic structure, and
genetic association among individuals at distances , 50 km.
Genetic structure.—We observed significant genetic
differentiation among county groupings (FST ¼ 0.031, P ,
0.001) and the 3 regions (FST¼ 0.074, P , 0.001), indicating
moderate levels of genetic structure. The regional division
accounted for more genetic variation than the county
groupings, suggesting that the differences among regions
were greater than within regions. Fifty-six of 66 pairwise
comparisons among samples grouped by county were
TABLE 1.—Mean estimates (over 11 loci) of observed (HO) and expected (HE) heterozygosity, number of alleles per locus (A), and allelic
richness (Ar) for known populations of mountain lions (Puma concolor) in Texas and New Mexico sampled during 1985–2010. Standard
deviations (SDs) are in parentheses, and n indicates sample size. Estimates of FIS indicate tests for Hardy–Weinberg equilibrium, and P-values are
based on 1,023 permutations of alleles among individuals. We used the computer program Arlequin 3.5 (Excoffier and Lischer 2010) to compute
HO, HE, A, and FIS, and HP-RARE 1.0 (Kalinowski 2005) to compute Ar.
Region n HO HE A Ar FIS
New Mexico 31 0.57 (0.21) 0.61 (0.22) 4.55 (1.64) 4.43 (1.59) 0.07, P ¼ 0.08
Western Texas 178 0.56 (0.22) 0.58 (0.23) 5.09 (1.81) 4.23 (1.39) 0.02, P ¼ 0.76
Southern Texas 28 0.45 (0.25) 0.47 (0.25) 3.91 (1.64) 3.85 (1.60) 0.02, P ¼ 0.38
Total 237 0.55 (0.21) 0.59 (0.23) 5.55 (1.92) 5.53 (1.90) 0.11, P , 0.01
FIG. 2.—Regression of linearized FST and geographic distance for
mountain lions (Puma concolor) sampled from known populations (n¼ 237) during 1985–2010. Samples were grouped by county in Texas
and New Mexico while maintaining n � 5. We highlighted
comparisons with different symbols to display important trends within
each geographic region. Dark diamonds represent comparisons within
western Texas and New Mexico. Open circles indicate comparisons of
the western county grouping in southern Texas (i.e., Maverick–
Kinney–Webb) to other groups. Open triangles signify comparisons of
the eastern county group in southern Texas (i.e., LaSalle–McMullen–
Kleberg–Live Oak) to other groups; the comparison within southern
Texas (i.e., western and eastern county comparison) also is included
(see arrow). The slope was significant (P , 0.001) based on 1,000
permutations of locations among groups, and the SE was derived by
jackknifing over loci.
August 2012 993HOLBROOK ET AL.—GENETICS OF MOUNTAIN LIONS IN TEXAS
statistically .0.0 (Table 2). Estimates of FST between Texas
and New Mexico were moderate to high (0.056–0.279), and
generally increased with Euclidean distance. All estimates
including the LaSalle–McMullen–Kleberg–Live Oak group
were notably high (FST ¼ 0.124–0.279). Pairwise FST-values
among regions were positive, and revealed that the greatest
structure was associated with southern Texas (New Mexico–
southern Texas FST ¼ 0.148, P , 0.001; western Texas–
southern Texas FST ¼ 0.102, P , 0.001; and New Mexico–
western Texas FST ¼ 0.056, P , 0.001).
Of the 8 runs using Geneland, the maximized posterior
probability of K occurred at 3 for 6 runs, and at 5 for 2 runs.
However, the maximized probability for all 6 runs at K¼ 3 was
higher than at K ¼ 5. Therefore, we inferred the optimal
number of clusters to be 3. The clusters of individuals and
membership probability suggested by Geneland corresponded
to the 3 regions, New Mexico, western Texas, and southern
Texas. Similarly, the BAPS results indicated that the log
marginal likelihoods for the 10 best-visited partitions were
maximized at K¼ 3, providing a posterior probability of 1 for
K ¼ 3. The clustering of individuals from BAPS (Fig. 4)
approximately corresponded to New Mexico, western Texas,
and southern Texas, corroborating the results from Geneland.
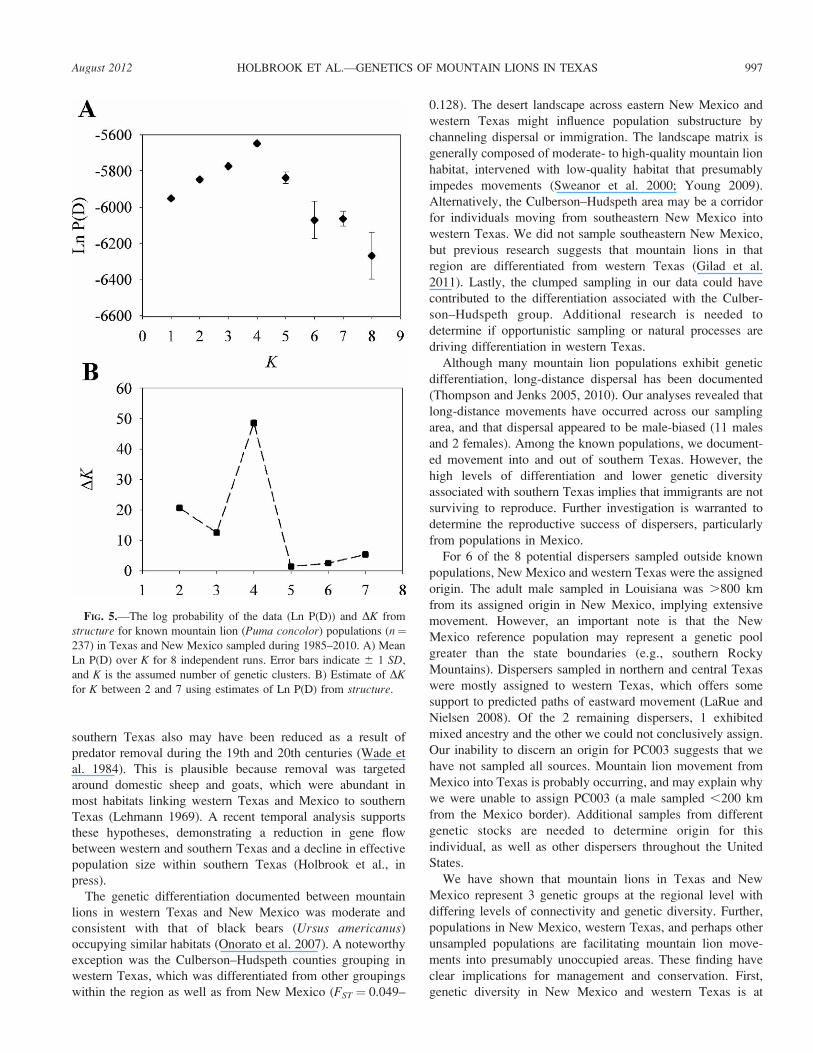
The structure results were less clear than those from
Geneland and BAPS. The mean Ln P(D) appeared to reach a
plateau at K ¼ 2 or K ¼ 3, peaked at K ¼ 4, and declined and
became more variable at K . 4 (Fig. 5). The DK statistic of
Evanno et al. (2005) provided moderate support for K¼ 2 and
K¼3, but high support for K¼4 (Fig. 5). Ancestry proportions
(q-values) for most individuals at K ¼ 2, K ¼ 3, and K ¼ 4
maintained high values, indicating support for all 3 scenarios.
However, at K ¼ 2–4, western Texas displayed greater
admixture (q ¼ 0.25–0.75) than the other regions: K ¼ 2—
New Mexico (29%), southern Texas (18%), western Texas
(34%); K ¼ 3—New Mexico (32%), southern Texas (21%),
western Texas (66%); and K ¼ 4—New Mexico (23%),
southern Texas (18%), western Texas (51%). We mapped
individuals assuming K¼ 4 to explore if there was an obvious
biological or terrain feature that may explain the additional
cluster in western Texas. We included individuals in 1 of the 2
clusters within western Texas if q was .0.65. There was no
clear biological interpretation of the additional cluster in
western Texas. Incoherent clustering has been documented in
clumped and opportunistic sampling designs (McRae et al.
2005; Schwartz and McKelvey 2009), as well as in data
exhibiting isolation by distance (Frantz et al. 2009), both of
which are characteristic of our data. However, we conducted
exploratory analyses by separating males and females to
determine if dispersal differences were responsible for the
additional cluster in western Texas. For both males (n ¼ 98)
and females (n ¼ 73) results indicated K ¼ 1, but when
combined, Ln P(D) and DK suggested K¼ 2. Accordingly, we
explored genetic differentiation between sexes in western
Texas, which proved to be low (FST ¼ 0.005, P . 0.05). We
were unable to identify biological support for the additional
cluster in western Texas. Therefore, we concluded that our
sample was composed of only 3 genetic clusters, a solution
supported by FST analyses and 2 of 3 clustering algorithms.
The partition of individuals from Geneland, BAPS, and
structure with K ¼ 3 suggested the clusters generally
corresponded to the 3 regions of New Mexico, western Texas,
and southern Texas.
Assigning origin to dispersers.—We identified long-distance
movements among known populations using mean q-values
from structure, assuming K ¼ 3. Two adult males sampled in
Jeff Davis and Brewster counties, western Texas, exhibited
ancestry to southern Texas (PC040—q ¼ 0.793, SD ¼ 0.010;
and MLA19—q¼ 0.933, SD¼ 0.003). In addition, 2 males and
1 adult female sampled in Maverick, LaSalle, and Kinney
counties, southern Texas, exhibited ancestry to New Mexico
(PC007—q ¼ 0.780, SD ¼ 0.005; PC189—q ¼ 0.794, SD ¼0.005; and PC121—q ¼ 0.753, SD ¼ 0.008).
Before implementing assignment tests, it is important to
ensure that a sufficient number of loci and individuals have
been sampled from reference populations (Manel et al. 2002).
Reasonable levels of genetic diversity and differentiation also
are required. Our reference populations were composed of 28–
178 individuals genotyped at 11 loci with reasonable levels of
HE and FST providing adequate power to assign origins (Latch
et al. 2006; Manel et al. 2002). Results from GeneClass,
structure, and BAPS were consistent and implied strong
genetic assignments for 6 of the 8 potential dispersers (Table
3). PC001 and PC042 were strongly assigned to New Mexico.
This is particularly interesting because PC001 was a male
sampled in Bossier City, Louisiana, .800 km from New
Mexico (Fig. 1). The assignment for PC0042 is not surprising
because this male was sampled ,10 km from New Mexico.
PC004, PC123, PC163, and PC165 all exhibited strong
FIG. 3.—Mean autocorrelation coefficients (Moran’s I) and
Euclidean distance among pairs of individuals using 15 distance
classes for known mountain lion (Puma concolor) populations (n ¼237) in Texas and New Mexico sampled during 1985–2010. Dark
circles represent observed Moran’s I-values, and open circles represent
null values based on 1,023 permutations of individual locations. Error
bars indicate 6 1 SE, and were computed by jackknifing over loci.
994 Vol. 93, No. 4JOURNAL OF MAMMALOGY
assignments to western Texas. These assignments are reason-
able because PC004 was a male sampled in north-central
Texas, and PC123 (male), PC163 (female), and PC165 (male)
were sampled in central Texas (Fig. 1).
Unfortunately, we were unable to assign 2 dispersers. PC003
was moderately or weakly assigned to all reference populations
by GeneClass and structure, suggesting admixed ancestry.
However, BAPS provided essentially no support to any
reference population (i.e., a change , 3 in 2 times the log
marginal likelihood), indicating that PC003 could be from an
unsampled source. Further, by all methodologies PC164 was
moderately and weakly assigned to western Texas and New
Mexico with essentially no support for southern Texas. PC164
appeared to be a product of combined ancestry from New
Mexico and western Texas. Assignments from GeneClass,
structure, and BAPS indicated that long-distance movements
have occurred across our sampling area.
DISCUSSION
Genetic structure in populations of mountain lions is low in
relatively continuous habitats (Anderson et al. 2004; Culver et
al. 2000; Sinclair et al. 2001), but can be highly structured in
fragmented habitats (Ernest et al. 2003). Associations of
genetic and geographic distance in our study indicated that
genetic structure was present at both the local and regional
scales. For the local scale (,50 km), autocorrelation analyses
suggested that sampled mountain lions exhibited relatively
high genetic associations, particularly for a territorial species.
Female philopatry (Logan and Sweanor 2001, 2010; Sweanor
et al. 2000), high sampling effort (e.g., hunting and trapping) at
local scales (Schwartz and McKelvey 2009), habitat loss, or a
combination could have contributed to the nonindependence
among proximate individuals. At the regional scale, autocor-
relation and regression analyses identified a significant
isolation-by-distance pattern, suggesting a decrease in genetic
similarity with increasing geographic distance. This pattern is
consistent with other continuous (Anderson et al. 2004;
Sinclair et al. 2001) as well as structured (Ernest et al. 2003;
Loxterman 2011; McRae et al. 2005) mountain lion popula-
tions.
In general, traditional FST and Bayesian clustering analyses
provided support for 3 distinct groups at the regional level
(New Mexico, western Texas, and southern Texas). However,
the nonspatial algorithm in structure rendered support for 4
genetic clusters (split western Texas into 2 clusters rather than
1). This discrepant result may be due to either sampling
constraints or ecological processes. Spurious genetic disconti-
nuities in clustering analyses have been observed in cases
involving opportunistic and clumped sampling schemes
(McRae et al. 2005; Schwartz and McKelvey 2009), and
where there is pronounced isolation-by-distance (Frantz et al.
2009). Our sampling scheme was necessarily clumped and
opportunistic, and the data exhibited patterns of isolation-by-
distance, producing an environment prone to spurious
clustering. Alternatively, high harvest of mountain lions can
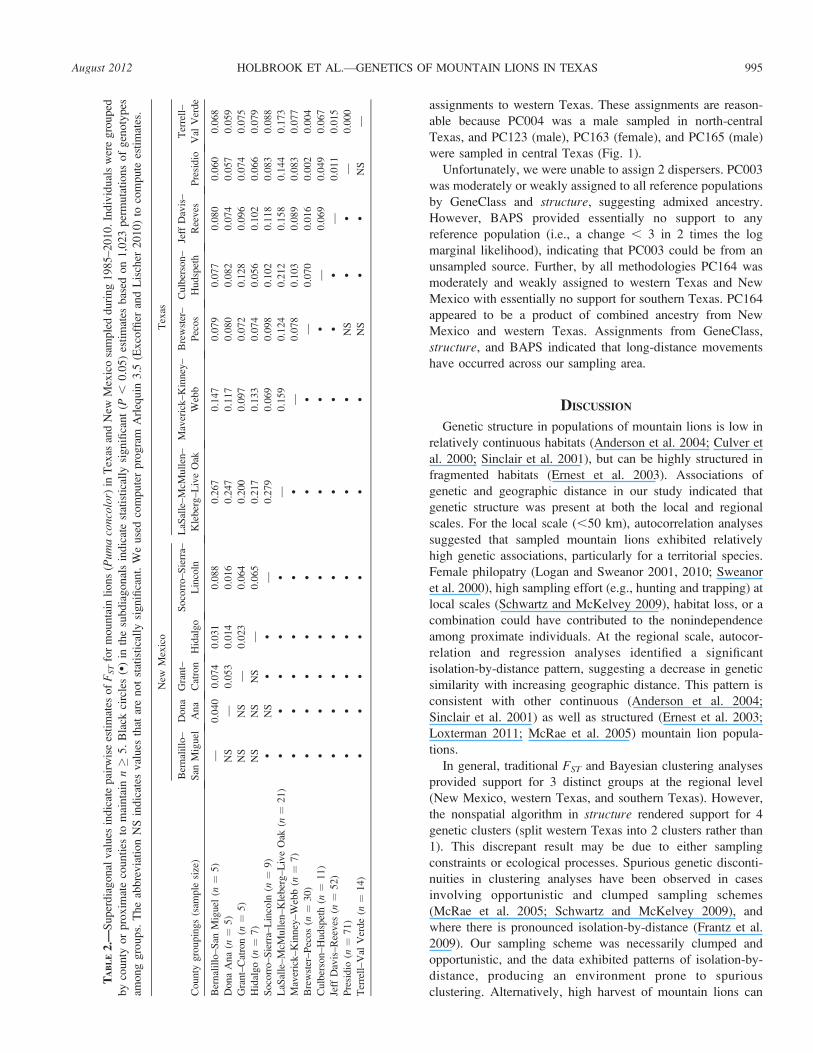
TA
BL
E2
.—S
up
erd
iag
on
alv
alu
esin
dic
ate
pai
rwis
ees
tim
ates
of
FS
Tfo
rm
ounta
inli
ons
(Pum
aco
ncol
or)
inT
exas
and
New
Mex
ico
sam
ple
dd
uri
ng
19
85
–2
01
0.
Ind
ivid
ual
sw
ere
gro
up
ed
by
cou
nty
or
pro
xim
ate
cou
nti
esto
mai
nta
inn�
5.
Bla
ckci
rcle
s(�
)in
the
sub
dia
go
nal
sin
dic
ate
stat
isti
call
ysi
gn
ifica
nt
(P,
0.0
5)
esti
mat
esb
ased
on
1,0
23
per
mu
tati
on
so
fg
eno
typ
es
amo
ng
gro
up
s.T
he
abb
rev
iati
on
NS
ind
icat
esv
alu
esth
atar
en
ot
stat
isti
call
ysi
gn
ifica
nt.
We
use
dco
mp
ute
rp
rog
ram
Arl
equ
in3
.5(E
xco
ffier
and
Lis
cher
20
10
)to
com
pu
tees
tim
ates
.
Cou
nty
gro
up
ings
(sam
ple
size
)
New
Mex
ico
Tex
as
Ber
nal
illo
–
San
Mig
uel
Do
na
An
a
Gra
nt–
Cat
ron
Hid
algo
So
corr
o–S
ierr
a–
Lin
coln
LaS
alle
–M
cMu
llen
–
Kle
ber
g–L
ive
Oak
Mav
eric
k–
Kin
ney
–
Web
b
Bre
wst
er–
Pec
os
Culb
erso
n–
Hu
dsp
eth
Jeff
Dav
is–
Ree
ves
Pre
sid
io
Ter
rell
–
Val
Ver
de
Ber
nal
illo
–S
anM
iguel
(n¼
5)
—0
.040
0.0
74
0.0
31
0.0
88
0.2
67
0.1
47
0.0
79
0.0
77
0.0
80
0.0
60
0.0
68
Do
na
An
a(n¼
5)
NS
—0
.05
30
.014
0.0
16
0.2
47
0.1
17
0.0
80
0.0
82
0.0
74
0.0
57
0.0
59
Gra
nt–
Cat
ron
(n¼
5)
NS
NS
—0
.023
0.0
64
0.2
00
0.0
97
0.0
72
0.1
28
0.0
96
0.0
74
0.0
75
Hid
algo
(n¼
7)
NS
NS
NS
—0
.065
0.2
17
0.1
33
0.0
74
0.0
56
0.1
02
0.0
66
0.0
79
So
corr
o–
Sie
rra–
Lin
coln
(n¼
9)
�N
S�
�—
0.2
79
0.0
69
0.0
98
0.1
02
0.1
18
0.0
83
0.0
88
LaS
alle
–M
cMull
en–K
leber
g–L
ive
Oak
(n¼
21
)�
��
��
—0
.15
90
.12
40
.21
20
.15
80
.144
0.1
73
Mav
eric
k–K
inney
–W
ebb
(n¼
7)
��
��
��
—0
.07
80
.10
30
.08
90
.083
0.0
77
Bre
wst
er–
Pec
os
(n¼
30
)�
��
��
��
—0
.07
00
.01
60
.002
0.0
04
Culb
erso
n–H
udsp
eth
(n¼
11
)�
��
��
��
�—
0.0
69
0.0
49
0.0
67
Jeff
Dav
is–
Ree
ves
(n¼
52
)�
��
��
��
��
—0
.011
0.0
15
Pre
sid
io(n¼
71
)�
��
��
��
NS
��
—0
.000
Ter
rell
–V
alV
erd
e(n¼
14
)�
��
��
��
NS
��
NS
—
August 2012 995HOLBROOK ET AL.—GENETICS OF MOUNTAIN LIONS IN TEXAS

promote immigration from adjacent populations (Cooley et al.
2009). Mountain lion harvest is unregulated in Texas, and as a
result the samples from western Texas might have had a high
proportion of immigrants from surrounding unsampled popu-
lations (e.g., from Mexico or elsewhere). Analyses from
structure indicated higher levels of admixture within western
Texas, which may provide support for the harvest–immigration
hypothesis. However, the data provided the most support for K¼ 3 corresponding to the regions of New Mexico, western
Texas, and southern Texas.
When compared to western Texas and New Mexico, the
southern Texas group exhibited high levels of genetic
differentiation (FST¼ 0.102–0.148), substantiating the findings
from Walker et al. (2000). Within southern Texas, notable
genetic differentiation was associated with the eastern county
grouping of LaSalle–McMullen–Kleberg–Live Oak (FST ¼0.124–0.279). Similar levels of genetic structure were observed
in highly fragmented or isolated populations in southwestern
California (Ernest et al. 2003). Additionally, regression
analyses including individuals from the LaSalle–McMullen–
Kleberg–Live Oak group did not follow the isolation-by-
distance relationship, indicating that factors other than
geographic distance are likely influencing genetic differentia-
tion.
Southern Texas is currently a peripheral population on the
eastern edge of the mountain lion distribution, and some
genetic differentiation may be due to the population’s location
on the landscape. Species of felids have exhibited higher
differentiation in peripheral populations compared to interior
populations (Schwartz et al. 2003). The central–marginal
hypothesis states that peripheral populations can suffer from
smaller census sizes and fewer opportunities for gene flow, and
are generally more sensitive to range shifts (Eckert et al. 2008;
Schwartz et al. 2003). Second, the urban development and
sprawl throughout central Texas and along the Mexico–United
States border has presumably restricted mountain lion
movements and gene flow into southern Texas from western
Texas and Mexico. Connectivity from adjacent populations to
FIG. 4.—Genetic clustering results from BAPS for known mountain lion (Puma concolor) populations (n¼ 237) in Texas and New Mexico
sampled during 1985–2010. A) Voronoi tessellations around each sample location for all individuals. Shades correspond to each genetic cluster (K¼ 3). B) Individual assignments to each genetic cluster with geographic sampling locations labeled below: New Mexico, southern Texas, and
western Texas. Each column represents 1 individual.
996 Vol. 93, No. 4JOURNAL OF MAMMALOGY
southern Texas also may have been reduced as a result of
predator removal during the 19th and 20th centuries (Wade et
al. 1984). This is plausible because removal was targeted
around domestic sheep and goats, which were abundant in
most habitats linking western Texas and Mexico to southern
Texas (Lehmann 1969). A recent temporal analysis supports
these hypotheses, demonstrating a reduction in gene flow
between western and southern Texas and a decline in effective
population size within southern Texas (Holbrook et al., in
press).
The genetic differentiation documented between mountain
lions in western Texas and New Mexico was moderate and
consistent with that of black bears (Ursus americanus)
occupying similar habitats (Onorato et al. 2007). A noteworthy
exception was the Culberson–Hudspeth counties grouping in
western Texas, which was differentiated from other groupings
within the region as well as from New Mexico (FST ¼ 0.049–
0.128). The desert landscape across eastern New Mexico and
western Texas might influence population substructure by
channeling dispersal or immigration. The landscape matrix is
generally composed of moderate- to high-quality mountain lion
habitat, intervened with low-quality habitat that presumably
impedes movements (Sweanor et al. 2000; Young 2009).
Alternatively, the Culberson–Hudspeth area may be a corridor
for individuals moving from southeastern New Mexico into
western Texas. We did not sample southeastern New Mexico,
but previous research suggests that mountain lions in that
region are differentiated from western Texas (Gilad et al.
2011). Lastly, the clumped sampling in our data could have
contributed to the differentiation associated with the Culber-
son–Hudspeth group. Additional research is needed to
determine if opportunistic sampling or natural processes are
driving differentiation in western Texas.
Although many mountain lion populations exhibit genetic
differentiation, long-distance dispersal has been documented
(Thompson and Jenks 2005, 2010). Our analyses revealed that
long-distance movements have occurred across our sampling
area, and that dispersal appeared to be male-biased (11 males
and 2 females). Among the known populations, we document-
ed movement into and out of southern Texas. However, the
high levels of differentiation and lower genetic diversity
associated with southern Texas implies that immigrants are not
surviving to reproduce. Further investigation is warranted to
determine the reproductive success of dispersers, particularly
from populations in Mexico.
For 6 of the 8 potential dispersers sampled outside known
populations, New Mexico and western Texas were the assigned
origin. The adult male sampled in Louisiana was .800 km
from its assigned origin in New Mexico, implying extensive
movement. However, an important note is that the New
Mexico reference population may represent a genetic pool
greater than the state boundaries (e.g., southern Rocky
Mountains). Dispersers sampled in northern and central Texas
were mostly assigned to western Texas, which offers some
support to predicted paths of eastward movement (LaRue and
Nielsen 2008). Of the 2 remaining dispersers, 1 exhibited
mixed ancestry and the other we could not conclusively assign.
Our inability to discern an origin for PC003 suggests that we
have not sampled all sources. Mountain lion movement from
Mexico into Texas is probably occurring, and may explain why
we were unable to assign PC003 (a male sampled ,200 km
from the Mexico border). Additional samples from different
genetic stocks are needed to determine origin for this
individual, as well as other dispersers throughout the United
States.
We have shown that mountain lions in Texas and New
Mexico represent 3 genetic groups at the regional level with
differing levels of connectivity and genetic diversity. Further,
populations in New Mexico, western Texas, and perhaps other
unsampled populations are facilitating mountain lion move-
ments into presumably unoccupied areas. These finding have
clear implications for management and conservation. First,
genetic diversity in New Mexico and western Texas is at
FIG. 5.—The log probability of the data (Ln P(D)) and DK from
structure for known mountain lion (Puma concolor) populations (n¼237) in Texas and New Mexico sampled during 1985–2010. A) Mean
Ln P(D) over K for 8 independent runs. Error bars indicate 6 1 SD,
and K is the assumed number of genetic clusters. B) Estimate of DKfor K between 2 and 7 using estimates of Ln P(D) from structure.
August 2012 997HOLBROOK ET AL.—GENETICS OF MOUNTAIN LIONS IN TEXAS
seemingly high levels compared to that of other mountain lion
populations (Culver et al. 2000), and probably will be
maintained if effective population size remains large (Allendorf
and Luikart 2007). Conservation strategies should aim at
maintaining large effective sizes in these regions to perpetuate
diversity and maintain large peripheral populations in the
United States. Southern Texas, however, displayed lower
levels of genetic diversity along with high levels of
differentiation comparable to fragmented or isolated popula-
tions in California (Ernest et al. 2003). We did detect natural
movements into southern Texas, but reproduction may be
negated due to high mortality, as suggested by Harveson
(1997). Natural dispersal into southern Texas is promising
because it has the potential to increase diversity and reduce
differentiation if reproduction occurs. Strategies should be
implemented to increase survival of these immigrants during
movement and after establishment if mountain lion persistence
is desired. For instance, lowering harvest pressure in potential
movement corridors into southern Texas from western Texas or
Mexico could be 1 alternative. Estimates of population
productivity and survival in southern Texas also would inform
the status and future persistence of mountain lions in the
region.
Second, our findings suggest that mountain lions in the
southwestern United States are not continuous (Logan and
Sweanor 2001; Sweanor et al. 2000). Levels of differentiation
between southern and western Texas are high, and similar to
previous work despite our larger sample size and sampling
area. Therefore, we support the suggestion by Walker et al.
(2000) that western and southern Texas be treated as 2
management units. This information should be considered
when implementing management prescriptions that impact
regional mountain lion fitness. In addition, our results indicate
that New Mexico and western Texas are separate units
connected through moderate levels of genetic exchange.
Maintaining connectivity among mountain lions in New
Mexico, Texas, and perhaps Mexico will likely have a positive
influence on regional persistence by sustaining large effective
sizes.
Finally, mountain lions from New Mexico and western
Texas are emigrating into portions of their historical range,
suggesting that these 2 regions may serve as sources for future
recolonization in the southern United States. Further identifi-
cation and maintenance of potential source populations and
corridors for dispersal would help prioritize conservation
efforts as well as help minimize mountain lion–human conflict,
both of which are imperative for the future of mountain lion
conservation (Hornocker 2010).
ACKNOWLEDGMENTS
We extend our sincere thanks to B. Applegate, L. Harveson, The
Museum of Southwestern Biology—Division of Genomic Resources,
J. Rutledge, J. Arredondo, F. Hernandez, R. Dickerson, B. P.
Mckinney, R. Donaho, R. Taylor, and J. LaCour for providing tissue
samples. We thank E. Redeker for providing geographic information
system support. The Houston Safari Club, Quail Unlimited (South
Texas Chapter), and Quail Coalition deserve special thanks for
valuable scholarship funds. We thank P. Beier and 1 anonymous
reviewer for providing constructive comments that improved this
manuscript. Financial support for this research was provided by the
Texas Parks and Wildlife Department. This is contribution 12-111 of
the Caesar Kleberg Wildlife Research Institute.
LITERATURE CITED
ALLENDORF, F. W., AND G. LUIKART. 2007. Conservation and the
genetics of populations. Blackwell Publishing, Oxford, United
Kingdom.
ANDERSON, C. R., AND F. G. LINDZEY. 2005. Experimental evaluation of
population trend and harvest composition in a Wyoming cougar
population. Wildlife Society Bulletin 33:179–188.
ANDERSON, C. R., F. G. LINDZEY, K. H. KNOPFF, M. G. JALKOTZY, AND
M. S. BOYCE. 2010. Cougar management in North America. Pp. 41–
54 in Cougar ecology and conservation (M. Hornocker and S.
Negri, eds.). University of Chicago Press, Chicago, Illinois.
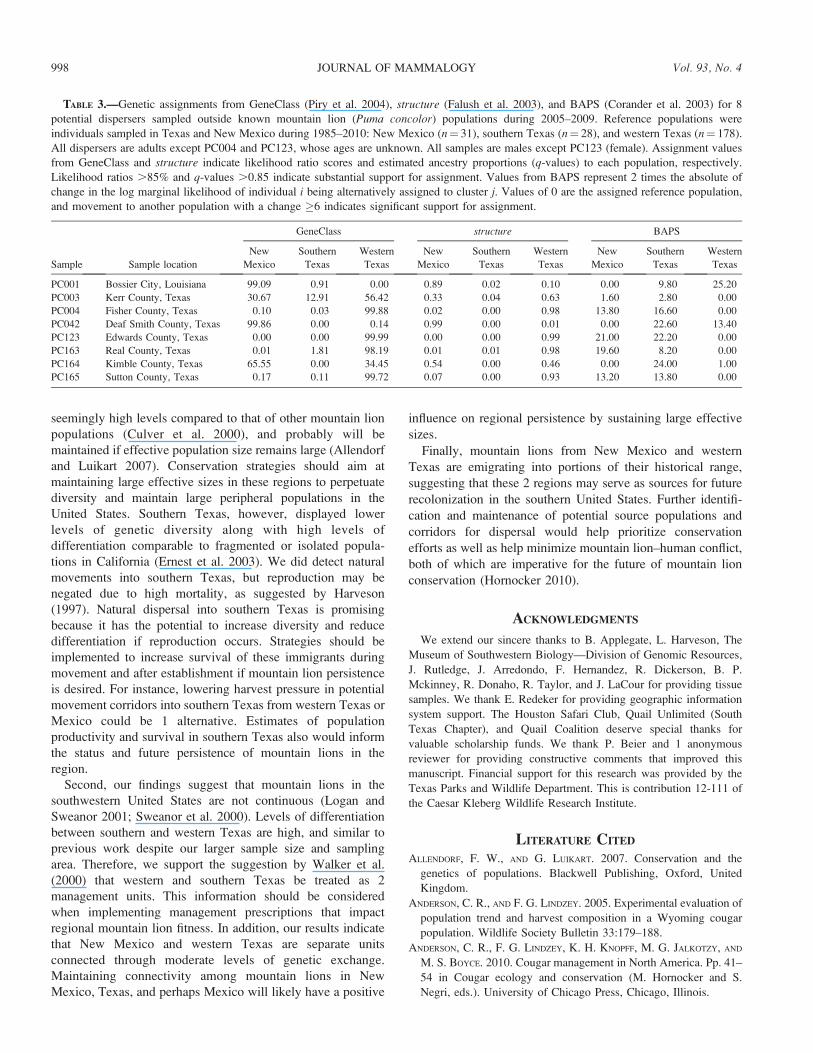
TABLE 3.—Genetic assignments from GeneClass (Piry et al. 2004), structure (Falush et al. 2003), and BAPS (Corander et al. 2003) for 8
potential dispersers sampled outside known mountain lion (Puma concolor) populations during 2005–2009. Reference populations were
individuals sampled in Texas and New Mexico during 1985–2010: New Mexico (n¼ 31), southern Texas (n¼ 28), and western Texas (n¼ 178).
All dispersers are adults except PC004 and PC123, whose ages are unknown. All samples are males except PC123 (female). Assignment values
from GeneClass and structure indicate likelihood ratio scores and estimated ancestry proportions (q-values) to each population, respectively.
Likelihood ratios .85% and q-values .0.85 indicate substantial support for assignment. Values from BAPS represent 2 times the absolute of
change in the log marginal likelihood of individual i being alternatively assigned to cluster j. Values of 0 are the assigned reference population,
and movement to another population with a change �6 indicates significant support for assignment.
Sample Sample location
GeneClass structure BAPS
New
Mexico
Southern
Texas
Western
Texas
New
Mexico
Southern
Texas
Western
Texas
New
Mexico
Southern
Texas
Western
Texas
PC001 Bossier City, Louisiana 99.09 0.91 0.00 0.89 0.02 0.10 0.00 9.80 25.20
PC003 Kerr County, Texas 30.67 12.91 56.42 0.33 0.04 0.63 1.60 2.80 0.00
PC004 Fisher County, Texas 0.10 0.03 99.88 0.02 0.00 0.98 13.80 16.60 0.00
PC042 Deaf Smith County, Texas 99.86 0.00 0.14 0.99 0.00 0.01 0.00 22.60 13.40
PC123 Edwards County, Texas 0.00 0.00 99.99 0.00 0.00 0.99 21.00 22.20 0.00
PC163 Real County, Texas 0.01 1.81 98.19 0.01 0.01 0.98 19.60 8.20 0.00
PC164 Kimble County, Texas 65.55 0.00 34.45 0.54 0.00 0.46 0.00 24.00 1.00
PC165 Sutton County, Texas 0.17 0.11 99.72 0.07 0.00 0.93 13.20 13.80 0.00
998 Vol. 93, No. 4JOURNAL OF MAMMALOGY
ANDERSON, C. R., F. G. LINDZEY, AND D. B. MCDONALD. 2004. Genetic
structure of cougar populations across the Wyoming basin:
metapopulation or megapopulation. Journal of Mammalogy
85:1207–1214.
BAILEY, R. G. 1980. Description of the ecoregions of the United States.
United States Department of Agriculture, Miscellaneous Publication
1391:1–77.
BEIER, P. 2010. A focal species for conservation planning. Pp. 177–
189 in Cougar ecology and conservation (M. Hornocker and S.
Negri, eds.). University of Chicago Press, Chicago, Illinois.
COOLEY, H. S., R. B. WIELGUS, G. M. KOEHLER, H. S. ROBINSON, AND B.
T. MALETZKE. 2009. Does hunting regulate cougar populations? A
test of the compensatory mortality hypothesis. Ecology 90:2913–
2921.
CORANDER, J., P. MARTTINEN, AND S. MANTYNIEMI. 2006. Bayesian
identification of stock mixtures from molecular marker data.
Fishery Bulletin 104:550–558.
CORANDER, J., P. MARTTINEN, J. SIREN, AND J. TANG. 2008a. Enhanced
Bayesian modelling in BAPS software for learning genetic
structures of populations. BMC Bioinformatics 9:539.
CORANDER, J., P. MARTTINEN, J. SIREN, AND J. TANG. 2009. BAPS:
Bayesian analysis of population structure. Program manual. Abo
Akademi University, Turku, Finland.
CORANDER, J., J. SIREN, AND E. ARJAS. 2008b. Bayesian spatial
modeling of genetic population structure. Computational Statistics
23:111–129.
CORANDER, J., P. WALDMANN, AND M. J. SILLANPAA. 2003. Bayesian
analysis of genetic differentiation between populations. Genetics
163:367–374.
CULVER, M., W. E. JOHNSON, J. PECON-SLATTERY, AND S. J. O’BRIEN.
2000. Genomic ancestry of the American puma (Puma concolor).
Journal of Heredity 91:186–197.
DEYOUNG, R. W., AND R. L. HONEYCUTT. 2005. The molecular toolbox:
genetic techniques in wildlife ecology and management. Journal of
Wildlife Management 69:1362–1384.
ECKERT, C. G., K. E. SAMIS, AND S. C. LOUGHEED. 2008. Genetic
variation across species’ geographic ranges: the central–marginal
hypothesis and beyond. Molecular Ecology 17:1170–1188.
EPPERSON, B. K. 2004. Multilocus estimation of genetic structure
within populations. Theoretical Population Biology 65:227–237.
ERNEST, H. B., W. M. BOYCE, V. C. BLEICH, B. MAY, S. J. STIVER, AND
S. G. TORRES. 2003. Genetic structure of mountain lion (Pumaconcolor) populations in California. Conservation Genetics 4:353–
366.
EVANNO, G., S. REGNAUT, AND J. GOUDET. 2005. Detecting the number
of clusters of individuals using the software STRUCTURE: a
simulation study. Molecular Ecology 14:2611–2620.
EXCOFFIER, L., AND H. E. L. LISCHER. 2010. Arlequin suite ver 3.5: a
new series of programs to perform population genetics analyses
under Linux and Windows. Molecular Ecology Resources 10:564–
567.
FALUSH, D., M. STEPHENS, AND J. K. PRITCHARD. 2003. Inference of
population structure using multilocus genotype data: linked loci and
correlated allele frequencies. Genetics 164:1567–1587.
FRANTZ, A. C., S. CELLINA, A. KRIER, L. SCHLEY, AND T. BURKE. 2009.
Using spatial Bayesian methods to determine the genetic structure
of a continuously distributed population: clusters or isolation by
distance? Journal of Applied Ecology 46:493–505.
FRANTZ, A. C., ET AL. 2006. Genetic structure and assignment tests
demonstrate illegal translocation of red deer (Cervus elaphus) into a
continuous population. Molecular Ecology 15:3191–3203.
GILAD, O., J. E. JANEKA, F. ARMSTRONG, M. E. TEWES, AND R. L.
HONEYCUTT. 2011. Cougars in the Guadalupe Mountains National
Park, Texas: estimates of occurrence and distribution using analysis
of DNA. Southwestern Naturalist 56:297–304.
GUILLOT, G., A. ESTOUP, F. MORTIER, AND J. F. COSSON. 2005a. A
spatial statistical model for landscape genetics. Genetics 170:1261–
1280.
GUILLOT, G., F. MORTIER, AND A. ESTOUP. 2005b. Geneland: a
computer package for landscape genetics. Molecular Ecology
Notes 5:712–715.
HAAG, T., ET AL. 2010. The effect of habitat fragmentation on the
genetic structure of a top predator: loss of diversity and high
differentiation among remnant populations of Atlantic Forest
jaguars (Panthera onca). Molecular Ecology 19:4906–4921.
HARDY, O. J., AND X. VEKEMANS, 1999. Isolation by distance in a
continuous population: reconciliation between spatial autocorrela-
tion analysis and population genetics models. Heredity 83:145–154.
HARDY, O. J., AND X. VEKEMANS. 2002. SPAGeDi: a versatile computer
program to analyze spatial genetic structure at the individual or
population levels. Molecular Ecology Notes 2:618–620.
HARDY, O. J., AND X. VEKEMANS. 2009. SPAGeDi 1.3 a program for
spatial pattern analysis of genetic diversity. Program manual.
Universite Libre de Bruxelles, Brussels, Belgium.
HARVESON, L. A. 1997. Ecology of a mountain lion population in
southern Texas. Ph.D. dissertation, Texas A&M University and
Texas A&M University–Kingsville, Kingsville.
HARVESON, L. A., M. E. TEWES, N. J. SILVY, AND J. RUTLEDGE. 1996.
Mountain lion research in Texas: past, present, and future. Pp. 45–
54 in Proceedings of the fifth mountain lion workshop (W. D.
Padly, ed.). Department of Fish and Game, San Diego, California.
HOLBROOK, J. D., R. W. DEYOUNG, M. E. TEWES, AND J. H. YOUNG. In
press. Demographic history of an elusive carnivore: using museums
to inform management. Evolutionary Applications. Holbrook et al.,
in press.
HOLSINGER, K. E., AND B. S. WEIR. 2009. Genetics in geographically
structured populations: defining, estimating and interpreting FST.
Nature Reviews Genetics 10:639–650.
HORNOCKER, M. 2010. Pressing buisness. Pp. 235–247 in Cougar
ecology and conservation (M. Hornocker and S. Negri, eds.).
University of Chicago Press, Chicago, Illinois.
HURLBERT, S. H. 1971. The nonconcept of species diversity: a critique
and alternative parameters. Ecology 52:577–586.
KALINOWSKI, S. T. 2005. HP-RARE 1.0: a computer program for
performing rarefaction on measures of allelic richness. Molecular
Ecology Notes 5:187–189.
KASS, R. E., AND A. E. RAFTERY. 1995. Bayes factors. Journal of the
American Statistical Association 90:773–795.
LARUE, M. A., AND C. K. NIELSEN. 2008. Modeling potential dispersal
corridors for cougars in midwestern North America using least-cost
path methods. Ecological Modelling 212:372–381.
LATCH, E. K., G. DHARMARAJAN, J. C. GLAUBITZ, AND O. E. RHODES.
2006. Relative performance of Bayesian clustering software for
inferring population substructure and individual assignment at low
levels of population differentiation. Conservation Genetics 7:295–
302.
LATCH, E. K., D. G. SCOGNAMILLO, J. A. FIKE, M. J. CHAMBERLAIN, AND
O. E. RHODES. 2008. Deciphering ecological barriers to North
American river otter (Lontra canadensis) gene flow in the Louisiana
landscape. Journal of Heredity 99:265–274.
LEHMANN, V. W. 1969. Forgotten legions. Texas Western Press,
University of Texas–El Paso, El Paso.
August 2012 999HOLBROOK ET AL.—GENETICS OF MOUNTAIN LIONS IN TEXAS
LOGAN, K. A., AND L. L. SWEANOR. 2001. Desert puma: evolutionary
ecology and conservation of an enduring carnivore. Island Press,
Washington D.C.
LOGAN, K. A., AND L. L. SWEANOR. 2010. Behavior and social
organization of a solitary carnivore. Pp. 105–117 in Cougar ecology
and conservation (M. Hornocker and S. Negri, eds.). University of
Chicago Press, Chicago, Illinois.
LONGMIRE, J. L., M. MALTBIE, AND R. J. BAKER. 1997. Use of lysis
buffer in DNA isolation and its implications for museum
collections. Occasional Papers, The Museum, Texas Tech Univer-
sity 163:1–3.
LOXTERMAN, J. L. 2011. Fine scale population structure of pumas in the
Intermountain West. Conservation Genetics 12:1049–1059.
MANEL, S., P. BERTHIER, AND G. LUIKART. 2002. Detecting wildlife
poaching: identifying the origin of individuals with Bayesian
assignment tests and multilocus genotypes. Conservation Biology
16:650–659.
MCRAE, B. H., P. BEIER, L. E. DEWALD, L. Y. HUYNH, AND P. KEIM.
2005. Habitat barriers limit gene flow and illuminate historical
events in a wide-ranging carnivore, the American puma. Molecular
Ecology 14:1965–1977.
MENOTTI-RAYMOND, M., ET AL. 1999. A genetic linkage map of
microsatellites in the domestic cat (Felis catus). Genomics 57:9–23.
NEI, M. 1987. Molecular evolutionary genetics. Columbia University
Press, New York.
ONORATO, D. P., E. C. HELLGREN, R. A. VAN DEN BUSSCHE, D. L.
DOAN-CRIDER, AND J. R. SKILES. 2007. Genetic structure of American
black bears in the desert southwest of North America: conservation
implications for recolonization. Conservation Genetics 8:565–576.
PIRY, S., A. ALAPETITE, J. M. CORNUET, D. PAETKAU, L. BAUDOUIN, AND
A. ESTOUP. 2004. GeneClass2: a software for genetic assignment
and first-generation migrant detection. Journal of Heredity 95:536–
539.
PITTMAN, M. T., G. J. GUZMAN, AND B. P. MCKINNEY. 2000. Ecology of
the mountain lion on Big Bend Ranch State Park in Trans-Pecos
region of Texas. Texas Parks and Wildlife Department, Final
Report Project 86:1–53.
PRITCHARD, J. K., M. STEPHENS, AND P. DONNELLY. 2000. Inference of
population structure using multilocus genotype data. Genetics
155:945–959.
PRITCHARD, J. K., X. WEN, AND D. FALUSH. 2007. Documentation for
structure software: version 2.2. Program manual. University of
Chicago, Chicago, Illinois.
R DEVELOPMENT CORE TEAM. 2011. R: a language and environment for
statistical computing. R Foundation for Statistical Computing,
Vienna, Austria. http://www.R-project.org. Accessed 14 March
2011.
RANNALA, B., AND J. L. MOUNTAIN. 1997. Detecting immigration by
using multilocus genotypes. Proceedings of the National Academy
of Sciences 94:9197–9201.
ROUSSET, F. 1997. Genetic differentiation and estimation of gene flow
from F-statistics under isolation by distance. Genetics 145:1219–
1228.
RUSS, W. B. 1996. The status of the mountain lion in Texas. Pp. 30–31
in Proceedings of the fifth mountain lion workshop (W. D. Padly,
ed.). Department of Fish and Game, San Diego, California.
SCHMIDLY, D. J. 2004. The mammals of Texas. 6th ed. University of
Texas Press, Austin.
SCHWARTZ, M. K., AND K. S. MCKELVEY. 2009. Why sampling scheme
matters: the effect of sampling scheme on landscape genetic results.
Conservation Genetics 10:411–452.
SCHWARTZ, M. K., L. S. MILLS, Y. ORTEGA, L. F. RUGGIERO, AND F. W.
ALLENDORF. 2003. Landscape location affects genetic variation of
Canada lynx (Lynx canadensis). Molecular Ecology 12:1807–1816.
SCRIBNER, K. T., ET AL. 2005. Geographical genetics: conceptual
foundations and empirical applications of spatial genetic data in
wildlife management. Journal of Wildlife Management 69:1434–
1453.
SINCLAIR, E. A., E. L. SWENSON, M. L. WOLFE, D. C. CHOATE, B. GATES,
AND K. A. CRANALL. 2001. Gene flow estimates in Utah’s cougars
imply management beyond Utah. Animal Conservation 4:257–264.
SPONG, G., M. JOHANSSON, AND M. BJORKLUND. 2000. High genetic
variation in leopards indicates large and long-term stable effective
population size. Molecular Ecology 9:1773–1782.
SWEANOR, L. L., K. A. LOGAN, AND M. G. HORNOCKER. 2000. Cougar
dispersal patterns, metapopulation dynamics, and conservation.
Conservation Biology 14:798–808.
THOMPSON, D. J., AND J. A. JENKS. 2005. Long-distance dispersal by a
subadult male cougar from the Black Hills, South Dakota. Journal
of Wildlife Management 69:818–820.
THOMPSON, D. J., AND J. A. JENKS. 2010. Dispersal movements of
subadult cougars from the Black Hills: the notions of range
expansion and recolonization. Ecosphere 1:1–11.
WADE, D. A., D. W. HAWTHORNE, G. L. NUNLEY, AND M. CAROLINE.
1984. History and status of predator control in Texas. Pp. 122–131
in Proceedings of the eleventh vertebrate pest conference (D. O.
Clark, ed.). University of Nebraska, Lincoln.
WALKER, C. W., L. A. HARVESON, M. T. PITTMAN, M. E. TEWES, AND R.
L. HONEYCUTT. 2000. Microsatellite variation in two populations of
mountain lions (Puma concolor) in Texas. Southwestern Naturalist
45:196–203.
WASSER, S. K., ET AL. 2008. Combating the illegal trade in African
elephant ivory with DNA forensics. Conservation Biology
22:1065–1071.
WEIR, B. S., AND C. C. COCKERHAM. 1984. Estimating F-statistics for
the analysis of population structure. Evolution 38:1358–1370.
YOUNG, J. H. 2009. Estimating mountain lion population parameters in
Texas. Ph.D. dissertation, Texas A&M University–Kingsville,
Kingsville.
YOUNG, J. H., M. E. TEWES, A. M. HAINES, G. GUZMAN, AND S. J.
DEMASO. 2010. Survival and mortality of cougars in the Trans-
Pecos region. Southwestern Naturalist 55:411–418.
Submitted 10 September 2011. Accepted 11 February 2012.
Associate Editor was Bradley J. Swanson.
1000 Vol. 93, No. 4JOURNAL OF MAMMALOGY
Copyright © 2022 FDOKUMEN