Genetic diversity and population structure of the endangered insect species Carabus variolosus in...
12
Theor Appl Genet (2008) 117:413–424 DOI 10.1007/s00122-008-0785-4 123 ORIGINAL PAPER Genetic diversity and population structure of pea (Pisum sativum L.) varieties derived from combined retrotransposon, microsatellite and morphological marker analysis Petr Smýkal · Miroslav Hýbl · Jukka Corander · Jilí Jarkovský · Andrew J. Flavell · Miroslav Griga Received: 5 October 2007 / Accepted: 2 May 2008 / Published online: 27 May 2008 © Springer-Verlag 2008 Abstract One hundred and sixty-four accessions repre- senting Czech and Slovak pea (Pisum sativum L.) varieties bred over the last 50 years were evaluated for genetic diver- sity using morphological, simple sequence repeat (SSR) and retrotransposon-based insertion polymorphism (RBIP) markers. Polymorphic information content (PIC) values of 10 SSR loci and 31 RBIP markers were on average high at 0.89 and 0.73, respectively. The silhouette method after the Ward clustering produced the most probable cluster esti- mate, identifying nine clusters from molecular data and Wve to seven clusters from morphological characters. Principal component analysis of nine qualitative and eight quantita- tive morphological parameters explain over 90 and 93% of total variability, respectively, in the Wrst three axes. Multidimensional scaling of molecular data revealed a con- tinuous structure for the set. To enable integration and eval- uation of all data types, a Bayesian method for clustering was applied. Three clusters identiWed using morphology data, with clear separation of fodder, dry seed and aWla types, were resolved by DNA data into 17, 12 and Wve sub- clusters, respectively. A core collection of 34 samples was derived from the complete collection by BAPS Bayesian analysis. Values for average gene diversity and allelic rich- ness for molecular marker loci and diversity indexes of phenotypic data were found to be similar between the two collections, showing that this is a useful approach for repre- sentative core selection. Introduction The demand for productivity and homogeneity in crops has resulted in a limited number of standard, high-yielding varieties, at the price of the loss of heterogeneous tradi- tional local varieties (landraces), a process known as genetic erosion. Landraces and older crop varieties preserve much of this lost diversity and comprise the genetic resources for breeding new crop varieties to cope with envi- ronmental and demographic changes (Esquinas-Alacazar 2005). To prevent the extinction of such genotypes, ex situ conservation of germplasm resources was pioneered by Vavilov (1926) and nowadays, germplasm collections hold over 6 million crop plant accessions world-wide. The study of genetic diversity for both germplasm management and breeding has received much attention, Communicated by D. A. Hoisington. Electronic supplementary material The online version of this article (doi:10.1007/s00122-008-0785-4) contains supplementary material, which is available to authorized users. P. Smýkal (&) · M. Hýbl · M. Griga Plant Biotechnology Department, Agritec Plant Research Ltd, Zem5d5lská 2520/16, 787 01 Kumperk, Czech Republic e-mail: [email protected] M. Hýbl Grain Legumes Department, Agritec Plant Research Ltd, Zem5d5lská 2520/16, 787 01 Kumperk, Czech Republic J. Corander Department of Mathematics and Statistics, Åbo Akademi University, P.O. Box 68, Turku 20500, Finland J. Jarkovský Institute of Biostatistics and Analysis, Masaryk University, Kamenice 3, 625 00 Brno, Czech Republic A. J. Flavell Plant Research Unit, University of Dundee at SCRI, Invergowrie, Dundee DD2 5DA, Scotland, UK
-
Upload
independent -
Category
Documents
-
view
0 -
download
0
Transcript of Genetic diversity and population structure of the endangered insect species Carabus variolosus in...

Theor Appl Genet (2008) 117:413–424
DOI 10.1007/s00122-008-0785-4ORIGINAL PAPER
Genetic diversity and population structure of pea (Pisum sativum L.) varieties derived from combined retrotransposon, microsatellite and morphological marker analysis
Petr Smýkal · Miroslav Hýbl · Jukka Corander · Jilí Jarkovský · Andrew J. Flavell · Miroslav Griga
Received: 5 October 2007 / Accepted: 2 May 2008 / Published online: 27 May 2008© Springer-Verlag 2008
Abstract One hundred and sixty-four accessions repre-senting Czech and Slovak pea (Pisum sativum L.) varietiesbred over the last 50 years were evaluated for genetic diver-sity using morphological, simple sequence repeat (SSR)and retrotransposon-based insertion polymorphism (RBIP)markers. Polymorphic information content (PIC) values of10 SSR loci and 31 RBIP markers were on average high at0.89 and 0.73, respectively. The silhouette method after theWard clustering produced the most probable cluster esti-mate, identifying nine clusters from molecular data and Wve
to seven clusters from morphological characters. Principalcomponent analysis of nine qualitative and eight quantita-tive morphological parameters explain over 90 and 93%of total variability, respectively, in the Wrst three axes.Multidimensional scaling of molecular data revealed a con-tinuous structure for the set. To enable integration and eval-uation of all data types, a Bayesian method for clusteringwas applied. Three clusters identiWed using morphologydata, with clear separation of fodder, dry seed and aWlatypes, were resolved by DNA data into 17, 12 and Wve sub-clusters, respectively. A core collection of 34 samples wasderived from the complete collection by BAPS Bayesiananalysis. Values for average gene diversity and allelic rich-ness for molecular marker loci and diversity indexes ofphenotypic data were found to be similar between the twocollections, showing that this is a useful approach for repre-sentative core selection.
Introduction
The demand for productivity and homogeneity in crops hasresulted in a limited number of standard, high-yieldingvarieties, at the price of the loss of heterogeneous tradi-tional local varieties (landraces), a process known asgenetic erosion. Landraces and older crop varieties preservemuch of this lost diversity and comprise the geneticresources for breeding new crop varieties to cope with envi-ronmental and demographic changes (Esquinas-Alacazar2005). To prevent the extinction of such genotypes, ex situconservation of germplasm resources was pioneered byVavilov (1926) and nowadays, germplasm collections holdover 6 million crop plant accessions world-wide.
The study of genetic diversity for both germplasmmanagement and breeding has received much attention,
Communicated by D. A. Hoisington.
Electronic supplementary material The online version of this article (doi:10.1007/s00122-008-0785-4) contains supplementary material, which is available to authorized users.
P. Smýkal (&) · M. Hýbl · M. GrigaPlant Biotechnology Department, Agritec Plant Research Ltd, Zem5d5lská 2520/16, 787 01 Kumperk, Czech Republice-mail: [email protected]
M. HýblGrain Legumes Department, Agritec Plant Research Ltd, Zem5d5lská 2520/16, 787 01 Kumperk, Czech Republic
J. CoranderDepartment of Mathematics and Statistics, Åbo Akademi University, P.O. Box 68, Turku 20500, Finland
J. JarkovskýInstitute of Biostatistics and Analysis, Masaryk University, Kamenice 3, 625 00 Brno, Czech Republic
A. J. FlavellPlant Research Unit, University of Dundee at SCRI, Invergowrie, Dundee DD2 5DA, Scotland, UK
123

414 Theor Appl Genet (2008) 117:413–424
especially following the introduction of the core collectionconcept by Frankel and Brown (1984). For legumes, corecollections have been deWned using various strategies,varying from random and stratiWed sampling strategies(Erskine and Muehlbauer 1991) to the use of evolutionary,agroecological and/or molecular data (Tohme et al. 1995;Baranger et al. 2004). Morphological descriptors are widelyused in deWning germplasm groups and remain the onlylegitimate marker type accepted by the international unionfor the protection of new varieties of plants (UPOV). Mor-phological traits represent the action of numerous genesand thus contain high information value but can be unreli-able owing to a strong inXuence of the environment. Incontrast, molecular markers accurately represent theunderlying genetic variation and now dominate the geneticdiversity Weld. Initially, storage proteins and isozymes(Brown and Weir 1983) were applied to assess diversity butthese do not provide suYcient polymorphism and can suVerfrom tissue and environment inXuence. Therefore, DNA-based descriptors of genetic diversity have largely super-seded protein-based methods. A variety of DNA markermethods have been widely used for diversity analysis inplants, including randomly ampliWed polymorphic DNA(RAPD) markers (Williams et al. 1990), inter-simplesequence repeat (ISSR; Zietkiewicz et al. 1994), ampliWedfragment length polymorphism (AFLP; Vos et al. 1995)and simple sequence repeat (SSR; Beckmann and Soller1990).
For the analysis of pea diversity, SSRs have been popu-lar because of their high polymorphism level and informa-tion content, co-dominance and good reproducibility(Burstin et al. 2001; Ford et al. 2002; Baranger et al. 2004;Loridon et al. 2005). A potential problem in using SSRs forcharacterising highly diverse germplasm is homoplasy,associated with the high mutation rate and the possibility ofback-mutation exhibited by this marker type. Marker sys-tems based on retrotransposon insertion polymorphismhave also been widely used for phylogeny and genetic rela-tionship studies in pea. Sequence-speciWc ampliWcationpolymorphism (SSAP; Waugh et al. 1997) is a multiplexapproach that reveals large numbers of polymorphic inser-tions in a single gel assay (Ellis et al. 1998). An alternativeis inter-retrotransposon ampliWed polymorphism (IRAP;Kalendar et al. 1999; Smýkal 2006) which requires only asimple PCR, using retrotransposon primer(s), followed bygel analysis. Both methods, however, suVer from the domi-nant nature of detection and problems with reproducibilitybetween experiments. Retrotransposon-based insertionalpolymorphism (RBIP) avoids these drawbacks by scoringboth presence and absence of individual insertions, with acombination of retrotransposon-speciWc and Xanking host-speciWc primers (Flavell et al. 1998). RBIP is more accuratefor studies of deeper phylogeny in highly diverse germplasm
owing to its co-dominant nature and has been adapted to ahigh throughput microarray format (Flavell et al. 2003; Jinget al. 2005, 2007).
Improvements in marker methods for revealing geneticdiversity have been accompanied by corresponding reWne-ments in computational methods to convert raw markerdata into useful representations of diversity. Distance-basedmethods were initially used (Reif et al. 2005). Bayesianapproaches oVer an alternative for germplasm geneticstructure assessment (Pritchard et al. 2000; Falush et al.2003; Corander et al. 2004, 2007; Maccaferri et al. 2005)and the incorporation of probability, measures of supportand complex model and data character processing (Beau-mont and Rannala 2004), makes them more attractive.
The aim of this study was to investigate genetic diversityin a selection of pea assessions, which have been used inCzech and Slovak breeding over the last ca. 50 years. Wehave combined morphological qualitative and quantitativecharacters, with RBIP and SSR markers and tested a varietyof clustering approaches to reveal the diversity of the sam-ple set and suggest the composition of a working core col-lection to faithfully represent this germplasm.
Material and methods
Plant materials
One hundered and sixty-four Pisum sativum sp. sativumaccessions were obtained from the pea collection of theCzech gene bank held in AGRITEC Ltd. (Electronic sup-plementary material S1). Cultivars Gotik, Alan, Adept andBohatyr were included as controls for quantitative traits.
Analysis of morphological descriptors
Plants were grown in Weld trials in 2004 and 2005 at Kum-perk (Czech Republic) on orthic luvisol soils at 315 m alti-tude, with long term average temperature of 8°C and longterm rainfall of 693 mm. The trials used a randomised com-plete block design with three replicates. Thirty-three char-acters (for stem, leaXets, stipules, Xowers, pods and seeds)were evaluated (ESM S3a, b) according to the descriptorlist of genus Pisum L. (Pavelková et al. 1986). All plantschosen for DNA extraction were Wrst described morpholog-ically.
DNA isolation
Young leaves from ten randomly chosen plants per acces-sion were bulked together and stored at ¡80°C until DNAisolation. Genomic DNAs were manually isolated by amodiWed CTAB method (Smýkal 2006). DNAs obtained
123

Theor Appl Genet (2008) 117:413–424 415
from approximately 100 mg fresh weight leaf material peraccession were resuspended in 300 �l of TE buVer at con-centration of 50–100 ng/�l and stored at –20°C until use.
DNA marker analysis
SSR primer pairs (Table 1) were selected from Ford et al.(2002) and Loridon et al. (2005). PCRs and gel analysiswere performed as described in Smýkal et al. (2007). RBIPanalysis was performed according to Flavell et al. (2003),with the exception that BioTools Taq DNA polymerase(BioTools S.A., Madrid, Spain) was used. The following 31RBIP primers pairs were selected from Jing et al. (2005):Birte-B1, Birte-x5, Birte-x16, Birte-x28, MKRBIP3,MKRBIP4, MKRBIP7, 1006-x19, 1006nr27, 1006nr13,399-14-9, 45x31, 64x45, 281x5, 281x40, 281x16, 281x44,2055nr1, 2055nr23, 95x2, 1794x35, 2055nr36, 2055nr51,1794-2, 399-80-46, 1794-1, 2385x23, 2385x64, 2201Cyc6,1074Cyc12, 1074cyc29. PCRs, as described in Jing et al.(2005), were resolved by electrophoresis on 1.5 or 2% aga-rose-TBE gels (Serva, Heidelberg, Germany) using UV-visualised ethidium bromide staining.
Genetic similarity, cluster and structure analysis
SSR and RBIP scores were converted into binary data bypresence (1) or absence (0) of the selected fragment. In thecase of RBIP analysis, a fourth state, namely completeabsence of any PCR product corresponding to primer sitemutation (Jing et al. 2005) was added. Genetic similaritycoeYcients were calculated using the Jaccard index of sim-ilarity (Nei 1973, 1978; Reif et al. (2005) using SPSS 12software (SPSS 2003). Polymorphic information content(PIC) was calculated for each marker using the followingformula: PICi = 1 ¡ �P2ij, where Pij is the frequency of
the jth allele in clone (i). For the visualisation of geneticdata in factorial space, multidimensional scaling (MDS)based on similarity matrix of Jaccard coeYcients, wasadopted (Kruskal 1964). Morphological descriptors wereanalysed using principal component analysis (PCA). In afurther analysis, the multivariate space of morphologicaldescriptors was combined with genetic variabilitydescribed by the multidimensional scaling (MDS). Clusteranalysis was performed on the genetic similarity matricesby the method of Ward (1963) using Statistica for Windows7.1. (StatSoft 2006). The silhouette method was applied forthe identiWcation of the optimal number of the most homo-geneous clusters (Rousseeuw 1987). The resulting clusterswere expressed as dendrograms. Goodness of Wt wasassessed by Mantel test (Mantel 1967) using NTSYS-pcversion 2.2 (Rohlf 2006). The PopGene program (version1.32.; Yeh and Boyle 1997) was used to calculate the fol-lowing parameters: allele frequencies at each locus forcomplete and subdivided populations; gene diversity Hvalue (Nei 1973), expected and observed homozygosities,population genetic distance expressed as Nei unbiasedgenetic distance (Nei 1978), F-statistic (Wright 1965;Reynolds et al. 1983) and Shannon index (Lewontin 1972).
Bayesian structure analysis
To investigate the genetic structure of the pea collection,the Bayesian method available in the BAPS software (Cor-ander et al. 2004, 2007; Corander and Martiinen 2006) wasused. Initial screening of the morphological charactersrevealed them to be highly informative. Therefore, the sam-ple set was Wrst clustered using the BAPS model for the dis-crete-valued traits. As a single clustering solution withthree clusters was conclusively supported, the moleculardata were subsequently analysed separately for each of
Table 1 List of SSR loci used in this study
Indicated linkage groups and map positions according to Loridon et al. (2005)
SSR locus Linkage group
Position (cM)
Number of alleles
Observed heterozygozity
Size range(bp)
Polymorphic information content (PIC)
AA-67 I 80.3 6 0.012 330–390 0.882
AD-186 II 36.2 8 0.147 220–320 0.961
AD-270 III 254.3 7 0.0 230–290 0.964
A-278 III 154.9 3 0.062 130–170 0.827
A-9 IV 62.1 3 0.073 330–380 0.886
AA-163 V 100.3 5 0.120 250–320 0.869
AD-141 VI 70.1 7 0.185 210–330 0.973
B-14 VII 113.9 4 0.017 430–470 0.929
AD-237 VII 152.1 7 0.073 1 220–360 0.934
AB-65 VII 94.1 3 0.0 1 140–180 0.697
Mean 5.3 0.069 0.892
123
416 Theor Appl Genet (2008) 117:413–424
these three clusters. In all analyses the clustering was doneusing the model for non-linked markers and the estimationwas performed using 30 replicate runs of the algorithm,with the a priori upper boundary for the number of clustersranging between 10 and 40.
Core set analysis:
To test the utility of BAPS-based core set selection, geneticdiversity parameters of selected accessions were analysedusing FSTAT v2.9.3.2 (Goudet 1995) and PopGene v1.32.(Yeh and Boyle 1997). Gene diversity, allelic richness andWxation indices were computed. To compare morphologicaldiversity, Shannon–Weaver Diversity Indexes were com-puted for each trait separately (Shannon and Weaver 1962)according to Nersting et al. (2006).
Results
Marker analysis and allelic richness of SSR and RBIP data
We surveyed 164 pea accessions using 10 SSR loci(Table 1). A total of 53 alleles were identiWed with a mini-mum three and maximum eight alleles per locus. Twelverare alleles (22%) with frequencies below 0.05 were foundat six SSR loci. Calculated PIC values were high, rangingfrom 0.697 to 0.964, with an average of 0.89. Heterogene-ity, associated with the use of ten bulked plants per acces-sion, was detected in 60 out of 164 accessions (37%) ateight loci, averaging 0.069. Analysis of individual plants in
the case of 15 such accessions, indicated heterogeneitybetween plants rather than heterozygosity (data not shown).
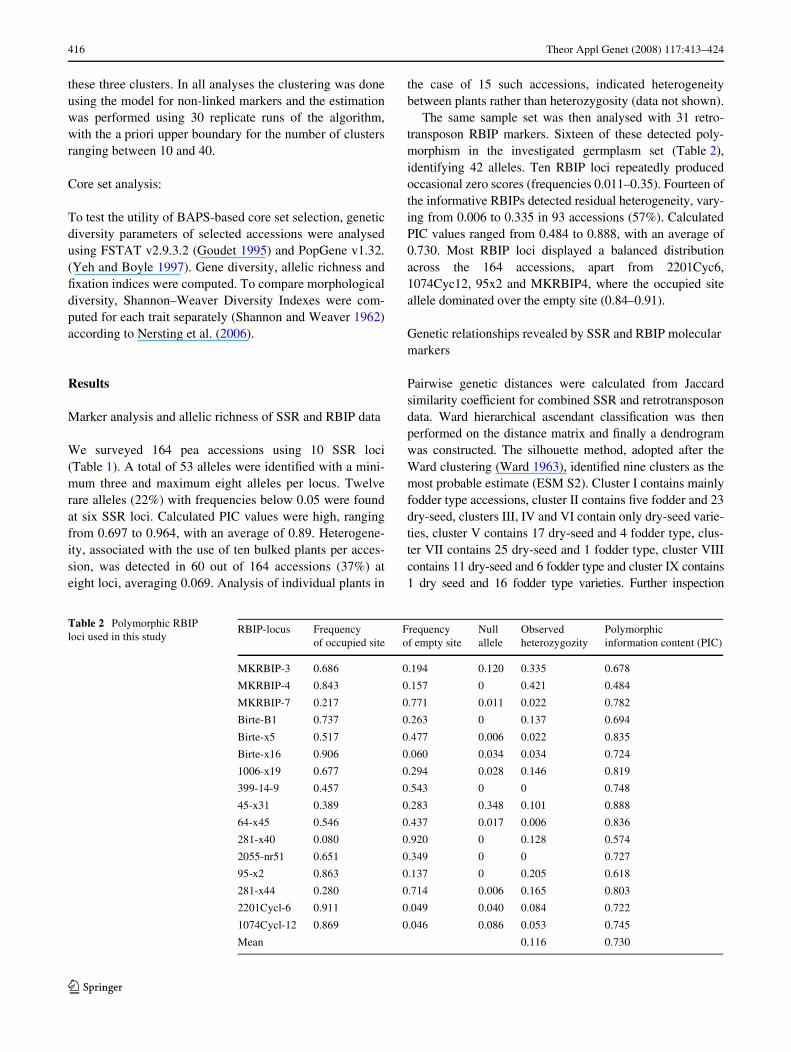
The same sample set was then analysed with 31 retro-transposon RBIP markers. Sixteen of these detected poly-morphism in the investigated germplasm set (Table 2),identifying 42 alleles. Ten RBIP loci repeatedly producedoccasional zero scores (frequencies 0.011–0.35). Fourteen ofthe informative RBIPs detected residual heterogeneity, vary-ing from 0.006 to 0.335 in 93 accessions (57%). CalculatedPIC values ranged from 0.484 to 0.888, with an average of0.730. Most RBIP loci displayed a balanced distributionacross the 164 accessions, apart from 2201Cyc6,1074Cyc12, 95x2 and MKRBIP4, where the occupied siteallele dominated over the empty site (0.84–0.91).
Genetic relationships revealed by SSR and RBIP molecular markers
Pairwise genetic distances were calculated from Jaccardsimilarity coeYcient for combined SSR and retrotransposondata. Ward hierarchical ascendant classiWcation was thenperformed on the distance matrix and Wnally a dendrogramwas constructed. The silhouette method, adopted after theWard clustering (Ward 1963), identiWed nine clusters as themost probable estimate (ESM S2). Cluster I contains mainlyfodder type accessions, cluster II contains Wve fodder and 23dry-seed, clusters III, IV and VI contain only dry-seed varie-ties, cluster V contains 17 dry-seed and 4 fodder type, clus-ter VII contains 25 dry-seed and 1 fodder type, cluster VIIIcontains 11 dry-seed and 6 fodder type and cluster IX contains1 dry seed and 16 fodder type varieties. Further inspection
Table 2 Polymorphic RBIP loci used in this study
RBIP-locus Frequency of occupied site
Frequency of empty site
Null allele
Observed heterozygozity
Polymorphic information content (PIC)
MKRBIP-3 0.686 0.194 0.120 0.335 0.678
MKRBIP-4 0.843 0.157 0 0.421 0.484
MKRBIP-7 0.217 0.771 0.011 0.022 0.782
Birte-B1 0.737 0.263 0 0.137 0.694
Birte-x5 0.517 0.477 0.006 0.022 0.835
Birte-x16 0.906 0.060 0.034 0.034 0.724
1006-x19 0.677 0.294 0.028 0.146 0.819
399-14-9 0.457 0.543 0 0 0.748
45-x31 0.389 0.283 0.348 0.101 0.888
64-x45 0.546 0.437 0.017 0.006 0.836
281-x40 0.080 0.920 0 0.128 0.574
2055-nr51 0.651 0.349 0 0 0.727
95-x2 0.863 0.137 0 0.205 0.618
281-x44 0.280 0.714 0.006 0.165 0.803
2201Cycl-6 0.911 0.049 0.040 0.084 0.722
1074Cycl-12 0.869 0.046 0.086 0.053 0.745
Mean 0.116 0.730
123

Theor Appl Genet (2008) 117:413–424 417
revealed that 33 out of 49 fodder types (67%) are found inclusters I and IX, clusters IV, V and VI contain mostly oldervarieties (registered up to 1975) and cluster VII containslargely modern varieties bred after the 1980s, including allaWla type accessions. Based on combined RBIP and SSRdata, the Nei genetic distances were 0.0689 and 0.1401,respectively for fodder and dry-seed type groups.
Cluster analysis using only RBIPs placed about one third offodder pea accessions in the same group as Weld peas, whilecombining SSR and RBIP data clustered 67% of fodder peaaccessions into two of the nine clusters (data not shown). In thecase of RBIP markers, no speciWc allele is linked to seed type,but 5 RBIP loci showed altered frequencies of occupied/emptysites. RBIP null alleles were detected in seven loci in the caseof fodder-types and nine in case of dry-seed types (data notshown). Average detected heterogeneities for RBIP and SSRloci were 0.15 and 0.05, respectively, for fodder and 0.06 and0.08, respectively, for dry-seed types. SSR-based cluster anal-ysis revealed both quantitative and qualitative diVerences fromthe RBIP results, with Wve alleles (<0.05 frequency) at threeSSR loci being speciWc for dry-seed pea, while three alleles atthree SSR loci were speciWc for fodder pea.
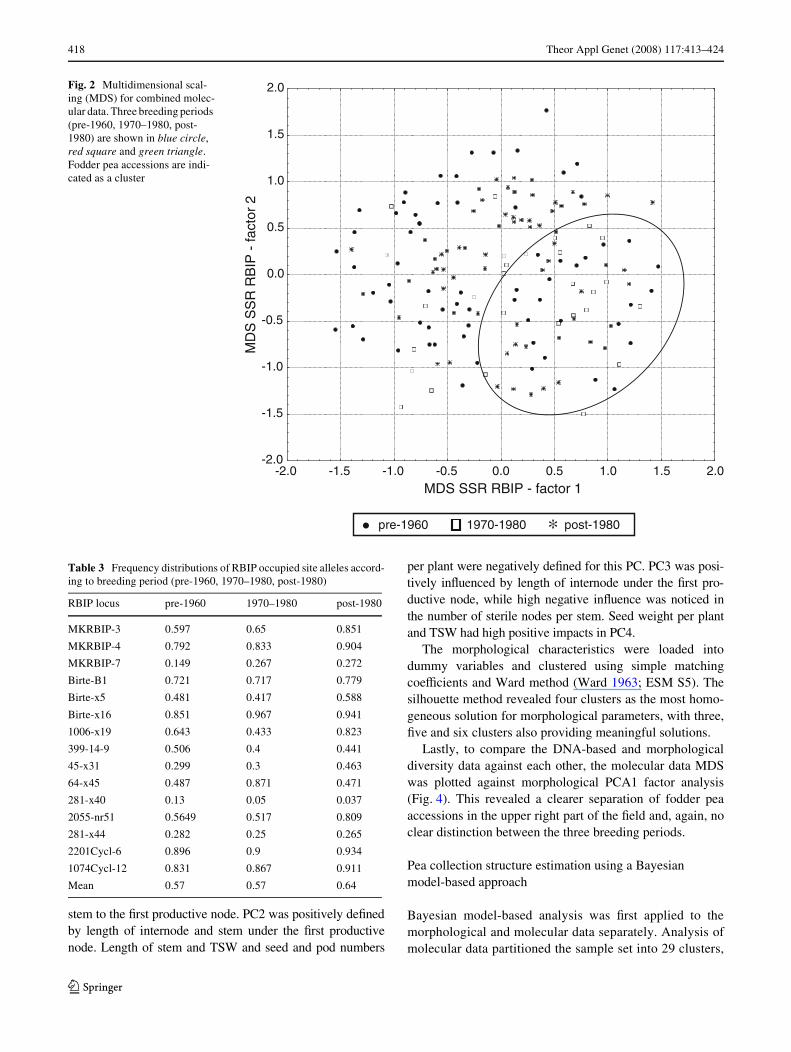
Frequency calculations for all SSR and RBIP marker-based distances of the entire data set resulted in a columngraph (Fig. 1a) with a normal-like distribution in the rangeof 0.2–1.0. To reveal another level of structure for thecollected sample set, multidimensional scaling (MDS) wasperformed on the SSR and RBIP data (Fig. 2). This identi-Wed a broad, continuous variation for the pea sample set,with no clear outgroup. Fodder pea types are conWnedlargely to the bottom right sector and dry-seed pea acces-sions are spread across the plot, indicating exchange ofgenetic material during the breeding process.
To compare genetic diversity in relation to breedingperiod, the sample set was divided into three sub-sets: theWrst consists of 91 older varieties and landraces establishedbefore 1950, the second comprises 19 samples from 1960to 1970 and the third contains 54 modern varieties (since1980). Although diVerences in allele frequencies both forRBIP (Table 3) and SSR (Fig. 3) were encountered, no sta-tistically signiWcant diVerences were observed between thethree periods using DNA marker data (not shown).
Morphology-based characterisation of pea diversity
The distribution of 15 qualitative and 18 quantitative mor-phological characteristics across the pea germplasm set ispresented in Supplementary material S3a, b. Calculation ofEuclidean distances derived from these data resulted inFig. 1b. The distribution lies in the range of 1.5–16.5 withtwo peaks discernible at 6–7 and 12–13.
Correlations between morphological characters wereexamined next. Numerous traits were strongly correlated,
for example stipules-character of anthocyan spot withXower-vexillum colour (r = 0.91), Xower-wings colour (r =0.94), seed-colour at full ripeness (r = 0.65) and seed-testacolour (r = 0.64). Nine out of the Wfteen qualitative traitswere used to estimate phenotypic diversity by PCA (ESMS4a). More than 90% of the total variation of qualitativetraits was explained three PCs (43.85, 36.64, and 5.86%),based on the nine qualitative eigenvectors. The Xower char-acters of anthocyan spotted stipules and colour of Xowerwings and wexillum, were the eigenvectors with high posi-tive loading for PC1. The leaf characters leaXet colour,shape, shape of leaXet apex and type of leaf, were compo-nents of PC2. Colour of seed testa had high positiveloading, whilst seed colour at full ripeness had high nega-tive loadings on PC3. SigniWcant correlations were foundalso between quantitative characters. For example, seednumber per plant correlated closely with pod number perplant (r = 0.90), thousand seed weight (TSW; r = ¡0.65)and seed weight per plant (r = 0.70).
Eight of the 18 quantitative traits were then used for eval-uation of morphologic diversity. PCA of quantitative traitsincluded 93% of total variation in four PCs (ESM S4b). Themost important eigenvectors for PC1 were seed and podnumber per plant, together with length of stem and length of
Fig. 1 Frequency calculation of distances for molecular and morpho-logical markers. a SSR and polymorphic RBIP markers. Values are ex-pressed as (q1-Jaccard similarity coeYcient) on the x axis. bEuclidean distances for qualitative and quantitative morphologicalcharacters
0
5
10
15
20
25
30
35
0.5
- 0.
55
0.56
- 0
.60
0.61
- 0
.65
0.66
- 0
.70
0.7
- 0.
75
0.76
- 0
.80
0.81
- 0
.85
0.86
- 0
.90
0.91
- 0
.95
0.96
- 1
Genetic distance
Dat
a d
istr
ibu
tio
n0
5
10
15
20
25
30
0 -
1.5
1.6
- 3.
0
3.1
- 4.
5
4.6
- 6.
0
6.1
- 7.
5
7.6
- 9.
0
9.1
- 10
.5
10.6
- 1
2.0
12.1
- 1
3.5
13.6
- 1
5.0
15.1
- 1
6.5
Euclidean distance
Dat
a d
istr
ibu
tio
n
a
b
123
418 Theor Appl Genet (2008) 117:413–424
stem to the Wrst productive node. PC2 was positively deWnedby length of internode and stem under the Wrst productivenode. Length of stem and TSW and seed and pod numbers
per plant were negatively deWned for this PC. PC3 was posi-tively inXuenced by length of internode under the Wrst pro-ductive node, while high negative inXuence was noticed inthe number of sterile nodes per stem. Seed weight per plantand TSW had high positive impacts in PC4.
The morphological characteristics were loaded intodummy variables and clustered using simple matchingcoeYcients and Ward method (Ward 1963; ESM S5). Thesilhouette method revealed four clusters as the most homo-geneous solution for morphological parameters, with three,Wve and six clusters also providing meaningful solutions.
Lastly, to compare the DNA-based and morphologicaldiversity data against each other, the molecular data MDSwas plotted against morphological PCA1 factor analysis(Fig. 4). This revealed a clearer separation of fodder peaaccessions in the upper right part of the Weld and, again, noclear distinction between the three breeding periods.
Pea collection structure estimation using a Bayesian model-based approach
Bayesian model-based analysis was Wrst applied to themorphological and molecular data separately. Analysis ofmolecular data partitioned the sample set into 29 clusters,
Fig. 2 Multidimensional scal-ing (MDS) for combined molec-ular data. Three breeding periods (pre-1960, 1970–1980, post-1980) are shown in blue circle, red square and green triangle. Fodder pea accessions are indi-cated as a cluster
MDS SSR RBIP - factor 1
MD
S S
SR
RB
IP -
fact
or 2
-2.0-2.0
-1.5
-1.5
-1.0
-1.0
-0.5
-0.5
0.0
0.0
0.5
0.5
1.0
1.0
1.5
2.0
1.5 2.0
• pre-1960 1970-1980 ∗ post-1980
Table 3 Frequency distributions of RBIP occupied site alleles accord-ing to breeding period (pre-1960, 1970–1980, post-1980)
RBIP locus pre-1960 1970–1980 post-1980
MKRBIP-3 0.597 0.65 0.851
MKRBIP-4 0.792 0.833 0.904
MKRBIP-7 0.149 0.267 0.272
Birte-B1 0.721 0.717 0.779
Birte-x5 0.481 0.417 0.588
Birte-x16 0.851 0.967 0.941
1006-x19 0.643 0.433 0.823
399-14-9 0.506 0.4 0.441
45-x31 0.299 0.3 0.463
64-x45 0.487 0.871 0.471
281-x40 0.13 0.05 0.037
2055-nr51 0.5649 0.517 0.809
281-x44 0.282 0.25 0.265
2201Cycl-6 0.896 0.9 0.934
1074Cycl-12 0.831 0.867 0.911
Mean 0.57 0.57 0.64
123

Theor Appl Genet (2008) 117:413–424 419
with a log marginal likelihood value of optimal partition at¡7184.9 and a probability of 0.948, showing highstructuring of the set (data not shown). Eleven of theseclusters contained nearly exclusively fodder type accessions,
four others grouped 23 out of 47 dry-seed accessions col-lected before 1965, while 17 of the 28 most recent dry-seed varieties released after 1989 were separated intothree clusters. The remaining clusters provided no clear
Fig. 3 Temporal changes in SSR allele frequencies in three breeding periods. Breeding periods are shown in Fig. 2. SSR markers used are AD-270, B-14, A-237 and AD-141. Allele sizes are in bp
AD-270
0%
20%
40%
60%
80%
100%
pre -1960 1970-1980 pos t-1980
Alle
le f
requ
ency 255
265
250
280
230
260
270
A-237
0%
20%
40%
60%
80%
100%
pre -1960 1970-1980 pos t-1980
Alle
le f
requ
ency 320
240
280
250
220
340
330
B-14
0%
20%
40%
60%
80%
100%
pre-1960 1970-1980 post-1980
Alle
le f
requ
ency
440
430
450
460
AD-141
0%
20%
40%
60%
80%
100%
pre -1960 1970-1980 pos t-1980
Alle
le f
requ
ency 330
280
210
220
230
320
325
Fig. 4 Plot of molecular data MDS versus morphological PCA1 factor analysis. Breeding periods are indicated in Fig. 2. Fodder pea accessions are indi-cated as a cluster
MDS SSR RBIP
-6-2.0 -1.5 -1.0 -0.5 0.0 0.5 1.0 1.5 2.0
-4
-2
0
2
4
6
• pre-1960 1970-1980 ∗ post-1980
123
420 Theor Appl Genet (2008) 117:413–424
assignment of the accessions to either type or breedingperiod. In the case of morphological data, three or sixclusters were found by optimal partitioning, with log mar-ginal likelihood values of ¡14971.4 for six clusters and¡17237.7 for three clusters. One cluster comprised 105dry-seed plus two fodder varieties, a second cluster com-prised 47 fodder accessions plus two dry-seed varietiesand the third cluster comprised eight dry seed varieties ofaWla type. Therefore, partitioning into three clusters wasaccepted, with a probability of 1.0.
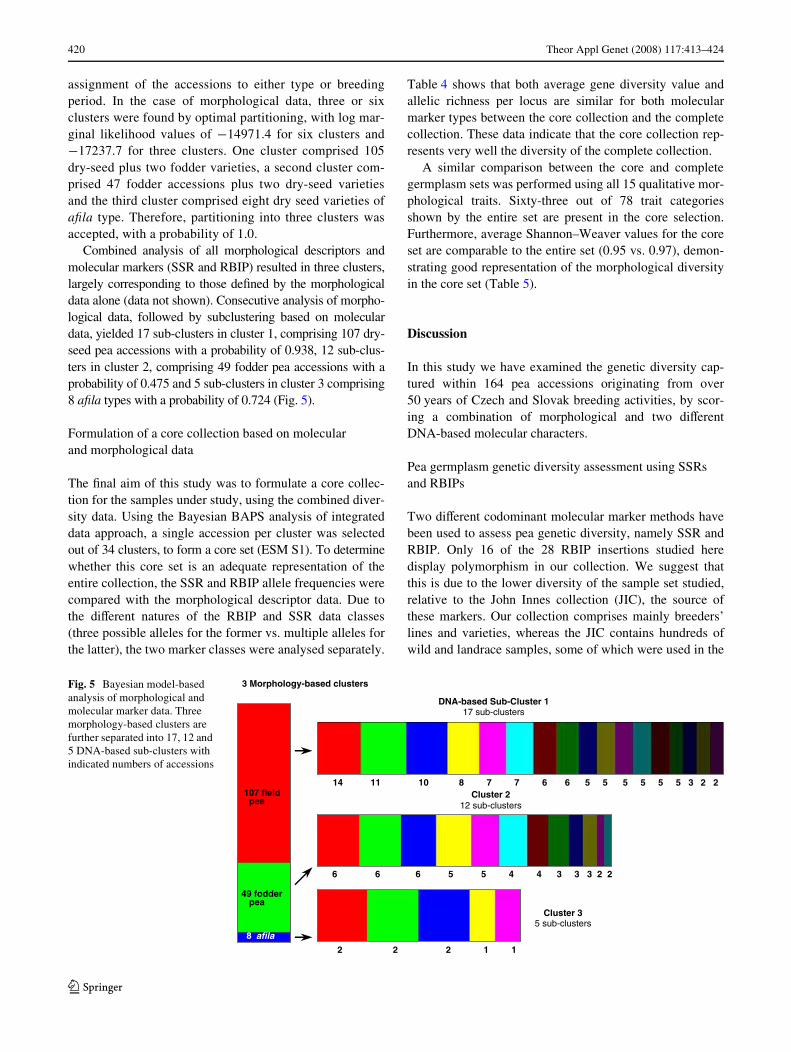
Combined analysis of all morphological descriptors andmolecular markers (SSR and RBIP) resulted in three clusters,largely corresponding to those deWned by the morphologicaldata alone (data not shown). Consecutive analysis of morpho-logical data, followed by subclustering based on moleculardata, yielded 17 sub-clusters in cluster 1, comprising 107 dry-seed pea accessions with a probability of 0.938, 12 sub-clus-ters in cluster 2, comprising 49 fodder pea accessions with aprobability of 0.475 and 5 sub-clusters in cluster 3 comprising8 aWla types with a probability of 0.724 (Fig. 5).
Formulation of a core collection based on molecular and morphological data
The Wnal aim of this study was to formulate a core collec-tion for the samples under study, using the combined diver-sity data. Using the Bayesian BAPS analysis of integrateddata approach, a single accession per cluster was selectedout of 34 clusters, to form a core set (ESM S1). To determinewhether this core set is an adequate representation of theentire collection, the SSR and RBIP allele frequencies werecompared with the morphological descriptor data. Due tothe diVerent natures of the RBIP and SSR data classes(three possible alleles for the former vs. multiple alleles forthe latter), the two marker classes were analysed separately.
Table 4 shows that both average gene diversity value andallelic richness per locus are similar for both molecularmarker types between the core collection and the completecollection. These data indicate that the core collection rep-resents very well the diversity of the complete collection.
A similar comparison between the core and completegermplasm sets was performed using all 15 qualitative mor-phological traits. Sixty-three out of 78 trait categoriesshown by the entire set are present in the core selection.Furthermore, average Shannon–Weaver values for the coreset are comparable to the entire set (0.95 vs. 0.97), demon-strating good representation of the morphological diversityin the core set (Table 5).
Discussion
In this study we have examined the genetic diversity cap-tured within 164 pea accessions originating from over50 years of Czech and Slovak breeding activities, by scor-ing a combination of morphological and two diVerentDNA-based molecular characters.
Pea germplasm genetic diversity assessment using SSRs and RBIPs
Two diVerent codominant molecular marker methods havebeen used to assess pea genetic diversity, namely SSR andRBIP. Only 16 of the 28 RBIP insertions studied heredisplay polymorphism in our collection. We suggest thatthis is due to the lower diversity of the sample set studied,relative to the John Innes collection (JIC), the source ofthese markers. Our collection comprises mainly breeders’lines and varieties, whereas the JIC contains hundreds ofwild and landrace samples, some of which were used in the
Fig. 5 Bayesian model-based analysis of morphological and molecular marker data. Three morphology-based clusters are further separated into 17, 12 and 5 DNA-based sub-clusters with indicated numbers of accessions
107 field pea
49 fodder pea
8 afila
DNA-based Sub-Cluster 117 sub-clusters
3 Morphology-based clusters
Cluster 212 sub-clusters
Cluster 35 sub-clusters
14 11 10 8 7 7 6 6 5 5 5 5 5 5 3 2 2
6 6 6 5 5 4 4 3 3 3 2 2
2 2 2 1 1
123

Theor Appl Genet (2008) 117:413–424 421
RBIP isolation strategy. In contrast, all of the ten SSRmarkers used display polymorphism in the sample set. Thisis not surprising in view of the much higher polymorphismlevel for this marker class and the fact that these ten mark-ers were pre-selected by us partly on the basis of polymor-phism level. Nevertheless, the PIC values obtained for thepolymorphic RBIP markers used in our study indicate highinformation value which is comparable to that availablefrom SSRs.
We observe no signiWcant correlation between thegenetic distance values derived from SSR and RBIP markerdata, indicating that these two marker types sample diVer-ent fractions of genetic diversity in this germplasm. Wesuggest that combining these two data types is moreinformative than using just one alone. The RBIP approach
is accurate for studies of deeper phylogeny in diversegermplasm, as insertions occur on the Mya scale (Jing et al.2005), whereas the SSR approach should provide high reso-lution discrimination between closely related accessions,because of the high mutability of SSRs but should proveless useful for analysing diverse germplasm because ofhomoplasy (see “Introduction”).
An argument for using RBIPs is the good transferabilityof results between labs. RBIPs yield presence or absence ofsingle bands of known size. SSRs are less transferable,because precise marker size reading and validation are nec-essary (Bredemeijer et al. 2002). In particular, the use ofdiVerent analytical systems between labs for SSRs hindersdata comparison. For example, agarose gels were used byTar’an et al. (2005), sequencing gels with silver staining
Table 4 Diversity data for en-tire germplasm set and BAPS-selected core set using SSR and RBIP markers
Entire collection (164) Core set (34)
Locus SSR
na ne I Gene diversity
Allelic richness
na ne I Gene diversity
Allelic richness
AD-270 7 4.52 1.59 0.783 6.38 5 3.8 1.46 0.809 6.18
AD-9 3 2.99 1.09 0.670 3.00 3 2.6 1.03 0.674 3.00
B-14 4 3.19 1.26 0.691 4.00 4 3.8 1.36 0.681 4.00
AD-237 7 4.18 1.60 0.764 6.72 5 3.2 1.34 0.730 6.66
AA-278 5 2.25 0.98 0.560 3.85 1 3 1.70 0.67 0.630 3.85
AD-141 8 4.05 1.60 0.757 7.49 5 2.59 1.12 0.723 7.26
AB-65 3 1.17 0.32 0.149 2.96 3 1.59 .32 0.121 2.95
AD-186 6 3.42 1.43 0.722 6.38 5 2.67 1.12 0.671 6.47
AA-67 4 2.10 0.89 0.528 3.62 4 2.65 0.95 0.544 3.47
AA-163 4 2.78 1.12 0.697 3.49 4 2.69 1.08 0.613 3.40
Mean 5.2 3.10 1.20 0.63 4.78 4.1 2.45 1.04 0.61 4.72
RBIP-locus na ne I Gene diversity
na ne I Gene diversity
MKRBIP-3 3 1.91 0.83 0.478 3 2.10 0.88 0.536
MKRBIP-4 2 1.36 0.43 0.264 2 1.57 0.55 0.368
MKRBIP-7 3 1.57 0.60 0.367 2 1.60 0.56 0.383
Birte-B1 2 1.62 0.57 0.468 2 1.68 0.59 0.412
Birte-x5 3 2.02 0.72 0.508 3 2.07 0.78 0.529
Birte-x16 3 1.79 0.75 0.443 3 2.02 0.84 0.516
1006-x19 3 1.87 0.74 0.468 3 2.18 0.87 0.553
399-14-9 2 1.98 0.69 0.499 2 2.00 0.69 0.511
45-x31 3 2.97 1.09 0.667 3 2.96 1.09 0.676
64-x45 3 2.09 0.79 0.525 2 1.73 0.61 0.430
281-x40 2 1.17 0.28 0.147 2 1.25 0.35 0.205
281-x44 3 1.72 0.63 0.419 3 1.87 0.72 0.473
2055-nr51 2 1.83 0.65 0.457 2 1.99 0.69 0.509
95-r2 3 1.31 0.42 0.238 2 1.49 0.51 0.337
2201Cycl-6 3 1.28, 0.43 0.224 3 1.23 0.38 0.194
1074Cycl-22 3 1.31 0.47 0.236 3 1.28 0.43 0.227
Mean 2.69 1.74 0.62 0.41 2.50 1.81 0.66 0.42
na observed number of alleles; ne eVective number jof alleles (Kimura and Crow 1964); I Shannon’s Information index (Lewontin 1972)
123

422 Theor Appl Genet (2008) 117:413–424
were used by Burstin et al. (2001) and Baranger et al.(2004) and automated DNA sequencer reading was used byFord et al. (2002).
Mixed molecular marker types have been used previouslyin pea diversity analysis. Tar’an et al. (2005) used a mixedset of RAPD, ISSR and SSR markers to analyse 65 pea vari-eties and 21 wild accessions. Unfortunately, no direct com-parison is possible between out studies and that of Tar’anet al. because only a single sample was shared (cv. Olivin).The most comprehensive study published to date on peagermplasm (Baranger et al. 2004) used a combination of iso-zymes, seed-storage proteins, RAPD, and 13 EST derived-SSR markers on 148 pea accessions of mainly Western Euro-pean origin. Again, there is virtually no sample overlap withour study. Interestingly, Baranger et al. (2004) found themost informative marker type to be EST-derived SSRs, withhigh allele richness and occurrence of rare alleles. Our test ofWve of these EST-SSRs on a set of 20 Czech origin varietiesdid not reveal such high polymorphism (data not shown).
Most previously published experiments on pea germ-plasm have used either a single plant sample per accessionor no information has been provided, preventing the analy-sis of heterozygosity/heterogeneity in accessions. Pisum asa predominant selfer but crosses can be made across thegenus and heterozygosity is a possibility. Our use of bulksof ten plants per accession provides a more representativedescription of the germplasm samples, reduces the possibil-ity of mis-scoring, compared to single plant sampling (VanHintum 1999) and reveals heterogeneity in accessions. Inour study both SSR and RBIP markers reveal accession het-erogeneity, and no heterozygosity.
Diversity of pea germplasm used in this study
We observe a broad continuous distribution of genetic dis-tances in the germplasm set using molecular data but mor-phological traits indicate two separated peaks (Fig. 1a, b).Furthermore, we see no signiWcant correlation between themorphological and molecular data for this germplasm set.We suggest that these diVerences are due to the very diVer-ent types of data classes used. The molecular markers usedderive from multiple dispersed loci in the Pisum genomeand represent the spectrum of genetic distances betweenorthologous genomic regions in the germplasm, whereasthe morphological traits are controlled by multiple genes,some of which have probably been subjected to strongdirect or indirect selection during the breeding process.
A narrow genetic base or even genetic erosion of WesternEuropean commercial pea cultivated germplasm has beenclaimed for pea cultivars (Baranger et al. 2004; Tar’an et al.2005; Simioniuc et al. 2002). We Wnd quite high diversity inour collection and our analysis of three temporally dividedsubsets, spanning the past 50 years, has not revealed signiW-cant genetic erosion. Similar experiments for maize and breadwheat using molecular data showed genetic narrowing (LeClerc et al. 2005; Roussel et al. 2005, 2006) but analysescombining morphological, DNA and protein marker andenzymatic characters revealed no such losses of diversity(Donini et al. 2000; Le Clerc et al. 2006). We suggest that itwould be important to consider crosses between varieties indiVerent breeding programs to increase the diversity.
Our cluster analysis using molecular data has not fullyseparated fodder and pea types, in agreement with Tar’anet al. (2005) but in contrast to the study of Baranger et al.(2004). We presume that this is because only the latterincluded seed storage protein and isozyme data in theirstudy. We suggest that no global genomic diVerences existbetween the two pea types and this is reXected in the SSRand RBIP markers used here but genes controlling seedcharacters probably show clear distinction.
The ordination analysis reported here has identiWed ninequalitative and eight quantitative morphological characters,which together account for >90% of both correspondingtotal variations observed. The qualitative traits identiWedhere diVer from those found by Tar’an et al. (2005) but thetwo sets of results agree with that of Baranger et al. (2004)that the most important PC is associated with Xower colour,leaf type and seed weight.
In contrast to previous studies which used PCA and PCOapproaches (Baranger et al. 2004; Tar’an et al. 2005), we haveused MDS for analysis of molecular data, because of advanta-ges in the rank order of magnitude preservation of distancesbetween the data points and visualisation of a larger propor-tion of variability. Our data suggest signiWcant gene Xowbetween fodder and dry seed pea types, despite the existence
Table 5 Shannon-Weaver Diversity Indexes per 15 qualitative mor-phological traits for entire germplasm set and BAPS-selected core set
Trait Core Entire
Stipules-character of anthocyan spot 0.64 0.68
Flower-wings colour 1.43 1.42
Flower-vexillum colour 1.28 1.34
LeaXet-margin shape on the second realleaf 1.35 1.23
Seed-funiculus stability 0.00 0.00
LeaXet-margin shape at the Wrst Xowering node 0.87 0.78
Seed-colour at full ripeness 1.65 1.80
Seed-cotyledons colour 1.03 1.16
Leaf-type 0.11 0.25
Seed-hilum colour 0.46 0.47
LeaXet-colour 1.41 1.42
LeaXet-shape (at the Wrst Xowering node) 1.60 1.52
LeaXet-appex shape 0.97 1.11
Seed-testa colour 0.66 0.70
Seed-surface 0.82 0.74
Mean index 0.95 0.97
123

Theor Appl Genet (2008) 117:413–424 423
of several type-speciWc SSR alleles. Interestingly, MDS sepa-rated several accessions which are in the same Ward cluster. Itshould be noted that molecular markers display much less ofthe total variance in the Wrst 2–3 axes in than do morphologi-cal traits. Therefore, unless highly distinct accessions aretested, such analysis might not be expected to resolve thegermplasm into clearly separated outgroups. Such a clear out-grouping was observed when molecular data for ten acces-sions of winter fodder type were analysed with unique SSRalleles and diVerential combinations of RBIP loci (data notshown), but the lack of comparable morphological dataexcluded them from the presented analysis.
We have used BAPS analysis to combine molecular withthe morphological data and to select a core collection fromthe complete collection. The core set retains the majority ofdiversity for the complete collection, validating this multi-factorial approach. Future studies will attempt a similarapproach on the full Czech national pea germplasm collec-tion hold at Agritec. There has been low utilisation ofexotic germplasm in pea improvement up to now and theselection of a representative core collection will make thegermplasm more accessible to the breeder.
Model-based population structure
Our BAPS analysis has shown that consecutive rather thancombined morphological and molecular data computationleads to better interpretable results which essentially agreewith Ward cluster analysis of morphological data. No directcomputational comparison between distance and model-based population structure has been attempted here, sincethese methods rely upon diVerent principles. Nevertheless,the utility and complementarity of these approaches has beenshown here and previously (Corander et al. 2004; Maccaferriet al. 2005). Bayesian approaches can readily deal with com-binations of diVerent data types and STRUCTURE software(Pritchard et al. 2000; Falush et al. 2003) has been particu-larly popular. In contrast to probabilistic assignment of geno-types into user deWned cluster numbers, the partitioningbased BAPS software uses an analytical integration strategycombined with stochastic search methods. As shown in ourstudy, BAPS provides a good alternative that requires muchless computational time, suits more complex data sets,accommodates spatial models of genetic population andinvestigates admixture inference. Therefore, we propose it asan attractive approach for future germplasm analysis.
Core and reference collections
The core collection concept is well established but assess-ment of representativeness is usually lacking. No standar-dised method has yet been accepted for core selection,although numerous strategies have been tested (Van Hintum
1999; Hu et al. 2000; Wang et al. 2007). The most com-monly used strategy combines geographical and morpho-logical characteristics (Brown and Spillane 1999) but theseparameters are unreliable for reXecting genetic diversityaccurately (Tanksley and McCouch 1997). We stronglyargue for the establishment of core collections for pea andother crops, using approaches described here, combiningsuitably reproducible molecular platforms with robust mor-phological parameters to address population structure andto allow better cross-comparison of results.
Acknowledgments This work was Wnancially supported by Ministryof Education of Czech Republic research project MSMT 2678424601and Czech Ministry of Agriculture project no. 33083/03-3000. Techni-cal support of Mrs. L.Vítámvásová, E. Fialová, M. Vachatová andE. Kamlerová are greatly acknowledged.
References
Baranger A, Aubrey G, Aran G, Laine AL, Deniot G, Potier J, BurstinJ (2004) Genetic diversity within Pisum sativum using protein andPCR-based markers. Theor Appl Genet 108:1309–1321
Beaumont MA, Rannala B (2004) The Bayesian revolution in genetics.Nature Rev 5:251–261
Beckmann JS, Soller M (1990) Toward a uniWed approach to geneticmapping of eukaryotes based on sequence tagged microsatellitesites. Biotechnology 10:930–932
Bredemeijer GMM, Cooke RJ, Ganal MW, Peeter R, Isakk P, NoordijkY, Rendell S, Jackson J, Roder MS, Wendehake K, Dijcks M,Amelaine M, Wickaert V, Bertrand L, Vosman B (2002) Con-struction and testing of a microsatellite database containing morethan 500 tomato varieties. Theor Appl Genet 105:1019–1026
Brown AHD, Spillane C (1999) Implementing core collections––prin-ciples, procedures, progress, problems and promise. In: JohnsonRC, Hodgkin T (eds) Core collections for today and tommorow.IPGRI, Rome
Brown AHD, Weir BS (1983) Measuring genetic variability in plantpopulations. In: Tanksley SD, Orton TJ (eds) Isozymes in plantgenetics and breeding, part A. Elsevier, Amsterdam
Burstin J, Deniot G, Potier J, Weinachter C, Aubert G, Baranger A(2001) Microsatellite polymorphism in Pisum sativum. PlantBreed 120:311–217
Corander J, Martiinen P (2006) Bayesian identiWcation of admixture eventsusing multilocus molecular markers. Mol Ecology 15:2833–2843
Corander J, Waldmann P, Marttinen P, Sillanpää MJ (2004) BAPS 2:enhanced possibilities for the analysis of genetic population struc-ture. Bioinformatics 20:2363–2369
Corander J, Gyllenberg M, Koski T (2007) Random partition modelsand exchangeability for Bayesian identiWcation of populationstructure. Bull Math Biol 69:797–815
Donini P, Law JR, Koebner RMD, Reeves JC, Cooke RJ (2000) Temporaltrends in the diversity of UK wheat. Theor Appl Genet 100:912–917
Ellis THN, Poyser SJ, Knox MR, Vershinin AV, Ambrose MJ (1998)Polymorphism of insertion sites of Ty1-copia class retrotranspo-sons and its use for linkage and diversity analysis in pea. Mol GenGenet 260:9–19
Erskine W, Muehlbauer FJ (1991) Allozyme and morpfological vari-ability, outcrossing rate and core collection formation in lentilgermplasm. Theor Appl Genet 83:119–125
Esquinas-Alacazar J (2005) Protecting crop genetic diversity for foodsecurity: political, ethical and technical challenges. Nature RevGenet 6:946–953
123

424 Theor Appl Genet (2008) 117:413–424
Falush D, Stephens M, Pritchard JK (2003) Inference of populationstructure using multilocus genotype data: linked loci and corre-lated allele frequencies. Genetics 164:1567–1587
Flavell AJ, Knox MR, Pearce SR, Ellis THN (1998) Retrotransposon-based insertion polymorphisms (RBIP) for high throughput mark-er analysis. Plant J 16:643–650
Ford R, LeRoux K, Itman C, Brouwer JB, Tayler PWJ (2002) Diversityanalysis and genotyping in Pisum with sequence tagged microsat-ellite (STSM) primers. Euphytica 124:397–405
Flavell AJ, Bolshakov VN, Booth A, Jing R, Russell J, Ellis THN,Isaac P (2003) A microarray-based high throughput molecularmarker genotyping method: the tagged microarray marker (TAM)approach. Nucleic Acids Res e31:e115
Frankel OH, Brown AHD (1984) Current plant genetic resources––acritical appraisal. In: Genetics: new Frontiers, vol IV. Oxford andIBH Publ. Co., New Delhi
Goudet J (1995) FSTAT (ver. 1.2): a computer program to calculate F-statistics. J Heredity 86:485–486
Hu J, Zhu J, Xu HM (2000) Methods of constructing core collectionsby stepwise clustering with three sampling strategies based on thegenotypic values of crops. Theor Appl Genet 101:264–268
Jing RC, Knox MR, Lee JM, Vershinin AV, Ambrose M, Ellis THN, Flav-ell AJ (2005) Insertional polymorphism and antiquity of PDR1 retro-transposon insertions in Pisum species. Genetics 171:741–752
Jing R, Bolshakov VI, Flavell AJ (2007) The Tagged MicroarrayMarker (TAM) method for high throughput detection of singlenucleotide and indel polymorphisms. Nature Protocols 2:168–177
Kalendar R, Grob T, Regina M, Suoniemi A, Schulman A (1999) IRAPand REMAP: two new retrotransposon-based DNA Wngerprintingtechniques. Theor Appl Genet 98:704–711
Kimura M, Crow JF (1964) The number of alleles that can be main-tained in a Wnite population. Genetics 49:725–738
Kruskal JB (1964) Multidimensional scaling by optimizing goodnessof Wt to a nonmetric hypothesis. Psychometrika 29:1–27
Le Clerc V, Bazante F, Baril C, Guiard J, Zhang D (2005) Assessingtemporal changes in genetic diversity of maize varieties usingmicrosatellite markers. Theor Appl Genet 110:294–302
Le Clerc V, Cadot V, Canadas M, Lallemand J, Guerin D, Boulineau F(2006) Indicators to assess temporal genetic diversity in theFrench Catalogue: no losses for maize and peas. Theor Appl Gen-et 113:1197–1209
Lewontin RC (1972) The apportionment of human diversity. Evol Biol6:381–398
Loridon K, McPhee K, Morin J, Dubreuil P, Pilet-Nayel ML, AubertG, Rameau C, Baranger A, Coyne C, Lejeune-Henaut I, Burstin J(2005) Microsatellite marker polymorphism and mapping in pea(Pisum sativum L.). Theor Appl Genet 111:1022–1031
Maccaferri M, Sanguineti MC, Noli E, Tuberosa R (2005) Populationstructure and long-range linkage disequilibrium in a durum wheatelite collection. Mol Breed 15:271–289
Mantel N (1967) The detection of disease clustering and a generalizedregression approach. Cancer Res 27:209–220
Nei M (1973) Analysis of gene diversity in subdivaded populations.Proc Natl Acad Sci USA 70:3321–3323
Nei M (1978) Estimation of average heterozygosity and genetic dis-tance from a small number of individuals. Genetics 89:583–590
Nersting LG, Andersen SB, von Bothmer R, Gullord M, Jorgensen RB(2006) Morphological and molecular diversity of Nordic oatthrough one hundred years of breeding. Euphytica 150:327–337
Pavelková A, Moravec J, Hájek D, Baren I, Sehnalová J (1986)Descriptor list genus Pisum L. RICP Prague. Genové zdroje 32:46
Pritchard JK, Stephens M, Donnelly P (2000) Inference of populationstructure using multilocus genotype data. Genetics 155:945–959
Reif JC, Melchinger AE, Frish M (2005) Genetical and mathematicalproperties of similarity and dissimilarity coeYcients applied inplant breeding and seed bank management. Crop Sci 45:1–7
Reynolds J, Weir BS, Cockerham C (1983) Estimation of the coances-try coeYcient: basis for a short-term genetic distance. Genetics105:767–776
Rohlf F (2006) NTSYSpc: Numerical Taxonomy System (ver. 2.2).Exeter Publishing, Ltd., Setauket
Rousseeuw PJ (1987) Silhouettes: a graphical aid to the interpretationand validation of cluster analysis. J Comput Appl Math 20:53–65
Roussel V, Leisova L, Exbrayat F, Stehno Z, Balfourier F (2005) SSRallelic diversity changes in 480 European bread wheat varietiesreleased from 1840 to 2000. Theor Appl Genet 111:162–170
Roussel V, Koenig J, Beckert M, Balfourier F (2006) Molecular diver-sity in French bread wheat accessions related to temporal trendsand breeding programmes. Theor Appl Genet 108:920–930
Shannon CE, Weaver W (1962) The mathematical theory of commu-nication. Univer. of Illinois Press, Urbana
Simioniuc D, Uptmoor R, Friedt W, Ordon F (2002) Genetic diversityand relationships among pea cultivars revealed by RAPDs andAFLPs. Plant Breed 121:429–435
Smýkal P (2006) Development of an eYcient retrotransposon-basedWngerprinting method for rapid pea variety identiWcation. J ApplGenet 47:221–230
Smýkal P, Valledor L, Rodríguez R, Griga M (2007) Assessment ofgenetic and epigenetic stability in long-term in vitro shoot cultureof pea (Pisum sativum L.). Plant Cell Rep 26:1985–1998
SPSS for Windows, Rel. 12.0.1 (2003) SPSS Inc., ChicagoStatSoft Inc (2006) STATISTICA (data analysis software system),
version 7.1. http://www.statsoft.comTanksley SD, McCouch SR (1997) Seed bank and molecular maps:
unlocking genetic potential from the wild. Science 277:1063–1066Tar’an B, Zhang C, Wankertin T, Tullu A, Vandenberg A (2005) Ge-
netic diversity among varietis and wild species accessions of pea(Pisum sativum L.) based on molecular markers, and morpholog-ical and physiological characters. Genome 48:257–272
Tohme J, Jones P, Beebe S, Iwanaga M (1995) The combined use ofagroecological and characterization data to establish the CIATPhaseolus vulgaris core collection. In: Hodgkin T, Brown AHD,van Hintum TJL, Morales EAV (eds) Core collections of plant ge-netic resources. Wiley, Chichester, pp 95–107
Van Hintum TJL (1999) The general methodology for creating a corecollection. In: Johnson RC, Hodgkin T (eds) Core collections fortoday and tomorrow. International Plant Genetic Resources Insti-tute, Rome, pp 10–17
Vavilov NI (1926) Studies on the origin of cultivated plants, Bulletinof Applied Botany, vol 26. Leningrad, USSR
Vos P, Hogers R, Bleeker M, Reijans M, van de Lee T, Hornes M, FrijtersA, Pot J, Peleman J, Kuiper M, Zabeau M (1995) AFLP: a new tech-nique for DNA Wngerprinting. Nucleic Acids Res 23:4407–4414
Wang JC, Hu J, Xu HM, Zhang S (2007) A strategy on constructingcore collections by least distance stepwise sampling. Theor ApplGenet 115:1–8
Ward JH (1963) Hierarchical grouping to optimize an objective func-tion. J Am Stat Assoc 58:236
Waugh R, McLean K, Flavell AJ, Pearce SR, Kumar A, Thomas BT,Powell W (1997) Genetic distribution of BARE-1 retrotransposableelements in the barley genome revealed by sequence-speciWc ampli-Wcation polymorphisms (S-SAP). Mol Gen Genet 253:687–694
Williams JGK, Kubelik AR, Livak KJ, Rafalski JA, Tingey SV (1990)DNA polymorphism ampliWed by arbitrary primers are usefull asgenetic markers. Nucleic Acids Res 18:6531–6535
Wright S (1965) The interpretation of population structure by F-statisticswith special regards to systems of mating. Evolution 19:395–420
Yeh FC, Boyle TJB (1997) Population genetic analysis of co-dominantand dominant markers and quantitative traits. Belg J Bot 129:157
Zietkiewicz E, Rafalski A, Labuda D (1994) Genome Wngerprinting bysimple sequence repeat (SSR)-anchored polymerase chain reac-tion. Genomics 20:176–183
123