Genetic Determinants of Major Blood Lipids in Pakistanis Compared With Europeans
60
1942-3268 Copyright © 2010 American Heart Association. All rights reserved. Print ISSN: 1942-325X. Online ISSN: Avenue, Dallas, TX 72514 Circulation: Cardiovascular Genetics is published by the American Heart Association. 7272 Greenville DOI: 10.1161/CIRCGENETICS.109.906180 published online Jun 22, 2010; Circ Cardiovasc Genet Panos Deloukas Simon Thompson, Willem Ouwehand, Winfried März, Philippe Frossard, John Danesh and Böhm, Sarah Bray, Ralph McGinnis, Frank Dudbridge, Bernhard R. Winkelmann, Bernhard Shahid, Shahzad Majeed Bhatti, Syed Saadat Ali, Muhammad Fahim, Gurdeep Sagoo, Kumar, Muhammad Salman Daood, Aftab Alam Gul, Shahid Abbas, Junaid Zafar, Faisal Anthony Attwood, Kerstin Koch, Mustafa Hussain, Kishore Kumar, Asim Saleem, Kishwar Hoffmann, Wilfried Renner, Marcus Kleber, Tanja B. Grammer, Jonathon Stephens, Gardezi, Nazir Ahmed Memon, Abdul Ghaffar, Fazal-ur Rehman, Michael Marcus Muhammad Ishaq, Syed Zahed Rasheed, Rashid Jooma, Jawaid Hassan Niazi, Ali Raza Qamar, Azhar Faruqui, Nadeem Hayat Mallick, Muhammad Azhar, Abdus Samad, Hakeem, Khan Shah Zaman, Assadullah Kundi, Zia Yaqoob, Liaquat Ali Cheema, Nadeem Murtaza, Alexander Thompson, Reeta Gobin, Adam Butterworth, Usman Ahmad, Abdul E. Hunt, Nasir Sheikh, Nabi Shah, Maria Samuel, Shajjia Razi Haider, Muhammed Suzanna Bumpstead, Stephen Kaptoge, Emanuele Di Angelantonio, Nadeem Sarwar, Sarah Myriam Alexander, Michael Inouye, Moazzam Zaidi, Simon Potter, Philip Haycock, Danish Saleheen, Nicole Soranzo, Asif Rasheed, Hubert Scharnagl, Rhian Gwiliam, Europeans Genetic Determinants of Major Blood Lipids in Pakistan Is Compared with http://www.lww.com/reprints Reprints: Information about reprints can be found online at [email protected] 410-528-8550. E-mail: Health, 351 West Camden Street, Baltimore, MD 21202-2436. Phone: 410-528-4050. Fax: Permissions: Permissions & Rights Desk, Lippincott Williams & Wilkins, a division of Wolters Kluwer http://circgenetics.ahajournals.org/subscriptions/ Subscriptions: Information about subscribing to Circulation: Cardiovascular Genetics is online at at INSERM - DISC on July 18, 2010 circgenetics.ahajournals.org Downloaded from
Transcript of Genetic Determinants of Major Blood Lipids in Pakistanis Compared With Europeans
1942-3268 Copyright © 2010 American Heart Association. All rights reserved. Print ISSN: 1942-325X. Online ISSN:
Avenue, Dallas, TX 72514Circulation: Cardiovascular Genetics is published by the American Heart Association. 7272 Greenville
DOI: 10.1161/CIRCGENETICS.109.906180 published online Jun 22, 2010; Circ Cardiovasc Genet
Panos Deloukas Simon Thompson, Willem Ouwehand, Winfried März, Philippe Frossard, John Danesh and
Böhm,Sarah Bray, Ralph McGinnis, Frank Dudbridge, Bernhard R. Winkelmann, Bernhard Shahid, Shahzad Majeed Bhatti, Syed Saadat Ali, Muhammad Fahim, Gurdeep Sagoo,
Kumar, Muhammad Salman Daood, Aftab Alam Gul, Shahid Abbas, Junaid Zafar, Faisal Anthony Attwood, Kerstin Koch, Mustafa Hussain, Kishore Kumar, Asim Saleem, Kishwar
Hoffmann, Wilfried Renner, Marcus Kleber, Tanja B. Grammer, Jonathon Stephens, Gardezi, Nazir Ahmed Memon, Abdul Ghaffar, Fazal-ur Rehman, Michael Marcus
Muhammad Ishaq, Syed Zahed Rasheed, Rashid Jooma, Jawaid Hassan Niazi, Ali Raza Qamar, Azhar Faruqui, Nadeem Hayat Mallick, Muhammad Azhar, Abdus Samad,
Hakeem, Khan Shah Zaman, Assadullah Kundi, Zia Yaqoob, Liaquat Ali Cheema, Nadeem Murtaza, Alexander Thompson, Reeta Gobin, Adam Butterworth, Usman Ahmad, Abdul
E. Hunt, Nasir Sheikh, Nabi Shah, Maria Samuel, Shajjia Razi Haider, Muhammed Suzanna Bumpstead, Stephen Kaptoge, Emanuele Di Angelantonio, Nadeem Sarwar, Sarah
Myriam Alexander, Michael Inouye, Moazzam Zaidi, Simon Potter, Philip Haycock, Danish Saleheen, Nicole Soranzo, Asif Rasheed, Hubert Scharnagl, Rhian Gwiliam,
EuropeansGenetic Determinants of Major Blood Lipids in Pakistan Is Compared with
http://www.lww.com/reprintsReprints: Information about reprints can be found online at
[email protected]. E-mail: Health, 351 West Camden Street, Baltimore, MD 21202-2436. Phone: 410-528-4050. Fax: Permissions: Permissions & Rights Desk, Lippincott Williams & Wilkins, a division of Wolters Kluwer
http://circgenetics.ahajournals.org/subscriptions/Subscriptions: Information about subscribing to Circulation: Cardiovascular Genetics is online at
at INSERM - DISC on July 18, 2010 circgenetics.ahajournals.orgDownloaded from

http://circgenetics.ahajournals.org/cgi/content/full/CIRCGENETICS.109.906180/DC1Data Supplement (unedited) at:
http://circgenetics.ahajournals.org
the World Wide Web at: The online version of this article, along with updated information and services, is located on
http://www.lww.com/reprintsReprints: Information about reprints can be found online at
[email protected]. E-mail: Health, 351 West Camden Street, Baltimore, MD 21202-2436. Phone: 410-528-4050. Fax: Permissions: Permissions & Rights Desk, Lippincott Williams & Wilkins, a division of Wolters Kluwer
http://circgenetics.ahajournals.org/subscriptions/Subscriptions: Information about subscribing to Circulation: Cardiovascular Genetics is online at
at INSERM - DISC on July 18, 2010 circgenetics.ahajournals.orgDownloaded from

1
Genetic Determinants of Major Blood Lipids in Pakistan Is Compared with Europeans
Running title: Saleheen et al.; Genetic loci for major lipids in Pakistan
Danish Saleheen+1,2 MBBS, MPhil; Nicole Soranzo+3,4 BSC, PhD; Asif Rasheed1 MBBS; Hubert
Scharnagl5 PhD; Rhian Gwilliam3 PhD; Myriam Alexander2 MSc, MPhil; Michael Inouye3 PhD;
Moazzam Zaidi1 MBBS; Simon Potter3 PhD; Philip Haycock2 MSc, MPhil; Suzanna Bumpstead3
BSC; Stephen Kaptoge2 PHD; Emanuele Di Angelantonio2 MD, MSc, PhD; Nadeem Sarwar2,6
MRPharmS, PhD; Sarah E Hunt3 PhD; Nasir Sheikh2 MSc; Nabi Shah1 B-Pharmacy; Maria
Samuel1 BSC, MSC; Shajjia Razi Haider1 MSC; Muhammed Murtaza1 MBBS; Alexander
Thompson2 PhD; Reeta Gobin2 MBBS, MPhil; Adam Butterworth2 PhD, MSc; Usman Ahmad1
MBBS; Abdul Hakeem1 MBBS; Khan Shah Zaman7 MBBS, MRCP, FRCP, MRCS; Assadullah
Kundi7 MBBS, FCPS; Zia Yaqoob7 MBBS, FACC; Liaquat Ali Cheema7 MBBS, PhD; Nadeem
Qamar7 MBBS FACC; Azhar Faruqui7 FACC, FRCP, FCPS, FAHA; Nadeem Hayat Mallick8
MBBS, MRCP; Muhammad Azhar8 MBBS, MRCP; Abdus Samad9 MD, FACC; Muhammad
Ishaq9 MBBS, MRCP, FRCP, FACC; Syed Zahed Rasheed9 MD, FESC, FRCP; Rashid Jooma10
MBBS; Jawaid Hassan Niazi10 MBBS, FCPS; Ali Raza Gardezi11 MBBS, Dip Card, MRCP;
Nazir Ahmed Memon12 MBBS, FRCP, FACC, FACVS; Abdul Ghaffar12 MBBS, FCPS; Fazal-
ur-Rehman13 MBBS, Dip Card; Michael Marcus Hoffmann14 PhD; Wilfried Renner5 PHD;
Marcus E Kleber15 PhD; Tanja B Grammer16 MD; Jonathon Stephens17 BSC; Anthony
Attwood17; Kerstin Koch17 PhD; Mustafa Hussain1 MBBS; Kishore Kumar1 MBBS; Asim
Saleem1 MBBS; Kishwar Kumar1 MBBS; Muhammad Salman Daood1 MBBS; Aftab Alam Gul1
MBBS; Shahid Abbas1 MBBS; Junaid Zafar1 MBBS; Faisal Shahid1 MBBS; Shahzad Majeed
Bhatti1 MBBS; Syed Saadat Ali1 MBBS; Muhammad Fahim1 MBBS; Gurdeep Sagoo18 BSC,
MSc, PhD; Sarah Bray19 MA, PhD, Grad Dip; Ralph McGinnis3 PhD; Frank Dudbridge19 PhD;
Bernhard R Winkelmann20 PhD; Bernhard Böehm21 MD, PhD; Simon Thompson19 DSc; Willem
Ouwehand4,17 MD, PhD, FRCPath; Winfried März6,16,20 MD; Philippe Frossard1 PhD, DSc;
*John Danesh2 MBChB, MSc, DPhil, FRCP, FFPH; *Panos Deloukas3 PhD
1Center for Non-Communicable Diseases (CNCD) Karachi Pakistan, 2Department of Public Health and Primary Care, University of Cambridge, UK; 3Wellcome Trust Sanger Institute, Hinxton, Cambridge, UK; 4Department of Twin Research & Genetic Epidemiology, King's College London, St Thomas'
RCPCCCCCC , ,,,,,,,,,, FRRRRRRRRCPCCCCCCCCCCCCCC , ,,,,,,,,,,,,, MRMRMRMRMRMRMRMRMRMRMRRMRMRMRMRMRMRMRMMR
Cheeeeeeeeeeeeeema7 77777777777777777777 MBMBMBMBMBMBMBMBMMBMBMBMBMBMMMBMBMBMBMBBSBBSBSBSBBSBSBSBSBSBBBBBBBBBB
C 7
h ;
P
a12 MBBS FRCP FACC FACVS Abd l Gh ff 12 MBBS
C;C;;;; A AAA Azhzhzhzhzharararaa FFFFFaaraaa uqui7 FACC, FRCPCPCPCPCP, FCPS, , ,, FAAAAAHAHHHH ; Nadeem H
haaaaammmmmm ad Azhzzhaar8 88 88 MBMBMBMBM BSBSBSSBS, MRMRMRCPCP; AbAbAbAbAbdududududus SaSS mamamaddd99999 DMDMDMDMD,,, , FAFAAACCCCCCCCC ;
P, FRFRFRFRFRCPCPCPCPCP, FAFAFAFAACCCCCCCCCC; SySySySySyed ZZZZZ hahhhhedddd RRRashhehhh ededededed9999 MDMDMDMDMD, ,, FEFEFEFEFESCSCSCSCSC, FRFRFRFRF CPCPCPCPCP;
aaaannn NiNiazazazii10 MBMBMBBSBS,, FCFCFCPSPSPS;;; AlAlAliii RaRazazaza GG Gararardeddezizii1111111111 MBMBBBSBS,, DiDippp CaCC1212 MBMBBSBS FRFRCPCP FAFACCCC FAFACVCVCVSSS AAAbdbdbd lll GGGhhh ffffff 1212 MBMBMBBSBSBSS
at INSERM - DISC on July 18, 2010 circgenetics.ahajournals.orgDownloaded from

2
Hospital Campus, Lambeth Palace Rd, London, UK; 5Clinical Institute of Medical and Chemical Laboratory Diagnostics, Medical University Graz, Graz, Austria; 6Section of Population Health, University of Aberdeen, UK; 7National Institute of Cardiovascular Diseases, Karachi, Pakistan; 8Punjab Institute of Cardiology Lahore Pakistan; 9Karachi Institute of Heart Diseases, Karachi, Pakistan; 10Jinnah Post-graduate Medical Centre, Karachi, Pakistan; 11Multan Institute of Cardiology, Multan, Pakistan; 12Civil Hospital, Hyderabad, Pakistan; 13Red Crescent Institute of Cardiology, Hyderabad, Pakistan; 14Division of Clinical Chemistry, Department of Medicine, Albert Ludwig University, Freiburg Germany; 15LURIC non profit LLC, Freiburg, Germany; 16Synlab Center of Laboratory Diagnostics Heidelberg, Heidelberg, Germany; 17Department of Haematology, University of Cambridge and NHS Blood and Transplant, Cambridge, UK. 18PHG foundation, Strangeways Research Laboratories, UK; 19MRC Biostatistics Unit, Cambridge, United Kingdom; 20Division of Endocrinology and Diabetes and Institute of Public Health, Social Medicine and Epidemiology, Medical Faculty Mannheim, University of Heidelberg, Germany, Graduate School Molecular Endocrinology and Diabetes, University of Ulm, Ulm Germany; 21Cardiology Group Frankfurt, Frankfurt, Germany, + these authors contributed equally; * these authors contributed equally
Correspondence: Dr Danish Saleheen
Center for Non-Communicable Diseases (CNCD),
Karachi, Pakistan &
Department of Public Health and Primary Care
University of Cambridge
Strangeways Research Laboratory
Cambridge CB1 8RN, UK
[email protected], [email protected]
Dr Panos Deloukas
Wellcome Trust Sanger Institute
Wellcome Trust Genome Campus
Hinxton CB10 1SA.UK
Journal Subject Codes: [8] Epidemiology [109] Clinical genetics [112] Lipids [89] Genetics of cardiovascular disease [146] Genomics [90] Lipid and lipoprotein metabolism
C
n
u
m
Comomomomommuninininin cacaacacabbbbleeeee D DD DDisiii eaeaeaeaeasesseseses s s s (C(C(C(CNCNNN D)D ,
n & & && &
ublic Health h h hh ananananand dddd PrPrPrPrPrimimimimimararararary y y y y CaCaCaCaCarererere
mmmbridggggge e e ee
at INSERM - DISC on July 18, 2010 circgenetics.ahajournals.orgDownloaded from

3
Abstract
Background Evidence is sparse about the genetic determinants of major lipids in
Pakistanis.
Methods and Results 45,000 variants across 2000 genes were assessed in 3200
Pakistanis, and compared with 2450 Germans using the same gene array and similar
lipid assays. We also did a meta-analysis of selected lipid-related variants in Europeans.
Pakistani genetic architecture was distinct from that of several ethnic groups
represented in international reference samples. 41 variants at 14 loci were significantly
associated with levels of HDL-C, triglyceride or LDL-C. The most significant lipid-
related variants identified among Pakistanis corresponded to genes previously shown to
be relevant to Europeans, such as CETP associated with HDL-C levels (rs711752;
P<10-13); APOA5/ZNF259 (rs651821; P<10-13) and GCKR (rs1260326; P<10-13) with
triglyceride levels; and CELSR2 variants with LDL-C levels (rs646776; P<10-9). For
Pakistanis, these 41 variants explained 6.2%, 7.1%, and 0.9% of the variation in HDL-
C, triglyceride, and LDL-C, respectively. Compared with Europeans, the allele
frequency of rs662799 in APOA5 among Pakistanis was higher and its impact on
triglyceride concentration was greater (P<10-4).
Conclusions Several lipid-related genetic variants are common to Pakistanis and
Europeans, though they explain only a modest portion of population variation in lipid
concentration. Allelic frequencies and effect sizes of lipid-related variants can differ
between Pakistanis and Europeans.
Key words: Lipids, HDL-C, LDL-C, triglycerides, Pakistan, Gene, Population structure, GWAS, IBC-array, Meta-analysis
he most signifififiifiiifififififififififf c
to geeeeeeeeeeeeeeenenenenenenneneneneneneneneeenenneneenees sssssssssssssssss prprprprprprprprprprprprprprprprprprprpppp evevevevevevevevevvevevevevevevevvvevve ioiioioioioioioioioioioioioiioioioioi u
E 7
A
v <
Eurururururopeansnsnsnsn ,,, , , susususuuchchchchch a a a aas CECECECECETPTPTPTPTP asasasasssoss ciciatededededed w w w w wititititith h h hh HDHDHDHDHDL-C CC CC lelelelelevevevevevelslslslsls ( ( ( ( (rsrrrr 7
A5/5/5/5/5/ZNZNZNZNZNF2F2F2F2F259595959 (r(r(rr(rs6s6s66651111182828282821;1111 PPPPP<1<1<1<1<100000-133333)) )) anananannd dddd GCGCGCGCGCKRKRKRKRKR ((((rsrrrr 1212121212606060606032323222666;66 PPPPP<<<<<
velels;s;s; aa andndddd CECECELSLSLSR2R2R2 vv vararariaiantntntsss wiwithth LL LDLDLDL CC-C l levevevelelsss (r(r((( s6s6s64646467777776;6;6; PP P<<<<
at INSERM - DISC on July 18, 2010 circgenetics.ahajournals.orgDownloaded from

4
INTRODUCTION
Levels of major blood lipids that is, concentrations of low- and high- density
lipoprotein cholesterol (LDL-C and HDL-C) and triglyceride are each strongly,
log-linearly, and positively (or, in the case of HDL-C, inversely) associated with the
risk of coronary heart disease (CHD).1-2 Linkage and twin based studies suggest that
more than 50% of the variation in these serum lipids is determined by genetic factors.3-5
Several genetic variants have been established in the regulation of lipid metabolism in
people of European continental ancestry, including 40 genomic loci (represented by 152
SNPs) identified in genome wide association scans.5-16 In contrast with considerable
evidence available on people of European ancestry, data on genetic regulation of major
blood lipids in Pakistanis are limited. For example, the previous largest relevant study
reported on five genetic markers in relation to a few hundred participants.17
We report the first large-scale study of the genetic determinants of LDL-C, HDL-C and
triglyceride concentrations in people living in Pakistan, a country of 175 million people
with a high burden of cardiovascular disease. We have assayed over 45,000 single
nucleotide polymorphisms (SNPs) across 2000 candidate genes using the ITMAT-
Broad-CARe (IBC) array18 in 3200 participants from the Pakistan Risk of Myocardial
Infarction Study (PROMIS).19 We compared association signals observed in PROMIS
with those in 2450 participants of German ancestry from the Ludwigshafen Risk and
Cardiovascular Health (LURIC) prospective study, which used the same gene array.20
To place the German findings in the context of data from other populations of European
ancestry, we did a meta-analysis of published studies.
ontrast with cooooooooooooooooon
n genenneneneneneneneneneneneneneneeeetititttititititititititititititititic cccccccccccccccc rererererererererererererererereeregugugugugguguguguguguguguguguguguuuguugguulalalalalalalalalalalallallallll t
e
e 7
f ,
PaPaPaPaPakkkikk stannnnnisisisss aaa aareereee ll l llimimimimimititittitededededed. .... FoFoFoFoF r rrr exexexee ammpllllle,e,e,e,e t t t t thehehehehe pp pprererereevivvvv ouuuuus ss ss lalalalalargrgrgrgrgesesesesest t t t t rererrr le
e gggggeneneneneneteteteteticicicicic mmmmarararararkekekekekersrrr iiiiinnnn n rerererer laaaaatititititiononononon t tttto oooo aa aaa fefefefefeww www huhuhuhuhundndndndndrererereddd dd papapapapartrtrtrtrticicicicicipipipppanananaantstststts.17
fififirsrsrsttt lalargrgrgggeee-scscscalaleee stststududy y y yy ofofff t t thehe g g ggeneneneteteticicicc d d etetetererermimimm nnnananantststs oo off LDLDLDLLL-C,C,C
at INSERM - DISC on July 18, 2010 circgenetics.ahajournals.orgDownloaded from
5
MATERIALS AND METHODS
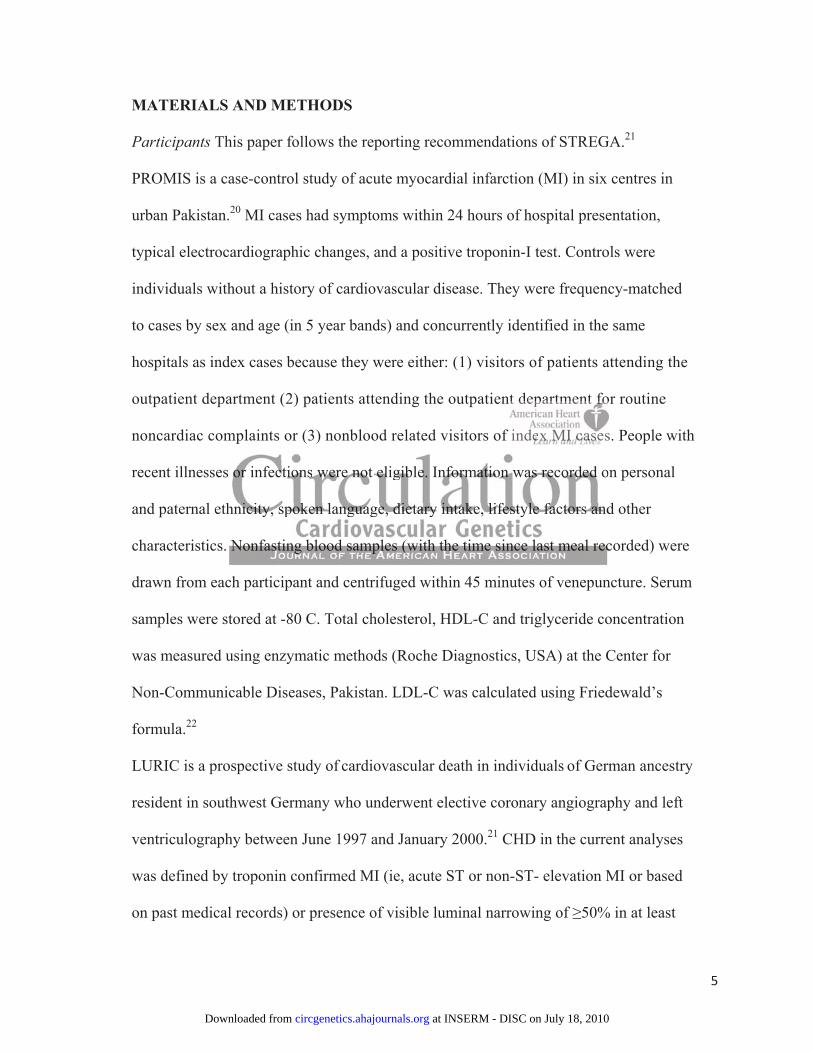
Participants This paper follows the reporting recommendations of STREGA.21
PROMIS is a case-control study of acute myocardial infarction (MI) in six centres in
urban Pakistan.20 MI cases had symptoms within 24 hours of hospital presentation,
typical electrocardiographic changes, and a positive troponin-I test. Controls were
individuals without a history of cardiovascular disease. They were frequency-matched
to cases by sex and age (in 5 year bands) and concurrently identified in the same
hospitals as index cases because they were either: (1) visitors of patients attending the
outpatient department (2) patients attending the outpatient department for routine
noncardiac complaints or (3) nonblood related visitors of index MI cases. People with
recent illnesses or infections were not eligible. Information was recorded on personal
and paternal ethnicity, spoken language, dietary intake, lifestyle factors and other
characteristics. Nonfasting blood samples (with the time since last meal recorded) were
drawn from each participant and centrifuged within 45 minutes of venepuncture. Serum
samples were stored at -80 C. Total cholesterol, HDL-C and triglyceride concentration
was measured using enzymatic methods (Roche Diagnostics, USA) at the Center for
Non-Communicable Diseases, Pakistan. LDL-C was calculated using Friedewald’s
formula.22
LURIC is a prospective study of cardiovascular death in individuals of German ancestry
resident in southwest Germany who underwent elective coronary angiography and left
ventriculography between June 1997 and January 2000.21 CHD in the current analyses
was defined by troponin confirmed MI (ie, acute ST or non-ST- elevation MI or based
on past medical records) or presence of visible luminal narrowing of 50% in at least
t department fffffffffffffffffoooooooooo
indeeeeeeeeeeeeeeeex x xxxxxxxxx x x xxx x xxx MIMIMIMIMIMIMMIMIMIMIMMIMIMIMIMMIIM cc c c ccccccc cc ccccasasaasasasasasasasasasasasasasasaasaassses
s infe . o
h d
c
s ooooorrr rr infectccctctioioioioionsnsnsnss w w w wwerererere ee ee nononononot ttt elelelee igggggibibi lee. Innnnnfofofofoformrmrmrmrmatatataatioioioon n nn n wawawawaas s s ss rererererecococococordrdrdrdrdededededed o
hnininininicicicicicitytytytyty, spspppokokokokkeeeeenn nn lalll ngngngngnguauauauau geeeee, dididididietetetetetararaara yy yyy ininininintatatatatakekekekeke, lililililifefefefefestststsstylylylylyleee ee fafafafafactcttttororororors sss anananannd
NNNonononfafastststining g g g blbloooooodd sasasampmpmppplelell sss (w(w(( itithh thththheee titimememe s s sinincecece l lasasasttt mememealal rr receccec
at INSERM - DISC on July 18, 2010 circgenetics.ahajournals.orgDownloaded from

6
on coronary vessel. Individuals with 20% but <50% stenosis were excluded from the
analyses. Individuals with stenosis <20% were regarded as controls. Fasting blood
samples collected before angiography were kept frozen at –80°C between the day of
blood draw and the day of analysis for total cholesterol, HDL-C and triglycerides (all
determined enzymatically).
The studies were approved by relevant ethics committees, and participants gave
informed consent.
Genotyping Genotyping for both studies was performed at the Wellcome Trust Sanger
Institute using the “IBC” array of about 2000 candidate genes.18 Variants on the array
were selected on the basis of: (1) genes with known associations for various
cardiovascular, pulmonary and sleep related disorders (2) information from pathway-
based tools for the identification of biologically plausible candidate genes (3)
unpublished functional experiments in mice (4) findings from various genomewide
scans (5) priority SNPs identified by IBC consortium investigators.18 45,237 SNPs in
version 1 of this array were genotyped in the PROMIS participants and were called
using the Illuminus algorithm.23 Markers were excluded from analysis if: the call rate
was <95% (372 SNPs); there was evidence of departure from Hardy-Weinberg
Equilibrium at a P-value of <10-3 (1750 SNPs); or the minor allele frequency (MAF)
was <1% (11,931 SNPs, with most such omissions due to genetic markers relevant in
Africans and being uninformative in Pakistanis and Europeans). LURIC participants
were typed with the version 2 of the IBC array and underwent the same calling and
quality control procedures. As version 2 has 4,050 additional SNPs, these SNPs were
nes. Variants sssss oooo
ationsnnsnsnsnsnsnsnsnsnsnnsnsnsnsss f fff f fffff fff f ff fffororororororororororororororororroror vv v vvvvvv vv vvvvvvvararararaaraarararararararrrarrrraarioiioioioioioioioioioioioioiioioioioi u
, m
(
n o
, pupupupupulmonnnnnarararrary yyyy ananananand d d d d slssss eeeeeeeeeep p pp p rererereelall teteteteed d ddisosordrdrdrdrdererererers (2(2(2((2) ))) inininininformrmrmrmrmatatatatatiooooon n n n n frfrfrfrfromoooo
thhhhhe eeee idididididenenenenentitittifififif cacacacacatitititt oonooo ooooof ffff bibibibibiolllollogogogogogicicicicicalalalalallylyylyy ppppplalalalalausususususibibibibiblelelelele c ccccanananaandidididididadadadadatetetett gggggeneneneneneseseseses (
ncnncnctitionononalalll ee expxpxpperererimimenenentststs i innn mimimm cecece (4(4((( ) ) ))) fififindndnn iningsgsgsg f frororommm vavavaririououousss gegegenonoono
at INSERM - DISC on July 18, 2010 circgenetics.ahajournals.orgDownloaded from
7
excluded from the current analysis. After quality control, 31,883 SNPs in 3197
Pakistanis and 35,533 SNPs in 2452 Germans remained for analyses.
Statistical methods To compare the genetic structure of Pakistanis with that of several
major ethnic groups, we received permission from HapMap3 investigators to conduct
principal components analyses on 1124 participants in HapMap3. We selected 19,931
SNPs in common with the PROMIS sample, and excluded 11,952 A/T and C/G SNPs to
avoid possible strand alignment bias, as it is difficult to reliably infer the minor allele
for A/T or C/G SNPs for non-HapMap populations.8 To investigate genetic sub-
structure, we classified Pakistani participants into eight self-identified ethnic and
linguistic groups and calculated principal components on the matrix of identity-by-state
sharing of all pairs of individuals. Quantile-quantile plots were produced by plotting the
observed –log10 P-value for each lipid against the expected –log10 p value. The
association between each lipid measure and genetic variants was tested using linear
regression. Additive models calculated the change in lipid level per copy of the minor
allele. Beta coefficients have been reported using the common allele as the reference
allele in PROMIS. All analyses were done using models adjusting for age, sex, the first
two principal components and case-control status. Effect estimates in LURIC were
reported for the same allele taken as reference in PROMIS.
We adopted a p 10-6 for declaration of significance. The Bonferroni correction for the
32,000 SNPs for three traits is 10-7, assuming 96000 independent tests with no prior
information. We chose a more relaxed cut-off 10-6 owing to the likely higher prior odds
of association because the array involves candidate genes and because there is a high
degree of correlation between the tested SNPs. To reduce potential biases, lipid
f identified ethnhnhnnhnnnhnhnhnhnhhnhhhh
he mammamamamamaamaamamamamamaaaaatrtrtrtrtrtrtrtrtrtrtrrrtrtrtrtrtrtrixixixixxixixixixixixixixixixixxix ofofofofofoofofoffoofoffoofofooffof i i i i ii ii i i i iii iiii ideddddddededededddeddddddddd n
y
0
w n
aiaiaiaiairrrsrr of innnnndididididivivivivvidududududualalalalals.s.s.s.. Q Q Q QQuauauauauantntntntn illllleeeee-q-- uauantttttililililile e ee e plplplplplotototoots sss wewwww reeeee p p p p prororororoduduududucececececed d dd d by
0 PPPPP-v-v-v-v-valalalalalueueuuu fffforororoor eeeeeacacacaca h hhh lililililipipipipipid dddd agagagagagaiaiaiaiainsnsnnsnst tttt ththtththe eeee exexexexexpepepeppectctctctctededededed –– –loloolooggggg10101000 p vvvvvalalalaalueueueueue.
wwwweeeeeennn eaeaeachch l lipippppidid mm meaeaeasususurerere aa andnd gegegegg nenenetititiiccc vavavaririananantststs ww wasasas tetetestststeded uu usisiin
at INSERM - DISC on July 18, 2010 circgenetics.ahajournals.orgDownloaded from

8
analyses were stratified by case-control status and excluded participants on lipid-
lowering medication at the time of baseline examination. Analyses used PLINK 1.06, R
version 2.9.1, and STATA 10.0.
Meta-analysis We sought genetic association studies of lipid-related variants in people
of European ancestry without a history of cardiovascular disease published between
January 1970 and January 2009. We focused on SNPs (ie, rs1800775, rs708272,
rs646776, rs662799) identified as top signals in the Pakistan study to enable
comparison of their impact in Europeans (with the exception of rs780093, for which
there were minimal previous data owing to the recency of its discovery). Electronic
searches involved MEDLINE, EMBASE, BIOSIS, and Science Citation index, and
combined search terms related to genes (eg, cholesteryl ester transfer protein [CETP])
and lipids (eg, HDL-C) without language restriction. These searches were supplemented
by scanning reference lists, hand searching relevant journals, and correspondence with
authors. Two investigators independently extracted the following information: mean
and SD of lipid levels by genotype; proportion of males; fasting status; assay methods.
Analyses involved only within-study comparisons. Mean levels of lipids (and
differences in mean levels in comparison with the common homozygotes) were
calculated using both fixed and random-effects models (as the latter makes allowances
for between-study heterogeneity). P-value for difference between the effect estimates
obtained in PROMIS and European participants was calculated through a 2 test of
heterogeneity.
ts discovery). ElEEEEEEEEEEEEEE
ence eeeeeeeeeeeeeee CiCiCCiCiCiCiCiCiCiCiCiCiCCCiCiCiCiCiC tatataaatatatatatatatatatataatataatititititititititiititititititiittiononononoonononononononononnnonnnnnoon i i i i iii ii i ii i n
c rm ol r te
H s
f n
chhh hh ttettt rms rererereelalalll teteteteted d d d d tototoo g g g g genenenenenesesesess ( egegegegg,, chholesesesese teteteteteryryyryryll lll esesesessteteteteter trtrtrrrananananansfsfsfssfererererer p p p p prororororote
HDDDDDL-L-L-L-L-C)C)C)C)C) wwwwititittthohohohohoututututu lalalalalangngngngnguuauu gegegegege rrrrresesesesestrtrtrtrtriciciici tititititiononononon. ThThThThTheseseseese eeee sessss arararararchchchchhesssss wwwwwerereree eee ee s
fefferererencncnceee lilill stststs,s,s,, h hananandd sesesearararchchhhining g g gg rererelelevavavantntnt j jjjououournrnrnalals,s,s,,, aa andnd cc corororrererespspspononnon
at INSERM - DISC on July 18, 2010 circgenetics.ahajournals.orgDownloaded from

9
RESULTS
The main characteristics of the Pakistani and German participants in this study are
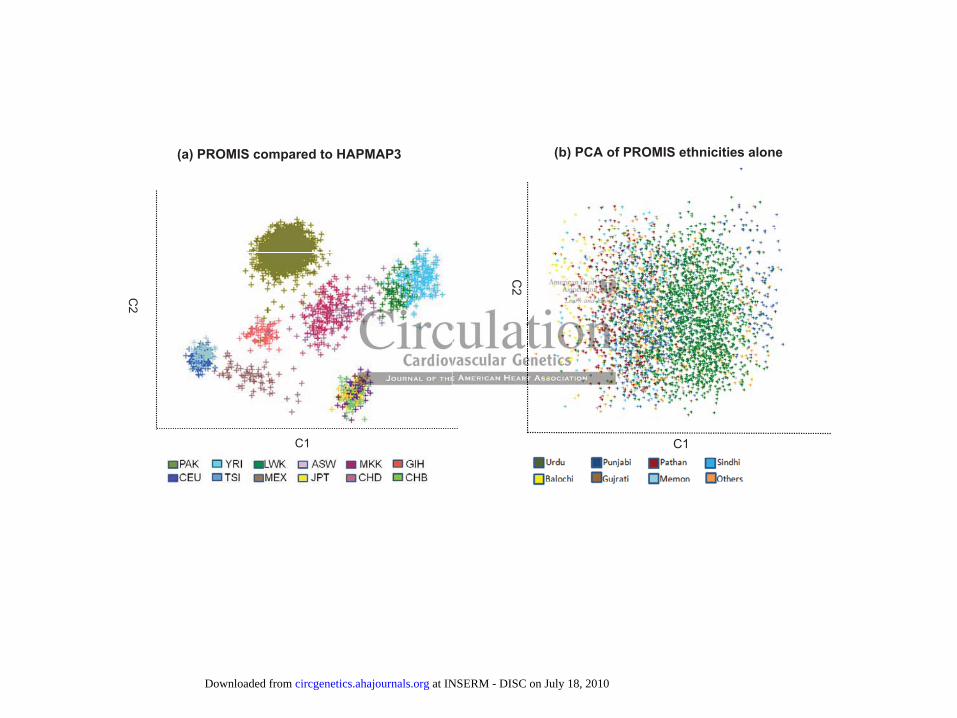
summarised in Table 1. Comparison with HapMap3 population panels shows that the
Pakistani population clustered differently to that of 11 other major ethnic groups,
indicated by the separate clustering on the scatter plot of principal components (Figure
1). Pakistanis appear genetically closest to, but still clearly distinct from, Gujarati
Indians living in the USA, a group that is known to differ genetically from Indians
living in India.24 Analysis of the 8 ethnic and linguistic groups in the Pakistani study
suggested the possibility of relatively minor population substructure; the different
ethnicities could not be demarcated discretely on the scatter plots involving different
principal components (Figure 1 and Supplemental Figure 1). Compared with
Germans, the Pakistani participants were about a decade younger and had broadly
similar mean lipid values, though lower HDL-C (Table 1).
Variants with highly significant associations
Under an additive model, linear regression analysis for each lipid measure identified
several SNPs deviating from the expected 2 values as shown by the quantile-quantile
plots in Figure 2. A total of 25 variants in four genomic regions were associated with
lipid levels in Pakistanis (P 10-6), including 16 variants for HDL-C, 8 variants for
triglycerides, and one variant for LDL-C. All 16 HDL-C-related variants were on the
cholesteryl ester transfer protein (CETP) gene (10-14<P<10-6; Figure 3a &
Supplemental Table 1). Each copy of the minor allele of rs711752, the lead SNP, was
associated with 0.048 mmol/l (95% CI: 0.04 to 0.06; P<10-14) higher HDL-C levels.
MAFs and effect sizes of the CETP variants in Pakistanis were broadly similar to those
bstructure; the dddddddddddddddi
r plooooooooooooooootstssttststsststststststtststsstts i iii i i i ii i i i i i i iinvnvnvnvvnvnvnvnvnvnvnvnvnvnvnnvnvvvolololololoolololloolollooloololollvivviviviviiviviviviviivivivivivivivivvviv ng
P b
p
onononononeeenee ts ((((FiFiFiFiFigugugugug rerererere 1 1 11 a a a aandndndndnd S S SSSupupupupplplplpp emmenennnntatatatatal l ll l FiFiFiFiFigugguguurerererere 1).).).).). C C C C Comomomomompapapapaparerererered
Pakkkkkisisisisistatatatataninininini pppararararrtitititiicicicicic papppp ntntntntntss s wwewww rerererer aaaaaboboboboboututututut aaaaa dd dddecececececadadadadadee eee yoyoyoyoyouuunuu gegegegeger rrrr ananananand dddd hahahahaaddd dd b
pppidid vv valalueueues,s,s, tt thohouguguggghh lolowewewer r r HDHDHDLLL-CCC (((TaTaTablblbleee 111).).)))
at INSERM - DISC on July 18, 2010 circgenetics.ahajournals.orgDownloaded from

10
observed in this German population (Figure 3a), with overlapping genetic association
signals and a similar pattern of linkage disequilibrium (LD) in this region (Figure 4).
Subsidiary analyses in PROMIS cases and controls for these variants revealed
qualitatively similar results, with no substantial evidence of heterogeneity
(Supplemental Figures 2a-c). To further explore LD patterns in Europeans, subsidiary
analyses were conducted in CEU HapMap2 data which revealed a similar pattern of LD
in the CEU HapMap2 population and LURIC participants (data available on request).
As shown in Figure 5, meta-analyses of the two most extensively studied CETP
variants in Europeans yielded overall increases in HDL-C concentration of 0.063
mmol/l (0.055 to 0.071; I2=67%, 55% to 77%) per copy of the A allele of the Taq1B
variant (rs708272; 46 studies, 65,640 participants) and 0.071 mmol/l (0.066 to 0.075;
I2=10%, 0% to 43%) per copy of the A allele of the C-629A variant (rs1800775; 26
studies, 80,184 participants). Associations of the Taq1B variant appeared of similar size
in the two studies; the Taq1B variant was in strong LD with rs711752 (r2=0.99), the
lead variant in the Pakistani population. By contrast, the association of the C-629A
variant with HDL-C appeared somewhat stronger in Europeans than in Pakistanis ( 2
test for difference P=2 x 10⁻⁴; Figure 5 & Supplemental Figures 3a-1b).
Eight variants in two genomic regions were highly significantly associated with log
triglyceride concentration in the Pakistani participants. The most significant SNP
(rs662799; P=1.25 x 10⁻¹⁴) localized to the APOA5 gene (Figure 3b & Supplemental
Table 1). Each copy of the rs662799-C allele at this locus was associated with a 0.14
mmol/l higher log triglyceride concentration (Figures 3b & 4), with MAF about two
times higher in the Pakistani than German participants (0.17 v 0.07). This variant was in
concentration ooooooooooooooooof
the A AAAAAAAA AA AA A AAAA A alaaallalalalalaalalalalalalaalala leleleleelleleleleelelelleleleleeleleleleleelelelelleleellelleelee o o oo o ooo o o oooooooooooooffffff ffffffffff th
2 46 1 6
o
2777772;2;2;2;2; 46 stststststudududududieieees,s,s,s,s, 6 6 6 665,5,5,5,5,64646464640 0000 papapapap rtttticiciii ipanantsssss) ))) ) ananananand dddd 0.0.0.0 07070707071 mmmmmmmmmmoloooo /ll/ll/l ( ( ( ( (0.0.0.0.0.060000 6
433333%)%)%)%)%) ppppperereeer cccopopopopopyy yy ofofofoff ttttthehehehehe AAAAA aa aaallllllllllelelelelele eeee ofofoofof ttttthehehehehe CCCCC-66-6662929292929A AAAA vavaavaaririririr ananananant tt (r(r(r(r(rs1s1s1s1180808088
papapartrtrticicipippppananantststs).).)) AA Assssssococociaiatitionononsss ofof ththeee TaTaTaq1q1q1q BBB vavavaririanananttt apapappppepepepp ararareded o oo o
at INSERM - DISC on July 18, 2010 circgenetics.ahajournals.orgDownloaded from
11
strong LD with several other variants in APOA5 and nearby ZNF259 that were also
significantly associated with triglyceride concentration, but apparently not in LD with
any of the variants in APOA1, APOC3 or APOA4. Overall, APOA5 variants appeared to
have stronger LD and associations with triglyceride concentration in Pakistani than in
German participants (Figure 4). Meta-analysis of rs662799 in available European
studies yielded 0.20 mmol/l (0.14 to 0.26) higher triglyceride per each copy of the
minor allele (18 studies, 20,963 participants: Figure 5 & Supplemental figure 3d), an
effect size that was lower than that observed in the Pakistani participants ( 2 for
difference P=7 x 10⁻⁴; Figure 5). Three variants in the glucokinase regulatory protein
(GCKR) gene highly significantly associated with triglyceride in Pakistanis (P<10-6)
had broadly similar-sized effects in Germans (Figure 3b).
Only rs646776 in the cadherin, EGF LAG seven-pass G-type receptor 2 (CELSR2) gene
was highly significantly associated with LDL-C concentration in the Pakistani
participants (P=1.25 x 10⁻¹⁰) and was associated with a 0.16 mmol/l (-0.23 to -0.08)
lower LDL-C concentration per copy of the minor allele. This variant was not
significantly associated with LDL-C concentration in the German participants (n=1175)
owing to limited statistical power. Analyses conducted earlier in a larger LURIC study
population (n=3189) for the same locus yielded a similar association with LDL-C levels
as observed in Pakistanis.25 The current meta-analysis of rs646776, however,
established its relevance more reliably in Europeans, yielding an overall 0.15 mmol/l (-
0.17 to -0.14) lower LDL-C per each copy of the minor allele (14 studies, 48,445
okinase regulaaaaaaaaaaaaaaatottttttttttt
ide iniinninininninnnininininnnnn P PP P P PPPPP PPP P P P PPPakakakakkakakakakakakakakakakaakakka isisisisissisisisiisisiissiissistatatattatatatatatatatatataatataaaaattaannnnnnninnnnnnnnnn s
m
C
mimimimiilalalalaar-sizezeeeed d d dd efefefeffefefefefectctctctc s ssss ininininin G GGGGerereree mamamamaansnn ((FFigugugugugurerererere 33333bbbb).).).).
inin tt thehe c c cadadheheririn,n,n, EE EGFGFGF LL LAGAGAG ss sevevevenenen-p-p-ppasasassss G-G-G-tytytyypepepepp rr recececepepeppptototorrr 222 ( (CCCC
at INSERM - DISC on July 18, 2010 circgenetics.ahajournals.orgDownloaded from

12
participants; Figure 5), an effect size comparable to that observed in Pakistanis ( 2 test
for difference P =0.84; Figure 5 & Supplemental figure 3c).
No significant interactions were observed on an additive scale of the 25 top variants
with lipid measures by levels of ghee or tobacco consumption or by sex (Supplemental
Figure 4). Qualitatively similar results were observed in analyses of the 875 cases in
PROMIS for whom information was available on time since onset of MI symptoms;
furthermore, adjustment for this variable yielded largely unchanged results (available
upon request).
Variants with nominally significant associations
Of the 152 lipid-related SNPs discovered through previous genome wide scans in
European populations, 49 were covered by the gene array used in the current study (23
for HDL-C, 17 for LDL-C, and 17 for triglycerides with a few SNPs associated with
two or all three traits). At a pre-specified nominal value of P<0.01, 12 of the 23
established HDL-C-related variants were associated with HDL-C concentration
(including 7 variants described earlier in CETP and 5 other variants in LIPG, LIPC,
and DPEP2); 10 of the established 17 triglyceride-related variants were associated with
triglyceride concentration (including 3 variants described earlier in APOA5 and GCKR
and 7 other variants in DOCK7, TBL2, LPL, BAZ1b, and APOB); and 5 of the 17
established LDL-C-related variants were associated with LDL-C concentration
(including one variant in CELSR2 described above and 4 other variants in FADS1,
FADS2 and CELSR2: Supplemental Figure 5). Hence, we identified a total of 41
different variants significantly related to major lipid levels in Pakistanis (ie, 25 variants
at P<10-6 and a further 16 variants at P<10-2). Analyses of these genes in PROMIS and
genomoomomomomomoomomomomomomomommmomommome e e eeeee ee e e e e ee wiwwwiwwwwwwwiwwwiwiwwwwideededededededededededededededededededdddeee s c
u e
i
e h
ulatatatatatiiioii ns, 494949499 www wwererererere e eee cococococovevevevevererererred d ddd bybybyyy t hee geeeeenenenenene a a aarrrrrrrrrrayayayayy u u uuusessss d d d d d ininininin t t tttheheeehe c c c c curururururre
fooooorrrr r LDLDLDLDLDL-L-L-LL C,CCC aaaaandndndndd 11111777 77 fofofofofor trtrtrtrtrigigigigiglylylylylycececececeririrrir dededededes ssss wiwiwiwiwiththththth aaaaa ffffewewewewew S SSSSNPNPNPNPNPs ssss asasasaassososososocicc
e tttrararaitits)s). AtAtAt aa a p p pprerere ss-spepepep cccififieieeedd nononomiminananal l l vavavalulueee ofofooo PP P<0<0<0 00.01,1,1,, 11 1222 ofof tt thhh
at INSERM - DISC on July 18, 2010 circgenetics.ahajournals.orgDownloaded from

13
LURIC participants revealed a similar pattern of LD, with somewhat stronger LD
blocks in APOB and LPL genes in Pakistanis (Supplemental Figure 6). Collectively,
these variants explained 6.2%, 7.1%, and 0.9% of the variation in HDL-C, triglyceride,
and LDL-C, respectively, whereas corresponding analyses in the German participants
explained 5.9%, 7.2% and 0.71% of the variation in these lipids, respectively.
Subsidiary analyses yielded odds ratio for MI in Pakistanis with each of the 41 principal
SNPs that were compatible with the direction of associations of each of these variants
on lipid concentration, although the current study was underpowered for reliable gene-
MI analyses (Supplemental Figure 7).
DISCUSSION
The current study has identified a total of 41 variants at 14 loci that were significantly
associated with levels of HDL-C, triglyceride or LDL-C in Pakistanis. The most highly
significant lipid-related variants identified among Pakistanis corresponded to genes
previously shown to be relevant to lipid metabolism in Europeans, such as CETP,
APOA5, and CELSR2. Even collectively, however, the top variants explained only
6.2%, 7.1%, and 0.9% of the population variation in HDL-C, triglyceride, and LDL-C
levels in Pakistanis, respectively (a similar proportion of lipid variation was explained
by the top signals in our parallel analysis of Germans). The current study has also
suggested some differing allelic frequencies and lipid effects for variants in APOA5 in
Pakistanis compared with Europeans. As discussed below, however, further studies are
needed to confirm whether such differences are mainly related to ethnicity rather than
other characteristics.
N
u i
h
N
udy yyyy hahahahahas ssss idididididenenenentititittififififf edededede a aaaa totototototatattatal ofofofofof 444441 1111 vavavavavariririiiananananantsttststs aaaat tttt 1414141414 lololololocicicicici tt ttthahahahahat wewewewew rerererre ss si
h h lelevevevelsls o o off HDHDHDLLL-C,C,C,, tt tririglglggg ycycycyy erereridideee ororor L L LDLDLDL CC-C i innn PaPaPakikistststanananisis. ThTheeee
at INSERM - DISC on July 18, 2010 circgenetics.ahajournals.orgDownloaded from

14
Most of the highly significant lipid-related loci identified in Pakistani participants were
related to HDL-C and triglyceride, rather than LDL-C, a finding which is consistent
with a lower yield of genetic loci associated with LDL-C in previous GWA studies in
Europeans.5-16 For HDL-C, our most highly significant findings related to the CETP
gene.26 HDL is believed to exert atheroprotective effects through several mechanisms,
including transfer of cholesterol from peripheral tissues to liver.26-27 CETP facilitates
this process by exchanging cholesterol esters from HDL with triglycerides in
apolipoprotein B-containing particles.26 Deficiency of this protein leads to higher HDL-
C levels and other lipoprotein abnormalities.25-26 Our meta-analysis focused on the
Taq1B and C-629A variants in CETP, which alter CETP mass and activity and,
consequently, increase HDL-C concentration.27
For triglyceride, our most highly significant findings related to variants in APOA5,
which is part of the APOA1/C3/A4/A5 gene cluster localized to chromosome 11q23.28-29
It has been proposed that APOAV regulates lipoprotein lipase-mediated hydrolysis of
triglycerides contained in VLDL particles.28 Further triglyceride-related variants were
found in GCKR,30 which regulates activity of glucokinase, a key enzyme responsible for
the first rate-limiting step in the glycolysis pathway, deficiency of which alters glucose
and lipoprotein metabolism.31 For LDL-C, the sole highly significant finding related to
a variant in CELSR2,32 a gene that expresses itself along with PSRC1 and SORT1 within
a transcriptional network proposed to regulate metabolic profile and atherosclerosis,32-33
although precise mechanisms remain unknown.
Compared with German participants we studied, the frequency of the rs662799-C
allele in the APOA5 locus was higher in Pakistanis and appeared to have a greater
analysis focusssssssssssedeeeeeeeeeee
mass anaanananananaanananananananannanananand d ddddd d dddd dd d d dd dd acacacacacacacacacacacacacaacacacacca tititititittititittitiittititiiiviviviviviviiviviiviviivivivivivivivivvviittttytttttt
i
e A
f m
innnnncrcrcrcrrease HHHHHDLDLDLDLDL-C-C-C-C-C c c ccconononononcececececentntntntn rararar tititittionoo .277
e, ououououour rrrr momomomomostststt h hhhhigigigigghlhlhlhlh y sisisisisigngngngng iffffficiccicicananananantt ttt fififififindndndndndininininingsgsgsgsgs rr rrrelelelelelatatatatateeeeefffffff ddd dd tooototo vv vvvararararariaiaiaiaiantntntntnts sss ininininn A
fff tt thehe APAPAPOAOAOA1/1/C3C3C3/A/A4/4/A5A5A5 g g gggeneneneee clclusususteteter r r lolocacacaliliiizezezedd tototo cc chrhromomomosososomommom
at INSERM - DISC on July 18, 2010 circgenetics.ahajournals.orgDownloaded from

15
impact on triglyceride concentration. However, as at least part of these differences
could have been due to non-ethnic factors (eg, differences in sample size and/or
population sampling frameworks used), further study is needed. Evidence of ethnic-
related differences is emerging from other contexts, such as suggestions that total
cholesterol is a stronger risk factor among South Asians than Europeans34 and that the
LTA4H haplotype has higher odds ratios for myocardial infarction in Africans than
Europeans.35 The value of large ethnic-specific studies has also been illustrated by
the discovery of the strongest common susceptibility locus (KCNQ1) yet for T2D,36-
38 identified in East Asians but not initially in Europeans because the allele frequency
in East Asians is much higher (40% v 5%) despite similar odds ratios in both
populations.36-38
For reasons of feasibility, we used existing genetic tools based on catalogues of
genetic variation mostly discovered in Europeans, East Asians and West Africans,
even though we were aware that these tools may not adequately capture genetic
variation in Pakistanis (or other South Asians).39-40 For example, the recent discovery of
a 7-fold relative risk for heart failure with the 25 bp deletion allele in the MYBPC3 gene
would have remained undetected using conventional platforms because this variant is
present only in South Asians.41 Further study in Pakistanis is, therefore, needed
involving better population-specific tools for genetic mapping. Larger replication
studies should also help to quantify and control any over-estimation in hypothesis-
generating estimates (“winner’s curse”). Such studies should aim to involve fine
mapping of relevant loci (eg, APOA5) and functional studies.42 Future studies may also
yield stronger (or novel) genetic signals by direct assay of LDL-C rather than, as in the
because the alllllllllllelllllllllllll
r oddsddsdsdsdsdsddsdsdsdsdsdsdsddssds rrrr rrrrrrrrrrrrrratatatattatatatatatatatatatataatata ioioioioioioioioiooioioioioioioios sssssssss s s ss ssss iniiinininininininiinininiiniiinini b
3
g
o A
38 888 8
feasasasasasibibibibibilililililitititii y,yyy ww wwwee ee usuuu ededededed e eeee ixiixixistststststininininingg ggg gegegegegeneneneeetititititiccccc tt tttoooooooooolslslslsls bbbbbasaaa ededededed ooooonnn ccccatatatatalalalalalogoo
ooonnn momomostststlylyyyy d disiscococoveveverereredd ininnn EE Eurururopopopppeaeaeansnsns, , EaEaEaststst A A Asisiananansss ananandd WeWeWeststst A AA A
at INSERM - DISC on July 18, 2010 circgenetics.ahajournals.orgDownloaded from

16
current study, calculation of LDL-C using Friedewald’s formula. However, as a large
prospective study has shown that associations of major lipids with CHD risk are at least
as extreme in non-fasted participants as in fasted participants,43 use of nonfasting
samples in the current study seems unlikely to have influenced materially the findings
here.
Funding Sources: Epidemiological fieldwork in PROMIS has been supported by unrestricted grants to investigators at the University of Cambridge and in Pakistan. Genotyping for this study was funded by the Wellcome Trust and the EU Framework 6–funded Bloodomics Integrated Project (LSHM-CT-2004-503485). The British Heart Foundation has supported some biochemical assays. The Yousef Jameel Foundation supports Dr Saleheen. The cardiovascular disease epidemiology group of Dr Danesh is underpinned by programme grants from the British Heart Foundation and the UK Medical Research Council.
Conflict of Interest Disclosures: Dr Saleheen has received research funding from the Fogarty International Center, National Heart, Lung and Blood Institute, National Institute of Neurological Disorders and Stroke and Wellcome Trust. Dr Danesh reports having received research funding from the British Heart Foundation, BUPA Foundation, diaDexus, European Union, Evelyn Trust, Fogarty International Center, GlaxoSmithKline, Medical Research Council, Merck, National Heart, Lung and Blood Institute, National Institute of Neurological Disorders and Stroke, Novartis, Pfizer, Roche, and Wellcome Trust.
References
1. Lewington S, Whitlock G, Clarke R, Sherliker P, Emberson J, Halsey J, Qizilbash N, Peto R, Collins R. Blood cholesterol and vascular mortality by age, sex, and blood pressure: a meta-analysis of individual data from 61 prospective studies with 55,000 vascular deaths. Lancet 2007;370:1829-39.
2. Sarwar N, Danesh J, Eiriksdottir G, Sigurdsson G, Wareham N, Bingham S, Boekholdt SM, Khaw KT, Gudnason V. Triglycerides and the risk of coronary heart disease: 10,158 incident cases among 262,525 participants in 29 Western prospective studies. Circulation 2007;115:450-8.
oooooooooooooooololololololololololololollololollololololol gygygygygygygygygyygygygygygygygygygygygyygygygygy ggggggggggggggggggggggggrorororororororoorororororororooroorooupupupupupupupupupupupupupupupupupupupuupupuppu oooooooooooooooof f ff f ff f f ff f ffff ffffff DDDDDDDDDDDDDDDDDFounddddaddddddddddddddddd titititititittitittititittitiiion andndndndnddndndndndndndndddndndndnndd t
rch Council.
t ia aud AD E U i E l T t F t I t ti
rch CCCouoo ncnn ilililil.
teeeeerererererest Disssccloosururresssss: : :: Drrrrr SSSaaaleheeheeenn hahahahahass rereececeeivededed rrrrreeesee eaaaarcrcrcrcrchh fuuunnndiationannannal lll CCeCeCC ntntnterererer, NaNNaNNatititiitionononononal HHHHHeaeaeaeaeart, LuLLuL ngngngngng aaaaandndndndnd B BBBBlolll oodoo IIIIInsnsnsttit tutt ttete, NNaNNNurological DiDiDiDiDisososososordrdrdrdrdererereers ssss ananananand dddd StStStStStrrrrrokokokokoke eee anananaandd d WeWeWeWeWellllllllllcococococomememememe T TTTTrrrrur st. Dr Dad dd d researrrrrchchchchch fufufufuundndndndndinininnng g g g g frfrfrfrfrommomomm t t tt thehehehehe B B BBBririririritititititishshsh H H HHHeaeaeaeaeartrtrt F F FFFouououououndndndndndatatatatatioioioioon,nnnn BB BUPUPUPAAAADD EE UU ii EE ll TT tt FF tt II tt titi
at INSERM - DISC on July 18, 2010 circgenetics.ahajournals.orgDownloaded from

17
3. Namboodiri KK, Kaplan EB, Heuch I, Elston RC, Green PP, Rao DC, Laskarzewski P, Glueck CJ, Rifkind BM. The Collaborative Lipid Research Clinics Family Study: biological and cultural determinants of familial resemblance for plasma lipids and lipoproteins. Genet Epidemiol 1985;2:227-54.
4. Weiss LA, Pan L, Abney M, Ober C. The sex-specific genetic architecture of quantitative traits in humans. Nat Genet 2006;38:218-22.
5. Kathiresan S, Musunuru K, Orho-Melander M. Defining the spectrum of alleles that contribute to blood lipid concentrations in humans. Curr Opin Lipidol 2008;19:122-7.
6. Hegele RA. Plasma lipoproteins: genetic influences and clinical implications. Nat Rev Genet 2009;10:109-21.
7. Manolio TA. Cohort studies and the genetics of complex disease. Nat Genet 2009;41:5-6.
8. Aulchenko YS, Ripatti S, Lindqvist I, Boomsma D, Heid IM, Pramstaller PP, Penninx BW, Janssens AC, Wilson JF, Spector T, Martin NG, Pedersen NL, Kyvik KO, Kaprio J, Hofman A, Freimer NB, Jarvelin MR, Gyllensten U, Campbell H, Rudan I, Johansson A, Marroni F, Hayward C, Vitart V, Jonasson I, Pattaro C, Wright A, Hastie N, Pichler I, Hicks AA, Falchi M, Willemsen G, Hottenga JJ, de Geus EJ, Montgomery GW, Whitfield J, Magnusson P, Saharinen J, Perola M, Silander K, Isaacs A, Sijbrands EJ, Uitterlinden AG, Witteman JC, Oostra BA, Elliott P, Ruokonen A, Sabatti C, Gieger C, Meitinger T, Kronenberg F, Doring A, Wichmann HE, Smit JH, McCarthy MI, van Duijn CM, Peltonen L. Loci influencing lipid levels and coronary heart disease risk in 16 European population cohorts. Nat Genet 2009;41:47-55.
9. Kathiresan S, Willer CJ, Peloso GM, Demissie S, Musunuru K, Schadt EE, Kaplan L, Bennett D, Li Y, Tanaka T, Voight BF, Bonnycastle LL, Jackson AU, Crawford G, Surti A, Guiducci C, Burtt NP, Parish S, Clarke R, Zelenika D, Kubalanza KA, Morken MA, Scott LJ, Stringham HM, Galan P, Swift AJ, Kuusisto J, Bergman RN, Sundvall J, Laakso M, Ferrucci L, Scheet P, Sanna S, Uda M, Yang Q, Lunetta KL, Dupuis J, de Bakker PI, O'Donnell CJ, Chambers JC, Kooner JS, Hercberg S, Meneton P, Lakatta EG, Scuteri A, Schlessinger D, Tuomilehto J, Collins FS, Groop L, Altshuler D, Collins R, Lathrop GM, Melander O, Salomaa V, Peltonen L, Orho-Melander M, Ordovas JM, Boehnke M, Abecasis GR, Mohlke KL, Cupples LA. Common variants at 30 loci contribute to polygenic dyslipidemia. Nat Genet 2009;41:56-65.
10. Sabatti C, Service SK, Hartikainen AL, Pouta A, Ripatti S, Brodsky J, Jones CG, Zaitlen NA, Varilo T, Kaakinen M, Sovio U, Ruokonen A, Laitinen J, Jakkula E, Coin L, Hoggart C, Collins A, Turunen H, Gabriel S, Elliot P, McCarthy MI, Daly MJ, Jarvelin
eeeeeeeeeeeeeeeididididididididididididididididididididid I IIIIIIIIIIII IIIIIIIIM,M,M,MMM,M,M,M,MM,M,M,M,M,M,M,MMM,M,M,MMM,M,M PPPPPPPP PPPPP PPPPPPPPPPPrarrarararararararaarrarrararrarararaarr msmsmssmsmsmsmssmsmsmsmsmsmsmmssmssmsstatataatataaaaaaaaaaaaderssssssssssssenenenenenenenenenenenenenenennnenenenenee N NNNN N N NNN NN N N NNNN NN NNL,L,L,L,L,L,L,L,L,L,L,L,L,L,LLL,LL,LLLLL KKKKKKKKKKKK KKKKKKKKKKKKyvyyyyyyyyyyyyyyyy
F nH aF MMagnuss K, Isaacs A bKronenberg F Doring A Wichmann HE Smit JH McCarth
Freieieieieimememememerrrr r NBNBNBNBNB, Jarvelin MR, Gylllleleleleennsten U, CCCCCamamamamampbell H, RudanHayayayayayward CCCCC, ViViViViV tatatatatartrtrtrtrt VVV VV, JoJoJoJoJonnnasssssss onn I, PaPaPaPaPattttttttttarrooo CCCCC, W W WWW iiririghghghghght t t tt A,A,A,AA HHH HHaFaFaaaalclclclclchi MMMMM,, , , WiWiWilllemmmmmsesesesesen nnnn G,G,G,G,G, H H H H Hototootteteetengngngngngaa aaa JJJJJJJJJ, , , ,, dedededde GGGGGeueueueueus s s s s EJEE , MMMMagnussonnnnn P P P P P,,,, , SaSaSaSaSahahahahahariririririnenenenenen n n n n J,J,J,J,J, PPPPerererererololololola M,M,M,M,M, S S SS Silililililananananandededededer r r rr K, Isaacs AAAGG, W Witittetetemamamannn JCJC, OoOostststrarara B BAA, E Elllliiotototttt PP, R Ruououokokonenenennn AA, S SababbKKKKroronenenbnbnberergg FFF DDDororininingg AAA WWWicicichhhmamannnn HHHEEE SSSmimimitt JHJHJH McMcMcCaCaCarttrthhh
at INSERM - DISC on July 18, 2010 circgenetics.ahajournals.orgDownloaded from
18
MR, Freimer NB, Peltonen L. Genome-wide association analysis of metabolic traits in a birth cohort from a founder population. Nat Genet 2009;41:35-46.
11. Sandhu MS, Waterworth DM, Debenham SL, Wheeler E, Papadakis K, Zhao JH, Song K, Yuan X, Johnson T, Ashford S, Inouye M, Luben R, Sims M, Hadley D, McArdle W, Barter P, Kesaniemi YA, Mahley RW, McPherson R, Grundy SM, Bingham SA, Khaw KT, Loos RJ, Waeber G, Barroso I, Strachan DP, Deloukas P, Vollenweider P, Wareham NJ, Mooser V. LDL-cholesterol concentrations: a genome-wide association study. Lancet 2008;371:483-91.
12. Burkhardt R, Kenny EE, Lowe JK, Birkeland A, Josowitz R, Noel M, Salit J, Maller JB, Pe'er I, Daly MJ, Altshuler D, Stoffel M, Friedman JM, Breslow JL. Common SNPs in HMGCR in micronesians and whites associated with LDL-cholesterol levels affect alternative splicing of exon13. Arterioscler Thromb Vasc Biol 2008;28:2078-84.
13. Kathiresan S, Melander O, Anevski D, Guiducci C, Burtt NP, Roos C, Hirschhorn JN, Berglund G, Hedblad B, Groop L, Altshuler DM, Newton-Cheh C, Orho-Melander M. Polymorphisms associated with cholesterol and risk of cardiovascular events. N Engl J Med 2008;358:1240-9.
14. Kathiresan S, Melander O, Guiducci C, Surti A, Burtt NP, Rieder MJ, Cooper GM, Roos C, Voight BF, Havulinna AS, Wahlstrand B, Hedner T, Corella D, Tai ES, Ordovas JM, Berglund G, Vartiainen E, Jousilahti P, Hedblad B, Taskinen MR, Newton-Cheh C, Salomaa V, Peltonen L, Groop L, Altshuler DM, Orho-Melander M. Six new loci associated with blood low-density lipoprotein cholesterol, high-density lipoprotein cholesterol or triglycerides in humans. Nat Genet 2008;40:189-97.
15. Willer CJ, Sanna S, Jackson AU, Scuteri A, Bonnycastle LL, Clarke R, Heath SC, Timpson NJ, Najjar SS, Stringham HM, Strait J, Duren WL, Maschio A, Busonero F, Mulas A, Albai G, Swift AJ, Morken MA, Narisu N, Bennett D, Parish S, Shen H, Galan P, Meneton P, Hercberg S, Zelenika D, Chen WM, Li Y, Scott LJ, Scheet PA, Sundvall J, Watanabe RM, Nagaraja R, Ebrahim S, Lawlor DA, Ben-Shlomo Y, vey-Smith G, Shuldiner AR, Collins R, Bergman RN, Uda M, Tuomilehto J, Cao A, Collins FS, Lakatta E, Lathrop GM, Boehnke M, Schlessinger D, Mohlke KL, Abecasis GR. Newly identified loci that influence lipid concentrations and risk of coronary artery disease. Nat Genet 2008;40:161-9.
16. Saxena R, Voight BF, Lyssenko V, Burtt NP, de Bakker PI, Chen H, Roix JJ, Kathiresan S, Hirschhorn JN, Daly MJ, Hughes TE, Groop L, Altshuler D, Almgren P, Florez JC, Meyer J, Ardlie K, Bengtsson BK, Isomaa B, Lettre G, Lindblad U, Lyon HN, Melander O, Newton-Cheh C, Nilsson P, Orho-Melander M, Rastam L, Speliotes EK, Taskinen MR, Tuomi T, Guiducci C, Berglund A, Carlson J, Gianniny L, Hackett R, Hall L,
rtrtrtrrtrrrrrtrrrrrtt NPNNNPNPNPNNNNNNNN , ,,,,,,,,,,, RoRoRoRoRoRRRoRRRoRRRooooosososssossssosososososoos CCCC CCCC CC CCC C C CCCCCCton-ChChChChChChChChChChChCChChChChChChChhhCChCCC ehehehehehehehehehehehehehehehehehehehehehhh CCCCCCCCCCCCCCCCCCCCC, OrOrOrOrOOrOrOOrOrOrOOOOOOOOO
ddddddddddddddiiiiiiiiiiiiii lllllllllllllllllms associated with cholesterol and risk of cardiovascular 5
, CF E
NP lt L G L Alt h l DM O h M l d M
ms associatated with cholesterol and risk of cardiovascular 588888:1:1:1:1:1240---99.999
, MeMeMeMeMelalalaaandndndndnderererr O OOOO,,, GuGuGuGuGuidididididucucucucuccicccc CCCCC,,,, , SuSuSuSuSurtrtrtrr ii iii A,A,A,AA, B B BBBurururururtttttttttt NNNNNP,P,P,PP RRRRRieieieieiedededededer rrrr MJMJMJMJMJ,,, CCCF, Havulinnnnnnaa aaa ASASASASAS, , ,, , WaWaWaWaWahlhlhlhlhlstststststrararararandndndndn B BB BB,,, HHH HHededededednenenenenerrr r T,T,T,T,T, C C C C Corooororelelelele la D, Tai E
VVa ttrtiiainininininenenenen E E E EE, ,, JoJoJoJoJousususususililiillahahahahhtititititi P P P PP, , ,, HeHeHeHeHedbdbdbblalalaaad d dd B,B,B,B,B, T TTTTasasasasaskikikikikinenenenenen nnnn MRMR, NNNPPP lllt LLL GGG LLL AlAlAlt hhh lll DDDMMM OOO hhh MMM lll ddd MMMM
at INSERM - DISC on July 18, 2010 circgenetics.ahajournals.orgDownloaded from
19
Holmkvist J, Laurila E, Sjogren M, Sterner M, Surti A, Svensson M, Svensson M, Tewhey R, Blumenstiel B, Parkin M, Defelice M, Barry R, Brodeur W, Camarata J, Chia N, Fava M, Gibbons J, Handsaker B, Healy C, Nguyen K, Gates C, Sougnez C, Gage D, Nizzari M, Gabriel SB, Chirn GW, Ma Q, Parikh H, Richardson D, Ricke D, Purcell S. Genome-wide association analysis identifies loci for type 2 diabetes and triglyceride levels. Science 2007;316:1331-6.
17. Saleheen D, Khanum S, Haider SR, Nazir A, Ahmad U, Khalid H, Hussain I, Shuja F, Shahid K, Habib A, Frossard PM. A novel haplotype in ABCA1 gene effects plasma HDL-C concentration. Int J Cardiol 2007;115:7-13.
18. Keating BJ, Tischfield S, Murray SS, Bhangale T, Price TS, Glessner JT, Galver L, Barrett JC, Grant SF, Farlow DN, Chandrupatla HR, Hansen M, Ajmal S, Papanicolaou GJ, Guo Y, Li M, Derohannessian S, de Bakker PI, Bailey SD, Montpetit A, Edmondson AC, Taylor K, Gai X, Wang SS, Fornage M, Shaikh T, Groop L, Boehnke M, Hall AS, Hattersley AT, Frackelton E, Patterson N, Chiang CW, Kim CE, Fabsitz RR, Ouwehand W, Price AL, Munroe P, Caulfield M, Drake T, Boerwinkle E, Reich D, Whitehead AS, Cappola TP, Samani NJ, Lusis AJ, Schadt E, Wilson JG, Koenig W, McCarthy MI, Kathiresan S, Gabriel SB, Hakonarson H, Anand SS, Reilly M, Engert JC, Nickerson DA, Rader DJ, Hirschhorn JN, Fitzgerald GA. Concept, design and implementation of a cardiovascular gene-centric 50 k SNP array for large-scale genomic association studies. PLoS One 2008;3:e3583.
19. Saleheen D, Zaidi M, Rasheed A, Ahmad U, Hakeem A, Murtaza M, Kayani W, Faruqui A, Kundi A, Zaman KS, Yaqoob Z, Cheema LA, Samad A, Rasheed SZ, Mallick NH, Azhar M, Jooma R, Gardezi AR, Memon N, Ghaffar A, Fazal uR, Khan N, Shah N, Ali SA, Samuel M, Hanif F, Yameen M, Naz S, Sultana A, Nazir A, Raza S, Shazad M, Nasim S, Javed MA, Ali SS, Jafree M, Nisar MI, Daood MS, Hussain A, Sarwar N, Kamal A, Deloukas P, Ishaq M, Frossard P, Danesh J. The Pakistan Risk of Myocardial Infarction Study: a resource for the study of genetic, lifestyle and other determinants of myocardial infarction in South Asia. Eur J Epidemiol 2009;24:329-38.
20. Winkelmann BR, Marz W, Boehm BO, Zotz R, Hager J, Hellstern P, Senges J. Rationale and design of the LURIC study--a resource for functional genomics, pharmacogenomics and long-term prognosis of cardiovascular disease. Pharmacogenomics 2001;2:S1-73.
21. Little J, Higgins JP, Ioannidis JP, Moher D, Gagnon F, von EE, Khoury MJ, Cohen B, vey-Smith G, Grimshaw J, Scheet P, Gwinn M, Williamson RE, Zou GY, Hutchings K, Johnson CY, Tait V, Wiens M, Golding J, van DC, McLaughlin J, Paterson A, Wells G, Fortier I, Freedman M, Zecevic M, King R, Infante-Rivard C, Stewart A, Birkett N. STrengthening the REporting of Genetic Association studies (STREGA)--an extension of the STROBE statement. Eur J Clin Invest 2009;39:247-66.
KKKKKKKKKKKKKKKKKKKKKKKimimimimimimimimimimimimimimimimimmimimimmmm C CC CC CC CC C CC CCCCC CCCC CCCCCE,E,E,E,E,E,E,E,E,E,E,E,E,E,E,E,,EEE,EEEE, F F F F FFFFFFF FFFFFFFFFFFFabababababababababababababababababa sisisisisisisiisisisisisisisiisisssis tztztztzttztztztztztztttzzzznkle E,E,E,E,E,E,E,E,E,E,E,E,E,E,E,E,E,EE,, RRRRR RRRRRRRRRRRRRRReieieieieieieieieieieieieiieiiiichchchchchhchhchhchchchchchchchch DDD DDDDDDDDDDDD
Samani NJ Lusis AJ, Schadt E, Wilson JG, Koenig We
D rs it . ig par gene-ce c arr or -s enom ass0
Saaaaamamamamamaninininini N NN N NJ,JJ Lusis AJ, Schaddadaddt tttt E, Wilson nn nn JG, Koenig W, GGaGGG brieeeeel SBSBSBSBSB, ,,,, HaHaHaHaHakokokokokonananananarsrsrsrr ononononn H H H, AnAnnnnananananand dddd SSSSSSSSS , ReRRRR ililililillylylylyly M M M M M, ,,, EnEnEnEnEngegggg
DJJJJJ, ,,,, HiHHH rschhhhchhohhornn JN,N,N,NN Fitzgzgzgzzgeeeraaaldd GAGAA. CoCoCoCC ncceeept,,, desesesesesignn nn annddd imimimpar gene-centntntntntriririrr c 505050500 kkkkk SNPPPPP arrayayayy f ffor l l ll laraaaa gegggg -scacacalllell gggggenomiici ass008;;3:e3583.3333
at INSERM - DISC on July 18, 2010 circgenetics.ahajournals.orgDownloaded from
20
22. Friedewald WT, Levy RI, Fredrickson DS. Estimation of the concentration of low-density lipoprotein cholesterol in plasma, without use of the preparative ultracentrifuge. Clin Chem 1972;18:499-502.
23. Teo YY, Inouye M, Small KS, Gwilliam R, Deloukas P, Kwiatkowski DP, Clark TG. A genotype calling algorithm for the Illumina BeadArray platform. Bioinformatics 2007;23:2741-6.
24. Reich D, Thangaraj K, Patterson N, Price AL, Singh L. Reconstructing Indian population history. Nature 2009;461:489-94.
25. Kleber ME, Renner W, Grammer TB, Linsel-Nitschke P, Boehm BO, Winkelmann BR, Bugert P, Hoffmann MM, März W. Association of the single nucleotide polymorphism rs599839 in the vicinity of the sortilin 1 gene with LDL and triglyceride metabolism, coronary heart disease and myocardial infarction The Ludwigshafen Risk and Cardiovascular Health Study. Atherosclerosis 2010;209:492-7.
26. de Grooth GJ, Klerkx AH, Stroes ES, Stalenhoef AF, Kastelein JJ, Kuivenhoven JA. A review of CETP and its relation to atherosclerosis. J Lipid Res 2004;45:1967-74.
27. Thompson A, Di AE, Sarwar N, Erqou S, Saleheen D, Dullaart RP, Keavney B, Ye Z, Danesh J. Association of cholesteryl ester transfer protein genotypes with CETP mass and activity, lipid levels, and coronary risk. JAMA 2008;299:2777-88.
28. Kluger M, Heeren J, Merkel M. Apoprotein A-V: An important regulator of triglyceride metabolism. J Inherit Metab Dis 2008.
29. Lai CQ, Parnell LD, Ordovas JM. The APOA1/C3/A4/A5 gene cluster, lipid metabolism and cardiovascular disease risk. Curr Opin Lipidol 2005;16:153-66.
30. Ferre T, Riu E, Franckhauser S, Agudo J, Bosch F. Long-term overexpression of glucokinase in the liver of transgenic mice leads to insulin resistance. Diabetologia 2003;46:1662-8.
31. O'Doherty RM, Lehman DL, Telemaque-Potts S, Newgard CB. Metabolic impact of glucokinase overexpression in liver: lowering of blood glucose in fed rats is accompanied by hyperlipidemia. Diabetes 1999;48:2022-7.
32. Samani NJ, Braund PS, Erdmann J, Gotz A, Tomaszewski M, Linsel-Nitschke P, Hajat C, Mangino M, Hengstenberg C, Stark K, Ziegler A, Caulfield M, Burton PR, Schunkert H, Tobin MD. The novel genetic variant predisposing to coronary artery disease in the region of the PSRC1 and CELSR2 genes on chromosome 1 associates with serum cholesterol. J Mol Med 2008;86:1233-41.
4999999999999999992-7.77777.7777777.
Kastelelelelelelelelelelelelelllleelelelleieieeieieieieieieieieieieiieieieieieieiee nnnnnnnnnnnnnnnnnnn JJJJJJJJJJJJJJJJJJJJJJJJJJJJJJJJJJJJJJJJJJJJJJ KuKuKuKuKKuKKKKKuKKKKKKKuKKKKKK iE 1
A Ks wl
ETPTPTPTPTP anddddd ii its rrrerr lation to atherosclelelll rosis. J LLLLLipididididid Res 2004;45:1
A, DiDiDiDiDi AE,EE,E,E, SSSaaraaa waww r N,N,N,N,N EE EEErqqqqqououououou SSSSS, ,,,, SaSaaSaalelelelelehehehehheeneneneen DDDDD, , ,, DuDuDuuDullllllllllaaaaaartrtrtrtrt RRRP,P,P,P,, KKssociation ofofofofof ccccchohohohoholeleleleestststststerererererylylylyyl eeeeeststststs eeeerrr r trtrtrtrtranananana sfsfsfsfsfererererer p p p p prororororoteteteteteininininin g g g g genotypes wlillipipidd lelevevevelsls, ananandd cococorororonananaryryry rr risiskk. J JAMAMAA 20200808;2;29999:2:277777-7-8888.
at INSERM - DISC on July 18, 2010 circgenetics.ahajournals.orgDownloaded from

21
33. Schadt EE, Molony C, Chudin E, Hao K, Yang X, Lum PY, Kasarskis A, Zhang B, Wang S, Suver C, Zhu J, Millstein J, Sieberts S, Lamb J, GuhaThakurta D, Derry J, Storey JD, vila-Campillo I, Kruger MJ, Johnson JM, Rohl CA, van NA, Mehrabian M, Drake TA, Lusis AJ, Smith RC, Guengerich FP, Strom SC, Schuetz E, Rushmore TH, Ulrich R. Mapping the genetic architecture of gene expression in human liver. PLoS Biol 2008;6:e107.
34. Karthikeyan G, Teo KK, Islam S, McQueen MJ, Pais P, Wang X, Sato H, Lang CC, Sitthi-Amorn C, Pandey MR, Kazmi K, Sanderson JE, Yusuf S. Lipid profile, plasma apolipoproteins, and risk of a first myocardial infarction among Asians: an analysis from the INTERHEART Study. J Am Coll Cardiol 2009;53:244-53.
35. Helgadottir A, Manolescu A, Helgason A, Thorleifsson G, Thorsteinsdottir U, Gudbjartsson DF, Gretarsdottir S, Magnusson KP, Gudmundsson G, Hicks A, Jonsson T, Grant SF, Sainz J, O'Brien SJ, Sveinbjornsdottir S, Valdimarsson EM, Matthiasson SE, Levey AI, Abramson JL, Reilly MP, Vaccarino V, Wolfe ML, Gudnason V, Quyyumi AA, Topol EJ, Rader DJ, Thorgeirsson G, Gulcher JR, Hakonarson H, Kong A, Stefansson K. A variant of the gene encoding leukotriene A4 hydrolase confers ethnicity-specific risk of myocardial infarction. Nat Genet 2006;38:68-74.
36. Yasuda K, Miyake K, Horikawa Y, Hara K, Osawa H, Furuta H, Hirota Y, Mori H, Jonsson A, Sato Y, Yamagata K, Hinokio Y, Wang HY, Tanahashi T, Nakamura N, Oka Y, Iwasaki N, Iwamoto Y, Yamada Y, Seino Y, Maegawa H, Kashiwagi A, Takeda J, Maeda E, Shin HD, Cho YM, Park KS, Lee HK, Ng MC, Ma RC, So WY, Chan JC, Lyssenko V, Tuomi T, Nilsson P, Groop L, Kamatani N, Sekine A, Nakamura Y, Yamamoto K, Yoshida T, Tokunaga K, Itakura M, Makino H, Nanjo K, Kadowaki T, Kasuga M. Variants in KCNQ1 are associated with susceptibility to type 2 diabetes mellitus. Nat Genet 2008;40:1092-7.
37. Unoki H, Takahashi A, Kawaguchi T, Hara K, Horikoshi M, Andersen G, Ng DP, Holmkvist J, Borch-Johnsen K, Jorgensen T, Sandbaek A, Lauritzen T, Hansen T, Nurbaya S, Tsunoda T, Kubo M, Babazono T, Hirose H, Hayashi M, Iwamoto Y, Kashiwagi A, Kaku K, Kawamori R, Tai ES, Pedersen O, Kamatani N, Kadowaki T, Kikkawa R, Nakamura Y, Maeda S. SNPs in KCNQ1 are associated with susceptibility to type 2 diabetes in East Asian and European populations. Nat Genet 2008;40:1098-102.
38. McCarthy MI, Abecasis GR, Cardon LR, Goldstein DB, Little J, Ioannidis JP, Hirschhorn JN. Genome-wide association studies for complex traits: consensus, uncertainty and challenges. Nat Rev Genet 2008;9:356-69.
39. McCarthy MI. Casting a wider net for diabetes susceptibility genes. Nat Genet. 2008;40:1039-40.
lllllllllllllllllllfefefefefefefefefefefefefefefffefefefefeef M M M MM MMM MMMMM MMMMMM MMMMMMML,L,L,L,L,L,L,L,L,L,L,L,L,L,LLLL,L,LLLLL, G G GG GGGGGGGGGGGG GGGGGGGGududududududududududududududududududnananananananananananananannannananannaJR,R,R,R,R,R,R,R,RRRR,,,,, H HH H HH H H HHHH HH H H HH kakkkkkkkkkkkkkkkonononononononononnoononnnnononarararrrarararararaaraarrrso
K. A variant of the gene encoding le kotriene A4 h drolase co
M iN
N
K. A A A AA vavavavavaririrririananaana tt tt t of the gene encodiiingngngngng leukotrienenenenene A 4 hydrolase cofffoff mmmmyocaaaaardrdrddrdiaiaiaial l l ll inininininfafafafafarcrcrcrcrctititititiononononon. NaNaNaNaNat tt GeGeneeeeet t tt t 2020202020060606060 ;3;33;338:8:8:8:8:688888-7-7-7-7-74.4.4.4.4.
Miyayayayayakekekekeke KKKKK, HoHoHoHoHoririririikakakakawawawawawa YYYYY, HaHaHaHaHarararaara KKK,KK O OOOOsasasasasawawawawawa HHHHH, FuFuFuFuFurururuurutatata HHHHH, HHHiHHato Y, Yammmmmagagagagagatatattata aaaa K,K,K,K,K HHHHHinininininokokokokokioioioioio YYYYY,,,, WW WWWanananananggg gg HYHYHYHYHY, TaTaTaTaanananananahashi T, N
NNN, Iwammmmmotototototo oooo Y,Y,Y,Y,Y, YYYYYamamamamamadadadadda aaaa Y,Y,Y,YY, SSSSSeieieieieinonononono YYYYY, ,,, MaMaMaMaMaegegegegegawawawawawa aaaa H,H,H,H,H, KKKKKashiwww
at INSERM - DISC on July 18, 2010 circgenetics.ahajournals.orgDownloaded from
22
40. Ioannidis JP, Thomas G, Daly MJ. Validating, augmenting and refining genome-wide association signals. Nat Rev Genet 2009;10(5):318-29.
41. Dhandapany PS, Sadayappan S, Xue Y, Powell GT, Rani DS, Nallari P, Rai TS, Khullar M, Soares P, Bahl A, Tharkan JM, Vaideeswar P, Rathinavel A, Narasimhan C, Ayapati DR, Ayub Q, Mehdi SQ, Oppenheimer S, Richards MB, Price AL, Patterson N, Reich D, Singh L, Tyler-Smith C, Thangaraj K. A common MYBPC3 (cardiac myosin binding protein C) variant associated with cardiomyopathies in South Asia. Nat Genet 2009;41:187-91.
42. Ioannidis JP, Thomas G, Daly MJ. Validating, augmenting and refining genome-wide association signals. Nat Rev Genet. 2009;10:318-29
43. Emerging Risk Factors Collaboration, Di Angelantonio E, Sarwar N, Perry P, Kaptoge S, Ray KK, Thompson A, Wood AM, Lewington S, Sattar N, Packard CJ, Collins R, Thompson SG, Danesh J. Major lipids, apolipoproteins, and risk of vascular disease. JAMA 2009;302:1993-2000
,
at INSERM - DISC on July 18, 2010 circgenetics.ahajournals.orgDownloaded from

23
Table 1: Some characteristics of the participants from PROMIS and LURIC studies
Data are mean (SD), median (IQR), or %.
Figure Legends
Figure 1: (a) Scatter plot of the first two principal components identified by principal component
analysis of the identity-by-state matrix. The colors of points refer to the self reported-ethnicities
in PROMIS control participants and HAPMAP (These ethnicities were not used in the PCA). (b)
Scatter plot of the first two principal components and self reported ethnicities in PROMIS
control participants
Figure 1 (a-b) PAK: Pakistani from the PROMIS controls; YRI: Yoruba in Ibadan Nigeria,
LWK: Luhya in Webuye Kenya, ASW: African ancestry in Southwest USA, MKK: Maasai in
PROMIS
LURIC
Characteristic n= 3195 n = 2452
Age (y) 53.2 (10) 62 (10)
Women (%) 17.5 29.5
Self-reported history of diabetes mellitus (%) 17.2 32.4
Family history of MI (%) 15.4% 10%
Body mass index (kg/m2) 25.2 (4.3) 27.4 (4.0)
Total cholesterol (mmol/l) 4.6 (1.3) 5.0 (1.0)
Low density lipoprotein cholesterol (mmol/l) 2.70 (1.20) 2.96 (0.85)
High density lipoprotein cholesterol (mmol/l) 0.82 (0.24) 0.99 (0.27)
Triglycerides (mmol/l) 0.56 (0.22 -0.95) 0.49 (0.21 – 0.81)
2727272727272727272727272727272727272222 .4.4.4.4.4.44.44.4.44.4.44.4.44444 ((((( (( (((( ((((( (4.4.4.4.4.4.4.4.444.4444 0)0)0)0)0)0)0)00)0)0000)000))00
/l) 4 6 (1 3) 5 0 (1 0)
c )
)
.
/l) 4.6 (1.3) 5.0 (1.0)
chchhhchoooloo esterol (((((mmmmololololo /l/l/l/l/l) ) ) ) 22.700000 ( ( (((111.11 222022 )) 2.2.2.2.2.9666 (((((0...88858 )
cholellel stststtterolll ((mmmmm llol/l/// ) 00.82828222 (((( (0.0.000.2424242424) 0.99999 ( (((0.0000 27727)
000.565656 (( (000.222222 -000.959595) ) ) ) 000.494949 (( (000.212121 – 0 0 0.
at INSERM - DISC on July 18, 2010 circgenetics.ahajournals.orgDownloaded from
24
Kinyawa Kenya, GIH:Gujarati Indians in Houston, CEU: Utah residents with Northern and
Western European ancestry from the CEPH collection, TSI:Toscani in Italia, MEX: Mexican
ancestry in Los Angeles, California, JPT: Japanese in Tokyo, Japan, CHD:Chinese in
Metropolitan Denver, Colorado Texas, CHB:Han Chinese in Beijing, China. C1: First principal
component; C2: Second principal component
Figure 2: : Genomic inflation factor
Figures 3 (a-b): Estimates represent the per-minor allele increase in lipid levels, adjusted for age,
sex, the first two principal components and case-control status. The P-value for difference
between studies corresponds to a test of nullity of interaction term between study and the SNP of
interest. Boxes are proportional to the inverse of the variance of study estimates. Chr:
chromosome, SNP: Single Nucleotide Polymorphism, MAF: minor allele frequency
Figure 4: (a) PROMIS (blue) and Luric (red) (b) LD plot (D’) LURIC (c) LD plot (D’) PROMIS.
LD plots have been drawn using 1595 PROMIS control and 1175 LURIC control
participants.Similar analyses for CELSR2 gene in PROMIS and LURIC were not possible as the
current gene array has only few SNPs in this gene.
Figure 5: Estimates represent the per-minor allele increase in lipid levels. PROMIS estimates are
derived fitting a regression, adjusting for age, sex, case-control status and the first two
components of PCA. Estimates in Whites are derived from a random effect meta-analysis of
additive estimates. Individual plots for each meta-analysis are presented in Webfigures 2a-2d.
The p-value of heterogeneity derives from a heterogeneity test between the overall estimates in
Whites and the estimate in PROMIS. Boxes are proportional to the inverse of the variance of
study estimates. The mean difference is in mmol/l. Scales differ between lipids.
nnnnnnnnorororororororororororororororoooororro aaaaaaaaaaaaaaaaaalllllllllllllllllllllllllllelelelelelellelelelleeeeeee e e ee ee e eee ee e ee e frfrfrfrfrfrfrfrfrfrfrfrfrfrfrreqeqeqeqqeqeqeqeqeqeqeqeqeqeqeqeqeqqeqqe ueueueueueueueueueueuueuueueueueueueueuueue
URICCCCCCCCCCCCCCCCCCCCCC ((((((((((((((((((((( )))))))))))))))))))) LLLLLLLLLLLLLLLLLLLLLLLDDDDDDDDDDDDDDDDDDDDDD lIS (blue) and Luric (red) (b) LD plot (D ) LURIC (c) LD plo
d o
a o
a
h i ll l i i li id l l PROM
IS (blue) ))) and Luric (red) (b) LD plot (D ) LURIC (c) LD plo
drarararawn usisss ngngngng 1111595959595 555 PRPRPRPROMOMOMOMISSSS cc connttrolololol aaa andndndnd 1 1 1171717175 555 LULULULURIRIRIRIC CC C cocococontntntntro
ananananalylylylyseeseses s s s foooor r r r CECECECELSSSSR2R2R2R g g g genenenene eee innnn PPPPROROROROMIMIMIM S SSS anananand d d d LULULULURIRIRRIC C C C wewewewereeee n nno
as only few www SNSNSNSNPsPsPsPs i i iinn nn ththththisisisis g g ggenenenene.e.e.e
h i ll l i i li id l l PROM
at INSERM - DISC on July 18, 2010 circgenetics.ahajournals.orgDownloaded from
C1C
2
(a) PROMIS compared to HAPMAP3 (b) PCA of PROMIS ethnicities alone
C2
C1
at INSERM - DISC on July 18, 2010 circgenetics.ahajournals.orgDownloaded from

= 1.02 = 1.03= 1.02
Pakistani Participants (PROMIS)
HDL
German Participants (LURIC)
LDL TG
HDL LDL TG
= 1.04 = 1.03= 1.01= ==== 111.11 0101010101
at INSERM - DISC on July 18, 2010 circgenetics.ahajournals.orgDownloaded from

16
16
16
16
16
16
16
16
16
16
16
16
16
16
16
16
rs7499892
rs1532624
CETP
rs1532625CETP
CETP
CETP
rs3764261
rs5880
rs1800775
rs11508026
CETP
rs12720922
CETP
CETP
rs12708967
CETP
CETP
CETP
CETP
CETP
rs11076175
rs11076176
rs711752
rs1864163
rs17231506
CETP
rs708272
rs9939224
CETP
CETP
CETP
A
T
T
A
G
T
A
T
G
G
C
T
A
A
A
A
3023
3023
2451
29962428
2451
2450
3023
3024
3024
3021
2448
3024
2451
2451
3021
2452
2451
2452
2450
2452
3022
3021
3023
3024
3023
2452
3023
3021
2451
2451
2443
-0.04 (-0.06, -0.03)
0.04 (0.03, 0.06)
-0.07 (-0.10, -0.04)
0.05 (0.03, 0.06)0.06 (0.04, 0.07)
-0.06 (-0.08, -0.05)
-0.06 (-0.08, -0.04)
0.05 (0.04, 0.06)
-0.06 (-0.09, -0.04)
-0.05 (-0.06, -0.03)
0.05 (0.03, 0.06)
0.06 (0.04, 0.07)
-0.04 (-0.06, -0.03)
0.06 (0.04, 0.07)
-0.06 (-0.08, -0.04)
-0.04 (-0.05, -0.02)
0.06 (0.04, 0.07)
-0.06 (-0.08, -0.04)
-0.04 (-0.05, -0.02)
0.06 (0.04, 0.07)
-0.06 (-0.08, -0.04)
-0.04 (-0.06, -0.03)
-0.04 (-0.05, -0.02)
0.05 (0.04, 0.06)
-0.04 (-0.06, -0.03)
0.05 (0.04, 0.06)
-0.06 (-0.08, -0.04)
0.05 (0.04, 0.06)
-0.04 (-0.05, -0.02)
0.06 (0.04, 0.07)
0.06 (0.04, 0.07)
-0.06 (-0.08, -0.05)
.22
.48
.05
.48
.43
.53
.18
.33
.08
.4
.46
.43
.2
.42
.18
.22
.42
.18
.2
.42
.18
.19
.21
.47
.22
.33
.21
.47
.22
.32
.32
.27
3.8e-08
4.1e-12
5.2e-05
2.3e-128.3e-15
3.7e-17
9.7e-11
1.2e-12
7.9e-08
3.0e-12
1.5e-12
8.7e-15
1.3e-07
5.0e-15
1.0e-09
3.8e-07
3.4e-15
1.3e-10
1.2e-04
4.8e-15
8.5e-11
5.0e-08
6.7e-07
4.7e-14
1.6e-08
5.5e-13
1.5e-11
4.8e-14
2.7e-07
7.5e-14
1.1e-13
2.4e-13
-0.04 (-0.06, -0.03)
0.04 (0.03, 0.06)
-0.07 (-0.10, -0.04)
0.05 (0.03, 0.06)0.06 (0.04, 0.07)
-0.06 (-0.08, -0.05)
-0.06 (-0.08, -0.04)
0.05 (0.04, 0.06)
-0.06 (-0.09, -0.04)
-0.05 (-0.06, -0.03)
0.05 (0.03, 0.06)
0.06 (0.04, 0.07)
-0.04 (-0.06, -0.03)
0.06 (0.04, 0.07)
-0.06 (-0.08, -0.04)
-0.04 (-0.05, -0.02)
0.06 (0.04, 0.07)
-0.06 (-0.08, -0.04)
-0.04 (-0.05, -0.02)
0.06 (0.04, 0.07)
-0.06 (-0.08, -0.04)
-0.04 (-0.06, -0.03)
-0.04 (-0.05, -0.02)
0.05 (0.04, 0.06)
-0.04 (-0.06, -0.03)
0.05 (0.04, 0.06)
-0.06 (-0.08, -0.04)
0.05 (0.04, 0.06)
-0.04 (-0.05, -0.02)
0.06 (0.04, 0.07)
0.06 (0.04, 0.07)
-0.06 (-0.08, -0.05)
.22
.48
.05
.48
.43
.53
.18
.33
.08
.40
.46
.43
.20
.42
.18
.22
.42
.18
.20
.42
.18
.19
.21
.47
.22
.33
.21
.47
.22
.32
.32
.27
0-.1 -.05 0 .05 .1
Minor allele
Number of participants P-value
for associationMean difference(95% CI)
MAFSNPGene
Chr
PROMIS
LURIC
mmol/l
P-value for difference between
studies
0.48
0.69
0.25
0.76
0.55
0.63
0.63
0.16
0.11
0.26
0.36
0.11
0.04
0.45
0.25
1
))))))) .222222227...
)))
6, -0.000000000000000000003)3)3)3)33)3)3))3)3)3)3)3)3)3)33)3)6, -0.0000000000000003)3)3)3)333)3))3)3)33)33)33)))8, -0.000000000000000000005)5)5))5)5)5))5)5)5)55)5)5)5)5)5)5)5)5))55)558, -0.000000000000005)55))55)5))5)55)5)5)5)5)5))5)5))55)58 0 05)0 0 )
))) .2222.222222222222222222222222222.22222222222222222.27.27.277..27227272727.27772.27.27.27.27.27.27.27.272.27.27.27.27.2727.27.27.27.27277272.2727.272.272.27.272.272727.27272.2727722
-0 04 (-0 05 -0 02)-0 04 (-0 05 -0 02) 2222
0 00 ( )
-0. ( )-0. ((( )
- ( - )
.46.
.2
.18
.4242
22
0.00 00.00.00 05 (5 (5 (5 (5 (0.00.0000 03, 3, 3, 3, 3, 0.0000 6)6)6)6)6)0.00 00.00.00 05 (5 ((5 (5 (0.00.0000 03,3,3,3,3, 0.0000 6)6)6)6)6)( )( )
((( 3)-0.0.0.00.04 04 0404 04 (-0(((( .060606, --, -, --0.03)-0.040000 (-0.0666, -, -, --0.03)( 4)-0.0.0.0.06 0606 06 06 (-0(-0(-0((-0.08.08.08.08.08, -, -, -, -, 0.00.00.00.00.04)4444-0.0.0.0.0606060606 (-0(-0(-0(( 0.0808080808, -, -, -, 0.00.00.00.00.04)4444
( 7)0.00.00.00.00.066 (66 0.00. 4, 0.00.000077)770.00.00.00.00 66 (6 0.00. 4, 0.00.00077)770 000 066 (0 00 4 0 00 0077)000 066 (0 00 4 00 077)( )( )( )( )
00-0 040404 ( 0( 0(-0 050505 -0 00 00 02)2)2)00-0 040404 ( 0( 0(-0 050505 -0 00 00 02)2)2)
.46.46.46.4646.46.46.46.46.46.46.4646.4646
.20.2.2
.18.18.18
.42.42222.42.4242422.42.42222
222222222222
at INSERM - DISC on July 18, 2010 circgenetics.ahajournals.orgDownloaded from

2
11
2
2
11
11
11
11
rs1260326
rs662799
APOA5
GCKR
GCKR
rs780094
rs780093
rs2266788APOA5
APOA5
rs2075290
APOA5rs651821
rs2072560
GCKR
ZNF259/APOA5
T
C
T
T
G
G
C
A
5500
3195
2450
2451
2445
3185
3194
31952452
2452
3189
24523195
3195
2449
2452
0.08 (0.06, 0.10)
0.14 (0.11, 0.18)
0.08 (0.03, 0.13)
0.08 (0.05, 0.10)
0.08 (0.05, 0.11)
0.07 (0.04, 0.11)
0.07 (0.04, 0.11)
0.13 (0.10, 0.16)0.07 (0.02, 0.12)
0.08 (0.03, 0.13)
0.13 (0.10, 0.17)
0.08 (0.03, 0.13)0.14 (0.11, 0.18)
0.14 (0.11, 0.18)
0.08 (0.05, 0.11)
0.08 (0.03, 0.13)
.26
.17
.07
.44
.44
.26
.26
.2
.07
.07
.19
.07
.17
.16
.44
.07
1.1e-10
1.2e-14
3.3e-03
7.2e-09
3.4e-09
2.6e-06
2.3e-06
6.9e-143.8e-03
2.2e-03
8.8e-14
1.5e-031.5e-14
2.1e-14
3.9e-09
2.2e-03
0.08 (0.06, 0.10)
0.14 (0.11, 0.18)
0.08 (0.03, 0.13)
0.08 (0.05, 0.10)
0.08 (0.05, 0.11)
0.07 (0.04, 0.11)
0.07 (0.04, 0.11)
0.13 (0.10, 0.16)0.07 (0.02, 0.12)
0.08 (0.03, 0.13)
0.13 (0.10, 0.17)
0.08 (0.03, 0.13)0.14 (0.11, 0.18)
0.14 (0.11, 0.18)
0.08 (0.05, 0.11)
0.08 (0.03, 0.13)
.26
.17
.07
.44
.44
.26
.26
.20
.07
.07
.19
.07
.17
.16
.44
.07
0-.05 .05 .1 .15 .2
Minor allele
Number of participants P-value
for associationMean difference(95% CI)
MAFSNPGene
Chr
PROMIS
LURIC
log mmol/l
0.07
0.69
0.11
0.15
0.17
0.86
0.64
0.19
P-value for difference
between studies
)))))))
07..
161616161616616
0.12)2, ,,,,, 0.12)222,,,,,, 0.12)22
)))0 118)8)8)8)8)8)8)8)8)8)8)))8)8)88)))0 118)88)8)8)8))8)8)8)8888))
.07...07......07....
616161616161616161616166161666166616.)( , )( , ) 6.16.16
0 10 10.1444 (4 0 10 10 11111 0 10 10 10 8)8)8
0.0 ( 0.13)
0.0008 ((((00 000 3 0 13)3)3)3)0.1 (( )
1.17
.07
.07
.17
.
(( )8))0 10 10.100 4 (4 (4 (44 0.10 10 10 10 11, 1111 0.10 10 100 8)8)8)80 10 10.100 444 (4 0.10 10 10 10 11,111 0.10 10 100 8)8)8)8
0.0 (( 0.13)0.08 (((((0.000.00 00 033, 333 0.13)0.08 (((((0.00033,33 0.13)
( 3)0.00.00.00.00. 8 ((((00.000 3, 33 0.1000 3)3)3)3)0.000.0.00 8 (((0.03,33 0.10 3)3)3)( 8)0.10.100.10.14 (4 (4 (4 4 0.0.10.0.0. 1, 1,1,1,1, 0.10.10.1.1.18)80.10.1000 4 (0.0.1.. ,,1,,, 0.10.10.1.1.18)
( , )( , )( , )
.171.1711.171
.07.07.07
.07.07.07
.171717.171717717.171771
.16.16.16
at INSERM - DISC on July 18, 2010 circgenetics.ahajournals.orgDownloaded from

(a)
(b)
(c)
at INSERM - DISC on July 18, 2010 circgenetics.ahajournals.orgDownloaded from
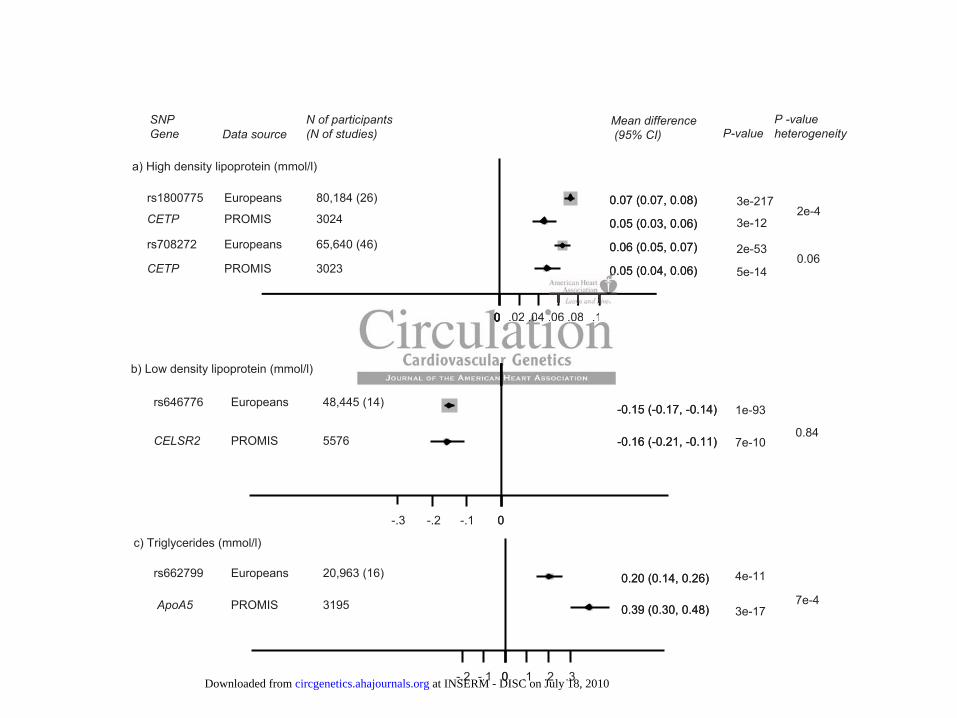
0.07 (0.07, 0.08)
0.05 (0.03, 0.06)
0.06 (0.05, 0.07)
0.05 (0.04, 0.06)
0.07 (0.07, 0.08)
0.05 (0.03, 0.06)
0.06 (0.05, 0.07)
0.05 (0.04, 0.06)
00 .02 .04 .06 .08 .1
-0.15 (-0.17, -0.14)
-0.16 (-0.21, -0.11)
-0.15 (-0.17, -0.14)
-0.16 (-0.21, -0.11)
0-.3 -.2 -.1 0
0.20 (0.14, 0.26)
0.39 (0.30, 0.48)
0.20 (0.14, 0.26)
0.39 (0.30, 0.48)
0-.2 -.1 0 .1 .2 .3
a) High density lipoprotein (mmol/l)
rs646776
CELSR2
rs1800775
CETP
rs708272
CETP
rs662799
ApoA5
Europeans
PROMIS
Europeans
PROMIS
Europeans
PROMIS
Europeans
PROMIS
48,445 (14)
5576
80,184 (26)
3024
65,640 (46)
3023
20,963 (16)
3195
SNPGene
N of participants (N of studies)Data source
c) Triglycerides (mmol/l)
b) Low density lipoprotein (mmol/l)
4e-11
3e-17
1e-93
7e-10
P-valueMean difference(95% CI)
3e-12
5e-14
2e-53
3e-217
7e-4
0.84
P -valueheterogeneity
0.06
2e-4
0000000000000000
000000 .02 .0.0.0.0.04 .06 .08 .1
at INSERM - DISC on July 18, 2010 circgenetics.ahajournals.orgDownloaded from

1
"SUPPLEMENTAL MATERIAL."
at INSERM - DISC on July 18, 2010 circgenetics.ahajournals.orgDownloaded from

2
Supplemental Figure 1: Scatter plot of additional principal components and self reported ethnicities in PROMIS control participants
at INSE
RM
- DISC
on July 18, 2010 circgenetics.ahajournals.org
Dow
nloaded from

3
PROMIS LURIC P‐value for difference between studies
Chr snp bp gene a1 N maf beta se p N maf beta se p
Association with HDL‐C levels (mmol/l)
16 rs711752 55553712 CETP T 3023 0.47 0.048 0.006 4.67E‐14 2451 0.42 0.058 0.007 5.05E‐15 0.45
16 rs708272 55553789 CETP A 3023 0.47 0.048 0.006 4.77E‐14 2450 0.42 0.058 0.007 4.77E‐15 0.76
16 rs17231506 55552029 CETP A 3023 0.33 0.049 0.007 5.54E‐13 2451 0.32 0.059 0.008 7.50E‐14 1
16 rs3764261 55550825 CETP A 3023 0.33 0.049 0.007 1.17E‐12 2451 0.32 0.058 0.008 1.08E‐13 0.63
16 rs11508026 55556829 CETP A 3021 0.46 0.046 0.006 1.47E‐12 2452 0.42 0.058 0.007 3.40E‐15 0.55
16 rs1532625 55562802 CETP T 2996 0.48 0.045 0.006 2.27E‐12 2428 0.43 0.058 0.007 8.28E‐15 0.63
16 rs1800775 55552737 CETP G 3024 0.40 ‐0.045 0.006 3.00E‐12 2451 0.53 ‐0.062 0.007 3.69E‐17 0.11
16 rs1532624 55562980 CETP T 3023 0.48 0.044 0.006 4.06E‐12 2448 0.43 0.057 0.007 8.69E‐15 0.25
16 rs1864163 55554734 CETP A 3024 0.22 ‐0.043 0.008 1.56E‐08 2443 0.27 ‐0.063 0.009 2.40E‐13 0.16
16 rs7499892 55564091 CETP A 3023 0.22 ‐0.042 0.008 3.82E‐08 2452 0.18 ‐0.063 0.010 8.52E‐11 0.11
16 rs11076175 55563879 CETP G 3022 0.19 ‐0.044 0.008 5.04E‐08 2451 0.18 ‐0.063 0.010 1.27E‐10 0.36
16 rs5880 55572592 CETP G 3024 0.08 ‐0.064 0.012 7.86E‐08 2451 0.05 ‐0.068 0.017 5.25E‐05 0.69
16 rs12720922 55558386 CETP T 3024 0.20 ‐0.042 0.008 1.29E‐07 2451 0.18 ‐0.060 0.010 1.02E‐09 0.48
16 rs9939224 55560233 CETP A 3021 0.22 ‐0.039 0.008 2.74E‐07 2452 0.21 ‐0.062 0.009 1.49E‐11 0.25
16 rs12708967 55550712 CETP G 3021 0.22 ‐0.039 0.008 3.85E‐07 2452 0.20 ‐0.036 0.009 1.16E‐04 0.26
16 rs11076176 55564947 CETP C 3021 0.21 ‐0.038 0.008 6.71E‐07 2450 0.18 ‐0.063 0.010 9.67E‐11 0.04
Association with LDL‐C levels (mmol/l)
1 rs646776++ 109620053 CELSR2 G 5576 0.25 ‐0.158 0.025 7.19E‐10 1175 0.239 ‐0.014 0.040 0.7224 0.05
Association with log‐triglyceride levels (mmol/l)
11 rs662799 116168917 APOA5 C 3195 0.17 0.142 0.018 1.25E‐14 2452 0.07 0.080 0.026 2.22E‐03 0.07
11 rs651821 116167789 APOA5 C 3195 0.17 0.142 0.018 1.47E‐14 2452 0.07 0.083 0.026 1.49E‐03 0.15
11 rs2072560 116167036 APOA5 A 3195 0.16 0.142 0.019 2.13E‐14 2450 0.07 0.077 0.026 3.34E‐03 0.11
11 rs2266788 116165896 APOA5 G 3195 0.20 0.129 0.017 6.94E‐14 2452 0.07 0.073 0.025 3.83E‐03 0.17
11 rs2075290 116158506 ZNF259/APOA5 G 3189 0.19 0.132 0.018 8.77E‐14 2452 0.07 0.077 0.025 2.15E‐03 0.19
2 rs1260326++ 27584444 GCKR T 5500 0.26 0.078 0.012 1.09E‐10 2451 0.44 0.078 0.014 7.19E‐09 0.86
2 rs780093 27596107 GCKR T 3194 0.26 0.075 0.016 2.35E‐06 2445 0.44 0.080 0.014 3.41E‐09 0.64
2 rs780094 27594741 GCKR T 3185 0.26 0.074 0.016 2.63E‐06 2449 0.44 0.080 0.014 3.86E‐09 0.69
Supplemental Table 1: Association of major lipid traits in PROMIS and comparison with the LURIC participants of SNPs significantly associated in PROMIS (P < 10-6)
++Genotyping was done in further 2555 PROMIS individuals for variants associated with lipid traits at a P < 10-5
Chr: chromosome, a1: minor allele, N: number of individuals, maf: minor allele frequency, beta: per-minor allele increase in lipid levels, adjusted for age, sex, the first two principal components and case-control status. For LDL, the LURIC dataset was restricted to participants not on lipid lowering drugs. The P-value for difference between studies corresponds to a test of nullity of interaction term between study and the SNP of interest.
at INSE
RM
- DISC
on July 18, 2010 circgenetics.ahajournals.org
Dow
nloaded from

4
rs1107617516
rs1107617616
rs1150802616
rs1270896716
rs1272092216
rs153262416
rs153262516
rs1723150616
rs180077516
rs186416316
rs376426116
rs588016
rs70827216
rs71175216
rs749989216
rs993922416
SNP_id/Chr.
Status
-0.05 (-0.07, -0.02)-0.08 (-0.11, -0.05)
-0.04 (-0.06, -0.01)-0.06 (-0.08, -0.03)
0.05 (0.03, 0.07)0.06 (0.04, 0.09)
-0.06 (-0.08, -0.03)-0.06 (-0.09, -0.03)
-0.05 (-0.07, -0.02)-0.08 (-0.11, -0.05)
0.05 (0.03, 0.07)0.06 (0.04, 0.09)
0.05 (0.03, 0.08)0.07 (0.04, 0.09)
0.06 (0.04, 0.09)0.07 (0.05, 0.10)
-0.04 (-0.06, -0.02)-0.07 (-0.10, -0.05)
-0.05 (-0.07, -0.02)-0.07 (-0.10, -0.04)
0.06 (0.04, 0.09)0.07 (0.05, 0.10)
-0.08 (-0.12, -0.04)-0.07 (-0.11, -0.02)
0.05 (0.03, 0.08)0.07 (0.05, 0.09)
0.06 (0.03, 0.08)0.07 (0.05, 0.09)
-0.05 (-0.07, -0.02)-0.07 (-0.10, -0.04)
-0.04 (-0.07, -0.02)-0.07 (-0.10, -0.05)
Mean difference (95% CI)
.128
.288
.554
.869
.118
.491
.502
.609
.049
.196
.57
.609
.327
.362
.327
.119
P-value het.
-0.05 (-0.07, -0.02)-0.08 (-0.11, -0.05)
-0.04 (-0.06, -0.01)-0.06 (-0.08, -0.03)
0.05 (0.03, 0.07)0.06 (0.04, 0.09)
-0.06 (-0.08, -0.03)-0.06 (-0.09, -0.03)
-0.05 (-0.07, -0.02)-0.08 (-0.11, -0.05)
0.05 (0.03, 0.07)0.06 (0.04, 0.09)
0.05 (0.03, 0.08)0.07 (0.04, 0.09)
0.06 (0.04, 0.09)0.07 (0.05, 0.10)
-0.04 (-0.06, -0.02)-0.07 (-0.10, -0.05)
-0.05 (-0.07, -0.02)-0.07 (-0.10, -0.04)
0.06 (0.04, 0.09)0.07 (0.05, 0.10)
-0.08 (-0.12, -0.04)-0.07 (-0.11, -0.02)
0.05 (0.03, 0.08)0.07 (0.05, 0.09)
0.06 (0.03, 0.08)0.07 (0.05, 0.09)
-0.05 (-0.07, -0.02)-0.07 (-0.10, -0.04)
-0.04 (-0.07, -0.02)-0.07 (-0.10, -0.05)
.128
.288
.554
.869
.118
.491
.502
.609
.049
.196
.570
.609
.327
.362
.327
.119
0-.1 -.05 0 .05 .1
casecontrol
casecontrol
casecontrol
casecontrol
casecontrol
casecontrol
casecontrol
casecontrol
casecontrol
casecontrol
casecontrol
casecontrol
casecontrol
casecontrol
casecontrol
casecontrol
mmol/l
Supplemental Figure 2(a): Association with HDL-C in PROMIS cases and controls for SNPs significantly associated with HDL-C levels in all PROMIS participants (P < 10-6)
at INSERM - DISC on July 18, 2010 circgenetics.ahajournals.orgDownloaded from
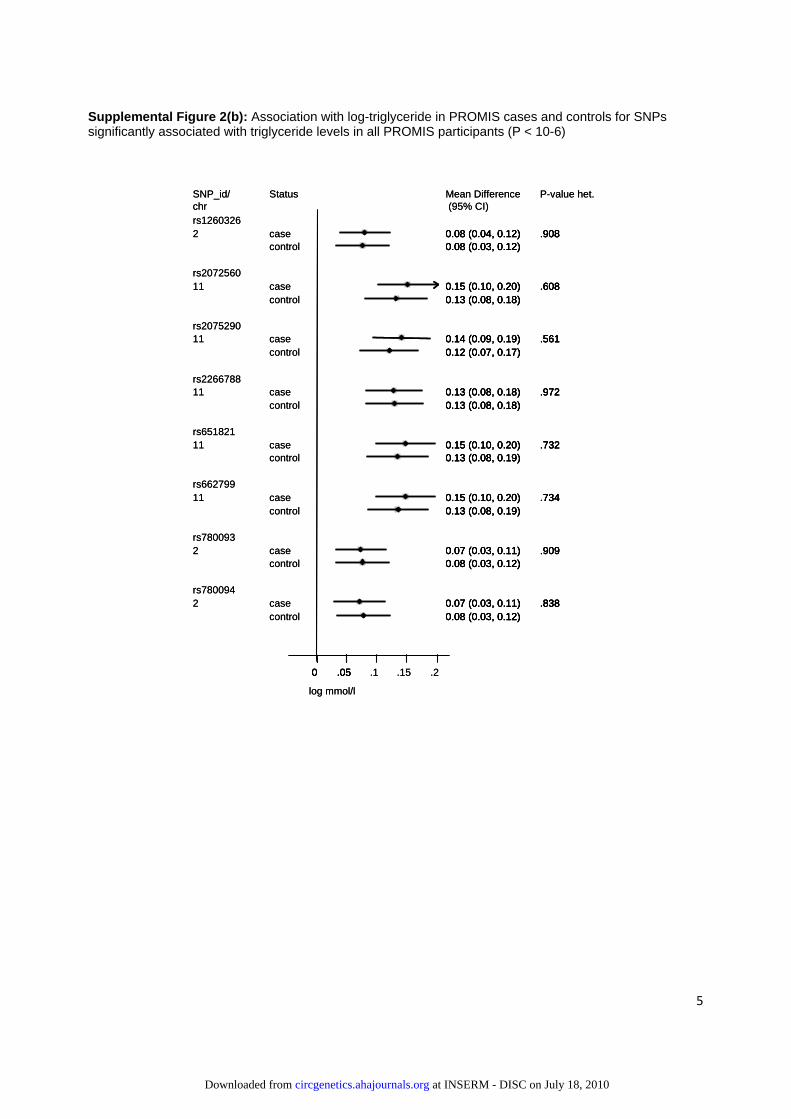
5
Supplemental Figure 2(b): Association with log-triglyceride in PROMIS cases and controls for SNPs significantly associated with triglyceride levels in all PROMIS participants (P < 10-6)
rs12603262
rs207256011
rs207529011
rs226678811
rs65182111
rs66279911
rs7800932
rs7800942
SNP_id/chr
casecontrol
casecontrol
casecontrol
casecontrol
casecontrol
casecontrol
casecontrol
casecontrol
Status
0.08 (0.04, 0.12)0.08 (0.03, 0.12)
0.15 (0.10, 0.20)0.13 (0.08, 0.18)
0.14 (0.09, 0.19)0.12 (0.07, 0.17)
0.13 (0.08, 0.18)0.13 (0.08, 0.18)
0.15 (0.10, 0.20)0.13 (0.08, 0.19)
0.15 (0.10, 0.20)0.13 (0.08, 0.19)
0.07 (0.03, 0.11)0.08 (0.03, 0.12)
0.07 (0.03, 0.11)0.08 (0.03, 0.12)
Mean Difference(95% CI)
.908
.608
.561
.972
.732
.734
.909
.838
P-value het.
0.08 (0.04, 0.12)0.08 (0.03, 0.12)
0.15 (0.10, 0.20)0.13 (0.08, 0.18)
0.14 (0.09, 0.19)0.12 (0.07, 0.17)
0.13 (0.08, 0.18)0.13 (0.08, 0.18)
0.15 (0.10, 0.20)0.13 (0.08, 0.19)
0.15 (0.10, 0.20)0.13 (0.08, 0.19)
0.07 (0.03, 0.11)0.08 (0.03, 0.12)
0.07 (0.03, 0.11)0.08 (0.03, 0.12)
.908
.608
.561
.972
.732
.734
.909
.838
0 .050 .05 .1 .15 .2
log mmol/l
at INSERM - DISC on July 18, 2010 circgenetics.ahajournals.orgDownloaded from

6
Supplemental Figure 2(c): Association with LDL-C in PROMIS cases and controls for SNPs significantly associated with LDL-C levels in all PROMIS participants
Supplemental Figures 2 (a-c): Estimates represent the per-minor allele increase in lipid levels, adjusted for age, sex, the first two principal components. P_value het. Is the P-value for heterogeneity for effect estimates obtained in cases and controls. Chr: chromosome.
rs6467761
chr
case
control
Status
-0.05 (-0.09, -0.02)
-0.07 (-0.11, -0.03)
Mean Difference(95% CI)
.584
P_value het.
-0.05 (-0.09, -0.02)
-0.07 (-0.11, -0.03)
.584
0-.1 -.05 0 .05
SNP_id/
rs6467761
chr
case
control
Status
-0.05 (-0.09, -0.02)
-0.07 (-0.11, -0.03)
Mean Difference(95% CI)
.584
P_value het.
-0.05 (-0.09, -0.02)
-0.07 (-0.11, -0.03)
.584
0-.1 -.05 0 .05
SNP_id/
mmol/l
at INSERM - DISC on July 18, 2010 circgenetics.ahajournals.orgDownloaded from

7
Supplemental Figure 3(a): Meta-analysis of previously published studies in Europeans for the association of rs1800775 (C-629A) variant, located in the CETP gene, with HDL-C levels Suppl1-20
% Weight
NOTE: Weights are from random effects analysis
Overall random effect I-squared = 10% (95% CI 0% - 43%), p = 0.318)
Blankenberg S (AtheroGene)
Thompson JF
Ridker (WGHS)
Eiriksdottir Reykjavik)
Thompson JF
Overall fixed effect
Dullaart (PREVEND)
Schouw (PROSPECT/EPIC)
Bernstein MS
Sabatti (NFBC1966)
Kathiresan (NORDIL)
Girelli (Verona Heart Project)
Kathiresan (FIINRISK97)
Kathiresan (MDC-CC)
Kakko (OPERA)
Tobin MD
Aulchenko (ENGAGE consortium)
Bauerfeind
Freeman DJ (WOSCOPS)
Kathiresan (DGI)
Horne (IHCS)
Dachet C (ECTIM)
Author (Name of Study)
Heidema (CDRFMP)
Chasman (WGHS)
Barzilai N (Longevity)
McCaskie (CUDAS/BPHS/CUPID)
Rotterdam study
2004
2007
2009
2001
2003
2007
2003
2009
2008
2008
2008
2001
2004
2009
2002
2003
2008
2007
1999
Year
2007
2008
2003
2007
2007
574
2087
18000
745
93
8141
1519
1720
4531
5095
1187
7940
5519
481
182
5840
185
1107
2758
1309
668
Number ofparticipants
1071
6195
743
1059
1435
0.07 (0.07, 0.08)
0.08 (0.03, 0.13)
0.05 (0.03, 0.07)
0.08 (0.07, 0.09)
0.08 (0.05, 0.11)
0.08 (-0.00, 0.15)
0.07 (0.07, 0.08)
0.06 (0.05, 0.08)
0.08 (0.05, 0.11)
0.05 (0.02, 0.09)
0.07 (0.05, 0.09)
0.08 (0.05, 0.10)
0.07 (0.04, 0.10)
0.06 (0.05, 0.08)
0.08 (0.07, 0.09)
0.05 (0.01, 0.09)
0.06 (-0.01, 0.13)
0.06 (0.05, 0.08)
0.07 (-0.01, 0.15)
0.06 (0.04, 0.08)
0.07 (0.05, 0.09)
0.05 (-0.00, 0.11)
0.08 (0.04, 0.12)
ES (95% CI)
0.07 (0.04, 0.10)
0.09 (0.08, 0.10)
0.07 (0.03, 0.11)
0.07 (0.04, 0.11)
0.08 (0.06, 0.11)
100.00
0.84
5.44
14.06
2.38
0.32
9.87
2.32
1.50
3.79
3.88
2.24
7.79
7.79
1.17
0.38
9.33
0.32
4.20
4.43
0.59
1.11
(D+L)
2.14
8.28
1.17
1.73
2.94
0.07 (0.07, 0.08)
0.08 (0.03, 0.13)
0.05 (0.03, 0.07)
0.08 (0.07, 0.09)
0.08 (0.05, 0.11)
0.08 (-0.00, 0.15)
0.07 (0.07, 0.08)
0.06 (0.05, 0.08)
0.08 (0.05, 0.11)
0.05 (0.02, 0.09)
0.07 (0.05, 0.09)
0.08 (0.05, 0.10)
0.07 (0.04, 0.10)
0.06 (0.05, 0.08)
0.08 (0.07, 0.09)
0.05 (0.01, 0.09)
0.06 (-0.01, 0.13)
0.06 (0.05, 0.08)
0.07 (-0.01, 0.15)
0.06 (0.04, 0.08)
0.07 (0.05, 0.09)
0.05 (-0.00, 0.11)
0.08 (0.04, 0.12)
ES (95% CI)
0.07 (0.04, 0.10)
0.09 (0.08, 0.10)
0.07 (0.03, 0.11)
0.07 (0.04, 0.11)
0.08 (0.06, 0.11)
100.00
0.84
5.44
14.06
2.38
0.32
9.87
2.32
1.50
3.79
3.88
2.24
7.79
7.79
1.17
0.38
9.33
0.32
4.20
4.43
0.59
1.11
(D+L)
2.14
8.28
1.17
1.73
2.94
0-.153 0 .153
Effect Size
at INSERM - DISC on July 18, 2010 circgenetics.ahajournals.orgDownloaded from
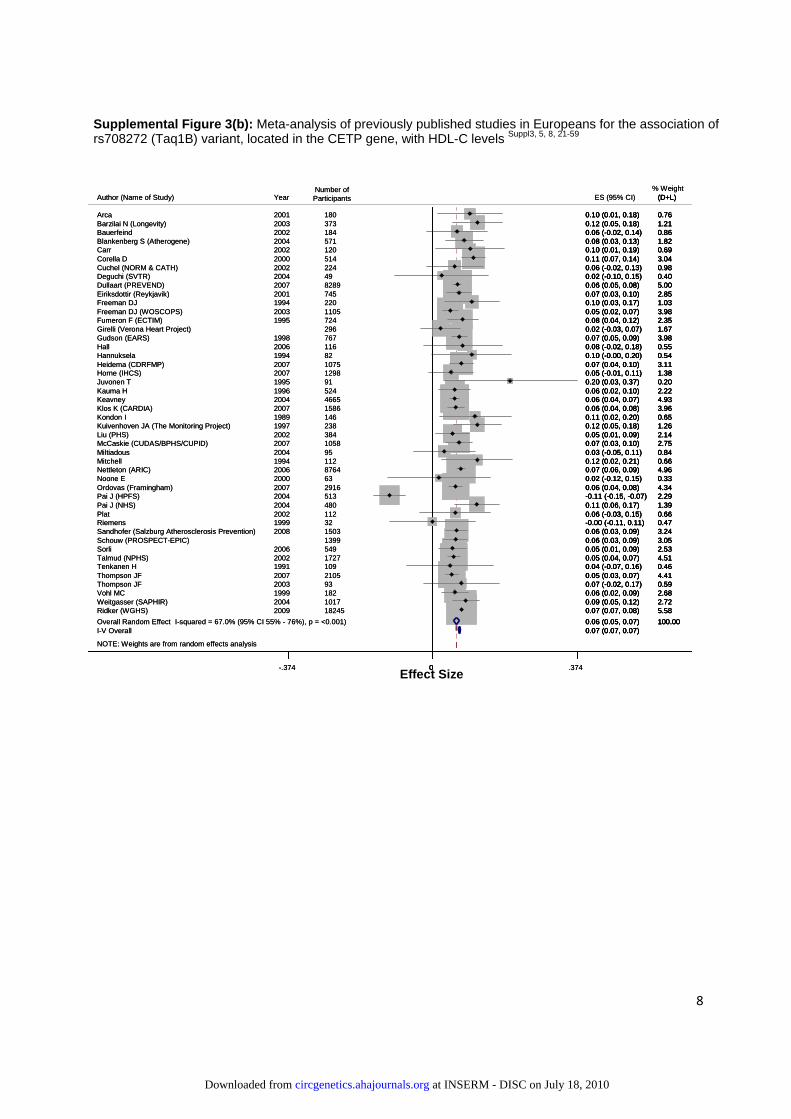
8
Supplemental Figure 3(b): Meta-analysis of previously published studies in Europeans for the association of rs708272 (Taq1B) variant, located in the CETP gene, with HDL-C levels Suppl3, 5, 8, 21-59
% Weight
NOTE: Weights are from random effects analysis
Overall Random Effect I-squared = 67.0% (95% CI 55% - 76%), p = <0.001)
Mitchell
Pai J (NHS)
Gudson (EARS)
Corella D
Eiriksdottir (Reykjavik)
Klos K (CARDIA)
Girelli (Verona Heart Project)
Noone EOrdovas (Framingham)
Schouw (PROSPECT-EPIC)Sorli
Hall
Cuchel (NORM & CATH)
Horne (IHCS)
Miltiadous
Ridker (WGHS)
I-V Overall
Plat
Vohl MC
Barzilai N (Longevity)
Dullaart (PREVEND)
Liu (PHS)Kuivenhoven JA (The Monitoring Project)
Riemens
Talmud (NPHS)
Deguchi (SVTR)
Freeman DJ
Kondon I
Tenkanen H
Heidema (CDRFMP)
Juvonen T
Thompson JF
Blankenberg S (Atherogene)
Thompson JF
Hannuksela
Freeman DJ (WOSCOPS)
Kauma H
Pai J (HPFS)
Nettleton (ARIC)
Keavney
Carr
McCaskie (CUDAS/BPHS/CUPID)
Fumeron F (ECTIM)
Bauerfeind
Author (Name of Study)
Sandhofer (Salzburg Atherosclerosis Prevention)
Arca
Weitgasser (SAPHIR)
1994
2004
1998
2000
2001
2007
20002007
2006
2006
2002
2007
2004
2009
2002
1999
2003
2007
20021997
1999
2002
2004
1994
1989
1991
2007
1995
2007
2004
2003
1994
2003
1996
2004
2006
2004
2002
2007
1995
2002
Year
2008
2001
2004
112
480
767
514
745
1586
296
632916
1399549
116
224
1298
95
18245
112
182
373
8289
384238
32
1727
49
220
146
109
1075
91
2105
571
93
82
1105
524
513
8764
4665
120
1058
724
184
Number ofParticipants
1503
180
1017
0.06 (0.05, 0.07)
0.12 (0.02, 0.21)
0.11 (0.06, 0.17)
0.07 (0.05, 0.09)
0.11 (0.07, 0.14)
0.07 (0.03, 0.10)
0.06 (0.04, 0.08)
0.02 (-0.03, 0.07)
0.02 (-0.12, 0.15)0.06 (0.04, 0.08)
0.06 (0.03, 0.09)0.05 (0.01, 0.09)
0.08 (-0.02, 0.18)
0.06 (-0.02, 0.13)
0.05 (-0.01, 0.11)
0.03 (-0.05, 0.11)
0.07 (0.07, 0.08)
0.07 (0.07, 0.07)
0.06 (-0.03, 0.15)
0.06 (0.02, 0.09)
0.12 (0.05, 0.18)
0.06 (0.05, 0.08)
0.05 (0.01, 0.09)0.12 (0.05, 0.18)
-0.00 (-0.11, 0.11)
0.05 (0.04, 0.07)
0.02 (-0.10, 0.15)
0.10 (0.03, 0.17)
0.11 (0.02, 0.20)
0.04 (-0.07, 0.16)
0.07 (0.04, 0.10)
0.20 (0.03, 0.37)
0.05 (0.03, 0.07)
0.08 (0.03, 0.13)
0.07 (-0.02, 0.17)
0.10 (-0.00, 0.20)
0.05 (0.02, 0.07)
0.06 (0.02, 0.10)
-0.11 (-0.15, -0.07)
0.07 (0.06, 0.09)
0.06 (0.04, 0.07)
0.10 (0.01, 0.19)
0.07 (0.03, 0.10)
0.08 (0.04, 0.12)
0.06 (-0.02, 0.14)
0.06 (0.03, 0.09)
0.10 (0.01, 0.18)
0.09 (0.05, 0.12)
100.00
0.66
1.39
3.98
3.04
2.85
3.96
1.67
0.334.34
3.052.53
0.55
0.98
1.38
0.84
5.58
0.66
2.68
1.21
5.00
2.141.26
0.47
4.51
0.40
1.03
0.65
0.46
3.11
0.20
4.41
1.82
0.59
0.54
3.98
2.22
2.29
4.96
4.93
0.69
2.75
2.35
0.86
(D+L)
3.24
0.76
2.72
0.06 (0.05, 0.07)
0.12 (0.02, 0.21)
0.11 (0.06, 0.17)
0.07 (0.05, 0.09)
0.11 (0.07, 0.14)
0.07 (0.03, 0.10)
0.06 (0.04, 0.08)
0.02 (-0.03, 0.07)
0.02 (-0.12, 0.15)0.06 (0.04, 0.08)
0.06 (0.03, 0.09)0.05 (0.01, 0.09)
0.08 (-0.02, 0.18)
0.06 (-0.02, 0.13)
0.05 (-0.01, 0.11)
0.03 (-0.05, 0.11)
0.07 (0.07, 0.08)
0.07 (0.07, 0.07)
0.06 (-0.03, 0.15)
0.06 (0.02, 0.09)
0.12 (0.05, 0.18)
0.06 (0.05, 0.08)
0.05 (0.01, 0.09)0.12 (0.05, 0.18)
-0.00 (-0.11, 0.11)
0.05 (0.04, 0.07)
0.02 (-0.10, 0.15)
0.10 (0.03, 0.17)
0.11 (0.02, 0.20)
0.04 (-0.07, 0.16)
0.07 (0.04, 0.10)
0.20 (0.03, 0.37)
0.05 (0.03, 0.07)
0.08 (0.03, 0.13)
0.07 (-0.02, 0.17)
0.10 (-0.00, 0.20)
0.05 (0.02, 0.07)
0.06 (0.02, 0.10)
-0.11 (-0.15, -0.07)
0.07 (0.06, 0.09)
0.06 (0.04, 0.07)
0.10 (0.01, 0.19)
0.07 (0.03, 0.10)
0.08 (0.04, 0.12)
0.06 (-0.02, 0.14)
ES (95% CI)
0.06 (0.03, 0.09)
0.10 (0.01, 0.18)
0.09 (0.05, 0.12)
100.00
0.66
1.39
3.98
3.04
2.85
3.96
1.67
0.334.34
3.052.53
0.55
0.98
1.38
0.84
5.58
0.66
2.68
1.21
5.00
2.141.26
0.47
4.51
0.40
1.03
0.65
0.46
3.11
0.20
4.41
1.82
0.59
0.54
3.98
2.22
2.29
4.96
4.93
0.69
2.75
2.35
0.86
(D+L)
3.24
0.76
2.72
0-.374 0 .374
% Weight
NOTE: Weights are from random effects analysis
Overall Random Effect I-squared = 67.0% (95% CI 55% - 76%), p = <0.001)
Mitchell
Pai J (NHS)
Gudson (EARS)
Corella D
Eiriksdottir (Reykjavik)
Klos K (CARDIA)
Girelli (Verona Heart Project)
Noone EOrdovas (Framingham)
Schouw (PROSPECT-EPIC)Sorli
Hall
Cuchel (NORM & CATH)
Horne (IHCS)
Miltiadous
Ridker (WGHS)
I-V Overall
Plat
Vohl MC
Barzilai N (Longevity)
Dullaart (PREVEND)
Liu (PHS)Kuivenhoven JA (The Monitoring Project)
Riemens
Talmud (NPHS)
Deguchi (SVTR)
Freeman DJ
Kondon I
Tenkanen H
Heidema (CDRFMP)
Juvonen T
Thompson JF
Blankenberg S (Atherogene)
Thompson JF
Hannuksela
Freeman DJ (WOSCOPS)
Kauma H
Pai J (HPFS)
Nettleton (ARIC)
Keavney
Carr
McCaskie (CUDAS/BPHS/CUPID)
Fumeron F (ECTIM)
Bauerfeind
Author (Name of Study)
Sandhofer (Salzburg Atherosclerosis Prevention)
Arca
Weitgasser (SAPHIR)
1994
2004
1998
2000
2001
2007
20002007
2006
2006
2002
2007
2004
2009
2002
1999
2003
2007
20021997
1999
2002
2004
1994
1989
1991
2007
1995
2007
2004
2003
1994
2003
1996
2004
2006
2004
2002
2007
1995
2002
Year
2008
2001
2004
112
480
767
514
745
1586
296
632916
1399549
116
224
1298
95
18245
112
182
373
8289
384238
32
1727
49
220
146
109
1075
91
2105
571
93
82
1105
524
513
8764
4665
120
1058
724
184
Number ofParticipants
1503
180
1017
0.06 (0.05, 0.07)
0.12 (0.02, 0.21)
0.11 (0.06, 0.17)
0.07 (0.05, 0.09)
0.11 (0.07, 0.14)
0.07 (0.03, 0.10)
0.06 (0.04, 0.08)
0.02 (-0.03, 0.07)
0.02 (-0.12, 0.15)0.06 (0.04, 0.08)
0.06 (0.03, 0.09)0.05 (0.01, 0.09)
0.08 (-0.02, 0.18)
0.06 (-0.02, 0.13)
0.05 (-0.01, 0.11)
0.03 (-0.05, 0.11)
0.07 (0.07, 0.08)
0.07 (0.07, 0.07)
0.06 (-0.03, 0.15)
0.06 (0.02, 0.09)
0.12 (0.05, 0.18)
0.06 (0.05, 0.08)
0.05 (0.01, 0.09)0.12 (0.05, 0.18)
-0.00 (-0.11, 0.11)
0.05 (0.04, 0.07)
0.02 (-0.10, 0.15)
0.10 (0.03, 0.17)
0.11 (0.02, 0.20)
0.04 (-0.07, 0.16)
0.07 (0.04, 0.10)
0.20 (0.03, 0.37)
0.05 (0.03, 0.07)
0.08 (0.03, 0.13)
0.07 (-0.02, 0.17)
0.10 (-0.00, 0.20)
0.05 (0.02, 0.07)
0.06 (0.02, 0.10)
-0.11 (-0.15, -0.07)
0.07 (0.06, 0.09)
0.06 (0.04, 0.07)
0.10 (0.01, 0.19)
0.07 (0.03, 0.10)
0.08 (0.04, 0.12)
0.06 (-0.02, 0.14)
0.06 (0.03, 0.09)
0.10 (0.01, 0.18)
0.09 (0.05, 0.12)
100.00
0.66
1.39
3.98
3.04
2.85
3.96
1.67
0.334.34
3.052.53
0.55
0.98
1.38
0.84
5.58
0.66
2.68
1.21
5.00
2.141.26
0.47
4.51
0.40
1.03
0.65
0.46
3.11
0.20
4.41
1.82
0.59
0.54
3.98
2.22
2.29
4.96
4.93
0.69
2.75
2.35
0.86
(D+L)
3.24
0.76
2.72
0.06 (0.05, 0.07)
0.12 (0.02, 0.21)
0.11 (0.06, 0.17)
0.07 (0.05, 0.09)
0.11 (0.07, 0.14)
0.07 (0.03, 0.10)
0.06 (0.04, 0.08)
0.02 (-0.03, 0.07)
0.02 (-0.12, 0.15)0.06 (0.04, 0.08)
0.06 (0.03, 0.09)0.05 (0.01, 0.09)
0.08 (-0.02, 0.18)
0.06 (-0.02, 0.13)
0.05 (-0.01, 0.11)
0.03 (-0.05, 0.11)
0.07 (0.07, 0.08)
0.07 (0.07, 0.07)
0.06 (-0.03, 0.15)
0.06 (0.02, 0.09)
0.12 (0.05, 0.18)
0.06 (0.05, 0.08)
0.05 (0.01, 0.09)0.12 (0.05, 0.18)
-0.00 (-0.11, 0.11)
0.05 (0.04, 0.07)
0.02 (-0.10, 0.15)
0.10 (0.03, 0.17)
0.11 (0.02, 0.20)
0.04 (-0.07, 0.16)
0.07 (0.04, 0.10)
0.20 (0.03, 0.37)
0.05 (0.03, 0.07)
0.08 (0.03, 0.13)
0.07 (-0.02, 0.17)
0.10 (-0.00, 0.20)
0.05 (0.02, 0.07)
0.06 (0.02, 0.10)
-0.11 (-0.15, -0.07)
0.07 (0.06, 0.09)
0.06 (0.04, 0.07)
0.10 (0.01, 0.19)
0.07 (0.03, 0.10)
0.08 (0.04, 0.12)
0.06 (-0.02, 0.14)
ES (95% CI)
0.06 (0.03, 0.09)
0.10 (0.01, 0.18)
0.09 (0.05, 0.12)
100.00
0.66
1.39
3.98
3.04
2.85
3.96
1.67
0.334.34
3.052.53
0.55
0.98
1.38
0.84
5.58
0.66
2.68
1.21
5.00
2.141.26
0.47
4.51
0.40
1.03
0.65
0.46
3.11
0.20
4.41
1.82
0.59
0.54
3.98
2.22
2.29
4.96
4.93
0.69
2.75
2.35
0.86
(D+L)
3.24
0.76
2.72
0-.374 0 .374Effect Size
at INSERM - DISC on July 18, 2010 circgenetics.ahajournals.orgDownloaded from

9
Supplemental Figure 3(c): Meta-analysis of previously published studies in Europeans for the association of rs646776 variant, located in the CELSR2 gene, with LDL-C levels Suppl 60-64
NOTE: Weights are from random effects analysis
12685
1461
3293
781
4507
587
1686
993
2891
2014
5519
1330
2758
7940
-0.15 (-0.17, -0.14)
-0.14 (-0.17, -0.11)
-0.08 (-0.16, -0.00)
-0.18 (-0.24, -0.12)
-0.29 (-0.49, -0.09)
-0.16 (-0.20, -0.11)
-0.19 (-0.31, -0.07)
-0.15 (-0.21, -0.09)
-0.18 (-0.28, -0.08)
-0.20 (-0.30, -0.10)
-0.17 (-0.23, -0.11)
-0.15 (-0.19, -0.11)
-0.13 (-0.21, -0.05)
-0.19 (-0.25, -0.13)
-0.14 (-0.18, -0.10)
100.00
24.53
3.45
6.13
0.55
8.83
1.53
6.13
2.21
2.21
6.13
13.80
3.45
5.74
15.29
0-.3 -.2 -.1 0
Overall random effect
2008
2009
2008
2008
2008
2008
2008
2008
2008
2008
2008
2009
2008
Kathiresan (FINRISK 97)
Sabatti (NFBC1966)
Wallace (Twins UK)
Sandhu (EPIC-Norfolk Obese)
Sandhu (EPIC-Norfolk Replication)
Sandhu (Ely study)
Kathiresan (MDC-CC)
Kathiresan (NHS98 Malaysia)
Sandhu (1958 British Birth Cohort )
Kathiresan (NHS98 India)
Sandhu (EPIC-Norfolk subcohort)
Aulchenko (Meta-analysis 15 studies)
Kathiresan (DGI)
2008Kathiresan (NHS98 China)
ES (95% CI)%WeightES (95% CI)%WeightNo. of participantsYearAuthor (name of study)
-0.15 (-0.17, -0.14)Overall fixed effect
I2 = 0 (95% CI 0%-55%), p = 0.695
Effect Size
at INSERM - DISC on July 18, 2010 circgenetics.ahajournals.orgDownloaded from

10
Supplemental Figure 3(d): Meta-analysis of previously published studies in Europeans for the association of variant rs662799 (T1131C), located in the ApoA5 gene, with triglyceride levels Suppl 65-80
NOTE: Weights are from random effects analysis
Overall random effect
Hubacek (Male)
Hubacek (Female)
Helgadottir (PennCATH)
Lee (Japanese American Family)
Talmud (NPHSII)
Grallert (KORA & SAPHIR)
Szalai
Martinelli (Verona Heart Project)
Lee
Vaessen (EPIC-Norfolk)
Aouizerat
Farall (PROCARDIS)
Lai (Framingham Offspring)
Klos (CARDIA)
Evans
Vaverkova
1191
1368
476
154
2537
3264
310
913
438
1800
198
2956
1725
3415
1094
267
0.20 (0.14, 0.26)
0.27 (0.05, 0.49)
0.14 (0.03, 0.25)
0.06 (0.00, 0.12)
0.30 (0.04, 0.57)
0.18 (0.06, 0.31)
0.11 (0.01, 0.21)
0.18 (0.01, 0.35)
0.19 (0.04, 0.34)
0.48 (0.04, 0.93)
0.27 (0.15, 0.39)
0.25 (0.05, 0.44)
0.23 (0.12, 0.34)
0.42 (0.25, 0.58)
0.08 (0.03, 0.14)
0.94 (0.39, 1.50)
0.33 (-0.22, 0.88)
100.00
4.55
8.40
10.64
3.62
7.98
9.05
6.25
6.88
1.56
8.18
5.33
8.40
6.23
10.80
1.06
1.07
00 .2 .4 .6 .8 1
ES (95% CI)%WeightES (95% CI)%WeightNo. of participantsYearAuthor (name of study)
2004
2004
2007
2004
2002
2007
2004
2007
2004
2006
2003
2006
2004
2005
2003
2004
0.14 (0.11, 0.17)Overall fixed effect
I2 = 66 (95% CI 43%-80%), p <0.001
Effect Size
at INSERM - DISC on July 18, 2010 circgenetics.ahajournals.orgDownloaded from
11
References for Supplemental figures 3a-3d
Supplementary references for the SNP rs1800775 (C-629A) and SNP rs708272 (Taq1B)
1. Aulchenko YS, Ripatti S, Lindqvist I, Boomsma D, Heid IM, Pramstaller PP, Penninx BW, Janssens AC, Wilson JF, Spector T, Martin NG, Pedersen NL, Kyvik KO, Kaprio J, Hofman A, Freimer NB, Jarvelin MR, Gyllensten U, Campbell H, Rudan I, Johansson A, Marroni F, Hayward C, Vitart V, Jonasson I, Pattaro C, Wright A, Hastie N, Pichler I, Hicks AA, Falchi M, Willemsen G, Hottenga JJ, De Geus EJ, Montgomery GW, Whitfield J, Magnusson P, Saharinen J, Perola M, Silander K, Isaacs A, Sijbrands EJ, Uitterlinden AG, Witteman JC, Oostra BA, Elliott P, Ruokonen A, Sabatti C, Gieger C, Meitinger T, Kronenberg F, Doring A, Wichmann HE, Smit JH, McCarthy MI, van Duijn CM, Peltonen L. Loci influencing lipid levels and coronary heart disease risk in 16 European population cohorts. Nat Genet 2009;41:47-55.
2. Barzilai N, Atzmon G, Schechter C, Schaefer EJ, Cupples AL, Lipton R, Cheng S, Shuldiner AR. Unique lipoprotein phenotype and genotype associated with exceptional longevity. JAMA 2003;290:2030-40.
3. Bauerfeind A, Knoblauch H, Schuster H, Luft FC, Reich JG. Single nucleotide polymorphism haplotypes in the cholesteryl-ester transfer protein (CETP) gene and lipid phenotypes. Hum Hered 2002;54:166-73.
4. Bernstein MS, Costanza MC, James RW, Morris MA, Cambien F, Raoux S, Morabia A. No physical activity x CETP 1b.-629 interaction effects on lipid profile. Med Sci Sports Exerc 2003;35:1124-9.
5. Blankenberg S, Tiret L, Bickel C, Schlitt A, Jungmair W, Genth-Zotz S, Lubos E, Espinola-Klein C, Rupprecht HJ. [Genetic variation of the cholesterol ester transfer protein gene and the prevalence of coronary artery disease. The AtheroGene case control study]. Z Kardiol 2004;93 Suppl 4:IV16-IV23.
6. Chasman DI, Pare G, Zee RYL, Parker AN, Cook NR, Buring JE, Kwiatkowski DJ, Rose LM, Smith JD, Williams PT, Rieder MJ, Rotter JI, Nickerson DA, Krauss RM, Miletich JP, Ridker PM. Genetic Loci Associated With Plasma Concentration of Low-Density Lipoprotein Cholesterol, High-Density Lipoprotein Cholesterol, Triglycerides, Apolipoprotein A1, and Apolipoprotein B Among 6382 White Women in Genome-Wide Analysis With Replication. Circ Cardiovasc Genet 2008;1:21-30.
7. Dachet C, Poirier O, Cambien F, Chapman J, Rouis M. New functional promoter polymorphism, CETP/-629, in cholesteryl ester transfer protein (CETP) gene related to CETP mass and high density lipoprotein cholesterol levels: role of Sp1/Sp3 in transcriptional regulation. Arterioscler Thromb Vasc Biol 2000;20:507-15.
8. Dullaart RP, Borggreve SE, Hillege HL, Dallinga-Thie GM. The association of HDL cholesterol concentration with the -629C>A CETP promoter polymorphism is not fully explained by its relationship with plasma cholesteryl ester transfer. Scand. J Clin.Lab Invest 67: 2007.
9. Eiriksdottir G, Bolla MK, Thorsson B, Sigurdsson G, Humphries SE, Gudnason V. The -629C>A polymorphism in the CETP gene does not explain the association of TaqIB polymorphism with risk and age of myocardial infarction in Icelandic men. Atherosclerosis 2001;159:187-92.
10. Freeman DJ, Griffin BA, Holmes AP, Lindsay GM, Gaffney D, Packard CJ, Shepherd J. Regulation of plasma HDL cholesterol and subfraction distribution by genetic and environmental factors. Associations between the TaqI B RFLP in the CETP gene and smoking and obesity. Arterioscler Thromb 1994;14:336-44.
11. Heidema AG, Feskens EJ, Doevendans PA, Ruven HJ, van Houwelingen HC, Mariman EC, Boer JM. Analysis of multiple SNPs in genetic association studies: comparison of three multi-locus methods to prioritize and select SNPs. Genet Epidemiol 2007.
at INSERM - DISC on July 18, 2010 circgenetics.ahajournals.orgDownloaded from
12
12. Horne BD, Camp NJ, Anderson JL, Mower CP, Clarke JL, Kolek MJ, Carlquist JF. Multiple less common genetic variants explain the association of the cholesteryl ester transfer protein gene with coronary artery disease. J Am Coll Cardiol 2007;49:2053-60.
13. Kakko S, Tamminen M, Paivansalo M, Kauma H, Rantala AO, Lilja M, Reunanen A, Kesaniemi YA, Savolainen MJ. Variation at the cholesteryl ester transfer protein gene in relation to plasma high density lipoproteins cholesterol levels and carotid intima-media thickness. Eur J Clin Invest 2001;31:593-602.
14. Kathiresan S, Melander O, Guiducci C, Surti A, Burtt NP, Rieder MJ, Cooper GM, Roos C, Voight BF, Havulinna AS, Wahlstrand B, Hedner T, Corella D, Tai ES, Ordovas JM, Berglund G, Vartiainen E, Jousilahti P, Hedblad B, Taskinen MR, Newton-Cheh C, Salomaa V, Peltonen L, Groop L, Altshuler DM, Orho-Melander M. Six new loci associated with blood low-density lipoprotein cholesterol, high-density lipoprotein cholesterol or triglycerides in humans. Nat Genet 2008.
15. McCaskie PA, Beilby JP, Chapman CM, Hung J, McQuillan BM, Thompson PL, Palmer LJ. Cholesteryl ester transfer protein gene haplotypes, plasma high-density lipoprotein levels and the risk of coronary heart disease. Hum Genet 2007;121:401-11.
16. Ridker PM, Pare G, Parker AN, Zee RYL, Miletich JP, Chasman DI. Polymorphism in the CETP Gene Region, HDL Cholesterol, and Risk of Future Myocardial Infarction: Genomewide Analysis Among 18 245 Initially Healthy Women From the Women's Genome Health Study. Circ Cardiovasc Genet 2009;2:26-33.
17. Sabatti C, Service SK, Hartikainen AL, Pouta A, Ripatti S, Brodsky J, Jones CG, Zaitlen NA, Varilo T, Kaakinen M, Sovio U, Ruokonen A, Laitinen J, Jakkula E, Coin L, Hoggart C, Collins A, Turunen H, Gabriel S, Elliot P, McCarthy MI, Daly MJ, Jarvelin MR, Freimer NB, Peltonen L. Genome-wide association analysis of metabolic traits in a birth cohort from a founder population. Nat Genet 2009;41:35-46.
18. Thompson JF, Lira ME, Durham LK, Clark RW, Bamberger MJ, Milos PM. Polymorphisms in the CETP gene and association with CETP mass and HDL levels. Atherosclerosis 2003;167:195-204.
19. Thompson JF, Wood LS, Pickering EH, Dechairo B, Hyde CL. High-density genotyping and functional SNP localization in the CETP gene. J Lipid Res 2007;48:434-43.
20. Tobin MD, Braund PS, Burton PR, Thompson JR, Steeds R, Channer K, Cheng S, Lindpaintner K, Samani NJ. Genotypes and haplotypes predisposing to myocardial infarction: a multilocus case-control study. Eur Heart J 2004;25:459-67.
21. Arca M, Montali A, Ombres D, Battiloro E, Campagna F, Ricci G, Verna R. Lack of association of the common TaqIB polymorphism in the cholesteryl ester transfer protein gene with angiographically assessed coronary atherosclerosis. Clin Genet 2001;60:374-80.
22. Barzilai N, Atzmon G, Schechter C, Schaefer EJ, Cupples AL, Lipton R, Cheng S, Shuldiner AR. Unique lipoprotein phenotype and genotype associated with exceptional longevity. JAMA 2003;290:2030-40.
23. Carr MC, Ayyobi AF, Murdoch SJ, Deeb SS, Brunzell JD. Contribution of hepatic lipase, lipoprotein lipase, and cholesteryl ester transfer protein to LDL and HDL heterogeneity in healthy women. Arterioscler Thromb Vasc Biol 2002;22:667-73.
24. Corella D, Saiz C, Guillen M, Portoles O, Mulet F, Gonzalez JI, Ordovas JM. Association of TaqIB polymorphism in the cholesteryl ester transfer protein gene with plasma lipid levels in a healthy Spanish population. Atherosclerosis 2000;152:367-76.
at INSERM - DISC on July 18, 2010 circgenetics.ahajournals.orgDownloaded from

13
25. Cuchel M, Wolfe ML, deLemos AS, Rader DJ. The frequency of the cholesteryl ester transfer protein-TaqI B2 allele is lower in African Americans than in Caucasians. Atherosclerosis 2002;163:169-74.
26. Deguchi H, Pecheniuk NM, Elias DJ, Averell PM, Griffin JH. High-density lipoprotein deficiency and dyslipoproteinemia associated with venous thrombosis in men. Circulation 2005;112:893-9.
27. Eiriksdottir G, Bolla MK, Thorsson B, Sigurdsson G, Humphries SE, Gudnason V. The -629C>A polymorphism in the CETP gene does not explain the association of TaqIB polymorphism with risk and age of myocardial infarction in Icelandic men. Atherosclerosis 2001;159:187-92.
28. Freeman DJ, Griffin BA, Holmes AP, Lindsay GM, Gaffney D, Packard CJ, Shepherd J. Regulation of plasma HDL cholesterol and subfraction distribution by genetic and environmental factors. Associations between the TaqI B RFLP in the CETP gene and smoking and obesity. Arterioscler Thromb 1994;14:336-44.
29. Freeman DJ, Samani NJ, Wilson V, McMahon AD, Braund PS, Cheng S, Caslake MJ, Packard CJ, Gaffney D. A polymorphism of the cholesteryl ester transfer protein gene predicts cardiovascular events in non-smokers in the West of Scotland Coronary Prevention Study. Eur Heart J 2003 ;24:1833-42.
30. Fumeron F, Betoulle D, Luc G, Behague I, Ricard S, Poirier O, Jemaa R, Evans A, Arveiler D, Marques-Vidal P, . Alcohol intake modulates the effect of a polymorphism of the cholesteryl ester transfer protein gene on plasma high density lipoprotein and the risk of myocardial infarction. J Clin Invest 1995;96:1664-71.
31. Gudnason V, Kakko S, Nicaud V, Savolainen MJ, Kesaniemi YA, Tahvanainen E, Humphries S. Cholesteryl ester transfer protein gene effect on CETP activity and plasma high-density lipoprotein in European populations. The EARS Group. Eur J Clin Invest 1999;29:116-28.
32. Hall WL, Vafeiadou K, Hallund J, Bugel S, Reimann M, Koebnick C, Zunft HJ, Ferrari M, Branca F, Dadd T, Talbot D, Powell J, Minihane AM, Cassidy A, Nilsson M, hlman-Wright K, Gustafsson JA, Williams CM. Soy-isoflavone-enriched foods and markers of lipid and glucose metabolism in postmenopausal women: interactions with genotype and equol production. Am J Clin Nutr 2006;83:592-600.
33. Hannuksela ML, Liinamaa MJ, Kesaniemi YA, Savolainen MJ. Relation of polymorphisms in the cholesteryl ester transfer protein gene to transfer protein activity and plasma lipoprotein levels in alcohol drinkers. Atherosclerosis 1994;110:35-44.
34. Heidema AG, Feskens EJ, Doevendans PA, Ruven HJ, van Houwelingen HC, Mariman EC, Boer JM. Analysis of multiple SNPs in genetic association studies: comparison of three multi-locus methods to prioritize and select SNPs. Genet Epidemiol 2007
35. Horne BD, Camp NJ, Anderson JL, Mower CP, Clarke JL, Kolek MJ, Carlquist JF. Multiple less common genetic variants explain the association of the cholesteryl ester transfer protein gene with coronary artery disease. J Am Coll Cardiol 2007;49:2053-60.
36. Juvonen T, Savolainen MJ, Kairaluoma MI, Lajunen LH, Humphries SE, Kesaniemi YA. Polymorphisms at the apoB, apoA-I, and cholesteryl ester transfer protein gene loci in patients with gallbladder disease. J Lipid Res 1995;36:804-12.
37. Kauma H, Savolainen MJ, Heikkila R, Rantala AO, Lilja M, Reunanen A, Kesaniemi YA. Sex difference in the regulation of plasma high density lipoprotein cholesterol by genetic and environmental factors. Hum Genet 1996;97:156-62.
38. Keavney B, Palmer A, Parish S, Clark S, Youngman L, Danesh J, McKenzie C, Delepine M, Lathrop M, Peto R, Collins R. Lipid-related genes and myocardial infarction in 4685 cases and
at INSERM - DISC on July 18, 2010 circgenetics.ahajournals.orgDownloaded from

14
3460 controls: discrepancies between genotype, blood lipid concentrations, and coronary disease risk. Int J Epidemiol 2004;33:1002-13.
39. Klos KL, Sing CF, Boerwinkle E, Hamon SC, Rea TJ, Clark A, Fornage M, Hixson JE. Consistent effects of genes involved in reverse cholesterol transport on plasma lipid and apolipoprotein levels in CARDIA participants. Arterioscler Thromb Vasc Biol 2006;26:1828-36.
40. Kondo I, Berg K, Drayna D, Lawn R. DNA polymorphism at the locus for human cholesteryl ester transfer protein (CETP) is associated with high density lipoprotein cholesterol and apolipoprotein levels. Clin Genet 1989;35:49-56.
41. Kuivenhoven JA, De KP, Boer JM, Smalheer HA, Botma GJ, Seidell JC, Kastelein JJ, Pritchard PH. Heterogeneity at the CETP gene locus. Influence on plasma CETP concentrations and HDL cholesterol levels. Arterioscler Thromb Vasc Biol 1997;17:560-8.
42. Liu S, Schmitz C, Stampfer MJ, Sacks F, Hennekens CH, Lindpaintner K, Ridker PM. A prospective study of TaqIB polymorphism in the gene coding for cholesteryl ester transfer protein and risk of myocardial infarction in middle-aged men. Atherosclerosis 2002;161:469-74.
43. McCaskie PA, Beilby JP, Chapman CM, Hung J, McQuillan BM, Thompson PL, Palmer LJ. Cholesteryl ester transfer protein gene haplotypes, plasma high-density lipoprotein levels and the risk of coronary heart disease. Hum Genet 2007;121:401-11.
44. Miltiadous G, Hatzivassiliou M, Liberopoulos E, Bairaktari E, Tselepis A, Cariolou M, Elisaf M. Gene polymorphisms affecting HDL-cholesterol levels in the normolipidemic population. Nutr Metab Cardiovasc Dis 2005;15:219-24.
45. Mitchell RJ, Earl L, Williams J, Bisucci T, Gasiamis H. Polymorphisms of the gene coding for the cholesteryl ester transfer protein and plasma lipid levels in Italian and Greek migrants to Australia. Hum Biol 1994;66:13-25.
46. Nettleton JA, Steffen LM, Ballantyne CM, Boerwinkle E, Folsom AR. Associations between HDL-cholesterol and polymorphisms in hepatic lipase and lipoprotein lipase genes are modified by dietary fat intake in African American and White adults. Atherosclerosis 2006.
47. Noone E, Roche HM, Black I, Tully AM, Gibney MJ. Effect of postprandial lipaemia and Taq 1B polymorphism of the cholesteryl ester transfer protein (CETP) gene on CETP mass, activity, associated lipoproteins and plasma lipids. Br J Nutr 2000;84:203-9.
48. Pai JK, Pischon T, Ma J, Manson JE, Hankinson SE, Joshipura K, Curhan GC, Rifai N, Cannuscio CC, Stampfer MJ, Rimm EB. Inflammatory markers and the risk of coronary heart disease in men and women. N Engl J Med 2004;351:2599-610.
49. Plat J, Mensink RP. Relationship of genetic variation in genes encoding apolipoprotein A-IV, scavenger receptor BI, HMG-CoA reductase, CETP and apolipoprotein E with cholesterol metabolism and the response to plant stanol ester consumption. Eur J Clin Invest 2002;32:242-50.
50. Ridker PM, Pare G, Parker AN, Zee RYL, Miletich JP, Chasman DI. Polymorphism in the CETP Gene Region, HDL Cholesterol, and Risk of Future Myocardial Infarction: Genomewide Analysis Among 18 245 Initially Healthy Women From the Women's Genome Health Study. Circ Cardiovasc Genet 2009;2:26-33.
51. Riemens SC, van TA, Stulp BK, Dullaart RP. Influence of insulin sensitivity and the TaqIB cholesteryl ester transfer protein gene polymorphism on plasma lecithin:cholesterol acyltransferase and lipid transfer protein activities and their response to hyperinsulinemia in non-diabetic men. J Lipid Res 1999;40:1467-74.
at INSERM - DISC on July 18, 2010 circgenetics.ahajournals.orgDownloaded from

15
52. Sandhofer A, Tatarczyk T, Laimer M, Ritsch A, Kaser S, Paulweber B, Ebenbichler CF, Patsch JR. The Taq1B-variant in the Cholesteryl Ester-Transfer Protein Gene and the Risk of Metabolic Syndrome. Obesity (Silver Spring) 2008.
53. Sorli JV, Corella D, Frances F, Ramirez JB, Gonzalez JI, Guillen M, Portoles O. The effect of the APOE polymorphism on HDL-C concentrations depends on the cholesterol ester transfer protein gene variation in a Southern European population. Clin Chim Acta 2006;366:196-203.
54. Talmud PJ, Hawe E, Robertson K, Miller GJ, Miller NE, Humphries SE. Genetic and environmental determinants of plasma high density lipoprotein cholesterol and apolipoprotein AI concentrations in healthy middle-aged men. Ann Hum Genet 2002;66:111-24.
55. Tenkanen H, Koshinen P, Kontula K, alto-Setala K, Manttari M, Manninen V, Runeberg SL, Taskinen MR, Ehnholm C. Polymorphisms of the gene encoding cholesterol ester transfer protein and serum lipoprotein levels in subjects with and without coronary heart disease. Hum Genet 1991;87:574-8.
56. Thompson JF, Lira ME, Durham LK, Clark RW, Bamberger MJ, Milos PM. Polymorphisms in the CETP gene and association with CETP mass and HDL levels. Atherosclerosis 2003;167:195-204.
57. Thompson JF, Wood LS, Pickering EH, Dechairo B, Hyde CL. High-density genotyping and functional SNP localization in the CETP gene. J Lipid Res 2007;48:434-43.
58. Vohl MC, Lamarche B, Pascot A, Leroux G, Prud'homme D, Bouchard C, Nadeau A, Despres JP. Contribution of the cholesteryl ester transfer protein gene TaqIB polymorphism to the reduced plasma HDL-cholesterol levels found in abdominal obese men with the features of the insulin resistance syndrome. Int J Obes Relat Metab Disord 1999;23:918-25.
59. Weitgasser R, Galvan G, Malaimare L, Derflinger I, Hedegger M, Lang J, Iglseder B, Ladurner G, Paulweber B. Cholesteryl ester transfer protein TaqIB polymorphism and its relation to parameters of the insulin resistance syndrome in an Austrian cohort. Biomed Pharmacother 2004;58:619-27.
Supplementary references for the SNP rs646776 located in the CELSR2 gene
60. Aulchenko YS, Ripatti S, Lindqvist I, Boomsma D, Heid IM, Pramstaller PP, Penninx BW, Janssens AC, Wilson JF, Spector T, Martin NG, Pedersen NL, Kyvik KO, Kaprio J, Hofman A, Freimer NB, Jarvelin MR, Gyllensten U, Campbell H, Rudan I, Johansson A, Marroni F, Hayward C, Vitart V, Jonasson I, Pattaro C, Wright A, Hastie N, Pichler I, Hicks AA, Falchi M, Willemsen G, Hottenga JJ, de Geus EJ, Montgomery GW, Whitfield J, Magnusson P, Saharinen J, Perola M, Silander K, Isaacs A, Sijbrands EJ, Uitterlinden AG, Witteman JC, Oostra BA, Elliott P, Ruokonen A, Sabatti C, Gieger C, Meitinger T, Kronenberg F, Döring A, Wichmann HE, Smit JH, McCarthy MI, van Duijn CM, Peltonen L; ENGAGE Consortium. Loci influencing lipid levels and coronary heart disease risk in 16 European population cohorts. Nat Genet. 2009;41:47-55
61. Sabatti C, Service SK, Hartikainen AL, Pouta A, Ripatti S, Brodsky J, Jones CG, Zaitlen NA, Varilo
T, Kaakinen M, Sovio U, Ruokonen A, Laitinen J, Jakkula E, Coin L, Hoggart C, Collins A, Turunen H, Gabriel S, Elliot P, McCarthy MI, Daly MJ, Järvelin MR, Freimer NB, Peltonen L. Genome-wide association analysis of metabolic traits in a birth cohort from a founder population. Nat Genet. 2009;41:35-46.
62. Sandhu MS, Waterworth DM, Debenham SL, Wheeler E, Papadakis K, Zhao JH, Song K, Yuan X,
Johnson T, Ashford S, Inouye M, Luben R, Sims M, Hadley D, McArdle W, Barter P, Kesäniemi YA, Mahley RW, McPherson R, Grundy SM; Wellcome Trust Case Control Consortium, Bingham SA, Khaw KT, Loos RJ, Waeber G, Barroso I, Strachan DP, Deloukas P, Vollenweider P, Wareham NJ, Mooser V. LDL-cholesterol concentrations: a genome-wide association study. Lancet. 2008 9;371:483-91.
at INSERM - DISC on July 18, 2010 circgenetics.ahajournals.orgDownloaded from
16
63. Kathiresan S, Melander O, Guiducci C, Surti A, Burtt NP, Rieder MJ, Cooper GM, Roos C, Voight BF, Havulinna AS, Wahlstrand B, Hedner T, Corella D, Tai ES, Ordovas JM, Berglund G, Vartiainen E, Jousilahti P, Hedblad B, Taskinen MR, Newton-Cheh C, Salomaa V, Peltonen L, Groop L, Altshuler DM, Orho-Melander M. Six new loci associated with blood low-density lipoprotein cholesterol, high-density lipoprotein cholesterol or triglycerides in humans. Nat Genet. 2008;40:189-97. Epub 2008 Jan 13. Erratum in: Nat Genet. 2008;40(11):1384.
64. Wallace C, Newhouse SJ, Braund P, Zhang F, Tobin M, Falchi M, Ahmadi K, Dobson RJ, Marçano
AC, Hajat C, Burton P, Deloukas P, Brown M, Connell JM, Dominiczak A, Lathrop GM, Webster J, Farrall M, Spector T, Samani NJ, Caulfield MJ, Munroe PB. Genome-wide association study identifies genes for biomarkers of cardiovascular disease: serum urate and dyslipidemia. Am J Hum Genet. 2008;82:139-49.
Supplementary reference for SNP rs662799 (T1131C) located in the ApoA5 gene
65. Klos KL, Hamon S, Clark AG, Boerwinkle E, Liu K, Sing CF. APOA5 polymorphismsinfluence
plasma triglycerides in young, healthy African Americans and whites of the CARDIA Study. J Lipid Res. 2005;46:564-71
66. Grallert H, Sedlmeier EM, Huth C, Kolz M, Heid IM, Meisinger C, Herder C, Strassburger K,
Gehringer A, Haak M, Giani G, Kronenberg F, Wichmann HE, Adamski J, Paulweber B, Illig T, Rathmann W. APOA5 variants and metabolic syndrome in Caucasians. J Lipid Res. 2007;48:2614-21
67. Talmud PJ, Hawe E, Martin S, Olivier M, Miller GJ, Rubin EM, Pennacchio LA, Humphries SE.
Relative contribution of variation within the APOC3/A4/A5 gene cluster in determining plasma triglycerides. Hum Mol Genet. 2002;11:3039-46
68. Vaessen SF, Schaap FG, Kuivenhoven JA, Groen AK, Hutten BA, Boekholdt SM, Hattori H,
Sandhu MS, Bingham SA, Luben R, Palmen JA, Wareham NJ, Humphries SE, Kastelein JJ, Talmud PJ, Khaw KT. Apolipoprotein A-V, triglycerides and risk of coronary artery disease: the prospective Epic-Norfolk Population Study. J Lipid Res. 2006;47:2064-70
69. Vaessen SF, Schaap FG, Kuivenhoven JA, Groen AK, Hutten BA, Boekholdt SM, Hattori H,
Sandhu MS, Bingham SA, Luben R, Palmen JA, Wareham NJ, Humphries SE, Kastelein JJ, Talmud PJ, Khaw KT. Apolipoprotein A-V, triglycerides and risk of coronary artery disease: the prospective Epic-Norfolk Population Study. J Lipid Res.2006 ;47:2064-70
70. Lai CQ, Demissie S, Cupples LA, Zhu Y, Adiconis X, Parnell LD, Corella D, Ordovas JM. Influence
of the APOA5 locus on plasma triglyceride, lipoprotein subclasses, and CVD risk in the Framingham Heart Study. J Lipid Res. 2004;45:2096-105
71. Hubacek JA, Skodova Z, Adamkova V, Lanska V, Poledne R. The influence of APOAV
polymorphisms (T-1131>C and S19>W) on plasma triglyceride levels and risk of myocardial infarction. Clin Genet. 2004;65:126-30
72. Evans D, Buchwald A, Beil FU. The single nucleotide polymorphism -1131T>C in the
apolipoprotein A5 (APOA5) gene is associated with elevated triglycerides in patients with hyperlipidemia. J Mol Med. 2003;81:645-54
73. Martinelli N, Trabetti E, Bassi A, Girelli D, Friso S, Pizzolo F, Sandri M, Malerba G, Pignatti PF,
Corrocher R, Olivieri O. The -1131 T>C and S19W APOA5 gene polymorphisms are associated with high levels of triglycerides and apolipoprotein CIII, but not with coronary artery disease: an angiographic study. Atherosclerosis. 2007;191:409-17
74. Lee KW, Ayyobi AF, Frohlich JJ, Hill JS. APOA5 gene polymorphism modulates levels of
triglyceride, HDL cholesterol and FERHDL but is not a risk factor for coronary artery disease. Atherosclerosis. 2004 Sep;176(1):165-72Lee KW, Ayyobi AF, Frohlich JJ, Hill JS. APOA5 gene
at INSERM - DISC on July 18, 2010 circgenetics.ahajournals.orgDownloaded from
17
polymorphism modulates levels of triglyceride, HDL cholesterol and FERHDL but is not a risk factor for coronary artery disease. Atherosclerosis. 2004;176:165-72
75. Szalai C, Keszei M, Duba J, Prohaszka Z, Kozma GT, Csaszar A, Balogh S, Almassy Z, Fust G,
Czinner A. Polymorphism in the promoter region of the apolipoprotein A5 gene is associated with an increased susceptibility for coronary artery disease. Atherosclerosis. 2004;173:109-14
76. Vaverkova H, Novotn D, Kar sek D, Bud kov. Slav L, Hutyra, Halenka M. Polymorphism T-1131C
(SNP3) of apoAV gene increases triglycerides levels independently of the presence of insulin resistance. Abstract, 74th EAS Congress, 2004.
77. Aouizerat BE, Kulkarni M, Heilbron D, Drown D, Raskin S, Pullinger CR, Malloy MJ, Kane JP.
Genetic analysis of a polymorphism in the human apoA-V gene: effect on plasma lipids. J Lipid Res. 2003;44:1167-73
78. Lee KW, Ayyobi AF, Frohlich JJ, Hill JS. APOA5 gene polymorphism modulates levels of
triglyceride, HDL cholesterol and FERHDL but is not a risk factor for coronary artery disease. Atherosclerosis. 2004;176:165-72
79. Farrall M, Green FR, Peden JF, Olsson PG, Clarke R, Hellenius ML, Rust S, Lagercrantz J,
Franzosi MG, Schulte H, Carey A, Olsson G, Assmann G, Tognoni G, Collins R, Hamsten A, Watkins H. Genome-wide mapping of susceptibility to coronary artery disease identifies a novel replicated locus on chromosome 17. PLoS Genet. 2006;2:e72
80. Helgadottir A, Thorleifsson G, Manolescu A, Gretarsdottir S, Blondal T, Jonasdottir A, Jonasdottir
A, Sigurdsson A, Baker A, Palsson A, Masson G, Gudbjartsson DF, Magnusson KP, Andersen K, Levey AI, Backman VM, Matthiasdottir S, Jonsdottir T, Palsson S, Einarsdottir H, Gunnarsdottir S, Gylfason A, Vaccarino V, Hooper WC, Reilly MP, Granger CB, Austin H, Rader DJ, Shah SH, Quyyumi AA, Gulcher JR, Thorgeirsson G, Thorsteinsdottir U, Kong A, Stefansson K. A common variant on chromosome 9p21 affects the risk of myocardial infarction. Science. 2007;316:1491-3
at INSERM - DISC on July 18, 2010 circgenetics.ahajournals.orgDownloaded from

18
Supplemental Figure 4: Effect modification of genetic effects by gender, ghee consumption and tobacco consumption in Pakistanis
Log triglyceridesrs1260326GCKR
Rs271LPL
rs651821APOA5/ZNF259
LDL-CRs646776CELSR2
HDL-Crs711752CETP
Lipid traitSNPGene
Gender
Oil type
Tobacco
Gender
Oil type
Tobacco
Gender
Oil type
Tobacco
Gender
Oil type
Tobacco
Gender
Oil type
Tobacco
malefemale
gheeoilcombination
EverCurrent
malefemale
gheeoilcombination
EverCurrent
malefemale
gheeoilcombination
EverCurrent
malefemale
gheeoilcombination
EverCurrent
malefemale
gheeoilcombination
EverCurrent
Subgroup
2,558 578
4491,925635
1,625 1,426
2,559 578
4501,925635
1,625 1,427
2,557578
4491,924 635
1,624 1,426
2,424 498
4381,769601
1,486 1,357
2,440 505
4411,785603
1,504 1,360
No. of participants
0.03 (-0.04, 0.10)0.09 (-0.05, 0.23)
0.09 (0.05, 0.13)0.05 (-0.08, 0.18)0.05 (-0.07, 0.17)
0.08 (0.04, 0.12)0.07 (-0.03, 0.18)
-0.09 (-0.18, -0.01)-0.08 (-0.26, 0.10)
-0.07 (-0.12, -0.02)-0.12 (-0.28, 0.03)-0.06 (-0.20, 0.08)
-0.10 (-0.15, -0.05)-0.05 (-0.18, 0.07)
0.13 (0.05, 0.21)0.15 (-0.03, 0.32)
0.12 (0.08, 0.17)0.06 (-0.09, 0.22)0.24 (0.10, 0.38)
0.11 (0.06, 0.16)0.16 (0.04, 0.29)
-0.09 (-0.26, 0.08)-0.16 (-0.52, 0.19)
-0.20 (-0.29, -0.11)-0.03 (-0.31, 0.25)-0.14 (-0.40, 0.11)
-0.18 (-0.28, -0.09)-0.13 (-0.36, 0.10)
0.06 (0.04, 0.09)0.05 (-0.01, 0.11)
0.05 (0.03, 0.06)0.06 (0.01, 0.11)0.06 (0.02, 0.11)
0.05 (0.03, 0.07)0.05 (0.01, 0.09)
0.13
0.50
0.78
0.82
0.60
0.27
0.78
0.01
0.16
0.44
0.24
0.46
0.32
0.49
0.71
Interaction p-value
0.03 (-0.04, 0.10)0.09 (-0.05, 0.23)
0.09 (0.05, 0.13)0.05 (-0.08, 0.18)0.05 (-0.07, 0.17)
0.08 (0.04, 0.12)0.07 (-0.03, 0.18)
-0.09 (-0.18, -0.01)-0.08 (-0.26, 0.10)
-0.07 (-0.12, -0.02)-0.12 (-0.28, 0.03)-0.06 (-0.20, 0.08)
-0.10 (-0.15, -0.05)-0.05 (-0.18, 0.07)
0.13 (0.05, 0.21)0.15 (-0.03, 0.32)
0.12 (0.08, 0.17)0.06 (-0.09, 0.22)0.24 (0.10, 0.38)
0.11 (0.06, 0.16)0.16 (0.04, 0.29)
-0.09 (-0.26, 0.08)-0.16 (-0.52, 0.19)
-0.20 (-0.29, -0.11)-0.03 (-0.31, 0.25)-0.14 (-0.40, 0.11)
-0.18 (-0.28, -0.09)-0.13 (-0.36, 0.10)
0.06 (0.04, 0.09)0.05 (-0.01, 0.11)
0.05 (0.03, 0.06)0.06 (0.01, 0.11)0.06 (0.02, 0.11)
0.05 (0.03, 0.07)0.05 (0.01, 0.09)
Change in lipid trait (mmol/L) per copy of the minor allele (95% CI)
0-.516 0 .516
Lipid level (mmol/L) and 95% confidence intervalsAnalyses are presented only for the lead SNPs at loci that showed highly signficant associations with lipid traits (P < 10-6)Size of data markers are proportional to the inverse of the variance of the minor allele effect. P-values were derived from F tests of the interaction terms fitted in linear regression models of each lipid trait, adjusted for age, gender, the first two principle components and case-control status.
at INSERM - DISC on July 18, 2010 circgenetics.ahajournals.orgDownloaded from

19
9
20
1
16
16
16
16
16
19
2
15
16
16
16
8
9
12
16
16
1
15
8
18
CETP
CETP
rs1883025
LPL
rs1800961
rs2144300
rs5882
rs1800775
APOB
rs1800777CETP
rs5880
APOE
HNF4A
rs255052
GALNT2
rs157580
LIPC
rs693
CETP
CETP
LPL
ABCA1
rs1800588
rs7499892
CETP
rs3764261
rs2197089
CETP
LIPC
rs3890182
DPEP2
rs2338104
rs1864163
KCTD10
rs711752
rs4846914
rs261332
CETP
ABCA1
rs328
rs1532624
rs2156552(intergenic)
GALNT2
CETP
A
A
A
C
G
A
G
A
G
T
T
A
A
A
T
C
A
T
A
A
G
T
A
2451
2451
3023
2434
3021
3023
3024
3024
2451
30242452
3024
2449
2451
3024
2450
3015
2452
3024
2443
2452
2451
2451
3024
3023
2448
3023
3001
2452
2451
3024
2449
3023
3024
2451
3023
3022
3022
2451
2451
3024
3023
30202451
2452
2451
0.06 (0.04, 0.07)
-0.07 (-0.10, -0.04)
-0.01 (-0.03, -0.00)
0.02 (0.01, 0.04)
-0.01 (-0.05, 0.03)
0.00 (-0.01, 0.02)
0.02 (0.01, 0.04)
-0.05 (-0.06, -0.03)
-0.02 (-0.03, -0.00)
-0.06 (-0.10, -0.03)-0.07 (-0.11, -0.03)
-0.06 (-0.09, -0.04)
0.00 (-0.01, 0.02)
-0.07 (-0.12, -0.03)
0.03 (0.01, 0.04)
0.02 (0.00, 0.03)
0.01 (-0.00, 0.02)
0.04 (0.02, 0.05)
-0.01 (-0.02, 0.00)
-0.06 (-0.08, -0.05)
0.03 (0.02, 0.05)
0.05 (0.03, 0.07)
-0.03 (-0.05, -0.01)
0.02 (0.01, 0.03)
-0.04 (-0.06, -0.03)
0.06 (0.04, 0.07)
0.05 (0.04, 0.06)
0.00 (-0.01, 0.02)
-0.06 (-0.08, -0.04)
0.04 (0.02, 0.06)
-0.01 (-0.03, 0.01)
0.03 (0.01, 0.05)
0.01 (-0.00, 0.02)
-0.04 (-0.06, -0.03)
0.00 (-0.01, 0.02)
0.05 (0.04, 0.06)
0.00 (-0.01, 0.02)
0.02 (0.01, 0.04)
-0.06 (-0.08, -0.05)
-0.02 (-0.04, -0.01)
0.02 (-0.00, 0.04)
0.04 (0.03, 0.06)
-0.02 (-0.04, -0.00)-0.00 (-0.02, 0.02)
0.02 (0.00, 0.03)
0.06 (0.04, 0.07)
.32
.05
.35
.55
.03
.45
.43
.4
.46
.04
.04
.08
.36
.04
.19
.58
.47
.22
.27
.27
.32
.11
.12
.25
.22
.43
.34
.44
.18
.23
.08
.15
.44
.22
.57
.47
.45
.19
.53
.26
.10
.48
.14
.15
.58
.42
1.1e-13
5.2e-05
3.4e-02
5.4e-03
5.3e-01
5.1e-01
5.4e-04
3.0e-12
4.4e-02
1.8e-042.8e-04
7.9e-08
5.4e-01
8.8e-04
5.4e-04
2.1e-02
1.9e-01
8.7e-05
1.6e-01
2.4e-13
3.8e-05
2.6e-05
5.9e-03
7.3e-03
3.8e-08
8.7e-15
1.2e-12
6.0e-01
8.5e-11
1.2e-05
3.8e-01
6.0e-03
1.8e-01
1.6e-08
5.0e-01
4.7e-14
4.9e-01
5.5e-03
3.7e-17
4.2e-03
5.8e-02
4.1e-12
2.6e-026.9e-01
2.2e-02
5.0e-15
0.06 (0.04, 0.07)
-0.07 (-0.10, -0.04)
-0.01 (-0.03, -0.00)
0.02 (0.01, 0.04)
-0.01 (-0.05, 0.03)
0.00 (-0.01, 0.02)
0.02 (0.01, 0.04)
-0.05 (-0.06, -0.03)
-0.02 (-0.03, -0.00)
-0.06 (-0.10, -0.03)-0.07 (-0.11, -0.03)
-0.06 (-0.09, -0.04)
0.00 (-0.01, 0.02)
-0.07 (-0.12, -0.03)
0.03 (0.01, 0.04)
0.02 (0.00, 0.03)
0.01 (-0.00, 0.02)
0.04 (0.02, 0.05)
-0.01 (-0.02, 0.00)
-0.06 (-0.08, -0.05)
0.03 (0.02, 0.05)
0.05 (0.03, 0.07)
-0.03 (-0.05, -0.01)
0.02 (0.01, 0.03)
-0.04 (-0.06, -0.03)
0.06 (0.04, 0.07)
0.05 (0.04, 0.06)
0.00 (-0.01, 0.02)
-0.06 (-0.08, -0.04)
0.04 (0.02, 0.06)
-0.01 (-0.03, 0.01)
0.03 (0.01, 0.05)
0.01 (-0.00, 0.02)
-0.04 (-0.06, -0.03)
0.00 (-0.01, 0.02)
0.05 (0.04, 0.06)
0.00 (-0.01, 0.02)
0.02 (0.01, 0.04)
-0.06 (-0.08, -0.05)
-0.02 (-0.04, -0.01)
0.02 (-0.00, 0.04)
0.04 (0.03, 0.06)
-0.02 (-0.04, -0.00)-0.00 (-0.02, 0.02)
0.02 (0.00, 0.03)
0.06 (0.04, 0.07)
.32
.35
.55
.45
.43
.40
.46
.36
.19
.58
.47
.22
.27
.27
.32
.11
.12
.25
.22
.43
.34
.44
.18
.23
.15
.44
.22
.57
.47
.45
.19
.53
.26
.48
.14
.15
.58
.42
0-.1 -.05 0 .05 .1
Minor allele
Number of subjects P-value
for associationMean difference(95% CI)
MAFSNPGene
Chr
PROMISLURIC
0.15
0.10
0.74
0.92
0.02
0.10
0.87
0.19
0.10
0.67
0.52
0.28
0.63
0.30
0.13
0.16
0.08
0.09
0.69
0.09
0.08
0.30
0.35
P-value for difference
between studies
genome wide association studies in association with HDL-C levels
Supplemental Figure 5(a): Association with HDL-C (mmol/l) in PROMIS and LURIC participants of SNPs discovered in previous genome wide association studies in association with HDL-C levels
at INSERM - DISC on July 18, 2010 circgenetics.ahajournals.orgDownloaded from
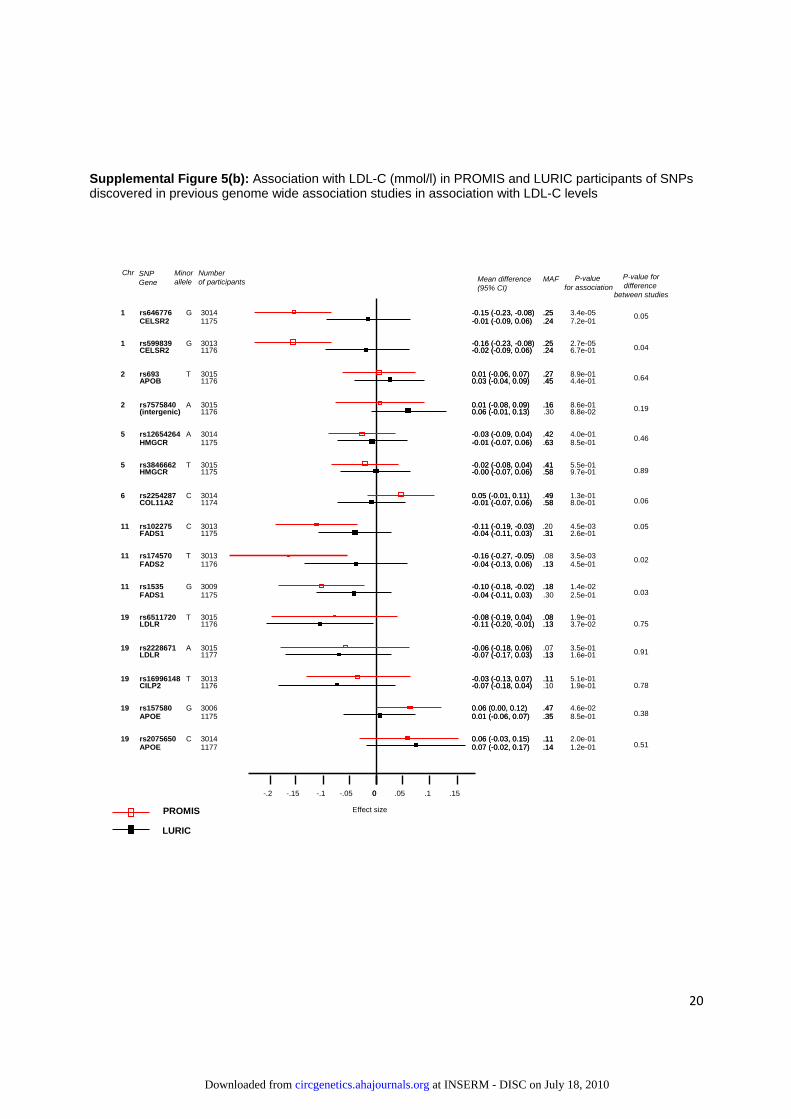
20
19
19
5
5
1
19
11
11
19
2
19
1
6
2
11
rs16996148
HMGCR
rs2228671
rs12654264
rs3846662
LDLR
FADS2
rs646776
APOE
rs6511720
rs102275
rs1535
HMGCR
rs2075650
rs7575840
rs157580
APOB
CELSR2
FADS1
APOE
LDLR
(intergenic)
rs599839
rs2254287
CILP2
FADS1
CELSR2
COL11A2
rs693
rs174570
T
A
A
T
G
T
C
G
C
A
G
G
C
T
T
3013
1175
3015
3014
3015
1177
1176
3014
1175
3015
3013
3009
1175
3014
3015
3006
1176
1175
1175
1177
1176
1176
3013
3014
1176
1175
1176
1174
3015
3013
-0.03 (-0.13, 0.07)
-0.01 (-0.07, 0.06)
-0.06 (-0.18, 0.06)
-0.03 (-0.09, 0.04)
-0.02 (-0.08, 0.04)
-0.07 (-0.17, 0.03)
-0.04 (-0.13, 0.06)
-0.15 (-0.23, -0.08)
0.01 (-0.06, 0.07)
-0.08 (-0.19, 0.04)
-0.11 (-0.19, -0.03)
-0.10 (-0.18, -0.02)
-0.00 (-0.07, 0.06)
0.06 (-0.03, 0.15)
0.01 (-0.08, 0.09)
0.06 (0.00, 0.12)
0.03 (-0.04, 0.09)
-0.01 (-0.09, 0.06)
-0.04 (-0.11, 0.03)
0.07 (-0.02, 0.17)
-0.11 (-0.20, -0.01)
0.06 (-0.01, 0.13)
-0.16 (-0.23, -0.08)
0.05 (-0.01, 0.11)
-0.07 (-0.18, 0.04)
-0.04 (-0.11, 0.03)
-0.02 (-0.09, 0.06)
-0.01 (-0.07, 0.06)
0.01 (-0.06, 0.07)
-0.16 (-0.27, -0.05)
.11
.63
.07
.42
.41
.13
.13
.25
.35
.08
.20
.18
.58
.11
.16
.47
.45
.24
.30
.14
.13
.25
.49
.10
.31
.24
.58
.27
.08
5.1e-01
8.5e-01
3.5e-01
4.0e-01
5.5e-01
1.6e-01
4.5e-01
3.4e-05
8.5e-01
1.9e-01
4.5e-03
1.4e-02
9.7e-01
2.0e-01
8.6e-01
4.6e-02
4.4e-01
7.2e-01
2.5e-01
1.2e-01
3.7e-02
8.8e-02
2.7e-05
1.3e-01
1.9e-01
2.6e-01
6.7e-01
8.0e-01
8.9e-01
3.5e-03
-0.03 (-0.13, 0.07)
-0.01 (-0.07, 0.06)
-0.06 (-0.18, 0.06)
-0.03 (-0.09, 0.04)
-0.02 (-0.08, 0.04)
-0.07 (-0.17, 0.03)
-0.04 (-0.13, 0.06)
-0.15 (-0.23, -0.08)
0.01 (-0.06, 0.07)
-0.08 (-0.19, 0.04)
-0.11 (-0.19, -0.03)
-0.10 (-0.18, -0.02)
-0.00 (-0.07, 0.06)
0.06 (-0.03, 0.15)
0.01 (-0.08, 0.09)
0.06 (0.00, 0.12)
0.03 (-0.04, 0.09)
-0.01 (-0.09, 0.06)
-0.04 (-0.11, 0.03)
0.07 (-0.02, 0.17)
-0.11 (-0.20, -0.01)
0.06 (-0.01, 0.13)
-0.16 (-0.23, -0.08)
0.05 (-0.01, 0.11)
-0.07 (-0.18, 0.04)
-0.04 (-0.11, 0.03)
-0.02 (-0.09, 0.06)
-0.01 (-0.07, 0.06)
0.01 (-0.06, 0.07)
-0.16 (-0.27, -0.05)
.11
.63
.42
.41
.13
.13
.25
.35
.08
.18
.58
.11
.16
.47
.45
.24
.14
.13
.30
.25
.49
.31
.24
.58
.27
Minor allele
Number of participants P-value
for associationMean difference(95% CI)
MAFSNPGene
Chr
PROMIS
LURIC
Effect size
0-.2 -.15 -.1 -.05 0 .05 .1 .15
0.04
0.75
0.64
0.03
0.02
0.19
0.89
0.05
0.06
0.91
0.46
0.78
0.51
0.38
0.05
P-value fordifference
between studies
Supplemental Figure 5(b): Association with LDL-C (mmol/l) in PROMIS and LURIC participants of SNPs discovered in previous genome wide association studies in association with LDL-C levels
at INSERM - DISC on July 18, 2010 circgenetics.ahajournals.orgDownloaded from

21
8
2
11
7
19
8
2
1
2
19
2
7
1
8
11
19
1
(intergenic)
GALNT2
DOCK7
CILP2
rs328
APOE
APOE
(intergenic)
rs780094
rs12286037
LPL
rs17145738
rs16996148
APOB
GCKR
GCKR
rs17321515
rs673548
rs4846914
rs1260326
rs439401
APOBrs693
rs714052
ZNF259
BAZ1B
rs12130333
APOA5
rs2197089
rs662799
rs157580
TBL2
rs1748195
LPL
G
T
T
T
T
C
A
A
T
C
T
G
T
A
C
G
G
2451
2450
2440
2451
3197
2449
2426
2450
3185
3197
2451
3197
3195
2451
2451
2449
3197
3196
3194
3196
3183
24513197
3193
2452
2451
3197
2451
3172
3195
3188
2451
3195
2434
-0.02 (-0.05, 0.01)
-0.03 (-0.05, 0.00)
-0.02 (-0.05, 0.01)
-0.11 (-0.16, -0.06)
-0.08 (-0.13, -0.03)
-0.02 (-0.05, 0.01)
0.04 (0.02, 0.07)
-0.03 (-0.06, -0.00)
0.07 (0.04, 0.11)
0.12 (0.06, 0.19)
-0.12 (-0.17, -0.08)
-0.09 (-0.14, -0.05)
-0.05 (-0.09, -0.01)
-0.04 (-0.07, -0.01)
0.08 (0.05, 0.10)
0.08 (0.05, 0.11)
-0.01 (-0.04, 0.01)
-0.04 (-0.06, -0.01)
-0.02 (-0.04, 0.01)
0.08 (0.05, 0.11)
0.04 (0.01, 0.07)
0.02 (-0.00, 0.05)0.03 (-0.00, 0.06)
-0.08 (-0.12, -0.03)
0.08 (0.03, 0.13)
-0.02 (-0.06, 0.03)
-0.04 (-0.07, -0.00)
0.14 (0.09, 0.19)
-0.02 (-0.05, 0.01)
0.14 (0.11, 0.18)
-0.03 (-0.06, -0.01)
-0.02 (-0.06, 0.03)
-0.06 (-0.08, -0.03)
-0.04 (-0.07, -0.02)
.20
.58
.31
.36
.61
.48
.26
.04
.11
.11
.22
.44
.44
.37
.49
.45
.26
.45
.46
.27
.10
.068
.11
.17
.06
.44
.17
.47
.11
.45
.55
2.5e-01
6.8e-02
1.3e-01
6.5e-06
6.5e-04
1.9e-01
1.9e-03
3.5e-02
2.6e-06
2.8e-04
2.2e-08
7.3e-05
2.5e-02
6.8e-03
7.2e-09
3.9e-09
3.3e-01
5.7e-03
2.4e-01
9.0e-07
4.1e-03
9.1e-028.1e-02
1.0e-03
2.2e-03
4.9e-01
4.6e-02
1.3e-07
1.7e-01
1.2e-14
1.6e-02
4.5e-01
2.6e-05
1.8e-03
-0.02 (-0.05, 0.01)
-0.03 (-0.05, 0.00)
-0.02 (-0.05, 0.01)
-0.11 (-0.16, -0.06)
-0.08 (-0.13, -0.03)
-0.02 (-0.05, 0.01)
0.04 (0.02, 0.07)
-0.03 (-0.06, -0.00)
0.07 (0.04, 0.11)
0.12 (0.06, 0.19)
-0.12 (-0.17, -0.08)
-0.09 (-0.14, -0.05)
-0.05 (-0.09, -0.01)
-0.04 (-0.07, -0.01)
0.08 (0.05, 0.10)
0.08 (0.05, 0.11)
-0.01 (-0.04, 0.01)
-0.04 (-0.06, -0.01)
-0.02 (-0.04, 0.01)
0.08 (0.05, 0.11)
0.04 (0.01, 0.07)
0.02 (-0.00, 0.05)0.03 (-0.00, 0.06)
-0.08 (-0.12, -0.03)
0.08 (0.03, 0.13)
-0.02 (-0.06, 0.03)
-0.04 (-0.07, -0.00)
0.14 (0.09, 0.19)
-0.02 (-0.05, 0.01)
0.14 (0.11, 0.18)
-0.03 (-0.06, -0.01)
-0.02 (-0.06, 0.03)
-0.06 (-0.08, -0.03)
-0.04 (-0.07, -0.02)
.58
.31
.09
.10
.36
.61
.48
.26
.11
.10
.11
.22
.44
.44
.37
.49
.45
.26
.45
.46
.27
.068
.11
.17
.44
.17
.47
.11
.45
.55
0-.15 -.1 -.05 0 .05 .1 .15 .2
Minor allele
Number of participants
P-valuefor association
Mean difference(95% CI)
MAFSNPChr
PROMIS
LURIC
0.81
0.07
0.73
0.07
0.07
0.02
0.68
0.80
0.50
0.12
0.69
0.69
0.39
0.65
0.48
0.86
0.09
P-value for difference
between studies
Supplemental Figure 5(c): Association with log triglycerides (mmol/l) in PROMIS and LURIC participants of SNPs discovered in previous genome wide association studies in association with triglyceride levels
WebFigures 4 (a-b): Estimates represent the per-minor allele increase in lipid levels, adjusted for age, sex, the first two principal components and case-control status. The P-value for difference between studies corresponds to a test of nullity of interaction term between study and the SNP of interest. Boxes are proportional to the inverse of the variance of study estimates. Chr: chromosome, SNP: Single Nucleotide Polymorphism, MAF: minor allele frequency
at INSERM - DISC on July 18, 2010 circgenetics.ahajournals.orgDownloaded from
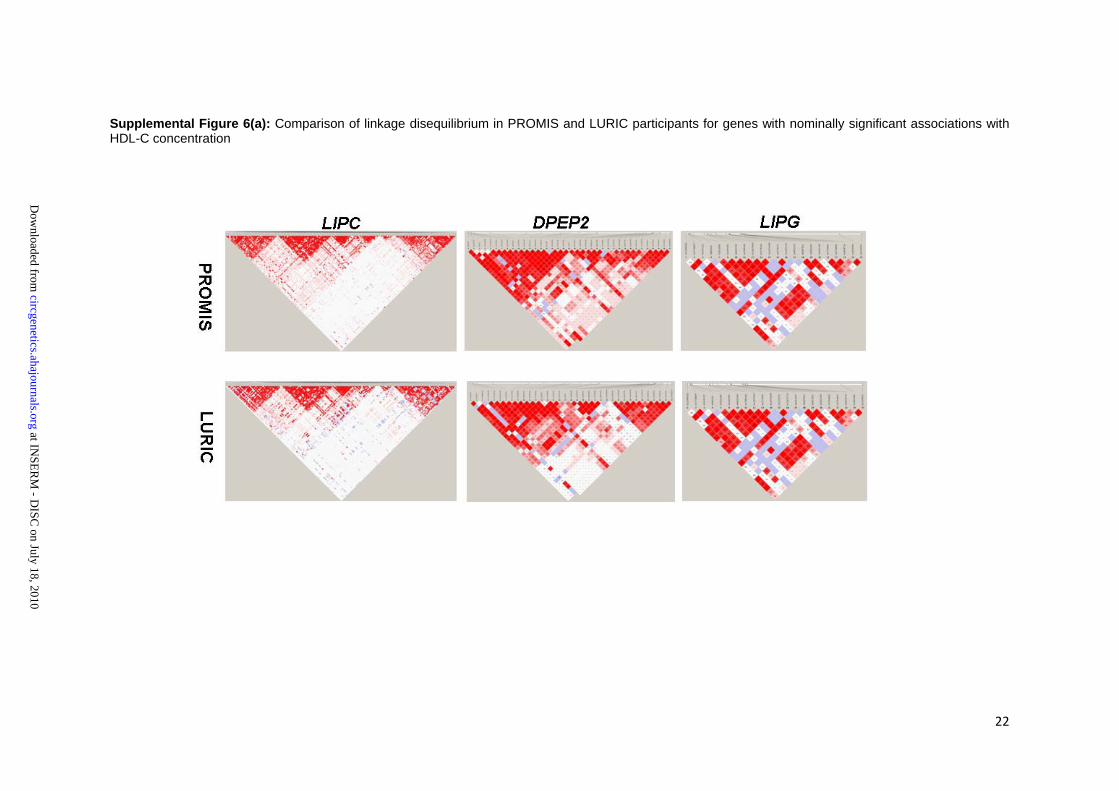
22
Supplemental Figure 6(a): Comparison of linkage disequilibrium in PROMIS and LURIC participants for genes with nominally significant associations with HDL-C concentration
at INSE
RM
- DISC
on July 18, 2010 circgenetics.ahajournals.org
Dow
nloaded from
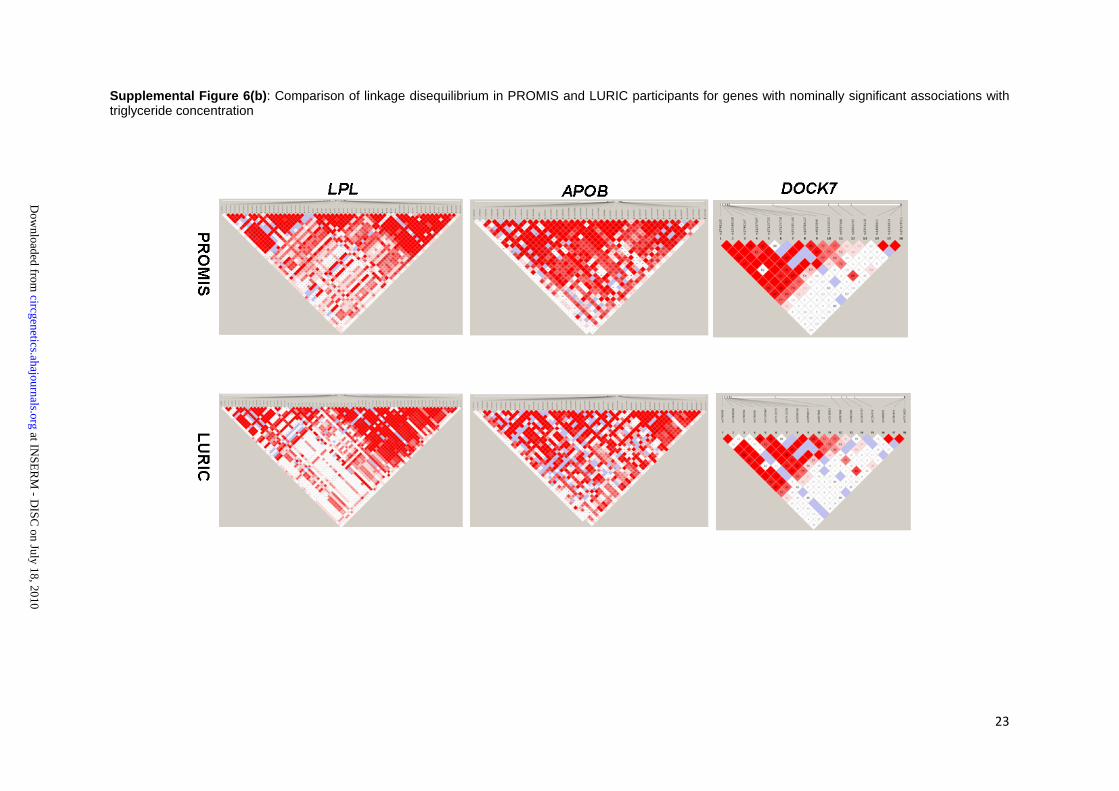
23
Supplemental Figure 6(b): Comparison of linkage disequilibrium in PROMIS and LURIC participants for genes with nominally significant associations with triglyceride concentration
at INSE
RM
- DISC
on July 18, 2010 circgenetics.ahajournals.org
Dow
nloaded from
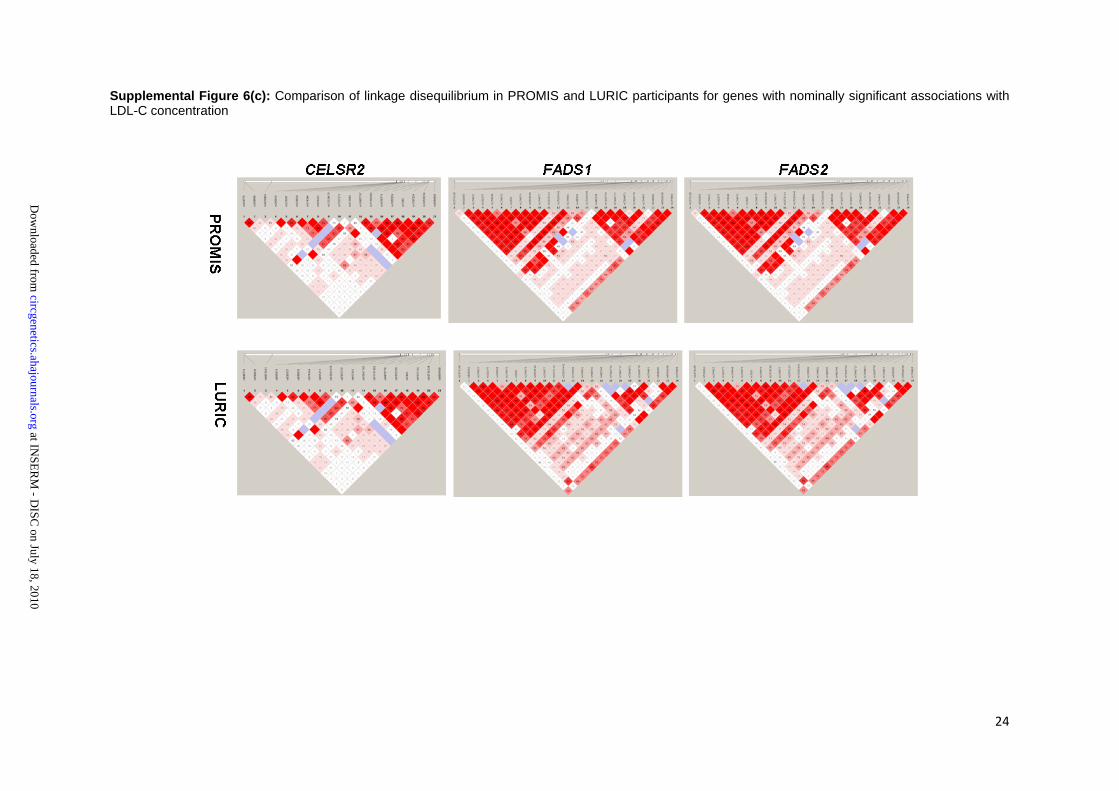
24
Supplemental Figure 6(c): Comparison of linkage disequilibrium in PROMIS and LURIC participants for genes with nominally significant associations with LDL-C concentration
at INSE
RM
- DISC
on July 18, 2010 circgenetics.ahajournals.org
Dow
nloaded from

25
Supplemental Figure 7(a): Association with MI for SNPs associated with high density cholesterol in PROMIS
rs12708967
rs11508026
rs9939224
rs255052
rs17231506
rs1800777rs5882
rs2156552
rs1864163
rs261332
rs12720922
rs11076175
rs3764261
rs5880
rs711752
rs1883025
rs1532625
rs1800775
rs7499892rs11076176
rs1800588
rs708272
rs1532624
G
A
A
A
A
AC
A
A
A
T
G
A
G
T
A
T
G
AC
T
A
T
CETP
CETP
CETP
DPEP2
CETP
CETPCETP
(intergenic)
CETP
LIPC
CETP
CETP
CETP
CETP
CETP
ABCA1
CETP
CETP
CETPCETP
LIPC
CETP
CETP
0.98 (0.86, 1.09)
0.98 (0.88, 1.07)
0.97 (0.86, 1.08)
1.15 (1.03, 1.26)
0.97 (0.88, 1.07)
0.93 (0.69, 1.17)0.97 (0.88, 1.06)
0.94 (0.81, 1.07)
0.97 (0.86, 1.08)
0.84 (0.73, 0.96)
0.97 (0.86, 1.08)
1.00 (0.88, 1.12)
0.97 (0.88, 1.07)
1.00 (0.83, 1.17)
0.99 (0.90, 1.08)
0.92 (0.83, 1.02)
0.99 (0.90, 1.09)
0.97 (0.87, 1.06)
1.01 (0.90, 1.12)1.00 (0.89, 1.11)
0.89 (0.78, 0.99)
0.99 (0.90, 1.08)
0.98 (0.89, 1.07)
.22
.46
.22
.2
.33
.038
.43
.14
.22
.18
.2
.19
.33
.08
.47
.35
.48
.4
.22
.21
.24
.47
.48
.65
.62
.55
.017
.6
.56
.49
.37
.57
.0049
.57
.99
.6
.97
.82
.11
.87
.49
.81
.97
.026
.86
.7
0.98 (0.86, 1.09)
0.98 (0.88, 1.07)
0.97 (0.86, 1.08)
1.15 (1.03, 1.26)
0.97 (0.88, 1.07)
0.93 (0.69, 1.17)0.97 (0.88, 1.06)
0.94 (0.81, 1.07)
0.97 (0.86, 1.08)
0.84 (0.73, 0.96)
0.97 (0.86, 1.08)
1.00 (0.88, 1.12)
0.97 (0.88, 1.07)
1.00 (0.83, 1.17)
0.99 (0.90, 1.08)
0.92 (0.83, 1.02)
0.99 (0.90, 1.09)
0.97 (0.87, 1.06)
1.01 (0.90, 1.12)1.00 (0.89, 1.11)
0.89 (0.78, 0.99)
0.99 (0.90, 1.08)
0.98 (0.89, 1.07)
.22
.46
.22
.2
.33
.038
.43
.14
.22
.18
.2
.19
.33
.08
.47
.35
.48
.4
.22
.21
.24
.47
.48
.8 1 1.2
Chromosome 15
Chromosome 16
Chromosome 18
Chromosome 9
SNP Gene OR (95% CI) P-valueMAFRisk allele
odds ratio
at INSERM - DISC on July 18, 2010 circgenetics.ahajournals.orgDownloaded from

26
Supplemental Figure 7(b): Association with MI for SNPs associated with low density cholesterol in PROMIS
Chromosome 11
rs1535
rs174570
rs102275
rs599839
Chromosome 19
rs646776
rs157580
Chromosome 1
G
T
C
G
G
G
FADS1
FADS2
FADS1
CELSR2
CELSR2
APOE
0.95 (0.83, 1.07)
1.03 (0.87, 1.19)
0.99 (0.88, 1.11)
0.87 (0.76, 0.98)
0.85 (0.75, 0.96)
0.99 (0.90, 1.09)
.17
.085
.2
.24
.24
.46
.42
.72
.93
.011
.0041
.91
0.95 (0.83, 1.07)
1.03 (0.87, 1.19)
0.99 (0.88, 1.11)
0.87 (0.76, 0.98)
0.85 (0.75, 0.96)
0.99 (0.90, 1.09)
.17
.085
.2
.24
.24
.46
.8 1 1.2 1.4
SNP Gene OR (95% CI) P-valueMAFRisk allele
odds ratio
at INSERM - DISC on July 18, 2010 circgenetics.ahajournals.orgDownloaded from
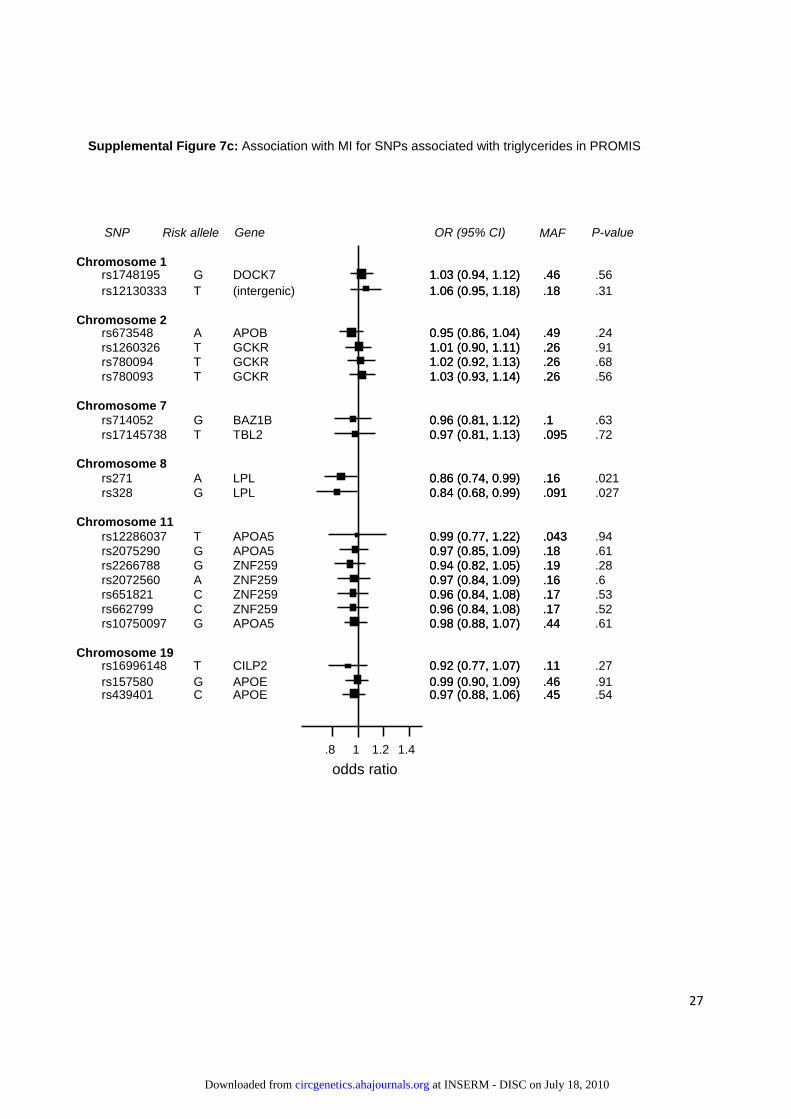
27
Supplemental Figure 7c: Association with MI for SNPs associated with triglycerides in PROMIS
rs12286037
rs1748195
rs10750097
rs157580
Chromosome 11
rs662799
Chromosome 19
rs1260326
rs16996148
Chromosome 7
rs2266788
rs271
rs780093
rs12130333
rs714052
Chromosome 8
Chromosome 2rs673548
rs2072560
Chromosome 1
rs780094
rs17145738
rs2075290
rs439401
rs651821
rs328
T
G
G
G
C
T
T
G
A
T
T
G
A
A
T
T
G
C
C
G
APOA5
DOCK7
APOA5
APOE
ZNF259
GCKR
CILP2
ZNF259
LPL
GCKR
(intergenic)
BAZ1B
APOB
ZNF259
GCKR
TBL2
APOA5
APOE
ZNF259
LPL
0.99 (0.77, 1.22)
1.03 (0.94, 1.12)
0.98 (0.88, 1.07)
0.99 (0.90, 1.09)
0.96 (0.84, 1.08)
1.01 (0.90, 1.11)
0.92 (0.77, 1.07)
0.94 (0.82, 1.05)
0.86 (0.74, 0.99)
1.03 (0.93, 1.14)
1.06 (0.95, 1.18)
0.96 (0.81, 1.12)
0.95 (0.86, 1.04)
0.97 (0.84, 1.09)
1.02 (0.92, 1.13)
0.97 (0.81, 1.13)
0.97 (0.85, 1.09)
0.97 (0.88, 1.06)
0.96 (0.84, 1.08)
0.84 (0.68, 0.99)
.043
.46
.44
.46
.17
.26
.11
.19
.16
.26
.18
.1
.49
.16
.26
.095
.18
.45
.17
.091
.94
.56
.61
.91
.52
.91
.27
.28
.021
.56
.31
.63
.24
.6
.68
.72
.61
.54
.53
.027
0.99 (0.77, 1.22)
1.03 (0.94, 1.12)
0.98 (0.88, 1.07)
0.99 (0.90, 1.09)
0.96 (0.84, 1.08)
1.01 (0.90, 1.11)
0.92 (0.77, 1.07)
0.94 (0.82, 1.05)
0.86 (0.74, 0.99)
1.03 (0.93, 1.14)
1.06 (0.95, 1.18)
0.96 (0.81, 1.12)
0.95 (0.86, 1.04)
0.97 (0.84, 1.09)
1.02 (0.92, 1.13)
0.97 (0.81, 1.13)
0.97 (0.85, 1.09)
0.97 (0.88, 1.06)
0.96 (0.84, 1.08)
0.84 (0.68, 0.99)
.043
.46
.44
.46
.17
.26
.11
.19
.16
.26
.18
.1
.49
.16
.26
.095
.18
.45
.17
.091
.8 1 1.2 1.4
SNP Gene OR (95% CI) P-valueMAFRisk allele
odds ratio
at INSERM - DISC on July 18, 2010 circgenetics.ahajournals.orgDownloaded from
28
Acknowledgements
We would like to acknowledge the contributions of the following individuals: Epidemiological fieldwork in Pakistan: Zeeshan Ozair, Fahad Shuja, Mustafa Qadir Hameed, Imad Hussain, Hamza Khalid, Ali Memon, Kamran Shahid, Ali Kazmi, Sana Nasim, Muhammad Ahsan Javed, Zahir Hussain, Kanwal Aamir, Mazhar Khan, Muhammad Zuhair Yusuf, Muhammad Zafar, Faisal Majeed, Madiha Ishaq, Turkey Hussain Marmoos, Faud Khurshid, Farhat Abdul Muntaqim, Sarosh Fatima, Rehan Ahmed, Muhammad Nabeel, Mansoor Ahmed Khokar, Syed Shazad Hussain, Madad Ali Ujjan, Parveen Sultan, Asghar Ali, Ayaz Ali, Mir Alam, Hassan Zaib, Abdul Ghafoor, Saeed Ahmed, Muhammad Riazuddin, Muhammad Irshad Javed, Jabir Furqan, Abdul Ghaffar, Muhammad Shahid, Tanveer Baig Mirza, Muhammad Naeem, Afzal Hussain, Abdul Hakeem, Zahid Hussain, Tanveer Abbas, Muhammad Khurram Shahzad, Khowaja Muhammad Shoaib, Muhammad Imran Nisar, Altaf Hussain, Waleed Kayani, Muhammad Shazad, Mehmood Jafree and Ayeesha Kamal. Laboratory assays: Asad Ali Shah, Sobia Naz, Farina Hanif, Shaheen Khanum, Aisha Nazir, Aisha Sultana, Mehwish Jabar, Zahid Hussain, Madiha Yameen, Nadir Khan, Inosh Hasan, Jonathan Stephens, Pamela Whittaker, Radhi Ravindrarajah, Owen T McCann and the personnel of the WTSI Genotyping Facility Jackie Bryant, Sarah L. Clark, Jen S. Conquer, Thomas Dibling, Stephen Gamble, Clifford Hind, Michelle Ricketts, Claire R. Stribling, Sam Taylor, Alicja Wilk, Julia C. Wyatt, Silvia Behaim, Ursula Discher, Isolde Friedrich, Brigitte Haas, Gaby Herr and Brigitte Kreisel. Data management: Sarfaraz Sher Ali, Touqeer Ahmed, Fariha Nadeem, Matthew Walker, Sarah Watson and Mohammed J.R. Ghori. Epidemiological/statistical support: Nilesh Samani and Kausik Ray. Administration: Kashif Saleheen and Hannah Sneath.
at INSERM - DISC on July 18, 2010 circgenetics.ahajournals.orgDownloaded from


![[Cool] Gas Chromatography and Lipids](https://static.fdokumen.com/doc/165x107/6325a4b1852a7313b70e98e9/cool-gas-chromatography-and-lipids.jpg)