Association of the 9p21.3 Locus With Risk of First-Ever Myocardial Infarction in Pakistanis:...
32
ISSN: 1524-4636 Copyright © 2010 American Heart Association. All rights reserved. Print ISSN: 1079-5642. Online 7272 Greenville Avenue, Dallas, TX 72514 Arteriosclerosis, Thrombosis, and Vascular Biology is published by the American Heart Association. DOI: 10.1161/ATVBAHA.109.197210 published online Apr 15, 2010; Arterioscler Thromb Vasc Biol Danesh Muhammad Fahim, Muhammad Ishaq, Philippe Frossard, Panos Deloukas and John Shahid, Zehra Memon, Shahzad Majeed Bhatti, Waleed Kayani, Syed Saadat Ali, Salman Daood, Fatima Memon, Aftab Alam Gul, Shahid Abbas, Junaid Zafar, Faisal Mustafa Hussain, Kishore Kumar, Asim Saleem, Kishwar Kumar, Muhammad Cheema, Nadeem Qamar, Azhar Faruqui, Rashid Jooma, Jawaid Hassan Niazi, Fazal-ur-Rehman, Khan Shah Zaman, Assadullah Kundi, Zia Yaqoob, Liaquat Ali Syed Zahed Rasheed, Ali Raza Gardezi, Nazir Ahmed Memon, Abdul Ghaffar, Muhammad Ali Memon, Nadeem Hayat Mallick, Muhammad Azhar, Abdus Samad, Sheikh, Shajjia Razi Haider, Muhammed Murtaza, Usman Ahmad, Abdul Hakeem, Angelantonio, Stephen Kaptoge, Nabi Shah, Maria Samuel, Ahmedyar Janjua, Nasir Bumpstead, Simon Potter, Hannah Blackburn, Emma Gray, Emanuele Di Naomi Hammond, Adam Butterworth, Moazzam Zaidi, Philip Haycock, Suzannah Danish Saleheen, Myriam Alexander, Asif Rasheed, David Wormser, Nicole Soranzo, Pakistanis Association of the 9p21.3 Locus With Risk of First-Ever Myocardial Infarction in http://www.lww.com/reprints Reprints: Information about reprints can be found online at [email protected] 410-528-8550. E-mail: Fax: Kluwer Health, 351 West Camden Street, Baltimore, MD 21202-2436. Phone: 410-528-4050. Permissions: Permissions & Rights Desk, Lippincott Williams & Wilkins, a division of Wolters http://atvb.ahajournals.org/subscriptions/ Biology is online at Subscriptions: Information about subscribing to Arteriosclerosis, Thrombosis, and Vascular by on May 15, 2011 atvb.ahajournals.org Downloaded from
-
Upload
independent -
Category
Documents
-
view
1 -
download
0
Transcript of Association of the 9p21.3 Locus With Risk of First-Ever Myocardial Infarction in Pakistanis:...
ISSN: 1524-4636 Copyright © 2010 American Heart Association. All rights reserved. Print ISSN: 1079-5642. Online
7272 Greenville Avenue, Dallas, TX 72514Arteriosclerosis, Thrombosis, and Vascular Biology is published by the American Heart Association.
DOI: 10.1161/ATVBAHA.109.197210 published online Apr 15, 2010; Arterioscler Thromb Vasc Biol
Danesh Muhammad Fahim, Muhammad Ishaq, Philippe Frossard, Panos Deloukas and JohnShahid, Zehra Memon, Shahzad Majeed Bhatti, Waleed Kayani, Syed Saadat Ali,
Salman Daood, Fatima Memon, Aftab Alam Gul, Shahid Abbas, Junaid Zafar, FaisalMustafa Hussain, Kishore Kumar, Asim Saleem, Kishwar Kumar, Muhammad Cheema, Nadeem Qamar, Azhar Faruqui, Rashid Jooma, Jawaid Hassan Niazi,
Fazal-ur-Rehman, Khan Shah Zaman, Assadullah Kundi, Zia Yaqoob, Liaquat Ali Syed Zahed Rasheed, Ali Raza Gardezi, Nazir Ahmed Memon, Abdul Ghaffar,
Muhammad Ali Memon, Nadeem Hayat Mallick, Muhammad Azhar, Abdus Samad, Sheikh, Shajjia Razi Haider, Muhammed Murtaza, Usman Ahmad, Abdul Hakeem,Angelantonio, Stephen Kaptoge, Nabi Shah, Maria Samuel, Ahmedyar Janjua, Nasir
Bumpstead, Simon Potter, Hannah Blackburn, Emma Gray, Emanuele DiNaomi Hammond, Adam Butterworth, Moazzam Zaidi, Philip Haycock, Suzannah
Danish Saleheen, Myriam Alexander, Asif Rasheed, David Wormser, Nicole Soranzo,Pakistanis
Association of the 9p21.3 Locus With Risk of First-Ever Myocardial Infarction in
http://www.lww.com/reprintsReprints: Information about reprints can be found online at
[email protected]. E-mail:
Fax:Kluwer Health, 351 West Camden Street, Baltimore, MD 21202-2436. Phone: 410-528-4050. Permissions: Permissions & Rights Desk, Lippincott Williams & Wilkins, a division of Wolters
http://atvb.ahajournals.org/subscriptions/Biology is online at Subscriptions: Information about subscribing to Arteriosclerosis, Thrombosis, and Vascular
by on May 15, 2011 atvb.ahajournals.orgDownloaded from

http://atvb.ahajournals.org/cgi/content/full/ATVBAHA.109.197210/DC1Data Supplement (unedited) at:
http://atvb.ahajournals.org
located on the World Wide Web at: The online version of this article, along with updated information and services, is
http://www.lww.com/reprintsReprints: Information about reprints can be found online at
[email protected]. E-mail:
Fax:Kluwer Health, 351 West Camden Street, Baltimore, MD 21202-2436. Phone: 410-528-4050. Permissions: Permissions & Rights Desk, Lippincott Williams & Wilkins, a division of Wolters
http://atvb.ahajournals.org/subscriptions/Biology is online at Subscriptions: Information about subscribing to Arteriosclerosis, Thrombosis, and Vascular
by on May 15, 2011 atvb.ahajournals.orgDownloaded from
Association of the 9p21.3 Locus With Risk of First-EverMyocardial Infarction in Pakistanis
Danish Saleheen, Myriam Alexander, Asif Rasheed, David Wormser, Nicole Soranzo, Naomi Hammond,Adam Butterworth, Moazzam Zaidi, Philip Haycock, Suzannah Bumpstead, Simon Potter, Hannah Blackburn,
Emma Gray, Emanuele Di Angelantonio, Stephen Kaptoge, Nabi Shah, Maria Samuel, Ahmedyar Janjua,Nasir Sheikh, Shajjia Razi Haider, Muhammed Murtaza, Usman Ahmad, Abdul Hakeem,
Muhammad Ali Memon, Nadeem Hayat Mallick, Muhammad Azhar, Abdus Samad, Syed Zahed Rasheed,Ali Raza Gardezi, Nazir Ahmed Memon, Abdul Ghaffar, Fazal-ur-Rehman, Khan Shah Zaman,
Assadullah Kundi, Zia Yaqoob, Liaquat Ali Cheema, Nadeem Qamar, Azhar Faruqui, Rashid Jooma,Jawaid Hassan Niazi, Mustafa Hussain, Kishore Kumar, Asim Saleem, Kishwar Kumar,
Muhammad Salman Daood, Fatima Memon, Aftab Alam Gul, Shahid Abbas, Junaid Zafar, Faisal Shahid,Zehra Memon, Shahzad Majeed Bhatti, Waleed Kayani, Syed Saadat Ali, Muhammad Fahim, Muhammad Ishaq,
Philippe Frossard, Panos Deloukas, John Danesh
Objective—To examine variants at the 9p21 locus in a case-control study of acute myocardial infarction (MI) in Pakistanis andto perform an updated meta-analysis of published studies in people of European ancestry to help contextualize these data.
Methods and Results—A total of 1851 patients with first-ever confirmed MI and 1903 controls were genotyped for 89 taggingsingle-nucleotide polymorphisms at locus 9p21, including the lead variant (rs1333049) identified by the Wellcome Trust CaseControl Consortium. Minor allele frequencies and extent of linkage disequilibrium observed in Pakistanis were broadly similarto those seen in Europeans. In the Pakistani study, 6 variants were associated with MI (P�10�2) in the initial sample set, andin an additional 741 cases and 674 controls in whom further genotyping was performed for these variants. For Pakistanis, theodds ratio for MI was 1.13 (95% CI, 1.05 to 1.22; P�2�10�3) for each copy of the C allele at rs1333049. In comparison,a meta-analysis of studies in Europeans yielded a higher odds ratio of 1.31 (95% CI, 1.26 to 1.37) for the same variant(P�1�10�3 for heterogeneity). Meta-analyses of 23 variants, in up to 38 250 cases and 84 820 controls, quantified the oddsratios for coronary artery disease, generally yielding higher values in Europeans than in Pakistanis.
Conclusion—To our knowledge, this study provided the first demonstration that variants at the 9p21 locus are significantlyassociated with MI risk in Pakistanis. However, association signals at this locus were considerably weaker in Pakistanisthan those previously reported in Europeans. (Arterioscler Thromb Vasc Biol. 2010;30:00-00.)
Key Words: myocardial infarction � 9p21 � Pakistanis � risk factor � South Asia
Variants at the 9p21.3 locus have been established asamong the strongest common genetic factors associated
with the risk of coronary artery disease (CAD) in people ofEuropean continental ancestry.1–5 These variants are in high-linkage disequilibrium (LD) and span a 58-kb region that hasmultiple neighboring genes (CDKN2A, CDNK2B, and
MTAP), without annotating to any single protein codingsequence.5 An RNA coding gene, ANRIL, that overlaps withthe risk locus associated with CAD has been identified,suggesting a regulatory role in gene expression.6 Althoughassociations of variants at 9p21.3 with CAD have beenestablished in several non-European populations (eg, East
Received on: September 21, 2009; final version accepted on: March 31, 2010.From the Center for Non-Communicable Diseases (D.S., A.R., M.Z., N.S., M.S., A.J., S.R.H., M.M., U.A., A.H., M.A.M., M.H., K.K., A.S., K.K., M.S.D.,
F.M., A.A.G., S.A., J.Z., F.S., Z.M., S.M.B., W.K., S.S.A., M.F., and P.F.), Karachi, Pakistan; the Department of Public Health and Primary Care(D.S., M.A., D.W., A.B., P.H., E.D.A., S.K., N.S., and J.D.), University of Cambridge, Cambridge, England; the Wellcome Trust Sanger Institute (N.S.,N.H., S.B., S.P., H.B., E.G., and P.D.), Cambridge; the Department of Twin Research and Genetic Epidemiology (N.S.), King’s College London, StThomas’ Hospital Campus, London, England; the Punjab Institute of Cardiology (N.H.M. and M.A.), Lahore, Pakistan; the Karachi Institute of HeartDiseases (A.S., S.Z.R., and M.I.), Karachi; the Ch. Perwaiz Elahi Institute of Cardiology (A.R.G.), Multan, Pakistan; the Deewan Mushtaq CCU (N.A.M.and A.G.), Liaquat University of Medical and Health Sciences, Civil Hospital; the Red Crescent Institute of Cardiology (F.-u.-R.,), Hyderabad, Pakistan;the National Institute of Cardiovascular Diseases (K.S.Z., A.K., Z.Y., L.A.C., N.Q., and A.F.), Karachi; and the Jinnah Post-graduate Medical Centre (R.J.and J.H.N.), Karachi.
Drs Saleheen and Alexander contributed equally to this work; and Drs Deloukas and Danesh contributed equally to this work.Correspondence to Danish Saleheen, Center for Non-Communicable Diseases, Karachi, Pakistan & Department of Public Health and Primary Care
University of Cambridge Strangeways Research Laboratory Cambridge CB1 8RN, England. E-mail [email protected], [email protected], or [email protected]
© 2010 American Heart Association, Inc.
Arterioscler Thromb Vasc Biol is available at http://atvb.ahajournals.org DOI: 10.1161/ATVBAHA.109.197210
1 by on May 15, 2011 atvb.ahajournals.orgDownloaded from
Asians), they have not been well studied in South Asians,populations at high risk of vascular disease.7
To our knowledge, we report the first large-scale study ofvariants at the 9p21 locus in relation to risk of acutemyocardial infarction (MI) in Pakistanis. This study involved1851 patients with confirmed diagnoses of first-ever MI and1903 control subjects from the Pakistan Risk of MyocardialInfarction Study8 (PROMIS). Genotyping involved 89 taggingsingle-nucleotide polymorphisms (SNPs) at the 9p21.3 locus,including the lead variant (rs1333049) identified by the Well-come Trust Case Control Consortium in association with MI.1,2
To place our findings in context, we also report a literature-basedmeta-analysis of relevant studies, encompassing information on23 variants at the 9p21 locus in up to 38 250 CAD cases and84 820 controls. The current meta-analysis substantially updatesa previous relevant review,5 involving data from an additional82 117 participants and 20 additional variants.
MethodsStudy DesignThis article follows the reporting recommendations of STrengtheningthe REporting of Genetic Association studies.9 PROMIS is a case-control study of acute first-ever MI in urban Pakistan.8 Patients with MIexperienced the following: (1) symptoms within 24 hours of hospitalpresentation, (2) typical ECG characteristics (eg, �1-mm ST elevationin any �2 contiguous limb leads and new-onset left bundle branchblock), and (3) a positive troponin test result (�1 ng/mL). Controls wereindividuals without a history of cardiovascular disease frequency,matched to cases by sex and age in 5-year age bands, and concurrentlyidentified in the same hospitals as the index cases by virtue of being thefollowing: (1) visitors of patients attending the outpatient department,(2) patients attending the outpatient department for routine noncardiaccomplaints, or (3) non–blood-related visitors of index MI cases.Controls with recent illnesses or infections were excluded. A locallypiloted and validated epidemiological questionnaire was administered toparticipants by medically qualified research officers that sought morethan 200 items of information in relation to ethnicity, demographiccharacteristics, lifestyle factors (eg, tobacco and alcohol consumption,dietary intake, and physical activity), personal and family history ofcardiovascular disease, and medication use. Nonfasting blood sampleswere drawn from each participant and centrifuged within 45 minutes ofvenipuncture. Samples were stored at �80°C. The study has receivedapproval from relevant institutional review boards in each recruitmentcenter and the Center for Non-Communicable Diseases, Karachi,Pakistan. Informed consent was obtained from all the participants(including consent to use samples in genetic, biochemical, and otheranalyses).
GenotypingDNA was extracted from leukocytes using a reference phenol-chloroform protocol.8 Genotyping was performed at the WellcomeTrust Sanger Institute, Cambridge, England. To minimize anysystematic biases arising from plate- or batch-specific genotypingerror, genotyping plates contained a mixture of cases and controls,including negative and positive controls. A total of 1851 cases and1903 controls were genotyped using version 1 of the IBC array of�2000 candidate genes; 169 SNPs tagged the 9p21.3 locus at r2�0.8and were available in the current analyses. This array used acosmopolitan tagging approach, using information from the Hap MapCaucasian (CEU), East Asian (Han Chinese and Japanese), and African(Yoruba) populations.10 SNPs were excluded if (1) the call rate was lessthan 95% (2 SNPs), (2) there was evidence of departure from theHardy-Weinberg equilibrium in controls at P�0.05 (17 SNPs), or (3)the minor allele frequency was less than 1% (63 SNPs), with most ofsuch omissions being the result of SNPs relevant for Africans beingmonomorphic in Pakistanis. Seven individuals were excluded because
the self-reported sex did not match chromosomal sex status or there wasevidence of cryptic relatedness or more than 2% missing genotypes.After such quality control, 89 SNPs remained. The 6 SNPs mostsignificantly associated with MI risk were genotyped in a further 741cases and 674 controls (iPLEX: Sequenom).
Statistical AnalysisAnalyses involved PLINK 1.0611 and STATA, version 10.0 (Stata-Corp). Assuming an additive model, associations with each SNP weretested fitting a logistic regression model, adjusted for age, sex, and thefirst 2 principal components (calculated using all 45 000 SNPs geno-typed in the array, as previously described).1,12 Effect modification wasinvestigated by tests of interaction in fully adjusted models. LD wasassessed using Haploview, with blocks graphically identified from theLD intensity expressed in D’.13 Haplotype association analyses wereperformed with THESIAS software implementing the Stochastic-EMalgorithm,14 enabling simultaneous estimation of haplotype frequenciesand their effects on MI, again assuming additive effects. By using aparsimonious approach, the most informative tagging SNPs werechosen for haplotype analyses that accounted for at least 85% of thehaplotypic block variability.15 To compare LD patterns in Pakistaniswith those in other ethnic groups, data were downloaded from theHapMap Web site for whites, East Asians (Han Chinese and Japanese),and Africans (Yoruba); and drawn using Haploview.13
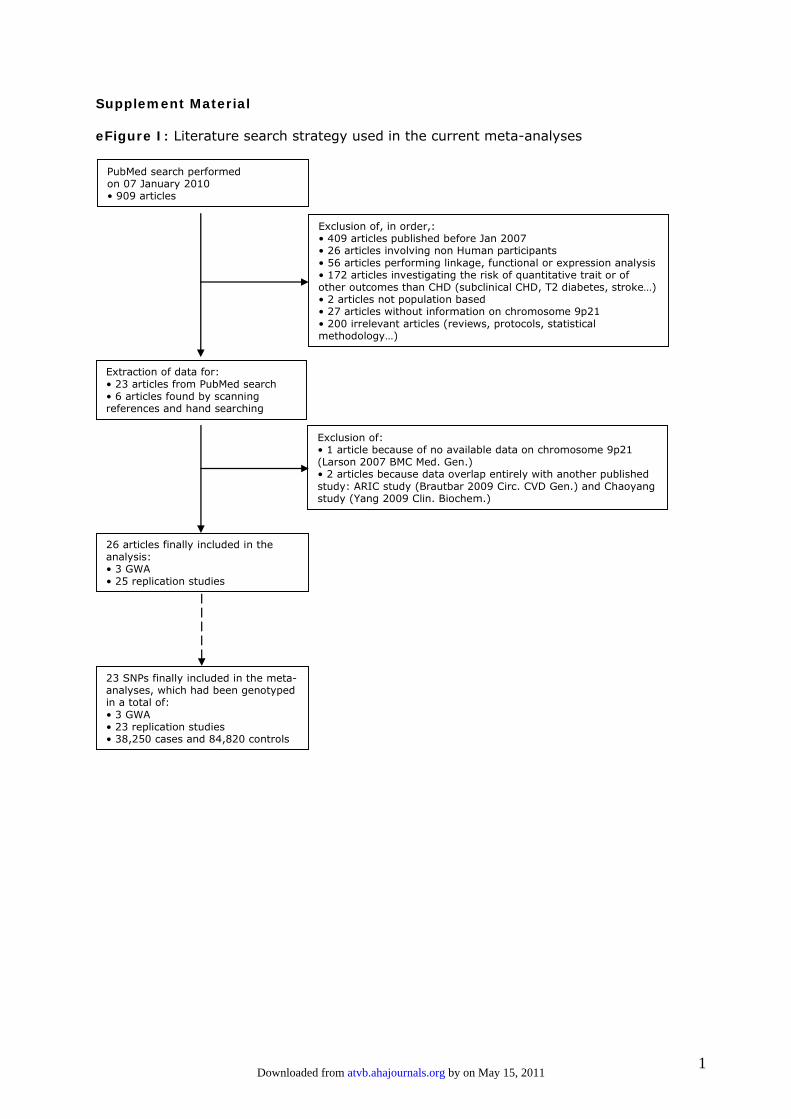
Systematic ReviewWe sought studies reporting on associations between variants at the9p21 locus and risk of CAD before January 2010 (supplementalFigure 1; available online at http://atvb.ahajournals.org). Electronicsearches, not limited to the English language, used the MEDLINEdatabase and involved search terms related to the locus (eg, chro-
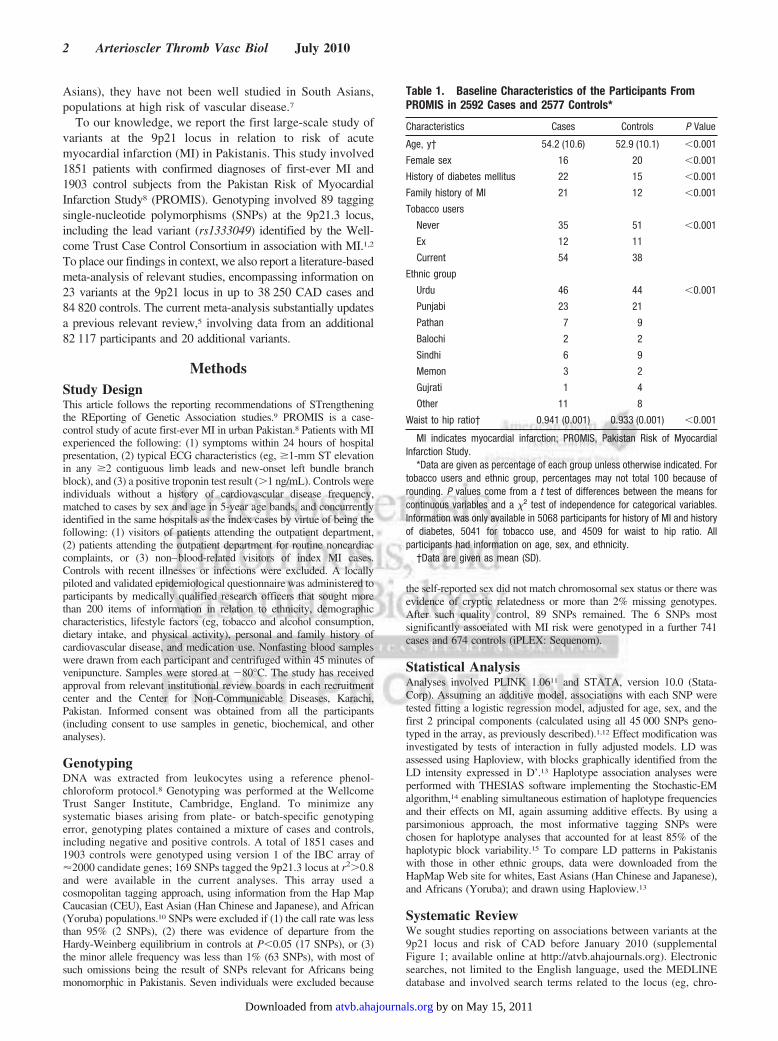
Table 1. Baseline Characteristics of the Participants FromPROMIS in 2592 Cases and 2577 Controls*
Characteristics Cases Controls P Value
Age, y† 54.2 (10.6) 52.9 (10.1) �0.001
Female sex 16 20 �0.001
History of diabetes mellitus 22 15 �0.001
Family history of MI 21 12 �0.001
Tobacco users
Never 35 51 �0.001
Ex 12 11
Current 54 38
Ethnic group
Urdu 46 44 �0.001
Punjabi 23 21
Pathan 7 9
Balochi 2 2
Sindhi 6 9
Memon 3 2
Gujrati 1 4
Other 11 8
Waist to hip ratio† 0.941 (0.001) 0.933 (0.001) �0.001
MI indicates myocardial infarction; PROMIS, Pakistan Risk of MyocardialInfarction Study.
*Data are given as percentage of each group unless otherwise indicated. Fortobacco users and ethnic group, percentages may not total 100 because ofrounding. P values come from a t test of differences between the means forcontinuous variables and a �2 test of independence for categorical variables.Information was only available in 5068 participants for history of MI and historyof diabetes, 5041 for tobacco use, and 4509 for waist to hip ratio. Allparticipants had information on age, sex, and ethnicity.
†Data are given as mean (SD).
2 Arterioscler Thromb Vasc Biol July 2010
by on May 15, 2011 atvb.ahajournals.orgDownloaded from

mosome 9, CDKN2A, CDNK2B, MTAP, ANRIL, and the rs numbersof variants previously reported) and coronary artery disease (eg,coronary heart disease, myocardial infarction, atherosclerosis, andcoronary stenosis). These searches were supplemented by scanningreference lists, hand searching relevant journals, and talking withauthors. Two investigators independently extracted the following infor-mation: genotype frequencies, unadjusted additive odds ratios, ethnicity,geographical location, CAD definition, study type (eg, genomewideassociation or candidate replication study), genotyping platform, studydesign, and source of controls. Additive odds ratios were computed foreach study using genotype counts and were compared with reportedodds ratios, when available. For prospective cohorts, hazard ratios wereassumed to approximate odds ratios. Summary odds ratios and 95% CIsfor each SNP were calculated by fitting a random-effects model thatincluded between-study heterogeneity. Heterogeneity was assessed bythe I2 statistic16 and the Q statistic and investigated by prespecifiedstudy-level characteristics, notably study size, case definition, studydesign, and genotyping platform used.
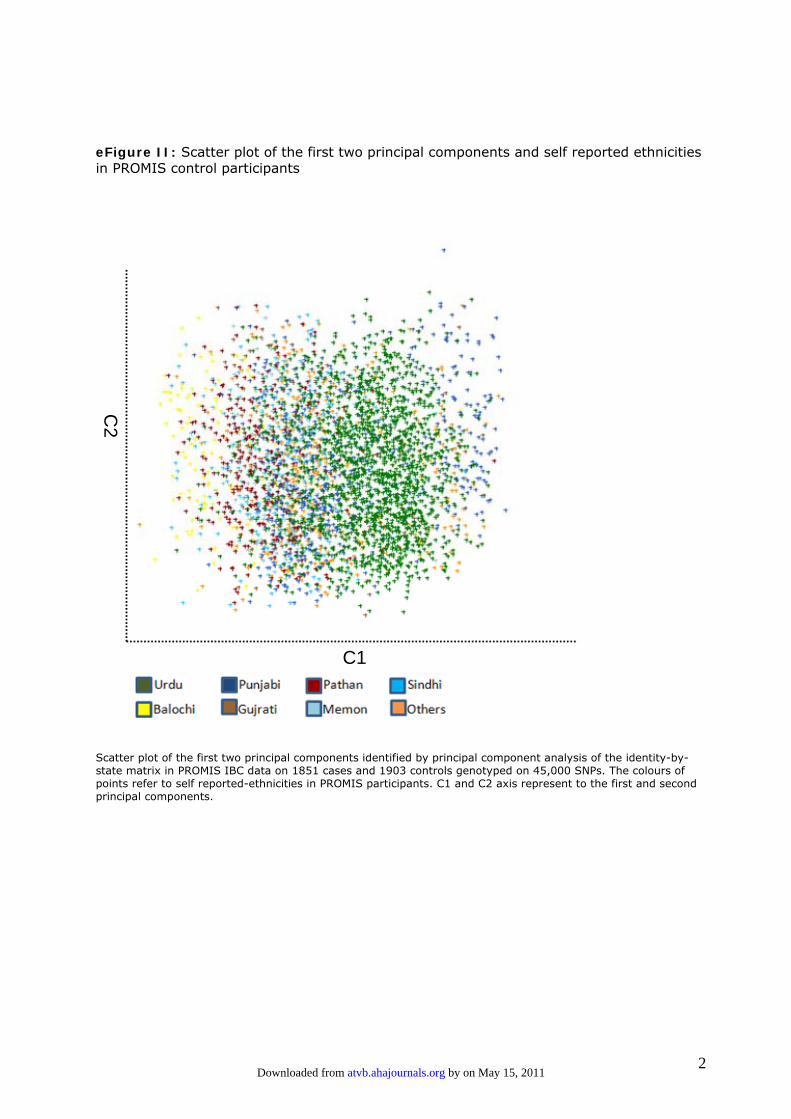
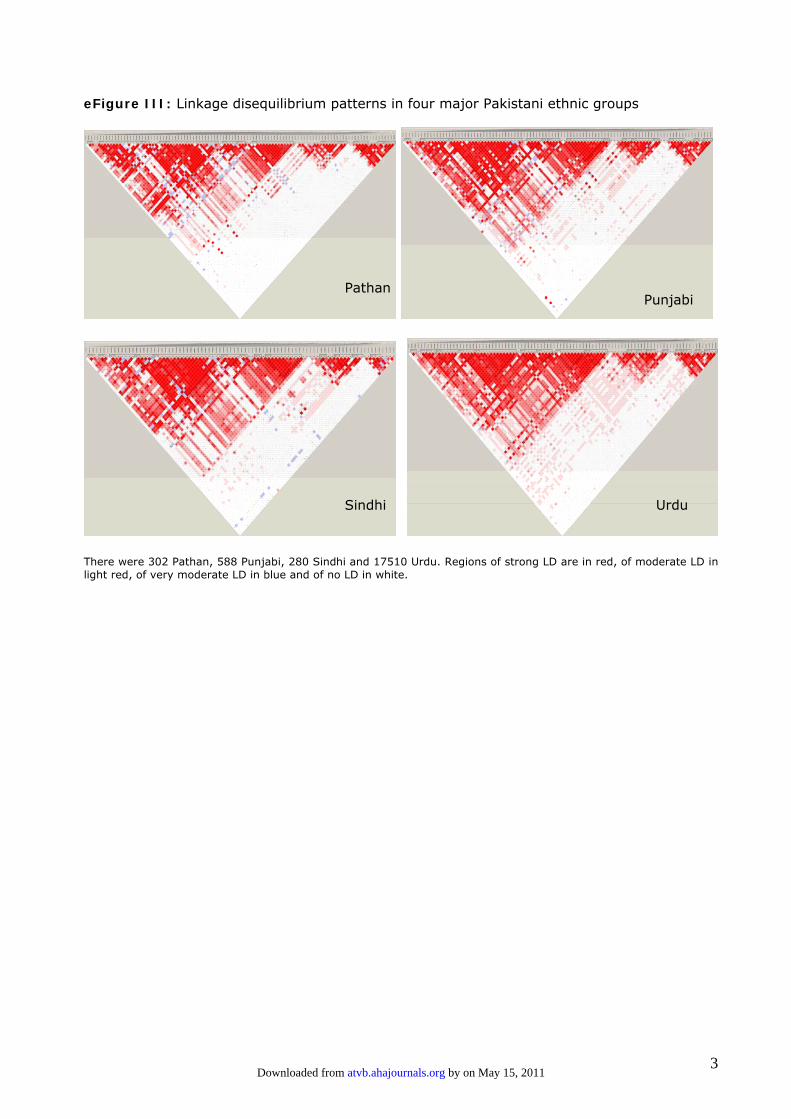
ResultsAnalyses in PakistanisAs would be expected, baseline levels of conventional riskfactors were significantly higher in MI cases than controls(Table 1). Genetic similarity did not correlate strongly withself-reported ethnicity among the 8 ethnic and linguistic groupsstudied in PROMIS (supplemental Figure 2), and LD patterns atthe 9p21 locus were similar among the 4 major Pakistanisubethnicities (supplemental Figure 3). Of the 89 relevant SNPsassessed, 6 were associated with MI at P�10�2 (Figure 1 andsupplemental Table 1), including the lead variant (rs1333049)identified by the Wellcome Trust Case Control Consortium.1
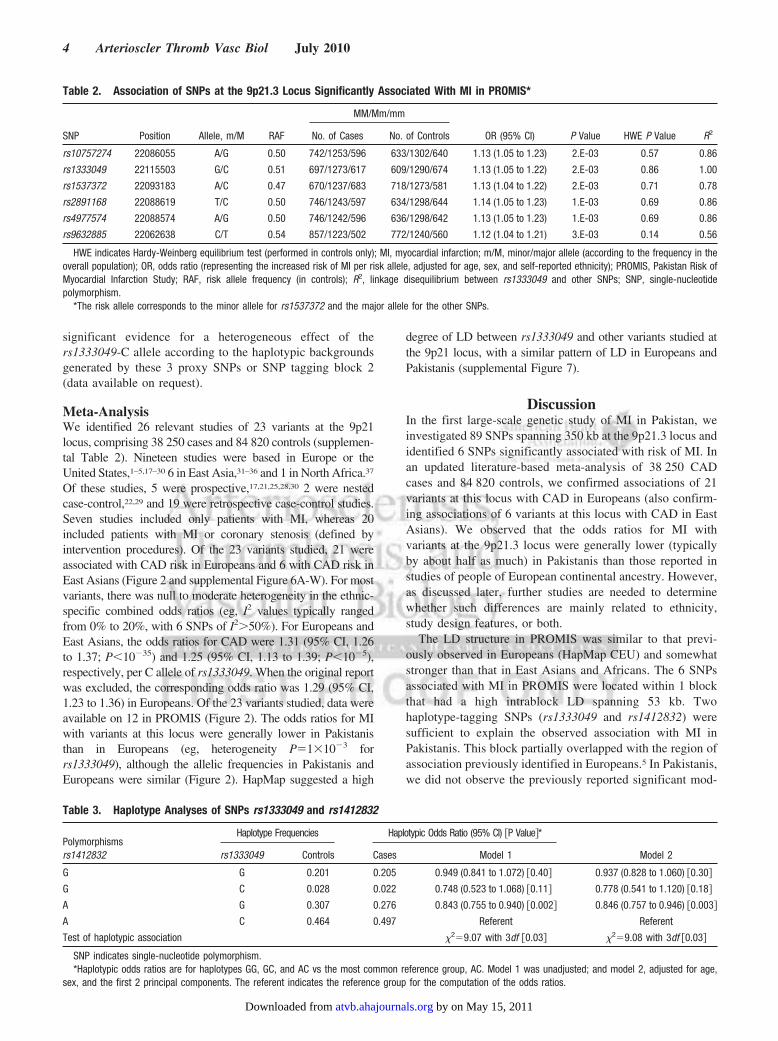
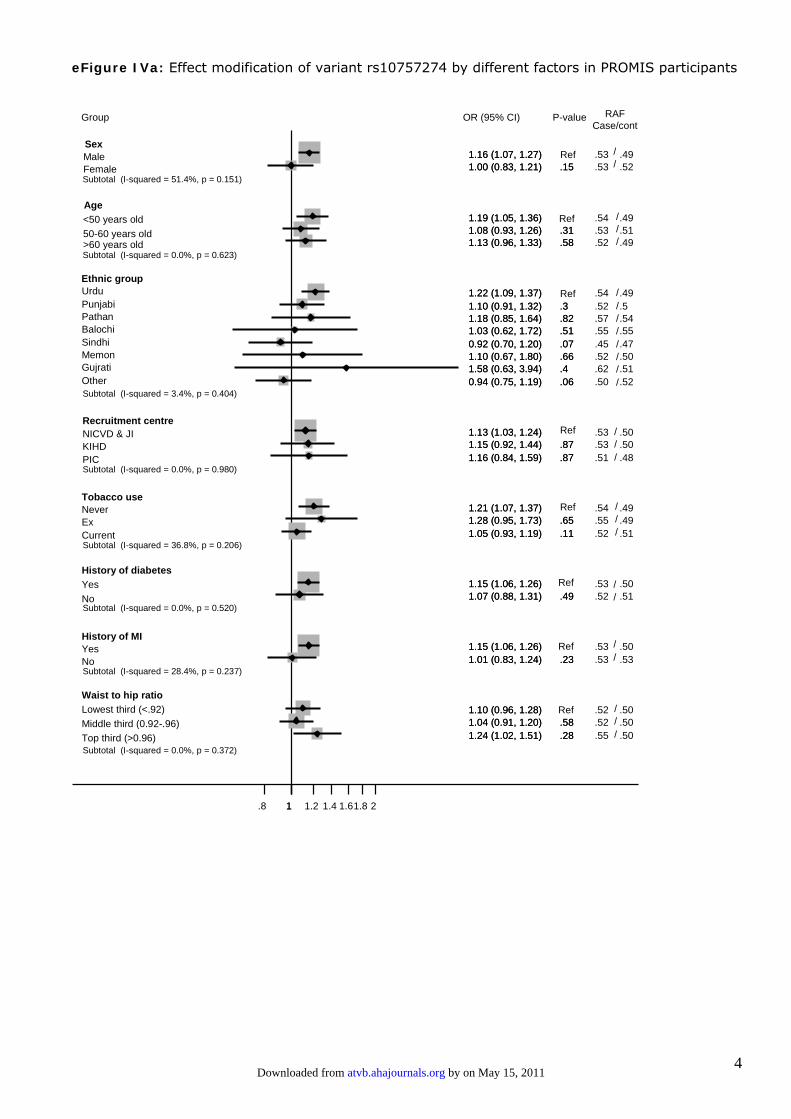
The odds ratios for MI with each of these 6 SNPs were �1.13(P�10�3 for each) (Table 2). In the case of rs1333049, the oddsratio for MI was 1.12 (95% CI, 1.04 to 1.20; P�2�10�3) per Callele. The odds ratios for MI were not significantly differentunder a range of circumstances (supplemental Figure 4A-F),although there was limited power to evaluate the potential effectmodification (eg, it was not possible to confirm or refute thepossible differences noted in men and women and betweenethnic groups for some SNPs).
There were 5 distinct LD blocks at the 9p21 locus inPakistanis, each having strong intrablock LD (supplementalFigure 5). All 6 variants and haplotypes associated with MI werelocated within block 3. By using a parsimonious model, haplo-typic associations observed in block 3 could be explained byonly 2 tagging SNPs (rs1412832 and rs1333049) (Table 3).Haplotype analyses involving these 2 tagging SNPs generated 4haplotypes, each with a frequency of greater than 2%, and theglobal test of association with MI was significant (P�0.03). Theodds ratio for MI with the AG haplotype was 0.85 (95% CI, 0.76to 0.95; P�0.003) compared with the most frequent AChaplotype.
Three SNPs (rs7865618, rs1292136, and rs7044859) lo-cated in the genomic region of block 2 previously modulatedthe effect of SNP rs1333049 on the risk of MI in Europeans,with the 2 most frequent haplotypes being in “yin yang.”5 Toevaluate these findings in Pakistanis, we analyzed proxySNPs (rs518394, rs10965212, and rs7049105) based on theHapMap CEU data (0.69�r2�0.90). We did not find any
Figure 1. Association of variants at the 9p21.3locus with MI in PROMIS participants. A, Regionalplot of association for all the 89 variants at the9p21.3 locus genotyped in PROMIS participants(1851 cases and 1903 controls) based on r2 valuesbetween SNPs and rs1333049. The dotted lineindicates the nominal threshold of significance(P�10�2). The association of SNPs with MI wastested using an additive model, adjusting for age,sex, and the first 2 principal components. Geneinformation was downloaded from http://www.ucsc.edu. B, LD plot in PROMIS participants forthe region highlighted in A. Values within eachsquare are pairwise r2 estimates. SNPs associatedwith MI are highlighted in black boxes, and thetagging SNPs selected for haplotype analyses arehighlighted in blue.
Saleheen et al 9p21.3 Locus and Myocardial Infarction in Pakistanis 3
by on May 15, 2011 atvb.ahajournals.orgDownloaded from
significant evidence for a heterogeneous effect of thers1333049-C allele according to the haplotypic backgroundsgenerated by these 3 proxy SNPs or SNP tagging block 2(data available on request).
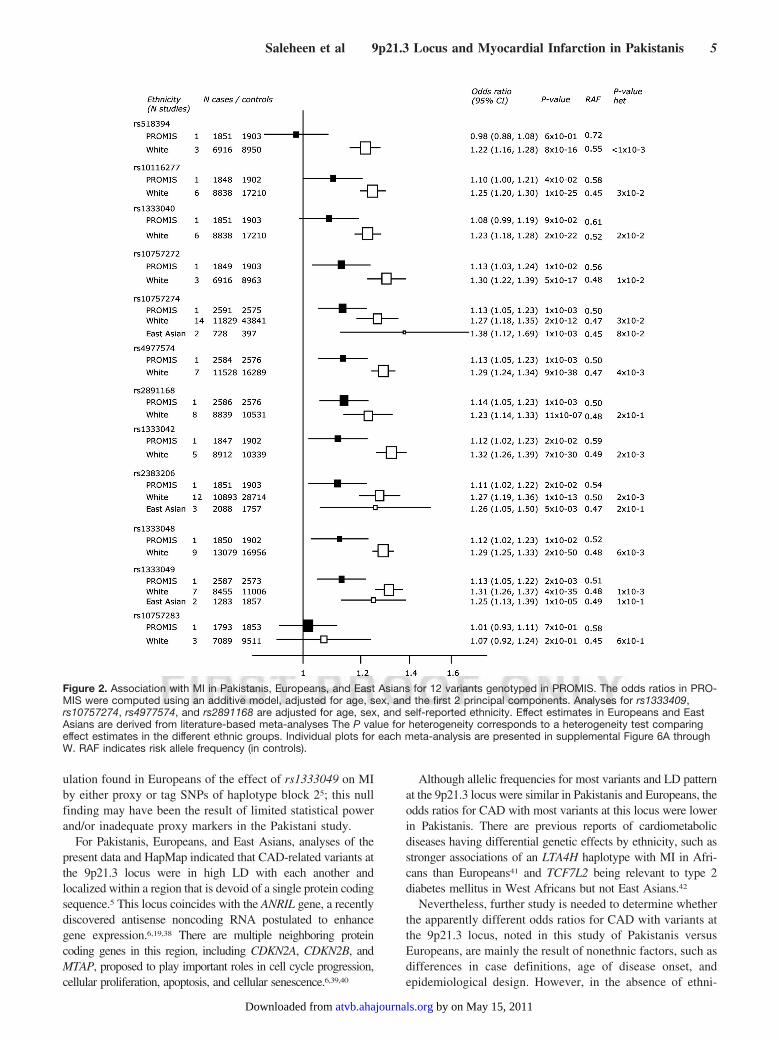
Meta-AnalysisWe identified 26 relevant studies of 23 variants at the 9p21locus, comprising 38 250 cases and 84 820 controls (supplemen-tal Table 2). Nineteen studies were based in Europe or theUnited States,1–5,17–30 6 in East Asia,31–36 and 1 in North Africa.37
Of these studies, 5 were prospective,17,21,25,28,30 2 were nestedcase-control,22,29 and 19 were retrospective case-control studies.Seven studies included only patients with MI, whereas 20included patients with MI or coronary stenosis (defined byintervention procedures). Of the 23 variants studied, 21 wereassociated with CAD risk in Europeans and 6 with CAD risk inEast Asians (Figure 2 and supplemental Figure 6A-W). For mostvariants, there was null to moderate heterogeneity in the ethnic-specific combined odds ratios (eg, I2 values typically rangedfrom 0% to 20%, with 6 SNPs of I2�50%). For Europeans andEast Asians, the odds ratios for CAD were 1.31 (95% CI, 1.26to 1.37; P�10�35) and 1.25 (95% CI, 1.13 to 1.39; P�10�5),respectively, per C allele of rs1333049. When the original reportwas excluded, the corresponding odds ratio was 1.29 (95% CI,1.23 to 1.36) in Europeans. Of the 23 variants studied, data wereavailable on 12 in PROMIS (Figure 2). The odds ratios for MIwith variants at this locus were generally lower in Pakistanisthan in Europeans (eg, heterogeneity P�1�10�3 forrs1333049), although the allelic frequencies in Pakistanis andEuropeans were similar (Figure 2). HapMap suggested a high
degree of LD between rs1333049 and other variants studied atthe 9p21 locus, with a similar pattern of LD in Europeans andPakistanis (supplemental Figure 7).
DiscussionIn the first large-scale genetic study of MI in Pakistan, weinvestigated 89 SNPs spanning 350 kb at the 9p21.3 locus andidentified 6 SNPs significantly associated with risk of MI. Inan updated literature-based meta-analysis of 38 250 CADcases and 84 820 controls, we confirmed associations of 21variants at this locus with CAD in Europeans (also confirm-ing associations of 6 variants at this locus with CAD in EastAsians). We observed that the odds ratios for MI withvariants at the 9p21.3 locus were generally lower (typicallyby about half as much) in Pakistanis than those reported instudies of people of European continental ancestry. However,as discussed later, further studies are needed to determinewhether such differences are mainly related to ethnicity,study design features, or both.
The LD structure in PROMIS was similar to that previ-ously observed in Europeans (HapMap CEU) and somewhatstronger than that in East Asians and Africans. The 6 SNPsassociated with MI in PROMIS were located within 1 blockthat had a high intrablock LD spanning 53 kb. Twohaplotype-tagging SNPs (rs1333049 and rs1412832) weresufficient to explain the observed association with MI inPakistanis. This block partially overlapped with the region ofassociation previously identified in Europeans.5 In Pakistanis,we did not observe the previously reported significant mod-
Table 2. Association of SNPs at the 9p21.3 Locus Significantly Associated With MI in PROMIS*
SNP Position Allele, m/M RAF
MM/Mm/mm
OR (95% CI) P Value HWE P Value R2No. of Cases No. of Controls
rs10757274 22086055 A/G 0.50 742/1253/596 633/1302/640 1.13 (1.05 to 1.23) 2.E-03 0.57 0.86
rs1333049 22115503 G/C 0.51 697/1273/617 609/1290/674 1.13 (1.05 to 1.22) 2.E-03 0.86 1.00
rs1537372 22093183 A/C 0.47 670/1237/683 718/1273/581 1.13 (1.04 to 1.22) 2.E-03 0.71 0.78
rs2891168 22088619 T/C 0.50 746/1243/597 634/1298/644 1.14 (1.05 to 1.23) 1.E-03 0.69 0.86
rs4977574 22088574 A/G 0.50 746/1242/596 636/1298/642 1.13 (1.05 to 1.23) 1.E-03 0.69 0.86
rs9632885 22062638 C/T 0.54 857/1223/502 772/1240/560 1.12 (1.04 to 1.21) 3.E-03 0.14 0.56
HWE indicates Hardy-Weinberg equilibrium test (performed in controls only); MI, myocardial infarction; m/M, minor/major allele (according to the frequency in theoverall population); OR, odds ratio (representing the increased risk of MI per risk allele, adjusted for age, sex, and self-reported ethnicity); PROMIS, Pakistan Risk ofMyocardial Infarction Study; RAF, risk allele frequency (in controls); R2, linkage disequilibrium between rs1333049 and other SNPs; SNP, single-nucleotidepolymorphism.
*The risk allele corresponds to the minor allele for rs1537372 and the major allele for the other SNPs.
Table 3. Haplotype Analyses of SNPs rs1333049 and rs1412832
Polymorphismsrs1412832
Haplotype Frequencies Haplotypic Odds Ratio (95% CI) �P Value�*
rs1333049 Controls Cases Model 1 Model 2
G G 0.201 0.205 0.949 (0.841 to 1.072) �0.40� 0.937 (0.828 to 1.060) �0.30�
G C 0.028 0.022 0.748 (0.523 to 1.068) �0.11� 0.778 (0.541 to 1.120) �0.18�
A G 0.307 0.276 0.843 (0.755 to 0.940) �0.002� 0.846 (0.757 to 0.946) �0.003�
A C 0.464 0.497 Referent Referent
Test of haplotypic association �2�9.07 with 3df �0.03� �2�9.08 with 3df �0.03�
SNP indicates single-nucleotide polymorphism.*Haplotypic odds ratios are for haplotypes GG, GC, and AC vs the most common reference group, AC. Model 1 was unadjusted; and model 2, adjusted for age,
sex, and the first 2 principal components. The referent indicates the reference group for the computation of the odds ratios.
4 Arterioscler Thromb Vasc Biol July 2010
by on May 15, 2011 atvb.ahajournals.orgDownloaded from
ulation found in Europeans of the effect of rs1333049 on MIby either proxy or tag SNPs of haplotype block 25; this nullfinding may have been the result of limited statistical powerand/or inadequate proxy markers in the Pakistani study.
For Pakistanis, Europeans, and East Asians, analyses of thepresent data and HapMap indicated that CAD-related variants atthe 9p21.3 locus were in high LD with each another andlocalized within a region that is devoid of a single protein codingsequence.5 This locus coincides with the ANRIL gene, a recentlydiscovered antisense noncoding RNA postulated to enhancegene expression.6,19,38 There are multiple neighboring proteincoding genes in this region, including CDKN2A, CDKN2B, andMTAP, proposed to play important roles in cell cycle progression,cellular proliferation, apoptosis, and cellular senescence.6,39,40
Although allelic frequencies for most variants and LD patternat the 9p21.3 locus were similar in Pakistanis and Europeans, theodds ratios for CAD with most variants at this locus were lowerin Pakistanis. There are previous reports of cardiometabolicdiseases having differential genetic effects by ethnicity, such asstronger associations of an LTA4H haplotype with MI in Afri-cans than Europeans41 and TCF7L2 being relevant to type 2diabetes mellitus in West Africans but not East Asians.42
Nevertheless, further study is needed to determine whetherthe apparently different odds ratios for CAD with variants atthe 9p21.3 locus, noted in this study of Pakistanis versusEuropeans, are mainly the result of nonethnic factors, such asdifferences in case definitions, age of disease onset, andepidemiological design. However, in the absence of ethni-
Figure 2. Association with MI in Pakistanis, Europeans, and East Asians for 12 variants genotyped in PROMIS. The odds ratios in PRO-MIS were computed using an additive model, adjusted for age, sex, and the first 2 principal components. Analyses for rs1333409,rs10757274, rs4977574, and rs2891168 are adjusted for age, sex, and self-reported ethnicity. Effect estimates in Europeans and EastAsians are derived from literature-based meta-analyses The P value for heterogeneity corresponds to a heterogeneity test comparingeffect estimates in the different ethnic groups. Individual plots for each meta-analysis are presented in supplemental Figure 6A throughW. RAF indicates risk allele frequency (in controls).
Saleheen et al 9p21.3 Locus and Myocardial Infarction in Pakistanis 5
by on May 15, 2011 atvb.ahajournals.orgDownloaded from
cally mediated differences in disease susceptibility, the pres-ent Pakistani study might have been expected to yield higherodds ratios than most previous studies in Europeans becausethe authors presumed enrichment for genetic signals (eg,through use of strict phenotyping and inclusion of early-onsetfirst-ever MI cases with a high degree of familial clustering).Therefore, such considerations reinforce the need for furtherstudies of MI in Pakistanis to help validate and discover itspopulation-relevant genetic determinants.
In conclusion, this study has provided the first demonstra-tion that variants at the 9p21 locus are significantly associatedwith MI risk in Pakistanis. However, association signals atthis locus were considerably weaker in Pakistanis than thosepreviously reported in Europeans.
AcknowledgmentsWe thank David Tregouet for helping in the haplotype analyses. Wethank the following individuals for their specific contributions.Epidemiological field work in Pakistan: Zeeshan Ozair, Fahad Shuja,Mustafa Qadir Hameed, Imad Hussain, Hamza Khalid, Ali Memon,Kamran Shahid, Ali Kazmi, Sana Nasim, Muhammad Ahsan Javed,Zahir Hussain, Kanwal Aamir, Mazhar Khan, Muhammad Zafar,Faisal Majeed, Madiha Ishaq, Turkey Hussain Marmoos, FaudKhurshid, Farhat Abdul Muntaqim, Sarosh Fatima, Rehan Ahmed,Muhammad Nabeel, Syed Shazad Hussain, Muhammad ZuhairYusuf, Nadeem Baig, Madad Ali Ujjan, Parveen Sultan, Asghar Ali,Ayaz Ali, Mir Alam, Hassan Zaib, Abdul Ghafoor, Saeed Ahmed,Muhammad Riazuddin, Muhammad Waqar Khan, Muhammad Ir-shad Javed, Jabir Furqan, Abdul Ghaffar, Muhammad Shahid,Tanveer Baig Mirza, Muhammad Naeem, Afzal Hussain, AbdulHakeem, Zahid Hussain, Tanveer Abbas, Muhammad KhurramShahzad, Iqbal Ali, Muhammad Imran Nisar, Altaf Hussain, Mu-hammad Shazad, Mehmood Jafree, and Ayeesha Kamal. Laboratoryassays: Sadaf Raza, Naeem Khan, Asad Ali Shah, Sobia Naz, FarinaHanif, Shaheen Khanum, Aisha Nazir, Aisha Sultana, MehwishJabar, Zahid Hussain, Madiha Yameen, Nadir Khan, and Inosh Hasan.Data management: Sarfaraz Sher Ali, Touqeer Ahmed, Syed WaqasAhmed, Azfar Hussain, Matthew Walker, and Sarah Watson. Adminis-tration: Kashif Saleheen, Hannah Sneath, and Sarah Drummond.
Sources of FundingEpidemiological field work in PROMIS was supported by unre-stricted grants to investigators at the University of Cambridge;genotyping for this study was supported by the Wellcome Trust;some biochemical assays were provided by the British Heart Foun-dation; the Yousef Jameel Foundation supported (Dr Saleheen); anda Marie Curie Bloodomics 2 scholarship (Dr Alexander). Thecardiovascular disease epidemiology group of Dr Danesh receivedgrants from the British Heart Foundation, the UK Medical ResearchCouncil, and the Wellcome Trust.
DisclosuresNone.
References1. WTCCC. Genome-wide association study of 14,000 cases of seven
common diseases and 3,000 shared controls. Nature. 2007;447:661–678.2. Samani NJ, Erdmann J, Hall AS, Hengstenberg C, Mangino M, Mayer B,
Dixon RJ, Meitinger T, Braund P, Wichmann HE, Barrett JH, Konig IR,Stevens SE, Szymczak S, Tregouet DA, Iles MM, Pahlke F, Pollard H, LiebW, Cambien F, Fischer M, Ouwehand W, Blankenberg S, Balmforth AJ,Baessler A, Ball SG, Strom TM, Braenne I, Gieger C, Deloukas P, TobinMD, Ziegler A, Thompson JR, Schunkert H. Genomewide association anal-ysis of coronary artery disease. N Engl J Med. 2007;357:443–453.
3. McPherson R, Pertsemlidis A, Kavaslar N, Stewart A, Roberts R, CoxDR, Hinds DA, Pennacchio LA, Tybjaerg-Hansen A, Folsom AR, Boer-
winkle E, Hobbs HH, Cohen JC. A common allele on chromosome 9associated with coronary heart disease. Science. 2007;316:1488–1491.
4. Helgadottir A, Thorleifsson G, Manolescu A, Gretarsdottir S, Blondal T,Jonasdottir A, Jonasdottir A, Sigurdsson A, Baker A, Palsson A, MassonG, Gudbjartsson DF, Magnusson KP, Andersen K, Levey AI, BackmanVM, Matthiasdottir S, Jonsdottir T, Palsson S, Einarsdottir H, Gunnars-dottir S, Gylfason A, Vaccarino V, Hooper WC, Reilly MP, Granger CB,Austin H, Rader DJ, Shah SH, Quyyumi AA, Gulcher JR, ThorgeirssonG, Thorsteinsdottir U, Kong A, Stefansson K. A common variant onchromosome 9p21 affects the risk of myocardial infarction. Science.2007;316:1491–1493.
5. Schunkert H, Gotz A, Braund P, McGinnis R, Tregouet DA, Mangino M,Linsel-Nitschke P, Cambien F, Hengstenberg C, Stark K, Blankenberg S,Tiret L, Ducimetiere P, Keniry A, Ghori MJ, Schreiber S, El MokhtariNE, Hall AS, Dixon RJ, Goodall AH, Liptau H, Pollard H, Schwarz DF,Hothorn LA, Wichmann HE, Konig IR, Fischer M, Meisinger C,Ouwehand W, Deloukas P, Thompson JR, Erdmann J, Ziegler A, SamaniNJ. Repeated replication and a prospective meta-analysis of the asso-ciation between chromosome 9p21.3 and coronary artery disease. Circu-lation. 2008;117:1675–1684.
6. Jarinova O, Stewart AF, Roberts R, Wells G, Lau P, Naing T, Buerki C,McLean BW, Cook RC, Parker JS, McPherson R. Functional analysis ofthe chromosome 9p21.3 coronary artery disease risk locus. ArteriosclerThromb Vasc Biol. 2009;29:1671–1677.
7. Nishtar S. Prevention of coronary heart disease in south Asia. Lancet.2002;360:1015–1018.
8. Saleheen D, Zaidi M, Rasheed A, Ahmad U, Hakeem A, Murtaza M,Kayani W, Faruqui A, Kundi A, Zaman KS, Yaqoob Z, Cheema LA,Samad A, Rasheed SZ, Mallick NH, Azhar M, Jooma R, GardeziAR, Memon N, Ghaffar A, Fazal UR, Khan N, Shah N, Ali SA, SamuelM, Hanif F, Yameen M, Naz S, Sultana A, Nazir A, Raza S, Shazad M,Nasim S, Javed MA, Ali SS, Jafree M, Nisar MI, Daood MS, Hussain A,Sarwar N, Kamal A, Deloukas P, Ishaq M, Frossard P, Danesh J. ThePakistan Risk of Myocardial Infarction Study: a resource for the study ofgenetic, lifestyle and other determinants of myocardial infarction in SouthAsia. Eur J Epidemiol. 2009;24:329–338.
9. Little J, Higgins JP, Ioannidis JP, Moher D, Gagnon F, von Elm E, KhouryMJ, Cohen B, Davey-Smith G, Grimshaw J, Scheet P, Gwinn M, WilliamsonRE, Zou GY, Hutchings K, Johnson CY, Tait V, Wiens M, Golding J, vanDuijn DC, McLaughlin J, Paterson A, Wells G, Fortier I, Freedman M,Zecevic M, King R, Infante-Rivard C, Stewart A, Birkett N. STrengtheningthe REporting of Genetic Association studies (STREGA): an extension of theSTROBE statement. Eur J Clin Invest. 2009;39:247–266.
10. Keating BJ, Tischfield S, Murray SS, Bhangale T, Price TS, Glessner JT,Galver L, Barrett JC, Grant SF, Farlow DN, Chandrupatla HR, Hansen M,Ajmal S, Papanicolaou GJ, Guo Y, Li M, Derohannessian S, de BakkerPI, Bailey SD, Montpetit A, Edmondson AC, Taylor K, Gai X, Wang SS,Fornage M, Shaikh T, Groop L, Boehnke M, Hall AS, Hattersley AT,Frackelton E, Patterson N, Chiang CW, Kim CE, Fabsitz RR, OuwehandW, Price AL, Munroe P, Caulfield M, Drake T, Boerwinkle E, Reich D,Whitehead AS, Cappola TP, Samani NJ, Lusis AJ, Schadt E, Wilson JG,Koenig W, McCarthy MI, Kathiresan S, Gabriel SB, Hakonarson H, AnandSS, Reilly M, Engert JC, Nickerson DA, Rader DJ, Hirschhorn JN, FitzgeraldGA. Concept, design and implementation of a cardiovascular gene-centric50 k SNP array for large-scale genomic association studies. PLoS One.2008;3:e3583.
11. Purcell S, Neale B, Todd-Brown K, Thomas L, Ferreira MA, Bender D,Maller J, Sklar P, de Bakker PI, Daly MJ, Sham PC. PLINK: a tool set forwhole-genome association and population-based linkage analyses. Am JHum Genet. 2007;81:559–575.
12. Sabatti C, Service SK, Hartikainen AL, Pouta A, Ripatti S, Brodsky J,Jones CG, Zaitlen NA, Varilo T, Kaakinen M, Sovio U, Ruokonen A,Laitinen J, Jakkula E, Coin L, Hoggart C, Collins A, Turunen H, GabrielS, Elliot P, McCarthy MI, Daly MJ, Jarvelin MR, Freimer NB, PeltonenL. Genome-wide association analysis of metabolic traits in a birth cohortfrom a founder population. Nat Genet. 2009;41:35–46.
13. Barrett JC, Fry B, Maller J, Daly MJ. Haploview: analysis and visual-ization of LD and haplotype maps. Bioinformatics. 2005;21:263–265.
14. Tregouet DA, Garelle V. A new JAVA interface implementation ofTHESIAS: testing haplotype effects in association studies. Bioinfor-matics. 2007;23:1038–1039.
15. Tregouet DA, Ricard S, Nicaud V, Arnould I, Soubigou S, Rosier M,Duverger N, Poirier O, Mace S, Kee F, Morrison C, Denefle P, Tiret L,Evans A, Deleuze JF, Cambien F. In-depth haplotype analysis of ABCA1
6 Arterioscler Thromb Vasc Biol July 2010
by on May 15, 2011 atvb.ahajournals.orgDownloaded from

gene polymorphisms in relation to plasma ApoA1 levels and myocardialinfarction. Arterioscler Thromb Vasc Biol. 2004;24:775–781.
16. Higgins JP, Thompson SG. Quantifying heterogeneity in a meta-analysis.Stat Med. 2002;21:1539–1558.
17. Abdullah KG, Li L, Shen GQ, Hu Y, Yang Y, MacKinlay KG, Topol EJ,Wang QK. Four SNPS on chromosome 9p21 confer risk to premature,familial CAD and MI in an American Caucasian population (GeneQuest).Ann Hum Genet. 2008;72(pt 5):654–657.
18. Assimes TL, Knowles JW, Basu A, Iribarren C, Southwick A, Tang H,Absher D, Li J, Fair JM, Rubin GD, Sidney S, Fortmann SP, Go AS, HlatkyMA, Myers RM, Risch N, Quertermous T. Susceptibility locus for clinicaland subclinical coronary artery disease at chromosome 9p21 in the multi-ethnic ADVANCE study. Hum Mol Genet. 2008;17:2320–2328.
19. Broadbent HM, Peden JF, Lorkowski S, Goel A, Ongen H, Green F, ClarkeR, Collins R, Franzosi MG, Tognoni G, Seedorf U, Rust S, Eriksson P,Hamsten A, Farrall M, Watkins H. Susceptibility to coronary artery diseaseand diabetes is encoded by distinct, tightly linked SNPs in the ANRIL locuson chromosome 9p. Hum Mol Genet. 2008;17:806–814.
20. Samani NJ, Deloukas P, Erdmann J, Hengstenberg C, Kuulasmaa K,McGinnis R, Schunkert H, Soranzo N, Thompson J, Tiret L, Ziegler A.Large scale association analysis of novel genetic loci for coronary arterydisease. Arterioscler Thromb Vasc Biol. 2009;29:774–780.
21. Dehghan A, van Hoek M, Sijbrands EJ, Oostra BA, Hofman A, van DuijnCM, Witteman JC. Lack of association of two common polymorphismson 9p21 with risk of coronary heart disease and myocardial infarction:results from a prospective cohort study. BMC Med. 2008;6:30.
22. Karvanen J, Silander K, Kee F, Tiret L, Salomaa V, Kuulasmaa K, WiklundPG, Virtamo J, Saarela O, Perret C, Perola M, Peltonen L, Cambien F,Erdmann J, Samani NJ, Schunkert H, Evans A. The impact of newly iden-tified loci on coronary heart disease, stroke and total mortality in theMORGAM prospective cohorts. Genet Epidemiol. 2009;33:237–246.
23. Lemmens R, Abboud S, Robberecht W, Vanhees L, Pandolfo M, Thijs V,Goris A. Variant on 9p21 strongly associates with coronary heart disease,but lacks association with common stroke. Eur J Hum Genet. 2009;17:1287–1293.
24. Kathiresan S, Voight BF, Purcell S, Musunuru K, Ardissino D, MannucciPM, Anand S, Engert JC, Samani NJ, Schunkert H, Erdmann J, ReillyMP, Rader DJ, Morgan T, Spertus JA, Stoll M, Girelli D, McKeown PP,Patterson CC, Siscovick DS, O’Donnell CJ, Elosua R, Peltonen L,Salomaa V, Schwartz SM, Melander O, Altshuler D, Ardissino D, MerliniPA, Berzuini C, Bernardinelli L, Peyvandi F, Tubaro M, Celli P, FerrarioM, Fetiveau R, Marziliano N, Casari G, Galli M, Ribichini F, Rossi M,Bernardi F, Zonzin P, Piazza A, Mannucci PM, Schwartz SM, SiscovickDS, Yee J, Friedlander Y, Elosua R, Marrugat J, Lucas G, Subirana I, SalaJ, Ramos R, Kathiresan S, Meigs JB, Williams G, Nathan DM, MacRaeCA, O’Donnell CJ, Salomaa V, Havulinna AS, Peltonen L, Melander O,Berglund G, Voight BF, Kathiresan S, Hirschhorn JN, Asselta R, Duga S,Spreafico M, Musunuru K, Daly MJ, Purcell S, Voight BF, PurcellS, Nemesh J, Korn JM, McCarroll SA, Schwartz SM, Yee J, KathiresanS, Lucas G, Subirana I, Elosua R, Surti A, Guiducci C, Gianniny L, MirelD, Parkin M, Burtt N, Gabriel SB, Samani NJ, Thompson JR, Braund PS,Wright BJ, Balmforth AJ, Ball SG, Hall AS, Schunkert H, Erdmann J,Linsel-Nitschke P, Lieb W, Ziegler A, Konig I, Hengstenberg C, FischerM, Stark K, Grosshennig A, Preuss M, Wichmann HE, Schreiber S,Schunkert H, Samani NJ, Erdmann J, Ouwehand W, Hengstenberg C,Deloukas P, Scholz M, Cambien F, Reilly MP, Li M, Chen Z, WilenskyR, Matthai W, Qasim A, Hakonarson HH, Devaney J, Burnett MS,Pichard AD, Kent KM, Satler L, Lindsay JM, Waksman R, Epstein SE,Rader DJ, Scheffold T, Berger K, Stoll M, Huge A, Girelli D, MartinelliN, Olivieri O, Corrocher R, Morgan T, Spertus JA, McKeown P,Patterson CC, Schunkert H, Erdmann E, Linsel-Nitschke P, Lieb W,Ziegler A, Konig IR, Hengstenberg C, Fischer M, Stark K, GrosshennigA, Preuss M, Wichmann HE, Schreiber S, Holm H, Thorleifsson G,Thorsteinsdottir U, Stefansson K, Engert JC, Do R, Xie C, Anand S,Kathiresan S, Ardissino D, Mannucci PM, Siscovick D, O’Donnell CJ,Samani NJ, Melander O, Elosua R, Peltonen L, Salomaa V, Schwartz SM,Altshuler D. Genome-wide association of early-onset myocardialinfarction with single nucleotide polymorphisms and copy numbervariants. Nat Genet. 2009;41:334–341.
25. Paynter NP, Chasman DI, Buring JE, Shiffman D, Cook NR, Ridker PM.Cardiovascular disease risk prediction with and without knowledge ofgenetic variation at chromosome 9p21.3. Ann Intern Med. 2009;150:65–72.
26. Schaefer AS, Richter GM, Groessner-Schreiber B, Noack B, NothnagelM, El Mokhtari NE, Loos BG, Jepsen S, Schreiber S. Identification of a
shared genetic susceptibility locus for coronary heart disease and peri-odontitis. PLoS Genet. 2009;5:e1000378.
27. Shen GQ, Rao S, Martinelli N, Li L, Olivieri O, Corrocher R, AbdullahKG, Hazen SL, Smith J, Barnard J, Plow EF, Girelli D, Wang QK.Association between four SNPs on chromosome 9p21 and myocardialinfarction is replicated in an Italian population. J Hum Genet. 2008;53:144–150.
28. Talmud PJ, Cooper JA, Palmen J, Lovering R, Drenos F, Hingorani AD,Humphries SE. Chromosome 9p21.3 coronary heart disease locus geno-type and prospective risk of CHD in healthy middle-aged men. ClinChem. 2008;54:467–474.
29. Zee RY, Ridker PM. Two common gene variants on chromosome 9 andrisk of atherothrombosis. Stroke. 2007;38:e111.
30. Ye S, Willeit J, Kronenberg F, Xu Q, Kiechl S. Association of geneticvariation on chromosome 9p21 with susceptibility and progression ofatherosclerosis: a population-based, prospective study. J Am Coll Cardiol.2008;52:378–384.
31. Chen Z, Qian Q, Ma G, Wang J, Zhang X, Feng Y, Shen C, Yao Y. Acommon variant on chromosome 9p21 affects the risk of early-onsetcoronary artery disease. Mol Biol Rep. 2009;36:889–893.
32. Hinohara K, Nakajima T, Takahashi M, Hohda S, Sasaoka T, NakaharaK, Chida K, Sawabe M, Arimura T, Sato A, Lee BS, Ban JM, YasunamiM, Park JE, Izumi T, Kimura A. Replication of the association betweena chromosome 9p21 polymorphism and coronary artery disease inJapanese and Korean populations. J Hum Genet. 2008;53:357–359.
33. Hiura Y, Fukushima Y, Yuno M, Sawamura H, Kokubo Y, Okamura T,Tomoike H, Goto Y, Nonogi H, Takahashi R, Iwai N. Validation of theassociation of genetic variants on chromosome 9p21 and 1q41 withmyocardial infarction in a Japanese population. Circ J. 2008;72:1213–1217.
34. Shen GQ, Li L, Rao S, Abdullah KG, Ban JM, Lee BS, Park JE, WangQK. Four SNPs on chromosome 9p21 in a South Korean populationimplicate a genetic locus that confers high cross-race risk for devel-opment of coronary artery disease. Arterioscler Thromb Vasc Biol. 2008;28:360–365.
35. Zhang Q, Wang XF, Cheng SS, Wan XH, Cao FF, Li L, Chen XD, LiuWJ, Yang XC, Jin L. Three SNPs on chromosome 9p21 confer increasedrisk of myocardial infarction in Chinese subjects. Atherosclerosis. 2009;207:26–28.
36. Zhou L, Zhang X, He M, Cheng L, Chen Y, Hu FB, Wu T. Associationsbetween single nucleotide polymorphisms on chromosome 9p21 and riskof coronary heart disease in Chinese Han population. Arterioscler ThrombVasc Biol. 2008;28:2085–2089.
37. Ghazouani L, Khalifa SB, Abboud N, Perret C, Nicaud V, Ben KhalfallahA, Alamawi WY, Cambien F, Mahjoub T. Association of three poly-morphisms selected from a genome-wide association study with coronaryheart disease in the Tunisian population. J Thromb Thrombolysis. 2010;29:114–118.
38. Amaral PP, Dinger ME, Mercer TR, Mattick JS. The eukaryotic genomeas an RNA machine. Science. 2008;319:1787–1789.
39. Hannon GJ, Beach D. p15INK4B is a potential effector of TGF-beta-induced cell cycle arrest. Nature. 1994;371:257–261.
40. Pomerantz J, Schreiber-Agus N, Liegeois NJ, Silverman A, Alland L,Chin L, Potes J, Chen K, Orlow I, Lee HW, Cordon-Cardo C, DePinhoRA. The Ink4a tumor suppressor gene product, p19Arf, interacts withMDM2 and neutralizes MDM2’s inhibition of p53. Cell. 1998;92:713–723.
41. Helgadottir A, Manolescu A, Helgason A, Thorleifsson G, Thorsteins-dottir U, Gudbjartsson DF, Gretarsdottir S, Magnusson KP, Gud-mundsson G, Hicks A, Jonsson T, Grant SF, Sainz J, O’Brien SJ, Svein-bjornsdottir S, Valdimarsson EM, Matthiasson SE, Levey AI, AbramsonJL, Reilly MP, Vaccarino V, Wolfe ML, Gudnason V, Quyyumi AA,Topol EJ, Rader DJ, Thorgeirsson G, Gulcher JR, Hakonarson H, KongA, Stefansson K. A variant of the gene encoding leukotriene A4 hydrolaseconfers ethnicity-specific risk of myocardial infarction. Nat Genet. 2006;38:68–74.
42. Helgason A, Palsson S, Thorleifsson G, Grant SF, Emilsson V, Gunnars-dottir S, Adeyemo A, Chen Y, Chen G, Reynisdottir I, Benediktsson R,Hinney A, Hansen T, Andersen G, Borch-Johnsen K, Jorgensen T,Schafer H, Faruque M, Doumatey A, Zhou J, Wilensky RL, Reilly MP,Rader DJ, Bagger Y, Christiansen C, Sigurdsson G, Hebebrand J,Pedersen O, Thorsteinsdottir U, Gulcher JR, Kong A, Rotimi C, Ste-fansson K. Refining the impact of TCF7L2 gene variants on type 2diabetes and adaptive evolution. Nat Genet. 2007;39:218–225.
Saleheen et al 9p21.3 Locus and Myocardial Infarction in Pakistanis 7
by on May 15, 2011 atvb.ahajournals.orgDownloaded from
1
Supplement Material eFigure I: Literature search strategy used in the current meta-analyses
PubMed search performed on 07 January 2010• 909 articles
Exclusion of, in order,:• 409 articles published before Jan 2007 • 26 articles involving non Human participants• 56 articles performing linkage, functional or expression analysis• 172 articles investigating the risk of quantitative trait or ofother outcomes than CHD (subclinical CHD, T2 diabetes, stroke…)• 2 articles not population based• 27 articles without information on chromosome 9p21• 200 irrelevant articles (reviews, protocols, statistical methodology…)
Extraction of data for:• 23 articles from PubMed search• 6 articles found by scanning references and hand searching
Exclusion of:• 1 article because of no available data on chromosome 9p21 (Larson 2007 BMC Med. Gen.)• 2 articles because data overlap entirely with another publishedstudy: ARIC study (Brautbar 2009 Circ. CVD Gen.) and Chaoyangstudy (Yang 2009 Clin. Biochem.)
26 articles finally included in the analysis:• 3 GWA• 25 replication studies
23 SNPs finally included in the meta-analyses, which had been genotyped in a total of:• 3 GWA• 23 replication studies• 38,250 cases and 84,820 controls
by on May 15, 2011 atvb.ahajournals.orgDownloaded from
2
eFigure II: Scatter plot of the first two principal components and self reported ethnicities in PROMIS control participants
C1C
2
Scatter plot of the first two principal components identified by principal component analysis of the identity-by-state matrix in PROMIS IBC data on 1851 cases and 1903 controls genotyped on 45,000 SNPs. The colours of points refer to self reported-ethnicities in PROMIS participants. C1 and C2 axis represent to the first and second principal components.
by on May 15, 2011 atvb.ahajournals.orgDownloaded from
3
eFigure III: Linkage disequilibrium patterns in four major Pakistani ethnic groups
There were 302 Pathan, 588 Punjabi, 280 Sindhi and 17510 Urdu. Regions of strong LD are in red, of moderate LD in light red, of very moderate LD in blue and of no LD in white.
Pathan Punjabi
Sindhi Urdu
by on May 15, 2011 atvb.ahajournals.orgDownloaded from
4
eFigure IVa: Effect modification of variant rs10757274 by different factors in PROMIS participants
Subtotal (I-squared = 51.4%, p = 0.151)
Subtotal (I-squared = 0.0%, p = 0.623)
Subtotal (I-squared = 3.4%, p = 0.404)
Subtotal (I-squared = 0.0%, p = 0.980)
Subtotal (I-squared = 36.8%, p = 0.206)
Subtotal (I-squared = 0.0%, p = 0.520)
Subtotal (I-squared = 28.4%, p = 0.237)
Subtotal (I-squared = 0.0%, p = 0.372)
1.16 (1.07, 1.27)1.00 (0.83, 1.21)
1.19 (1.05, 1.36)1.08 (0.93, 1.26)1.13 (0.96, 1.33)
1.22 (1.09, 1.37)1.10 (0.91, 1.32)1.18 (0.85, 1.64)1.03 (0.62, 1.72)0.92 (0.70, 1.20)1.10 (0.67, 1.80)1.58 (0.63, 3.94)0.94 (0.75, 1.19)
1.13 (1.03, 1.24)1.15 (0.92, 1.44)1.16 (0.84, 1.59)
1.21 (1.07, 1.37)1.28 (0.95, 1.73)1.05 (0.93, 1.19)
1.15 (1.06, 1.26)1.07 (0.88, 1.31)
1.15 (1.06, 1.26)1.01 (0.83, 1.24)
1.10 (0.96, 1.28)1.04 (0.91, 1.20)1.24 (1.02, 1.51)
.15
.31
.58
.3
.82
.51
.07
.66
.4
.06
.87
.87
.65
.11
.49
.23
.58
.28
.53
.53
.54
.53
.52
.54
.52
.57
.55
.45
.52
.62
.50
.53
.53
.51
.54
.55
.52
.53
.52
.53
.53
.52
.52
.55
.49
.52
.49
.51
.49
.49
.5
.54
.55
.47
.50
.51
.52
.50
.50
.48
.49
.49
.51
.50
.51
.50
.53
.50
.50
.50
1.16 (1.07, 1.27)1.00 (0.83, 1.21)
1.19 (1.05, 1.36)1.08 (0.93, 1.26)1.13 (0.96, 1.33)
1.22 (1.09, 1.37)1.10 (0.91, 1.32)1.18 (0.85, 1.64)1.03 (0.62, 1.72)0.92 (0.70, 1.20)1.10 (0.67, 1.80)1.58 (0.63, 3.94)0.94 (0.75, 1.19)
1.13 (1.03, 1.24)1.15 (0.92, 1.44)1.16 (0.84, 1.59)
1.21 (1.07, 1.37)1.28 (0.95, 1.73)1.05 (0.93, 1.19)
1.15 (1.06, 1.26)1.07 (0.88, 1.31)
1.15 (1.06, 1.26)1.01 (0.83, 1.24)
1.10 (0.96, 1.28)1.04 (0.91, 1.20)1.24 (1.02, 1.51)
.15
.31
.58
.3
.82
.51
.07
.66
.4
.06
.87
.87
.65
.11
.49
.23
.58
.28
1.8 1 1.2 1.4 1.61.8 2
//
///
////////
///
///
//
//
///
RAF Case/cont
Group OR (95% CI) P-value
MaleFemale
UrduPunjabiPathanBalochiSindhiMemonGujratiOther
Recruitment centreNICVD & JIKIHDPIC
Tobacco useNeverExCurrent
Sex
Age<50 years old50-60 years old>60 years old
Ethnic group
History of diabetesYesNo
History of MIYesNo
Waist to hip ratioLowest third (<.92)Middle third (0.92-.96)Top third (>0.96)
Ref
Ref
Ref
Ref
Ref
Ref
Ref
Ref
by on May 15, 2011 atvb.ahajournals.orgDownloaded from
5
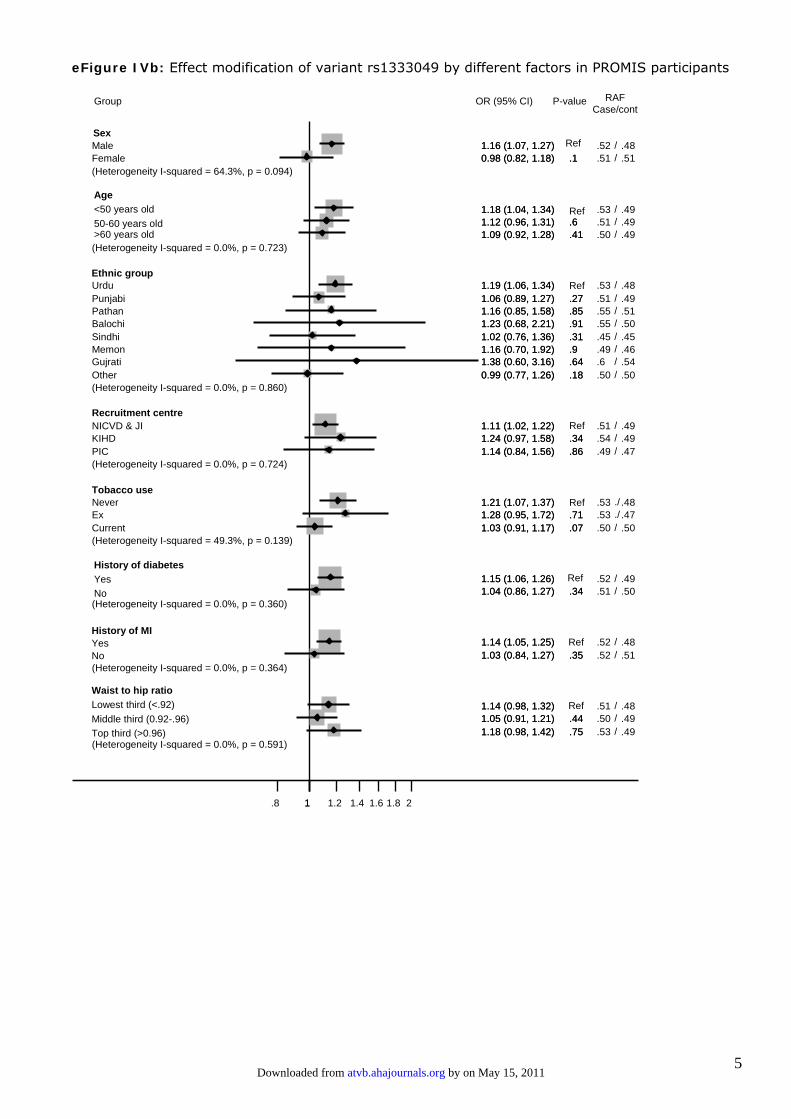
eFigure IVb: Effect modification of variant rs1333049 by different factors in PROMIS participants
MaleFemale(Heterogeneity I-squared = 64.3%, p = 0.094)
(Heterogeneity I-squared = 0.0%, p = 0.723)
UrduPunjabiPathanBalochiSindhiMemonGujratiOther(Heterogeneity I-squared = 0.0%, p = 0.860)
Recruitment centreNICVD & JIKIHDPIC(Heterogeneity I-squared = 0.0%, p = 0.724)
Tobacco useNeverExCurrent(Heterogeneity I-squared = 49.3%, p = 0.139)
(Heterogeneity I-squared = 0.0%, p = 0.360)
(Heterogeneity I-squared = 0.0%, p = 0.364)
(Heterogeneity I-squared = 0.0%, p = 0.591)
1.16 (1.07, 1.27)0.98 (0.82, 1.18)
1.18 (1.04, 1.34)1.12 (0.96, 1.31)1.09 (0.92, 1.28)
1.19 (1.06, 1.34)1.06 (0.89, 1.27)1.16 (0.85, 1.58)1.23 (0.68, 2.21)1.02 (0.76, 1.36)1.16 (0.70, 1.92)1.38 (0.60, 3.16)0.99 (0.77, 1.26)
1.11 (1.02, 1.22)1.24 (0.97, 1.58)1.14 (0.84, 1.56)
1.21 (1.07, 1.37)1.28 (0.95, 1.72)1.03 (0.91, 1.17)
1.15 (1.06, 1.26)1.04 (0.86, 1.27)
1.14 (1.05, 1.25)1.03 (0.84, 1.27)
1.14 (0.98, 1.32)1.05 (0.91, 1.21)1.18 (0.98, 1.42)
.1
.6
.41
.27
.85
.91
.31
.9
.64
.18
.34
.86
.71
.07
.34
.35
.44
.75
.52
.51
.53
.51
.50
.53
.51
.55
.55
.45
.49
.6
.50
.51
.54
.49
.53
.53
.50
.52
.51
.52
.52
.51
.50
.53
.48
.51
.49
.49
.49
.48
.49
.51
.50
.45
.46
.54
.50
.49
.49
.47
.48
.47
.50
.49
.50
.48
.51
.48
.49
.49
RAF Case/cont
1.16 (1.07, 1.27)0.98 (0.82, 1.18)
1.18 (1.04, 1.34)1.12 (0.96, 1.31)1.09 (0.92, 1.28)
1.19 (1.06, 1.34)1.06 (0.89, 1.27)1.16 (0.85, 1.58)1.23 (0.68, 2.21)1.02 (0.76, 1.36)1.16 (0.70, 1.92)1.38 (0.60, 3.16)0.99 (0.77, 1.26)
1.11 (1.02, 1.22)1.24 (0.97, 1.58)1.14 (0.84, 1.56)
1.21 (1.07, 1.37)1.28 (0.95, 1.72)1.03 (0.91, 1.17)
1.15 (1.06, 1.26)1.04 (0.86, 1.27)
1.14 (1.05, 1.25)1.03 (0.84, 1.27)
1.14 (0.98, 1.32)1.05 (0.91, 1.21)1.18 (0.98, 1.42)
.1
.6
.41
.27
.85
.91
.31
.9
.64
.18
.34
.86
.71
.07
.34
.35
.44
.75
1.8 1 1.2 1.4 1.6 1.8 2
//
///
////////
///
./
.//
//
//
///
Group OR (95% CI) P-value
Sex
Age<50 years old50-60 years old>60 years old
Ethnic group
History of diabetesYesNo
History of MIYesNo
Waist to hip ratioLowest third (<.92)Middle third (0.92-.96)Top third (>0.96)
Ref
Ref
Ref
Ref
Ref
Ref
Ref
Ref
by on May 15, 2011 atvb.ahajournals.orgDownloaded from

6
eFigure IVc: Effect modification of variant rs1537372 by different factors in PROMIS participants
Subtotal (I-squared = 35.0%, p = 0.215)
Subtotal (I-squared = 27.0%, p = 0.254)
Subtotal (I-squared = 24.4%, p = 0.235)
Subtotal (I-squared = 0.0%, p = 0.913)
Subtotal (I-squared = 59.4%, p = 0.085)
Subtotal (I-squared = 1.6%, p = 0.313)
Subtotal (I-squared = 0.0%, p = 0.429)
Subtotal (I-squared = 0.0%, p = 0.377)
1.15 (1.06, 1.26)1.01 (0.84, 1.22)
1.21 (1.06, 1.38)1.03 (0.89, 1.19)1.14 (0.96, 1.34)
1.23 (1.10, 1.39)1.09 (0.91, 1.30)1.08 (0.80, 1.45)1.25 (0.67, 2.35)0.88 (0.68, 1.14)1.11 (0.68, 1.81)1.50 (0.64, 3.48)0.93 (0.74, 1.17)
1.13 (1.03, 1.24)1.16 (0.93, 1.46)1.07 (0.81, 1.44)
1.21 (1.08, 1.37)1.33 (0.97, 1.80)1.02 (0.91, 1.16)
1.16 (1.06, 1.26)1.04 (0.86, 1.26)
1.14 (1.05, 1.25)1.05 (0.85, 1.28)
1.13 (0.98, 1.30)1.04 (0.91, 1.20)1.23 (1.02, 1.49)
.21
.09
.52
.22
.37
.96
.03
.64
.51
.04
.79
.73
.51
.05
.3
.41
.43
.41
.50
.50
.52
.49
.49
.52
.49
.53
.52
.41
.51
.59
.48
.50
.51
.48
.52
.52
.49
.51
.50
.50
.51
.49
.50
.52
.47
.5
.47
.49
.46
.46
.47
.52
.48
.44
.49
.49
.50
.47
.48
.47
.47
.45
.49
.47
.49
.47
.5
.47
.48
.47
1.15 (1.06, 1.26)1.01 (0.84, 1.22)
1.21 (1.06, 1.38)1.03 (0.89, 1.19)1.14 (0.96, 1.34)
1.23 (1.10, 1.39)1.09 (0.91, 1.30)1.08 (0.80, 1.45)1.25 (0.67, 2.35)0.88 (0.68, 1.14)1.11 (0.68, 1.81)1.50 (0.64, 3.48)0.93 (0.74, 1.17)
1.13 (1.03, 1.24)1.16 (0.93, 1.46)1.07 (0.81, 1.44)
1.21 (1.08, 1.37)1.33 (0.97, 1.80)1.02 (0.91, 1.16)
1.16 (1.06, 1.26)1.04 (0.86, 1.26)
1.14 (1.05, 1.25)1.05 (0.85, 1.28)
1.13 (0.98, 1.30)1.04 (0.91, 1.20)1.23 (1.02, 1.49)
.21
.09
.52
.22
.37
.96
.03
.64
.51
.04
.79
.73
.51
.05
.30
.41
.43
.41
1.8 1 1.2 1.4 1.6 1.8 2
MaleFemale
UrduPunjabiPathanBalochiSindhiMemonGujratiOther
Recruitment centreNICVD & JIKIHDPIC
Tobacco useNeverExCurrent
Sex
Age<50 years old50-60 years old>60 years old
Ethnic group
History of diabetesYesNo
History of MIYesNo
Waist to hip ratioLowest third (<.92)Middle third (0.92-.96)Top third (>0.96)
RAF Case/cont
Group OR (95% CI) P-value
//
///
////////
///
///
//
//
///
Ref
Ref
Ref
Ref
Ref
Ref
Ref
Ref
by on May 15, 2011 atvb.ahajournals.orgDownloaded from
7
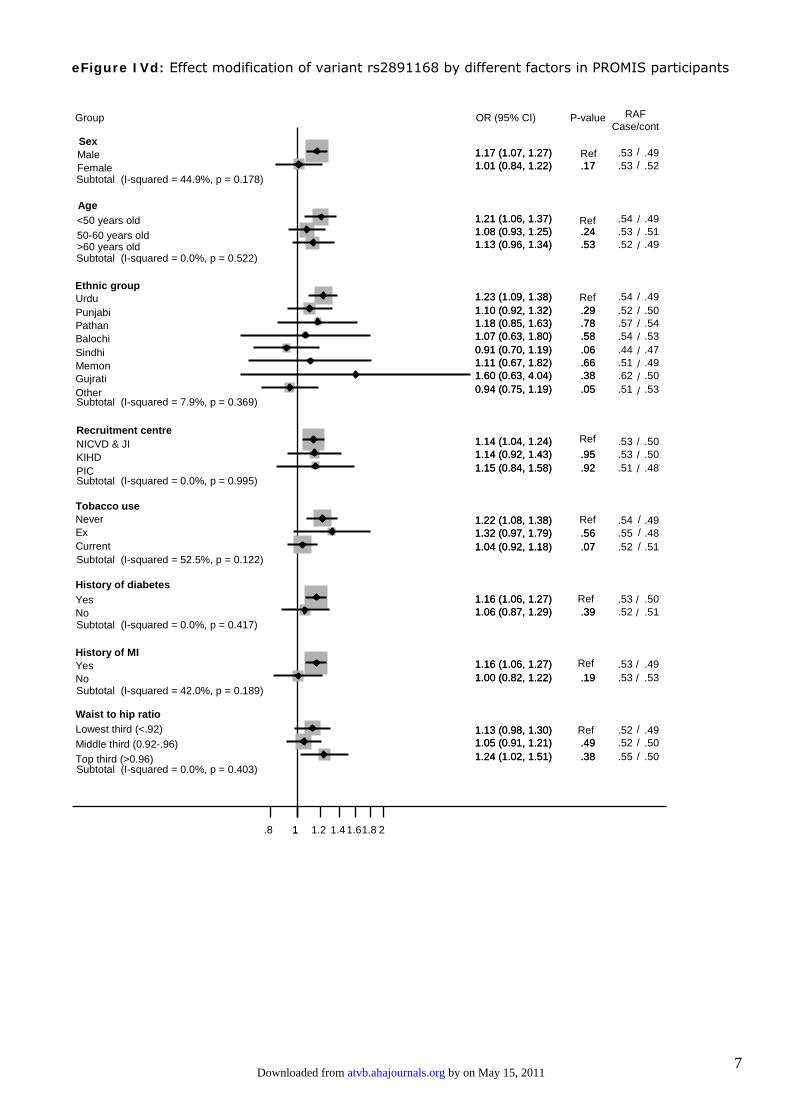
eFigure IVd: Effect modification of variant rs2891168 by different factors in PROMIS participants
Subtotal (I-squared = 44.9%, p = 0.178)
Subtotal (I-squared = 0.0%, p = 0.522)
Subtotal (I-squared = 7.9%, p = 0.369)
Subtotal (I-squared = 0.0%, p = 0.995)
Subtotal (I-squared = 52.5%, p = 0.122)
Subtotal (I-squared = 0.0%, p = 0.417)
Subtotal (I-squared = 42.0%, p = 0.189)
Subtotal (I-squared = 0.0%, p = 0.403)
1.17 (1.07, 1.27)1.01 (0.84, 1.22)
1.21 (1.06, 1.37)1.08 (0.93, 1.25)1.13 (0.96, 1.34)
1.23 (1.09, 1.38)1.10 (0.92, 1.32)1.18 (0.85, 1.63)1.07 (0.63, 1.80)0.91 (0.70, 1.19)1.11 (0.67, 1.82)1.60 (0.63, 4.04)0.94 (0.75, 1.19)
1.14 (1.04, 1.24)1.14 (0.92, 1.43)1.15 (0.84, 1.58)
1.22 (1.08, 1.38)1.32 (0.97, 1.79)1.04 (0.92, 1.18)
1.16 (1.06, 1.27)1.06 (0.87, 1.29)
1.16 (1.06, 1.27)1.00 (0.82, 1.22)
1.13 (0.98, 1.30)1.05 (0.91, 1.21)1.24 (1.02, 1.51)
.17
.24
.53
.29
.78
.58
.06
.66
.38
.05
.95
.92
.56
.07
.39
.19
.49
.38
.53
.53
.54
.53
.52
.54
.52
.57
.54
.44
.51
.62
.51
.53
.53
.51
.54
.55
.52
.53
.52
.53
.53
.52
.52
.55
.49
.52
.49
.51
.49
.49
.50
.54
.53
.47
.49
.50
.53
.50
.50
.48
.49
.48
.51
.50
.51
.49
.53
.49
.50
.50
1.17 (1.07, 1.27)1.01 (0.84, 1.22)
1.21 (1.06, 1.37)1.08 (0.93, 1.25)1.13 (0.96, 1.34)
1.23 (1.09, 1.38)1.10 (0.92, 1.32)1.18 (0.85, 1.63)1.07 (0.63, 1.80)0.91 (0.70, 1.19)1.11 (0.67, 1.82)1.60 (0.63, 4.04)0.94 (0.75, 1.19)
1.14 (1.04, 1.24)1.14 (0.92, 1.43)1.15 (0.84, 1.58)
1.22 (1.08, 1.38)1.32 (0.97, 1.79)1.04 (0.92, 1.18)
1.16 (1.06, 1.27)1.06 (0.87, 1.29)
1.16 (1.06, 1.27)1.00 (0.82, 1.22)
1.13 (0.98, 1.30)1.05 (0.91, 1.21)1.24 (1.02, 1.51)
.17
.24
.53
.29
.78
.58
.06
.66
.38
.05
.95
.92
.56
.07
.39
.19
.49
.38
1.8 1 1.2 1.4 1.61.8 2
RAF Case/cont
Group OR (95% CI) P-value
MaleFemale
UrduPunjabiPathanBalochiSindhiMemonGujratiOther
Recruitment centreNICVD & JIKIHDPIC
Tobacco useNeverExCurrent
Sex
Age<50 years old50-60 years old>60 years old
Ethnic group
History of diabetesYesNo
History of MIYesNo
Waist to hip ratioLowest third (<.92)Middle third (0.92-.96)Top third (>0.96)
//
///
////////
///
///
//
//
///
Ref
Ref
Ref
Ref
Ref
Ref
Ref
Ref
by on May 15, 2011 atvb.ahajournals.orgDownloaded from
8
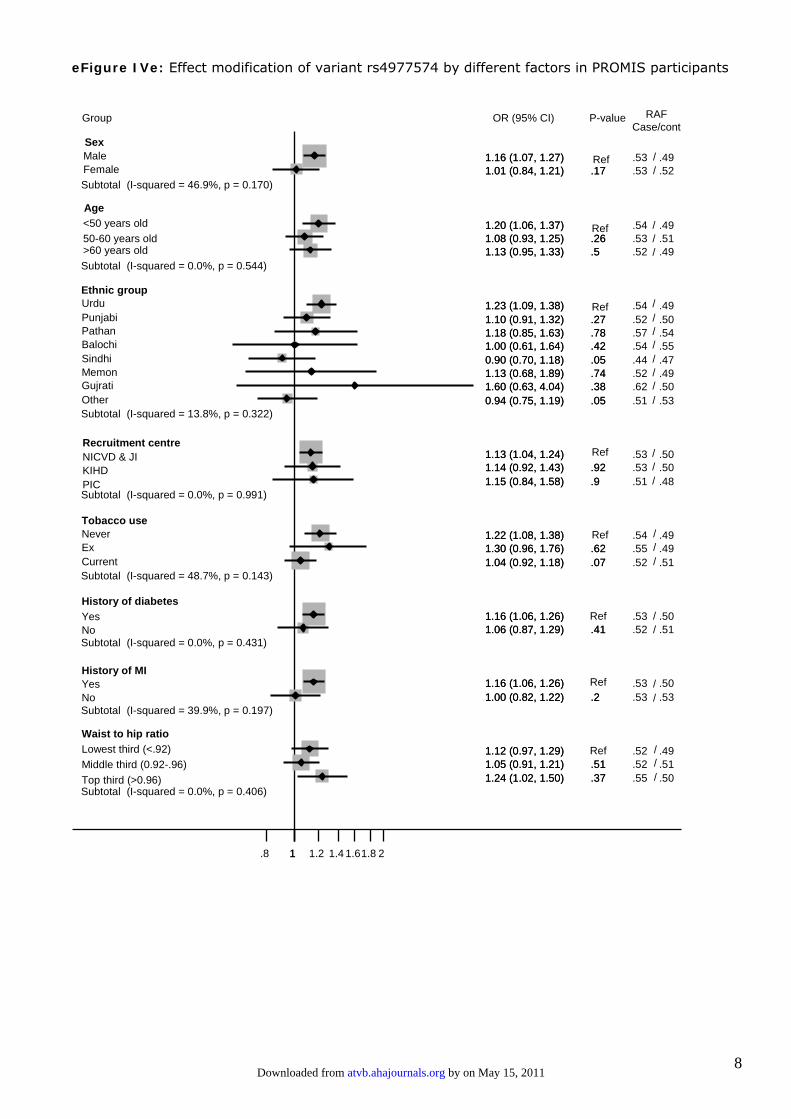
eFigure IVe: Effect modification of variant rs4977574 by different factors in PROMIS participants
Subtotal (I-squared = 46.9%, p = 0.170)
Subtotal (I-squared = 0.0%, p = 0.544)
Subtotal (I-squared = 13.8%, p = 0.322)
Subtotal (I-squared = 0.0%, p = 0.991)
Subtotal (I-squared = 48.7%, p = 0.143)
Subtotal (I-squared = 0.0%, p = 0.431)
Subtotal (I-squared = 39.9%, p = 0.197)
Subtotal (I-squared = 0.0%, p = 0.406)
1.16 (1.07, 1.27)1.01 (0.84, 1.21)
1.20 (1.06, 1.37)1.08 (0.93, 1.25)1.13 (0.95, 1.33)
1.23 (1.09, 1.38)1.10 (0.91, 1.32)1.18 (0.85, 1.63)1.00 (0.61, 1.64)0.90 (0.70, 1.18)1.13 (0.68, 1.89)1.60 (0.63, 4.04)0.94 (0.75, 1.19)
1.13 (1.04, 1.24)1.14 (0.92, 1.43)1.15 (0.84, 1.58)
1.22 (1.08, 1.38)1.30 (0.96, 1.76)1.04 (0.92, 1.18)
1.16 (1.06, 1.26)1.06 (0.87, 1.29)
1.16 (1.06, 1.26)1.00 (0.82, 1.22)
1.12 (0.97, 1.29)1.05 (0.91, 1.21)1.24 (1.02, 1.50)
.17
.26
.5
.27
.78
.42
.05
.74
.38
.05
.92
.9
.62
.07
.41
.2
.51
.37
.53
.53
.54
.53
.52
.54
.52
.57
.54
.44
.52
.62
.51
.53
.53
.51
.54
.55
.52
.53
.52
.53
.53
.52
.52
.55
.49
.52
.49
.51
.49
.49
.50
.54
.55
.47
.49
.50
.53
.50
.50
.48
.49
.49
.51
.50
.51
.50
.53
.49
.51
.50
1.16 (1.07, 1.27)1.01 (0.84, 1.21)
1.20 (1.06, 1.37)1.08 (0.93, 1.25)1.13 (0.95, 1.33)
1.23 (1.09, 1.38)1.10 (0.91, 1.32)1.18 (0.85, 1.63)1.00 (0.61, 1.64)0.90 (0.70, 1.18)1.13 (0.68, 1.89)1.60 (0.63, 4.04)0.94 (0.75, 1.19)
1.13 (1.04, 1.24)1.14 (0.92, 1.43)1.15 (0.84, 1.58)
1.22 (1.08, 1.38)1.30 (0.96, 1.76)1.04 (0.92, 1.18)
1.16 (1.06, 1.26)1.06 (0.87, 1.29)
1.16 (1.06, 1.26)1.00 (0.82, 1.22)
1.12 (0.97, 1.29)1.05 (0.91, 1.21)1.24 (1.02, 1.50)
.17
.26
.5
.27
.78
.42
.05
.74
.38
.05
.92
.9
.62
.07
.41
.2
.51
.37
1.8 1 1.2 1.4 1.61.8 2
RAF Case/cont
Group OR (95% CI) P-value
MaleFemale
UrduPunjabiPathanBalochiSindhiMemonGujratiOther
Recruitment centreNICVD & JIKIHDPIC
Tobacco useNeverExCurrent
Sex
Age<50 years old50-60 years old>60 years old
Ethnic group
History of diabetesYesNo
History of MIYesNo
Waist to hip ratioLowest third (<.92)Middle third (0.92-.96)Top third (>0.96)
//
///
////////
///
///
//
//
///
Ref
Ref
Ref
Ref
Ref
Ref
Ref
Ref
by on May 15, 2011 atvb.ahajournals.orgDownloaded from
9
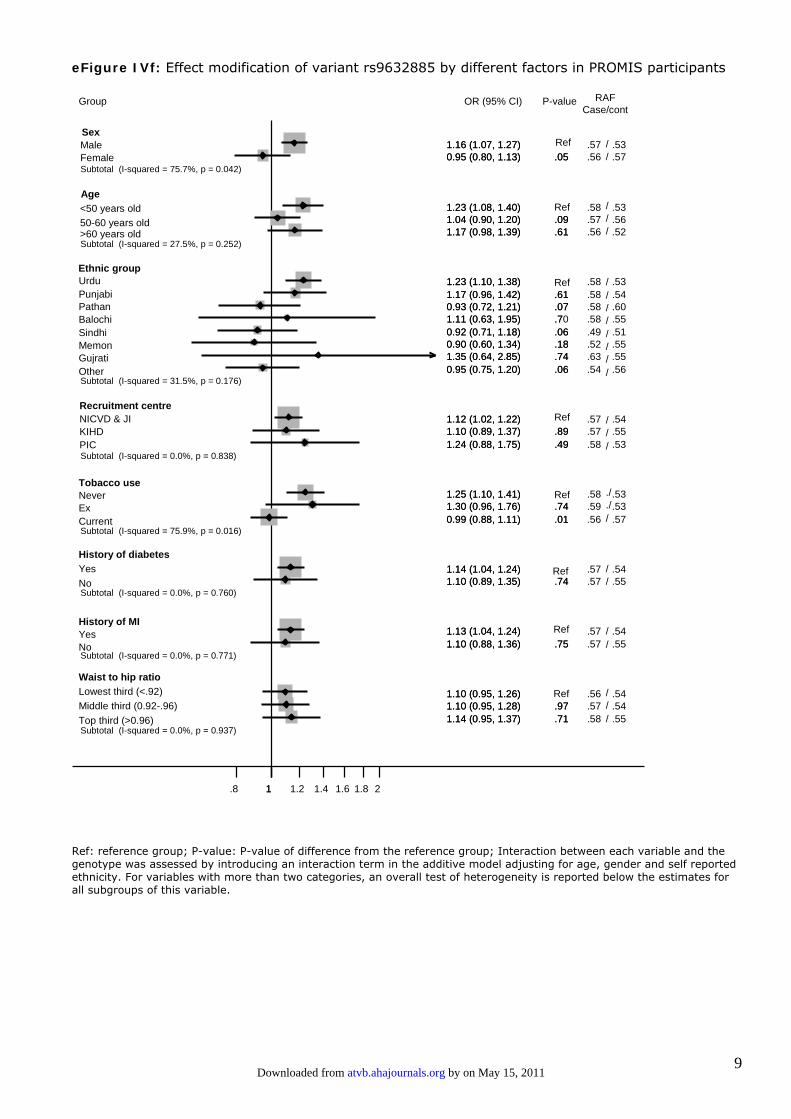
eFigure IVf: Effect modification of variant rs9632885 by different factors in PROMIS participants
Subtotal (I-squared = 75.7%, p = 0.042)
Subtotal (I-squared = 27.5%, p = 0.252)
Subtotal (I-squared = 31.5%, p = 0.176)
Subtotal (I-squared = 0.0%, p = 0.838)
Subtotal (I-squared = 75.9%, p = 0.016)
Subtotal (I-squared = 0.0%, p = 0.760)
Subtotal (I-squared = 0.0%, p = 0.771)
Subtotal (I-squared = 0.0%, p = 0.937)
1.16 (1.07, 1.27)0.95 (0.80, 1.13)
1.23 (1.08, 1.40)1.04 (0.90, 1.20)1.17 (0.98, 1.39)
1.23 (1.10, 1.38)1.17 (0.96, 1.42)0.93 (0.72, 1.21)1.11 (0.63, 1.95)0.92 (0.71, 1.18)0.90 (0.60, 1.34)1.35 (0.64, 2.85)0.95 (0.75, 1.20)
1.12 (1.02, 1.22)1.10 (0.89, 1.37)1.24 (0.88, 1.75)
1.25 (1.10, 1.41)1.30 (0.96, 1.76)0.99 (0.88, 1.11)
1.14 (1.04, 1.24)1.10 (0.89, 1.35)
1.13 (1.04, 1.24)1.10 (0.88, 1.36)
1.10 (0.95, 1.26)1.10 (0.95, 1.28)1.14 (0.95, 1.37)
.05
.09
.61
.61
.07
.7
.06
.18
.74
.06
.89
.49
.74
.01
.74
.75
.97
.71
.57
.56
.58
.57
.56
.58
.58
.58
.58
.49
.52
.63
.54
.57
.57
.58
.58
.59
.56
.57
.57
.57
.57
.56
.57
.58
.53
.57
.53
.56
.52
.53
.54
.60
.55
.51
.55
.55
.56
.54
.55
.53
.53
.53
.57
.54
.55
.54
.55
.54
.54
.55
1.16 (1.07, 1.27)0.95 (0.80, 1.13)
1.23 (1.08, 1.40)1.04 (0.90, 1.20)1.17 (0.98, 1.39)
1.23 (1.10, 1.38)1.17 (0.96, 1.42)0.93 (0.72, 1.21)1.11 (0.63, 1.95)0.92 (0.71, 1.18)0.90 (0.60, 1.34)1.35 (0.64, 2.85)0.95 (0.75, 1.20)
1.12 (1.02, 1.22)1.10 (0.89, 1.37)1.24 (0.88, 1.75)
1.25 (1.10, 1.41)1.30 (0.96, 1.76)0.99 (0.88, 1.11)
1.14 (1.04, 1.24)1.10 (0.89, 1.35)
1.13 (1.04, 1.24)1.10 (0.88, 1.36)
1.10 (0.95, 1.26)1.10 (0.95, 1.28)1.14 (0.95, 1.37)
.05
.09
.61
.61
.07
.70
.06
.18
.74
.06
.89
.49
.74
.01
.74
.75
.97
.71
1.8 1 1.2 1.4 1.6 1.8 2
MaleFemale
UrduPunjabiPathanBalochiSindhiMemonGujratiOther
Recruitment centreNICVD & JIKIHDPIC
Tobacco useNeverExCurrent
Sex
Age<50 years old50-60 years old>60 years old
Ethnic group
History of diabetesYesNo
History of MIYesNo
Waist to hip ratioLowest third (<.92)Middle third (0.92-.96)Top third (>0.96)
//
///
////////
///
./
.//
//
//
///
RAF Case/cont
Group OR (95% CI) P-value
Ref
Ref
Ref
Ref
Ref
Ref
Ref
Ref
Ref: reference group; P-value: P-value of difference from the reference group; Interaction between each variable and the genotype was assessed by introducing an interaction term in the additive model adjusting for age, gender and self reported ethnicity. For variables with more than two categories, an overall test of heterogeneity is reported below the estimates for all subgroups of this variable.
by on May 15, 2011 atvb.ahajournals.orgDownloaded from
10
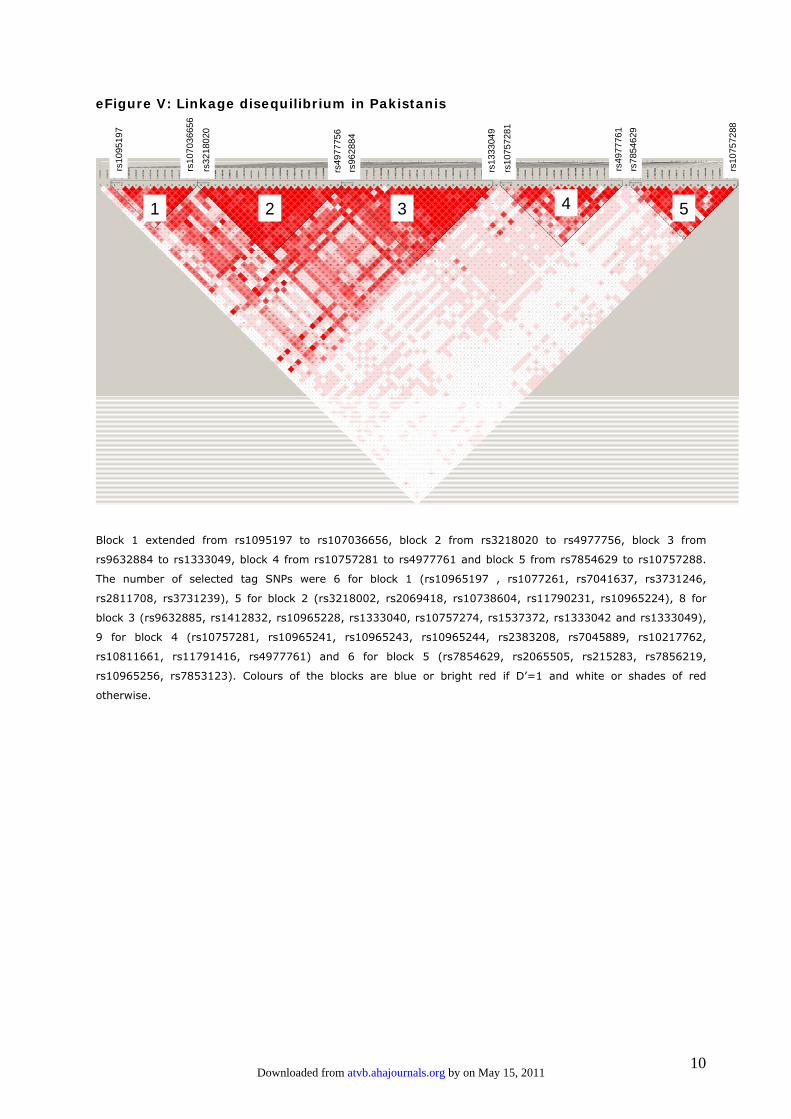
eFigure V: Linkage disequilibrium in Pakistanis
1 2 3 4 5
rs13
3304
9
rs96
2884
rs49
7775
6
rs10
7572
81
rs49
7776
1rs
7854
629
rs10
7572
88
rs10
9519
7
rs10
7036
656
rs32
1802
0
Block 1 extended from rs1095197 to rs107036656, block 2 from rs3218020 to rs4977756, block 3 from
rs9632884 to rs1333049, block 4 from rs10757281 to rs4977761 and block 5 from rs7854629 to rs10757288.
The number of selected tag SNPs were 6 for block 1 (rs10965197 , rs1077261, rs7041637, rs3731246,
rs2811708, rs3731239), 5 for block 2 (rs3218002, rs2069418, rs10738604, rs11790231, rs10965224), 8 for
block 3 (rs9632885, rs1412832, rs10965228, rs1333040, rs10757274, rs1537372, rs1333042 and rs1333049),
9 for block 4 (rs10757281, rs10965241, rs10965243, rs10965244, rs2383208, rs7045889, rs10217762,
rs10811661, rs11791416, rs4977761) and 6 for block 5 (rs7854629, rs2065505, rs215283, rs7856219,
rs10965256, rs7853123). Colours of the blocks are blue or bright red if D’=1 and white or shades of red
otherwise.
by on May 15, 2011 atvb.ahajournals.orgDownloaded from
11
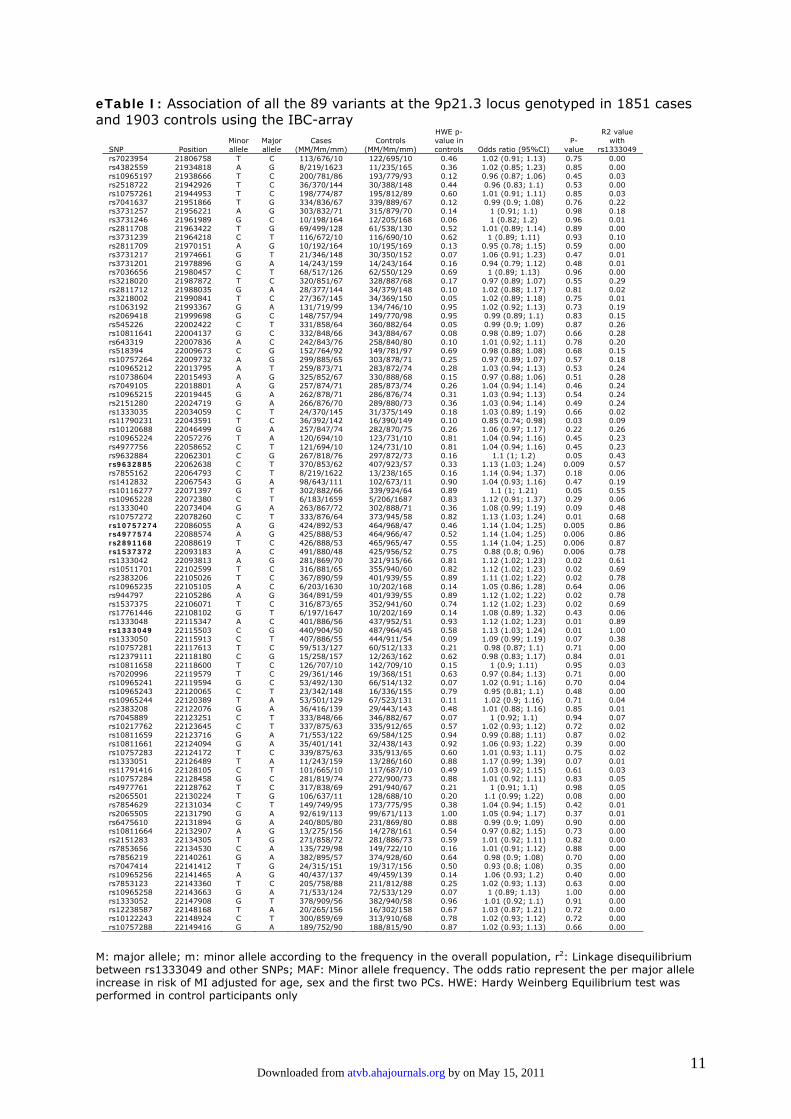
eTable I: Association of all the 89 variants at the 9p21.3 locus genotyped in 1851 cases and 1903 controls using the IBC-array
SNP Position Minor allele
Major allele
Cases (MM/Mm/mm)
Controls (MM/Mm/mm)
HWE p-value in controls Odds ratio (95%CI)
P-value
R2 value with
rs1333049 rs7023954 21806758 T C 113/676/10 122/695/10 0.46 1.02 (0.91; 1.13) 0.75 0.00 rs4382559 21934818 A G 8/219/1623 11/235/165 0.36 1.02 (0.85; 1.23) 0.85 0.00 rs10965197 21938666 T C 200/781/86 193/779/93 0.12 0.96 (0.87; 1.06) 0.45 0.03 rs2518722 21942926 T C 36/370/144 30/388/148 0.44 0.96 (0.83; 1.1) 0.53 0.00 rs10757261 21944953 T C 198/774/87 195/812/89 0.60 1.01 (0.91; 1.11) 0.85 0.03 rs7041637 21951866 T G 334/836/67 339/889/67 0.12 0.99 (0.9; 1.08) 0.76 0.22 rs3731257 21956221 A G 303/832/71 315/879/70 0.14 1 (0.91; 1.1) 0.98 0.18 rs3731246 21961989 G C 10/198/164 12/205/168 0.06 1 (0.82; 1.2) 0.96 0.01 rs2811708 21963422 T G 69/499/128 61/538/130 0.52 1.01 (0.89; 1.14) 0.89 0.00 rs3731239 21964218 C T 116/672/10 116/690/10 0.62 1 (0.89; 1.11) 0.93 0.10 rs2811709 21970151 A G 10/192/164 10/195/169 0.13 0.95 (0.78; 1.15) 0.59 0.00 rs3731217 21974661 G T 21/346/148 30/350/152 0.07 1.06 (0.91; 1.23) 0.47 0.01 rs3731201 21978896 G A 14/243/159 14/243/164 0.16 0.94 (0.79; 1.12) 0.48 0.01 rs7036656 21980457 C T 68/517/126 62/550/129 0.69 1 (0.89; 1.13) 0.96 0.00 rs3218020 21987872 T C 320/851/67 328/887/68 0.17 0.97 (0.89; 1.07) 0.55 0.29 rs2811712 21988035 G A 28/377/144 34/379/148 0.10 1.02 (0.88; 1.17) 0.81 0.02 rs3218002 21990841 T C 27/367/145 34/369/150 0.05 1.02 (0.89; 1.18) 0.75 0.01 rs1063192 21993367 G A 131/719/99 134/746/10 0.95 1.02 (0.92; 1.13) 0.73 0.19 rs2069418 21999698 G C 148/757/94 149/770/98 0.95 0.99 (0.89; 1.1) 0.83 0.15 rs545226 22002422 C T 331/858/64 360/882/64 0.05 0.99 (0.9; 1.09) 0.87 0.26 rs10811641 22004137 G C 332/848/66 343/884/67 0.08 0.98 (0.89; 1.07) 0.66 0.28 rs643319 22007836 A C 242/843/76 258/840/80 0.10 1.01 (0.92; 1.11) 0.78 0.20 rs518394 22009673 C G 152/764/92 149/781/97 0.69 0.98 (0.88; 1.08) 0.68 0.15 rs10757264 22009732 A G 299/885/65 303/878/71 0.25 0.97 (0.89; 1.07) 0.57 0.18 rs10965212 22013795 A T 259/873/71 283/872/74 0.28 1.03 (0.94; 1.13) 0.53 0.24 rs10738604 22015493 A G 325/852/67 330/888/68 0.15 0.97 (0.88; 1.06) 0.51 0.28 rs7049105 22018801 A G 257/874/71 285/873/74 0.26 1.04 (0.94; 1.14) 0.46 0.24 rs10965215 22019445 G A 262/878/71 286/876/74 0.31 1.03 (0.94; 1.13) 0.54 0.24 rs2151280 22024719 G A 266/876/70 289/880/73 0.36 1.03 (0.94; 1.14) 0.49 0.24 rs1333035 22034059 C T 24/370/145 31/375/149 0.18 1.03 (0.89; 1.19) 0.66 0.02 rs11790231 22043591 T C 36/392/142 16/390/149 0.10 0.85 (0.74; 0.98) 0.03 0.09 rs10120688 22046499 G A 257/847/74 282/870/75 0.26 1.06 (0.97; 1.17) 0.22 0.26 rs10965224 22057276 T A 120/694/10 123/731/10 0.81 1.04 (0.94; 1.16) 0.45 0.23 rs4977756 22058652 C T 121/694/10 124/731/10 0.81 1.04 (0.94; 1.16) 0.45 0.23 rs9632884 22062301 C G 267/818/76 297/872/73 0.16 1.1 (1; 1.2) 0.05 0.43 rs9632885 22062638 C T 370/853/62 407/923/57 0.33 1.13 (1.03; 1.24) 0.009 0.57 rs7855162 22064793 C T 8/219/1622 13/238/165 0.16 1.14 (0.94; 1.37) 0.18 0.06 rs1412832 22067543 G A 98/643/111 102/673/11 0.90 1.04 (0.93; 1.16) 0.47 0.19 rs10116277 22071397 G T 302/882/66 339/924/64 0.89 1.1 (1; 1.21) 0.05 0.55 rs10965228 22072380 C T 6/183/1659 5/206/1687 0.83 1.12 (0.91; 1.37) 0.29 0.06 rs1333040 22073404 G A 263/867/72 302/888/71 0.36 1.08 (0.99; 1.19) 0.09 0.48 rs10757272 22078260 C T 333/876/64 373/945/58 0.82 1.13 (1.03; 1.24) 0.01 0.68 rs10757274 22086055 A G 424/892/53 464/968/47 0.46 1.14 (1.04; 1.25) 0.005 0.86 rs4977574 22088574 A G 425/888/53 464/966/47 0.52 1.14 (1.04; 1.25) 0.006 0.86 rs2891168 22088619 T C 426/888/53 465/965/47 0.55 1.14 (1.04; 1.25) 0.006 0.87 rs1537372 22093183 A C 491/880/48 425/956/52 0.75 0.88 (0.8; 0.96) 0.006 0.78 rs1333042 22093813 A G 281/869/70 321/915/66 0.81 1.12 (1.02; 1.23) 0.02 0.61 rs10511701 22102599 T C 316/881/65 355/940/60 0.82 1.12 (1.02; 1.23) 0.02 0.69 rs2383206 22105026 T C 367/890/59 401/939/55 0.89 1.11 (1.02; 1.22) 0.02 0.78 rs10965235 22105105 A C 6/203/1630 10/202/168 0.14 1.05 (0.86; 1.28) 0.64 0.06 rs944797 22105286 A G 364/891/59 401/939/55 0.89 1.12 (1.02; 1.22) 0.02 0.78 rs1537375 22106071 T C 316/873/65 352/941/60 0.74 1.12 (1.02; 1.23) 0.02 0.69 rs17761446 22108102 G T 6/197/1647 10/202/169 0.14 1.08 (0.89; 1.32) 0.43 0.06 rs1333048 22115347 A C 401/886/56 437/952/51 0.93 1.12 (1.02; 1.23) 0.01 0.89 rs1333049 22115503 C G 440/904/50 487/964/45 0.58 1.13 (1.03; 1.24) 0.01 1.00 rs1333050 22115913 C T 407/886/55 444/911/54 0.09 1.09 (0.99; 1.19) 0.07 0.38 rs10757281 22117613 T C 59/513/127 60/512/133 0.21 0.98 (0.87; 1.1) 0.71 0.00 rs12379111 22118180 C G 15/258/157 12/263/162 0.62 0.98 (0.83; 1.17) 0.84 0.01 rs10811658 22118600 T C 126/707/10 142/709/10 0.15 1 (0.9; 1.11) 0.95 0.03 rs7020996 22119579 T C 29/361/146 19/368/151 0.63 0.97 (0.84; 1.13) 0.71 0.00 rs10965241 22119594 G C 53/492/130 66/514/132 0.07 1.02 (0.91; 1.16) 0.70 0.04 rs10965243 22120065 C T 23/342/148 16/336/155 0.79 0.95 (0.81; 1.1) 0.48 0.00 rs10965244 22120389 T A 53/501/129 67/523/131 0.11 1.02 (0.9; 1.16) 0.71 0.04 rs2383208 22122076 G A 36/416/139 29/443/143 0.48 1.01 (0.88; 1.16) 0.85 0.01 rs7045889 22123251 C T 333/848/66 346/882/67 0.07 1 (0.92; 1.1) 0.94 0.07 rs10217762 22123645 C T 337/875/63 335/912/65 0.57 1.02 (0.93; 1.12) 0.72 0.02 rs10811659 22123716 G A 71/553/122 69/584/125 0.94 0.99 (0.88; 1.11) 0.87 0.02 rs10811661 22124094 G A 35/401/141 32/438/143 0.92 1.06 (0.93; 1.22) 0.39 0.00 rs10757283 22124172 T C 339/875/63 335/913/65 0.60 1.01 (0.93; 1.11) 0.75 0.02 rs1333051 22126489 T A 11/243/159 13/286/160 0.88 1.17 (0.99; 1.39) 0.07 0.01 rs11791416 22128105 C T 101/665/10 117/687/10 0.49 1.03 (0.92; 1.15) 0.61 0.03 rs10757284 22128458 G C 281/819/74 272/900/73 0.88 1.01 (0.92; 1.11) 0.83 0.05 rs4977761 22128762 T C 317/838/69 291/940/67 0.21 1 (0.91; 1.1) 0.98 0.05 rs2065501 22130224 T G 106/637/11 128/688/10 0.20 1.1 (0.99; 1.22) 0.08 0.00 rs7854629 22131034 C T 149/749/95 173/775/95 0.38 1.04 (0.94; 1.15) 0.42 0.01 rs2065505 22131790 G A 92/619/113 99/671/113 1.00 1.05 (0.94; 1.17) 0.37 0.01 rs6475610 22131894 G A 240/805/80 231/869/80 0.88 0.99 (0.9; 1.09) 0.90 0.00 rs10811664 22132907 A G 13/275/156 14/278/161 0.54 0.97 (0.82; 1.15) 0.73 0.00 rs2151283 22134305 T G 271/858/72 281/886/73 0.59 1.01 (0.92; 1.11) 0.82 0.00 rs7853656 22134530 C A 135/729/98 149/722/10 0.16 1.01 (0.91; 1.12) 0.88 0.00 rs7856219 22140261 G A 382/895/57 374/928/60 0.64 0.98 (0.9; 1.08) 0.70 0.00 rs7047414 22141412 T G 24/315/151 19/317/156 0.50 0.93 (0.8; 1.08) 0.35 0.00 rs10965256 22141465 A G 40/437/137 49/459/139 0.14 1.06 (0.93; 1.2) 0.40 0.00 rs7853123 22143360 T C 205/758/88 211/812/88 0.25 1.02 (0.93; 1.13) 0.63 0.00 rs10965258 22143663 G A 71/533/124 72/533/129 0.07 1 (0.89; 1.13) 1.00 0.00 rs1333052 22147908 G T 378/909/56 382/940/58 0.96 1.01 (0.92; 1.1) 0.91 0.00 rs12238587 22148168 T A 20/265/156 16/302/158 0.67 1.03 (0.87; 1.21) 0.72 0.00 rs10122243 22148924 C T 300/859/69 313/910/68 0.78 1.02 (0.93; 1.12) 0.72 0.00 rs10757288 22149416 G A 189/752/90 188/815/90 0.87 1.02 (0.93; 1.13) 0.66 0.00
M: major allele; m: minor allele according to the frequency in the overall population, r2: Linkage disequilibrium between rs1333049 and other SNPs; MAF: Minor allele frequency. The odds ratio represent the per major allele increase in risk of MI adjusted for age, sex and the first two PCs. HWE: Hardy Weinberg Equilibrium test was performed in control participants only
by on May 15, 2011 atvb.ahajournals.orgDownloaded from

12
eTable II: Characteristics of studies included in the current literature based meta-analyses
Author
Consortium and studies names
Type Design Source controls
Location N cases/ N controls
Diagnostic of CAD Genotyping platform
SNPs included in the literature based meta-analysis
Abdullah GeneQuest Rep. CC Population USA 310/560 CAD/MI TaqMan Assay, Applied Biosystems
rs2383206, rs10757274
Assimes ADVANCE: White, Black, East Asian, Hispanic, Mixed (Black) and Mixed (non Black)
Rep. CC Health care system
USA 3618/3468 MI/PTCA/CABG/angina
TaqMan Assay, Applied Biosystems
rs2383206, rs10757274
Broadbent PROCARDIS: Germany, Italy, Sweden, UK
Rep. CC Hospital Europe 4251/4443 MI/PTCA/CABG/angina
Sequenom iPLEXTM rs518394, rs1333040,rs1333042, rs1333048, rs1333049, rs2383206, rs2891168, rs4977574, rs10116277, rs10757272, rs10757274, rs10757283
CAD Consortium
AMC-PAS, ECTIM, EPIC-Norfolk, GerMIFS$, KORA/GOC$, LURIC, MORGAM$, UKMI$, PopGen$
Rep. CC Mixed Europe 11550/11205 MI/Stenosis (>50%)/PTCA/ CABG/Angina
Sequenom iPLEXTM rs1333049
Chen China Study Rep. CC Health care system
China 232/212 MI/Stenosis (≥50%)
TaqMan Assay, Applied Biosystems
rs10757278, rs2383207
Dehghan Rotterdam study Rep. PC Population Netherlands
588/5251 MI/CABG/PTCA TaqMan Assay, Applied Biosystems
rs10757274
Ghazouani Tunisia study Rep. CC Population Tunisia 296/324 Stenosis/MI TaqMan Assay, Applied Biosystems
rs1333049
Iceland A GWA CC Mixed Europe, USA
MI Infinium HumanHap300 (Illumina, USA)
rs1333040, rs10116277 Helgadottir
Iceland B, Atlanta, Durham, PennCath
Rep. CC Hospital
4587/12767
MI/CABG/PTCA Centaurus (Nanogen) platform
rs1333040, rs1333048, rs4977574, rs10116277
Hinohara SMC2 & Tokyo study Rep. CC NF Japan 1283/1857 MI/Stenosis (≥50%)
TaqMan Assay, Applied Biosystems
rs1333049
Hiura Suita study Rep. CC Population Japan 589/2475 MI TaqMan Assay, Applied Biosystems
rs1333049
Karvanen MORGAM$ Rep. NCC Population Europe 1050/1878 MI/angina/CABG/PCI
Sequenom iPLEXTM rs1333049, rs10757283
Lemmens Caregene Ref CC Population Belgium 926/648 MI/angina/CABG/PCI
TaqMan Assay, Applied Biosystems
rs10757278
OHS-1 GWA CC Hospital McPherson
ARIC**, CCHS, DHS, OHS-2, OHS-3
Rep. CC Population and hospital
Canada, USA,
Europe
4306/20119 MI/PTCA/CABG/CHD death
Perlegen Sciences rs2383206, rs10757274
MIGC deCODE, MIGen, AMI Gene-VHS-MAHI-IFS# GerMIFS II#
INTERHEART# and PennCath# MedSTAR#
Rep. CC Population, blood donor
Europe & USA
NF MI Affymetrix GeneChip Human Mapping 500KArray Set or SNP array 6.0
rs4977574
Paynter Women's Genome Health Study
Rep. PC Population USA 469/10660 MI/PTCA/CABG/CHD death
Luminex100 xMAP microspheres (Luminex, USA)
rs10757274
Samani GerMIFS Rep. CC Population Europe 844/1605 early MI and family history of MI
Affymetrix GeneChip Human Mapping 500K Array Set
rs518394, rs1333042, rs1333048, rs1333049, rs2891168, rs10757272
Schaefer PopGen 1, PopGen 2 Rep. CC Blood donors
Europe Stenosis (>70%)/MI/PTCA/ CABG
SNPlex and TaqMan GenotypingSystem (Applied Biosystems, USA)
rs1333042, rs1333048, rs2891168
Schunkert CARDIOGENICS: AtheroGene, GerMIFS II, LMDS, MONICA/KORA, PopGen, PRIME, UKMI
Rep. CC Mixed Europe 8912/9828 MI/angina TaqMan Assay, Applied Biosystems
rs1333049
Shen SMC2 Rep. CC Hospital Korea 611/294 MI/stenosis/CABG/PCI
TaqMan Assay, Applied Biosystems
rs2383206, rs10757274
Shen VHP Rep. CC Hospital Europe 416/308 MI TaqMan Assay, Applied Biosystems
rs2383206, rs10757274
Talmud NPHS2 Rep. PC Population UK 264/2430 MI/PTCA/CABG TaqMan Assay, Applied Biosystems
rs2383206, rs10757274
WTCCC WTCCC GWA CC Population and blood donors
UK 1926/2938 MI or CABG/PTCA Affymetric GeneChip Human Mapping 500K Array Set
rs518394, rs1333042, rs1333048, rs1333049, rs2891168, rs10757272, rs10757283
Ye Bruneck study Rep. PC Population Italy 56/713 MI/CABG/PTCA TaqMan Assay, Applied Biosystems
rs1333049
Zee Physician's Health Study
Rep. NCC Health physicians
USA 335/335 MI NF rs2383206, rs10757274
Zhang Chaoyang study Rep. CC Hospital China 432/430 MI Orchid BioSciences (GenomLab SNPstream genotyping platform)
rs2383206, rs10757274
Zhou Wuhan study Rep. CC Population China 1360/1360 stenosis (>= 50%)/MI/CABG/PCI
TaqMan Assay, Applied Biosystems
rs2383206
Rep: Replication study; GWA: genome wide association study; PC: prospective cohort study; CC: Case-control study; NCC: Nested case-control study; MI: Myocardial Infarction; NF: Not found. ** except ARIC, a prospective cohort study; £The following studies from MIGC were not included in the analysis for rs4977574 because they overlapped partially with previously published results. For prospective cohorts, the number of controls corresponds to the number of individuals who had not developed the disease at the end of follow-up. Study acronyms: ADVANCE: Atherosclerosis Disease Vascular FuNction & GenetiC Epidemiology; PROCARDIS; AMC-PAS: Academic Medical Centre Amsterdam Premature Atherosclerosis Study; ECTIM: Etude Cas-Temoin sur l’Infarctus du Myocarde; EPIC: European Prospective Investigation into Cancer and Nutrition Study; GerMIFS: German MI Family Study; LURIC: Ludwigshafen Risk and Cardiovascular Heatlh; PopGen: PopGen biobank; UKMI: UK MI; SMC: Samsung Medical Centre; OHS: Ottawa Heart Study,; ARIC: Atherosclerosis Risk in Community; CCHS: Copenhagen City Heart Study; DHS: Dallas Heart Study; AMI Gene: Acute MI Gene; VHS: Verona Heart Study; MAHI: Mid America Heart Institute IFS: Irish Family Study;
by on May 15, 2011 atvb.ahajournals.orgDownloaded from

13
PennCATH: University of Pennsylvania Catheterization Study; MedSTAR: Washington based Study; VHP: Verona Heart Project; NPHS: Northwick Park Health Study; WTCCC: Wellcome Trust Case Control Consortium.
by on May 15, 2011 atvb.ahajournals.orgDownloaded from
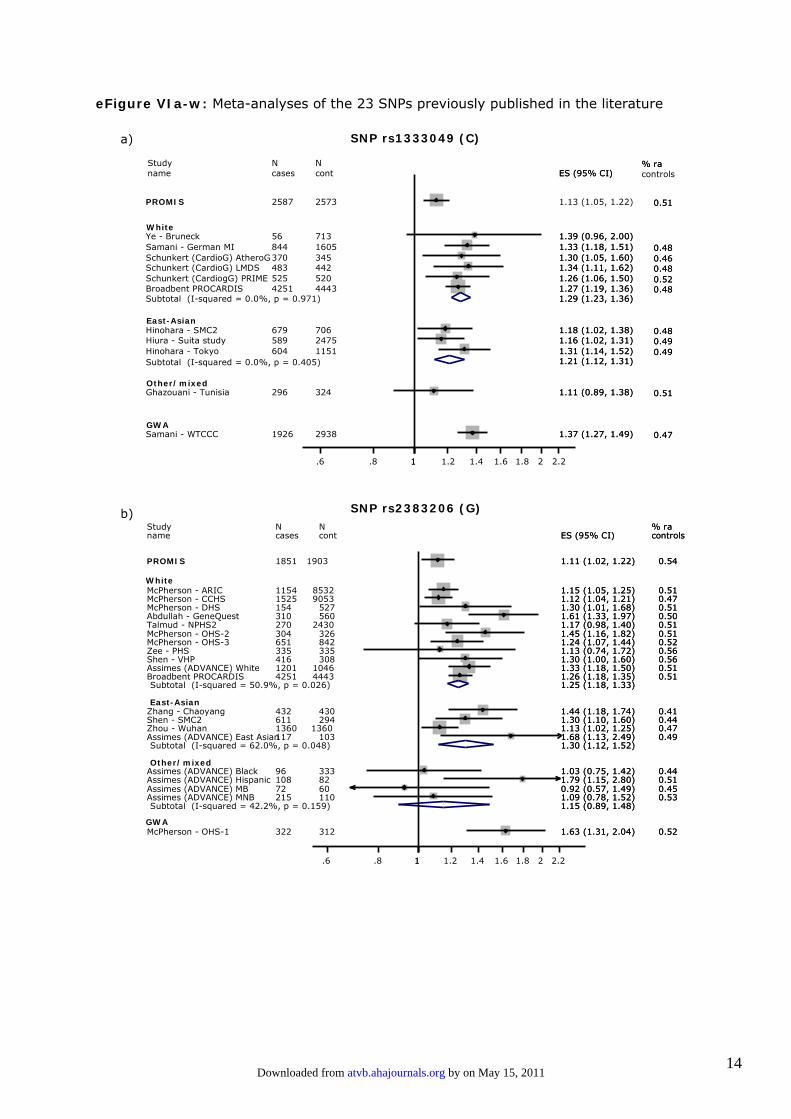
14
eFigure VIa-w: Meta-analyses of the 23 SNPs previously published in the literature
Subtotal (I-squared = 0.0%, p = 0.971)
Ye - Bruneck
PROMIS
name
Schunkert (CardiogG) PRIME
Ghazouani - Tunisia
Study
Schunkert (CardioG) LMDS
Hiura - Suita study
Broadbent PROCARDIS
Hinohara - Tokyo
Hinohara - SMC2
Schunkert (CardioG) AtheroG
Samani - WTCCC
Samani - German MI56
2587
cases
525
296
N
483
589
4251
604
679
370
1926
844713
2573
cont
520
324
N
442
2475
4443
1151
706
345
2938
16051.39 (0.96, 2.00)
1.13 (1.05, 1.22)
ES (95% CI)
1.26 (1.06, 1.50)
1.11 (0.89, 1.38)
1.21 (1.12, 1.31)
1.34 (1.11, 1.62)
1.16 (1.02, 1.31)
1.27 (1.19, 1.36)
1.31 (1.14, 1.52)
1.18 (1.02, 1.38)
1.29 (1.23, 1.36)
1.30 (1.05, 1.60)
1.37 (1.27, 1.49)
1.33 (1.18, 1.51)1.39 (0.96, 2.00)
ES (95% CI)
1.26 (1.06, 1.50)
1.11 (0.89, 1.38)
1.21 (1.12, 1.31)
1.34 (1.11, 1.62)
1.16 (1.02, 1.31)
1.27 (1.19, 1.36)
1.31 (1.14, 1.52)
1.18 (1.02, 1.38)
1.29 (1.23, 1.36)
1.30 (1.05, 1.60)
1.37 (1.27, 1.49)
1.33 (1.18, 1.51)
1.6 .8 1 1.2 1.4 1.6 1.8 2 2.2
SNP rs1333049 (C)
0.51
controls
0.52
0.51
% ra
0.48
0.49
0.48
0.49
0.48
0.46
0.47
0.48
0.51
0.52
0.51
% ra
0.48
0.49
0.48
0.49
0.48
0.46
0.47
0.48
East-Asian
Subtotal (I-squared = 50.9%, p = 0.026)
Subtotal (I-squared = 62.0%, p = 0.048)
Subtotal (I-squared = 42.2%, p = 0.159)
Other/mixedAssimes (ADVANCE) Black
McPherson - ARIC
McPherson - OHS-1
Assimes (ADVANCE) Hispanic
Zee - PHS
Abdullah - GeneQuest
Broadbent PROCARDIS
McPherson - CCHS
Talmud - NPHS2
name
Zhang - ChaoyangShen - SMC2
McPherson - OHS-3
PROMIS
Study
Zhou - WuhanAssimes (ADVANCE) East Asian
McPherson - DHS
Shen - VHP
Assimes (ADVANCE) MBAssimes (ADVANCE) MNB
Assimes (ADVANCE) White
McPherson - OHS-2
333
8532
312
335
560
4443
9053
2430
cont
430294
842
1903
1360103
527
308
110
1046
326
1.03 (0.75, 1.42)
1.15 (1.05, 1.25)
1.63 (1.31, 2.04)
1.79 (1.15, 2.80)
1.13 (0.74, 1.72)
1.61 (1.33, 1.97)
1.26 (1.18, 1.35)
1.12 (1.04, 1.21)
1.17 (0.98, 1.40)
ES (95% CI)
1.44 (1.18, 1.74)1.30 (1.10, 1.60)
1.24 (1.07, 1.44)
1.11 (1.02, 1.22)
1.25 (1.18, 1.33)
1.30 (1.12, 1.52)
1.13 (1.02, 1.25)1.68 (1.13, 2.49)
1.30 (1.01, 1.68)
1.30 (1.00, 1.60)
0.92 (0.57, 1.49)
1.15 (0.89, 1.48)1.09 (0.78, 1.52)
1.33 (1.18, 1.50)
1.45 (1.16, 1.82)
0.44
0.51
0.52
0.51
0.56
0.50
0.51
0.47
0.51
controls
0.410.44
0.52
0.54
% ra
0.470.49
0.51
0.56
0.450.53
0.51
0.51
1.6 .8 1 1.2 1.4 1.6 1.8 2 2.2
SNP rs2383206 (G)
96
1154
322
108
335
310
4251
1525
270
cases
432611
651
1851
N
1360117
154
416
72215
1201
304
82
N
60
Other/mixed
East-Asian
GWA
White
White
GWA
Subtotal (I-squared = 0.0%, p = 0.405)
a)
b)
by on May 15, 2011 atvb.ahajournals.orgDownloaded from
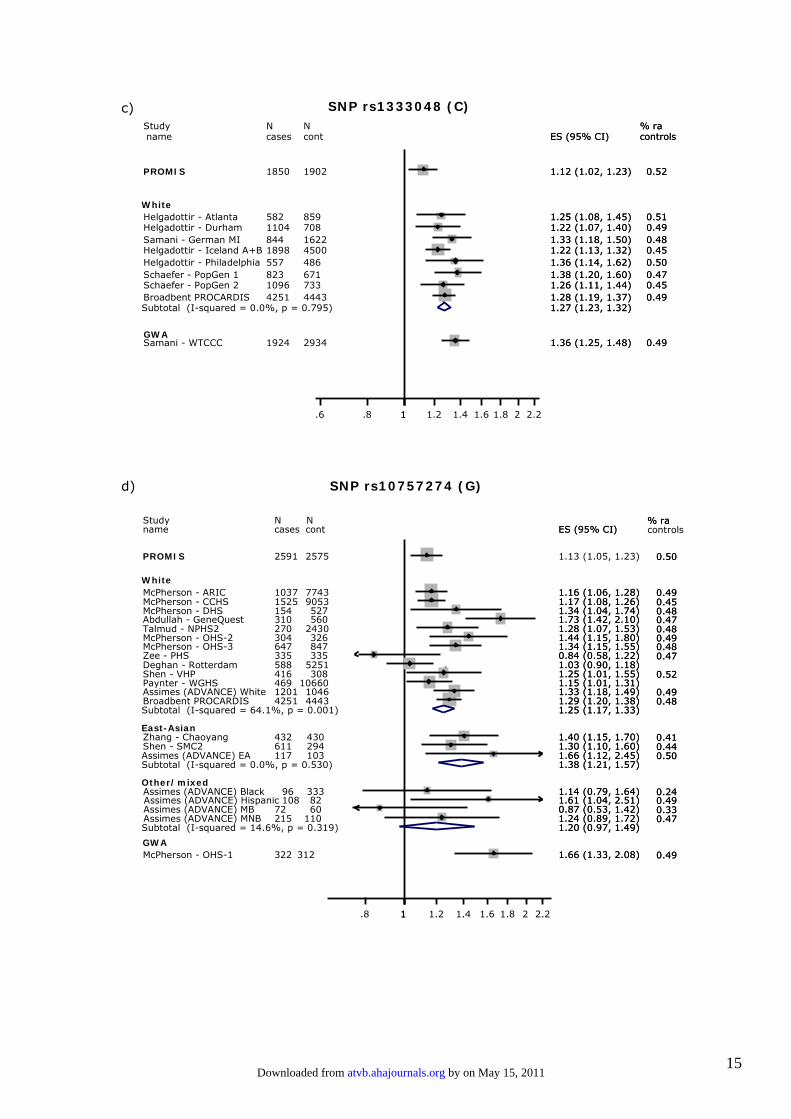
15
Subtotal (I-squared = 0.0%, p = 0.795)
White
Samani - German MI
Schaefer - PopGen 2
Helgadottir - Durham
name
Helgadottir - Atlanta
Samani - WTCCC
PROMIS
Helgadottir - Philadelphia
Broadbent PROCARDIS
Study
Schaefer - PopGen 1
Helgadottir - Iceland A+B844
1096
1104
cases
582
1924
1850
557
4251
N
823
18981622
733
708
cont
859
2934
1902
486
4443
N
671
45001.33 (1.18, 1.50)
1.26 (1.11, 1.44)
1.22 (1.07, 1.40)
ES (95% CI)
1.25 (1.08, 1.45)
1.27 (1.23, 1.32)
1.36 (1.25, 1.48)
1.12 (1.02, 1.23)
1.36 (1.14, 1.62)
1.28 (1.19, 1.37)
1.38 (1.20, 1.60)
1.22 (1.13, 1.32)0.48
0.45
0.49
controls
0.51
0.49
0.52
0.50
0.49
% ra
0.47
0.451.33 (1.18, 1.50)
1.26 (1.11, 1.44)
1.22 (1.07, 1.40)
ES (95% CI)
1.25 (1.08, 1.45)
1.27 (1.23, 1.32)
1.36 (1.25, 1.48)
1.12 (1.02, 1.23)
1.36 (1.14, 1.62)
1.28 (1.19, 1.37)
1.38 (1.20, 1.60)
1.22 (1.13, 1.32)0.48
0.45
0.49
controls
0.51
0.49
0.52
0.50
0.49
% ra
0.47
0.45
1.6 .8 1 1.2 1.4 1.6 1.8 2 2.2
SNP rs1333048 (C)
SNP rs10757274 (G)
Subtotal (I-squared = 64.1%, p = 0.001)
Other/mixed
Subtotal (I-squared = 0.0%, p = 0.530)
East-Asian
Subtotal (I-squared = 14.6%, p = 0.319)
Assimes (ADVANCE) White
McPherson - OHS-3
Assimes (ADVANCE) Hispanic
Assimes (ADVANCE) MNB
Paynter - WGHS
McPherson - OHS-1
Assimes (ADVANCE) Black
Shen - VHP
McPherson - DHS
Shen - SMC2
Study
Broadbent PROCARDIS
Talmud - NPHS2
name
PROMIS
McPherson - OHS-2
Zee - PHS
Assimes (ADVANCE) MB
Abdullah - GeneQuest
Assimes (ADVANCE) EA
Deghan - Rotterdam
McPherson - CCHS
Zhang - Chaoyang
McPherson - ARIC
1201
647
108
215
469
322
96
416
154
611
N
4251
270
cases
2591
304
335
72
310
117
588
1525
432
1037
1046
847
82
110
10660
312
333
308
527
294
N
4443
2430
cont
2575
326
335
60
560
103
5251
9053
430
7743
1.33 (1.18, 1.49)
1.34 (1.15, 1.55)
1.61 (1.04, 2.51)
1.25 (1.17, 1.33)
1.24 (0.89, 1.72)
1.15 (1.01, 1.31)
1.66 (1.33, 2.08)
1.14 (0.79, 1.64)
1.25 (1.01, 1.55)
1.34 (1.04, 1.74)
1.30 (1.10, 1.60)
1.38 (1.21, 1.57)
1.29 (1.20, 1.38)
1.28 (1.07, 1.53)
ES (95% CI)
1.20 (0.97, 1.49)
1.13 (1.05, 1.23)
1.44 (1.15, 1.80)
0.84 (0.58, 1.22)
0.87 (0.53, 1.42)
1.73 (1.42, 2.10)
1.66 (1.12, 2.45)
1.03 (0.90, 1.18)
1.17 (1.08, 1.26)
1.40 (1.15, 1.70)
1.16 (1.06, 1.28)
0.49
0.48
0.49
0.47
0.49
0.24
0.52
0.48
0.44
% ra
0.48
0.48
controls
0.50
0.49
0.47
0.33
0.47
0.50
0.45
0.41
0.49
1.33 (1.18, 1.49)
1.34 (1.15, 1.55)
1.61 (1.04, 2.51)
1.25 (1.17, 1.33)
1.24 (0.89, 1.72)
1.15 (1.01, 1.31)
1.66 (1.33, 2.08)
1.14 (0.79, 1.64)
1.25 (1.01, 1.55)
1.34 (1.04, 1.74)
1.30 (1.10, 1.60)
1.38 (1.21, 1.57)
1.29 (1.20, 1.38)
1.28 (1.07, 1.53)
ES (95% CI)
1.20 (0.97, 1.49)
1.44 (1.15, 1.80)
0.84 (0.58, 1.22)
0.87 (0.53, 1.42)
1.73 (1.42, 2.10)
1.66 (1.12, 2.45)
1.03 (0.90, 1.18)
1.17 (1.08, 1.26)
1.40 (1.15, 1.70)
1.16 (1.06, 1.28)
0.49
0.48
0.49
0.47
0.49
0.24
0.52
0.48
0.44
% ra
0.48
0.48
0.50
0.49
0.47
0.33
0.47
0.50
0.45
0.41
0.49
1.8 1 1.2 1.4 1.6 1.8 2 2.2
GWA
GWA
White
c)
d)
by on May 15, 2011 atvb.ahajournals.orgDownloaded from

16
GWA
White
PROMIS
Subtotal (I-squared = 0.0%, p = 0.501)
name
Broadbent PROCARDISSamani - German MI
Samani - WTCCC
Studycases
4251
1851
743
1922
Ncont
4443
1903
1575
2932
NES (95% CI)
1.20 (1.12, 1.28)
0.98 (0.88, 1.08)
1.26 (1.11, 1.43)
1.23 (1.13, 1.33)
1.21 (1.14, 1.29)
controls
0.56
0.72
0.55
0.54
% raES (95% CI)
1.20 (1.12, 1.28)
0.98 (0.88, 1.08)
1.26 (1.11, 1.43)
1.23 (1.13, 1.33)
1.21 (1.14, 1.29)
controls
0.56
0.72
0.55
0.54
% ra
1.6 .8 1 1.2 1.4 1.6 1.8 2 2.2
SNP rs518394 (G)
Subtotal (I-squared = 58.6%, p = 0.025)
White
Samani - WTCCC
Study
Broadbent (PROCARDIS) GermanySchaefer - PopGen 2
Broadbent (PROCARDIS) UKBroadbent (PROCARDIS) Sweden
Schaefer - PopGen 1
Broadbent (PROCARDIS) Italy
name
PROMIS
Samani - German MI
1926
N
4361096
3253010
818
480
cases
2586
748
2938
N
524733
5712829
777
519
cont
2576
1640
1.35 (1.24, 1.46)
1.21 (1.11, 1.31)
1.26 (1.02, 1.55)1.30 (1.14, 1.49)
1.26 (1.00, 1.59)1.28 (1.18, 1.39)
1.07 (0.93, 1.21)
1.36 (1.11, 1.67)
ES (95% CI)
1.14 (1.05, 1.23)
1.03 (0.91, 1.17)
0.48
% ra
0.440.52
controls
0.50
0.47
1.35 (1.24, 1.46)
1.21 (1.11, 1.31)
1.26 (1.02, 1.55)1.30 (1.14, 1.49)
1.26 (1.00, 1.59)1.28 (1.18, 1.39)
1.07 (0.93, 1.21)
1.36 (1.11, 1.67)
ES (95% CI)
1.03 (0.91, 1.17)
0.48
% ra
0.440.52
controls
0.50
0.47
1.6 .8 1 1.2 1.4 1.6 1.8 2 2.2
SNP rs2891168 (G)
Subtotal (I-squared = 20.4%, p = 0.285)
White
Study
Broadbent PROCARDIS
Helgadottir - Atlanta
Helgadottir - PhiladelphiaHelgadottir - Iceland BHelgadottir - Durham
PROMIS
Helgadottir - Iceland A
nameN
4251
596
5826651137
1851
1607
casesN
4443
1284
5043533718
1903
6728
cont
1.23 (1.16, 1.30)1.22 (1.14, 1.31)
1.39 (1.19, 1.62)
1.33 (1.11, 1.59)1.18 (1.05, 1.33)1.13 (0.98, 1.30)
1.08 (0.99, 1.19)
1.23 (1.14, 1.33)
ES (95% CI)% ra
0.56
0.57
0.580.500.59
0.61
0.49
controls
1.23 (1.16, 1.30)1.22 (1.14, 1.31)
1.39 (1.19, 1.62)
1.33 (1.11, 1.59)1.18 (1.05, 1.33)1.13 (0.98, 1.30)
1.08 (0.99, 1.19)
1.23 (1.14, 1.33)
ES (95% CI)% ra
0.56
0.57
0.580.500.59
0.61
0.49
controls
1.6 .8 1 1.2 1.4 1.6 1.8 2 2.2
SNP rs1333040 (T)
GWA
GWA
e)
f)
g)
by on May 15, 2011 atvb.ahajournals.orgDownloaded from
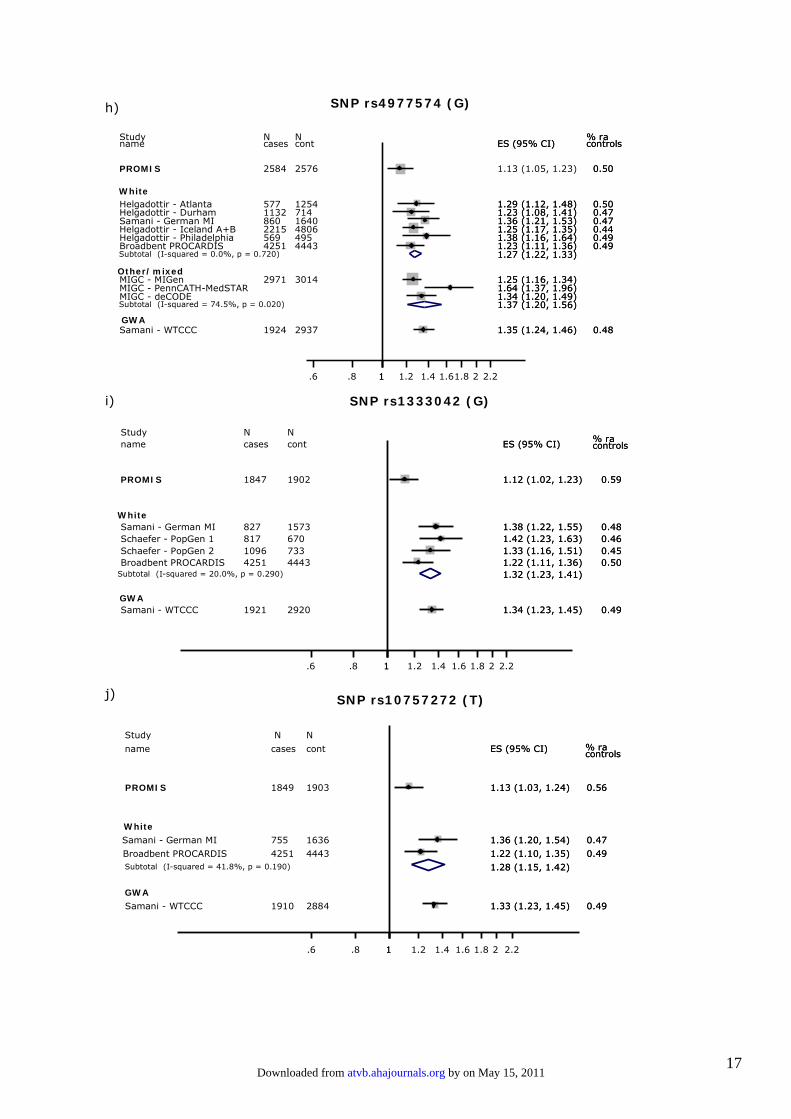
17
Other/mixed
Subtotal (I-squared = 74.5%, p = 0.020)
Subtotal (I-squared = 0.0%, p = 0.720)
Helgadottir - Durham
Study
Helgadottir - Philadelphia
PROMIS
name
Samani - WTCCC
Helgadottir - Iceland A+B
Helgadottir - Atlanta
MIGC - MIGenMIGC - PennCATH-MedSTARMIGC - deCODE
Broadbent PROCARDIS
Samani - German MI1132
N
569
2584
cases
1924
2215
577
2971
4251
860714
N
495
2576
cont
2937
4806
1254
3014
4443
16401.23 (1.08, 1.41)
1.38 (1.16, 1.64)
1.13 (1.05, 1.23)
1.37 (1.20, 1.56)
ES (95% CI)
1.35 (1.24, 1.46)
1.25 (1.17, 1.35)
1.27 (1.22, 1.33)
1.29 (1.12, 1.48)
1.25 (1.16, 1.34)1.64 (1.37, 1.96)1.34 (1.20, 1.49)
1.23 (1.11, 1.36)
1.36 (1.21, 1.53)0.47
% ra
0.49
0.50
controls
0.48
0.44
0.50
0.49
0.471.23 (1.08, 1.41)
1.38 (1.16, 1.64)
1.37 (1.20, 1.56)
ES (95% CI)
1.35 (1.24, 1.46)
1.25 (1.17, 1.35)
1.27 (1.22, 1.33)
1.29 (1.12, 1.48)
1.25 (1.16, 1.34)1.64 (1.37, 1.96)1.34 (1.20, 1.49)
1.23 (1.11, 1.36)
1.36 (1.21, 1.53)0.47
% ra
0.49
0.50
controls
0.48
0.44
0.50
0.49
0.47
1.6 .8 1 1.2 1.4 1.61.8 2 2.2
SNP rs4977574 (G)
GWA
Subtotal (I-squared = 20.0%, p = 0.290)
WhiteSamani - German MI
nameStudy
Samani - WTCCC
Broadbent PROCARDISSchaefer - PopGen 2
PROMIS
Schaefer - PopGen 1827
casesN
1921
42511096
1847
8171573
contN
2920
4443733
1902
6701.38 (1.22, 1.55)
ES (95% CI)
1.32 (1.23, 1.41)
1.34 (1.23, 1.45)
1.22 (1.11, 1.36)1.33 (1.16, 1.51)
1.12 (1.02, 1.23)
1.42 (1.23, 1.63)0.48
0.49
0.500.45
0.59
0.461.38 (1.22, 1.55)
ES (95% CI)
1.32 (1.23, 1.41)
1.34 (1.23, 1.45)
1.22 (1.11, 1.36)1.33 (1.16, 1.51)
1.12 (1.02, 1.23)
1.42 (1.23, 1.63)0.48
0.49
0.500.45
0.59
0.46
1.6 .8 1 1.2 1.4 1.6 1.8 2 2.2
SNP rs1333042 (G)
White
Subtotal (I-squared = 41.8%, p = 0.190)
GWA
PROMIS
Broadbent PROCARDIS
name
Samani - WTCCC
Samani - German MI
Study
1849
4251
cases
1910
755
N
1903
4443
cont
2884
1636
N
1.13 (1.03, 1.24)
1.22 (1.10, 1.35)
ES (95% CI)
1.33 (1.23, 1.45)
1.28 (1.15, 1.42)
1.36 (1.20, 1.54)
0.56
0.49
0.49
0.47
1.13 (1.03, 1.24)
1.22 (1.10, 1.35)
ES (95% CI)
1.33 (1.23, 1.45)
1.28 (1.15, 1.42)
1.36 (1.20, 1.54)
0.56
0.49
0.49
0.47
1.6 .8 1 1.2 1.4 1.6 1.8 2 2.2
SNP rs10757272 (T)
White
GWA
h)
i)
j)
% racontrols% racontrols
% racontrols% racontrols
by on May 15, 2011 atvb.ahajournals.orgDownloaded from
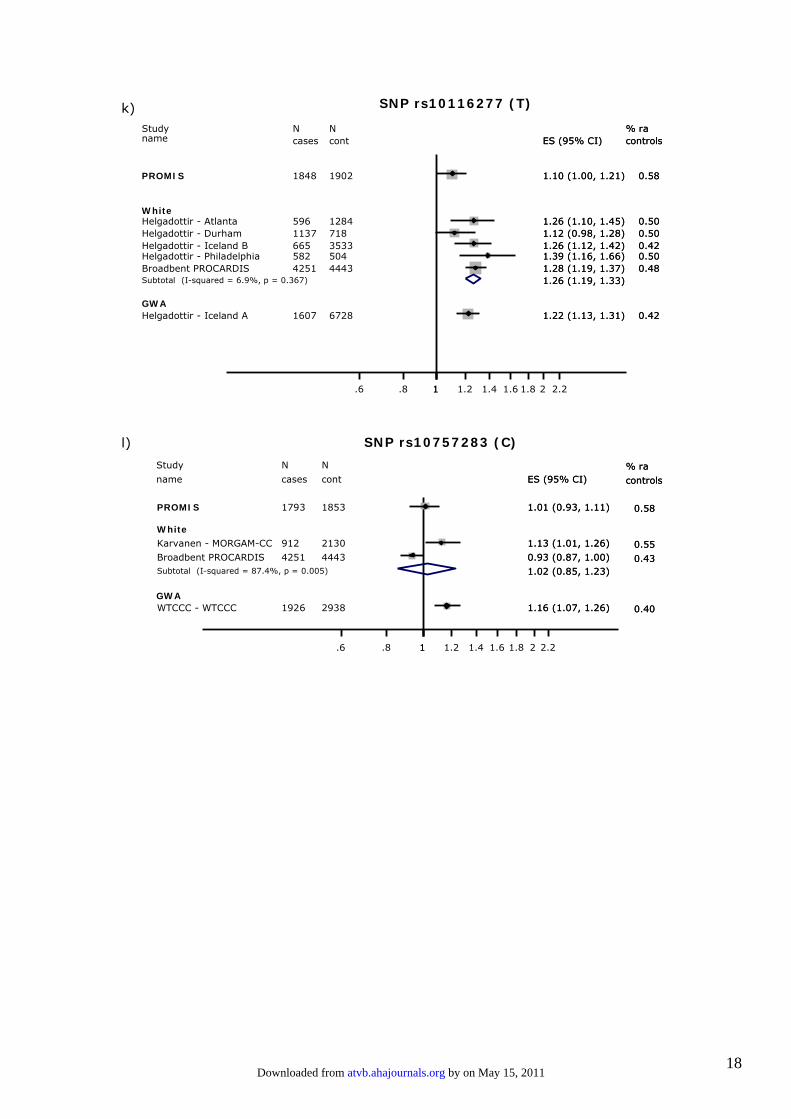
18
White
GWA
Subtotal (I-squared = 6.9%, p = 0.367)
Helgadottir - Iceland BHelgadottir - Durham
name
Helgadottir - Atlanta
Helgadottir - Iceland A
Helgadottir - PhiladelphiaBroadbent PROCARDIS
PROMIS
Study
6651137
cases
596
1607
5824251
1848
N
3533718
cont
1284
6728
5044443
1902
N
1.26 (1.12, 1.42)
1.26 (1.19, 1.33)
1.12 (0.98, 1.28)
ES (95% CI)
1.26 (1.10, 1.45)
1.22 (1.13, 1.31)
1.39 (1.16, 1.66)1.28 (1.19, 1.37)
1.10 (1.00, 1.21)
0.420.50
controls
0.50
0.42
0.500.48
0.58
% ra
1.26 (1.12, 1.42)
1.26 (1.19, 1.33)
1.12 (0.98, 1.28)
ES (95% CI)
1.26 (1.10, 1.45)
1.22 (1.13, 1.31)
1.39 (1.16, 1.66)1.28 (1.19, 1.37)
1.10 (1.00, 1.21)
0.420.50
controls
0.50
0.42
0.500.48
0.58
% ra
1.6 .8 1 1.2 1.4 1.6 1.8 2 2.2
SNP rs10116277 (T)
White
Subtotal (I-squared = 87.4%, p = 0.005)
Study
WTCCC - WTCCC
Karvanen - MORGAM-CC
PROMIS
Broadbent PROCARDIS
name
N
1926
912
1793
4251
cases
N
2938
2130
1853
4443
cont
1.16 (1.07, 1.26)
1.13 (1.01, 1.26)
1.02 (0.85, 1.23)
1.01 (0.93, 1.11)
0.93 (0.87, 1.00)
ES (95% CI)% ra
0.40
0.55
0.58
0.43
controls
1.16 (1.07, 1.26)
1.13 (1.01, 1.26)
1.02 (0.85, 1.23)
1.01 (0.93, 1.11)
0.93 (0.87, 1.00)
ES (95% CI)% ra
0.40
0.55
0.58
0.43
controls
1.6 .8 1 1.2 1.4 1.6 1.8 2 2.2
SNP rs10757283 (C)
GWA
k)
l)
by on May 15, 2011 atvb.ahajournals.orgDownloaded from

19
White
Subtotal (I-squared = 0.0%, p = 0.609)
Helgadottir - Philadelphia
Broadbent PROCARDIS
Helgadottir - Durham
Helgadottir - Atlanta
Helgadottir - Iceland A+B
Study name
564
4251
1111
583
2190
No cases
491
4443
706
1238
2512
Nocontrols
1.39 (1.16, 1.66)
1.25 (1.17, 1.34)
1.23 (1.07, 1.41)
1.31 (1.14, 1.51)
1.20 (1.11, 1.30)
1.25 (1.19, 1.30)
ES (95% CI)
% risk allele incontrols
.50
.51
.51
.52
.51
1.39 (1.16, 1.66)
1.25 (1.17, 1.34)
1.23 (1.07, 1.41)
1.31 (1.14, 1.51)
1.20 (1.11, 1.30)
1.25 (1.19, 1.30)
1.6 .8 1 1.2 1.4 1.6 1.8 2 2.2
SNP rs1333045 (C)
Subtotal (I-squared = 13.7%, p = 0.314)
GWA
Subtotal (I-squared = 41.5%, p = 0.114)
White
East AsianChen - China
Zhou - Wuhan
Helgadottir - AtlantaHelgadottir - Durham
Shen - SMC2
Abdullah - GeneQuest
Helgadottir - Philadelphia
Broadbent - PROCARDIS
Helgadottir - Iceland B
Helgadottir - Iceland A
Shen - VHP
212
1360
5961137
611
310
582
4251
665
1607
416
232
1360
1284718
294
560
504
4443
3533
6728
308
1.31 (1.18, 1.46)
1.54 (1.19, 2.00)
1.25 (1.11, 1.39)
1.21 (1.06, 1.40)1.18 (1.03, 1.35)
1.34 (1.10, 1.70)
1.69 (1.38, 2.06)
1.38 (1.16, 1.65)
1.27 (1.18, 1.36)
1.26 (1.12, 1.42)
1.22 (1.13, 1.32)
1.29 (1.20, 1.38)
1.25 (1.00, 1.50)
.55
.66
.54
.51
.65
.51
.52
.51
.46
.45
.57
1.31 (1.18, 1.46)
1.54 (1.19, 2.00)
1.25 (1.11, 1.39)
1.21 (1.06, 1.40)1.18 (1.03, 1.35)
1.34 (1.10, 1.70)
1.69 (1.38, 2.06)
1.38 (1.16, 1.65)
1.27 (1.18, 1.36)
1.26 (1.12, 1.42)
1.22 (1.13, 1.32)
1.29 (1.20, 1.38)
1.25 (1.00, 1.50)
1.6 .8 1 1.2 1.4 1.6 1.8 2 2.2
SNP rs2383207 (G)
Study name No cases
Nocontrols
ES (95% CI)
% risk allele incontrols
Subtotal (I-squared = 0.0%, p = 0.796)
White
Helgadottir - Atlanta
Helgadottir - Durham
Helgadottir - Iceland A+B
Helgadottir - Philadelphia
578
1113
2215
557
1231
714
4744
487
1.26 (1.10, 1.45)
1.23 (1.08, 1.41)
1.23 (1.14, 1.32)
1.24 (1.18, 1.31)
1.35 (1.13, 1.60)
.51
.48
.44
.50
1.26 (1.10, 1.45)
1.23 (1.08, 1.41)
1.23 (1.14, 1.32)
1.24 (1.18, 1.31)
1.35 (1.13, 1.60)
1.6 .8 1 1.2 1.4 1.6 1.8 2 2.2
SNP rs1333046 (A)
Study name No cases
Nocontrols
ES (95% CI)
% risk allele incontrols
m)
n)
o)
by on May 15, 2011 atvb.ahajournals.orgDownloaded from

20
Subtotal (I-squared = 55.7%, p = 0.079)
White
Helgadottir - Iceland A+B
Helgadottir - Atlanta
Helgadottir - Philadelphia
Helgadottir - Durham
2099
564
567
1070
2350
1193
486
687
1.10 (1.01, 1.21)
1.34 (1.13, 1.58)
1.38 (1.12, 1.68)
1.21 (1.09, 1.35)
1.16 (0.99, 1.35)
.69
.71
.72
.71
1.10 (1.01, 1.21)
1.34 (1.13, 1.58)
1.38 (1.12, 1.68)
1.21 (1.09, 1.35)
1.16 (0.99, 1.35)
1 .
6 .8 1 1.2 1.4 1.
6 1.8 2 2.2
SNP rs6475608 (C)
Study name No cases
No controls
ES (95% CI)
Subtotal (I-squared = 81.5%, p = 0.000)
Study
Helgadottir - Iceland A+B
Helgadottir - Atlanta
Broadbent PROCARDIS
Helgadottir - Durham
Helgadottir - Philadelphia
name
N
2204
709
4251
1125
556
cases
N
4761
1247
4443
697
491
cont
1.36 (1.22, 1.52)
1.26 (1.17, 1.35)
1.76 (1.55, 2.01)
1.28 (1.20, 1.37)
1.27 (1.11, 1.45)
1.36 (1.14, 1.62)
ES (95% CI)
% ra
0.44
0.49
0.48
0.46
0.48
controls
1.36 (1.22, 1.52)
1.26 (1.17, 1.35)
1.76 (1.55, 2.01)
1.28 (1.20, 1.37)
1.27 (1.11, 1.45)
1.36 (1.14, 1.62)
ES (95% CI)
% ra
0.44
0.49
0.48
0.46
0.48
controls
1 .6 .8 1 1.2 1.
4 1.6 1.8 2 2.
2
SNP rs10738607 (G)
White
Subtotal (I-squared = 67.7%, p = 0.026)
name
Helgadottir - Philadelphia
Study
Helgadottir - Iceland A+B
Helgadottir - Durham
Helgadottir - Atlanta
cases
465
N
1866
1093
569
cont
410
N
2113
694
834
ES (95% CI)
1.48 (1.22, 1.79)
1.20 (1.09, 1.31)
1.22 (1.08, 1.38)
1.04 (0.90, 1.19)
1.26 (1.09, 1.47)
controls
0.42
% ra
0.37
0.44
0.41
ES (95% CI)
1.48 (1.22, 1.79)
1.20 (1.09, 1.31)
1.22 (1.08, 1.38)
1.04 (0.90, 1.19)
1.26 (1.09, 1.47)
0.42
% ra
0.37
0.44
0.41
1 .6 .
8 1 1.
2 1.4 1.
6 1.8 2 2.2
SNP rs10811650 (G)
White
p) q) r)
by on May 15, 2011 atvb.ahajournals.orgDownloaded from

21
Subtotal (I-squared = 0.0%, p = 0.640)
GWA
Subtotal (I-squared = 57.2%, p = 0.013)
Other/mixed
Subtotal (I-squared = 46.7%, p = 0.131)
White
Assimes (ADVANCE) H
Lemmens - Caregene
Zhang - Chaoyang
Abdullah - GeneQuest
Assimes (ADVANCE) Black
Helgadottir - Iceland B
Assimes (ADVANCE) EA
Helgadottir - Atlanta
Assimes (ADVANCE) White
name
Helgadottir - Iceland A
Shen - VHP
Assimes (ADVANCE) MNB
Broadbent PROCARDIS
Helgadottir - Durham
Shen - SMC2
Deghan - RotterdamHelgadottir - Philadelphia
Chen - China
Study
108
926
432
72
310
96
665
117
596
1201
cases
1607
416
215
4251
1110
611
588582
212
N
82
828
430
60
560
333
3533
103
1284
1046
cont
6728
308
110
4443
693
294
5251504
232
N
1.61 (1.05, 2.48)
1.34 (1.18, 1.54)
1.28 (1.05, 1.57)
1.32 (1.09, 1.61)
1.30 (1.22, 1.39)
1.08 (0.64, 1.85)
1.75 (1.43, 2.14)
1.30 (0.89, 1.88)
1.32 (1.13, 1.54)
1.56 (1.05, 2.32)
1.32 (1.15, 1.52)
1.32 (1.17, 1.48)
ES (95% CI)
1.30 (1.18, 1.43)
1.28 (1.00, 1.60)
1.19 (0.86, 1.65)
1.27 (1.19, 1.37)
1.27 (1.11, 1.46)
1.29 (1.10, 1.60)
1.03 (0.90, 1.18)1.39 (1.17, 1.66)
1.45 (1.23, 1.71)
1.85 (1.42, 2.40)
0.48
0.48
0.42
0.28
0.45
0.22
0.44
0.49
0.48
0.47
controls
0.43
0.50
0.46
0.47
0.46
0.46
0.47
0.41
% ra
1.8 1 1.2 1.4 1.6 1.8 2 2.2
SNP rs10757278 (G)
Assimes (ADVANCE) MB
East Asian
East-Asian
White
GWA
Study
Broadbent PROCARDIS
WTCCC - WTCCC
Yang - Chaoyang
name
N
4251
1925
432
cases
N
4443
2937
430
cont
1.07 (0.96, 1.18)
0.97 (0.90, 1.06)
1.08 (0.87, 1.35)
ES (95% CI)
% ra
0.47
0.47
0.23
controls
1.07 (0.96, 1.18)
0.97 (0.90, 1.06)
1.08 (0.87, 1.35)
ES (95% CI)
% ra
0.47
0.47
0.23
controls
1.6 .8 1 1.2 1.4 1.6 1.8 2 2.2
SNP rs7027989 (A)
Subtotal (I-squared = 0.0%, p = 0.808)
White
GWA
name
Samani - WTCCC
Study
Broadbent PROCARDIS
Samani - German MI
cases
1926
N
4251
761
cont
2938
N
4443
1636
ES (95% CI)
1.27 (1.17, 1.38)
1.21 (1.13, 1.30)
1.23 (1.08, 1.40)
1.22 (1.14, 1.29)
controls
0.56
% ra
0.58
0.58
ES (95% CI)
1.27 (1.17, 1.38)
1.21 (1.13, 1.30)
1.23 (1.08, 1.40)
1.22 (1.14, 1.29)
controls
0.56
% ra
0.58
0.58
1.6 .8 1 1.2 1.4 1.6 1.8 2 2.2
SNP rs564398 (T)
s)
t)
u)
by on May 15, 2011 atvb.ahajournals.orgDownloaded from
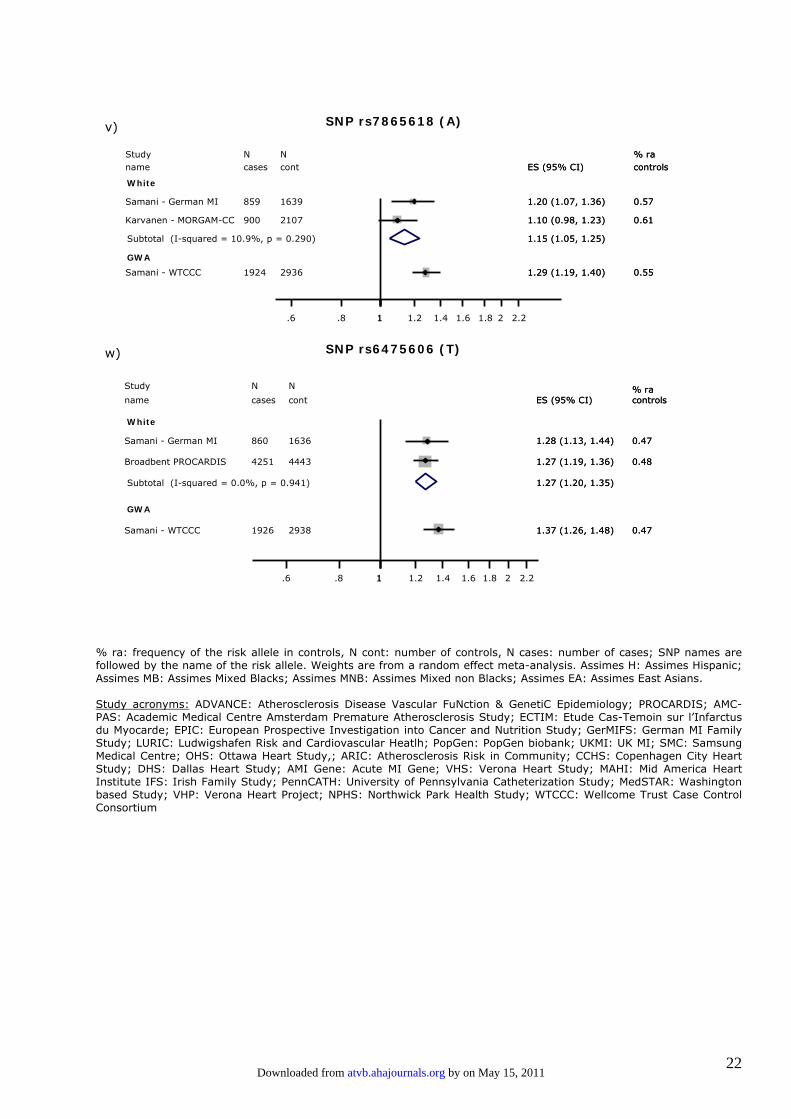
22
% ra: frequency of the risk allele in controls, N cont: number of controls, N cases: number of cases; SNP names are followed by the name of the risk allele. Weights are from a random effect meta-analysis. Assimes H: Assimes Hispanic; Assimes MB: Assimes Mixed Blacks; Assimes MNB: Assimes Mixed non Blacks; Assimes EA: Assimes East Asians. Study acronyms: ADVANCE: Atherosclerosis Disease Vascular FuNction & GenetiC Epidemiology; PROCARDIS; AMC-PAS: Academic Medical Centre Amsterdam Premature Atherosclerosis Study; ECTIM: Etude Cas-Temoin sur l’Infarctus du Myocarde; EPIC: European Prospective Investigation into Cancer and Nutrition Study; GerMIFS: German MI Family Study; LURIC: Ludwigshafen Risk and Cardiovascular Heatlh; PopGen: PopGen biobank; UKMI: UK MI; SMC: Samsung Medical Centre; OHS: Ottawa Heart Study,; ARIC: Atherosclerosis Risk in Community; CCHS: Copenhagen City Heart Study; DHS: Dallas Heart Study; AMI Gene: Acute MI Gene; VHS: Verona Heart Study; MAHI: Mid America Heart Institute IFS: Irish Family Study; PennCATH: University of Pennsylvania Catheterization Study; MedSTAR: Washington based Study; VHP: Verona Heart Project; NPHS: Northwick Park Health Study; WTCCC: Wellcome Trust Case Control Consortium
Subtotal (I-squared = 10.9%, p = 0.290)
GWA
White
Samani - WTCCC
Study
Samani - German MI
Karvanen - MORGAM-CC
name
1924
N
859
900
cases
2936
N
1639
2107
cont
1.29 (1.19, 1.40)
1.20 (1.07, 1.36)
1.15 (1.05, 1.25)
1.10 (0.98, 1.23)
ES (95% CI)
0.55
% ra
0.57
0.61
controls
1.29 (1.19, 1.40)
1.20 (1.07, 1.36)
1.15 (1.05, 1.25)
1.10 (0.98, 1.23)
ES (95% CI)
0.55
% ra
0.57
0.61
controls
1.6 .8 1 1.2 1.4 1.6 1.8 2 2.2
SNP rs7865618 (A)
SNP rs6475606 (T)
Subtotal (I-squared = 0.0%, p = 0.941)
White
GWA
Broadbent PROCARDIS
Samani - WTCCC
Samani - German MI
name
Study
4251
1926
860
cases
N
4443
2938
1636
cont
N
1.27 (1.20, 1.35)
1.27 (1.19, 1.36)
1.37 (1.26, 1.48)
1.28 (1.13, 1.44)
ES (95% CI)
0.48
0.47
0.47
controls% ra
1.27 (1.20, 1.35)
1.27 (1.19, 1.36)
1.37 (1.26, 1.48)
1.28 (1.13, 1.44)
ES (95% CI)
0.48
0.47
0.47
controls% ra
1.6 .8 1 1.2 1.4 1.6 1.8 2 2.2
v)
w)
by on May 15, 2011 atvb.ahajournals.orgDownloaded from
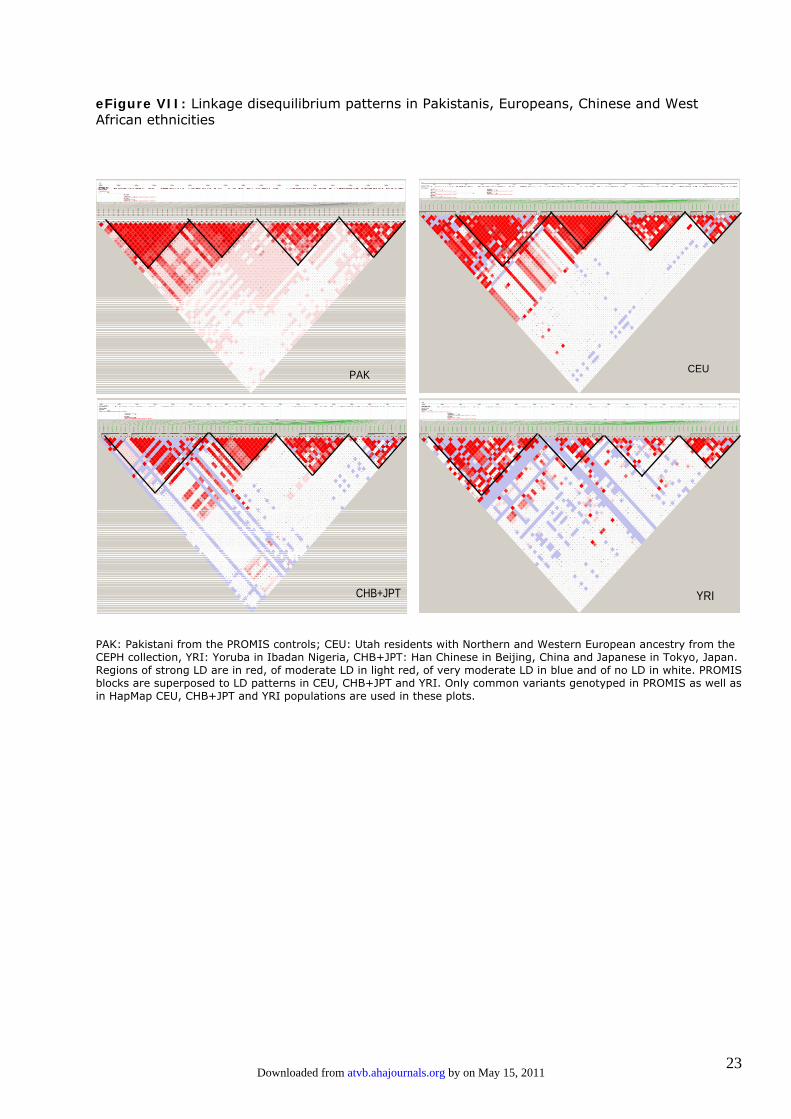
23
eFigure VII: Linkage disequilibrium patterns in Pakistanis, Europeans, Chinese and West African ethnicities
PAK: Pakistani from the PROMIS controls; CEU: Utah residents with Northern and Western European ancestry from the CEPH collection, YRI: Yoruba in Ibadan Nigeria, CHB+JPT: Han Chinese in Beijing, China and Japanese in Tokyo, Japan. Regions of strong LD are in red, of moderate LD in light red, of very moderate LD in blue and of no LD in white. PROMIS blocks are superposed to LD patterns in CEU, CHB+JPT and YRI. Only common variants genotyped in PROMIS as well as in HapMap CEU, CHB+JPT and YRI populations are used in these plots.
YRI
PAK
CHB+JPT
CEU
by on May 15, 2011 atvb.ahajournals.orgDownloaded from