
Genetic algorithm aided optimization of hierarchical multiagent system organization
32
UMass Amherst Computer Science Technical Report 2011-003 Genetic Algorithm Aided Optimization of Hierarchical Multi-Agent System Organization Ling Yu 1 , Zhiqi Shen 2 , Chunyan Miao 1 , and Victor Lesser 3 1 School of Computer Engineering, Nanyang Technological University, Singapore 639798 2 School of Electrical and Electronic Engineering, Nanyang Technological University, Singapore 639798 3 Department of Computer Science, University of Massachusetts Amherst, Amherst, MA 01003-9264 emails: {yuling, zqshen, ascymiao}@ntu.edu.sg, [email protected] December 2010 Abstract It has been widely recognized that the performance of a multi-agent system (MAS) is highly affected by its organization. A large scale MAS may have billions of possible ways of organization, depending on the number of agents, the roles, and the relationships among these agents. These characteristics make it impractical to find an optimal choice of organization using exhaustive search methods. In this report, we propose a genetic algorithm aided optimization scheme for designing hierarchical structures of multi-agent systems. We introduce a novel algorithm, called the hierarchical genetic algorithm, in which hierarchical crossover with a repair strategy and mutation of small perturbation are used. The phenotypic hierarchical structure space is translated to the genome-like array representation space, which makes the algorithm genetic-operator- literate. A case study with 10 scenarios of a hierarchical information retrieval model is provided. Our experiments have shown that competitive baseline structures which lead to the optimal organization in terms of utility can be found by the proposed algorithm during the evolutionary search. Compared with the traditional genetic operators, the newly introduced operators produced better organizations of higher utility more consistently in a variety of test cases. The proposed algorithm extends the search processes of the state-of-the-art multi-agent organization design methodologies, and is more computationally efficient in a large search space. Keywords: genetic algorithm, hierarchical crossover, information retrieval, multi-agent systems, organization design, optimization, representation, tree structures.
-
Upload
independent -
Category
Documents
-
view
4 -
download
0
Transcript of Genetic algorithm aided optimization of hierarchical multiagent system organization

UMass Amherst Computer Science Technical Report 2011-003
Genetic Algorithm Aided Optimization of Hierarchical Multi-Agent System Organization
Ling Yu1, Zhiqi Shen2, Chunyan Miao1, and Victor Lesser3
1School of Computer Engineering, Nanyang Technological University, Singapore 639798
2School of Electrical and Electronic Engineering, Nanyang Technological University, Singapore 639798
3Department of Computer Science, University of Massachusetts Amherst, Amherst, MA 01003-9264
emails: {yuling, zqshen, ascymiao}@ntu.edu.sg, [email protected]
December 2010
Abstract
It has been widely recognized that the performance of a multi-agent system (MAS) is highly affected by its organization. A
large scale MAS may have billions of possible ways of organization, depending on the number of agents, the roles, and the
relationships among these agents. These characteristics make it impractical to find an optimal choice of organization using
exhaustive search methods. In this report, we propose a genetic algorithm aided optimization scheme for designing
hierarchical structures of multi-agent systems. We introduce a novel algorithm, called the hierarchical genetic algorithm, in
which hierarchical crossover with a repair strategy and mutation of small perturbation are used. The phenotypic hierarchical
structure space is translated to the genome-like array representation space, which makes the algorithm genetic-operator-
literate. A case study with 10 scenarios of a hierarchical information retrieval model is provided. Our experiments have
shown that competitive baseline structures which lead to the optimal organization in terms of utility can be found by the
proposed algorithm during the evolutionary search. Compared with the traditional genetic operators, the newly introduced
operators produced better organizations of higher utility more consistently in a variety of test cases. The proposed algorithm
extends the search processes of the state-of-the-art multi-agent organization design methodologies, and is more
computationally efficient in a large search space.
Keywords: genetic algorithm, hierarchical crossover, information retrieval, multi-agent systems, organization design,
optimization, representation, tree structures.
michele
Text Box
This material is based in part upon work supported by the National Research Foundation of Singapore under Award No. NRF2008-IDM001-MOE-015 and National Science Foundation under Award No. IIS-0964590. Any opinions, findings, conclusions or recommendations expressed in this publication are those of the author(s) and do not necessarily reflect the views of the National Research Foundation of Singapore and the National Science Foundation.

1 Introduction
The research on the organization of a multi-agent system (MAS) has attracted much interest in recent years. An organization
provides a framework for activities and interactions in a MAS through the definition of agent roles, groups, tasks, behavioral
expectations and authority relationships such that all the agents in the MAS can cooperate systematically and contribute to
the common good of the overall system. More specifically, the organization defines which resources an agent is able to
acquire, what roles/functions it takes, with which other agents it is allowed to exchange information, etc.
A proper organization for a MAS can ensure the behavior of the agents to be externally observable and make up for the major
drawback of the traditional agent centered MAS in which the patterns and the outcomes of the interactions are inherently
unpredictable because of the high likelihood of emergent (and unwanted) behavior [4]. Particularly, in large scale systems, to
form and evolve an organization makes it possible for the system to exploit collective efficiencies and to manage emerging
situations [12]. So far, a number of organization designs have been proposed for multi-agent systems [9]. Experiments and
simulations have shown that various organizations employed by a system with the same set of agents may have different
impacts on its performance [8][15][5][10][17][21].
Among all kinds of organizations, the hierarchical structure is one of the most common structures observed in multi-agent
systems. Like human organizations, primate societies, and insect colonies, many multi-agent systems can be abstracted as
hierarchical, tree-like structures or sets of parallel hierarchical structures, where agents are categorized in different levels in
the hierarchies [11]. Often, the level of an agent indicates its capabilities and roles. In other words, a specific level in the
system consists of equally capable agents, performing similar roles. Agents at the bottom level may execute the routine tasks
under the orders given by their higher-level authorities, whereas agents at the top level may assign the task, collect and
assemble the returned information from their subordinates, as seen in the distributed information retrieval (IR) system
described in [10].
For a large hierarchical MAS, there exist a great variety of possible ways to organize the system, which induces different
agent behaviors and system characteristics. Due to the difference in the depth and the width of the hierarchy, the number of
organization instances increases exponentially with the number of agents, which poses a great challenge for us to construct
the most suitable organization for a given system. Although many methodologies for organization modeling have been
proposed, few of them present an effective way to search for an optimal organization instance.

In order to solve the problem, this report proposes a genetic algorithm (GA) approach as an alternative to the conventional
enumeration methods for optimizing hierarchical multi-agent systems. Inspired by biological evolution processes such as
selection, reproduction, and mutation, GAs are known to be robust global search algorithms for optimization and machine
learning [7][2][3]. The heuristic nature of GA helps it to locate the global optimum in a vast search space. We design novel
crossover and mutation operators to make the algorithm suitable for organization evolution and thereby ensure competitive
performance. We tested the algorithm in an example of the IR model [10] which exhibits numerous possible organizational
variants and verify its capability through simulations in different scenarios.
The rest of the report is structured as follows. Section 2 discusses the related work. In Section 3, we introduce the
representation of organization employed in our algorithm, followed by the newly proposed crossover and mutation operators
in Section 4. Section 5 proceeds with description of the IR model in our case study, with implementation details and
experimental setup. And in Section 6, the simulation results are presented with the number of databases varying from 12 to
30. We analyze the results by comparing the different test cases which show the impact of environment variables on the best
organizations obtained. The proposed algorithm is compared with the standard genetic algorithm (SGA) with one-point
crossover and two-point crossover in terms of its search accuracy and stability. In Section 7, we further compare our
algorithm with the search process of the state-of-the-art multi-agent organization design methodologies. In the last section,
we conclude the report and discuss promising future research directions in this topic.
2 Related Work
The design of a multi-agent system organization has been investigated by many researchers. Early methodologies such as
Gaia [19] and OMNI [18] aim to assist the manual design process of agent organizations. In these models the roles that
agents have to play within the MAS and the interaction protocols are identified. Instead of relying heavily on the expertise of
human designers, it is desirable to automate the process of producing multi-agent organization designs. In this case, a
quantitative measurement of a set of metrics is essentially needed for us to rapidly and precisely predict the performance of
the MAS. With these metrics we can evaluate a number of organization instances, rank them, and select the best organization
without having to introduce heavy cost by actually implementing the organization designs.

In [10], the utility value was defined as the quantitative measurement of the performance of a distributed sensor network and
an information retrieval system. An organizational design modeling language (ODML) was proposed and a template was
constructed for each domain. Several approaches, including the exploitation of hard constraints and equivalence classes,
parallel search, and the use of abstraction, have been studied in order to reduce the complexity of searching for a valid
optimal organization.
Another organization designer, KB-ORG, which also incorporates quantitative utility as a user evaluation criterion, was
proposed for multi-agent systems in [17]. It uses both application-level and coordination-level organization design
knowledge to explore the combinatorial search space of candidate organizations selectively. This approach significantly
reduces the exploration effort required to produce effective designs as compared to modeling and evaluation-based
approaches that do not incorporate designer expertise.
Nonetheless, similar to ODML, KB-ORG aims at pruning the search space. However, the design knowledge alone is
inadequate for the identification of an optimal design when the possible varieties of the organization structure become large.
Evolutionary based search mechanisms have been used to help the design of MAS organizations on a few occasions. For
example, in [20], a GA-based algorithm is proposed for coalition structure formation which aims at achieving the goals of
high performance, scalability, and fast convergence rate simultaneously. And in [13], a heuristic search method, called
evolutionary organizational search (EOS), which is based on genetic programming (GP), was introduced. A review of
evolutionary methodologies, mostly involving co-evolution, for the engineering of multi-agent market mechanisms, can also
be found in [16]. These techniques show a promising direction to deal with the organization search in hierarchical multi-
agent systems, as exhaustive methods, such as breadth-first search and depth-first search, become inefficient and impractical
in a large search space.
3 Representation of Organizations
Generally speaking, the organization of a hierarchical MAS consists of a number of tree structures. It can either be a single
tree, where the root node is the sole leader of the organization, or a set of trees, where there are several equally important
leaders that communicate with each other and share the decision-making power. The intermediate nodes in a tree have the

responsibility to assign tasks to their subordinates, as well as reporting the results of the accomplished tasks back to their
higher-level authorities. Information exchange is only allowed in the vertical directions between higher and lower levels, and
there is no interaction of agents horizontally, or among different hierarchies. The leaf nodes are the bottom of the structure
and they complete the most basic tasks.
Optimization in such a search space can be handled by evolutionary algorithms [3], especially genetic programming, which
supports populations of model structures of varying length and complexity. It has also been shown from previous studies that
some well-structured trees (e.g. binary trees), with a certain number of levels and a fixed number of subordinates per node,
can be represented by arrays [14][1]. Transformations are feasible as a result of their regular structures, which thereby allow
the traditional crossover and mutation operators of other evolutionary algorithms, such as genetic algorithms, to take effect.
We propose an array representation of hierarchical MAS organizations which is applicable to a much broader range of
hierarchical structures than just binary trees. It converts s set of hierarchical trees into a fixed-length array with integer
components, which resemble gene sequences. The representation is not limited to describe a single tree, and the number of
subordinates of each node need not be a constant. Unbalanced trees, in which leaf nodes are not on the same hierarchical
level, can also be depicted using this representation.
3.1 Translating Organizations into Genomes
We assume that the hierarchical MAS considered here have the following properties. We assume that the number of leaf node
agents is fixed before the search. We also assume that the maximum possible number of levels is determined. Thus, the total
number of agents in the organization is bounded. Based on these assumptions, we can make use of the partition concept to
convert the organization from tree structures to arrays.
Let N be the total number of leaf nodes or end nodes, so that the they can be numbered as 1, 2, …, N respectively from left to
right. Let M be the maximum tree depth (i.e. maximum height of the structure). The reason for limiting the height is that very
tall structures can be slow or irresponsive, as the long path length from root to leaf increases message latency among the
agents. The organization of a hierarchical MAS can be outlined by Representation 1:
a1a2a3…aN–1
where ai is an integer between 1 and M, denoting the level number where leaf nodes i and i+1 start to separate.

An example with seven leaf nodes (N=7) is illustrated in Figure 1. It consists of two trees. On Level 1, the four leaf nodes on
the left and the three leaf nodes on the right separate into two trees. In other words, there is one separation between the leaf
nodes 4 and 5, so a4=1. On Level 2, there are two leaf nodes and one intermediate node (three nodes altogether) under the left
tree root, corresponding to the “2 2” (two partition numbers) to the left of the “1” in the array. The one leaf node and one
intermediate node (two nodes altogether) under the right tree root give the “2” (one partition number) to the right. Both
intermediate nodes on Level 2 have two leaf nodes as their subordinates (leaf nodes 3 and 4, leaf nodes 6 and 7), which are
separated on Level 3, resulting in the two 3’s in the 3rd and 6th places in the array. Therefore, the array “2 2 3 1 2 3” fully
specifies the organization.
Conversely, we can also obtain an organization by interpreting the representation array. For instance, if we want to determine
which level node 4 in Figure 1 sits on, we need to examine both the node's left and right neighbor. The third and forth digits
in the array are “3” and “1”. It means that node 3 and node 4 are separated on Level 3. Node 4 and node 5 are separated on
Level 1. As a result, we can place node 4 on Level 3 (larger number between 3 and 1). Similarly, because the fifth digit is “2”,
i.e. node 5 and node 6 are separated on level 2, node 5 can be put on level 2 (larger number between 2 and 1).
Theorem:
The above representation has the following properties.
(1) For every hierarchical organization instance which satisfies our assumptions in the beginning of Section 3.1, the
array representation that can be generated is unique.
(2) For every representation of the above mentioned form, there is an organization instance corresponding to it.
Proof:
2 2 3 1 2 3
Figure 1: A sample organization and its array representation. Agent nodes are displayed as circles in the figure, and leaf nodes are numbered.

(1) We firstly prove the existence of an array representation for every hierarchical organization instance. The way of
generating an array representation of an arbitrary hierarchical organization instance can be expressed as follows. If there are
N leaf nodes, we prepare N–1 slots. Firstly, organize the structure well so that the root nodes, intermediate nodes, and leaf
nodes are on their proper levels. Secondly, we examine the separation pattern between adjacent leaf nodes one by one from
left to right. Fill the slots with the level number where the adjacent leaf nodes start to separate. See Figure 1 for an example.
The first two leaf nodes on the left are direct subordinates of the first tree root, i.e. on the root level (Level 1) they do not
separate. However, on Level 2, they separate into different nodes. So the first number is 2. The second slot should also be
filled with number 2 because the second and third leaf nodes on the left separate on Level 2. The third leaf node belongs to an
intermediate node on Level 2 different from the second leaf node. And as the third and fourth leaf nodes are direct
subordinates of an intermediate node on Level 2, they start to separate on Level 3. Number 3 should be the third number in
the array representation. And so on, we can get the values, which are the level numbers, for all the slots. Together they form
the required representation.
We then prove the uniqueness of the generated array representation. If array representations a1a2a3…aN–1 and b1b2b3…bN–1
which are derived from the same organization instance are different, there exits an i∈{1, 2, …, N} such that ai≠bi. This
shows that the leaf nodes i and i+1 separate at different levels in the two corresponding organization structures, which means
the organization structures are not identical.
(2) Given an array representation with positive integers of length L, we would like to construct an organization instance
containing L+1 leaf nodes as follows. Find all the digit “1”s in the representation (if there are any). Calculate the number of
digits (greater than 1) between adjacent 1’s one by one from left to right, and denote them as n1, n2, n3, …, nk+1, where k is the
number of 1’s. If there are no 1’s, then k=0 and n1=L. The corresponding organization has k+1 root nodes with n1+1, n2+1,
n3+1, …, nk+1+1 leaf nodes, respectively, from left to right. So far we have completed the root level (Level 1) of the
organization. For instance, with array [2 2 3 1 2 3], n1=3, n2=2, i.e. there are two root nodes with 4 and 3 leaf nodes
respectively. For Level 2, we take segments with 1’s and 2’s as separators. These segments should only contain digits greater
than 2 (if any). Like what is done for Level 1, the number of digits between adjacent separators are recorded as r1, r2, r3, …,
rt+1, where t is the number of 1’s and 2’s. If ri=0, it corresponds to a leaf node; otherwise, it corresponds to an intermediate
node on Level 2. After that, take segments with 1’s, 2’s, and 3’s as separators, and repeat the steps until the greatest numbers
in the representation are examined. In this way we can obtain the full organization instance.

Note that the organization instance is non-unique. Figure 2(a) illustrates an extreme case where all three leaf nodes separate
on Level 2, so the representation is [2 2]. It has the same representation as the organization in Figure 2(b). When such
circumstances arise, we should examine all the possible organization instances that correspond to a representation and use the
best one. In the following section we explain that in the IR model, the sub-organizations having nodes with only one
subordinate are uneconomical and should be simplified to achieve higher utility. Therefore, we only need to focus on the
most simplified organization instance.
So far, we have established a surjective mapping from the set of all valid structure instances containing N leaf nodes with
maximum height M, denoted as A, to the set of all arrays containing N–1 integer elements ranging from 1 to M, denoted as B.
Furthermore, the representation is compatible with genetic operators such as one-point, two-point or uniform crossover, i.e.
the offspring generated after the crossover of individuals from set B still belong to set B. Bit-wise mutation can also be
applied here, so that every bit of the genome ai is mutated to a randomly picked different value from {1, 2, …, M}\{ai}
according to the user defined mutation probability.
3.2 Simplifying Organizations
The above representation can be applied to a general hierarchical MAS organization. For specific organization search
problems, we may find it beneficial to simplify the representation in order to prune the search space and avoid unnecessary
candidate evaluations of the algorithm. The simplification steps should be determined by the designer depending on the
problems. Trimming, combining, and reducing of branches are easy to achieve using the proposed representation. We will
give an example of how to remove redundant intermediate nodes of the IR system in Section 5.2.
3.3 Variations of Representations
(a) (b)
Figure 2: Organizations with the same representation.

In Section 3.1, we have assumed that the leaf nodes are homogeneous. In such circumstances, a 1×N–1 array is enough to
represent a hierarchical organization of a MAS. Nonetheless, in view of the circumstances where each leaf node must be
treated uniquely, a second row can be added to the array representation to address the distinction resulting from permutations.
This will make the representation to be in the form of a 2×N–1 array (Representation 2):
⎟⎟⎠
⎞⎜⎜⎝
⎛
−
−
1321
1321
N
N
ppppaaaa……
where {ai} are still integers between 1 and M, denoting the level of the partition between leaf nodes i and i+1, and p1, p2, …,
pN–1 are a permutation of 1 to N with the last number discarded. Still using the example in Figure 1, now we use numbers 1,
2, …, 7 to distinguish the mutually different leaf nodes. If in the organization they are 5, 3, 2, 1, 4, 7, 6, respectively, then the
representation is:
⎟⎟⎠
⎞⎜⎜⎝
⎛
741235321322
.
One may also want to design an organization in which the number of leaf node agents is not fixed beforehand. To account for
varied number of leaf node agents, we may use the following Representation 3:
……s0')(
132112
1000
NNNaaaa
−−
where N1 is the actual number of leaf nodes of the representation, N2 is the maximum number of leaf nodes allowed in the
organization, and the remaining positions are filled with zeros.
These variants of representations will function in the same manner as the Representation 1 when taken to go through genetic
operators which are introduced next.
4 Crossover and Mutation Operators
The traditional one-point crossover chooses a random slicing position along the chromosomes of both parents. All data
beyond that point in either solution is swapped between the two parents. The resulting chromosomes are two offspring.

Though commonly used in genetic algorithms, this crossover method only influences the structure near the crossover point,
as shown in Figure 3(a,b). It may not be enough to generate new offspring in large-scale systems. To speed up the evolution
and increase the chance of getting a desired structure with higher utility, new crossover operators are needed. In this report,
we propose a novel crossover operator - hierarchical crossover - specially designed for optimization of tree-structured
organizations.
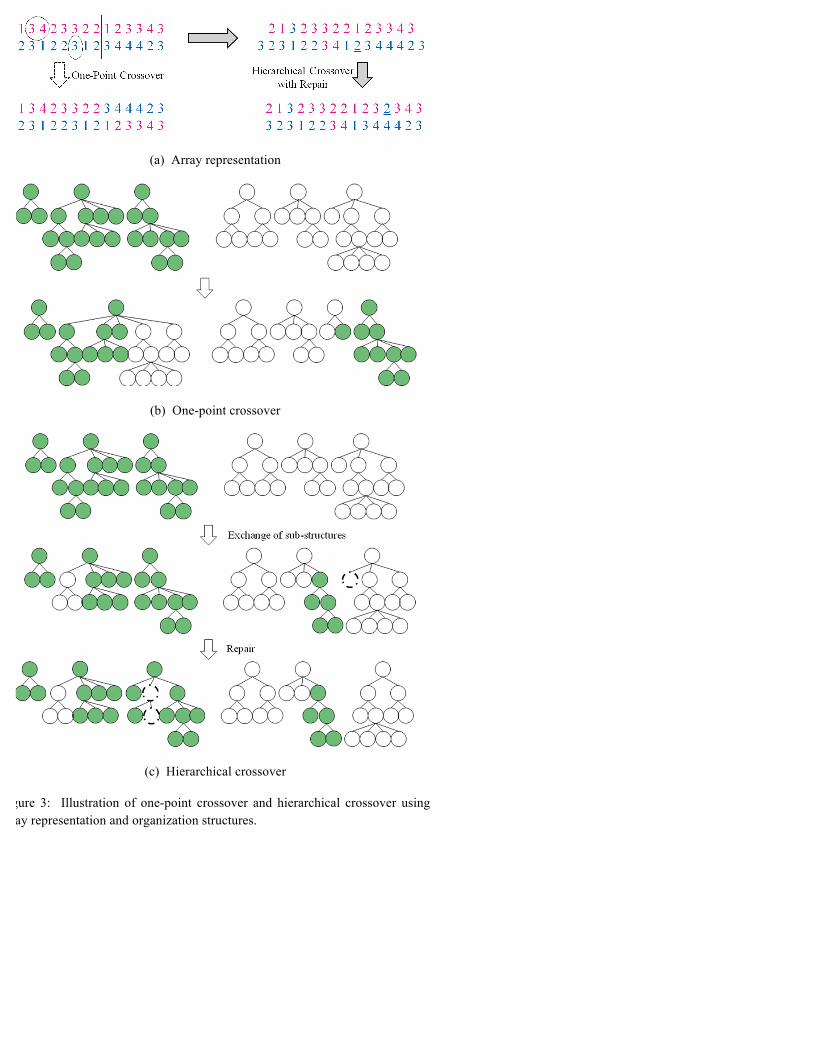
(a) Array representation
(b) One-point crossover
(c) Hierarchical crossover
Figure 3: Illustration of one-point crossover and hierarchical crossover using array representation and organization structures.

The proposed hierarchical crossover operator based on the previously described Representation 1 contains swapping of sub-
organizations and a repair strategy to keep the number of total leaf nodes constant. It is implemented as follows.
First of all, we compare the number of structure levels of two randomly selected organization solutions from the population.
Denote the organization with more levels as the first individual and the number of levels as T. Denote the organization with
fewer levels as the second individual. (In the case of a tie, the order can be arbitrarily assigned.) After that, we choose a node
randomly from all nodes whose level number is between 1 and T–1 from the first solution and denote the level number of the
chosen node as S. Thirdly, we choose a node randomly at Level S, or the penultimate level, whichever is smaller, from the
second solution, and exchange the sub-structures between the two solutions below the chosen nodes. If any of the solution
candidates have only one level, we generate two random individuals of maximum tree depth instead. The exchange ensures
that the two newly formed organization structures do not exceed the maximum height of their parent structures. However, the
exchanged sub-structures do not necessarily contain equal number of leaf nodes. Thus, we propose the following repair
strategy.
Find the solution with longer representation and randomly pick out one digit from it and insert this digit into a random slot in
the other solution. Continue until the two solutions have equal length. This will guarantee the validity of the two solutions, as
shown in Figure 3(a,c). Illustrated in both the array representation and the organization structures, Figure 3 displays the
difference between the proposed hierarchical crossover and one-point crossover. The pseudo code of hierarchical crossover is
given in Figure 4.
To apply hierarchical crossover to Representation 2, all we need is to bundle each column and move the second row together
with the first row. As for organizations in Representation 3, the repair strategy is implemented with the digits randomly
picked out from non-zero locations only and until each selected organizations have the same number of leaf nodes as before.

As seen in Figure 3, a branch of the tree is corresponding to a piece of gene fragment. By swapping the two selected gene
segments in the parents, we get two new organization instances with exchanged sub-organizations. This step is similar to
two-point crossover, in which the segments between the two randomly selected crossover points of both parents are swapped
to form the offspring. However, like one-point crossover, two-point crossover also does not concern whether the selected
Let parent1 and parent 2 be the array representations of two selected parents. if max(parent1)<max(parent2) Exchange parent1 and parent2; end T = max(parent1); if T==1 or max(parent2)==1 Randomly generate offspring1 and offspring2 of maximum tree depth; return end For parent1: List all possible crossover nodes of parent1 from Level 1 till T-1; Randomly select a node from the above list as cp1; Record the level number of cp1 as S; Get the segments of the array representation of the sub-structure below cp1 as portion_c1; Get the segments of the array representation to the left of the sub-structure below cp1 as portion_l1; Get the segments of the array representation to the right of the sub-structure below cp1 as portion_r1; For parent2: Randomly select a node cp2 from parent2 at the level number min(S, max(parent2)-1)); Get the segments of the array representation of the sub-structure below cp2 as portion_c2; Get the segments of the array representation to the left of the sub-structure below cp2 as portion_l2; Get the segments of the array representation to the right of the sub-structure below cp2 as portion_r2; offspring1 = [portion_l1 portion_c2 portion_r1]; offspring2 = [portion_l2 portion_c1 portion_r2]; Repair strategy: if length(offspring1)>length(parent1) exnum = length(offspring1)-length(parent1); for j=1:exnum, Randomly select an integer p1 between 1 and length(offspring1); Randomly select an integer p2 between 1 and length(offspring2)+1; offspring2 = [offspring2(1:p2-1) offspring1(p1) offspring2(p2:end)]; offspring1 = [offspring1(1:p1-1) offspring1(p1+1:end)]; end elseif length(offspring2)>length(parent2) exnum = length(offspring2)- length(parent2); for j=1:exnum, Randomly select an integer p2 between 1 and length(offspring2); Randomly select an integer p1 between 1 and length(offspring1)+1; offspring1 = [offspring1(1:p1-1) offspring2(p2) offspring1(p1:end)]; offspring2 = [offspring2(1:p2-1) offspring2(p2+1:end)]; end end
Figure 4: Pseudo code for hierarchical crossover.

gene segments correspond to the whole tree branches or not. And as long as the two crossover points are determined, the
segments are fixed and the locations of them in the arrays do not change. Hierarchical crossover is different from two-point
crossover in that it focuses on the branches of the tree structures and only change the gene segments that refer to whole
branches. Moreover, the locations of the two gene segments of the parents may differ from each other, and the repair strategy
promotes population update.
In addition to the crossover method mentioned above, we use the mutation of small perturbation. It is different from bit-wise
mutation in that the digit can only increase by 1 or decrease by 1 with equal probability. In the cases of the boundaries, if the
perturbed digit is out of bounds, the original value is restored. The pseudo code of the mutation operator based on
Representation 1 is displayed in Figure 5.
5 The Information Retrieval Model
In this report we will examine the algorithm in the information retrieval system [10]. A structured, hierarchical organization
composed of nodes as mediators, aggregators, and databases is used to model the IR system. An agent is assigned for each
node to take the corresponding functions. The information recall and the query response time are combined to form a metric
to determine the utility of the organization. We will summarize the derivation of the utility function in the following section.
Detailed procedures to calculate the utility can be found in [10]. In the template of the IR system shown in Figure 6, directed
edges with a solid arrow represent has-a relations, and the corresponding label indicates the magnitude of that relation, and
hollow-arrow edges represent is-a relations.
Let offspring be the array representation of an offspring created by the crossover operator, numVar be the length of the representation, mutOps be the mutation probability, and maxTreeDepth be the maximum tree depth.
rN = rand(size(offspring,1),numVar)<mutOps; offspring = offspring+rN.*((rand(size(offspring,1),numVar)>0.5)*2-1); offspring(offspring==0) = 1; offspring(offspring==maxTreeDepth+1) = maxTreeDepth;
Figure 5: Mutation of small perturbation.

At the top level of each hierarchy is a mediator. The user sends a query, which a randomly assigned mediator is responsible
to handle. It uses the collection signatures of all the mediators to compare data sources, then routes the query to those
mediators that seem appropriate. After the query has been directed through the aggregators and processed by all the databases
under the selected mediators, the responsible mediator finally collects and delivers the resulting data.
5.1 The Utility of the IR Model
According to [10], every mediator has got a rank according to its perceived response size. The one with the largest perceived
response size receives rank No. 1, and the same rank is given to mediators with equal perceived response sizes. Mediators are
chosen to be sent queries based on their ranks, resulting in the query probability P(m) (m=1, 2, …, num_mediators). This is
used to calculate the response recall of the organization, which is given by the following equation:
sizetopicenv
msizeresponseactualmPrecallresponse
mediatorsnum
m
__
)(__)(_
_
1∑=
×=
(1)
where the expectation of the system’s actual response size regarding all the mediators is divided by the environmental topic
size to form the value of the response recall.
The IR model assumes that queries have a Poisson arrival distribution with mean rate query rate, and each node follows the
FIFO processing principle. Each database has a process service rate, defining how quickly it can process queries. Likewise,
Figure 5: Organization template of the information retrieval system. [10]

each aggregator and mediator has a response service rate, and must wait for the slowest information source before sending
responds. The probability density function (pdf) and cumulative density function (cdf) of the waiting time in a database node
are given as:
x
M exf λλλ −=),( (2)
xM exF λλ −−=1),( (3)
where x≥0 is the waiting time and λ=service_rate–arrival_rate. The query rate of the mediator m equals query_rate×P(m),
and all nodes under a particular mediator inherit the query rate of that mediator. The service rate of a database is simply its
process service rate, whereas aggregators and mediators have service rate as response_service_rate/num_sources.
The pdf and cdf of the maximum service time of a node’s all sources can be generated by the following equations:
∑∏==
=n
i i
in
iin xF
xfxFxf11
)( )()(])([)(
(4)
∏=
=n
iin xFxF
1)( )()(
(5)
where fi and Fi represent the pdf and cdf of the ith source respectively.
The mediator and aggregator must process and aggregate the resulting data, leading to a total service time combining these
two activities. The pdf and cdf of the total service time can then be determined by the convolution of the corresponding local
and source distribution functions, which have the forms:
∑=
⋅−⋅=x
ilsC stepdistixfifxf
0
_)()()( (6)
∑=
⋅−⋅=x
ilsC stepdistixFifxF
0
_)()()( (7)

where x=0, 1, 2, …, dist_range/dist_step, with dist_range representing the upper bound on the sampled points and dist_step
the stride length between points. fs is the aggregate information source pdf, and fl and Fl are the pdf and cdf of the waiting
time for the local queuing process.
By incorporating the result propagation process and the cumulative overhead latency incurred by the message transits we can
predict the expected response time of the system as a whole. And finally the utility of organization is computed by combining
the aspects of response recall and response time with appropriate weights of each term as follows:
10/_1000_ timeresponserecallresponseutility −×= (8)
5.2 Simplifying the Organization Representation with Regard to the IR Model
Since it is assumed in the IR model that all the databases in the system contain the same amount of topic data, and thus, there
are no differences among the end nodes (i.e. leaves of the trees), we may directly borrow the array representation introduced
in Section 3 to the IR model. Here Level 1 is the mediator level, where nodes are all mediators. The intermediate nodes
correspond to aggregators, and the leaf nodes are database agents. The whole organization can be outlined by a set of trees.
Exchange of information is enabled between every two root nodes and all immediate superiors and subordinates.
From a practical viewpoint, we notice that it is not necessary to include an aggregator if it only has one subordinate, because
it will only increase the information transmission delay and not bring any integration advantages. Hence, if such an
organization instance emerges, we can simply omit the aggregator node and reduce the organization structure by one level.
Related modification can be made in the array representation, which is summarized below. Firstly, obtain all the segments of
a genome between adjacent mediators (i.e. the integer series between 1’s). Set the smallest values of these segments to 2.
Secondly, obtain all the segments with 1’s and 2’s as separators. Set the smallest values of these segments to 3. Continue
until the highest level of the organization. Figure 7 shows the detailed steps of a sample simplifying procedure. It transforms
a 5-level sample organization of the IR system to a 4-level one. In the simplified organization, all mediators and aggregators
have no less than two sources.

The simplifying procedure is employed to achieve higher utility. At the same time, the number of organization instances we
have to evaluate for every representation is reduced to one.
5.3 Implementation and Evaluation Criteria
In the case study of the IR model, the optimization is carried out using genetic algorithm with population of organizations
represented by arrays, the hierarchical crossover and the mutation of small perturbation as described in the above sections.
The utility value serves as the fitness measure of an individual organization. If the arrival rate exceeds the service rate at one
or more points, resulting in infinite queues, the fitness of the organization will be penalized. Systems with one infinite queue
are considered to have fitness of –2500, and for each additional infinite queue, another 500 is deducted from the fitness.
Original representation: 3 1 5 2 3 3 4 2 1 2 5 3 1 4 3
Using “1” as separators: 3 1 5 2 3 3 4 2 1 2 5 3 1 4 3 Using “1” “2” as separators: 2 1 5 2 3 3 4 2 1 2 5 3 1 4 2
Using “1” to “3” as separators: 2 1 3 2 3 3 4 2 1 2 5 3 1 3 2
Final organization: 2 1 3 2 3 3 4 2 1 2 4 3 1 3 2
Figure 7: Simplifying the organization. Nodes M are mediators, nodes A are aggregators, and nodes D are databases.

We recognize that there are likely multiple optimal solutions that achieve the same utility in a given system environment,
owing to the symmetry of the structures. Besides, the building blocks that may lead to a good solution need to be maintained
in the population. Therefore, we need a method that allows growth in several promising areas in the search space. In other
words, the diversity of the population should be enhanced and over-convergence should be avoided. We increase the
competition between similar individuals by applying the restricted tournament selection (RTS) method described in [6]. It
helps to preserve diverse building blocks needed to locate the optimal organization. A flowchart of the algorithm is shown in
Figure 8.
Figure 8: Flowchart of the algorithm.

We compare the proposed algorithm, called hierarchical genetic algorithm (HGA), with the standard genetic algorithm using
one-point crossover with bit-wise mutation (SGA1) and two-point crossover with bit-wise mutation (SGA2) in order to show
the benefits of the newly introduced operators. We examine the algorithms in two aspects, the accuracy and the stability of
search, which are evaluated using the parameters, average percentage relative error (APRE) and success rate (SR),
respectively. They are derived using the following equations.
The percentage relative error (PRE) can be calculated by:
PRE=(fbest–f)/fbest×100 (9)
where fbest is the best known fitness value among all the runs of all the algorithms for a given test case, and f is the current
fitness value achieved by the algorithm. APRE is the average of the PRE values among all the independent runs of each test
case.
SR is a number between 0 and 1 that denotes the ratio of the number of runs in which the best known solution is found by the
algorithm to the total number of runs in each test case. Since GAs involve stochastic initialization of solution candidates,
selection, crossover, and mutation, the stability of search is also an important factor that we should take account into.
We examine the test cases of 12, 14, 16, 18, 20, 22, 24, 26, 28, and 30 databases. The maximum height of the structures is set
to be 4. The population size and the maximum number of candidate evaluations used are shown in Table 1. All algorithms
use a window size w=5 for RTS in the population updating stage. The mutation rate is 0.1. All the test cases involve 10
independent runs.
The environment parameters of the IR model are set as follows: message latency = 20 milliseconds, process service rate = 10
per second, response service rate = 20 per second, and query rate = 3 per second. The search set size and query set size are set
to be the total number of mediators for each organization. The response recall is therefore identical (100%) in all cases, and
the utility is determined by the response time.
The best achieved fitness value in every generation is recorded and the best organization instance found after the maximum
number of candidate evaluations along with its fitness are used for calculating APRE and SR. In this case study and many
other applications, the computation time of the genetic operators and population updating is negligible compared to that of
the candidate evaluations. Moreover, when parallel computing is used, the execution time depends on number and quality of

the machines used. Therefore, we conclude that the number of candidate evaluations is more suitable as an evaluation metric
than computation time. When we use the same machine, computation time is proportional to the number of candidate
evaluations. All algorithms are tested in MATLAB ver. 7.9.0.
Table 1: Configurations of HGA. No. DBs Population Size No. of Candidate Evaluations
12 50 2,000
14 100 5,000
16 200 10,000
18 500 50,000
20 500 50,000
22 500 50,000
24 500 100,000
26 500 100,000
28 500 100,000
30 1,000 200,000
6 Experimental Results
In this section we will firstly analyze the properties of the best solutions found by the algorithms so far. Secondly, we will
demonstrate the advantage of the proposed HGA over the standard GA with one-point and two point crossover in locating the
best organization of the IR system.1
6.1 Best Organizations Found by the Algorithms
The characteristics of the best organizations found by the algorithms are listed in Table 2, and the corresponding structures
are shown in Figure 9. Since previous studies did not give comparison among the highly rated organizations in different
scenarios, it should be worthwhile for us to summarize their features.
1 As the EOS method does not contain detailed description of the algorithm, unfortunately, we are not able to compare our algorithm with EOS.

Table 2: Characteristics of the Best Organizations. No. of DBs Representation of Best Organization No. of
Mediators No. of Levels
Total No. of Agents
Fitness
12 33233133233 2 3 18 860.39
14 3233132331323 3 3 23 847.62
16 332313323133233 3 3 25 839.20
18 33233133233133233 3 3 27 832.27
20 4434342443434243434 1 4 33 821.60
22 332434341434342434434 2 4 37 813.90
24 43434243434143434243434 2 4 42 810.13
26 4434342443434143434243434 2 4 44 802.24
28 443434244343414434342443434 2 4 46 795.96
30 44343442443434414434342443434 2 4 48 790.06
Firstly, we may see that there is no node with more than 6 sources in the best organization of any test case because it will
cause an infinite queue in the current settings. If an aggregator has too many sources, it needs a long time to collect and
analyze the information from the sources, and is thus not optimal. Secondly, most of the best found organizations are
composed of the following strings: 3323, 33233, 443434. These baseline structures of 5, 6, and 7 databases offer an
advantage in efficiency and are assembled to constitute the best organization in a larger scale. During the evolutionary search,
they are identified by the algorithms as building blocks for solutions with high fitness values. Thirdly, as the number of
databases increases, the model has to deal with more distributed load. It first seeks to introduce more mediators, and later the
height of the structure is increased to balance off the transmission burden of mediators. For example, 2 mediators are
sufficient to handle a system with 12 databases, but for a system with 18 databases, 3 mediators are needed. And in the 20-
database case, a 3-level organization with 3 mediators is no longer adequate, therefore a 4th level is added. Since the height of
the structure is raised, the number of mediators is cut down to avoid unnecessary delay in assembling the data.

It can be observed from Figure 9 that it is beneficial to group the databases at the bottom level as evenly as possible, which is
consistent with our intuition of a good organization design. In the test cases where there are 12, 18, 24, and 28 databases,
balanced allocation can be realized. Perfect symmetry appears in the designs. Similar efforts are made in the test cases of 14,
(a) 12 databases (b) 14 databases (c) 16 databases
(d) 18 databases (e) 20 databases
(f) 22 databases (g) 24 databases
(h) 26 databases
(i) 28 databases
(j) 30 databases
Figure 9: Best organizations found by the algorithm.

16, 20, 26, and 30 databases. Note that for the latter two instances, the two mediators process different number of databases,
however the second-level aggregators have exactly the same subordinate structures. The organizations shown in Figure 9(h&j)
achieve higher fitness values than the organizations with both mediators having the same number of databases, which can be
represented as [443434 2 43434 1 443434 2 43434] and [4434344 2 443434 1 4434344 2 443434] respectively. It is more
interesting to investigate the case where there are 22 databases. The tradeoff is so difficult and eventually unbalanced
organization wins. Moreover, putting two or three databases at the penultimate level emerges as a good choice in this kind of
situations.
6.2 Comparison of Results
Table 3 shows the APRE of SGA1, SGA2, and HGA in the 10 test cases, and the SR values are displayed in Table 4. The
best value for each test case is highlighted. It can be observed that the accuracy of the proposed HGA is better than SGA1
and SGA2 in 9 out of the 10 cases. Only in the 18-database case, SGA2 outperforms SGA1 and HGA in terms of APRE.
Table 3: Average Percentage Relative Error. No. DBs SGA1 SGA2 HGA
12 0.1103 0.1122
0.0370
14 0.0090 0.0460
0
16 0.0966 0.0869
0
18 0.0940 0.0372
0.0505
20 0.1150 0.3076 0.0749
22 0.2037 0.3085 0.0031
24 0.3376 0.4914 0.0406
26 0.1556 0.3494 0
28 0.2104 0.5307 0.0067
30 0.2470 0.4825 0
Regarding the search ability, HGA also has an advantage over SGA1 and SGA2 in the majority of the test cases. The
superiority of HGA is more pronounced in larger-scale organizations which contain more than 20 database nodes. In those
cases, SGA1 and SGA2 fail to locate the best known organization instances for most of the time, whereas the proposed HGA
still maintains high SR values of 90%–100%. This proves that HGA uses fewer candidate evaluations to locate the best

organization than the conventional GAs. Given that the candidate evaluations are very computationally expensive in many
real-world systems, it is beneficial to use HGA in such circumstances.
Table 4: Success Rate. No. DBs SGA1 SGA2 HGA
12 0.5 0.5
0.8
14 0.8 0.7
1
16 0.7 0.8
1
18 0.8 0.8
0.8
20 0.5 0.1 0.3
22 0.1 0 0.9
24 0.2 0 0.9
26 0.4 0.1 1
28 0.2 0 0.9
30 0.2 0.1 1
The non-parametric Wilcoxon signed-rank test is performed to judge whether there is a statistically significant difference
between HGA and SGA1/SGA2. As a pair-wise test in a multi-problem scenario, we use all the APRE values of each
algorithm as sample vectors. The null hypothesis H0 is set as “there is no difference between HGA and SGA1/SGA2 in terms
of the APRE values.” Accordingly, the alternative hypothesis H1 is ‘‘The two methods are significantly different.” A
significance level of 0.05 is implemented, i.e. if the p-value of the test turns out to be less than 0.05, the algorithms involved
are considered to have different performance, and the smaller the p-value is, the more distinct they are from each other. We
get that the APRE values of HGA is different from those of SGA1 at the p-value of 0.001953 and is different from those of
SGA2 at the p-value of 0.003906, which suggests the proposed algorithm is statistically better than both SGAs.
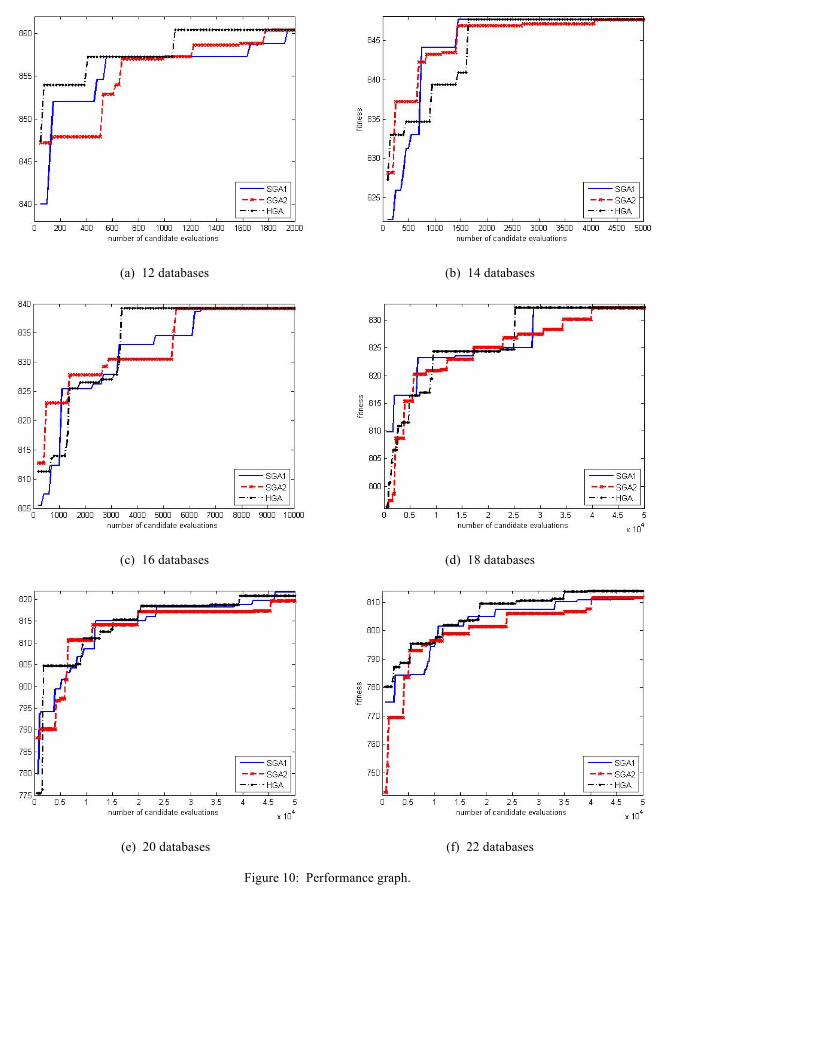
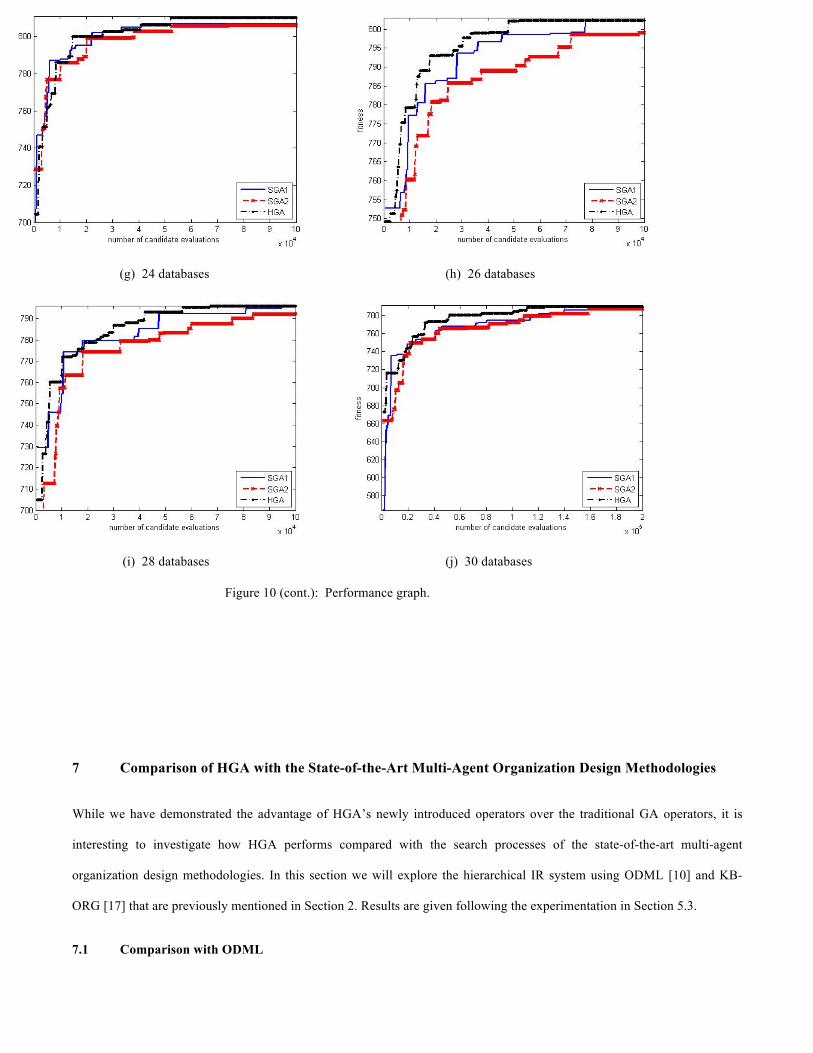
The performance graphs of the median runs (i.e. the 5th best runs in our experiment) of SGA1, SGA2, and HGA are shown in
Figure 10. Owning to the specially designed genetic operators, HGA is able to locate good solutions faster in most of the
circumstances. When the number of databases is larger (especially over 20 databases), HGA regularly scores higher fitness
than SGA1 and SGA2 when the same number of candidate evaluations is used. It is also able to find better organizations
within the maximum number of candidate evaluations. From Figure 10(f,g,h,i,j) we can see, HGA has a remarkable
advantage over SGA1 and SGA2 in the convergence speed.
(a) 12 databases (b) 14 databases
(c) 16 databases (d) 18 databases
(e) 20 databases (f) 22 databases
Figure 10: Performance graph.
7 Comparison of HGA with the State-of-the-Art Multi-Agent Organization Design Methodologies
While we have demonstrated the advantage of HGA’s newly introduced operators over the traditional GA operators, it is
interesting to investigate how HGA performs compared with the search processes of the state-of-the-art multi-agent
organization design methodologies. In this section we will explore the hierarchical IR system using ODML [10] and KB-
ORG [17] that are previously mentioned in Section 2. Results are given following the experimentation in Section 5.3.
7.1 Comparison with ODML
(g) 24 databases (h) 26 databases
(i) 28 databases (j) 30 databases
Figure 10 (cont.): Performance graph.

In ODML, four approaches are listed to assist the search process. They are the exploitation of hard constraints, equivalence
classes, parallel search, and model abstraction. Rather than going through a decision tree to verify whether an organization
instance satisfies the hard constraints of the problem as ODML does, our algorithm incorporates the array representation that
already ensures the satisfaction of constraints in maximum height of the structure and the number of databases in the system.
Parallel search and model abstraction are also intuitively used in HGA.
In ODML, the agents are treated in three equivalence classes: the mediators, the aggregators, and the databases. Within the
same class, the characteristics of the agents do not distinguish between each other. In other words, choosing any agent in the
“mediators” group for a role of mediator in the IR organization is the same. Moreover, the number of organization
alternatives can be cut down by discarding organizations which are equivalent to an existing one in the candidate pool. For
instance, the organizations shown in Figure 11 are equivalent in ODML in that their utility will be exactly the same, and only
one should be kept as an evaluation candidate.
Based on these notions, we have calculated the number of evaluations needed for ODML in the 10 test cases as in Section 5.3,
with exploited hard constraints of the number of database nodes from 12 to 30 and the maximum height of the structure
equaling 4. All nodes in the organizations (expect the leaf nodes) should have a minimum of two subordinates. Details are
shown in Table 5. It confirms that the number of organization instances increases exponentially as the number of leaf node
agents increases, despite the truncation of redundant equivalent organizations. The total number of evaluations can be
approximated as O(2.1N), where N is the number of leaf nodes. Comparing Table 5 with Table 1, we can see that HGA uses
much fewer candidate evaluations than ODML does. Especially, when the number of databases becomes larger, the fraction
of the number of candidate evaluations needed by HGA to the total number of candidate evaluations becomes smaller and
smaller. This saves a great amount of computation burden, as the computation of utility functions can be extremely expensive.
Figure 11: An Example of equivalent organizations in ODML.

Table 5: Number of organization Evaluations Needed for ODML. No. DBs No. of Evaluations No. DBs No. of Evaluations
12 4,304 22 9,675,949
14 20,699 24 43,663,703
16 98,186 26 195,062,099
18 459,311 28 863,372,191
20 2,120,799 30 3,788,734,984
It should be noted that the proposed HGA is compatible with all the above mentioned search space reducing measures,
however, we maintain the equivalent organizations as in Figure 11, for they may contribute to finding an optimal solution of
the test problems. This compromise results in a larger search space for HGA, whereas in ODML, the elimination of
redundant equivalent organizations helps to narrow down the search range to a great extent. When the number of equivalent
organizations is prevailing, ODML should have an advantage benefited from the elimination measure. Nevertheless, in the
studied system, HGA still manages to evolve the population of organizations at a reasonable pace, and it spares the
computation time for branch pruning at the same time.
7.2 Comparison with KB-ORG
KB-ORG has also placed much effort on reducing the search space. Different from ODML, it emphasizes the use of design
knowledge in application and coordination of roles and design functions. With good knowledge, a system can be designed
with relatively affordable cost. However, in certain cases, design knowledge is hard to acquire. It largely depends on the level
of expertise of the designer. A barely trained designer may have little experience to rely on when he or she tries to construct
an organization for a multi-agent system under the guideline of KB-ORG. Design knowledge is not guaranteed to be accurate.
When taking a greedy approach in a certain decision step, the search process may leave out the optimal solutions. In addition,
design knowledge needs to be updated following the change of environmental variables. If the environmental variables are
altered, previous knowledge may not be applicable anymore; instead, new knowledge should be added to help the
organization design.
In the IR model, the utility of the organizations does not involve spatial contents, and every role has only got one kind of
agent to perform, so no extra knowledge is required in either spatial proximity of the agents or role-agent binding. The main
difficulty lies in the coordination of agents, e.g. how many levels of hierarchy is needed. Assume that the designer has

successfully searched out the best organizations for 12, 14, 16, and 18 databases. He may think that a 3-level hierarchy is best
for the 20-databse case. This will reduce the search space to 58,327 organizations, which is only 2.75% of ODML’s search
space, but, it will miss out the highest rated organization, which is 4-leveled with the utility of 821.60. The best 3-level
organization can be expressed with our proposed representation as [33233 1 33233 1 3233233], with the utility of 814.11,
which is worse than the worst utility (820.01) found by HGA within 50,000 evaluations in all runs. On the other hand, if the
designer reaches at a relaxed bound of structure height of either 3 or 4 for the 20-database case, the number of organization
evaluations will mount to 2,120,662.
Let us further assume that the designer not only has the knowledge about the vertical depth of the organization structure, but
also has some knowledge about its horizontal size. If in the 22-database case, it can be speculated that the organizations with
4 levels and 2 mediators are optimal, the designer is faced with a search space of 3,384,278 options without duplicate. And
for organizations with 24 databases, 4 levels, and 2 mediators, the number is 12,686,252. If it can be speculated furthermore
that the highest rated organization is made up of 4 levels, 2 mediators, with every mediator having 2 subordinate agents, the
number of evaluations needed for KB-ORG will be 282,812 and 800,996 for the test cases with 22 and 24 databases
respectively, whereas, for HGA, only 50,000 and 100,000 evaluations are needed to reach a 90% success rate. Although
design knowledge has brought us convenience in searching for the highest rated organization in these test cases, it is far from
satisfactory. In contrast, our algorithm searches for the highest rated organization in a heuristic way. It is able to handle these
test cases without the assistance of external expertise.
8 Conclusion and Future Work
We have proposed a novel genetic algorithm based approach to solve the problem of designing the best organization in
hierarchical multi-agent systems. Complementary to existing methodologies that emphasize on the pruning of the search
space, our algorithm uses a bio-inspired evolutionary approach to lead the search to promising areas of the search space, and
is thus suitable for optimizing multi-agent systems with a great variety of possible organizations where designer expertise
alone is not enough or hard to acquire. In the example of the information retrieval system, we have empirically proved that
the algorithm is able to discover competitive baseline structures in different systems and assemble them to obtain the highest
rated structure from a magnitude of up to 109 organization alternatives. In particular, we propose the use of hierarchical

crossover and mutation of small perturbation to add to the advantage of our algorithm. The new crossover and mutation
methods help HGA enhance the search efficiency greatly, promoting its performance both in accuracy and stability of search.
With necessary modifications, the proposed algorithm is applicable to other models as well. It can be used to optimize any
tree-based hierarchical organizations of multi-agent systems, given that proper fitness values are assigned. Application areas
include scenario tree and decision tree optimization. On the other hand, the proposed array representation can also be used for
other forms of MAS organizations, such as holarchies. It is worthwhile to further examine the performance of the algorithm
for systems with non-uniform leaf nodes and unfixed number of leaf nodes using Representation 2 and 3. In subsequent
studies, we will investigate the efficiency of the proposed approach in larger-scale MASs involving a massive number of
agents.
References
[1]. Aranha, C., and Iba, H. 2009. The memetic tree-based genetic algorithm and its application to portfolio optimization. Memetic Computing 1(2): 139–151.
[2]. Bäck, T. 1996. Evolutionary Algorithms in Theory and Practice: Evolution Strategies, Evolutionary Programming, Genetic Algorithms. Oxford University Press US.
[3]. De Jong, K. A. 2006. Evolutionary Computation: A Unified Approach. Cambridge, MA: MIT Press.
[4]. Ferber, J., Gutknecht, O., and Michel, F. 2003. From agents to organizations: an organizational view of multi-agent systems. In: Lecture Notes in Computer Science, 2935, Proc. Agent-Oriented Software Engineering 2003: 214–230.
[5]. Fernández, A., and Ossowski, S. 2008. Exploiting organisational information for service coordination in multiagent systems. In Proceedings of the 7th International Conference on Autonomous Agents and Multiagent Systems (AAMAS), 257–264, Estoril, Portugal.
[6]. Harik, G. R. 1995. Finding multimodal solutions using restricted tournament selection. In Proceedings of the 6th International Conference on Genetic Algorithms, 24–31. San Francisco, CA: Morgan Kaufmann Publishers Inc.
[7]. Holland, J. H. 1975. Adaptation in Natural and Artificial Systems. Ann Arbor, MI: University of Michigan Press.
[8]. Horling, B., and Lesser, V. 2005. Analyzing, modeling and predicting organizational effects in a distributed sensor network. Journal of the Brazilian Computer Society 11(1): 9–30.
[9]. Horling, B., and Lesser, V. 2005. A survey of multi-agent organizational paradigms. The Knowledge Engineering Review 19(4): 281–316.
[10]. Horling, B., and Lesser, V. 2008. Using quantitative models to search for appropriate organizational designs. Autonomous Agents and Multi-Agent Systems 16(2): 95–149.
[11]. Kirley, M. 2006. Dominance hierarchies and social diversity in multi-agent systems. Proceedings of the 8th Annual Conference on Genetic and Evolutionary Computation (GECCO), 159–166. Seattle, Washington, USA.
[12]. Lesser, V. 1998. Reflections on the nature of multi-agent coordination and its implications for an agent architecture. Autonomous Agents and Multi-Agent Systems, 1: 89–111.

[13]. Li, B., Yu, H., Shen, Z., and Miao, C. 2009. Evolutionary organizational search. In Proceedings of the 8th International Conference on Autonomous Agents and Multiagent Systems - Volume 2, 1329–1330. Budapest, Hungary.
[14]. Nan, G., Li, M., and Kou, J. 2005. Multi-level genetic algorithm (MLGA) for the construction of clock binary tree. In Proceedings of the 2005 Conference on Genetic and Evolutionary Computation, 1441–1445. Washington DC, USA: ACM.
[15]. Okamoto, S., Scerri, P., and Sycara, K. 2008. The impact of vertical specialization on hierarchical multi-agent systems. In Proceedings of the 23rd AAAI Conference on Artificial Intelligence, 138–143.
[16]. Phelps, S., McBurney, P., and Parsons, S. 2010. Evolutionary mechanism design: a review. Autonomous Agents and Multi-Agent Systems, 21: 237–264.
[17]. Sims, M., Corkill, D., and Lesser, V. 2008. Automated organization design for multi-agent systems. Autonomous Agents and Multi-Agent Systems 16(2): 151–185.
[18]. Vázquez-Salceda, J., Dignum, V., and Dignum, F. 2005. Organizing multiagent systems. Autonomous Agents and Multi-Agent Systems, 11: 307–360.
[19]. Wooldridge, M., Jennings, N. R., and Kinny, D. 2000. The Gaia methodology for agent-oriented analysis and design. Autonomous Agents and Multi-Agent Systems, 3: 285–312.
[20]. Yang, J. and Luo, Z. 2007. Coalition formation mechanism in multi-agent systems based on genetic algorithms. Applied Soft Computing, 7: 561–568.
[21]. Zafar, H., Lesser, V., Corkill, D., and Ganesan, D. 2008. Using organization knowledge to improve routing performance in wireless multi-agent networks. In Proceedings of the 7th International Conference on Autonomous Agents and Multiagent Systems - Volume 2, 821–828.