Generated on 2014-02-16 03:31 GMT / ...
75
blic Domain, Google-digitized / http://www.hathitrust.org/access_use#pd-google
-
Upload
khangminh22 -
Category
Documents
-
view
1 -
download
0
Transcript of Generated on 2014-02-16 03:31 GMT / ...

A
I.
ENGIN. LIB.
, ‘1
1" ‘ T‘-
." “'5;
’ ,QHL
I Q78
How to Service
Radios with an
fiscillosope
\J’.’
Genera
ted o
n 2
01
4-0
2-1
6 0
3:3
1 G
MT /
htt
p:/
/hd
l.hand
le.n
et/
20
27
/mdp.3
90
15
02
10
72
56
9Public
Dom
ain
, G
oog
le-d
igit
ized
/
htt
p:/
/ww
w.h
ath
itru
st.o
rg/a
ccess
_use
#pd-g
oogle

Genera
ted o
n 2
01
4-0
2-1
6 0
3:3
2 G
MT /
htt
p:/
/hd
l.hand
le.n
et/
20
27
/mdp.3
90
15
02
10
72
56
9Public
Dom
ain
, G
oog
le-d
igit
ized
/
htt
p:/
/ww
w.h
ath
itru
st.o
rg/a
ccess
_use
#pd-g
oogle

Genera
ted o
n 2
01
4-0
2-1
6 0
3:3
2 G
MT /
htt
p:/
/hd
l.hand
le.n
et/
20
27
/mdp.3
90
15
02
10
72
56
9Public
Dom
ain
, G
oog
le-d
igit
ized
/
htt
p:/
/ww
w.h
ath
itru
st.o
rg/a
ccess
_use
#pd-g
oogle

Genera
ted o
n 2
01
4-0
2-1
6 0
3:3
2 G
MT /
htt
p:/
/hd
l.hand
le.n
et/
20
27
/mdp.3
90
15
02
10
72
56
9Public
Dom
ain
, G
oog
le-d
igit
ized
/
htt
p:/
/ww
w.h
ath
itru
st.o
rg/a
ccess
_use
#pd-g
oogle
HOW TO
SERVICE RADIOS
WITH AN
OSCILLOSCQPE
§YLVANIA ELECTRIC PRODUCTS INC.
5/00 FIFTH AVENUE NEW YORK 18, N. Y.
Genera
ted o
n 2
01
4-0
2-1
6 0
3:3
2 G
MT /
htt
p:/
/hd
l.hand
le.n
et/
20
27
/mdp.3
90
15
02
10
72
56
9Public
Dom
ain
, G
oog
le-d
igit
ized
/
htt
p:/
/ww
w.h
ath
itru
st.o
rg/a
ccess
_use
#pd-g
oogle

Engin, Library
TR
“’1’
f-'
"2 LJ
vi
5 (/8
FIRST Em'rxou
6th Printing
PRINTKD IN U.S‘A.
Genera
ted o
n 2
01
4-0
2-1
6 0
3:3
2 G
MT /
htt
p:/
/hd
l.hand
le.n
et/
20
27
/mdp.3
90
15
02
10
72
56
9Public
Dom
ain
, G
oog
le-d
igit
ized
/
htt
p:/
/ww
w.h
ath
itru
st.o
rg/a
ccess
_use
#pd-g
oogle

Fifi
z/ »,r
j l
1(-
PREFACE
CHAPTER
CHAPTER
CHAPTER
CHAPTER
CHAPTER
CHAPTER
CHAPTER
III.
IV.
VI.
VII.
TABLE OF CONTENTS
Page
OSCILLOSCOPE FUNDAMENTALS 9
1.1 Usefulness of the Oscilloscope. 1.2 Cathode Rays. 1.3 The Electron Gun. 1.4 Defect-
ing Plates. 1.5 How an AC Signal Afi'ects the Beam. 1.6 Sensitivity. 1.7 Cathode Ray
Tube Sizes.
THE LINEAR TIME BASE 14
2.1 Function of Time Base. 2.2 Sweep Voltage Nature and Source. 2.3 Sweep and Sig-
nal Voltage Relations.
THE COMPLETE OSCILLOSCOPE 17
3.1 Instrument Arrangement. 3.2 Sylvania Oscilloscope Type 131. 3.3 Sylvania Oscil-
loscope Type 132.
VOLTAGE MEASUREMENTS WITH THE OSCILLOSCOPE 29
4.1 Cathode Ray Tube as V. T. Voltmeter. 4.2 Voltage Measurement Principle. 4.3 DC
Voltage Measurement. 4.4 Alternating Voltage Measurement. 4.5 Sensitivity of Oscil-
loscope Voltmeter. 4.6 Calibration of Oscilloscope as Voltmeter. 4.7 Gain Control Cal-
ibration. 4.8 Calibration of Direct Input. 4.9 Calibration of Horizontal Plates. 4.10
Extension of Screen Scale.
USE OF THE OSCILLOSCOPE IN RADIO RECEIVER SERVICING 35
5.1 AM Receiver Alignment Using AM Signal Generator. 5.2 AM Receiver Alignment
Using FM Signal Generator. 5.3 Aligning F lat-Topped High-Fidelity Receivers. 5.4 Ad-
ditional Instructions on Receiver Alignment. 5.5 FM Receiver Alignment. 5.6 AFC
Alignment. 5.7 Checking AVC Action. 5.8 Establishing Marker Points. 5.9 Finding
Receiver Faults from Oscilloscope Patterns. 5.10 Signal Tracing and Trouble-Shooting
of Radio Receivers. 5.11 Testing AM Superhets. 5.12 Testing FM Receivers.
USE OF THE OSCILLOSCOPE IN AUDIO AMPLIFIER TESTING 48
6.1 Signal Transmission Test in Single Amplifier Stage. 6.2 Measurement of Voltage
Gain. 6.3 Locating Hum. 6.4 Distortion Measurements with Sine Waves. 6.5 Distortion
Measurements with Square Waves. 6.6 Checking Frequency Response. 6.7 Signal Trac-
ing in Audio Amplifier.
USE OF THE OSCILLOSCOPE IN TRANSMITTER TESTING 56
7.1 Modulation Checking with Wave Patterns. 7.2 Modulation Checking with Trape-
zoidal Patterns. 7.3 Detecting Hum and Noise on Carrier. 7.4 Checking Class-C Linearity.
Genera
ted o
n 2
01
4-0
2-1
6 0
3:3
2 G
MT /
htt
p:/
/hd
l.hand
le.n
et/
20
27
/mdp.3
90
15
02
10
72
56
9Public
Dom
ain
, G
oog
le-d
igit
ized
/
htt
p:/
/ww
w.h
ath
itru
st.o
rg/a
ccess
_use
#pd-g
oogle

CHAPTER VIII.
MISCELLANEOUS APPLICATIONS 60
8.1 Frequency Checking with Circular Pattern. 8.2 Frequency Checking with Sine-
Wave Pattern. 8.3 Frequency Checking with Other Patterns. 8.4 Frequency Checking
with Intensity Modulation. 8.5 Calibration of Fine Frequency Control. 8.6 Checking
Phase Relationships. 8.7 Checking Phase Inverter Action. 8.8 Current Measurement with
Oscilloscope. 8.9 Impedance Measurement. 8.10 AC Power Supply Tests. 8.11 Checking
Ripple Current in Filter Capacitors. 8.12 Checking Peak Current in Rectifiers. 8.13
Auto Radio Vibrator Tests. 8.14 Checking DC Generator Ripple. 8.15 Use of Oscillo-
scope as Bridge Null Detector. 8.16 Use of Oscilloscope as Zero Beat Indicator. 8.17
Exploring Probe for RF Signal Tracing. 8.18 Demonstration of Speech Waveforms. 8.19
Electronic Switch.
Genera
ted o
n 2
01
4-0
2-1
6 0
3:3
2 G
MT /
htt
p:/
/hd
l.hand
le.n
et/
20
27
/mdp.3
90
15
02
10
72
56
9Public
Dom
ain
, G
oog
le-d
igit
ized
/
htt
p:/
/ww
w.h
ath
itru
st.o
rg/a
ccess
_use
#pd-g
oogle
PREFACE
The purpose of this book is to explain in a practical manner the opera-
tion and applications of the cathode ray oscilloscope. This is not an engi-
neering manual. We expect that our readers will be radio and amplifier
servicemen, and some radio operators, students and technicians.
Because of its general usefulness for all kinds of radio work, the oscillo-
scope deserves to be used much more widely than it is now. We believe
that radio servicemen have neglected the oscilloscope more because of a
lack of knowledge of how to use it than for any other single reason. This
book explains in simple terms the steps to follow in using an oscilloscope
to service AM and FM radios, audio amplifiers and transmitters. All theo-
retical material has been sifted, condensed and sifted again. Only abso-
lutely essential theory—theory which we believe will be of real value to
radio servicemen—has been retained. We have tried to keep the language
as simple as possible and yet give complete and technically accurate ex-
planations as well as detailed pictorial material to aid in a better under-
standing of the function of the oscilloscope.
Space in any book unfortunately is limited. There has not been room
for every one of the thousands of applications of the oscilloscope. We
have selected for complete explanation those applications which are most
likely to be of interest and service to our readers. If we have been able, in
any measure, to save radio servicemen time and trouble and make their
tasks more interesting and enjoyable through better understanding and
familiarity with new tools, we will consider our job not so badly done.
Genera
ted o
n 2
01
4-0
2-1
6 0
3:3
2 G
MT /
htt
p:/
/hd
l.hand
le.n
et/
20
27
/mdp.3
90
15
02
10
72
56
9Public
Dom
ain
, G
oog
le-d
igit
ized
/
htt
p:/
/ww
w.h
ath
itru
st.o
rg/a
ccess
_use
#pd-g
oogle

On the left is the Sylvonia Three-Inch Oscilloscope Type 131 and on the right,
the Sylvania Seven-Inch Oscilloscope Type 132. Use of these instruments in servic-
ing AM and FM radio receivers and many other applications is described in de-
tail in this book.
<._J
Genera
ted o
n 2
01
4-0
2-1
6 0
3:3
2 G
MT /
htt
p:/
/hd
l.hand
le.n
et/
20
27
/mdp.3
90
15
02
10
72
56
9Public
Dom
ain
, G
oog
le-d
igit
ized
/
htt
p:/
/ww
w.h
ath
itru
st.o
rg/a
ccess
_use
#pd-g
oogle
CHAPTER I
OSCILLOSCOPE FUNDAMENTALS
1.1 USEFULNESS OF
THE OSCILLOSCOPE
The modern oscilloscope is the most useful single
tool a radio repairman can own. More than any other
instrument, it removes the guesswork from radio
maintenance and repair and makes it possible to get
at the seat of troubles quickly. Now moderately
priced, oscilloscopes offer the exceptional advantage
of allowing the serviceman to analyze the actual signal
in radio circuits while the circuits are in operation.
The oscilloscope will:
1. Trace and measure a signal throughout the
various rf, if, and audio channels of a receiver.
2. Indicate how well each channel is adjusted.
3. Reveal the presence of outside signal voltages,
such as those due to hum and noise.
4. Check the operating characteristics of receiver
audio channels and complete audio amplifiers
by showing amplifier response patterns on its
screen.
5. In the alignment of broad-hand amplifiers and
other circuits requiring special response curves,
show the complete curve in one operation,
thereby eliminating point-by-point plotting.
6. Perform a complete trouble-shooting job on a
receiver or amplifier when used with a dc
vacuum-tube voltmeter-ohmmeter, such as the
Sylvania Polymeter; an audio oscillator, such
as the Sylvania Type 145; and a signal genera-
tor such as the Sylvania Type 216.
7. Provide the only effective way of adjusting
some types of modern radio apparatus, such
as FM and television receivers, broad-band
high-fidelity rf amplifiers, high-frequency
power supplies, and automatic frequency con-
trol circuits.
EVACU ATED
METALLIC METALLIC
CATHODE GLASS TUBE; ANODE
PLATE PLATE
CATHODE RAYS
- +
iIII *1
HIGH VOLTAGE
FIGURE 1'! PRODUCTION OF CATHODE RAYS
INA SIMPLE VACUUM TUBE
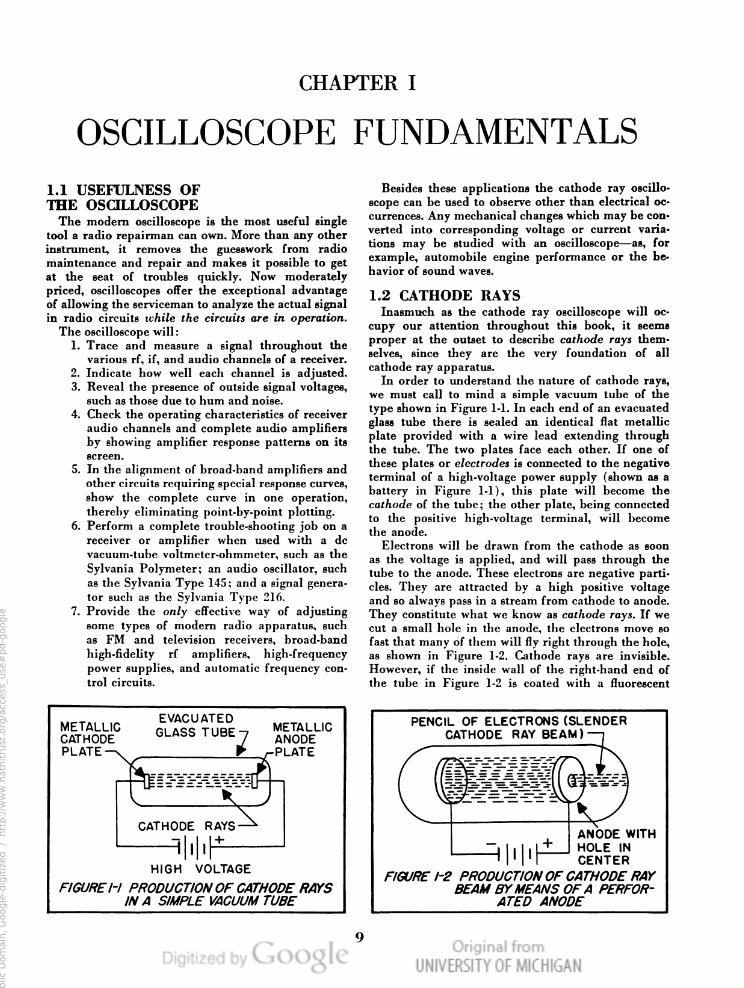
Besides these applications the cathode ray oscillo-
scope can be used to observe other than electrical oc-
currences. Any mechanical changes which may be con-
verted into corresponding voltage or current varia-
tions may be studied with an oscilloscope-as, for
example, automobile engine performance or the be,
havior of sound waves.
1 .2 CATHODE RAYS
Inasmuch as the cathode ray oscilloscope will oc-
cupy our attention throughout this book, it seems
proper at the outset to describe cathode rays them-
selves, since they are the very foundation of all
cathode ray apparatus.
In order to understand the nature of cathode rays,
we must call to mind a simple vacuum tube of the
type shown in Figure 1-1. In each end of an evacuated
glass tube there is sealed an identical flat metallic
plate provided with a wire lead extending through
the tube. The two plates face each other. If one of
these plates or electrodes is connected to the negative
terminal of a high-voltage power supply (shown as a
battery in Figure 1-1), this plate will become the
cathode of the tube; the other plate, being connected
to the positive high-voltage terminal, will become
the anode.
Electrons will be drawn from the cathode as soon
as the voltage is applied, and will pass through the
tube to the anode. These electrons are negative parti-
cles. They are attracted by a high positive voltage
and so always pass in a stream from cathode to anode.
They constitute what we know as cathode rays. If we
cut a small hole in the anode, the electrons move so
fast that many of them will fly right through the hole,
as shown in Figure 1-2. Cathode rays are invisible.
However, if the inside wall of the right-hand end of
the tube in Figure 1-2 is coated with a fluorescent
PENCIL OF ELECTRONS (SLENDER
CATHODE RAY BEAM)
\
ANODE WITH
—Jl||ll+ HOLE m
I I CENTER
Fla/RE /-2 PRODUCTION OF CATHODE RAY
BEAM BYMEANS OF A PERFOR-
A TED ANODE
Genera
ted o
n 2
01
4-0
2-1
6 0
3:3
2 G
MT /
htt
p:/
/hd
l.hand
le.n
et/
20
27
/mdp.3
90
15
02
10
72
56
9Public
Dom
ain
, G
oog
le-d
igit
ized
/
htt
p:/
/ww
w.h
ath
itru
st.o
rg/a
ccess
_use
#pd-g
oogle
PHOSPHOR COATING
INSIDE TUBE
VIEWIN G
CATHODE RAY BEAM
ELECTRON GUN
SCREEN
ossssvsas
GLASS VACUUM EYE
TUBE SPACE
FIGURE I-3 ARRANGEMENT 0F GUN AND
$0REENfiQ$GILLO$GDPE
chemical, it will glow at the point where the electron
beam strikes it. This will produce a small, bright dot,
at that point, but elsewhere the fluorescent surface
will not be affected. In the modern oscillosc0pe tube
employed by radio engineers and servicemen, emis-
sion of electrons is efl'ected by heating a cathode,
rather than as shown in Figures 1-1 and 1-2.
1.3 THE ELECTRON GUN
The heart of the oscilloscope tube is the electron
gun. The electron gun is mounted in one end of the
evacuated glass tube and projects its cathode ray
beam toward the opposite end of the tube where the
slightly curved glass end serves as a viewing screen.
Minus other essential elements, the arrangement of
the gun and viewing screen is shown in Figure 1-3.
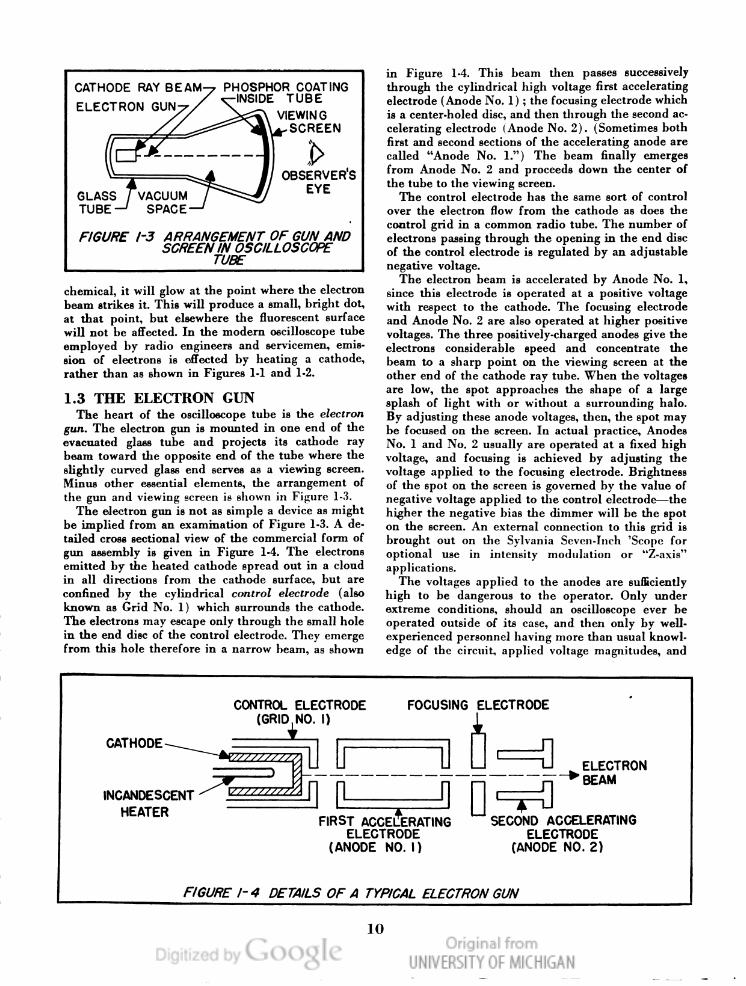
The electron gun is not as simple a device as might
be implied from an examination of Figure 1-3. A de-
tailed cross sectional view of the commercial form of
gun assembly is given in Figure 1-4. The electrons
emitted by the heated cathode spread out in a cloud
in all directions from the cathode surface, but are
confined by the cylindrical control electrode (also
known as Grid No. 1) which surrounds the cathode.
The electrons may escape only through the small hole
in the end disc of the control electrode. They emerge
from this hole therefore in a narrow beam, as shown
in Figure 1-4. This beam then passes successively
through the cylindrical high voltage first accelerating
electrode (Anode N o. 1) ; the focusing electrode which
is a center-holed disc, and then through the second ac-
celerating electrode (Anode No. 2). (Sometimes both
first and second sections of the accelerating anode are
called “Anode No. 1.”) The beam finally emerges
from Anode No. 2 and proceeds down the center of
the tube to the viewing screen.
The control electrode has the same sort of control
over the electron flow from the cathode as does the
control grid in a common radio tube. The number of
electrons passing through the opening in the end disc
of the control electrode is regulated by an adjustable
negative voltage.
The electron beam is accelerated by Anode No. 1,
since this electrode is operated at a positive voltage
with respect to the cathode. The focusing electrode
and Anode No. 2 are also operated at higher positive
voltages. The three positively-charged anodes give the
electrons considerable speed and concentrate the
beam to a sharp point on the viewing screen at the
other end of the cathode ray tube. When the voltages
are low, the spot approaches the shape of a large
splash of light with or without a surrounding halo.
By adjusting these anode voltages, then, the spot may
be focused on the screen. In actual practice, Anodes
No. 1 and No. 2 usually are operated at a fixed high
voltage, and focusing is achieved by adjusting the
voltage applied to the focusing electrode. Brightness
of the spot on the screen is governed by the value of
negative voltage applied to the control electrode—the
higher the negative bias the dimmer will be the spot
on the screen. An external connection to this grid is
brought out on the Sylvania Seven-Inch ’Scope for
optional use in intensity modulation or “Z-axis”
applications.
The voltages applied to the anodes are sufficiently
high to be dangerous to the operator. Only under
extreme conditions, should an oscilloscope ever be
operated outside of its case, and then only by well-
experienced personnel having more than usual knowl-
edge of the circuit, applied voltage magnitudes, and
CONTROL ELECTRODE
(GRID NO. I)
h
FOCUSING ELECTRODE
CATHODE\L L J
lNCANDESCENT” EZZZEZZ§¢J_ 1L
\\\\\
_’ ELECTRON
_—__f ____ _'_ BEAM
HEATER
FIRST ACCEIIERATING SECOND ACCELERATING
ELECTRODE
(ANODE no.1)
ELECTRODE
(ANODE NO. 2)
FIGURE /"4 DE TAILS OF A TYPICAL ELECTRON GUN
Genera
ted o
n 2
01
4-0
2-1
6 0
3:3
2 G
MT /
htt
p:/
/hd
l.hand
le.n
et/
20
27
/mdp.3
90
15
02
10
72
56
9Public
Dom
ain
, G
oog
le-d
igit
ized
/
htt
p:/
/ww
w.h
ath
itru
st.o
rg/a
ccess
_use
#pd-g
oogle

exposed high-potential points. Remember that inside
the oscilloscope many points are connected, to high
voltages which in other electronic circuits are at low
potential. For example, the chassis, normally “cold”
in other types of instruments, is at —700 V. in the
Sylvania ’Scope Type 131 and at ——-1500 V. in the
Sylvania ’Scope Type 132.
1.4 DEFLECTING PLATES
If the tube had no other elements except the gun
and screen, as indicated in Figure 1-3, the beam would
strike the screen in the exact center and would produce
a single glowing spot which might be focused. Such a
tube would have little value for tests and measure-
ments. To swing the beam around and move the spot
to various positions on the screen deflecting plates are
employed.
The placement of deflecting plates within a typical
oscilloscope tube is shown in Figure 1-5. These metal-
lic plates are arranged in pairs, with one pair at
right angles to the other, so that the electron beam
must pass successively between both pairs on its way
to the fluorescent viewing screen and so come under
the influence of any electric charge applied to the
plates. One pair of plates (H1 and H2) is arranged to
move the beam horizontally from side to side. The
second pair (V1 and V2) moves the beam vertically,
up and down. Figure 1-6 is an end view of a typical
oscilloscope tube (looking in from the viewing screen
end), showing the position of the two pairs of de-
flecting plates with respect to the electron beam.
If one remembers that a negative charge of high
voltage will repel the electron beam and a positive
charge will attract the beam he can understand how
these electrostatic deflection plates work. Referring
to Figure 1-6, if no external voltages are applied to
either pair of deflecting plates, the beam will travel
down the center of the tube and will produce a single
spot on the screen. The screen pattern will then cor-
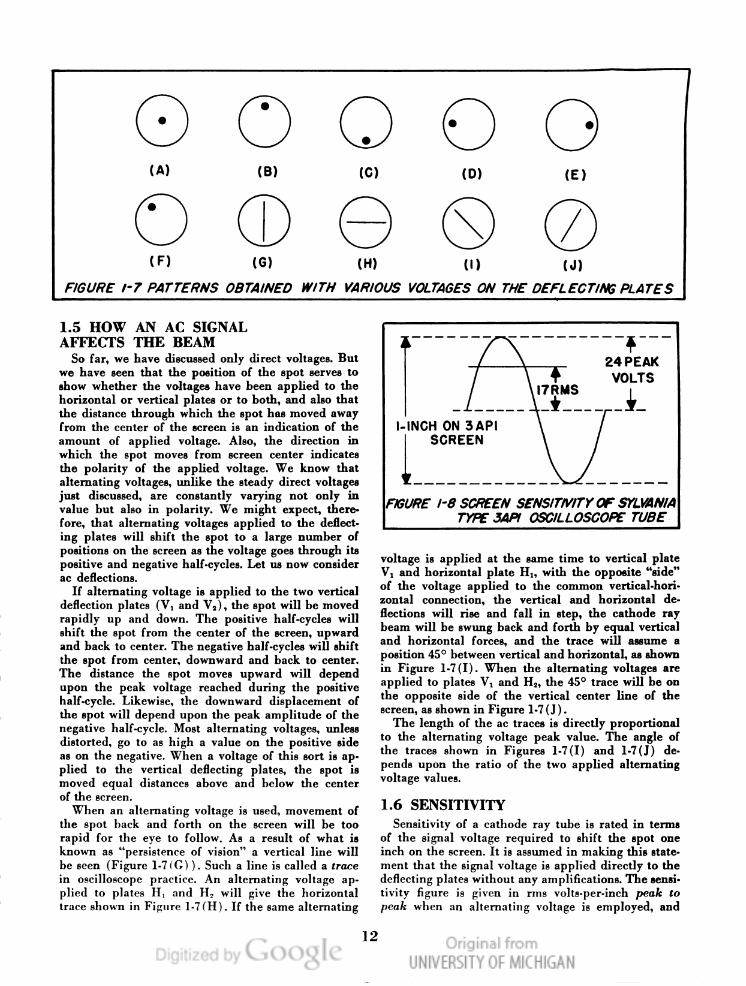
respond to Figure 1-7 (A) .
If vertical plate V1 is made positive with respect to
vertical plate V,, the beam will be attracted toward
V1, and the spot will be deflected upward away from
ELECTRON
BEAM
IGURE [-6 END VIEW OF A TYPICAL OSCIL-
F LOSCOPE TUBE SHOWING AR-
RANGEMENT 0!‘ 0m. 50 mva
PLATES
the center of the screen, as in Figure 1-7(B). If verti-
cal plate V1 is made negative with respect to V2, the
spot will be shifted downward, as in Figure 1-7(C).
All three illustrations (A, B and C) assume that there
is zero voltage on the horizontal deflecting plates
(H1 and H2) .
If the vertical plates are operated at zero voltage,
and horizontal plate H1 is made positive with respect
to H2, the beam will be attracted toward H1, and the
spot will be shifted to the left on the screen, as shown
in Figure 1-7(D). And finally, if horizontal plate H,
is made positive with respect to H1, the spot will be
shifted to the right on the screen, as shown in Figure
1-7(E).
In each instance, the distance the spot is moved
from its center-of-screen (zero voltage) position is
directly proportional to the applied voltage. If equal
positive voltages are applied to vertical plate V1 and
horizontal plate H1, the beam will be attracted both
upward and to the left by equal forces. The result is
a shift of the spot to a resultant position at a 45°
angle from the center of the screen, as shown in Figure
1-7 (F) . Other combinations of voltages applied simul-
taneously to vertical and horizontal deflecting plates
will shift the spot to corresponding positions on the
screen. By choosing the proper horizontal and vertical
voltages, the spot may be placed at any desired posi-
tion on the screen.
CATH ODE RAY BEAM
ELECTRON GUN
HORIZONTAL
DEFLECTING
PLATE 3
/
VERTICAL DEFLECTING
/ PLATES
TO FLUORESCENT
VIEWING SCREEN
COMMON CONNECTION
FIGURE 1'5 ARRANGEMENT 0F ELECTRON GUN AND DEFLECTING PLATES IN A
TYPICAL OSCILLOSCOPE TUBE
Genera
ted o
n 2
01
4-0
2-1
6 0
3:3
2 G
MT /
htt
p:/
/hd
l.hand
le.n
et/
20
27
/mdp.3
90
15
02
10
72
56
9Public
Dom
ain
, G
oog
le-d
igit
ized
/
htt
p:/
/ww
w.h
ath
itru
st.o
rg/a
ccess
_use
#pd-g
oogle
O
(A)
O
(B) (C) (D) (E)
(F) (6) (HI (I) (J)
FIGURE 1'7 PATTERNS OBTAINED WITH VARIOUS VOLTAGES ON THE DEFLECTMG PLATES
1.5 HOW AN AC SIGNAL
AFFECT S THE BEAM
So far, we have discussed only direct voltages. But
we have seen that the position of the spot serves to
show whether the voltages have been applied to the
horizontal or vertical plates or to both, and also that
the distance through which the spot has moved away
from the center of the screen is an indication of the
amount of applied voltage. Also, the direction in
which the spot moves from screen center indicates
the polarity of the applied voltage. We know that
alternating voltages, unlike the steady direct voltages
just discussed, are constantly varying not only in
value but also in polarity. We might expect, there-
fore, that alternating voltages applied to the deflect-
ing plates will shift the spot to a large number of
positions on the screen as the voltage goes through its
positive and negative half-cycles. Let us now consider
ac deflections.
If alternating voltage is applied to the two vertical
deflection plates (V, and V,), the spot will be moved
rapidly up and down. The positive half-cycles will
shift the spot from the center of the screen, upward
and back to center. The negative half-cycles will shift
the spot from center, downward and back to center.
The distance the spot moves upward will depend
upon the peak voltage reached during the positive
half-cycle. Likewise, the downward displacement of
the spot will depend upon the peak amplitude of the
negative half-cycle. Most alternating voltages, unless
distorted, go to as high a value on the positive side
as on the negative. When a voltage of this sort is ap-
plied to the vertical deflecting plates, the spot is
moved equal distances above and below the center
of the screen.
When an alternating voltage is used, movement of
the spot back and forth on the screen will be too
rapid for the eye to follow. As a result of what is
known as “persistence of vision” a vertical line will
be seen (Figure l-7(G) ). Such a line is called a trace
in oscilloscope practice. An alternating voltage ap-
plied to plates H. and H2 will give the horizontal
trace shown in Figure 1-7 (H). If the same alternating
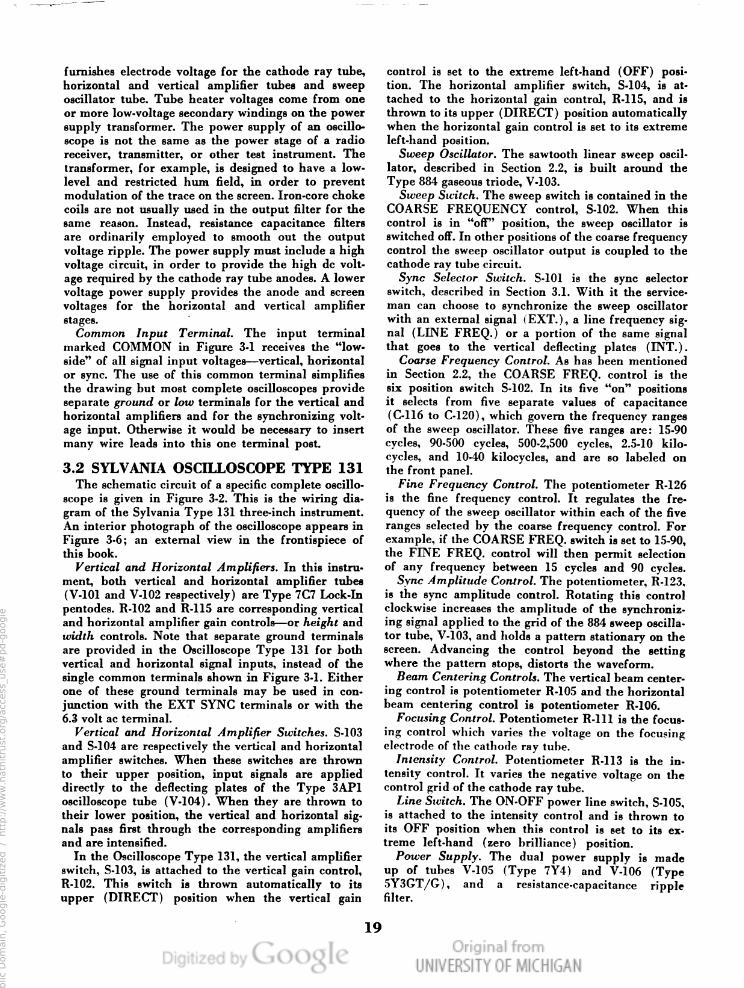
I-INCH ON 3 API
SCREEN
FEURE 1'8 SCREEN SENS/TlV/TYOF SYLVAN/A
TYPE 3AP/ OSCILLOSCOPE TUBE
voltage is applied at the same time to vertical plate
V1 and horizontal plate H1, with the opposite “side”
of the voltage applied to the common vertical-hori-
zontal connection, the vertical and horizontal de-
flections will rise and fall in step, the cathode ray
beam will be swung back and forth by equal vertical
and horizontal forces, and the trace will assume a
position 45° between vertical and horizontal, as shown
in Figure l-7(I). When the alternating voltages are
applied to plates V1 and H2, the 45° trace will be on
the opposite side of the vertical center line of the
screen, as shown in Figure 1-7 (I ) .
The length of the ac traces is directly proportional
to the alternating voltage peak value. The angle of
the traces shown in Figures 1-7(I) and 1-7(.l) de-
pends upon the ratio of the two applied alternating
voltage values.
1.6 SENSITIVITY
Sensitivity of a cathode ray tube is rated in terms
of the signal voltage required to shift the spot one
inch on the screen. It is assumed in making this state-
ment that the signal voltage is applied directly to the
deflecting plates without any amplifications. The sensi-
tivity figure is given in rms volts-per-inch peak to
peak when an alternating voltage is employed, and
l2
Genera
ted o
n 2
01
4-0
2-1
6 0
3:3
3 G
MT /
htt
p:/
/hd
l.hand
le.n
et/
20
27
/mdp.3
90
15
02
10
72
56
9Public
Dom
ain
, G
oog
le-d
igit
ized
/
htt
p:/
/ww
w.h
ath
itru
st.o
rg/a
ccess
_use
#pd-g
oogle

FIGURE 1-9 Sylvania 3AP1 Cathode Ray Tube used in
the Sylvania Oscilloscope Type 131.
simply in volts-per-inch when the applied signal is
a direct voltage. Sensitivity of the Sylvania Type
3AP1 tube, as used in the Sylvania Oscilloscope Type
131, is 17 volts rms to give a one inch peak to peak
deflection. That is, an ac voltage 17 volts rms on an
ordinary voltmeter will produce a trace which meas-
ures one inch from the top of the positive peak to
the bottom of the negative peak on a 3AP1 tube
screen. See Figure 1-8.
1.7 CATHODE RAY TUBE SIZES
Oscilloscope tubes are rated in size according to the
diameters of their viewing screens. Thus, the three
FIGURE 1-10 Sylvania TGP1 Cathode Ray Tube used in
the Sylvania Oscilloscope Type 132.
inch tube has a three inch viewing screen, the seven
inch tube a seven inch diameter screen, etc.
Study and experience in all problems involved show
the three and seven inch diameters to be the most
practical and versatile oscilloscope tube sizes for
general laboratory and radio shop applications. These
diameters give good clear images large enough to be
seen easily. They also provide good sensitivity. Figures
1-9 and 1-10 are pictures of popular oscilloscope tubes
of these two sizes. Figure 1-9 shows the Sylvania
Type 3AP1 three-inch tube. Figure 1-10 shows the
Sylvania Type 7GP1 seven-inch tube, used in the Syl-
vania Oscilloscope Type 132.
13
Genera
ted o
n 2
01
4-0
2-1
6 0
3:5
2 G
MT /
htt
p:/
/hd
l.hand
le.n
et/
20
27
/mdp.3
90
15
02
10
72
56
9Public
Dom
ain
, G
oog
le-d
igit
ized
/
htt
p:/
/ww
w.h
ath
itru
st.o
rg/a
ccess
_use
#pd-g
oogle

CHAPTER II
THE LINEAR TIME BASE
2.1 FUNCTION OF TIME BASE
Up to this point, we have considered only the pat-
terns obtained when signal voltages are applied to
the deflecting plates of an oscilloscope tube. The
oscilloscope finds its greatest use, however, in observa-
tion of the actual waveform and amplitude of alter-
nating and transient voltages.
On graphs of such voltages, amplitude (measured
vertically) is always plotted against time (measured
horizontally). Examples are the 60-cycle sine wave
shown in Figure 2-1 (A) and the 60-cycle square wave
shown in Figure 2-1(B). In each case, voltage level
(amplitude) is shown along the vertical axis and time
along the horizontal axis.
To reproduce waveforms on the viewing screen, it
is necessary to sweep the spot across the screen hori-
zontally from left to right at the same time that the
spot is being moved up and down vertically by the
signal voltage under observation. Furthermore in
order to carry out this process successfully, a com-
plete left-to-right sweep of the electron beam must
be accomplished in the time required for the vertical
signal to complete one cycle, if we wish to see one
complete cycle on the screen.
In Figure 2-1 (A), when a 60-cycle sine wave signal
voltage is applied to the vertical plates and a left-to-
right linear sweeping voltage is applied to the hori-
zontal plates, the spot traces out a plot of the voltage
variations occurring in one cycle of the signal voltage.
Thus, the spot will start its trip at zero, will be at the
crest of the positive half-cycle in 1/240 second, at the
zero line at 1 / 120 second, at the trough of the negative
half-cycle at 1/80 second, and again at the zero line
1/60 second from the time it started. In between these
time intervals, the spot will be at each point along the
curve and will move with such speed as to give in-
stantaneous reproduction of the waveform.
2.2 SWEEP VOLTAGE NATURE
AND SOURCE
In order to sweep the electron beam horizontally in
one direction only (left to right), the sweep voltage
must be made to increase evenly from zero to a posi-
tive value high enough to shift the spot to the extreme
right-hand side of the screen, and then must fall sud-
denly to zero.
If no signal is applied to the vertical plates, the
horizontal trace produced by the sweep voltage will
be a straight line, similar to that shown in Figure
1-7(H). Although any alternating voltage applied to
the horizontal plates will produce such a straight line
trace, sine waves are unsatisfactory as normal time
bases since they do not possess the desirable feature
of an even (linear) rise in voltage from zero to a high
positive value and almost instantaneous return to zero.
A suitable waveform for the time-base sweep volt-
age is shown in Figure 2-2. Note that this sawtooth-
shaped voltage wave successively rises evenly from
E1 (zero) to E, (the positive value required to shift
the spot to the right-hand side of the screen) and
_l_
240 SEC-
NEG. VOLTS 0 P05. VOLTS
(A) SINE WAVE
_|_
0 sec. IZOSEC.
POS. VOLTS
<———c|’———>
NEG. VOLTS
(8) ONE TYPE OF SQUARE WAVE
FIGURE 2'! RELATION OF VOLTAGE VARIATIONS TO TIME
14
Genera
ted o
n 2
01
4-0
2-1
6 0
3:5
3 G
MT /
htt
p:/
/hd
l.hand
le.n
et/
20
27
/mdp.3
90
15
02
10
72
56
9Public
Dom
ain
, G
oog
le-d
igit
ized
/
htt
p:/
/ww
w.h
ath
itru
st.o
rg/a
ccess
_use
#pd-g
oogle

VOLTAGE RANGE REQUIRED TO SHIFT
SPOT HORIZONTALLY ACROSS SCREEN\
_ E
El
FIGURE 2'2 SAWTOOTH SWEEP VOLTAGE
APPLIED TO HORIZONTAL
PLATES
then falls quickly back to level E1. The sharp drop
from E2 to El must occur in a small fraction of the
time required for the completion of one cycle of the
signal voltage applied to the vertical plates.
The required sawtooth wave may be generated by
any one of a number of special circuits. However, the
circuit usually employed in oscilloscopes is a relaxa-
tion-type gaseous tube oscillator. The circuits of the
linear sweep oscillator employed in the Sylvania
Three-Inch Oscilloscope Type 131 is shown in Figure
2-3. A similar circuit is used in the Type 132 seven-
inch instrument.
In this circuit, the sawtooth waveform is generated
by the alternate charging of one of the capacitors
selected by switch 82 and the subsequent discharge of
the capacitor through the Type 884 gaseous triode.
The mechanism may be explained in this manner:
Current flows from the 300-volt dc power source into
the capacitor, causing the voltage across the capacitor
to build up as shown by the climbing sides of the
wave in Figure 2-2. When the capacitor voltage
reaches a certain value, the tube fires, quickly dis-
charging the capacitor. This discharge causes the
capacitor voltage to drop quickly, as indicated by the
steep dropping sides of the wave in Figure 2-2. The
tube stops conducting when the capacitor voltage falls
to the “extinction potential” of the tube. The capaci-
tor then recharges from the 300-volt source, and
the sawtooth is repeated. The frequency of the saw-
tooth oscillation is governed by the capacitance of the
selected capacitor and the resistance setting of the
potentiometer R2. Actually, the capacitor sets the fre-
quency range in this circuit, and R2 may be set to se-
cure any desired frequency within this range. Because
of this action, switch 51 is termed the COARSE FRE-
QUENCY CONTROL, and potentiometer R2, the
FINE FREQUENCY CONTROL. C1 in the Sylvania
Oscilloscope Type 131 is the 0.25 pfd capacitor which
selects the 15-90 cycle sweep frequency range. With
52 in its C1 position the potentiometer R2 accordingly is
“tunable” from 15 to 90 cycles. The frequency range of
the sweep-voltage generator contained in the Sylvania
Oscilloscope Type 131 extends from 15 to 40,000 cycles
per second. The Type 132 has a range of approxi-
mately 15 to 30,000 cycles per second.
Sawtooth output voltage from the plate circuit of
the sweep oscillator is coupled to the horizontal input
circuit of the oscilloscope tube. Since this output volt-
age usually is too low to be eflective, and since the
sweep oscillator should be isolated from the rest of
the instrument circuit, a voltage amplifier (not shown
in Figure 2-3) is inserted between the sweep oscillator
and the horizontal deflecting plates. This amplifier
will be discussed later.
TO VERTICAL INPUT
LINE FREQe
Hf;
H|—> TO GRID 0F HORIZONTAL
AMPLIFIER
,FINE FREQUENCY
‘INTERNAL
l
3
SYNC SELECTOR
SWITCH
J‘EXTERNAL
@—
SYNC
NP T
I U SYNC AMPLITUDE'
9 CONTROL
R2 CONTROL
- WOHSOOV.
S? COARSE FREQUENCY
/ CONTROL
+ 5 V.
FIGURE 2'3 SAWTOOTH LINEAR SWEEP OSCILLATOR
Genera
ted o
n 2
01
4-0
2-1
6 0
3:5
3 G
MT /
htt
p:/
/hd
l.hand
le.n
et/
20
27
/mdp.3
90
15
02
10
72
56
9Public
Dom
ain
, G
oog
le-d
igit
ized
/
htt
p:/
/ww
w.h
ath
itru
st.o
rg/a
ccess
_use
#pd-g
oogle

(A) (B) (0) (D)
1:2" fl fz'ifl
Q'zfl
1‘' = SIGNAL FREQUENCY
(VERT. PLATES)
f2
= SWEEP FREQUENCY
(HORIZ . PLATES)
fi'éfi
FIGURE 2'4 SIGNAL V5. SWEEP RELATIONS AS VIEWED 0N OSCILLOSCOPE SCREEN
The sweep oscillator is self-excited. However, if it
is to show one cycle of signal voltage on the screen,
it must oscillate at the same frequency as the signal
under test. If two test cycles are to be shown on the
screen, it must oscillate at one half the frequency of
the test signal, etc. To do either it must be synchro-
nized with a signal voltage to keep their frequencies
“locked together” to prevent the pattern from drift-
ing across the screen. This synchronizing voltage is
applied to the grid of the sweep oscillator tube.
The same signal voltage which is applied to the ver-
tical deflecting plates can be applied also to the grid
of the 884 tube when 5,, the SYNC SELECTOR
SWITCH (see Figure 2-3), is thrown to its IN-
TERNAL position. Internal synchronization allows
the signal to “freeze” its own pattern on the screen.
This removes the necessity of supplying a separate
synchronizing signal. When S, is in its lowermost
(EXTERNAL) position, any suitable external signal
voltage may be fed into the instrument for synchro-
nizing purposes, via the SYNC terminals. When
switch 5; is set to its center (LINE FREQUENCY)
position, the synchronizing voltage, taken from the
884 heater terminals, has the same frequency as that
of the power line. Proper adjustment of the SYNC
AMPLITUDE CONTROL potentiometer, R1, locks the
image in a stationary position on the screen. Advanc-
ing this control beyond the setting where the pattern
stops distorts the waveform.
2.3 SWEEP AND SIGNAL VOLTAGE
RELATIONS
When the sawtooth sweep voltage has the same
frequency as that of the vertical signal voltage, it has
been shown that a single complete cycle of signal
voltage appears on the screen. This pattern is shown
in Figure 24(A). When the sweep frequency is one-
half the signal frequency, the signal has a chance to
complete two cycles by the time the sweep trace
reaches the right-hand side of the screen. The cor-
responding pattern is shown in Figure 24(B). If the
sweep frequency is twice the signal frequency, the
horizontal swing is completed at the end of the posi-
tive half-cycle of the signal. The beam then swings
hack to the left-hand side of the screen and starts
out again. This second swing then catches the negative
half-cycle, plotting it directly below the positive half,
as shown in Figure 2-4(C). A sweep frequency equal
to one-third the signal frequency will catch three com-
plete cycles of the signal, as shown in Figure 24(D).
From these relationships, it is clear that by proper
adjustment of the sweep frequency controls the
serviceman can select one or several cycles of signal
voltage for study on the screen. While sine waves
have been shown here for the sake of simplicity, use
of the instrument is not restricted to sine wave signals.
The patterns might as easily have been those of more
complex waves.
16
Genera
ted o
n 2
01
4-0
2-1
6 0
3:5
3 G
MT /
htt
p:/
/hd
l.hand
le.n
et/
20
27
/mdp.3
90
15
02
10
72
56
9Public
Dom
ain
, G
oog
le-d
igit
ized
/
htt
p:/
/ww
w.h
ath
itru
st.o
rg/a
ccess
_use
#pd-g
oogle

CHAPTER III
THE COMPLETE OSCILLOSCOPE
3. l INSTRUMENT ARRANGEMENT
In the foregoing chapters, to explain how an oscillo-
scope works, we have talked about the cathode ray
tube and its operation almost as if this tube were all
by itself. To fit it for tests and measurements, how-
ever, the tube requires, in addition to a power supply
and sweep oscillator, already described, several other
circuits and devices. The complete oscilloscope, such
as the Sylvania Type 131 Three-Inch and the Type
132 Seven-Inch, is a complex instrument of many
stages.
Several “basic oscilloscopes” are likewise available.
The basic instrument is composed simply of a cathode
ray tube and power supply. Such an oscilloscope is
limited in application, since no provision is made in
its circuit for sweep action or for signal amplification.
The incomplete, basic oscilloscope was designed pri-
marily for use as a modulation meter for radiophone
stations, and is useful for very little else. It has vir-
tually no value in radio servicing.
A block diagram of a typical complete oscilloscope
is given in Figure 3-1. This diagram shows the ar-
rangement of the various controls, switches, and cir-
cuits which comprise the complete instrument, and
indicates their relationship to each other. These sec-
tions of the instrument will be discussed separately
in the following paragraphs.
Vertical Amplifier. This is a high gain broad-band
voltage amplifier, used to increase the signal voltage
applied to the vertical deflecting plates. Without this
amplifier, low signal voltages could not be examined,
since they do not produce a vertical trace on the
screen of suflicient height. The vertical amplifier is
provided with a gain control in order that the service-
man can adjust the amount of amplification. Setting
of the vertical gain control governs the height of the
pattern on the viewing screen.
The input circuit of the amplifier is coupled to the
VERTICAL INPUT terminal through a fixed ca-
pacitor which serves also to protect the instrument
from any harmful dc voltage in the signal under
measurement.
Vertical Amplifier Switch. This is the single-pole,
double-throw switch, 5,, in Figure 3-1. When this
sancu. soggy“ DIRECT
v ©—I(>—-—o->
mrur s VERTICAL
| T mmnsn A
cam contact vzsrlcs ssm
cznrrmus comm.
“2'15” sumac?
HORIZONTM© .1
INPUT -\ HORIZONTAL
52 °__i up In I carnoDE
sun A L in I RAY ruse ’—-
osm CONTROL 1
Yo Focusms 1'0 contact
comm" Q ELECTRODE smo
V LO—
,couPuuc one - - — - - - - _ _.== HORIZONTAL scam Focusmo wrsusrrv
sync SELECTOR CENTERINO CONTROL CONTROL CONTROL
smrcu
~~_ swear
5"“; @ l‘ '"T‘ s OSCILLATOR SWEEP °"
mrur s
,v o 9 o 4 oswzsp orr
coup'ima' ' R sweep svnrcu
I \
FINE COAR SE
F REG. F REO.
TO 'HIGN'SIDE OF TUBE HEATERS
TO VERTICAL AND HORIZONTAL AMPLIFIERS
TO SWEEP OSCILLATOR
-[4.—
+
'— mes voursos
0c Powza
+ suwur
FIGURE 5'/ BLOCK DIAGRAM 0F COMPLETE OSCILLOSCOPE
Genera
ted o
n 2
01
4-0
2-1
6 0
3:5
3 G
MT /
htt
p:/
/hd
l.hand
le.n
et/
20
27
/mdp.3
90
15
02
10
72
56
9Public
Dom
ain
, G
oog
le-d
igit
ized
/
htt
p:/
/ww
w.h
ath
itru
st.o
rg/a
ccess
_use
#pd-g
oogle

switch is thrown to its upper position, the signal is
applied directly to the vertical deflecting plates. A
large signal voltage, or one outside the frequency
range of the vertical amplifier, may be handled in
this manner. When 51 is thrown to its lower position,
the signal is passed through the amplifier before going
to the vertical plates. The vertical amplifier switch,
5,, is known also by the name of “signal input switch.”
Horizontal Amplifier. Like the vertical amplifier,
this is a high gain voltage amplifier. The purpose of
this stage is to increase the signal voltage applied to
the horizontal deflecting plates. Without this ampli-
fier, a low signal voltage (including the output volt-
age of the linear sweep oscillator) might not produce
a sumciently long trace on the viewing screen. Like
the vertical amplifier, the horizontal amplifier is
provided with a gain control, and is coupled through
a fixed isolating capacitor to the HORIZONTAL
INPUT terminal.
Because of its usual function in the complete os-
cilloscope, the horizontal amplifier frequently has
been termed the “sweep amplifier” or “time base
amplifier.”
Horizontal Amplifier Switch. This is the single-pole,
double-throw switch, 52, in Figure 3-1. It works in the
same way as the vertical amplifier switch, 5,. That is,
when the horizontal switch is thrown to its lower
position the signal or sweep voltage goes to the hori-
zontal amplifier for intensification before being ap-
plied to the horizontal deflecting plates.
Sweep Oscillator. The sweep oscillator in this in-
strument set-up is the relaxation-type sawtooth wave
generator described previously in Section 2.2 and
represented in Figure 3-1 by the lower left-hand
block. This unit is provided with controls for SYNC
AMPLITUDE, COARSE FREQUENCY adjustment,
and FINE FREQUENCY adjustment, each of which
was described in Section 2.2 and shown in detail in
Figure 2-3. The sweep oscillator has the main func-
tion of sweeping the signal across the screen so that it
will appear on the scope in the same form as it oc-
curs in the circuit being tested. The sweep oscillator
may also be used in frequency comparisons and other
applications to be described further along in this
book.
Sweep Switch. When sweep switch, 5,, is set to its
lower position, no sweeping voltage is coupled from
the plate circuit of the sawtooth oscillator to the hori-
zontal deflecting plates. When S, is thrown to its up-
per position, however, the sweep oscillator output
is capacitively coupled to the cathode ray circuit.
(On the two Sylvania oscilloscopes, the sweep switch
is incorporated in the COARSE FREQUENCY con-
trol. When this coarse frequency control is moved to
the “OE” position, the sweeping voltage is eliminated.
In any other position the coarse frequency con-
trol couples the sweep voltage to the cathode ray
circuit.) With S, in its upper position, and the hori-
zontal amplifier switch, S2, thrown to DIRECT, the
sweep voltage is applied directly to the horizontal
__ _ _A---_—
plates. When 52 is thrown to AMP, the sweep voltage
is amplified by the horizontal amplifier and then ap-
plied to the horizontal deflecting plates. The width
of the horizontal trace, and accordingly the width
of any pattern on the viewing screen, may be adjusted
by means of the setting of the gain control in the
horizontal amplifier, when S2 is thrown to AMP.
Sync Selector Switch. By means of the sync selector
switch, 53, the proper synchronizing voltage may be
selected and applied to the sweep oscillator grid. As
was shown in Section 2.2, the switch allows the opera-
tor to look at one or more complete cycles of test
signal, shown motionless on the screen. A portion of
the test signal itself may be used to lock the sweep
oscillator to its frequency (INT. position of switch).
An external oscillator or signal source can also be
used to synchronize the sweep oscillator with the test
signal EXT. position of switch, or the test signal can
be synchronized by the line voltage frequency (LINE
FREQ. position of switch).
Beam Centering Controls. These potentiometers
enable the operator to place the spot on any part of
the viewing screen. The spot may be moved up and
down, from top to bottom of the screen by means of
the vertical beam centering control, or back and forth,
from one side of the screen to the other, by means of
the horizontal beam centering control. The two con-
trols are high-resistance potentiometers through which
continuously variable dc voltages of the proper po-
larity are applied to the deflecting plates. The range
of beam centering adjustment is wide enough to per-
mit the moving of the spot to any position, and even
entirely off the screen in any direction.
Intensity Control. The intensity or brilliance con-
trol is a potentiometer through which a continuously
variable dc voltage of negative polarity is applied to
the control grid of the cathode ray tube to regulate
the brightness of the image on the screen. The higher
the voltage delivered by this control, the dimmer
will be the image.
In order to prevent burning of the viewing screen,
the serviceman should use at all times the minimum
intensity which will give a pattern which may easily
be seen. For the same reason, bright stationary pat-
terns must not he held on the screen for long periods.
Keep the pattern in motion whenever possible. A
single bright dot is especially harmful to the screen.
Focusing Comrol. The focusing control is a poten-
tiometer through which a continuously variable dc
voltage of positive polarity is applied to the focusing
electrode of the cathode ray tube to regulate clarity
of the image on the screen. The range of the control
is wide enough to allow adjustment of spot size from
a tiny clear pin-point to a large splatter surrounded
by a fuzzy halo. When the focusing control is set
properly, the trace or image on the screen has sharp,
clear lines, well in focus. When focusing is incorrect,
the lines of the image will be thick and fuzzy and ac-
curate readings of heights and widths on the screen
are impossible.
Power Supply. The high-voltage dc power supply
18
Genera
ted o
n 2
01
4-0
2-1
6 0
3:5
3 G
MT /
htt
p:/
/hd
l.hand
le.n
et/
20
27
/mdp.3
90
15
02
10
72
56
9Public
Dom
ain
, G
oog
le-d
igit
ized
/
htt
p:/
/ww
w.h
ath
itru
st.o
rg/a
ccess
_use
#pd-g
oogle
furnishes electrode voltage for the cathode ray tube,
horizontal and vertical amplifier tubes and sweep
oscillator tube. Tube heater voltages come from one
or more low-voltage secondary windings on the power
supply transformer. The power supply of an oscillo-
scope is not the same as the power stage of a radio
receiver, transmitter, or other test instrument. The
transformer, for example, is designed to have a low-
level and restricted hum field, in order to prevent
modulation of the trace on the screen. Iron-core choke
coils are not usually used in the output filter for the
same reason. Instead, resistance capacitance filters
are ordinarily employed to smooth out the output
voltage ripple. The power supply must include a high
voltage circuit, in order to provide the high dc volt-
age required by the cathode ray tube anodes. A lower
voltage power supply provides the anode and screen
voltages for the horizontal and vertical amplifier
stages. '
Common Input Terminal. The input terminal
marked COMMON in Figure 3-1 receives the “low-
side” of all signal input voltages——vertical, horizontal
or sync. The use of this common terminal simplifies
the drawing but most complete oscilloscopes provide
separate ground or low terminals for the vertical and
horizontal amplifiers and for the synchronizing volt-
age input. Otherwise it would be necessary to insert
many wire leads into this one terminal post.
3.2 SYLVANIA OSCILLOSCOPE TYPE 131
The schematic circuit of a specific complete oscillo-
scope is given in Figure 3-2. This is the wiring dia-
gram of the Sylvania Type 131 three-inch instrument.
An interior photograph of the oscilloscope appears in
Figure 3-6; an external view in the frontispiece of
this book.
Vertical and Horizontal Amplifiers. In this instru-
ment, both vertical and horizontal amplifier tubes
(V-101 and V-102 respectively) are Type 7C7 Lock-In
pentodes. R-102 and R-llS are corresponding vertical
and horizontal amplifier gain controls—or height and
width controls. Note that separate ground terminals
are provided in the Oscilloscope Type 131 for both
vertical and horizontal signal inputs, instead of the
single common terminals shown in Figure 3-1. Either
one of these ground terminals may be used in con-
junction with the EXT SYNC terminals or with the
6.3 volt ac terminal.
Vertical and Horizontal Amplifier Switches. S-103
and S-104 are respectively the vertical and horizontal
amplifier switches. When these switches are thrown
to their upper position, input signals are applied
directly to the deflecting plates of the Type 3AP1
oscilloscope tube (V-104). When they are thrown to
their lower position, the vertical and horizontal sig-
nals pass first through the corresponding amplifiers
and are intensified.
In the Oscilloscope Type 131, the vertical amplifier
switch, S-103, is attached to the vertical gain control,
R-102. This switch is thrown automatically to its
upper (DIRECT) position when the vertical gain
control is set to the extreme left-hand (OFF) posi-
tion. The horizontal amplifier switch, S-104, is at-
tached to the horizontal gain control, R-115, and is
thrown to its upper (DIRECT), position automatically
when the horizontal gain control is set to its extreme
left-hand position.
Sweep Oscillator. The sawtooth linear sweep oscil-
lator, described in Section 2.2, is built around the
Type 884 gaseous triode, V-103.
Sweep Switch. The sweep switch is contained in the
COARSE FREQUENCY control, S-102. When this
control is in “off” position, the sweep oscillator is
switched off. In other positions of the coarse frequency
control the sweep oscillator output is coupled to the
cathode ray tube circuit.
Sync Selector Switch. S-IOI is the sync selector
switch, described in Section 3.1. With it the service-
man can choose to synchronize the sweep oscillator
with an external signal (EXT.), a line frequency sig-
nal (LINE FREQ.) or a portion of the same signal
that goes to the vertical deflecting plates (INT.).
Coarse Frequency Control. As has been mentioned
in Section 2.2, the COARSE FREQ. control is the
six position switch S-102. In its five “on” positions
it selects from five separate values of capacitance
(C-116 to C-120), which govern the frequency ranges
of the sweep oscillator. These five ranges are: 15-90
cycles, 90-500 cycles, BOO-2,500 cycles, 2.5-10 kilo-
cycles, and 10-40 kilocycles, and are so labeled on
the front panel.
Fine Frequency Control. The potentiometer R-126
is the fine frequency control. It regulates the fre-
quency of the sweep oscillator within each of the five
ranges selected by the coarse frequency control. For
example, if the COARSE FREQ. switch is set to 15-90,
the FINE FREQ. control will then permit selection
of any frequency between 15 cycles and 90 cycles.
Sync Amplitude Control. The potentiometer, R-123,
is the sync amplitude control. Rotating this control
clockwise increases the amplitude of the synchroniz-
ing signal applied to the grid of the 884 sweep oscilla-
tor tube, V-103, and holds a pattern stationary on the
screen. Advancing the control beyond the setting
where the pattern stops, distorts the waveform.
Beam Centering Controls. The vertical beam center-
ing control is potentiometer R-105 and the horizontal
beam centering control is potentiometer R-106.
Focusing Control. Potentiometer R-lll is the focus-
ing control which varies the voltage on the focusing
electrode of the cathode ray tube.
Intensity Control. Potentiometer R-ll3 is the in-
tensity control. It varies the negative voltage on the
control grid of the cathode ray tube.
Line Switch. The ON-OFF power line switch, S-IOS,
is attached to the intensity control and is thrown to
its OFF position when this control is set to its ex-
treme left-hand (zero brilliance) position.
Power Supply. The dual power supply is made
up of tubes V-105 (Type 7Y4) and V-106 (Type
5Y3GT/G), and a resistance-capacitance ripple
filter.
19
Genera
ted o
n 2
01
4-0
2-1
6 0
3:5
3 G
MT /
htt
p:/
/hd
l.hand
le.n
et/
20
27
/mdp.3
90
15
02
10
72
56
9Public
Dom
ain
, G
oog
le-d
igit
ized
/
htt
p:/
/ww
w.h
ath
itru
st.o
rg/a
ccess
_use
#pd-g
oogle

OZ
R- :01 vsnncm. I
szooo AMPLIFIER 6"03
vastness swnrcn .l
G ~O \|
Input - - - - - - - - - - - - - - --
l C-IOI I’- Zk “.s_|03 25 I
I L: s
/ - ::‘ R-IO4
- e
aulcoez ‘ 1 _ -_ - s * 90V 2.2 use
' VERTICAL 7 I c-noa
GAIN 7 .0l
m0 comaon. 'Y Y 8
V- l01 I i vsnncm. sew V404
R-IO3 __ TC? ___ csmssmc comaom. 3AP|
020 fmcqoz R-IOS g f <
0.004 ,
a- l28 3 use. 4 .2 ._ 6
H166. -|oovO———0 0-—0+ 90v 5;: ¢-|o7
—: R—IOG 2 '25
HORIZONTAL seam :
CENTERING comaoz. sues I 1
C-IOS
+300 v __l: l -°' X X
R-IO7
R-IM 2.2 are
02000 C-IOG
HORIZONTAL .|
| P 1'
Nu C’L ----.. _ _ _ _ _ _ __: \| Focus
s-104 ll comao
HORIZONTAL
==
Homzomst -_ 3 AMPLIFIER swncn
GAIN comaou. - 5 0+9°V
\‘ ’ I
s :
sun 0— Y Yv-|()2 +sv +90 +3oov
7C7 .____‘_,
R-ll3
6409 INTENSITYI 35°00
\ 0004 y Y CONTROL L
+ t '7 v~ W W _ ~
,. , |
l
l
c-nz I
__ -l
lommf . T s 05
cossse 6 ||05- IZSV
use H FREQUENCY
FREQUENCY CONTROL 7Y4 so 6 m
. s-|02 I
i c—m 2 ' F-IQI
, INT R- '2' R-IZS _1_——. “_ R-lgs .39 use. ,0 :: V-l06 " IA
\ SYNC ‘ 2-2 NEG. 390 T . ' E 4 NEG. |QQQ v 4
_ ‘orr-ou
'5 ° : 8 4 35 L 8 x T '0' 5mm"
IF ' °. go A: g3 -700v0 6 (oulmeusm
g a 0 . 96 __ x LIDNTROL)
a ‘ ' T 0.
0% T t 00 1 J0 + 5 v
AMPLITUDE
CONTROL
NOTEI —ALL cspscnoas m mf. 400 VOLT sums mo
ALL RESISTORS m onusJ/z w UNLESS OTHERWISE NOTED
F/GURE 3-2 SCHEMAT/C C/RCU/T-SYLVA/V/A OSCILLOSCOPE TYPE /3/
Genera
ted o
n 2
01
4-0
2-1
6 0
3:5
3 G
MT /
htt
p:/
/hd
l.hand
le.n
et/
20
27
/mdp.3
90
15
02
10
72
56
9Public
Dom
ain
, G
oog
le-d
igit
ized
/
htt
p:/
/ww
w.h
ath
itru
st.o
rg/a
ccess
_use
#pd-g
oogle

SYLVANIA
SYMBOL DESCRIPTION RATING TOL % PART NO.
C-101 Condenser, Tubular Paper 0.25 uf., 400V +30 Pc. 13103
-20
C-102 Condenser, Thbular Paper 0.004 uf., 400 V. +20 P0. 13740
-10
C-103 Condenser, Tubular Paper 0.1 uf., 400 V. +30 Pc. 12796
~20
C-104 Condenser, Tubular Paper 0.01 uf., 400 V. +30 Pc. 13098
~20
C-105 Same as C-104
C-106 Same as C-103
C-107 Same as C-101
C-108 Same as C-101
C-109 Same as C-102 '
C-110 Condenser, Can Type Electrolytic 10-10-10/20 uf. Pc. 12784
450/25 V. ~
C-lll Condenser, Can Type Paper 1.0 uf., 1000 V. Pc. 12785
C-112 Condenser, Mica 10 uuf., 500 V. 110 Pc. 13095
C-ll3 Same as C-101
C-114 Same as C-103
C-116 Condenser, Tubular Paper 0.25 uf., 400 V. i20 Pc. 13100
C-117 Condenser, Tubular Paper 0.04 uf., 400 V. $20 Pc. 13099
C-118 Condenser, Tubular Paper 0.008 uf., 400 V. i20 Pc. 13101
C-119 Condenser, Mica 1000 uuf., 500 V. ilO Pc. 13097
C-l20 Condenser, Ceramic 200 uuf., 500 V. 110 Pc. 13315
F-101 Fuse, Type 3AG 1 Ampere Pc. 2422
I-101 Lamp-Incandescent Bayonet S-47 6-8 V., 0.15 A. Pc. 2828
R-101 Resistor-Composition 82,000 ohms, % W. i10 Pc. 1020
R-102 Resistor-Variable, linear taper 1 meg., 1/3 W. i20 Pc. 12791
R-103 Resistor-Composition 820 ohms, X W. iIO Pc. 936
R-104 Resistor-Composition 2.2 meg., X W. i10 Pc. 1080
R-105 Resistor-Variable, linear taper 3 meg., 1/3 W £20 Pc. 12792
R-106 Same as R-IOS
R-107 Same as R-104
R-108 Resistor-Composition 0.15 meg., K W. i10 Pc. 1031
R-109 Resistor-Composition 0.1 meg., X W. i10 Pc. 1024
R-110 Same as R-108
R-lll Resistor-Variable, linear taper 0.15 meg., 1/3 W. i20 Pc. 12790
R-112 Resistor-Composition 68,000 ohms, K W. i10 Pc. 1017
R-ll3 Resistor-Variable, linear taper 35,000 ohms, 1/3W i20 Pc. 12788
R-114 Same as R-101
R-115 Same as R-102
R-116 Same as R-103
R-117 Resistor-Composition 750 ohms, X W. i 5 Pc. 935
R-118 Resistor-Composition 15,000 ohms, 1 W. i10 Pc. 1244
R-119 Resistor-Composition 33,000 ohms. 2 W. 110 Pc. 1513
'R-120 Resistor-Wire Wound 3000 ohms, 10 W. i 5 Pc. 12787
R-121 Same as R-104
R-122 Resistor-Composition 27,000 ohms, K W. i10 Pc. 999
R-l23 Resistor-Variable, Audio taper 50,000 ohms, X W. i20 Pc. 12789
R-124 Resistor-Composition 33 ohms, X W. $10 Pc. 877
R-125 Resistor-Composition 390 ohms, K W. $10 Pc. 922
R-I26 Resistor-Variable, linear taper 4 meg., 1/3 W. i20 Pc. 12941
R-127 Resistor-Composition 0.39 meg., K W. i10 Pc. 1048
R-128 Resistor-Composition 1.0 meg., K W. $10 Pc. 1066
R-129 Resistor-Adjustable wire wound 400 ohms i 5 Pc. 11925
S—101 Switch-Rotary, S.P., 3T Non-shorting Pc. 12650
S-102 Switch-Rotary, D.P., 6T Non-shorting Pc. 12515
S-103 Switch-Variable Resistor Mounting S.P. 2T
S-104 Switch-Variable Resistor Mounting S.P. 2T
S—105 Switch-Variable Resistor Mounting 2P S.T.
V-101 Tube, Sylvania Type 7C7
V-102 Same as V—101
V-103 Tube, Sylvania Type 884
V-104 Tube, Sylvania Type 3AP1
V-105 Tube, Sylvania Type 7Y4
V-106 Tube, Sylvania Type 5Y3GT/G
FIGURE 3—3-
FMRTS LIST - SYLVANIA 3-inch OSCILLOSCOPE TYPE 131
21
Genera
ted o
n 2
01
4-0
2-1
6 0
3:5
3 G
MT /
htt
p:/
/hd
l.hand
le.n
et/
20
27
/mdp.3
90
15
02
10
72
56
9Public
Dom
ain
, G
oog
le-d
igit
ized
/
htt
p:/
/ww
w.h
ath
itru
st.o
rg/a
ccess
_use
#pd-g
oogle

A 6.3 volt ac output terminal is provided for test
purposes. This is very useful. A lead may be run
directly from this terminal to the vertical input
terminal to check operation of the oscilloscope at the
power line frequency. This 6.3 volt source may also
be used in place of an oscillator to supply a signal
for any tests in which a 60-cycle (or other line fre-
quency) signal will be satisfactory. The 6.3 volt
source will deliver 0.3 amperes and therefore may be
used to power the filament or heater in other instru-
ments, such as a simple test oscillator or clipper-type
square wave generator.
Location of Controls. The following controls and
terminals are located on the front panel of the Syl-
vania Oscilloscope Type 131: vertical beam centering,
horizontal beam centering, focus control, intensity
control, vertical gain, horizontal gain, sync amplitude,
coarse frequency, fine frequency, sync selector, ex-
ternal sync terminal, vertical input terminal, horizon-
tal input terminal, 6.3 volt ac terminal, two ground
terminals, and pilot light. There are no controls or
terminals in the rear of this instrument.
Viewing Screen. For purpose of accurate measure-
ments of the pattern along both horizontal and verti-
cal axes, Sylvania Oscilloscope Type 131 is provided
with a transparent overlay disc ruled-off in vertical
and horizontal coordinate lines. The Type 131 screen
has 30 vertical and 30 horizontal lines, with each fifth
line heavier than the others. The scope is also pro-
vided with a light hood which reduces the glare on
the screen due to room lighting.
Characteristics. Input impedance of the vertical
amplifier is 1 megohm and 30 upf when gain control
R-102 is advanced to maximum. Input impedance
when switch S-103 is thrown for direct connection
to the vertical deflecting plates is 680,000 ohms and
45 upf.
Input impedance of the horizontal amplifier is 1
megohm and 50 uuf when gain control R-llS is ad-
vanced to maximum. Input impedance when switch
S-104 is thrown for direct connection to the horizontal
deflecting plates is 680,000 ohms and 60 ppf.
Sine-wave frequency response of the vertical and
horizontal amplifiers is uniform within 3 db from 10
cycles to 100 kilocycles. This range is sufficiently wide
for all radio and PA amplifier servicing applications.
The sensitivity of the Type 131 Oscilloscope is
such that using the amplifiers, 0.5 volt rms will give a
1-inch peak-to-peak deflection on the screen: and
without the amplifiers (direct signal input to the de-
flecting plates), 17 volts rrns will give a l-inch peak-
to-peak deflection. (See Figure 1-8.)
The linear sweep frequency is continuously varia-
ble in 5 ranges between 15 and 40,000 cycles. The
sweep direction is from left to right.
3.3 SYLVANIA OSCILLOSCOPE TYPE 132
The schematic circuit of a larger, complete oscillo-
scope is given in Figure 34. This is the wiring dia-
gram of the Sylvania Type 132 seven-inch instru-
ment. This circuit will be seen to be more complicated
than that of the three-inch oscilloscope described in
Section 3.2. An interior photograph of this oscillo-
scope appears in Figure 3-7; an external view may be
seen in the frontispiece of this book. The sections of
the Type 132 instrument will be described in the
following paragraphs.
Vertical and Horizontal Amplifiers. In the Type
132 Oscilloscope, both vertical and horizontal ampli-
fiers are phase-inverter type push-pull amplifiers. The
vertical amplifier employs two Type 7C7 tubes (V-lOl
and V-102); the horizontal amplifier also employs
two Type 7C7 tubes (V-103 and V-104). R-101 and
R-ll4 are the corresponding gain control poten-
tiometers.
The amplifiers are coupled to the VERTICAL and
HORIZONTAL INPUT terminals by means of 1000-
volt capacitors (C-101 and G109).
Vertical Amplifier Switch. This is the double-pole,
double-throw switch, S-lOl, located at the back of the
scope. Its two poaitions are marked plainly DIRECT
and AMP. See Figures 3-8 and 3-9. When the poles of
this switch are thrown to their upper position, the
signal is applied directly to the vertical deflecting
plates through input terminals provided at the back.
A high amplitude signal, or one which is outside of
the frequency range of the vertical amplifier, may be
handled with the switch in this position. When the
poles of S-101 are thrown to their lower position, the
signal is passed through the push-pull vertical ampli-
fier before being presented to the vertical plates.
Horizontal Amplifier Switch. This is the double-
pole, double-throw switch, S-102. This switch likewise
is located on the rear of the Sylvania Seven-Inch
Oscilloscope. Its positions are marked plainly,
DIRECT and AMP. When the poles of this switch are
thrown to their upper position, the signal is applied
directly to the horizontal deflecting plates through
input terminals on the back of the instrument. A high
amplitude signal, or one which is outside of the fre-
quency range of the horizontal amplifier, may be
handled with the switch in this position. When the
poles of S-102 are thrown to their lower position, the
signal is passed through the push-pull horizontal
amplifier before being presented to the horizontal
deflecting plates.
Sweep Oscillator. The sweep oscillator is a relaxa-
tion-type sawtooth wave generator similar to the one
described previously in Section 2.2. This unit is pro-
vided with controls for SYNC AMPLITUDE,
COARSE FREQUENCY adjustment, and FINE FRE-
QUENCY adjustment. The sweep oscillator tube is
V-105 (Type 884).
Sweep Switch. The sweep switch is incorporated in
the COARSE FREQUENCY control, S-104. When this
switch is in “off” position, the sweep oscillator is
switched off. In other positions. the coarse frequency
control couples the sweep oscillator output to the
cathode ray circuit.
Svnc Selector Switch. By means of the sync switch.
S-103, the proper synchronizing voltage may be se-
lected and applied to the sweep oscillator grid. When
l0
[0
Genera
ted o
n 2
01
4-0
2-1
6 0
3:5
3 G
MT /
htt
p:/
/hd
l.hand
le.n
et/
20
27
/mdp.3
90
15
02
10
72
56
9Public
Dom
ain
, G
oog
le-d
igit
ized
/
htt
p:/
/ww
w.h
ath
itru
st.o
rg/a
ccess
_use
#pd-g
oogle

+320 v. C-l29 VERTICAL memes swncu S-tOl
\ 9’,
c l ‘ '
0| 1'
O
n I
9:8 ‘3 .525 3C a m '
'0' c3 0 03 0“ -' " : Teams
6- -l m» VERTICAL seam can
- 0.|
o—olzs g 0.5 02 a” I Hoov / CONTROL
_ - l is V“ as .
|000v V7'8'7 ° 2 707 0406 I 4/.__,
' / \ 4 ' ' / 4
_- c 3 -_" D4 —_
VERTICAL g 6 2:: 3 , i < -—- -|20v :-
INPUT ~ .6 °v_ > Q * 0V. 6 5
._ n -: n
I N
g 7 _ 9 an 7 |
2v. x' ' {10 i 2 ‘-? '5 2" : V406
c | | a T | IO
VERT. cam woe N 5° ,9; "Io-:05 Q
cosmos ;: 3 9 v, :2 9
.00s 0 a': ~°°5 d: I
‘ 0 T
2.‘
-: 5‘
-|20v.
>' g 3' 3
0 ,, ‘7
HORIZONTAL scan 3 g .i a:
“Em” COMROL mressnv To-ue'
uooucsnou °-°5
+320v. 0' 3
H cow-0 —— ii
\ I —
c c c-eo / 00|
02 '
28 3 ~ '7 9.9% f Inomzounu. supunss swnca 5-102 R426 _ 2,5
0'09 ég -0 so u '3 0| l/ a:
0215 w e - ' 39
o ) '9’) V ‘04 a? 2 l—OQ—LF g "o
_ ‘ s N
nooov 6‘ q 2 7:637 2' ml ' 0.4
HORIZONTAL 3 '1':-
INPUT >. a 0“ 6 s
' '3 3 | 7 s I
074 g l < 0301“.
HQR GAIN l°__ I i x
CONTROL 750: 73 1:. 2v
I
V. n
u__.J _ can t
c "2;: N 5 .0 nmsnsmr cosmos
00s 2 IGOOV- _ 005
#4 j P
- rm rs u n Y CONTROL
s £0 E c -|500v.
cosass resousncv +520v. +IOO v. Q-SV.
025 'B!5% comaot —-—§ s-m saaz a-ms a-mk
pfl-lifq __, m,
8.522%... ~l . <.
smrcu A “2° 5”“ '1.’ O —'
'I 0' a m r“ —__— __lI.-____I.__
use ' 5403 04:9 SYNC AMPLITUDE "’ __ exl c428“ ‘cqzag ,\ Ic'll‘o 0°“
rs: cosmos 33v? fags ________ __c-_|2_sg____, I
600V- ,1» L
E“ 5 M36 —L-\ 334 '0“ -°°° ’"Ezmmrisss
EXTERNAL o 5 ___ .
$040. 0— o n w k A o+sv.
8 QZTOOOn. ' 9 T
a; l sv.
1-10: 2 7
x
53V" x NOTEI su. RESISTOR VALUES m usoouns -ALI..
__ F"°' \S-l05 FIXED RESISTOR TOLERENCE81IO%-ALL
— '06 '2" F W %; cseacn'oa VALUES m ur‘s.s400v.ssrms
56-60;" ‘A "H," “"5 8mm" UNLESS omsawuse sescmsa
4*0
F /G‘UR£' 3-4 SCHEMAT/O C/RCU/T— SYL IAN/A OSC/L L OSCOPE TYPE /32
£3
Genera
ted o
n 2
01
4-0
2-1
6 0
3:5
3 G
MT /
htt
p:/
/hd
l.hand
le.n
et/
20
27
/mdp.3
90
15
02
10
72
56
9Public
Dom
ain
, G
oog
le-d
igit
ized
/
htt
p:/
/ww
w.h
ath
itru
st.o
rg/a
ccess
_use
#pd-g
oogle

SYLVANIA
BYIBOL DESCRIPTION RATING TOL % PART NO.
C-101 Condenser, Thbular Paper 0.25 mf., 1000V. +28 Pc._14987
-1
C-102 Condenser, Tubular Paper 0.005 mf., 400V. +23 Pc. 16163
C-103 Condenser, Ihbular Paper 0.5 mf., 400V. +30 Pc. 12800
-10
C-104 Condenser, Tubular Electrolytic 10-10/20 mfn450/25V. Pc. 16378
C-105 Same as C-102
C-106 Condenser, Thbular Paper 0.1 mf., 400V. +30 Pc. 12796
-10
C-107 Condenser. Tubular Paper 0.01 mf., 400v. +30 Pc. 12794
C-108 Same as C-107 -10
C-109 Same as C-101
C-110 Same as C-102
C-111 Same as C-103
C-112 Same as C-102
C-113 Same as C-106
C-114 Same as C-107
C-115 Same as C-107
C-116 Condenser, Tubular Paper 0.05 mf., 2000V. +30 Pc. 16424
-10
C-117 Condenser, Tubular Paper 1.0 mf., 200V. +38 Pc. 16377
C-118 Condenser, Can Type Paper 1.0 mf., 1500V. +20 Pc. 16172
-10
C-119 Condenser, Tubular Paper 0.1 mf., 600V. +20 Pc. 16168
-10
C-120 Condenser, Tabular Paper 0.25 mf., 400V. +30 Pc. 12798
-10
C-121 Condenser, Tubular Ceramic 5 mmf., 500V. i10 Pc. 16161
C-122 Condenser, Tubular Paper 0.25 mf., 400V. $10 Pc. 16169
C-123 Condenser, Tubular Paper 0.045 mf., 400V. $10 Pc. 16982
C-124 Condenser, Tubular Paper 0.008 mf., 400V. $10 Pc. 16164
C-125 Condenser, Mica 0.001 mf., 500V. :10 Pc. 15401
C-l26 Condenser, Mica 220 mmf., 500V. 110 Pc. 16162
C-127 Condenser, Can Type Paper 0.5 mf., 2000V. +20 Pc. 16873
-10
C-128 Condenser, Can Type Electrolytic 10-10-10 mf., 450“ Pc. 16173
C-129 Same as C-106
C-130 Same as C-106
F-101 Fuse, Type 3AG 1 Ampere Pc. 2422
I-101 Lamp-Incandescent Bayonet 5-47 6-8V., 0.15 A. Pc. 2828
R-101 Resistor-Variable, linear taper 0.5 meg., % W. 120 Pc. 16391
R-102 Resistor-Composition 820 ohms, % W. $10 Pc. 936
H-103 Resistor-Composition 68,000 ohms, 1 W. :10 Pc. 1272
R-104 Resistor-Composition 0.27 meg., % W. $10 P6. 1041
R-105 Resistor-Composition 1.0 meg., % W. $10 Pc. 1066
H-106 Same as R-105
R-107 Resistor-Composition 36,000 ohms, % W. i 5 Pc. 1005
R-108 Same as R-102
R-109 Same as B-103
R—110 Resistor~Composition 3.9 meg., % W. $10 Pc. 1090
R-111 Resistor-Variable, linear taper Dual 4 meg., % W. $20 Pc. 16393
R-112 Resistor-Composition 1.0 meg., 1 W. 110 Pc. 1321
R-113 Same as R-110
3-114 Same as R-lOl
R-llS Same as 3-102
R-116 Same as R-103
3-117 Same as R-104
R-118 Same as R-105
H-119 Same as R-107
R-120 Same as 3-102
R-121 Same as R-103
3-122 Same as R-110
R-l23 Same as R-111
R-125 Same as 3-110
R-126 Same as R-105
FIGURE 3~5 PARTS LIST - SYLVANIA 7-inch OSCILLOSCOPE TYPE 132
24' Genera
ted o
n 2
01
4-0
2-1
6 0
3:5
3 G
MT /
htt
p:/
/hd
l.hand
le.n
et/
20
27
/mdp.3
90
15
02
10
72
56
9Public
Dom
ain
, G
oog
le-d
igit
ized
/
htt
p:/
/ww
w.h
ath
itru
st.o
rg/a
ccess
_use
#pd-g
oogle

SYLVANIA
SYMBOL DESCRIPTION RATING TOL % PART NO.
R-127 Resistor-Composition 47,000 ohms, % W. i10 Pc. 1010
R-128 Resistor-Composition 0.22 meg., % W. 110 Pc. 1038
R-l29 Resistor-Composition 0.18 meg., % W. $10 Pc- 1034
R-l30 Same as R-128
R-131 Same as 3-128
R-132 Resistor-Variable, linear taper 0.4 meg., 2 W. i10 Pc. 16157
H-133 Resistor-Composition 0.3 meg., % W. i 5 Pc. 1043
R-134 Resistor-Variable, linear taper 50,000 ohms, 1/3 W. i20 PC- 16155
R-135 Resistor-Variable, linear taper 50,000 ohms, % W. i20 PC- 16390
R-136 Resistor-Composition 27,000 ohms, % W. $10 Pc. 999
H-137 Resistor-Composition 1.8 meg., K W. i 5 Pc. 1076
R-138 Resistor-Composition 390 ohms, % W. i10 Pc. 922
R-139 Resistor—Variable, linear taper 4 meg., % W. 120 PC- 16392
B-140 Resistor-Composition 0.51 meg., % W. i 5 PC. 1054
R-141 Resistor-Wire Wound 3000 ohms, 10 W. i 5 Pc. 12787
R-l42 Resistor-Composition 33,000 ohms, 2 W. 110 PC- 1513
R-143 Resistor-Composition 15,000 ohms, l W. iIO Pc. 1244
H-144 Resistor-Composition 750 ohms, % W. i 5 Pc. 935
R-145 Resistor-Variable, linear taper 400 ohms, l W. ilo Pc. 16154
S-101 Switch-Slide, DPDT PC. 16429
S-102 Same as S-101
S-103 Switch-Rotary, S.P. 3T Non-shorting Pc. 16810
S-104 Switch-Rotary, D.P. 6T Non-shorting Pc. 12515
s-1os Switch-Toggle, D.P.S.T. Pc. 15011
V-lOl Tube, Sylvania Type 7C7
V-lO2 Same as V-101
V-103 Same as V-101
V-104 Same as V-101
V-lOS Thbe, Sylvania Type 884
V-106 Thbe, Sylvania Type 7GP1
V-107 Thbe, Sylvania Type 2X2A
V-100 Tube, Sylvania Type 7Y4
FIGURE 3-5 PARTS LIST - SYLVANIA 7-1'nch OSCILLOSCOPE TYPE 132
S-103 is thrown to its upper (INTERNAL) position,
the synchronizing voltage, obtained through series
resistor 11-105, is the same signal voltage which is ap-
plied to the vertical deflecting plates. Applying the
signal simultaneously to the vertical plates and sync
input results in self-synchronization. When S-103 is
thrown to its center (LINE FREQ) position, synchro-
nizing voltage is obtained from one leg of the sweep
tube heater, and accordingly has the same frequency
as the power-line voltage. When S-103 is thrown to
its lower (EXTERNAL) position, a synchronizing
voltage may be obtained, through coupling capacitor
C-llO, from an external oscillator (or other suitable
signal source) connected to the SYNC INPUT ter-
minal.
Coarse Frequency Control. As has been mentioned
in Section 2.2, the coarse frequency control is the
six-position switch 5-104. In its five “on” positions it
selects from five separate values of capacitance (C-122
to C-126), which govern the frequency range of the
sweep oscillator. These five ranges are 15-90 cycles,
90-500 cycles, SOD-2,500 cycles, 2.5-10 kilocycles, and
10-30 kilocycles, and are so labeled on the front panel.
Fine Frequency Control. The potentiometer R-139
is the fine frequency control. It regulates the fre-
quency of the sweep oscillator within each of the five
ranges selected by the coarse frequency control. For
example, if the coarse frequency switch is set to 15-90,
the fine frequency control will then permit selection
of any frequency between 15 cycles and 90 cycles.
Sync Amplitude Control. The potentiometer R-135
is the sync amplitude control. Rotating this control
clockwise increases the amplitude of the synchroniz-
ing signal applied to the grid of the 884 sweep oscilla-
tor tube (V-103) and holds a pattern stationary on
the screen. Advancing the control beyond the setting
where the pattern stops, distorts the waveforms.
Beam Centering Controls. As in the Type 131 three-
inch oscilloscope, the beam centering controls in the
Type 132 instrument enable the operator to position
the spot on any part of the viewing screen. Thus, by
means of these two controls (R-lllA and R-lllB for
vertical centering, and R-123A and R-123B for hori-
zontal centering), a normally off-center spot, pe-
culiar to a particular oscilloscope tube, may be
brought to the exact center of the screen. In the Type
132 instrument, each beam centering control consists
of two “gang-tuned” potentiometers, as may be seen in
Figure 3-4.
Focus Control. Potentiometer 11-132 is the focus
25
Genera
ted o
n 2
01
4-0
2-1
6 0
4:2
7 G
MT /
htt
p:/
/hd
l.hand
le.n
et/
20
27
/mdp.3
90
15
02
10
72
56
9Public
Dom
ain
, G
oog
le-d
igit
ized
/
htt
p:/
/ww
w.h
ath
itru
st.o
rg/a
ccess
_use
#pd-g
oogle

FIGURE 3-6 Inside view ot Sylvania Three-Inch Oscilloscope Type 131. Note large metal shield around neck of tube.
Tubes and other circuit components are mounted below 3AP1 tube. Power transformer (lower left) is mounted as far as
possible from tube to prevent hum modulation of electron beam.
. s ‘ 7‘
I . ,l"
:. ../
a
II ‘H'I/
ID/
:- 4
FIGURE 3-7 Inside view of Sylvania Seven-Inch Oscilloscope Type 132. Construction is similar to that at Type 131 three-
inch instrument except that higher voltage components and larger tubes are necessary. Circuit is also more complicated.
(See Figure 3-4).
26
Genera
ted o
n 2
01
4-0
2-1
6 0
4:2
7 G
MT /
htt
p:/
/hd
l.hand
le.n
et/
20
27
/mdp.3
90
15
02
10
72
56
9Public
Dom
ain
, G
oog
le-d
igit
ized
/
htt
p:/
/ww
w.h
ath
itru
st.o
rg/a
ccess
_use
#pd-g
oogle

INTENSITY
MOD
Q Q
s. ,I‘ ’-
'-,._ a‘ .4} q a
I onufpgg PLATES DEFLECTION PLATES _
o q o ' a
._ AMP L- DIRECT Q omtcr MAP 3‘
l;¢".'r'.fi-’.'£i¢‘.;2 .4. Fit“; wt-TR'TA; 'i-
{33' f5 :1- "
FIGURE 3-8 Rear panel at Sylvania Seven-Inch Oscilloscope Type 132. This panel contains the horizontal and vertical
amplifier switches and input jacks tor the detlecting plates and intensity modulations. (See Figure 3-9 tor a graphic
explanation of panel jacks and switches.)
control which varies the high positive voltage on the
first anode of the cathode ray tube.
Intensity Control. The potentiometer R-l3-l (see
Figure 3-4) is the intensity control. It varies the nega-
tive bias on the control grid of the cathode ray tube.
Line Switch. The “on-ofl'” power line switch is the
front panel toggle switch, labeled 3-105 on the circuit
diagram.
Intensity Modulation Input. A tip jack is available
on the rear terminal panel of the instrument (see
Figures 3-8 and 3-9) for introducing an externally-
generated signal voltage to modulate the control grid
of the Type 7GP1 cathode ray tube. This type of
modulation varies the brightness of the spot on the
viewing screen in accordance with the modulation,
and thus may be utilized to blank out undesired por-
tions of the trace. It may be employed also to provide
“timing dots” to time the length of a wave under
observation on the screen. Methods of using intensity
modulation will be described in a later chapter.
Power Supply. The dual high-voltage power supply
of the Type 132 oscilloscope is composed of rectifier
tubes V-107 (Type 2X2A) and V-108 (Type 7Y4)
and a multisection resistance-capacitance ripple filter.
Location of Controls. The seven-inch oscilloscope
has the following controls and terminals on its front
panel: vertical beam centering, horizontal beam cen-
tering, focus control, intensity control, vertical gain,
horizontal gain, sync amplitude, coarse frequency,
fine frequency, sync selector, external sync terminal,
6.3 volt ac terminal, two ground terminals, pilot light
and ON-OFF toggle switch for the power line. The rear
JACKS FOR DIRECT\,_
CONNECTION TO
HORIZONTAL PLATES\ DI
\ 02
HOR.
DEFLECTION
PLATES
7
HORIZONTAL SIGNAL”/'
swncu (S-l02) AMP. DIRECT
INTENSITY MOD.
JACKS FOR DIRECT
CONNECTION TO
,VERTICAL PLATES
D3 D4 //
VERT.
osruzcnou
PLATES
I%
\r vssncm. SIGNAL
DIRECT AMP SWITCH (S-IOll
F/GURE 3-9 REAR PANEL OF TYPE /32 SHOW/1V6 P/M/AOKS AND SWITCHES
($55 ALéo FIGURE 3-8)
Genera
ted o
n 2
01
4-0
2-1
6 0
4:2
7 G
MT /
htt
p:/
/hd
l.hand
le.n
et/
20
27
/mdp.3
90
15
02
10
72
56
9Public
Dom
ain
, G
oog
le-d
igit
ized
/
htt
p:/
/ww
w.h
ath
itru
st.o
rg/a
ccess
_use
#pd-g
oogle

T
2I2PEAK
I5V-RMS iVOLTS
__t __ _
uucn ON 7651 _"
SGREEN=I5V-RMS
(A) VERTICAL SENSITIVITY
4 PEAK
l VOLTS
Is—sr- 25.
l
I
i
F+IBV'R MS
s—l mcH—d
ON 7GPI SCREEN=I8 V-RMS
(Bl HORIZONTAL SENSITIVITY
FIGURE 3-I0 SCREEN SENSITIVITY 0F SYLVANIA TYPE 7GP! OSCILLOSCOPE TUBE
panel has four tip-type jacks for direct input to the
deflecting plates, one tip-jack for intensity modula-
tion input and the vertical and horizontal amplifier
switches.
Viewing Screen. To make accurate measurements
of waveforms easier, the Sylvania Oscilloscope Type
132 is provided with a transparent overlay disc ruled
off in vertical and horizontal coordinate lines. There
are 60 horizontal and 60 vertical lines with each tenth
line accentuated. It is made of 1A," safety glass.
Characteristics. Input impedance of the vertical
amplifier corresponds to 0.5 megohm and 26 ppf. In-
put impedance, when the vertical signal switch, S-101,
is thrown for direct connection to the vertical deflect-
ing plates, corresponds to 3.9 megohms and 20 uuf
between each deflecting plate terminal and chassis
ground.
Input impedance of the horizontal amplifier
corresponds to 0.5 megohm and 33 uuf. Input im-
pedance, when the horizontal signal switch, S-102,
is thrown for direct connection to the horizontal de-
flecting plates, corresponds to 3.9 megohms and 20
uuf between each deflecting plate terminal and chassis
ground.
Sine-wave frequency response of the vertical ampli-
fier is within i20% (1000-cycle reference) from 10
cycles to 70 kilocycles. Response is down not more
than 30% at 7 cycles and at 90 kc, and is down not
more than 50% at 145 kc.
Sine wave frequency response of the horizontal
amplifier is within 220% (1000-cycle reference) from
10 cycles to 55 kc. Response is down not more than
30% at 7 cycles and at 75 kc, and is down not more
than 50% at 135 kc.
The sensitivity of the Type 132 oscilloscope is such
that with the vertical amplifier, 0.21 volts rms sine
wave will give a 1-inch peak-to-peak deflection on
the viewing screen; and without the vertical ampli-
fier, a 15 volt rms sine-wave signal will be required
for a 1-inch peak-to-peak deflection on the screen.
With the horizontal amplifier, a 0.25 volt rms sine-
wave signal will give a 1-inch peak-to-peak deflection;
and without the horizontal amplifier, 18 volts rms
sine wave will be required to give a 1-inch peak-to-
peak deflection. (See Figure 3-10.)
The linear sweep frequency is continuously varia-
ble in 5 ranges, from 15 to 30,000 cycles. The sweep
direction is from left to right.
28
Genera
ted o
n 2
01
4-0
2-1
6 0
4:2
8 G
MT /
htt
p:/
/hd
l.hand
le.n
et/
20
27
/mdp.3
90
15
02
10
72
56
9Public
Dom
ain
, G
oog
le-d
igit
ized
/
htt
p:/
/ww
w.h
ath
itru
st.o
rg/a
ccess
_use
#pd-g
oogle

CHAPTER IV
VOLTAGE MEASUREMENT WITH
THE OSCILLOSCOPE
4.1 CATHODE RAY TUBE AS
V.T. VOLTMETER
The cathode ray tube is a voltage-operated device,
since deflection of its electron beam is accomplished
by means of applied voltages. In many of its applica-
tions, the oscilloscope actually functions as a highly
specialized electronic ac voltmeter, although we may
interpret its indications in other terms. Both horizon-
tal and vertical deflection are proportional to the
instantaneous applied horizontal and vertical signal
voltage amplitudes. These voltage values may be de-
termined by measuring the length of the traces they
produce, provided the viewing screen is calibrated.
The length of the trace on the viewing screen (or
movement of the spot over a screen distance) in-
creases linearly with applied voltagcha distinct ad-
vantage in any voltmeter. The oscilloscope also has
a high impedance input circuit which keeps at a
minimum any loading of a circuit under test. Unlike
the nearest comparable voltmeter, which can indicate
only voltage amplitude under a recommended set of
operating conditions, the oscilloscope can show wave-
form and phase relations, positive and negative ampli-
tudes without limitations as to waveform or distor-
tion, and with fewer limitations as to frequency.
Because it is so useful. modern laboratories strongly
encourage the use of the oscilloscope in ac voltage
measurements and in tests of various sorts in which
other changes can be translated into voltage varia-
tions. In some voltage measurements, the oscilloscope
is indispensable. In other such measurements, it is
better to employ a regular voltmeter. For example,
it is hardly possible that a radio repairman would
demand an oscilloscope for measuring the heater volt-
age unless no simpler ac voltmeter were available.
But he would prefer to use the oscilloscope if a test
required that the voltage measuring instrument have
higher input impedance, better sensitivity, and better
frequency response than his ac voltmeter of the am-
plifier type. The oscilloscope constitutes an excellent
substitute for a vacuum tube voltmeter in most in-
stances when one is not available.
In this chapter, we will describe various voltage
measurements which can be made with an oscillo-
scope. The advantages and disadvantages of using a
scope will be discussed for each case. The applica-
tions described will undoubtedly suggest many others
which may answer each serviceman’s own specific
problems of voltage measurement.
4.2 VOLTAGE MEASUREMENT
PRINCIPLE
In Figure 1-7, the various viewing screen patterns
shown from A to F indicate how the spot is deflected
away from its at-rest center position to various loca-
tions on the screen by applying dc voltages to the de-
flecting plates. The patterns shown from G to J in
the same figure show the straight-line traces obtained
when the spot swings rapidly back and forth under
the influence of alternating voltages applied to the
deflecting plates.
These patterns are obtained with the linear sweep
oscillator switched 08', although the pattern shown
in Figure 1-7(H) might be that of the sweep voltage
alone when no signal voltage is present at the vertical
deflecting plates.
Since the distance through which the spot moves,
and the length of the trace both are proportional to
the peak applied voltage, and since this distance and
length can be measured easily on the viewing screen,
it is plain that the screen may be calibrated as a volt-
meter scale.
4.3 DC VOLTAGE MEASUREMENT
DC voltages can be measured with an oscilloscope
with complete success only when they are applied
directly to the deflecting plates and not through in-
tervening series or parallel connected circuit com-
ponents. Furthermore on both the Sylvania Oscillo-
scopes Types 131 and 132 do voltages may not be
measured through either the horizontal or vertical
amplifier. DC voltage leads can be connected directly
(not through amplifiers or capacitors) to the deflect-
ing plates of the Sylvania Seven-Inch Oscilloscope
Type 132 through the vertical deflection plate jacks
on the rear of the instrument. On the three-inch scope
Type 131, however, direct connection to deflecting
plates is not possible without alterations in the oscillo-
scope circuit, which are not advisable. Because of
their fluctuating nature, on the other hand, pulsating
dc voltages usually may be measured easily through
the vertical signal channel of either Sylvania Oscillo-
scope (with or without the amplifier, as the case may
require) without making any changes in the instru-
ment circuit.
This Section 4.3 dealing with oscilloscope measure-
ments of dc voltages, therefore, will be valuable to an
owner of the Sylvania Seven-Inch Oscilloscope Type
132. For others, although Section 4.3 will provide
29
Genera
ted o
n 2
01
4-0
2-1
6 0
4:2
8 G
MT /
htt
p:/
/hd
l.hand
le.n
et/
20
27
/mdp.3
90
15
02
10
72
56
9Public
Dom
ain
, G
oog
le-d
igit
ized
/
htt
p:/
/ww
w.h
ath
itru
st.o
rg/a
ccess
_use
#pd-g
oogle

NO VOLTAGE APPLIED
POSITIVE VOLTAGE
NEGATIVE VOLTAGE
TO VERTICAL PLATES APPLIED TO APPLIED TO
VERTICAL PLATES VERTICAL PLATES
(A) (B) (C)
FIGURE 4-/ EFFECT OF 00 VOLTAGE ON SPOT
interesting background for the discussion to follow on
alternating voltage measurements, it will generally be
advisable to employ a good voltmeter instead of an
oscilloscope for pure dc measurements—preferably
an electronic voltmeter with an extremely high input
resistance, such as the Sylvania Polymeter.
A voltage of unknown value may be supplied to
either the horizontal or vertical deflecting plates. But
since the horizontal plates usually will be reserved
for the time-base sweep voltage, most of our discus-
sion will be confined to voltage measurements by
means of the vertical plates.
When no voltage at all is applied to either set of
plates, the spot occupies the center of the viewing
screen, as shown in Figure 4-1 (A), or it may be placed
there by adjustment of the beam centering controls.
This central position therefore may be regarded as
the voltmeter zero. If the positive terminal of a dc
voltage source is connected to the upper vertical de-
g fleeting plate (directly, not through a coupling capaci-
tor), and the negative terminal of the common ter-
minal of the cathode ray tube (or to the other vertical
plate if a common terminal is not available), the spot
will be deflected upward, as shown in Figure 4-1(B).
The distance through which the spot moves away
from its at-rest central position is proportional to the
dc voltage. The linear sweep is not used here. A suffi-
ciently large dc voltage will move the spot off the
screen entirely, while a very small voltage will shift
the spot vertically only a fraction of an inch. If a
negative voltage is applied to the same vertical de-
flecting plate, the spot will be shifted downward, as
indicated in Figure 4-1(C) a distance from center
proportional to the applied negative voltage.
If a series of accurately-known positive and nega-
tive dc voltages are applied successively to the verti-
cal plates and the corresponding spot displacements
measured on the viewing screen and recorded, the
screen then will be calibrated for dc voltages. Since
response of the cathode ray tube is linear, however,
not more than one accurate voltage check point ordi-
narily need be established. All voltages up to this
point then may be identified as fractions of the
calibration voltage. For example: if we find that 15
volts positive will shift the spot upward exactly one
inch from the center of the screen, then a shift of
half-inch indicates 7.5 volts, 2/3 inch shows 10 volts,
etc., etc. Another way is to calibrate the graduated
overlay disc of the viewing screen in terms of disc
divisions. If we find, for example, that the spot moves
10 divisions upward from the center line of this disc
upon application of 15 volts to the vertical plates,
then our disc will indicate 1.5 volts per division. A
NO VOLTAGE APPLIED POSITIVE PULSATINI'G
TO VERTICAL PLATES DC APPLIED TO
VERTICAL PLATES
IA) (8)
“AXYYYYYA
ZERO
POSITIVE PULSATING
DC
NEGATIVE PULSATING ZERO W
DC APPLIED TO MAX, _
VERTICAL PLATES NEGATIVE PULSATING
0 c
(C) (D)
F/G‘URE4-2 EFFECT OF PULSAT/NG OO VOLTAGE ON SPOT
Genera
ted o
n 2
01
4-0
2-1
6 0
4:3
3 G
MT /
htt
p:/
/hd
l.hand
le.n
et/
20
27
/mdp.3
90
15
02
10
72
56
9Public
Dom
ain
, G
oog
le-d
igit
ized
/
htt
p:/
/ww
w.h
ath
itru
st.o
rg/a
ccess
_use
#pd-g
oogle
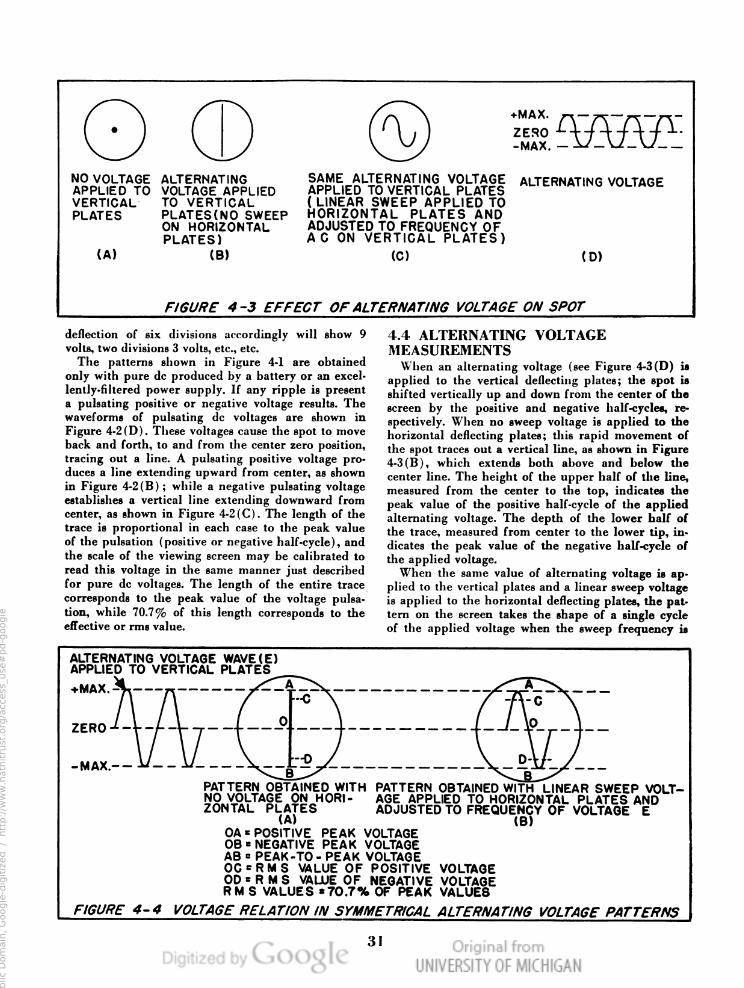
@G) @
SAME ALTERNATING VOLTAGE
APPLIED TO VERTICAL PLATES
(LINEAR SWEEP APPLIED TO
HORIZONTAL PLATES AND
ADJUSTED TO FREQUENCY OF
AC ON VERTICAL PLATES)
NO VOLTAGE ALTERNATING
APPLIED TO VOLTAGE APPLIED
VERTICAL TO VERTICAL
PLATES PLATES(NO SWEEP
ON HORIZONTAL
PLATES)
(A) (B)
+MAX- — _' _ _
-MAX. - - - -_
ALTERNATING VOLTAGE
(C) (D)
FIGURE 4-3 EFFECT OFALTERNATING VOLTAGE ON SPOT
deflection of six divisions accordingly will show 9
volts, two divisions 3 volts, etc., etc.
The patterns shown in Figure 4-1 are obtained
only with pure dc produced by a battery or an excel-
lently-filtered power supply. If any ripple is present
a pulsating positive or negative voltage results. The
waveforms of pulsating dc voltages are shown in
Figure 4-2(D). These voltages cause the spot to move
back and forth, to and from the center zero position,
tracing out a line. A pulsating positive voltage pro-
duces a line extending upward from center, as shown
in Figure 4-2(B); while a negative pulsating voltage
establishes a vertical line extending downward from
center, as shown in Figure 4-2(C). The length of the
trace is proportional in each case to the peak value
of the pulsation (positive or negative half-cycle), and
the scale of the viewing screen may be calibrated to
read this voltage in the same manner just described
for pure dc voltages. The length of the entire trace
corresponds to the peak value of the voltage pulsa-
tion, while 70.7% of this length corresponds to the
effective or rms value.
4.4 ALTERNATING VOLTAGE
MEASUREMENTS
When an alternating voltage (see Figure 4-3(D) is
applied to the vertical deflecting plates; the spot is
shifted vertically up and down from the center of the
screen by the positive and negative half-cycles, re-
spectively. When no sweep voltage is applied to the
horizontal deflecting plates; this rapid movement of
the spot traces out a vertical line, as shown in Figure
4-3(B), which extends both above and below the
center line. The height of the upper half of the line,
measured from the center to the top, indicates the
peak value of the positive half-cycle of the applied
alternating voltage. The depth of the lower half of
the trace, measured from center to the lower tip, in-
dicates the peak value of the negative half-cycle of
the applied voltage.
When the same value of alternating voltage is ap-
plied to the vertical plates and a linear sweep voltage
is applied to the horizontal deflecting plates, the pat-
tern on the screen takes the shape of a single cycle
of the applied voltage when the sweep frequency is
ALTERNATING VOLTAGE WAVE (E)
APPLIED TO VERTICAL PLATES
PATTERN OBTAINED WITH PATTERN OBTAINED WITH LINEAR SWEEP VOLT-
NO VOLTAGE ON HORI-
ZONTAL PlzgTES
AGE APPLIED TO HORIZONTAL PLATES AND
ADJUSTED TO FREQUE(NB(;Y OF VOLTAGE E
OA= POSITIVE PEAK VOLTAGE
08 = NEGATIVE PEAK VOLTAGE
AB = PEAK-TO - PEAK VOLTAGE
00 = RM S VALUE OF POSITIVE VOLTAGE
OD = R M S VALUE OF NEGATIVE VOLTAGE
R M S VALUES =70.7% OF PEAK VALUES
FIGURE 4-4 VOLTAGE RELATION IN SYMMETR/CAL ALTERNATING VOLTAGE PATTERNS
Genera
ted o
n 2
01
4-0
2-1
6 0
4:3
3 G
MT /
htt
p:/
/hd
l.hand
le.n
et/
20
27
/mdp.3
90
15
02
10
72
56
9Public
Dom
ain
, G
oog
le-d
igit
ized
/
htt
p:/
/ww
w.h
ath
itru
st.o
rg/a
ccess
_use
#pd-g
oogle

adjusted to that of the applied voltage. This pattern
is shown in Figure 4-3IC). Unlike the simple trace
shown in Figure 4-3(B), the waveform, shown in
Figure 4-3(C), shows not only positive and negative
peak voltage values, but the waveform as well. Addi-
tional information gained from a study of the latter
pattern includes, (1) whether the positive and nega-
tive peaks are of the same amplitude (that is, whether
the wave is symmetrical), (2) whether the voltage is
a true sine wave or is distorted, and (3) whether the
voltage under study has constant frequency.
Voltage relations in the straight-line and sine-wave
traces are illustrated by Figure 4-4. At (A) in this
Figure, we have the simple trace resulting when sine-
wave alternating voltage E is applied to the vertical
deflecting plates and no voltage is applied to the hori-
zontal plates. At (B) is shown the single sine-wave
cycle resulting when, in addition, a linear sweep volt-
age of the same frequency is applied to the horizontal
plates.
In each pattern the height measured center of
screen to the upper tip of the image indicates the
peak voltage of the positive half-cycle. This is the dis-
tance OA. Similarly, OB (the distance measured down
from center to the lower tip of the pattern) indicates
the peak voltage of the negative half-cycle. Distance
OC is 70.7% of the upper half and therefore indicates
the effective or rms voltage of the positive half-cycle,
while distance OD is 70.7% of the lower half and in-
dicates the rms voltage of the negative half-cycle.
Distance AB, measured from one tip of the pattern
to the other, indicates the peak-to-peak voltage. A
point 63.6% above or below center would indicate the
average value of a sine wave voltage half-cycle.
The oscilloscope patterns shown in Figure 4-4 assume
a symmetrical applied voltage; that is, one having
equal positive and negative half-cycles. Very often,
the voltages encountered in electronic testing are not
symmetrical. Figure 4-5 shows an example of this con-
dition. Here the positive half-cycles are noticeably
taller than the negative half-cycles. Although the
positive peak and ms values in Figure 4-5 and the
peak-to-peak values as well are the same as in Figure
44, the negative peak and negative rms values are less
than in Figure 4-4(A). One of the advantages of the
oscilloscope as an ac voltmeter is this ability to show
readily the waveform of the voltage under study.
In many electronic tests, it is important to have such
information.
4.5 SENSITIVITY OF OSCILLOSCOPE
VOLTMETER
Because the vertical amplifier serves to increase the
signal voltage before it is presented to the vertical
deflecting plates, good sensitivity is obtained with the
complete oscilloscope employed as an ac voltmeter.
In Section 3.2, we pointed out that 0.5 volt rms will
produce a 1-inch peak-to-peak deflection on the screen
of the Sylvania Three-Inch Oscilloscope Type 131
when the vertical amplifier is used. But when the am-
plifier is not used, 17 volts rms are required for the
same deflection. This means that the amplifier in-
creases the sensitivity of the 3AP1 cathode ray tube,
as an ac voltmeter, 34 times.
Similarly, 0.21 volt rms will produce a one-inch
peak-to-peak deflection on the screen of the Sylvania
Seven-Inch Oscilloscope Type 132 when the vertical
amplifier is used (see Section 3.3), but 15 volts rms
are required for the same deflection when the ampli-
fier is not used. This indicates that the sensitivity of
the 7CP1 cathode ray tube, as an ac voltmeter, is
increased 711/2 times by the vertical amplifier in this
instrument.
The vertical amplifier thus makes possible oscillo-
scope measurement of small voltages, within the fre-
quency range of the instrument, which might not be
detectable with an available ac voltmeter. For still
greater sensitivity, an external amplifier of known
gain may be used ahead of the vertical amplifier in
the oscilloscope.
It can be seen that it is important when warming
up the oscilloscope to center the dot which represents
the electron beam (while the sync selector switch is
turned to “external”) exactly in the center of the
viewing screen. If this is done, whether a voltage
waveform is symmetrical or not can be determined
easily by noticing whether the peak values of the
positive and negative half cycles lie an equal number
of screen divisions above and below the center line
of the screen.
DISTORTED(ASSYMETRICAL)
ALTERNATING VOLTAGE
WAVE APPLIED TO
VERTICAL PLATES
WITHOUT SWEEP
(A) (B)
WITH SWEEP
FIGURE 4-5' VOLTAGE RELATIONS IN OISTORTEO ALTERNATING VOLTAGiE PATTERNS
Genera
ted o
n 2
01
4-0
2-1
6 0
4:3
3 G
MT /
htt
p:/
/hd
l.hand
le.n
et/
20
27
/mdp.3
90
15
02
10
72
56
9Public
Dom
ain
, G
oog
le-d
igit
ized
/
htt
p:/
/ww
w.h
ath
itru
st.o
rg/a
ccess
_use
#pd-g
oogle

A C INPUT
VOLTAGE
ADJUSTING
POTENTIOMETER
10,000 a WIREWOUND
WT};
_>TO VERTICAL INPUT
TERMINAL OF
OSCILLOSCOPE
—> T0 GROUND TERMINAL
OF OSCILLOSCOPE
AC VACUUM—TUBE VOLTMETER (SYLVANIA POLYMETER)/
FIGURE 4'6 CIRCUIT FOR VOLTAGE CALIBRATION OF OSCILLOSCOPE
Sensitivity of the oscilloscope is reduced when the
vertical gain control is turned down. However, this
very feature enables the gain control to act as an in-
put voltage divider (voltmeter multiplier), permit-
ting higher voltages to be applied to the oscilloscope
vertical input terminals. Calibration of the gain con-
trol will be discussed in Section 4.7.
4.6 CALIBRATION OF OSCILLOSCOPE
AS VOLTMETER
Figure 4-6 shows a circuit arrangement for calibrat-
ing the vertical deflection of the oscilloscope in terms
of voltage. Apply an alternating voltage to the two
input terminals of the circuit. Select various fractions
of this input voltage for the vertical input terminals
of the oscilloscope by means of the potentiometer, R.
The selected voltage values are indicated continu-
ously by an ac vacuum tube voltmeter, such as the
Sylvania Polymeter. The input voltage may be sup-
plied by a sine-wave audio oscillator, such as the Syl-
vania Audio Oscillator Type 145, set to any frequency
between 50 and 10,000 cycles, or by the 6.3-volt
secondary winding of a transformer operated from the
power line. An alternative circuit in which a Variac
is used instead of a potentiometer is shown in Figure
4-7.
6.3 V.
II5 VOLT LINE
TO VERTICAL INPUT
“_PTERM|NAL OF
OSCILLOSCOPE
‘ AC VT VOLTMETER
(SYLVANIA POLYMETER)
TO GROUND TERMINAL
OF OSCILLOSCOPE
FIGURE 4'7 ALTERNATIVE CIRCUIT FOR VOLTAGE CALIBRATION
Genera
ted o
n 2
01
4-0
2-1
6 0
4:3
3 G
MT /
htt
p:/
/hd
l.hand
le.n
et/
20
27
/mdp.3
90
15
02
10
72
56
9Public
Dom
ain
, G
oog
le-d
igit
ized
/
htt
p:/
/ww
w.h
ath
itru
st.o
rg/a
ccess
_use
#pd-g
oogle
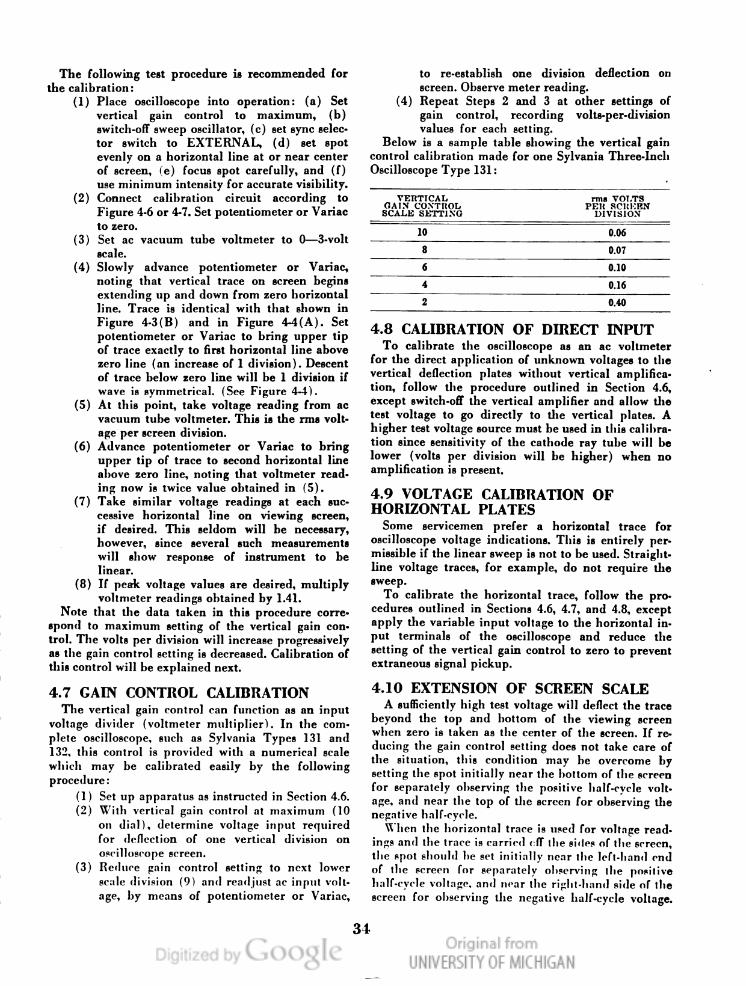
The following test procedure is recommended for
the calibration:
(1) Place oscilloscope into operation: (a) Set
vertical gain control to maximum, (b)
switch-ofl' sweep oscillator, (c) set sync selec-
tor switch to EXTERNAL, (d) set spot
evenly on a horizontal line at or near center
of screen, (e) focus spot carefully, and (f)
use minimum intensity for accurate visibility.
Connect calibration circuit according to
Figure 4-6 or 47. Set potentiometer or Variac
to zero.
Set ac vacuum tube voltmeter to 0—3-volt
scale.
Slowly advance potentiometer or Variac,
noting that vertical trace on screen begins
extending up and down from zero horizontal
line. Trace is identical with that shown in
Figure 4-3(B) and in Figure 4-4(A). Set
potentiometer or Variac to bring upper tip
of trace exactly to first horizontal line above
zero line (an increase of l division). Descent
of trace below zero line will be 1 division if
wave is symmetrical. (See Figure 4-4).
At this point, take voltage reading from ac
vacuum tube voltmeter. This is the rms volt-
age per screen division.
Advance potentiometer or Variac to bring
upper tip of trace to second horizontal line
above zero line, noting that voltmeter read-
ing now is twice value obtained in (5).
Take similar voltage readings at each suc-
cessive horizontal line on viewing screen,
if desired. This seldom will be necessary,
however, since several such measurements
will show response of instrument to be
linear.
(8) If peak voltage values are desired, multiply
voltmeter readings obtained by 1.41.
Note that the data taken in this procedure corre-
spond to maximum setting of the vertical gain con-
trol. The volts per division will increase progressively
as the gain control setting is decreased. Calibration of
this control will be explained next.
4.7 GAIN CONTROL CALIBRATION
The vertical gain control can function as an input
voltage divider (voltmeter multiplier). In the com-
plete oscilloscope, such as Sylvania Types 131 and
132, this control is provided with a numerical scale
which may be calibrated easily by the following
procedure:
(1) Set up apparatus as instructed in Section 4.6.
(2) With vertical gain control at maximum (10
on dial), determine voltage input required
for deflection of one vertical division on
oscilloscope screen.
(3) Reduce gain control setting to next lower
scale division (9) and readjust ac input volt-
age, by means of potentiometer or Variac,
(2)
(3)
(4)
(5)
(6)
(7)
to re-establish one division deflection on
screen. Observe meter reading.
(4) Repeat Steps 2 and 3 at other settings of
gain control, recording volts-per-division
values for each setting.
Below is a sample table showing the vertical gain
control calibration made for one Sylvania Three-Inch
Oscilloscope Type 131:
VERTICAL rms vorxrs
GAIN coxrnor. PElt SCltl-ZEN
SCALE SETTING DIVISION
10 0.06
8 0.07
6 0.10
4 0.16
2 0.40
4.8 CALIBRATION OF DIRECT INPUT
To calibrate the oscilloscope as an ac voltmeter
for the direct application of unknown voltages to the
vertical deflection plates without vertical amplifica-
tion, follow the procedure outlined in Section 4.6,
except switch-ofl' the vertical amplifier and allow the
test voltage to go directly to the vertical plates. A
higher test voltage source must be used in this calibra-
tion since sensitivity of the cathode ray tube will be
lower (volts per division will be higher) when no
amplification is present.
4.9 VOLTAGE CALIBRATION OF
HORIZONTAL PLATES
Some servicemen prefer a horizontal trace for
oscilloscope voltage indications. This is entirely per-
missible if the linear sweep is not to be used. Straight-
line voltage traces, for example, do not require the
sweep.
To calibrate the horizontal trace, follow the pro-
cedures outlined in Sections 4.6, 4.7, and 4.8, except
apply the variable input voltage to the horizontal in-
put terminals of the oscilloscope and reduce the
setting of the vertical gain control to zero to prevent
extraneous signal pickup.
4.10 EXTENSION OF SCREEN SCALE
A sufliciently high test voltage will deflect the trace
beyond the top and bottom of the viewing screen
when zero is taken as the center of the screen. If re-
ducing the gain control setting does not take care of
the situation, this condition may be overcome by
setting the spot initially near the bottom of the screen
for separately observing the positive half-cycle volt-
age, and near the top of the screen for observing the
negative half-cycle.
When the horizontal trace is used for voltage read-
ings and the trace is carried cfT the sides of the screen,
the spot should he set initially near the left-hand 0nd
of the screen for separately observing the positive
half-cycle voltage, and near the right-hand side of the
screen for observing the negative half-cycle voltage.
34
Genera
ted o
n 2
01
4-0
2-1
6 0
4:3
3 G
MT /
htt
p:/
/hd
l.hand
le.n
et/
20
27
/mdp.3
90
15
02
10
72
56
9Public
Dom
ain
, G
oog
le-d
igit
ized
/
htt
p:/
/ww
w.h
ath
itru
st.o
rg/a
ccess
_use
#pd-g
oogle

CHAPTER V
USE OF THE OSCILLOSCOPE IN
RADIO RECEIVER SERVICING
5.1 AM RECEIVER ALIGNMENT,
USING AM SIGNAL GENERATOR
In the radio receiver service shop, the oscilloscope
is a precise, time-saving instrument in such dynamic
tests (tests made while the circuit is in operation) as
set alignment, checking set performance, tracing sig-
nals, locating faulty tubes, capacitors, and resistors;
tracking down hum, regeneration, oscillation, and
noise; discovering and identifying overloading and
distortion; and in general trouble-shooting. The vari-
ous receiver test operations are described, step by
step, in this chapter.
When an amplitude-modulated signal generator is
used in the stage-by-stage alignment of a radio re-
ceiver, the oscilloscope acts as an alignment peak
indicator. In this application the vertical input ter-
minals of the oscilloscope are connected across the
loudspeaker voice coil as shown in Figure 5-1. Ac-
CONVERTER
VOICE COIL\
AF AMPLIFIER\\
23 ‘
OSCILLATOR
_ , — PADDER
OSCILLATOR
- -TRIMMER
\L
If
'5 gal-i
@111
VOLUME
CONTROL g
vvvvvvv
32 22
g '6 seas i
i
28
CI AND 02 GANGED
V5
POWER LINE ON-OFF
3° I
\ T .
POWER SUPPLY RECTIFlER
28
28
OSCILLOSCOPE
FIGURE 5'/ A C '00 SURE RHE' TE RODYNE RECEIVER ARRANGED FOR OSC/LLOSCOP/C AL lG/VME N 7'
35
Genera
ted o
n 2
01
4-0
2-1
6 0
4:3
3 G
MT /
htt
p:/
/hd
l.hand
le.n
et/
20
27
/mdp.3
90
15
02
10
72
56
9Public
Dom
ain
, G
oog
le-d
igit
ized
/
htt
p:/
/ww
w.h
ath
itru
st.o
rg/a
ccess
_use
#pd-g
oogle

curate alignment may be obtained with this arrange-
ment.
The following steps give the procedure to be fol-
lowed in aligning an AM superheterodyne receiver.
The circuit given in Figure 5-1 is typical of most sets.
(1) Interrupt avc in receiver by connecting tem-
porary wire jumper between points 15 and
28. Remove jumper as soon as alignment is
completed. Insert receiver plug into power
line. Set volume control at about 1/2 maxi-
mum. Tune receiver dial until variable con-
denser plates are completely meshed.
Adjust AM signal generator to intermediate
frequency of receiver, usually 455 kc, switch-
on 400 cycle modulation, set attenuators at
zero, and insert signal generator plug into
power line.
Prepare oscilloscope: For vertical straight-
line pattern, switch-oil linear sweep, set
SYNC switch to EXTERNAL set FRE-
QUENCY controls to zero, set GAIN con-
trols to zero, set INTENSITY and FOCUS
controls for sharp dot on screen. For sine-
wave pattern; set linear sweep to any fre-
quency near 100 cycles, set VERTICAL GAIN
control to zero, set SWEEP AMPLITUDE
control to maximum, set SYNC switch to
INTERNAL, adjust HORIZONTAL GAIN
control, FOCUS and INTENSITY controls
for long, clear horizontal line on screen.
Either the straight line or sine wave pattern
will be satisfactory, and the operator should
make his own choice between the two.
(2)
(3)
(4)
oscilloscope to voice coil of loudspeaker, as
shown in Figure 5-1.
Connect ground terminal of signal generator
to point 31. Provide “high” terminal of sig-
nal generator with short, shielded test lead
with blocking capacitor of 0.05 or 0.1 pf.
To test af amplifier of receiver, connect lead
from 400-cycle output terminal of signal
generator to 21. Slowly advance vertical gain
control of oscilloscope, noting that height of
pattern increases, until pattern is about 11/2
inch high. If no pattern is obtained, af
amplifier is not operating. Removing 400-
cycle signal from 21 should cause pattern to
return to dot or line. Make additional af
test with 400-cycle lead at 18.
Remove 400-cycle signal and connect high
terminal of signal generator (set to receiver
intermediate frequency) to 8. Increase setting
of attentuators in signal generator, and ad-
just trimmers C, and C, for peak height of
pattern on screen. If pattern is not large
enough, advance settings of attenuators and
vertical gain control.
Transfer high lead of generator to 3, and
adjust trimmers C3 and C, for peak height
of pattern If pattern extends off screen, re-
(5)
(6)
(7)
(8)
Connect VERTICAL INPUT terminals of '
FIGURE 5-2 PATTERN IND/DATING SWEEP
OSCILLA TOR ADJUSTED TO IZO~
duce setting of receiver volume control, oscil-
loscope vertical gain control, signal generator
attenuators, or all three.
Transfer high lead of generator to 1, set
signal generator to 1500 kc, set receiver dial
to 1500 kc, and adjust trimmers on detector
tuning capacitor to C1 and oscillator tuning
section C, for peak height of pattern. Re—
duce attenuator setting if pattern is too high.
With same connections as in (9), set genera-
tor and receiver to 600 kc and adjust padder
cp on oscillator section of tuning capacitor
for peak height of pattern.
After readjusting all detector and if trim-
mers, remove jumper from points 15 and 23.
5.2 AM RECEIVER ALIGNMENT,
USING FM SIGNAL GENERATOR
The method which will be described in this section
has the advantage that the oscilloscope pattern it
yields is the actual selectivity curve of the rf detector,
or if stage under test—or of the entire receiver. Ob-
servation of this curve shows quickly whether the cir-
cuit is sharply or broadly tuned. This method of
alignment requires, in addition to an oscilloscope, a
frequency-modulated signal generator, such as the
Sylvania Type 216.
(1) Prepare oscilloscope according to instructions
given for sine-wave pattern in Step 3 in Section 5.1,
except set linear sweep to 120 cycles in following
manner: (a) Connect 60-cycle voltage to vertical am-
plifier input terminals and advance vertical gain con-
trol to about IA maximum. 60-cycle voltage may be
obtained from the 6.3-volt output terminal of Sylvania
Oscilloscopes Types 131 and 132. (b) Set sync switch
to LINE FREQ. (c) Adjust coarse and fine frequency
controls and sync amplitude control to obtain sta-
tionary pattern shown in Figure 5-2, indicating sweep
oscillator is set to 120 cycles. ((1) Without disturb-
ing control settings, remove 60-cycle voltage from
vertical input terminals. (e) Throw sync switch to
EXTERNAL.
(2) Plug-in frequency-modulated signal generator
and set dial to receiver intermediate frequency.
(3) Interrupt avc in receiver by connecting tem-
porary jumper from 15 to 28 (see Figure 5-1). Re-
(9)
(10)
(11)
36
Genera
ted o
n 2
01
4-0
2-1
6 0
4:3
3 G
MT /
htt
p:/
/hd
l.hand
le.n
et/
20
27
/mdp.3
90
15
02
10
72
56
9Public
Dom
ain
, G
oog
le-d
igit
ized
/
htt
p:/
/ww
w.h
ath
itru
st.o
rg/a
ccess
_use
#pd-g
oogle
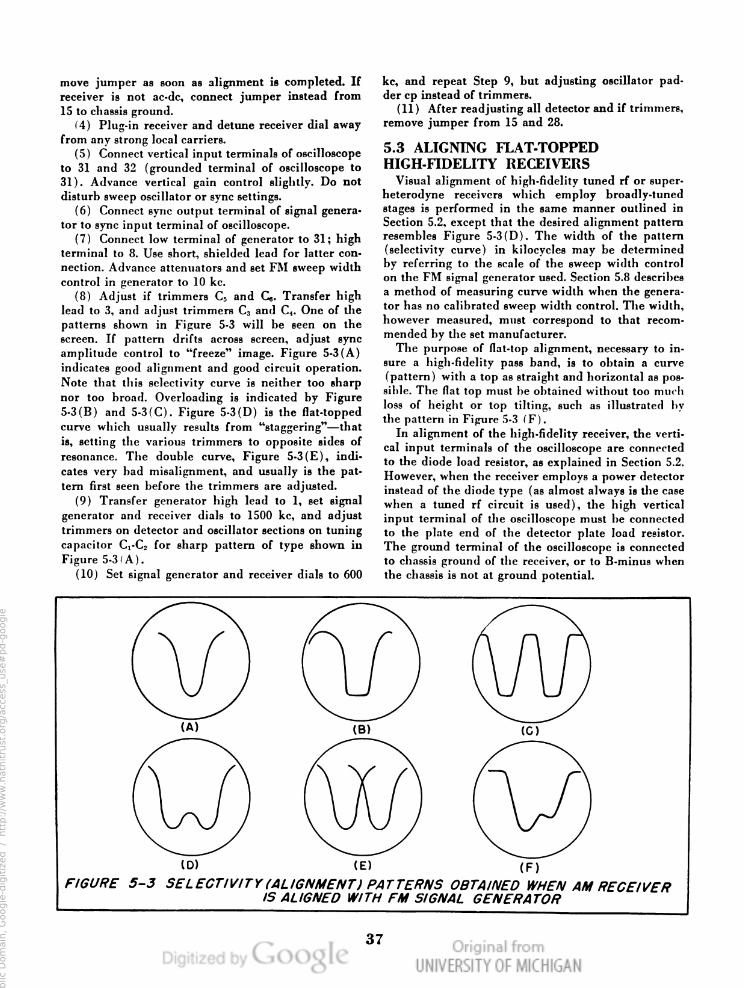
move jumper as soon as alignment is completed. If
receiver is not ac-dc, connect jumper instead from
15 to chassis ground.
(4) Plug-in receiver and detune receiver dial away
from any strong local carriers.
(5) Connect vertical input terminals of oscilloscope
to 31 and 32 (grounded terminal of oscilloscope to
31). Advance vertical gain control slightly. Do not
disturb sweep oscillator or sync settings.
(6) Connect sync output terminal of signal genera-
tor to sync input terminal of oscilloscope.
(7) Connect low terminal of generator to 31; high
terminal to 8. Use short, shielded lead for latter con-
nection. Advance attenuators and set FM sweep width
control in generator to 10 kc.
(8) Adjust if trimmers C5 and C6. Transfer high
lead to 3, and adjust trimmers C3 and C,. One of the
patterns shown in Figure 5-3 will be seen on the
screen. If pattern drifts across screen, adjust sync
amplitude control to “freeze” image. Figure 5-3(A)
indicates good alignment and good circuit operation.
Note that this selectivity curve is neither too sharp
nor too broad. Overloading is indicated by Figure
5-3(B) and 5-3(C). Figure 5-3(D) is the flat-topped
curve which usually results from “staggering”—that
is, setting the various trimmers to opposite sides of
resonance. The double curve, Figure 5-3(E), indi-
cates very bad misalignment, and usually is the pat-
tern first seen before the trimmers are adjusted.
(9) Transfer generator high lead to 1, set signal
generator and receiver dials to 1500 kc, and adjust
trimmers on detector and oscillator sections on tuning
capacitor C1-C2 for sharp pattern of type shown in
Figure 5-3(A).
(10) Set signal generator and receiver dials to 600
kc, and repeat Step 9, but adjusting oscillator pad-
der cp instead of trimmers.
(11) After readjusting all detector and if trimmers,
remove jumper from 15 and 28.
5.3 ALIGNING FLAT-TOPPED
HIGH-FIDELITY RECEIVERS
Visual alignment of high-fidelity tuned rf' or super-
heterodyne receivers which employ broadly-tuned
stages is performed in the same manner outlined in
Section 5.2, except that the desired alignment pattern
resembles Figure 5-3(D). The width of the pattern
(selectivity curve) in kilocycles may be determined
by referring to the scale of the sweep width control
on the FM signal generator used. Section 5.8 describes
a method of measuring curve width when the genera-
tor has no calibrated sweep width control. The width,
however measured, must correspond to that recom-
mended by the set manufacturer.
The purpose of flat-top alignment, necessary to in-
sure a high-fidelity pass band, is to obtain a curve
(pattern) with a top as straight and horizontal as pos-
sible. The flat top must be obtained without too much
loss of height or top tilting, such as illustrated by
the pattern in Figure 5-3 (F).
In alignment of the high-fidelity receiver, the verti-
cal input terminals of the oscilloscope are connected
to the diode load resistor, as explained in Section 5.2.
However, when the receiver employs a power detector
instead of the diode type (as almost always is the case
when a tuned rf circuit is used), the high vertical
input terminal of the oscilloscope must be connected
to the plate end of the detector plate load resistor.
The ground terminal of the oscilloscope is connected
to chassis ground of the receiver, or to B-minus when
the chassis is not at ground potential.
(A)
(D)
6!.)
@D
(E)
(C)
(<3
(F)
FIGURE 5-3 SELECT/VITYIAL/GNMEIVT) PATTERNS OBTAINED WHEN AM RECEIVER
IS AL/GNED WITH FM SIG/VAL GENERATOR
37
Genera
ted o
n 2
01
4-0
2-1
6 0
4:3
3 G
MT /
htt
p:/
/hd
l.hand
le.n
et/
20
27
/mdp.3
90
15
02
10
72
56
9Public
Dom
ain
, G
oog
le-d
igit
ized
/
htt
p:/
/ww
w.h
ath
itru
st.o
rg/a
ccess
_use
#pd-g
oogle

TRIMMERS TO ALIGN
-————0
FROM SIGNAL 775 LIMITER
GENERATOR
05* ' ‘ ' '
I _ _ __ A A A ,
UMITER
GRID
;: RESIISTOR
I
. _ . a g, ;:
o
9 K
| \
_.._. III \\
,P 1}) \ISOLATING
1,} RESISTOR
u
I
l
lif—T'
III
III
II:
* A._ .__ || __
T L T +8 l|| _
l||
||l
'LL: _- : :-<—_-_:-_-_'._-_-_JJ'
FIGURE 5'4 OSCILLOSCOPE CONNECTIONS FOR /FAL/CNMENT//V FM RECEIVER
5.4- ADDITIONAL INSTRUCTIONS
ON RECEIVER ALIGNMENT
Many receivers do not employ capacitive trimming
and tuning of the type shown in Figure 5-1. These
sets usually make use of powdered-iron slugs for in-
ductive tuning and trimming. Visual alignment of
such receivers is done in the same way as outlined in
the foregoing sections, except that slugs instead of
capacitors must be adjusted in the rf, detector, if and
oscillator stages. No special connections, not already
covered in the text, need be made.
In an all-wave receiver, alignment of the front end
of set must be completed for each setting of the band
switch. The generator must be set successively to fre-
quencies near the top and bottom of each wave band,
just as the frequencies of 1500 and 600 kc were used
for alignment of the broadcast range. Alignment of if
and 2nd detector stages need be performed only once.
The circuit shown in Figure 5-1 is an ac-dc set
powered by a simple line rectifier. The ave is inter-
rupted in this circuit (see Sections 5.1 and 5.2) by
connecting a short-circuiting jumper temporarily from
point 15 to B-minus (point 28). In straight ac re-
ceivers, the jumper must be run from point 15 to
chassis ground.
Occasionally, connection of an oscilloscope to a
radio receiver results in pickup of outside signals,
noise. or hum voltage, or in internal regeneration or
oscillation. Either of these conditions will cause
modulation or distortion of the pattern on the screen.
Usually, a short. well-shielded lead to the vertical
input terminals will correct the trouble. In stubborn
cases. it may be necessary to include a 50.000- to
100.000-ohm series resistor in the vertical input lead
as close as practicable to the point of contact in the
receiver circuit.
5.5 FM RECEIVER ALIGNMENT
From the antenna and ground input terminals
through the if amplifier, the FM receiver is similar
to, and often identical with an AM superheterodyne.
The audio stages of the FM receiver likewise are
identical with those in an AM set. The point of differ-
ence is that the AM receiver utilizes a second detec-
tor between the if and af amplifiers, while the FM
receiver uses a discriminator (preceded by one or
more limiter stages) in this same position. More re-
cently-designed FM receivers employ a special type
' of discriminator, the ratio detector, which requires
no limiter section.
Alignment of the FM receiver differs from AM
alignment chiefly in the special adjustment of the dis-
criminator or ratio detector. However, to make the
operation clear we will explain separately in the fol-
lowing paragraphs the adjustment of each of these
circuits.
Discriminator-Type Receiver. (1) Prepare oscillo-
scope in same manner outlined in Step 1 of Sec-
tion 5.2.
(2) Connect sync input terminals of oscilloscope
to l20-cycle sync output terminal of frequency-modu-
lated signal generator.
(3) Set generator output to intermediate frequency
of receiver (usually 10.7 me).
(4) Connect short. shielded “high” lead of genera-
tor to grid of last if stage.
(5) Via a short, shielded lead, connect vertical in-
put terminal of oscilloscope to junction of limiter
grid resistor and secondary of last if transformer, as
shown in Figure 5-4.
'6) Adjust trimmers of last if stage to obtain a
pattern similar to Figure 5~3(D). Bandwidth of an FM
if amplifier is somewhat broader than that of an AM
38
Genera
ted o
n 2
01
4-0
2-1
6 0
4:3
4 G
MT /
htt
p:/
/hd
l.hand
le.n
et/
20
27
/mdp.3
90
15
02
10
72
56
9Public
Dom
ain
, G
oog
le-d
igit
ized
/
htt
p:/
/ww
w.h
ath
itru
st.o
rg/a
ccess
_use
#pd-g
oogle

—)s—
OSCILLOSCOPE
LIMITER
E ECONDARY
?5 ' ;£STRIMMER
PRIMARY
TRIMMER
V ’/
+B SHIELDED LEAD--/
F /GURE 5 '5 OSC/L L056 OPE CONNECT/0N5 FOR D/SCR/M/NATOF? AL/GNME N 7'
if amplifier, consequently the sharp curve of Figure
5-3(A) must not be expected.
(7) Transfer generator output to detector grid of
converter (mixer) stage (such as point 3 in Figure
5-1) and adjust remaining if trimmers for peak height
of pattern on screen.
(8) Finally, “touch up” all if trimmers for close
adjustment.
(9) For discriminator alignment, transfer vertical
input of oscilloscope to top of discriminator load re-
sistor string, as shown in Figure 5-5. Generator output
must be connected to detector grid of converter stage.
Pattern seen on screen will resemble Figure 5-8 when
signal generator sweep frequency is same as line f re-
quency and sync frequency is twice line frequency.
Trimmers of discriminator transformer must be ad-
justed to bring points A and C, or E and C, equal
distances from horizontal center line (B or F). Also,
adjustment must be continued to bring B and F equal
distances from D. Slant lines AC and CE will inter-
sect, with point D resting on the horizontal line when
alignment is correct. Adjustment of primary trim-
mer of discriminator transformer controls distance of
points A, C, E, and C from horizontal center line;
adjustment of secondary trimmer controls position of
cross-over point D with respect to horizontal center
line and spacing from points B and F.
(10) If oscilloscope is synchronized at line fre-
quency, instead of twice that value, and signal genera-
tor sweep is same as line frequency, the dual pattern
shown in Figure 5-9 will be seen on screen during dis-
criminator alignment. Discriminator transformer trim-
mers must be adjusted, in this case, to bring points
B and D (or B' and D') equal distances from hori-
zontal center line, and points A and E equal dis-
tances from C—or A' and E’ equal distances from C'.
Ratio Detector-Type Receiver. The if amplifier of
an FM receiver employing a ratio detector must be
aligned in the same manner as the if section of a dis-
criminator-type set (see Section 6.5), except that the
vertical input terminal of the oscilloscope must be
connected to the top of the detector load resistor
(point A in Figure 5-6) for alignment of the if ampli-
fier up to and including the primary of the ratio
detector transformer.
(1) To align secondary of ratio detector trans-
former, transfer vertica] input terminal of oscillo-
scope to point B (see Figure 5-6) and adjust sec-
ondary trimmer. The pattern seen on oscilloscope
screen will depend upon synchronizing frequency.
Pattern shown in Figure 5-8 will be seen when signal
generator sweep rate and sync frequency both are
twice the line frequency. Pattern shown in Figure 5-9
will be seen when sweep rate is same as line frequency
and sync frequency is twice that value.
(2) Adjust detector trimmers for symmetry of pat-
tern. as instructed in Step 9, Section 5.5.
(3) Work hack and forth with vertical input ter-
minals of oscilloscope successively at points A and B
39
Genera
ted o
n 2
01
4-0
2-1
6 0
4:3
4 G
MT /
htt
p:/
/hd
l.hand
le.n
et/
20
27
/mdp.3
90
15
02
10
72
56
9Public
Dom
ain
, G
oog
le-d
igit
ized
/
htt
p:/
/ww
w.h
ath
itru
st.o
rg/a
ccess
_use
#pd-g
oogle

LAST IF
STAGE
FROM
SIGNAL_GENERATOFI
PRIMARY SECONDARY
LII IT
CONNECT VERTICAL INPUT HERE-31
TO AVC
TO ALIGN IF AND /
DISCRIMINATOR PRIMARY 1
TO EXT. SYNC VOLTAGE
SUPPLIED BY FM
. A:
l SOURCE (USUALLY
SIGNAL GENERATOR)
T *II'—
BJJFD
I \I I
. IF.
’\/\I\
\I
II
\I
n
_:L__ 1'8
CONNECT VERTICAL INPUT HERE
TO ALIGN DISCRIMINATOR "
y SECONDARY --------------- _/ I
I
SHIELDED /
LEAD "
CONNECT FM SIGNAL GENERATOR
TO GRID OF IST IF TUBE
B
FIGURE 5'6 OSCILLOSCOPE CONNECTIONS FOR RAT/O DETECTOR ALIGNMENT
(See Figure 5-6) for close alignment of both primary
and secondary of ratio detector transformer.
(4) If load resistor of ratio detector does not have
grounded center point1 as shown in Figure 5-6, but
one end grounded as in Figure 5-7, vertical input of
oscilloscope must be connected to junction of two
matched 250,000-ohm l-watt carbon resistors. These
connections are shown in Figure 5-7. After final ad-
justment of detector, these resistors must be removed
from circuit.
F ront End Alignment. The front end of an FM re-
ceiver (that is, the converter, mixer, or first detector-
oscillator section) resembles that of any other super-
heterodyne, except that the input tuning will cover
88 to 108 megacycles, and in some cases 42-50 Mc
(old FM band) as well. Alignment is the same as de-
scribed for AM front ends (see Steps 9 and 10 in
Section 5.2), except that the signal generator is set
to 108 Me for the high-end adjustment and to 88 Mc
for low-end adjustment.
LOAD
RESISTOR
\
TO EXTERNAL SYNC VOLTAGE
SOURCE (USUALLY SUPPLIED
BY FM SIGNAL GENERATOR)
SHIELDED LEAD”
)I——+ AUDIO I
CONNECT FM SIGNAL GENERATOR
TO GRID OF IST IF TUBE
FIGURE 5-7 ALTERNATE OSCILLOSCOPE CONNECTIONS FOR RAT/0
DETECTOR ALIGNMENT
40
Genera
ted o
n 2
01
4-0
2-1
6 0
4:3
4 G
MT /
htt
p:/
/hd
l.hand
le.n
et/
20
27
/mdp.3
90
15
02
10
72
56
9Public
Dom
ain
, G
oog
le-d
igit
ized
/
htt
p:/
/ww
w.h
ath
itru
st.o
rg/a
ccess
_use
#pd-g
oogle

F__ HORIZONTAL
CENTER LINE
G
FIGURE 5-8 DISCRIMINATOR OR RA TIO
OE TEGTOR ALIGNMENT
PATTERN. (SYNC VOLTAGE
HAS TWICE POWER LINE
F RE OUE NCY )
FIGURE 5 - .9 OlSCR/MINA TOR OR RA TIO
DE TECTOR ALIGNMENT
PATTERN (SYNC VOLTAGE HAS
POWER LINE FREQUENCY)
5.6 AFC ALIGNMENT
Several AM receiver models employ automatic fre-
quency control. The heart of this system is a discrimi-
nator stage, resembling the FM discriminator shown
in Figure 5-5.
Proper connections for visual alignment of an afc
discriminator are shown in Figure 5-10. Before under-
taking alignment, capacitor C, must be disconnected
temporarily, the avc circuit of the receiver inter-
rupted (by connecting a temporary jumper from
point A to ground), and the upper half of the dis-
criminator load resistor short-circuited, as shown in
Figure 5-10.
The frequency-modulated signal generator should
be set to the intermediate frequency of the receiver
and connected to the last if grid. Sync voltage output
terminals of the generator are connected to the sync
input of the oscilloscope.
Proper alignment of the discriminator will yield
patterns of the type shown in Figures 5-8 and 5-9.
See Section 5.5 for detailed instructions on discrimi-
nator alignment.
5.7 CHECKING AVC ACTION
I
Every present-day receiver, except simple tuned rf
regenerative, and superregenerative sets, has an avc
circuit. For best set performance, the avc circuit must
operate properly. While avc circuits have been ad-
justed by means of a high-resistance dc voltmeter, the
advantage of using an oscilloscope lies in the ability
of this instrument to show avc distortion as well as
whether or not avc “takes hold.” The following 7-step
method describes a simple and complete scheme for
checking ave performance:
(1) Connect signal generator having known good
SECONDARY OF
I- DISCRIMINATOR TRANSFORMER
TO EXTERNAL
rTEMPORARY JUMPER smc VOLTAGE SOURCE
\
\
\
'
.\\‘
I
J_ 0I I C l 02
T I C _ In
A? SHIELDED
LEAD
TO R F A TO A F
A F g - l(__+
GRIDNQEITURNS i W ' INAIR‘EO'E'NEE'R
FIGURE 5‘I0 OSCILLOSCOPE CONNECT/0N5 FOR A F0 D/SCR/M/IVATOR ALIGNMENT
41
Genera
ted o
n 2
01
4-0
2-1
6 0
4:3
4 G
MT /
htt
p:/
/hd
l.hand
le.n
et/
20
27
/mdp.3
90
15
02
10
72
56
9Public
Dom
ain
, G
oog
le-d
igit
ized
/
htt
p:/
/ww
w.h
ath
itru
st.o
rg/a
ccess
_use
#pd-g
oogle

@OOO
WEAK
NOT OPERATING
SIGNAL, AV C STRONG SIGNAL, AV C
OPERATING, NO
DISTORTION
(A) (B)
STRONG SGNAL,AVC
OPERAHNG,USTORHON
PRESENT
(D)
(0)
FIGURE 5-I/ PATTERNS OBTAINED IN AVC TEST
FIGURE 5-I2 MARKER PIP ONSELECTIVITY
CURVE
RECEIVER SELECTIVITY
PAT TERN
MARKER PIP
B__HORQONTAL
REFERENOE UNE
(2)
(3)
(4)
(5)
(6)
sine-wave output to antenna and ground ter-
minals of receiver under test.
Set signal generator modulation to 400 cycles.
Set generator and receiver dials to a clear
frequency preferably in broadcast band.
Connect vertical input terminal of oscillo-
scope, by means of short, shielded lead to
second detector output.
Prepare oscilloscope as follows: (a) Set
coarse and fine frequency controls to ap-
proximately 100 cycles, (h) set sync switch
to INTERNAL, and (c) advance sync ampli-
tude control about halfway.
Adjust signal generator attenuator for low
signal output, tune-in signal with receiver,
and note that several cycles of modulating
frequency appear on oscilloscope screen. Ad-
just vertical gain control for pattern height
of about 1/2 inch, set frequency controls for
about 4 cycles on screen, and adjust sync
control to hold pattern stationary on screen.
Pattern should have good sine wave form,
similar to Figure 5-11 (A) .
Advance generator attenuator setting gradu-
ally for higher signal output, noting that
pattern height increases—rapidly at first, up
to point at which avc action starts, after
which little or no increase in height will
result from further increase of signal input
to receiver. At this point, pattern should be
larger in size, as shown in Figure 5-ll(B),
but should have the same good waveform as
originally. If wave is distorted, as in Figure
5-11(C), a defective component (such as
open, shorted, or leaky capacitor) is present
in avc circuit.
5.8 ESTABLISHING MARKER POINTS
Very often, when aligning a receiver visually, it is
necessary to know the actual passband width of the
selectivity curve (see Figure 5-3, (A) to (E)) in kilo-
cycles.
Bandwidth sometimes may be determined from the
setting of the sweep width control of the frequency-
modulated signal generator, if the scale of this con-
trol has been calibrated accurately. However, an in-
dication obtained in this manner usually will measure
only the frequency width at the bottom of the skirts
of the curve.
A more satisfactory method, which furnishes a
legible “pip” (sec Figure 5-12) that may he moved at
will to any point on the curve, is illustrated by Figure
5-13. The scheme works this way: After the if ampli-
(7)
42
Genera
ted o
n 2
01
4-0
2-1
6 0
4:5
4 G
MT /
htt
p:/
/hd
l.hand
le.n
et/
20
27
/mdp.3
90
15
02
10
72
56
9Public
Dom
ain
, G
oog
le-d
igit
ized
/
htt
p:/
/ww
w.h
ath
itru
st.o
rg/a
ccess
_use
#pd-g
oogle

COUPLING CAPACITOR OR
' DUMMY ANTENNA
SYLVANIA FM / IST IF TRANSFORMER
651222?”
M XER
TYPE 2I6 ' F—
- - - —_ ZR
AUXILIARY I ‘gé
UNMODULATED
SIGNAL I
GENERATOR
A
\
COUPLING CAPACITOR OR
DUMMY ANTENNA
‘
FIGURE 5—I3 APPARATUS SETUP FOR PRODUCING MARKER P/PS ON SELECT/V/TY CURVE
fier has been correctly aligned with an FM signal
generator connected to the mixer control grid, apply
a signal at the same time to the same grid from a
second, unmodulated signal generator set to the inter-
mediate frequency (see Figure 5-13) .
As the second (auxiliary) signal generator is tuned
above and below the intermediate frequency, the
marker pip will travel around the curve pattern,
being at some point on the left-hand slope of the
curve at lower frequencies and on the right-hand
slope at higher frequencies. The corresponding fre-
quencies may be read from the dial settings of the
auxiliary signal generator. Thus, if the pip is at point
A when the auxiliary generator is tuned to 10.6 Me
and is at point B when the generator is tuned to 10.8
Mc, the bandwidth along the horizontal reference line
is 10.8—10.6 or 0.2 megacycles.
Another method makes use of the intensity modula-
tion input feature of the Sylvania Oscilloscope Type
132. The apparatus set-up is shown in Figure 5-14.
The FM signal generator output is connected to the
antenna and ground terminals of the receiver or to
the if input, depending upon whether if selectivity
or overall selectivity is to be observed.
The output of a pulse generator is connected to the
intensity modulation input terminal of the Type 132
oscilloscope. This generator should deliver sharp,
spiked positive pulses at a continuously variable repe-
tition rate. The sharper and narrower these pulses,
the brighter and finer will be the marker points ob-
tained. However, not more than 2 volts should be
applied to the cathode ray grid. For best stability at
any repetition rate, the pulse generator may be syn-
chronized with an external oscillator.
A typical selectivity curve (alignment pattern)
punctuated by marker points obtained from a pulse
generator is shown in Figure 5-15. A similar pattern,
in which corresponding points are blanked out by
pulses of opposite polarity, is shown in Figure 5-16.
To determine the frequency separation of the marker
points along the selectivity curve, it is necessary only
to read the pulse repetition frequency from the dial
SHIELED LEAD TO DETECTOR
SHIELDED LEAD TO VERTICAL
OR IF AMPLIFIER
INPUT lTERMINAL
i
SYLVANIA FM SIGNAL
GENERATOR TYPE 2I6
PULSE
GENERATOR
(Deg
RECEIVER
-=L
SYLVANIA
T0 INTENSITY MODULATION OSCILLOSCOPE
INPUT TERMINAL TYPE I32
FIGURE 5-l4 CONNECTIONS OF INSTRUMENTS FOR PRODUCING MARKER POINTS ON
ALIGNMENT PATTERN
43
Genera
ted o
n 2
01
4-0
2-1
6 0
4:3
4 G
MT /
htt
p:/
/hd
l.hand
le.n
et/
20
27
/mdp.3
90
15
02
10
72
56
9Public
Dom
ain
, G
oog
le-d
igit
ized
/
htt
p:/
/ww
w.h
ath
itru
st.o
rg/a
ccess
_use
#pd-g
oogle
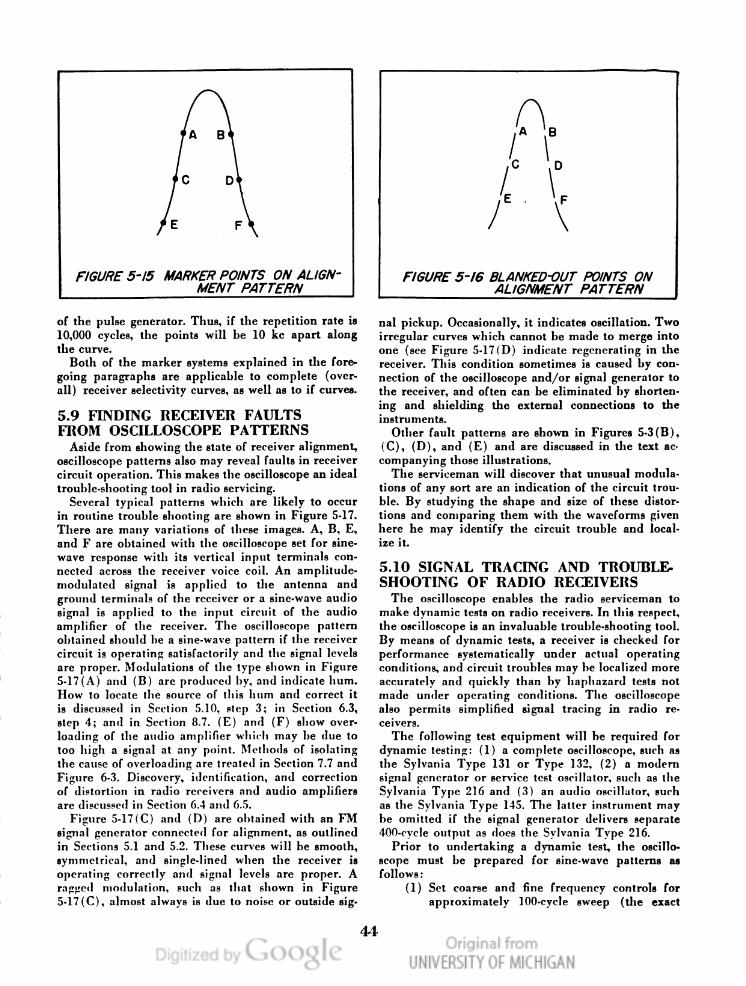
FIGURE 5-I5 MARKER POINTS ON ALIGN-
MENT PATTERN
FIGURE 5-l6' BLANKED-OUT POINTS ON
ALIGNMENT PATTERN
of the pulse generator. Thus, if the repetition rate is
10,000 cycles, the points will be 10 kc apart along
the curve.
Both of the marker systems explained in the fore-
going paragraphs are applicable to complete (over-
all) receiver selectivity curves, as well as to if curves.
5.9 FINDING RECEIVER FAULTS
FROM OSCILLOSCOPE PATTERNS
Aside from showing the state of receiver alignment,
oscilloscope patterns also may reveal faults in receiver
circuit operation. This makes the oscilloscope an ideal
trouble-shooting tool in radio servicing.
Several typical patterns which are likely to occur
in routine trouble shooting are shown in Figure 5-17.
There are many variations of these images. A, B, E,
and F are obtained with the oscilloscope set for sine-
wave response with its vertical input terminals con-
nected across the receiver voice coil. An amplitude-
modulated signal is applied to the antenna and
ground terminals of the receiver or a sine-wave audio
signal is applied to the input circuit of the audio
amplifier of the receiver. The oscilloscope pattern
obtained should be a sine-wave pattern if the receiver
circuit is operating satisfactorily and the signal levels
are proper. Modulations of the type shown in Figure
5-17(A) and (B) are produced by, and indicate hum.
How to locate the source of this hum and correct it
is discussed in Section 5.10, step 3; in Section 6.3,
step 4; and in Section 8.7. (E) and (F) show over-
loading of the audio amplifier which may be due to
too high a signal at any point. Methods of isolating
the cause of overloading are treated in Section 7.7 and
Figure 6-3. Discovery, identification, and correction
of distortion in radio receivers and audio amplifiers
are discussed in Section 6.4 and 6.5.
Figure 5-17(C) and (D) are obtained with an FM
signal generator connected for alignment, as outlined
in Sections 5.1 and 5.2. These curves will be smooth,
symmetrical, and single-lined when the receiver is
operating correctly and signal levels are proper. A
ragged modulation, such as that shown in Figure
5-17(C), almost always is due to noise or outside sig-
nal pickup. Occasionally, it indicates oscillation. Two
irregular curves which cannot be made to merge into
one (see Figure 5-17(D) indicate regenerating in the
receiver. This condition sometimes is caused by con-
nection of the oscilloscope and/or signal generator to
the receiver, and often can be eliminated by shorten-
ing and shielding the external connections to the
instruments.
Other fault patterns are shown in Figures 5-3 (B),
(C), (D), and (E) and are discussed in the text ac-
companying those illustrations.
The serviceman will discover that unusual modula-
tions of any sort are an indication of the circuit trou-
ble. By studying the shape and size of these distor-
tions and comparing them with the waveforms given
here he may identify the circuit trouble and local-
ize it.
5.10 SIGNAL TRACING AND TROUBLE-
SHOOTING OF RADIO RECEIVERS
The oscilloscope enables the radio serviceman to
make dynamic tests on radio receivers. In this respect,
the oscilloscope is an invaluable trouble-shooting tool.
By means of dynamic tests, a receiver is checked for
performance systematically under actual operating
conditions, and circuit troubles may be localized more
accurately and quickly than by haphazard tests not
made under operating conditions. The oscilloscope
also permits simplified signal tracing in radio re-
ceivers.
The following test equipment will be required for
dynamic testing: (1) a complete oscilloscope, such as
the Sylvania Type 131 or Type 132, (2) a modern
signal generator or service test oscillator, such as the
Sylvania Type 216 and (3) an audio oscillator, such
as the Sylvania Type 145. The latter instrument may
be omitted if the signal generator delivers separate
400-cycle output as does the Sylvania Type 216.
Prior to undertaking a dynamic test, the oscillo-
scope must he prepared for sine-wave patterns as
follows:
(1) Set coarse and fine frequency controls for
approximately 100-cycle sweep (the exact
Genera
ted o
n 2
01
4-0
2-1
6 0
4:3
4 G
MT /
htt
p:/
/hd
l.hand
le.n
et/
20
27
/mdp.3
90
15
02
10
72
56
9Public
Dom
ain
, G
oog
le-d
igit
ized
/
htt
p:/
/ww
w.h
ath
itru
st.o
rg/a
ccess
_use
#pd-g
oogle
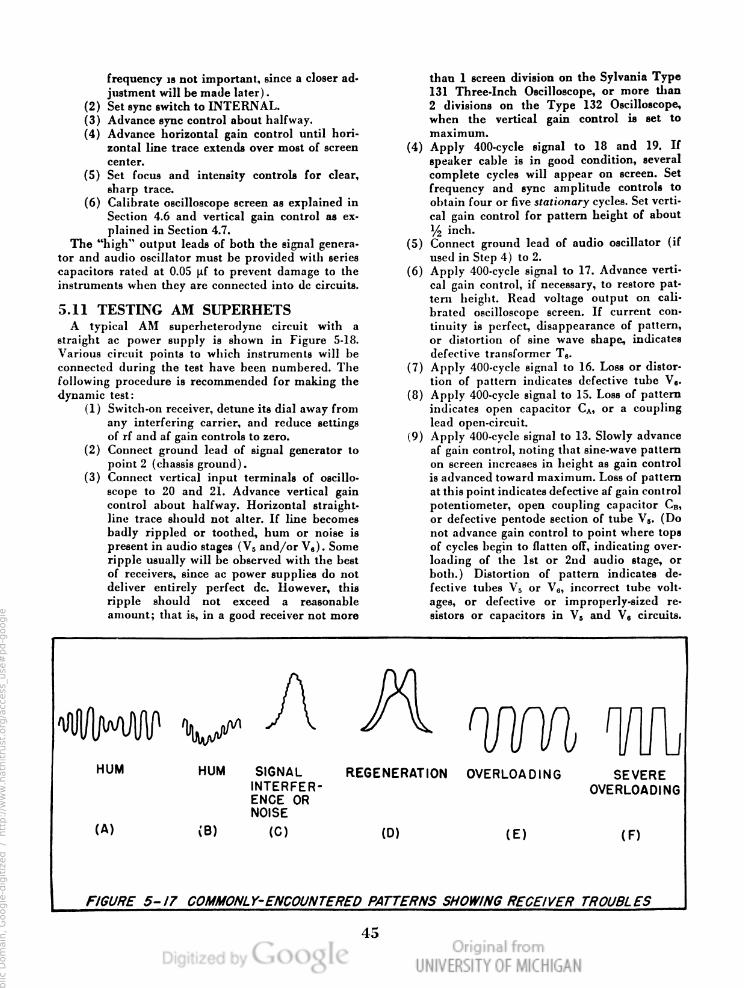
frequency is not important, since a closer ad-
justment will be made later).
(2) Set sync switch to INTERNAL.
(3) Advance sync control about halfway.
(4) Advance horizontal gain control until hori-
zontal line trace extends over most of screen
center.
(5) Set focus and intensity controls for clear,
sharp trace.
(6) Calibrate oscilloscope screen as explained in
Section 4.6 and vertical gain control as ex-
plained in Section 4.7.
The “high” output leads of both the signal genera-
tor and audio oscillator must be provided with series
capacitors rated at 0.05 pf to prevent damage to the
instruments when they are connected into dc circuits.
5.11 TESTING AM SUPERHETS
A typical AM superheterodyne circuit with a
straight ac power supply is shown in Figure 5-18.
Various circuit points to which instruments will be
connected during the test have been numbered. The
following procedure is recommended for making the
dynamic test: '
(1) Switch-on receiver, detune its dial away from
any interfering carrier, and reduce settings
of rf and af gain controls to zero.
(2) Connect ground lead of signal generator to
point 2 (chassis ground).
(3) Connect vertical input terminals of oscillo-
scope to 20 and 21. Advance vertical gain
control about halfway. Horizontal straight-
line trace should not alter. If line becomes
badly rippled or toothed, hum or noise is
present in audio stages (V5 and/or V6) . Some
ripple usually will be observed with the best
of receivers, since ac power supplies do not
deliver entirely perfect dc. However, this
ripple should not exceed a reasonable
amount; that is, in a good receiver not more
than 1 screen division on the Sylvania Type
131 Three-Inch Oscilloscope, or more than
2 divisions on the Type 132 Oscilloscope,
when the vertical gain control is set to
maximum.
(4) Apply 400-cycle signal to 18 and 19. If
speaker cable is in good condition, several
complete cycles will appear on screen. Set
frequency and sync amplitude controls to
obtain four or five stationary cycles. Set verti-
cal gain control for pattern height of about
1‘2 inch.
(5) Connect ground lead of audio oscillator (if
used in Step 4) to 2.
(6) Apply 400-cycle signal to 17. Advance verti-
cal gain control, if necessary, to restore pat-
tern height. Read voltage output on cali-
brated oscilloscope screen. If current con-
tinuity is perfect, disappearance of pattern,
or distortion of sine wave shape, indicates
defective transformer T6.
(7) Apply 400-cycle signal to 16. Loss or distor-
tion of pattern indicates defective tube V,.
(8) Apply 400-cycle signal to 15. Loss of pattern
indicates open capacitor CA, or a coupling
lead open-circuit.
(9) Apply 400-cycle signal to 13. Slowly advance
af gain control, noting that sine-wave pattern
on screen increases in height as gain control
is advanced toward maximum. Loss of pattern
at this point indicates defective af gain control
potentiometer, open coupling capacitor C3,
or defective pentode section of tube V‘. (Do
not advance gain control to point where tops
of cycles begin to flatten off, indicating over-
loading of the 1st or 2nd audio stage, or
both.) Distortion of pattern indicates de-
fective tubes V, or V8, incorrect tube volt-
ages, or defective or improperly-sized re-
sistors or capacitors in V5 and V, circuits.
"IIIWIII‘WA ANTI/WWII
HUM HUM l:IrGENAL REGENERATION OVERLOADING SEVERE
RFER- V ’
ENCE OR 0 ERLOADING
NOISE
(A) (B) (C) (E) (F)
FIGURE 5— /7 COMMONL Y-ENCOUN TE RED PATTERNS SHOWING RECEIVER T ROUBL E S
4.5
Genera
ted o
n 2
01
4-0
2-1
6 0
4:3
4 G
MT /
htt
p:/
/hd
l.hand
le.n
et/
20
27
/mdp.3
90
15
02
10
72
56
9Public
Dom
ain
, G
oog
le-d
igit
ized
/
htt
p:/
/ww
w.h
ath
itru
st.o
rg/a
ccess
_use
#pd-g
oogle

“\mx QXSC. b§<$<xQ QQu‘ mK>\\Qn\ RSUQG .QSfiQIm. UEXQOQMRMItMQbm. .0? Q?“ Wmbbt
023010
w_mm<IO IH
_N @-
h-
ON 2 ._
X
e.
A E
nu
MPH
cm .
m nu
-
Q> one 525w 5:01
34
</\( so»: no
Ii
_ H III I
I I I 1328 53 a a
e> A
.
A m
4 )\/\/\
FDmFDO u a.
\IJOKhZOO 230 m4
/
Ty
L1.
*“LItl
* Al
u<km_|9>4|.wuc 02“ Fwo km-
“ _ 2361392
uZS o 4
mtuhqmr was» on. WW
ucnzw
\Irm_
46
Genera
ted o
n 2
01
4-0
2-1
6 0
4:5
3 G
MT /
htt
p:/
/hd
l.hand
le.n
et/
20
27
/mdp.3
90
15
02
10
72
56
9Public
Dom
ain
, G
oog
le-d
igit
ized
/
htt
p:/
/ww
w.h
ath
itru
st.o
rg/a
ccess
_use
#pd-g
oogle

(10)
(11)
(12)
(13)
(14)
(15)
(16)
(17)
(18)
(19)
(20)
Interrupt avc by connecting temporary
jumper from 13 to chassis.
Apply 400-cycle-modulated if signal to 12.
Adjust vertical gain control, if necessary, to
restore pattern height. Loss of pattern at this
point indicates defective diode section in
tube V.,, or defective components in 2nd de-
tector circuit.
Apply modulated if signal to 11 and adjust
trimmers of transformer T, for peak height
of pattern. Loss of pattern indicates defective
if transformer T5.
Apply modulated if signal to 10. Advance
rf gain control about halfway, and readjust
T, trimmers. Loss of pattern indicates de-
fective tube V,, absent or incorrect tube volt-
ages, or defective resistors or capacitors in
if circuit.
Apply modulated if signal to 9. Adjust trim-
mers of transformer T, for peak height of
pattern. Loss or distortion of pattern indi-
cates defective if transformer T,. If tops of
cycles on screen begin to flatten out, indicat-
ing overloading, reduce signal output of
generator, reduce setting of rf gain control,
or both.
Apply modulated if signal to 8. Readjust T,
trimmers. Readjust vertical gain control if
necessary. Loss of pattern indicates defective
tube V,; loss of, or incorrect tube voltages;
defective 1st detector circuit components; or
dead or misaligned oscillator V5.
Apply modulated 1000-kc signal to 7. Tune
receiver dial for peak pattern height at 1000
kc. Loss of pattern indicates defective de-
tector input transformer T8.
Apply modulated 1000-kc signal to 6. In-
crease in pattern height indicates voltage
gain of 2nd rf stage. Loss of pattern indicates
defective tube V,; loss of, or incorrect tube
voltages; or defective 2nd rf circuit com-
ponents.
Apply modulated 1000-kc signal to 5. In-
crease in pattern height indicates step-up
ratio of rf transformer T2. Loss of pattern
indicates defective transformer T2.
Apply modulated 1000-kc signal to 3. In-
crease in pattern height indicates voltage
gain of 1st rf stage. Loss of pattern indicates
defective tube V,; loss of, or incorrect tube
voltages; or defective 1st rf circuit com-
ponents.
Apply modulated 1000-kc signal to 1. In-
crease in pattern height indicates step-up
ratio of antenna input transformer T,. Loss
of pattern indicates defective transformer T1.
With signal generator still connected to point
1, set generator to 1500 kc and to 600 kc,
retune receiver to those frequencies, and
check overall alignment carefully, as ex-
plained in Section 6.1
Remove jumper from point 13, and check
avc action as instructed in Section 5.7.
5.12 TESTING FM RECEIVERS
The procedure for dynamic analysis of an FM re-
ceiver will be very much the same as just outlined
for an AM superheterodyne, except that a frequency
modulated signal generator must be employed. The
FM signal is applied to the rf, 1st detector (mixer),
if, and discriminator stages. A 400-cycle audio-fre-
quency signal is applied to the af stages for test, and
then removed before undertaking tests with the FM
signal. The oscilloscope must be synchronized at the
sweep rate of the generator, and its frequency controls
must be adjusted to give a screen image of several
cycles of the sweep generator frequency.
In the dynamic analysis of either AM or FM re-
ceivers, the pattern on the oscilloscope screen should
not become very noticeably distorted at any point in
the tests. If the preceding stage-by-stage procedure is
followed, such distortion can be traced to the stage
under test, where components may be replaced or
adjusted to correct the trouble.
5.13 TESTING POWER SUPPLIES
To check efl'ectiveness of the receiver power sup-
ply filter in removing ripple from the dc output volt-
age, follow this procedure: (1) With oscilloscope fre-
quency controls set to approximately 20 cycles, sync
switch to LINE FREQ, and other controls as recom-
mended in the 3rd paragraph in Section 5.10, connect
vertical input terminals to chassis ground and point
24. Connect a 0.25 pf, 600-volt capacitor in series with
the “high” vertical input terminal to protect oscillo-
scope from high dc voltage.
(2) Adjust vertical gain control for ripple pattern
height of about 11/2 inch.
(3) Transfer vertical input lead to 25, noting re-
duction of pattern height. If filter is very eIIcctive,
nearly all ripple will disappear at point 25 and origi-
nal horizontal straight-line trace will be resumed. If
little or no reduction in ripple pattern height is ob-
served as vertical input is transferred from 24 to 25,
filter is not operating elliciently, and filter choke and
capacitors should be inspected.
Further hum analysis steps are outlined in Chap-
ter 6.
(21)
(22)
47
Genera
ted o
n 2
01
4-0
2-1
6 0
4:5
4 G
MT /
htt
p:/
/hd
l.hand
le.n
et/
20
27
/mdp.3
90
15
02
10
72
56
9Public
Dom
ain
, G
oog
le-d
igit
ized
/
htt
p:/
/ww
w.h
ath
itru
st.o
rg/a
ccess
_use
#pd-g
oogle

CHAPTER VI
USE OF THE OSCILLOSCOPE IN
AUDIO AMPLIFIER TESTING
6.1 SIGNAL TRANSMISSION TEST
IN SINGLE AMPLIFIER STAGE
An oscilloscope may be used with an audio oscilla-
tor to determine if an af signal is transmitted by an
amplifier stage. By observing both input and output
signals on the oscilloscope screen, the serviceman can
note presence or absence of amplification. Also, dis-
tortion and outside modulation (introduced by hum,
noise, or oscillation in the amplifier stage) may be de-
tected. The single amplifier stage test is the basis of
the complete amplifier test, as will be seen later in
this chapter. However, the chief purpose of the trans-
mission test is to determine if the amplifier is work-
ing.
The setup of apparatus for making this test is shown
in Figure 6-1. Best results will he obtained with an
audio oscillator, such as the Sylvania Type 145, having
good sine wave output. A 0.1-pf fixed capacitor, C1.
is connected in series with the short, shielded oscilla-
tor output lead to protect the oscillator output trans-
former from dc voltages in the amplifier. Both oscil-
lator and oscilloscope “exploring” leads may be
terminated with clip-type test prods for quick con-
nection to the numbered circuit points.
The test is made in the following manner: (1)
Prepare oscilloscope for sine-wave patterns by setting
frequency controls to approximately 200 cycles, sync
switch to INTERNAL, sync amplitude control to one-
half maximum, horizontal gain control to give long
{\ ‘1 '10 NEXT AMPLIFIER STAGE 0R OUTPUT
FROM 6
PRECEDING
AMPLIFIER
STAGE
\l
I
If
c4 T0 8+
4-— ----- SHIELDED LEAD
/ OSCILLOSCOPE
VERTICAL INPUT TERMINAL '5
AUDIO OSCILLATOR
F/GUE’E 6'/ SETUP FOR S/G/VAL TRANSM/SS/O/V 7557 //V S/NGLE AUD/O AMPL/F/Ef? STAGE
Genera
ted o
n 2
01
4-0
2-1
6 0
4:5
4 G
MT /
htt
p:/
/hd
l.hand
le.n
et/
20
27
/mdp.3
90
15
02
10
72
56
9Public
Dom
ain
, G
oog
le-d
igit
ized
/
htt
p:/
/ww
w.h
ath
itru
st.o
rg/a
ccess
_use
#pd-g
oogle

horizontal line trace on screen, and vertical gain con-
trol to zero.
(2) Set audio oscillator to 1000 cycles. Set oscilla-
tor output control to zero.
(3) Couple oscillator, as shown in Figure 6-1, to
point 2. Connect oscilloscope also to point 2.
(4) Advance oscillator output control slightly to
trial setting.
(5) Advance vertical gain control (and oscillator
output control, if necessary) until sine wave pattern
has overall height of 2 screen divisions. Set frequency ‘
control for 5 complete cycles, and sync amplitude
control to lock image on screen.
(6) Transfer vertical input lead to point 3. Pattern
height should increase, indicating voltage gain of
tube. Sine wave should not become distorted.
(7) Transfer vertical input lead to point 4. Loss of
pattern indicates open capacitor C‘.
(8) With vertical input lead at point 4, transfer
oscillator to point 1. Loss of pattern indicates open
capacitor C2. 4
(9) With oscillator connected to point 1, vertical
input lead may be switched back and forth between
I and 4. Resulting difference in pattern height indi-
cates voltage gain of amplifier stage. If oscilloscope
screen and vertical gain control have been calibrated
(see Sections 4.6 and 4.7), corresponding gain may be
read directly as difference between input (point 1)
and output (point 4) voltages.
(10) At no step in this test should the waveform of
the output voltage look much different from the sine-
wave of the input voltage. Any change of the wave-
form itself indicates faulty transmission—either dis-
tortion, hum or noise. Distortion is discussed in Sec-
tion 7.4 and 7.5; bum in Section 7.3.
(11) The transmission test may be repeated at
other frequencies, such as 100, 500 and 10,000 cycles.
(12) The setup of apparatus for making a similar
check of an entire amplifier, rather than a single
audio stage, is shown in Figure 6-2.
6.2 MEASUREMENT OF VOLTAGE GAIN
As a sensitive ac voltmeter for voltage gain measure-
ments in an audio amplifier, the oscilloscope offers
the advantages of high input impedance, good fre-
quency response, wide voltage range, and the ability
to show waveform as well as amplitude of a voltage.
Voltage gain may be measured in a single amplifier
stage or through a complete multi-stage amplifier.
For voltage gain measurements, use the same ap-
paratus setup shown in Figure 6-1 or 6-2, and prepare
the oscilloscope according to the instructions given in
step 1 of Section 6.1. Calibrate the vertical gain con-
trol and the oscilloscope screen as outlined in Section
4.6 and 4.7.
Determination of Voltage Gain of a Single Stage:
(1) Connect oscillator and vertical input ter-
minals of oscilloscope to point 1 (see Figure
6-1).
Set oscillator to 400 cycles. Set oscillator out-
put control and vertical gain control for sine-
wave pattern with overall height of about 2
screen divisions. Set sync amplitude control
to lock image on screen. Record voltage, read
voltage from oscilloscope screen and vertical
gain control setting and record it as E.
Transfer vertical input lead to point 4.
Record new voltage, indicated by taller image
on screen, as E2.
(4) Determine voltage gain from the formula:
E2
E1
(5) Repeat measurement at as many frequencies
as desired.
Determination 0] Voltage Gain of Several Cascaded
Stages:
(1) Proceed as when checking gain of single
stage, except connect audio oscillator to in-
put of first stage.
(2)
(3)
V. G:
MAKE SEPARATE TESTS FOR VARIOUS SETTINGS OF GAIN AND
TONE CONTROLS IN AMPLIFIER
l
I
v
VERTICAL
INPUT TERMINALS
I
AMPLIFIER UNDER TEST \
4 c x
o ------------------- - -‘c>
AUDIO OSCILLATOR
‘ INPUT TERMINALS
Lourpur TERMINALS
OSCILLOSCOPE
FIGURE 6 '2 SETUP FOR TRANSM/SS/ON TEST 0N COMPLETE AUD/O AMPL/F/E/i’
49
Genera
ted o
n 2
01
4-0
2-1
6 0
4:5
4 G
MT /
htt
p:/
/hd
l.hand
le.n
et/
20
27
/mdp.3
90
15
02
10
72
56
9Public
Dom
ain
, G
oog
le-d
igit
ized
/
htt
p:/
/ww
w.h
ath
itru
st.o
rg/a
ccess
_use
#pd-g
oogle
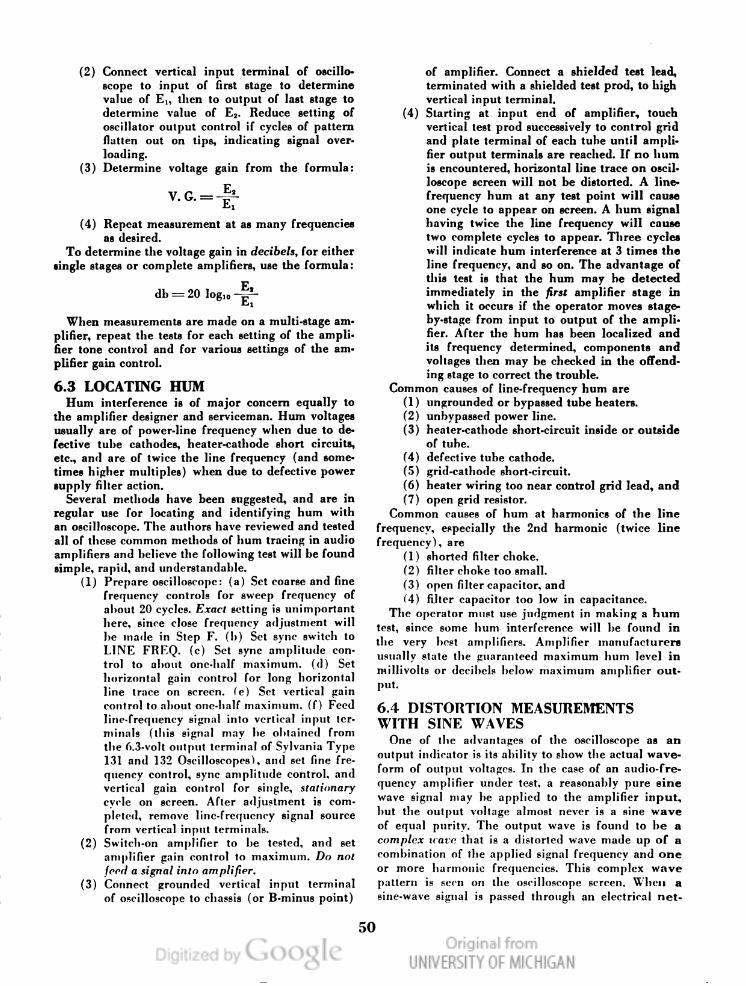
(2) Connect vertical input terminal of oscillo-
scope to input of first stage to determine
value of E1, then to output of last stage to
determine value of E2. Reduce setting of
oscillator output control if cycles of pattern
flatten out on tips, indicating signal over-
loading.
(3) Determine voltage gain from the formula:
_ E2
V. G. _ E1
(4) Repeat measurement at as many frequencies
as desired.
To determine the voltage gain in decibels, for either
single stages or complete amplifiers, use the formula:
E
db = loglo
When measurements are made on a multi-stage am-
plifier, repeat the tests for each setting of the ampli-
fier tone control and for various settings of the am-
plifier gain control.
6.3 LOCATING HUM
Hum interference is of major concern equally to
the amplifier designer and serviceman. Hum voltages
usually are of power-line frequency when due to de-
fective tube cathodes, heater-cathode short circuits,
etc., and are of twice the line frequency (and some-
times higher multiples) when due to defective power
supply filter action.
Several methods have been suggested, and are in
regular use for locating and identifying hum with
an oscilloscope. The authors have reviewed and tested
all of these common methods of hum tracing in audio
amplifiers and believe the following test will be found
simple, rapid, and understandable.
(1) Prepare oscilloscope: (a) Set coarse and fine
frequency controls for sweep frequency of
about 20 cycles. Exact setting is unimportant
here, since close frequency adjustment will
be made in Step F. (b) Set sync switch to
LINE FREQ. (0) Set sync amplitude con-
trol to about one-half maximum. ((1) Set
horizontal gain control for long horizontal
line trace on screen. (e) Set vertical gain
control to about one-half maximum. (f) Feed
line-frequency signal into vertical input ter-
minals (this signal may be obtained from
the 6.3-volt output terminal of Sylvania Type
131 and 132 Oscilloscopes), and set fine fre-
quency control, sync amplitude control, and
vertical gain control for single, stationary
cycle on screen. After adjustment is com-
pleted, remove line-frequency signal source
from vertical input terminals.
Switch-on amplifier to be tested, and set
amplifier gain control to maximum. Do not
feed a signal into amplifier.
Connect grounded vertical input terminal
of oscilloscope to chassis (or B-minus point)
(2)
(3)
of amplifier. Connect a shielded test lead,
terminated with a shielded test prod, to high
vertical input terminal.
Starting at input end of amplifier, touch
vertical test prod successively to control grid
and plate terminal of each tube until ampli-
fier output terminals are reached. If no hum
is encountered, horizontal line trace on oscil-
loscope screen will not be distorted. A line-
frequency hum at any test point will cause
one cycle to appear on screen. A hum signal
having twice the line frequency will cause
two complete cycles to appear. Three cycles
will indicate hum interference at 3 times the
line frequency, and so on. The advantage of
this test is that the hum may be detected
immediately in the first amplifier stage in
which it occurs if the operator moves stage-
by-stage from input to output of the ampli-
fier. After the bum has been localized and
its frequency determined, components and
voltages then may be checked in the ofi'end-
ing stage to correct the trouble.
Common causes of line-frequency hum are
(I) ungrounded or bypassed tube heaters.
(2) unbypassed power line.
(3) heater-cathode short-circuit inside or outside
of tube.
(4) defective tube cathode.
(5) grid-cathode short-circuit.
(6) heater wiring too near control grid lead, and
(7) open grid resistor.
Common causes of hum at harmonics of the line
frequency, especially the 2nd harmonic (twice line
frequency). are
(l) shorted filter choke.
(2) filter choke too small.
(3) open filter capacitor, and
(4) filter capacitor too low in capacitance.
The operator must use judgment in making a bum
test, since some bum interference will be found in
the very best amplifiers. Amplifier manufacturers
usually state the guaranteed maximum hum level in
millivolts or decibels below maximum amplifier out~
put.
6.4 DISTORTION MEASUREMENTS
WITH SINE WAVES
One of the advantages of the oscilloscope as an
output indicator is its ability to show the actual wave-
form of output voltages. In the case of an audio-fre-
quency amplifier under test, a reasonably pure sine
wave signal may be applied to the amplifier input,
but the output voltage almost never is a sine wave
of equal purity. The output wave is found to be a
complex wave that is a distorted wave made up of a
combination of the applied signal frequency and one
or more harmonic frequencies. This complex wave
pattern is seen on the oscilloscope screen. When a
sine-wave signal is passed through an electrical net-
(4)
50
Genera
ted o
n 2
01
4-0
2-1
6 0
4:5
4 G
MT /
htt
p:/
/hd
l.hand
le.n
et/
20
27
/mdp.3
90
15
02
10
72
56
9Public
Dom
ain
, G
oog
le-d
igit
ized
/
htt
p:/
/ww
w.h
ath
itru
st.o
rg/a
ccess
_use
#pd-g
oogle

WWFWULWM
SINE-WAVE LOW BIAS HIGH BIAS
INPUT SIGNAL
(A) (B) (O)
mmmm’I
PRONOUNCED
2ND HARMONIC
PRONOUNCED
3RD HARMONIC
(6) (HI
PRONOUNCED
4TH HARMONIC
O°/ APPROX. 25%
10% I
2ND HARMONIC 3RD HARMONIC 3RD HARMONIC
(D) (E) (F)
I
OVERLOADING PRONOUNCED
OF GRID JUST OVERLOADING
STARTING
(J)
(I) (K)
FIGURE 6 -3 FAN/L IAR DISTORTION PAT TE RNS OBTAINED IN AUDIO AMPLIFIER TE 5 TING
work which is not an amplifier, similar distortion
occurs.
Any measurement of the extent to which the output
waveform varies from the pure sine-wave input signal
is a distortion measurement. Distortion tests may be
performed on single amplifier stages or upon a com-
plete multi-stage amplifier.
Most amplifier servicemen will be concerned with
whether or not distortion is present at all, and to what
extent it is corrected by their repair operations. When
making distortion tests at any audio frequency, un-
distorted sine-wave signal is fed into the amplifier
input circuit, and the waveform of the output voltage
is examined by means of the oscilIOscope set for sta-
tionary sine-wave patterns and connected to the am-
plifier output terminals. Some of the output patterns
resulting from various sorts of distortion are given in
Figure 6-3.
The patterns shown in Figure 6-3 (B to K) are
typical of those usually encountered when a sine-
wave signal (Figure 6-3(A)) is fed into the amplifier
input terminals. In ordinary amplifier work, the 2nd,
3rd and 4th harmonics usually are the only distortion
components of concern to the serviceman. The old
harmonics (3rd, 5th, etc.) produce symmetrical dis-
tortion of the sine wave; that is, both positive and
negative peaks are altered so that one is a “mirror
image” of the other. (See E, F, H, J and K in Figure
6-3.) Even harmonics (2nd, 4th, etc.), on the other
hand, alter the sine wave asymmetrically, so that one
side of the waveform looks different from the other,
as shown in B, C, D and G in Figure 6-3.
Various other distortion patterns resembling those
shown in Figure 6-3 may be obtained in audio ampli-
fier tests. They may be more or less exaggerated than
those shown here, indicating more or less distortion
than that indicated by patterns in Figure 6-3. Also,
various phase changes acting upon the signal and its
harmonics as they pass through the amplifier under
test may alter these patterns somewhat from the
shapes given here. But, in general, the patterns given
in Figure 6-3 are typical and common and, when
thoroughly learned, will be of considerable service to
the amplifier serviceman.
6.5 DISTORTION MEASUREMENTS
WITH SQUARE WAVES
Square waves offer the serviceman a means whereby
the entire overall operation of an audio amplifier may
be known quickly and completely. The principle
underlying this test is simple: A square wave signal
(see Figure 6-5(A)) is applied to the input of the
amplifier under test. The output voltage delivered by
the amplifier then is examined with an oscilloscope.
If overall response of the amplifier is uniform and
efficient, a square wave output signal will be observed.
If the amplifier is not operating entirely efficiently,
the squareness of the output signal will be destroyed
in one way or another. Response of the amplifier may
be interpreted from the shape of the output wave.
Instruments required for this test are
(I) a square wave generator, and
(2) a complctc oscilloscope.
The setup of apparatus for the square wave test is
shown in Figure 6-4.
The square wave test is made in the following
manner:
(I) Set frequency control of square wave genera~
tor to the desired test frequency (60 cycles
will be a good initial frequency) and connect
51
Genera
ted o
n 2
01
4-0
2-1
6 0
4:5
4 G
MT /
htt
p:/
/hd
l.hand
le.n
et/
20
27
/mdp.3
90
15
02
10
72
56
9Public
Dom
ain
, G
oog
le-d
igit
ized
/
htt
p:/
/ww
w.h
ath
itru
st.o
rg/a
ccess
_use
#pd-g
oogle
VERTICAL INPUT
TERMINALS
\
INPUT OUTPUT \\
TERMINALS TERMINALS \
I \
\
l
I
I
I
©©
\
O \
O
SQUARE WAVE
GENERATOR OSCILLOSCOPE
AMPLIFIER UNDER TEST
FIGURE 6'4 SETUP FOR SQUARE-WAVE TESTING OF AUDIO AMPLIFIER
compare with patterns B to E in Figure 6-5,
for interpretation.
(5) Repeat tests at several square wave frequen-
cies and at various settings of amplifier gain
and tone controls.
generator output terminals to input termi-
nals of amplifier under test.
(2) Set oscilloscope frequency controls to fre-
quency of square wave generator. Set sync
control to INTERNAL, and sync amplitude
control to about 1/2 maximum. Set horizontal
gain control for long horizontal line trace. 6_6 CHECKING FREQUENCY RESPONSE
Set vertical gain control to zero. . _ _ _
(3) Connect vertical input terminals of oscillo_ In amplifier testing, especially 1n the absence of a
scope to amplifier output terminals_ square wave generator, it often is desirable to check
(4) Slowly increase settings of generator output the overall frequency response or a Single amplifier
control and vertical gain control for reasona. stage or of a complete amplifier. Instruments required
bly high pattern on oscilloscope screen, Set for this test are (l) a good-grade variable-frequency
oscilloscope frequency controls and sync am- sine-wave audio oscillator, such as the Sylvania Type
plitude control for several stationary “cycles” 145, and (2) a complete oscilloscope. The apparatus
on screen. Note appearance of pattern and setup is shown in Figure 6-6. The test procedure is to
REASONABLY FLAT OVERALL FREQUENCY
' W“ {\l/
SQUARE-WAVE MODERATELY SHARP
PRONOUNCED HIGH-FREQUENCY
INPUT SIGNAL PEAK AND LOW-FREQUENCY LOW-FREQUENCY CUTOFF.
CUTOFF SMALL HIGH- FREQUENCY
"sUMP‘
(A) (s) (0)
mm
FLAT OVERALL FREQUENCY RESPONSE,
RESPONSE,WITH GRADUAL FALLING OFF
AT LOW- FREQUENCY END AND SHARP
DROP AT HIGH- FREQUENCY EXTREME.
WITH NEGLIGIBLE DROP AT LOW-FRE-
QUENCY EXTREME AND SMALL EX-
TREME HIGH-FREQUENCY RISE.
(D) (E)
FIGURE 6'5 FAMILIAR RESPONSE PATTERNS OBTAINED IN SQUARE-WAVE TESTING OF
AUDIO AMPLIFIERS
Genera
ted o
n 2
01
4-0
2-1
6 0
4:5
4 G
MT /
htt
p:/
/hd
l.hand
le.n
et/
20
27
/mdp.3
90
15
02
10
72
56
9Public
Dom
ain
, G
oog
le-d
igit
ized
/
htt
p:/
/ww
w.h
ath
itru
st.o
rg/a
ccess
_use
#pd-g
oogle

measure the amplifier output voltage at a number of
frequencies throughout the audio-frequency range
using a constant value of signal voltage. The oscilla-
tor supplies the signal voltage, and the oscilloscope
is employed to check both input and output voltages.
The changeover switch permits switching of the high
vertical input terminal from input to output of the
amplifier to check these two voltages. If the oscillator
is known to have a constant voltage output a quick,
easy check can be made without the changeover switch
by running through the audio frequency band observ-
ing the change in the height of the trace. To make a
more careful check, the following procedure is sug-
gested:
(1) Prepare the oscilloscope:
(a) After calibrating screen and vertical
gain control (see Section 4.6 and 4.7),
set frequency controls to approximately
20 cycles;
(h) set horizontal gain control for long hori-
zontal line trace;
(0) set sync switch to INTERNAL;
((1) set sync amplitude control to 1/2 maxi-
mum, and
(e) set vertical gain control to zero.
(2) Switch-on amplifier, and set its gain control
to maximum and tone control to center or
“mellow” position.
(3) Set oscillator to 20 cycles.
(4)
(5)
(6)
(7)
(3)
(9)
(10)
Throw changeover switch to position A. Ad-
just oscillator output control and oscilloscope
vertical gain control for pattern height of
2 screen divisions.
Throw changeover switch to position B and
adjust amplifier gain control for convenient
pattern height. Do not touch oscillator out-
put control or oscilloscope vertical gain con-
trol. Read voltage from pattern height and
record this voltage against 20 cycles.
Set oscillator to 75 cycles. Throw changeover
switch to position A. Readjust oscillator out-
put control for 2-division pattern height.
Throw changeover switch to position B and
read output voltage, on oscilloscope screen,
for 75 cycles.
Repeat procedure at 100, 150, 200, 250, 300,
400, 500, 600, 700, 800, 900, 1000, 2000, 5000
and 10,000 cycles. At each new frequency,
reset signal voltage to same 2-division ampli-
tude by throwing changeover switch to posi-
tion A and adjusting oscillator output con-
trol.
Plot each output voltage value against corre-
sponding frequency, to obtain response curve.
For a complete inspection, plot several re-
sponse curves showing frequency response of
amplifier for each setting of tone control and
several settings of amplifier gain control.
CHA/NGEOVER SWITCH
AUDIO OSCILLATOR
/
/
VERTICAL INPUT
l
I, AMPLIFIER UNDER TEST I; TERMINALS
'NPUT OUTPUT oscILLoscoPE
TERMINALS TERMINALs
FIGURE 6‘6 SETUP FOR CHECKING FREQUENCY RESPONSE OF AUDIO AMPLIFIER
53
Genera
ted o
n 2
01
4-0
2-1
6 0
4:5
4 G
MT /
htt
p:/
/hd
l.hand
le.n
et/
20
27
/mdp.3
90
15
02
10
72
56
9Public
Dom
ain
, G
oog
le-d
igit
ized
/
htt
p:/
/ww
w.h
ath
itru
st.o
rg/a
ccess
_use
#pd-g
oogle

t
TONE %
CONTROL I
SPEAKER
[SHIELDED LEAD
AUDIO OSCILLATOR I, ,SHIELDED TEST PROD
( f I
J:—
.. —>
T0 TUBE HEATERS
VERTICAL /
INPUT I
E
TERMINALS
16W
a
\oIpFo 600 v CAPAGTOR
II
II
II
-—a
ON-OFF
c
I 2 4
INPUT
TERMINALS GAIN
CONTROL
0 %
POWER LINE
%
J.
FIGURE 6 '7 SETUP FOR SIGNAL TRACING (CHANNEL ANALYZING) IN
AUDIO AMPL IF IE R
OSCILLOSCOPE
17$
Genera
ted o
n 2
01
4-0
2-1
6 0
4:5
4 G
MT /
htt
p:/
/hd
l.hand
le.n
et/
20
27
/mdp.3
90
15
02
10
72
56
9Public
Dom
ain
, G
oog
le-d
igit
ized
/
htt
p:/
/ww
w.h
ath
itru
st.o
rg/a
ccess
_use
#pd-g
oogle

6.7 SIGNAL TRACING IN
AUDIO AMPLIFIER
Signal tracing is as important a dynamic test in
amplifier trouble shooting as in receiver testing. The
oscilloscope is unequaled as the indicating device in
amplifier signal tracing, since it shows not only pres-
ence or absence of the signal in each amplifier stage,
but shows quickly and simply the amplitude and
waveform of the signal as well.
The apparatus setup for amplifier signal tracing
is shown in Figure 6-7. A typical audio amplifier cir-
cuit is shown. Using this equipment, there are two
ways to trace signals through the amplifier. The first
method consists of permanently connecting the verti-
cal input terminals of the oscilloscope to the ampli-
fier output terminals, as shown in Figure 6-7, and
applying an audio signal successively to the various
amplifier stages, starting at the output stage and work-
ing back to the input stage. The second method con-
sists of connecting the audio oscillator permanently
to the amplifier input terminals and connecting the
vertical input terminals of the oscilloscope succes-
sively to various circuit points, starting at the input
stage and working forward progressively to the out-
put stage. Both methods accomplish the same result
and neither is recommended as superior to the other.
For purposes of explanation here, however, we have
chosen the first method. Consequently, the audio
oscillator is shown in Figure 6-7 provided with a
shielded output prod by means of which the audio
signal may be applied to the various numbered cir-
cuit points.
Prior to tracing the signal, prepare the oscilloscope
according to the instructions given in Step 1 in Sec-
tion 6.6, and set the audio oscillator to 1000 cycles.
Connect the apparatus as shown in Figure 6-7 and al-
low amplifier to warm up.
(I) Apply audio signal to point 8. Adjust oscilla-
tor output control and vertical gain control
for sine-wave pattern about 2 screen divisions
high. Set sync amplitude control to lock
(2)
(5)
(6)
(7)
(8)
(9)
pattern on screen. No pattern indicates de-
fective transformer T2.
Apply audio signal to 9. No pattern indicates
open lower half of primary transformer T2.
Apply audio signal to 6. Loss or distortion
of pattern indicates defective tube V,, loss
of tube voltages, incorrect voltages or defec-
tive cathode resistor.
Apply audio signal to 7. Loss or distortion
of pattern indicates defective tube V., loss of
tube voltages, incorrect voltages, or defective
cathode resistor.
Apply audio signal to 5. Increased pattern
height indicates step-up ratio of transformer
T1; decrease of pattern height indicates step-
down ratio. No increase indicates l-to-I ratio.
Run tone control through range to study its
operation. Loss of pattern indicates shorted
tone control capacitor or defective trans-
former T1.
Apply audio signal to 4. Run gain control
through range to determine if it is operating
properly (pattern height should increase as
gain control is advanced). Finally set gain
control for desirable pattern height. Loss of
pattern indicates defective tube V2, loss of
tube voltages, incorrect voltage, or defective
components in V2 circuit. Distortion of pat-
tern indicates incorrect tube voltages, or de-
fective or improperly-sized components in
V2 circuit.
Apply audio signal to 3. Loss of pattern in-
dicates open capacitor C2.
Apply audio signal to 2. Increased pattern
height indicates voltage gain supplied by
tube V1. Loss of pattern indicates defective
tube V1, loss of tube voltages, incorrect volt-
ages, or defective components in V1 circuit.
Distortion of pattern indicates defective tube
V1, incorrect tube voltages, or defective or
improperly-sized components in V1 circuit.
Apply audio signal to 1. Loss of pattern in-
dicates open capacitor C1.
55
Genera
ted o
n 2
01
4-0
2-1
6 0
4:5
5 G
MT /
htt
p:/
/hd
l.hand
le.n
et/
20
27
/mdp.3
90
15
02
10
72
56
9Public
Dom
ain
, G
oog
le-d
igit
ized
/
htt
p:/
/ww
w.h
ath
itru
st.o
rg/a
ccess
_use
#pd-g
oogle

CHAPTER VII
USE OF THE OSCILLOSCOPE IN
TRANSMITTER TESTING
7.1 MODULATION CHECKING
WITH WAVE PATTERNS
The cathode ray oscilloscope is particularly useful
for observing and measuring modulation percentage
of the amplitude modulated transmitters. In this ap-
plication, the oscilloscope is superior to modulation
monitors employing d’Arsonval meters, since the elec-
tron beam can follow the most rapid modulation
peaks without lag. Commercial and amateur trans-
mitters operating on any carrier frequency may be
checked. For modulation checking, either wave pat-
terns (see Figure 7-3) or trapezoidal pattern (see
Figure 7-4) may be employed.
Instrument connections for modulation checking
by means of wave patterns are shown in Figure 7-1.
Here, the direct vertical input must be employed. Do
not use the vertical amplifier, since it will not pass
the transmitter carrier frequency efficiently. The
linear sweep frequency is set to 50 or 100 cycles, sync
switch to INTERNAL. Horizontal gain control is set
for a long, horizontal line trace in the absence of an
applied carrier (see Figure 7-3(A) ). The sync ampli-
tude control is set to prevent drift of the modulation
pattern across the screen.
Figure 7-3 (C), (D) and (E) gives modulation pat-
terns for under-modulation and overmodulation, and
100% modulation. Figure 7-5(A) gives the method of
computing any modulation percentage from wave pat-
terns. F or modulation checking, a sine-wave audio
oscillator may be employed to modulate the trans-
mitter—or the operator may whistle a sustained note
into the microphone.
7.2 MODULATION CHECKING
WITH TRAPEZOIDAL PATTERNS
Figure 7-2 shows the apparatus setup and trans-
mitter connections for modulation checking by means
of trapezoidal patterns. Here, as in the preceding
method, the direct vertical input connection of the
oscilloscope is employed. Do not use the vertical am-
plifier. The linear sweep oscillator is switched-ofl' and
the vertical gain control set to zero.
Trapezoidal modulation patterns for under-modula-
tion, overmodulation and 100% modulation are
20R3 TURNS OF INSULATED HOOKUP
WnlRE, WOUND ON FORM (OR IN HANK)
3 IN DIAMETER AND PLACED WITHIN
IFOOT OF FINAL AMPLIFIER TANK COIL
I
I VERTICAL INPUT TERMINALS
/ USE DIRECT INPUT—NO
VERTICAL AMPLIFIER\\
TWISTED PAIR OR COAXIAL
(CONCENTRIC) CABLE ANY LENGTH
LINEAR SWEEP OSCILLATOR
SWITCHED'ON AND SET TO
APPROXIMATELY IOO CYCLES
EARTH GROUND-—~> : OSCILLOSCOPE
FIGURE 7-I OSCILLOSCOPE CONNECTIONS FOR WAVE -TYPE MODULATION PATTERNS
Genera
ted o
n 2
01
4-0
2-1
6 0
4:5
5 G
MT /
htt
p:/
/hd
l.hand
le.n
et/
20
27
/mdp.3
90
15
02
10
72
56
9Public
Dom
ain
, G
oog
le-d
igit
ized
/
htt
p:/
/ww
w.h
ath
itru
st.o
rg/a
ccess
_use
#pd-g
oogle

TO CLASS C
RF AMPLIFIER
2 0R 3 TURNS OF INSULATED
RESISTOR HOOKUP WIRE WOUND ON
FORM 3 INCHES IN DIAMETER
AND PLACED WITHIN I FOOT
MODULA'HON OF FINAL AMPLIFIER TANK
TRANSFORMER COIL“.
'— SECONDARY \\
I
HI-VOLTAGE I
EXTERNAL ,'
CONDENSER + H v ,'
I
I _Z PICK UP COIL COUPLED
03 | , 0‘ I,v/~ To TRANSMITTER
c E e ;
V RT I RESONATE TO 0R NEAR
I: I TRANSMITTER FREQUENCY
I \
SYLVANIA oscILLoscoPE TYPE I32 ----- - -+ DIRECT AMP XCAPAGITANCE VALUE DEPENDS UPON
FREQUENCY OF TRANSMITTER
REAR (so-250 UIJFD)
FIGURE 7’2 OSCILLOSCOPE CONNECTIONS TO TRANSMITTER FOR TRAPEZO/DAL MODULATION PATTERNS
CARRIER CARRIER
OFF ON,NO LESS THAN OVER- IOO%
MODULATION IOO% MODULATION MODULATION MODULATION
(A) (B) (0) (D) (E)
FIGURE 7'3 WAVE PATTERNS FOR MODULAIION CHECKING
CARRIER OFF CARRIER ON LESS THAN OVERMODULATION IOO%MODULATION
NO MODULATION IOO‘loMODULATION
(A) (B) (C) (D) (E)
FIGURE 7'4 TRAPEZO/DAL MODULATION PATTERNS
57
Genera
ted o
n 2
01
4-0
2-1
6 0
4:5
5 G
MT /
htt
p:/
/hd
l.hand
le.n
et/
20
27
/mdp.3
90
15
02
10
72
56
9Public
Dom
ain
, G
oog
le-d
igit
ized
/
htt
p:/
/ww
w.h
ath
itru
st.o
rg/a
ccess
_use
#pd-g
oogle

UNMODULATED KMODULATED CARRIER
CARRIER -‘- T-
_§_ , H, > “2 H2
INT ———— —-
_ - HORIZONTAL
; AXIS -
WAVE PATTERN TRAPEZOIDAL PATTERN
(A) (B)
Hz-HI
MODULATION PERGENTAGE=T x I00
PATTERN HEIGHTS Hl AND H2 MAY BE MEASURED IN INCHES,CENTIMETERS,OR SIMPLY
VERTICAL SCREEN DIVISIONS.
FIGURE 7'5 DETERMINATION OF MODULATION PERCENTAGE FROM OSCILLOSCOPE
PATTERNS
-- _ ~~~~~~ NAM—M—
MODULATOR OUTPUT LOW, REGENERATION IN R F STAGE, LOW GRID BIAS IN R F
MODULATOR MISMATCHED PLUS LOW A F OUTPUT OR STAGE, LOW EXCITATION,
To R F STAGE MODULATOR MISMATcI-I. 0R BOTH.
(A) (C)
__ _______ .....,|||||| ____ __ __
R F STAGE IMODULATEDI Low EXCITATION, Low BIAS, "DRIvEN" PARASITICS IN
INGOMPLETELY NEU- 0R BOTH IN HIGH—MU MODULATED R F STAGE.
TRALIZED. MODULATED R F STAGE.
(0) (E) (F)
FIGURE 7'6 TRAPEZO/DAL PATTERNS INDIGAT/NG VARIOUS TRANSMITTER FAULTS
W
CLEAN,UNMODULATED HUM MODULATION NOISE MODULATION
CARRIER
(A) (B) (0)
FIGURE 7'7 EXTRANEOUS MODULATION ON R F CARR/ER
58
Genera
ted o
n 2
01
4-0
2-1
6 0
4:5
5 G
MT /
htt
p:/
/hd
l.hand
le.n
et/
20
27
/mdp.3
90
15
02
10
72
56
9Public
Dom
ain
, G
oog
le-d
igit
ized
/
htt
p:/
/ww
w.h
ath
itru
st.o
rg/a
ccess
_use
#pd-g
oogle

shown in Figure 7-4. Figure 7-5(B) gives the method
of computing any modulation from trapezoidal pat-
terns. Figure 7-6 shows commonly-encountered trape-
zoidal modulation patterns indicating transmitter
troubles of various sorts.
7.3 DETECTING HUM AND NOISE
ON CARRIER
Hum or noise modulation may be detected on the
unmodulated carrier of a transmitter by means of
an oscilloscope set up as shoWn in Figure 7-1.
When the carrier is clean, that is, free of burn or
noise, the top and bottom edges of the “carrier only”
pattern (see Figure 7-7(A)) are flat, sharp and
straight. Hum modulation causes a sine-wave ripple
to appear on both top and bottom edges (Figure 7-7
(B) ). This ripple is usually low. Noise, usually arising
in the audio amplifier stages or produced by leaky
circuit components or intermittent opens or shorts
in any part of the transmitter, causes a ragged modu-
lation to appear on the top and bottom edges of the
pattern, as in Figure 7-7 (C) .
7.4- CHECKING CLASS-C LINEARITY
For best fidelity, the class C rf output amplifier in
an AM transmitter must have a linear plate charac-
teristic. That is, if the dc plate voltage of this stage
is doubled, the rf output voltage likewise should be
double.
This action may be checked with an oscilloscope
and the linearity of the final amplifier determined.
Set up the oscilloscope as shown in Figure 7-1. A
wide band pattern is obtained for the unmodulated
carrier (see Figure 7-7(A)). Measure the height of
this pattern (Figure 7-8). Double the dc plate volt-
age of the class-C final amplifier and measure the new
pattern height. For best linearity, the second height
will be exactly twice the first.
CARRIER HEIGHT CORRESPONDING
TO FIRST PLATE VOLTAGE
CARRIER HEIGHT CORRESPONDING TO
TWICE ORIGINAL PLATE VOLTAGE
In
_I'_
__ H2
H. AND H2 (HEIGHTS) MAY BE MEASURED IN INCHES, CENTIMETERS, OR
VERTICAL SCREEN DIVISIONS.
H
FOR GOOD LIN EARITY, H_2=2.
l
FIGURE 7'8 MEASUREMENT OF LINEAR/TY 0F CLASS-C R F AMPLIFIER FROM
OSCILLOSCOPE PATTERN
59
Genera
ted o
n 2
01
4-0
2-1
6 0
4:5
5 G
MT /
htt
p:/
/hd
l.hand
le.n
et/
20
27
/mdp.3
90
15
02
10
72
56
9Public
Dom
ain
, G
oog
le-d
igit
ized
/
htt
p:/
/ww
w.h
ath
itru
st.o
rg/a
ccess
_use
#pd-g
oogle

CHAPTER VIII
MISCELLANEOUS APPLICATIONS
8.1 FREQUENCY CHECKING
WITH CIRCULAR PATTERN
An oscilloscope and a calibrated variable-frequency
audio oscillator may be used with great accuracy for
the identification of unknown frequencies. Connection
of the instruments for frequency measurements are
shown in Figure 8-1. Patterns appearing on the screen
for various relationships between the unknown fre-
quency and the frequency setting of the audio oscil-
lator are shown in Figure 8-2.
In this application, the sweep oscillator in the
oscilloscope is switched off, and sync controls are set
at zero. The unknown frequency is applied to the
vertical input terminals, and the audio oscillator is
connected to the horizontal input terminals. When
the oscillator is adjusted exactly to the unknown fre-
quency, a single stationary circle or ellipse appears on
the screen (see Figure 8-2(A) ). When this pattern is
obtained, the unknown frequency may be read di-
rectly from the oscillator dial. Other frequency rela-
tionships are indicated by the patterns shown in
Figure 8-2(B) to (G).
8.2 FREQUENCY CHECKING
WITH SINE-WAVE PATTERN
If the oscilloscope is set up for sine-wave patterns,
a signal of unknown frequency may be applied to the
vertical input terminals and the internal linear sweep
oscillator frequency adjusted to give a single sta-
tionary cycle on the screen. If the fine frequency con-
trol of the oscilloscope has been calibrated before-
hand, the unknown frequency may be read at this
point from the setting of the fine frequency control.
Section 8.5 explains calibration of the fine frequency
control.
This method of frequency identification will be
found to be very convenient, but it does not offer
the accuracy of other methods outlined in Sections
8.1, 8.3 and 8.4. The inaccuracies of the system are
due largely to the fact that the sawtooth sweep oscil-
lator cannot be expected to possess the accuracy and
stability of an external sine-wave audio oscillator.
Also, adjustment of the sync amplitude control, neces-
sary to lock the image on the screen, inadvertently
shifts the frequency of the sweep oscillator.
8.3 FREQUENCY CHECKING
WITH OTHER PATTERNS
In the system of frequency identification described
in Section 8.1, when the ratio between unknown and
standard frequencies becomes high, counting the loops
of the pattern is difficult and apt to introduce inac-
curacies. This may be appreciated if the patterns
shown in Figure 8-2(D) and 8-2(G) are examined.
A system which is much easier to handle and pro-
TO SOURCE OF
UNKNOWN
FREQUENCY
OSCILLOSCOPE
HORIZONTAL
INPUT
TERMINALS
/
AUDIO
OSCILLATOR
FIGURE 8"! SETUP FOR CHECKING FREQUENCY BY MEANS OF CIRCULAR
(ELLIPTICAL) PATTERN
Genera
ted o
n 2
01
4-0
2-1
6 0
4:5
5 G
MT /
htt
p:/
/hd
l.hand
le.n
et/
20
27
/mdp.3
90
15
02
10
72
56
9Public
Dom
ain
, G
oog
le-d
igit
ized
/
htt
p:/
/ww
w.h
ath
itru
st.o
rg/a
ccess
_use
#pd-g
oogle

Fl =UNKNOWN FREQUENCY (VERTICAL PLATES)
|
|
C) 2
2
3
4
Fl “:2 Fl ’iFz Fl=%F2 I"Vii-2 Fl =2Fz
(It) (8) (C) (D) (E)
I F =KNOWN STANDARD FREQUENCY(HORIZONTAL PLATES)
2
l2 I 2 l
2 3 2 3 4
Fl =3F'2
(F) (6)
Fl “F2
FIGURE 8‘2 L/SSAJCUS PA TTERIKS‘ OBTAINED IN FREQUENCY CHECK, USINC APPARATUS
AND CIRCUIT SHOWN IN FIGURE 8"!
ductive of better accuracy employs gear-wheel pat-
terns, such as shown in Figure 84. Here, the operator
need only to count the small cycles, or gear teeth, in
the pattern to obtain the figure whereby the known
standard frequency must be multiplied to equal the
unknown frequency.
The instrument connections for comparing frequen-
cies by means of gear-wheel patterns are given in
Figure 8-3. The internal sweep oscillator of the oscil-
loscope is switched off for this test. The external ca-
pacitor and resistor form a phase-splitting network
which produces a circular pattern on the screen
(when no unknown signal is applied to the circuit),
provided the capacitor reactance equals the 5000-ohm
resistance—or an ellipse for all other reactance-resist-
ance relationships. When the unknown signal is ap-
plied, the circle of ellipse breaks up into cycles or
gear teeth. Figure 84(A) shows the toothed ellipse,
while Figure 8-4(B) and (C) show toothed circles.
The audio oscillator (see Figure 8'3) is employed
here as the source of standard, known signal fre-
quencies. The unknown signal is applied, and the
oscillator frequency dial is adjusted to obtain a sta-
tionary pattern on the screen. The unknown fre-
quency then may be determined by multiplying the
oscillator frequency by the number of teeth in the
pattern. If the number of teeth is too great for con-
venient counting, increase the oscillator frequency.
0.25 l [
AUDIO
OSCILLATOR “FD
(F2)
5000 .n.
VERTICAL , "
INPUT /
TERMINALS
X
OSCILLOSCOPE ,
HORIZONTAL ’
W»
.00... 35)
UNKNOWN SIGNAL
INPUT /’
TERMINAL
INPUT (Fl)
F/CURE 8—3 SETUP FOR COMPARING FREQUENCIES BY MEANS OF
GEAR—WHEEL PATTERNS
Genera
ted o
n 2
01
4-0
2-1
6 0
5:0
7 G
MT /
htt
p:/
/hd
l.hand
le.n
et/
20
27
/mdp.3
90
15
02
10
72
56
9Public
Dom
ain
, G
oog
le-d
igit
ized
/
htt
p:/
/ww
w.h
ath
itru
st.o
rg/a
ccess
_use
#pd-g
oogle
I 2
I2
ll
Io
f|=|3f
2 9
(A) 8
f|=UNKNOWN FREQUENCY f|=|2f2
f2=KNOWN STANDARD FREQUENCY (B)
4
l6 5
6
6 15 7
l4
7
'2 II IO
FREQUENCY RAJ)IO=I8 T02
(
FIGURE 8'4 GEAR-WHEEL FREQUENCY COMPARISON PATTERNS OBTAINED WITH CIRCUIT
SHOWN IN FIGURE 8'3
8.4 FREQUENCY CHECKING
WITH INTENSITY MODULATION
A variation of the system for comparing frequencies
described in Section 8.3 is the interesting spot-wheel
method. In this system, a spotted-wheel pattern (see
Figure 8-6) is obtained. To determine the unknown
frequency, the operator simply multiplies the known
standard oscillator frequency by the number of spots
counted around the circumference of the wheel.
The apparatus setup for the spot-wheel method is
shown in Figure 8-5. The internal sweep oscillator of
the oscilloscope is switched 05'. The oscilloscope must
have provision for intensity modulation of the elec-
tron beam. The Sylvania Oscilloscope Type 132 has
this feature, there being an intensity modulation in-
put jack on the rear panel of this instrument.
With the setup shown in Figure 8-5, a circle or
ellipse appears on the screen when no unknown signal
is applied. The pattern is a circle when the reactance
of the external 0.25-pf capacitor equals the 5000-ohm
resistance. The pattern is an ellipse for all other re-
actance-resistance relationships. When the unknown
signal is applied, the circle or ellipse is broken up
into spots or short lines, depending upon the wave-
form of the unknown signal. The minimum intensity
should be used in this application in order to empha-
size the spots and blanked-out segments. It is very
important that the unknown frequency voltage ap-
plied to the Z axis should not exceed 1- 2 v peak.
To determine the unknown frequency, multiply the
oscillator frequency by the number of spots or lines
counted around the wheel circumference. If the
number of spots or lines is too large for accurate
counting, or if it becomes difficult to “lock” the wheel
pattern, increase the oscillator frequency to obtain a
lesser number.
8.5 CALIBRATION OF FINE
FREQUENCY CONTROL
In order to use the frequency identification method
outlined in Section 8.2, it is necessary first to calibrate
AU OIO OSCIL LATOR TO INTENSITY
(F2) OSCIL LOSCOPE MOD. JACK
4 ON REAR
'.-.......~'-;.i.v.-a.-:.~.l~ia~1= am;- ;.‘.'~=I'I‘I‘:' “9 i / N E L
W" HORIZONTAL /
:{lwuflucmc \V IN PUT //
VERTICAL _ , TERMINALS,
lN ,_____ 5:?" 1,: I, /
TERMINALS 1 :-_ l/ I
\\ MET I +
\
\ O
" 0
SOURCE OF
UNKNOWN
500°“ FREQUENCY
(4])
FIGURE 8'5 SETUP FOR COMPARING FREQUENCIES BY MEANS OF
SPOT'WHEEL PATTERN
62
Genera
ted o
n 2
01
4-0
2-1
6 0
5:0
7 G
MT /
htt
p:/
/hd
l.hand
le.n
et/
20
27
/mdp.3
90
15
02
10
72
56
9Public
Dom
ain
, G
oog
le-d
igit
ized
/
htt
p:/
/ww
w.h
ath
itru
st.o
rg/a
ccess
_use
#pd-g
oogle

8/ \Jsrr
7/ \
6/ \l8
5 _ "9
I F - 29F2 ,20
4\ I
3\ , 2I
2\ / 22
'\\ 23
L_ , / 24
29 2827 2625
FI = UNKNOWN FREQUENCY
F = KNOWN STANDARD
FREQUENCY
FIGURE 8'6 SPOT-WHEEL PATTERN OBTAINED WITH CIRCUIT SHOWN IN FIGURE 8‘5
the fine frequency control of the oscilloscope for each
setting of the coarse frequency control.
This calibration may be made by means of an exter-
nal variable-frequency audio oscillator connected to the
vertical input terminals of the oscilloscope. The sync
switch is thrown to INTERNAL, sync amplitude con-
trol at about 3% maximum, and horizontal gain con-
trol set for wide image. For each setting of the coarse
frequency control, the fine frequency control must be
set successively to each of its dial readings and the
frequency discovered by varying the audio oscillator
frequency until a single, stationary cycle is seen on
the screen. At this point, the sweep oscillator (fine
frequency control) frequency may be determined by
reading directly from the audio oscillator dial. A
chart may be prepared to show the frequencies corre-
sponding to all settings of the fine frequency and
coarse frequency controls.
8.6 CHECKING PHASE RELATIONSHIPS
If two sine-wave alternating voltages which have
the same frequency are applied simultaneously to the
horizontal and vertical deflecting plates of the cathode
ray tube, the pattern seen on the screen will show the
phase relationship between the two voltages. The twa
voltages may be produced by separate devices, such
as two oscillators, or they may be taken from separate
points in the same circuit.
Figure 8-7 shows the simple arrangement of the
oscilloscope for phase tests. In this application do not
use either the horizontal or vertical amplifier, since
both oscilloscope amplifiers introduce some phase
shift. Use the DIRECT horizontal and vertical inputs.
Switch off the sweep oscillator during this test.
Figure 8-8 shows typical patterns seen on the screen
when two ac signals are compared. When both signals
have the same amplitude, the patterns are symmetri-
cal, as shown in Figure 8-8. But if the signal applied
to the vertical plates is the larger of the two, the pat-
tern will be stretched from top to bottom. Similarly,
if the signal applied to the horizontal plates is the
larger of the two, the pattern will be stretched from
side to side.
8.7 CHECKING PHASE INVERTER
ACTION
Figure 8-9 shows a typical phase inverter circuit in
an audio amplifier, with points A, B, and C labeled
for connection to an oscilloscope. The phase inverter
takes the place of a coupling transformer in the am-
TO VOLTAGE SOURCE NO. I <--—
TO GROUNDED f
OUTPUT TERMINAL <—|__ .
/
TO VOLTAGE SOURCE NO.2
—>TO GROUNDED
OUTPUT TERMINAL
/ \
COMMON ( GROUN D) TERMINALS
F/GURE 8'7 CONNECTIONS FOR PHASE CHECKING
Genera
ted o
n 2
01
4-0
2-1
6 0
5:0
7 G
MT /
htt
p:/
/hd
l.hand
le.n
et/
20
27
/mdp.3
90
15
02
10
72
56
9Public
Dom
ain
, G
oog
le-d
igit
ized
/
htt
p:/
/ww
w.h
ath
itru
st.o
rg/a
ccess
_use
#pd-g
oogle

PH AS E PHASE
DIFFERENCE DIFFERENCE DIFFERENCE DIFFERENCE DIFFERENCE
0° 45 ° 90° I35° l80°
(A) (B) (C) (D) (E)
FIGURE 8-8 TYPICAL PHASE - DIFFERENCE PA TTERNS
OUTPUT
AMPLIFIER
PHASE INVERTER
JII
FROM PRECEEDING AMPLIFIER STAGE I
ll
' l\
$s+
FIGURE 8-9 PHASE INVERTER, WITH CONNECTIONS FOR OSCILLOSCOPE
@
l-OHM I00-WATT
INPUT -
TERMINALS NONRQ'QPSUTQQVE
R
(9‘
VERTICAL AMPLIFIER
INPUT TERMINALS
FIGURE 8- IO CONNECTIONS FOR CURRENT MEASUREMENT
64‘
Genera
ted o
n 2
01
4-0
2-1
6 0
5:0
7 G
MT /
htt
p:/
/hd
l.hand
le.n
et/
20
27
/mdp.3
90
15
02
10
72
56
9Public
Dom
ain
, G
oog
le-d
igit
ized
/
htt
p:/
/ww
w.h
ath
itru
st.o
rg/a
ccess
_use
#pd-g
oogle

AUDIO OSCILLATOR
I
/
/
/
I
CONNECT UNKNOWN
IMPEDANCE HERE
/
CALIBRATED VARIABLE RESISTOR
WITH DIAL READING DIRECT IN OHMS
MAY BE LABORATORY DECADE BOX
/
/
/
I
©
@
A
—-o
CHANGEOVER SWITCH — +
LL,
,8
VERTICAL INPUT TERMINALS”
OSCILLOSCOPE
FIGURE 8'// SETUP FOR IMPEDANCE MEASUREMENT
plifier circuit. If it is working correctly, the grids of
the two output tubes are driven 180° out of phase,
with respect to each other, when a signal is applied
to the input terminals of the amplifier. To check
action of the phase inverter:
(1) Connect COMMON (GROUND) input ter-
minal of oscilloscope to point C.
(2) Connect VERTICAL input terminal to point
A
(3) Connect HORIZONTAL input to point B.
(4) Switch oscilloscope for DIRECT input to
both sets of deflecting plates. Do not use
horizontal and vertical amplifiers.
(5) Switch-off sweep oscillator in oscilloscope.
(6) Apply audio signal (400 or 1000 cycles) to
input terminals of amplifier and note pattern
on oscilloscope screen.
(7) When phase inverter is working correctly,
the 180° pattern shown in Figure 8-8(E)
will be obtained.
8.8 CURRENT MEASUREMENT
WITH OSCILLOSCOPE
Figure 8-10 shows the simple circuit for oscillo-
scopic measurement of alternating current (milli-
amperes and amperes). In this application, the oscil-
loscope is operated as a voltmeter to check the voltage
drop produced across a non-inductive resistor, R, by
I
I\ '
TEST PROD
\I
fil
ON-OFF
<3
A 0 POWER LINE
0.5 lIFO
HIGH-VOLTAGE
CAPACITOR
OSCILLOSCOPE
FIGURE 8-I2 ARRANGEMENT FOR TESTING POWER SUPPLY
65
Genera
ted o
n 2
01
4-0
2-1
6 0
5:0
9 G
MT /
htt
p:/
/hd
l.hand
le.n
et/
20
27
/mdp.3
90
15
02
10
72
56
9Public
Dom
ain
, G
oog
le-d
igit
ized
/
htt
p:/
/ww
w.h
ath
itru
st.o
rg/a
ccess
_use
#pd-g
oogle

the unknown current. The unknown current (I)
equals E/R, where E is the voltage shown by the
oscilloscope. If R is made 1 ohm, then I = E. When
the power rating of the resistor is 100 watts, up to
10 amperes may be measured. The oscilloscope screen
and vertical gain control must be calibrated for volt-
age according to the instructions given in Sections 4.6
and 4.7. When the circuit of Figure 8-10 is employed,
the current values may be read directly from the oscil-
loscope screen and vertical gain control setting.
8.9 IMPEDANCE MEASUREMENT
The apparatus setup for impedance measurements
is shown in Figure 8-11. This is a convenient arrange-
ment for measuring the impedance directly of such
components as coils, capacitors, speaker voice coils,
transformer windings, and combinations of resistance,
capacitance and inductance.
The calibrated variable resistor is provided with a
dial reading direct in ohms. If desired, this resistor
may be one or more laboratory decade resistance
boxes. The oscilloscope is set up for sine-wave pat-
terns or for a straight vertical-line trace. The oscillo-
scope functions as a high-impedance electronic ac
voltmeter which may be switched across the unknown
impedance when the changeover switch is in position
A, or across the known resistance when the switch is
in position B.
The unknown impedance is connected to the two
terminals so labeled in Figure 8-11. The changeover
switch is thrown to position B, a trial setting made of
the resistor, and the oscillator output control and
vertical gain control are adjusted for a pattern of
good height on the oscilloscope screen. The change-
over switch then is thrown to position A, noting
whether pattern height shifts. If height shifts, throw
switch back to B, reset the variable resistor to a new
value, and throw switch back to A. Without changing
the oscillator output or the setting of the vertical gain
control, work back and forth between positions A and
B of the changeover switch, carefully adjusting the
resistor until no change is noticed in the pattern
height as the switch is thrown back and forth. At that
point, the resistance equals the unknown impedance,
and the impedance value may be read directly from
the dial of the variable resistor.
With this arrangement, impedance may be checked
at any desired frequency within the range of the audio
oscillator simply by setting the oscillator beforehand
to the desired frequency. This is a particular advan-
tage, since some audio components have their im-
pedance values given for 400 cycles, while others are
rated at 1000 cycles.
8.10 AC POWER SUPPLY TESTS
The oscilloscope is extremely useful for measuring
peak voltages across filter capacitors in ac power sup-
ply units. A typical choke input-type power supply
is shown in Figure 8-12 with an oscilloscope arranged
for testing in this circuit. Waveform, as well as peak
amplitude, may be observed with this setup.
The oscilloscope is set for either sine-wave pattern
(if the operator is interested in waveform) or for
straight-line vertical trace. The screen and vertical
gain control must be calibrated in voltage (see Sec-
tions 4.6 and 4.7) with the external 0.5-pf dc blocking
capacitor in place.
The high vertical input terminal of the oscilloscope
must be provided with a well-insulated test prod for
connection to the various numbered circuit points.
When the prod is at point 1, oscilloscope shows wave-
form and amplitude of voltage at input of first filter
choke; at 2, waveform and amplitude of voltage across
first filter capacitor; at 3, waveform and amplitude of
voltage at output of second filter choke and across
second filter capacitor. Equal peak voltages should
be observed when the prod is touched alternately to
4 and 5. Any difference in amplitude indicates un-
balance between the two halves of the power trans-
former secondary winding.
Effectiveness of the filter sections can be noted by
observing the waveform at points 1, 2 and 3. In this
POWER SUPPLY FILTER
I j
FILTER CHOKE
E
- rims - A)
To NORMAL LOAD CIRCUIT
OF POWER SUPPLY
FILTER
+ I CAPACITORS
CI 02
FROM RECTIFIER
_ +
VERTICAL INPUT TERMINALS
RI R2
,,-—--s
OSCILLOSCOPE
FIGURE 6’ */3 CO/V/VE C TIONS F OR CHE CK/IVC R/PPLE CURRENT //V FILTER CAPACITORS
Genera
ted o
n 2
01
4-0
2-1
6 0
3:3
1 G
MT /
htt
p:/
/hd
l.hand
le.n
et/
20
27
/mdp.3
90
15
02
10
72
56
9Public
Dom
ain
, G
oog
le-d
igit
ized
/
htt
p:/
/ww
w.h
ath
itru
st.o
rg/a
ccess
_use
#pd-g
oogle

(I)
(A)
N
CHATTER“ /BOU CE
(2) (3)
(B)
F IQIRE 8-I4 AUTO RADIO VIBRATOR WAVE F ORMS,AS OBSERVED ON OSCILLOSCOPE SCREEN
way, defective chokes and/or capacitors may be
isolated.
8.11 CHECKING RIPPLE CURRENT
IN FILTER CAPACITORS
The peak value of ripple current in filter capacitors
is an important characteristic which must be checked
in any complete study of power supply behavior. The
oscilloscope is the best instrument to use for checking
peak capacitor current since it shows not only the
peak current value but also the wave shape of the
ripple current.
Figure 8-13 shows the connections which must be
made between a power supply and oscilloscope in
order to check capacitor peak current. Connect a
l-ohm resistor (see R1 and R2) in series with each
capacitor to be checked. Connect the vertical input
terminals of the oscilloscope across the resistor, as
shown in Figure 8-13.
Set the oscilloscope controls for voltage measure-
ments with sine-wave patterns, as described in Sec-
tion 4.4. Use the vertical amplifier of the oscilloscope
in this test. Read the peak voltage drop across the re-
sistor R1 or R2 (see Figure 8-13), by means of the
oscilloscope screen calibration and vertical gain con-
trol calibration.
To determine the peak current, this peak voltage
value must be divided by the resistance of R1 or R2.
But since the resistance is 1 ohm, no division is re-
quired. Thus, a peak voltage of 0.05 v across resistor
R, indicates a peak current of 0.05 ampere (50 milli-
amperes) flowing through capacitor C2. Similarly, a
peak voltage of 0.021 v across resistor R1 indicates a
peak current of 21 ma flowing through filter capaci-
tor Cl.
8.12 CHECKING PEAK CURRENT
IN RECTIFIERS
Peak current in rectifier tubes may be checked in
the same manner described in Section 8.11, except
that the l-ohm test resistor is connected in series with
the plate of the rectifier tube. Before attempting to
make this test, connect an external 0.5-pf capacitor
in series with each of the vertical input terminals of
the oscilloscope to protect the instrument from the
rectifier voltage, and make a voltage calibration of
the oscilloscope screen and vertical gain control with
these capacitors connected. Each capacitor must be
VERTICAL AMPLIFIER
INPUT TERMINALS
O O
H \I
O.25(J.lFD
|__l\
C
DC GENERATOR
OSCILLOSCOPE
FIGURE 8- I5 CONNE C TIONS FOR CHECKING RIPPL E OF DC GE NE RA TOR
Genera
ted o
n 2
01
4-0
2-1
6 0
3:3
1 G
MT /
htt
p:/
/hd
l.hand
le.n
et/
20
27
/mdp.3
90
15
02
10
72
56
9Public
Dom
ain
, G
oog
le-d
igit
ized
/
htt
p:/
/ww
w.h
ath
itru
st.o
rg/a
ccess
_use
#pd-g
oogle

NO RIPPLE NEGLICIBLE RIPPLE SEVERE RIPPLE
(A) (B) (C)
FIGURE 8-l6 GENERATOR RIPPLE PATTERNS
AUDIO OSCILLATOR RIDGE OUTPUT‘\
(BRIDGE GENERATOR) BTERMINALS \\
II II \
I\ , , /
\ A\ O 4” II
\\ l/ \ 0 III
\ _-(\ I)" ”
‘ 0 \Y/ C 1:,
O I C E
VERTICAL
BRIDGE 'NPUT
TERM'NALS 'OSCILLOSCCPE
HORIZONTAL INPUT TERMlNALS /
FIGURE 8'I7 CONNECTIONS FOR OSCILLOSCOPE AS BRIDGE NULL DETECTOR
(A) (B) (C) (D)
FIGURE 8-I8 NULL DETECTOR PATTERNS
68
Genera
ted o
n 2
01
4-0
2-1
6 0
3:1
7 G
MT /
htt
p:/
/hd
l.hand
le.n
et/
20
27
/mdp.3
90
15
02
10
72
56
9Public
Dom
ain
, G
oog
le-d
igit
ized
/
htt
p:/
/ww
w.h
ath
itru
st.o
rg/a
ccess
_use
#pd-g
oogle

0.0] FD
Q———-——|
MIXER
To RF “OJ
OSCILLATOR No. I
4— 00‘ 65J7
¢ PTO O.I w o" w
TO RF '
OSCILLATOR No.2
d—qosw o.IpFO
O.l
, ' IJFD
soon °" “FD / OSCILLOSCOPE
I
égov m; ‘ (VERTICAL INPUT TERMINALS
FIGURE 8 - 1.9 CONNECTIONS FOR FREQUENCY COMPARISON
rated at twice the ac voltage applied to the rectifier
tube. DANGER! DO NOT TOUCH THE METAL
CASE OF THE OSCILLOSCOPE OR ANY SWITCH
OR OTHER METALLIC DEVICE ATTACHED TO
THE CASE OR PANEL.
8.13 AUTO RADIO VIBRATOR TESTS
The cathode ray oscilloscope enables the radio
serviceman to observe auto radio vibrators while they
are in operation and, from these observations, to de-
termine faults in these units.
In order to make the vibrator test, the vertical in-
put terminals of the oscilloscope must be connected
across the entire primary of the auto radio power
supply. The receiver must be in operation, that is,
switched-on. The oscilloscope is set for sine-wave
patterns, sync switch thrown to INTERNAL, and sync
amplitude control advanced to lock image on screen.
Oscilloscope frequency controls are set to give a single
“cycle” on the screen. Several patterns observed with
vibrators in operation are shown in Figure 8-14.
Figure 8-14(A) is the correct waveform for a tube-
less, non-synchronous vibrator operating in the re-
ceiver and adjusted properly. Waveform (1) in figure
8-14(B) shows the small peaks on each half-cycle
caused by using too small a buffer capacitance. Wave-
form (2) in the same figure represents the same
vibrator operating with too small a capacitor, but
with the power supply load removed. Waveform (3)
shows the appearance of pattern resulting from a
vibrator in which considerable bounce and chatter
are present.
8.14 CHECKING DC GENERATOR
RIPPLE
The oscilloscope is invaluable for studying the
effectiveness or commutator and filter action in do
generators. When commutation and filtration are
efficient, little or no ripple is present in the output
voltage. The oscilloscope shows the actual ripple am-
plitude, as well as its presence.
Figure 8-15 shows connections for generator ripple
measurements. The generator is connected to the ver-
tical amplifier input terminals of the oscilloscope
through a 0.25-pf fixed capacitor rated at twice the
BEAT NOTE
(A)
ZERO BEAT
(B)
FIGURE 8-20 FREQUENCY COMFMRISON PATTERNS
69
Genera
ted o
n 2
01
4-0
2-1
6 0
3:0
5 G
MT /
htt
p:/
/hd
l.hand
le.n
et/
20
27
/mdp.3
90
15
02
10
72
56
9Public
Dom
ain
, G
oog
le-d
igit
ized
/
htt
p:/
/ww
w.h
ath
itru
st.o
rg/a
ccess
_use
#pd-g
oogle
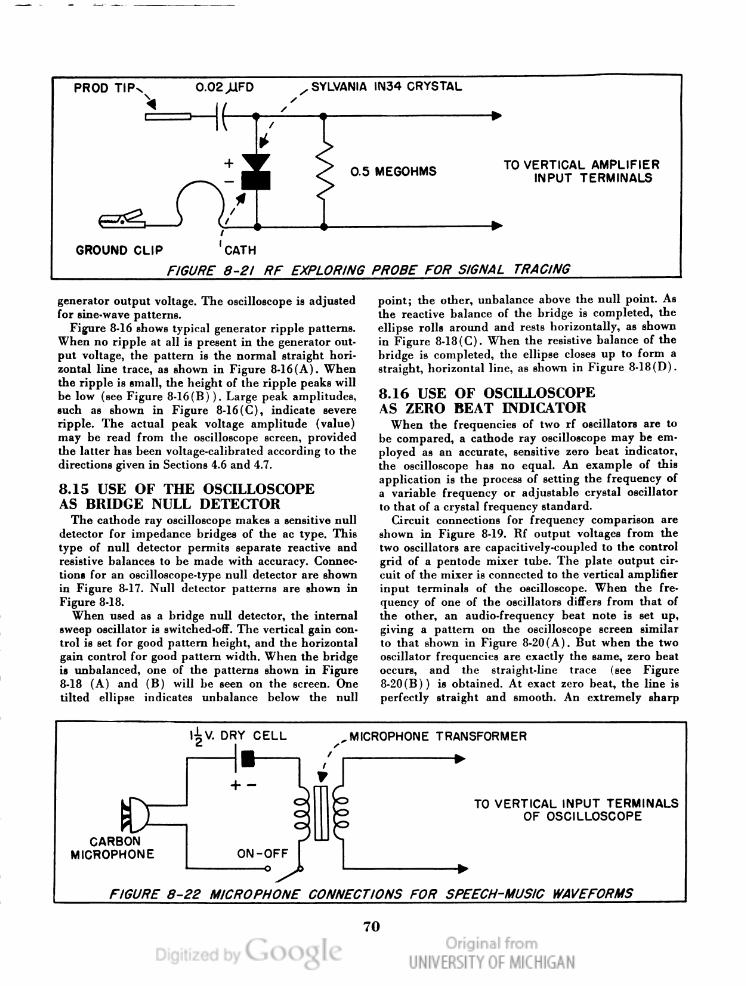
TO VERTICAL AMPLIFIER
INPUT TERMINALS
P
PROD TIP\\ 0.02 pm ,SYLVANIA IN34 CRYSTAL
Q I ,’
r \ I
l‘
+
0.5 meson-ms
fl
/
l
I
GROUND cup 'CATH
FIGURE 8-2/ RF EXPLOR/NG PROBE FOR SIGNAL TRACING
generator output voltage. The oscilloscope is adjusted
for sine-wave patterns.
Figure 8-16 shows typical generator ripple patterns.
When no ripple at all is present in the generator out-
put voltage, the pattern is the normal straight hori-
zontal line trace, as shown in Figure 8-16(A). When
the ripple is small, the height of the ripple peaks will
be low (see Figure 8-16(B) ). Large peak amplitudes,
such as shown in Figure 8-16(C), indicate severe
ripple. The actual peak voltage amplitude (value)
may be read from the oscilloscope screen, provided
the latter has been voltage-calibrated according to the
directions given in Sections 4.6 and 4.7.
8.15 USE OF THE OSCILLOSCOPE
AS BRIDGE NULL DETECTOR
The cathode ray oscilloscope makes a sensitive null
detector for impedance bridges of the ac type. This
type of null detector permits separate reactive and
resistive balances to be made with accuracy. Connec-
tions for an oscilloscope-type null detector are shown
in Figure 8-17. Null detector patterns are shown in
Figure 8-18.
When used as a bridge null detector, the internal
sweep oscillator is switched-off. The vertical gain con-
trol is set for good pattern height, and the horizontal
gain control for good pattern width. When the bridge
is unbalanced, one of the patterns shown in Figure
8-18 (A) and (B) will be seen on the screen. One
tilted ellipse indicates unbalance below the null
point; the other, unbalance above the null point. As
the reactive balance of the bridge is completed, the
ellipse rolls around and rests horizontally, as shown
in Figure 8-18(C). When the resistive balance of the
bridge is completed, the ellipse closes up to form a
straight, horizontal line, as shown in Figure 8-18(D) .
8.16 USE OF OSCILLOSCOPE
AS ZERO BEAT INDICATOR
When the frequencies of two If oscillators are to
be compared, a cathode ray oscilloscope may be em-
ployed as an accurate, sensitive zero beat indicator,
the oscilloscope has no equal. An example of this
application is the process of setting the frequency of
a variable frequency or adjustable crystal oscillator
to that of a crystal frequency standard.
Circuit connections for frequency comparison are
shown in Figure 8-19. Rf output voltages from the
two oscillators are capacitively-coupled to the control
grid of a pentode mixer tube. The plate output cir-
cuit of the mixer is connected to the vertical amplifier
input terminals of the oscilloscope. When' the fre-
quency of one of the oscillators difl'ers from that of
the other, an audio-frequency beat note is set up,
giving a pattern on the oscilloscope screen similar
to that shown in Figure 8-20(A). But when the two
oscillator frequencies are exactly the same, zero beat
occurs, and the straight-line trace (see Figure
8-20(B)) is obtained. At exact zero beat, the line is
perfectly straight and smooth. An extremely sharp
l-LV. DRY csu.
f_{
I
I
+ - iii-i
CARBON
MICROPHONE ON-OFF
-_-o
I, MICROPHONE TRANSFORM ER
TO VERTICAL INPUT TERMINALS
OF OSCILLOSCOPE
F IGURE 8—22 MICROPHONE CONNECTIONS FOR SPEECH-MUSIC WAVEFORMS
70
Genera
ted o
n 2
01
4-0
2-1
6 0
0:5
9 G
MT /
htt
p:/
/hd
l.hand
le.n
et/
20
27
/mdp.3
90
15
02
10
72
56
9Public
Dom
ain
, G
oog
le-d
igit
ized
/
htt
p:/
/ww
w.h
ath
itru
st.o
rg/a
ccess
_use
#pd-g
oogle

zero beat indication is obtained by adjusting one of
the oscillators for this straight-line pattern.
For the zero beat test, prepare the oscilloscope in
the following manner:
(1) Set coarse and fine frequency controls to ap-
proximately 100 cycles.
(2) Set sync switch to INTERNAL.
( 3) Set sync amplitude control at about 1/2 maxi-
mum.
(4) Set horizontal gain control for long straight-
line trace.
(5) Set vertical gain control for desired pattern
height when beat note pattern (Figure
8-20(A)) is obtained.
8.17 EXPLORING PROBE
FOR RF SIGNAL TRACING
When the oscilloscope is to be used to trace a radio-
frequency signal through a radio receiver circuit,
some form of peak diode rectifier probe must be used
ahead of the vertical amplifier. Figure 8-21 shows the
schematic of a crystal-type probe which is satisfactory
for this application and is useful well into the ultra-
high-frequency spectrum. All of the components of
the crystal probe may be fitted into the handle of a
large-size test prod.
When using the crystal probe and oscilloscope, ap-
ply a modulated rf signal to the antenna and ground
terminals of the receiver under test. Prepare the oscil-
loscope for sine-wave patterns, and set the coarse and
fine frequency controls for a sweep frequency equal
to 4 or 5 times the signal modulating frequency.
The ground clip of the probe is attached to the
receiver chassis (B-minus) and the prod tip is touched
successively to the input and output terminals of each
stage, working through the receiver from antenna to
loudspeaker. The signal will appear as a string of
cycles on the screen. Loss of the signal at any point
in the circuit will be indicated by a reduction to the
horizontal line trace. Amplification is indicated by
an increase in pattern height.
8.18 DEMONSTRATION OF
SPEECH WAVEFORMS
Speech or music waveforms may be shown directly
on the oscilloscope screen. For this purpose, a micro-
phone will be required. The Sylvania Type 132 Seven-
Inch Oscilloscope has sufficient vertical amplifier gain
to give speech and music patterns directly when a
diaphram-type crystal microphone is connected to
its vertical input terminals. Other oscilloscopes may
be used in this manner, with crystal microphones,
provided suflicient external pro-amplification is in-
troduced. A carbon microphone may be connected in
the manner shown in Figure 8-22. For reproduction
of waveforms directly from a radio receiver, connect
the vertical amplifier input terminals across the loud-
speaker voice coil.
When preparing to observe voice or music wave-
form patterns, set the sync switch in the oscilloscope
to INTERNAL, set sync amplitude control to about
1/2 maximum, set sweep oscillator frequency to about
75 cycles, and set horizontal gain control for long,
straight horizontal-line trace. While observing wave-
form patterns, set sync amplitude control to prevent
pattern from drifting across the screen, and set the
vertical gain control for the desired pattern height.
8.19 ELECTRONIC SWITCH
Occasionally, it is desirable to view two or more
separate signal voltage patterns simultaneously on the
oscilloscope screen. There is available for this purpose
an external instrument known as an electronic switch.
The two signals to be studied are applied to the sepa-
rate pairs of input terminals of the electronic switch.
The output of the electronic switch is connected to
the vertical input terminals of the oscilloscope. Action
of the instrument is to switch onto the oscilloscope
vertical input terminals quickly (by means of an elec-
tronic circuit) first a part of one signal and then a
part of the other. The two signals accordingly are
constructed on the screen in tiny segments or pieces,
but at such a high rate of speed and with such detail
that the eye sees two complete waveforms in proper
relation to each other.
This device enables the operator to study two or
more separate phenomena which are related to each
other. An example is the reproduction of an alternat-
ing voltage and corresponding alternating current so
as to show phase relation between the two.
71
Genera
ted o
n 2
01
4-0
2-1
6 0
0:5
9 G
MT /
htt
p:/
/hd
l.hand
le.n
et/
20
27
/mdp.3
90
15
02
10
72
56
9Public
Dom
ain
, G
oog
le-d
igit
ized
/
htt
p:/
/ww
w.h
ath
itru
st.o
rg/a
ccess
_use
#pd-g
oogle

Genera
ted o
n 2
01
4-0
2-1
6 0
0:5
9 G
MT /
htt
p:/
/hd
l.hand
le.n
et/
20
27
/mdp.3
90
15
02
10
72
56
9Public
Dom
ain
, G
oog
le-d
igit
ized
/
htt
p:/
/ww
w.h
ath
itru
st.o
rg/a
ccess
_use
#pd-g
oogle
Genera
ted o
n 2
01
4-0
2-1
6 0
0:5
9 G
MT /
htt
p:/
/hd
l.hand
le.n
et/
20
27
/mdp.3
90
15
02
10
72
56
9Public
Dom
ain
, G
oog
le-d
igit
ized
/
htt
p:/
/ww
w.h
ath
itru
st.o
rg/a
ccess
_use
#pd-g
oogle