Generalized phase behavior of cluster formation in colloidal dispersions with competing interactions
11
Generalized phase behavior of cluster formation in colloidal dispersions with competing interactions† P. Douglas Godfrin, a N ´ estor E. Valadez-P ´ erez, b Ramon Casta ˜ neda-Priego, b Norman J. Wagner * a and Yun Liu * ac Colloidal liquids interacting with short range attraction and long range repulsion, such as proposed for some protein solutions, have been found to exhibit novel states consisting of equilibrium particle clusters. Monte Carlo simulations are performed for two physically meaningful inter-particle potentials across a broad range of interaction parameters, temperatures and volume fractions to locate the conditions where clustered states are found. A corresponding states phase behavior is identified when normalized by the critical point of an appropriately selected reference attractive fluid. Clustered fluid states and cluster percolated states are found exclusively within the two phase region of the state diagram for a reference attractive fluid, confirming the underlying intrinsic relation between clustered states and bulk phase separation. Clustered and cluster percolated states consistently exhibit an intermediate range order peak in their structure factors with a magnitude above 2.7, leading to a semi-empirical rule for identifying clustered fluids in scattering experiments. Introduction Modern liquid state theory and colloid science employ computer simulations and the methods of statistical mechanics to quantitatively predict the phase behavior of a broad range of simple uids and colloidal dispersions with widely varying inter-particle interactions. This is critical for a priori design of materials with specic properties for functionality ranging from food products 1,2 to injectable biopharmaceuticals based on concentrated monoclonal antibody solutions. 3 Colloidal and molecular uids are oen accurately represented by a combi- nation of long range attraction and short range repulsion. 4,5 The basic understanding of such uids can be traced back to the work of van der Waals, 6 where the interplay between excluded volume and long-range attraction leads to gas–liquid critical points, and if the system is low in polydispersity, crystallization and a triple point. 7–9 More recently, the so matter community has focused attention on systems with an excluded volume with short-range attraction (SA) and long-range repulsion (LR), or SALR potentials. These systems are of particular interest as they can produce liquid states comprised of equilibrium clusters. 10–17 These complex potentials are pertinent to fundamental scien- tic research as well as many industrially relevant materials, such as protein solutions. Therefore, efforts are being made to understand the more complicated phase behavior arising from the interplay of both potential features. 12,13,18 In contrast to irreversible fractal aggregates, or ocs, clusters in an SALR system can be reversible aggregates with a preferred nite size. 18,19 Attraction induces particle aggregation, which continues until the cluster accrues a sufficiently strong repul- sion to prevent further growth. One important difference between ocs and these types of clusters is their lifetime. Floc size grows continuously in the reaction- or diffusion-limited regimes until forming a system spanning aggregate or settling out of solution. 20,21 In contrast, clusters in an SALR system can have a thermodynamically preferred size distribution and particles within the clusters have a nite rate of exchange with particles in the bulk. Recent experimental studies distinguish clusters as transient, dynamic, or permanent according to their dynamics. 22,23 Systems with an SALR potential exhibit a variety of distinct microstructural states. In addition to stable clustered uids, aggregation of such clusters have been reported as precursors or building blocks of gels. 11–15,24 Both simulations and theoretical calculations also indicate the possibility of forming Wigner crystals of mutually repulsive clusters at low temperature. 13,19 A a Center for Neutron Science, Department of Chemical and Biomolecular Engineering, University of Delaware, 150 Academy St, Newark, DE 19716, USA. E-mail: yun.liu@ nist.gov; [email protected] b Divisi´ on de Ciencias e Ingenier´ ıas, Universidad de Guanajuato, Loma del Bosque 103, 37150 Leon, Mexico c NIST Center for Neutron Science, National Institute of Standards and Technology, Gaithersburg, MD 20899, USA † Electronic supplementary information (ESI) available: Pertinent details of the results discussed throughout the text are provided for further understanding. All potentials are plotted together for comparing the relative range and strength of attraction and repulsion. Details of effective range of attraction calculations are shown along with corresponding reduced second virial coefficients for comparison with previous results. Finally, additional pertinent details are provided regarding of the effect of the range of repulsion on the applicability of the generalized state diagram. See DOI: 10.1039/c3sm53220h Cite this: Soft Matter, 2014, 10, 5061 Received 30th December 2013 Accepted 1st May 2014 DOI: 10.1039/c3sm53220h www.rsc.org/softmatter This journal is © The Royal Society of Chemistry 2014 Soft Matter, 2014, 10, 5061–5071 | 5061 Soft Matter PAPER Published on 08 May 2014. Downloaded by UNIVERISDAD DE GUANAJUATO on 26/06/2014 00:12:15. View Article Online View Journal | View Issue
Transcript of Generalized phase behavior of cluster formation in colloidal dispersions with competing interactions

Soft Matter
PAPER
Publ
ishe
d on
08
May
201
4. D
ownl
oade
d by
UN
IVE
RIS
DA
D D
E G
UA
NA
JUA
TO
on
26/0
6/20
14 0
0:12
:15.
View Article OnlineView Journal | View Issue
aCenter for Neutron Science, Department of
University of Delaware, 150 Academy St, N
nist.gov; [email protected] de Ciencias e Ingenierıas, Universid37150 Leon, MexicocNIST Center for Neutron Science, Nationa
Gaithersburg, MD 20899, USA
† Electronic supplementary informationresults discussed throughout the text arAll potentials are plotted together for comof attraction and repulsion. Details of effare shown along with corresponding rcomparison with previous results. Finprovided regarding of the effect of the rathe generalized state diagram. See DOI: 1
Cite this: Soft Matter, 2014, 10, 5061
Received 30th December 2013Accepted 1st May 2014
DOI: 10.1039/c3sm53220h
www.rsc.org/softmatter
This journal is © The Royal Society of C
Generalized phase behavior of cluster formation incolloidal dispersions with competing interactions†
P. Douglas Godfrin,a Nestor E. Valadez-Perez,b Ramon Castaneda-Priego,b
Norman J. Wagner*a and Yun Liu*ac
Colloidal liquids interactingwith short range attraction and long range repulsion, such as proposed for some
protein solutions, have been found to exhibit novel states consisting of equilibrium particle clusters. Monte
Carlo simulations are performed for two physically meaningful inter-particle potentials across a broad range
of interaction parameters, temperatures and volume fractions to locate the conditions where clustered
states are found. A corresponding states phase behavior is identified when normalized by the critical
point of an appropriately selected reference attractive fluid. Clustered fluid states and cluster percolated
states are found exclusively within the two phase region of the state diagram for a reference attractive
fluid, confirming the underlying intrinsic relation between clustered states and bulk phase separation.
Clustered and cluster percolated states consistently exhibit an intermediate range order peak in their
structure factors with a magnitude above 2.7, leading to a semi-empirical rule for identifying clustered
fluids in scattering experiments.
Introduction
Modern liquid state theory and colloid science employcomputer simulations and the methods of statistical mechanicsto quantitatively predict the phase behavior of a broad range ofsimple uids and colloidal dispersions with widely varyinginter-particle interactions. This is critical for a priori design ofmaterials with specic properties for functionality ranging fromfood products1,2 to injectable biopharmaceuticals based onconcentrated monoclonal antibody solutions.3 Colloidal andmolecular uids are oen accurately represented by a combi-nation of long range attraction and short range repulsion.4,5 Thebasic understanding of such uids can be traced back to thework of van der Waals,6 where the interplay between excludedvolume and long-range attraction leads to gas–liquid criticalpoints, and if the system is low in polydispersity, crystallization
Chemical and Biomolecular Engineering,
ewark, DE 19716, USA. E-mail: yun.liu@
ad de Guanajuato, Loma del Bosque 103,
l Institute of Standards and Technology,
(ESI) available: Pertinent details of thee provided for further understanding.paring the relative range and strengthective range of attraction calculationseduced second virial coefficients forally, additional pertinent details arenge of repulsion on the applicability of0.1039/c3sm53220h
hemistry 2014
and a triple point.7–9 More recently, the so matter communityhas focused attention on systems with an excluded volume withshort-range attraction (SA) and long-range repulsion (LR), orSALR potentials. These systems are of particular interest as theycan produce liquid states comprised of equilibrium clusters.10–17
These complex potentials are pertinent to fundamental scien-tic research as well as many industrially relevant materials,such as protein solutions. Therefore, efforts are being made tounderstand the more complicated phase behavior arising fromthe interplay of both potential features.12,13,18
In contrast to irreversible fractal aggregates, or ocs, clustersin an SALR system can be reversible aggregates with a preferrednite size.18,19 Attraction induces particle aggregation, whichcontinues until the cluster accrues a sufficiently strong repul-sion to prevent further growth. One important differencebetween ocs and these types of clusters is their lifetime. Flocsize grows continuously in the reaction- or diffusion-limitedregimes until forming a system spanning aggregate or settlingout of solution.20,21 In contrast, clusters in an SALR system canhave a thermodynamically preferred size distribution andparticles within the clusters have a nite rate of exchange withparticles in the bulk. Recent experimental studies distinguishclusters as transient, dynamic, or permanent according to theirdynamics.22,23
Systems with an SALR potential exhibit a variety of distinctmicrostructural states. In addition to stable clustered uids,aggregation of such clusters have been reported as precursors orbuilding blocks of gels.11–15,24 Both simulations and theoreticalcalculations also indicate the possibility of forming Wignercrystals of mutually repulsive clusters at low temperature.13,19 A
Soft Matter, 2014, 10, 5061–5071 | 5061

Soft Matter Paper
Publ
ishe
d on
08
May
201
4. D
ownl
oade
d by
UN
IVE
RIS
DA
D D
E G
UA
NA
JUA
TO
on
26/0
6/20
14 0
0:12
:15.
View Article Online
large variety of additional cluster-based arrested states have alsobeen reported in SALR systems with a very strong, very longrange repulsion.25 Recent work has corroborated these resultsby explicitly demonstrating a shi in the percolation transitionto smaller volume fractions with increasing strength of repul-sion.26 Note that the range of attraction has a strong effect onthe phase behavior of systems with competing interactions.Works focusing on systems with repulsion and long-rangedattraction, about the size of a particle diameter, displaydistinctly different phase transitions at low temperaturecompared to SALR systems.27–29 As the attractive range for mostcluster forming experimental systems is very short, unlessexplicitly mentioned, the discussion in the rest of the paper willonly focus on cases where the range of SA is around 10% of aparticle diameter or shorter.
Clarication of the phase behavior of clustering solutions isof signicant technological importance for biological materialsof varying complexity, ranging from model globular proteins totherapeutic monoclonal antibodies (mAbs). Recent experi-mental work with high concentration solutions of mAbs30–35 andglobular proteins, such as lysozyme,10,15–17,22,36 suggest extensiveformation of clusters in solution (not necessarily of a preferredsize). In particular, clustering of mAbs has been shown to have astrong effect on solution viscosity depending on the type ofclusters formed32,35 However, the fundamental issue of experi-mentally identifying clustered uids in protein solutions is stilldebated in literature,10,16,17,22,37–39 which further complicates thematter.
Early small angle X-ray and neutron scattering studies oflysozyme protein10,39 identied a unique peak at small scat-tering wave vectors, or q-values. This low-q peak was thought tobe due to cluster formation and hence, termed the “clusterpeak”.10 Simulations and integral equation theory calculationshave determined the dependence of the low-q peak position andmagnitude on SALR potential parameters.37,40,41 Cluster statesestimated in this way have been mapped onto a reducedtemperature–density phase diagram.15,42 However, recentexperimental studies17,23 and simulations24 have provided directevidence that low-q peaks are not necessarily a consequence ofclustering as envisioned in the earlier sense, but rather, are ageneral representation of the presence of intermediate rangeorder (IRO) in the uid. Hence, a low-q peak in the structurefactor is not an accurate indication of cluster formation and ismore accurately termed an IRO peak. Therefore, clustered uidstates in SALR systems based on this misidentication areinaccurate.24
This contribution builds upon a previous attempt to studythe phase behavior of SALR systems that provided state deni-tions and identied a possible link between the existence ofclustered uid states and the gas–liquid phase behavior of areference potential uid.24 In that work, clustered states werefound to exist in the two-phase region of the liquid state phasediagram of an appropriately dened reference uid withexcluded volume and a short range attraction. As the attractiveinteractions drive cluster formation, it is not surprising inhindsight that an appropriately dened reference attractivesystem can provide physical insight and quantitative guidance
5062 | Soft Matter, 2014, 10, 5061–5071
into the phase space occupied by various structural states of theSALR uid. However, the transition boundary from disperseduid states to clustered states was not precisely determined, butwas compared with the binodal line of the reference potentialuid. Here, by investigating a large number of state points and awide range of potential parameters including published litera-ture results, we conclusively demonstrate the broader generalityof this observation.
The concept of corresponding states in thermodynamics iswell understood for simple liquids that interact according to asimilar underlying interaction potential, such as the classicLeonard-Jones uid.43 However, the phase behavior of systemswith attractive interactions depends strongly on the range ofattraction such that corresponding states does not hold.8
However, when limiting the range of attraction to less than�10% of a particle diameter, an extended law of correspond-ing states (ELCS) for the structure and liquid–liquid binodalwas observed by Noro and Frenkel.44 It was found that theliquid structure and phase behavior is less sensitive to theexact shape of the potential than the total effective strength ofattraction. When represented in terms of the normalizedsecond virial coefficient, ELCS has been shown to accuratelyrepresent systems interacting by square well and attractiveYukawa potentials with short range attraction.45–47 Further,ELCS was recently shown to remain accurate for thesepotentials with a range of attraction as large as 25% of aparticle diameter.47 Therefore, the phase behavior of uidsinteracting with a potential composed only of the short rangeattractive component of a more complex SALR potential willalso reduce to a common corresponding states diagramaccording to ELCS. We propose that the generalized phasebehavior of these reference uids will provide context andphysical insight into cluster formation in SALR systems ingeneral, as suggested for a single SALR potential in our earlierwork.24
Here, we systematically investigate the transition from adispersed uid to a clustered uid by exploring more statepoints, broadening the space of potential parameters, andexamining the effect of different potential shapes, includingresults reported in literature. From these simulations, weconstruct a corresponding states diagram for a broad andrepresentative range of SALR potential systems. Simulations areperformed utilizing two functional forms of SALR interactionpotentials with varying parameters, temperature and volumefraction. We augment recent work by studying a system at atypical range of repulsion equivalent to roughly 2s.40,42,48,49 Acorresponding states diagram is found for the referenceattractive potentials and this is used to create a generalized statediagram for clustered uids. We have also summarized andincluded published results12,13,19 and show that they too areconsistent with our proposed generalized, corresponding statesphase diagram. Finally, the formation of clustered and clusterpercolated states is also shown to correlate well with themagnitude of the IRO peak magnitude as well as the averagecoordination number of particles in the uid, providing a new,semi-empirical method for identifying clustered uids directlyfrom scattering experiments.
This journal is © The Royal Society of Chemistry 2014

Paper Soft Matter
Publ
ishe
d on
08
May
201
4. D
ownl
oade
d by
UN
IVE
RIS
DA
D D
E G
UA
NA
JUA
TO
on
26/0
6/20
14 0
0:12
:15.
View Article Online
Simulation and analysis methodsSimulation protocol
Monte Carlo (MC) computer simulations50,51 consisting of 1728particles in the NVT ensemble within the one-phase region,employing periodic boundary conditions, are used to studyspherical particles with central force two-body interactions overa wide range of interaction parameters. Starting from a simplecubic lattice, each system is thermalized for 2 � 107 steps. Aerequilibration, thermodynamic and structural parameters wereaveraged over 4 � 104 independent congurations. The initialdisplacement distance of 0.1, where all distances are normal-ized by the particle diameter s, is dynamically adjusted tomaintain an acceptance ratio of 30%. The observables wereaveraged over 10 different seeds to reduce the intrinsic uncer-tainties. System size effects were also monitored in a few cases(data not shown), but in all cases N ¼ 1728 particles provided areasonable system size that allowed us to optimize thecomputational time.
Particles interact via an isotropic pairwise potential with acombination of short range attraction and long range repulsion.A representative potential of each type is shown in Fig. 1. Therst type, known as a hard sphere double Yukawa (HSDY)potential, represents attraction and repulsion with an expo-nential function:
UHSDYðrÞkT
¼N r\1�
1
T*ð1� lÞr��� e�z1ðr�1Þ þ le�z2ðr�1Þ� r$ 1
; (1)
where r is the reduced particle–particle separation, z1 is theinverse range of attraction, z2 is the inverse range of repulsion, lis the ratio of strength of repulsion to attraction, and T* is thereduced temperature that represents the relative strength ofthermal energy and the strength of attraction. Previous integral
Fig. 1 Representative HSDY and LJY interaction potentials are shownas solid lines (HSDY1 and LJY1 potentials from Table 1). Phase sepa-ration, indicated by the binodal, is calculated with respect to theattractive component of the potential (dotted line) termed the refer-ence attractive potential. The cut-off distances used to determineconnectivity is defined as the separation distance at which the mixedpotential has zero energy.
This journal is © The Royal Society of Chemistry 2014
equation theory calculations have demonstrated the formationof IRO peaks by this potential.40,42
We also consider a pairwise potential that combines a hardsphere component with the Leonard-Jones 2a–a form of shortrange attraction and Yukawa repulsion, called the Leonard-Jones–Yukawa (LJY) interaction potential:
ULJYðrÞkT
¼N r\1
1
T*
�4�r�2a � r�a
�þ Ax
re�r=x
�r$ 1
; (2)
where a is inversely related to the range of attraction, x is therange of repulsion, and A is the ratio of strength of repulsion tostrength of attraction. This potential has been previously shownto produce clustered and percolated states12,13 and is represen-tative of attractive interactions arising from dispersion forces.
Protein interactions originate from complex anisotropiccharge distributions, upon which the phase behavior is builtand has been captured by patchy colloidal models.52 While notcompletely representative, protein phase behavior has beensuccessfully modeled by effective isotropic interactions.47,53 Thetrue functional form of these effective interactions is debated inliterature.54,55 However, inter-protein interactions in lysozymesolutions have been accurately represented by both theHSDY22,36 and LJY15,16,56 potentials used in this work.
As a typical representation of the solution structure obtainedfrom scattering experiments, we calculate the radial distribu-tion function, g(r), and structure factor, S(q), for each state. Theradial distribution function is calculated by averaging allparticle congurations using direct summation according to:
gðrÞ ¼ V 2
n2
*Xn
i¼1
Xn
j¼1
dðrij � rÞV
+; (3)
using standard methods.50,51 Here, n is the number of particles,V is the sample volume, and d is the Dirac delta function.Restricting the calculation of eqn (3) to include only particlescontained in clusters, and explicitly accounting for each particlewithin the double summation, generates cluster–cluster corre-lations dened by gcc(r), the radial distribution function of clus-tered particles. This function represents the degree of orderbetween clusters and helps in distinguishing between structuralstates formed by SALR systems. The structure factor is calculatedaccording to its relationshipwith the radial distribution function:
SðqÞ ¼ 1þ r
ðN0
sinðqrÞqr
½gðrÞ � 1� 4pr2dr; (4)
where r is the solution density and q¼ (4p/l)sin(q/2) is the wavevector with the incident wavelength, l, and scattering angle, q,as parameters. Structure factors and radial distribution func-tions calculated from all simulations were found to quantita-tively agree with numerical calculations using athermodynamically self-consistent closure relation for theOrnstein–Zernike (OZ) equation.24,49
Reference potential liquid–liquid binodal calculation
A reference potential is dened for the HSDY and LJY potentialsas the purely attractive portion of each potential. These are
Soft Matter, 2014, 10, 5061–5071 | 5063
Soft Matter Paper
Publ
ishe
d on
08
May
201
4. D
ownl
oade
d by
UN
IVE
RIS
DA
D D
E G
UA
NA
JUA
TO
on
26/0
6/20
14 0
0:12
:15.
View Article Online
shown in Fig. 1 as dashed lines with their corresponding “full”potential. The reference potentials are dened for HSDYsystems as:
U refHSDYðrÞkT
¼
8>>><>>>:
N r\1�1
T*ð1� lÞr��� e�z1ðr�1Þ þ le�z2ðr�1Þ� 1# r# rc
0 r. rc
;
(5)
and for LJY systems as:
U refLJYðrÞkT
¼
8>>><>>>:
N r\1
1
T*
�4�r�2a � r�a
�þ Ax
re�r=x
�1# r# rc
0 r. rc
; (6)
where rc is the cut-off distance dened as the separation atwhich the potential produces a zero interaction energy.24 Forconsistency, this cut-off distance is also used to determineconnectivity. The interaction parameters and correspondingcut-off distance of each of the potentials studied in this work,including those of previous studies used for comparison, areprovided in Table 1.
Binodal lines representing liquid–liquid phase separationare generated by discrete perturbation theory (DPT)57–60 for thereference attractive potentials of each system in Table 1. DPTrepresents the interaction potential by numerous discretesquare well-like steps and is known to calculate accurate gas–liquid binodals and critical points of purely attractive systems.
State denitions
A particle is dened as part of a specic cluster when it is lessthan a distance rc from a neighboring particle. These calcula-tions distinguishing particle “species” are summarized by the
Table 1 The inverse range of attraction, inverse range of repulsion, therelative strength of repulsion to attraction, and the cut-off distance aregiven for the HSDY potentials (z1, z2, l, and rc respectively) and for theLJY potentials (a, 1/x, A, and rc respectively) represented in this work. Allpotentials plotted relative to each other can be found in the ESI
HSDY # z1 z2 l rc
HSDY 1 10 0.5 0.1 1.2424HSDY 2 11.3023 0.5 0.094515 1.2184HSDY 3 11.9279 0.5 0.092307 1.2085HSDY 4 8.134 0.5 0.2 1.2108HSDY 5 20 0.5 0.175 1.0894HSDY 6 5 0.5 0.2 1.357740HSDY 7 10 0.5 0.01 1.484740HSDY 8 10 0.5 0.05 1.3153
LJY # a 1/x A rc
LJY 1 16.6755 0.5 0.090982 1.2665LJY 2 32 0.5 0.17 1.100513LJY 3 100 0.5 0.2 1.028219LJY 4 100 0.5 0.05 1.043312LJY 5 18 2.0 8 1.1358
5064 | Soft Matter, 2014, 10, 5061–5071
cluster size distribution, n(s). We normalize the cluster sizedistribution by the cluster size, s, and system size, Np:
NðsÞ ¼�
s
Np
�nðsÞ; (7)
similar to that proposed by Stauffer61 and used by Chen et al.62
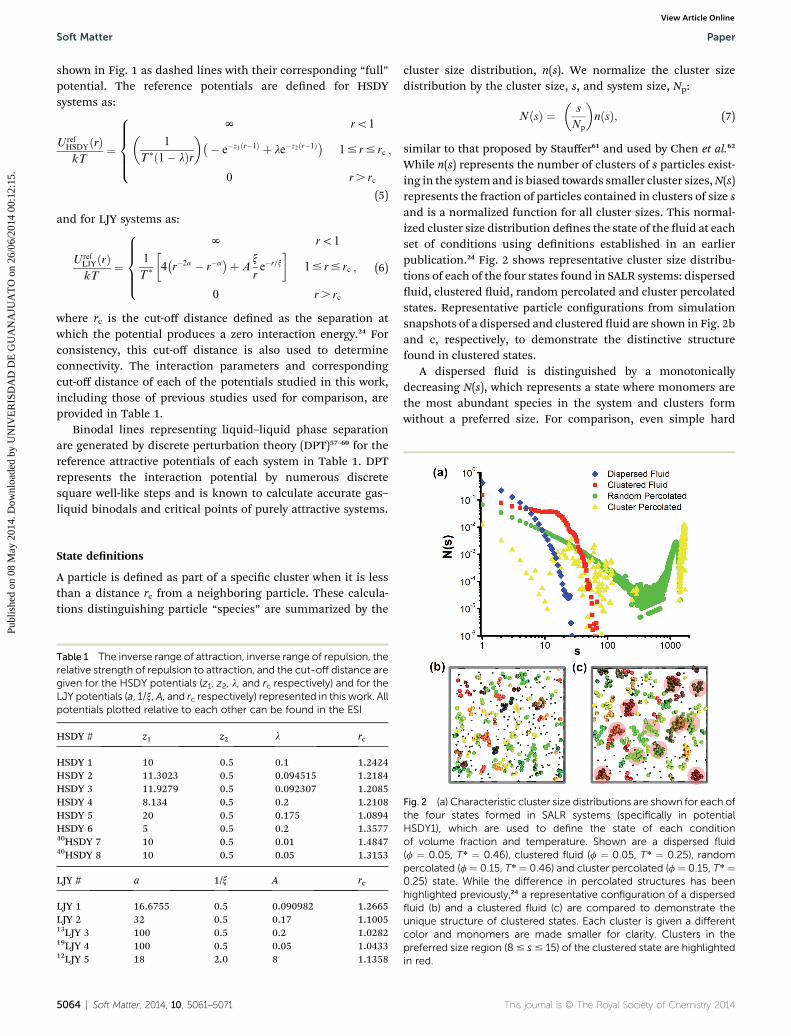
While n(s) represents the number of clusters of s particles exist-ing in the system and is biased towards smaller cluster sizes,N(s)represents the fraction of particles contained in clusters of size sand is a normalized function for all cluster sizes. This normal-ized cluster size distribution denes the state of the uid at eachset of conditions using denitions established in an earlierpublication.24 Fig. 2 shows representative cluster size distribu-tions of each of the four states found in SALR systems: disperseduid, clustered uid, random percolated and cluster percolatedstates. Representative particle congurations from simulationsnapshots of a dispersed and clustered uid are shown in Fig. 2band c, respectively, to demonstrate the distinctive structurefound in clustered states.
A dispersed uid is distinguished by a monotonicallydecreasing N(s), which represents a state where monomers arethe most abundant species in the system and clusters formwithout a preferred size. For comparison, even simple hard
Fig. 2 (a) Characteristic cluster size distributions are shown for each ofthe four states formed in SALR systems (specifically in potentialHSDY1), which are used to define the state of each conditionof volume fraction and temperature. Shown are a dispersed fluid(f ¼ 0.05, T* ¼ 0.46), clustered fluid (f ¼ 0.05, T* ¼ 0.25), randompercolated (f ¼ 0.15, T* ¼ 0.46) and cluster percolated (f ¼ 0.15, T* ¼0.25) state. While the difference in percolated structures has beenhighlighted previously,24 a representative configuration of a dispersedfluid (b) and a clustered fluid (c) are compared to demonstrate theunique structure of clustered states. Each cluster is given a differentcolor and monomers are made smaller for clarity. Clusters in thepreferred size region (8# s# 15) of the clustered state are highlightedin red.
This journal is © The Royal Society of Chemistry 2014

Fig. 3 (a) Binodals corresponding to the reference attractive poten-tials for 7 of the 13 SALR potentials studied in this work are plottedtogether. The inset displays the associated reference attractivepotential of each binodal with the same line color and style. (b) Binodallines of the reference attractive potential of all systems studied arenormalized by their respective critical points and shown to overlap.Three potentials (HSDY5, LJY3, and LJY4) do not overlap entirely;however, their state points still follow the trends shown in this work.
Paper Soft Matter
Publ
ishe
d on
08
May
201
4. D
ownl
oade
d by
UN
IVE
RIS
DA
D D
E G
UA
NA
JUA
TO
on
26/0
6/20
14 0
0:12
:15.
View Article Online
sphere uids show a similar monotonically decaying cluster sizedistribution at nite concentration.24 Note that many clusteredstates dened by previous studies, which have been dened byan average cluster size of 2 or greater15,63 or a large effectivehydrodynamic radius,17 will be labeled as dispersed uid statesunder this denition. Although dispersed uids are “monomer-dominated” they will still contain some clusters (as is evenobserved for hard sphere uids).
The formation of a local maximum in N(s) for s > 1 is used todene a clustered uid state. Under these conditions theensemble average contains a range of cluster sizes that areenergetically preferred over others. Unlike dispersed uids thatcontain contributions from all cluster sizes, clustered uidproperties are expected to be governed predominantly by clus-ters around the preferred size. This strict taxonomy, combinedwith an appropriate denition of rc, provides consistency andphysical signicance to the solution structure and its correla-tion with both the particle interactions and mechanical prop-erties of the material.
A prerequisite of gelled or glassy states is the formation ofpercolated clusters.64,65 Percolation is dened according to theconventional method when at least 50% of the sampledcongurations in the simulation trajectory contain a system-spanning cluster.66 Under these circumstances, the cluster iseffectively innite when applying periodic boundary conditions.Typical percolating uids exhibit a single peak in the N(s)comparable to the system size and these states are denoted asrandom percolated.67 Clustered states will also percolate uponconcentration and theirN(s) will exhibit both the cluster peak aswell as the system-size peak, as shown in Fig. 2a. This is adistinctly different structural state from percolation in thedispersed uid as there is a preferred size for the “buildingblocks” that comprise the percolation cluster. Further demar-cation of these two distinct percolated states can be accom-plished by analyzing their structural order as shown in aprevious study.24
In the following, between 5 and 15 state points are chosen foreach potential and associated with one of the four states(dispersed uid, clustered uid, random percolated or clusterpercolated). These states are then located on a correspondingstates phase diagram relative to the predicted binodal of acorresponding reference attractive uid.
Results and discussionGeneralized corresponding states diagram
Table 1 shows the potential parameters studied in this work.The choice of parameters is motivated by research that modelsphysically meaningful systems observed in experiments andalso overlap with potential parameters studied in literature.This range is extensive and covers many physically realizablesystems of interest to the protein, biopharmaceutical, nano-particle, and colloid communities.
As a representation of the diversity in interaction potentialsused in this study, a selection of reference attractive potentialsand their corresponding binodals are plotted together in Fig. 3a(only half are shown for the sake of clarity). Critical points are
This journal is © The Royal Society of Chemistry 2014
found to vary in volume fraction from roughly 0.2 to 0.4 whilecritical temperatures vary from about 0.15 to 0.55. In accor-dance with previous work,47 as the total attractive strengthdecreases, either by a smaller range or weaker strength ofattraction, the corresponding binodal has a smaller value of T*
c.However, potentials HSDY5 and LJY4 appear to deviate fromthis trend. If the range of attraction is too short, Asakura–Oosawa and attractive Yukawa potentials have been shownpreviously to bias the liquid branch of the binodal,47 as observedin Fig. 3a for potentials HSDY5 and LJY4.
The binodals of all reference attractive potentials are plottedtogether in Fig. 3b in a corresponding states plot by reducingthe temperature and volume fraction by the critical values.Excellent agreement is observed. The uncertainty is greatest inthe calculations for potentials HSDY5, LJY3, and LJY4, whichshow the largest deviations from the average behavior. DPTcalculations become more difficult for potentials with ranges ofattraction less than 1.1s, or less than 10%, and deviations fromexact behavior have been reported to be as large as 15%.60 Inwhat follows, the binodal of potential HSDY1 is used for refer-ence as representative of all these systems. The critical
Soft Matter, 2014, 10, 5061–5071 | 5065

Soft Matter Paper
Publ
ishe
d on
08
May
201
4. D
ownl
oade
d by
UN
IVE
RIS
DA
D D
E G
UA
NA
JUA
TO
on
26/0
6/20
14 0
0:12
:15.
View Article Online
behaviors of these reference uids are consistent with thosereported for square well45 and attractive Yukawa46 uids, shownin the ESI.†
Equilibrated uid structures are calculated for the potentialsgiven in Table 1 and the state points presented in Fig. 4. Fig. 4 isa master corresponding states diagram using the critical point(f, T*
c) of the reference attractive uid. Aer this normalizationthe four types of states are observed to lie in dened regions ofthe state diagram (distinguished by color) relative to the refer-ence attractive uid binodal. As might be expected, disperseduids and random percolated states lie above the binodal of thereference attractive uid at low and high volume fractions,respectively. Similarly, clustered uids and cluster percolatedstates lie within the two-phase region of the reference attractiveuid.
These results indicate that the binodal of a referenceattractive potential is an accurate indicator of the location ofclustered states and cluster percolated states in the phase spaceof SALR systems. This conrms our earlier observation andextends it to a much broader range of potential parameters. Theoverlap of the dispersed and clustered uid regions is repre-sentative of the uncertainty in the binodals calculated by DPT.In the absence of repulsion, below the reference binodal theuid would phase separate, which suggests cluster formation inthe presence of a long range inter-particle repulsion corre-sponds to a frustrated phase separation. The long range repul-sion provides a balancing force that prevents unboundedgrowth of clusters driven by a strong attractive driving force,resulting in clusters with a preferred size. Increasing volumefraction leads to the formation of more clusters of the preferredsize until they merge and percolate the system volume,
Fig. 4 Generalized phase diagram for clustered states. State points forthe interaction potentials studied in this work are combined withresults from ref. 13, 19, and 12 (orange, dark cyan, and grey points,respectively). The various potentials used are shown in the ESI† wherethe colors of the points correspond with the potential used in thosesimulations. Four distinct regions are found to exist when normalizedby their respective reference attractive potential critical points:dispersed (blue), clustered (red), random percolated (green), andcluster percolated (yellow). The clustered and cluster percolated statesexist only within the liquid–liquid phase separation region of thereference attractive potential indicating an arrested phase separationthat leads to states comprised of clusters of a preferred size.
5066 | Soft Matter, 2014, 10, 5061–5071
producing a percolated network with strong intermediate rangeorder. The observation of a corresponding states diagram forcluster uids provides an efficient and robust method for esti-mating the conditions of cluster formation for a wide range ofuids.
Heuristic models for identifying clustered states
All four of the state classications explored here have previouslybeen demonstrated to produce IRO peaks in simulations andscattering experiments. Therefore, these peaks in scatteringexperiments are in and of themselves insufficient to indicate theformation of clustered or cluster percolated states. However,previous literature reports indicate, but do not elaborate on, apossible correlation between the magnitude of IRO peaks andthe formation of clustered states as dened here (i.e., a peak inthe cluster size distribution).12,19 Such a correlation is logical asa high peak magnitude indicates greater structure in the uid,which would be expected if a preferred cluster size is evident.Fig. 5 shows the magnitude of the IRO peak for all statesexplored in this work. An IRO peak magnitude of �2.7 consis-tently identies a transition from dispersed uid and randompercolated states at smaller magnitudes to clustered uid andcluster percolated states at larger magnitudes, respectively.Fig. 5 also includes data from literature12,19 shown as open andhalf-lled systems that also follow this semi-empirical obser-vation. Correspondingly, experimental studies of lysozymeprotein solutions with a broad cluster size distribution, i.e., adispersed uid as dened here, indeed form IRO peaks whosemagnitude remain below 2.7.15
Fig. 5 also indicates that clustered and cluster percolatedstates can form IRO peaks with a magnitude of 10 or greater.According to the work of Hansen and Verlet,68,69 the evolution ofa peak in the structure factor with amagnitude greater than 2.85is indicative of a freezing transition. The formation of Wignercrystals in cluster uids has been demonstrated by proposedsimple models.19 Previous work has shown the empirical
Fig. 5 IRO peak magnitudes plotted against the reduced volumefraction. Clustered and cluster percolated states have a magnitudeabove an apparent critical magnitude of �2.7 while monomer andmonomer percolated states form IRO peaks with magnitudes belowthis value. Filled symbols are from this work, open symbols are takenfrom ref. 12, and half-filled symbols are from ref. 19.
This journal is © The Royal Society of Chemistry 2014

Paper Soft Matter
Publ
ishe
d on
08
May
201
4. D
ownl
oade
d by
UN
IVE
RIS
DA
D D
E G
UA
NA
JUA
TO
on
26/0
6/20
14 0
0:12
:15.
View Article Online
Hansen–Verlet criteria to accurately predict phase transitionsfor the HSDY interaction potential.70 However, this work alsodemonstrates that for short range attraction (z1 $ 8) as used inthe current simulations, these systems are expected to remainin a uid state. In agreement with these expectations, we nd noevidence of crystallization in our simulations, most likely due tothe degree of polydispersity of cluster sizes and shapes incluster percolated and clustered states.
Finally, we note another semi-empirical criterion for thetransition between states as given by the average particle coor-dination number, shown in Fig. 6. Specically, the transitionoccurs at an average coordination number of �2.4 from adispersed uid state to either a clustered state or randompercolated state. (Note that the transition coordination numberfrom a random percolated state to a cluster percolated state islarger than 2.4). This minimum coordination number has beenreported as a criterion for dynamically arrested states innumerous atomic systems71 and recently has also been observedin colloidal systems.65 Theory and experimental studies ofatomic glasses suggest that short range attractive uids require,on average, at least 2.4 neighbors in order to produce what isknown as “rigidity percolation.” This phase transition is basedtheoretically on the minimum number of neighbors or cagingelements required to restrict the degrees of freedom available toparticles in three dimensions.71 For systems that can be directlyimaged by optical microscopy, this criterion for the formationof clustered states will be more easily accessible than themagnitude of the IRO peak in scattering.
Although expected for random percolation, the applicabilityof this average bond number criterion to also predict clusteruid formation is unexpected. The formation of high magni-tude IRO peaks provides a possible clarication as to why thiscriterion holds. Such strong intermediate range order indicatesa large degree of localization that should inevitably hinder themotion of particles and clusters associated with caging. Due to
Fig. 6 Average coordination number hNi as a function of averagecluster size hsi. Clustered, random percolated, and cluster percolatedstates all exist above the “critical” value of hNi ¼ 2.4 necessary forrigidity percolated.73 Eqn (8), which shows the extent of local orderwithin clusters, separates dispersed fluids and random percolatedstates from clustered and cluster percolated states. Filled symbols arefrom this work and open symbols are taken from ref. 12.
This journal is © The Royal Society of Chemistry 2014
the long ranged nature of inter-particle and inter-clusterrepulsion, caging is possible over intermediate range ratherthan the particle length scale as found in glassy and percolatedstates for uids interacting only with short range attraction. Infact, by using mode-coupling theory, the formation of a clusterglass has been predicted when the magnitude of the IRO peak isvery large.72 Particles within a cluster are caged in the traditionalsense by many neighbors. Thus, clusters likely have locallyglassy structures (i.e., amorphous with limited mobility) that issustained by a minimum average coordination number.Neutron spin echo studies of lysozyme diffusivity appear tocorroborate this hypothesis.15,17,23 The observation that collec-tive diffusivity is q-independent at high q-values indicates thatthe dynamics are dominated by cluster diffusivity, suggestingthat local dynamics are slow and possibly glassy in nature.
Examining the clusters evident in our simulations, we ndan empirical relationship between the average cluster size andminimum average coordination number (i.e., number of near-est neighbors) required to form clustered states. This correla-tion, shown in Fig. 6, is based on all state points studied in thiswork as well as those from a previous study:12
hNi ¼ 1.5(ln hsi)0.5, (8)
where hNi is the average coordination number and hsi is theaverage cluster size. As clusters grow in size, more particles arecontained within the cluster, and thus have a higher coordi-nation number, as compared to those at the cluster surface orfree in solution. However, this minimum average coordinationnumber is indicative of the local order necessary for clusterformation to be energetically preferred. A larger coordinationnumber produces an enthalpic contribution to the free energythat compensates for the reduction in entropy in the compactstructure. The net free energy is thus lowered for cluster sizesaround the average, making them preferential to other sizedclusters.
As a measure of this minimum extent of local order, wecompare the average coordination number needed for clusterformation calculated by eqn (8) with that calculated numericallyfor spherical clusters of s particles with face-centered, body-centered, simple cubic and diamond cubic lattices (FCC, BCC,SC and DC, respectively). Based on the well-known packingfraction of each of these lattices (0.74, 0.68, 0.52 and 0.34,respectively) and the direct (non-linear) correlation betweencoordination number and volume fraction, we can estimate thelocal volume fraction of clusters formed in clustered states.Fig. 7a shows the trends in coordination number with clustersize for all four lattices explored as well as along the empiricalcluster line, eqn (8). Normalizing the cluster line by each of thefour crystal structures provides remarkably at lines, indicatinga consistent relationship between local packing fraction andcoordination number regardless of cluster size. These coordi-nation number ratios (Nclus/Ncrys) are plotted as a function of thedifference in volume fraction from the maximum possiblepacking (fFCC ¼ 0.74) in Fig. 7b to provide a linear t. Theequivalence point calculation produces an estimation of localvolume fraction for cluster formation at 0.38 � 0.04. Previous
Soft Matter, 2014, 10, 5061–5071 | 5067

Fig. 7 (a) The average coordination number as a function of clustersize is compared for the cluster transition represented by eqn (8) andspherical clusters with four different crystal lattices. All crystal structurecoordination numbers approach their bulk values in the limit of largeclusters. (b) Normalizing the cluster coordination number by that ofthe four crystal lattices produces constant values that are plotted as afunction of the corresponding crystal volume fraction relative tomaximum packing, which is the FCC lattice. The linear correlation isused to calculate the equivalence point of the coordination numbersand estimate the minimum volume fraction needed to form clusteredstates at 0.384 � 0.035.
Soft Matter Paper
Publ
ishe
d on
08
May
201
4. D
ownl
oade
d by
UN
IVE
RIS
DA
D D
E G
UA
NA
JUA
TO
on
26/0
6/20
14 0
0:12
:15.
View Article Online
experimental work by Campbell et al. provides a strikinglysimilar value for the local packing fraction of clusters of �0.42at all bulk volume fractions in which clustering was observed.11
Bomont et al. identied a possible signature of clusterformation as a jump in the excess entropy, sex, of SALR potentialsystems.48 However, the jump was associated with the initialpresence of an IRO peak rather than a peak in N(s), as used inthis work to dene clustered states. Their work utilized the sameparameters as potential HSDY1 employed here, which we showto form clustered states below the reference attractive binodal,or below a T*/T*
c of roughly 0.8 (T*c ¼ 0.328). The jump observed
in sex occurred at a T* of 0.688, far above the reference attractivebinodal. Therefore, this jump is likely a signature of the entropychange related to intermediate range order rather than explicitlywith the formation of clustered states. However, further study ofpossible thermodynamic signatures of cluster states wouldgreatly progress our understanding of these unique systems andour capability of experimentally identifying their formation.
5068 | Soft Matter, 2014, 10, 5061–5071
Role of long-range repulsion
During our study, we have xed the range of the repulsion to beabout 2s (z2 ¼ 0.5) and conclusively demonstrated the existenceof corresponding states of colloidal systems with an SALRpotential. If the range of repulsion becomes even longer ranged,SALR systems are expected to still favor the formation of nitesize clusters. We speculate that the proposed correspondingstates diagram will remain valid, though future works areneeded to demonstrate this. However, when the range ofrepulsion becomes shorter, the formation of small clusters maynot be energetically favorable. Thus, this could pose a limit ofour method to identify the cluster states having clusters with apreferred size.
Here, we explore the effect of the range of repulsion in theHSDY1 potential by studying one clustered state point with f ¼0.05 and T* ¼ 0.25. The full study of all state points is beyondthe scope of this paper and will be addressed in future works.The resultant states at this volume fraction and temperature areanalyzed as a function of the range of repulsion by varying z2both above and below the value of 0.5 originally used.
The variation of the repulsion range is performed whilemaintaining the reduced second virial coefficient of theattractive portion of the potential and the point of zero energy(i.e., the cut-off distance dening connectivity). This is accom-plished by also shiing the range of attraction, z1, and strengthof repulsion, l, which consequently varies the maximumstrength of repulsion. By maintaining constant B*
2c values, allthese new states share the same reference binodal. Whendecreasing the range of repulsion by increasing z2 above roughly0.8, the clustered states are observed to transition to disperseduid states as shown in Fig. S6 in the ESI.† Note that oursimulation results show that this state point remains in the onephase region below a z2 of roughly 2.5.
The disappearance of clustered states with signicantdecrease in the range of the repulsion is due to the fact thatsmall cluster formation is no longer energetically favorable.This can be estimated by some simple calculations as demon-strated in Fig. S5 in the ESI.† Following previous work,18,19 wecalculate the conguration energy per particle at the groundstate for a single cluster for a large set of HSDY interactionparameters. Conditions producing an energy minimum as afunction of cluster size are considered capable of producingclusters. As shown previously for an LJY potential,18 bothincreasing and decreasing the strength and range of repulsiontoo signicantly will destabilize the formation of clusters of apreferred size. Under the specic scenario where the strengthand range of repulsion are too small, insufficient repulsionexists to stabilize clusters to a nite size, leading to unstableaggregation. Therefore, above a z2 value of 0.8, clusters are notpreferred in this limit of innite dilution as shown in Fig. S6 inthe ESI.† At nite temperatures and volume fractions, entropiccontributions to the system free energy will only further desta-bilize cluster formation. Therefore, this simple model providesa limit of the generalized state diagram applicability.
Very interestingly, the transition from clustered to disperseduid states with decreasing range of repulsion also corresponds
This journal is © The Royal Society of Chemistry 2014

Paper Soft Matter
Publ
ishe
d on
08
May
201
4. D
ownl
oade
d by
UN
IVE
RIS
DA
D D
E G
UA
NA
JUA
TO
on
26/0
6/20
14 0
0:12
:15.
View Article Online
with a shi in IRO peak magnitudes below 2.7 and a shi inaverage coordination numbers below 2.4, shown in Fig. S8 inthe ESI.† Therefore, the semi-empirical observations of the IROpeak in the small angle scattering exceeding �2.7 in magnitudeand of the average coordination number exceeding 2.4 seem tobe very robust signatures of a clustered uid.
We also note that if the strength of the repulsion is very large,relatively short ranges of repulsion may still favor the formationof nite size clusters. Therefore, the upper limit of z2, abovewhich clusters with a preferred size no longer form, may shi tolarger values. Our preliminary study indicates that when l z 1,z2 could be larger than 1.6. Interestingly, even though there maynot be a cluster state with an optimal size when the range of therepulsion is too short, there is still an interesting phase regionsandwiched between the binodal lines of the reference potentialand the full SALR potential. There may be some other inter-esting properties of the solutions within this phase region thatcan also show the behavior of the generalized correspondingstates similar to what we have proposed here; however, this is asubject for future investigation.
Conclusions
The main conclusion of this work is the existence of a gener-alized corresponding states phase diagram for systems withphysically meaningful potentials comprised of excludedvolume with short range attraction and long range repulsion(SALR). Four distinct types of states are distinguished asdispersed uid, clustered uid, random percolated, and clusterpercolated states. Most signicantly, cluster uids are locatedwithin the binodal of the reference system and in the one-phase region of the HSDY system. This supports the intuitivenotion that cluster uids are what otherwise would be phaseseparated uids that are frustrated by the repulsive interac-tions. This work builds upon and further extends the extendedlaw of corresponding states as proposed for systems withexcluded volume and short range attraction by Noro andFrenkel44 to include this new and technologically importantstate of clustered uids.
The dening observation proven by direct simulation is thatthe phase behavior of a broad range of physically meaningfulSALR systems collapses onto a single state diagram whennormalized by the critical point of an appropriately denedreference system. The reference system's potential is comprisedof the excluded volume and short range attraction of the cor-responding SALR potential. Importantly, the liquid state bino-dals for these reference potentials are very similar and followthe extended law of corresponding states themselves.
All four types of states formed in SALR systems are found indistinct regions of the phase diagram. Of particular importanceis the separation of dispersed uid and random percolatedstates from clustered uid and cluster percolated states by thereference attractive binodal. As calculations of the binodal foruids with attractive potentials are inexpensive, this corre-sponding state diagram is a very efficient method for estimatingthe conditions conducive for cluster states. We also provideevidence that the reference attractive binodal is an accurate
This journal is © The Royal Society of Chemistry 2014
indication of cluster formation for physically meaningfulranges of repulsion.
A detailed analysis of the structure of clustered uidsprovides three semi-empirical criteria necessary for clusterformation in uids with SALR interactions. The magnitude ofthe IRO peak for clustered uids is $2.7. Further, the averagecoordination number at the transition from a dispersed uid toa clustered uid is observed to be 2.4, consistent with rigiditypercolation.65,73 Finally, the estimated local volume fraction forcluster formation is found to be 0.38 � 0.04 that is consistentwith literature results.11
These results demonstrating a generalized phase diagramfor cluster formation and the associated semi-empirical prop-erties of clustered uids offer substantial guidance for thefuture study of clustered states, which have become an impor-tant topic in numerous industries, such as biopharmaceuticals.In particular, these provide methods to rapidly estimate theconditions necessary for cluster formation as well as guidancefor identifying possible cluster uids by scattering andmicroscopy. Further, simulation and experimental studies ofcluster uid properties and dynamics will also be important forfurther understanding these intriguing, complex uids.
Acknowledgements
This manuscript was prepared under cooperative agreements70NANB12H239 and 70NANB10H256 from NIST, U.S. Depart-ment of Commerce. The statements, ndings, conclusions andrecommendations are those of the author(s) and do notnecessarily reect the view of NIST or the U.S. Department ofCommerce. This work has also been supported in part by NSF-Conacyt grant 147892/2011.
Notes and references
1 R. Mezzenga, P. Schurtenberger, A. Burbidge and M. Michel,Nat. Mater., 2005, 4, 729–740.
2 T. Gibaud, N. Mahmoudi, J. Oberdisse, P. Lindner,J. S. Pedersen, C. L. P. Oliveira, A. Stradner andP. Schurtenberger, Faraday Discuss., 2012, 158, 267.
3 E. J. Yearley, I. E. Zarraga, S. J. Shire, T. M. Scherer, Y. Gokarn,N. J. Wagner and Y. Liu, Biophys. J., 2013, 105, 720–731.
4 B. Derjaguin, Trans. Faraday Soc., 1940, 35, 203–215.5 E. J. W. Verwey and J. T. G. Overbeek, Theory of the stability oflyophobic colloids, Elsevier, 1948.
6 J. D. van der Waals, On the continuity of the gas and liquidstate, Ph.D. Thesis, Leiden University, 1873.
7 V. J. Anderson and H. N. W. Lekkerkerker, Nature, 2002, 416,811–815.
8 G. Foffi, G. McCullagh, A. Lawlor, E. Zaccarelli, K. Dawson,F. Sciortino, P. Tartaglia, D. Pini and G. Stell, Phys. Rev. E:Stat., Nonlinear, So Matter Phys., 2002, 65, 031407.
9 M. Miller and D. Frenkel, J. Chem. Phys., 2004, 121, 535.10 A. Stradner, H. Sedgwick, F. Cardinaux, W. C. K. Poon,
S. U. Egelhaaf and P. Schurtenberger, Nature, 2004, 432, 492.11 A. Campbell, V. Anderson, J. S. van Duijneveldt and
P. Bartlett, Phys. Rev. Lett., 2005, 94, 1.
Soft Matter, 2014, 10, 5061–5071 | 5069

Soft Matter Paper
Publ
ishe
d on
08
May
201
4. D
ownl
oade
d by
UN
IVE
RIS
DA
D D
E G
UA
NA
JUA
TO
on
26/0
6/20
14 0
0:12
:15.
View Article Online
12 F. Sciortino, P. Tartaglia and E. Zaccarelli, J. Phys. Chem. B,2005, 109, 21942.
13 J. C. F. Toledano, F. Sciortino and E. Zaccarelli, So Matter,2009, 5, 2390.
14 H. Sedgwick, S. U. Egelhaaf and W. C. K. Poon, J. Phys.:Condens. Matter, 2004, 16, S4913–S4922.
15 F. Cardinaux, E. Zaccarelli, A. Stradner, S. Bucciarelli,B. Farago, S. U. Egelhaaf, F. Sciortino andP. Schurtenberger, J. Phys. Chem. B, 2011, 115, 7227.
16 F. Cardinaux, A. Stradner, P. Schurtenberger, F. Sciortinoand E. Zaccarelli, Europhys. Lett., 2007, 77, 48004.
17 L. Porcar, P. Falus, W.-R. Chen, A. Faraone, E. Fratini,K. Hong, P. Baglioni and Y. Liu, J. Phys. Chem. Lett., 2010,1, 126.
18 S. Mossa, F. Sciortino, P. Tartaglia and E. Zaccarelli,Langmuir, 2004, 20, 10756–10763.
19 F. Sciortino, S. Mossa, E. Zaccarelli and P. Tartaglia, Phys.Rev. Lett., 2004, 93, 5.
20 P. Meakin, Phys. Rev. Lett., 1983, 51, 1119.21 M. Y. Lin, H. M. Lindsay, D. A. Weitz, R. C. Ball, R. Klein and
P. Meakin, Nature, 1989, 339, 360.22 Y. Liu, L. Porcar, J. Chen, W. Chen, P. Falus, A. Faraone,
E. Fratini, K. Hong and P. Baglioni, J. Phys. Chem. B, 2011,115, 7238.
23 P. Falus, L. Porcar, E. Fratini, W.-R. Chen, A. Faraone,K. Hong, P. Baglioni and Y. Liu, J. Phys.: Condens. Matter,2012, 24, 064114.
24 P. D. Godfrin, R. Castaneda-Priego, Y. Liu and N. J. Wagner,J. Chem. Phys., 2013, 139, 154904.
25 C. L. Klix, C. P. Royall and H. Tanaka, Phys. Rev. Lett., 2010,104, 165702.
26 N. E. Valadez-Perez, R. Castaneda-Priego and Y. Liu, RSCAdv., 2013, 3, 25110.
27 D. Pini, G. Jialin, A. Parola and L. Reatto, Chem. Phys. Lett.,2000, 327, 209–215.
28 A. J. Archer and N. Wilding, Phys. Rev. E: Stat., Nonlinear, SoMatter Phys., 2007, 76, 1–14.
29 A. Ciach, Mol. Phys., 2011, 109, 1101–1119.30 W. G. Lilyestrom, S. Yadav, S. J. Shire and T. M. Scherer,
J. Phys. Chem. B, 2013, 117, 6373–6384.31 I. E. Zarraga, R. Taing, J. Zarzar, J. Luoma, J. Hsiung and
A. Patel, J. Pharm. Sci., 2013, 102, 2538–2549.32 K. P. Johnston, J. A. Maynard, T. M. Truskett,
A. U. Borwankar, M. A. Miller, B. K. Wilson,A. K. Dinin, T. A. Khan and K. J. Kaczorowski, ACSNano, 2012, 6, 1357.
33 J. A. Pathak, R. R. Sologuren and R. Narwal, Biophys. J., 2013,104, 1–11.
34 A. U. Borwankar, A. K. Dinin, J. R. Laber, A. Twu,B. K. Wilson, J. a. Maynard, T. M. Truskett andK. P. Johnston, So Matter, 2013, 9, 1766.
35 E. J. Yearley, P. D. Godfrin, T. Perevozchikova, H. Zhang,P. Falus, L. Porcar, M. Nagao, J. Curtis, P. Gawande,R. Taing, I. E. Zarraga, N. J. Wagner and Y. Liu, Biophys. J.,2014, 106, 1763–1770.
36 S.-H. Chen, M. Broccio, Y. Liu, E. Fratini and P. Baglioni,J. Appl. Crystallogr., 2007, 40, s321–s326.
5070 | Soft Matter, 2014, 10, 5061–5071
37 Y. Liu, W.-R. Chen and S.-H. Chen, J. Chem. Phys., 2005, 122,44507.
38 A. Shukla, E. Mylonas, E. Di Cola, S. Finet, P. Timmins,T. Narayanan and D. I. Svergun, Proc. Natl. Acad. Sci.U. S. A., 2008, 105, 5075–5080.
39 A. Stradner, F. Cardinaux and P. Schurtenberger, J. Phys.Chem. B, 2006, 110, 21222–21231.
40 J.-M. Bomont, J.-L. Bretonnet and D. Costa, J. Chem. Phys.,2010, 132, 184508.
41 M. Broccio, D. Costa, Y. Liu and S.-H. Chen, J. Chem. Phys.,2006, 124, 084501.
42 D. Costa, C. Caccamo, J.-M. Bomont and J.-L. Bretonnet,Mol.Phys., 2011, 109, 2845–2853.
43 S. I. Sandler, Chemical, Biochemical, and EngineeringThermodynamics, 2006.
44 M. G. Noro and D. Frenkel, J. Chem. Phys., 2000, 113, 2941.45 J. Largo, M. A. Miller and F. Sciortino, J. Chem. Phys., 2008,
128, 134513.46 P. Orea, C. Tapia-Medina, D. Pini and A. Reiner, J. Chem.
Phys., 2010, 132, 114108.47 N. E. Valadez-Perez, A. L. Benavides, E. Scholl-Paschinger
and R. Castaneda-Priego, J. Chem. Phys., 2012, 137, 084905.48 J.-M. Bomont, J.-L. Bretonnet, D. Costa and J.-P. Hansen,
J. Chem. Phys., 2012, 137, 011101.49 J. M. Kim, R. Castaneda-Priego, Y. Liu and N. J. Wagner,
J. Chem. Phys., 2011, 134, 064904.50 D. Frenkel and B. Smit, Molecular Simulations: From
Algorithms to Applications, Academic Press, 2002.51 M. P. Allen and D. J. Tildesley, Computer Simulation of
Liquids, Oxford University Press, 1987.52 C. Gogelein, G. Nagele, R. Tuinier, T. Gibaud, A. Stradner
and P. Schurtenberger, J. Chem. Phys., 2008, 129, 085102.53 M. Muschol and F. Rosenberger, J. Chem. Phys., 1997, 107,
1953.54 A. Stradner, F. Cardinaux and P. Schurtenberger, Phys. Rev.
Lett., 2006, 96, 219801.55 Y. Liu, E. Fratini, P. Baglioni, W.-R. Chen, L. Porcar and
S.-H. Chen, Phys. Rev. Lett., 2006, 96, 219802.56 M. C. Abramo, C. Caccamo, D. Costa, G. Pellicane,
R. Ruberto and U. Wanderlingh, J. Chem. Phys., 2012, 136,035103.
57 A. L. Benavides and A. Gil-villegas, Mol. Phys., 1999, 97,1225–1232.
58 G. A. Chapela, F. del Rıo, A. L. Benavides and J. Alejandre,J. Chem. Phys., 2010, 133, 234107.
59 A. Vidales, A. L. Benavides and A. Gil-villegas, Mol. Phys.,2001, 99, 703–710.
60 J. Torres-Arenas, L. A. Cervantes, A. L. Benavides,G. A. Chapela and F. del Rıo, J. Chem. Phys., 2010, 132,034501.
61 D. Stauffer, Phys. Rep., 1979, 54, 1.62 S.-H. Chen, J. Rouch, F. Sciortino and P. Tartaglia, J. Phys.:
Condens. Matter, 1994, 6, 10855–10883.63 A. Malins, S. R. Williams, J. Eggers, H. Tanaka and
C. P. Royall, J. Non-Cryst. Solids, 2011, 357, 760.64 A. P. R. Eberle, N. J. Wagner and R. Castaneda-Priego, Phys.
Rev. Lett., 2011, 106, 1.
This journal is © The Royal Society of Chemistry 2014

Paper Soft Matter
Publ
ishe
d on
08
May
201
4. D
ownl
oade
d by
UN
IVE
RIS
DA
D D
E G
UA
NA
JUA
TO
on
26/0
6/20
14 0
0:12
:15.
View Article Online
65 N. E. Valadez-Perez, Y. Liu, A. P. R. Eberle, N. J. Wagner andR. Castaneda-Priego, Phys. Rev. E: Stat., Nonlinear, SoMatterPhys., 2013, 88, 060302(R).
66 N. A. Seaton and E. D. Glandt, J. Chem. Phys., 1987, 86, 4668.67 L. V. Woodcock, AIChE J., 2012, 58, 1610.68 K. Kremer, M. O. Robbins and G. S. Grest, Phys. Rev. Lett.,
1986, 57, 2694.
This journal is © The Royal Society of Chemistry 2014
69 J.-P. Hansen and L. Verlet, Phys. Rev., 1969, 184, 151–161.70 L. L. Lee, M. C. Hara, S. J. Simon, F. S. Ramos, A. J. Winkle
and J.-M. Bomont, J. Chem. Phys., 2010, 132, 074505.71 J. C. Phillips, J. Non-Cryst. Solids, 1979, 34, 153–181.72 J. Wu, Y. Liu, W.-R. Chen, J. Cao and S.-H. Chen, Phys. Rev. E:
Stat., Nonlinear, So Matter Phys., 2004, 70, 3–6.73 H. He and M. Thorpe, Phys. Rev. Lett., 1985, 54, 2107–2110.
Soft Matter, 2014, 10, 5061–5071 | 5071