Gender Inequalities in Education and Its Effect on Health of Women and Child
18
Gender Inequalities in Education and Its Effect on Health of Women and Child: Md. Tarique & Sana Samreen 673 International Journal of Research (IJR) Vol-1, Issue-4, May 2014 ISSN 2348-6848 Gender Inequalities in Education and Its Effect on Health of Women and Child Md. Tarique 1 & Sana Samreen 2 Abstract: In India the condition of women was appalling during independence. The deprivation of women in getting the similar level of opportunities relating to education, health, decision making as men due to prevalence of patriarchal society and socioeconomic backwardness in India put women at a backstage. After independence Indian planners and policy makers recognized the problem and framed variety of policies and programs to provide women equal status as men. But since after six decades of Indian planning after making various efforts Indian women are still at a backstage than men on various aspects specifically health and educational opportunities. Under this backdrop, this paper tries to evaluate the status and position of women in India in the light of some important gender –related as well as health related indicators. It makes a comparative analysis of different states of India in the attainment of the indicators. The indicators chosen cover wide spectrum of status of women. The analyses is also done regarding inequalities and the resulting loss in human development index that forces India to pose a sorry figure in comparison to other developed countries. The paper is divided into four parts; the first part looks into the background of the problem. The second part presents a wider view on the inequalities and gender discrimination prevalent in India. The third part gives a brief view of the comparison of India with the other countries excelling in human development index. Finally, the fourth part presents concluding observations and policy recommendations. Key Words: Gender discrimination, health, women’s education. 1 Associate Prof., Dept. of Economics, Aligarh Muslim University, Aligarh. Available at: [email protected] 2 Junior Research Fellow, Dept. of Economics, Aligarh Muslim University, Aligarh. Available at:: [email protected]
Transcript of Gender Inequalities in Education and Its Effect on Health of Women and Child
Gender Inequalities in Education and Its Effect on Health of Women and Child: Md. Tarique & Sana Samreen
673
International Journal of Research (IJR) Vol-1, Issue-4, May 2014 ISSN 2348-6848
Gender Inequalities in Education and Its Effect on Health of Women and Child
Md. Tarique1 & Sana Samreen2
Abstract: In India the condition of women was appalling during independence. The deprivation of women in getting the similar level of opportunities relating to education, health, decision making as men due to prevalence of patriarchal society and socioeconomic backwardness in India put women at a backstage. After independence Indian planners and policy makers recognized the problem and framed variety of policies and programs to provide women equal status as men. But since after six decades of Indian planning after making various efforts Indian women are still at a backstage than men on various aspects specifically health and educational opportunities. Under this backdrop, this paper tries to evaluate the status and position of women in India in the light of some important gender –related as well as health related indicators. It makes a comparative analysis of different states of India in the attainment of the indicators. The indicators chosen cover wide spectrum of status of women. The analyses is also done regarding inequalities and the resulting loss in human development index that forces India to pose a sorry figure in comparison to other developed countries. The paper is divided into four parts; the first part looks into the background of the problem. The second part presents a wider view on the inequalities and gender discrimination prevalent in India. The third part gives a brief view of the comparison of India with the other countries excelling in human development index. Finally, the fourth part presents concluding observations and policy recommendations.
Key Words: Gender discrimination, health, women’s education.
1 Associate Prof., Dept. of Economics, Aligarh Muslim University, Aligarh. Available at: [email protected] 2 Junior Research Fellow, Dept. of Economics, Aligarh Muslim University, Aligarh. Available at:: [email protected]
Gender Inequalities in Education and Its Effect on Health of Women and Child: Md. Tarique & Sana Samreen
674
International Journal of Research (IJR) Vol-1, Issue-4, May 2014 ISSN 2348-6848
Introduction: During independence the condition of women in terms of literacy and health status was very much appalling. The female literacy rate was less than 1% during independence. The deprivation of women in getting the similar level of opportunities relating to education, health, decision making as men due to the prevalence of patriarchal society and social - economic backwardness in India puts women at a backstage. It’s a well proven fact that the overall effect of women's education, even in the short run, is unequivocally beneficial: it saves children's lives, and it especially gives daughters a more even chance. Thus, formal education is a slow process; it must begin now to benefit the next generation. The Indian government has officially recognized the great importance of schooling, particularly for females. In addition to providing ostensibly free and compulsory education to all children up to the age of 14, some states offer special inducements to the parents of girls. Attendance rates are still low, however, and more must be done to convince parents of the importance of keeping all of their children in school, and to make it truly accessible. It would hardly be an improvement over the traditional perspective, if India were to promote the education of women solely on the basis that it made them better mothers. Equally important, and a point that is often overlooked, is that education also gives women the potential to improve their own lives and health. Furthermore, an educated population will be India's best resource in its struggle to stabilize and develop its economy. In this paper I argue that there is a direct impact of women’s education on various health parameters and can be explained to a
very large extent by the basic abilities and personality characteristics of the mother, independently of education, occupation, income, and wealth. Of course, the father and other carers are also involved, but mothers tend to be the primary carers for children, so that their characteristics are more significant for child health. These characteristics strongly influence child health as well as the ultimate outcome of mortality. In terms of Mosley and Chen's framework3, this would add personal abilities to the position at present occupied only by socio-economic determinants. There is, of course, widespread awareness that the mother's abilities are important for the child's health, as evidenced in the discussion of the role of mother's education. However, this perception is essentially limited to mother's education. It seems to be assumed that women's innate abilities are similar and that education acts exogenously to improve those abilities. For example, when Mosley and Chen, discuss maternal skills, they relate this firmly to educational levels. This is why there is interest in documenting the pathways through which mothers' educational influences child health, an area in which relatively little work has been done as yet.
However, we argue that people's basic abilities are very far from being the same and while education can improve them, it does not make them homogeneous. Stated
3 The framework gives an analytical study of the determinants of child survival in developing countries. It is based on the premise that all social and economic determinants of child mortality necessarily operate through a common set of biological mechanism, or proximate determinants to exert an impact on mortality.
Gender Inequalities in Education and Its Effect on Health of Women and Child: Md. Tarique & Sana Samreen
675
International Journal of Research (IJR) Vol-1, Issue-4, May 2014 ISSN 2348-6848
baldly, this is obvious, but this question has been neglected in the literature.
Inequalities in India: Women's health in India can be examined in terms of multiple indicators, which vary by
Currently, women in India face a multitude of health problems, which ultimately affect the aggregate economy’s output. Addressing the gender, class or ethnic disparities that exist in healthcare and improving the health
outcomes can contribute to economic gain through the creation of quality human capital and increased levels of savings and investment.
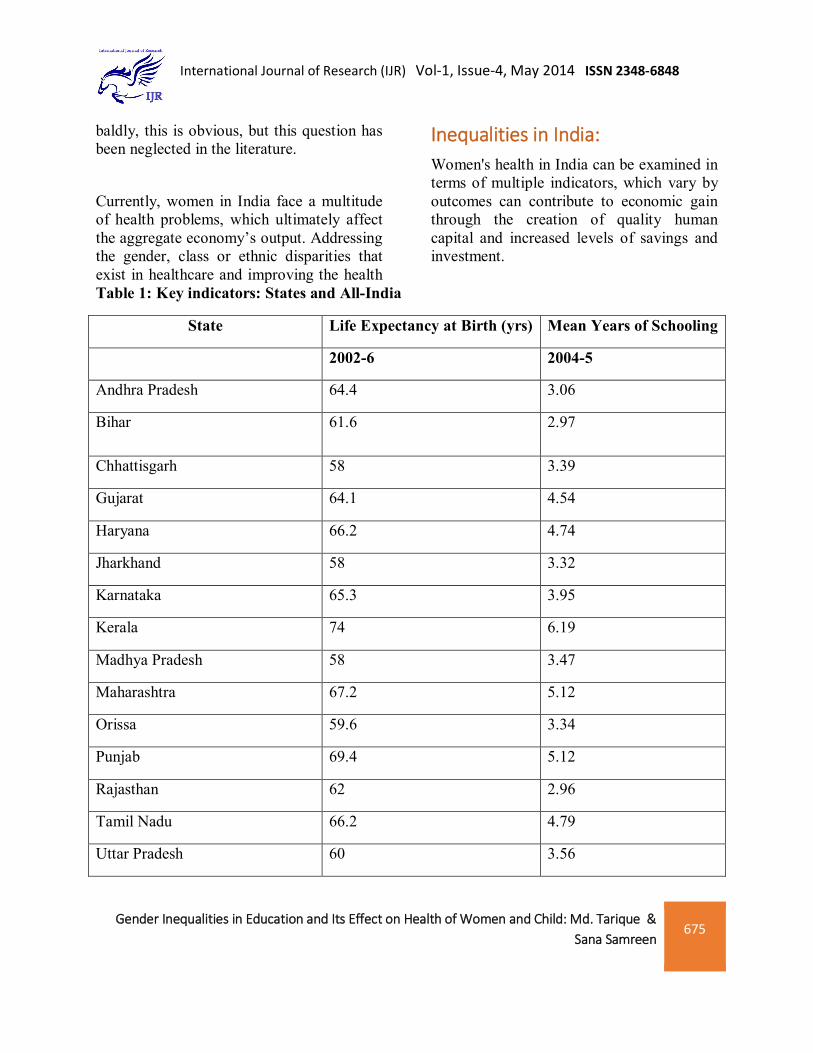
Table 1: Key indicators: States and All-India
State Life Expectancy at Birth (yrs) Mean Years of Schooling
2002-6 2004-5
Andhra Pradesh 64.4 3.06
Bihar 61.6 2.97
Chhattisgarh 58 3.39
Gujarat 64.1 4.54
Haryana 66.2 4.74
Jharkhand 58 3.32
Karnataka 65.3 3.95
Kerala 74 6.19
Madhya Pradesh 58 3.47
Maharashtra 67.2 5.12
Orissa 59.6 3.34
Punjab 69.4 5.12
Rajasthan 62 2.96
Tamil Nadu 66.2 4.79
Uttar Pradesh 60 3.56

Gender Inequalities in Education and Its Effect on Health of Women and Child: Md. Tarique & Sana Samreen
676
International Journal of Research (IJR) Vol-1, Issue-4, May 2014 ISSN 2348-6848
Uttarakhand 60 4.97
West Bengal 64.9 4.36
India 63.5 4.1
Source: NSS data on educational status and training in India (GOI, 2006).
Note: The same data source is used to obtain estimate of Atkinson inequality in levels of education.
Correlation coefficient between mean yrs of schooling and life expectancy is = 0.766. This value of r shows positive direct relationship between both the indicators which proves that education and health are directly related and investing in one will automatically take care of the other.
Above table 1 indicates that the states having higher mean years of schooling are the ones that also excel in one very important health indicator that is life expectancy. This proves the direct relationship between education and growing
awareness towards health and diseases to increase life expectancy. Above table-1 indicated that the states like Bihar, Chhattisgarh, Jharkhand and Orissa that fare very badly at schooling front register lower life expectancy as compared to the other states. While states like Kerala, Punjab, Haryana excel on both the fronts of health and education indicating direct relationship between the two.
Table 2. Male-Female Literacy in India: Number of literates per thousand population:
Year Male Female 1911 106 11 1921 122 18 1931 156 29 1941 249 73 1951 250 79 1961 344 130 1971 395 187 1981 469 248 1991 641 393 2001 753 537 2011 821 654
Source: Various Census of India Issues
Gender Inequalities in Education and Its Effect on Health of Women and Child: Md. Tarique & Sana Samreen
677
International Journal of Research (IJR) Vol-1, Issue-4, May 2014 ISSN 2348-6848
Although there has been a considerable improvement in literacy rate of female but still it is much lower compared to male. Male-female gap is predominant and nearly 20% gap is remaining between male-female literacy rates (Table 2). Health is generally regarded as a vital component of growth and development of a nation. However, in India the field of health and health care in general and women health in particular is the most neglected aspects of development. Women are viewed mainly as the means of production often at the cost of own personal, individual identity (Rustogi 2004). Even today the issue of family welfare and reproductive health is much more important to policy makers than the issue of providing basic level of nutrition, better health, better control over women’s body etc. In this context to assess the women health in the country the following indicators are chosen.
i) IMR for females ii) Anaemia among women iii) Maternal Mortality Ratio iv) Life expectancy of female at birth v) Sex ratio
Infant Mortality Rate for females: IMR for females refers to the number of female
death in the first year of life per 1000 live birth. A study by Murti, Guio and Drez (1995) about the variation of under-five mortality rates between different districts of India shows that female labor force participation and female literacy are strongly associated with female disadvantage and child survival whereas the issue of modernization and urbanization appears to provide a weak link with that of female disadvantage and child survival. It implies that economic freedom and knowledge has a greater role to play in removing female disadvantage and child survival. It is worth mentioning that discrimination in access to healthcare services to females and the lower status ascribed to females in our society is at the base of excess female mortality in the inference stage (Basu 1989). Mosey and Chen’s framework crystallizes the implicit assumption in the literature that variation in mortality between households within a given community (where households are subject to the same community-level conditions and influenced by the same culture), is explained by differentials in socio-economic factors such as education.
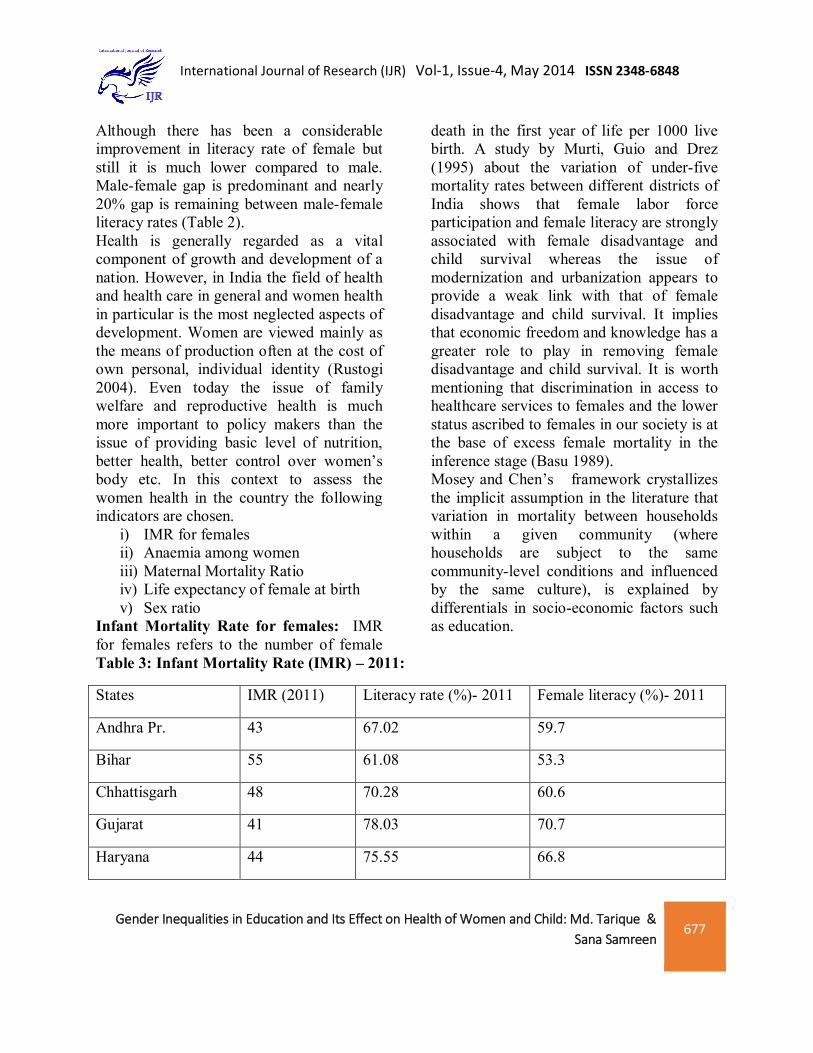
Table 3: Infant Mortality Rate (IMR) – 2011:
States IMR (2011) Literacy rate (%)- 2011 Female literacy (%)- 2011
Andhra Pr. 43 67.02 59.7
Bihar 55 61.08 53.3
Chhattisgarh 48 70.28 60.6
Gujarat 41 78.03 70.7
Haryana 44 75.55 66.8

Gender Inequalities in Education and Its Effect on Health of Women and Child: Md. Tarique & Sana Samreen
678
International Journal of Research (IJR) Vol-1, Issue-4, May 2014 ISSN 2348-6848
Jharkhand 39 66.41 56.2
Karnataka 35 75.36 68.1
Kerala 12 94 92
Madhya Pr. 59 69.32 60
Maharashtra 25 82.34 75.5
Orissa 57 72.87 64.4
Punjab 30 75.84 71.3
Rajasthan 52 66.11 52.7
Tamil Nadu 22 80.09 73.9
U.P. 57 67.68 59.3
Uttarakhand 36 78.82 70.7
West Bengal 32 76.26 71.2
INDIA 44 74.04 65.46
Source: Census of India report - 2011
Coefficient of correlation(r) between IMR and literacy rate is = -0.823 (-vely correlated) Coefficient of correlation(r) between IMR and female literacy rate is = -0.846 (-vely correlated) showing inverse relationship interpreting that if literacy rate specifically female literacy rate increases, IMR comes down. Above table 3 clearly indicates that states excelling on literacy and female literacy front have lower levels of IMR.
Maternal Mortality Ratio: Maternal Mortality Rate (MMR) is calculated as the number of maternal death per 1, 00,000 live birth. According to Gopalon and Shiva (2000), Krishnaji and James (2002), the high rates of maternal mortality are not due to reproduction but are a result of poor health condition that are the outcome of gender discrimination meted out over the years from childhood. Lack of education remains one of the most crucial factors in expanding MMR.
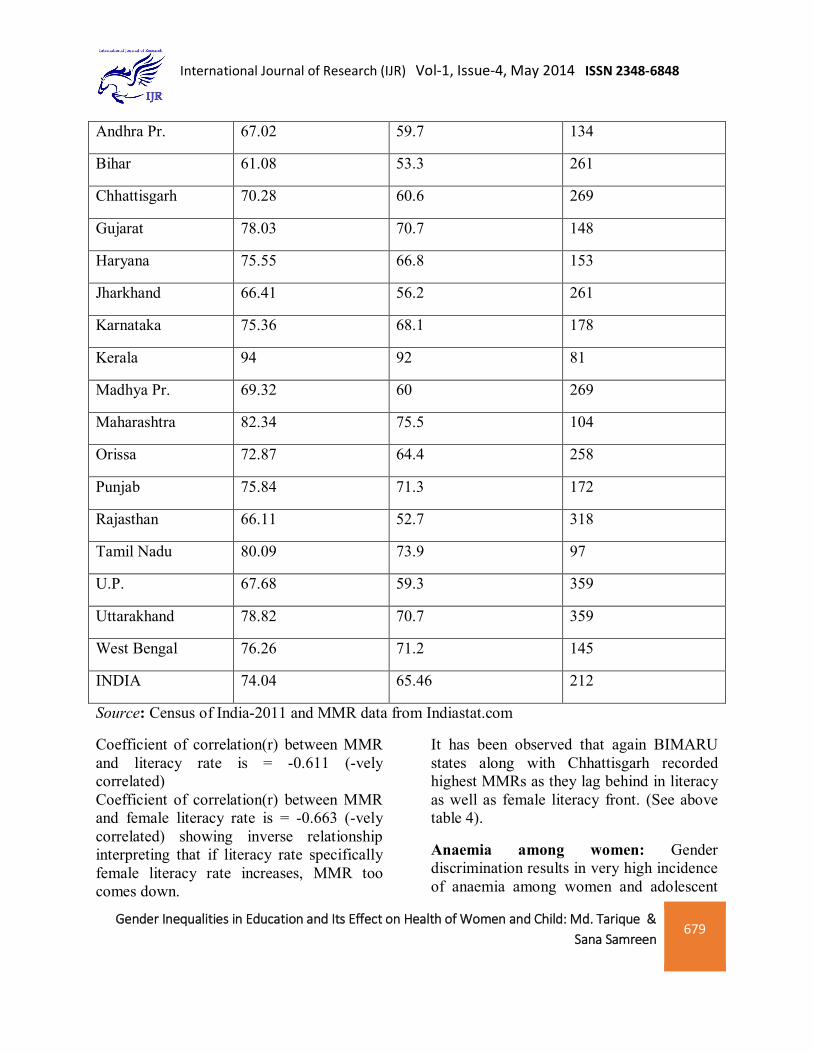
Table 4: Maternal Mortality Rates in India:
States Literacy rate (%) - 2011
Female literacy (%) - 2011
Maternal Mortality Rate (2007-10)
Gender Inequalities in Education and Its Effect on Health of Women and Child: Md. Tarique & Sana Samreen
679
International Journal of Research (IJR) Vol-1, Issue-4, May 2014 ISSN 2348-6848
Andhra Pr. 67.02 59.7 134
Bihar 61.08 53.3 261
Chhattisgarh 70.28 60.6 269
Gujarat 78.03 70.7 148
Haryana 75.55 66.8 153
Jharkhand 66.41 56.2 261
Karnataka 75.36 68.1 178
Kerala 94 92 81
Madhya Pr. 69.32 60 269
Maharashtra 82.34 75.5 104
Orissa 72.87 64.4 258
Punjab 75.84 71.3 172
Rajasthan 66.11 52.7 318
Tamil Nadu 80.09 73.9 97
U.P. 67.68 59.3 359
Uttarakhand 78.82 70.7 359
West Bengal 76.26 71.2 145
INDIA 74.04 65.46 212
Source: Census of India-2011 and MMR data from Indiastat.com
Coefficient of correlation(r) between MMR and literacy rate is = -0.611 (-vely correlated) Coefficient of correlation(r) between MMR and female literacy rate is = -0.663 (-vely correlated) showing inverse relationship interpreting that if literacy rate specifically female literacy rate increases, MMR too comes down.
It has been observed that again BIMARU states along with Chhattisgarh recorded highest MMRs as they lag behind in literacy as well as female literacy front. (See above table 4).
Anaemia among women: Gender discrimination results in very high incidence of anaemia among women and adolescent

Gender Inequalities in Education and Its Effect on Health of Women and Child: Md. Tarique & Sana Samreen
680
International Journal of Research (IJR) Vol-1, Issue-4, May 2014 ISSN 2348-6848
girls in India (IHDR 2011). In India, anaemia is rampant among women in the reproductive age group, children and low socio-economic strata of the population. Anaemia in pregnant women leads to adverse pregnancy outcomes such as high maternal and neonatal mortality, low birth weight, increased risk of obstetric complications, increased morbidity that seriously impairs the physical and mental development of the child. Anaemia remains a major indirect cause of maternal mortality in India (planning Commission 2008). The
11th five year plan targeted reducing anaemia among women and girls by 50% by 2012. According to IHDR 2011 data Percentage of women suffered from anaemia increased to 55.3% of women more than 60% for low income states. From the below table 5 it seems that the experience of the state of Kerala is an obvious outcome of the continuous effort of the state government in providing basic education and health facility to common people.
Table 5. Percentage of Women with Anaemia, 2005-06
States Literacy rate (%) Female literacy (%) Anaemic Women (%)
Andhra Pr. 67.02 59.7 62.9
Bihar 61.08 53.3 67.4
Chhattisgarh 70.28 60.6 57.5
Gujarat 78.03 70.7 55.3
Haryana 75.55 66.8 56.1
Jharkhand 66.41 56.2 69.5
Karnataka 75.36 68.1 52.1
Kerala 94 92 32.8
Madhya Pr. 69.32 60 53.6
Maharashtra 82.34 75.5 48.4
Orissa 72.87 64.4 61.2
Punjab 75.84 71.3 50.7
Rajasthan 66.11 52.7 53.1
Gender Inequalities in Education and Its Effect on Health of Women and Child: Md. Tarique & Sana Samreen
681
International Journal of Research (IJR) Vol-1, Issue-4, May 2014 ISSN 2348-6848
Tamil Nadu 80.09 73.9 61.1
U.P. 67.68 59.3 49.9
Uttarakhand 78.82 70.7 55.2
West Bengal 76.26 71.2 63.2
INDIA 74.04 65.46 55.3
Source: India Human Development Report 2011
Coefficient of correlation(r) between % of anaemic women and literacy rate is = -0.696 (-vely correlated). Coefficient of correlation(r) between % of anaemic women and female literacy rate is = -0.665 (-vely
correlated) showing inverse relationship interpreting that if literacy rate specifically female literacy rate increases,% of anaemic women would also come down.
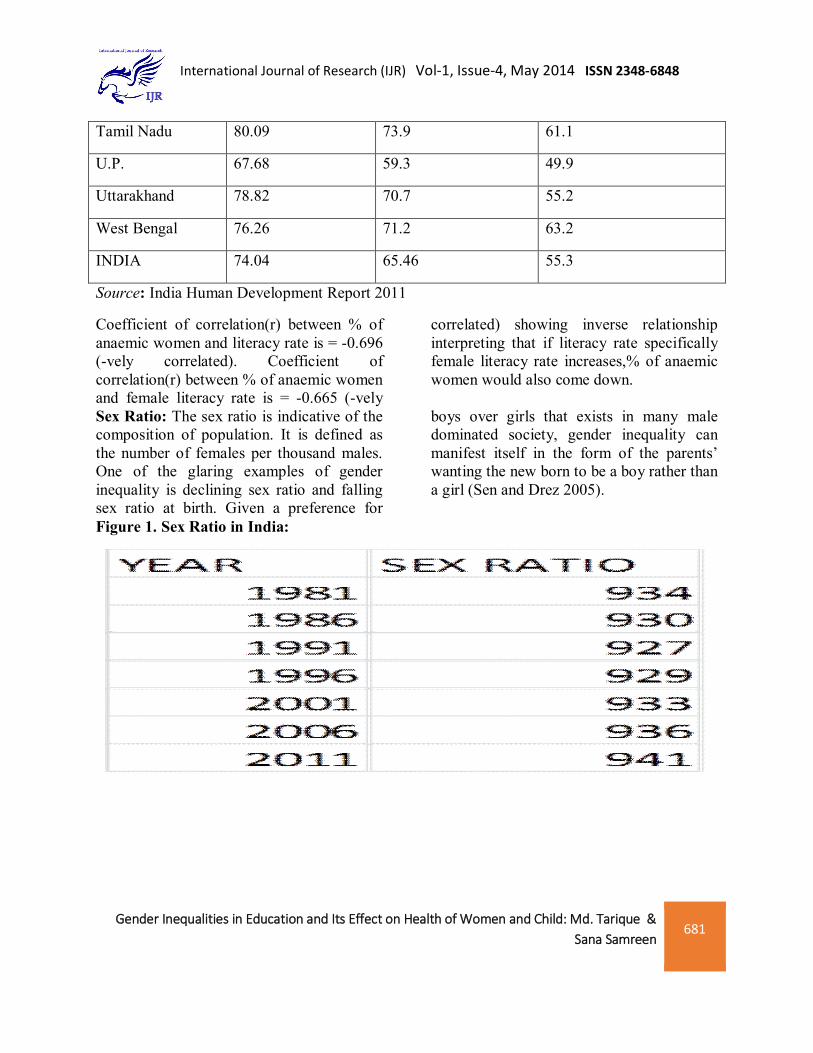
Sex Ratio: The sex ratio is indicative of the composition of population. It is defined as the number of females per thousand males. One of the glaring examples of gender inequality is declining sex ratio and falling sex ratio at birth. Given a preference for
boys over girls that exists in many male dominated society, gender inequality can manifest itself in the form of the parents’ wanting the new born to be a boy rather than a girl (Sen and Drez 2005).
Figure 1. Sex Ratio in India:

Gender Inequalities in Education and Its Effect on Health of Women and Child: Md. Tarique & Sana Samreen
682
International Journal of Research (IJR) Vol-1, Issue-4, May 2014 ISSN 2348-6848
925
930
935
940
945
Source: Various Census of India Issues
Table-6: Sex ratio and female literacy %:
Year Sex Ratio Female literacy (%)
1981 934 29.8
1991 927 39.3
2001 933 53.7
2011 940 65.5
Source: Various Census of India Issues
Coefficient of correlation(r) between sex ratio and female literacy rate is = 0.630 (+vely correlated) showing direct relationship interpreting that if female literacy rate increases, sex ratio would improve. Three dimensions of HDI i.e. income, education and health are when adjusted for inequalities in attainments across people
give a more clear picture. Globally, India is ranked 119 out of 169 countries but loses 32 percent of its value when adjusted for inequalities. Amidst growing concern over these persistent inequalities, and in light of government emphasis on inclusive growth, this paper has taken into account the Inequality-adjusted HDI for states in India

Gender Inequalities in Education and Its Effect on Health of Women and Child: Md. Tarique & Sana Samreen
683
International Journal of Research (IJR) Vol-1, Issue-4, May 2014 ISSN 2348-6848
Table 6: Estimates of sub-indices by dimension, with and without adjustment for inequality
State Education (y) Health (z)
Iy IIy Iz IIz
Andhra Pradesh 0.347 0.192 0.703 0.479
Bihar 0.34 0.187 0.658 0.411
Chhattisgarh 0.358 0.202 0.601 0.343
Gujarat 0.403 0.243 0.698 0.475
Haryana 0.432 0.244 0.731 0.485
Jharkhand 0.361 0.196 0.658 0.411
Karnataka 0.396 0.226 0.717 0.503
Kerala 0.534 0.41 0.854 0.764
Madhya Pradesh 0.355 0.194 0.601 0.343
Maharashtra 0.453 0.279 0.747 0.562
Orissa 0.345 0.199 0.627 0.38
Punjab 0.452 0.265 0.782 0.572
Rajasthan 0.333 0.179 0.665 0.4
Tamil Nadu 0.454 0.278 0.731 0.55
Uttar Pradesh 0.365 0.195 0.633 0.384
Uttarakhand 0.454 0.256 0.633 0.384
West Bengal 0.397 0.238 0.71 0.494
India 0.4 0.229 0.688 0.452
Source: Inequality- adjusted HDI for Indian states (2011), UNDP
Notes: i. The two dimensions, viz., education and health are denoted by y and z respectively; and
Gender Inequalities in Education and Its Effect on Health of Women and Child: Md. Tarique & Sana Samreen
684
International Journal of Research (IJR) Vol-1, Issue-4, May 2014 ISSN 2348-6848
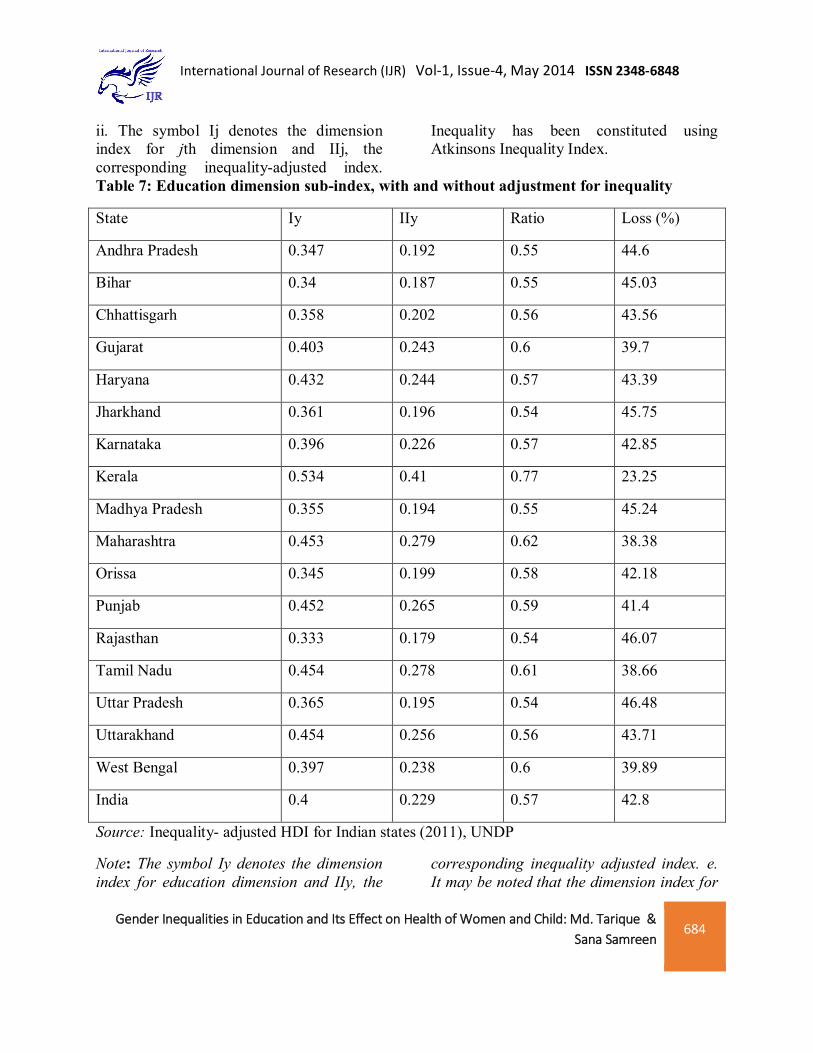
ii. The symbol Ij denotes the dimension index for jth dimension and IIj, the corresponding inequality-adjusted index.
Inequality has been constituted using Atkinsons Inequality Index.
Table 7: Education dimension sub-index, with and without adjustment for inequality
State Iy IIy Ratio Loss (%)
Andhra Pradesh 0.347 0.192 0.55 44.6
Bihar 0.34 0.187 0.55 45.03
Chhattisgarh 0.358 0.202 0.56 43.56
Gujarat 0.403 0.243 0.6 39.7
Haryana 0.432 0.244 0.57 43.39
Jharkhand 0.361 0.196 0.54 45.75
Karnataka 0.396 0.226 0.57 42.85
Kerala 0.534 0.41 0.77 23.25
Madhya Pradesh 0.355 0.194 0.55 45.24
Maharashtra 0.453 0.279 0.62 38.38
Orissa 0.345 0.199 0.58 42.18
Punjab 0.452 0.265 0.59 41.4
Rajasthan 0.333 0.179 0.54 46.07
Tamil Nadu 0.454 0.278 0.61 38.66
Uttar Pradesh 0.365 0.195 0.54 46.48
Uttarakhand 0.454 0.256 0.56 43.71
West Bengal 0.397 0.238 0.6 39.89
India 0.4 0.229 0.57 42.8
Source: Inequality- adjusted HDI for Indian states (2011), UNDP
Note: The symbol Iy denotes the dimension index for education dimension and IIy, the
corresponding inequality adjusted index. e. It may be noted that the dimension index for
Gender Inequalities in Education and Its Effect on Health of Women and Child: Md. Tarique & Sana Samreen
685
International Journal of Research (IJR) Vol-1, Issue-4, May 2014 ISSN 2348-6848
education is based on two components, viz., (i) mean years of schooling; and (ii) expected years of schooling (or school life expectancy), which are aggregated by their geometric mean.
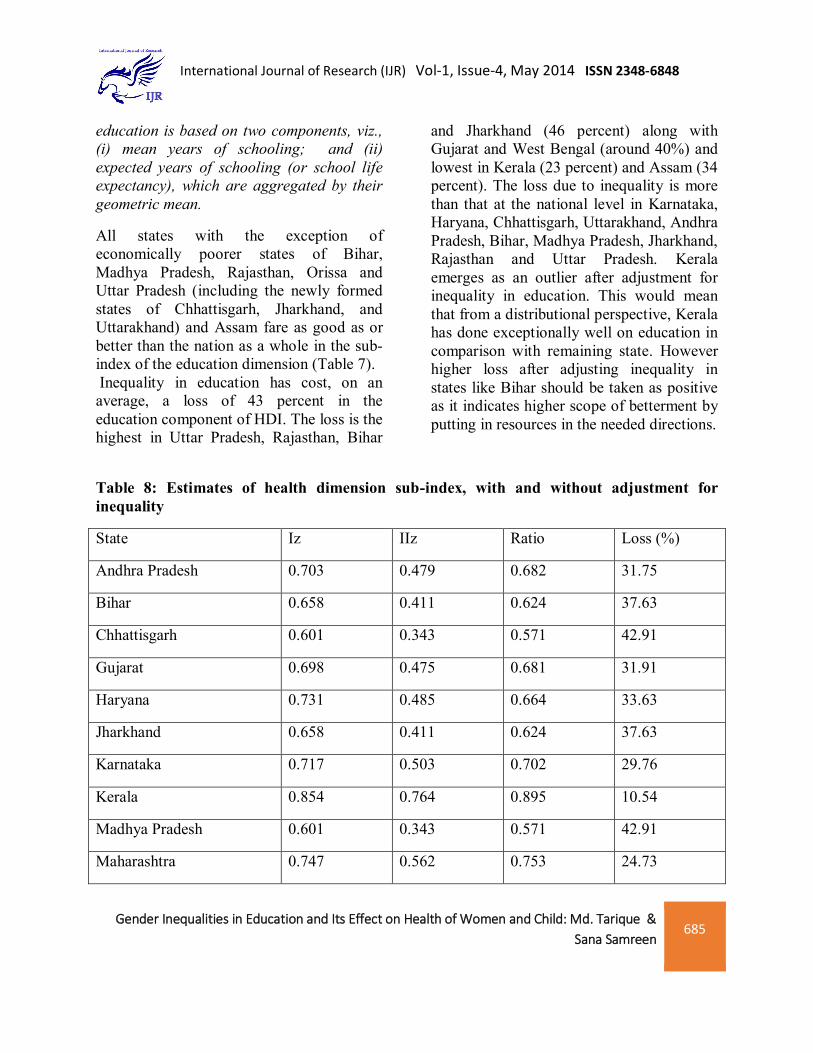
All states with the exception of economically poorer states of Bihar, Madhya Pradesh, Rajasthan, Orissa and Uttar Pradesh (including the newly formed states of Chhattisgarh, Jharkhand, and Uttarakhand) and Assam fare as good as or better than the nation as a whole in the sub-index of the education dimension (Table 7). Inequality in education has cost, on an average, a loss of 43 percent in the education component of HDI. The loss is the highest in Uttar Pradesh, Rajasthan, Bihar
and Jharkhand (46 percent) along with Gujarat and West Bengal (around 40%) and lowest in Kerala (23 percent) and Assam (34 percent). The loss due to inequality is more than that at the national level in Karnataka, Haryana, Chhattisgarh, Uttarakhand, Andhra Pradesh, Bihar, Madhya Pradesh, Jharkhand, Rajasthan and Uttar Pradesh. Kerala emerges as an outlier after adjustment for inequality in education. This would mean that from a distributional perspective, Kerala has done exceptionally well on education in comparison with remaining state. However higher loss after adjusting inequality in states like Bihar should be taken as positive as it indicates higher scope of betterment by putting in resources in the needed directions.
Table 8: Estimates of health dimension sub-index, with and without adjustment for inequality
State Iz IIz Ratio Loss (%)
Andhra Pradesh 0.703 0.479 0.682 31.75
Bihar 0.658 0.411 0.624 37.63
Chhattisgarh 0.601 0.343 0.571 42.91
Gujarat 0.698 0.475 0.681 31.91
Haryana 0.731 0.485 0.664 33.63
Jharkhand 0.658 0.411 0.624 37.63
Karnataka 0.717 0.503 0.702 29.76
Kerala 0.854 0.764 0.895 10.54
Madhya Pradesh 0.601 0.343 0.571 42.91
Maharashtra 0.747 0.562 0.753 24.73
Gender Inequalities in Education and Its Effect on Health of Women and Child: Md. Tarique & Sana Samreen
686
International Journal of Research (IJR) Vol-1, Issue-4, May 2014 ISSN 2348-6848
Orissa 0.627 0.38 0.607 39.31
Punjab 0.782 0.572 0.731 26.86
Rajasthan 0.665 0.4 0.602 39.79
Tamil Nadu 0.731 0.55 0.753 24.7
Uttar Pradesh 0.633 0.384 0.607 39.34
Uttarakhand 0.633 0.384 0.607 39.34
West Bengal 0.71 0.494 0.695 30.48
India 0.688 0.452 0.657 34.26
Source: Inequality- adjusted HDI for Indian states (2011), UNDP
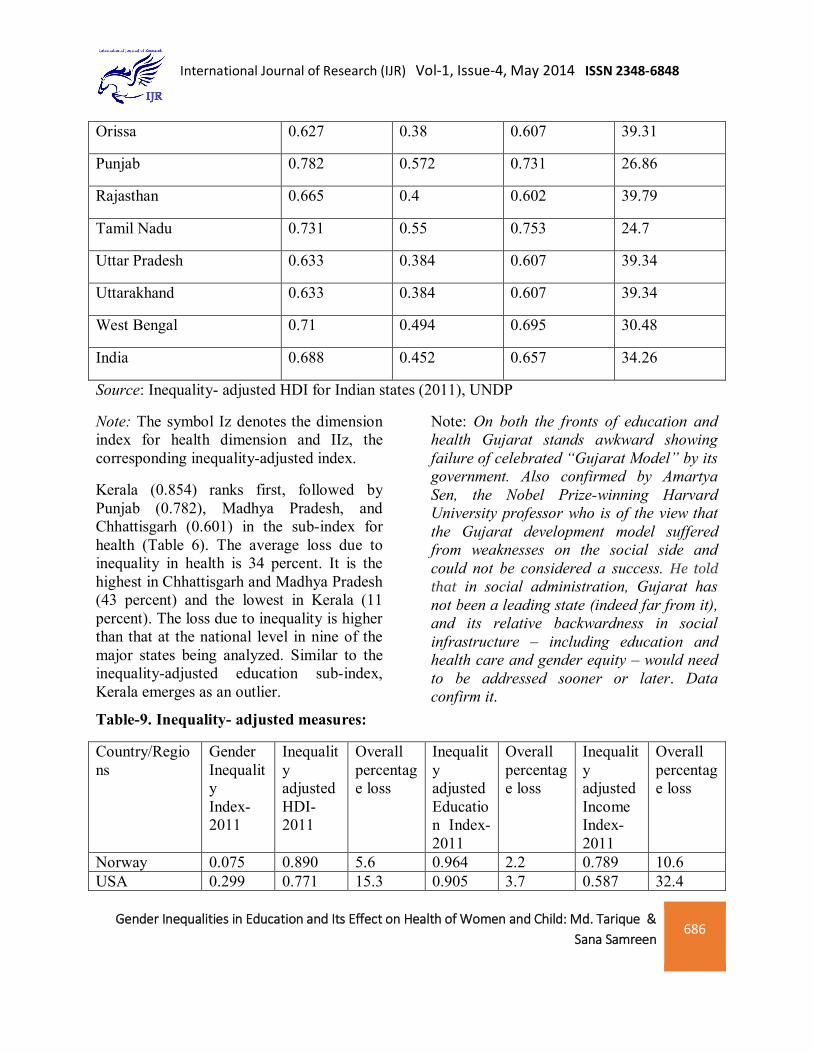
Note: The symbol Iz denotes the dimension index for health dimension and IIz, the corresponding inequality-adjusted index.
Kerala (0.854) ranks first, followed by Punjab (0.782), Madhya Pradesh, and Chhattisgarh (0.601) in the sub-index for health (Table 6). The average loss due to inequality in health is 34 percent. It is the highest in Chhattisgarh and Madhya Pradesh (43 percent) and the lowest in Kerala (11 percent). The loss due to inequality is higher than that at the national level in nine of the major states being analyzed. Similar to the inequality-adjusted education sub-index, Kerala emerges as an outlier.
Note: On both the fronts of education and health Gujarat stands awkward showing failure of celebrated “Gujarat Model” by its government. Also confirmed by Amartya Sen, the Nobel Prize-winning Harvard University professor who is of the view that the Gujarat development model suffered from weaknesses on the social side and could not be considered a success. He told that in social administration, Gujarat has not been a leading state (indeed far from it), and its relative backwardness in social infrastructure – including education and health care and gender equity – would need to be addressed sooner or later. Data confirm it.
Table-9. Inequality- adjusted measures:
Country/Regions
Gender Inequality Index-2011
Inequality adjusted HDI- 2011
Overall percentage loss
Inequality adjusted Education Index- 2011
Overall percentage loss
Inequality adjusted Income Index- 2011
Overall percentage loss
Norway 0.075 0.890 5.6 0.964 2.2 0.789 10.6 USA 0.299 0.771 15.3 0.905 3.7 0.587 32.4
Gender Inequalities in Education and Its Effect on Health of Women and Child: Md. Tarique & Sana Samreen
687
International Journal of Research (IJR) Vol-1, Issue-4, May 2014 ISSN 2348-6848
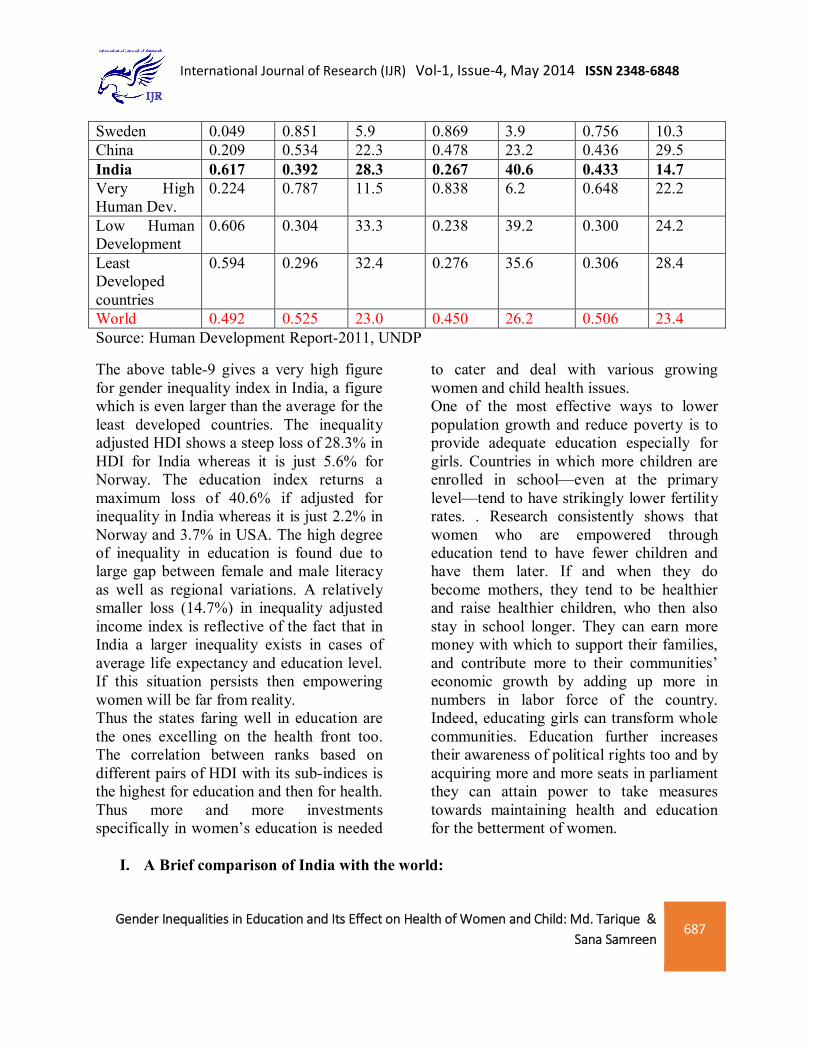
Sweden 0.049 0.851 5.9 0.869 3.9 0.756 10.3 China 0.209 0.534 22.3 0.478 23.2 0.436 29.5 India 0.617 0.392 28.3 0.267 40.6 0.433 14.7 Very High Human Dev.
0.224 0.787 11.5 0.838 6.2 0.648 22.2
Low Human Development
0.606 0.304 33.3 0.238 39.2 0.300 24.2
Least Developed countries
0.594 0.296 32.4 0.276 35.6 0.306 28.4
World 0.492 0.525 23.0 0.450 26.2 0.506 23.4 Source: Human Development Report-2011, UNDP
The above table-9 gives a very high figure for gender inequality index in India, a figure which is even larger than the average for the least developed countries. The inequality adjusted HDI shows a steep loss of 28.3% in HDI for India whereas it is just 5.6% for Norway. The education index returns a maximum loss of 40.6% if adjusted for inequality in India whereas it is just 2.2% in Norway and 3.7% in USA. The high degree of inequality in education is found due to large gap between female and male literacy as well as regional variations. A relatively smaller loss (14.7%) in inequality adjusted income index is reflective of the fact that in India a larger inequality exists in cases of average life expectancy and education level. If this situation persists then empowering women will be far from reality. Thus the states faring well in education are the ones excelling on the health front too. The correlation between ranks based on different pairs of HDI with its sub-indices is the highest for education and then for health. Thus more and more investments specifically in women’s education is needed
to cater and deal with various growing women and child health issues. One of the most effective ways to lower population growth and reduce poverty is to provide adequate education especially for girls. Countries in which more children are enrolled in school—even at the primary level—tend to have strikingly lower fertility rates. . Research consistently shows that women who are empowered through education tend to have fewer children and have them later. If and when they do become mothers, they tend to be healthier and raise healthier children, who then also stay in school longer. They can earn more money with which to support their families, and contribute more to their communities’ economic growth by adding up more in numbers in labor force of the country. Indeed, educating girls can transform whole communities. Education further increases their awareness of political rights too and by acquiring more and more seats in parliament they can attain power to take measures towards maintaining health and education for the betterment of women.
I. A Brief comparison of India with the world:

Gender Inequalities in Education and Its Effect on Health of Women and Child: Md. Tarique & Sana Samreen
688
International Journal of Research (IJR) Vol-1, Issue-4, May 2014 ISSN 2348-6848
Table 10: Comparison of Indian states with other countries
HDI Rank COUNTRY HDI VALUE IHDI VALUE LOSS 1 TO 42 VERY HIGH HDI 0.788-0.938 0.700 - 0.876 6.1 - 16.7 43 TO 85 HIGH HDI 0.677-0.784 0.492 - 0.693 8.1 - 30.786 TO 127 MEDIUM HDI 0.488 - 0.669 0.320 - 0.546 13.5 - 44.3128 T0 169 LOW HDI 0.140 - 0.470 0.098 - 0.383 19.32 - 45.30
Source: Inequality- adjusted HDI for Indian states (2011), UNDP
Note: The UNDP (2011) classifies countries into four ordinal groups with reference to HDI values. Since none of the Indian states has an HDI value within the limits of the first two groups, the details of these countries are not shown.
From the above table 7 it becomes quite clear that India is still much far behind other countries who fall within the bracket of very high and high HDI. The need of the hour is to take lesson from these countries ( with high and very high HDI) and recognize the crucial areas that needs to be taken of to improve human development most important of which is women’s education that will itself take care of health issues. India, with a global HDI value of 0.504, falls in the category of countries with ’Medium Human Development’. It falls short of the world average, which is 0.624 (UNDP, 2010; p. 155). The loss in global HDI due to inequality is much higher in India (32 percent) than in the world as a whole (22 percent) (UNDP, 2010; p. 155). This shows that if education and health parameters are taken care of then they will automatically improve our HDI- ranking as compared to other countries.
The major states are distributed between the categories of countries with ‘Medium’ and ‘Low Human Development’ as per the HDR 2010 classification (Table 7). Kerala, with a global HDI of 0.625, is in the ‘Medium HDI’ category. Other major states in this group are Punjab, Himachal Pradesh, Haryana, Maharashtra, Tamil Nadu, Karnataka, Gujarat, West Bengal and Uttarakhand. Nine other states, namely Andhra Pradesh, Assam, Uttar Pradesh, Rajasthan, Jharkhand, Madhya Pradesh, Chhattisgarh, Bihar and Orissa fall in the ‘Low HDI’ category. While India is ranked 119 out of 169 countries in the Global HDI, our estimates for different states range from 99 for the state of Kerala (whose Global HDI estimate places it between Philippines and the Republic of Moldova) to 133 for Orissa (whose Global HDI estimate places it between Myanmar and Yemen).

Gender Inequalities in Education and Its Effect on Health of Women and Child: Md. Tarique & Sana Samreen
689
International Journal of Research (IJR) Vol-1, Issue-4, May 2014 ISSN 2348-6848
II. Conclusion:
The performance of the country and states in respect of female education is praiseworthy though it is still lagging behind in comparison with the developed countries in international arena. Various programs and policies implemented to improve the public health system in India have now been started providing output. The BIMARU states (Bihar, Uttar Pradesh, Madhya Pradesh and Rajasthan) are though experiencing some kind of improvement over the years but are
still lagging far behind the attainment level of some of developed states. The direct relationship between improvement in education leading to improvement in all health indicators is a very big direction for policy making. Much greater attention and investments are needed towards women education to fight back the evils of female foeticide, declining sex ratio, gender discrimination and huge loss in HDI due to various inequalities.
Gender Inequalities in Education and Its Effect on Health of Women and Child: Md. Tarique & Sana Samreen
690
International Journal of Research (IJR) Vol-1, Issue-4, May 2014 ISSN 2348-6848
References:
1. Basu, A. 1989. ’Is Discrimination in Food Really Necessary for Explaining Sex Differentials in Childhood Mortality?’. Population Studies, 43(2): 193.210. 063 International Journal of Development Research, Vol. 3, Issue, 12, pp.057-064, December, 2013
2. Census of India, various issues
3. Felman, Shelley 1998. ‘Conceptualising Change and equality in the “Third World” Conpedia of Contemporary Issues. Pp. 24-36. New York: Garland Publishing.
4. India Human Development Report 2011
5. Kanitkar, I. 1991. ‘.The Sex Ratio in India: A Topic for Speculation and Research’., Journal of Family Welfare, 37(3): 18.22.
6. Krishnaji, N. and K.S. James. 2002. ’Gender Differentials in Adult Mortality with Notes and Rural-Urban Contrasts’., Economic and Political Weekly, 37(46):4633.37.
7. Mazum, et al. 2001. Gender and Covernance-A Country Paper-India. Study Commissioned by UNDP. New Delhi: Centre for Women’s Development Studies.
8. Rustogi P 2004. ‘Significance of Gender-related Development Indicators: An Analysis of Indian States’, Indian Journal of Gender Studies, 11:3
9. Sen, A. and J. Dreze 2005. “India Development and Participation”. Oxford University Press.
About the authors:
Md. Tarique is Associate Professor in Department of Economics, Aligarh Muslim University, Aligarh since 01.08.2012 till date. He was awarded Ph.D. degree on the topic, “Dynamics of Indian Agriculture and WTO: With Special Reference to Price and Production”.
Ms. Sana Samreen is a junior research fellow (JRF) in the Department of Economics, Aligarh Muslim University, Aligarh since July 2012. Her area of specialization is economics of education. Her research topic is , “ Perceived returns to education and demand for schooling: A case study of minorities of Aligarh district”.