China's Pork Miracle? Agribusiness and Development in China's Pork Industry

roiw_489 1..23
GENDER AND WORK COMPENSATION IN CHINA’S
INDUSTRIAL SECTOR
by Johanna Rickne*
Research Institute for Industrial Economics and Uppsala Center for Labor Studies
The gender gap in earnings is analyzed using data for 250,000 Chinese industrial firms in 2004. Theskill-weighted gender wage is estimated to be 12 percent and stems entirely from the female wagedisadvantage among employees with below college education. Firms’ payments to social insuranceprograms do not give further polarization of earnings, and descriptive statistics contradict the notionthat women are segregated into sectors with low program participation rates. Narrower gender wagegaps are found in more labor intensive industries and in private domestic firms, suggesting that themarket transition has not hurt the relative wages of female industrial workers. Finally, women’searnings disadvantage is fully accounted for by smaller contributions to value added, suggesting thatfirms do not wage-discriminate against female employees.
JEL Codes: I30, J16, J71, O10
Keywords: China, gender wage gap, non-wage compensation
1. Introduction
The question of gender-related wage discrimination and earnings differencesis of great economic and social importance. China’s female labor force is thelargest in the world, reaching 640 million in 2004. China is also the largest countryin transition from a planned to a market economy with a rapidly expandingand evolving labor market. How female employees are faring in this transition isimportant, not only to women’s welfare. Discriminatory treatment that discour-ages labor market participation and skills investments would damage Chineselong-term growth, and thereby also affect the world.
In this paper, I assess the gender wage gap in China’s industrial sectorby drawing on a large and nationally representative firm-level dataset. Thisdata allows the calculation of gender wage gaps by education level, as well as byindustrial sector, firm ownership, and geographical region. As such, I explore themain dimensions of China’s market transition, i.e. the expansion of private andforeign industrial ownership, the expansion of light consumer goods production,and the geographically diverse market liberalization.
My study is also the first quantitative analysis of whether non-wage compen-sation contributes to a wider gender gap in earnings. In China’s new social insur-ance system, mandatory provisions carry a total cost equal to nearly half of the
Note: The author would like to thank Bertil Holmlund, Johan Lyhagen, Fredrik Sjöholm, TorEriksson, Olle Folke, Petra Ornstein, the referees, and numerous seminar participants for helpfulcomments and suggestions.
*Correspondence to: Johanna Rickne, Research Institute for Industrial Economics, Box 55665,102 15 Stockholm, Sweden ([email protected]).
Review of Income and Wealth 2012DOI: 10.1111/j.1475-4991.2011.00489.x
© 2012 The AuthorReview of Income and Wealth © 2012 International Association for Research in Income and WealthPublished by Blackwell Publishing, 9600 Garsington Road, Oxford OX4 2DQ, UK and 350 Main St,Malden, MA, 02148, USA.
1

total wage bill (Banister, 2005).1 Previous research has argued that insurance coverhas become increasingly gender-biased during the transition period, stemming anover-representation of women in evading firms (Wang, 2006; Razavi, 2007).
To assess the existence of wage discrimination, I use the method offeredby Hellerstein and Neumark (1999) and Hellerstein et al. (1999) to calculate andcompare women’s relative wages to their relative productivity. This method hasthe advantage of circumventing the need to rely on control variables in the wageequation to capture all gender-related productivity differences. As pointed out by,for example, Altonji and Blank (1999), observable individual-level characteristicsare unlikely to properly capture these differences, thus overestimating the degreeof discrimination. Indeed, the unexplained proportion of the wage gap has beenlarge in previous studies, often exceeding two thirds of the gap (see Shen and Deng,2008, for a survey). Firm level data, instead, allows direct estimation of women’srelative productivity from the firm’s production function. The popularity ofHellerstein and Neumark’s method also has the advantage of making the resultscomparable to the numerous studies conducted for other countries.2
The dataset includes all large and medium-sized industrial enterprises, aswell as the majority of those designated as “small.” Importantly, it includes theprecise educational attainment of each employee, each employee’s gender, as wellas firm expenditures on various social insurance items. Using this highly represen-tative data improves substantially on the statistical precision of previous studies,in particular compared to Dong and Zhang’s (2009) unique study of 998 firms inthe late 1990s. Nevertheless, the use of cross-sectional data also merits caution ininterpreting the results, as the statistical analysis relies on control variables tocapture gender-related wage and productivity differences across firms.
The descriptive analysis offers a uniquely comprehensive picture of women’semployment on the industrial labor market. It shows overrepresentation of womenin firms with private ownership, in particular among those with investment fromoutside the Chinese mainland. There is also substantial gender segregation acrossindustries. Women make up less than a third of the workforce in heavy industry,but approach two thirds in the textile, tailoring, and leather sectors.
In the nationwide sample, the estimates show an average skill-weighted genderwage gap of 12 percent. This is a narrow gap compared to those found in studiesof other countries, when using similar methodologies and data.3 Adding firmpayments to social insurance programs to the wage bill does not give evidence thatnon-wage payments contribute to further gender polarization of average earnings.
Separating workers according to skill-level shows that unskilled women earnless than men with the same skill-level, while skilled women earn more. This resultcorresponds to previous studies using individual-level data, which have demon-
1Banister (2005) draws upon a survey conducted by China’s Ministry of Labor, covering 11,704urban enterprises in 51 large cities, to conclude that the standard wage measure of employee earningsshould be increased by 53.8 percent to fully account for labor compensation actually paid by urbanemployers.
2Including analysis of the U.S. (Hellerstein et al., 1999; Hellerstein and Neumark, 2005); Israel(Hellerstein and Neumark, 1999); Germany (Bartolucci and Alberto, 2010); Japan (Asano andKawaguchi, 2007); and China (Dong and Zhang, 2009).
3It is also slightly narrower than the gap found by Dong and Zhang (2009), although their sampleselection combined with the imprecision of the estimate makes a comparison difficult.
Review of Income and Wealth 2012
© 2012 The AuthorReview of Income and Wealth © International Association for Research in Income and Wealth 2012
2
strated a larger education premium for female than for male workers (Maurer-Fazio, 1999; Li, 2003). Further investigation of this result shows that it stems fromwage setting in state-controlled sectors, while there is no statistically significantwage difference among highly educated workers in the foreign-owned sector.Separating firms by industrial sector also yields some added insights. The wagedisadvantage of unskilled women is found to be smaller in light industry than inother sectors. Meanwhile, no correlation is found between the size of the genderwage gap and the level of regional development.
With respect to gender wage discrimination, the results show that althoughwomen with lower education levels earn on average less than men, their relativecontributions to firms’ value added is even lower. For the state-controlled sectors,this finding may be interpreted as further evidence of a lingering mismatch betweenwomen and jobs as a result of the state’s labor allocation (as argued by Dong andZhang, 2009). For the more recently established private sectors, an employerpreference for unskilled female labor over male unskilled labor is confirmed byqualitative studies of Chinese factories. These studies highlight a preference forfemale unskilled labor motivated by women’s perceived obedience and suitabilityfor assembly line work (e.g. Pun, 2005, 2007).
The paper is organized as follows. Section 2 provides a brief overview ofreforms to wage-setting and welfare systems in the post-1978 period and a reviewof previous research on gender-related wage gaps and discrimination in China.Section 3 explains the basic econometric framework, and Section 4 discusses thedataset, variables, and descriptive statistics. Benchmark estimation results androbustness checks are presented in Section 5, and Section 6 extends the analysis tovariation by industry, ownership, and location. Section 7 concludes.
2. Wage and Non-Wage Compensation in Chinese Industry
In pre-reform socialist China, urban industrial workers enjoyed a systemof guaranteed occupational and income security. This “Iron Rice Bowl” alsoprovided access to social insurances (health care, pensions, education) that weredistributed via state-owned work units. Equal labor market rights for men andwomen constituted an ethical commitment by the socialist state. It included judi-cial equality, the absence of gender bias with respect to entry into paid work, andaccess to social rights. Under this system, women’s incomes improved radically:the gender-based wage differential narrowed and became small compared to thatin other countries, particularly in urban areas (Croll, 1995). But with an industrialpolicy that emphasized heavy and capital-intensive industry, many women occu-pied blue collar positions for which they were physically disadvantaged, comparedto men. The resulting skill mismatch was not reflected in the remuneration systemwhich was determined at the central level (Korzec, 1992).
In the late 1970s, a series of radical reforms were enacted with respect to theindustrial labor market. Transformation of the wage-setting system started in theearly 1980s when firms were given autonomy over their remuneration levels withingovernment guidelines. By the 1990s, these guidelines had evolved into the impo-sition of minimum wages (Shen, 2007). Another centerpiece of reform was thetransfer of the labor allocation decision from the state to individual enterprises. By
Review of Income and Wealth 2012
© 2012 The AuthorReview of Income and Wealth © International Association for Research in Income and Wealth 2012
3

1994, firms had been given the right to dismiss workers. This new authority wasextensively practiced during a massive retrenchment program in the state-ownedsector. Between 1997 and 2002, more than 28 million state employees were askedto leave their jobs (Dong and Xu, 2009).4
Reform aimed at streamlining the organization of state-owned enterprises(SOEs) came as a response to increasing competition from the rapidly growingprivate and foreign-owned sectors. These sectors also represented a problem froma social insurance perspective, because a growing number of firms were automati-cally excluded from insurance coverage. Simultaneously, problems were brewingin many state-owned firms where high pension costs hampered competitiveness. Inthe 1990s, the social system was dramatically overhauled with the aim of solvingthese problems.
Put simply, social insurance reform consisted of breaking up the enterprise-based entitlement model, known as the Labor Insurance Scheme (LIS), into sepa-rate social insurances. Instead of the insurance provided by each firm individuallyunder the LIS, the new programs aimed to share risk across firms by regionalpooling of worker accounts. In this way, the 1990s saw the birth of a number ofprograms: a two-tiered pension system in 1997, the Urban Employee’s BasicHealth Care Insurance System in 1998, an unemployment insurance scheme in1999, and a system of workers’ savings accounts for housing.
Although firms outside the state economy were obliged to join the newprograms, compliance grew only modestly.5 One reason was the high paymentlevels required to compensate for the pension arrears accumulated in state-ownedfirms.6 Another important issue was the lack of a legal foundation, makingenforcement difficult and evasion easy. Only very recently was this issue addressed,and China’s new social insurance law has collected and formalized the previoussets of regulations.
Qualitative research has indicated an emerging pattern of gender-polarizationin insurance cover, in particular in the export-oriented sectors of the economy(Wang, 2006; Razavi, 2007). It has also argued that women dismissed from SOEswere pushed into ownership sectors where social security protection was low(Stockman, 1994; Cooke, 2001).
In contrast to non-wage compensation, there are a large number of studiesdedicated to earnings gaps and discrimination. Most studies use some of thecross-sectional household datasets collected by the Chinese Academy of SocialSciences in 1988, 1995, and 2002 under a project known as CHIP (China House-hold Income Project). The common finding in these papers is a gender wage gap of
4Women were over-represented among the employees that were laid-off (Appleton et al., 2002;Giles et al., 2006) but simultaneously the demand for them increased in the export-oriented, and highlylabor intensive, industries.
5In 2005, the pension scheme covered 17 percent of the urban workforce, and unemploymentinsurance covered 14 percent (NBS, 2006, pp. 43, 201). Overall health insurance coverage actuallydecreased between 1998 and 2003, as mainstream cover fell more sharply than the increase in commer-cial and other non-commercial insurances (Xu et al., 2007).
6Guidelines call for a total of 24 percent of the payroll to be directed to pensions accounts (Jacksonet al., 2009), 16 percent to the housing accumulation funds (by 2003; Wang et al., 2005), 2–6 percent tomedical insurance (Xu et al., 2007), and 2 percent to unemployment insurance (Vodopivec and Tong,2008).
Review of Income and Wealth 2012
© 2012 The AuthorReview of Income and Wealth © International Association for Research in Income and Wealth 2012
4
slightly less than 20 percent, which was fairly constant over this period (Gustafssonand Li, 2000; Shu and Bian, 2003; Bishop et al., 2005; Démurger et al., 2007). Thisresult is corroborated by the findings of researchers using data from the UrbanHousehold Survey between 1988 and 1999 (Ng, 2004). Xu et al. (2006) report aslightly larger gap, 32 percent, in two recently urbanized towns in Zhejiang Prov-ince between 1999 and 2000. This is similar to Dong and Zhang’s (2009) findingbased on late 1990s firm-level data.
With respect to the size of the wage gap across educational categories, anumber of studies report a smaller gender difference among highly educatedemployees (Gustafsson and Li, 2000; Hughes and Maurer-Fazio, 2002; Xu et al.,2006). Many studies have also focused on differences in the gender wage gap acrossownership sectors, as motivated by the ongoing market transition of the Chineseeconomy. Xu et al. (2006) find the widest wage gap in privately owned enterprises,while Maurer-Fazio and Hughes (2002) and Maurer-Fazio et al. (1999) obtain thesame result for firms registered as joint ventures. The studies by Liu et al. (2000)and Hughes and Maurer-Fazio (2002) add evidence that the widest wage gaps existin the most marketized ownership sectors. However, their results show that alarger proportion of the wage gaps in these sectors are unexplained by observedworker characteristics. Rozelle et al. (2002) do not find any systematic associationbetween the level of wage discrimination and the degree of market orientation byindustry or ownership. Finally, the firm-level study by Dong and Zhang (2009)demonstrates that women are rewarded in accordance with their productivity inprivate firms but over-compensated compared to their productivity in the state-owned sector.
The share of the gender wage gap that is not explained by gender-relatedproductivity proxies in the wage equation is generally large in the previous studies:over 50 percent in some cases (Gustafsson and Li, 2000; Shu and Bian, 2003;Bishop et al., 2005), and above 75 percent of the gap in others (Liu et al., 2000;Rozelle et al., 2002; Wang and Cai, 2008). This evidence for substantial gender-based wage discrimination is contested by Dong and Zhang’s (2009) study of firms.They show that women’s estimated wages, although lower than men’s, are notstatistically different from their estimated productivity.
3. Analysis of Earnings Discrimination with Firm-Level Data
Following Hellerstein and Neumark (1999), I use firm-level data to analyzethe difference between women’s and men’s marginal wages and productivities.First, the production of firms, in value added terms, is expressed using a Cobb–Douglas production function in capital (K) and labor (L).7 The labor input isrepresented by a quality of labor index
7As discussed by Griliches and Ringstad (1971), the value added specification of the productionfunction improves comparability of data across industries and across establishments within industries.It also allows greater comparability when industries or establishments differ in the degree of verticalintegration, and can be derived from quite polar production function specifications: one in which theelasticity of substitution between materials and value added is infinite (i.e., Y = f(K, QL) + M); and onein which this elasticity of substitution is zero (so that materials have to be used in a fixed proportion tooutput).
Review of Income and Wealth 2012
© 2012 The AuthorReview of Income and Wealth © International Association for Research in Income and Wealth 2012
5

QL M F M FU FU U MS S MS S= + + +φ φ φ ,(1)
where Fj and Mj are the number of skilled, j = S, or unskilled, j = U, female ormale employees. Hence, using natural logarithms, the full production function isexpressed as
ln ln ln ln .VA A K M F M FK L U FU U MU S FS S( ) = ( ) + ( ) + + + +[ ]′α α φ φ φ(2)
The specification of the quality of labor index implies that members of thefour gender–skill groups are perfectly substitutable inputs, but that the marginalproductivities of the groups may differ. The fij parameters denote the averagemarginal productivity compared to male unskilled workers for the three otherdemographic groups: unskilled females, skilled females, and skilled males. Inthis setting, fFU = fMS = fFS = 1 would indicate that all four gender–skill groupscontribute equally to the firm’s output. Alternatively, fFU = 0.75 would imply thatthe average marginal productivity of female unskilled employees is 75 percent ofthat of their male unskilled co-workers. Letting L represent total firm employmentsuch that MU = L - FU - MS - FS, we can rewrite (2) as
ln ln ln lnVA A K L F M FK L FU U MS S FS S( ) = ( ) + ( ) + + −( ) + −( ) + −( )[′α α φ φ φ1 1 1 ]].(3)
We next turn to the estimation of relative differentials for work compensa-tion. A firm-level wage equation is set up in the form of a Mincer-type earningsequation:
ln ln ln ,W QL L F M FT FU U MS S FS S( ) = + ( ) = + + −( ) + −( ) + −( )[ ]λ λ λ λ λ0 0 1 1 1(4)
where the dependent variable is the total wage bill, or the total amount of workercompensation, paid by the firm.8 Analogous to the specification of the productionfunction, the parameters lij denote the relative average wages of the threegender–skill groups compared to the wages of unskilled male workers. A vectorcomprising control variables is included in both equations. It incorporatesmeasures of geographical location, industry, size, age, ownership, unionization,and township-and-village enterprise status.
Whether worker groups are compensated in accordance with their productiv-ity is tested by comparing the estimated results of the production function (3) andof the wage equation (4). In practice, this means that the size of the relative averagewage parameters lij are compared to the relative average productivity parametersfij for each gender–skill group. Given the specification of the production function,is would be inconsistent with profit-maximizing or cost-minimizing behavior forfirms to employ workers if their wage cost surpasses their productive value to the
8To see how this firm-level function can be understood as an aggregation of individual-level wageequations over workers in the firm, consider the individual level wage equation wi = wMMi + wFFi wherewi is the wage of an individual worker with gender i, wM and wF are average wages, and Mi and Fi aredummy variables for females and males, respectively. Aggregating this function over the entire firm, thetotal wage bill is W = wM(L - F) + wFF, which can be expressed as W = wM [L + (lF - 1)F] where lF isthe average relative wage of women compared to men, wF / wM. Taking logs gives a simplified equivalentof equation (4), in which the constant corresponds to the average wage of men l0 = lnwM.
Review of Income and Wealth 2012
© 2012 The AuthorReview of Income and Wealth © International Association for Research in Income and Wealth 2012
6

firm. Hence, such deviations could imply that firms sacrifice some profits toindulge in discriminatory preferences across worker groups (Becker, 1971). Thedeviations could also imply a legacy of misallocation of labor during the plannedeconomy (Dong and Zhang, 2009), imperfect competition for labor, or that dis-tortions within the product or labor markets have prevented firms from achievingtheir profit-maximizing size (Hellerstein et al., 1999; Hellerstein and Neumark,2005; Fleisher et al., 2011).
We are also interested in the wage and productivity gaps between all women,skilled and unskilled, compared to all men. These are calculated by weighting theestimated wage and productivity gaps for the groups of skilled and unskilledworkers by the proportion of the workforce they represent in the sample of firms.Using the productivity gap as an example, the calculation becomes
φφ φ
φFFU FU FS FS
MU MS MS
P P
P P=
++
,(5)
where Pij is the proportion of employees with gender i and skill level j in theirrespective gender group.9
One limitation of the cross-sectional data is that we cannot distinguishbetween wage and productivity differences originating within or between firms. Amajor concern is that women may be sorted into lower paying and less productivefirms, resulting in a downward bias in the estimated gender differences in wagesand productivity. The latter part of this paper addresses this issue by re-estimatingthe model after separating firms into groups along the lines of three potentialdimensions: sorting by industry, ownership, and location.
There is also a concern that the gender–skill division of the firms’ laborforce may be correlated with unobserved firm or worker characteristics. Besidesthe estimation of fixed effects, robustness is assessed by controlling for unobservedand time varying productivity shocks (Olley and Pakes, 1996; Levinsohn andPetrin, 2003). The influence of unobserved worker effects when testing for equalrelative productivities and earnings should, however, be limited if the bias thatthey introduce in the estimated differentials in earnings and productivities run inthe same direction.10
Estimation of equations (3) and (4) is conducted simultaneously using thenon-linear seemingly unrelated regressions (NLSUR) method, which takesaccount of cross-equation correlation in the shocks to wages and output.
4. Data, Variables, and Summary Statistics
The data on industrial firms was collected by China’s National Bureau ofStatistics (NBS) in 2004.11 It covers all state-owned firms and all non-state firmswith annual sales above 5 million RMB (about US$750,000). Dividing the total
9So that PFU + PFU = 1 and PMU + PMS = 1.10For example, if the unobserved characteristic of tenure is likely to result in an upward bias in
both productivity and wages. These biases are then cancelled out when we compare one with the other.11This dataset is used by the NBS to compile the Industry section of the China Statistical Yearbook
and industry specific reports in the China Markets Yearbook.
Review of Income and Wealth 2012
© 2012 The AuthorReview of Income and Wealth © International Association for Research in Income and Wealth 2012
7

value added of the firms in the dataset by the total industrial value added reportedin China’s Statistical Yearbook indicates that the dataset accounts for more than 90percent of the total.
To ensure high data quality, I follow the cleaning procedure of Jefferson et al.(2008) and omit firms that report zero employment, firms with fewer than eightworkers, firms in the upper and lower tails of productivity,12 and those with a ratioof value added to productivity that is above one or below zero. This procedureremoves 11,807 firms and leaves 257,721.
Summary statistics are reported in Table 1. They show that the average firmhas 248 employees, of whom 40 percent are female. Defining a skilled worker ashaving completed more than 12 years of education, the average share of skilledmale employees (8 percent) is twice the share of female skilled employees (4percent). The bottom row of Table 1 shows the proportion of firms reportingnon-zero expenditures on three non-salary items: (i) pensions and medical insur-ance; (ii) unemployment and labor insurance, and (iii) housing accumulation fund.Using this definition of social insurance participation, 12 percent of all firms arefound to participate.
Detailed information on firms’ registered ownership is used to aggregate theminto six larger ownership sectors (as detailed in Table A1 in the Appendix).According to this categorization, 8.3 percent of the firms are state-owned, 9.6percent collective owned, 44.1 percent private domestically owned, 10.5 percentfunded by entities based in Hong Kong, Macao, or Taiwan (HKMT), and anadditional 10.5 percent funded by entities in foreign countries. The remaining 17percent are classified as having “mixed” ownership.13
The lowest share of female employees is found in the state-owned sector (33percent). Somewhat higher shares are noted for the collective (35 percent) orprivate (40 percent) sectors, and the highest shares in firms with investment fromforeign (48 percent) or HKMT-based entities (49 percent). Not surprisingly, state-owned firms are on average larger, older, and more likely to participate in thesocial insurance programs. It is also noteworthy that the highest average wage ispaid in the foreign and HKMT-owned sectors, while the lowest wages are foundamongst private domestic and collective owned firms.14
Summary statistics for industrial sub-sectors are given in the Appendix,Table A2. They are calculated after first grouping firms according to the 14 indus-try ex-factory price index categories used in China’s statistical publications. Thepercentage of female workers differs radically across sectors, ranging from 9percent in the coal industry to 73 percent in the tailoring sector.
12After computing ratios of value added to labor and capital, and ratios of labor and capital tovalue added, I delete firms for which the computed values for each of these four variables is more thanfour standard deviations above the mean of each measure.
13Jefferson and Su (2006) argue that formal ownership registration is an unreliable measure ofactual firm control. Examining the share of firm assets held by the Chinese state and by non-mainlandentities in the different ownership categories however shows that an alternative ownership categoriza-tion based on this variation would only differ slightly from the one based on registration.
14The standard measure of China’s urban wage (gongzi) includes a range of subsidies such as: formeals, transport, dormitory living expenses, bonus payments, overtime pay, and danger or hardshippay (for a complete list of items, see Banister, 2005).
Review of Income and Wealth 2012
© 2012 The AuthorReview of Income and Wealth © International Association for Research in Income and Wealth 2012
8

TA
BL
E1
Sum
ma
ry
Sta
tis
tic
s
All
Fir
ms
Stat
eO
wne
dC
olle
ctiv
eO
wne
dP
riva
teD
omes
tic
HK
MT
-F
inan
ced
For
eign
Ow
ned
Mix
edO
wne
rshi
p
Num
ber
offir
ms
257,
721
21,4
7724
,732
113,
498
26,9
6327
,139
43,9
12(s
hare
ofto
tals
ampl
e)(1
00)
(8.3
)(9
.6)
(44,
1)(1
0.5)
(10.
5)(1
7.0)
Log
valu
ead
ded
(¥10
00)
8.75
8.67
8.62
8.42
9.13
9.38
9.10
Log
capi
tal(
¥10
00)
8.16
8.95
7.81
7.65
8.54
8.77
8.65
Mon
thly
per
wor
ker
(¥)
1,07
31,
192
945
917
1,25
21,
559
1,05
7E
mpl
oym
ent
248
601
171
129
322
310
344
Pro
port
ion
offe
mal
eem
ploy
ees
0.40
0.33
0.35
0.40
0.49
0.48
0.36
Pro
port
ion
ofm
ale
unsk
illed
empl
oyee
s0.
520.
530.
590.
530.
430.
400.
53P
ropo
rtio
nof
mal
esk
illed
empl
oyee
s0.
080.
130.
060.
070.
080.
120.
11P
ropo
rtio
nof
fem
ale
unsk
illed
empl
oyee
s0.
360.
270.
330.
370.
450.
420.
31P
ropo
rtio
nof
fem
ale
skill
edem
ploy
ees
0.04
0.06
0.02
0.03
0.04
0.06
0.05
Fir
mag
e(y
ears
)8.
522
.913
.75.
66.
75.
88.
3T
owns
hip
orvi
llage
ente
rpri
se0.
170.
380.
660.
000.
080.
080.
35P
ropo
rtio
nof
unio
nize
dfir
ms
0.46
0.83
0.53
0.36
0.41
0.43
0.58
Soci
alin
sura
nce
part
icip
atio
n(p
ropo
rtio
n)0.
120.
390.
090.
030.
120.
260.
18P
ropo
rtio
nof
soci
alin
sura
nce
into
talw
age
cost
0.11
0.31
0.11
0.05
0.09
0.13
0.13
Not
es:
Soci
alin
sura
nce
part
icip
atio
nis
defin
edas
the
firm
repo
rtin
gno
n-ze
roye
arly
expe
ndit
ures
for:
(i)
unem
ploy
men
tor
labo
rin
sura
nce;
(ii)
pens
ion
and
med
ical
insu
ranc
e;an
d(i
ii)ho
usin
gfu
nds.
Em
ploy
ees
wit
hm
ore
than
12ye
ars
ofed
ucat
ion
are
defin
edas
“ski
lled.
”
Review of Income and Wealth 2012
© 2012 The AuthorReview of Income and Wealth © International Association for Research in Income and Wealth 2012
9

5. Wages, Productivity and Discrimination of Female Employees
5.1. Baseline Results
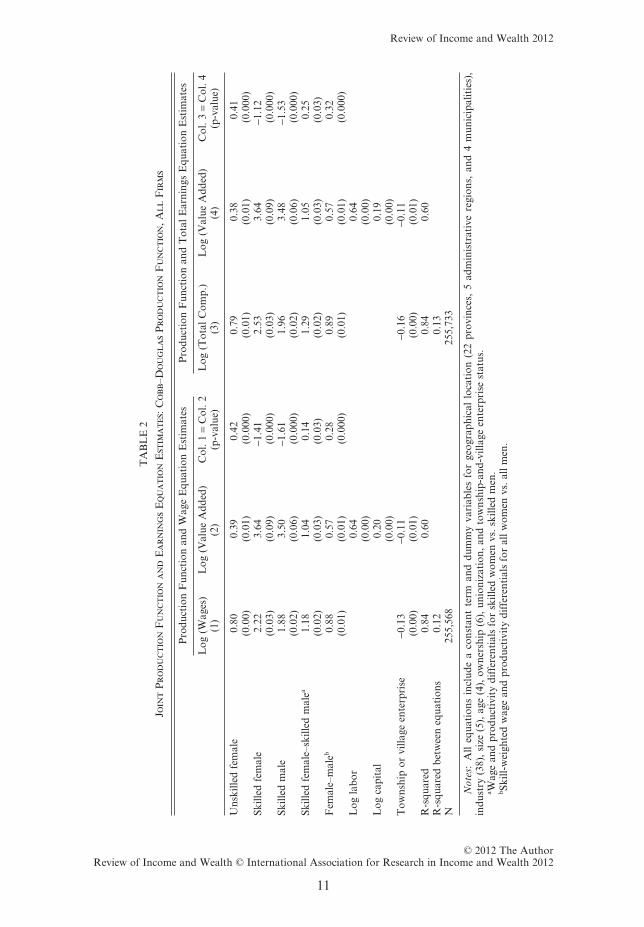
The benchmark results are presented in Table 2. Columns 1 and 2 containestimates derived by jointly estimating the production function (3) and the wageequation (4) for the full sample, with the total wage bill being the dependentvariable in the wage equation. Row 5 contains the gender wage gap weighted byeducational attainment. It is calculated to be 12 percent, which is narrow froman international perspective. Using similar data and methodologies, Hellersteinand Neumark (2005) report that women earn 38 percent less than men in theU.S.; Bartolucci and Alberto (2010) find a 34 percent gender wage gap in the caseof Germany; and Asano and Kawaguchi (2007) find a 70 percent gap in the case ofJapan. The narrow gap in the Chinese case may suggest that, at least on average, theMaoist ideology of equal pay has been maintained during the economic transition.
Dividing employees by skill level reveals a stark difference in women’s relativewages. The estimate in Row 1 shows that women with less than 12 years of educationearn on average 20 percent lower wages than their male counterparts. For womenwith 12 years of education or below, the situation is reversed. In Rows 2 and 3 we seethat workers of both genders are rewarded for their educational attainments, butthat the reward is 14 percent larger for women (Row 4).15 This result mirrors someprevious studies on Chinese individual level data which have found greater educa-tion premiums for women than men (Maurer-Fazio, 1999; Li, 2003).
The wage estimates for highly educated workers can be used to approximatethe wage premium of one additional year of schooling. This is done by simplydividing the premium of being “skilled” with the average number of additionalyears of schooling attained by the workers in this group.16 The calculation suggestsan education premium for men of 12–16 percent for men, and 16.5–22 percent forwomen. These numbers are slightly higher than those reported using the 2002CHIP household data (Zhang et al., 2005), but similar in size to the findings inQian and Smyth’s (2005) analysis of data from China’s Institute of Labor Studies.The latter study finds an average return to one additional year of schooling of12.06 percent in the full sample, and 17.16 percent for employees aged below 35.
Arguably, comparing the return to schooling for the employees to the returnto schooling for the firm (in terms of productivity) gives an indication of whetherthe social gains of an educated workforce match the employee’s payoffs for invest-ments in education. Fleisher et al. (2011) conduct this comparison for 998 manu-facturing firms for the years 1998–2000. Similar to the results produced by these
15This result is not the consequence of skilled women receiving more on-the-job training thanskilled men. The benchmark results are robust to estimation in a sub-sample including only the 144,666firms with zero expenditure on worker education.
16The composition of educational attainment levels among skilled men and women is as follows.Among skilled men: graduate studies (18 years, 2 percent); undergraduate university (16 years, 25percent); professional school “Dazhuan” (15 years, 73 percent). Among unskilled men: high school (12years, 44 percent); junior high school or below (5 or 8 years, 56 percent). Among skilled women:graduate studies (18 years, 1 percent); undergraduate university (16 years, 18 percent); professionalschool “Dazhuan” (15 years, 81 percent). Among unskilled women: high school (12 years, 41 percent);junior high school or below (5 or 8 years, 59 percent). The higher and lower “bound” for the calculationis determined by the average years of schooling assumed for workers having attained “junior highschool or below,” set to lie in the interval 5 to 8 years.
Review of Income and Wealth 2012
© 2012 The AuthorReview of Income and Wealth © International Association for Research in Income and Wealth 2012
10
TA
BL
E2
Join
tP
ro
du
ct
ion
Fu
nc
tio
na
nd
Ea
rn
ing
sE
qu
at
ion
Est
ima
tes
:Co
bb
–Do
ug
la
sP
ro
du
ct
ion
Fu
nc
tio
n,A
ll
Fir
ms
Pro
duct
ion
Fun
ctio
nan
dW
age
Equ
atio
nE
stim
ates
Pro
duct
ion
Fun
ctio
nan
dT
otal
Ear
ning
sE
quat
ion
Est
imat
es
Log
(Wag
es)
(1)
Log
(Val
ueA
dded
)(2
)C
ol.1
=C
ol.2
(p-v
alue
)L
og(T
otal
Com
p.)
(3)
Log
(Val
ueA
dded
)(4
)C
ol.3
=C
ol.4
(p-v
alue
)
Uns
kille
dfe
mal
e0.
800.
390.
420.
790.
380.
41(0
.00)
(0.0
1)(0
.000
)(0
.01)
(0.0
1)(0
.000
)Sk
illed
fem
ale
2.22
3.64
-1.4
12.
533.
64-1
.12
(0.0
3)(0
.09)
(0.0
00)
(0.0
3)(0
.09)
(0.0
00)
Skill
edm
ale
1.88
3.50
-1.6
11.
963.
48-1
.53
(0.0
2)(0
.06)
(0.0
00)
(0.0
2)(0
.06)
(0.0
00)
Skill
edfe
mal
e–sk
illed
mal
ea1.
181.
040.
141.
291.
050.
25(0
.02)
(0.0
3)(0
.03)
(0.0
2)(0
.03)
(0.0
3)F
emal
e–m
aleb
0.88
0.57
0.28
0.89
0.57
0.32
(0.0
1)(0
.01)
(0.0
00)
(0.0
1)(0
.01)
(0.0
00)
Log
labo
r0.
640.
64(0
.00)
(0.0
0)L
ogca
pita
l0.
200.
19(0
.00)
(0.0
0)T
owns
hip
orvi
llage
ente
rpri
se-0
.13
-0.1
1-0
.16
-0.1
1(0
.00)
(0.0
1)(0
.00)
(0.0
1)R
-squ
ared
0.84
0.60
0.84
0.60
R-s
quar
edbe
twee
neq
uati
ons
0.12
0.13
N25
5,56
825
5,73
3
Not
es:
All
equa
tion
sin
clud
ea
cons
tant
term
and
dum
my
vari
able
sfo
rge
ogra
phic
allo
cati
on(2
2pr
ovin
ces,
5ad
min
istr
ativ
ere
gion
s,an
d4
mun
icip
alit
ies)
,in
dust
ry(3
8),s
ize
(5),
age
(4),
owne
rshi
p(6
),un
ioni
zati
on,a
ndto
wns
hip-
and-
villa
geen
terp
rise
stat
us.
a Wag
ean
dpr
oduc
tivi
tydi
ffer
enti
als
for
skill
edw
omen
vs.s
kille
dm
en.
b Skill
-wei
ghte
dw
age
and
prod
ucti
vity
diff
eren
tial
sfo
ral
lwom
envs
.all
men
.
Review of Income and Wealth 2012
© 2012 The AuthorReview of Income and Wealth © International Association for Research in Income and Wealth 2012
11

authors, the estimates in Table 2 shows that the marginal products of the highlyeducated are much larger than their wages. Although this result is common to allprevious studies using the statistical method applied in this paper (e.g. Hellersteinand Neumark, 1999, 2005; Hellerstein et al., 1999; Dong and Zhang, 2009), itremains puzzling. A likely explanation in the Chinese case lies in the substantialrestrictions the labor mobility that stem from an underdeveloped labor marketcoupled with the institutional barriers of the Hukou system, which together pro-hibit workers from efficient wage bargaining. Fleisher et al. (2011) also argue thatstate-controlled firms in particular hold monopsony power that allows them tounder compensate skilled workers. For non-state firms, constraints on borrowing,land-use, and electricity (power) may prevent them from reaching their profit-maximizing size, thus depressing the demand for skilled labor.17
To address the question of wage discrimination, I compare the relative wagesand productivities of female workers. The estimates suggest that women are notdiscriminated against. Similar to the results found by Dong and Zhang (2009),women’s average productivity falls behind their marginal wage. As noted above,skilled women are under-compensated compared to their wages. The “over-payment” of women thus stems from employees with high school education orbelow. Interpreting this result using Becker’s (1971) framework would suggest thatthe average manager prefers to hire female unskilled workers over male unskilledworkers. Such a preference is a well-established feature of globalizing anddeveloping industrial labor markets, and the phenomenon has been coined the“feminization of labor” (Standing, 1989, 1999). In China, it has been documentedqualitatively as a result of managers’ striving for workforce control (Lee, 1995;Pun, 2005; Xue, 2008).
Importantly, great caution is merited when interpreting the wage and produc-tivity differentials as stemming from differences within firms. Key aspects of theworkforce composition, such as occupations, are not available in the presentdataset. There are however insights to be had from dividing the sample along themain dimensions of firm heterogeneity–ownership, industry, and region–to furtherexplore how Chinese women are faring in different areas of the transitional labormarket.
5.2. Robustness Checks
Some robustness checks of the baseline results are in order. Although thecoefficients for capital and labor are both highly significant and of magnitudes thatseem plausible, I apply the Olley and Pakes (1996) and Levinsohn and Petrin (2003)methods to control for bias stemming from unobserved productivity shocks beingcorrelated with the firms’ input choices. In particular, if female labor adjusts morespeedily than male labor to unobserved productivity shocks, there could be anupward bias in the relative wage and productivity estimates for women. The resultsshow that the Olley–Pakes and Levinsohn–Petrin estimates of the relative femalewages and productivity are almost identical to the results without proxy variables
17Evidence abounds on the issue of borrowing constraints; see, for example, Poncet et al. (2010).
Review of Income and Wealth 2012
© 2012 The AuthorReview of Income and Wealth © International Association for Research in Income and Wealth 2012
12

when using the limited sub-samples required by the data demands of these methods(not reported).
The lack of information about work hours could be a potential source of errorin the quality of the labor index. Relying on a count variable of male and femaleworkers when measuring labor input will yield misleading results if the number ofhours worked differs by gender. I use individual-level data on work hours from the2002 China Household Income Project (CHIP) to calculate labor input weightsfor each gender–skill group and for each ownership sector.18 These weights confirmthat employees with higher levels of education work fewer hours per week, andthat in foreign-owned firms, female unskilled employees work longer hours thantheir male colleagues (see Table A3). Panel A in Table A4 presents the results ofthe robustness check, showing that the main results remain unaltered.
It has been argued that technological change is gender-biased due toimprovements in firm productivity leading to the dismissal of (generally male)production labor (Berman et al., 1994; Dunne et al., 1997). Under such circum-stances, the productivity of females would be overestimated due to the positivecorrelation between the proportion of women and productivity enhancingtechnological change. Panel B in Table A4 examines this hypothesis by dividingthe data into two sub-samples based on the median proportion of women. If thehypothesis is true, controlling for the proportion of females, by splitting thesample in this way, should yield larger gender differences in productivity. Com-paring the estimation results within the two sub-samples to the baseline inTable 2, however, shows that the skill-weighted average gender-difference inproductivity remains roughly constant.
A final robustness check is carried out to examine differential gender wageeffects of unionization. In China, labor unions are responsible, by law, for moni-toring firms’ compliance with anti-discriminatory laws and regulations. If union-ization is correlated with the proportion of male workers, men’s wages couldreceive a higher degree of protection than women’s. Empirical research has pro-vided evidence of higher wages and social insurance coverage in unionized firms(Yao and Zhong, 2011). However, dividing firms according to unionization showsno statistically significant differences in the estimates for the 119,788 unionizedand the 137,933 non-unionized firms (results not reported).
5.3. Does Social Insurance Coverage Contribute to a Wider GenderGap in Earnings?
To examine whether non-wage compensation provided by firms contributesto a wider gap in gender earnings, the sum of the firms’ expenditures on socialinsurance payments is added to the wage measure in equation (4) before jointestimation with the production function. Using the entire sample of firms, of whicha large proportion evade program participation, I first examine the combinedeffect of women receiving fewer benefits within firms, and the potential over-representation of women within non-participating units. The results are shown inthe three rightmost columns in Table 2. Comparing the estimated gender gap in
18The HKMT and mixed ownership sectors are excluded due to a lack of unambiguous ownershipinformation for these sectors in the CHIP data.
Review of Income and Wealth 2012
© 2012 The AuthorReview of Income and Wealth © International Association for Research in Income and Wealth 2012
13
total earnings (Column 3) to the gender gap in wages, contained in Column 1,yields no statistically significant difference.
Examining the earnings gaps for unskilled and skilled workers separatelyshows no evidence of gender polarization of non-wage earnings for unskilledworkers. For skilled workers, the estimates in Rows 2 and 3 of Column 3 show thatnon-wage compensation appears to be distributed in favor of workers with higherlevels of education. This observation is in accordance with incentives for firms toreduce turnover costs by providing skilled workers with social insurances whichwere, at least in 2004, generally not transferable between workplaces. Skilledwomen are more likely to receive social insurance than skilled men. Their earningsadvantage over their male counterparts grows from 18 to 29 percent when takingaccount of non-wage compensation.
I next exclude firms that do not participate in the social insuranceprograms from the sample, leaving 31,554 firms. This implies an analysis ofwhether women receive fewer benefits within firms, while excluding the effectof firm non-participation. Among these participating firms, the average ratio ofnon-wage benefits to wages is quite high: 0.37. But, as shown in Panel A, Table A5,the baseline estimates remain largely unaltered in this sample. Including socialinsurance payments in the earnings measure does not yield a wider gender gap inwork compensation. For skilled workers, there is however an added insight. In thissmaller sample there is not a statistically significant difference between the gendergap with respect to wages or total earnings for the skilled worker group. Hence,rather than receiving more non-wage compensation within firms, skilled womenappear to gain a social insurance advantage by being more likely to work inparticipating firms.
China’s social insurance system is highly fragmented. In many regions,workers with temporary contracts (often migrants) lack rights to insurance coveror are only entitled to inferior insurance packages. Several robustness checks arecarried out to ascertain whether the small effect of social insurances on the baselinegender gap in wages is not caused by an understating of the total earnings bill. InTable A5, Panel B, I first use data from Guangdong province only (32,545 obser-vations). Since the late 1990s, this province has taken the lead in requiring firms toprovide equal insurance cover for temporary and permanent contract workers(Zhang et al., 2010). Next, in Panel C, I exclude the most likely employers ofmigrant labor, namely private domestic firms, from the sample of participatingfirms used in Panel A. Results from both these sub-samples corroborate previousfindings of a statistically non-significant insignificant difference between thegender gap in wages and total earnings.19
It is worthwhile to provide some descriptive statistics as a backdrop tothe econometric findings in this section. Industrial sector and firm ownershipare two important dimensions of both female employment and social insuranceparticipation. As described above, women—and especially skilled women—are
19The same result is found when instead excluding: (i) all rural firms, i.e. firms under the admin-istrative subordination of a township or village council, or that of a street committee; (ii) firms with abelow-median ratio of insurance expenditures to wages plus all firms with zero social insurance costs;(iii) firms in the Eastern region (Beijing, Tianjin, Hebei, Liaoning, Shanghai, Jiangsu, Fujian, Shan-dong, Guangdong, and Hainan); and (iv) firms with an above-median share of unskilled workers.
Review of Income and Wealth 2012
© 2012 The AuthorReview of Income and Wealth © International Association for Research in Income and Wealth 2012
14

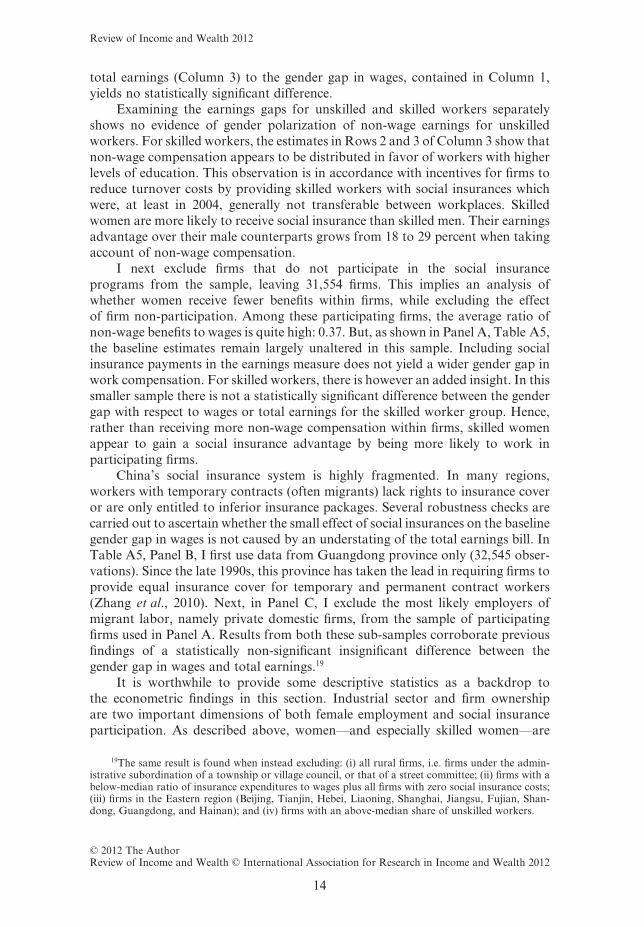
over-represented in foreign and HKMT-owned firms, and these sectors also showabove-average levels of social insurance participation. In Figure 1, I plot the shareof females and the share of firms participating in the pension and medical insur-ance programs for each of 13 industrial sectors ordered by labor intensity. Thefigure illustrates a heavy over-representation of female workers in light industry,but these sectors are not less likely to participate in social insurance programs. Weshould however remember that the data used here contains only firms with annualsales above 5 million RMB and which are included in the formal work unitreporting system while excluding small and informal industrial workplaces.
6. Industry and Ownership Specific Results
6.1. Ownership
Table 3 presents results obtained by jointly estimating equations (3) and (4)by ownership sector. The estimates of the skill-weighted average gender wage gaps(Row 5) show the widest gap in the foreign (16 percent) and HKMT-owned firms(21 percent), while narrower gaps are found among state-owned firms (12 percent),private firms (10 percent), and collective-owned firms (8 percent). This variationcorroborates the findings of previous studies which have documented wider thanaverage wage differences between men and women employed in the foreign-ownedsector (Maurer-Fazio et al., 1999; Liu et al., 2000; Hughes and Maurer-Fazio,2002; Xu et al., 2006).
00
.20
.40
.60
.8
Pet
roleum
Met
allurg
ical
Building
Mat
erials
Pow
er
Mac
hine
Building
Che
mical
Timbe
r
Food
Pap
er
Cultu
re a
nd E
duca
tion
Leat
her
Textile
Tailorin
g
Share of female employees Share of participating firms
Figure 1. Share of Female Employees and the Share of Firms Participating in the Medical and/orPension Programs by Industrial Sector in Order of Female Share
Review of Income and Wealth 2012
© 2012 The AuthorReview of Income and Wealth © International Association for Research in Income and Wealth 2012
15

Further insights are gathered by analyzing the results of the two educationgroups separately. It is noteworthy that women with less than 12 years of educa-tion face the largest wage disadvantage in the state-owned sector (28 percent) andsmaller disadvantages in foreign-owned (22 percent) and private domestic firms(13 percent). For this group of workers, who make up the vast majority of theindustrial workforce, the aggregate result of narrow wage gaps in the state-ownedsector is thus misleading. This narrow gap is the result of a wage advantage of
TABLE 3
Joint Production Function and Wage Equation Estimates: Cobb–Douglas ProductionFunction, by Ownership
Log(Wages)
(1)
Log(ValueAdded)
(2)
Column 1=
Column 2(p-value)
Log(Wages)
(3)
Log(ValueAdded)
(4)
Column 3=
Column 4(p-value)
State Owned Collective Owned
Unskilled female 0.72 0.48 0.24 0.86 0.30 0.56(0.03) (0.05) (0.000) (0.01) (0.03) (0.000)
Skilled female 2.44 3.46 -1.02 1.99 3.48 -1.51(0.11) (0.28) (0.000) (0.10) (0.38) (0.000)
Skilled male 2.18 3.95 -1.81 1.42 2.71 -1.32(0.07) (0.21) (0.000) (0.05) (0.21) (0.000)
Skilled female–skilled malea 1.12 0.87 0.25 1.40 1.28 0.12(0.05) (0.08) (0.002) (0.10) (0.19) (0.530)
Female–maleb 0.88 0.70 0.18 0.92 0.49 0.43(0.03) (0.05) (0.000) (0.02) (0.04) (0.000)
N 20,830 24,532
Foreign Owned HKMT Financed
Unskilled female 0.78 0.42 0.36 0.75 0.43 0.32(0.02) (0.02) (0.000) (0.01) (0.02) (0.000)
Skilled female 2.65 4.47 -1.82 2.10 3.57 -1.47(0.09) (0.27) (0.000) (0.08) (0.24) (0.000)
Skilled male 2.77 5.00 -2.21 2.15 3.96 -1.81(0.07) (0.25) (0.000) (0.06) (0.21) (0.000)
Skilled female–skilled malea 0.95 0.90 0.05 0.98 0.90 0.07(0.04) (0.04) (0.348) (0.05) (0.05) (0.336)
Female–maleb 0.84 0.67 0.17 0.79 0.57 0.21(0.02) (0.03) (0.000) (0.01) (0.03) (0.000)
N 27,024 26,893
Private Owned Mixed Ownership
Unskilled female 0.87 0.39 0.48 0.79 0.35 0.44(0.01) (0.01) (0.000) (0.01) (0.02) (0.000)
Skilled female 1.70 3.50 -1.80 2.30 3.54 -1.23(0.04) (0.17) (0.000) (0.07) (0.23) (0.000)
Skilled male 1.45 2.89 -1.44 1.89 3.43 -1.51(0.02) (0.09) (0.000) (0.04) (0.14) (0.000)
Skilled female–skilled malea 1.17 1.21 -0.04 1.21 1.03 0.18(0.04) (0.08) (0.616) (0.05) (0.08) (0.029)
Female–maleb 0.90 0.57 0.37 0.90 0.61 0.28(0.01) (0.02) (0.000) (0.02) (0.03) (0.03)
N 112,859 43,547
Notes: All equations include a constant term and dummy variables for geographical location (22 provinces, 5administrative regions, and 4 municipalities), industry (38), size (5), age (4), unionization, R&D expenditure perworker, township-and-village enterprise status.
aWage and productivity differentials for skilled women vs. skilled men.bSkill-weighted wage and productivity differentials for all women vs. all men.
Review of Income and Wealth 2012
© 2012 The AuthorReview of Income and Wealth © International Association for Research in Income and Wealth 2012
16

female skilled employees in this sector rather than a more equal wage structure forless educated workers. As such, the results point out the importance of skilldisaggregation in analyzing the impact of Chinese industry’s ownership transitionon gender wages. For unskilled women, the results thus suggest that the state-sector was not an efficient advocate for equal pay.
I next compare how the relative wages of skilled and unskilled women matchtheir average productivity across sectors. For women with limited education, theresults show that wages exceed productivity in all six ownership groups. For highlyeducated women, average wages match average productivity in all sectors exceptstate-owned and mixed ownership firms. In the case of the state-owned firms, thisresult is consistent with the reasoning of Dong and Zhang (2009). They argue thatthe legacy of the planned economy, which involved disregarding the average lowerphysical capacity of female workers while maintaining gender-equal wages,resulted in a systematic overcompensation of women in comparison to their pro-ductivity contributions.
The finding that firms in the private and foreign-owned sectors also payunskilled women wages that exceed their contributions to firm productivity is inaccordance with the abovementioned employer preference. Production of lightmanufacturing goods for the global market is often gender-segregated, with womenoccupying the seats along the assembly lines. Qualitative research has shown thatworkforce control constitutes a major motivation for this organization. In the eyesof the employers, women are perceived as more docile, obedient, and easily con-trolled (Lee, 1995; Pun, 2005; Xue, 2008). The gender preference is further enforcedby the use of single-sex dormitories, which provide added control and form part ofthe workforce organization of many workplaces (Pun and Smith, 2006).
6.2. Industrial Sector
Figure 1 illustrated that the female labor is highly segregated across indus-tries. Women make up less than a third of the workforce in the metallurgical,petroleum, power, timber, and coal industries, but more than two thirds in thetailoring and textile sectors. By estimating the production and wage equations byindustry, I can conduct a basic examination of whether some industrial sector(s)is(are) driving the benchmark. Effects of this type have been hypothesized byprevious research, for example as a downward push on women’s relative wagesfrom the “feminization” of industries in developing and globalizing economies(e.g. Seguino, 2000).
The results give little evidence in this regard. Instead, quite the opposite trendemerges when plotting the estimates for women with less than 12 years of educa-tion (Figure 2).20 The gender wage gap is narrower in more labor intensive indus-tries, and in several female dominated industries such as tailoring and textiles, nostatistically significant gender wage gap is found.21 Although this result could be
20For skilled workers, the figure shows no consistent pattern, and the estimates are imprecisebecause of the smaller sample sizes. These results are therefore left out to preserve space.
21The results for the coal industry are however probably spurious. Firms in this industry areoutliers with respect to the dominance of state ownership, firm age, and the low average proportion offemale workers (9 percent) and skilled workers (4 percent).
Review of Income and Wealth 2012
© 2012 The AuthorReview of Income and Wealth © International Association for Research in Income and Wealth 2012
17

interpreted as women faring relatively better in these sectors, it is worth remem-bering that wages are only one of many aspects associated with a job. As argued inprevious studies, women in the “new” industrial economy may be systematicallyhired to fill the more precarious jobs with poor job security (Cooke, 2001; Razavi,2007), and may face exploitative working conditions (Berik et al., 2007; Burda,2007; Pun, 2007). Another caveat lies in potentially relevant, but missing, vari-ables. If firms in the light industrial sectors hire younger workers of both genders,this could explain narrower productivity and wage gaps if women’s productivity isdifferentially affected by family responsibilities later in life.
There is a clear productivity disadvantage associated with unskilled womenacross all 14 industrial sectors. In addition, unskilled women consistently haveaverage wages that exceed their average productivity. It is noteworthy that thelatter result applies not only to heavy industrial sectors, but also to light manu-facturing. As such, it yields further support for the hypothesis that there is anemployer preference for unskilled women in light and labor intensive industries.For the heavy industrial sectors, the “preference” for female workers, bothunskilled, and in some sectors also for skilled,22 adds support to Dong and Zhang’s(2009) conjecture regarding the legacy of a mismatch between female workers andjobs.
22Over-compensation of skilled women compared to their average productivity is observed in thetimber, power, and food sectors, all of which are sectors with firms that are older than average and morelikely to be state-controlled.
00
.51
ol
Petr
eum
l
Meta
lurg
ical
Che
mical
Pow
er
Bui
ldin
g mat
eria
ls
Mac
hin
e build
ing
Food
Tim
ber
Pap
er
Text
iles
Cultu
re a
nded
ucatio
n
Leath
er
Tailo
ring
Relative average wages of unskilled women compared to unskilled men
Relative average productivity of unskilled women compared to unskilled men
Figure 2. Estimates of Average Wages and Productivities of Unskilled Women Relative toUnskilled Men by Industrial Sector, Ranked by Labor Intensity
Review of Income and Wealth 2012
© 2012 The AuthorReview of Income and Wealth © International Association for Research in Income and Wealth 2012
18

6.3. Region
China’s strategy of market reform has been geographically uneven. Startingwith a few select special economic zones on the east coast, the liberalization oflabor and product markets was gradually extended first to wider coastal areas, andthen to inland and western locations. Numerous studies provide empirical supportfor a strong effect of the spatially diverse liberalization policy on economic growth(Chen and Feng, 2000), even when accounting for geography (Démurger et al.,2002), domestic investment (Jones et al., 2003), and agglomeration (Chen, 2009).
In an attempt to assess the effect of reform intensity on women’s relativewages and productivities, I estimate the wage and production functions for each ofChina’s regions (22 provinces, 4 self-governing municipalities, and 5 autonomousregions). To limit space I only report the results for workers with 12 years ofeducation or below. Figure 3 shows the estimated gaps in wages and productivityby region, with the regions ranked according to their GDP per capita in 2004 as aproxy for market reform intensity. Four regions with less than 1,000 observationsare excluded from the analysis.23
The horizontal fitted lines do not indicate a correlation between reform inten-sity and women’s relative wages or productivity. This result mirrors the findingof Xie and Hannum (1996) who found that the size of the gender wage gap isunrelated to city-level variation in industrial output growth.
23Qinghai (391), Ningxia Automonous Region (597), Tibet Autonomous Region (158), and theisland of Hainan (513).
00.5
1
Guizh
ou
Gan
su
Yun
nan
Gua
ngxi
Anhui
Sichu
an
Jian
gxi
Shaan
xi
Hun
an
Chon
gqing
Hen
an
Sha
nxi
Hub
eiJilin
Xinjia
ng
Inne
r Mong
olia
Heb
ei
Heilong
jiang
Liao
ning
Shand
ong
Fujian
Gua
ngdo
ng
Jian
gsu
Zhejia
ng
Tianjin
Beijin
g
Shang
hai
Relative average wages of unskilled women compared to unskilled men
Relative average productivity of unskilled women compared to unskilled men
Figure 3. Estimates of Average Wages and Productivities of Unskilled Women Relative toUnskilled Men by Region, Ranked According to Regional GDP Per Capita
Review of Income and Wealth 2012
© 2012 The AuthorReview of Income and Wealth © International Association for Research in Income and Wealth 2012
19

7. Conclusions
In this paper I used firm-level data from Chinese industrial firms to assessdifferences between men’s and women’s work compensation relating to educationlevel, firm ownership, industrial sector, and geographical location. By jointlyestimating wage and productivity functions, I also compared women’s relativewage to their relative contributions to firms’ value added.
The estimate of the nationwide gender wage gap showed that the averagewages of women employed in industrial firms were 12 percent lower than those ofmen. This gap is narrower than those found for other large economies in studiesusing firm-level data and similar methodologies, which could suggest that theMaoist ideology of gender equality has carried over into the period of markettransition. Adding social insurance payments to the wage bill was found notto yield further gender polarization in earnings. Descriptive evidence providedfurther understanding of this result by showing that women were not over-represented in industries with low compliance to social insurance regulations. Assuch, the results indicated that the fears of a female disadvantage in social insur-ance coverage could be exaggerated, at least among women in informal industrialemployment.
The estimates of the wage gaps by education level showed the overall disad-vantage of women stemmed from wage differences between employees with aneducation level of high school or below. By contrast, the education premium forwomen with above high school education was found to be larger than for theirskilled male colleagues. Interestingly, this result was driven by state-controlled andprivate domestic firms, while no gender wage gap among skilled workers wasfound in the foreign-owned sector. This sector difference illustrates the importanceof representative data with respect to ownership when investigating gender-relatedearnings in the Chinese transitional labor market.
Ownership specific results for the relative wages of unskilled female workersshowed greater wage disadvantages in state-owned and foreign invested firms, thuscontradicting the notion of the state sector as the protector of women’s rights. Thenarrowest wage gap was instead found in the private sector. Further understand-ing of this result was derived from a disaggregation by industry. The wage gap wasshown to be narrower in more labor intensive industries where firms are also morerecently established. This indicates that the relative wages for women with lowerlevels of education did not fall with the expansion of the consumer goods manu-facturing industry.
While the results showed that both men and women with above high schooleducation received wages that fell short of their productivity contributions, womenwith lower levels of education were found to be paid in excess of their contribu-tions. This result was consistent across industrial, regional, and ownership groups.For state controlled and heavy industrial firms, this result could be ascribed to alegacy of mismatching women with jobs, i.e. firms taking on more female “surplusworkers,” during the planned economy, as argued by Dong and Zhang (2009). Formore recently established light industrial and foreign-owned sectors, the persis-tence of a smaller, but nevertheless positive wage-premium can be understood as areflection of the gender segregated production processes observed by qualitative
Review of Income and Wealth 2012
© 2012 The AuthorReview of Income and Wealth © International Association for Research in Income and Wealth 2012
20

researchers. Firms prefer to hire young female labor because of their perceivedobedience, flexibility, and suitability for assembly line work.
Although the surplus labor and feminization explanations of the results areappealing, it is important to be cautious in the interpretation of estimates based oncross-sectional data. In particular, the contribution to the productivity differentialfrom the sorting of women into more labor intensive production structures, andinto certain occupations, should be thoroughly examined by future studies.
References
Altonji, J. and R. Blank, “Race and Gender in the Labor Market,” in O. Ashenfelter and D.Card (eds), Handbook of Labor Economics, vol. 3c, Elsevier North Holland, Oxford, 3144–213,1999.
Appleton, S., J. Knight, L. Song, and Q. Xia, “Labor Retrenchment in China: Determinants andConsequences,” China Economic Review, 13, 252–75, 2002.
Asano, H. and D. Kawaguchi, “Male-Female Wage and Productivity Differentials: A StructuralApproach using Japanese Firm-Level Panel Data,” REITI Discussion Paper No. 20, 2007.
Banister, J., “Manufacturing Earnings and Compensation in China,” Monthly Labor Review, August,2005.
Bartolucci, C. and C. C. Alberto, “Gender Wage Gaps Reconsidered: A Structural Approach usingMatched Employer-Employee Data,” Working Paper, Collegio Carlo Alberto, 2010.
Becker, G., The Economics of Discrimination, University of Chicago Press, Chicago and London, 1971.Berik, G., X. Dong, and G. Summerfield, “China’s Transition and Feminist Economics,” Feminist
Economics, 13, 1–33, 2007.Berman, E., J. Bound, and Z. Griliches, “Changes in the Demand for Skilled Labor Within
U.S. Manufacturing: Evidence from the Annual Survey of Manufacturing,” Quarterly Journal ofEconomics, 109, 367–98, 1994.
Bishop, J. A., F. J. Luo, and F. Wang, “Economic Transition, Gender Bias, and the Distribution ofEarning in Urban China,” Economics of Transition, 13, 239–60, 2005.
Burda, J., “Chinese Women after the Accession to the World Trade Organization: A Legal Perspectiveon Women’s Labor Rights,” Feminist Economics, 13, 259–85, 2007.
Chen, B. and Y. Feng, “Determinants of Economic Growth in China: Private Enterprise, Educationand Openness,” China Economic Review, 11, 1–15, 2000.
Chen, Y., “Agglomeration and Location of Foreign Direct Investment: The Case of China,” ChinaEconomic Review, 20, 549–57, 2009.
Cooke, F. L., “Equal Opportunities? The Role of Legislation and Public Policies in Women’s Employ-ment in China,” Women in Management Review, 16, 334–48, 2001.
Croll, E., Changing Identities of Chinese Women: Rhetoric, Experience, and Self-Perception in TwentiethCentury China, Hong Kong University Press and Zed Press, London, 1995.
Démurger, S., J. Sachs, W. Woo, S. Bao, and G. Chang, “The Relative Contributions of Location andPreferential Policies in China’s Regional Development: Being in the Right Place and Having theRight Incentives,” China Economic Review, 13, 444–65, 2002.
Démurger, S., M. Fournier, and Y. Chen, “The Evolution of Gender Earnings Gaps and Discrimina-tion in Urban China, 1988 and 1995,” Developing Economies, 45, 97–121, 2007.
Dong, X.-Y. and L. Xu, “Labor Restructuring in China: Toward a Functioning Labor Market,”Journal of Comparative Economics, 37, 287–305, 2009.
Dong, X.-Y. and L. Zhang, “Economic Transition and Gender Differentials in Wages and Productiv-ity: Evidence from Chinese Manufacturing Enterprises,” Journal of Development Economics, 88,144–56, 2009.
Dunne, T., J. Haltiwanger, and K. Troske, “Technology and Jobs: Secular Change and CyclicalDynamics,” Carnegie-Rochester Conference Series on Public Policy No. 46, 1997.
Fleisher, B. M., Y. Hu, H. Li, and S. Kim, “Economic Transition, Higher Education and WorkerProductivity in China,” Journal of Development Economics, 94, 86–94, 2011.
Giles, J., A. Park, and F. Cai, “Re-Employment of Dislocates Workers in Urban China: The Roles ofInformation and Incentives,” Journal of Comparative Economics, 34, 582–602, 2006.
Griliches, Z. and V. Ringstad, Economies of Scale in the Form of the Production Function, North-Holland Publishing Company, Amsterdam, 1971.
Gustafsson, B. and S. Li, “Economic Transformation and the Gender Earnings Gap in Urban China,”Journal of Population Economics, 13, 305–29, 2000.
Review of Income and Wealth 2012
© 2012 The AuthorReview of Income and Wealth © International Association for Research in Income and Wealth 2012
21

Hellerstein, J. K. and D. Neumark, “Wages, and Productivity: An Empirical Analysis of IsraeliFirm-Level Data,” International Economic Review, 40, 95–123, 1999.
———, “Using Matched Employer–Employee Data to Study Labor Market Discrimination,” IZADiscussion Paper No. 1555, 2005.
Hellerstein, J. K., D. Neumark, and K. R. Troske, “Wages, Productivity and Worker Characteristics:Evidence from Plant-Level Production Functions and Wage Equations,” Journal of Labor Eco-nomics, 17, 409–46, 1999.
Holz, C. A. and Y. Lin, “Pitfalls in China’s Industrial Statistics,” The China Review, 1, 29–71, 2001.Hughes, J. and M. Maurer-Fazio, “Effects of Marriage, Education and Occupation on the Female/
Male Wage Gap in China,” Pacific Economic Review, 7, 137–56, 2002.Jackson, R., K. Nakashima, and H. Neil, “China’s Long March to Retirement reform,” CSIS Report,
2009.Jefferson, G. H. and J. Su, “Privatization and Restructuring in China: Evidence from Shareholding
Ownership, 1995–2001,” Journal of Comparative Economics, 34, 146–66, 2006.Jefferson, G. H., T. G. Rawski, and Y. Zhang, “Productivity Growth and the Convergence Across
China’s Industrial Economy,” Journal of Chinese Economy and Business Studies, 6, 121–40, 2008.Jones, D. C., C. Li, and A. L. Owen “Growth and Regional Inequality in China During the Reform
Era,” China Economic Review, 14, 186–200, 2003.Korzec, M., Labor and the Failure to Reform in China, St. Martin’s Press, New York, 1992.Lee, C. K., “Engendering the Worlds of Labor: Women Workers, Labor Markets, and Production
Politics in the South China Economic Miracle,” American Sociological Review, 60, 378–97, 1995.Levinsohn, J. and A. Petrin, “Estimating Production Functions using Inputs to Control for Unobserv-
ables,” Review of Economic Studies, 70, 317–41, 2003.Li, H., “Economic Transition and Returns to Education in China,” Economics of Education Review, 22,
317–28, 2003.Liu, P.-W., X. Meng, and J. S. Zhang, “Sectoral Gender Wage Differentials and Discrimination in the
Transitional Chinese Economy,” Journal of Population Economics, 13, 311–52, 2000.Maurer-Fazio, M., “Earnings and Education in China’s Transition to a Market Economy: Survey
Evidence from 1989 and 1992,” China Economic Review, 10, 17–40, 1999.Maurer-Fazio, M. and J. Hughes, “The Effects of Market Liberalization on the Relative Earnings of
Chinese Women,” Journal of Comparative Economics, 30, 109–31, 2002.Maurer-Fazio, M., T. Rawski, and W. Zhang, “Inequality in the Rewards for Holding Up Half the
Sky: Gender Wage Gaps in China’s Urban Labour Market, 1988–1994,” China Journal, 41, 55–88,1999.
NBS (National Bureau of Statistics of China), Chinese Statistical Yearbook, China Statistics Press,Beijing, 2006.
Ng, Y. C., “Economic Development, Human Capital, and Gender Earnings Differentials in China,”Economics of Education Review, 23, 587–603, 2004.
Olley, G. S. and A. Pakes, “The Dynamics of Productivity in the Telecommunications EquipmentIndustry,” Econometrica, 64, 1263–97, 1996.
Poncet, S., W. Steingress, and H. Vanderbussche, “Financial Constraints in China: Firm-Level Evi-dence,” China Economic Review, 21, 411–22, 2010.
Pun, N., Made in China: Women Factory Workers in a Global Workplace, Duke University Press,Durham, NC, 2005.
———, “Gendering the Dormitory Labour System: Production and Reproduction and Migrant Laborin South China,” Feminist Economics, 13, 239–58, 2007.
Pun, N. and C. Smith, “The Dormitory Labour Regime in China as a Site for Control and Resistance,”International Journal of Human Resource Management, 17, 1456–70, 2006.
Qian, X. and R. Smyth, “Private Returns to Investment in Education: An Empirical Study of UrbanChina,” Post-Communist Economies, 20, 483–501, 2005.
Razavi, S., “Does Paid Work Enhance Women’s Access to Welfare: Evidence from Selected Industri-alizing Countries,” Social Politics, 14, 58–92, 2007.
Rozelle, S., X. Dong, L. Zhang, and A. Mason, “Gender Wage Gaps in Post-Reform Rural China,”Pacific Economic Review, 7, 157–79, 2002.
Seguino, S., “Gender Inequality and Economic Growth: A Cross-Country Analysis,” World Develop-ment, 28, 1211–30, 2000.
Shen, J., Labor Disputes and their Management in China, Chandos Publishing, Oxford, 2007.Shen, J. and X. Deng, “Gender-Wage Inequality in the Transitional Chinese Economy: A Critical
Review of Post-Reform Research,” Journal of Organizational Transformation and Social Change,5, 109–26, 2008.
Shu, X. L. and Y. J. Bian, “Market Transition and Gender Gap in Earnings in Urban China,” SocialForces, 81, 1107–45, 2003.
Review of Income and Wealth 2012
© 2012 The AuthorReview of Income and Wealth © International Association for Research in Income and Wealth 2012
22

Standing, G., “Global Feminization through Flexible Labor,” World Development, 17, 1077–95, 1989.———, “Global Feminization through Flexible Labor: A Theme Revisited,” World Development, 27,
583–602, 1999.Stockman, N., “Gender Inequality and Social Structure in China,” Sociology, 28, 759–77, 1994.Vodopivec, M. and M. H. Tong, “China: Improving Unemployment Insurance,” World Bank SP
Discussion Paper No. 0820, 2008.Wang, J., “Health Sector Reform in China: Gender, Equality and Social Justice,” in S. Razavi and S.
Hassim (eds), Gender and Social Policy in a Global Context: Uncovering the Gendered Structure of“the Social”, Palgrave, Basingstoke, 2006.
Wang, M. and F. Cai, “Gender Earnings Differential in Urban China,” Review of DevelopmentEconomics, 12, 442–54, 2008.
Wang, Y.-P., Y. Wang, and G. Bramley, “Chinese Housing Reform in State-Owned Enterprises and itsImpacts on Different Social Groups,” Urban Studies, 42, 1859–78, 2005.
Xie, Y. and E. Hannum, “Regional Variation in Earnings Inequality in Reform-Era Urban China,”American Journal of Sociology, 101, 950–92, 1996.
Xu, L., Y. C. Wang, D. Charles, and T. Shenglan, “Urban Health Insurance Reform and Coverage inChina using Data from National Health Services Surveys in 1998 and 2003,” BMC Health ServicesResearch, 7, 1–14, 2007.
Xu, W., K.-C. Tan, and G. X. Wang, “Segmented Local Labour Markets in Post-Reform China:Gender Earnings Inequality in the Case of Two Towns in Zhejiang Province,” Environment andPlanning A, 38, 85–109, 2006.
Xue, H., “Local Strategies of Labor Control: A Case Study of Three Electronics Factories in China,”International Labor and Working Class History, 73, 85–103, 2008.
Yao, Y. and N. Zhong, “Unions and Workers’ Welfare in Chinese Firms,” Mimeo, China Center forEconomic Research and National School of Development, Peking University, 2011.
Zhang, J., Y. Zhao, A. Park, and X. Song, “Economic Returns to Schooling in Urban China, 1988 to2001,” Journal of Comparative Economics, 33, 730–52, 2005.
Zhang, S., W. Zhang, L. Wang, and L. Zhang, “China’s Migrant Workers’ Social Security,” ChineseJournal of Population, Resources and Environment, 8, 3–12, 2010.
Supporting Information
Additional Supporting Information may be found in the online version of this article:
Table A1. Aggregation of the Registration-Based Ownership CategoriesTable A2. Summary Statistics by Industrial SectorTable A3. Labor Input Weights for Gender-Skill Groups by Firm OwnershipTable A4. Joint Production Function and Earnings Equation Estimates: Cobb–Douglas Produc-
tion Function, Robustness ChecksTable A5. Joint Production Function and Total Compensation Equation Estimates: Cobb–
Douglas Production Function
Please note: Wiley-Blackwell are not responsible for the content or functionality of any support-ing materials supplied by the authors. Any queries (other than missing material) should be directed tothe corresponding author for the article.
Review of Income and Wealth 2012
© 2012 The AuthorReview of Income and Wealth © International Association for Research in Income and Wealth 2012
23
Copyright © 2022 FDOKUMEN