GALGOTIAS UNIVERSITY - The Researcher: International ...
49
Chief Patron Mr. Suneel Galgotia, Chancellor, Galgotias University, India Mr. Dhruv Galgotia, CEO, Galgotias University, India Patron Prof.(Dr.) Renu Luthra Vice Chancellor, Galgotias University, India Editor-in-Chief Dr. Adarsh Garg Galgotias University Publication Volume 01 July- December, 2016 Issue 02 The Researcher International Journal of Management Humanities and Social Sciences GALGOTIAS UNIVERSITY
-
Upload
khangminh22 -
Category
Documents
-
view
3 -
download
0
Transcript of GALGOTIAS UNIVERSITY - The Researcher: International ...

Chief Patron
Mr. Suneel Galgotia, Chancellor, Galgotias University, IndiaMr. Dhruv Galgotia, CEO, Galgotias University, India
Patron
Prof.(Dr.) Renu LuthraVice Chancellor, Galgotias University, India
Editor-in-Chief
Dr. Adarsh Garg
Galgotias University Publication
Volume
01July- December, 2016 Issue 02
The ResearcherInternational Journal of Management Humanities
and Social Sciences
GALGOTIA
S UNIV
ERSITY
Neuroscience Basis of Context in Multimedia Enhanced Problem-Based STEM Learning
The Researcher- International Journal of Management Humanities and Social Sciences July-Dec 2016, 1(2) 2
Neuroscience Basis of Context in Multimedia Enhanced
Problem-Based STEM Learning
1David Devraj Kumar
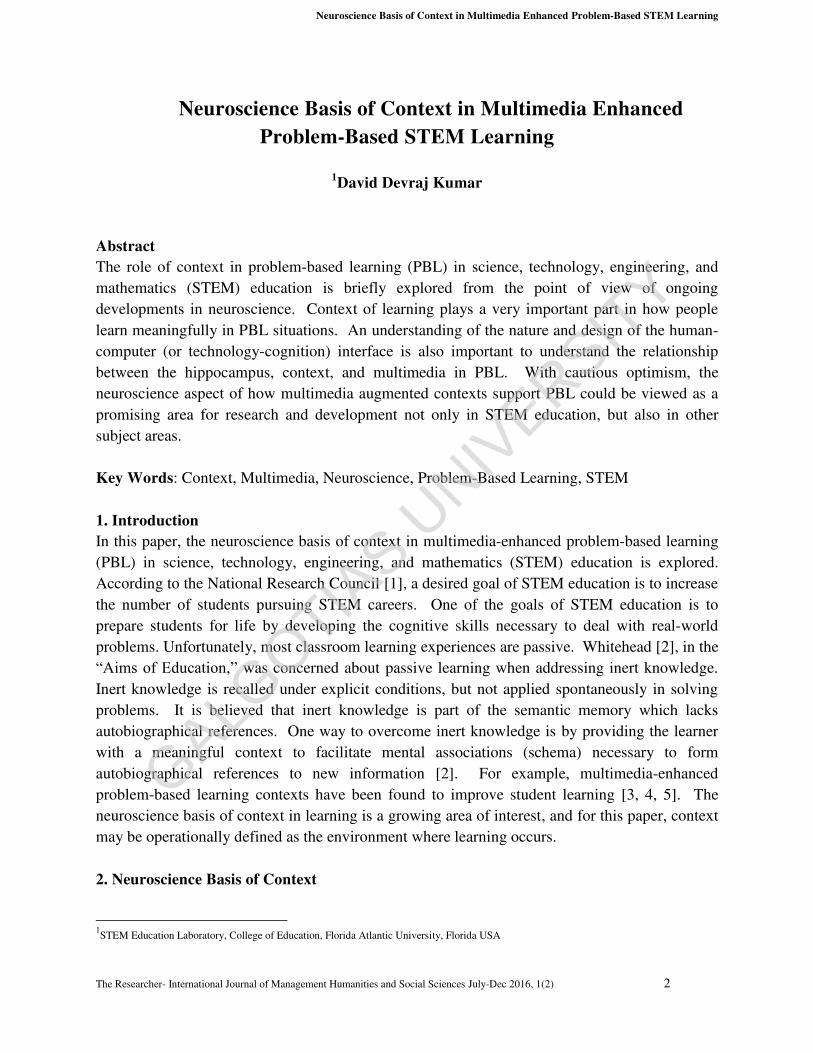
Abstract
The role of context in problem-based learning (PBL) in science, technology, engineering, and
mathematics (STEM) education is briefly explored from the point of view of ongoing
developments in neuroscience. Context of learning plays a very important part in how people
learn meaningfully in PBL situations. An understanding of the nature and design of the human-
computer (or technology-cognition) interface is also important to understand the relationship
between the hippocampus, context, and multimedia in PBL. With cautious optimism, the
neuroscience aspect of how multimedia augmented contexts support PBL could be viewed as a
promising area for research and development not only in STEM education, but also in other
subject areas.
Key Words: Context, Multimedia, Neuroscience, Problem-Based Learning, STEM
1. Introduction
In this paper, the neuroscience basis of context in multimedia-enhanced problem-based learning
(PBL) in science, technology, engineering, and mathematics (STEM) education is explored.
According to the National Research Council [1], a desired goal of STEM education is to increase
the number of students pursuing STEM careers. One of the goals of STEM education is to
prepare students for life by developing the cognitive skills necessary to deal with real-world
problems. Unfortunately, most classroom learning experiences are passive. Whitehead [2], in the
“Aims of Education,” was concerned about passive learning when addressing inert knowledge.
Inert knowledge is recalled under explicit conditions, but not applied spontaneously in solving
problems. It is believed that inert knowledge is part of the semantic memory which lacks
autobiographical references. One way to overcome inert knowledge is by providing the learner
with a meaningful context to facilitate mental associations (schema) necessary to form
autobiographical references to new information [2]. For example, multimedia-enhanced
problem-based learning contexts have been found to improve student learning [3, 4, 5]. The
neuroscience basis of context in learning is a growing area of interest, and for this paper, context
may be operationally defined as the environment where learning occurs.
2. Neuroscience Basis of Context
1STEM Education Laboratory, College of Education, Florida Atlantic University, Florida USA
GALGOTIA
S UNIV
ERSITY

Neuroscience Basis of Context in Multimedia Enhanced Problem-Based STEM Learning
The Researcher- International Journal of Management Humanities and Social Sciences July-Dec 2016, 1(2) 3
Advances in neuroscience have improved our understanding of the neurophysiological basis of
cognition in learning situations [6]. Non-invasive imaging technologies such as functional
magnetic resonance imaging (FMRI) have helped researchers to study learning processes. There
is a growing body of evidence from neuroscience to support the importance of the context of
learning centered on the hippocampus. The hippocampus is the enfolded cerebral cortex in the
lateral fissure of the cerebral hemisphere associated with long-term memory [7]. It has a role in
the formation of new memories and in sensing new stimuli, occurrences, and surroundings.
Episodic and semantic memories are “consolidated” in the hippocampus [6]. More specifically,
clinical and experimental studies show that the hippocampus processes episodic memories by
analyzing contextual information with temporal and spatial references [8, 9]. “Episodic memory refers to the ability to recall specifics of past events in our lives. An essential aspect of events is
timing when things occur during an episode. A number of recent studies have shown that the
hippocampus, a structure known to be essential to form episodic memories, possesses neurons
that explicitly mark moments in time” [9, p. 18351]. Sakon et al. have shown that in
experimental animals “hippocampal neurons not only track time, but do so only when specific contextual information (object identity/location) is cued. These time context-sensitive neurons
represent a novel way in which the brain unites disparate streams that comprise an episode and
will aid in our understanding of how we store and retrieve episodic memories” [9, p. 18351]. Research by Smith and Mizumori [10] (2006) suggests that the hippocampus has a key role in
the contextual representation of episodic memories.
Based on the fact that context influences hippocampal functions, it could be inferred that it also
facilitates meaningful learning, thus overcoming inert knowledge. In problem-solving situations,
inert knowledge is a factor inhibiting success [2, 3]. It is worth exploring how the context of
learning could be enhanced to improve meaningful learning and move away from inert
knowledge. There are many creative approaches to enhance the context of learning. For
example, the use of parables as exemplified by the Lord Jesus Christ over two thousand years
ago, noted in the Bible [11] is one approach. A parable is a method of instruction using
allegorical illustrations and it has human characters (e.g., Good Samaritan), and it differs from
fables where animal characters and inanimate objects are used (e.g., Aesop’s Fables) [12]. The application of theme based learning proposed by John Dewey is another approach [13]. The
use of case studies suggested by Charles Gragg [14] is yet another approach. The use of
multimedia anchors to portray and/or simulate authentic episodes is a current approach to enrich
the context of problem-based learning [3, 15] thanks to unprecedented developments in the
Internet, multimedia and electronic communication technologies.
3. Learning with Multimedia Technology
GALGOTIA
S UNIV
ERSITY

Neuroscience Basis of Context in Multimedia Enhanced Problem-Based STEM Learning
The Researcher- International Journal of Management Humanities and Social Sciences July-Dec 2016, 1(2) 4
A compelling argument for using multimedia technology to promote thinking has been made by
researchers and educators [16]. “We may distinguish two senses in which technology and
learning are intertwined. The first is thinking with technology; the second is thinking about
technology. The second twist of phrase is crucial for technological literacy and technical
education and is the topic of recent standards for student learning. But thinking with technology
is far more important historically and substantively, for it is in this sense that technology is an
instrument of knowing, reason, culture, and humanity itself” [16, p. xv]. One of the most
practical ways to promote thinking with technology is rooted in approaches to learning through
problem solving with technology. According to the Board on Science Education of the National
Research Council in the United States, “at the root of all science investigations are complex and
compelling problems. In order for problems to be effective for supporting learning, they must be
meaningful both from the standpoint of the discipline and from the standpoint of the learner… Students may relate more easily to the curious phenomena they observe in their daily lives, such
as what causes an empty juice box to crunch up when you suck continuously through a straw” [17, p. 127-128]. The authenticity of the learning context is one of the crucial supporting
environments for meaningful science learning, particularly in problem-based learning. It should
be noted here that the use multimedia to augment the context of learning should not be construed
as minimizing hands-on learning experiences in STEM education.
4. Problem-Based Learning (PBL)
PBL is a pedagogical strategy where students are engaged in small groups to participate in
problem-solving activities that they can relate to in an authentic context [4, 18, 19]. For
example, elementary school students can engage in making a consumer decision involving
sunscreen selection, between sunscreen with and without nano particles, in a web-anchor
supported PBL nanotechnology project, as reported in Kumar [15]. The context here is
authentic, and the processes involved in solving the challenge of choosing between the two kinds
of sunscreens include: the scientific method involving data-based decision-making, critical
thinking, and analytical thinking. The cognitive foundation of PBL is that it enables the
activation of prior knowledge which is vital to processing new information; as students engage in
discussing a problem case, they are able to make multiple cognitive associations between new
and old concepts. Learning takes place in an authentic context similar to real-world situations,
helping the learner receive prodding cues in accessing prior knowledge [19]. Thus, students see
the inter-connected nature of STEM. By carefully centering on a problem-based situation,
multimedia technologies could be designed to embed specific, well-defined problem-solving
tasks in a broader context, raising real-world societal and economic issues for consideration and
discussion in STEM education [4, 5, 15].
5. Enlarging the Context of Problem-Based Learning with Multimedia
GALGOTIA
S UNIV
ERSITY

Neuroscience Basis of Context in Multimedia Enhanced Problem-Based STEM Learning
The Researcher- International Journal of Management Humanities and Social Sciences July-Dec 2016, 1(2) 5
Information-rich contexts, often referred to as "macro-contexts," encourage the active
construction of knowledge by learners, and differ from "micro-contexts" (information-poor,
mostly unrealistic) found in traditional educational technology applications [3]. Often, it may not
be feasible to bring real-world problem situations into classrooms to enrich the context of
learning. One of the ways to present real-world contexts for PBL is through multimedia. The
following example draws from the ‘Golden Statuette” an uncopyrighted experimental work of
Professor Robert Sherwood produced in the 1980’s may shed some light on how an enriched
context may be developed for a particular learning experience.
The “Golden Statuette” test video anchor was developed with the intention of providing a real-
world problem-based learning context (as an episode) for introducing the concepts volume by
displacement and density. In the episode a misguided chap who wanted to generate some money
the wrong way to buy an electric guitar spray painted an old lead statuette gold and went to a
pawnshop. He was telling the shop owner that his mother needed money for surgery and asked
him to sell this treasured golden antique which his great grand father got from a potentate in the
Middle East in exchange for a portable radio. Being worried sampling by scraping would reveal
the true nature of the metal he was telling the owner “don’t you go cutting into it or anything… it’s pure gold and real soft,” In order to estimate its value, the shop owner first determined the
mass of the statuette and determined its volume by displacement method. The calculated density
came out to be that of lead 11.35 gm/cc, and the shop owner gave the chap 20 cents. The startled
chap who realized that he could not fool the pawnshop owner remarked “what can I buy with 20 cents?” and the owner replied “not much.” Undergraduate science education students when
challenged first with the “Golden Statuette” video followed by hands on activities in volume by
displacement and density expressed a greater appreciation for science as they were able to see its
connection to societal applications in an authentic context [20].
Multimedia technology provides a hypermedia platform for linking text, figures, audio and video
information without requiring the user to physically leave the environment where she/he is
located in order to access, manipulate, and interact with them. It is designed on the Internet,
creating a network of internally and externally connected platforms to represent a collection of
ideas for students to explore. Multimedia technology on the Internet has generated much interest
in education thanks to convenient ways to represent knowledge structures in line with some of
the learning theories [21]. Some of the advantages of multimedia include visual, dynamic,
spatial, veridical representation of information, random access, and greater user control [22]. For
details on how multimedia technology has been used to enlarge the context of PBL, see
“Problem-Based Learning in Nanotechnolgy” [15], “The River of Life” [23], and “Adventures of
Jasper Woodbury” [3]. These multimedia applications also involve hands-on learning and
provide classroom teachers the flexibility to make necessary adaptations based on their local
curricular needs. As noted earlier in this paper, information-rich meaningful contexts might
GALGOTIA
S UNIV
ERSITY

Neuroscience Basis of Context in Multimedia Enhanced Problem-Based STEM Learning
The Researcher- International Journal of Management Humanities and Social Sciences July-Dec 2016, 1(2) 6
work towards facilitating hippocampal functions in the process of learning [9, 10], leading to
meaningful learner outcomes in STEM education.
6. Concluding Thoughts
Ongoing developments in the field of neuroscience show an emerging connection between the
critical role of context and learning. Enriched contexts are essential to engaging students in
problem-based learning in STEM. Multimedia platforms are quite suitable for developing
enriched contexts to enhance problem-based learning in STEM education. The scope of this
brief note is limited to exploring the neuroscience base of contexts and how multimedia-
enhanced learning contexts could be developed to support PBL in STEM education. Most
neuroscience studies involve laboratory animals, translating results from animal studies to
situations involving human beings, hence demanding high inference. Also, the nature of the
technology-cognition interface [24, 25, 26, 27] and its effect on multimedia-supported STEM
learning is not addressed in this paper. To gain a clearer picture of the effect of multimedia-
augmented contexts on information processing in the hippocampus, our understanding of the
technology-cognition interface also needs to improve, and how human computer interfaces are
designed also must be taken into consideration [26, 27]. This is a complex relationship and
should not be overlooked when thinking about neuroscience developments, contexts, and
multimedia-enhanced learning. As research advances our understanding of the relationship
between the brain, learning, context, multimedia technology, and the technology-cognition
interface, it could be anticipated, with cautious optimism, that better ways of designing and
developing meaningful learning environments to facilitate PBL, not only in STEM education but
also in other subject areas, would emerge.
7. Acknowledgements
The “Problem Based Learning in Nanotechnology” instructional platform was developed with
funding from the Ewing Marion Kauffman Foundation. The views expressed are not that of the
funding source. "The Golden Statuette" is an uncopyrighted experimental work produced by
Professor R. D. Sherwood at Vanderbilt University in the 1980s. Thanks to Ms. Chelsea Dittrich
and Ms. Sharon Booshi for editorial feedback.
References
1. National Research Council. 2011. Successful K-12 STEM education: Identifying Effective
approaches in science, technology, engineering, and mathematics. Washington, DC: National
Academy Press
2. Whitehead, A. N. 1929. The aims of education. NY: Macmillan.
3. Cognition and Technology Group at Vanderbilt. 1993. Anchored instruction and situated
cognition revisited Educational Technology, 33, 52-70.
4. Kumar, D. D. 2010. Approaches to video anchors in problem-based science learning. Journal
of Science Education and Technology, 19(1), 13-19.
GALGOTIA
S UNIV
ERSITY

Neuroscience Basis of Context in Multimedia Enhanced Problem-Based STEM Learning
The Researcher- International Journal of Management Humanities and Social Sciences July-Dec 2016, 1(2) 7
5. Kumar, D. D., & Sherwood, R. D. 2007. Effect of a problem based simulation on the
conceptual understanding of undergraduate science education students. Journal of Science
Education and Technology, 16(3), 239-246.
6. Collins, J. W. 2007. The neuroscience of learning. Journal of Neuroscience Nursing, 39(5),
305-310.
7. Mandal, A. 2014. Hippocampus functions. News Medical. Available at: http://www.news-
medical.net/health/Hippocampus-Functions.aspx.
8. Mizumori, S. J. Y. 2013. Context prediction analysis and episodic memory. Frontiers in
Behavioral Neuroscience, 7, 132.
9. Sakon, J. J., Naya, Y., Wirth, S., & Suzuki, w. A. 2014. Context-dependent incremental
timing cells in the primate hippocampus. Proceedings of the National Academy of Sciences,
111(51), 18351- 18356.
10. Smith, D. M., & Mizumori, S. J. Y. 2006. The Journal of Neuroscience, 26(12), 3154-3163.
11.The Zondervan Corporation. 1995-2010. Bible Gateway. (n.d.). Available at:
https://www.biblegateway.com/
12.Oxford University Press. 2016. English.Oxford living dictionaries. Available at:
https://en.oxforddictionaries.com.
13. Dewey, J. 1933. How we think (revised edition). Boston: Heath.
14. Gragg, C. I. 1940. Because wisdom can’t be told. Harvard Alumni Bulletin, October, pp.
78-84.
15. Kumar, D. D. 2015. A study of web based anchors in nanotechnology for problem-based
science learning. Journal of Nano Education, 7(1), 58-64.
16. Pea, R. 2000. Introduction. In The Jossey-Bass Reader on Technology and Learning. San
Francisco: Jossey-Bass, pp. xv-xxiv.
17. Michaels, S., Shouse, A. W., & Schweingruber, H. A. 2008. Ready, set, science! Putting
research to work in K-8 science classrooms. Board on Science Education, Center for
Education, Division of Behavioral and Social Sciences and Education. Washington, DC:
The National Academies Press.
18.Hur, Y., & Kim, S. 2007. Different outcomes of active and reflective students in problem-
based learning. Medical Teacher, 29(1), 18–21.
19.Schmidt, H. G. 1993. Foundations of problem-based learning: Some explanatory notes.
Medical Education, 27, 422–432.
20.Kumar, D. D., & Hofwolt, C. A. 2002. Using technology to improve science teacher
education. A paper presented at the Annual International Conference of the Association for
Science Teacher Education, Charlotte, NC.
21.Marsh, E. J., & Kumar, D. D. 1992. Hypermedia: A conceptual framework for science
education and review of recent findings. Journal of Educational Multimedia and
Hypermedia, 1(1), 25-37.
GALGOTIA
S UNIV
ERSITY

Neuroscience Basis of Context in Multimedia Enhanced Problem-Based STEM Learning
The Researcher- International Journal of Management Humanities and Social Sciences July-Dec 2016, 1(2) 8
22. Sharp, D. L. M., Bransford, J. D., Goldman, S. R., Risko, V. J., Kinzer, C. K., & Vye, N. J.
1995. Dynamic visual support for story comprehension and mental model building by young at-
risk children. Educational Technology Research and Development, 43, 25-42.
23. Sherwood, R. D. 2002. Problem based multimedia software for middle grades science:
Development issues and an initial field study. Journal of Computers in Mathematics and
Science Teaching, 21(2), 147-165.
24. Kumar, D. D., Helgeson, S. L., & White, A. L. 1994. Computer technology-cognitive
psychology interface and science performance assessment. Educational Technology Research
& Development, 42, 6-16.
25. Kumar, D. D., & Helgeson, S. L. 1996. Effect of computer interfaces on chemistry problem
solving among various ethnic groups: A comparison of Pen-Point and Powerbook computers.
Journal of Science Education and Technology, 5(2), 121-130.
26. Carroll, J. M. 2010. Conceptualizing a possible discipline of human-computer interaction.
Interacting with Computers, 22, 3-12.
27. Shneiderman, B., & Plaisant, C. 2009. Designing the user interface: Strategies for effective
human-computer interaction (5th
edn.). Addison-Wesley.
GALGOTIA
S UNIV
ERSITY

ROLE OF MEDIA IN THE PROMOTION OF SUSTAINABLE TOURISM: AN EXPLORATORY STUDY OF SIKKIM
The Researcher- International Journal of Management Humanities and Social Sciences July-Dec 2016, 1(2) 9
Role of Media in the Promotion of Sustainable Tourism: An
exploratory Study of Sikkim
1Mahesh Puja
2Kumar Amit
Abstract
Appropriate information and message, being the source of knowledge, could have impact on
the attitude to access resources available to the target people over a period of time.
Development communication, in this context, is considered to be an important means for
spreading the message of development to the rural masses. The Ecotourism Directorate of
Sikkim runs appropriate multimedia campaigns to promote ecotourism through mass media.
Keywords: Tourism, sustainability, multimedia campaigns.
1.Introduction
The need of sustainability has become a fundamental issue in tourism development and
growth, after the debate at the Rio Earth Summit in 1992. According to Principle 4 of The
“Rio Declaration” on environment and development (1992) “In order to achieve sustainable
development, environmental protection shall constitute an integral part of the development
process and cannot be considered in isolation from it”. The Principle 22 states that
“Indigenous people and their communities, and other local communities, have a vital role in
environmental management and development because of their knowledge and traditional
practices. States should recognize and duly support their identity, culture and interests and
enable their effective participation in the achievement of sustainable development”.
India has some of the world's most bio-diverse regions. It hosts 3 biodiversity hotspots3: the
Western Ghats, the Himalayas and the Indo-Burma region. These hotspots have numerous
endemic species4. The State of Sikkim is located in the area of the Biodiversity Hotspot of
Eastern Himalaya Region. To promote conservation incentive and suitable livelihood option
for the natives, the Government of Sikkim has formulated an Ecotourism policy based on two
primary motives; “poverty alleviation” and “nature conservation”. (Kumar, 2014)
1 Associate Professor, Manipal University, Dubai
2 Assistant Professor, Galgotias University, Delhi, India
3 Biodiversity hotspots are defined as areas featuring exceptional concentrations of endemic species and experiencing exceptional loss of
habitat. 4 Species are described as endemic if they are unique to a specific area or region, and don't naturally occur anywhere else. Due to their
limited ranges, endemic species are particularly vulnerable to extinction.
GALGOTIA
S UNIV
ERSITY

ROLE OF MEDIA IN THE PROMOTION OF SUSTAINABLE TOURISM: AN EXPLORATORY STUDY OF SIKKIM
The Researcher- International Journal of Management Humanities and Social Sciences July-Dec 2016, 1(2) 10
1.1 Conceptual Framework of Sustainable Tourism
The requirement of nature based tourism emerged as an outcome of the world’s acknowledgment and reaction to global sustainable practices. There was an increasing
concern to minimize the negative impact of tourism on the environment and also a concrete
evidence was available that tourists have moved away from mass tourism to more
individualistic and enriching experiences. Moreover, these instances were further
substantiated with the urge to include natural and cultural component during vacations. This
set the ground for the alternative form of tourism which was termed in due course of time as
‘Eco Tourism’, ‘Sustainable Tourism’ and ‘Responsible Tourism’ etc. However, all these
terms were rooted in the concept of sustainable development and intended to benefit local
communities and destinations environmentally, culturally and economically. (Diamantis,
1999)
The World Conservation Union (IUCN) defines ecotourism as: “environmentally responsible travel and visitation to relatively undisturbed natural areas, in order to enjoy and appreciate
nature (and any accompanying cultural features - both past and present) that promotes
conservation, has low negative visitor impact, and provides for beneficially active socio-
economic involvement of local populations”. (IUCN, 1996)
According to the World Tourism Organization (UNWTO) definition, ecotourism refers to
forms of tourism which have the following characteristics:
1. All nature-based forms of tourism in which the main motivation of the tourists is the
observation and appreciation of nature as well as the traditional cultures prevailing in
natural areas
2. It contains educational and interpretation features
3. It is generally, but not exclusively organized by specialized tour operators for small
groups. Service provider partners at the destination tend to be small, locally owned
businesses
4. It minimizes negative impact on the natural and socio-cultural environment.
5. It supports the maintenance of natural areas which are used as ecotourism attractions by:
a. Generating economic benefits for host communities, organisations and authorities
managing natural areas with conservation purposes;
b. Providing alternative employment and income opportunities for local
communities;
c. Increasing awareness towards the conservation of natural and cultural assets, both
among locals and tourists (UNWTO, Ecotourism and Protected areas, 2002)
The International Ecotourism Society (TIES) has proposed a revised definition of ecotourism
in 2015 as, “responsible travel to natural areas that conserves the environment, sustains the
well-being of the local people and involves interpretation and education" with the
specification that education is to staff and guests. (TIES, 2015)
GALGOTIA
S UNIV
ERSITY

ROLE OF MEDIA IN THE PROMOTION OF SUSTAINABLE TOURISM: AN EXPLORATORY STUDY OF SIKKIM
The Researcher- International Journal of Management Humanities and Social Sciences July-Dec 2016, 1(2) 11
Tourism is one of the largest and fastest growing economic sectors in the world accounting
for some 9% of the world’s GDP and over 200 million jobs. In 2015, international tourist’s arrival crossed 1 billion marks and UNWTO predicts that growth trends in world tourism will
continue, with total arrivals reaching 1.8 billion by 2030. The highest share is expected to get
by emerging economies, including developing countries.
Tourism has potential to play a major role in delivering sustainable development in many
countries. For this it is critically important that it must be well managed so that it benefits
local communities and the natural and cultural environments upon which it depends.
(UNWTO, The Sustainable Tourism for Development Guidebook , 2013)
In September 2015, the 70th Session of the United Nations General Assembly adopted a
universal agenda for planet and people, termed as the 2030 Agenda for Sustainable
Development. Among the 17 Sustainable Development Goals (SDGs) and 169 associated
targets, tourism is explicitly featured in Goals 8, 12 and 14 because of its capability to
promote sustainable consumption and production and its critical contribution to sustainable
development. In 2015, over one billion tourists travelled internationally. This provides over
one billion opportunities for sustainable development, in line with the SDGs. Considering the
immense potential of sustainable tourism to be a part and parcel of SDGs; the United Nations
has declared 2017 as the International Year of Sustainable Tourism for Development.
(UNWTO, UNWTO Annual Report 2015, 2016)
1.2 Sustainable Tourism in Sikkim
1.2.1 Sikkim; an Introduction
Sikkim is truly a mystical land, a confluence of advancement and mysticism. It is situated in
eastern Himalayan region of India and have borders with Tibet, Bhutan and Nepal and only
open border with China (Nathula-Pass). It hosts Kanchenjunga, the world's third-highest peak
(8586 meters) which is also valued as the state’s guardian deity. Sikkim became the 22nd
state
of the India in 1975. The ecological condition in Sikkim varies from low tropical, temperate
to sub alpine and alpine zones in a small geographical area. Sikkim has a forest cover of over
47 per cent, which is the highest in India. The protected area network in Sikkim includes one
National Park and seven Wildlife Sanctuaries that cover an area of around 2,183 Sq. Km.,
which is the largest in the country. Sikkim has a rich variety of flora and fauna. Sikkim’s population comprises many ethnic, linguistic and cultural groups, each characterized by their
unique culture, customs and traditions that exhibit strong bonds with nature. It is also
reflected in a rich array of traditional festivals and rituals that take place throughout the year
in Sikkim. (ECOSS & WWF, 2016)
1.2.2 Growth of Tourism in Sikkim
The growth of tourism in Sikkim started during the period of 2002-10, with the gradual
opening of large areas which were inaccessible or restricted to tourists. Tourism centers and
GALGOTIA
S UNIV
ERSITY

ROLE OF MEDIA IN THE PROMOTION OF SUSTAINABLE TOURISM: AN EXPLORATORY STUDY OF SIKKIM
The Researcher- International Journal of Management Humanities and Social Sciences July-Dec 2016, 1(2) 12
circuits began slowly developing from Gangtok, the capital city, and gradually extended to
other areas. The decision to allow tourists first to visit Tsomgo Lake and then Nathula Pass,
near the Chinese border witnessed a surge of tourist flows. This was also aided by the
Government’s decision to allow Leave Travel Concession by Air to the North East Region in
2010 for Central Government employees. (ECOSS & WWF, 2016).
Sikkim has been named as the best region to visit in 2014 by a leading global travel guide
Lonely Planet. Lonely Planet describes Sikkim as “It's clean (plastic bags are banned) and the mountain air is fresh. Best of all the people are among India's most friendly, with a charming
manner that's unobtrusive and slightly shy”. Sikkim is witnessing a regular growth in tourism inflow. Till December 2015, 705023 domestic tourists and 38479 foreign tourists have visited
to Sikkim. (Tourism, 2016)
The state of Sikkim has divided into four administrative districts; North, South, East and
West.
Fig. 1: Sikkim map
East Sikkim is located at the south east corner of the state and Gangtok is the administrative
headquarters as well the state capital. The area of the district is 964 km². East Sikkim is very
close to the border with China and Bhutan therefore the area is divided into two regions;
Civilian and the Military region, which is under the control of the District collector and a
Major General respectively. Most of the parts of East Sikkim are restricted for civilian use.
GALGOTIA
S UNIV
ERSITY

ROLE OF MEDIA IN THE PROMOTION OF SUSTAINABLE TOURISM: AN EXPLORATORY STUDY OF SIKKIM
The Researcher- International Journal of Management Humanities and Social Sciences July-Dec 2016, 1(2) 13
Only a few areas are open to tourists in the eastern parts of Gangtok. Tsongmo Lake aka
Changu Lake at an altitude of 3780 m and Nathula Pass which is one of the three trading
border posts connecting India and China are main tourist’s attractions.
West Sikkim is next to East Sikkim in terms of tourism promotion. It is the place for
adventure tourism and many successful ecotourism ventures including homestays can be
found here. Pelling and Yuksom are two most popular destinations among tourists.
South Sikkim is an ideal place for trekkers, religious tourists, bird watchers and nature
lovers. It is being promoted as next tourist destination after East and West Sikkim. Namchi is
the district headquarter and a famous tourists destination. Temi Tea Garden and Ravangla are
other prominent attractions.
North Sikkim is the northern district of Sikkim. Mangan is the districts headquarter of North
Sikkim. North Sikkim can be visited only as part of an organized tour and tourists need
special permits to visit beyond Mangan. Almost the entire zone of North Sikkim comes under
the restricted territory; foreigner’s visit beyond Thangu is prohibited. Because of these
restrictions tourism in the region is at a nascent stage. Yumthang Valley, Chungthang, Lachen
and Lachung are other prominent attractions.
It has been observed that the Government of Sikkim has devised a model to promote
sustainable tourism in ecologically sensitive areas by managing tourists number as well
encouraging high income - low volume tourists. Another initiative includes sharing of tourism
revenues with local communities. Pokhri Sanrakshan Samitee at Tsomgo Lake is one such
successfully implemented strategy. (ECOSS & WWF, 2016)
1.2.3 Ecotourism in Sikkim
Being a Himalayan state Sikkim has a very fragile ecosystem. Its strength has always
been its natural beauty and distinctive culture, customs and traditions. To protect the unique
cultural identity and to curb the negative impact of mass tourism Sikkim pioneered in creating
a community supported ecotourism pathway which was based on the nature and cultural
conservation. Community-based tourism (CBT) sites were evolved in different parts of the
state with the core concept of village homestay that ensured benefits of tourism to local
communities. This was further supported through policy initiatives of government of Sikkim
including the Sikkim Ecotourism Policy 2011 prepared by The Forest Environment and
Wildlife Management Department along with the JICA funded Sikkim Biodiversity and
Forest Management Project (SBFP), and the Sikkim Registration of Homestay Establishment
Rules 2013.
Due to harsh climate, the number of tourists visiting Sikkim is less during winter and rainy
season. To help Sikkim grow as 365 days tourists destinations the government of Sikkim
conducts different ecotourism carnivals/festivals, promotional campaigns and other activities
periodically to attract more tourists during the lean season. Following ecotourism
GALGOTIA
S UNIV
ERSITY

ROLE OF MEDIA IN THE PROMOTION OF SUSTAINABLE TOURISM: AN EXPLORATORY STUDY OF SIKKIM
The Researcher- International Journal of Management Humanities and Social Sciences July-Dec 2016, 1(2) 14
carnivals/festivals were conducted during 2015-16 to promote Sikkim as a prime ecotourism
destination in India for both domestic and foreign tourists:
Table 1: Ecotourism Festivals/Carnivals in Sikkim
Sl.
No.
Name of the Ecotourism
Festival/Carnival
Destination being
promoted
Date &
Duration
1. Sikkim Butterfly Meet Yuksam-Rimbi, West
Sikkim
17-19 July 2015
2. Okharey Ecotourism Carnival Okharey, West Sikkim 17-19 October
2015
3. Red Panda Winter Festival Gangtok, East Sikkim 23-31 January
2016
4. 2nd Losar cum Tourism Festival Anden Walung Gumpa,
West Sikkim
11-12 February
2016
5. Tinjurey Ecotourism Festival Pangthang, East Sikkim 12-13 March
2016
6. Zakri-dhunga Rhododendron
Tourism Festival
Maneybung Dentam, West
Sikkim
13-15 April
2016
7. 9th Lampokhari Tourism Festival Dalapchand, East Sikkim 14-16 April
2016
1.2.4 Ecotourism Promotion Campaign in Sikkim
To promote Sikkim as a prime ecotourism destination in India and globally, the Government
of Sikkim has proposed guidelines in their Ecotourism Policy in 2011. An apex body, the
Directorate of Ecotourism has been constituted to ensure effective management and
implementation of the ecotourism initiatives under the Forest, Environment and Wildlife
Management Department in the State of Sikkim. The Directorate is the executing arm of the
Sikkim Ecotourism Council, an autonomous body with representatives from government
departments, civil society, tourism professionals and public sector representatives. In Sikkim,
March to June and September to December is considered as a peak tourist season. One of the
key targets of the Directorate is to promote Sikkim as a year around ecotourism destination.
(Sikkim, 2011)
2. Research Methodology
2.1 Selection of the Topic
Appropriate information and message, being the source of knowledge, could have an impact
on the attitude to access resources available to the target people over a period of time. Mass
media tools such as TV, radio, community radio, print publicity, outdoor media and new
GALGOTIA
S UNIV
ERSITY

ROLE OF MEDIA IN THE PROMOTION OF SUSTAINABLE TOURISM: AN EXPLORATORY STUDY OF SIKKIM
The Researcher- International Journal of Management Humanities and Social Sciences July-Dec 2016, 1(2) 15
media are being employed to carry these messages for providing information and educating
the people. Government schemes, programs and benefits are being informed to the general
masses through different publicity programs in a campaign mode.
People’s empowerment, as one of the major Millennium Development Goals, requires
working with communities at the grassroots level and involving them to participate in the
development efforts. Communication through mass media, in this regard, can have a
prominent role to play and inform communities. To communicate and publicize the
Government’s programs and initiatives directly to the beneficiaries down to the grassroots level, the Ministry of Tourism & Civil Aviation Department of Sikkim, an Eastern Himalayan
State of India, which is chosen as area of study for this work, runs appropriate multimedia
mass campaigns through different means of communication. To pursue these objectives, the
Government of Sikkim has formed Ecotourism Directorate which in co-ordination with The
Forest, Environment and Wildlife Management Department takes care of publicity for the
ecotourism initiatives in the state of Sikkim.
The plethora of choices in media vehicles has led to an urgent need to study the scope and
effectiveness of their utilization for the purposes of ‘People’s Empowerment through Development Communication’.
2.2 Significance of the Study
The findings of this study are significant to government, tourism service providers, and local
people in a variety of ways. For the government policy makers, the results will help to make
informed decisions, formulate and implement the appropriate policies and legislations to
establish Sikkim as a prime ecotourism destination. For Ecotourism Directorate and other
agencies who are entrusted with the responsibility to promote ecotourism in the state, this
study helped in understanding means that they can utilize the available resources to attract
many tourists and in providing convincing information to tourists. For the local people, the
results of this study help them to know the role to play and the associated benefits of
ecotourism in return.
2.3 Area of Study
The study area comprised two districts (East, West) of Sikkim, where media campaign and
publicity programs were undertaken by the Ecotourism Directorate, the Department of Forest,
Environment & Wildlife Management, State Tourism Development Corporation, and Ministry
of Tourism and Civil Aviation of Government of Sikkim during the period of 2015-16 (up to
April, 2016). The field work was conducted at the ecotourism sites of Gangtok in East Sikkim
and Pelling in West Sikkim.
2.4 Objectives of the Study
1. To analyze the role of media campaign in promoting ecotourism in Sikkim.
GALGOTIA
S UNIV
ERSITY

ROLE OF MEDIA IN THE PROMOTION OF SUSTAINABLE TOURISM: AN EXPLORATORY STUDY OF SIKKIM
The Researcher- International Journal of Management Humanities and Social Sciences July-Dec 2016, 1(2) 16
2. To analyze the media platforms in terms of media vehicles employed and its
corresponding strategies used for promoting ecotourism in Sikkim.
3. To analyze the impact of the promotional campaign on the target group in terms of their
level of awareness generation about the ecotourism promotion initiatives and the benefits
availed.
3. Research Design
3.1 Sample Selection
A sample of 200 respondents was taken for this study, out of which 100 were local residents
of Sikkim and another 100 were tourists in Sikkim, which included a mix of foreign and
domestic tourists. 80 domestic tourists and 20 foreign tourists were consulted precisely with
interview schedules.
3.2 Data Collection
Keeping in mind the proposed objectives, the study is based on both primary and secondary
resources. The study has both quantitative and qualitative data as components to substantiate
our argument through statistical analysis to assess the impact of the campaign and to
understand the functioning of Ecotourism Directorate.
3.2.1 Primary Sources
Qualitative Research: In-depth interviews with the officers of Ecotourism Directorate were
done to gauge the system of sharing the Campaign Brief among various teams especially the
creative (copy and art) and media planning section to aim at synergizing the process and
outcome. The qualitative research also aimed at finding out the process of ideation and pre-
testing of the promotional campaigns before these campaigns are released in media.
Quantitative Research: Under this study interview schedules were used to collect data from
respondents. Two different interview schedules were prepared; one was for tourists visiting
Sikkim and another was for local residents of Sikkim. It was constructed with a view to find
out ‘top of the mind recall’ of the requisite campaign message; and also whether it resulted in the desired response/action on the part of the respondent, besides which medium was also
more impactful in terms of recall, assimilation and action.
3.2.2 Secondary Sources
Desk Research: There was need to understand the media planning and buying strategies
adopted by the Ecotourism Directorate, to reach out to the desired constituent publics along
with an effort to have desk analysis on the campaign briefs received by the officials of
Ecotourism Directorate to gauge and understand the clarity of campaign objectives among
officials themselves.
GALGOTIA
S UNIV
ERSITY

ROLE OF MEDIA IN THE PROMOTION OF SUSTAINABLE TOURISM: AN EXPLORATORY STUDY OF SIKKIM
The Researcher- International Journal of Management Humanities and Social Sciences July-Dec 2016, 1(2) 17
Secondary records: Data were collected initially from the specific web sources of different
departments of Government of Sikkim.
Table 2: Govt. of Sikkim Resources
Sl. Name of the Department Web Page
1 Department of Forest, Environment &
Wildlife Management
http://www.sikkimforest.gov.in/Ecotourism.htm
2 ENVIS Centre: Sikkim
Status of Environment and Related
Issues
http://www.sikenvis.nic.in/
3 Sikkim Tourism Development
Corporation
http://www.sikkimstdc.com/Index.aspx
4 Tourism and Civil Aviation
Department
http://www.sikkimtourism.gov.in/Webforms/Gener
al/Default.aspx
5 Directorate of Ecotourism https://www.ecotourismsikkim.com/
6 ENVIS Center on Ecoturism http://scstsenvis.nic.in/index.aspx?langid=1
7 Sikkim Biodiversity Conservation and
Forest Management Project (SBFP)
http://forestsbfp.nic.in/default.aspx
The various records, white paper on policy, annual reports, ecotourism database, tourism
policy of state etc were examined. The collected data was used for statistical analysis to
justify arguments to measure the impact of the mass media campaign.
4. Data Analysis
Data was collected from the tourists and local residents of Sikkim through interview
schedules and from Ecotourism Directorate officials through interview to analyze as per the
given objectives. Thematic analysis5 was followed to understand the process and outcome of
internal briefings of the Ecotourism Directorate. Other qualitative data collected through
observation were thematically analyzed to support findings from the quantitative data. Apart
from these, quantitative data were fed into SPSS for cross tabulation and used for
tables/graphs giving number, frequencies and percentage. Those tables/graphs were used to
analyze the media planning, recall & retention of Ecotourism Promotional Campaigns and
awareness about ecotourism.
5 Thematic analysis is the most common form of analysis in qualitative research. It emphasizes pinpointing,
examining, and recording patterns (or "themes") within data. Themes are patterns across data sets that are
important to the description of a phenomenon and are associated to a specific research question.
GALGOTIA
S UNIV
ERSITY

ROLE OF MEDIA IN THE PROMOTION OF SUSTAINABLE TOURISM: AN EXPLORATORY STUDY OF SIKKIM
The Researcher- International Journal of Management Humanities and Social Sciences July-Dec 2016, 1(2) 18
4.1 Understanding of Ecotourism Directorate and its internal processes
4.1.1 On the process of internal briefing
The process of briefings for an advertising campaign is crucial to the success of any campaign
as it helps the agency to understand the requirement of the Client. A ‘brief’ generally means “that a client for an advertising project… is informing, or briefing, an advertising agency of the client’s expectations for a proposed advertising campaign6.” It was observed that the
briefs were clear and precise with the appropriate involvement of concerned officers.
However no pre-testing of creative is done because of lack of time and resources.
4.1.2 Assessing the process of internal communication and teamwork at the Directorate
From the detailed discussions with Ecotourism Directorate officers, it emerged that there
exists a team approach to the assigned tasks. Also the internal communication system exists in
Ecotourism Directorate favors the effective implementation of the assigned tasks. The senior
officers are also readily accessible. However the lack of manpower was a major concern.
4.1.3 Examining the process of identification of stakeholders and media planning to reach
them
The Ecotourism Promotional Campaigns targets at multiple stakeholders, therefore the choice
of media vehicles needed to be diverse. It was observed that multiple media platforms were
utilized in order to reach the diverse audience. This included Television Commercials, Radio
Spots, Print Campaigns and Social Media. However a better guideline to determine the fund
allocation and selection of media vehicles is required.
4.2 Media Planning: Observation and Analysis
4.2.1 The Role of Media Planning in a Campaign
Media planning forms a crucial part of any campaign given that media time and space are
expensive; in a typical advertising campaign, the media costs account for eighty to eighty-five
percent of the advertising budget; the remaining fifteen or twenty percent covers research,
message, production, evaluation and profits for the (private) advertising agency.7 It basically
consists of (1) formulating a media strategy to deliver the creative so as to meet the brand’s advertising objectives, and then (2) implementing the strategy in an accurate and cost-
effective manner.8
6 Advertising, Promotion and Other Aspects of Integrated Marketing Communications, Terence Shrimp,
Cengage Learning, 2010 7 Advertising Media Planning: A Brand Management Approach By Larry D. Kelley, Donald W. Jugenheimer,
2008, M E Sharpe, USA, p 3 8 Advanced Media Planning by John R Rossiter and Peter J Danaher, Kluwer Academic Publishers, USA, 1998,
p xi
GALGOTIA
S UNIV
ERSITY

ROLE OF MEDIA IN THE PROMOTION OF SUSTAINABLE TOURISM: AN EXPLORATORY STUDY OF SIKKIM
The Researcher- International Journal of Management Humanities and Social Sciences July-Dec 2016, 1(2) 19
4.2.2 Media Planning Analysis
From the field survey conducted, Television has emerged as the medium of choice among
local residents of Sikkim, with 63 percent of respondents overall naming it as their preferred
choice. Newspapers follow a poor second with 11 percent while Radio accounted for only 8
percent of respondent’s preference. However, social media seems to be gaining momentum
with 6 percent of respondents showed preference for Facebook, 4 percent for Tourism
Websites, 4 percent for YouTube and another 4 percent for other Media.
Fig. 2 : media preference of local residents
Facebook has emerged as the medium of choice among domestic tourists visiting Sikkim,
with 40 percent of respondents overall naming it as their preferred choice. Tourism Websites
follows with 22.5 percent while TV Spots accounted for only 11.25 percent of respondent’s preference. Other social media platforms like YouTube accounted for 10 percent.
Newspaper/Magazine was preferred by 13.75 percent of respondents while 2.5 percent of
respondents showed preference for other Media.
Facebook again emerged as the medium of choice among foreign tourists visiting Sikkim,
with 45 percent of respondents overall naming it as their preferred choice. Tourism Websites
follow with 25 percent while YouTube accounted for 10 percent of respondent’s preference. Other social media platforms like Twitter along with print publication accounted for 5 percent
each as preferred media choice of respondents. Other means of promotion like events, trade
shows,etc were significantly high and preferred by 10 percent of the respondents coming from
foreign land.
63
8 11
4 6 4
0
4
0
10
20
30
40
50
60
70
Media Preference of Local Residents of
Sikkim
GALGOTIA
S UNIV
ERSITY

ROLE OF MEDIA IN THE PROMOTION OF SUSTAINABLE TOURISM: AN EXPLORATORY STUDY OF SIKKIM
The Researcher- International Journal of Management Humanities and Social Sciences July-Dec 2016, 1(2) 20
Fig. 3 : media preference of domestic tourists
Fig. 4 : media preference of foreign tourists
4.3 Recall and Retention of Promotional Campaign
To gauge the recall and retention of the Ecotourism Promotional Campaign was one of the
most important parts of the field research. A sample was purposively taken of those who have
come across the advertisements directly or indirectly. The various advertisements of the
11.25
0
13.75
22.5
40
10
0
2.5
0
5
10
15
20
25
30
35
40
45
Media Preference of Domestic Tourists
0 0
5
25
45
10
5
10
0
5
10
15
20
25
30
35
40
45
50
Media Preference of Foreign Tourists
GALGOTIA
S UNIV
ERSITY
ROLE OF MEDIA IN THE PROMOTION OF SUSTAINABLE TOURISM: AN EXPLORATORY STUDY OF SIKKIM
The Researcher- International Journal of Management Humanities and Social Sciences July-Dec 2016, 1(2) 21
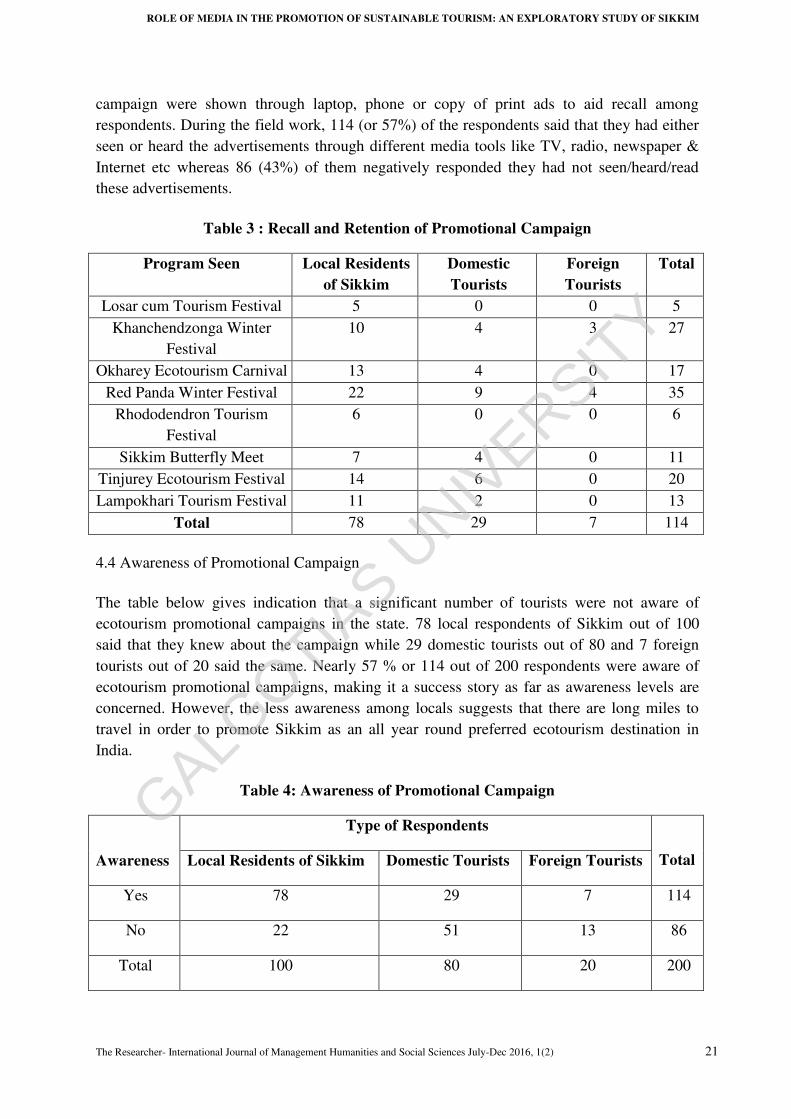
campaign were shown through laptop, phone or copy of print ads to aid recall among
respondents. During the field work, 114 (or 57%) of the respondents said that they had either
seen or heard the advertisements through different media tools like TV, radio, newspaper &
Internet etc whereas 86 (43%) of them negatively responded they had not seen/heard/read
these advertisements.
Table 3 : Recall and Retention of Promotional Campaign
Program Seen Local Residents
of Sikkim
Domestic
Tourists
Foreign
Tourists
Total
Losar cum Tourism Festival 5 0 0 5
Khanchendzonga Winter
Festival
10 4 3 27
Okharey Ecotourism Carnival 13 4 0 17
Red Panda Winter Festival 22 9 4 35
Rhododendron Tourism
Festival
6 0 0 6
Sikkim Butterfly Meet 7 4 0 11
Tinjurey Ecotourism Festival 14 6 0 20
Lampokhari Tourism Festival 11 2 0 13
Total 78 29 7 114
4.4 Awareness of Promotional Campaign
The table below gives indication that a significant number of tourists were not aware of
ecotourism promotional campaigns in the state. 78 local respondents of Sikkim out of 100
said that they knew about the campaign while 29 domestic tourists out of 80 and 7 foreign
tourists out of 20 said the same. Nearly 57 % or 114 out of 200 respondents were aware of
ecotourism promotional campaigns, making it a success story as far as awareness levels are
concerned. However, the less awareness among locals suggests that there are long miles to
travel in order to promote Sikkim as an all year round preferred ecotourism destination in
India.
Table 4: Awareness of Promotional Campaign
Awareness
Type of Respondents
Total Local Residents of Sikkim Domestic Tourists Foreign Tourists
Yes 78 29 7 114
No 22 51 13 86
Total 100 80 20 200
GALGOTIA
S UNIV
ERSITY

ROLE OF MEDIA IN THE PROMOTION OF SUSTAINABLE TOURISM: AN EXPLORATORY STUDY OF SIKKIM
The Researcher- International Journal of Management Humanities and Social Sciences July-Dec 2016, 1(2) 22
5. Conclusions and Recommendations
As per the stated objectives of this study, placed below are the main findings and
recommendations.
5.1 To analyze the role of media campaign in promoting ecotourism in Sikkim.
Observation – It has been clearly observed during the field work that a larger percentage of
respondents have given the thumbs up to the Ecotourism Promotional Campaign. Out of 200
respondents 114 were able to recall the different ecotourism promotional campaigns.
Recommendation – There is a scope to improve the production quality of the creative of the
campaigns. Also pre-testing is recommended before dissemination of any creative.
5.2 To analyze the media platforms in terms of media vehicles employed and its
corresponding strategies used for promoting ecotourism in Sikkim.
Observation – A look at the media platforms in terms of media vehicles employed and its
corresponding strategies showed a remarkable skew in favor of television among local
residents of Sikkim. However in case of tourists, both domestic and foreign, social media is
clearly a preferred choice with a significant percent of respondents preferring it over other
media vehicles. In social media, Facebook is most preferred choice followed by Tourism
Websites and YouTube.
Recommendation – The future marketing strategy should have specific plan to target the
tourists through social media. Though the internal processing of Media planning and use of
industry-specific metrics was found adequate, Ecotourism Directorate needs to increase the
manpower available for its Campaign Wing.
5.3 To analyze the impact of the promotional campaign on the target group in terms of their
level of awareness generation about the ecotourism promotion initiatives and the benefits
availed.
Observation – It has been clearly observed during the field work that large number of locals
were aware about the Ecotourism Promotional Campaign. However, the awareness level was
heading south in terms of awareness level of tourists. This will also help those who are
associated with tourism to plan their offerings to get benefit out of it. This has also been
vindicated by the statistical data where only 36% of the tourists were found aware of it.
Recommendation – While doing publicity campaigns ecotourism Directorate should also
include a component for impact assessment, with pre and post-evaluations to not only
measure success of that particular campaign but also to guide planning for future campaigns.
GALGOTIA
S UNIV
ERSITY

ROLE OF MEDIA IN THE PROMOTION OF SUSTAINABLE TOURISM: AN EXPLORATORY STUDY OF SIKKIM
The Researcher- International Journal of Management Humanities and Social Sciences July-Dec 2016, 1(2) 23
References
1. Baken, R. J., & Bhagavatula, S. (2010). Some reflections on tourism and tourism
policy in India. IIM Bangalore Research Paper No. 320, 1-21.
2. Barkin, D. (1996). Ecotourism: A Tool for Sustainable Development in an Era of
International Integration? The Ecotourism Equation: Measuring the Impacts (pp. 263-
272). New Haven, Connecticut: Yale F & ES Bulletin.
3. Bora, B. (2009). Tourism in Sikkim: An Evaluative Stuudy (Doctoral dissertation).
Guwahati: Retrieved from Shodhganga: A reservoir of Indian Theses.
4. Butcher, J. (2010). The 'New Tourist' as Anthropologist. Motivations, Behaviour and
Tourist Types: Reflections on International Tourism Motivations, 160-168.
5. Diamantis, D. (1999). The Concept of Ecotourism: Evolution and Trends. Current
Issues in Tourism, 93-122.
6. ECOSS, & WWF, I. (2016). State Tourism Policy. Gangtok: Government of Sikkim.
7. Environment and Forests, M. o. (2011). Guidelines for Ecotourism in and around
Protected Areas. New Delhi: Governmment of India.
8. GOI, D. o. (2002). National Tourism Policy. New Delhi: Ministry of Tourism and
Culture.
9. GOI, M. o. (2015). National Tourism Policy . New Dellhi: Government of India.
10. Honey, M., & Gilpin, R. (2009). Tourism in the Developing World Promoting Peace
and Reducing Poverty. Washington, DC: United States Institute of Peace.
11. IUCN. (1996). Definitions Sustainable Tourism. Retrieved from Sustaining Tourism:
http://www.sustainabletourism.net/sustainable-tourism/definitions/
12. Korstanje, M. (2007). The Origin and meaning of Tourism: Etymological study. e-
Review ofTourism Research, 100-108.
13. Kumar, A. (2014). Sikkim; A Role Model of Ecotourism in India: A Critical Analysis
. Indian Streams Research Journal, 1-5.
14. Lama, R. (2014). Community based Tourism Development: A Case Study of Sikkim
(Doctoral dissertation). Kurukshetra: Retrieved from Shodhganga: A reservoir of
Indian Theses.
15. Sikkim, G. o. (2011). Sikkim Ecotourism Policy. Gangtok: SBFP & DFEWM.
16. TIES, T. I. (2015, January 7). TIES Announces Ecotourism Principles Revision.
Retrieved from https://www.ecotourism.org/: https://www.ecotourism.org/news/ties-
announces-ecotourism-principles-revision
GALGOTIA
S UNIV
ERSITY

ROLE OF MEDIA IN THE PROMOTION OF SUSTAINABLE TOURISM: AN EXPLORATORY STUDY OF SIKKIM
The Researcher- International Journal of Management Humanities and Social Sciences July-Dec 2016, 1(2) 24
17. Tourism in India. (n.d.). Retrieved from Shodhganga:
http://shodhganga.inflibnet.ac.in/bitstream/10603/9790/10/10_chapter%203.pdf
18. Tourism, S. (2016, June 1). Statistics of Tourists Arrival in the State of Sikkim.
Retrieved from Tourism and Civil Aviation Department:
http://sikkimtourism.gov.in/Webforms/General/DepartmentStakeholders/TouristArriv
alStats.aspx
19. UNWTO. (2002). Ecotourism and Protected areas. Retrieved from World Tourism
Organization: http://sdt.unwto.org/content/ecotourism-and-protected-areas
20. UNWTO. (2013). The Sustainable Tourism for Development Guidebook . Madrid,
Spain: World Tourism Organization.
21. UNWTO. (2016). UNWTO Annual Report 2015. Madrid, Spain: World Tourism
Organization .
22. UNWTO. (2016). UNWTO Annual Report 2015. Madrid, Spain: World Tourism
Organization (UNWTO).
GALGOTIA
S UNIV
ERSITY

LIFE SATISFACTION: A LITERATURE REVIEW
The Researcher- International Journal of Management Humanities and Social Sciences July-Dec 2016, 1(2) 25
Life Satisfaction: A literature Review
1Rituparna Prasoon
2K R Chaturvedi
Abstract
This paper reviews the contributions of earlier study in the area of Life Satisfaction . The attempt
is to examine the extent of the knowledge contribution in this study sphere and incorporate
significant reviews of the patterns of Life Satisfaction in various domains . The literature looks
into the review of studies on finding the exact definition of Life Satisfaction along with its
determinants and the concept of subjective well being.
Keywords: Satisfaction, Quality of life, Social Indicators.
1.Introduction
“True happiness comes from the joy of deeds well done, the zest of creating things new. ‘ –
Antoine de Saint-Exupery—The little Prince
Embedded in the 18th century Age of Enlightenment, the concept of Life Satisfaction breezed
through 19th century as a means for providing people with good life and influenced the
development of Welfare State. By the late 20th Century, intellectuals endeavored to find a proper
definition of Life Satisfaction, envisioning the components of good life and its measurement.
The term Quality Of Life (QOL) was introduced in the 1960s. However, social indicators
replaced the traditional economic criteria of welfare and satisfaction by mid 1980's stating that
money cannot buy happiness. The early use of the idea was a reproval denoting that there is more
to human way of life than material gratification.
Several important books in this area were published, such as ‘The Quality of American Life’ (Campbell et al., 1976), ‘Social Indicators of Well-being’ (Andrews and Withey 1976), ‘The Social Progress of Nations’ (Estes 1984), and ‘Lebensqualität in der Bundesrepublik’ (Glatzer and Zapf 1984) . These accentuated on social relationships, health, work related conditions,
personal welfare, liberty, moral values and personality traits as a source of Life Satisfaction .
1 IILM Graduate School of Management Greater Noida, India
2 Professor KIET School of Management Ghaziabad, Indi
GALGOTIA
S UNIV
ERSITY

LIFE SATISFACTION: A LITERATURE REVIEW
The Researcher- International Journal of Management Humanities and Social Sciences July-Dec 2016, 1(2) 26
2.Literature Review
Definition of Life Satisfaction:
Many explanations and definitions of Life satisfaction can be observed as it is not a very easy to
understand notion. Neugarten at al.(1961) calls Life Sati8sfaction “an operational definition of
‘successful aging’. Life satisfaction for Sumner (1966) is "A positive evaluation of the
conditions of your life, a judgment that at least on balance, it measures up favorably against your
standards or expectations."
Andrew (1974) states life satisfaction symbolizing an overarching criterion or ultimate outcome
of human experience. Life satisfaction is an overall assessment of feelings and attitudes about
one’s life at a particular point in time ranging from negative to positive. It is one of three major
indicators of well-being: life satisfaction, positive effect, and negative effect (Diener,
1984). Life satisfaction is characterized, in agreement with the cognitive theory, as
“individual’s cognitive judgment about comparisons based on the compatibility of their
own living conditions with the standards” (Diener, Emmons, Larsen, & Griffen, 19 85).
Life satisfaction is believed to have antecedents in the work domain, family domain, and
personality traits Ruut Veenhoven ( 1993 ) has best summarized Life Satisfaction; “Life
satisfaction is the degree to which a person positively evaluates the overall quality of his/her life
as-a-whole.”.Diener, suh, lucas, & Smith (1999) also included the following under life
satisfaction: desire to change one’s life; satisfaction with past; satisfaction with future; and significant other’s views of one’s life." life-satisfaction is one of the pointers of ‘apparent’ quality of life along with other indicators of mental and physical health. It is referred as an
assessment of the overall conditions of existence as derived from a comparison of one's
aspiration to one's actual achievement (Cribb, 2000).
It is assumed that the less the incongruity between the individual’s desires and achievements, the more life satisfaction he/she has (Diener, Oishi, & Lucas, 2003). The
Affective theory, on the contrary feels life satisfaction to be an individual’s conscious experience as to the dominance of their positive emotions over their negative emotions.
In recent research conducted life satisfaction is assessed as the degree of the positive emotions
experienced (Frish, 2006; as cited in Simsek, 2011).
Subjective well-being:
Even though much of the current literature on well-being uses terms like happiness, life
satisfaction and subjective well-being interchangeably, this is not completely accurate. If well-
being is defined or assessed by individuals themselves, it is termed subjective well-being.
GALGOTIA
S UNIV
ERSITY

LIFE SATISFACTION: A LITERATURE REVIEW
The Researcher- International Journal of Management Humanities and Social Sciences July-Dec 2016, 1(2) 27
Understanding the psychology of Happiness and the concept of subjective well-being was done
by Myers, D. G. (1992) New York: William Morrow. Heady, B. and A. Wearing (1992); Argyle,
M. (1987) .
According to Diener, Emmons, Larsen & Griffin (1985) recognize three separable components
of subjective well-being: positive affect (PA), negative affect (NA), and life satisfaction.
Maddox (1987) in the encyclopedia of Aging defines life satisfaction as subordinate construct of
subjective wellbeing (SWB), others being happiness, mood and morale. It is contentment with
one's life in general. Research points out that there are individual differences in how meaning in
life is to one’s sense of wellbeing. The determinants of well-being and life satisfaction are highly
individualized or personalized. It is to each his own, depending on their value orientations
(Oishi, Graessman, 1998; Emmons, 1991)..
Whereas the affective part is a hedonic estimation guided by emotions and feelings, the cognitive
part is an information-based assessment of one’s life for which people judge the extent to how their life so far measures up to their expectations and bear a resemblance to their envisioned
‘ideal’ life (Hoorn, 2007). Although researchers have concentrated on the measurement of affective well-being in the past (e.g. using depression scales), the addition of separate
measurements of life satisfaction to complement traditional affective measurements has proven
useful in understanding and predicting reactions to stressful and challenging events in life
(Huebner & Dew, 1996; Bradley & Corwyn, 2004).
Cropanzano and Wright (2001) note, happiness is thought to have “three defining” characteristics: (a) it represents a “subjective experience”; (b) it “includes both the relative presence of positive emotions and the relative absence of negative emotions”; and (c) it “is a global judgment” (Cropanzano & Wright, 2001: 183). As Cropanzano and Wright (2001) note,
happiness is considered highly valuable by most people and scarce by many people, suggesting
their need to conserve or maintain happiness whenever possible. They term this model of
happiness the “re-source maintenance model,” and explain its differential effects for happy and unhappy people
Well-being and quality of life was studied by measuring the benefits of culture and sport ,
galloway susan (2005). Buetell (2006) suggests that life satisfaction is attributable to a family of
personality, genetic, and social-cognitive factors such as goal-directed activity, self-efficacy,
outcome expectations, and environmental support. Income and Individual happiness became an
important part of the study on life satisfaction by a number of theorists like Clark, Andrew E.,
Paul Frijters, and Michael Shields. 2008; Deaton, Angus. 2008; Di Tella, Rafael, John Haisken–DeNew, and Robert MacCulloch, 2007; Easterlin, Richard A. 1995; Kapteyn, Arie., Smith,
James. P. & van Soest, Arthur. 2008. Life Satisfaction was studied as a shift from wealth to
well-being by Aknin, L. B., & Norton, D.( 2009).
GALGOTIA
S UNIV
ERSITY

LIFE SATISFACTION: A LITERATURE REVIEW
The Researcher- International Journal of Management Humanities and Social Sciences July-Dec 2016, 1(2) 28
Constituents of Life Satisfaction
In the 1970's, life-satisfaction was a central theme in several American Social Indicator studies.
Analysis of the development of life-satisfaction and economic growth in the post-war decades in
the USA was done by Easterlin (1974) . With economic slowdown various studies in life
satisfaction showed that there was discrepancy in job and life satisfaction associated with
work-related and extra-workplace (Rice, R. W., Near,J. P., &Hunt, R. G. ( 1979). With
expanding society in terms of money and power and new trends setting in due to globalization
there was a rise in materialism and consumerism leading to various studies on Loneliness. It was
observed that Loneliness was a hindrance to Life satisfaction . Russell, D., Peplau, L.A.,
&Cutrona, C.E. (1980). The Satisfaction With Life Scale was a defined in detail by Diener, E.,
R. A. Emmons, R. J. Larsen and S. Griffin (1985) .
Outside the United States of America, Glatzer and Zapf (1984) reported studies from the Nordic
countries by Allardt (1975). Heady and Wearing (1992 performed one of the first large-scale
longitudinal survey on life-satisfaction in Australia.Review studies on cross-national
differences in happiness, cultural bias or societal quality were published by Veenhoven (1984),
Argyle (1987) and Meyers (1992). “Bottom-up” theories of life satisfaction (e.g., Brief, Butcher, George, & Link, 1993) recommend that life satisfaction represents an overall attitude, composed
of components of satisfaction in various domains of life . Andrews & Withey, (1976) state that
importance of any one specific life domain of life satisfaction varies by population .
The relations between Income and Life Satisfaction became an important area of study in the
early nineties. The relationship between income and subjective well-being whether relative or
absolute was a subject of study by Diener, E., Sandvik, E., Seidlitz, L., &Diener, M. (1993).
Richard A. 1995 also saw income and Individual happiness as a vital component of Life
Satisfaction in the study on Utility Income, Aging, Health and Well-Being. Along with income
health also became associated with life satisfaction Kim, O (1997) in his study on older Korean
immigrants observed that Loneliness was a deterrent to life satisfaction and also a predictor of
health perceptions .
The subjective evaluation of different aspects of life is known to correlate fairly strongly with
life satisfaction (Ateca-Amestoy, Serrano-del-Rosal, & Vera-Toscano, 2008; Lloyd & Auld,
2002; Van Praag & Ferrer-i-Carbonell, 2004: Van Praag et al, 2003). Evaluations of finance,
health, and job satisfaction, together with leisure satisfaction are the four most important
correlates (Van Praag et al., 2003). Ateca-Amestoy et al. (2008) and Spiers and Walker (2009)
find positive associations between leisure satisfaction and life satisfaction.
Neal et al. (1999) constructed a model based on the assumption that "life satisfaction is
functionally related to satisfaction with all of life's domains and subdomains" (Neal, Sirgy, &
Uysal, 1999, p. 154).In 2004. Neal and Sirgy (2004) further validated this model by
GALGOTIA
S UNIV
ERSITY
LIFE SATISFACTION: A LITERATURE REVIEW
The Researcher- International Journal of Management Humanities and Social Sciences July-Dec 2016, 1(2) 29
demonstrating that there is a correlation between satisfaction with leisure life and satisfaction
with life in general. Sirgy, Rahtz, Cicic, and Underwood (2000) developed a similar model and
included leisure as part of the "global satisfaction with other life domains" (Sirgy & Comwell.
2001: Sirgy et al., 2000).
Rode, Joseph Charles (2002) examined a job and life satisfaction model that included both
environmental conditions and personality measures within a longitudinal framework and
national r ep resen ta t ive sample to better understand the relationship of job satisfaction and
life satisfaction over time. Satisfaction with Life Index was created calculating, subjective well
being on the basis of health, wealth and access to basic education (White, Adrian (2007).
Life Cycle Happiness and its Sources was tried to be found out Easterlin, Richard A. 2006; Van
Praag, Bernard M.S., and Ada Ferrer-i-Carbonell (2008) and relation-ships among stressful life
events, temperament, problem behavior was also tried to be studied McKnight, C. G., Huebner,
E. S., &Suldo, S. M. (2002). Reschly, A. L., Huebner, E. S., Appleton, J. J., &Antaramian, S.
(2008).
Life satisfaction was studied amongst the below poverty line in India , Biswas-Diener, R.,
&Diener, E. (2001). Satisfaction with Life Index was created calculating, subjective well being
on the basis of health wealth , and access to basic education .White, Adrian (2007). Tremblay et
al. (2006) examined the role of subjective vitality and the perception of stress as mediators
between general life satisfaction and post-traumatic physiological and psychological health.
They found that satisfaction with life optimistically predict subjective vitality and negatively
predicted perceived stress.
Both resilience as well as perceived positive stress are positively related to life satisfaction
(Abolghasemi & Varaniyab, 2010). This demonstrates that life satisfaction increases with an
increase in resilience and a decrease of stress. Other conditions that influence life satisfaction
include demographic, environmental, and interpersonal factors (Koohsar & Bonab, 2011).
Saari and Judge (2004) add that factors such as taking pleasure in life, finding life meaningful,
consistency at the matter of reaching goal satisfaction, positive individual identity, physical
fitness, economical security, and social relationships are all important life satisfaction indicators.
The twenty first century ushered in specific studies on Life Satisfaction. AshleyD.Lewis,E.Scott
Huebner, Patrick S.Malone&RobertF.Valois (2011) tried to find out the various components of
Life Satisfaction in particular age groups such as adolescents Kohler et al. (2005), The authors
analyze the effects of partnerships and having children on Their results show that the first child
increases happiness for women but not for men, and that the magnitude of the effect is
considerable (half or more the size of the effect of being in a partnership). Additional children
are found to lower female happiness (and do not affect men).
Gender and Life Satisfaction also is an important study on life satisfaction stating the reasons of
Life satisfaction among women . The study depicts that women have average level of life
GALGOTIA
S UNIV
ERSITY

LIFE SATISFACTION: A LITERATURE REVIEW
The Researcher- International Journal of Management Humanities and Social Sciences July-Dec 2016, 1(2) 30
satisfaction at all age levels. It is found that with an increase in age, the overall life
satisfaction decreases; whereas, with an increase in personal income, the overall life
satisfaction increases. Moreover, with an increase in family income, the overa ll life
satisfaction of women also increases. Calasanti, T. M. (2009); CarmeTraid, W. (2009);
Machinov and Fernandez (2012). Muzamil Jan* and TasiaMasood(2008); Saundra HS, Hughey
AW 2003. African American Women; Kousha M, Moheen N 2004; KhannaShipra(2015) .
The direction of this relationship continues to be a source of debate.
Dispositional explanations, for example, propose a ‘spillover’ (Schmitt & Mellon, 1980) of general affective states of life satisfaction to the job situation (Judge & Locke, 1993; Staw, Bell,
& Clausen, 1986). Conversely, Rousseau (1978) and Chacko (1983) contend that job satisfaction
had a greater influence on life or non-work satisfaction than vice versa. They argued that this
was explained by the valence or value individuals place on work in general. Recent empirical
studies by Adams et al. (1996) and Judge et al. (1998) affirm this underlying sequence.
Likewise, Wright and Staw (1999) reviewed expectancy theory, goal-setting theory, and
attribution theory, and concluded that each theory predicts that positive mood is related to
motivation across a wide range of situations. Empirically, several studies have found a
relationship between subjective well-being and individual performance in the work domain
(Cropanzano & Wright, 1999; Staw & Barsade, 1993; Staw, Sutton, & Pelled, 1994; Wright &
Cropanzano, 1997,2000). However, in their study of CEO life satisfac-tion and firm performance
in small entrepreneurial firms, Daily and Near (2000) found no significant relationship.
3.Conclusion
Life satisfaction has been conceptualized as a cognitive constituent of subjective well-being.
High satisfaction suggests that the quality of life, in the population concerned, is good. Low
satisfaction on the other hand marks serious shortcomings of some kind. This is consistent with
Bradley & Corwyn (2004) who say that life satisfaction reflects both the extent to which basic
needs are met and the extent to which a variety of other goals are viewed as attainable. From this
perspective it reasonable seems that by realization of more goals, satisfaction with life will also
increase.
According to Beutell (2006) it is believed that life satisfaction is related to better physical, and
mental health, longevity, and other outcomes that are considered positive in nature. In addition,
Chow (2009) argues that improved levels of life satisfaction might give rise to better health in
the future.
Recent research, nevertheless, acknowledges that life satisfaction, should be important
considerations for organizations (Nadkarni & Stening, 1989). Researchers, are attempting to
explain the linkages between life satisfaction with other aspects by proposing that satisfaction in
one domain of an individual’s life extends into other areas.
GALGOTIA
S UNIV
ERSITY

LIFE SATISFACTION: A LITERATURE REVIEW
The Researcher- International Journal of Management Humanities and Social Sciences July-Dec 2016, 1(2) 31
References
1. Gurin, G., J. Veroff and S. Feld (1960.)Americans view their mental health. A nationwide
interview surve y. New York: Basic Books.
2. Cantril, H. (1965). The pattern of human concern. New Brunswick: Rutgers University Press
3. Bradburn, N. M. (1969).The structure of psychology gical well-bein g. Chicago: Aldine
publishing.
4. Alam, O.G. and Srivastava, Ramji (1971). A manual for Life Satisfaction Scale (L-S
Scale). National Psychological Corporation Kacheri Ghat, AGRA (UP).
5. Easterlin, R. A. (1974) Does economic growth improves the human lot? Some empirical
evidence. In: David, P. A. and W. R. Melvin (Eds.) Nations and Households in economic
growth. New York: Academic press. 89-125.
6. Campbell, A., P. E. Converse and W. L. Rodgers (1976). The Quality of American Li fe
New York: Russel Sage Foundation.
7. Veenhoven, R.( 1984). Conditions of happiness. Dordrecht: Reidel, (reprinted 1991 by
Kluwer Academic.)
8. Diener, Emmons, Larsen and Griffin( 1985) The Satisfaction with Life Scale , The Journal of
Personality Assessment page 71- 72
9. Veenhoven, R.( 1989). How harmfull is happiness? Consequences of enjoying life or not.
University Press Rotterdam.
10. Veenhoven, R. (1989). Does happiness bind? In: Veenhoven, R. 1989. 44-60.
11. Veenhoven, R.( 1990). Inequality in happiness. Inequality in countries compared between
countries.Madrid: Paper presented at the 12th IS A conference.
12. Veenhoven, R. (1991) Is happiness relative? Social Indicators Research, 24, 1-34.
13. Schwarz, N. and N. Strack (1991). Evaluating one's life: a jud gement model of subjective
well-being. In: Strack et al. (Eds.). 27-48.
14. Adams G. A , King, L A. and. King, D W (1996, ) Relationships of Job and Family
Involvement, Family Social Support, and Work-Family Conflict With Job and Life
Satisfaction Journal of Applied Psychology Vol. SL No. 4, 411-420
15. Diener, E., Suh, E.H., Lucas, R.E., & Smith, H.L. (1999). Subjective well- being:
Three decades of progress .Psychological Bulletin, 125, 276-302.
16. Galloway Susan (2005) Well-being and quality of life: Measuring the benefits of culture
and sport: a literature review and think piece Scottish Executive Social Research
17. Ashley D. Lewis • E. Scott Huebner •Patrick S. Malone • Robert F. Valois (2011)
Life Satisfaction and Student Engagement in Adolescents J Youth Adolescence 40:249–262 DOI 10.1007/s10964-010-9517-6
18. Dr. D.F. Meyer Dr. S.H. Dunga( 2014) The Determinants of Life Satisfaction in a Low-
Income Poor Community in South Africa J Mediterranean Journal of Social Sciences MCSER
Publishing, Rome Italy ISSN2039-2117(online) ISSN 2039-9340(print) Vol5 No; 13
19. Bum J Kim Kristen F Linton Wesley Lum(2015) Social capital and life
satisfaction among Chinese and Korean elderly immigrants Journal of Social
Work Vol 15 (1) 87-100 sage pub.co.uk/journals permissions .nav DOI
10.1177/1468017313504699
20. Abdullah sürücü03 june 2014, evaluation of life satisfaction among
guidanceteachers with respect to certain variables 10th international academic
conference, vienna isbn 978-80-87927-02-1, iises necmettin erbakan university ahmet
kelesoglu education faculty , turkey
GALGOTIA
S UNIV
ERSITY

LIFE SATISFACTION: A LITERATURE REVIEW
The Researcher- International Journal of Management Humanities and Social Sciences July-Dec 2016, 1(2) 32
21. Kim O1Loneliness: a predictor of health perceptions among older Korean immigrants.
https://www.ncbi.nlm.nih.gov/pubmed/9354113
22. http://homepages.rpi.edu/~verwyc/TMOH17.htm
23. http://www.hse.gov.uk/research/rrpdf/rr952.pdf
24. https://etd.ohiolink.edu/!etd.send_file?accession=bgsu1383319235&disposition=inline
25. https://www.academia.edu/1183520/DETERMINANTS_OF_LIFE_SATISFACTION
26. http://www.zeepedia.com/read.php?performance_determinants_of_job_performance_why_i
s_performance_measured_performance_management_human_resource_management&b=33&
c=25
27. https://www.classle.net/#!/classle/content-page/determinants-job-performance/
28. https://www.ukessays.com/essays/psychology/definition-of-life-satisfaction-psychology-
essay.php
GALGOTIA
S UNIV
ERSITY

FINANCING ALTERNATIVES FOR SACCOS AND THEIR IMPACT ON FINANCIAL PERFORMANCE: EVIDENCE FROM
TANZANIA
The Researcher- International Journal of Management Humanities and Social Sciences July-Dec 2016, 1(2) 33
Financing Alternatives for SACCOS and their Impact on Financial Performance: Evidence
from Tanzania
1Mosses Mwizarubi,
2Ramarcha Kumar,
3Bernard Mnzava
4Sadananda Prusty
Abstract This paper examines the impact of capital structure on financial performance for Savings and
Credit Cooperative Societies (SACCOS). The study uses panel data of 484 observations of
SACCOS whose information was gathered by the Bank of Tanzania from 2008 to 2012. Using
fixed effects approach, the findings indicate that increased use of members’ savings and using larger proportion of resources for lending purposes lead to a better financial performance. Firm
size is found to have a negative impact while debt usage does not guarantee good performance.
The results are robust to alternative regression estimates. To the best of our knowledge, this is
the first time a study is conducted on the impact of capital structure on financial performance of
SACCOS. Previous studies concentrated on banking industry and other types of MFIs apart from
SACCOS. This fact makes the findings of this research to be unique.
Keywords: Microfinance, Financial Sustainability, Capital Structure.
1. Introduction
Savings and Credit Co-operative Societies (SACCOS) are financial vehicles that are perceived to
be more attractive to customers, hence deeply embedding themselves in the financial sectors of
many countries (Munyiri, 2006). This has been argued to be contributed by the fact that they
have solid bases of small saving accounts, which form a stable and relatively low-cost source of
funding and low administrative costs, thus making them capable of advancing loans at interest
rates lower than those charged by other financial providers. (Branch, 2005). Another important
fact is that SACCOS have the ability to reach clients in areas that are distasteful to banks such as
rural or poor areas, and they reach such areas with the core objective of ensuring members
empowerment through mobilization of savings and disbursement of credit (Ofei, 2001).
Despite the fact that SACCOS are seen to bring financial redemption to low-income people, it
has been argued that, for them to operate sustainably, savings mobilization should be backed by
adequate institutional capital that ensures permanency, provide cushion to absorb losses and
impairment of members’ savings. This is important in ensuring the permanence and growth of
the SACCOS (economic and financial viability) even in turbulent economic times (Evans, 2001;
1 PhD Student Financial Analyst, Bank of Tanzania
2 Associate Professor, Galgotias University, Greater Noida – India
3 Senior Lecturer, Institute of Finance Management, Dar es salaam
, Tanzania
4 Professor, Galgotias University, Greater Noida – India
GALGOTIA
S UNIV
ERSITY

FINANCING ALTERNATIVES FOR SACCOS AND THEIR IMPACT ON FINANCIAL PERFORMANCE: EVIDENCE FROM
TANZANIA
The Researcher- International Journal of Management Humanities and Social Sciences July-Dec 2016, 1(2) 34
Gijselinckx and Devetere, 2007). The above argument suggests that SACCOS should look for
other financing means rather than focusing on members’ savings only. On this ground, this paper
analyzes the financing alternatives and their impact on financial performance of SACCOS in
Tanzania.
2. Brief Background of SACCOS in Tanzania
SACCOS are the most widespread form of financial intermediaries at the grass root in Tanzania,
especially in rural areas, which make them the most predominant rural based MFIs. They are
registered under the Cooperative Societies Act 2013, which requires a minimum of 20 members
(URT, 2014), and are currently under the Ministry of Agriculture, Food Security and
Cooperatives. Generally, there has been a progress in the development of SACCOS in the
country although there have been some challenges as well. As we can see in Table 1 below,
there was an abrupt and continuous growth of SACCOS in terms of number of SACCOS,
members, shares and savings, and loans disbursed from 2006 to 2009. This was mainly caused
by deliberate efforts of the 4th phase Government to promote the formation of SACCOS –
through providing them with funds – so as to ensure inclusion of the poor and low income strata
of the population in the formal financial system.
As at the end of 2009, among the existing SACCOS, 44% were located in urban areas while 56%
were located in rural areas. Of the total members, 56% were male, 41% were female and 3%
were groups. Although this was seen as a good progress, after 2009 there was a stagnation in the
SACCOS growth, which was thereafter followed by decrease in the number of SACCOS as a
result of deregistration and amalgamation in order to have sustainable SACCOS. A good
example is the trend seen from year 2009 to 2010 (Mgoba, 2011). This happened because some
of the SACCOS were formed in rush and without having proper roots, especially after the
government announced to provide them with grant funds; therefore they collapsed just a short
period of time after they were established.
Table 1: SACCOS’ Performance in Tanzania
Item 2005 2006 2007 2008 2009 2010 2011
No. of SACCOS 1,875 2,028 4,445 4,780 5,332 5,168 5,314
No. of members 255,938 291,344 765,931 713,699 820,670 917,889 970,665
Shares and savings
(Billion TZS) 44.56 52.65 113.33 134.00 181.60 236.80 399.00
Disbursed Loans
(Billion TZS) 54.14 66.99 186.58 228.50 383.50 539.2 627.2
Source: Ministry of Agriculture, Food Security and Cooperatives (Annual Reports)
Note: These statistics might include some dormant SACCOS that were not yet
deregistered during data collection and/or publication of the reports.
3. Literature Review
The following is a review of some empirical evidence on the impact of capital structure (funding
options and mix) on financial performance for Microfinance Institutions (MFIs).
GALGOTIA
S UNIV
ERSITY

FINANCING ALTERNATIVES FOR SACCOS AND THEIR IMPACT ON FINANCIAL PERFORMANCE: EVIDENCE FROM
TANZANIA
The Researcher- International Journal of Management Humanities and Social Sciences July-Dec 2016, 1(2) 35
The research by Coleman (2007) came out with the findings that the highly leveraged MFIs in
Ghana perform better by reaching out to more clients, enjoy economies of scale, and therefore
are better able to deal with moral hazard and adverse selection, thus improving their ability to
deal with risk. Similarly, the findings of the research conducted by Silva (2008), Kar (2012) and
Lislevand (2012) are consistent with the findings of the study by Coleman (2007). Kar (2012)
suggests that the increase in leverage raises profit-efficiency in MFIs while Lislevand (2012)
suggests that the use of debt is beneficial to the MFIs as far as cost of funds is concerned.
Contrary to the above authors; Hoque, Chishty and Halloway (2011) found that leverage
decreases the relative level of outreach to the very poor, suggesting that MFIs can adopt a non-
commercial approach to financing as an alternative to commercialization. In addition to that, the
study by Tehulu (2013) revealed that leverage (measured by debt to equity ratio) has a negative
and statistically significant impact on MFIs’ financial performance.
Regarding MFIs’ dependency on donors, Peter (2007) found a negative relationship between the
financial performance of a MFI and the level of subsidies it receives each quarter i.e. the more
the level of subsidy income rises, the more the respective MFI’s financial performance falls.
Similarly, Kereta (2007) found a negative relationship between dependency ratio (the ratio of
donated equity to total capital) and financial performance. Furthermore, Sekabira (2013)
suggests that grants and debt have a substantial damaging consequence on MFI performance, and
capital structure is an essential aspect on MFIs’ sustainability.
On the other hand, for the MFIs that collect savings, Iezza (2010) found that the collection of
deposits from clients has positive influence on MFI’s financial performance. In more or less the
same manner, Kioko (2012) revealed that deposit to asset ratio is a statically significant
determinant of MFI sustainability in Kenya; while for the non-deposit taking MFIs debt to equity
ratio is a significant determinant of MFI sustainability. Another research from Kenya by Kiiru
(2008), this time focusing on Deposit Taking Micro Finance institutions (DTMFIs) revealed that
the increase in customer deposits and assets in DTMFIs would significantly improve financial
performance of DTMFI while borrowing significantly decreases DTMFIs financial performance.
Focusing on share capital, Bogan (2012) revealed that share capital as a percent of assets is
significant and negatively related to MFI’s financial performance. Complementary to this, Kinde
(2012) found that debt to equity ratio has a negative but statistically insignificant impact on
financial sustainability, and there is a negative and statistically significant relationship between
dependency ratio and financial sustainability at 1% level of significance. On the other hand, Ngo
(2013) suggested that profitable and regulated MFIs that utilize considerably more commercial
funds have higher level of sustainability, efficiency and outreach. Lastly, Mwizarubi, Singh and
Mnzava (2015) revealed that deposit mobilization is the most crucial determinant of financial
sustainability amongst other MFI capital structure variables, followed by shareholders equity,
debt (commercial borrowing) and lastly going public.
GALGOTIA
S UNIV
ERSITY

FINANCING ALTERNATIVES FOR SACCOS AND THEIR IMPACT ON FINANCIAL PERFORMANCE: EVIDENCE FROM
TANZANIA
The Researcher- International Journal of Management Humanities and Social Sciences July-Dec 2016, 1(2) 36
Apart from the researches conducted in microfinance industry, there are findings from banking
industry as well. For instance, Goyal (2013) revealed a positive relationship of short-term debt
with banks’ profitability in India while Taani (2013) found that bank performance, which is
measured by net profit, return on capital employed and net interest margin has a significant and
positive association with total debt; while total debt is found to be insignificant in determining
return on equity in the banking industry of Jordan. Moreover, Mujahid et al (2014) found a
positive relationship between leverage and performance of banking industry.
The research by Anarfo (2015) in Sub-Sahara Africa revealed a negative relationship between
leverage and bank performance, and indicated that capital structure does not determine bank
performance but rather it is performance that determines banks capital structure. In this study the
performance variables used were return on asset (ROA), Return on equity (ROE) and net interest
margin (NIM). Nikoo (2015), conducting the same study in Tehran Stock Exchange, found that
debt-to-equity ratio has positive impact on bank performance.
The critical analysis of the above-discussed literatures show that there are mixed results on the
impact of capital structure on financial performance. In addition to that, to the best knowledge of
the researchers, the studies are concentrated on banking industry and other types of MFIs apart
from SACCOS. These facts raise a need for further research on the subject matter.
4. Methodology
This paper employs quantitative research techniques and uses secondary data only. It utilizes
secondary data of over 200 SACCOS that was collected by the Bank of Tanzania (BOT) from
2008 to 2012. However among the assessed SACCOS, 105 were sampled because they reported
consistently for at least two years, and the rest were left because of not meeting that requirement.
In total there are 484 observations, with SACCOS reported from 2 to 5 times, but most SACCOS
reported 5 times, making the average number of observation per SACCOS to be 4.6 times.
Financial performance is measured by two factors: Return on Assets (ROA) and Return on
Equity (ROE), which are the dependent variables. The capital structure variables (independent
variables) include Debt to Equity Ratio (DTEQ) and Savings to Assets Ratio (SAVAST). The
control variables included in this study are the effectiveness in loans disbursement – measured by
Loans to Total Assets Ratio (LOANAST), firm size – measured by Logarithm of Assets
(LOGAST), and time effects – measured by years dummies. We employed panel data analysis
methods as explained in many econometrics books such as Gujarat (2003). The following
regression equations summarize the study:
ROA = α + β1DTEQ + β2SAVAST + β3LOANAST + β4LOGAST………… (1) ROE = α + β1DTEQ + β2SAVAST + β3LOANAST + β4LOGAST………… (2)
5. Data Set and Analysis
As pointed out in Section 4 above, the variables included in this study are ROA, ROE, DTEQ,
SAVAST, LOANAST and LOGAST. All the variables, except LOGAST, are financial ratios.
ROA is a profitability measure and is calculated as a ratio of net income to total assets. In the
same manner, ROE is a profitability measure, calculated as the ratio of net income to total
GALGOTIA
S UNIV
ERSITY

FINANCING ALTERNATIVES FOR SACCOS AND THEIR IMPACT ON FINANCIAL PERFORMANCE: EVIDENCE FROM
TANZANIA
The Researcher- International Journal of Management Humanities and Social Sciences July-Dec 2016, 1(2) 37
equity. DTEQ is the measure of firm’s financial leverage and is calculated as the ratio of total
liabilities to total equity. SAVAST is the measure of the extent to which the financial institution
is capable of mobilizing savings and is calculated as the ratio of total savings to total assets.
LOANAST is the measure of the extent to which SACCOS use their resources for lending
purposes and is calculated as the ratio of gross loan portfolio to total assets. On the other hand
LOGAST is a proxy for firms size and is calculated by taking the natural logarithm of total
assets. Table 2 below gives a summary of descriptive statistics of the variables put in place.
Table 2: Descriptive Statistics of the Variables
Variable
Number of
observations Mean
Standard
Deviation
Minimum
Figure
Maximum
Figure
ROA 484 0.036216 0.045123 -0.1642 0.2081
ROE 484 0.049224 0.071454 -0.3103 0.2885
DTEQ 484 0.644898 1.414538 0 12.6877
SAVAST 484 0.517169 0.211066 0 0.9742
LOANAST 484 0.741672 0.153599 0.1667 0.9925
LOGAST 484 8.5576 0.70793 6.8791 10.1921
All the variables are defined in Section 4 of this paper.
A rough prediction on the relationship among the variables was generated through correlation as
shown in Table 3 below. This gives a highlight of the possible impact of independent variables
(DTEQ, SAVAST, LOANAST and LOGAST) on the dependent variables (ROA and ROE). As
we can see, SAVAST and LOANAST seem to have a positive effect on ROA, while DTEQ and
LOGAST seems to affect ROA in a negative manner. On the other hand, all the explanatory
variables, except LOGAST, seem to have a positive effect on ROE.
Table 3: Correlation Matrix of the Variables
ROA ROE DTEQ SAVAST LOANAST LOGAST
ROA 1.00
ROE 0.90*** 1.00
(0.00)
DTEQ -0.17*** 0.05 1.00
(0.00) (0.28)
GALGOTIA
S UNIV
ERSITY

FINANCING ALTERNATIVES FOR SACCOS AND THEIR IMPACT ON FINANCIAL PERFORMANCE: EVIDENCE FROM
TANZANIA
The Researcher- International Journal of Management Humanities and Social Sciences July-Dec 2016, 1(2) 38
SAVAST 0.23*** 0.04 -0.51*** 1.00
(0.00) (0.39) (0.00)
LOANAST 0.18*** 0.15*** 0.11** 0.11*** 1.00
(0.00) (0.00) (0.02) (0.01)
LOGAST -0.19*** -0.12*** 0.19*** -0.14*** -0.06 1.00
(0.00) (0.01) (0.00) (0.00) (0.18)
Notes: p-values in parentheses. *, ** and *** indicate significant correlations at 10, 5 and
1 percent respectively (correlation coefficients are the ones that are not in parentheses).
All the variables are defined in Section 4 of this paper.
After conducting the above preliminary tests, data analysis was conducted using fixed effects
regression analysis, which is a primary test for panel data. Thereafter random effects and pooled
regression analysis methods were employed. Hausman test was also conducted to check the
suitability of either fixed effects or random effects regression methods on different equations.
The research findings are discussed in Section 6 below.
6. Discussion of the Findings
6.1 Main Results – Based on Fixed Effects Regression
These results are summarized in Table 4 below whereby Model (1) and (3) summarize the results
of the independent variables on Return on Assets (ROA), and the impact of the same variables
on Return on Equity (ROE) in Model (2) and (4). Model (1) and (2) are based on main
independent variables only while Model (3) and (4) include all variables i.e. independent
variables and control variables. Both ROA and ROE (dependent variables) are the measures of
SACCOS’ performance in terms of profitability. The statistical significance of the results is
indicated at three levels: 1%, 5% and 10% levels of significance. The Hausman Test results are
also included in these findings so as to determine whether one should rely on the results basing
on fixed effects or random effects approach. The basis of making a decision is to look at the p-
value of Chi-square; when the value is statistically significant one has to rely on fixed effects
approach, otherwise random effects approach is applicable.
The Hausman Test reveals that Model (1) and (3) fit for fixed effects analysis. From Model (1),
it is revealed that savings mobilization has a positive and statistically significant impact on
SACCOS’ performance at 1% level while using debt has a negative but statistically insignificant impact. The results from Model (3) reveal a positive but statistically insignificant relationship
between debt usage and performance of the SACCOS. It also shows that the ratio of savings to
assets (SAVAST) and the ratio of outstanding loans to assets (LOANAST) have a positive
impact on ROA, while firm size (LOGAST) has a negative impact. The impact of SAVAST is
statistically significant at 1%; that of LOANAST is statistically significant at 5%, while that of
LOGAST is not statistically significant at all three levels of significance. This suggests that
borrowing does not guarantee better performance for SACCOS; the more the SACCOS mobilize
GALGOTIA
S UNIV
ERSITY
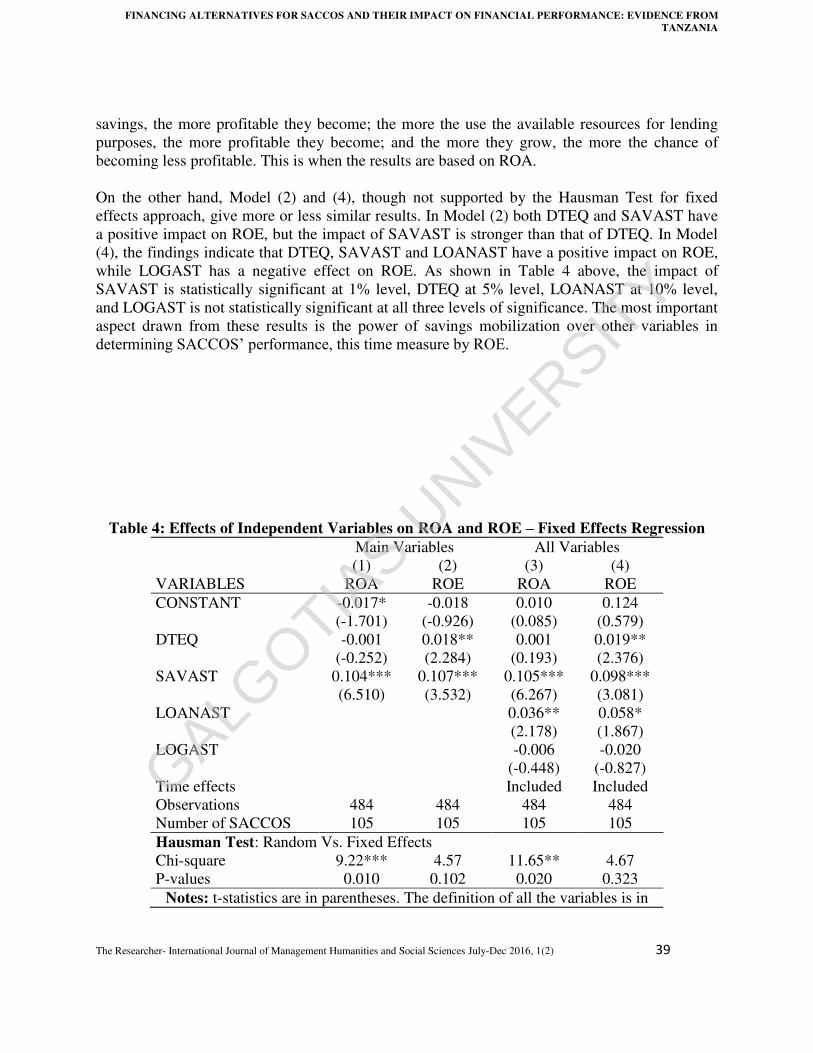
FINANCING ALTERNATIVES FOR SACCOS AND THEIR IMPACT ON FINANCIAL PERFORMANCE: EVIDENCE FROM
TANZANIA
The Researcher- International Journal of Management Humanities and Social Sciences July-Dec 2016, 1(2) 39
savings, the more profitable they become; the more the use the available resources for lending
purposes, the more profitable they become; and the more they grow, the more the chance of
becoming less profitable. This is when the results are based on ROA.
On the other hand, Model (2) and (4), though not supported by the Hausman Test for fixed
effects approach, give more or less similar results. In Model (2) both DTEQ and SAVAST have
a positive impact on ROE, but the impact of SAVAST is stronger than that of DTEQ. In Model
(4), the findings indicate that DTEQ, SAVAST and LOANAST have a positive impact on ROE,
while LOGAST has a negative effect on ROE. As shown in Table 4 above, the impact of
SAVAST is statistically significant at 1% level, DTEQ at 5% level, LOANAST at 10% level,
and LOGAST is not statistically significant at all three levels of significance. The most important
aspect drawn from these results is the power of savings mobilization over other variables in
determining SACCOS’ performance, this time measure by ROE.
Table 4: Effects of Independent Variables on ROA and ROE – Fixed Effects Regression
Main Variables All Variables
(1) (2) (3) (4)
VARIABLES ROA ROE ROA ROE
CONSTANT -0.017* -0.018 0.010 0.124
(-1.701) (-0.926) (0.085) (0.579)
DTEQ -0.001 0.018** 0.001 0.019**
(-0.252) (2.284) (0.193) (2.376)
SAVAST 0.104*** 0.107*** 0.105*** 0.098***
(6.510) (3.532) (6.267) (3.081)
LOANAST 0.036** 0.058*
(2.178) (1.867)
LOGAST -0.006 -0.020
(-0.448) (-0.827)
Time effects Included Included
Observations 484 484 484 484
Number of SACCOS 105 105 105 105
Hausman Test: Random Vs. Fixed Effects
Chi-square 9.22*** 4.57 11.65** 4.67
P-values 0.010 0.102 0.020 0.323
Notes: t-statistics are in parentheses. The definition of all the variables is in
GALGOTIA
S UNIV
ERSITY

FINANCING ALTERNATIVES FOR SACCOS AND THEIR IMPACT ON FINANCIAL PERFORMANCE: EVIDENCE FROM
TANZANIA
The Researcher- International Journal of Management Humanities and Social Sciences July-Dec 2016, 1(2) 40
Section 4 of this paper. Time dummies are included in Model (3) and (4).
*** p<0.01, ** p<0.05, * p<0.10
Hence, from fixed effects analysis based on both ROA and ROE, members’ savings mobilization by SACCOS is seen to be the most efficient way (among the variables taken into consideration)
of ensuring good performance of SACCOS in terms of profitability. This is because it both cases
its impact is positive and statistically significant at 1% level. The second factors in term of
importance is amount of funds lent (LOANAST), whose impact is positive in both cases but with
statistical significance at 5% and 10% levels in Model (1) and Model (2) respectively. Debt
usage (DTEQ) and size of the SACCOS (LOGAST) are the last ones in this case because they
impact have different signs and they are less statistical significant. The consolidation of the
findings, which also states which approach between fixed effects and random effects regression
is better in each case, will come later in the “Hausman Test” discussion.
6.2 Robustness Checks
To ensure that our results are robust we conducted two alternative tests: (1) Random effects
regression, and (2) Pooled regression. The results of these robustness tests are discussed in Sub-
Sections 6.2.1 and 6.2.2 below.
6.2.1 Results Based on Random Effects Regression
As it was in Section 6.1, there are four models, whereby Model (1) and (3) summarize the results
of the independent variables on Return on Assets (ROA), and Model (2) and (4) the impact of
these variables on Return on Equity (ROE). Model (1) and (2) are based on main independent
variables only while Model (3) and (4) include all variables i.e. independent variables and
control variables. The statistical significance of the results is indicated at 1%, 5% and 10% levels
of significance. The Hausman Test reveals that Model (2) and (4) fit for random effects analysis,
hence we start discussing the findings of these models in this Sub-Section.
As shown in Table 5 below, in Model (2), the results show that both SAVAST and DTEQ have a
positive relationship with ROE, but the impact of SAVAST is stronger than that of DTEQ. This
once again insists that SAVAST is the key driver of SACCOS’ performance. In Model (4), the
results reveal that only LOGAST has a negative relationship with ROE while the rest of the
variables have a positive relationship with ROE. The effect of SAVAST and LOANAST is
statistically significant at 5% level; DTEQ at 10% and LOGAST is not statistically significant at
all three levels. This is in line with the main findings that SAVAST and LOANAST are the key
drivers of SACCOS’ performance.
Table 5: Effects of Independent Variables on ROA and ROE – Random Effects Regression
(1) (2) (3) (4)
VARIABLES ROA ROE ROA ROE
CONSTANT -0.005 0.011 0.052 0.087
(-0.626) (0.770) (1.187) (1.240)
DTEQ -0.001 0.008** -0.000 0.008*
GALGOTIA
S UNIV
ERSITY

FINANCING ALTERNATIVES FOR SACCOS AND THEIR IMPACT ON FINANCIAL PERFORMANCE: EVIDENCE FROM
TANZANIA
The Researcher- International Journal of Management Humanities and Social Sciences July-Dec 2016, 1(2) 41
(-0.381) (2.020) (-0.142) (1.958)
SAVAST 0.081*** 0.063*** 0.077*** 0.054**
(6.300) (2.853) (5.906) (2.396)
LOANAST 0.038*** 0.054**
(2.709) (2.153)
LOGAST -0.009* -0.012
(-1.905) (-1.603)
Time effects Included Included
Observations 484 484 484 484
Number of SACCOS 105 105 105 105
Hausman Test: Random Vs. Fixed Effects
Chi-square 9.22*** 4.57 11.65** 4.67
P-values 0.010 0.102 0.020 0.323
Notes: t-statistics are in parentheses. The definition of all the variables is in
Section 4 of this paper. Time dummies are included in Model (3) and (4).
*** p<0.01, ** p<0.05, * p<0.10
On the other hand, in Model (1) and (3), though not supported by the Hausman Test for random
effects approach, give more or less similar results. Model (1) shows that SAVAST has a positive
and significant impact on ROA at 1% level while DTEQ has a negative and statistically
insignificant impact. This puts more emphasis that SAVAST is a key driver of SACCOS’ performance while DTEQ is not a guaranteed option. In Model (3) we see that SAVAST and
LOANAST have a positive and significant impact on ROA at 1% while DTEQ and LOGAST
have a negative impact. The impact of LOGAST is statistically significant at 10% level while
that of DTEQ is not significant at all three levels. This is supplementary evidence that SAVAST
and LOGAST are the key drivers of SACCOS’ financial performance.
Hence, from random effects analysis based on both ROA and ROE, members’ savings mobilization by SACCOS is seen to be the most efficient way of ensuring good performance of
SACCOS, followed by efficient utilization of funds for lending purposes (LOANAST). Debt
usage (DTEQ) is the third factor in the rank (having negative impact in one case and positive
impact in another case), which again suggests that it is not a guaranteed approach of enhancing
performance. The size of SACCOS has a negative insignificant effect on the performance.
6.2.2 Results Based on Pooled Regression Method
This is a second robustness check that was conducted and it came out with more or less similar
results as compared with the main findings. The results of pooled regression test are summarized
in Table 6 below. As in the previous sections, Model (1) and (2) are based on main independent
variables only while Model (3) and (4) include all variables i.e. independent variables and
control variables. In Model (1) and (3) – which are ROA based – we see that savings
mobilization and efficient utilization of resources for lending purposes have positive effect on
financial performance of SACCOS at 1% level of significance. From the sane models we see that
debt usage and firm size have negative on financial performance. The results of Model (2) and
GALGOTIA
S UNIV
ERSITY

FINANCING ALTERNATIVES FOR SACCOS AND THEIR IMPACT ON FINANCIAL PERFORMANCE: EVIDENCE FROM
TANZANIA
The Researcher- International Journal of Management Humanities and Social Sciences July-Dec 2016, 1(2) 42
(4) – which are ROE based – show that all the variables, except LOGAST, have a positive
impact on financial performance. In summary, the results of pooled regression test show that
SAVAST and LOANAST have positive impact in all cases; DTEQ has positive impact in two
cases and negative impact in two cases, while LOGAST has negative impact in both cases. Thus,
we can draw similar conclusion as in the previous cases.
Table 6: Effects of Independent Variables on ROA and ROE – Pooled Regression
(1) (2) (3) (4)
VARIABLES ROA ROE ROA ROE
CONSTANT 0.016** 0.031*** 0.074*** 0.102**
(2.364) (2.881) (2.654) (2.209)
DTEQ -0.002 0.005* -0.002 0.004
(-1.302) (1.770) (-1.438) (1.565)
SAVAST 0.042*** 0.029 0.033*** 0.017
(3.854) (1.644) (3.026) (0.959)
LOANAST 0.046*** 0.058***
(3.527) (2.676)
LOGAST -0.010*** -0.012**
(-3.404) (-2.511)
Time effects Included Included
Observations 484 484 484 484
R-squared 0.058 0.008 0.108 0.043
Adj. R-squared 0.054 0.004 0.093 0.027
Notes: t-statistics are in parentheses. The definition of all the variables is in
Section 4 of this paper. Time dummies are included in Model (3) and (4).
*** p<0.01, ** p<0.05, * p<0.10
7. Implication of the Findings and Conclusion
This research used SACCOS’ panel data to determine the effect of capital structure on financial performance. Primary findings were obtained by using fixed effects approach and robustness
checks were done by using random effects approach and pooled regression method. Due to the
results of the Hausman Test, the findings of Model (1) and (3) – which are ROA based – were
mainly drawn basing on fixed effects approach, and those of Model (2) and (4) mainly basing on
random effects approach. Basing on ROA, savings mobilization is the most important aspect in
bringing about good SACCOS performance, followed by efficient utilization of resources for
lending purposes (refer to Table 4 above). In more or less the same manner, basing on ROE, we
see the same factors to be the leading ones (refer to Table 5 above). Utilization of credits
(especially commercial borrowing) by SACCOS seems not to guarantee good performance,
probably due to the fact that the cost of capital (interest charges) is higher in this option as
compared to members’ savings mobilization. Likewise, the size of SACCOS does not guarantee
GALGOTIA
S UNIV
ERSITY

FINANCING ALTERNATIVES FOR SACCOS AND THEIR IMPACT ON FINANCIAL PERFORMANCE: EVIDENCE FROM
TANZANIA
The Researcher- International Journal of Management Humanities and Social Sciences July-Dec 2016, 1(2) 43
good performance; and in some cases the more the SACCOS grow, the less efficient they
become. The possible reasons for this might be management incompetence and misuse of
resources as the SACCOS grow, which can be attributed by the fact that most of them do not
adhere to corporate governance principles and mechanisms.
The findings of this research imply that mobilization of members’ savings and effective
utilization of funds for lending purposes are important aspects for good SACCOS’ performance.
Further, they bring the implication that usage of commercial borrowings is not a guaranteed
approach of bringing financial sustainability; and SACCOS growth (in terms of total assets) need
to well managed, otherwise it might lead to adverse effects on financial sustainability. It is
therefore recommended that SACCOS should capitalize on efficient mobilization of members’ savings and borrow less, unless they get cheap sources of external funds such as soft loans.
These institutions are encouraged to use a greater portion of their funds for lending purposes
instead of engaging themselves in other types of business. In addition to that, they should focus
on best corporate governance practices so that they will not experience poor performance as they
grow. This will make them sustainable operationally and financially.
References
1. Anarfo, E.B. (2015), Capital Structure and Bank Performance – Evidence From Sub-Sahara
Africa, European Journal of Accounting Auditing and Finance Research, Vol.3, No.3, pp.1-
20
2. Bogan, V.L. (2012), Capital Structure and Sustainability: An Empirical Study of
Microfinance Institutions, Review of Economics and Statistics, Vol. 94, No. 4, pp.1045-1058.
3. Branch, B. (2005), Kenyan Government Develops First CU Regulation with WOCCU
Support, Madison:WI, USA, World Council Of Credit Unions.
4. Coleman, A.K. (2007), The impact of capital structure on the performance of microfinance
institutions, The Journal of Risk Finance, Vol. 8, Issue 1, pp.56 – 71.
GALGOTIA
S UNIV
ERSITY
FINANCING ALTERNATIVES FOR SACCOS AND THEIR IMPACT ON FINANCIAL PERFORMANCE: EVIDENCE FROM
TANZANIA
The Researcher- International Journal of Management Humanities and Social Sciences July-Dec 2016, 1(2) 44
5. Evans A. C. (2001), Strengthening Credit Unions in Sri Lanka: Research Monograph, World
Council Of Credit Unions, Madison:WI, USA.
6. Gijselinckx, C. and Develtere, P. (2007), The co-operative trilemma: Cooperatives between
market, state and the civil society, Research Paper, Catholis Univeristy, Leuven, Belgium.
7. Goyal, A.M. (2013), Impact of Capital Structure on Performance of Listed Public Sector
Banks in India, International Journal of Business and Management Invention, Volume 2,
Issue 10, pp.35-43
8. Gujarati, D.N. (2003), Basic Econometrics, New York: McGraw Hill Book Co.
9. Hoque, M., Chishty, M. and Halloway, R. (2011), Commercialization and Changes in Capital
Structure in Microfinance Institutions: An Innovation or Wrong Turn? Emerald - Managerial
Finance, Vol. 37, No. 5, pp.414 – 425.
10. Iezza, P. (2010), Financial Sustainability of Microfinance Institutions: An Empirical
Analysis, Master’s Thesis (MSc. in Economics and Business Administration), Department of
Economics, Copenhagen Business School.
11. Ismail, A.G. and Possumah, B.T. (2012), Does the Capital Structure Matter for Islamic
Microfinance Institutions? IRTI Working Paper 1435-12, Islamic Research and Training
Institute.
12. Kar, A.K. (2012), Does capital and financing structure have any relevance to the
performance of microfinance institutions? International Review of Applied Economics, Vol.
26, Issue 3, pp. 329-348.
13. Kereta, B. (2007), Outreach and Financial Performance Analysis of Microfinance
Institutions in Ethiopia, African Economic Conference, Addis Ababa.
14. Kiiru, M.J. (2008), The Effect of Funding Structure on the Financial Performance of
Deposit Taking Microfinance Institutions in Kenya, A Research Project Submitted in Partial
Fulfillment of the Requirement for the Award of Master of Business Administration Degree,
University of Nairobi.
15. Kinde, B.A. (2012), Financial Sustainability of Microfinance Institutions in Ethiopia,
European Journal of Business and Management, Vol. 4, No.15, pp.1-10.
16. Kioko, M.N. (2012), Effect of Capital Structure on the Financial Sustainability of
Microfinance Institutions in Kenya, Student Research Project Output, Moi University.
17. Lislevand, C.J. (2012), The effect of capital structure on microfinance institutions
performance, Master’s thesis, Faculty of Economics and Social Sciences, University of Agder, Kristiansand.
18. Mgoba, V.A. (2011), The Status of SACCOS Development and Regulation, Presented by
Ministry of Agriculture, Food Security and Cooperatives at the Africa SACCO Regulatory
Framework Workshop.
19. Mujahid, M. et al (2014), Impact of Capital Structure on Banking Performance, Research
Journal of Finance and Accounting, Vol.5, No.19, pp.99-104
20. Munyiri, C. (2006), Study visit on the role of women in development of microfinance in
Africa, Digest 03, 3, pp. 1-6.
21. Mwizarubi, M., Singh, H. and Mnzava, B. (2015), Emerging Paradigms of Financing
Tanzanian Microfinance Institutions (MFIs) and their Impact on Financial Sustainability –
GALGOTIA
S UNIV
ERSITY

FINANCING ALTERNATIVES FOR SACCOS AND THEIR IMPACT ON FINANCIAL PERFORMANCE: EVIDENCE FROM
TANZANIA
The Researcher- International Journal of Management Humanities and Social Sciences July-Dec 2016, 1(2) 45
Part I, 11th
International Business and Social Science Research Conference – Dubai, UAE –
Jan 2015.
22. Nikoo, S.F. (2015), Impact of Capital Structure on Banking Performance: Evidence from
Tehran Stock Exchange, International Research Journal of Applied and Basic Sciences, Vol.
9 (6), pp.923-927
23. Ofei, K.A. (2001), Retooling credit unions: The case of credit union association of Ghana,
IFLIP Research Paper 1-3. Research Paper, International Labour Organization, University of
Ghana, Legon.
24. Olando, C., Jagongo, A. and Mbewa, M. (2013), The Contribution of SACCO Financial
Stewardship to Growth of SACCOs in Kenya, International Journal of Humanities and Social
Science, Vol. 3, No. 17, pp.112-137
25. Peter, C. (2007), The Success of Microfinance: What really sustains this poverty relief
effort? Free Market Forum Discussion, School of Business, Nazarene University.
26. Sekabira, H. (2013), Capital Structure and Its Role on Performance of Microfinance
Institutions: The Ugandan Case, Sustainable Agriculture Research, Vol. 2, No. 3, pp.86-100.
27. Silva, M.W. (2008), The effect of capital structure on microfinance institutions performance,
Master's thesis, University of Agder, Kristiansand.
28. Taani, K. (2013), Capital Structure effects on Banking Performance: A Case Study of
Jordan, International Journal of Economics, Finance and Management Sciences, Vol. 1(5),
pp.227-233
29. Tehulu, T.A. (2013), Determinants of Financial Sustainability of Microfinance Institutions
in East Africa, European Journal of Business and Management, Vol.5, No.17, pp.152-158.
30. URT – United Republic of Tanzania (2014), Cooperative Societies Act, 2013, The Gazette
of the United Republic of Tanzania, No.1, Vol.95
GALGOTIA
S UNIV
ERSITY

A STUDY ON APPLICATION OF NEW MEDIA FOR YOGA LEARNING AMONG WOMEN
The Researcher- International Journal of Management Humanities and Social Sciences July-Dec 2016, 1(2) 46
A Study on Application of New Media for Yoga Learning among
Women
(With Reference to Young Women of Raipur City)
1Sumedha Chaudhury Raj Kumar Das
2
Abstract
In the present scenario women are often seen becoming figure conscious particularly the
young ones aged between 18 to 30 years adapting various physical exercises. Yoga is one
such natural exercise. A research regarding this phenomenon was conducted among the
residents of Raipur, the state capital of Chhattisgarh. A sample size of 20 respondents was
taken on the basis of the area they visit for performing the yoga asanas in early morning
hours.
The research problem included what type of New Media is preferred by the young women,
Are there any particular asanas they often practice, Do they encourage others for performing
yoga and has Indian government’s call for yoga promotion influenced them. The hypothesis
for the first research problem was it might be Google, Youtube or Facebook. The second
hypothesis was most of them are career focused so it is difficult to presume the asana
preferred by them while the third hypothesis was they must be encouraging others and the
fourth presumption was the government’s call has influenced them.
Interestingly, the four hypotheses turned true after conducting the research.
Keywords: Yoga, Women, New Media
1. Introduction
Keeping in mind about the recent initiatives taken by the union as well as state governments
to promote Yoga, the traditional exercise form of India, the topic ‘A Study on Application of
New Media for Yoga Learning among Women’ has been chosen. Moreover, it relates with
the sub-theme ‘Yoga for mental and physical fitness’ of this scheduled National Seminar on ‘Women Empowerment and Sports’.
According to the art of living website, a daily yoga routine can be modified and adapted to
suit a woman’s changing needs in each phase of life, helping her to achieve peace of mind and bodily poise.
The ‘Illustrated Light on Yoga’ book written by BKS Iyengar, states that the word Yoga is
derived from the Sanskrit root yug meaning to bind join, attach and attention on, to use and
apply.
1 Kushabhau Thakre Patrakarita Avam Jansanchar Vishwavidyalaya, Raipur 2 Kushabhau Thakre Patrakarita Avam Jansanchar Vishwavidyalaya, Raipur
GALGOTIA
S UNIV
ERSITY

A STUDY ON APPLICATION OF NEW MEDIA FOR YOGA LEARNING AMONG WOMEN
The Researcher- International Journal of Management Humanities and Social Sciences July-Dec 2016, 1(2) 47
Since the area of the state capital Raipur is large, we divided it in four parts namely Gandhi
Park, Marine Drive, Anupam Garden and Bhatagaon.
The respondents were approached through schedule including around 10 close ended
questions for their convenience. It took the researchers around one day to collect the data and
three days to complete this research paper in the month of December, 2015.
2. Research Problem:
1) Which type of New Media is preferred by the young women for yoga asanas?
2) Are there any particular asanas they often practise?
3) Do they encourage others for performing yoga?
4) Has Indian government’s call for yoga promotion influenced them?
3.Hypothesis:
H1) It depends on their mood. It might be Google, Youtube or Facebook.
H2) Most of them are career focused so it is difficult to presume the asana preferred by them.
H3) Today’s youth claims self an idol so it is obvious they must be encouraging others even
for those healthy activities they do or even don’t do. H4) Yes government’s call must have influenced them. Many must not be following it physically but must be checking about yoga on New Media.
4.Data Analysis and Interpretation
We set four areas namely Gandhi Park, Marine Drive, Anupam Garden and Bhatagaon in the
state capital to conduct our study by preparing a schedule of 10 objective questions. The
findings are as follows:
Firstly, we asked the women respondentswhether they practice yoga or not wherein40% of
them said that they do not practice yoga but 60% of them agreed with it. This helped us in
proceeding with other questions concerned to our research topic.
In the second question, we asked them whether they use New Media or not for learning Yoga
asanas. 95 % replied they do use New Media while 5% accepted they do not use New Media
for the same purpose.Following our second question, the third question was if they use New
Media, which form is preferred of which 40 % said Facebook, 35% said Youtube, 15%
replied simply Internet and 5% pointed Whatsapp. Remaining 5% do not use the New Media. In fourth question, when asked about their yoga asana preference, majority i.e 55 % replied
NO while 30% highlighted Surya Namaskar because it covers the participation of many body
parts. 10% said Cardio and 5% focused on Shilpa Shetty special unable to say the exact yoga
performed by them.
Interestingly, in case of Yoga Guru which was mentioned in my fifth question, the fact
finding was quite new for us. Most among the 20 women said they watch and read Shilpa
GALGOTIA
S UNIV
ERSITY

A STUDY ON APPLICATION OF NEW MEDIA FOR YOGA LEARNING AMONG WOMEN
The Researcher- International Journal of Management Humanities and Social Sciences July-Dec 2016, 1(2) 48
Shetty related special yoga asanas. It was around 50%. Consecutively, 20% do not believe in
following a Yoga Guru. 15% however have a Yoga Guru that too a registered Doctor i.e Dr
Vivek Bharti. The yoga asanas of Sri Sri Ravishankar are liked by 5%. Similar percent
respondents like the asanas of Baba Ramdev.
Girls are figure conscious was proved by our sixth question wherein the respondents were
asked do they search yoga related asanas for physical problem on New Media. 90 percent
agreed that they do it for physical problems while 10 percent said they do not. Yet again in the seventh question we found the answer that girls are very much conscious for
their figure as well as health. When asked why they practice yoga, 95% said it is for physical
fitness. 5% said for other reasons but none said it is to get rid of diseases. When the respondents were asked whether they share the New Media contents with friends
and family members in the eighth question, 75% replied yes they do. While, 25% said they
do not asked about the effects in the ninth question, 45% said the effect is moderate. 30%
said it is very effective and 25% said it is less effective.
Most respondents seem encouraging others for checking yoga asanas on New Media in our
tenth cum last question. Interestingly, 75% women encourage others for such activities.
Merely, 25% do not encourage.
5.Conclusion
After this study the conclusion was drawn that most of the women practice Yoga and use
New Media Tools like Google, Facebook and Youtube to learn this. An interesting fact was
revealed that there is no particular asana in their preference but some of them are aware about
Surya Namaskar and Cardio.
Interestingly Shilpa Shetty is the most famous yoga guru among women of Raipur and some
of them follow Dr.Vivek Bharti.
Most of the women of the Raipur city are figure conscious and utilize the new media tools to
search yogasana for their physical fitness and most of them even share the contents over New
Media with their friends and family members.
On the point of effectiveness most of the women believe that using New Media tools for yoga
learning has Moderate effect and few of them consider this as a highly effective tool.
Lastly, we found that the Indian Government's call to practice and promote yoga over various
media platforms is effective upon the women of Raipur city, Most of them are not only
practising yoga on daily basis but also encouraging others to get physical and mental fitness.
Reference
1. http://www.dailypioneer.com/todays-newspaper/1st-global-yoga-day-to-showcase-indias-
cultural-diversity-to-world.html
2. www.facebook.com
GALGOTIA
S UNIV
ERSITY

A STUDY ON APPLICATION OF NEW MEDIA FOR YOGA LEARNING AMONG WOMEN
The Researcher- International Journal of Management Humanities and Social Sciences July-Dec 2016, 1(2) 49
3. www.google.com
4. www.mindfulyogahealth.com
5. time.com/3929265/international-yoga-day
6. https://en.wikipedia.org/wiki/Geeta_Iyengar
7. https://www.youtube.com/user/shilpayoga
GALGOTIA
S UNIV
ERSITY