La libération par le sexe. L’homosexualité dans Race de monde et Oh Miami Miami Miami
Upload
khangminh22Category
view
1download
0
Miami University Financial Report June 30, 2018
Contents
Independent Auditor's Report 1-2
Management's Discussion and Analysis 3-9 Basic Financial Statements Statement of Net Position 10 Statement of Revenues, Expenses, and Changes in Net Position 11 Statement of Cash Flows 12-13 Notes to Financial Statements 14-44
Required Supplementary Information Retirement Plan and Other Post-Employment Benefits Plan (OPEB) Data 44-47
Uniform Guidance Audit Requirements Schedule of Expenditures of Federal Awards 48-53 Notes to Schedule of Expenditures of Federal Awards 54 Report on Internal Control Over Financial Reporting and on Compliance and Other Matters Based on an Audit of Financial Statements Performed in Accordance With Government Auditing Standards 55-56 Report on Compliance For Each Major Federal Program and Report on
Internal Control Over Compliance Required by the Uniform Guidance 57-58 Schedule of Findings and Questioned Costs 59-60 Schedule of Prior Year Findings and Questioned Costs 61

1
Independent Auditor's Report President and Board of Trustees of Miami University Report on the Financial Statements We have audited the accompanying financial statements of the business-type activities and the discretely presented component unit of Miami University (the University), a component unit of the State of Ohio, as of and for the year ended June 30, 2018, and the related notes to the financial statements, which collectively comprise the University's basic financial statements as listed in the table of contents. Management’s Responsibility for the Financial Statements Management is responsible for the preparation and fair presentation of these financial statements in accordance with accounting principles generally accepted in the United States of America; this includes the design, implementation, and maintenance of internal control relevant to the preparation and fair presentation of financial statements that are free from material misstatement, whether due to fraud or error. Auditor’s Responsibility Our responsibility is to express opinions on these financial statements based on our audit. We conducted our audit in accordance with auditing standards generally accepted in the United States of America and the standards applicable to financial audits contained in Government Auditing Standards, issued by the Comptroller General of the United States. Those standards require that we plan and perform the audits to obtain reasonable assurance about whether the financial statements are free from material misstatement. An audit involves performing procedures to obtain audit evidence about the amounts and disclosures in the financial statements. The procedures selected depend on the auditor’s judgment, including the assessment of the risks of material misstatement of the financial statements, whether due to fraud or error. In making those risk assessments, the auditor considers internal control relevant to the entity’s preparation and fair presentation of the financial statements in order to design audit procedures that are appropriate in the circumstances, but not for the purpose of expressing an opinion on the effectiveness of the entity’s internal control. Accordingly, we express no such opinion. An audit also includes evaluating the appropriateness of accounting policies used and the reasonableness of significant accounting estimates made by management, as well as evaluating the overall presentation of the financial statements. We believe that the audit evidence we have obtained is sufficient and appropriate to provide a basis for our audit opinions. Opinion In our opinion, the financial statements referred to above present fairly, in all material respects, the respective financial position of the business-type activities and the discretely presented component unit of Miami University as of June 30, 2018, and the respective changes in financial position and, where applicable, cash flows thereof for the year then ended in accordance with accounting principles generally accepted in the United States of America.

2
Emphasis of Matter As disclosed in Note 9 to the financial statements, the University restated net position at June 30, 2017 by $108,413,278. The restatement was required to be made for the implementation of GASB Statement No. 75 – Accounting and Financial Reporting for Postemployment Benefits Other Than Pensions. Our opinion is not modified with respect to this matter. Other Matters Required Supplementary Information Accounting principles generally accepted in the United States of America require that management’s discussion and analysis on pages 3-9 as well as required supplementary data for certain retirement plan data and other postemployment benefits (OPEB) data on pages 44-47 be presented to supplement the basic financial statements. Such information, although not a part of the basic financial statements, is required by the Governmental Accounting Standards Board, who considers it to be an essential part of financial reporting for placing the basic financial statements in an appropriate operational, economic or historical context. We have applied certain limited procedures to the required supplementary information in accordance with auditing standards generally accepted in the United States of America, which consisted of inquiries of management about the methods of preparing the information and comparing the information for consistency with management’s responses to our inquiries, the basic financial statements, and other knowledge we obtained during our audit of the basic financial statements. We do not express an opinion or provide any assurance on the information because the limited procedures do not provide us with sufficient evidence to express an opinion or provide any assurance. Other Information
Our audit was conducted for the purpose of forming opinions on the financial statements that collectively comprise the University’s basic financial statements. The accompanying Schedule of Expenditures of Federal Awards, as required by Title 2 U.S. Code of Federal Regulations (CFR) Part 200, Uniform Administrative Requirements, Cost Principles, and Audit Requirements for Federal Awards is presented for purposes of additional analysis and is not a required part of the basic financial statements. The Schedule of Expenditures of Federal Awards is the responsibility of management and was derived from and relates directly to the underlying accounting and other records used to prepare the basic financial statements. Such information has been subjected to the auditing procedures applied in the audit of the basic financial statements and certain additional procedures, including comparing and reconciling such information directly to the underlying accounting and other records used to prepare the basic financial statements or to the basic financial statements themselves, and other additional procedures in accordance with auditing standards generally accepted in the United States of America. In our opinion, the Schedule of Expenditures of Federal Awards is fairly stated, in all material respects, in relation to the basic financial statements as a whole. Other Reporting Required by Government Auditing Standards In accordance with Government Auditing Standards, we have also issued our report dated October 15, 2018, on our consideration of the University’s internal control over financial reporting and on our tests of its compliance with certain provisions of laws, regulations, contracts, and grant agreements and other matters. The purpose of that report is solely to describe the scope of our testing of internal control over financial reporting and compliance and the results of that testing, and not to provide an opinion on the effectiveness of the University’s internal control over financial reporting or on compliance. That report is an integral part of an audit performed in accordance with Government Auditing Standards in considering the University’s internal control over financial reporting and compliance.
Cleveland, Ohio October 15, 2018
Miami University Management's Discussion and Analysis June 30, 2018 (Dollars in Thousands)
3
Introduction
The following discussion and analysis provides an overview of the financial position and activities of Miami University for the year ended June 30, 2018. This discussion should be read in conjunction with the accompanying financial statements and footnotes. The University’s annual report consists of this Management’s Discussion and Analysis, the Statements of Net Position, the Statements of Revenues, Expenses, and Changes in Net Position, the Statements of Cash Flows, and the Notes to the Financial Statements. The financial statements of the University have been prepared on the accrual basis of accounting, whereby revenues are recognized when earned and expenses are recorded when the related liability has been incurred. The financial activity of the Miami University Foundation, a component unit of the University, is included through a discrete presentation as part of the University’s financial statements. The financial statements, footnotes, and this discussion have been prepared by and are the responsibility of University management.
Financial Highlights
The University reported favorable year-end results for the ninth consecutive year. Enrollment gains, a modest tuition increase and a continued focus on controlling operating costs have been important contributing factors to these successful results. Overall the University’s financial position improved at June 30, 2018. Total assets rose 3.5 percent from $2.24 to $2.32 billion. Liabilities decreased $48.0 million and totaled $1.19 billion. Significant financial events during fiscal year 2018 were: The University's fall 2017 cohort, at a confirmed size of 3,828 first-year resident undergraduate
students, was the second enrolled cohort under the Miami Tuition Promise program. Each year of their enrollment, the incoming cohort of first-year first-time undergraduate resident students at the Oxford campus will have a guaranteed tuition amount due each year of their full-time enrollment for the four years of the guarantee. Total undergraduate enrollment rose 0.5 percent to 21,763 students for fall 2017 compared to 21,664 total undergraduate students in the fall 2016 class. Graduate enrollment for fall 2017 decreased by 5.2 percent to a total of 2,519 compared to 2,658 graduate students in the fall 2016 class.
The University's commitment to increase selectivity, diversity, and maintain quality with strong academic credentials in enrollment goals was evidenced by a confirmed ACT average in excess of 28.0 and a confirmed GPA average in excess of 3.76 for the fall 2017 class. The profile of the incoming class for fall 2017 consisted of 42.7 percent non-resident, and 16.9 percent students of color. The fall 2017 categories of transfer students and relocation students decreased by 40 students or 16.1 percent and 44 students or 14.7 percent, respectively. The Hamilton campus incoming class size decreased by 15 students from fall 2016 to fall 2017, and the Middletown campus increased from 324 students to 334 first time incoming students for the fall 2017 class.
Miami University Management's Discussion and Analysis June 30, 2018 (Dollars in Thousands)
4
Financial Highlights (Continued)
The investment portfolios experienced positive results during the fiscal year, though at lower levels than the previous year. Operational investments posted a positive return of 3.0 percent, down from the previous year’s return of 4.5 percent. While rising interest rates boosted yields on operating cash balances, it presented a challenge for the short-intermediate term bond exposures. The pooled investment fund, which includes the University and Foundation endowments, experienced an estimated gain of 6.0 percent, down from the 11.8 percent realized in the previous year. Global capital markets showed remarkable strength during the first half of the fiscal year, aided by federal tax law changes and the expectation for strong corporate earnings that would drive improved economic growth. The current economic cycle in the United States has completed its ninth year of expansion, the second longest on record. Plenty of threats persist, including continued interest rate increases by the U.S. Federal Reserve and concerns over tariffs and trade wars, all of which contributed to flat capital markets in the second half of the fiscal year and increased volatility after an extended period of extremely low levels.
For fiscal year 2018, the University increased salaries by 3.0 percent. General fund salary and benefit expense on all three campuses increased by $1.9 million to $266.1 million, which was $20.6 million below the adopted budget. Although a hiring freeze is not in affect, requests to add new positions or fill previously vacant positions are carefully scrutinized.
As noted above, total liabilities decreased $48.0 million. This decrease consisted of a $118.8 million
decrease in the University’s proportional share of the Net Pension Liability (NPL) for the non-student employees’ retirement plans offset by the liability incurred as the result of the University adopting GASB 75. GASB 75 required the University to record its proportional share of the OPEB liability for the State Teachers Retirement System (STRS) and Ohio Public Employees Retirement System of Ohio (OPERS) OPEB plans, resulting in a liability of $103,128 at June 30, 2018. The decrease in the NPL stemmed from an update in mortality tables and elimination of the cost of living adjustment utilized by STRS to measure NPL.
Statement of Net Position
The Statement of Net Position presents the assets, liabilities, deferred outflows/inflows of resources, and net position of the University as of the end of the fiscal year. The difference between total assets and total liabilities, or net position, is one indicator of the overall strength of the institution. Also, the increase or decrease in total net position indicates whether the financial position of the institution is improving or declining. Except for capital assets, all other assets and liabilities are measured at a point in time using current values. Capital assets are recorded at historical cost less an allowance for depreciation. The net position is classified into three major categories. The first category, net investment in capital assets, reports the institution’s net equity in property, plant, and equipment. The second major category, restricted net position, reports assets that are owned by the institution, but the use or purpose of the funds is restricted by an external source or entity. This category is subdivided into two types: nonexpendable and expendable. Nonexpendable restricted assets are primarily endowment funds that may be invested for income and capital gains, but the endowed principal may not be spent. Expendable restricted assets may be spent by the institution, but only for the purpose specified by the donor, grantor, or other external entity. The third category, unrestricted net position, is separated into two types: allocated and unallocated. Allocated unrestricted assets are available to the institution, but are set aside for a specific purpose by University policy, management, or the governing board. Unallocated unrestricted assets are available to be used for any lawful purpose of the institution.
Miami University Management's Discussion and Analysis June 30, 2018 (Dollars in Thousands)
5
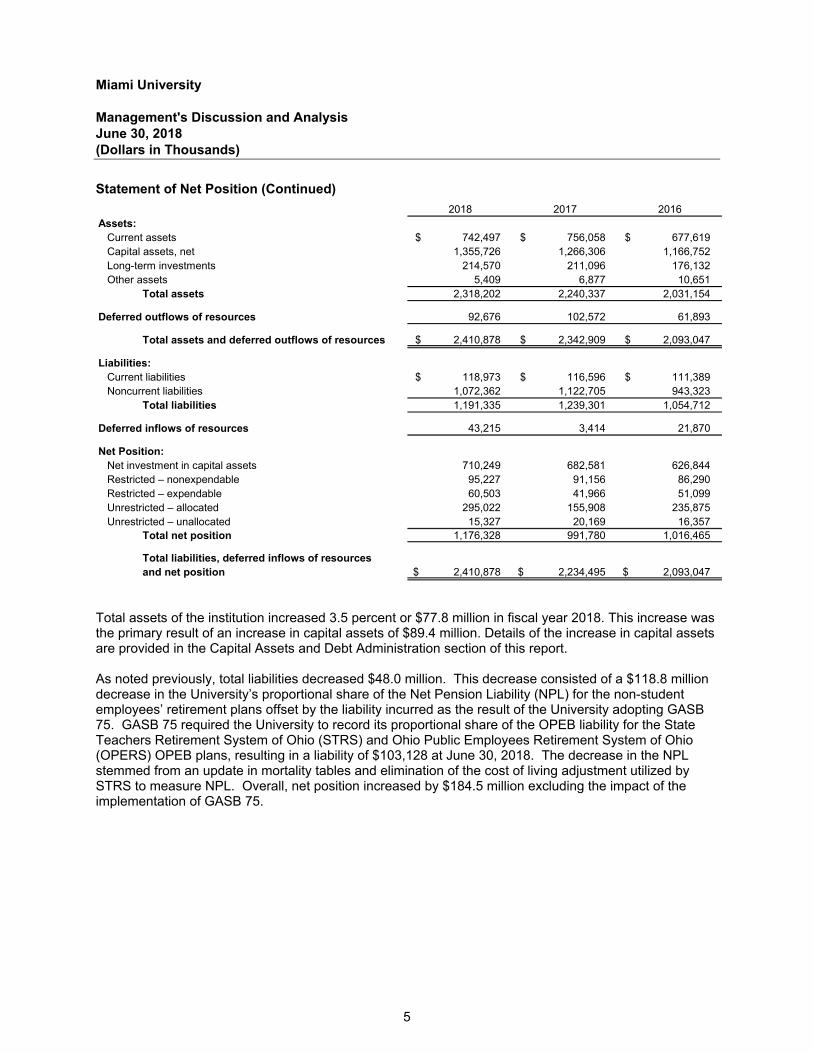
Statement of Net Position (Continued)
2018 2017 2016Assets:
Current assets 742,497 $ 756,058 $ 677,619 $ Capital assets, net 1,355,726 1,266,306 1,166,752 Long-term investments 214,570 211,096 176,132 Other assets 5,409 6,877 10,651
Total assets 2,318,202 2,240,337 2,031,154
Deferred outflows of resources 92,676 102,572 61,893
Total assets and deferred outflows of resources 2,410,878 $ 2,342,909 $ 2,093,047 $
Liabilities:Current liabilities 118,973 $ 116,596 $ 111,389 $ Noncurrent liabilities 1,072,362 1,122,705 943,323
Total liabilities 1,191,335 1,239,301 1,054,712
Deferred inflows of resources 43,215 3,414 21,870
Net Position:Net investment in capital assets 710,249 682,581 626,844 Restricted – nonexpendable 95,227 91,156 86,290 Restricted – expendable 60,503 41,966 51,099 Unrestricted – allocated 295,022 155,908 235,875 Unrestricted – unallocated 15,327 20,169 16,357
Total net position 1,176,328 991,780 1,016,465
Total liabilities, deferred inflows of resourcesand net position 2,410,878 $ 2,234,495 $ 2,093,047 $
Total assets of the institution increased 3.5 percent or $77.8 million in fiscal year 2018. This increase was the primary result of an increase in capital assets of $89.4 million. Details of the increase in capital assets are provided in the Capital Assets and Debt Administration section of this report. As noted previously, total liabilities decreased $48.0 million. This decrease consisted of a $118.8 million decrease in the University’s proportional share of the Net Pension Liability (NPL) for the non-student employees’ retirement plans offset by the liability incurred as the result of the University adopting GASB 75. GASB 75 required the University to record its proportional share of the OPEB liability for the State Teachers Retirement System of Ohio (STRS) and Ohio Public Employees Retirement System of Ohio (OPERS) OPEB plans, resulting in a liability of $103,128 at June 30, 2018. The decrease in the NPL stemmed from an update in mortality tables and elimination of the cost of living adjustment utilized by STRS to measure NPL. Overall, net position increased by $184.5 million excluding the impact of the implementation of GASB 75.
Miami University Management's Discussion and Analysis June 30, 2018 (Dollars in Thousands)
6
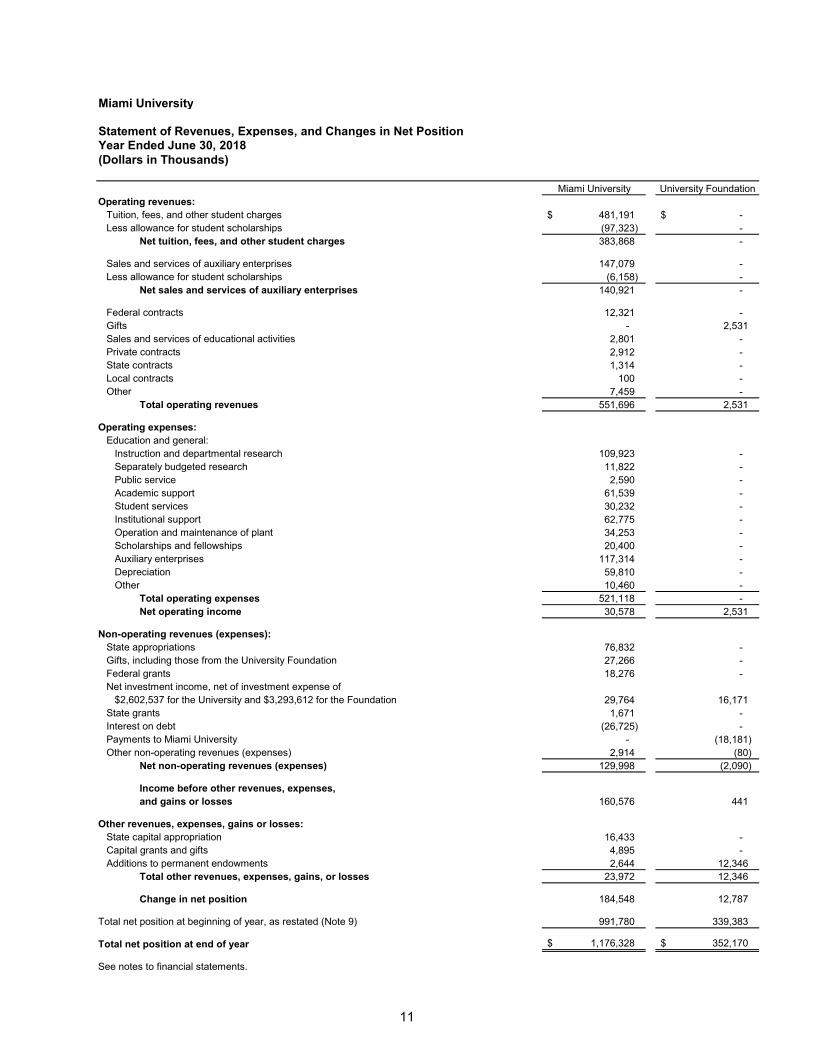
Statement of Revenues, Expenses and Changes in Net Position
The Statement of Revenues, Expenses, and Changes in Net Position presents the University’s results of operations for the fiscal year. The revenues and expenses are generally reported as either operating or non-operating. Operating revenues are generated by providing goods and services to customers and constituencies of the institution. Operating expenses are incurred when goods and services are provided by vendors and employees for the overall operations of the University. Non-operating revenues include the student instructional subsidy from the State of Ohio, while other revenues include the State’s capital appropriation. Investment losses and returns are also included in non-operating revenue. Interest on debt is the primary component of non-operating expense. In fiscal year 2018, total revenues of the institution from all sources were approximately $732.4 million, which represents a $22.7 million or 3.2 percent increase from the prior year. Approximately 75.3 percent of revenues were classified as operating, and 24.7 percent were classified as non-operating or other revenues.
2018 2017 2016
Operating revenues 551,696 $ 544,553 $ 522,244 $ Non-operating revenues 156,723 158,059 106,825 Other revenues 23,972 7,087 16,590
Total revenues 732,391 709,699 645,659
Operating expenses (521,118) (599,516) (557,505) Non-operating expenses (26,725) (26,455) (23,049)
Total expenses (547,843) (625,971) (580,554) Change in net position 184,548 $ 83,728 $ 65,105 $
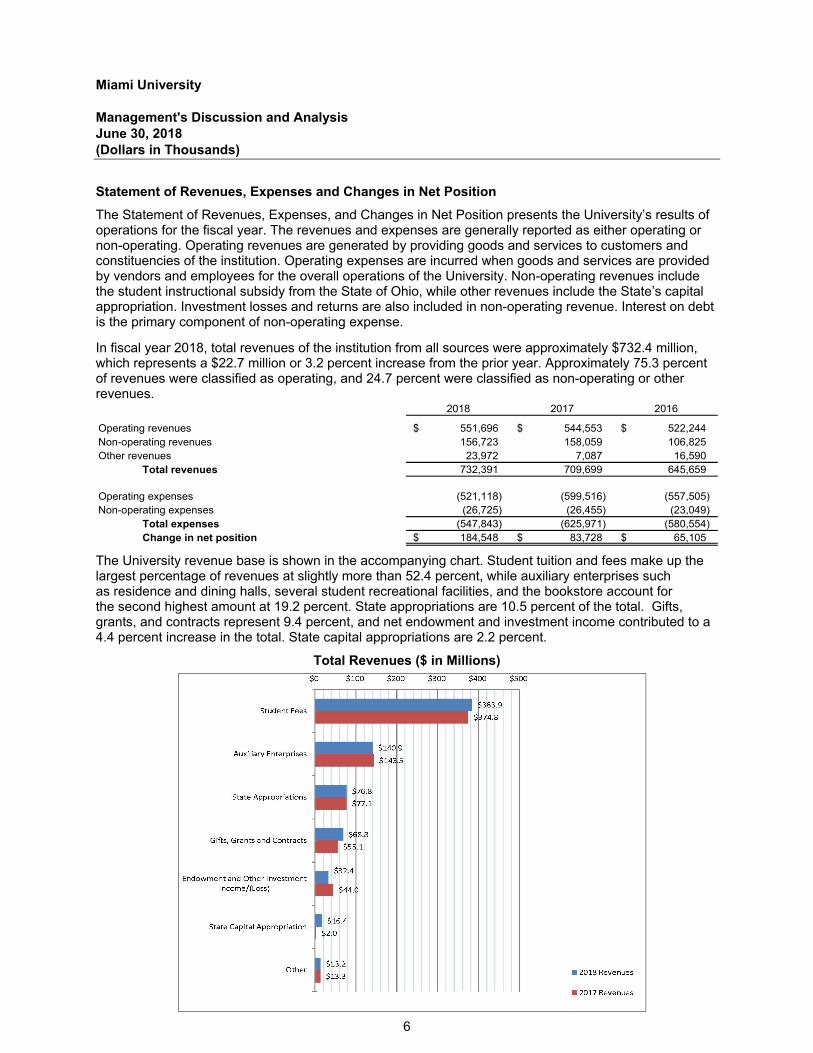
The University revenue base is shown in the accompanying chart. Student tuition and fees make up the largest percentage of revenues at slightly more than 52.4 percent, while auxiliary enterprises such as residence and dining halls, several student recreational facilities, and the bookstore account for the second highest amount at 19.2 percent. State appropriations are 10.5 percent of the total. Gifts, grants, and contracts represent 9.4 percent, and net endowment and investment income contributed to a 4.4 percent increase in the total. State capital appropriations are 2.2 percent.
Total Revenues ($ in Millions)
Miami University Management's Discussion and Analysis June 30, 2018 (Dollars in Thousands)
7
Statement of Revenues, Expenses and Changes in Net Position (Continued)
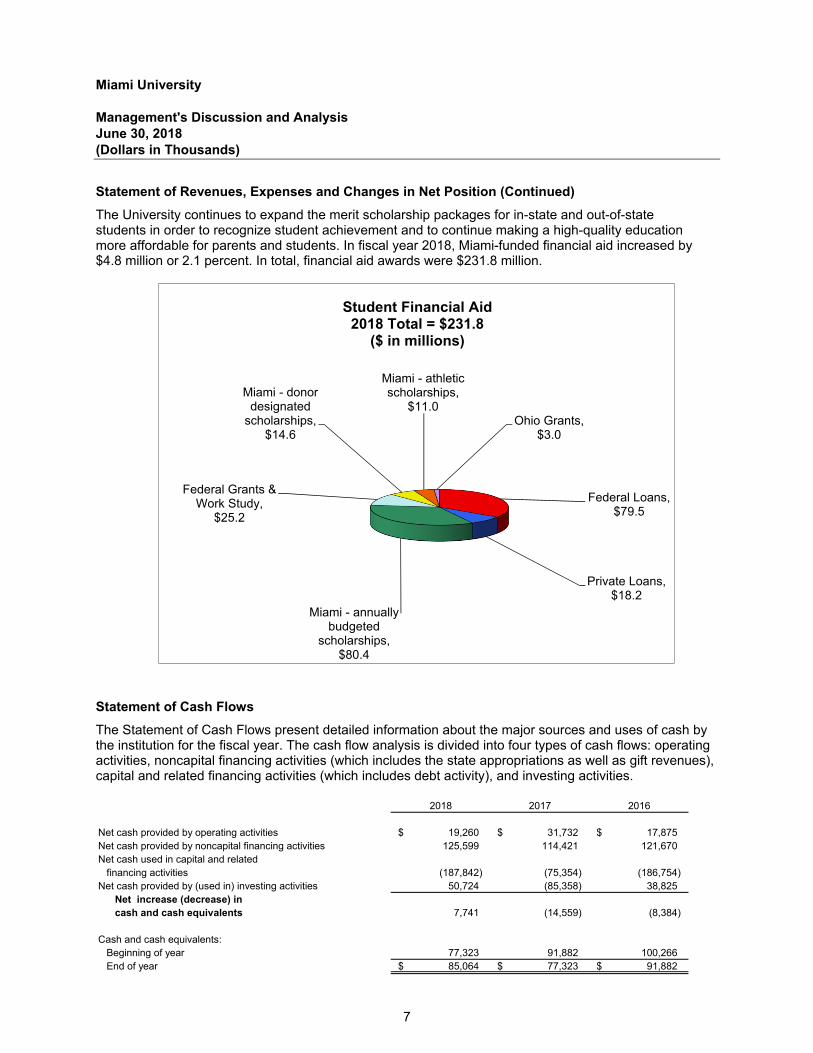
The University continues to expand the merit scholarship packages for in-state and out-of-state students in order to recognize student achievement and to continue making a high-quality education more affordable for parents and students. In fiscal year 2018, Miami-funded financial aid increased by $4.8 million or 2.1 percent. In total, financial aid awards were $231.8 million.
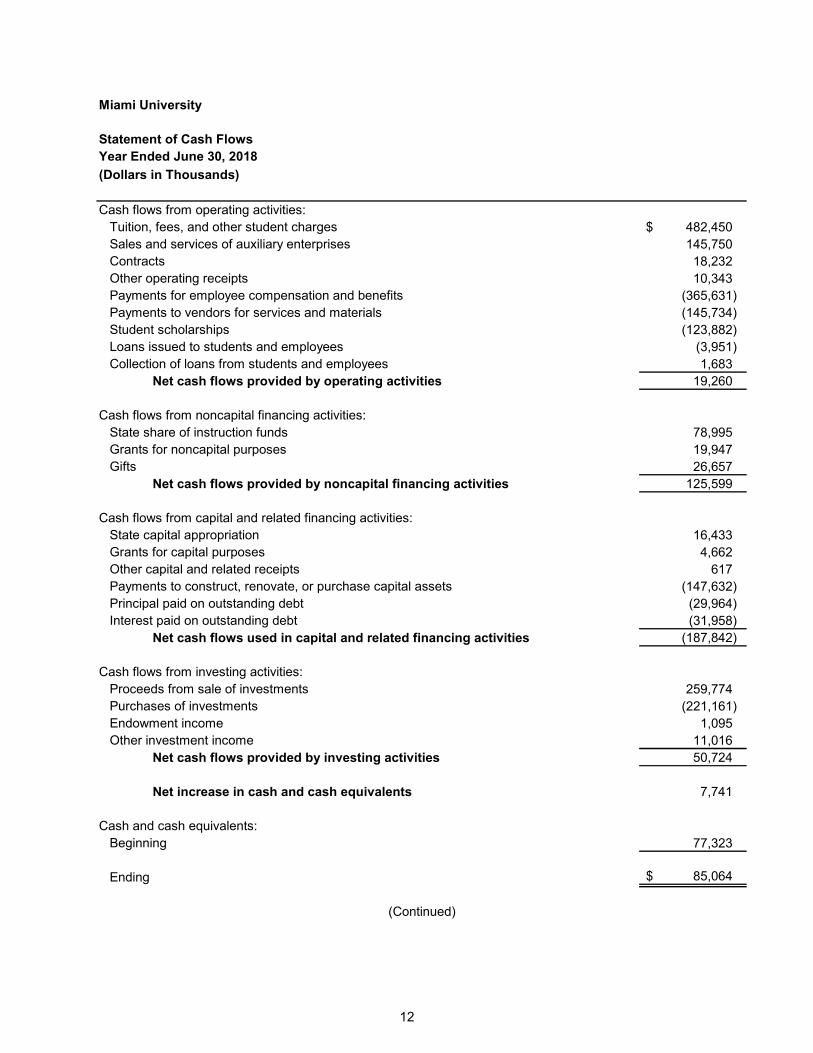
Statement of Cash Flows
The Statement of Cash Flows present detailed information about the major sources and uses of cash by the institution for the fiscal year. The cash flow analysis is divided into four types of cash flows: operating activities, noncapital financing activities (which includes the state appropriations as well as gift revenues), capital and related financing activities (which includes debt activity), and investing activities.
2018 2017 2016
Net cash provided by operating activities 19,260 $ 31,732 $ 17,875 $ Net cash provided by noncapital financing activities 125,599 114,421 121,670 Net cash used in capital and related
financing activities (187,842) (75,354) (186,754) Net cash provided by (used in) investing activities 50,724 (85,358) 38,825
Net increase (decrease) in cash and cash equivalents 7,741 (14,559) (8,384)
Cash and cash equivalents:Beginning of year 77,323 91,882 100,266 End of year 85,064 $ 77,323 $ 91,882 $
Federal Loans, $79.5
Private Loans, $18.2
Miami - annually budgeted
scholarships, $80.4
Federal Grants & Work Study,
$25.2
Miami - donor designated
scholarships, $14.6
Miami - athletic scholarships,
$11.0 Ohio Grants,
$3.0
Student Financial Aid2018 Total = $231.8
($ in millions)

Miami University Management's Discussion and Analysis June 30, 2018 (Dollars in Thousands)
8
Statement of Cash Flows (Continued)
The net $7.7 million increase in the fiscal year 2018 cash and cash equivalents balance primarily relates to improved operating performance during the year ended June 30, 2018. Throughout the year, cash was used for capital acquisitions, payment of debt, investment and operating activities. These uses of cash were offset in part by the cash provided by tuition and fees, state appropriations, sales by auxiliary enterprises, gifts, and grants.
Capital Assets and Debt Administration
During fiscal year 2018, the University completed and capitalized several projects. These projects were funded by a combination of bond proceeds, state capital appropriations, gifts, and local funding. The bond proceeds were generated from the 2014 and 2017 Series General Receipts Revenue Bonds totaling $88.9 million combined. Major projects completed in 2018 include renovation projects to Clawson Hall, Hamilton Hall, Hughes Hall, Irvin Hall, Recreational Sports Center, and the Steam Plant. Other infrastructure improvements included Western Geothermal Infrastructure. See Note 4 for additional information concerning capital assets and accumulated depreciation. The University’s bond rating remained the same with a rating of Aa3 from Moody’s Investors Services and a rating of AA from Fitch Ratings. For more detailed information on current outstanding debt, see Note 5 and 6. No new debt was issued in fiscal year 2018. Economic Factors That Will Affect the Future The higher education landscape continues to be influenced by disruptive forces resulting from technological change, the national conversation regarding affordability and efficiency, and economic and demographic issues. In Ohio, the issues mirror those of much of the nation. The focus of the Ohio General Assembly continues to be on improving affordability and graduation rates at Ohio’s public colleges and universities. Ohio’s demographic trends are a barrier to both Miami’s goal of growing its enrollment and Ohio’s desire to increase the number of Ohio residents with a college degree as the number of high school graduates in Ohio continues to decline. Similar declines in high school graduation numbers in the surrounding states and the northeastern United States also negatively impact Miami’s Oxford Campus as these regions have historically contributed students to Miami’s incoming freshmen classes. Ohio’s demographic trends are also expected to negatively affect future state support for higher education as the proportion of the state’s population in the workforce declines and the aged population increases the demand on state programs like Medicaid. The immediate outlook for state funding for higher education in Ohio is also unclear as Ohio will have a new governor for the first time in eight years. And as a result of term limits, will likely experience significant changes in the representation in the Ohio General Assembly. Miami’s state funding for 2019 in nominal dollars is about 8 percent below what it received in 2001.
Miami University Management's Discussion and Analysis June 30, 2018 (Dollars in Thousands)
9
Financial Highlights (Continued)
Economic Factors That Will Affect the Future (Continued)
The Oxford Campus’ fall 2018 class continued the recent pattern of modestly larger classes and more academically prepared students. However, the recent trend of an increased proportion of nonresident international students in the new class did not continue. As of the first day of classes, there were 3,977 new freshmen with an average ACT score of 28.0 which is one percent larger than the fall 2017 class on the first day. The nonresident composition of the new class fell from 43 percent to 41 percent largely as a result of a 10 percent (52 students) decline in international enrollment. Overall the enrollment on the Oxford Campus grew from 19,766 to 20,020 students. The decline in international enrollments generally occurred across all institutions of higher education as a result of policy changes in Washington. Future international enrollment trends remain difficult to predict given the current national conversation. Enrollment at Miami’s regional campuses for fall 2018 declined by 3.7 percent to 4,733 but enrollment on these campuses is stabilizing. Enrolling international students on these campuses actually increased by 16 students. Lackluster enrollment results over the last five years for these campuses reflects the national enrollment trend for open enrollment campuses as employment in the region and the nation has improved. New academic program offerings, a tuition guarantee, and new enrollment strategies are continuing to be implemented for these campuses in response to the downward enrollment trend. Fiscal year 2019 will mark the third year of President Crawford’s presidential tenure at Miami and bring a focus on developing a new strategic plan for the University. In anticipation of the new strategic plan and in response to the rapid change confronting higher education, President Crawford announced in 2018 the creation of a strategic investment fund totaling $50 million. The fund will be used to make investments in already strong academic programs with the intent of building a greater national profile for the program and in new areas where technological and economic changes suggest that enrollment interest in these degree programs or certificates is likely to increase in the future. Some program targets that have already been identified include health professions, entrepreneurship, and data analytics. The strategic planning process will be used to further refine these strategies as well as introduce additional strategies. Higher education across the nation continues to experience rapid change in contrast to much of its history. Technological change is not only creating the need for new academic disciplines and degree programs but impacting delivery systems and introducing greater competition in an already highly competitive industry. Public accountability for the high cost of tuition and rising student debt continue to influence the national conversation and state legislative policies negatively affecting revenue growth. But Miami’s strong commitment to undergraduate teaching, the demand for its programs not only in Ohio but around the nation and the world, its improved operating efficiencies, and its dedicated and committed faculty and staff, position it well to respond to these challenges and to maintain its financial performance in the face of transformational change.

10
Miami University
Statement of Net PositionJune 30, 2018 (Dollars in Thousands)
Miami University University FoundationAssetsCurrent assets:
Cash and cash equivalents 85,064 $ 25,392 $ Investments 609,414 - Accounts, pledges and notes receivable, net 39,963 10,099 Inventories 2,104 - Prepaid expenses and deferred charges 5,952 -
Total current assets 742,497 35,491
Noncurrent assets:Restricted cash and cash equivalents - 38,891 Investments 214,570 479,129 Pledges and notes receivable, net 4,477 33,598 Net pension asset 932 - Nondepreciable capital assets 212,691 - Depreciable capital assets, net 1,143,035 -
Total noncurrent assets 1,575,705 551,618
Total assets 2,318,202 587,109
Deferred outflows of resources:Pensions 85,137 - OPEB (Note 9) 7,539 -
Total deferred outflows of resources 92,676 -
Total assets and deferred outflows of resources 2,410,878 $ 587,109 $
LiabilitiesCurrent liabilities:
Accounts payable 43,134 $ 14,825 $ Accrued salaries and wages 16,834 - Accrued compensated absences 1,379 - Unearned revenue 12,719 - Deposits 12,529 - Current portion of long-term debt 31,577 - Other current liabilities 801 575
Total current liabilities 118,973 15,400
Noncurrent liabilities:Accrued compensated absences 16,844 - Bonds payable 659,572 - Capital leases payable 2,030 - Federal Perkins loan program 3,287 - Net pension liability 287,503 - Net OPEB liability (Note 9) 103,126 - Other noncurrent liabilities - 219,539
Total noncurrent liabilities 1,072,362 219,539
Total liabilities 1,191,335 234,939
Deferred inflows of resources:Deferred gains on refunding 1,129 - Pensions 32,777 - OPEB (Note 9) 9,309 -
Total deferred inflows of resources 43,215 -
Net position:Net investment in capital assets 710,249 - Restricted: Nonexpendable 95,227 222,824 Expendable 60,503 128,722 Unrestricted 310,349 624
Total net position 1,176,328 352,170
Total liabilities, deferred inflows and net position 2,410,878 $ 587,109 $
See notes to financial statements.
11
Miami University
Statement of Revenues, Expenses, and Changes in Net PositionYear Ended June 30, 2018 (Dollars in Thousands)
Miami University University FoundationOperating revenues:
Tuition, fees, and other student charges 481,191 $ -$ Less allowance for student scholarships (97,323) -
Net tuition, fees, and other student charges 383,868 -
Sales and services of auxiliary enterprises 147,079 - Less allowance for student scholarships (6,158) -
Net sales and services of auxiliary enterprises 140,921 -
Federal contracts 12,321 - Gifts - 2,531 Sales and services of educational activities 2,801 - Private contracts 2,912 - State contracts 1,314 - Local contracts 100 - Other 7,459 -
Total operating revenues 551,696 2,531
Operating expenses:Education and general:
Instruction and departmental research 109,923 - Separately budgeted research 11,822 - Public service 2,590 - Academic support 61,539 - Student services 30,232 - Institutional support 62,775 - Operation and maintenance of plant 34,253 - Scholarships and fellowships 20,400 - Auxiliary enterprises 117,314 - Depreciation 59,810 - Other 10,460 -
Total operating expenses 521,118 - Net operating income 30,578 2,531
Non-operating revenues (expenses):State appropriations 76,832 - Gifts, including those from the University Foundation 27,266 - Federal grants 18,276 - Net investment income, net of investment expense of
$2,602,537 for the University and $3,293,612 for the Foundation 29,764 16,171 State grants 1,671 - Interest on debt (26,725) - Payments to Miami University - (18,181) Other non-operating revenues (expenses) 2,914 (80)
Net non-operating revenues (expenses) 129,998 (2,090)
Income before other revenues, expenses, and gains or losses 160,576 441
Other revenues, expenses, gains or losses:State capital appropriation 16,433 - Capital grants and gifts 4,895 - Additions to permanent endowments 2,644 12,346
Total other revenues, expenses, gains, or losses 23,972 12,346
Change in net position 184,548 12,787
Total net position at beginning of year, as restated (Note 9) 991,780 339,383
Total net position at end of year 1,176,328 $ 352,170 $
See notes to financial statements.
12
Miami University
Statement of Cash FlowsYear Ended June 30, 2018
(Dollars in Thousands)
Cash flows from operating activities:Tuition, fees, and other student charges 482,450 $ Sales and services of auxiliary enterprises 145,750 Contracts 18,232 Other operating receipts 10,343 Payments for employee compensation and benefits (365,631) Payments to vendors for services and materials (145,734) Student scholarships (123,882) Loans issued to students and employees (3,951) Collection of loans from students and employees 1,683
Net cash flows provided by operating activities 19,260
Cash flows from noncapital financing activities:State share of instruction funds 78,995 Grants for noncapital purposes 19,947 Gifts 26,657
Net cash flows provided by noncapital financing activities 125,599
Cash flows from capital and related financing activities:State capital appropriation 16,433 Grants for capital purposes 4,662 Other capital and related receipts 617 Payments to construct, renovate, or purchase capital assets (147,632) Principal paid on outstanding debt (29,964) Interest paid on outstanding debt (31,958)
Net cash flows used in capital and related financing activities (187,842)
Cash flows from investing activities:Proceeds from sale of investments 259,774 Purchases of investments (221,161) Endowment income 1,095 Other investment income 11,016
Net cash flows provided by investing activities 50,724
Net increase in cash and cash equivalents 7,741
Cash and cash equivalents:Beginning 77,323
Ending 85,064 $
(Continued)

13
Miami University
Statement of Cash Flows (Continued)Year Ended June 30, 2018 (Dollars in Thousands)
Reconciliation of operating gain to net cash flows provided by operating activities:Operating income 30,578 $ Adjustments to reconcile net operating gain to net cash
provided by operating activities:Depreciation expense 59,810 Accounts receivable bad debt adjustments 87 Adjustments to reconcile change in net position to net cash provided by
operating activities:Accounts receivable 2,060 Inventories (232) Prepaid expenses and deferred charges (90) Notes receivable 744 Net pension asset (562) Deferred outflows of pension resources 17,435 Deferred outflows of OPEB resources (7,539) Accounts payable 2,990 Accrued salaries and wages 482 Accrued compensated absences (650) Unearned revenue and deposits (203) Federal Perkins loans (1,469) Net pension liability (118,841) Net OPEB liability (5,287) Deferred inflows of pension resources 30,638 Deferred inflows of OPEB resources 9,309
Net cash flows provided by operating activities 19,260 $
Supplemental disclosure of noncash information:Capital assets included in accounts payable 23,296 $
Capital assets acquired by gifts in kind 233 $
See notes to financial statements.
Miami University Notes to Financial Statements (Dollars in Thousands)
14
Note 1. Summary of Significant Accounting Policies
Miami University (the University) is a land grant institution chartered by the State of Ohio in 1809 and governed by a Board of Trustees (the board). The board consists of up to 17 members, including two student members and up to six non-voting national trustees. Voting members are appointed one each year for nine-year terms by the governor with the advice and consent of the state senate. The two student non-voting members are appointed for two-year staggered terms by the governor with the advice and consent of the senate, and the national trustees are appointed by the voting members and can serve for no more than two consecutive three-year terms. The Governmental Accounting Standards Boards (GASB) Statement No. 39 sets forth criteria to determine whether certain organizations for which the University is not financially accountable should be reported as component units based on the nature and significance of their relationship with the University. The Miami University Foundation (the Foundation), which is a separate not-for-profit foundation, meets this criteria due to the significance of their operational or financial relationships with the University. Note 10 provides additional information on the Foundation. Certain disclosures concerning the Foundation are not included because it has been audited separately for the year ended June 30, 2018 and reports have been issued under separate cover. The University's financial statements are included as a discretely presented component unit in the State of Ohio's Comprehensive Annual Financial Report. Basis for presentation: The financial statements of the University have been prepared on the accrual basis of accounting, whereby revenues are recognized when earned and expenses are recorded when the related liability has been incurred. For financial reporting purposes, the University is considered a special-purpose government engaged only in business-type activities as defined by GASB Statement Nos. 34 and 35. Recent and pending accounting pronouncements: Effective July 1, 2017, the University adopted GASB Statement No. 75, Accounting and Financial Reporting for Postemployment Benefits Other Than Pensions. The primary objective of this Statement is to improve accounting and financial reporting by state and local governments for postemployment benefits other than pensions (other postemployment benefits or OPEB). This Statement is effective for the University beginning with its year ending June 30, 2018. The adoption of this statement, further detailed in Note 9, required the restatement of prior year net position to conform to the 2018 presentation. Effective July 1, 2017, the University adopted GASB Statement No. 81, Irrevocable Split-Interest Agreements. The objective of this Statement is to improve accounting and financial reporting by establishing recognition and measurement requirements for irrevocable split-interest agreements as well as enhance the transparency and decision-usefulness of general purpose external financial reports by more clearly identifying resources that are available to a government. This Statement amends Statement No. 31, Accounting and Financial Reporting for Certain Investments and for External Investment Pools, paragraph 13; Statement No. 33, Accounting and Financial Reporting for Nonexchange Transactions, paragraph 5; Statement No. 34, Basic Financial Statements—and Management’s Discussion and Analysis—for State and Local Governments, paragraphs 16, 18, 22, 92, and 107; and Statement No. 67, Financial Reporting for Pension Plans, paragraph 24. There has been no significant impact to the University financial statements due to the adoption of Statement No. 81.
Miami University Notes to Financial Statements (Dollars in Thousands)
15
Note 1. Summary of Significant Accounting Policies (Continued)
In November 2016, GASB issued Statement No. 83, Certain Asset Retirement Obligations. The objective of this Statement is to address accounting and financial reporting for certain asset retirement obligations. An asset retirement obligation is defined as a legally enforceable liability associated with the retirement of a tangible capital asset. A government that has legal obligations to perform future asset retirement activities related to tangible capital assets should recognize a liability based on the guidance in this Statement. The requirements of this Statement are effective for reporting periods beginning after June 15, 2018. The University has not yet determined the impact this statement will have on the financial statements. In January 2017, GASB issued Statement No. 84, Fiduciary Activities. The objective of this Statement is to improve guidance regarding the identification of fiduciary activities for accounting and financial reporting purposes and how those activities should be reported. The Statement establishes criteria for identifying fiduciary activities and the focus of the criteria generally is on (1) whether the government is controlling the assets of the fiduciary activity and (2) the beneficiaries with whom a fiduciary relationship exists. The requirements of this Statement are effective for reporting periods beginning after December 15, 2018. The University has not yet determined the impact this statement will have on the financial statements. Effective July 1, 2017, the University adopted GASB Statement No. 85, Omnibus 2017. The objective of this Statement is to address practice issues that have been identified during implementation and application of certain GASB Statements. This Statement addresses a variety of topics including issues related to blending component units, goodwill, fair value measurement and application, and postemployment benefits (pensions and postemployment benefits (OPEB) amongst other things. There has been no significant impact to the University financial statements due to the adoption of Statement No. 85. Effective July 1, 2017, the University adopted GASB Statement No. 86, Certain Debt Extinguishment Issues. The primary objective of this Statement is to improve consistency in accounting and financial reporting for in-substance defeasance of debt by providing guidance for transactions in which cash and other monetary assets acquired with only existing resources—resources other than the proceeds of refunding debt—are placed in an irrevocable trust for the sole purpose of extinguishing debt. This Statement also improves accounting and financial reporting for prepaid insurance on debt that is extinguished and notes to financial statements for debt that is defeased in substance. There has been no significant impact to the University financial statements due to the adoption of Statement No. 86. In June 2017, GASB issued Statement No. 87, Leases. The objective of this Statement is to better meet the information needs of financial statement users by improving accounting and financial reporting for leases by governments. This Statement increases the usefulness of governments’ financial statements by requiring recognition of certain lease assets and liabilities for leases that previously were classified as operating leases and recognized as inflows of resources or outflows of resources based on the payment provisions of the contract. It establishes a single model for lease accounting based on the foundational principle that leases are financings of the right to use an underlying asset. Under this Statement, a lessee is required to recognize a lease liability and an intangible right-to-use lease asset, and a lessor is required to recognize a lease receivable and a deferred inflow of resources, thereby enhancing the relevance and consistency of information about governments’ leasing activities. The requirements of this Statement are effective for reporting periods beginning after December 15, 2019. The University has not yet determined the impact this statement will have on the financial statements.
Miami University Notes to Financial Statements (Dollars in Thousands)
16
Note 1. Summary of Significant Accounting Policies (Continued)
In March 2018, GASB issued Statement No. 88, Certain Disclosures Related to Debt, including Direct Borrowings and Direct Placements. The primary objective of this Statement is to improve the information that is disclosed in notes to government financial statements related to debt, including direct borrowings and direct placements. It also clarifies which liabilities governments should include when disclosing information related to debt. This Statement defines debt for purposes of disclosure in notes to financial statements as a liability that arises from a contractual obligation to pay cash (or other assets that may be used in lieu of cash) in one or more payments to settle an amount that is fixed at the date the contractual obligation is established. This Statement requires that additional essential information related to debt be disclosed in notes to financial statements, including unused lines of credit; assets pledged as collateral for the debt; and terms specified in debt agreements related to significant events of default with finance-related consequences, significant termination events with finance-related consequences, and significant subjective acceleration clauses. For notes to financial statements related to debt, this Statement also requires that existing and additional information be provided for direct borrowings and direct placements of debt separately from other debt. The requirements of this Statement are effective for reporting periods beginning after June 15, 2018. The University has not yet determined the impact this statement will have on the financial statements. In June 2018, GASB issued Statement No. 89, Accounting for Interest Cost Incurred before the End of a Construction Period. The objectives of this Statement are (1) to enhance the relevance and comparability of information about capital assets and the cost of borrowing for a reporting period and (2) to simplify accounting for interest cost incurred before the end of a construction period. This Statement requires that interest cost incurred before the end of a construction period be recognized as an expense in the period in which the cost is incurred for financial statements prepared using the economic resources measurement focus. As a result, interest cost incurred before the end of a construction period will not be included in the historical cost of a capital asset reported in a business-type activity or enterprise fund. This Statement also reiterates that in financial statements prepared using the current financial resources measurement focus, interest cost incurred before the end of a construction period should be recognized as an expenditure on a basis consistent with governmental fund accounting principles. The requirements of this Statement are effective for reporting periods beginning after December 15, 2019. The University has not yet determined the impact this statement will have on the financial statements.

Miami University Notes to Financial Statements (Dollars in Thousands)
17
Note 1. Summary of Significant Accounting Policies (Continued)
In August 2018, GASB issued Statement No. 90, Majority Equity Interests – An Amended of GASB Statements No. 15 and No. 61. The primary objectives of this Statement are to improve the consistency and comparability of reporting a government’s majority equity interest in a legally separate organization and to improve the relevance of financial statement information for certain component units. It defines a majority equity interest and specifies that a majority equity interest in a legally separate organization should be reported as an investment if a government’s holding of the equity interest meets the definition of an investment. A majority equity interest that meets the definition of an investment should be measured using the equity method, unless it is held by a special-purpose government engaged only in fiduciary activities, a fiduciary fund, or an endowment (including permanent and term endowments) or permanent fund. Those governments and funds should measure the majority equity interest at fair value. For all other holdings of a majority equity interest in a legally separate organization, a government should report the legally separate organization as a component unit, and the government or fund that holds the equity interest should report an asset related to the majority equity interest using the equity method. This Statement establishes that ownership of a majority equity interest in a legally separate organization results in the government being financially accountable for the legally separate organization and, therefore, the government should report that organization as a component unit. This Statement also requires that a component unit in which a government has a 100 percent equity interest account for its assets, deferred outflows of resources, liabilities, and deferred inflows of resources at acquisition value at the date the government acquired a 100 percent equity interest in the component unit. Transactions presented in flows statements of the component unit in that circumstance should include only transactions that occurred subsequent to the acquisition. The requirements of this Statement are effective for reporting periods beginning after December 15, 2018. The University has not yet determined the impact this statement will have on the financial statements. Cash and cash equivalents: Cash consists primarily of cash in banks and money market accounts. Cash equivalents are short-term, highly liquid investments readily convertible to cash, with an original maturity of three months or less at the time of purchase. Investments: Investments that are market traded, such as equity and debt securities, mutual funds, and cash equivalents, are recorded at fair value. Fair value is the price that would be received to sell an asset or paid to transfer a liability in an orderly transaction between market participants at the measurement date. The value of holdings of commingled funds investing in publicly traded stocks and bonds and not having a readily determined market value for fund units is based on the funds’ net asset value as supplied by the investment manager. Investments in real estate are recorded at fair value at the date of donation. Investment income is recorded on the accrual basis and purchases and sales of investments are recorded on a trade-date basis. Investment transactions occurring on or before June 30 that settle after such date are recorded as receivables or payables. Accounts, pledges and notes receivable allowance: The allowance for doubtful accounts is determined based on management’s judgment of potential uncollectible amounts, based on historical experience, analysis of the aging of payment schedules and type of receivable. Inventories: The University reports inventories at the lower of first-in, first out cost or market.

Miami University Notes to Financial Statements (Dollars in Thousands)
18
Note 1. Summary of Significant Accounting Policies (Continued)
Capital assets: Land, buildings, and equipment are recorded at cost at date of acquisition. In the case of gifts or other donated capital assets, they are recorded at acquisition value. Acquisition value is the price that would be paid to acquire an asset in an orderly market transaction at the acquisition date. Acquisition value is a market-based entry price. Intangible assets include patents, trademarks, land rights and computer software. Land, collections of works of art and historical treasures are capitalized but not depreciated. Any collection that is not capitalized is charged to operations at the time of purchase. Depreciation is computed using the straight-line method over the estimated useful lives of the respective assets. Estimated useful lives are 50 years for buildings; 25 years for infrastructure, library books and publications; and land improvements; 20 years for improvements to buildings; and 5 to 7 years for equipment, vehicles, and furniture. Intangible assets are depreciated based on the estimated life of each asset. The University’s capitalization threshold is the lower of 5 percent of the original building cost or $100 for building renovations and $5 for other capitalized items. The capitalization threshold for intangible assets is $100 except for internally generated computer software which has a threshold of $500. Interest on construction projects is capitalized until substantial completion of the project. Unearned revenue: Tuition and fees relating to summer sessions that are conducted in July and August are recorded in the accompanying Statement of Net Position as unearned revenue. Unearned revenue also includes the amounts received from grant and contract sponsors that have not yet been earned and amounts received from a tuition payment service for payments received for the next fiscal year. These will be recorded as revenue in the following fiscal year. Pensions: For purposes of measuring the net pension liability or asset, deferred outflows of resources and deferred inflows of resources related to pensions, pension expense, and information about the fiduciary net position of the Ohio Public Employees Retirement System (OPERS) Traditional and Combined Plans as well as the State Teachers Retirement System of Ohio Retirement Plan (STRS Ohio) (collectively referred to as, the Pension Plans) any additions to/deductions from the Pension Plan’s fiduciary net position have been determined on the same basis as they are reported by the Pension Plans. For this purpose, benefit payments (including refunds of employee contributions) are recognized when due and payable in accordance with the benefit terms. Investments are reported at fair value. Postemployment benefits other than pensions (OPEB): For purposes of measuring the OPEB liability or asset, deferred outflows of resources and deferred inflows of resources related to healthcare costs, and employer OPEB expense, information about the fiduciary net position of the OPERS OPEB Plan as well as the STRS Ohio OPEB Plan (collectively referred to as, the OPEB Plans) and additions to/deductions from the Plan’s fiduciary net position have been determined on the same basis as they are reported by the OPEB Plans. For this purpose, deductions are recorded when the liability is incurred and revenues are recognized when earned. OPEB plan liabilities are recognized when due and payable in accordance with the health care terms. Investments are reported at fair value. Operating and non-operating revenue: The University defines operating activities, for purposes of reporting on the Statement of Revenues, Expenses, and Changes in Net Position, as those activities that generally result from exchange transactions such as payments received for providing services and payments made for services or goods received. Substantially all of the University's expenses are from exchange transactions. Certain significant revenue streams relied upon for operations are recorded as non-operating revenues, as defined by GASB Statement No. 35, including state appropriations, gifts, and investment income.
Miami University Notes to Financial Statements (Dollars in Thousands)
19
Note 1. Summary of Significant Accounting Policies (Continued)
Revenue recognition: The University recognizes tuition, fees and other student charges as goods and services are provided to customers and constituencies of the institution. State appropriations are recognized when received or made available. Restricted funds are recognized as revenue as expenditures are incurred for cost reimbursement grants and contracts or when restricted funds are received. Gifts and interest on student loans are recognized when received. Allowance for student scholarships: Allowances for student tuition and fee revenues, and certain other revenues from students, are reported in the Statement of Revenues, Expenses, and Changes in Net Position. Scholarship allowances are the difference between the stated charge for goods and services provided by the University, and the amount that is paid by students and/or third parties making payments on the students’ behalf. Certain governmental grants, such as Pell grants, and other Federal, state or nongovernmental programs, are recorded as either operating or non-operating revenues in the University’s financial statements. To the extent that revenues from such programs are used to satisfy tuition and fees and other student charges, the University has recorded a scholarship allowance. Bond premiums, discounts and issuance costs: Bond premiums and discounts costs are deferred and amortized over the life of the bonds using the effective interest method. Bond issuance costs are recognized as an expense in the period incurred. Deferred outflows/inflows of resources: Deferred outflows of resources are a consumption of net position by the University that is applicable to a future reporting period. Deferred outflows of resources of the University consist of certain changes in the net pension liability and net OPEB liability not included in pension expense and OPEB expense, respectively. Employer contributions to the pension plan and OPEB plan subsequent to the measurement date of the net pension liability and OPEB liability, respectively, are also required to be reported as a deferred outflow of resources of the University. Deferred inflows of resources are an acquisition of net positions by the University that is applicable to a future reporting period. Deferred inflows of resources consist of deferred gains on debt refundings and certain changes in net pension liability not included in pension expense and net OPEB liability not included in OPEB expense. Compensated absences: Full-time unclassified staff earn vacation at rates of 18 to 22 days per year, based on the term of their employment contract, with a maximum accrual of 52 days. Classified employees earn vacation at rates up to 25 days per year, based on years of service and hours reported, with a maximum accrual equivalent to the amount earned in three years. Upon retirement, termination, or death, the employee is compensated at the final rate of pay for unused vacation up to a maximum of 40 days. Faculty accrue no vacation benefits. Full-time faculty, unclassified staff, and classified staff earn 15 days of sick leave per year and individuals who work less than full-time earn sick leave on a pro-rata basis. There is no limit on the number of sick leave hours that can be accumulated. Upon retirement a staff member with 10 or more years of Ohio public service is paid for one-fourth the value of earned but unused sick leave not to exceed 30 days, based on the employee's rate of pay at the time of retirement. The termination payment method is used to compute the liability for sick leave. Employees transferring to or from another State of Ohio agency may transfer any unused accumulated sick leave entitlement to/from the new agency. Persons leaving employment for reasons other than retirement are not compensated for unused sick leave.
Miami University Notes to Financial Statements (Dollars in Thousands)
20
Note 1. Summary of Significant Accounting Policies (Continued)
Net positions: Net positions are divided into three major categories. The first category, net investment in capital assets, which does not include unspent bond proceeds, reports the institution’s net equity in property, plant, and equipment. The second major category is restricted net position. This category contains assets that are owned by the institution, but the use or purpose of the funds is restricted by an external source or entity. The corpus of the nonexpendable restricted assets is available for investment purposes only. The expendable restricted assets may be expended by the institution, but must be spent only for the purpose as determined by a donor or external entity. The income generated from the nonexpendable restricted investments and the expendable restricted funds may be used for student loans, scholarships and fellowships, instruction, research, and other needs to support the operation of the University. The third category is unrestricted net position and is separated into two types: allocated and unallocated. Allocated unrestricted assets are available to the institution, but are allocated for a specific purpose within the institution by University policy, management, or the governing board. The allocated unrestricted net position was $295,022 as of June 30, 2018 and is to be used for loans, scholarships, investments and capital projects. Unallocated unrestricted net positions are available to be used for any lawful purpose of the institution. Tax status: The University is exempt from federal income taxes under Section 115 of the Internal Revenue Code. As such, the University is subject to federal income taxes only on unrelated business income, if any, under the provisions of Section 511 in the Internal Revenue Code. Estimates: Management has made, where necessary, estimates and judgments that affect certain amounts reported in the financial statements. The estimates and judgments are based on current available information, and actual results could differ from those estimates. Subsequent events: The University has evaluated subsequent events occurring between the end of our most recent fiscal year and October 15, 2018, the date the financial statements were available to be issued.
Note 2. Cash and Investments
The University’s cash and investment activities are governed by policies adopted by the board in accordance with authority granted by the Ohio Revised Code. Such policies are implemented by the treasurer and overseen by the board’s finance and audit committee. The University’s investment strategy incorporates financial instruments that involve varying elements of risk including market risk, credit risk, interest rate risk, and custodial credit risk. The University’s investment policies and procedures establish risk guidelines for each of the two primary investment pools, the non-endowment pool and endowment pool. Diversification is a fundamental risk management strategy for both pools.
Miami University Notes to Financial Statements (Dollars in Thousands)
21
Note 2. Cash and Investments (Continued)
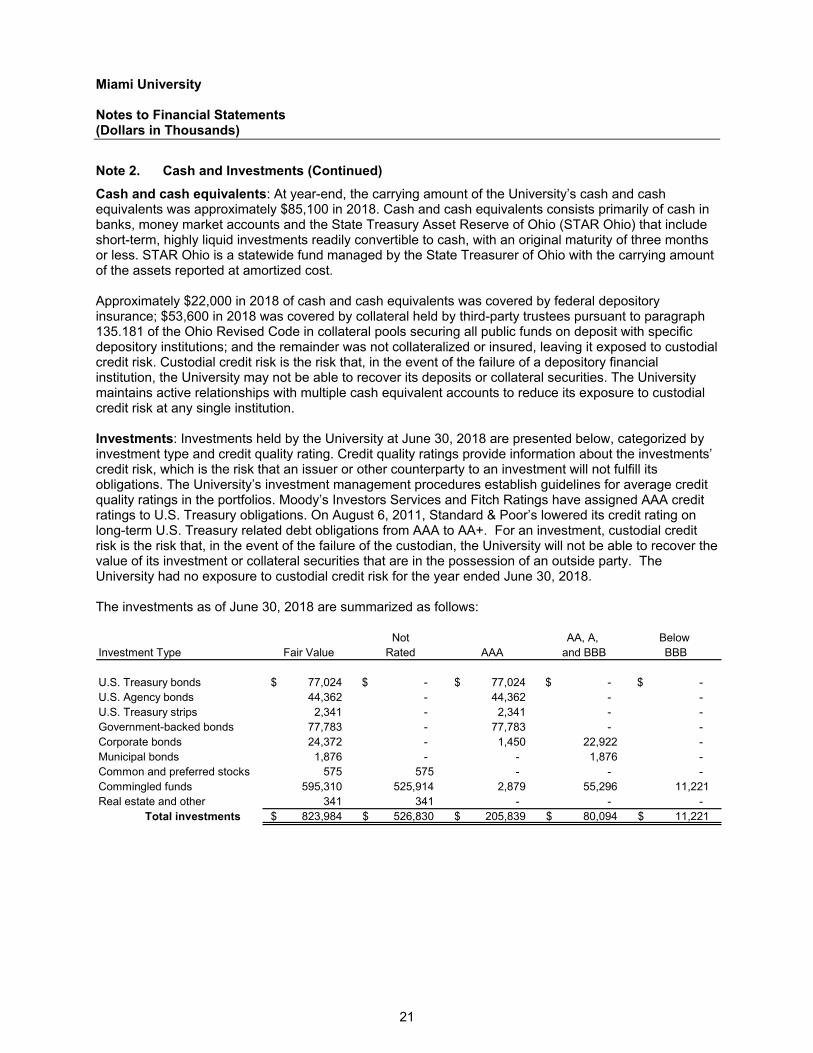
Cash and cash equivalents: At year-end, the carrying amount of the University’s cash and cash equivalents was approximately $85,100 in 2018. Cash and cash equivalents consists primarily of cash in banks, money market accounts and the State Treasury Asset Reserve of Ohio (STAR Ohio) that include short-term, highly liquid investments readily convertible to cash, with an original maturity of three months or less. STAR Ohio is a statewide fund managed by the State Treasurer of Ohio with the carrying amount of the assets reported at amortized cost. Approximately $22,000 in 2018 of cash and cash equivalents was covered by federal depository insurance; $53,600 in 2018 was covered by collateral held by third-party trustees pursuant to paragraph 135.181 of the Ohio Revised Code in collateral pools securing all public funds on deposit with specific depository institutions; and the remainder was not collateralized or insured, leaving it exposed to custodial credit risk. Custodial credit risk is the risk that, in the event of the failure of a depository financial institution, the University may not be able to recover its deposits or collateral securities. The University maintains active relationships with multiple cash equivalent accounts to reduce its exposure to custodial credit risk at any single institution. Investments: Investments held by the University at June 30, 2018 are presented below, categorized by investment type and credit quality rating. Credit quality ratings provide information about the investments’ credit risk, which is the risk that an issuer or other counterparty to an investment will not fulfill its obligations. The University’s investment management procedures establish guidelines for average credit quality ratings in the portfolios. Moody’s Investors Services and Fitch Ratings have assigned AAA credit ratings to U.S. Treasury obligations. On August 6, 2011, Standard & Poor’s lowered its credit rating on long-term U.S. Treasury related debt obligations from AAA to AA+. For an investment, custodial credit risk is the risk that, in the event of the failure of the custodian, the University will not be able to recover the value of its investment or collateral securities that are in the possession of an outside party. The University had no exposure to custodial credit risk for the year ended June 30, 2018. The investments as of June 30, 2018 are summarized as follows:
Not AA, A, Below Investment Type Fair Value Rated AAA and BBB BBB
U.S. Treasury bonds 77,024 $ -$ 77,024 $ -$ -$ U.S. Agency bonds 44,362 - 44,362 - - U.S. Treasury strips 2,341 - 2,341 - - Government-backed bonds 77,783 - 77,783 - - Corporate bonds 24,372 - 1,450 22,922 - Municipal bonds 1,876 - - 1,876 - Common and preferred stocks 575 575 - - - Commingled funds 595,310 525,914 2,879 55,296 11,221 Real estate and other 341 341 - - -
Total investments 823,984 $ 526,830 $ 205,839 $ 80,094 $ 11,221 $
Miami University Notes to Financial Statements (Dollars in Thousands)
22
Note 2. Cash and Investments (Continued)
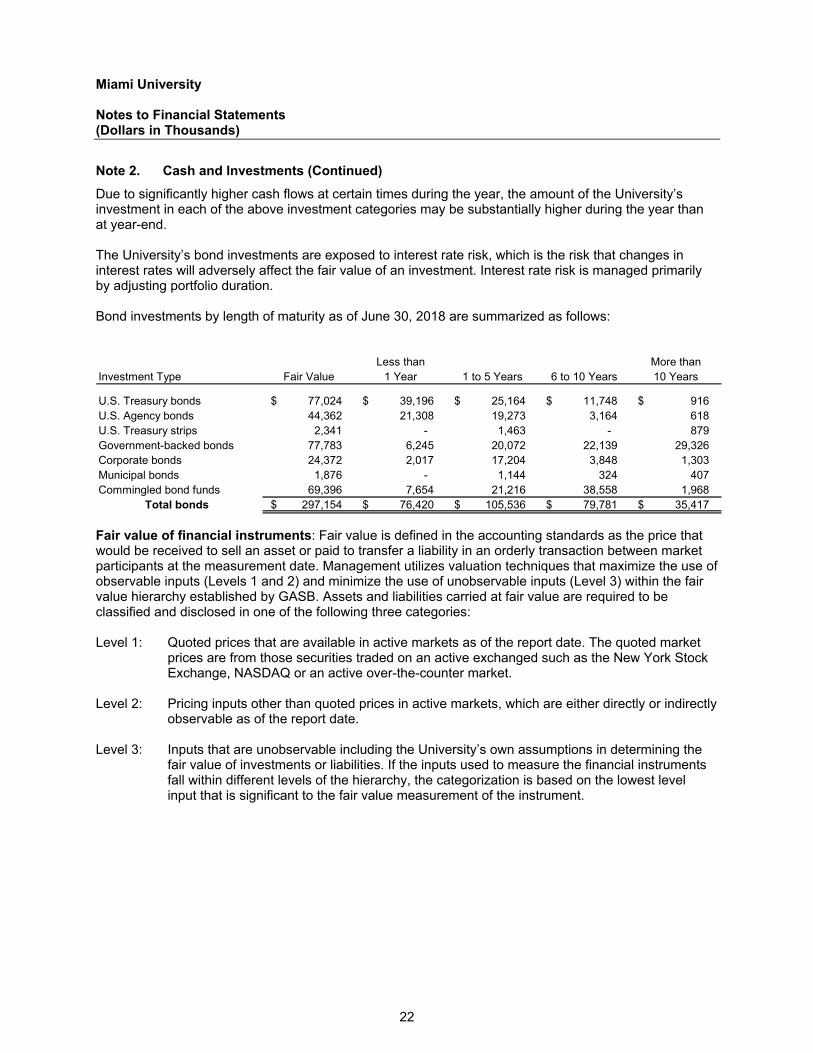
Due to significantly higher cash flows at certain times during the year, the amount of the University’s investment in each of the above investment categories may be substantially higher during the year than at year-end. The University’s bond investments are exposed to interest rate risk, which is the risk that changes in interest rates will adversely affect the fair value of an investment. Interest rate risk is managed primarily by adjusting portfolio duration. Bond investments by length of maturity as of June 30, 2018 are summarized as follows:
Less than More thanInvestment Type Fair Value 1 Year 1 to 5 Years 6 to 10 Years 10 Years
U.S. Treasury bonds 77,024 $ 39,196 $ 25,164 $ 11,748 $ 916 $ U.S. Agency bonds 44,362 21,308 19,273 3,164 618 U.S. Treasury strips 2,341 - 1,463 - 879 Government-backed bonds 77,783 6,245 20,072 22,139 29,326 Corporate bonds 24,372 2,017 17,204 3,848 1,303 Municipal bonds 1,876 - 1,144 324 407 Commingled bond funds 69,396 7,654 21,216 38,558 1,968
Total bonds 297,154 $ 76,420 $ 105,536 $ 79,781 $ 35,417 $
Fair value of financial instruments: Fair value is defined in the accounting standards as the price that would be received to sell an asset or paid to transfer a liability in an orderly transaction between market participants at the measurement date. Management utilizes valuation techniques that maximize the use of observable inputs (Levels 1 and 2) and minimize the use of unobservable inputs (Level 3) within the fair value hierarchy established by GASB. Assets and liabilities carried at fair value are required to be classified and disclosed in one of the following three categories: Level 1: Quoted prices that are available in active markets as of the report date. The quoted market
prices are from those securities traded on an active exchanged such as the New York Stock Exchange, NASDAQ or an active over-the-counter market.
Level 2: Pricing inputs other than quoted prices in active markets, which are either directly or indirectly
observable as of the report date. Level 3: Inputs that are unobservable including the University’s own assumptions in determining the
fair value of investments or liabilities. If the inputs used to measure the financial instruments fall within different levels of the hierarchy, the categorization is based on the lowest level input that is significant to the fair value measurement of the instrument.
Miami University Notes to Financial Statements (Dollars in Thousands)
23
Note 2. Cash and Investments (Continued)
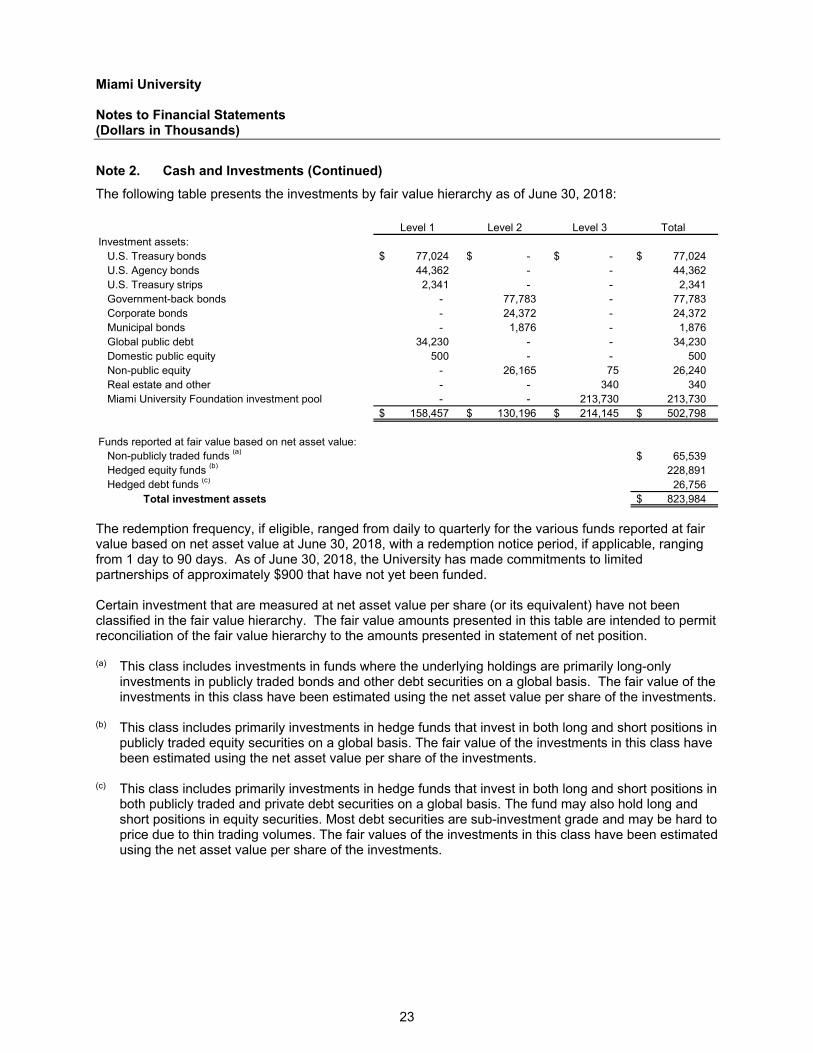
The following table presents the investments by fair value hierarchy as of June 30, 2018:
Level 1 Level 2 Level 3 Total Investment assets:
U.S. Treasury bonds 77,024 $ -$ -$ 77,024 $ U.S. Agency bonds 44,362 - - 44,362 U.S. Treasury strips 2,341 - - 2,341 Government-back bonds - 77,783 - 77,783 Corporate bonds - 24,372 - 24,372 Municipal bonds - 1,876 - 1,876 Global public debt 34,230 - - 34,230 Domestic public equity 500 - - 500 Non-public equity - 26,165 75 26,240 Real estate and other - - 340 340 Miami University Foundation investment pool - - 213,730 213,730
158,457 $ 130,196 $ 214,145 $ 502,798 $
Funds reported at fair value based on net asset value:Non-publicly traded funds (a) 65,539 $ Hedged equity funds (b) 228,891 Hedged debt funds (c) 26,756
Total investment assets 823,984 $
The redemption frequency, if eligible, ranged from daily to quarterly for the various funds reported at fair value based on net asset value at June 30, 2018, with a redemption notice period, if applicable, ranging from 1 day to 90 days. As of June 30, 2018, the University has made commitments to limited partnerships of approximately $900 that have not yet been funded. Certain investment that are measured at net asset value per share (or its equivalent) have not been classified in the fair value hierarchy. The fair value amounts presented in this table are intended to permit reconciliation of the fair value hierarchy to the amounts presented in statement of net position. (a) This class includes investments in funds where the underlying holdings are primarily long-only
investments in publicly traded bonds and other debt securities on a global basis. The fair value of the investments in this class have been estimated using the net asset value per share of the investments.
(b) This class includes primarily investments in hedge funds that invest in both long and short positions in
publicly traded equity securities on a global basis. The fair value of the investments in this class have been estimated using the net asset value per share of the investments.
(c) This class includes primarily investments in hedge funds that invest in both long and short positions in
both publicly traded and private debt securities on a global basis. The fund may also hold long and short positions in equity securities. Most debt securities are sub-investment grade and may be hard to price due to thin trading volumes. The fair values of the investments in this class have been estimated using the net asset value per share of the investments.
Miami University Notes to Financial Statements (Dollars in Thousands)
24
Note 2. Cash and Investments (Continued)
All of the University’s investments in publicly traded securities are subject to market risk. As a result, a significant downturn in the securities markets could adversely affect the market value of University assets. Investments include globally oriented strategies that include exposure to non-U.S. equity and debt securities. While providing a potential diversification benefit, such international investments are exposed to foreign currency risk. Less than half of the investments have exposure to foreign currency risk. The University’s investments that are exposed to concentration risk consist of securities issued by the U.S. agencies or instrumentalities of the U.S. government which represent 24.5 percent of investments at June 30, 2018. No other single issuer represents more than 5 percent of investments. Commingled funds held by the University include a wide range of investments, including hedge funds. The University’s objective for investing in these hedge funds is to provide stable, absolute returns that are uncorrelated to fluctuations in the stock and bond markets. Fair values were determined based on prices of established securities markets, with the exception of some hedge funds and alternative investments whose fair values were provided by the funds’ managements. Alternative investments generally represent investments that are less liquid than publicly traded securities and include private equity, investments in real assets, and other strategies. Hedge funds may include, but are not limited to, long and short investments in domestic and international equity securities, distressed securities, fixed income securities, currencies, commodities, options, futures, and other derivatives. Many of these securities are intended to reduce market risk, credit risk, and interest rate risk. Endowment funds: The Miami University Foundation (Foundation) manages the Foundation and University endowment and quasi-endowment funds in a single investment pool (Pooled Fund). The University investment is maintained as a separate fund in the financial system of the Foundation and receives a proportionate share of the Pooled Fund’s activity. The Foundation owns the assets of the Pooled Fund; the University has an interest in the Pooled Fund. The Foundation’s Pooled Fund is not registered with the Securities and Exchange Commission as an investment company. The Foundation’s Board of Directors appoints an Investment Committee, which is responsible for oversight of the Pooled Fund in accordance with Foundation policies. University investments include $213,730 managed by the Foundation as of June 30, 2018. The assets held on behalf of the University are included in other noncurrent liabilities on the statement of net position. The fair value of the University’s position in the Pooled Fund is based on the University’s proportional share of the Pooled Fund, which is marked-to-market annually. Note 10 provides additional information on the Foundation and the Pooled Fund. The Uniform Prudent Management of Institutional Funds Act (UPMIFA) as adopted by the State of Ohio provides statutory guidelines for prudent management, investment, and expenditure of donor-restricted endowment funds held by charitable organizations. The University’s interpretation of its fiduciary responsibilities for donor-restricted endowments under UPMIFA requirements, barring the existence of any donor-specific provisions, is to preserve intergenerational equity to the extent possible and to produce maximum total return without assuming inappropriate risks. The investment policies governing these funds look beyond short-term fluctuations in economic cycles toward an investment philosophy that provides the best total return over very long time periods.

Miami University Notes to Financial Statements (Dollars in Thousands)
25
Note 2. Cash and Investments (Continued)
The University employs a total return policy which defines the total amount of dividends, interest and realized gains to be distributed from the endowment assets to other funds. The policy distributes four percent of the average of the previous twelve quarterly market values as of March 31st of each fiscal year. The authorized spending amount was $7,546 in 2018. In accordance with donors’ stipulations, a portion of the earnings was returned to endowment principal and the balance of $6,726 was distributed for expenditure for 2018. Donor restricted endowments with insufficient accumulated earnings did not make a current year distribution.
Note 3. Accounts, Pledges and Notes Receivable, net
The accounts, pledges and notes receivable as of June 30, 2018 are summarized as follows: Accounts receivable:
Student receivables 10,670 $ University Foundation 14,719 Grants and contracts 3,869 Other receivables 5,300
Total accounts receivable 34,558 Less allowances for doubtful accounts (1,285)
Net accounts receivable 33,273 $
Pledges receivable:Pledges receivable 3,562 $ Less allowance for doubtful pledges (489)
Net pledges receivable 3,073 $
Notes receivable:Federal loan programs 5,810 $ University loan programs 4,258
Total notes receivable 10,068 Less allowance for doubtful notes (1,974)
Net notes receivable 8,094
Total 44,440 $

Miami University Notes to Financial Statements (Dollars in Thousands)
26
Note 4. Capital Assets
The capital assets and accumulated depreciation as of June 30, 2018 are summarized as follows:
Beginning EndingBalance Additions Retirements Transfers Balance
Capital assets:Land 5,792 $ 233 $ -$ -$ 6,025 $ Collections of works of art and historical
treasures 9,338 550 - - 9,888 Construction in progress 131,692 132,923 - (67,837) 196,778
Total nondepreciable capital assets 146,822 133,706 (67,837) 212,691
Land improvements 54,194 6,748 - - 60,942 Buildings 1,406,093 966 - 54,906 1,461,965 Infrastructure 155,878 1,238 - 12,931 170,047 Machinery and equipment 86,923 5,419 (4,195) - 88,147 Library books and publications 71,050 945 - - 71,995 Vehicles 7,048 208 (393) - 6,863 Intangible assets 17,069 - (4,198) - 12,871
Total depreciable capital assets 1,798,255 15,524 (8,786) 67,837 1,872,830 Total capital assets 1,945,077 149,230 (8,786) - 2,085,521
Less accumulated depreciation:Buildings 482,142 44,973 - - 527,115 Infrastructure 74,580 5,934 - - 80,514 Land improvements 19,869 2,057 - - 21,926 Machinery and equipment 28,805 3,821 (4,195) - 28,431 Library books and publications 50,709 2,001 - - 52,710 Vehicles 5,597 1,024 (393) - 6,228 Intangible assets 17,069 - (4,198) - 12,871
Total accumulated depreciation 678,771 59,810 (8,786) - 729,795
Total capital assets, net 1,266,306 $ 89,420 $ -$ -$ 1,355,726 $
Note 5. Long-Term Liabilities
The long-term liabilities as of June 30, 2018 are summarized as follows:
Beginning Ending CurrentBalance Additions Reductions Balance Portion
Bonds and leases payable:Bonds payable 671,655 $ -$ (29,840) $ 641,815 $ 31,450 $ Capital leases payable 2,281 - (124) 2,157 127 Premiums 51,561 - (2,354) 49,207 -
Total bonds and leases payable 725,497 - (32,318) 693,179 31,577
Other liabilities:Compensated absences 18,873 7,951 (8,601) 18,223 1,379 Federal Perkins loans 5,558 287 (1,757) 4,088 801
Total other liabilities 24,431 8,238 (10,358) 22,311 2,180
Total 749,928 $ 8,238 $ (42,676) $ 715,490 $ 33,757 $
Additional information regarding the bonds and capital leases is included in Note 6.
Miami University Notes to Financial Statements (Dollars in Thousands)
27
Note 6. Indebtedness
During the year ended June 30, 2017, the University issued $154,635 in General Receipts Revenue Bonds with interest rates ranging from 2.00 percent to 5.00 percent and maturities from 2017 to 2042. A part of the proceeds were used to refund a portion of the remaining Miami University General Receipts Bonds, Series 2007. The net change in cash flows related to the refunding was approximately $5,800 and the net present value savings was approximately $5,000. In 2017, the University defeased a portion of the Series 2007 bonds by placing some of the proceeds from the Series 2017 bonds into an escrow account to provide for future debt service. The outstanding balance of defeased bonds were $45,165 as of June 30, 2018. The February 14, 2017 bond refunding resulted in a difference between the net carrying amount of the old debt and the reacquisition price of $599. The unamortized difference of $549 at June 30, 2018 is reported in the accompanying financial statements as a deferred inflow of resources and is being amortized through the year 2028. During the year ended June 30, 2016, the University issued $52,335 in General Receipts Revenue Bonds with a 1.88 percent coupon and maturities from 2016 to 2025. The proceeds were used to retire existing debt obligations. During the year ended June 30, 2014, the University issued $135,035 in General Receipts Revenue Bonds with interest rates ranging from 3.00 percent to 5.00 percent and maturities from 2015 to 2040. During the year ended June 30, 2013, the University issued $116,065 in General Receipts Revenue Bonds with interest rates ranging from 3.00 percent to 5.00 percent and maturities from 2014 to 2038. During the year ended June 30, 2012, the University issued $148,775 in General Receipts Revenue Bonds with interest rates ranging from 2.00 percent to 5.00 percent and maturities from 2012 to 2037. A part of the proceeds were used to refund a portion of the remaining Miami University General Receipts Bonds, Series 2003. The net change in cash flows related to the refunding was approximately $2,100 and the net present value savings was approximately $1,600. In fiscal year 2012, the University defeased a portion of the Series 2003 bonds by placing some of the proceeds from the Series 2011 bonds into an escrow account to provide for all future debt service. The outstanding balance of defeased bonds were $20,590 as of June 30, 2018. The proceeds from the 2017, 2014, 2013, and 2012 issuances have been and will continue to be used to fund the multi-phase effort to renovate all campus student housing and dining facilities as well as to retire outstanding indebtedness of the University for more favorable borrowing terms as described in the proceeding paragraphs. The December 21, 2011 bond refunding resulted in a difference between the net carrying amount of the old debt and the reacquisition price of $1,209. The unamortized difference of $580 at June 30, 2018 is reported in the accompanying financial statements as a deferred inflow of resources and is being amortized through the year 2024.
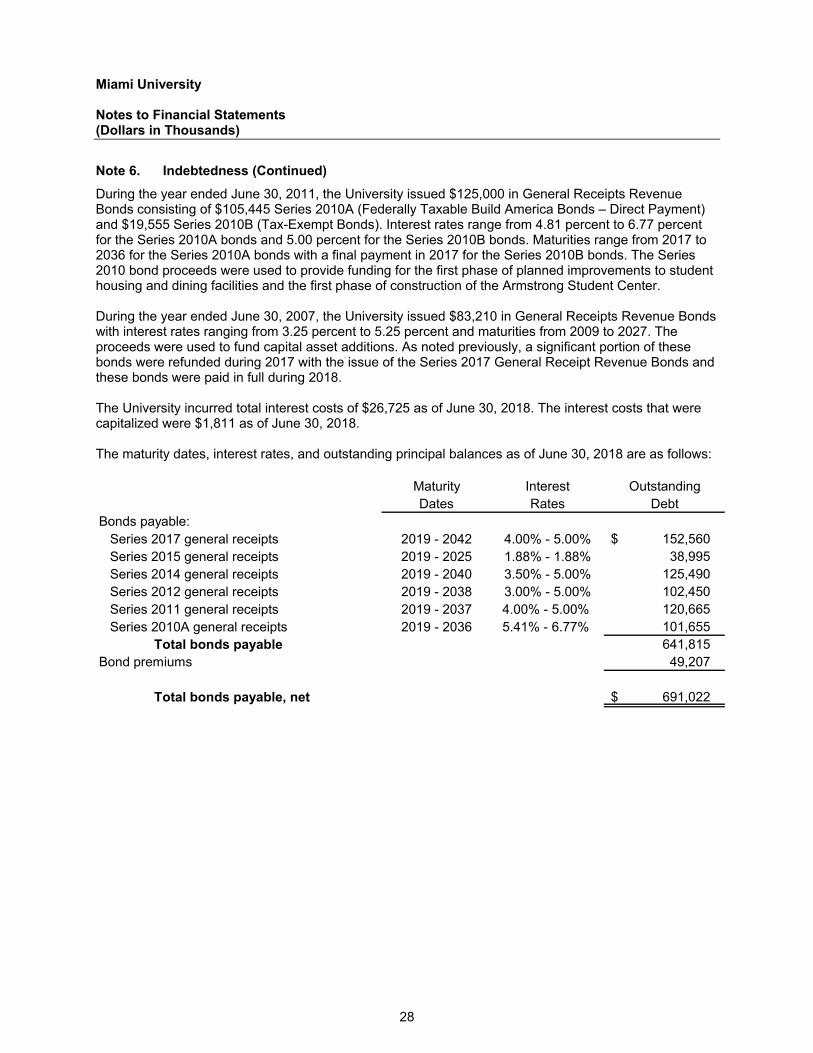
Miami University Notes to Financial Statements (Dollars in Thousands)
28
Note 6. Indebtedness (Continued)
During the year ended June 30, 2011, the University issued $125,000 in General Receipts Revenue Bonds consisting of $105,445 Series 2010A (Federally Taxable Build America Bonds – Direct Payment) and $19,555 Series 2010B (Tax-Exempt Bonds). Interest rates range from 4.81 percent to 6.77 percent for the Series 2010A bonds and 5.00 percent for the Series 2010B bonds. Maturities range from 2017 to 2036 for the Series 2010A bonds with a final payment in 2017 for the Series 2010B bonds. The Series 2010 bond proceeds were used to provide funding for the first phase of planned improvements to student housing and dining facilities and the first phase of construction of the Armstrong Student Center. During the year ended June 30, 2007, the University issued $83,210 in General Receipts Revenue Bonds with interest rates ranging from 3.25 percent to 5.25 percent and maturities from 2009 to 2027. The proceeds were used to fund capital asset additions. As noted previously, a significant portion of these bonds were refunded during 2017 with the issue of the Series 2017 General Receipt Revenue Bonds and these bonds were paid in full during 2018. The University incurred total interest costs of $26,725 as of June 30, 2018. The interest costs that were capitalized were $1,811 as of June 30, 2018. The maturity dates, interest rates, and outstanding principal balances as of June 30, 2018 are as follows:
Maturity Interest OutstandingDates Rates Debt
Bonds payable:Series 2017 general receipts 2019 - 2042 4.00% - 5.00% 152,560 $ Series 2015 general receipts 2019 - 2025 1.88% - 1.88% 38,995 Series 2014 general receipts 2019 - 2040 3.50% - 5.00% 125,490 Series 2012 general receipts 2019 - 2038 3.00% - 5.00% 102,450 Series 2011 general receipts 2019 - 2037 4.00% - 5.00% 120,665 Series 2010A general receipts 2019 - 2036 5.41% - 6.77% 101,655
Total bonds payable 641,815 Bond premiums 49,207
Total bonds payable, net 691,022 $
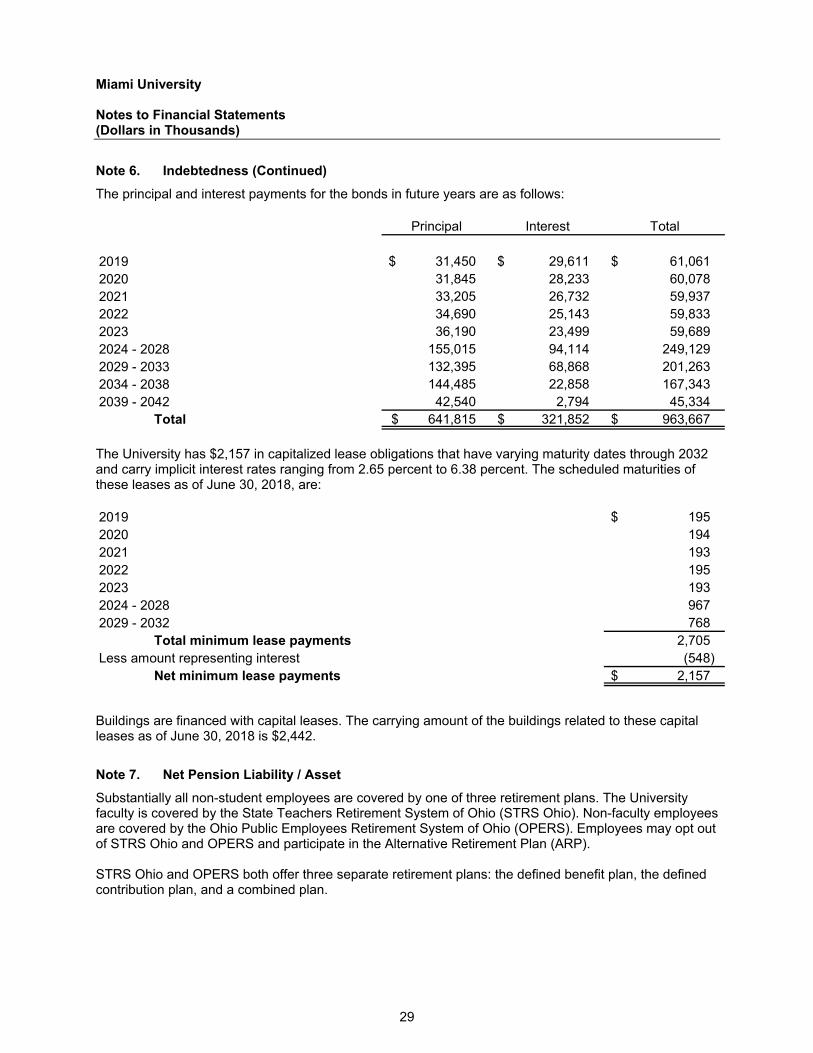
Miami University Notes to Financial Statements (Dollars in Thousands)
29
Note 6. Indebtedness (Continued)
The principal and interest payments for the bonds in future years are as follows:
Principal Interest Total
2019 31,450 $ 29,611 $ 61,061 $ 2020 31,845 28,233 60,078 2021 33,205 26,732 59,937 2022 34,690 25,143 59,833 2023 36,190 23,499 59,689 2024 - 2028 155,015 94,114 249,129 2029 - 2033 132,395 68,868 201,263 2034 - 2038 144,485 22,858 167,343 2039 - 2042 42,540 2,794 45,334
Total 641,815 $ 321,852 $ 963,667 $
The University has $2,157 in capitalized lease obligations that have varying maturity dates through 2032 and carry implicit interest rates ranging from 2.65 percent to 6.38 percent. The scheduled maturities of these leases as of June 30, 2018, are: 2019 195 $ 2020 194 2021 193 2022 195 2023 193 2024 - 2028 967 2029 - 2032 768
Total minimum lease payments 2,705 Less amount representing interest (548)
Net minimum lease payments 2,157 $
Buildings are financed with capital leases. The carrying amount of the buildings related to these capital leases as of June 30, 2018 is $2,442.
Note 7. Net Pension Liability / Asset
Substantially all non-student employees are covered by one of three retirement plans. The University faculty is covered by the State Teachers Retirement System of Ohio (STRS Ohio). Non-faculty employees are covered by the Ohio Public Employees Retirement System of Ohio (OPERS). Employees may opt out of STRS Ohio and OPERS and participate in the Alternative Retirement Plan (ARP). STRS Ohio and OPERS both offer three separate retirement plans: the defined benefit plan, the defined contribution plan, and a combined plan.
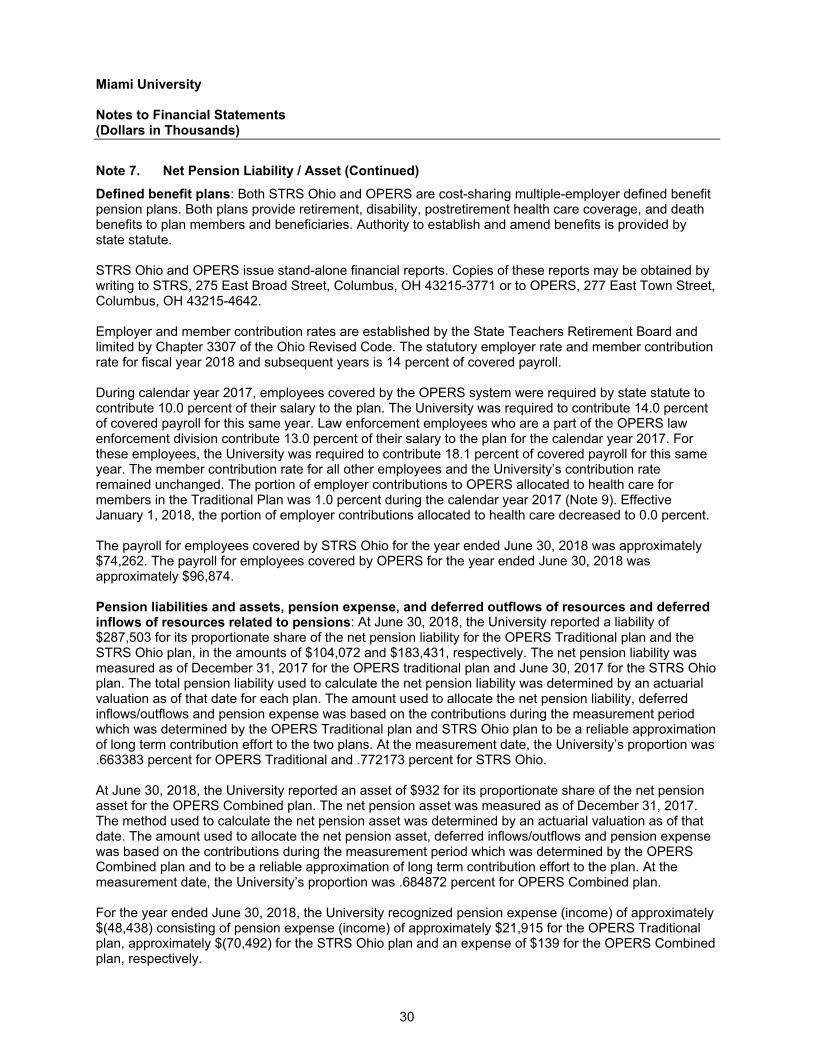
Miami University Notes to Financial Statements (Dollars in Thousands)
30
Note 7. Net Pension Liability / Asset (Continued)
Defined benefit plans: Both STRS Ohio and OPERS are cost-sharing multiple-employer defined benefit pension plans. Both plans provide retirement, disability, postretirement health care coverage, and death benefits to plan members and beneficiaries. Authority to establish and amend benefits is provided by state statute. STRS Ohio and OPERS issue stand-alone financial reports. Copies of these reports may be obtained by writing to STRS, 275 East Broad Street, Columbus, OH 43215-3771 or to OPERS, 277 East Town Street, Columbus, OH 43215-4642. Employer and member contribution rates are established by the State Teachers Retirement Board and limited by Chapter 3307 of the Ohio Revised Code. The statutory employer rate and member contribution rate for fiscal year 2018 and subsequent years is 14 percent of covered payroll. During calendar year 2017, employees covered by the OPERS system were required by state statute to contribute 10.0 percent of their salary to the plan. The University was required to contribute 14.0 percent of covered payroll for this same year. Law enforcement employees who are a part of the OPERS law enforcement division contribute 13.0 percent of their salary to the plan for the calendar year 2017. For these employees, the University was required to contribute 18.1 percent of covered payroll for this same year. The member contribution rate for all other employees and the University’s contribution rate remained unchanged. The portion of employer contributions to OPERS allocated to health care for members in the Traditional Plan was 1.0 percent during the calendar year 2017 (Note 9). Effective January 1, 2018, the portion of employer contributions allocated to health care decreased to 0.0 percent. The payroll for employees covered by STRS Ohio for the year ended June 30, 2018 was approximately $74,262. The payroll for employees covered by OPERS for the year ended June 30, 2018 was approximately $96,874. Pension liabilities and assets, pension expense, and deferred outflows of resources and deferred inflows of resources related to pensions: At June 30, 2018, the University reported a liability of $287,503 for its proportionate share of the net pension liability for the OPERS Traditional plan and the STRS Ohio plan, in the amounts of $104,072 and $183,431, respectively. The net pension liability was measured as of December 31, 2017 for the OPERS traditional plan and June 30, 2017 for the STRS Ohio plan. The total pension liability used to calculate the net pension liability was determined by an actuarial valuation as of that date for each plan. The amount used to allocate the net pension liability, deferred inflows/outflows and pension expense was based on the contributions during the measurement period which was determined by the OPERS Traditional plan and STRS Ohio plan to be a reliable approximation of long term contribution effort to the two plans. At the measurement date, the University’s proportion was .663383 percent for OPERS Traditional and .772173 percent for STRS Ohio. At June 30, 2018, the University reported an asset of $932 for its proportionate share of the net pension asset for the OPERS Combined plan. The net pension asset was measured as of December 31, 2017. The method used to calculate the net pension asset was determined by an actuarial valuation as of that date. The amount used to allocate the net pension asset, deferred inflows/outflows and pension expense was based on the contributions during the measurement period which was determined by the OPERS Combined plan and to be a reliable approximation of long term contribution effort to the plan. At the measurement date, the University’s proportion was .684872 percent for OPERS Combined plan. For the year ended June 30, 2018, the University recognized pension expense (income) of approximately $(48,438) consisting of pension expense (income) of approximately $21,915 for the OPERS Traditional plan, approximately $(70,492) for the STRS Ohio plan and an expense of $139 for the OPERS Combined plan, respectively.
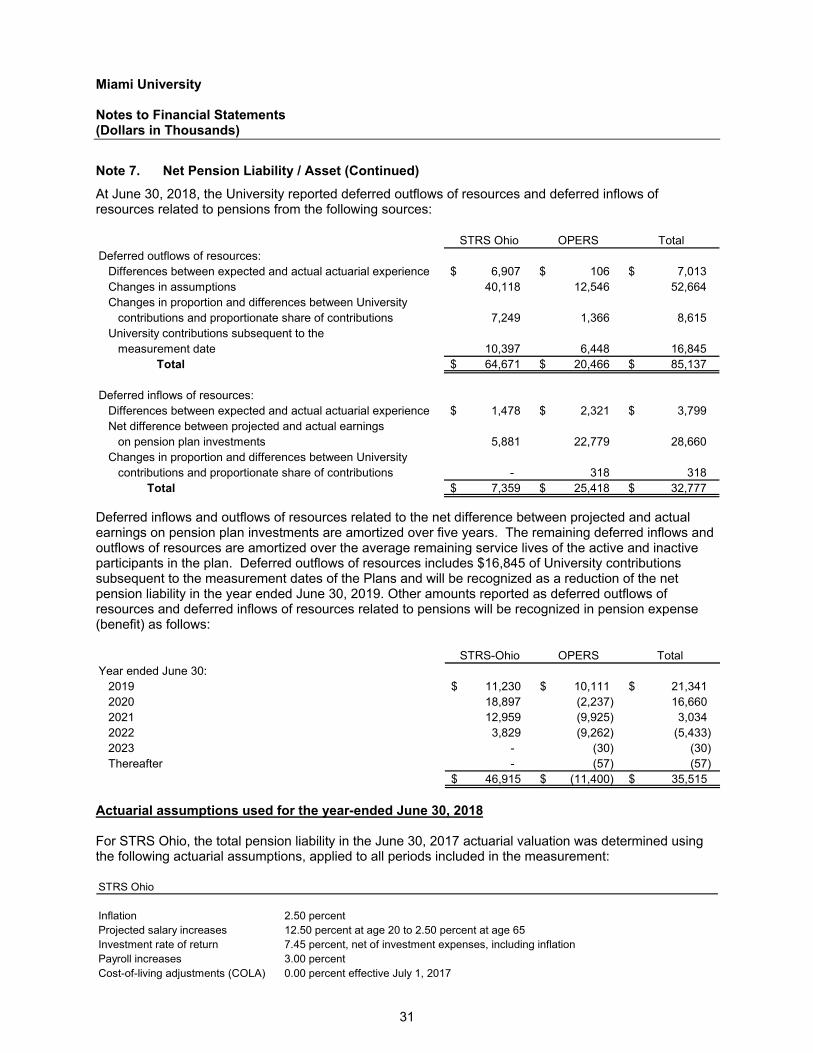
Miami University Notes to Financial Statements (Dollars in Thousands)
31
Note 7. Net Pension Liability / Asset (Continued)
At June 30, 2018, the University reported deferred outflows of resources and deferred inflows of resources related to pensions from the following sources:
STRS Ohio OPERS TotalDeferred outflows of resources:
Differences between expected and actual actuarial experience 6,907 $ 106 $ 7,013 $ Changes in assumptions 40,118 12,546 52,664 Changes in proportion and differences between University
contributions and proportionate share of contributions 7,249 1,366 8,615 University contributions subsequent to the
measurement date 10,397 6,448 16,845 Total 64,671 $ 20,466 $ 85,137 $
Deferred inflows of resources:Differences between expected and actual actuarial experience 1,478 $ 2,321 $ 3,799 $ Net difference between projected and actual earnings
on pension plan investments 5,881 22,779 28,660 Changes in proportion and differences between University
contributions and proportionate share of contributions - 318 318 Total 7,359 $ 25,418 $ 32,777 $
Deferred inflows and outflows of resources related to the net difference between projected and actual earnings on pension plan investments are amortized over five years. The remaining deferred inflows and outflows of resources are amortized over the average remaining service lives of the active and inactive participants in the plan. Deferred outflows of resources includes $16,845 of University contributions subsequent to the measurement dates of the Plans and will be recognized as a reduction of the net pension liability in the year ended June 30, 2019. Other amounts reported as deferred outflows of resources and deferred inflows of resources related to pensions will be recognized in pension expense (benefit) as follows:
STRS-Ohio OPERS Total Year ended June 30:
2019 11,230 $ 10,111 $ 21,341 $ 2020 18,897 (2,237) 16,660 2021 12,959 (9,925) 3,034 2022 3,829 (9,262) (5,433) 2023 - (30) (30) Thereafter - (57) (57)
46,915 $ (11,400) $ 35,515 $
Actuarial assumptions used for the year-ended June 30, 2018 For STRS Ohio, the total pension liability in the June 30, 2017 actuarial valuation was determined using the following actuarial assumptions, applied to all periods included in the measurement:
STRS Ohio
Inflation 2.50 percentProjected salary increases 12.50 percent at age 20 to 2.50 percent at age 65 Investment rate of return 7.45 percent, net of investment expenses, including inflationPayroll increases 3.00 percentCost-of-living adjustments (COLA) 0.00 percent effective July 1, 2017
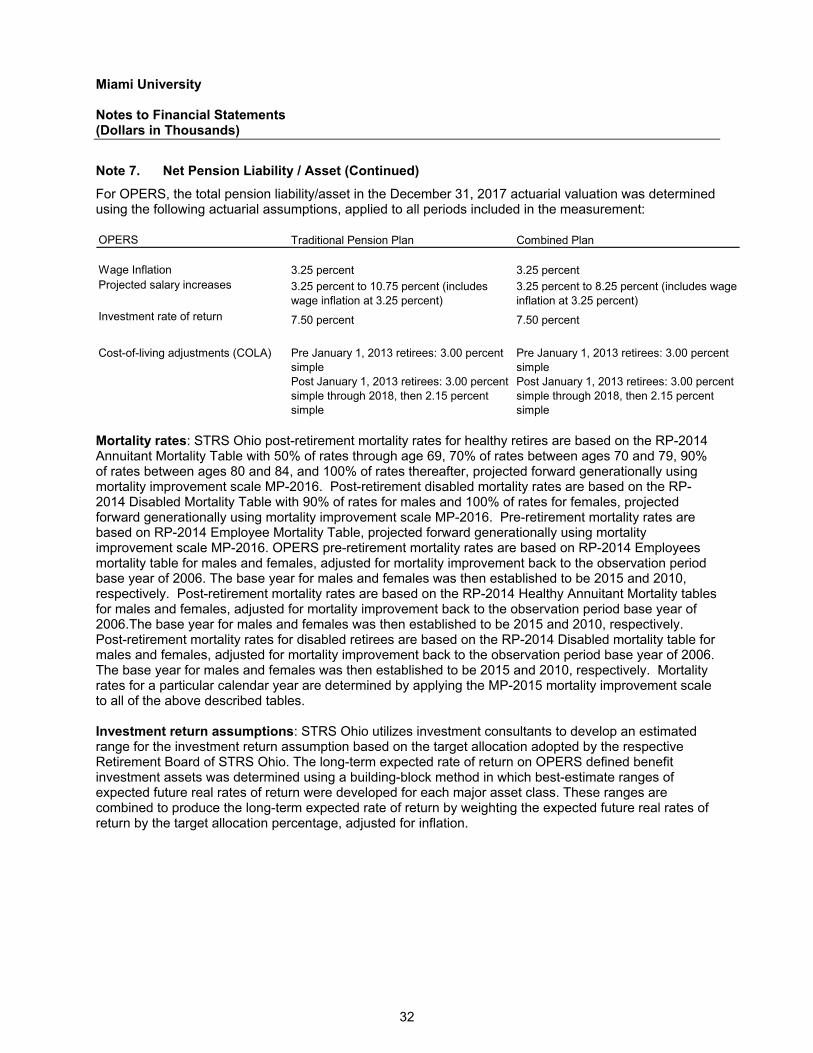
Miami University Notes to Financial Statements (Dollars in Thousands)
32
Note 7. Net Pension Liability / Asset (Continued)
For OPERS, the total pension liability/asset in the December 31, 2017 actuarial valuation was determined using the following actuarial assumptions, applied to all periods included in the measurement: OPERS Traditional Pension Plan Combined Plan
Wage Inflation 3.25 percent 3.25 percentProjected salary increases 3.25 percent to 10.75 percent (includes
wage inflation at 3.25 percent)3.25 percent to 8.25 percent (includes wage inflation at 3.25 percent)
Investment rate of return 7.50 percent 7.50 percent
Cost-of-living adjustments (COLA) Pre January 1, 2013 retirees: 3.00 percent simplePost January 1, 2013 retirees: 3.00 percent simple through 2018, then 2.15 percent simple
Pre January 1, 2013 retirees: 3.00 percent simplePost January 1, 2013 retirees: 3.00 percent simple through 2018, then 2.15 percent simple
Mortality rates: STRS Ohio post-retirement mortality rates for healthy retires are based on the RP-2014 Annuitant Mortality Table with 50% of rates through age 69, 70% of rates between ages 70 and 79, 90% of rates between ages 80 and 84, and 100% of rates thereafter, projected forward generationally using mortality improvement scale MP-2016. Post-retirement disabled mortality rates are based on the RP-2014 Disabled Mortality Table with 90% of rates for males and 100% of rates for females, projected forward generationally using mortality improvement scale MP-2016. Pre-retirement mortality rates are based on RP-2014 Employee Mortality Table, projected forward generationally using mortality improvement scale MP-2016. OPERS pre-retirement mortality rates are based on RP-2014 Employees mortality table for males and females, adjusted for mortality improvement back to the observation period base year of 2006. The base year for males and females was then established to be 2015 and 2010, respectively. Post-retirement mortality rates are based on the RP-2014 Healthy Annuitant Mortality tables for males and females, adjusted for mortality improvement back to the observation period base year of 2006.The base year for males and females was then established to be 2015 and 2010, respectively. Post-retirement mortality rates for disabled retirees are based on the RP-2014 Disabled mortality table for males and females, adjusted for mortality improvement back to the observation period base year of 2006. The base year for males and females was then established to be 2015 and 2010, respectively. Mortality rates for a particular calendar year are determined by applying the MP-2015 mortality improvement scale to all of the above described tables. Investment return assumptions: STRS Ohio utilizes investment consultants to develop an estimated range for the investment return assumption based on the target allocation adopted by the respective Retirement Board of STRS Ohio. The long-term expected rate of return on OPERS defined benefit investment assets was determined using a building-block method in which best-estimate ranges of expected future real rates of return were developed for each major asset class. These ranges are combined to produce the long-term expected rate of return by weighting the expected future real rates of return by the target allocation percentage, adjusted for inflation.
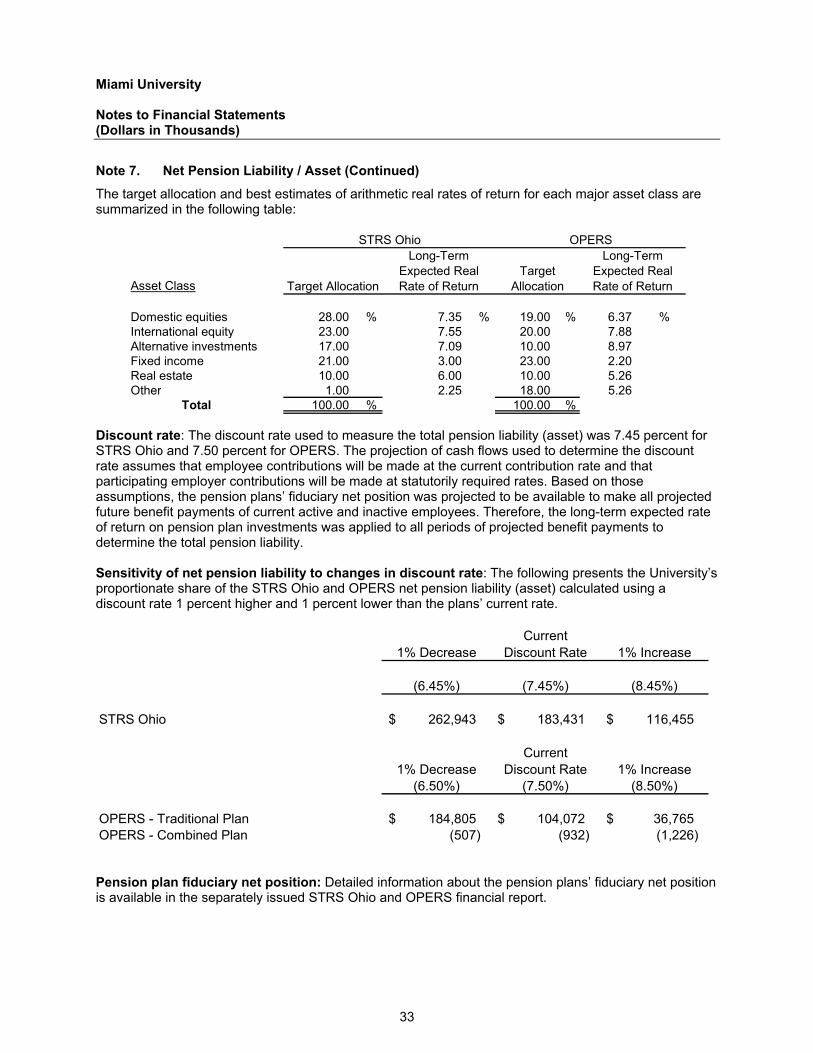
Miami University Notes to Financial Statements (Dollars in Thousands)
33
Note 7. Net Pension Liability / Asset (Continued)
The target allocation and best estimates of arithmetic real rates of return for each major asset class are summarized in the following table:
Asset Class
Domestic equities 28.00 % 7.35 % 19.00 % 6.37 % International equity 23.00 7.55 20.00 7.88 Alternative investments 17.00 7.09 10.00 8.97 Fixed income 21.00 3.00 23.00 2.20 Real estate 10.00 6.00 10.00 5.26 Other 1.00 2.25 18.00 5.26
Total 100.00 % 100.00 %
STRS Ohio
Target Allocation
Long-Term Expected Real Rate of Return
OPERS
Target Allocation
Long-Term Expected Real Rate of Return
Discount rate: The discount rate used to measure the total pension liability (asset) was 7.45 percent for STRS Ohio and 7.50 percent for OPERS. The projection of cash flows used to determine the discount rate assumes that employee contributions will be made at the current contribution rate and that participating employer contributions will be made at statutorily required rates. Based on those assumptions, the pension plans’ fiduciary net position was projected to be available to make all projected future benefit payments of current active and inactive employees. Therefore, the long-term expected rate of return on pension plan investments was applied to all periods of projected benefit payments to determine the total pension liability. Sensitivity of net pension liability to changes in discount rate: The following presents the University’s proportionate share of the STRS Ohio and OPERS net pension liability (asset) calculated using a discount rate 1 percent higher and 1 percent lower than the plans’ current rate.
Current1% Decrease Discount Rate 1% Increase
(6.45%) (7.45%) (8.45%)
STRS Ohio 262,943 $ 183,431 $ 116,455 $
Current1% Decrease Discount Rate 1% Increase
(6.50%) (7.50%) (8.50%)
OPERS - Traditional Plan 184,805 $ 104,072 $ 36,765 $ OPERS - Combined Plan (507) (932) (1,226) Pension plan fiduciary net position: Detailed information about the pension plans’ fiduciary net position is available in the separately issued STRS Ohio and OPERS financial report.

Miami University Notes to Financial Statements (Dollars in Thousands)
34
Note 8. Retirement Plans
Defined contribution plan: Full-time faculty and unclassified employees are eligible to participate in the Alternative Retirement Plan (ARP) offered by STRS Ohio and OPERS. The board has established the employer contribution as an amount equal to the amount which the University would have contributed to the respective state retirement system in which the employee would participate, less any amounts required to be remitted to the state retirement systems. ARP does not provide disability benefits, annual cost-of-living adjustments, postretirement health care benefits, or death benefits to plan members and beneficiaries. The payroll for employees electing the alternative retirement program for the year ended June 30, 2018 was approximately $73,665. Combined plans: STRS Ohio offers a combined plan with features of both a defined contribution plan and a defined benefit plan. In the combined plan, employee contributions are invested in self-directed investments, and the employer contribution is used to fund a reduced defined benefit. Employees electing the combined plan receive postretirement health care benefits. OPERS also offers a combined plan. This is a cost-sharing, multiple-employer defined benefit plan that has elements of both a defined benefit and defined contribution plan. In the combined plan, employee contributions are invested in self-directed investments, and the employer contribution is used to fund a reduced defined benefit. OPERS also provides retirement, disability, survivor, and postretirement health care benefits to qualified members. The portion of employer contributions to OPERS allocated to health care for members in the Combined Plan was 1.0 percent from January 1, 2017 through December 31, 2017 and decreased to 0.0 percent effective January 1, 2018 (Note 9). Retirement plan funding: The Ohio Revised Code provides statutory authority for employee and employer contributions. The University's contributions each year are equal to its required contributions. University contributions for the current and two preceding years are summarized below.
AlternativeSTRS Ohio OPERS Programs
2018 10,397 $ 13,654 $ 7,385 $ 2017 10,064 13,181 7,743 2016 9,516 12,678 7,387
Employer Contribution
Note 9. Postemployment Benefits Other Than Pensions (OPEB)
For the year ended June 30, 2018, Miami University implemented the provisions of GASB’s Statement No. 75, Accounting and Financial Reporting for Postemployment Benefits Other Than Pensions. Among other changes, this Statement was issued to improve accounting and financial reporting by governments for postemployment benefits other than pensions. As a result of implementing this Statement, Miami University was required to restate, net position as of July 1, 2017. The effect of the restatement on net position is as follows: Net position as previously reported, June 30 1,100,194 $
Adjustment for net OPEB liability and deferred outflows of resources (108,414) Net position as restated, June 30 991,780 $
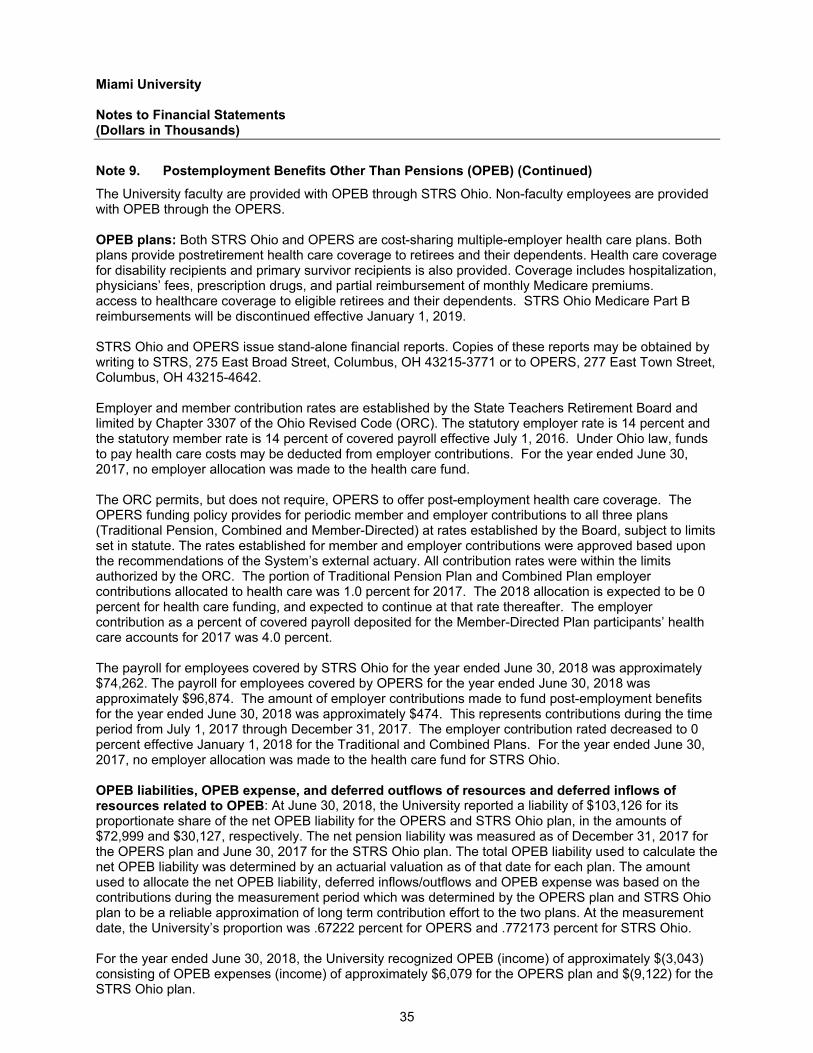
Miami University Notes to Financial Statements (Dollars in Thousands)
35
Note 9. Postemployment Benefits Other Than Pensions (OPEB) (Continued)
The University faculty are provided with OPEB through STRS Ohio. Non-faculty employees are provided with OPEB through the OPERS. OPEB plans: Both STRS Ohio and OPERS are cost-sharing multiple-employer health care plans. Both plans provide postretirement health care coverage to retirees and their dependents. Health care coverage for disability recipients and primary survivor recipients is also provided. Coverage includes hospitalization, physicians’ fees, prescription drugs, and partial reimbursement of monthly Medicare premiums. access to healthcare coverage to eligible retirees and their dependents. STRS Ohio Medicare Part B reimbursements will be discontinued effective January 1, 2019. STRS Ohio and OPERS issue stand-alone financial reports. Copies of these reports may be obtained by writing to STRS, 275 East Broad Street, Columbus, OH 43215-3771 or to OPERS, 277 East Town Street, Columbus, OH 43215-4642. Employer and member contribution rates are established by the State Teachers Retirement Board and limited by Chapter 3307 of the Ohio Revised Code (ORC). The statutory employer rate is 14 percent and the statutory member rate is 14 percent of covered payroll effective July 1, 2016. Under Ohio law, funds to pay health care costs may be deducted from employer contributions. For the year ended June 30, 2017, no employer allocation was made to the health care fund. The ORC permits, but does not require, OPERS to offer post-employment health care coverage. The OPERS funding policy provides for periodic member and employer contributions to all three plans (Traditional Pension, Combined and Member-Directed) at rates established by the Board, subject to limits set in statute. The rates established for member and employer contributions were approved based upon the recommendations of the System’s external actuary. All contribution rates were within the limits authorized by the ORC. The portion of Traditional Pension Plan and Combined Plan employer contributions allocated to health care was 1.0 percent for 2017. The 2018 allocation is expected to be 0 percent for health care funding, and expected to continue at that rate thereafter. The employer contribution as a percent of covered payroll deposited for the Member-Directed Plan participants’ health care accounts for 2017 was 4.0 percent. The payroll for employees covered by STRS Ohio for the year ended June 30, 2018 was approximately $74,262. The payroll for employees covered by OPERS for the year ended June 30, 2018 was approximately $96,874. The amount of employer contributions made to fund post-employment benefits for the year ended June 30, 2018 was approximately $474. This represents contributions during the time period from July 1, 2017 through December 31, 2017. The employer contribution rated decreased to 0 percent effective January 1, 2018 for the Traditional and Combined Plans. For the year ended June 30, 2017, no employer allocation was made to the health care fund for STRS Ohio. OPEB liabilities, OPEB expense, and deferred outflows of resources and deferred inflows of resources related to OPEB: At June 30, 2018, the University reported a liability of $103,126 for its proportionate share of the net OPEB liability for the OPERS and STRS Ohio plan, in the amounts of $72,999 and $30,127, respectively. The net pension liability was measured as of December 31, 2017 for the OPERS plan and June 30, 2017 for the STRS Ohio plan. The total OPEB liability used to calculate the net OPEB liability was determined by an actuarial valuation as of that date for each plan. The amount used to allocate the net OPEB liability, deferred inflows/outflows and OPEB expense was based on the contributions during the measurement period which was determined by the OPERS plan and STRS Ohio plan to be a reliable approximation of long term contribution effort to the two plans. At the measurement date, the University’s proportion was .67222 percent for OPERS and .772173 percent for STRS Ohio. For the year ended June 30, 2018, the University recognized OPEB (income) of approximately $(3,043) consisting of OPEB expenses (income) of approximately $6,079 for the OPERS plan and $(9,122) for the STRS Ohio plan.
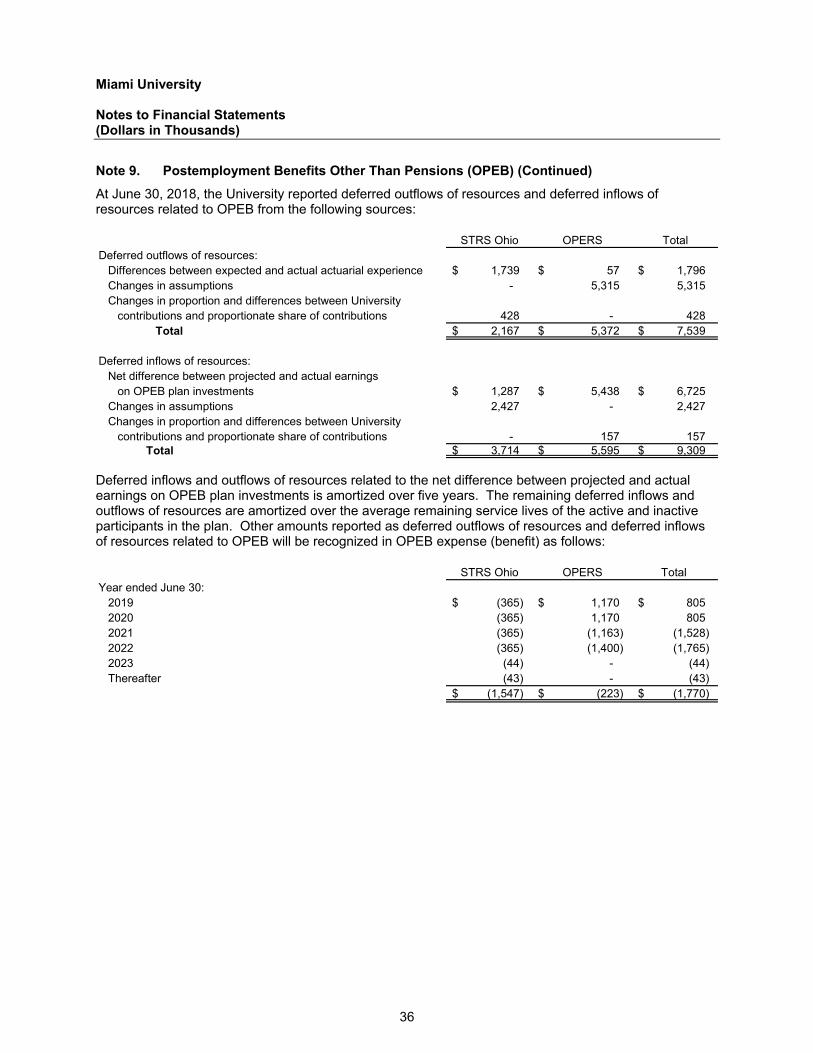
Miami University Notes to Financial Statements (Dollars in Thousands)
36
Note 9. Postemployment Benefits Other Than Pensions (OPEB) (Continued)
At June 30, 2018, the University reported deferred outflows of resources and deferred inflows of resources related to OPEB from the following sources:
STRS Ohio OPERS TotalDeferred outflows of resources:
Differences between expected and actual actuarial experience 1,739 $ 57 $ 1,796 $ Changes in assumptions - 5,315 5,315 Changes in proportion and differences between University
contributions and proportionate share of contributions 428 - 428 Total 2,167 $ 5,372 $ 7,539 $
Deferred inflows of resources:Net difference between projected and actual earnings
on OPEB plan investments 1,287 $ 5,438 $ 6,725 $ Changes in assumptions 2,427 - 2,427 Changes in proportion and differences between University
contributions and proportionate share of contributions - 157 157 Total 3,714 $ 5,595 $ 9,309 $
Deferred inflows and outflows of resources related to the net difference between projected and actual earnings on OPEB plan investments is amortized over five years. The remaining deferred inflows and outflows of resources are amortized over the average remaining service lives of the active and inactive participants in the plan. Other amounts reported as deferred outflows of resources and deferred inflows of resources related to OPEB will be recognized in OPEB expense (benefit) as follows:
STRS Ohio OPERS Total Year ended June 30:
2019 (365) $ 1,170 $ 805 $ 2020 (365) 1,170 805 2021 (365) (1,163) (1,528) 2022 (365) (1,400) (1,765) 2023 (44) - (44) Thereafter (43) - (43)
(1,547) $ (223) $ (1,770) $
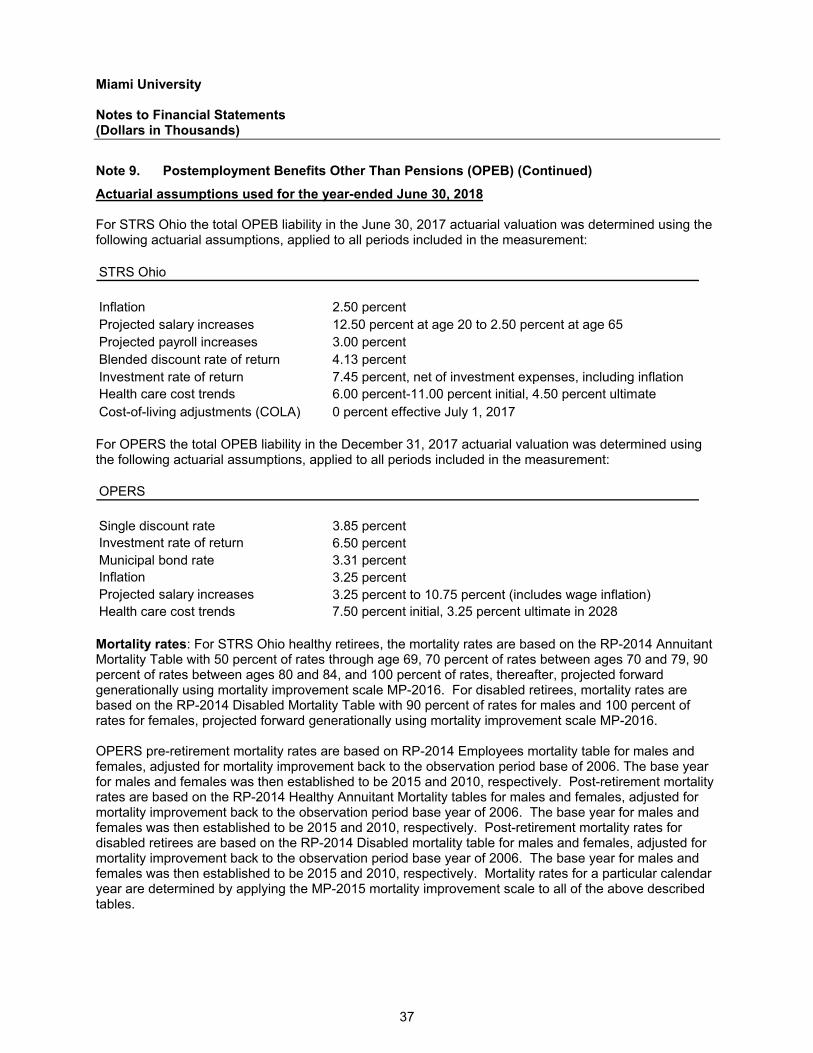
Miami University Notes to Financial Statements (Dollars in Thousands)
37
Note 9. Postemployment Benefits Other Than Pensions (OPEB) (Continued)
Actuarial assumptions used for the year-ended June 30, 2018 For STRS Ohio the total OPEB liability in the June 30, 2017 actuarial valuation was determined using the following actuarial assumptions, applied to all periods included in the measurement:
STRS Ohio
Inflation 2.50 percentProjected salary increases 12.50 percent at age 20 to 2.50 percent at age 65 Projected payroll increases 3.00 percent Blended discount rate of return 4.13 percentInvestment rate of return 7.45 percent, net of investment expenses, including inflationHealth care cost trends 6.00 percent-11.00 percent initial, 4.50 percent ultimateCost-of-living adjustments (COLA) 0 percent effective July 1, 2017
For OPERS the total OPEB liability in the December 31, 2017 actuarial valuation was determined using the following actuarial assumptions, applied to all periods included in the measurement:
OPERS
Single discount rate 3.85 percentInvestment rate of return 6.50 percentMunicipal bond rate 3.31 percentInflation 3.25 percentProjected salary increases 3.25 percent to 10.75 percent (includes wage inflation)Health care cost trends 7.50 percent initial, 3.25 percent ultimate in 2028 Mortality rates: For STRS Ohio healthy retirees, the mortality rates are based on the RP-2014 Annuitant Mortality Table with 50 percent of rates through age 69, 70 percent of rates between ages 70 and 79, 90 percent of rates between ages 80 and 84, and 100 percent of rates, thereafter, projected forward generationally using mortality improvement scale MP-2016. For disabled retirees, mortality rates are based on the RP-2014 Disabled Mortality Table with 90 percent of rates for males and 100 percent of rates for females, projected forward generationally using mortality improvement scale MP-2016. OPERS pre-retirement mortality rates are based on RP-2014 Employees mortality table for males and females, adjusted for mortality improvement back to the observation period base of 2006. The base year for males and females was then established to be 2015 and 2010, respectively. Post-retirement mortality rates are based on the RP-2014 Healthy Annuitant Mortality tables for males and females, adjusted for mortality improvement back to the observation period base year of 2006. The base year for males and females was then established to be 2015 and 2010, respectively. Post-retirement mortality rates for disabled retirees are based on the RP-2014 Disabled mortality table for males and females, adjusted for mortality improvement back to the observation period base year of 2006. The base year for males and females was then established to be 2015 and 2010, respectively. Mortality rates for a particular calendar year are determined by applying the MP-2015 mortality improvement scale to all of the above described tables.
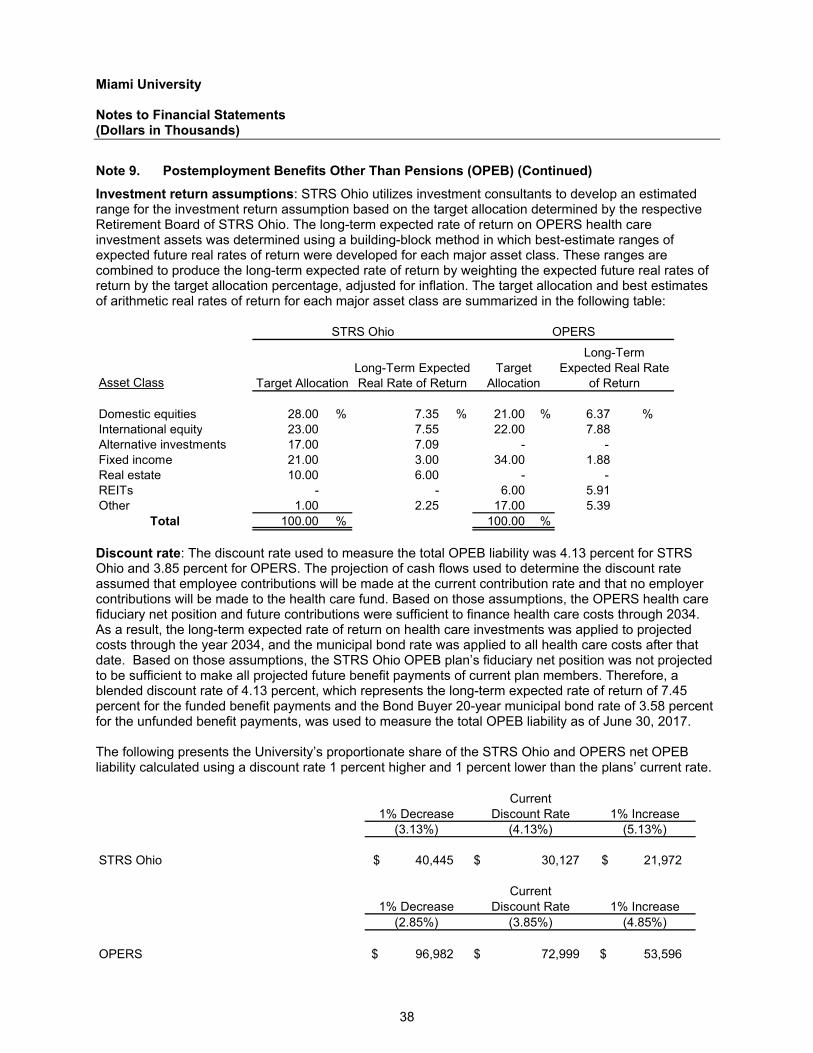
Miami University Notes to Financial Statements (Dollars in Thousands)
38
Note 9. Postemployment Benefits Other Than Pensions (OPEB) (Continued)
Investment return assumptions: STRS Ohio utilizes investment consultants to develop an estimated range for the investment return assumption based on the target allocation determined by the respective Retirement Board of STRS Ohio. The long-term expected rate of return on OPERS health care investment assets was determined using a building-block method in which best-estimate ranges of expected future real rates of return were developed for each major asset class. These ranges are combined to produce the long-term expected rate of return by weighting the expected future real rates of return by the target allocation percentage, adjusted for inflation. The target allocation and best estimates of arithmetic real rates of return for each major asset class are summarized in the following table:
Asset Class
Domestic equities 28.00 % 7.35 % 21.00 % 6.37 % International equity 23.00 7.55 22.00 7.88 Alternative investments 17.00 7.09 - - Fixed income 21.00 3.00 34.00 1.88 Real estate 10.00 6.00 - - REITs - - 6.00 5.91 Other 1.00 2.25 17.00 5.39
Total 100.00 % 100.00 %
STRS Ohio OPERS
Target AllocationLong-Term Expected Real Rate of Return
Target Allocation
Long-Term Expected Real Rate
of Return
Discount rate: The discount rate used to measure the total OPEB liability was 4.13 percent for STRS Ohio and 3.85 percent for OPERS. The projection of cash flows used to determine the discount rate assumed that employee contributions will be made at the current contribution rate and that no employer contributions will be made to the health care fund. Based on those assumptions, the OPERS health care fiduciary net position and future contributions were sufficient to finance health care costs through 2034. As a result, the long-term expected rate of return on health care investments was applied to projected costs through the year 2034, and the municipal bond rate was applied to all health care costs after that date. Based on those assumptions, the STRS Ohio OPEB plan’s fiduciary net position was not projected to be sufficient to make all projected future benefit payments of current plan members. Therefore, a blended discount rate of 4.13 percent, which represents the long-term expected rate of return of 7.45 percent for the funded benefit payments and the Bond Buyer 20-year municipal bond rate of 3.58 percent for the unfunded benefit payments, was used to measure the total OPEB liability as of June 30, 2017. The following presents the University’s proportionate share of the STRS Ohio and OPERS net OPEB liability calculated using a discount rate 1 percent higher and 1 percent lower than the plans’ current rate.
Current1% Decrease Discount Rate 1% Increase
(3.13%) (4.13%) (5.13%)
STRS Ohio 40,445 $ 30,127 $ 21,972 $
Current1% Decrease Discount Rate 1% Increase
(2.85%) (3.85%) (4.85%)
OPERS 96,982 $ 72,999 $ 53,596 $
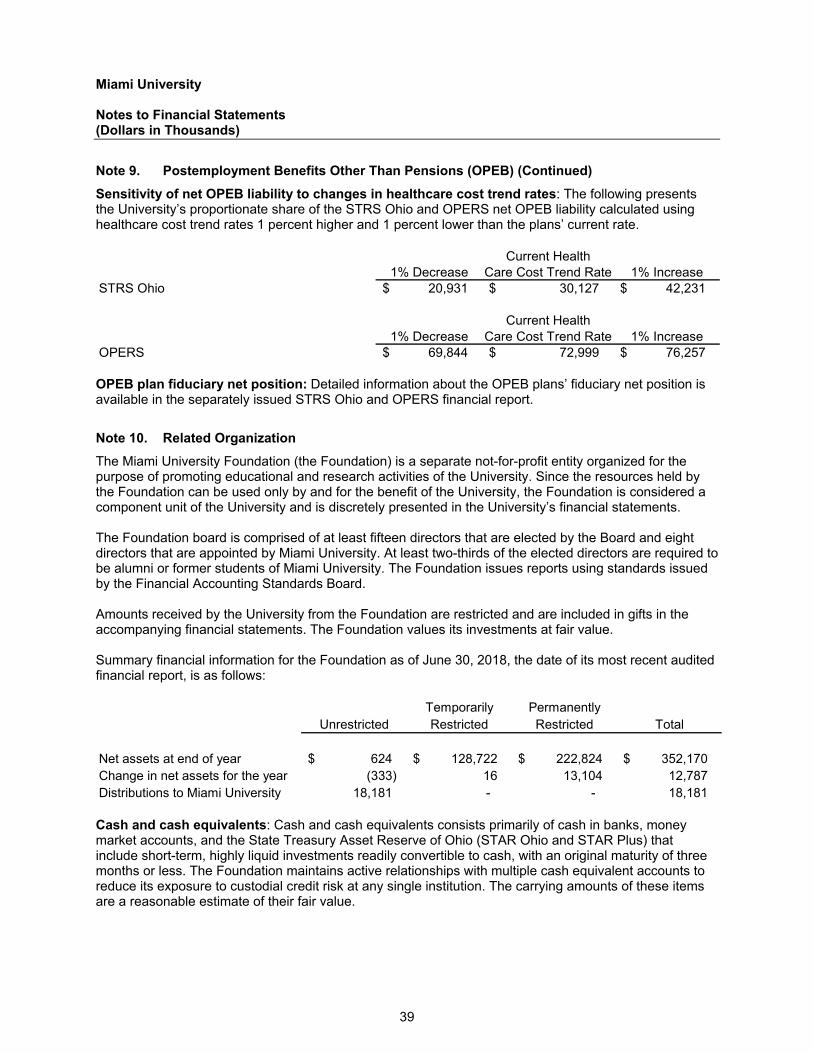
Miami University Notes to Financial Statements (Dollars in Thousands)
39
Note 9. Postemployment Benefits Other Than Pensions (OPEB) (Continued)
Sensitivity of net OPEB liability to changes in healthcare cost trend rates: The following presents the University’s proportionate share of the STRS Ohio and OPERS net OPEB liability calculated using healthcare cost trend rates 1 percent higher and 1 percent lower than the plans’ current rate.
Current Health1% Decrease Care Cost Trend Rate 1% Increase
STRS Ohio 20,931 $ 30,127 $ 42,231 $
Current Health1% Decrease Care Cost Trend Rate 1% Increase
OPERS 69,844 $ 72,999 $ 76,257 $ OPEB plan fiduciary net position: Detailed information about the OPEB plans’ fiduciary net position is available in the separately issued STRS Ohio and OPERS financial report.
Note 10. Related Organization
The Miami University Foundation (the Foundation) is a separate not-for-profit entity organized for the purpose of promoting educational and research activities of the University. Since the resources held by the Foundation can be used only by and for the benefit of the University, the Foundation is considered a component unit of the University and is discretely presented in the University’s financial statements. The Foundation board is comprised of at least fifteen directors that are elected by the Board and eight directors that are appointed by Miami University. At least two-thirds of the elected directors are required to be alumni or former students of Miami University. The Foundation issues reports using standards issued by the Financial Accounting Standards Board. Amounts received by the University from the Foundation are restricted and are included in gifts in the accompanying financial statements. The Foundation values its investments at fair value. Summary financial information for the Foundation as of June 30, 2018, the date of its most recent audited financial report, is as follows:
Temporarily PermanentlyUnrestricted Restricted Restricted Total
Net assets at end of year 624 $ 128,722 $ 222,824 $ 352,170 $ Change in net assets for the year (333) 16 13,104 12,787 Distributions to Miami University 18,181 - - 18,181 Cash and cash equivalents: Cash and cash equivalents consists primarily of cash in banks, money market accounts, and the State Treasury Asset Reserve of Ohio (STAR Ohio and STAR Plus) that include short-term, highly liquid investments readily convertible to cash, with an original maturity of three months or less. The Foundation maintains active relationships with multiple cash equivalent accounts to reduce its exposure to custodial credit risk at any single institution. The carrying amounts of these items are a reasonable estimate of their fair value.
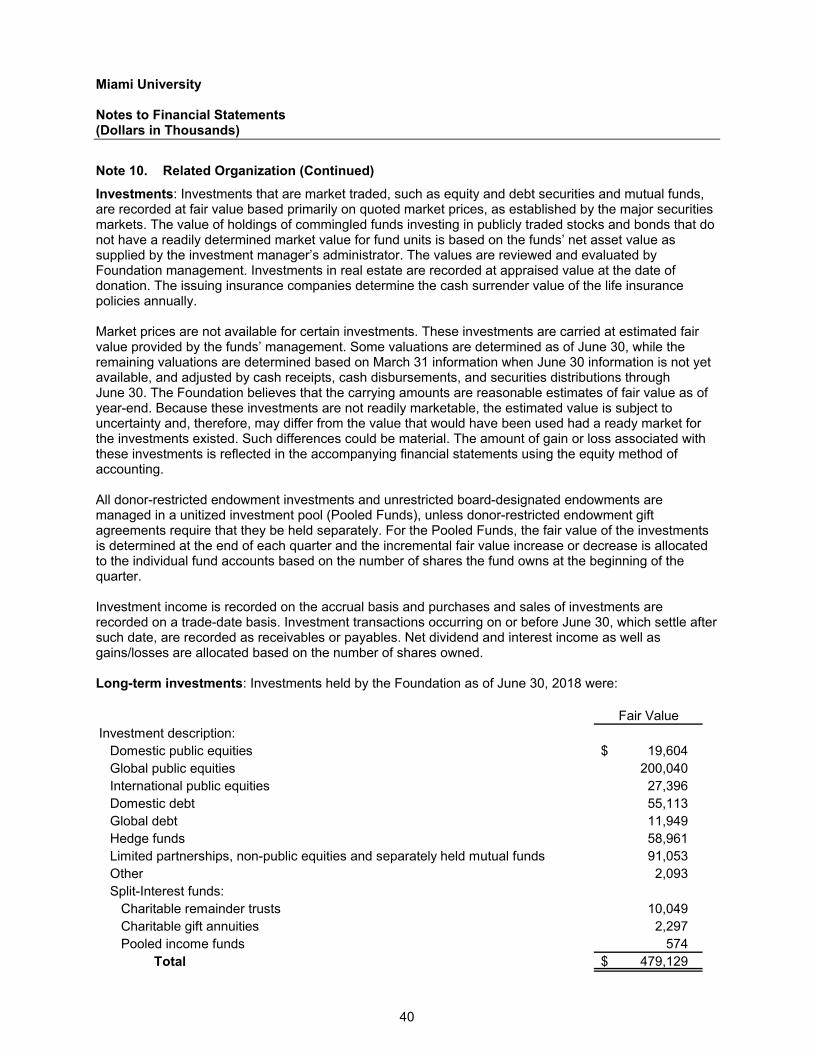
Miami University Notes to Financial Statements (Dollars in Thousands)
40
Note 10. Related Organization (Continued)
Investments: Investments that are market traded, such as equity and debt securities and mutual funds, are recorded at fair value based primarily on quoted market prices, as established by the major securities markets. The value of holdings of commingled funds investing in publicly traded stocks and bonds that do not have a readily determined market value for fund units is based on the funds’ net asset value as supplied by the investment manager’s administrator. The values are reviewed and evaluated by Foundation management. Investments in real estate are recorded at appraised value at the date of donation. The issuing insurance companies determine the cash surrender value of the life insurance policies annually. Market prices are not available for certain investments. These investments are carried at estimated fair value provided by the funds’ management. Some valuations are determined as of June 30, while the remaining valuations are determined based on March 31 information when June 30 information is not yet available, and adjusted by cash receipts, cash disbursements, and securities distributions through June 30. The Foundation believes that the carrying amounts are reasonable estimates of fair value as of year-end. Because these investments are not readily marketable, the estimated value is subject to uncertainty and, therefore, may differ from the value that would have been used had a ready market for the investments existed. Such differences could be material. The amount of gain or loss associated with these investments is reflected in the accompanying financial statements using the equity method of accounting. All donor-restricted endowment investments and unrestricted board-designated endowments are managed in a unitized investment pool (Pooled Funds), unless donor-restricted endowment gift agreements require that they be held separately. For the Pooled Funds, the fair value of the investments is determined at the end of each quarter and the incremental fair value increase or decrease is allocated to the individual fund accounts based on the number of shares the fund owns at the beginning of the quarter. Investment income is recorded on the accrual basis and purchases and sales of investments are recorded on a trade-date basis. Investment transactions occurring on or before June 30, which settle after such date, are recorded as receivables or payables. Net dividend and interest income as well as gains/losses are allocated based on the number of shares owned. Long-term investments: Investments held by the Foundation as of June 30, 2018 were:
Fair ValueInvestment description:
Domestic public equities 19,604 $ Global public equities 200,040 International public equities 27,396 Domestic debt 55,113 Global debt 11,949 Hedge funds 58,961 Limited partnerships, non-public equities and separately held mutual funds 91,053 Other 2,093 Split-Interest funds:
Charitable remainder trusts 10,049 Charitable gift annuities 2,297 Pooled income funds 574
Total 479,129 $
Miami University Notes to Financial Statements (Dollars in Thousands)
41
Note 10. Related Organization (Continued)
The Foundation maintains a diversified investment portfolio for the Pooled Funds, intended to reduce market risk, credit risk, and interest rate risk with a strategy designed to take advantage of market inefficiencies. The Foundation’s investment objectives are guided by its asset allocation policy and are achieved in partnership with external investment managers operating through a variety of investment vehicles including separate accounts, limited partnerships, and commingled funds. The Foundation's investment portfolio includes publicly traded securities. As a result, a significant downturn in the securities markets could adversely affect the market value of Foundation assets. As of June 30, 2018, the Foundation has made commitments to limited partnerships of approximately $54,000, that have not yet been funded, some of which management expects may not be called by the partnerships due to the life-cycle of the respective partnerships. The 2018 dividend and interest income of $4,445, is net of fees from external investment managers totaling $284 for June 30, 2018. Fair value measurements: The Foundation uses fair value measurements to record fair value adjustments to certain assets and liabilities and to determine fair value disclosures. Subsequent changes in fair value are recorded as an adjustment to earnings. Pledges receivable: As of June 30, 2018, contributors to the Foundation have made unconditional pledges totaling $34,372 with one pledge accounting for over 47 percent of that total. Net pledges receivable have been discounted using rates commensurate with the risks involved to a net present value of $32,984 at June 30, 2018. Discount rates ranged from 1.20 percent to 3.40 percent. Management has set up an allowance for uncollectible pledges of $1,725 at June 30, 2018. All pledges have been classified as temporarily restricted net assets since they will either expire or be fulfilled within a specified time or donor imposed stipulations. The Foundation had also been notified of revocable pledges, bequests, and other indications of intentions to give. These potential contributions are not permitted to be recorded as they are deemed intentions to give and not promises to give. Split-interest agreements: The Foundation’s split-interest agreements with donors consist primarily of charitable gift annuities, pooled income funds and irrevocable charitable remainder trusts for which the Foundation serves as trustee. Assets are invested and payments are made to donors and/or other beneficiaries in accordance with the respective agreements. Assets held for these agreements are included in investments.
Endowment: UPMIFA provides statutory guidelines for prudent management, investment, and expenditure of donor-restricted endowment funds held by charitable organizations.
The Foundation’s interpretation of its fiduciary responsibilities for donor-restricted endowments under UPMIFA requirements, barring the existence of any donor-specific provisions, is to preserve intergenerational equity to the extent possible and to produce maximum total return without assuming inappropriate risks. The investment policies governing these funds look beyond short-term fluctuations in economic cycles toward an investment philosophy that provides the best total return over very long time periods.
UPMIFA specifies that unless stated otherwise in the gift agreement, donor-restricted assets in an endowment fund are restricted assets until appropriated for expenditure by the institution. Barring the existence of specific donor instruction, the Foundation’s policy is to report (a) the historical value for such endowment as permanently restricted net assets and (b) the net accumulated appreciation as temporarily restricted net assets. In this context, historical value represents (a) the original value of initial gifts restricted as permanent endowments plus (b) the original value of subsequent gifts along with (c) if applicable, the value of accumulations made in accordance with specific donor instruction.
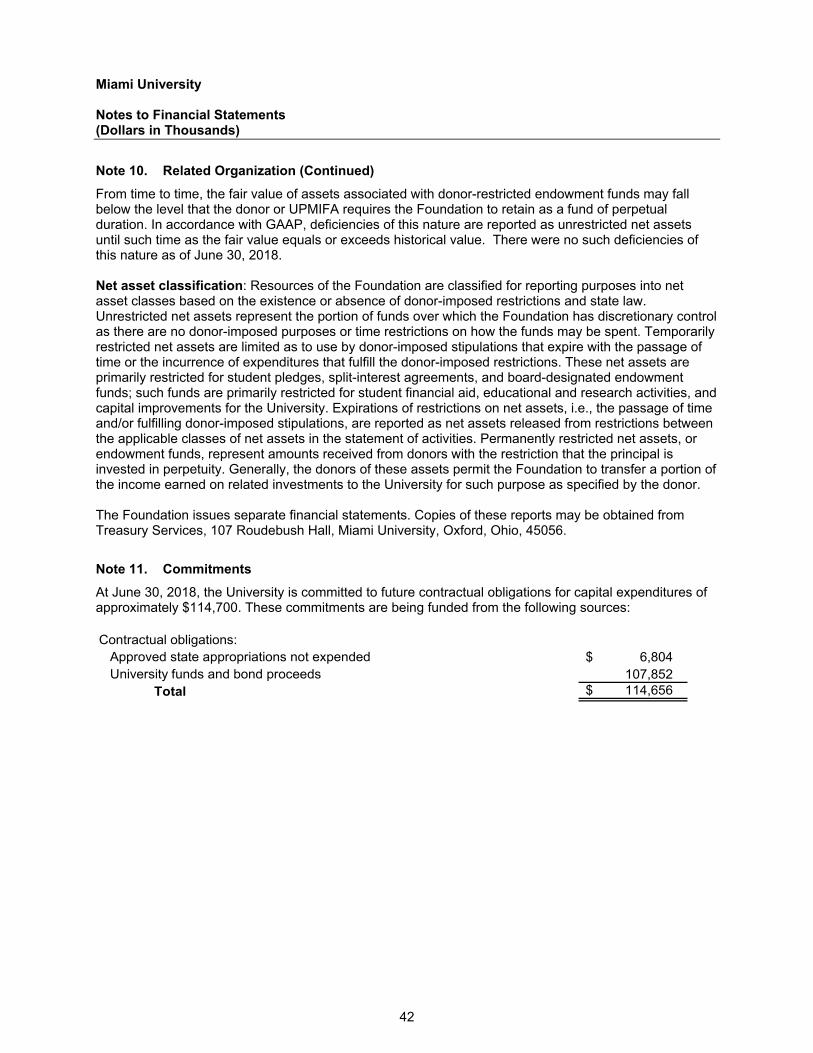
Miami University Notes to Financial Statements (Dollars in Thousands)
42
Note 10. Related Organization (Continued)
From time to time, the fair value of assets associated with donor-restricted endowment funds may fall below the level that the donor or UPMIFA requires the Foundation to retain as a fund of perpetual duration. In accordance with GAAP, deficiencies of this nature are reported as unrestricted net assets until such time as the fair value equals or exceeds historical value. There were no such deficiencies of this nature as of June 30, 2018. Net asset classification: Resources of the Foundation are classified for reporting purposes into net asset classes based on the existence or absence of donor-imposed restrictions and state law. Unrestricted net assets represent the portion of funds over which the Foundation has discretionary control as there are no donor-imposed purposes or time restrictions on how the funds may be spent. Temporarily restricted net assets are limited as to use by donor-imposed stipulations that expire with the passage of time or the incurrence of expenditures that fulfill the donor-imposed restrictions. These net assets are primarily restricted for student pledges, split-interest agreements, and board-designated endowment funds; such funds are primarily restricted for student financial aid, educational and research activities, and capital improvements for the University. Expirations of restrictions on net assets, i.e., the passage of time and/or fulfilling donor-imposed stipulations, are reported as net assets released from restrictions between the applicable classes of net assets in the statement of activities. Permanently restricted net assets, or endowment funds, represent amounts received from donors with the restriction that the principal is invested in perpetuity. Generally, the donors of these assets permit the Foundation to transfer a portion of the income earned on related investments to the University for such purpose as specified by the donor.
The Foundation issues separate financial statements. Copies of these reports may be obtained from Treasury Services, 107 Roudebush Hall, Miami University, Oxford, Ohio, 45056.
Note 11. Commitments
At June 30, 2018, the University is committed to future contractual obligations for capital expenditures of approximately $114,700. These commitments are being funded from the following sources: Contractual obligations:
Approved state appropriations not expended 6,804 $ University funds and bond proceeds 107,852
Total 114,656 $

Miami University Notes to Financial Statements (Dollars in Thousands)
43
Note 12. Risk Management
The University’s employee health insurance program is a self-insured plan. Administration of the plan is provided by United Medical Resources, a United Healthcare company. Employees are offered two plan options, a Traditional PPO Plan or a High Deductible Health Plan with a Health Savings Account. Health insurance claims are accrued based upon estimates of the claims liabilities. These estimates are based on past experience, current claims outstanding, and medical inflation trends. As a result, the actual claims experience may differ from the estimate. An estimate of claims incurred but not reported in the amount of $2,512 is included in the accrued salaries and wages as of June 30, 2018. The change in the total liability for actual and estimated claims is summarized below at June 30:
2018 2017
Liability at beginning of year 2,369 $ 2,888 $ Claims incurred 38,441 33,175 Claims paid (38,352) (33,186) Change in estimated claims incurred but not reported 512 (508)
Liability at end of year 2,970 $ 2,369 $
To reduce potential loss exposure, the University has established a reserve for health insurance stabilization of $15.0 million. The University participates in a consortium with all other Ohio state-assisted universities (excluding The Ohio State University) for the acquisition of commercial property and liability insurance. The name of the consortium is the IUC-Risk Management & Insurance Consortium. The commercial property program’s loss limit is $1.75 billion and the general/auto liability loss limit is $50 million. The property insurance program has been in place for 23 years during which time Miami University has had two material losses above the insurance policy deductible of $350,000. The property pool deductible for individual universities is $100,000. The liability program has been in place for 18 years during which time Miami University has had three losses above the pool deductible. The current self-insured retention for the liability program is $1 million. The educator’s legal liability loss limit is $50 million. The University also participates with the other consortium universities for the purchase of commercial insurance for other risks. The State of Ohio self-insures worker’s compensation benefits for all state employees, including University employees. Under the direction of the Ohio Bureau of Worker’s Compensation and the University, Careworks and Sheakley UniComp, Inc. assist in the administration and disposition of worker’s compensation claims.
Note 13. Contingencies
The University receives grants and contracts from certain federal, state, and local agencies to fund research and other activities. The costs, both direct and indirect, that have been charged to the grants or contracts are subject to examination and approval by the granting agency. It is the opinion of the University's administration that any disallowance or adjustment of such costs would not have a material effect on the financial statements. The University is presently involved as a defendant or codefendant in various matters of litigation. The University's administration believes that the ultimate disposition of any of these matters would not have a material adverse effect upon the financial condition of the University.

Supplementary Information

44
Miami University
Retirement Plan DataYears Ended June 30, 2018, 2017, 2016 and 2015(In Thousands)
STRS OPERS OPERS
For the Year Ended June 30, 2018 Ohio Traditional Combined
University's proportion of the net pension liability (asset) 0.772173% 0.663383% 0.684872%
University's proportionate share of the net pension liability (asset)183,431 $ 104,072 $ (932) $
University's covered-employee payroll 74,262 89,066 2,774
University's proportionate share of the net pension liability (asset) as a percentage of its covered-employee payroll
247.01% 116.85% -33.60%
Plan fiduciary net position as a percentage of the total pension liability 75.30% 84.66% 137.28%
For the Year Ended June 30, 2017
University's proportion of the net pension liability (asset) 0.762848% 0.664940% 0.665441%
University's proportionate share of the net pension liability (asset)255,348 $ 150,997 $ (370) $
University's covered-employee payroll 71,889 86,004 2,679
University's proportionate share of the net pension liability (asset) as a percentage of its covered-employee payroll
355.20% 175.57% -13.81%
Plan fiduciary net position as a percentage of the total pension liability 66.80% 77.25% 116.55%
For the Year Ended June 30, 2016
University's proportion of the net pension liability (asset) 0.750872% 0.651198% 0.664254%
University's proportionate share of the net pension liability (asset)207,519 $ 112,796 $ (323) $
University's covered-employee payroll 67,969 83,037 2,475
University's proportionate share of the net pension liability (asset) as a percentage of its covered-employee payroll 305.31% 135.84% -13.05%
Plan fiduciary net position as a percentage of the total pension liability 72.10% 81.08% 116.90%
For the Year Ended June 30, 2015
University's proportion of the net pension liability (asset) 0.718940% 0.662272% 0.650661%
University's proportionate share of the net pension liability (asset)174,871 $ 79,877 $ (251) $
University's covered-employee payroll 67,064 80,131 2,327
University's proportionate share of the net pension liability (asset) as a percentage of its covered-employee payroll 260.75% 99.68% -10.79%
Plan fiduciary net position as a percentage of the total pension liability 74.70% 86.45% 114.83%
Note: The University has presented as many years as information is available.
(Continued)
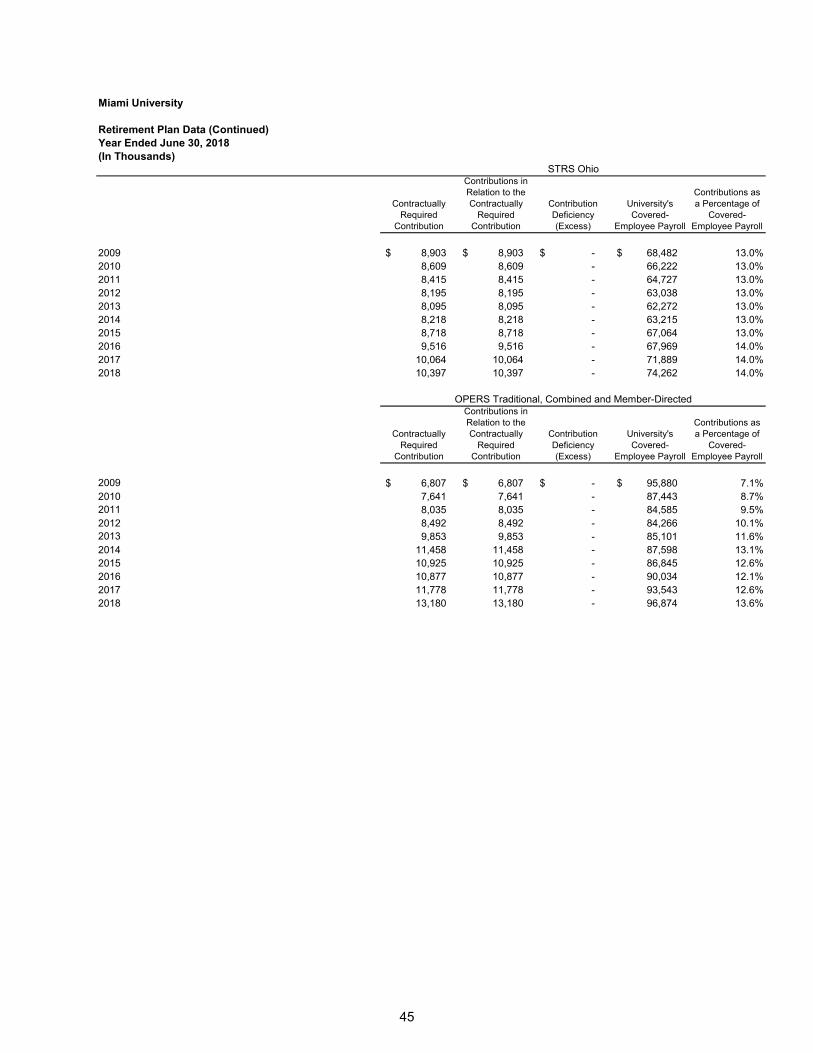
45
Miami University
Retirement Plan Data (Continued)Year Ended June 30, 2018(In Thousands)
Contractually Required
Contribution
Contributions in Relation to the Contractually
Required Contribution
Contribution Deficiency (Excess)
University's Covered-
Employee Payroll
Contributions as a Percentage of
Covered-Employee Payroll
2009 8,903 $ 8,903 $ -$ 68,482 $ 13.0%2010 8,609 8,609 - 66,222 13.0%2011 8,415 8,415 - 64,727 13.0%2012 8,195 8,195 - 63,038 13.0%2013 8,095 8,095 - 62,272 13.0%2014 8,218 8,218 - 63,215 13.0%2015 8,718 8,718 - 67,064 13.0%2016 9,516 9,516 - 67,969 14.0%2017 10,064 10,064 - 71,889 14.0%2018 10,397 10,397 - 74,262 14.0%
Contractually Required
Contribution
Contributions in Relation to the Contractually
Required Contribution
Contribution Deficiency (Excess)
University's Covered-
Employee Payroll
Contributions as a Percentage of
Covered-Employee Payroll
2009 6,807 $ 6,807 $ -$ 95,880 $ 7.1%2010 7,641 7,641 - 87,443 8.7%2011 8,035 8,035 - 84,585 9.5%2012 8,492 8,492 - 84,266 10.1%2013 9,853 9,853 - 85,101 11.6%2014 11,458 11,458 - 87,598 13.1%2015 10,925 10,925 - 86,845 12.6%2016 10,877 10,877 - 90,034 12.1%2017 11,778 11,778 - 93,543 12.6%2018 13,180 13,180 - 96,874 13.6%
STRS Ohio
OPERS Traditional, Combined and Member-Directed
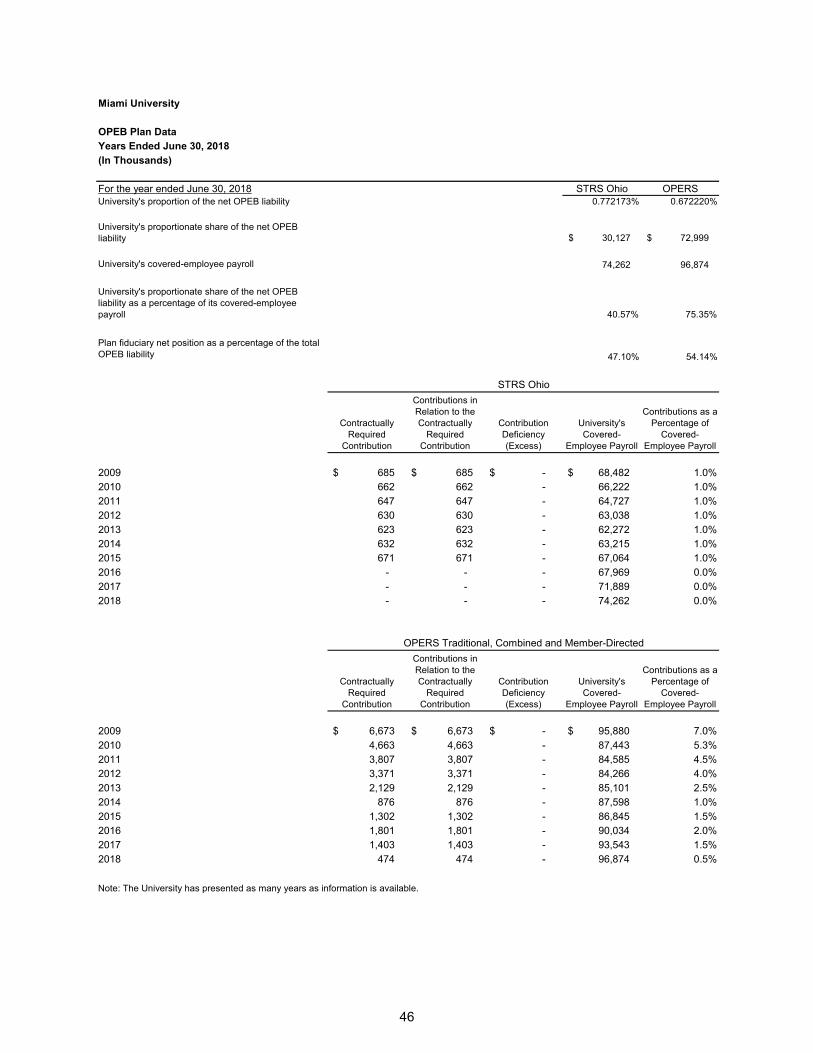
46
Miami University
OPEB Plan DataYears Ended June 30, 2018
(In Thousands)
For the year ended June 30, 2018 STRS Ohio OPERSUniversity's proportion of the net OPEB liability 0.772173% 0.672220%
University's proportionate share of the net OPEB liability 30,127 $ 72,999 $
University's covered-employee payroll 74,262 96,874
University's proportionate share of the net OPEB liability as a percentage of its covered-employee payroll 40.57% 75.35%
Plan fiduciary net position as a percentage of the total OPEB liability 47.10% 54.14%
Contractually Required
Contribution
Contributions in Relation to the Contractually
Required Contribution
Contribution Deficiency (Excess)
University's Covered-
Employee Payroll
Contributions as a Percentage of
Covered-Employee Payroll
2009 685 $ 685 $ -$ 68,482 $ 1.0%2010 662 662 - 66,222 1.0%
2011 647 647 - 64,727 1.0%2012 630 630 - 63,038 1.0%
2013 623 623 - 62,272 1.0%2014 632 632 - 63,215 1.0%2015 671 671 - 67,064 1.0%
2016 - - - 67,969 0.0%2017 - - - 71,889 0.0%
2018 - - - 74,262 0.0%
Contractually Required
Contribution
Contributions in Relation to the Contractually
Required Contribution
Contribution Deficiency (Excess)
University's Covered-
Employee Payroll
Contributions as a Percentage of
Covered-Employee Payroll
2009 6,673 $ 6,673 $ -$ 95,880 $ 7.0%
2010 4,663 4,663 - 87,443 5.3%2011 3,807 3,807 - 84,585 4.5%2012 3,371 3,371 - 84,266 4.0%
2013 2,129 2,129 - 85,101 2.5%2014 876 876 - 87,598 1.0%
2015 1,302 1,302 - 86,845 1.5%2016 1,801 1,801 - 90,034 2.0%2017 1,403 1,403 - 93,543 1.5%
2018 474 474 - 96,874 0.5%
Note: The University has presented as many years as information is available.
STRS Ohio
OPERS Traditional, Combined and Member-Directed

Miami University Notes to Required Retirement Plan Data Year Ended June 30, 2018
47
Changes to benefit terms: Effective July 1, 2017, the Cost of Living Adjustment (COLA) was reduced to zero for STRS Ohio. Changes of assumptions: The Retirement Board of STRS Ohio approved several changes to the actuarial assumptions in 2017. The long term expected rate of return was reduced from 7.75% to 7.45%, the inflation assumption was lowered from 2.75% to 2.50%, the payroll growth assumption was lowered to 3.00%, and total salary increases rate was lowered by decreasing the merit component of the individual salary increases, in addition to a decrease of 0.25% due to lower inflation. The healthy and disabled mortality assumptions were updated to the RP-2014 mortality tables with generational improvement scale MP-2016. Rates of retirement, termination and disability were modified to better reflect anticipated future experience.

Miami University Uniform Guidance Requirements
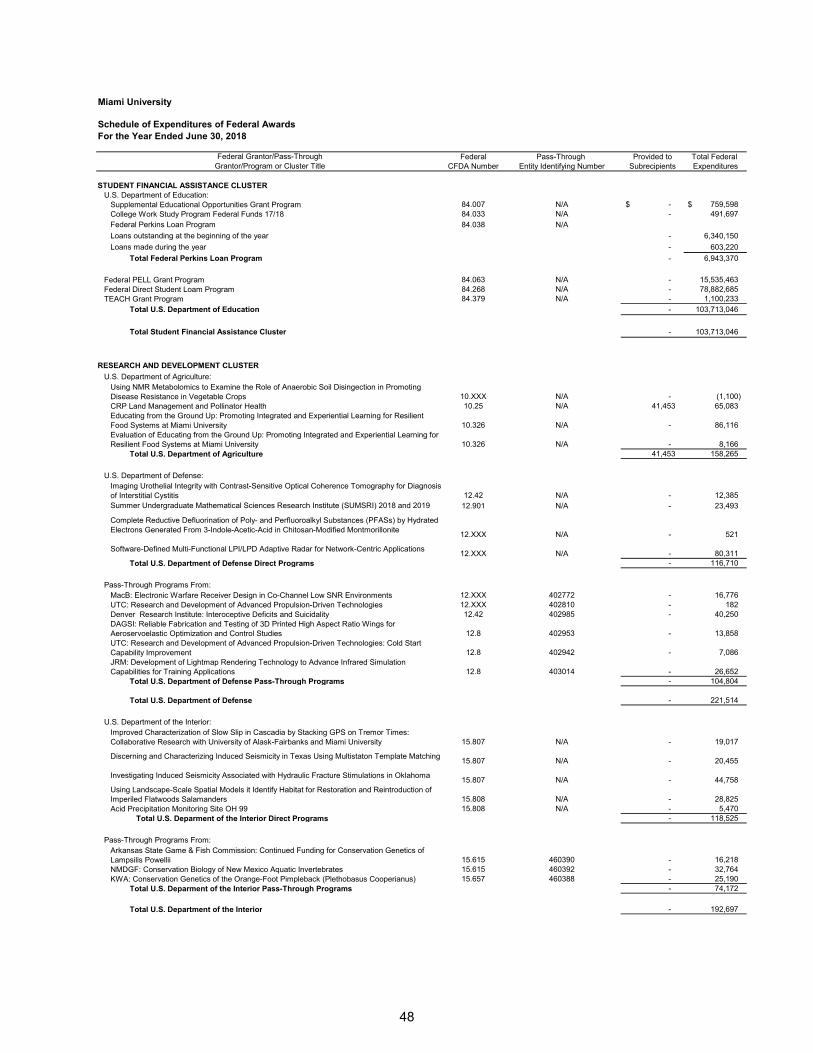
48
Miami University
Schedule of Expenditures of Federal AwardsFor the Year Ended June 30, 2018
Federal Grantor/Pass-Through Federal Pass-Through Provided to Total Federal Grantor/Program or Cluster Title CFDA Number Entity Identifying Number Subrecipients Expenditures
STUDENT FINANCIAL ASSISTANCE CLUSTERU.S. Department of Education:
Supplemental Educational Opportunities Grant Program 84.007 N/A -$ 759,598 $ College Work Study Program Federal Funds 17/18 84.033 N/A - 491,697 Federal Perkins Loan Program 84.038 N/A
Loans outstanding at the beginning of the year - 6,340,150
Loans made during the year - 603,220
Total Federal Perkins Loan Program - 6,943,370
Federal PELL Grant Program 84.063 N/A - 15,535,463 Federal Direct Student Loam Program 84.268 N/A - 78,882,685 TEACH Grant Program 84.379 N/A - 1,100,233
Total U.S. Department of Education - 103,713,046
Total Student Financial Assistance Cluster - 103,713,046
RESEARCH AND DEVELOPMENT CLUSTER
U.S. Department of Agriculture:Using NMR Metabolomics to Examine the Role of Anaerobic Soil Disingection in Promoting Disease Resistance in Vegetable Crops 10.XXX N/A - (1,100) CRP Land Management and Pollinator Health 10.25 N/A 41,453 65,083 Educating from the Ground Up: Promoting Integrated and Experiential Learning for Resilient Food Systems at Miami University 10.326 N/A - 86,116 Evaluation of Educating from the Ground Up: Promoting Integrated and Experiential Learning for Resilient Food Systems at Miami University 10.326 N/A - 8,166
Total U.S. Department of Agriculture 41,453 158,265
U.S. Department of Defense:Imaging Urothelial Integrity with Contrast-Sensitive Optical Coherence Tomography for Diagnosis of Interstitial Cystitis 12.42 N/A - 12,385 Summer Undergraduate Mathematical Sciences Research Institute (SUMSRI) 2018 and 2019 12.901 N/A - 23,493
Complete Reductive Defluorination of Poly- and Perfluoroalkyl Substances (PFASs) by Hydrated Electrons Generated From 3-Indole-Acetic-Acid in Chitosan-Modified Montmorillonite
12.XXX N/A - 521
Software-Defined Multi-Functional LPI/LPD Adaptive Radar for Network-Centric Applications12.XXX N/A - 80,311
Total U.S. Department of Defense Direct Programs - 116,710
Pass-Through Programs From:MacB: Electronic Warfare Receiver Design in Co-Channel Low SNR Environments 12.XXX 402772 - 16,776 UTC: Research and Development of Advanced Propulsion-Driven Technologies 12.XXX 402810 - 182 Denver Research Institute: Interoceptive Deficits and Suicidality 12.42 402985 - 40,250 DAGSI: Reliable Fabrication and Testing of 3D Printed High Aspect Ratio Wings for Aeroservoelastic Optimization and Control Studies 12.8 402953 - 13,858 UTC: Research and Development of Advanced Propulsion-Driven Technologies: Cold Start Capability Improvement 12.8 402942 - 7,086 JRM: Development of Lightmap Rendering Technology to Advance Infrared Simulation Capabilities for Training Applications 12.8 403014 - 26,652
Total U.S. Department of Defense Pass-Through Programs - 104,804
Total U.S. Department of Defense - 221,514
U.S. Department of the Interior:Improved Characterization of Slow Slip in Cascadia by Stacking GPS on Tremor Times: Collaborative Research with University of Alask-Fairbanks and Miami University 15.807 N/A - 19,017
Discerning and Characterizing Induced Seismicity in Texas Using Multistaton Template Matching15.807 N/A - 20,455
Investigating Induced Seismicity Associated with Hydraulic Fracture Stimulations in Oklahoma15.807 N/A - 44,758
Using Landscape-Scale Spatial Models it Identify Habitat for Restoration and Reintroduction of Imperiled Flatwoods Salamanders 15.808 N/A - 28,825 Acid Precipitation Monitoring Site OH 99 15.808 N/A - 5,470
Total U.S. Deparment of the Interior Direct Programs - 118,525
Pass-Through Programs From: Arkansas State Game & Fish Commission: Continued Funding for Conservation Genetics of Lampsilis Powellii 15.615 460390 - 16,218 NMDGF: Conservation Biology of New Mexico Aquatic Invertebrates 15.615 460392 - 32,764 KWA: Conservation Genetics of the Orange-Foot Pimpleback (Plethobasus Cooperianus) 15.657 460388 - 25,190
Total U.S. Deparment of the Interior Pass-Through Programs - 74,172
Total U.S. Department of the Interior - 192,697

49
Miami University
Schedule of Expenditures of Federal Awards (Continued)For the Year Ended June 30, 2018
Federal Grantor/Pass-Through Federal Pass-Through Provided to Total Federal Grantor/Program or Cluster Title CFDA Number Entity Identifying Number Subrecipients Expenditures
U.S. Department of Justice:
Pass-Through Programs From: NIJ: Development of a Novel Human Materials Hyperspectral Remote Sensing Tool for Forensic Investigations and Operations for US Law Enforcement 16.56 460386 -$ 142,682 $
U.S. Department of Labor:
Pass-Through Programs From: ODA: Ohio's Combined WIOA Plan: Identifying Strategies and Supports to Improve Outcomes for Older Workers Phase Three 17.235 402859 - (361)
U.S. Department of Transportation:
Pass-Through Programs From: NHTSA-ODPS FFY17 Project Completion 20.6 470630 - 43,543 NHTSA: Ohio Department of Public Safety: Telephone Survey of Sealt Belt Use, Alcohol-Impaired and Distracted Driving FFY17 20.6 470623 - 69,817 NHTSA: Ohio Department of Public Safety: FFY-17 Observation Study 20.616 470622 - 79,123
Total U.S. Department of Transportation - 192,483
National Aeronautics & Space Administration:Land-cover/Land-use Change in Southern Vietnam Through the Lenses of Conflict, Religion, and Politics, 1980s to Present 43.001 N/A - 5,580
Pass-Through Programs From: University of Houston: The Search for Nebular Heterogeneity and the Compositions of Terrestrial Planetary Materials Usign Nd, Sm and Os Isotopes 43.001 N/A - 9,531
Total National Aeronautics and Space Administration - 15,111
National Endowment for the Arts:Coral in Early American Literature, Science, and Culture 45.16 N/A - 50,399
Pass-Through Programs From: OHC: Austin-Magie Farm and Mill District Oxford, Ohio: Digital Humanities Map & Learning Resources 45.129 N/A - 3,000
Total National Endowment for the Arts - 53,399
Institute of Museum and Library Services:Building the Scholars Dashboard: Recipes for on-demand Digital Scholarship Infrastructure 45.312 N/A - 7,365
National Science Foundation: A Preliminary Investigation of a Social Cognitive Intervention in Early Courses 47.041 N/A - 88,937 Polarization Quantum Beat Spectroscopy in Diatomic Molecules 47.049 N/A - 1,182 Time-Resolved Spectroscopic Study of Diatomic Molecular Sodium 47.049 N/A - 84,412 Probing Substrate/Inhibitor to Metalloenzymes Using EPR 47.049 N/A - 105,829
REU Site: Summer Undergraduate Research in Chemistry and Biochemistry at Miami University47.049 N/A - 80,398
On Three Different Manifestations of Instability of Fronts in Parabolic and Partially Parabolic Systems 47.049 N/A - 322 Ortho-Phenylenes in Complex Foldamer Architectures 47.049 N/A - 126,913 External Problems for Sparse Hypergraphs and Graphs 47.049 N/A - 5,131 Large Cardinals and Small Sets 47.049 N/A - 34,890 Travel Support for the Thematic Program in Strong Logics 47.049 N/A - (1,710) MRI: Acquisition of a Pulsed EPR Spectrometer 47.049 N/A - 593,640 Investigating Membrane Proteins with Magnetic Resonance Spectroscopy 47.049 N/A - 441 Does Proximity of Hydraulic Fracturing and Wastewater Disposal to Basement Increase the Likelihood of Induced Seismicity in the Central and Eastern US? 47.05 N/A - 99,824 Collaborative Research: Nitrate Reduction by Redox-Modified Fe-Bearing Clay Minerals 47.05 N/A - 25,539

50
Miami University
Schedule of Expenditures of Federal Awards (Continued)For the Year Ended June 30, 2018
Federal Grantor/Pass-Through Federal Pass-Through Provided to Total Federal Grantor/Program or Cluster Title CFDA Number Entity Identifying Number Subrecipients Expenditures
Collaborative Research: The Role of Phyllosilicate Minerals in mediating the Temperature Sensitivity of Soil Organic Matter Decomposition 47.05 N/A -$ 40,740 $ Collaborative Research: ACACIA: Ancient Climate and the Authigenic Clay Index of Aridity 47.05 N/A - 4,579 Collaborative Research: Winter Survival Mechanisms and Adaptive Genetic Variation in an Antarctic Insect 47.05 N/A - 105,567 Collaborative Research: Development and Calibration of the Oxygen Isotope Systematics of Small Terrestrial Gastropods 47.05 N/A - 13,134 Collaborative Research: The Evolutionary Significance of Biotic Interactions: A Comparative Study Utilizing Echinoid Associated Traces 47.05 N/A - 40,157 Collaborative Research: Mesozoic Tethyan Paleocommunity Dynamics: Modeling Complexity and Stability During Times of Biotic Escalation and Community Restructuring 47.05 N/A - 24,660
Origin & Eruptive History of Quaternary Volcanism in Nosy Be and Itasy-Askaratra, Madagascar47.05 N/A - 82,091
Realistic Navigation in the Third Dimension Using Low Cost, Portable, Wearable Immersive Virtual Environment Systems 47.07 N/A - 62,635 REU Site: Ecology in Human-Dominated Landscapes 47.074 N/A - 108,010 Neuromodulatory Control of switching between SIngle and Dual Oscillatory Network States 47.074 N/A - 18,082 Collaborative Research: Nutrient Co-limitation in Young and Mature Hardwood Forests 47.074 N/A - (5,588) CAREER: Protein Quality Control at the Membrane 47.074 N/A - 264,831 Does a Large Detritus Pool Enhance Ecosystem Resilience in Response to an Episodic Perturbation? 47.074 N/A - 54 MRI: Acquisition of a Fluorescence Activated Cell Sorting System to Expand Synergistic Research and educational Opportunities 47.074 N/A - 253,528
Control of Lipid Metabolism and Muscle Hypertrophy by PPARs in Gray Catbird Annual Life Cycle47.074 N/A - (35,154)
Lobes or Gills, Exploring the Origin of Insect Wings 47.074 N/A - 160,129 LTREB Renewal: Response of a Reservoir Ecosystem to Declining Subsides of Nutrients and Detritus 47.074 N/A - 44,890 Collaborative Research: LTREB: Will Increases in Dissolved Organic Matter Accelerate a Shift in Trophic Status Through Anoxia-Driven Positive Feedbacks in an Oligotrophic Lake? 47.074 N/A - 8,844 Breath of Life Archival Institute for Indigenous Languages 47.075 N/A 21,783 115,537 Collaborative Research: Social Exclusion as a Determinant of Individuation and Stereotyping 47.075 N/A - 18,498 National Science Foundation: The Face of Humanity: Configural Face Processing and Dehumanization 47.075 N/A 56,384 152,097 Response Dynamics in Decision Making 47.075 N/A - 32,448 Evaluation of Breath of Life Archival Institute for Indigenous Languages 47.075 N/A - 16,822 Miami University Robert Noyce Scholars Program 47.076 N/A - 45,133 Developing Assessments for Core Chemistry Concepts: Measuring Student Understanding of Multiple External Representations through Cluster Analysis 47.076 N/A - 250,689 Staying in STEM: Examining Communal Goal Congruity Processes in the Retention of Women 47.076 N/A - 20,710 Collaborative Research: Engaged Student Learning - Design and Development Level II: Using a Cyberlegarning Environment to Improve Student Learning and Engagement in Software Courses 47.076 N/A - 35,211 Electronics and Computing Service Scholars 47.076 N/A - 139,249 Graduate Research Fellowship Program (GRFP) 47.076 N/A - 84,307 Evaluation of Further Development and Testing of the Target Inquiry Model for Middle and High School Science Teacher Professional Development 47.076 N/A - 22,610 Evaluation of Electronics and Computing Service Scholars 47.076 N/A - 4,304 Evaluation of Miami University Robert Noyce Scholars Program 47.076 N/A - 17,001 Collaborative Research: Further Development and Testing of the Target Inquiry Model for Middle and High School Science Teacher Professional Development 47.076 N/A - 82,868
Total National Science Foundation Direct Programs 78,167 3,474,421
Pass-Through Programs From: Cornell University: Evaluation of the Center for Bright Beams 47.049 402862 - 28,255 Indiana University: SCF: EXP: Canine-Inspired Smart Sensor for Detecting Hypoglycemia from Human Breath 47.07 402848 - 4,129
Michigan State University: Evaluation of CS10K- Leading the Way to CS10K: Assessing a Just-in-Time Professional Development Approach for Teacher Knowledge Growth in Computer Science
47.07 402489 - 1,957 Cary Institute of Ecosystems Studies: LTER: Long-Term Ecological Research at the Hubbard Brook Experimental Forest 47.074 402705 - 20,396 Cary Institute of Ecosystem Studies:LTER: Long-Term Ecological Research at the Hubbard Brook Experimental Forest 47.074 402874 - 6,253 Cornell University: Digitization TCN: Collaborative: The Microfungi Collections Consortium: A Networked Approach to Digitizing Small Fungi with Large Impacts on the Function and Health of Ecosystems 47.074 402606 - 11,443
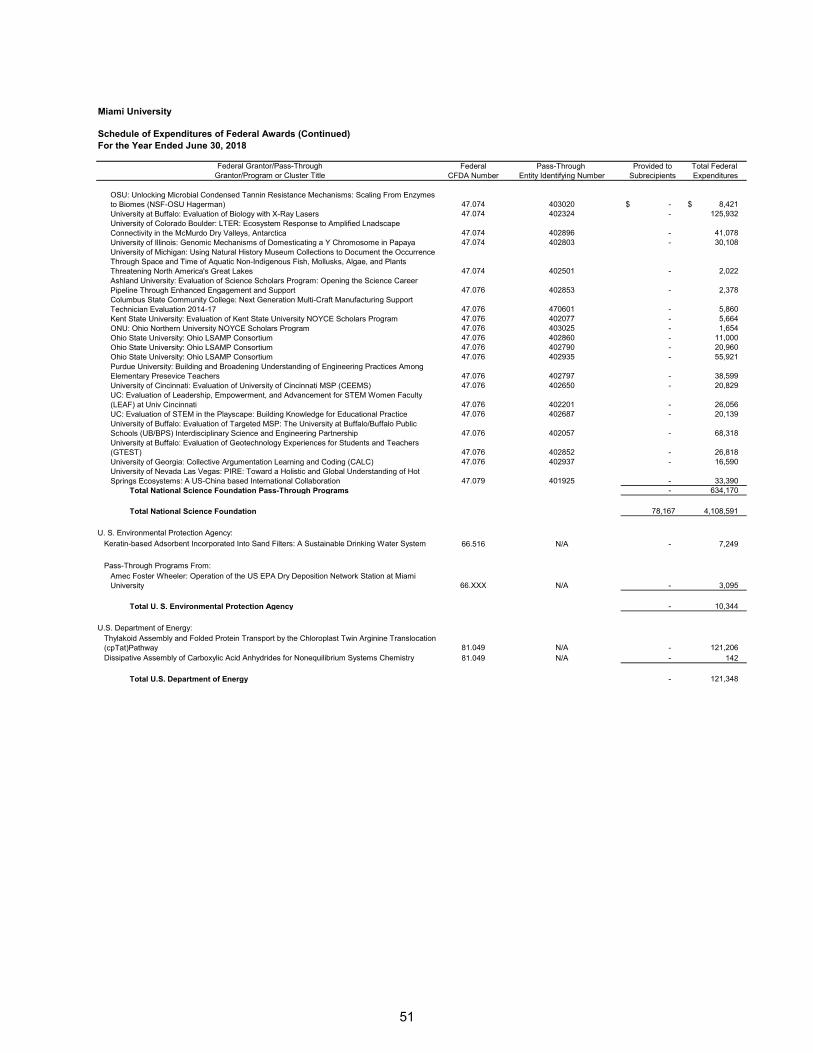
51
Miami University
Schedule of Expenditures of Federal Awards (Continued)For the Year Ended June 30, 2018
Federal Grantor/Pass-Through Federal Pass-Through Provided to Total Federal Grantor/Program or Cluster Title CFDA Number Entity Identifying Number Subrecipients Expenditures
OSU: Unlocking Microbial Condensed Tannin Resistance Mechanisms: Scaling From Enzymes to Biomes (NSF-OSU Hagerman) 47.074 403020 -$ 8,421 $ University at Buffalo: Evaluation of Biology with X-Ray Lasers 47.074 402324 - 125,932 University of Colorado Boulder: LTER: Ecosystem Response to Amplified Lnadscape Connectivity in the McMurdo Dry Valleys, Antarctica 47.074 402896 - 41,078 University of Illinois: Genomic Mechanisms of Domesticating a Y Chromosome in Papaya 47.074 402803 - 30,108 University of Michigan: Using Natural History Museum Collections to Document the Occurrence Through Space and Time of Aquatic Non-Indigenous Fish, Mollusks, Algae, and Plants Threatening North America's Great Lakes 47.074 402501 - 2,022 Ashland University: Evaluation of Science Scholars Program: Opening the Science Career Pipeline Through Enhanced Engagement and Support 47.076 402853 - 2,378 Columbus State Community College: Next Generation Multi-Craft Manufacturing Support Technician Evaluation 2014-17 47.076 470601 - 5,860 Kent State University: Evaluation of Kent State University NOYCE Scholars Program 47.076 402077 - 5,664 ONU: Ohio Northern University NOYCE Scholars Program 47.076 403025 - 1,654 Ohio State University: Ohio LSAMP Consortium 47.076 402860 - 11,000 Ohio State University: Ohio LSAMP Consortium 47.076 402790 - 20,960 Ohio State University: Ohio LSAMP Consortium 47.076 402935 - 55,921 Purdue University: Building and Broadening Understanding of Engineering Practices Among Elementary Presevice Teachers 47.076 402797 - 38,599 University of Cincinnati: Evaluation of University of Cincinnati MSP (CEEMS) 47.076 402650 - 20,829 UC: Evaluation of Leadership, Empowerment, and Advancement for STEM Women Faculty (LEAF) at Univ Cincinnati 47.076 402201 - 26,056 UC: Evaluation of STEM in the Playscape: Building Knowledge for Educational Practice 47.076 402687 - 20,139 University of Buffalo: Evaluation of Targeted MSP: The University at Buffalo/Buffalo Public Schools (UB/BPS) Interdisciplinary Science and Engineering Partnership 47.076 402057 - 68,318 University at Buffalo: Evaluation of Geotechnology Experiences for Students and Teachers (GTEST) 47.076 402852 - 26,818 University of Georgia: Collective Argumentation Learning and Coding (CALC) 47.076 402937 - 16,590 University of Nevada Las Vegas: PIRE: Toward a Holistic and Global Understanding of Hot Springs Ecosystems: A US-China based International Collaboration 47.079 401925 - 33,390
Total National Science Foundation Pass-Through Programs - 634,170
Total National Science Foundation 78,167 4,108,591
U. S. Environmental Protection Agency:
Keratin-based Adsorbent Incorporated Into Sand Filters: A Sustainable Drinking Water System 66.516 N/A - 7,249
Pass-Through Programs From: Amec Foster Wheeler: Operation of the US EPA Dry Deposition Network Station at Miami University 66.XXX N/A - 3,095
Total U. S. Environmental Protection Agency - 10,344
U.S. Department of Energy:Thylakoid Assembly and Folded Protein Transport by the Chloroplast Twin Arginine Translocation (cpTat)Pathway 81.049 N/A - 121,206 Dissipative Assembly of Carboxylic Acid Anhydrides for Nonequilibrium Systems Chemistry 81.049 N/A - 142
Total U.S. Department of Energy - 121,348
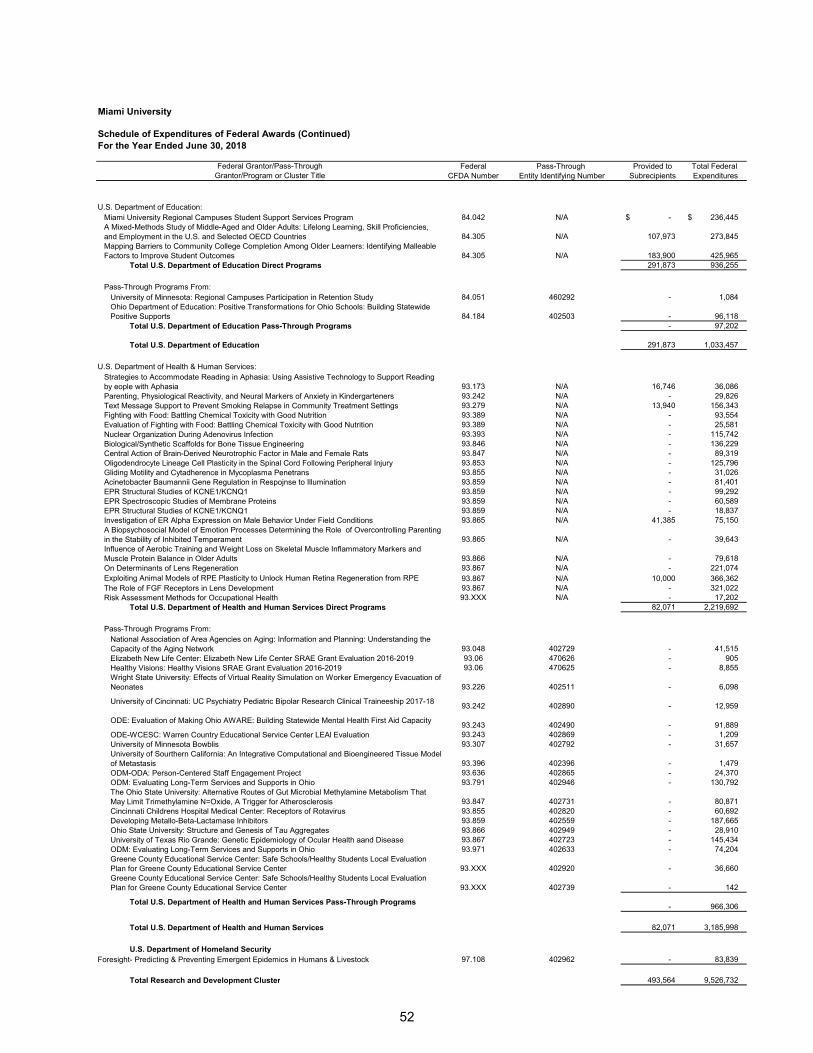
52
Miami University
Schedule of Expenditures of Federal Awards (Continued)For the Year Ended June 30, 2018
Federal Grantor/Pass-Through Federal Pass-Through Provided to Total Federal Grantor/Program or Cluster Title CFDA Number Entity Identifying Number Subrecipients Expenditures
U.S. Department of Education:Miami University Regional Campuses Student Support Services Program 84.042 N/A -$ 236,445 $ A Mixed-Methods Study of Middle-Aged and Older Adults: Lifelong Learning, Skill Proficiencies, and Employment in the U.S. and Selected OECD Countries 84.305 N/A 107,973 273,845 Mapping Barriers to Community College Completion Among Older Learners: Identifying Malleable Factors to Improve Student Outcomes 84.305 N/A 183,900 425,965
Total U.S. Department of Education Direct Programs 291,873 936,255
Pass-Through Programs From: University of Minnesota: Regional Campuses Participation in Retention Study 84.051 460292 - 1,084 Ohio Department of Education: Positive Transformations for Ohio Schools: Building Statewide Positive Supports 84.184 402503 - 96,118
Total U.S. Department of Education Pass-Through Programs - 97,202
Total U.S. Department of Education 291,873 1,033,457
U.S. Department of Health & Human Services:Strategies to Accommodate Reading in Aphasia: Using Assistive Technology to Support Reading by eople with Aphasia 93.173 N/A 16,746 36,086 Parenting, Physiological Reactivity, and Neural Markers of Anxiety in Kindergarteners 93.242 N/A - 29,826 Text Message Support to Prevent Smoking Relapse in Community Treatment Settings 93.279 N/A 13,940 156,343 Fighting with Food: Battling Chemical Toxicity with Good Nutrition 93.389 N/A - 93,554 Evaluation of Fighting with Food: Battling Chemical Toxicity with Good Nutrition 93.389 N/A - 25,581 Nuclear Organization During Adenovirus Infection 93.393 N/A - 115,742 Biological/Synthetic Scaffolds for Bone Tissue Engineering 93.846 N/A - 136,229 Central Action of Brain-Derived Neurotrophic Factor in Male and Female Rats 93.847 N/A - 89,319 Oligodendrocyte Lineage Cell Plasticity in the Spinal Cord Following Peripheral Injury 93.853 N/A - 125,796 Gliding Motility and Cytadherence in Mycoplasma Penetrans 93.855 N/A - 31,026 Acinetobacter Baumannii Gene Regulation in Respojnse to Illumination 93.859 N/A - 81,401 EPR Structural Studies of KCNE1/KCNQ1 93.859 N/A - 99,292 EPR Spectroscopic Studies of Membrane Proteins 93.859 N/A - 60,589 EPR Structural Studies of KCNE1/KCNQ1 93.859 N/A - 18,837 Investigation of ER Alpha Expression on Male Behavior Under Field Conditions 93.865 N/A 41,385 75,150 A Biopsychosocial Model of Emotion Processes Determining the Role of Overcontrolling Parenting in the Stability of Inhibited Temperament 93.865 N/A - 39,643 Influence of Aerobic Training and Weight Loss on Skeletal Muscle Inflammatory Markers and Muscle Protein Balance in Older Adults 93.866 N/A - 79,618 On Determinants of Lens Regeneration 93.867 N/A - 221,074 Exploiting Animal Models of RPE Plasticity to Unlock Human Retina Regeneration from RPE 93.867 N/A 10,000 366,362 The Role of FGF Receptors in Lens Development 93.867 N/A - 321,022 Risk Assessment Methods for Occupational Health 93.XXX N/A - 17,202
Total U.S. Department of Health and Human Services Direct Programs 82,071 2,219,692
Pass-Through Programs From: National Association of Area Agencies on Aging: Information and Planning: Understanding the Capacity of the Aging Network 93.048 402729 - 41,515 Elizabeth New Life Center: Elizabeth New Life Center SRAE Grant Evaluation 2016-2019 93.06 470626 - 905 Healthy Visions: Healthy Visions SRAE Grant Evaluation 2016-2019 93.06 470625 - 8,855 Wright State University: Effects of Virtual Reality Simulation on Worker Emergency Evacuation of Neonates 93.226 402511 - 6,098
University of Cincinnati: UC Psychiatry Pediatric Bipolar Research Clinical Traineeship 2017-1893.242 402890 - 12,959
ODE: Evaluation of Making Ohio AWARE: Building Statewide Mental Health First Aid Capacity93.243 402490 - 91,889
ODE-WCESC: Warren Country Educational Service Center LEAl Evaluation 93.243 402869 - 1,209 University of Minnesota Bowblis 93.307 402792 - 31,657 University of Sourthern California: An Integrative Computational and Bioengineered Tissue Model of Metastasis 93.396 402396 - 1,479 ODM-ODA: Person-Centered Staff Engagement Project 93.636 402865 - 24,370 ODM: Evaluating Long-Term Services and Supports in Ohio 93.791 402946 - 130,792 The Ohio State University: Alternative Routes of Gut Microbial Methylamine Metabolism That May Limit Trimethylamine N=Oxide, A Trigger for Atherosclerosis 93.847 402731 - 80,871 Cincinnati Childrens Hospital Medical Center: Receptors of Rotavirus 93.855 402820 - 60,692 Developing Metallo-Beta-Lactamase Inhibitors 93.859 402559 - 187,665 Ohio State University: Structure and Genesis of Tau Aggregates 93.866 402949 - 28,910 University of Texas Rio Grande: Genetic Epidemiology of Ocular Health aand Disease 93.867 402723 - 145,434 ODM: Evaluating Long-Term Services and Supports in Ohio 93.971 402633 - 74,204 Greene County Educational Service Center: Safe Schools/Healthy Students Local Evaluation Plan for Greene County Educational Service Center 93.XXX 402920 - 36,660 Greene County Educational Service Center: Safe Schools/Healthy Students Local Evaluation Plan for Greene County Educational Service Center 93.XXX 402739 - 142
Total U.S. Department of Health and Human Services Pass-Through Programs- 966,306
Total U.S. Department of Health and Human Services 82,071 3,185,998
U.S. Department of Homeland SecurityForesight- Predicting & Preventing Emergent Epidemics in Humans & Livestock 97.108 402962 - 83,839
Total Research and Development Cluster 493,564 9,526,732

53
Miami University
Schedule of Expenditures of Federal Awards (Continued)For the Year Ended June 30, 2018
Federal Grantor/Pass-Through Federal Pass-Through Provided to Total Federal Grantor/Program or Cluster Title CFDA Number Entity Identifying Number Subrecipients Expenditures
U.S. Department of State:Miami University - Sanya University American Cultural Center 19.04 N/A -$ 18,573 $
National Endowment for Humanities:Miami University Humanities Center NEH Challenge Grant Application 45.13 N/A - 87,560 From Warzone to Home: A Humanities Dialogue 45.162 N/A - 7,106
Total National Endowment for Humanities - 94,666
National Science Foundation :Great Plains Operator Theory Symposium 2018 47.049 N/A - 3,191 Does a Large Detritus Pool Enhance Ecosystem Resilience in Response to an Episodic Perturbation? 47.074 N/A - 54
Total National Science Foundation - 3,245
U.S Department of Education: N/AMiami University Regionals - Upward Bound Program 84.047 N/A - 135,494 Miami University: CCAMPIS Scholarships for Low Income Undergraduate Students on Three Campuses 84.335 N/A - 113,890
Total U.S. Department of Education Direct Programs - 249,384
Pass-Through Programs From: National Writing Project: 2016-2017 NWP SEED Invitational Leadership Institute to Invest in Developing New Teacher-Leaders 84.367 402691 - 322
National Writing Project: 2016-2017 NWP SEED Professional Development in a High-Need School84.367 402768 - 43,876
ODHE: Writing and Inquiry Stories to Explore Science II (WISE Science II) 84.367 402863 - 57,242 National Writing Project: Agreement # BRimer-NWP 2016 84.411 402793 - 19,720 National Writing Project: 2017 i3 Scale-up College-Ready Writers Program 2017-18 Advanced Institute 84.411 402884 - 17,597 2018-2019 Year 2 i3 Scale-Up C3WP Advanced Institute for Upper Elementary 84.411 403044 - 408 2018-19 i3 C3WP High-Need School PD 84.411 403045 - 751 ODHE: Evaluation of Writing and Inquiry Stories to Explore Science (WISE Science ii) 84.367B 402870 - 9,819
Total U.S. Department of Education Pass Through Programs - 149,735
Total U.S. Department of Pass Education - 399,119
U.S. Department of Defense:
Pass-Through Programs From: General Dynamics: Manufacturing Workshop for AFRL/ManTech 12.XXX 402787 - 42,866
U.S. Department of State:
Pass-Through Programs From: USDOS-ITD Albarran 19.009 403027 - 2,190
National Endowment for the Arts:
Pass-Through Programs From: Arts Midwest: 2017-18 Midwest Touring Fund 45.025 403033 - 3,600
National Science Foundation: Gonzalez NSF Intergovernmental Personnel Act (IPA) Assignment 47.XXX 402616 - 19,215 Vanni NSF Intergovernmental Personnel Act (IPA) 47.XXX 402625 - 23,140
Total National Science Foundation - 42,355
U.S. Department of Health & Human Services:
Pass-Through Programs From: Cincinnati Children's Medical Center: LEND CCHMC Traineeship Green 93.11 402726 - 130 Ohio Department of Education:Making Ohio AWARE: Building Statewide Mental Health First Aid Capacity 93.243 402502 - 417,923 ODMHAS: Miami University Bacchus Student Engagement Iniative 2018 93.959 402997 - 4,087
Ohio Department of Mental Health and Addiction Services: Hosting 2017 OPEC Conference93.959 402844 - 13,812
Ohio Department of Mental Health and Addiction Services: Hosting 2018 OPEC Conference93.959 402943 - 95,739
Total U.S. Department of Health and Human Services - 531,691
Office of Public Affairs:ICE-HSI: Reimbursement of Joint Operations Expenses from the Treasury Forfeiture Fund 97.XXX 402676 - 4,937
Total Expenditures of Federal Awards 493,564 $ 114,383,020 $
See notes to the schedule of expenditures of federal awards
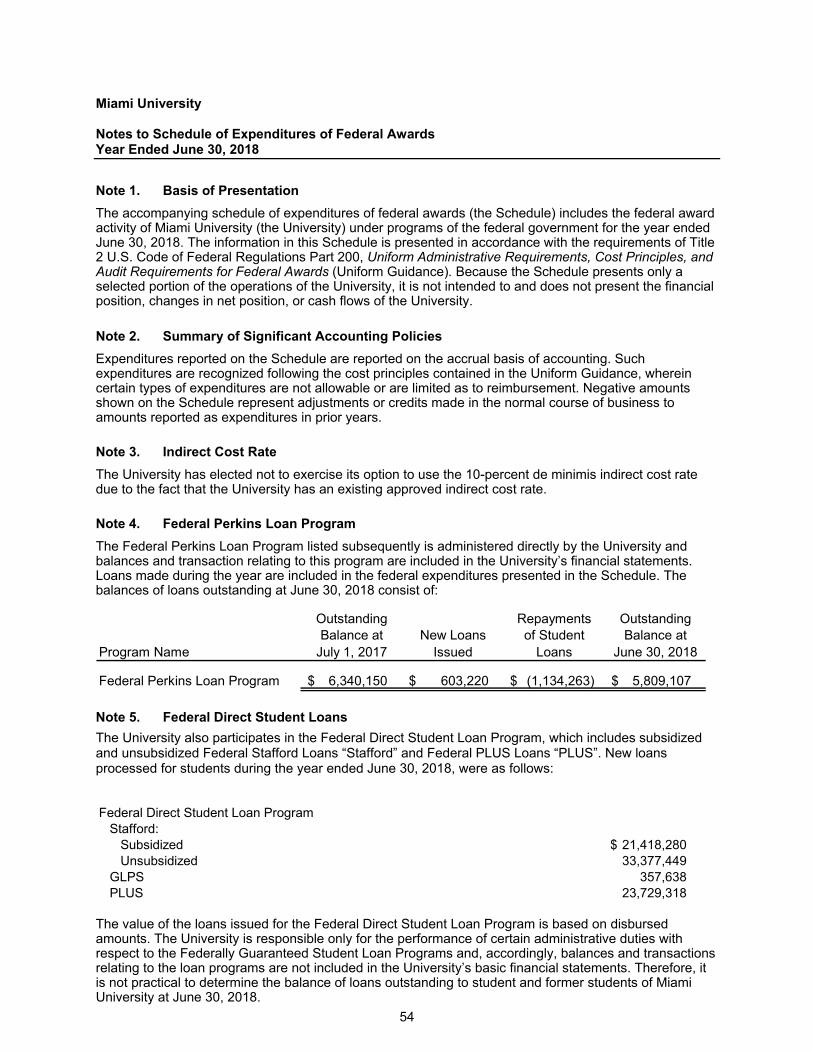
Miami University Notes to Schedule of Expenditures of Federal Awards Year Ended June 30, 2018
54
Note 1. Basis of Presentation
The accompanying schedule of expenditures of federal awards (the Schedule) includes the federal award activity of Miami University (the University) under programs of the federal government for the year ended June 30, 2018. The information in this Schedule is presented in accordance with the requirements of Title 2 U.S. Code of Federal Regulations Part 200, Uniform Administrative Requirements, Cost Principles, and Audit Requirements for Federal Awards (Uniform Guidance). Because the Schedule presents only a selected portion of the operations of the University, it is not intended to and does not present the financial position, changes in net position, or cash flows of the University.
Note 2. Summary of Significant Accounting Policies
Expenditures reported on the Schedule are reported on the accrual basis of accounting. Such expenditures are recognized following the cost principles contained in the Uniform Guidance, wherein certain types of expenditures are not allowable or are limited as to reimbursement. Negative amounts shown on the Schedule represent adjustments or credits made in the normal course of business to amounts reported as expenditures in prior years.
Note 3. Indirect Cost Rate
The University has elected not to exercise its option to use the 10-percent de minimis indirect cost rate due to the fact that the University has an existing approved indirect cost rate.
Note 4. Federal Perkins Loan Program
The Federal Perkins Loan Program listed subsequently is administered directly by the University and balances and transaction relating to this program are included in the University’s financial statements. Loans made during the year are included in the federal expenditures presented in the Schedule. The balances of loans outstanding at June 30, 2018 consist of:
Outstanding Repayments OutstandingBalance at New Loans of Student Balance at
Program Name July 1, 2017 Issued Loans June 30, 2018
Federal Perkins Loan Program 6,340,150 $ 603,220 $ (1,134,263) $ 5,809,107 $
Note 5. Federal Direct Student Loans
The University also participates in the Federal Direct Student Loan Program, which includes subsidized and unsubsidized Federal Stafford Loans “Stafford” and Federal PLUS Loans “PLUS”. New loans processed for students during the year ended June 30, 2018, were as follows:
Federal Direct Student Loan ProgramStafford:
Subsidized 21,418,280 $ Unsubsidized 33,377,449
GLPS 357,638 PLUS 23,729,318
The value of the loans issued for the Federal Direct Student Loan Program is based on disbursed amounts. The University is responsible only for the performance of certain administrative duties with respect to the Federally Guaranteed Student Loan Programs and, accordingly, balances and transactions relating to the loan programs are not included in the University’s basic financial statements. Therefore, it is not practical to determine the balance of loans outstanding to student and former students of Miami University at June 30, 2018.
55
Report on Internal Control Over Financial Reporting and on Compliance and Other Matters Based on an Audit of Financial Statements Performed in Accordance With Government Auditing
Standards
Independent Auditor's Report President and Board of Trustees of Miami University We have audited, in accordance with the auditing standards generally accepted in the United States of America and the standards applicable to financial audits contained in Government Auditing Standards issued by the Comptroller General of the United States, the financial statements of the business-type activities and the discretely presented component unit of Miami University (the University), as of and for the year ended June 30, 2018, which collectively comprise the University’s basic financial statements and the related notes to the financial statements, and have issued our report thereon dated October 15, 2018. This report does not extend to the Miami University Foundation due to the Foundation issuing a separate report on Internal Control over Financial Reporting and on Compliance and Others Matters Based on an Audit of Financial Statements Performed in Accordance with Government Auditing Standards dated October 15, 2018. Internal Control over Financial Reporting In planning and performing our audit of the financial statements, we considered the University's internal control over financial reporting (internal control) to determine the audit procedures that are appropriate in the circumstances for the purpose of expressing our opinion on the financial statements, but not for the purpose of expressing an opinion on the effectiveness of the University's internal control. Accordingly, we do not express an opinion on the effectiveness of the University's internal control. A deficiency in internal control exists when the design or operation of a control does not allow management or employees, in the normal course of performing their assigned functions, to prevent, or detect and correct, misstatements on a timely basis. A material weakness is a deficiency, or a combination of deficiencies, in internal control, such that there is a reasonable possibility that a material misstatement of the entity’s financial statements will not be prevented, or detected and corrected on a timely basis. A significant deficiency is a deficiency, or a combination of deficiencies, in internal control that is less severe than a material weakness, yet important enough to merit attention by those charged with governance. Our consideration of internal control was for the limited purpose described in the first paragraph of this section and was not designed to identify all deficiencies in internal control that might be material weaknesses or significant deficiencies. Given these limitations, during our audit we did not identify any deficiencies in internal control that we consider to be material weaknesses. However, material weaknesses may exist that have not been identified.

56
Compliance and Other Matters As part of obtaining reasonable assurance about whether the University's financial statements are free from material misstatement, we performed tests of its compliance with certain provisions of laws, regulations, contracts, and grant agreements, noncompliance with which could have a direct and material effect on the determination of financial statement amounts. However, providing an opinion on compliance with those provisions was not an objective of our audit, and accordingly, we do not express such an opinion. The results of our tests disclosed no instances of noncompliance or other matters that are required to be reported under Government Auditing Standards. Purpose of this Report The purpose of this report is solely to describe the scope of our testing of internal control and compliance and the results of that testing, and not to provide an opinion on the effectiveness of the University’s internal control or on compliance. This report is an integral part of an audit performed in accordance with Government Auditing Standards in considering the University’s internal control and compliance. Accordingly, this communication is not suitable for any other purpose.
Cleveland, Ohio October 15, 2018
57
Report On Compliance For Each Major Federal Program; And Report On Internal Control Over Compliance Required By The Uniform Guidance
Independent Auditor's Report
President and Board of Trustees of Miami University Report on Compliance for Each Major Federal Program We have audited Miami University's (the University) compliance with the types of compliance requirements described in the OMB Compliance Supplement that could have a direct and material effect on each of the University's major federal programs for the year ended June 30, 2018. The University's major federal programs are identified in the summary of auditor’s results section of the accompanying Schedule of Findings and Questioned Costs. Management’s Responsibility Management is responsible for compliance with federal statutes, regulations, and the terms and conditions of its federal awards applicable to its federal programs. Auditor’s Responsibility Our responsibility is to express an opinion on compliance for each of the University’s major federal programs based on our audit of the types of compliance requirements referred to above. We conducted our audit of compliance in accordance with auditing standards generally accepted in the United States of America; the standards applicable to financial audits contained in Government Auditing Standards, issued by the Comptroller General of the United States; and the audit requirements of Title 2 U.S. Code of Federal Regulations Part 200, Uniform Administrative Requirements, Cost Principles, and Audit Requirements for Federal Awards (Uniform Guidance). Those standards and the Uniform Guidance require that we plan and perform the audit to obtain reasonable assurance about whether noncompliance with the types of compliance requirements referred to above that could have a direct and material effect on a major federal program occurred. An audit includes examining, on a test basis, evidence about the University’s compliance with those requirements and performing such other procedures as we considered necessary in the circumstances. We believe that our audit provides a reasonable basis for our opinion on compliance for each major federal program. However, our audit does not provide a legal determination of the University's compliance. Opinion on Each Major Federal Program In our opinion, the University complied, in all material respects, with the types of compliance requirements referred to above that could have a direct and material effect on each of its major federal programs for the year ended June 30, 2018.
58
Report on Internal Control over Compliance Management of the University is responsible for establishing and maintaining effective internal control over compliance with the types of compliance requirements referred to above. In planning and performing our audit of compliance, we considered the University's internal control over compliance with the types of requirements that could have a direct and material effect on each major federal program to determine the auditing procedures that are appropriate in the circumstances for the purpose of expressing an opinion on compliance for each major federal program and to test and report on internal control over compliance in accordance with the Uniform Guidance, but not for the purpose of expressing an opinion on the effectiveness of internal control over compliance. Accordingly, we do not express an opinion on the effectiveness of the University's internal control over compliance. A deficiency in internal control over compliance exists when the design or operation of a control over compliance does not allow management or employees, in the normal course of performing their assigned functions, to prevent, or detect and correct, noncompliance with a type of compliance requirement of a federal program on a timely basis. A material weakness in internal control over compliance is a deficiency, or combination of deficiencies, in internal control over compliance, such that there is a reasonable possibility that material noncompliance with a type of compliance requirement of a federal program will not be prevented, or detected and corrected, on a timely basis. A significant deficiency in internal control over compliance is a deficiency, or a combination of deficiencies, in internal control over compliance with a type of compliance requirement of a federal program that is less severe than a material weakness in internal control over compliance, yet important enough to merit attention by those charged with governance. Our consideration of internal control over compliance was for the limited purpose described in the first paragraph of this section and was not designed to identify all deficiencies in internal control over compliance that might be material weaknesses or significant deficiencies. We did not identify any deficiencies in internal control over compliance that we consider to be material weaknesses. However, material weaknesses may exist that have not been identified. The purpose of this report on internal control over compliance is solely to describe the scope of our testing of internal control over compliance and the results of that testing based on the requirements of the Uniform Guidance. Accordingly, this report is not suitable for any other purpose.
Cleveland, Ohio October 15, 2018

59
Miami University
Schedule of Findings and Questioned CostsFor the Year Ended June 30, 2018
Section I - Summary of Auditor's Results
Financial Statements
Type of report the auditor issued on whether the financial statements audited were prepared in accordance with GAAP:
Internal control over financial reporting:• Material weakness(es) identified? Yes X No• Significant deficiency(ies) identified? Yes X None reported
Noncompliance material to financial statements noted? Yes X No
Federal Awards
Internal control over major programs:• Material weakness(es) identified? Yes X No• Significant deficiency(ies) identified? Yes X None reported
Type of auditor's report issued on compliancefor major programs:
Any audit findings disclosed that are required tobe reported in accordance with 2 CFR 200.516(a)?
Yes X No
Identification of major programs:
CFDA Number(s) Name of Federal Program or Cluster84.007, 84.033, 84.038, 84.063, 84.268 and 84.379Various
Dollar threshold used to distinguish betweenType A and Type B programs: 750,000$
Auditee qualified as a low risk auditee? X Yes No
Unmodified
Unmodified
Student Financial Aid ClusterResearch and Development Cluster
Miami University Schedule of Findings and Questioned Costs Year Ended June 30, 2018
60
II. Findings Relating to the Financial Statement Audit as Required to be Reported in Accordance with Generally Accepted Government Auditing Standards
(A) Internal Control
None reported.
(B) Compliance Findings
None reported.
III. Findings and Questioned Costs for Federal Awards
(A) Internal Control
None reported.
(B) Compliance Findings None reported.

Miami University Schedule of Prior Year Findings and Questioned Costs Year Ended June 30, 2018
61
No matters were reported.
Copyright © 2022 FDOKUMEN