FY 2015 APR - Department of Energy
123
DOE/CF-0145
-
Upload
khangminh22 -
Category
Documents
-
view
3 -
download
0
Transcript of FY 2015 APR - Department of Energy

DOE/CF-0145

FY 2015 DOE ANNUAL PERFORMANCE REPORT 2 | P a g e
Contents
Introduction .................................................................................................................................. 3
DOE Organization ........................................................................................................................... 3
Strategic Framework....................................................................................................................... 3
Agency Priority Goals ...................................................................................................................... 4
Cross-Agency Priority Goals.............................................................................................................. 8
Management Review ...................................................................................................................... 8
FY 2014 Unmet Performance Goals ................................................................................................... 9
Program Inventory......................................................................................................................... 12
Strategic Objectives Summary of Progress......................................................................................... 13
Program Performance Goals ........................................................................................................... 19

FY 2015 DOE ANNUAL PERFORMANCE REPORT 3 | P a g e
Introduction The FY 2015 DOE Annual Performance Report contains details of the Department of Energy’s (DOE) program performance, showing the historical targets and results from FY 2011 through 2015 for specific goals, measures and methodology documentation. This report fulfills the statutory requirements of the Government Performance and Results Act (GPRA) of 1993 and the GPRA-Modernization Act of 2010 to produce an annual report on past program performance.
DOE Organization In response to changing needs and an extended energy crisis, the Congress passed the Department of Energy Organization Act in 1977, creating the Department of Energy (DOE). That legislation brought together for the first time, not only most of the government’s energy programs, but also science and technology programs and defense responsibilities that included the design, production and certification of nuclear weapon performance. The Department provided the framework for a comprehensive and balanced national energy plan by coordinating and administering the energy functions of the federal government. The Department undertook responsibility for long-term, high-risk research and development of energy technology, federal power marketing, some energy conservation activities, the nuclear weapons programs, some energy regulatory programs and a central energy data collection and analysis program. Three Under Secretaries manage the core functions that carry out the DOE mission with significant cross-cutting work spanning across the enterprise. The DOE enterprise is comprised of approximately 15,000 federal employees and over 90,000 management and operating contractors and other contractor employees at the Department’s headquarters in Washington, D.C., and at 85 field locations. DOE operates a nationwide system of 17 national laboratories that provides world-class scientific, technological, and engineering capabilities, including the operation of national scientific user facilities used by over 29,000 researchers from academia, federal laboratories, and industry. The range, scale, and excellence of science and technology at the DOE laboratories provide strategic assets to accomplish DOE missions, respond to unforeseen domestic and international emergencies, and provide technical capabilities to help shape the global science and technology agenda. The Department’s organizational chart is located at http://energy.gov/about-us/organization-chart.
Strategic Framework The FY 2015 performance reporting is based on the 2014-2018 DOE Strategic Plan, which serves as a blueprint for enhancing U.S. security and economic growth through transformative science, technology innovation, and market solutions to meet our energy, nuclear security, and environmental challenges. The plan is available at http://www.energy.gov/downloads/2014-2018-strategic-plan. This report is organized by the following three strategic goals:
1. Science and Energy - Advance foundational science, innovative energy technologies, and inform data driven policies that enhance U.S. economic growth and job creation, energy security, and environmental quality, with emphasis on implementation of the President’s Climate Action Plan to mitigate the risks of and enhance resilience against climate change.
2. Nuclear Security - Strengthen national security by maintaining the nuclear stockpile and modernizing nuclear security infrastructure, reducing global nuclear threats, providing for nuclear propulsion, improving physical and cybersecurity, and strengthening key science, technology, and engineering capabilities.
3. Management and Performance - Position the Department of Energy to meet the challenges of the 21st century and the nation’s Manhattan Project and Cold War legacy responsibilities by employing effective management and refining operational and support capabilities to pursue departmental missions.
FY 2015 DOE ANNUAL PERFORMANCE REPORT 4 | P a g e
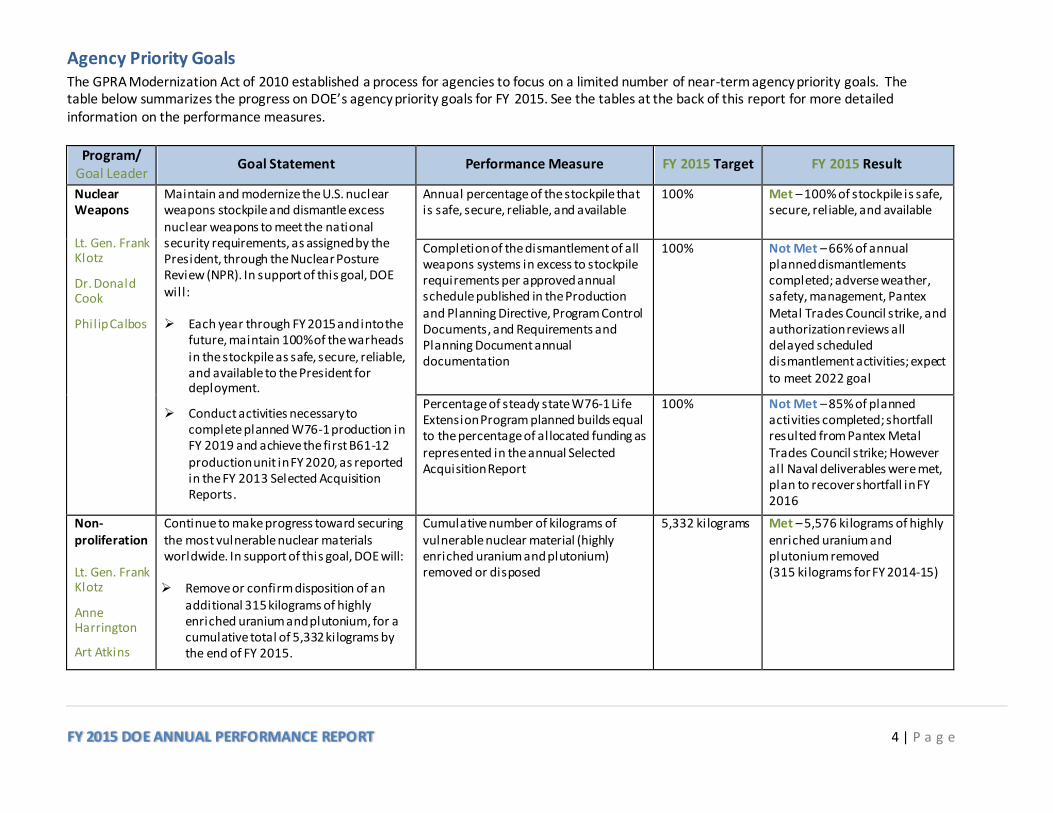
Agency Priority Goals The GPRA Modernization Act of 2010 established a process for agencies to focus on a limited number of near-term agency priority goals. The table below summarizes the progress on DOE’s agency priority goals for FY 2015. See the tables at the back of this report for more detailed information on the performance measures.
Program/ Goal Leader
Goal Statement Performance Measure FY 2015 Target FY 2015 Result
Nuclear Weapons Lt. Gen. Frank Klotz
Dr. Donald Cook
Philip Calbos
Maintain and modernize the U.S. nuclear weapons stockpile and dismantle excess nuclear weapons to meet the national security requirements, as assigned by the President, through the Nuclear Posture Review (NPR). In support of this goal, DOE will: Each year through FY 2015 and into the
future, maintain 100% of the warheads in the stockpile as safe, secure, reliable, and available to the President for deployment.
Conduct activities necessary to complete planned W76-1 production in FY 2019 and achieve the first B61-12 production unit in FY 2020, as reported in the FY 2013 Selected Acquisition Reports.
Annual percentage of the stockpile that is safe, secure, reliable, and available
100% Met – 100% of stockpile is safe, secure, reliable, and available
Completion of the dismantlement of all weapons systems in excess to stockpile requirements per approved annual schedule published in the Production and Planning Directive, Program Control Documents, and Requirements and Planning Document annual documentation
100% Not Met – 66% of annual planned dismantlements completed; adverse weather, safety, management, Pantex Metal Trades Council strike, and authorization reviews all delayed scheduled dismantlement activities; expect to meet 2022 goal
Percentage of steady state W76-1 Life Extension Program planned builds equal to the percentage of allocated funding as represented in the annual Selected Acquisition Report
100% Not Met – 85% of planned activities completed; shortfall resulted from Pantex Metal Trades Council strike; However all Naval deliverables were met, plan to recover shortfall in FY 2016
Non-proliferation Lt. Gen. Frank Klotz
Anne Harrington
Art Atkins
Continue to make progress toward securing the most vulnerable nuclear materials worldwide. In support of this goal, DOE will: Remove or confirm disposition of an
additional 315 kilograms of highly enriched uranium and plutonium, for a cumulative total of 5,332 kilograms by the end of FY 2015.
Cumulative number of kilograms of vulnerable nuclear material (highly enriched uranium and plutonium) removed or disposed
5,332 kilograms Met – 5,576 kilograms of highly enriched uranium and plutonium removed (315 kilograms for FY 2014-15)

FY 2015 DOE ANNUAL PERFORMANCE REPORT 5 | P a g e
Climate Action Plan Dr. Franklin Orr
Mike Knotek
Kathleen Hogan
Mark McCall
Dong Kim
Implement elements of the Climate Action Plan, including:
Supporting the goal of reducing cumulative carbon pollution by 3 billion metric tons by 2030 through standards set since 2009 and promulgating new standards for consumer products and industrial equipment by the end of calendar year 2016.
Providing up to $8 billion in loan guarantees for advanced fossil energy technologies that reduce greenhouse gas emissions by the end of FY 2017.
Promulgating new standards for consumer products and industrial equipment
236 million metric tons of CO2 (equivalent) projected carbon reduction through 2030 associated with published standards final rules
Not Met – 100 MMT of CO2 (equivalent) projected carbon reduction associated with FY15 published standards final rules
Loan guarantees for advanced fossil energy technologies
Complete application review process
Ongoing – FY15 target met: 5 rounds of Part I of application review process complete, and 6 rounds of Part II complete. The Loan Programs Office continues to process and evaluate loan guarantee applications for advanced fossil projects and anticipates issuing conditional commitments for advanced fossil loans by the end of FY17.
Quadrennial Energy Review (QER) Melanie Kenderdine
Jonathan Pershing
Enhance desirable characteristics and diminish vulnerabilities of the U.S. energy infrastructure to meet goals of economic competitiveness, national security, and environmental responsibility. In support of this goal, DOE will:
Support the first installment of the QER through early FY 2015 and begin implementation of relevant recommendations within DOE’s existing authorities.
Support first installment of QER and begin implementation of recommendations
Support and implement QER
Met – Released the Accelerate Energy Productivity by 2030 Roadmap; began to implement recommendations in the QER regarding energy transmission, storage, and distribution
Science
Support and conduct basic research to deliver scientific breakthroughs and extend our knowledge of the natural world by capitalizing on the capabilities available at
Prioritization of Science user facilities
Prioritize user facilities in budget submission
Met – FY 2016 President’s Budget submission includes funding for Science user

FY 2015 DOE ANNUAL PERFORMANCE REPORT 6 | P a g e
Dr. Franklin Orr
Mike Knotek
Pat Dehmer
the national laboratories, and through partnerships with universities and industry. In support of this goal, DOE will: Incorporate Science user facility
prioritization into program planning efforts.
Identify programmatic drivers and technical requirements in coordination with other Departmental mission areas to inform future development of high performance computing capabilities and in anticipation of capable exascale systems.
facilities based on prioritization listing
Identification of programmatic drivers and technical requirements
Deliver conceptual design document
Met – Preliminary conceptual design document presented to the DOE Secretary
Management David Klaus
Paul Bosco Michael Johnson
Increase the focus on efficient and effective management across the DOE enterprise and improve performance in the areas of environmental cleanup, construction project management, and cybersecurity. In support of this goal, DOE will:
Retrieve tank waste, close tanks, and dispose of transuranic waste within cost and schedule through FY 2015.
On a 3-year rolling basis, complete at least 90% of departmental projects
Liquid Waste Tanks Closed 15 tanks Not Met – 14 tanks were closed; expect to close final tank at Savanah River in first quarter of FY 2016
Transuranic Waste Dispositioned 102,591 cubic meters (cumulative)
Not Met – 102,026 cubic meters (cumulative) of combined remote-handled and contact- handled transuranic waste were disposed or re-characterized as low-level or mixed low-level waste

FY 2015 DOE ANNUAL PERFORMANCE REPORT 7 | P a g e
baselined since the start of FY 2008 within the original scope baseline and not to exceed 110% of the cost as reflected in the performance baseline established at Critical Decision 2 through FY 2015.
Achieve full operational capability of the Joint Cybersecurity Coordination Center (JC3), including classified operations, by the end of FY 2015.
On a 3-year rolling basis, the percentage of departmental projects baselined since the start of FY 2008 that were completed within the original scope baseline and not to exceed 110% of the cost as reflected in the performance baseline established at Critical Decision 2.
90% Not Met – 78% of projects completed within scope and cost baseline
Operational capability of the Joint Cybersecurity Coordination Center (JC3), including TS-SCI operations
Full operational capability
Met – DOE achieved full operational capability of the Joint Cybersecurity Coordination Center, including Top-Secret/Special Compartmented Information operations
Labs David Klaus
Restructure the relationship and interactions between the Department and the national laboratories and sites to ensure the continued status of the national laboratories as world-class research institutions best able to achieve DOE’s mission, maximize the impact of federal R&D investment in the laboratories, accelerate the transfer of technology into the private and government sectors, and better respond to opportunities and challenges. In support of this goal, DOE will: Establish the National Laboratory Policy
Council to address high-level policy challenges and develop initiatives to build and focus the laboratory system on critical economic, research and national security priorities.
Establish the National Laboratory Operations Board to address operational
Establishment of the National Laboratory Policy Council
Establish Lab Council
Met – Laboratory Policy Council created and met four times in FY 2015
Establishment of the National Laboratory Operations Board
Establish Lab Board
Met – Laboratory Operations Board created and met 11 times in FY 2015. Met to discuss key Departmental operational and performance matters; working groups held additional meetings during this period. The LOB led a laboratory-wide assessment of the condition of existing infrastructure throughout the laboratory complex which assessed how well each existing and planned real property asset at the National Laboratories meets the mission and core capability.

FY 2015 DOE ANNUAL PERFORMANCE REPORT 8 | P a g e
and administrative issues and enhance the effectiveness and efficiency of DOE’s management of the national laboratories.
Improve stewardship of national assets across the national laboratories and DOE operating sites to assure that DOE physical plants and their operating practices comply with DOE Directives and achieve Administration priority initiatives by end of FY 2015.
Improvement of stewardship of national assets across the national laboratories and DOE operating sites
Improve stewardship of national assets
Met – Completed infrastructure and excess facilities assessments of how well each existing and planned real property asset at the National Labs meets the mission and core capability

FY 2015 DOE ANNUAL PERFORMANCE REPORT 9 | P a g e
Cross-Agency Priority Goals The Administration identified 15 cross-agency priority (CAP) goals in the FY 2015 President’s Budget. The implementation of these goals was led by White House offices, the Office of Management and Budget, and interagency councils. Action plans and FY 2015 results for each cross-agency priority goal can be found on the interagency performance management website at http://www.performance.gov. The Office of Science and Technology Policy and DOE are the leads for the “Economic Growth: Lab-to-Market” goal:
Increase the economic impact of federally-funded research and development by accelerating and improving the transfer of new technologies from the laboratory to the commercial marketplace. The following actions are being taken to accelerate and improve the transfer of new technologies from the laboratory to the commercial marketplace:
• Optimizing the management, discoverability, and ease-of-license of the 100,000+ federally funded patents;
• Increasing the utilization of federally-funded research facilities by entrepreneurs and innovators;
• Ensuring that relevant federal institutions and employees are appropriately incentivized to prioritize R&D commercialization;
• Identifying steps to develop human capital with experience in technology transfer, including by expanding opportunities for entrepreneurship education; and
• Maximizing the economic impact of the Small Business Innovation Research (SBIR) and Small Business Technology Transfer (STTR) programs.
Management Review The Department is meeting the GPRA-Modernization Act requirements for quarterly data driven executive review of Agency Priority Goals through a meeting within the Department known as the Business Quarterly Review (BQR). This review focuses on current performance and execution, providing appropriate data to support corporate level management decision making. The BQR is structured to evaluate progress in implementing the Department’s Strategic Plan. The three Under Secretaries each have primary responsibility in implementing one of the three strategic goals, an underlying set of program goals (including priority goals), and associated key performance measures. The Performance Improvement Officer collects quarterly milestones and stewards data-driven reviews for all priority goals and program performance measures. The quarterly BQR cycle occurs in tandem with the longer term, annual budget process, and focuses on key priorities and strategy, resource deliberations, and budget construction. The BQR is chaired by the Deputy Secretary, who serves as the Chief Operating Officer. The main participants are the Under Secretaries, Chief Human Capital Officer, Performance Improvement Officer, and the Agency Priority Goal leaders. The meetings and briefing materials are prepared by the Performance Improvement Officer and Budget Director.

FY 2015 DOE ANNUAL PERFORMANCE REPORT 10 | P a g e
FY 2014 Unmet Performance Goals The following table displays the FY 2015 status of program performance goals that were not met in FY 2014 and explains actions to bring the activity back on track or an explanation of why the measure was discontinued.
Program FY 2014 Performance Goal FY 2015 Performance Status
NNSA
Weapons Activities / Inertial Confinement Fusion Ignition and High Yield
Advanced Ignition Demonstration – Cumulative percentage of progress toward the validation of a concept that meets the requirements for weapons science applications and contributes to energy science and national security
FY 2014 Target: 30 Result: 0
NNSA replaced two ICF program measures, Advanced Ignition Demonstration and Application of Ignition, with a new single measure, High Energy Density Physics Research. The new Measure reflects the recent rebalancing of the program to support both ignition and non-ignition SSP efforts and provides a better determination of relevant mission accomplishments for the ICF program.
Cumulative percentage of progress towards completion of the high energy density physics research needed to support the nuclear weapons program as embodied in the Predictive Capability Framework (PCF).
FY15 Target: 10% completion
FY15 Result: 10% - The annual target was met. All major ICF facilities have completed, or exceeded, their respective planned number of effective shots.
Application of Ignition – Cumulative percentage of progress in providing data required to support the predictive capability framework burn boost initiative in FY 2018
FY 2014 Target: 35 Result: 0
NNSA
Defense Nuclear Nonproliferation/ International Material Protection and Cooperation
MPC&A Buildings Upgrades – Cumulative number of buildings containing weapons-usable material with completed MPC&A upgrades
FY 2014 Target: 229 Result: 218
Met FY 2015 target.
FY 2015 Target: 221 Result: 221
In December 2014, Russian partner Rosatom told the U.S. that the scope of Material Protection, Control, and Accounting Cooperation (MPC&A) would be decreased, and that the remaining 8 buildings originally identified for joint MPC&A upgrades would be completed without U.S. assistance. Thus, 221 is the final number of buildings. Met 221 buildings (changed from 229).
The remaining 8 buildings will not be completed due to Russia’s decision to reduce the scope of MPC&A cooperation.

FY 2015 DOE ANNUAL PERFORMANCE REPORT 11 | P a g e
Second Line of Defense Sustainability – Cumulative number of Second Line of Defense fixed sites and Mobile Detection System deployments that are being indigenously sustained
FY 2014 Target: 431 Result: 412
FY 2015 Target: 490 Result: 488
NSAA missed the annual target because of on-going political instability in Lebanon. This instability prevented the scheduled transition of some sites to indigenous sustainment. This work remains a high priority and DOE/NNSA will keep working towards the transition of the remaining 2 detection systems to partner countries. Continued political instability in Lebanon prevented the scheduled transition of some sites to indigenous sustainment. NSDD expects these countries to take full responsibility for these sites in the next few years when internal challenges have been overcome.
NNSA
Defense Nuclear Nonproliferation/ Fissile Materials Disposition
U.S. Plutonium Disposition (H-Canyon) – Cumulative kilograms of plutonium converted to oxide at Savannah River H-Canyon
FY 2014 Target: 180 Result: 1
FY 2015 Target: 100 Result: 1.8
Through the end of the 4th quarter, SRNS produced ~9.6 kg of plutonium as oxide in HB-Line, with 1.8 kg meeting all MOX physical, chemical, and isotopic specifications. The difference is caused by the failure to meet moisture content specifications in the fuel as well as a criticality safety control violation in the production process. Due to extended effort to respond to a February criticality safety control violation, HB-Line was not able to achieve consistent plutonium oxide production operations as planned in FY 2015. During 4Q, HB-Line met their resumption schedule following the February incident, operating to produce a small amount additional Pu oxide. However, operations were once again paused following an August 2015 Technical Safety Requirement violation relative to criticality safety controls and procedural violations in HB-Line. SRNS is taking a comprehensive approach to addressing the incident that implements methodical action steps with senior management direct oversight. Resumption date is unknown at this time.

FY 2015 DOE ANNUAL PERFORMANCE REPORT 12 | P a g e
U.S. Plutonium Disposition (LANL) – Cumulative kilograms of plutonium metal converted to oxide at Los Alamos National Laboratory
FY 2014 Target: 692 Result: 617
FY 2015 Target: 792 Result: 667
NNSA missed the plutonium disposition target of 792 kg due to an extended shutdown of operations of the operating facility (PF-4). As of September 30, 2015, 50 kg of plutonium oxide were accepted at LANL, with a resulting cumulative total of 667 kg. The operational pause is due to conduct of operations and criticality safety concerns in PF-4 which impacted the ability to achieve this metric in FY 2015 and will continue to do so in FY 2016. Readiness activities at LANL are ongoing and will support resumption of processes that support oxide production during FY 2016.
EERE
Advanced Manufacturing
Superior Energy Performance – Increase number of manufacturing facilities certified in Superior Energy Performance by ANSI accredited bodies (cumulative number certified since the beginning of FY 2011)
FY 2014 Target: 40 Result: 22
FY 2015 Target: N/A Measure no longer active in FY15 – FY14 Results remain Not Met
EERE
Federal Energy Management Program
Federal Energy Management Program Contract – Reduce life-cycle energy consumption of federal facilities through increased performance contracting and technical assistance (thousand Btu life cycle energy savings)
FY 2014 Target: 57 thousand Btu savings
Result: 41.1 thousand Btu savings
FY 2015 Target: $750 Million federal investment in Facilities Energy Conservation Measures Government-Wide Result: $592 Million FY 2015 target not met.
Nuclear Energy
Nuclear Infrastructure
Facility Availability (Idaho Facilities Management Program) – Enable nuclear research and development activities by providing operational facilities and capabilities, as measured by availability percentages
FY 2014 Target: ≥ 80 Result: 77
FY 2015 Target: ≥ 80 Result: 77 FY 2015 target not met. Major equipment issues have affected the ability of the reactor to meet its schedule and have negatively impacted research activities, which rely on irradiation in ATR. This highlights the need for ATR to accelerate the maintenance and/or refurbishment of ATR systems and equipment, in order to improve equipment reliability and increase confidence in the reactor's ability to meet its programmatic commitments to its customers in a timely and cost effective manner.

FY 2015 DOE ANNUAL PERFORMANCE REPORT 13 | P a g e
Environmental Management
Tank Waste and Nuclear Materials
Depleted Uranium and Uranium (DU&U) –Number of metric tons of DU&U packaged in a form suitable for disposition
FY 2014 Target: 68,730 Result: 68,624
FY 2015 Target: 93,624 Result: 79,232 The EM program packaged for disposition a cumulative total of 79,232 metric tons of depleted and other uranium, 14,292 metric tons short of its target. The EM Program will evaluate its targets for FY 2016 to ensure the most safe and efficient operations of the Uranium Hexafluoride Conversion Facilities at both the Portsmouth and Paducah sites.
Liquid Waste – Thousands of gallons eliminated
FY 2014 Target: 7,343 Result: 6,592
FY 2015 Target: 7,592 Result: 6,862 Not Met At the end of FY 2015 the EM program eliminated a cumulative total of 6,862 thousands of gallon of liquid waste. The EM Program will adjust its FY 2016 target for this metric to reflect planned activities.
Environmental Management
Waste Management
Legacy and Newly Generated Low-Level Waste and Mixed Low-Level Waste – Cumulative cubic meters disposed
FY 2014 Target: 1,298,854
Result: 1,292,571
FY 2015 Target: 1,305,096 Result: 1,315,093 At the end of the fourth quarter of FY 2015, the EM program disposed of a cumulative total of 1,315,093 cubic meters of legacy and newly generated low-level and mixed low-level waste, 9,997 cubic meters above its target for FY 2015.
TRU Waste – Disposition of a cumulative total of cubic meters of transuranic waste consisting of Remote Handled TRU and Contact Handled TRU
FY 2014 Target: 102,591 Result: 99,179
FY 2015 Target: Not Met At the end of the fourth quarter of FY 2015, the EM program dispositioned a cumulative total of 102,026 cubic meters of combined Remote Handled and Contact Handled Transuranic Waste which included TRU waste that was characterized and disposed as Low Level Waste or Mixed Low Level Waste. Due to the suspension of WIPP operations and the ongoing recovery efforts, targets for the corporate performance metric, "Transuranic Waste Dispositioned," cannot be provided at this time. Efforts continue at TRU sites to process and characterize transuranic waste activities. Updated performance metric targets will be reported in the future.

FY 2015 DOE ANNUAL PERFORMANCE REPORT 14 | P a g e
Release Sites – Complete remediation work at a cumulative total of release sites
FY 2014 Target: 8,035 Result: 7,945
FY 2015 Target: 8,201 Result: 8,027 Not Met The EM program adjusted its targets for Release Sites completed in FY 2015 to a cumulative target of 8,201 release sites, which included the unmet goals in FY 2014. At the end of FY 2015 the EM Program completed a cumulative total of 8,027 release sites.
Chief Information Officer
Continuous Monitoring – Implement automated Continuous Monitoring of security controls to provide the Department with higher cybersecurity protection (percentage)
FY 2014 Target: 95 Result: 94
FY 2015 Target: 63 Result: 64 The Continuous Monitoring performance measure for all management capabilities combined exceeded the target goal of 63%.
Remote Access 2 Factor PIV Access – Manage and implement PIV access to provide the Department with higher cybersecurity protection (percentage)
FY 2014 Target: 70 Result: 25
FY 2015 Target: 26 Result: 23 The Strong Authentication (PIV/ICAM) performance measure which includes Privileged and Unprivileged Network User capabilities did not meet their target goals throughout the year except for Q3 FY15.
Trusted Internet Connection and Managed Trusted Internet Protocol Service – Manage and implement TIC and MTIPS consolidation in order to provide the Department with higher cybersecurity protection (percentage)
FY 2014 Target: 95 Result: 72
FY 2015 Target: N/A Based on guidance from DHS, the Trusted Internet Connection (TIC)/MTIPS measure is no longer considered a CAP Goal for FY 2015. As a result, these measures are no longer applicable and should be inactivated.
Project Management
Project Success – On a 3-year rolling basis, the percentage of departmental projects baselined since the start of FY 2008 that were completed within the original scope baseline and not to exceed 110% of the cost as reflected in the performance baseline established at Critical Decision 2
FY 2014 Target: 90 Result: 76
FY 2015 Target: 90 Result: 77
Actions Taken: To bring the activity back on track, a working group of DOE’s most senior project managers produced an in-depth analysis of project management in a report entitled “Improving Project Management” which resulted in a Secretarial policy memorandum, “Improving the Department’s Management of Projects” released by the Secretary on December 1, 2014. Based on the report and policy memorandum, and drawing from industry and government best practices, the Department took several steps to supplement ongoing efforts to improve project management, including:

FY 2015 DOE ANNUAL PERFORMANCE REPORT 15 | P a g e
strengthening the Energy Systems Acquisition Advisory Board (ESAAB), establishing a Project Management Risk Committee (PMRC), and improving the lines of responsibility and the peer review process. In a memorandum dated June 8, 2015, entitled “Project Management Policies and Principles”, the Secretary further enhanced and clarified departmental policy related to areas of project management to include analysis of alternatives, cost estimating, planning and scheduling, and design management, among others. The Secretary further directed that all requirements of DOE Order 413.3B, Program and Project Management for the Acquisition of Capital Assets, were applicable for all capital asset projects having a Total Project Cost (TPC) of $10 million or greater versus the $50 million threshold originally specified in the Order, and that a limited update to the Order be immediately undertaken to incorporate all recent Secretarial policy memorandums.
Loan Programs Generation Capacity of Projects Receiving Loan Guarantees – Annual generation capacity from projects receiving DOE loan guarantees that have achieved commercial operations (gigawatts)
FY 2014 Target: ≥ 3.8 Result: 3.2
Exceeded FY 2015 target. FY 15 Target: ≥ 3.8 Result: 3.82
Program Inventory The following table presents the FY 2015 inventory of DOE programs and shows the relationship between the DOE strategic goals, objectives, and program activities.
Goal Objective Program Activity 1. Science and Energy - Advance foundational science, innovative energy technologies, and inform data driven policies that enhance U.S. economic growth and job creation, energy security, and environmental quality, with
Strategic Objective 1 – Advance the goals and objectives in the President’s Climate Action Plan by supporting prudent development, deployment, and efficient use of energy resources that also create new jobs and industries
Advanced Research Projects Agency-Energy
Electricity Delivery and Energy Reliability
Energy Efficiency and Renewable Energy
Energy Information Administration
Energy Policy and Systems Analysis

FY 2015 DOE ANNUAL PERFORMANCE REPORT 16 | P a g e
emphasis on implementation of the President’s Climate Action Plan to mitigate the risks of and enhance resilience against climate change
Strategic Objective 2 – Support a more economically competitive, environmentally responsible, secure and resilient U.S. energy infrastructure
Fossil Energy
Indian Energy Policy and Programs
International Affairs
Loan Programs
Nuclear Energy
Power Marketing Administrations
Science
Strategic Objective 3 – Deliver the scientific discoveries and major scientific tools that transform our understanding of nature and strengthen the connection between advances in fundamental science and technology innovation
Goal Objective Program Activity 2. Nuclear Security:
Strengthen national security by maintaining the nuclear
stockpile and modernizing nuclear security
infrastructure, reducing
global nuclear threats, providing for nuclear
propulsion, improving physical and cybersecurity,
and strengthening key science, technology, and
engineering capabilities
Strategic Objective 4 – Maintain the safety, security and effectiveness of the nation’s nuclear deterrent without nuclear testing
National Nuclear Security Administration
Intelligence and Counterintelligence
International Affairs
Strategic Objective 5 – Strengthen key science, technology, and engineering capabilities and modernize the national security infrastructure
Strategic Objective 6 – Reduce global nuclear security threats
Strategic Objective 7 – Provide safe and effective integrated nuclear propulsion systems for the U.S. Navy
Goal Objective Program Activity 3. Management and
Performance: Position the
Department of Energy to meet the challenges of the
21st century and the nation’s Manhattan Project and Cold
War legacy responsibilities by employing effective
management and refining operational and support
Strategic Objective 8 – Continue cleanup of radioactive and chemical waste resulting from the Manhattan Project and Cold War activities
Environmental Management
Legacy Management
Chief Financial Officer
Chief Human Capital Officer
Chief Information Officer
Congressional and Intergovernmental Affairs
Strategic Objective 9 – Manage assets in a sustainable manner that supports the DOE mission
FY 2015 DOE ANNUAL PERFORMANCE REPORT 17 | P a g e
capabilities to pursue departmental missions
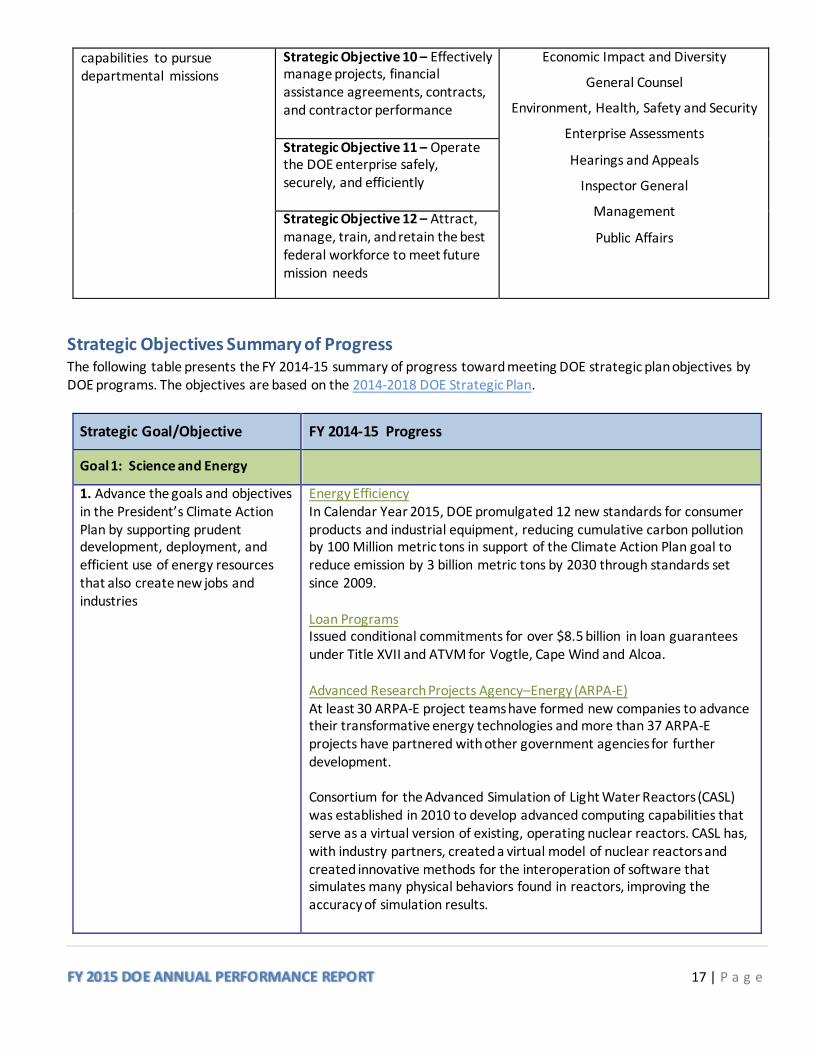
Strategic Objective 10 – Effectively manage projects, financial assistance agreements, contracts, and contractor performance
Economic Impact and Diversity
General Counsel
Environment, Health, Safety and Security
Enterprise Assessments
Hearings and Appeals
Inspector General
Management
Public Affairs
Strategic Objective 11 – Operate the DOE enterprise safely, securely, and efficiently Strategic Objective 12 – Attract, manage, train, and retain the best federal workforce to meet future mission needs
Strategic Objectives Summary of Progress The following table presents the FY 2014-15 summary of progress toward meeting DOE strategic plan objectives by DOE programs. The objectives are based on the 2014-2018 DOE Strategic Plan.
Strategic Goal/Objective FY 2014-15 Progress
Goal 1: Science and Energy
1. Advance the goals and objectives in the President’s Climate Action Plan by supporting prudent development, deployment, and efficient use of energy resources that also create new jobs and industries
Energy Efficiency In Calendar Year 2015, DOE promulgated 12 new standards for consumer products and industrial equipment, reducing cumulative carbon pollution by 100 Million metric tons in support of the Climate Action Plan goal to reduce emission by 3 billion metric tons by 2030 through standards set since 2009. Loan Programs Issued conditional commitments for over $8.5 billion in loan guarantees under Title XVII and ATVM for Vogtle, Cape Wind and Alcoa. Advanced Research Projects Agency–Energy (ARPA-E) At least 30 ARPA-E project teams have formed new companies to advance their transformative energy technologies and more than 37 ARPA-E projects have partnered with other government agencies for further development. Consortium for the Advanced Simulation of Light Water Reactors (CASL) was established in 2010 to develop advanced computing capabilities that serve as a virtual version of existing, operating nuclear reactors. CASL has, with industry partners, created a virtual model of nuclear reactors and created innovative methods for the interoperation of software that simulates many physical behaviors found in reactors, improving the accuracy of simulation results.

FY 2015 DOE ANNUAL PERFORMANCE REPORT 18 | P a g e
2. Support a more economically competitive, environmentally responsible, secure and resilient U.S. energy infrastructure
Electricity Delivery and Reliability Energy storage, cybersecurity, and energy impact analyses goals have been met. Key milestones include the deployment of analytical methodology to forecast impacts from hurricanes and demonstrating a tool that designs-in enhanced communications security between control centers. Supported development and testing of multiple technologies that advance resilience and responded to five severe weather events in FY 2014, providing information to decision-makers using Eagle-I. Also provided support to states assessing impacts of climate change and tools for improving the reliability of the grid. Energy Information Administration Several projects underway that will fill data gaps and improve public understanding of key factors impacting the nation’s energy infrastructure. These include:
Playing a significant role in the trilateral U.S./Canada/Mexico initiative to exchange views on and projections for cross-border flows of energy; compare respective import and export information on energy flows to validate data and improve data quality; share geographic information system data files reflecting energy infrastructure; and develop a cross-reference for terminology commonly used in the energy sector.
Developing first-ever hourly collection of electricity load data from the nation’s balancing authorities that will provide timely insights into grid functionality.
Implementing monthly collection of oil and natural gas production data, including data on API gravity as a measure of oil quality to enable better understanding of market fundamentals related to increased domestic production.
Updating and extending models to address new developments in the electricity sector, including effects of expanded energy efficiency programs and the regulation of carbon dioxide emissions.
Continuing to expand the State Energy Portal, mapping system, and state outreach to improve information accessibility to key stakeholders.
Fossil Energy – Strategic Petroleum Reserve Conducted a successful test sale in FY2014, providing lessons learned that will improve future drawdowns. Phases of the site oil tank repair and roof conversion on Bryan Mound Tank 2 (BMT-2) will continue until the beginning of FY2018. In addition, oil tank repair and roof conversion is now required for Bryan Mound Tank 4 (BMT-4) which has a scheduled completion that is subject to availability of funding. The restoration of these tanks are an integral part of maintaining a drawdown rate of 4.4 million barrels a day.
3. Deliver the scientific discoveries and major scientific tools that transform our understanding of nature and strengthen the
Science
Incorporated science user facility prioritization into program planning efforts.

FY 2015 DOE ANNUAL PERFORMANCE REPORT 19 | P a g e
connection between advances in fundamental science and technology innovation
Identified programmatic drivers and technical requirements in coordination with other Departmental mission areas to inform future development of high performance computing capabilities and in anticipation of capable exascale systems.
Discovery-Focused Research Awarded $100 million under the FastForward 2 program to develop
critical technologies needed to deliver computing capabilities that will enable affordable and energy-efficient advanced extreme scale computing research and development for the next decade.
Awarded $100 million to fund 32 Energy Frontier Research Centers
Initiated the first set of Computational Materials Sciences awards in support of the Materials Genome Initiative.
Announced breakthroughs in bioenergy sciences, including the identification of new genes involved in plant cell wall biosynthesis, development of new engineered plants with “zip-lignins” incorporated into cell wall structural components that produce plants far easier to break down to lignocellulosic sugars and development of engineered bacteria that can tolerate and grow in presence of ionic liquids (used to breakdown biomass), thereby improving overall biofuel production costs.
NOvA (Neutrinos at Main Injector (NuMI) Off-axis Neutrino Appearance), currently the longest baseline and highest intensity neutrino experiment in the world, produced its first results.
The Relativistic Heavy Ion Collider set new luminosity records in FY 2014; the higher the luminosity, the higher the probability that rare nuclear events will occur frequently enough to enable new discoveries about the state of matter that existed under the extreme conditions that occurred soon after the Big Bang.
The DOE Isotope Program initiated a tri-laboratory research effort to demonstrate the feasibility of large scale production of Ac-225, a high priority alpha-emitter for cancer therapy.
Scientific User Facilities Approximately 31,000 researchers from universities, national
laboratories, industry, and international partners are have used the Office of Science national user facilities in FY 2014 and FY 2015.
Final funding/successful completion of many construction and major items of equipment projects during FY 2014-2015, including: o National Synchrotron Light Source-II (NSLS-II, BES) o NUMI Off-axis Neutrino Appearance (NOvA, HEP) o The Energy Sciences Building (ESB, SLI) o SNS Instruments - Next Generation-II (SING-II, BES)
Goal 2: Nuclear Security

FY 2015 DOE ANNUAL PERFORMANCE REPORT 20 | P a g e
4. Maintain the safety, security and effectiveness of the nation’s nuclear deterrent without nuclear testing
National Nuclear Security Administration
Maintained 100% of the warheads in the stockpile as safe, secure, reliable, and available.
Conducted activities necessary to complete planned W76-1 production in FY 2019 and achieve the first B61-12 production unit in FY 2020.
Defense Nuclear Security Developed a “Nuclear Security Roadmap” leading to near- and long-term strategic planning across the eight NNSA sites. The Roadmap was provided to GAO and Congress. This Roadmap includes strategies for completion/expansion of the above “achievements” and establishes additional business processes to promote a secure NNSA enterprise. Advanced Simulation and Computing
FY 2015 - Provided models for complex hydrodynamic processes that are sufficiently predictive to enable design and assessment of various stockpile options.
FY 2016 - Refined models for complex hydrodynamic processes that are sufficiently predictive to enable design and assessment of various stockpile options.
5. Strengthen key science, technology, and engineering capabilities and modernize the national security infrastructure
Advanced Scientific Computing Initiated calculations in support of improving boost models by September 2017. Inertial Confinement Fusion
Drafting the 10-year HED Strategic Plan, the foundation of the multi-year planning efforts of the Inertial Confinement Fusion and High Energy Density research.
Working on completion of the initial set of experiments defined in the 10-year HED Strategic Plan by September 2018.
Weapons
Implementing Phase 1 (development, initiation, and small-scale pilot) of the Asset Management Program (AMP), a systems-engineering approach to facilities investment. The AMP is aimed at addressing enterprise-wide modernization needs and achieving economies-of-scale efficiencies in cost and schedule. Heating, Ventilation, Air Conditioning systems have been identified as the top priority to be deployed by the AMP.
An additional 20 recapitalization projects are scheduled to be complete in FY 2017.
FY 2016 Congressional Budget Request includes a new performance measure to demonstrate improvement in infrastructure modernization.

FY 2015 DOE ANNUAL PERFORMANCE REPORT 21 | P a g e
6. Reduce global nuclear security threats
Global Threat Reduction Initiative Goal was to remove or confirm disposition of 5,332 kilograms of highly-enriched uranium and plutonium. Looking into the possibility of accelerating a shipment of highly-enriched uranium from France and confirming the disposition of material in France.
7. Provide safe and effective integrated nuclear propulsion systems for the U.S. Navy
Naval Reactors Completed A1B reactor plant design for the next-generation aircraft carrier.
Goal 3: Management and Performance
8. Continue cleanup of radioactive and chemical waste resulting from the Manhattan Project and Cold War activities
Environmental Management Goal is to retrieve tank waste, close tanks, and dispose of transuranic waste within cost and schedule – got behind schedule and did not meet goals.
9. Manage assets in a sustainable manner that supports the DOE mission
Legacy Site Responsibility Transfer of the five remaining sites has been postponed to FY 2017 or later due to delays in the cleanup activities of the U.S. Army Corps of Engineers and the private licensees charged with the cleanup of former uranium mills. Sustainability An emphasis for DOE is to improve performance in improving buildings to address sustainability. Currently, only 4.7% of DOE buildings are in compliance with the Guiding Principles for High Performance Sustainable Buildings, which is the only sustainability goal on which DOE lags. DOE facilities consist of unique scientific laboratories, accelerators, light sources, supercomputers, data centers, industrial facilities, and traditional office space environments. DOE is challenged with integrating sustainability into aging infrastructure with energy intensive processes or designating more buildings for disposition. DOE is working with all sites to implement best practices and evaluate performance contracting opportunities. Sites are working independently to install lighting upgrades, high-efficiency water fixtures, occupancy sensors, metering, and other energy efficiency and sustainable enhancements.
10. Effectively manage projects, financial assistance agreements, contracts, and contractor performance
Project Management Goal was to complete 90% of Departmental projects within the original scope baseline and not to exceed 110% of the cost – did not meet this goal. Acquisition Workforce The DOE goals for managing and strengthening the acquisition workforce through FY 2015 include plans to strengthen the capacity and capability with current staffing. In addition to continuing previous initiatives. Some specific examples include:

FY 2015 DOE ANNUAL PERFORMANCE REPORT 22 | P a g e
Leveraging best practices from one organization to the next through knowledge sharing through the EPiC intranet.
Creating the infrastructure to support alternative delivery methodologies and learning how to deliver and determine demand in a virtual structure. Desktop delivery training has proved to be a great way to develop the workforce and deliver training cost effectively.
Participating as members of Procurement Management Reviews at other sites, provides valuable opportunities for the workforce to learn from each other.
Implementing and expanding the utilization of FAITAS as a complete workforce certification and management tool.
Workforce Development Authority Aligning workforce professional development authority at the appropriate level. Revised workforce professional development order and will be implementing new authorities at lower organizational levels.
11. Operate the DOE enterprise safely, securely, and efficiently
National Laboratories
Achieved full operational capability of the Joint Cybersecurity Coordination Center (JC3), including TS-SCI operations.
Established the Lab Policy Council.
Established the Lab Operations Board. Improved stewardship of national assets across the national
laboratories and DOE operating sites. IT Policy and Governance Recently released FITARA legislation was a major priority in FY 2015. The Department ensured that the guidance and requirements prescribed in FITARA are worked on collaboratively with enterprise-wide input with the goal of executing as efficiently as possible.
Cybersecurity
Enhancing DOE's reputation as a responsible interagency partner in information sharing and safeguarding.
Continuing to meet and work with DHS and will initiate outreach to the DOE Enterprise with guidance and support to participate in Phase 2 exercises for CDM.
Developed the Incident Management Core Competency Training Module. This course is available to all DOE Cybersecurity and Information Technology professionals through the Online Training Center and the DOE Contractor Training Site. A course in Supply Chain Risk Management for Program Managers is also now available.
Enterprise Supply Chain Risk Management (eSCRM) program will continue to refine its processes and services to reach full operating capability (per CNSS Directive 505) during FY 2016. The eSCRM capability continues to mature and expand, leveraging innovations in supply chain management to

FY 2015 DOE ANNUAL PERFORMANCE REPORT 23 | P a g e
strengthen and secure the foundations of our acquisition activities and underlying infrastructure.
Technology and Innovation Completed the following:
Version 2 of the primary system requirements; Representative software application inventories from all six team
members;
Evaluation of OneID (NNSA prototype) as a possible model solution; Hire an experienced, dedicated program manager;
Develop a formal program plan.
Energy IT Services
Continuous Monitoring – create a dashboard with Risk Heat Map or similar visualization of risk.
Major Security Events – plan to continue vigilance in identifying and mitigating security events.
Microsoft Office 365 e-mail migrations completed. Enterprise Assessments Executed a 2015 assessment schedule, including performance evaluations, for the following areas: cyber security, physical and information security, nuclear safety, environmental safety, worker safety and health, and emergency management. Completed over 80 assessments of DOE enterprise assets and facilities (including NNSA) during 2014. Exceeded the number of completed assessments during 2015.
12. Attract, manage, train, and retain the best federal workforce to meet future mission needs
Human Resources (HR) In the process of improving delivery of HR services and consolidating multiple HR offices into consolidated service centers. This effort will continue into FY 2016.
Program Performance Goals Detailed progress reports on DOE programs’ annual performance goals are presented in the pages that follow. The tables are organized by program and sub-program and provide targets and results for FY 2011 through 2015.

FY 2015 DOE ANNUAL PERFORMANCE REPORT 24 | P a g e
Federal Salaries & Expenses
NNSA Federal Salaries & Expenses
The mission of Office of the Administrator is to create a well-managed, inclusive, responsive, and accountable organization through the strategic management of human capital and acquisitions and integration of budget and performance data.
Program NNSA Federal Salaries & Expenses
Performance Goal (Measure) Federal Administrative Costs - Maintain the Federal Salaries and Expenses federal administrative costs as a percentage of total Weapons Activities and Defense Nuclear Nonproliferation program costs at less than 6%.
Fiscal Year 2011 2012 2013 2014 2015
Target 5.9 % 5.9 % 5.9 % 5.9 % 5.9 %
Result Exceeded - 4.5 Exceeded - 4.1 Exceeded - 4.2 Exceeded - 4.1 Met - 3.9
Endpoint Target In keeping with OMB and DOE expectations that administrative costs be minimized, maintain the Office of the Administrator Federal administrative costs as a percentage of total Weapons Activities and Defense Nuclear Nonproliferation program costs at less than 6%.
Commentary on 2015 Results (Action Plan if Not Met)
Achieved the annual target of the NNSA Federal administrative costs as a percentage of total Weapons Activities and Defense Nuclear Nonproliferation program costs at 5.9 percent or less. FY 2015 result is 3.9 percent. This result is important because it demonstrates a prudent use of valuable resources.
Documentation, Limitations, Methodology, Validation, and Verification
DOE accounting report; Excel spreadsheet with percent calculations
Weapons Activities
Directed Stockpile Work
Maintain the U.S. nuclear weapons stockpile and dismantle excess nuclear weapons to meet national nuclear security requirements as assigned by the President through the Nuclear Posture Review.
Program Directed Stockpile Work
Performance Goal (Measure) Annual Warheads Certification - Annual percentage of warheads in the stockpile that is safe, secure, reliable, and available to the President for deployment.
Fiscal Year 2011 2012 2013 2014 2015
Target 100 % of stockpile certified
100 % of stockpile certified
100 % of stockpile certified
100 % of stockpile certified
100 % of stockpile certified
Result Met - 100 Met - 100 Met - 100 Met - 100 Met - 100

FY 2015 DOE ANNUAL PERFORMANCE REPORT 25 | P a g e
Endpoint Target Annually, maintain 100% of warheads in the stockpile as safe, secure, reliable, and available to the President for deployment.
Commentary on 2015 Results (Action Plan if Not Met)
The target was met. Accomplishments: During the fourth quarter the National Laboratories issued the final Cycle 20 Annual Assessment Reports (AARs) for each weapon system in the stockpile. Additionally, the National Laboratories issued the 2015 Annual Assessment Letters that discusses the current state and health of the stockpile in preparation for the FY 2015 Report on Stockpile Assessments to the President.
Documentation, Limitations, Methodology, Validation, and Verification
1) NNSA National Laboratories published Warhead Annual Assessment Reports/Weapon Reliability Reports; 2) Laboratory Director Annual Assessment Letters; 3) Cycle 20 Execution Plan
Program Directed Stockpile Work
Performance Goal (Measure) Retired Weapons Systems Dismantlement - Complete the dismantlement of all weapons systems in excess to stockpile requirements per approved annual schedule published in the Production and Planning Directive (P&PD), Program Control Documents (PCDs), and Requirements and Planning Document (RPD) “annual” documentation with the goal of balancing dismantlement work by mitigating gaps in future stockpile reductions.
Fiscal Year 2011 2012 2013 2014 2015
Target N/A 100 % of annual planned
dismantlements
100 % of annual planned
dismantlements
100 % of annual planned
dismantlements
100 % of annual planned
dismantlements
Result Exceeded - 112 Not Met - 88 Met - 100 Not Met - 66
Endpoint Target Complete by FY 2021 the dismantlement of all weapons systems retired prior to 2009. Note: The Dismantlement Annual Performance Goal was changed to complete the recommendation against the finding in the GAO Draft Report: GAO-14-206C, Nuclear Weapons: Actions Needed by NNSA to Clarify Dismantlement Performance Goal.
Commentary on 2015 Results (Action Plan if Not Met)
The target was not met for FY 2015. During 4Q, the Agency made plans to increase dismantlement activities in response to Secretary Kerry’s announcement that the President will seek to accelerate dismantlement by 20%. However, NNSA contractors fell behind the target of 100% dismantlements scheduled to be completed in FY 2015. Adverse weather, safety, management, and authorization reviews also delayed scheduled dismantlement activities. Safety reviews required by DOE orders involved responding to unresolved safety questions that arose while NNSA was dismantling several weapons, and safety evaluations of the proposed engineering solutions. In addition, management and authorization reviews were conducted to approve proposed solutions. Solutions included process changes and new tooling. Although Weapons Dismantlement and Disposition (WDD) is behind schedule for 2015, NNSA expects to meet the 2022 commitment. This result is important because it demonstrates NNSA’s commitment to the President’s vision for reducing nuclear dangers and pursuing the long-term goal of a world without nuclear weapons. As

FY 2015 DOE ANNUAL PERFORMANCE REPORT 26 | P a g e
defined by the 2010 Nuclear Posture Review (NPR), this target is a concrete demonstration of meeting our Non-Proliferation Treaty (NPT) Article VI obligation to make progress toward nuclear disarmament. Action Plan: NNSA is evaluating FY 2015 4Q results and re-baselining dismantlement schedules to recover as much of FY 2015 as possible in FY 2016 while retaining the FY 2016 planned schedule.
Documentation, Limitations, Methodology, Validation, and Verification
1) Current DSW Planning and Production Directive (P&PD) (workload planning documentation); 2) Program Control Documents (for individual weapons); 3) Requirements and Planning Document (RPD) DoD/DOE Nuclear Weapons Council (NWC); 4) Nuclear Weapons Dismantlement Program Plan of record; and 5) 2008 Report to Congress on NNSA Nuclear Weapons Dismantlement.
Program Directed Stockpile Work
Performance Goal (Measure) Steady State W-76-1 LEP Production - The percentage of planned builds equal to the percentage of allocated funding as represented in the annual Selected Acquisition Report (SAR).
Fiscal Year 2011 2012 2013 2014 2015
Target N/A N/A N/A 100 % of scheduled unit builds
100 % of scheduled unit builds
Result Met - 100 Not Met - 85
Endpoint Target Complete production of the NWC-approved W76-1 LEP production schedule by FY 2019. Note: This performance measure is used to track progress on the Nuclear Weapons agency priority goal.
Commentary on 2015 Results (Action Plan if Not Met)
The FY 2015 target was not met and the Agency achieved only 85% of the annual target of producing 100% of allocated War Reserve (WR) unit builds of the Nuclear Weapons Council-approved W76-1 Life Extension Program as represented in the annual Selected Acquisition Report (SAR). NNSA successfully recovered behind schedule production deliverables at the end of June 2015 due to Mass Properties testing and safety basis issues. However, the W76-1 LEP did not meet the FY 2015 production baseline due to several production issues, complicated by the Pantex Metal Trades Council strike, which arose after achievement of the production recovery in June 2015. The Agency completed its deliveries of WR units to the Navy through September 2015 in accordance with the negotiated Defense Programs and Navy delivery schedule without impact to the Navy’s fleet deployment schedules. This result is important because extending the life of the W76-0, a weapon system for Navy submarines, is on a highly success-oriented refurbishment schedule to meet DoD requirements and national security needs. Action Plan: NNSA is developing a plan to recover the FY 2015 production shortfall in FY 2016.
Documentation, Limitations, Methodology, Validation, and Verification
1) W76-1 Selected Acquisition Report(s); 2) Planning and Production Directive (P&PD) current FY revision); 3) W76-01 Program Control Document 2013-C dated 05-02-13; 4) Requirements and Planning Directive (RPD) current revision; 5) Life Extension Program Management Plan dated 01-24-03; 6) W76 LEP NNSA Project Plan (as revised) – provides a summary of the activities and schedules necessary to accomplish the W76-1/Mk4A refurbishment; 7) NNSA memorandum from J.M. Oder, Office of Nuclear Weapon Stockpile, NA-122, to Distribution, "Update to Production and Planning Directive 2011-1," dated February 21, 2012; 8)

FY 2015 DOE ANNUAL PERFORMANCE REPORT 27 | P a g e
Microsoft Excel Spreadsheet, "Cost Estimating for the W76 LEP 12/29/2011 Rev. 7," dated September 27, 2012; 9) NNSA memorandum from J.M. Oder, Office of Nuclear Weapon Stockpile, NA-122, to Distribution, "Update to W76-1 Production (U)," dated March 12, 2013.
Program Directed Stockpile Work
Performance Goal (Measure) Tritium Production - Cumulative number of Tritium-Producing Burnable Absorber Rods irradiated in Tennessee Valley Authority reactors to provide the capability of producing new tritium to support national security requirements.
Fiscal Year 2011 2012 2013 2014 2015
Target 1,328 TPBARs 1,872 TPBARs 1,872 TPBARs 2,416 TPBARs 3,120 TPBARs
Result Met - 1,328 Met - 1,872 Met - 1,872 Met - 2,416 Met - 3,120
Endpoint Target By the end of FY 2020, complete irradiation of 6,768 Tritium-Producing Burnable Rods (TPBARs) to provide tritium for nuclear weapons. Note: Irradiation of TPBARs is completed every 18 months, or 1.5 years, in approximately October or March. For FY 2016, the irradiation cycle started in October of 2015 and will complete in March 2017. Thus, there is no increase to the number of TPBARs irradiated in FY 2017 and, for the same reason, no increase in FY 2018 or FY 2019. This performance measure was moved from the Readiness Campaign in the FY 2014 appropriation.
Commentary on 2015 Results (Action Plan if Not Met)
The annual target was met completing the irradiation of 704 Tritium Producing Burnable Absorber Rods (TPBARs) thereby increasing the cumulative quantity of completely irradiated TPBARs to 3,120. These 704 TPBARs started irradiation in March 2014, and completed their 18 month irradiation cycle mid-September 2015. The program also completed the fabrication and delivery of the FY 2016 quantity of TPBARs for irradiation. This result is important because irradiation and extraction of tritium is essential to meeting national security requirements.
Documentation, Limitations, Methodology, Validation, and Verification
Milestones supporting the performance measure are documented in the Campaign’s plans; Site acceptance reports or other appropriate documentation (if classified, cover pages submitted including applicable document record numbers and information on how to obtain a copy of the report); Weekly site status calls with the Federal Program Manager; End of cycle reports submitted by the Tennessee Valley Authority (TVA); Quarterly Project Reviews (attended by TVA); Milestone Reporting Tool (MRT) status reports.
Science
The Science Campaign develops our nation’s scientific capabilities and experimental infrastructure used to assess the safety, security, reliability, and performance of the nuclear explosives package (NEP) without reliance on further underground testing. The Science Campaign supports this evaluation by developing certification and assessment tools and the experimental platforms to inform, validate, and provide confidence in our essential predictive capabilities. Its science-based approach provides the fundamental knowledge needed to: (1) provide a quantitative measure of confidence in weapons

FY 2015 DOE ANNUAL PERFORMANCE REPORT 28 | P a g e
performance; (2) address and reduce uncertainties in our predictive capabilities; (3) predict the performance of the NEP as components age; (4) inform decisions for Stockpile Stewardship Programs; and (5) exercise readiness capabilities through experiments and assessments.
Program Science
Performance Goal (Measure) Experimentally Validated Physics Models - Cumulative percentage of progress in delivering an experimentally validated physics-based capability to enable assessment of weapon performance with quantified uncertainties, replacing key empirical parameters in the nuclear explosive package.
Fiscal Year 2011 2012 2013 2014 2015
Target 63 % of progress 68 % of progress 72 % of progress 76 % of progress 80 % of progress
Result Met - 63 Met - 68 Met - 72 Met - 76 Met - 80
Endpoint Target By the end of FY 2020, use modern physics models in assessment calculations to replace the major empirical parameters affecting weapon performance. This activity is performed in collaboration with the ICF Campaign.
Commentary on 2015 Results (Action Plan if Not Met)
The target was met by achieving 80% progress in replacing key empirical parameters in the nuclear explosive package assessment with first principles physics models developed by validation with experiment. Performance Capability Framework (PCF) 4Q accomplishments include: Science Campaign work is complete for the technical foundation for certification of the level 1 pit reuse milestone, a PCF Pegpost and major achievement. Completed high energy density (HED) experiments providing data on the behavior of materials in extreme regimes relevant for stockpile primaries. Three boost experiments were completed last quarter to support the National Boost Initiative. Properties of 50 year old plutonium were measured. Final preparations were made to support the Orpheus experiment to be conducted at Nevada underground facility (U1a). The third planned plutonium experiment on the Z machine at Los Alamos National Laboratory was completed in September. Studies for safety improvements including insensitive high explosives were part of several successful milestones. Energy Balance II is proceeding and had a successful milestone in Q4 along with several other Secondary Assessment Technology experiments. This result is important because it will improve nuclear weapon certification confidence and underpins continued progress expected in FY 2016.
Documentation, Limitations, Methodology, Validation, and Verification
Predictive Capability Framework, Milestone Reporting Tool, White Paper on Quantification of Margins and Uncertainty Performance Measure
Engineering
The Engineering Campaign provides the modern tools and capabilities needed to ensure the safety, security, reliability and effectiveness of the United States nuclear weapons stockpile. It provides the fundamental and sustained engineering basis for stockpile certification and assessments that are needed throughout the entire lifecycle of each weapon. The Engineering Campaign funds activities that assess and improve fielded nuclear and non-nuclear engineering components without further underground testing. Additionally, this Campaign increases the ability of the National Nuclear Security Administration (NNSA) to predict the response of weapon components and subsystems to harsh environments and to the effects of aging. In accordance with the 2010 Nuclear Posture Review Report, the Engineering Campaign directly supports “strengthening the science, technology, and engineering

FY 2015 DOE ANNUAL PERFORMANCE REPORT 29 | P a g e
(ST&E) base needed for conducting weapon system LEPs, maturing advanced technologies to increase weapons surety, qualification of weapon components and certifying weapons without nuclear testing, and providing annual stockpile assessments through weapons surveillance.”
Program Engineering
Performance Goal (Measure) Technology Maturation Capabilities - The annual progress towards the maturation of technologies and stockpile assessment capabilities as measured by the number of deliverables in the implementation plans completed.
Fiscal Year 2011 2012 2013 2014 2015
Target N/A 21 deliverables 21 deliverables 20 deliverables 22 deliverables
Result Met - 21 Met - 21 Met - 20 Met - 22
Endpoint Target Until the last nuclear weapon system in the stockpile is dismantled, NNSA will continue to mature technologies and stockpile assessment capabilities to support Directed Stockpile Work (DSW) nuclear weapons refurbishment and assessment activities.
Commentary on 2015 Results (Action Plan if Not Met)
The target was met. Achievement was validated by the on time, on budget completion of FY 2015 milestones and deliverables. Significant accomplishments for 4Q includes Multi-Point Safety (MPS) concepts development completion at LANL/LLNL/SNL; Engineering maturation of highest priority surety component to TRL 3+; SRNL developed all resource loaded schedules for Advanced Hydrogen Tritium Thermal Cycling Absorption Process (HT-TCAP), Tritium Water Processing, Reservoir Unloading Purification System (RUPS), Hydrogen Processing Demonstration Facility, and Advanced Storage. These results are important because they ensure the tools and component technologies required to support the safety, security, reliability, and performance of the current and future US nuclear stockpile are available when needed.
Documentation, Limitations, Methodology, Validation, and Verification
Milestones and a table of deliverables supporting the performance measures are documented in the Program Implementation Plan (PIP). Weekly and monthly site status calls with the Federal Program Managers are documented. Milestone Reporting Tool (MRT) status reports also document progress performance on a quarterly basis. In addition, bi-annual and annual accomplishments are provided by the sites to Federal Program Manager in formal program reviews. Federal Program Manager and staff confirm capabilities completion during site field visits and Program Reviews.
Inertial Confinement Fusion Ignition and High Yield
The Inertial Confinement Fusion Ignition and High Yield (ICF) Campaign supports the U.S. Department of Energy’s (DOE) nationa l security goals by providing scientific understanding and experimental capabilities in high-energy-density (HED) physics for the validation of codes and models necessary to maintain a safe, secure, and effective nuclear weapons stockpile without underground testing.
Program Inertial Confinement Fusion Ignition and High Yield
Performance Goal (Measure) High Energy Density Physics Research - Cumulative percentage of progress towards completion of the high energy density physics research needed to support the nuclear weapons program as embodied in the Predictive Capability Framework (PCF).

FY 2015 DOE ANNUAL PERFORMANCE REPORT 30 | P a g e
Fiscal Year 2011 2012 2013 2014 2015
Target N/A N/A N/A N/A 10 % of progress (cumulative)
Result Met - 10
Endpoint Target By FY 2024, complete the ICF Program activities needed to complete the PCF pegposts, including demonstrating advanced burning plasma concepts that improve predictive capabilities and the application of physics for achieving ignition. These activities are performed in collaboration with the Science program within the Office of Research and Development.
Commentary on 2015 Results (Action Plan if Not Met)
The annual target was met. All major ICF facilities have completed, or exceeded, their respective planned number of effective shots. During September 2015, SNL successfully completed four complex, fully integrated, MagLIF experiments on Z, bringing the total of fully integrated shots for FY 2015 to 12. The MagLIF shot series successfully isolated the impact of liner height, window thickness, and target end-cap materials on contaminant mix in the fuel. These results are important for they contribute to a better understanding of the complex physics associated with the ignition domain.
Documentation, Limitations, Methodology, Validation, and Verification
1. Program Implementation Plans for ICF Program (NA-112) and Research and Development Program (Science, NA-113) document annually the program of work to be accomplished in support of the PCF, including Program Milestones. 2. Milestone Reporting Tool (MRT) reports: Progress toward and completion of annual milestones as documented and reported quarterly in the Milestone Reporting Tool (MRT) System. 3. Quarterly Reports by the HED Council and the ICF Council on the execution of the planned HED program of work on the major HED facilities. The planned program of work is derived from the PCF. The Councils establish their experimental campaign plans in support of the key performance indicators above, and are further supported through the milestones documented in the ICF and Science Program Implementation Plans.
Program Inertial Confinement Fusion Ignition and High Yield
Performance Goal (Measure) Key Extreme Experiments - Cumulative percentage of progress towards achievement of key extreme experimental condition of matter needed for predictive capability for nuclear weapons performance.
Fiscal Year 2011 2012 2013 2014 2015
Target 55 % of progress (cumulative)
75 % of progress (cumulative)
85 % of progress (cumulative)
90 % of progress (cumulative)
100 % of progress (cumulative)
Result Met - 55 Not Met - 65 Not Met - 68 Met - 90 Met - 100
Endpoint Target By the end of FY 2015, achieve temperature and pressure conditions in the laboratory relevant to weapons’ primaries. This activity is performed in collaboration with the Science program within the Office of Research and Development.

FY 2015 DOE ANNUAL PERFORMANCE REPORT 31 | P a g e
Commentary on 2015 Results (Action Plan if Not Met)
The annual target was met. The first hydro-growth radiography (HGR) shot with a beryllium capsule was completed on NIF and data is being analyzed. The HGR experiment measures the ablation front hydrodynamic instability growth for ICF capsule implosions. These results are important because this data contributes to a better understanding of the complex physics associated with the ignition domain.
Documentation, Limitations, Methodology, Validation, and Verification
Predictive Capability Framework; NA-10 Milestone Reporting Tool (MRT) status reports
Advanced Simulation and Computing
The Advanced Simulation and Computing (ASC) Campaign provides leading edge, high-end simulation capabilities to meet the requirements of weapons assessment and certification, including weapon codes, weapons science, computing platforms, and supporting infrastructure. The ASC Campaign serves as the computational surrogate for nuclear testing to determine weapon behavior. The ASC Campaign underpins the Annual Assessment of the stockpile, and is an integrating element of the Predictive Capability Framework.
Program Advanced Simulation and Computing
Performance Goal (Measure) Reduced Reliance on Calibration - The cumulative percentage reduction in the use of calibration “knobs” to successfully simulate nuclear weapons performance.
Fiscal Year 2011 2012 2013 2014 2015
Target 35 % cumulative reduction in use of calibration "knobs"
40 % cumulative reduction in use of calibration "knobs"
45 % cumulative reduction in the use of calibration "knobs"
44 % cumulative reduction in the use of calibration "knobs"
46 % cumulative reduction in the use of calibration "knobs"
Result Met - 35 Not Met - 38 Not Met - 41 Met - 44 Met - 46
Endpoint Target By the end of FY 2024, 100% of selected calibration knobs (non-science based models) affecting weapons performance simulation have been replaced by science-based, predictive phenomenological models. Reduced reliance on calibration will ensure the development of robust ASC simulation tools. These tools are intended to enable the understanding of the complex behaviors and effect of nuclear weapons, now and into the future, without nuclear testing.
Commentary on 2015 Results (Action Plan if Not Met)
Achieved 100% of the annual target of 46% cumulative percentage reduction in the use of calibration “knobs” to successfully simulate nuclear weapons performance. Q4 accomplishments: Level two milestones (sourced in the ASC FY 2015 Implementation Plan, Version 1.0, pages 12-14) were used to evaluate and track progress and were completed as planned by the end of FY 2015. This result is important because the continued reduction in the use of calibration “knobs” will improve our ability to continue to certify nuclear weapons performance without underground tests.

FY 2015 DOE ANNUAL PERFORMANCE REPORT 32 | P a g e
Documentation, Limitations, Methodology, Validation, and Verification
Laboratory reports to HQ Program Manager; NA-10 Milestone Reporting Tool (MRT) status reports
Advanced Manufacturing Development
The Readiness Campaign operates the capability for producing tritium to maintain the national inventory needed for the nuclear weapons stockpile and selects and matures production processes and technologies that are required for manufacturing components to meet Directed Stockpile Work production requirements.
Program Advanced Manufacturing Development
Performance Goal (Measure) Component Manufacturing Development - The annual progress towards the maturation of production technologies and manufacturing capabilities as measured by the number of deliverables completed.
Fiscal Year 2011 2012 2013 2014 2015
Target N/A N/A 5 deliverables 5 deliverables 6 deliverables
Result Exceeded - 6 Met - 5 Met - 6
Endpoint Target The NNSA will continue to mature production technologies and manufacturing capabilities to support nuclear weapons refurbishment and assessment activities to support Directed Stockpile Work.
Commentary on 2015 Results (Action Plan if Not Met)
This target was exceeded by achieving all 6 planned deliverables six months ahead of schedule. This is important because the Component Manufacturing Development program completed more scope than originally planned in FY 2015. These results demonstrate significant impact on NNSA’s ability to conduct surveillance and inspection on multiple weapon components in the stockpile.
Documentation, Limitations, Methodology, Validation, and Verification
Milestones and a table of deliverables supporting the performance measures are documented in the Program Implementation Plan (PIP). Weekly and monthly site status calls with the Federal Program Managers are documented. Milestone Reporting Tool (MRT) status reports also document progress performance on a quarterly basis. In addition, bi-annual and annual accomplishments are provided by the sites to Federal Program Manager in formal program reviews. Federal Program Manager and staff confirm capabilities completion during site field visits and Program Reviews.
Infrastructure and Operations
The goal of Site Stewardship is to ensure the overall health and viability of the NNSA nuclear security enterprise and to support the Department of Energy and other national missions, bringing focus to a number of areas including facility operations, sustainability, environmental compliance, and nuclear materials disposition. The program goal and objectives of Site Stewardship align with the Department’s Strategic Plan (May 2011) goals and management principles, by ensuring capabilities and resources are available to address a number of challenges in the areas of facility operations, environmental compliance, energy, security and management.
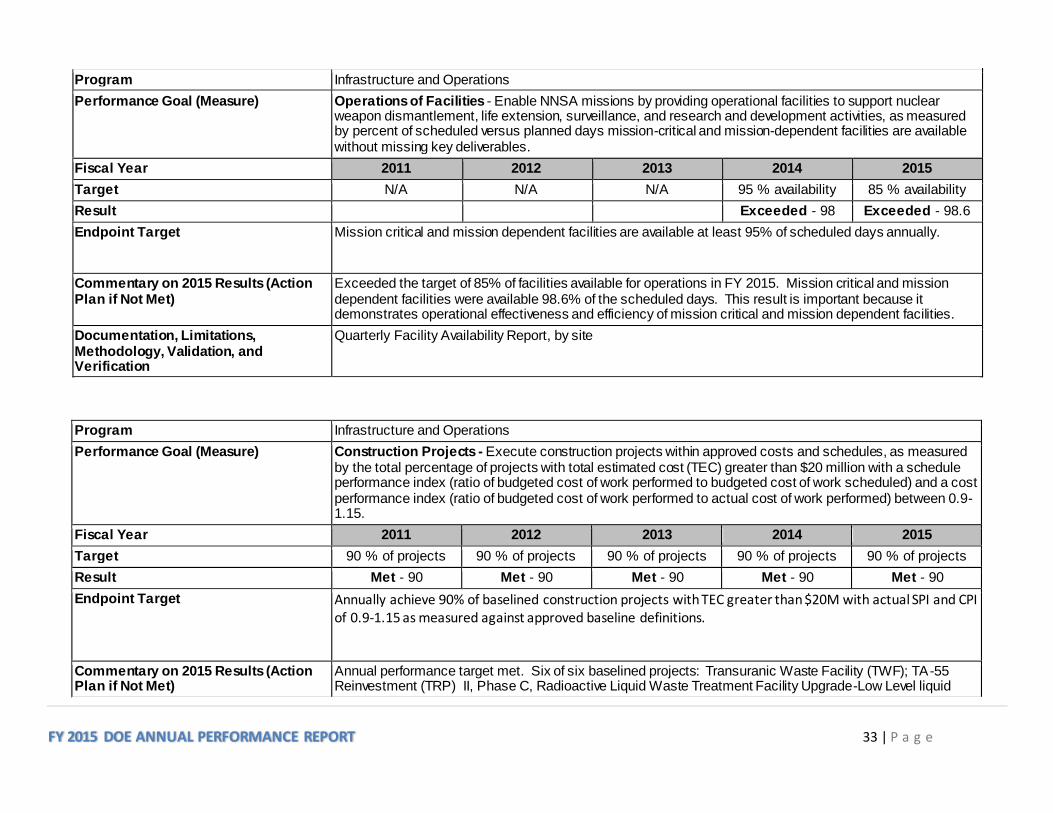
FY 2015 DOE ANNUAL PERFORMANCE REPORT 33 | P a g e
Program Infrastructure and Operations
Performance Goal (Measure) Operations of Facilities - Enable NNSA missions by providing operational facilities to support nuclear weapon dismantlement, life extension, surveillance, and research and development activities, as measured by percent of scheduled versus planned days mission-critical and mission-dependent facilities are available without missing key deliverables.
Fiscal Year 2011 2012 2013 2014 2015
Target N/A N/A N/A 95 % availability 85 % availability
Result Exceeded - 98 Exceeded - 98.6
Endpoint Target Mission critical and mission dependent facilities are available at least 95% of scheduled days annually.
Commentary on 2015 Results (Action Plan if Not Met)
Exceeded the target of 85% of facilities available for operations in FY 2015. Mission critical and mission dependent facilities were available 98.6% of the scheduled days. This result is important because it demonstrates operational effectiveness and efficiency of mission critical and mission dependent facilities.
Documentation, Limitations, Methodology, Validation, and Verification
Quarterly Facility Availability Report, by site
Program Infrastructure and Operations
Performance Goal (Measure) Construction Projects - Execute construction projects within approved costs and schedules, as measured by the total percentage of projects with total estimated cost (TEC) greater than $20 million with a schedule performance index (ratio of budgeted cost of work performed to budgeted cost of work scheduled) and a cost performance index (ratio of budgeted cost of work performed to actual cost of work performed) between 0.9-1.15.
Fiscal Year 2011 2012 2013 2014 2015
Target 90 % of projects 90 % of projects 90 % of projects 90 % of projects 90 % of projects
Result Met - 90 Met - 90 Met - 90 Met - 90 Met - 90
Endpoint Target Annually achieve 90% of baselined construction projects with TEC greater than $20M with actual SPI and CPI of 0.9-1.15 as measured against approved baseline definitions.
Commentary on 2015 Results (Action Plan if Not Met)
Annual performance target met. Six of six baselined projects: Transuranic Waste Facility (TWF); TA-55 Reinvestment (TRP) II, Phase C, Radioactive Liquid Waste Treatment Facility Upgrade-Low Level liquid

FY 2015 DOE ANNUAL PERFORMANCE REPORT 34 | P a g e
Waste (LLW) Treatment Facility Subproject, all at LANL, Nuclear Facility Risk Reduction Facility (NFRR) and UPF Site Readiness (SR) Subproject, both at Y-12, and High Explosive Pressing Facility at Pantex achieved performance indices within specified ranges. High Explosive Pressing Facility completed construction and full startup activities are pending receipt of critical documents from the USACE. NFRR received CD-4 in January 2015, well ahead of the December 2015 baseline date. UPF SR Subproject received CD-4 in February 2015. Demolition of the PF-7 part of the TRP II, Phase C was completed on time. Construction for the LLW Subproject was awarded in 1Q FY 2015 as planned. TWF construction is progressing slightly behind schedule; matt foundations for all six buildings are in place and structural steel for all are erected and enclosed. The Operation Building is enclosed and work inside continues. Substantial completion of the Operations Building was not achieved on 26 Aug 2015. As a result, the construction subcontractor is being charged for liquidated damage. TRP II Phase C construction is also progressing slightly behind schedule, however, it met the target CPI, SPI of 0.9. Monthly project progress reports include Earned Value Management (EVM) data and DOE Project Assessment and Reporting System (PARS) reporting data. This result is important because it demonstrates effective program management over multiple projects and improved efficiencies for managing the nuclear weapons mission.
Documentation, Limitations, Methodology, Validation, and Verification
Baselined schedules and major decision points for projects are in individual project plans; Monthly project progress reports that include Earned Value Management (EVM) data; DOE Project Assessment and Reporting System (PARS) reports; Milestone Reporting Tool (MRT) status reports.
Secure Transportation Asset
As a departmental asset, the Secure Transportation Asset (STA) program safely and securely transports nuclear weapons, weapons components, and special nuclear materials to meet projected Department of Energy (DOE), Department of Defense (DoD), and other customer requirements. STA contains two activities – Program Direction, and Operations and Equipment. Program Direction provides primarily for the federal agents and the secure transportation workforce. Operations and Equipment provides for STA’s transportation service infrastructure that is critical in meeting the stockpile refurbishment and modernization initiatives of the nuclear security enterprise.
Program Secure Transportation Asset
Performance Goal (Measure) Safe and Secure Shipments - Annual percentage of shipments completed safely and securely without compromise/loss of nuclear weapons/components or a release of radioactive material.
Fiscal Year 2011 2012 2013 2014 2015
Target 100 % of shipments 100 % of shipments 100 % of shipments 100 % of shipments 100 % of shipments
Result Met - 100 Met - 100 Met - 100 Met - 100 Met - 100
Endpoint Target Annually, ensure that 100% of shipments are completed safely and securely without compromise/loss of nuclear weapons/components or a release of radioactive material.
Commentary on 2015 Results (Action Plan if Not Met)
Target met. Fully achieved the annual target of 100% safe and secure shipments. Accomplishments for the fourth quarter includes: an on-time annual delivery rate of 97%, exceeding the STA goal of 90%. This result

FY 2015 DOE ANNUAL PERFORMANCE REPORT 35 | P a g e
is important because it indicates mission accomplishment, especially in light of the increased risks and threats to the nuclear security enterprise.
Documentation, Limitations, Methodology, Validation, and Verification
Certification from the senior Program Manager for Mission Operations that there are no known internal or external reports of any compromise or loss; absence of any DOE Occurrence Reporting and Processing System (ORPS) reports related to shipments; supporting milestones for the performance measure are documented and maintained by the Program. Official justification are contained internally within program secondary documents to include: Office of Mission Operations Manager Certification Memo, On Time Delivery Quarterly Report, On Board Agent Availability Report, and a Level II Milestone Report.
Nuclear Counterterrorism Incident Response Program
The Nuclear Counterterrorism Incident Response (NCTIR) program responds to and mitigates nuclear and radiological incidents worldwide and has a lead role in defending the Nation from the threat of nuclear terrorism.
Program Nuclear Counterterrorism Incident Response Program
Performance Goal (Measure) Emergency Operations Readiness Index - Emergency Operations Readiness Index (EORI) measures the overall organizational readiness to respond to and mitigate radiological or nuclear incidents worldwide. (This index is measured from 1 to 100 with higher numbers meaning better readiness--the first three quarters will be expressed as the readiness at those given points in time, whereas the year end will be expressed as the average readiness for the year's four quarters).
Fiscal Year 2011 2012 2013 2014 2015
Target 91 EORI 91 EORI 91 EORI 91 EORI 91 EORI
Result Not Met - 85 Exceeded - 93 Not Met - 81 Met - 91 Met - 91
Endpoint Target Annually, maintain an Emergency Operations Readiness Index of 91 or higher. Note: This target is under assessment resulting from reorganization. Although the Nuclear Incident Team remains under Emergency Operations, the program will reassess its Readiness measure.
Commentary on 2015 Results (Action Plan if Not Met)
Achieved the annual target of 91 Readiness Index level. At the end of September, an error was recognized in calculations for Q 2&3. Results for Q3 have been corrected and Q4 results are updated. This result is important because it identifies problem areas that may need to be adjusted for improved program management and better oversight, and achievement of the overall Readiness Index for the fiscal year.
Documentation, Limitations, Methodology, Validation, and Verification
ARMS Reports; Weekly Meetings; Daily situational reports; Daily Infrastructure reports; ARMS website https://arms.orau.gov/; After action reports – evaluators; After action reports – controllers; State, local, & federal reports validating our response efforts; Task Orders/Work Authorizations
Site Stewardship

FY 2015 DOE ANNUAL PERFORMANCE REPORT 36 | P a g e
The goal of Site Stewardship is to ensure the overall health and viability of the NNSA nuclear security enterprise and to support the Department of Energy and other national missions, bringing focus to a number of areas including facility operations, sustainability, environmental compliance, and nuclear materials disposition. The program goal and objectives of Site Stewardship align with the Department’s Strategic Plan (May 2011) goals and management principles, by ensuring capabilities and resources are available to address a number of challenges in the areas of facility operations, environmental compliance, energy, security and management.
Program Site Stewardship
Performance Goal (Measure) Environmental Monitoring and Remediation - Annual percentage of environmental monitoring and remediation deliverables that are required by regulatory agreements to be conducted at NNSA sites under Long Term Stewardship (LTS) that are executed on schedule and in compliance with all acceptance criteria.
Fiscal Year 2011 2012 2013 2014 2015
Target 95 % of deliverables 95 % of deliverables 95 % of deliverables 95 % of deliverables 95 % of deliverables
Result Exceeded - 100 Exceeded - 100 Exceeded - 100 Exceeded - 100 Exceeded - 100
Endpoint Target Annually, submit on schedule and receive regulatory approval of at least 95% of all environmental monitoring and remediation deliverables that are required at NNSA sites under LTS by regulatory agreements. Note: The Environmental Projects and Operations (EPO) has been renamed Long-Term Stewardship and has been moved from the Site Stewardship program to the Infrastructure and Operations program, formerly named Readiness in Technical Base and Facilities (RTBF), starting in FY 2016.
Commentary on 2015 Results (Action Plan if Not Met)
Exceeded the quarterly target of 95% by completing 100% of required environmental monitoring and remediation deliverables on schedule and acceptable by regulatory agreements. Meeting these regulatory deliverables is important as it prevents the issuance of notices of violations (NOVs), fines, and penalties by the regulators due to deliverables being late or insufficient.
Documentation, Limitations, Methodology, Validation, and Verification
RCRA Permits; monthly and annual reports to regulatory agencies; Compliance Monitoring Plans; Field Logs; Sampling Paperwork; LTS program plan status reports to the site offices
Defense Nuclear Security
Safeguards and Security (S&S) is comprised of two Government Performance and Results Act (GPRA) Unit Programs. The Defense Nuclear Security (DNS) program, managed by the National Nuclear Security Administration (NNSA) Associate Administrator for Defense Nuclear Security, provides protection for NNSA personnel, facilities, nuclear weapons, and information from a full spectrum of threats, most notably from terrorism, which has become of paramount concern since the September 11, 2001 attacks. The National Nuclear Security Administration Chief Information Officer (CIO) Activities program (formerly Cyber Security), managed by the NNSA Chief Information Officer, and provides the requisite guidance needed to ensure that sufficient information management security safeguards are implemented throughout the NNSA enterprise. These program efforts are integrated under NNSA’s Chief of Defense Nuclear Security.
Program Defense Nuclear Security

FY 2015 DOE ANNUAL PERFORMANCE REPORT 37 | P a g e
Performance Goal (Measure) Enterprise Risk Management (ERM) - Implement and sustain a repeatable process for conducting site vulnerability and risk assessments and a set of consistent deliverables to help Federal oversight ensure the security program is integrated, robust, and efficient.
Fiscal Year 2011 2012 2013 2014 2015
Target N/A N/A N/A 90 % index 90 % index
Result Met - 90 Met - 90
Endpoint Target BY 2017, achieve an improved corporate understanding of site operations, protection strategies, and risk acceptance that enables decision-makers to make true cost/benefit and risk acceptance decisions for physical security, better risk-informed resource allocation decisions, and more balance across NNSA sites, maintaining a 95% index thereafter.
Commentary on 2015 Results (Action Plan if Not Met)
4Q results: Achieved 100% of the annual target of 90% implementation and sustainment of a repeatable process for conducting site vulnerability and risk assessments and a set of consistent deliverables to help Federal oversight ensure the security program is integrated, robust, and efficient by the end of the FY. At this time, a program plan for this process has been prepared, resources have been identified, and initial assessments have been completed at LANL, Y-12, Pantex, NNSS, KCP, SRS, and SNL NM. The only remaining site for an initial assessment is LLNL and they are scheduled for December 2015. This result is important because it ensures consistent protection strategies across the Enterprise which are understandable and defensible.
Documentation, Limitations, Methodology, Validation, and Verification
Enterprise Vulnerability Assessment Project Plan.
Program Defense Nuclear Security
Performance Goal (Measure) Physical Security Infrastructure Recapitalization - Implement and maintain a physical security life cycle management process, including on-time and to-standard supplemental deliverables after implementation.
Fiscal Year 2011 2012 2013 2014 2015
Target N/A N/A N/A 85 % index 85 % index
Result Exceeded - 100 Met - 85
Endpoint Target By 2017, achieve defensible prioritization of systems investments based on risk, more efficient bulk procurements, more common systems configurations/designs, timely redistribution of inventories based on site needs, and more accurate reporting to external stakeholders on condition of NNSA security systems, maintaining a 95% index thereafter.
Commentary on 2015 Results (Action Plan if Not Met)
4Q results: Achieved 100% of the annual target of 85% implementation and sustainment of a repeatable process for establishing the baseline of physical security system components and a consistent deliverable

FY 2015 DOE ANNUAL PERFORMANCE REPORT 38 | P a g e
(Physical Security Supplemental) that will ensure Federal oversight knowledge level of the state of the physical security program. At this time, sites are reporting their physical security equipment holdings through the Physical Security Systems Supplemental on a quarterly basis. This result is important because i t ensures knowledge of readiness of the NNSA Physical Security Systems as well as providing information on prioritization of all lifecycle projects. Additionally, the Center for Security Technology, Analysis, Response and Testing (CSTART) is currently conducting field work to finalize the prioritization of security infrastructure replacements and upgrades, which then will become a 10-year lifecycle plan. Field visits have been conducted at Y-12, LANL, and LLNL to date, and the remaining sites will be completed during FY 2016.
Documentation, Limitations, Methodology, Validation, and Verification
Physical Security Supplemental Project Plan, Site Visit Reports, Physical Security Supplemental quarterly and annual reports. PSIR Index is calculated using a rate/weight model that incorporates.
Program Defense Nuclear Security
Performance Goal (Measure) Protective Force Training Reform - Implement and sustain an Enterprise Mission Essential Task List (EMETL)-based training program for protective forces at all eight NNSA sites.
Fiscal Year 2011 2012 2013 2014 2015
Target N/A N/A N/A 90 % index 90 % index
Result Exceeded - 100 Met - 90
Endpoint Target By FY 2017, produce protective forces that are high-performing in mission accomplishment with a necessary/appropriate training program that minimizes unproductive training time, maintaining a 95% index thereafter.
Commentary on 2015 Results (Action Plan if Not Met)
4Q results: Achieved 100% of the annual target of 90% implementation and sustainment of an Enterprise Mission Essential Task List (EMETL)-based training program for protective forces at all eight NNSA sites. All sites have implemented the EMETL-based training program and have developed procedures for sustaining the program. Additionally, DNS released version 4.0 of the EMETL Field Manual (FM) on 29 September 2015. The most notable change from the previous version was the addition of tasks associated with response to Unmanned Aerial Systems (UAS). Timely FM updates are important because it ensures enterprise-wide protective force readiness through a corporate approach to continuously identifying and addressing mission-critical training needs. Quarterly performance assessment reports continue to be analyzed by the Program Office to identify enterprise-wide needs and to provide NNSA senior leadership with a current and comprehensive snapshot of protective force capabilities in all mission-essential task areas.
Documentation, Limitations, Methodology, Validation, and Verification
EMETL Project Plan, Site Assistant Visit Reports, EMETL Implementation quarterly and annual reports
NNSA IT and Cybersecurity

FY 2015 DOE ANNUAL PERFORMANCE REPORT 39 | P a g e
The goal of the Information Technology and Cybersecurity (formerly NNSA CIO Activities program) is to ensure that sufficient information management security safeguards are implemented throughout the nuclear security enterprise to adequately protect the NNSA information assets and to provide the requisite guidance in compliance with the Department of Energy’s (DOE) Defense-in-Depth Cyber Security strategy and the NNSA Information Management Strategic Plan. The NNSA IT and Cybersecurity Activities program is a Homeland Security related activity.
Program NNSA IT and Cybersecurity
Performance Goal (Measure) Cybersecurity Assessment Reviews - Annual Percentage of Cybersecurity Site Assessment Reviews conducted by the Office of Enterprise Assessment (EA) and that resulted in the rating of "effective."
Fiscal Year 2011 2012 2013 2014 2015
Target N/A 100 % of reviews resulting in
"effective" rating
100 % of reviews resulting in
"effective" rating
100 % of reviews resulting in
"effective" rating
100 % of reviews resulting in
"effective" rating
Result Not Met - 67 Met - 100 Met - 100 Met - 100
Endpoint Target Annually, achieve at least an "effective" rating of 100% of OCIO site assistance visit (SAV) Cybersecurity reviews.
Commentary on 2015 Results (Action Plan if Not Met)
Met the annual target by achieving ratings of "effective" for 3 of 3 cybersecurity site assessment reviews conducted by the Office of Environment, Health, Safety, and Security (EHSS). EHSS completed cybersecurity assessment reviews of NSC, LANL, and SNL. Results of assessment reviews were issued in the Independent Evaluation of the U.S. Department of Energy's Information Security Program for National Security Systems Annual Report. This result is important because it provides an assessment of potential deficiencies in the management, operational and technical control implementation at NNSA sites that would lead to a significant loss of confidentiality, integrity, or availability of systems and the data they contain that is critical to enabling successful performance of mission requirements/business commitments.
Documentation, Limitations, Methodology, Validation, and Verification
HSS Final Assessment Report
Counterterrorism and Counterproliferation Programs
The Counterterrorism and Counterproliferation (CT/CP) program makes strategic investments in the national security science, technology and engineering capabilities and infrastructure base that are necessary to address current and future global security issues. The CT/CP budget is separated into its own budget line to highlight technical investments. This program integrates the management, development, and maintenance of CT/CP capabilities that are relied upon by agencies across the Federal government and provides transparency, alignment, and accountability into the investments made in workforce and infrastructure to preserve national security capabilities into the future. The facilities and the expert multidisciplinary workforce within the nuclear security enterprise provide decision makers with the ability to understand the state of international scientific and technological advances as well as project how these advances could affect national security. Furthermore, their unique

FY 2015 DOE ANNUAL PERFORMANCE REPORT 40 | P a g e
multidisciplinary infrastructure is key to anticipating technological surprise and for providing rapid innovative solutions to complex technical problems faced by multiple agencies. To address these national security challenges beyond the nuclear stockpile, the administration is committed to both retain and nurture national security research and development capabilities to serve broader national security interests. Note: The CTCP program (formerly National Security Applications) consolidates projects from the Nuclear Counterterrorism (NCT) program (formerly under NCTIR) with refocused, enduring projects from the NSA program.
Program Counterterrorism and Counterproliferation Programs
Performance Goal (Measure) WMD Counterterrorism Expertise - Cumulative number of officials trained in Weapons of Mass Destruction (WMD) Counterterrorism (CT) prevention and response via Office of Counterterrorism Policy and cooperation exercises.
Fiscal Year 2011 2012 2013 2014 2015
Target N/A N/A 9,500 trained personnel
10,200 trained personnel
11,000 trained personnel
Result Met - 9,500 Exceeded - 10,280 Met - 11,000
Endpoint Target By the end of FY 2020, train 14,800 officials in WMDCT prevention and response. Note: The Office of Counterterrorism Policy and Cooperation’s WMDCT Exercise Program designs, produces, and conducts tailor-made tabletop exercises for domestic public and private sector customers with nuclear or radioactive materials or associated nuclear security responsibilities. Internationally, the program works with key foreign partners to design, develop, and conduct National and regional WMD security and WMD counterterrorism tabletop exercises. Designed to build teamwork and an in-depth understanding of the roles and responsibilities of agencies charged with responding to terrorist-related radiological, nuclear, or WMD-related incidents, these exercises bring together Federal/National, State, and local decision-makers and first responders. This metric provides a quantitative (cumulative number of officials trained) measure of this program’s impact.
Commentary on 2015 Results (Action Plan if Not Met)
Achieved the FY 2015 target of training a cumulative 11,000 first responders, security, and WMD CT officials. Executed tabletop exercise at the Intermountain Medical, Salt Lake City, UT, training an additional 84 officials during Q4. This result is important because it measures the Counterterrorism program's progress in strengthening WMD CT capabilities by training Federal, state, local, and international officials to address WMD terrorism incidents. Additionally, conducted a tabletop exercises (TTX) for 35 Kazakhstani government representatives on that country's counter nuclear smuggling National Response Plan. Twenty-eight (28) of those participated in a follow-on "train-the-facilitator" to learn the skills required for building and facilitating a TTX.
Documentation, Limitations, Methodology, Validation, and Verification
Exercise Attendance Lists, After-Action Reports, Multi-Year Counterterrorism and Counterproliferation Management Plan (CCMP) dated November 2012

FY 2015 DOE ANNUAL PERFORMANCE REPORT 41 | P a g e
Defense Nuclear Nonproliferation
Defense Nuclear Nonproliferation Research and Development
This program improves U.S. national security through the development of novel technologies to detect foreign nuclear weapons proliferation/detonation and verification of foreign commitments to treaties and agreements.
Program Defense Nuclear Nonproliferation Research and Development
Performance Goal (Measure) Nuclear Detonation Detection - Annual index that summarizes the status of all NNSA nuclear detonation detection R&D deliveries that improve the nation's ability to detect nuclear detonations.
Fiscal Year 2011 2012 2013 2014 2015
Target 90 % index 90 % index 90 % index 90 % index 90 % index
Result Met - 90 Met - 90 Met - 90 Met - 90 Met - 90
Endpoint Target Annually achieve timely delivery of NNSA nuclear detonation detection products. (90% target reflects good on-time delivery. Index considers factors beyond NNSA’s control and impact on customer schedules.)
Commentary on 2015 Results (Action Plan if Not Met)
Achieved the FY 2015 delivery of nuclear detonation detection sensor payloads in accordance with current US Air Force published schedule for satellite production. These deliveries included: One Global Burst Detector sensor payload and three others contained in the Global Positioning System (GPS) IIF-8, -9, and -10 satellites launched during FY 2015, with Early On-orbit Testing support completed after each launch. This result is important because it maintains U.S National capability to monitor the Earth for nuclear detonations.
Documentation, Limitations, Methodology, Validation, and Verification
Quarterly reports; Final delivery transmittal letters to user agencies for satellite payloads (‘Consent to Ship’ letters); Integrated Research Product Releases
Program Defense Nuclear Nonproliferation Research and Development
Performance Goal (Measure) Nuclear Weaponization and Material Production Detection - Cumulative percentage of progress toward demonstrating improvements in detection and characterization capabilities of nuclear weapons production activities.
Fiscal Year 2011 2012 2013 2014 2015
Target N/A N/A N/A 20 % progress 50 % of progress
Result Met - 20 Met - 50
Endpoint Target By the end of FY 2018, achieve 100% cumulative progress toward demonstrating new capabilities detecting uranium and plutonium production and nuclear weaponization processes.
Commentary on 2015 Results (Action Plan if Not Met)
Achieved the cumulative target of 50% progress. Demonstrated new or improved capabilities against 8 of 17 total requirements and made progress toward completion of 38 deliverables in FY 2015. Progress is measured by meeting research tasks in life cycle plans as described in Quarterly Reports and annually

FY 2015 DOE ANNUAL PERFORMANCE REPORT 42 | P a g e
through Technology Readiness Assessments, as directed in the DNN R&D Technology Readiness and Maturation Guide. Specific requirements are described in the Nuclear Weapons Development and Material Production Detection Technical Roadmap. Each requirement has a specified target technical readiness level at which a new/improved capability is demonstrated and a definition of what constitutes successful demonstration. Progress is also independently validated with feedback from Independent Reviews, on annual program review briefings, and tracks with planned milestones. These results are important because they are key U.S. capabilities to increase confidence in detecting foreign nuclear weapons production activities.
Documentation, Limitations, Methodology, Validation, and Verification
Program Plan/Roadmap document; Memorandum for Record (unclassified, located in DNN R&D Office, certified by ADA) for DNN
Program Defense Nuclear Nonproliferation Research and Development
Performance Goal (Measure) Nuclear Weapons and Material Security - The cumulative percentage of progress towards demonstrating improvements in Special Nuclear Material detection, warhead monitoring, chain-of-custody monitoring, safeguards, and characterization capabilities.
Fiscal Year 2011 2012 2013 2014 2015
Target N/A N/A N/A 20 % progress 50 % progress
Result Met - 20 Met - 50
Endpoint Target By the end of FY 2018, achieve 100% cumulative progress toward demonstrating new capabilities for warhead monitoring, warhead chain-of-custody, Special Nuclear Material movement detection, and nuclear safeguards.
Commentary on 2015 Results (Action Plan if Not Met)
Achieved the cumulative target of 50% progress. Demonstrated new or improved capabilities against 8 of 17 total requirements and made progress toward completion of 102 deliverables in FY 2015. Progress is measured by meeting research tasks in life cycle plans as described in Quarterly Reports and annually through Technology Readiness Assessments, as directed in the DNN R&D Technology Readiness and Maturation Guide. Specific requirements are described in the Weapons and Material Security Technical Roadmap. Each requirement has a specified target technical readiness level at which a new/improved capability is demonstrated and a definition of what constitutes successful demonstration. Progress is also independently validated with feedback from Independent Reviews, on annual program review briefings, and tracks with planned milestones. This result is important because it improves U.S. capability to detect and interdict Special Nuclear Material movement, monitor compliance with international treaties, and detect the diversion of fissile materials from peaceful purposes.
Documentation, Limitations, Methodology, Validation, and Verification
Program Plan/Roadmap document; Memorandum for Record (unclassified, located in DNN R&D Office, certified by ADA) for DNN

FY 2015 DOE ANNUAL PERFORMANCE REPORT 43 | P a g e
Program Defense Nuclear Nonproliferation Research and Development
Performance Goal (Measure) Plutonium Production Detection - Cumulative percentage of progress toward demonstrating the next generation of technologies and methods to detect plutonium production activities. (Progress is measured against the baseline criteria and milestones published in the “FY 2006 R&D Requirements Document”).
Fiscal Year 2011 2012 2013 2014 2015
Target 65 % of progress 75 % of progress 90 % of progress 95 % of progress 100 % of progress
Result Met - 65 Met - 75 Met - 90 Met - 95 Met - 100
Endpoint Target By the end of FY 2015, demonstrate the next generation of technologies and methods to detect Plutonium production activities.
Commentary on 2015 Results (Action Plan if Not Met)
Achieved the cumulative target of 100% progress. Demonstrated completion of 17 deliverables in FY 2015. Progress is based on meeting research tasks in life cycle plans as described in Quarterly and Final Reports, on feedback from Independent Reviews, on successful demonstration of capabilities, and on annual program review briefings; tracks with planned milestones. This result is important because it increases the U.S. capability to detect foreign nuclear weapons production activities.
Documentation, Limitations, Methodology, Validation, and Verification
Program Plan/Roadmap document; Memorandum for Record (unclassified, located in Defense Nuclear Nonproliferation (DNN) R&D office, certified by Assistant Deputy Administrator) for DNN
Program Defense Nuclear Nonproliferation Research and Development
Performance Goal (Measure) Uranium-235 Production Detection - Cumulative percentage of progress toward demonstrating the next generation of technologies and methods to detect uranium-235 enrichment activities. (Progress is measured against the baseline criteria and milestones published in the “FY 2006 R&D Requirements Document”.)
Fiscal Year 2011 2012 2013 2014 2015
Target 50 % of progress 60 % of progress 75 % of progress 90 % of progress 95 % of progress
Result Met - 50 Met - 60 Met - 75 Met - 90 Met - 95
Endpoint Target By the end of FY 2016, demonstrate the next generation of technologies and methods to detect uranium-235 enrichment activities.
Commentary on 2015 Results (Action Plan if Not Met)
Achieved the cumulative target of 95% progress. Demonstrated completion of 14 of 14 deliverables in FY 2015. Progress is based on meeting research tasks in life cycle plans as described in Quarterly and Final Reports, on feedback from Independent Reviews, on successful demonstration of capabilities, and on annual program review briefings; tracks with planned milestones. This result is important because it increases the U.S. capability to detect foreign nuclear weapons production activities.
Documentation, Limitations, Methodology, Validation, and Verification
Program Plan/Roadmap document; Memorandum for Record (unclassified, located in DNN R&D Office, certified by ADA) for DNN

FY 2015 DOE ANNUAL PERFORMANCE REPORT 44 | P a g e
Nonproliferation and International Security
The Office of Nonproliferation and International Security (NIS) supports National Nuclear Security Administration (NNSA) efforts to prevent and counter the proliferation or use of weapons of mass destruction (WMD), including materials, technology and expertise, by state and non-state actors. NIS focuses on strengthening the nonproliferation regime in order to reduce proliferation risks by applying its unique expertise to safeguard nuclear material and strengthen its physical security; control the spread of WMD-related material, equipment, technology and expertise; verify nuclear reductions and compliance with nonproliferation treaties and agreements; and develop and implement Department of Energy (DOE)/NNSA nonproliferation and arms control policy. NIS pursues these objectives through four programs: (1) Nuclear Safeguards & Security; (2) Nuclear Controls; (3) Nuclear Verification; and (4) Nonproliferation Policy.
Program Nonproliferation and International Security
Performance Goal (Measure) International Nonproliferation Export Control Program - Cumulative number of countries where International Nonproliferation Export Control Program (INECP) is engaged that have export control systems that meet critical requirements.
Fiscal Year 2011 2012 2013 2014 2015
Target 22 countries 29 countries 31 countries 34 countries 35 countries
Result Exceeded - 27 Met - 29 Met - 31 Met - 34 Met - 35
Endpoint Target By the end of FY 2025, 45 countries where INECP is engaged will have export control systems that meet critical requirements, defined as having: (1) control lists consistent with the WMD regimes; (2) initiated outreach to producers of WMD-related commodities; (3) developed links between technical experts and license reviewers and front-line enforcement officers; and (4) begun customization of educational materials and technical guides.
Commentary on 2015 Results (Action Plan if Not Met)
The program met the FY 2015 target of 35 countries that meet critical export control system requirements. This number is derived from an annual review of updates to engagement plans for countries in which INECP has an active program. This result is important because it documents the success of the program building capacity in national systems of export control to prevent the spread of WMD-related commodities.
Documentation, Limitations, Methodology, Validation, and Verification
International Nuclear Export Control program database records and original input documents; INECP engagement plans and After Action Reports
Program Nonproliferation and International Security
Performance Goal (Measure) Reduce Nuclear Terrorism Threat - In order to reduce the threat of nuclear terrorism, evaluate the physical security of U.S. obligated nuclear material located at foreign facilities by conducting bilateral physical security assessment reviews designed to evaluate the adequacy of existing security measures and provide recommendations for enhancing security if necessary.
Fiscal Year 2011 2012 2013 2014 2015

FY 2015 DOE ANNUAL PERFORMANCE REPORT 45 | P a g e
Target N/A N/A N/A 6 assessments 6 assessments
Result Met - 6 Met - 6
Endpoint Target Annually review the physical security of U.S.-obligated nuclear material located at foreign facilities in order to reduce the threat of nuclear terrorism.
Commentary on 2015 Results (Action Plan if Not Met)
The program met the FY 2015 target of completing 6 bilateral physical protection security assessment reviews of foreign facilities holding U.S.-obligated nuclear material. In Q1, two security assessments were completed (Jamaica and Ukraine follow-up visit); in Q2, two security assessments were completed (United Kingdom and Belgium); and two assessments were completed in Q4 (Thailand and Philippines). This result is important because it documents progress of the program in ensuring the security of nuclear material to reduce the threat of nuclear terrorism.
Documentation, Limitations, Methodology, Validation, and Verification
Physical Protection Site Assessment database records and official reports; Bi-lateral Physical Protection Reports
Program Nonproliferation and International Security
Performance Goal (Measure) Safeguards Tools - Annual number of safeguards tools transferred and used in international regimes and other countries that address an identified safeguards deficiency.
Fiscal Year 2011 2012 2013 2014 2015
Target 5 systems 5 systems 5 systems 5 systems 5 systems
Result Met - 5 Met - 5 Met - 5 Met - 5 Met - 5
Endpoint Target Annually transfer tools to international regimes and other countries to address identified safeguards deficiencies. Note: Change "deployed" to "transferred" to more accurately describe the process by which the NPAC Safeguards program achieves its mission and to eliminate redundancy in the current measure. Adjusting endpoint to recognize an annual, continuing effort.
Commentary on 2015 Results (Action Plan if Not Met)
The program met the FY 2015 target of transferring 5 tools to international partners. In Q3, one tool was deployed (the High Count Rate Electronics Prototype to the IAEA), and in Q4 four tools were deployed (ASID Neutron Splitter Box to South Africa, RADAR-ORIGEN Upgrade to Euratom, Orella Spent Fuel Analysis Module Upgrade to the IAEA, and a Single Chip Shift Register to the IAEA). This result is important because the technology transfers will allow partners to more effectively and efficiently account for and control nuclear materials, and help ensure complete and correct reporting to the International Atomic Energy Agency (IAEA).
Documentation, Limitations, Methodology, Validation, and Verification
Shipping records; technical reports; e-mails confirming receipt; photographs; and other documentation.
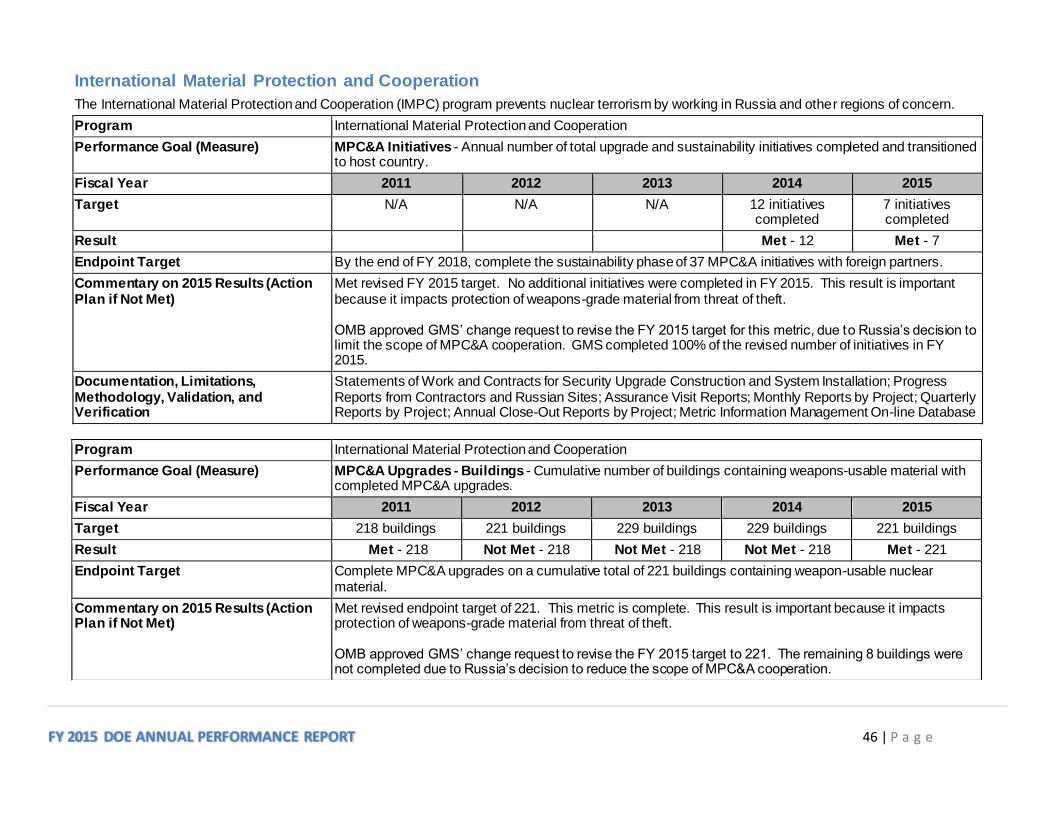
FY 2015 DOE ANNUAL PERFORMANCE REPORT 46 | P a g e
International Material Protection and Cooperation
The International Material Protection and Cooperation (IMPC) program prevents nuclear terrorism by working in Russia and other regions of concern.
Program International Material Protection and Cooperation
Performance Goal (Measure) MPC&A Initiatives - Annual number of total upgrade and sustainability initiatives completed and transitioned to host country.
Fiscal Year 2011 2012 2013 2014 2015
Target N/A N/A N/A 12 initiatives completed
7 initiatives completed
Result Met - 12 Met - 7
Endpoint Target By the end of FY 2018, complete the sustainability phase of 37 MPC&A initiatives with foreign partners.
Commentary on 2015 Results (Action Plan if Not Met)
Met revised FY 2015 target. No additional initiatives were completed in FY 2015. This result is important because it impacts protection of weapons-grade material from threat of theft. OMB approved GMS’ change request to revise the FY 2015 target for this metric, due to Russia’s decision to limit the scope of MPC&A cooperation. GMS completed 100% of the revised number of initiatives in FY 2015.
Documentation, Limitations, Methodology, Validation, and Verification
Statements of Work and Contracts for Security Upgrade Construction and System Installation; Progress Reports from Contractors and Russian Sites; Assurance Visit Reports; Monthly Reports by Project; Quarterly Reports by Project; Annual Close-Out Reports by Project; Metric Information Management On-line Database
Program International Material Protection and Cooperation
Performance Goal (Measure) MPC&A Upgrades - Buildings - Cumulative number of buildings containing weapons-usable material with completed MPC&A upgrades.
Fiscal Year 2011 2012 2013 2014 2015
Target 218 buildings 221 buildings 229 buildings 229 buildings 221 buildings
Result Met - 218 Not Met - 218 Not Met - 218 Not Met - 218 Met - 221
Endpoint Target Complete MPC&A upgrades on a cumulative total of 221 buildings containing weapon-usable nuclear material.
Commentary on 2015 Results (Action Plan if Not Met)
Met revised endpoint target of 221. This metric is complete. This result is important because it impacts protection of weapons-grade material from threat of theft. OMB approved GMS’ change request to revise the FY 2015 target to 221. The remaining 8 buildings were not completed due to Russia’s decision to reduce the scope of MPC&A cooperation.

FY 2015 DOE ANNUAL PERFORMANCE REPORT 47 | P a g e
Documentation, Limitations, Methodology, Validation, and Verification
Statements of Work and Contracts for Security Upgrade Construction and System Installation; Progress Reports from Contractors and Russian Sites; Assurance Visit Reports; Monthly Reports by Project; Quarterly Reports by Project; Annual Close-Out Reports by Project; Metric Information Management On-line Database
Program International Material Protection and Cooperation
Performance Goal (Measure) Mobile Detection System (MDS) - Cumulative number of Mobile Detection Systems (MDS) deployed.
Fiscal Year 2011 2012 2013 2014 2015
Target N/A N/A N/A 72 MDS 97 cumulative MDS
Result Exceeded - 76 Not Met - 96
Endpoint Target By the end of FY 2019, deploy 167 Mobile Detection Systems.
Commentary on 2015 Results (Action Plan if Not Met)
Largely achieved the FY 2015 cumulative target of 97 Mobile Detection Systems (MDS) provided. 5 MDS units were deployed in the fourth quarter of FY 2015, for a total of 20 MDS units deployed in FY 2015. The total cumulative number of MDS deployed as of the end of the fourth quarter FY 2015 is 96 units. The annual target was missed because of import/export issues encountered in the Philippines. NSDD's work to provide MDS is important because it gives host governments a 'mobile' technical means to detect, deter, and interdict illicit trafficking of nuclear and other radioactive materials. Action Plan: This work remains a high priority and DOE/NNSA will keep working to enhance partner countries radiation detection capability. Import/export issues in the Philippines prevented NSDD from achieving the targeted MDS deployments. These issues are being resolved and NSDD anticipates successful deployment in Q1 FY2016.
Documentation, Limitations, Methodology, Validation, and Verification
Schedules, trip reports, acceptance testing documentation
Program International Material Protection and Cooperation
Performance Goal (Measure) Sites - Cumulative number of sites with radiation detection systems deployed.
Fiscal Year 2011 2012 2013 2014 2015
Target 463 sites (45 Megaports)
496 sites (45 Megaports)
513 sites (45 Megaports)
548 sites/ports 575 cumulative sites
Result Not Met - 460 Not Met - 493 Met - 513 Exceeded - 550 Met - 575
Endpoint Target By the end of FY 2019, provide radiation detection systems to approximately 639 cumulative sites.
Commentary on 2015 Results (Action Plan if Not Met)
Achieved 100% of the annual target of 575 sites with radiation detection equipment. Work completed in the fourth quarter resulted in 16 additional site installed, for a total of 25 sites installed in FY 2015.

FY 2015 DOE ANNUAL PERFORMANCE REPORT 48 | P a g e
Nuclear Smuggling Detection and Deterrence (NSDD's) work on these sites is important because it provides host governments with the technical means to detect, deter, and interdict illicit trafficking of nuclear and other radioactive materials.
Documentation, Limitations, Methodology, Validation, and Verification
Schedules, trip reports, acceptance testing documentation
Program International Material Protection and Cooperation
Performance Goal (Measure) Sustainability - Cumulative number of radiation detection systems that are being indigenously sustained.
Fiscal Year 2011 2012 2013 2014 2015
Target N/A N/A N/A 431 sites/ports 490 cumulative radiation detection
systems
Result Not Met - 412 Not Met - 488
Endpoint Target By the end of FY 2020, transfer 786 radiation detection systems to indigenous sustainment.
Commentary on 2015 Results (Action Plan if Not Met)
Largely achieved the FY 2015 cumulative target of 490 radiation detection systems. Work completed in the fourth quarter of FY 2015 resulted in 12 sites being indigenously sustained, for a total of 76 additional sites being indigenously sustained in FY 2015. The total cumulative number of sites in indigenous sustainment as of the end of the fourth quarter FY 2015 is 488. (Note: In FY 2015, the program received approval to include MDS in this metric. To account for MDS that transitioned prior to FY 2015, NSDD is now including 26 previously transitioned MDS in its cumulative total.) The annual target was missed because of political instability in Lebanon. This instability prevented the scheduled transition of some sites to indigenous sustainment. NSDD's work in sustainability is important because it demonstrates that NSDD is successfully transitioning sites to host government responsibility. These host governments are now self-sustaining sites with a capacity to detect, deter, and interdict illicit trafficking of nuclear and other radioactive materials. Action Plan: This work remains a high priority and DOE/NNSA will keep working towards the transition of the remaining 2 detection systems to partner countries. Continued political instability in Lebanon prevented the scheduled transition of some sites to indigenous sustainment. NSDD fully expects these countries to take full responsibility for these sites in the next few years when internal challenges have been overcome.
Documentation, Limitations, Methodology, Validation, and Verification
Schedules, trip reports, joint transition and sustainability plans.

FY 2015 DOE ANNUAL PERFORMANCE REPORT 49 | P a g e
Fissile Materials Disposition
The program goal is to eliminate surplus Russian weapon-grade plutonium and surplus United States (U.S.) weapon-grade plutonium and highly enriched uranium.
Program Fissile Materials Disposition
Performance Goal (Measure) Mixed Oxide (MOX) Fuel Fabrication Facility - Cumulative percentage of the design, construction, and cold start-up activities completed for the Mixed Oxide (MOX) Fuel Fabrication Facility.
Fiscal Year 2011 2012 2013 2014 2015
Target 62 % completed 70 % completed 81 % completed 90 % completed TBD
Result Not Met - 58 Not Met - 67.8 Not Met - 60 Not Met - 71.3 TBD
Endpoint Target TBD Note: Project will be terminated.
Commentary on 2015 Results (Action Plan if Not Met)
N/A
Documentation, Limitations, Methodology, Validation, and Verification
Earned Value Management System (EVMS) data from MOX FFF Monthly Status Report - Earned value determined through physical examination, observation, computation, and inspection; as well as original documents such as a signed statement or email verifying target completion
Program Fissile Materials Disposition
Performance Goal (Measure) U.S. Highly Enriched Uranium (HEU) Downblended - Cumulative amount of surplus U.S. highly enriched uranium (HEU) down-blended or shipped for down-blending.
Fiscal Year 2011 2012 2013 2014 2015
Target 136 MT 139 MT 143 MT 146 MT 150 MT
Result Exceeded - 137.1 Exceeded - 141.1 Exceeded - 143.8 Exceeded - 146.3 Met - 150
Endpoint Target By the end of FY 2030, complete disposition of 186 MT of surplus HEU. The overall amount of HEU available for down-blending and the rate at which it will be down-blended is dependent upon decisions regarding the U.S. nuclear weapons stockpile, the pace of warhead dismantlement, and receipt of HEU from research reactors as well as other considerations, such as decisions on processing of additional HEU through H Canyon, disposition paths for weapons pits containing HEU, etc.
Commentary on 2015 Results (Action Plan if Not Met)
Fully achieve the cumulative target of 150 MT of HEU down-blended or shipped for down-blending. Through September 2015, OFMD dispositioned a cumulative total of 150.0 MT of HEU, meeting the FY 2015 target. This result is important because it is contributing to the Department’s goal of disposing of surplus U.S. HEU.

FY 2015 DOE ANNUAL PERFORMANCE REPORT 50 | P a g e
Documentation, Limitations, Methodology, Validation, and Verification
CNS Y-12 monthly program status documents - Physical examination and inspection as documented in material control and accounting data forms and reports that the site is required to maintain under Special Nuclear Materials handling/shipping requirements; Original documents such as a signed statement or email verifying target completion
Program Fissile Materials Disposition
Performance Goal (Measure) U.S. Plutonium Disposition (H-Canyon) - Cumulative kilograms (kg) of plutonium converted to oxide at SR H-Canyon.
Fiscal Year 2011 2012 2013 2014 2015
Target N/A N/A N/A 180 kg 100 kg
Result Not Met - 1 Not Met - 1.8
Endpoint Target By the end of FY 2023, complete operations for 3.7 MT of plutonium converted to oxide at Savannah River Site.
Commentary on 2015 Results (Action Plan if Not Met)
Behind schedule and will not meet the annual target of converting 100 kg of plutonium to oxide at H Canyon. Through the end of the 4th quarter, SRNS produced ~9.6 kg of plutonium as oxide in HB-Line, with 1.8 kg meeting all MOX physical, chemical, and isotopic specifications. This was caused by failure to meet moisture content specifications as well as a criticality safety control violation. This metric demonstrates the commitment towards the Department's goal of disposing of at least 34 metric tons of surplus U.S. weapon-grade plutonium. Action Plan: HB-Line was not able to achieve consistent plutonium oxide production operations as planned in FY 2015. During 4Q, HB-Line met their resumption schedule following the February incident. Operations were once again paused following an August 2015 Technical Safety Requirement violation relative to criticality safety controls and procedural violations in HB-Line. SRNS is taking a comprehensive approach to addressing the incident. Resumption date is unknown at this time.
Documentation, Limitations, Methodology, Validation, and Verification
Monthly progress reports from the contractor detailing HB-Line plutonium oxide production.
Program Fissile Materials Disposition
Performance Goal (Measure) U.S. Plutonium Disposition (LANL) - Cumulative kilograms of plutonium metal converted to oxide at Los Alamos National Laboratory.
Fiscal Year 2011 2012 2013 2014 2015
Target N/A 375 kg 592 kg 692 kg 792 kg
Result Exceeded - 442 Met - 592 Not Met - 617 Not Met - 667
Endpoint Target By 2029, complete operations for 2 MT (2,000 kg) of plutonium converted to oxide.

FY 2015 DOE ANNUAL PERFORMANCE REPORT 51 | P a g e
Commentary on 2015 Results (Action Plan if Not Met)
Behind schedule and did not meet the cumulative target of 792 kg due to extended shutdown of operations of the operating facility (PF-4). As of September 30, 2015, 50 kg of plutonium oxide were accepted during the fiscal year, with a resulting cumulative total of 667 kg. The operational pause is due to conduct of operations and criticality safety concerns in PF-4 which impacted the ability to achieve this metric in FY 2015 and will continue to do so in FY 2016. This metric demonstrates the commitment toward the Department's goal of disposing of at least 34 metric tons of surplus U.S. weapon-grade plutonium. Action Plan: Readiness activities at LANL are ongoing and will support resumption of processes that support oxide production during FY 2016.
Documentation, Limitations, Methodology, Validation, and Verification
Cost data from Pu consolidated monthly status reports. Original documents such as a signed statement or email verifying target completion.
Program Fissile Materials Disposition
Performance Goal (Measure) WSB - Cumulative percentage of the design, construction, and cold start-up activities completed for the Waste Solidification Building (WSB).
Fiscal Year 2011 2012 2013 2014 2015
Target 65 % completed 95 % completed 87 % completed 91 % completed 100 % completed
Result Exceeded - 70 Not Met - 84 Exceeded - 90 Exceeded - 99 Met - 100
Endpoint Target Construction and startup activities complete by July 2015.
Commentary on 2015 Results (Action Plan if Not Met)
Fully achieved 100% completion of the design, construction, and cold start-up activities for the Waste Solidification Building. CD-4 was approved by the Project Management Executive on July 30, 2015. The facility was placed in a lay-up condition pending completion of the MFFF project.
Documentation, Limitations, Methodology, Validation, and Verification
EVMS and cost data from the WSB consolidated monthly status reports - Earned value determined through physical examination, observation, computation, and inspection; as well as original documents such as a signed statement or email verifying target completion
Global Threat Reduction Initiative
The Global Threat Reduction Initiative (GTRI) program reduces and protects vulnerable nuclear and radiological materials located at civilian sites worldwide.
Program Global Threat Reduction Initiative
Performance Goal (Measure) Highly Enriched Uranium (HEU) Reactors Converted or Shutdown - Cumulative number of HEU reactors and isotope production facilities converted or verified as shutdown prior to conversion.
Fiscal Year 2011 2012 2013 2014 2015

FY 2015 DOE ANNUAL PERFORMANCE REPORT 52 | P a g e
Target 75 reactors 81 reactors 88 facilities 92 facilities 94 facilities
Result Exceeded - 76 Exceeded - 82 Met - 88 Met - 92 Met - 94
Endpoint Target By 2035, convert or verify the shutdown prior to conversion of approximately 156 HEU reactors and isotope production facilities.
Commentary on 2015 Results (Action Plan if Not Met)
Fully achieved the cumulative target of 94. Two HEU reactors converted or verified as shutdown (Switzerland and Jamaica). This result is important because this effort will minimize the amount of weapons -usable material around the world.
Documentation, Limitations, Methodology, Validation, and Verification
GTRI Scorecard; Written Notification of conversion; Conversion Report
Program Global Threat Reduction Initiative
Performance Goal (Measure) Nuclear Material Removed - Cumulative number of kilograms of vulnerable nuclear material (HEU and plutonium) removed or disposed.
Fiscal Year 2011 2012 2013 2014 2015
Target 3,297 kg 3,555 kg 3,835 kg 5,207 kg 5,332 kilograms
Result Not Met - 3,125 Not Met - 3,462 Exceeded - 5,017 Met - 5,207 Exceeded - 5,376
Endpoint Target By 2022, remove or dispose of 7,000 kilograms of vulnerable nuclear material (HEU and plutonium), enough for more than 280 nuclear bombs.
Commentary on 2015 Results (Action Plan if Not Met)
Exceeded the cumulative target of removing or disposing 5,332 kg of vulnerable nuclear material (HEU and plutonium). In the fourth quarter, successfully removed 16.5 kg of HEU from Canada, Jamaica, Switzerland and Uzbekistan in addition to the third quarter confirmation of the disposition (via downblending) of HEU in France (112.2kg), and through the end of the 2nd quarter, two successful removals (40.2 kg total), for a total of 168.9 kg in FY 2015 and a cumulative total of 5376 kg. This result is important because this effort will minimize the amount of weapons-usable material around the world.
Documentation, Limitations, Methodology, Validation, and Verification
GTRI Scorecard; Notification of removal; Remove Report
Program Global Threat Reduction Initiative
Performance Goal (Measure) Radiological Buildings Protected - Cumulative number of buildings with high-priority radiological materials secured.
Fiscal Year 2011 2012 2013 2014 2015

FY 2015 DOE ANNUAL PERFORMANCE REPORT 53 | P a g e
Target 1,081 buildings 1,355 buildings 1,603 buildings 1,785 buildings 1,890 buildings
Result Exceeded - 1,187 Exceeded - 1,488 Exceeded - 1,674 Exceeded - 1,816 Exceeded - 1,958
Endpoint Target 4394 by 2033
Commentary on 2015 Results (Action Plan if Not Met)
Exceeded the cumulative target of 1,890 buildings protected with high priority radiological materials secured. In Q4, an additional 56 (44 international and 12 domestic) buildings were secured. The cumulative total to-date is 1,958. This result is important because it reduces the risk posed by nuclear and radioactive materials worldwide that could be used in crude nuclear bombs and radiological dispersal devices. In Q1, the program secured 9 international and 18 domestic buildings. In Q2, the program secured 12 international and 11 domestic buildings; and in Q3, the program secured 26 international and 10 domestic buildings.
Documentation, Limitations, Methodology, Validation, and Verification
GTRI Scorecard; Monthly notification of protection; Work team reports; Global Threat Reduction Initiative Programmatic Guidelines for Site Prioritization and Protection Implementation
Naval Reactors
Naval Reactors
Naval Reactors’ mission includes ensuring the safety of reactors and associated naval nuclear propulsion plants, and control of radiation and radioactivity associated with naval nuclear propulsion activities, including prescribing and enforcing standards and regulations for these areas as they affect the environment and the safety and health of workers, operators, and the general public. Naval Reactors maintains oversight of program support in areas such as security, nuclear safeguards and transportation, radiological controls, public information, procurement, logistics, and fiscal management.
Program Naval Reactors
Performance Goal (Measure) A1B Reactor Plant Design - Cumulative percentage of completion on the next-generation aircraft carrier reactor plant design.
Fiscal Year 2011 2012 2013 2014 2015
Target 94 % complete 96 % complete 98 % complete 99 % complete 100 % complete
Result Met - 94 Met - 96 Met - 98 Exceeded - 99.6 Met - 100
Endpoint Target By the end of FY 2015, complete 100% of the design of the reactor plant for the next-generation aircraft carrier.
Commentary on 2015 Results (Action Plan if Not Met)
As of 9/30/2015, 100.0% of the next generation aircraft carrier reactor plant design has been completed. Milestones achieved this quarter: Bechtel Marine Propulsion Corporation (BMPC) physicists qualified for low power physics testing; issued reactor plan instrumentation and control certification report. This result is important because it provides the Navy with next-generation aircraft carrier propulsion plant technology that increases core energy, provides nearly three times the electric plant generating capability, and requires half of the reactor department sailors needed as compared to present-day CVN aircraft carriers.

FY 2015 DOE ANNUAL PERFORMANCE REPORT 54 | P a g e
Documentation, Limitations, Methodology, Validation, and Verification
CVN 21 Propulsion Plant Planning Estimate & Actual Reporting
Program Naval Reactors
Performance Goal (Measure) S1B Reactor Plant Design - Cumulative percentage of work complete on the Ohio Replacement submarine reactor plant design.
Fiscal Year 2011 2012 2013 2014 2015
Target N/A 12 % complete 17 % complete 22 % complete 32 % complete
Result Exceeded - 15.6 Exceeded - 18.4 Exceeded - 25.7 Exceeded - 34.6
Endpoint Target By the end of FY 2027, complete 100% of the Ohio-Class Replacement submarine reactor plant design. Note: In FY 2013, DoD delayed construction start for the lead ship by two years (from FY 2019 to FY 2021) and reactor plant advanced procurement from FY 2017 to FY 2019.
Commentary on 2015 Results (Action Plan if Not Met)
As of 9/30/2015, 34.6% of the Ohio-Class replacement submarine reactor plant has been completed. Milestones achieved this quarter: submitted reactor vessel flange taper design to NR for approval; submitted main omega seal reference design drawings for NR approval; completed power unit installation tolerance and alignment study; and submitted casualty rod control architecture and arrangement recommendation for NR approval. This result is important because it will provide the Nation's Sea Based Strategic Deterrent into the 2080s. S1B reactor and life-of-ship core design will support over 40 years of operation, exceeding Virginia-Class by more than 10 years, and allow fulfillment of its mission with two fewer submarines than the Ohio-Class.
Documentation, Limitations, Methodology, Validation, and Verification
S1B Propulsion Plant Planning Estimate & Actual Reporting
Energy Efficiency and Renewable Energy
Weatherization and Intergovernmental Programs
The mission of the Weatherization and Intergovernmental Programs (WIP) is to partner with state and local organizations to significantly accelerate the deployment of clean energy (e.g., energy efficiency and renewable energy) technologies and practices by a wide range of government, community, and business stakeholders
Program Weatherization and Intergovernmental Programs
Performance Goal (Measure) OWIP - Retrofits - Weatherize homes of low income families

FY 2015 DOE ANNUAL PERFORMANCE REPORT 55 | P a g e
Note: budget measure is for homes weatherized with base DOE funds. From FY 2010 - FY2012 DOE also achieved its joint Priority Goal with the Department of Housing and Urban Development (HUD) of retrofitting 1.2 million homes (cumulative), where DOE retrofitted more than 1 million homes. Most of these homes were retrofitted with Recovery Act funds. The number of homes, energy savings and GHG avoided metrics can be viewed on www.performance.gov.
Fiscal Year 2011 2012 2013 2014 2015
Target 33,484 homes weatherized*
10,000 homes weatherized
21,286 homes weatherized
24,600 homes weatherized
33,100 homes weatherized
Result Exceeded - 45,042 Exceeded - 31,871 Met - 21,286 Exceeded - 38,000 Exceeded - 34,220
Endpoint Target Support 300,000 homes energy retrofits between FY 2013 and FY 2022
Commentary on 2015 Results (Action Plan if Not Met)
34220
Documentation, Limitations, Methodology, Validation, and Verification
Bioenergy Technologies
The Bioenergy Technologies Program catalyzes the development of cost-effective technologies that reduce our dependence on imported petroleum, while lowering greenhouse gas emissions, through the use of domestically produced non-food biomass resources that enable the U.S. to be competitive in emerging renewable energy markets
Program Bioenergy Technologies
Performance Goal (Measure) Biomass - Conversion Cost - Reduce modeled conversion cost for feedstock to gasoline/diesel fuel via a bio-oil pathway ($2011, $/gallons of gasoline equivalent, gge)
Fiscal Year 2011 2012 2013 2014 2015
Target N/A N/A $3.18 /gge $4.1 /gge $3.7/gge
Result - 3.95 Met - 3.13 Met - 4.1 Exceeded - 6.14
Endpoint Target $2.5/gge by 2017.
Commentary on 2015 Results (Action Plan if Not Met)
Using the C5/C6 split stream sugar approach outlined in FY14, the cumulative technical performance for the 2015 State of Technology Case resulted in a conversion cost of $6.14/gge (in 2011 $). This exceeds both the 2015 conversion contribution target as stated in the MYPP of $6.93/gge and the 2015 conversion contribution dashboard target of $6.40/gge. Deconstruction and C6 conversion to hydrocarbons were on track with goals, and the significantly lower cost achieved was primarily due to significant improvements in succinic acid co-product overall yields (220 lb succinic acid/dry ton, compared to the 2015 goal of 206 lb succinic acid/dry ton and the demonstrated 2014 SOT result of 197 lb succinic acid/dry ton). The succinic

FY 2015 DOE ANNUAL PERFORMANCE REPORT 56 | P a g e
acid bioconversion parameters (productivity, metabolic yield, and process yield) all exceeded the 2015 technical targets and in some case are approaching the 2017 technical targets.
Documentation, Limitations, Methodology, Validation, and Verification
Program Bioenergy Technologies
Performance Goal (Measure) Biomass - Feedstock Logistics Cost - Reduce feedstock logistics cost for delivery to plant ($/dry-matter ton) [2013 & 2014 targets from 2011 baseline] 2013: Internal approval of design case for the modeled feedstock pathways to achieve the $80/DT 2017 target, which is part of the $3/gge programmatic target. 2010 – 2012: Reduce feedstock supply system logistics cost in dollars per dry matter ton ($/DM ton, in $2007, for delivery to plant gate or conversion reactor inlet) to support the development of cost -effective, high tonnage feedstock logistics systems and enable the supply of biomass feedstocks for a growing bio-based industry.
Fiscal Year 2011 2012 2013 2014 2015
Target 36.1 $/dry-matter ton 35 $/dry-matter ton 55 $/dry-matter ton 130 $/dry-matter ton 115 Dollars
Result Met - 36.1 Met - 35 Met - 55 Met - 130 Exceeded - 113.63
Endpoint Target A delivered feedstock cost of $80 per dry matter-ton by 2017
Commentary on 2015 Results (Action Plan if Not Met)
Woody Biomass is down from $101.45/dt to $92.22/dt (2011$) and herbaceous biomass is down from $129.75/dt to $113.63/dt (2011$) due mainly to blending and improvements in preprocessing.
Documentation, Limitations, Methodology, Validation, and Verification
Geothermal Technology
The mission of the Geothermal Technologies Program is to accelerate the deployment of domestic electricity generation from geothermal resources by investing in transformative research, development, and demonstration-scale projects that will catalyze commercial adoption. Successful efforts will promote a stronger, more productive economy; provide valuable, stable, and secure renewable energy to power the U.S.; and support a cleaner environment.
Program Geothermal Technology
Performance Goal (Measure) Geothermal - Systems - Reduce the Levelized Cost of Electricity (LCOE) from newly developed geothermal systems (cents/kWh)

FY 2015 DOE ANNUAL PERFORMANCE REPORT 57 | P a g e
2013+: includes both hydrothermal and Enhance Geothermal Systems. 2012: Reduce the LCOE for development of Enhanced Geothermal Systems: assuming non-uniform discount rate. 2011: Increase average total flow rate per production well in kilograms/second for EGS field site
Fiscal Year 2011 2012 2013 2014 2015
Target 12 average flow rate per production well
in kilograms/second for EGS field site
18 cents/KWh for 24-hour electricity
production
22.5 cents/KWh for 24-hour electricity
production
22.4 cents/kWh 22.4 cents/kWh
Result Not Met - 0 Met - 18 Met - 22.5 Met - 22.4 Exceeded - 22.3
Endpoint Target $0.06/kWh by 2030
Commentary on 2015 Results (Action Plan if Not Met)
With analysis conducted using GETEM, LCOE was successfully modeled at 22.3 cents in 2012 dollars.
Documentation, Limitations, Methodology, Validation, and Verification
Hydrogen and Fuel Cell Technologies
Hydrogen and fuel cells have the potential to improve energy security and reduce emissions of greenhouse gases, criteria pollutants, and net oil imports by improving energy efficiency, enabling alternative fuel sources, and spurring domestic production of clean energy technologies . Widespread use of hydrogen and fuel cells can have a major impact toward achieving EERE’s goals of expanding the adoption of sustainable, domestically powered transportation alternatives; improving the efficiency of energy use; stimulating the growth of domestic clean energy manufacturing; and enabling the integration of clean energy into a reliable, resilient, and more efficient electricity grid.
Program Hydrogen and Fuel Cell Technologies
Performance Goal (Measure) Hydrogen and Fuel Cell Technology - Cost - Reduce the cost of hydrogen [$/Gallon of Gasoline Equivalent) (gge)] 2012: Relative to the 2011 baseline, decrease the capital cost for hydrogen production and delivery using renewable resources.
Fiscal Year 2011 2012 2013 2014 2015
Target N/A 20 % decrease 7.6 $/gge 7.2 $/gge 6.8 gge
Result Met - 20 Met - 7.6 Met - 7.2 Met - 6.8
Endpoint Target $4/gge by 2020

FY 2015 DOE ANNUAL PERFORMANCE REPORT 58 | P a g e
Commentary on 2015 Results (Action Plan if Not Met)
The FY15 Q4 milestone of reducing the cost of delivered hydrogen to $6.80/gge relative to the FY11 baseline of $8/gge and the FY14 status of $7/gge has been met using the following cost contributions: - Tube trailer consolidation using 540-bar tube trailers: Cost savings associated with hydrogen delivery via 540-bar tube trailers, along with use of the consolidation scheme at the forecourt was established as $0.19/gge in comparison to the 2014 delivery cost status. (ANL) - Steel Concrete Composite Vessels: ASME certification of a prototype of a 430-bar steel concrete composite vessel for hydrogen storage results in cost savings of $0.08/gge relative to the 2014 delivery pathway status. (ORNL) - SOEC: A new case study that projects the cost of hydrogen production from solid oxide electrolysis cells (SOEC) updated the hydrogen production baseline to $4.21/gge (Strategic Analysis)
Documentation, Limitations, Methodology, Validation, and Verification
Program Hydrogen and Fuel Cell Technologies
Performance Goal (Measure) Hydrogen and Fuel Cell Technology - Fuel Cell Power - Improve the catalyst specific power of fuel cells, as measured in kilowatts, kW, per gram of platinum group metal.
Fiscal Year 2011 2012 2013 2014 2015
Target 5.5 kW per gram of platinum group metal
5.8 kW per gram of platinum group metal
5.9 kW per gram of platinum group metal
6.3 kW per gram of platinum group metal
6.5 kW per gram
Result Exceeded - 5.6 Met - 5.8 Exceeded - 6 Met - 6.3 Exceeded - 6.6
Endpoint Target 8 kW/g by 2017 $30/kW fuel cell system cost target
Commentary on 2015 Results (Action Plan if Not Met)
The Q4 milestone was met ahead of schedule in Q2. A best of class MEA prepared by 3M demonstrated average catalyst specific power of 6.6 kW/g while satisfying the heat rejection criterion of 1.45 kW/C. This MEA contained a nanostructured thin film (NSTF) anode based on PtCoMn catalyst, with 0.02mgPt/cm2. The NSTF cathode was based on dealloyed Pt3Ni7 catalyst at a loading of 0.106mgPt/cm2. The total MEA PGM areal loading was 0.126mg/cm2, and the active area was 50 cm2.
Documentation, Limitations, Methodology, Validation, and Verification

FY 2015 DOE ANNUAL PERFORMANCE REPORT 59 | P a g e
Solar Energy
The DOE SunShot Initiative is a collaborative national effort to make the U.S. a leader in the global clean energy race by accelerating solar energy technology development. The DOE SunShot Initiative will enable widespread, large-scale adoption of solar power technologies across America by making solar energy systems cost-competitive with other forms of energy by the end of the decade
Program Solar Energy
Performance Goal (Measure) Solar - Concentrated Solar Power (CSP) - Reduce the levelized cost of Concentrated Solar Power energy at utility scale (cents / kilowatt hour, kWh)
Fiscal Year 2011 2012 2013 2014 2015
Target 16 cents/kWh 19 cents/kWh (range 18-20)
18 cents/kWh (range 17-19)
15 cents/kWh 13 cents/kWh
Result Exceeded - 11 Exceeded - 18.5 Exceeded - 14.4 Exceeded - 14 Exceeded - 12.9
Endpoint Target 6 cent /kWh by 2020, cost competitive with traditional electricity sources
Commentary on 2015 Results (Action Plan if Not Met)
Current CSP benchmark is 12.9 cents/kWh, using the SAM model for a 100 MW Molten Salt Tower with 10 hours of storage, a 56.1% capacity factor, and a capital cost of $6,885/kW
Documentation, Limitations, Methodology, Validation, and Verification
Program Solar Energy
Performance Goal (Measure) Solar - Deployment - Installed capacity of solar in the US (gigawatts, GW)
Fiscal Year 2011 2012 2013 2014 2015
Target 3 GW installed 5 GW installed 7 GW installed 9 GW installed 23 gigawatts
Result Exceeded - 3.1 Met - 5 Exceeded - 8.8 Met - 16 Exceeded - 25
Endpoint Target 120 GW by 2020, 300 GW by 2030
Commentary on 2015 Results (Action Plan if Not Met)
As of 6/30/15 there was 21 GW of installed PV systems and 1.7 GW of CSP. SEIA/GTM projects 7.7GW of PV to be installed in CY2015, translating into 5GW in H2 2015. Assuming 40% of this is installed in FY Q415 then 23GW of PV has been installed and 25 GW of solar. (SEIA & GTM, U.S. Solar Market Insight Q2 2015, September 2015).
Documentation, Limitations, Methodology, Validation, and Verification

FY 2015 DOE ANNUAL PERFORMANCE REPORT 60 | P a g e
Program Solar Energy
Performance Goal (Measure) Solar - Photovoltaic (PV) - Reduce the levelized cost of Solar PV energy at utility scale (cents / kilowatt hour, kWh)
Fiscal Year 2011 2012 2013 2014 2015
Target 20 cents/kWh (range 8 - 20)
17 cents/kWh (range 13 – 17)
15 cents/kWh (range 13 – 17)
13 cents/kWh 10 cents per kwh
Result Met - 17 Met - 16 Met - 15 Exceeded - 11 Met - 10
Endpoint Target 6 cents /kWh by 2020, cost competitive with traditional electricity sources
Commentary on 2015 Results (Action Plan if Not Met)
The recently published report, "Technology Advances Needed for Photovoltaics to Achieve Widespread Grid Price Parity" by Michael Woodhouse of NREL and Rebecca Jones-Albertus of the DOE, reports utility-scale PV LCOE ranging from 8.0—13.1/kWh (Fixed Tilt) and 6.9—12.1 1-Axis Tracking
Documentation, Limitations, Methodology, Validation, and Verification
Water Power
The Water Power Program supports research, development, demonstration, and deployment (RDD&D) in two distinct renewable power domains: (1) Hydropower and (2) Marine and Hydrokinetic (MHK) energy.
Program Water Power
Performance Goal (Measure) Water - Marine & Hydrokinetic (MHK) - Reduce the cost of energy from Marine & Hydrokinetic technologies 2011 - 2013: Test marine and hydrokinetic devices and components to determine baseline cost, performance, and reliability. (all targets cumulative)
Fiscal Year 2011 2012 2013 2014 2015
Target 2 MHK devices tested
3 MHK devices tested
10 MHK devices tested
0.6 LCOE TBD - end of FY2013
50 percentage
Result Met - 2 Met - 3 Met - 10 Exceeded - 0.53 Met - 50
Endpoint Target Competitive with local coastal hurdle rates by 2030
Commentary on 2015 Results (Action Plan if Not Met)
The 2015 goal of achieving a power to weight ratio (PWR) of 0.375 kW/ton for wave energy conversion technologies was realized through R&D projects that were funded by the DOE Water Power Program. Specifically, recent DOE funded concept studies show that using advanced composite materials has the potential to achieve PWRs higher than 0.4 kW/ton, easily surpassing the 2015 GPRA goal. The Program is continuing to fund work in this area in 2016 and 2017 by supporting the open water tests of near full-scale device prototypes. Results from these tests will be used to validate the predicted PWR for devices that utilize advanced composite materials."

FY 2015 DOE ANNUAL PERFORMANCE REPORT 61 | P a g e
Documentation, Limitations, Methodology, Validation, and Verification
Wind Energy
The mission of the Wind Energy Program is to accelerate the widespread U.S. deployment of clean, affordable, and reliable wind power to promote energy security, economic growth, and environmental quality
Program Wind Energy
Performance Goal (Measure) Wind - Offshore - Cost of fixed-bottom off-shore wind energy (cents/kWh)
Fiscal Year 2011 2012 2013 2014 2015
Target 26.8 cents/kWh 22.5 cents/kWh 20.4 cents/kWh 20 cents/kWh 19.53 cents per kwh
Result Exceeded - 22.5 Met - 22.5 Met - 20.4 Exceeded - 18.8 Not Met - 20.9
Endpoint Target 16.7 cents/kWh by 2020 using a 7% discount rate.
Commentary on 2015 Results (Action Plan if Not Met)
The FY15 Offshore Wind Cost of Energy was estimated at 20.9 cents/kWh. With an equivalent 2014 dollar year and when applying representative US project financing terms rather than a fixed 7% real discount rate, costs of 19.3 cents/kWh are estimated. When adjusting for aggregate economy wide inflation (to the year in which the baseline values and targets were established) costs are estimated at 19.9 cents per kWh in 2011 dollars, with a fixed 7% real discount rate. Action Plan: Wind and Water will report all LCOE targets in real terms (2010 dollars). If Offshore Wind LCOE
is not held to a 7% discount rate and is modeled using market averages, the cost of Offshore Wind energy
would be 17.7 cents/kWh (2010 dollars), surpassing the stated goal of 18.5 cents/kWh (2010 dollars). The
wind program has historically expressed LCOE in nominal terms (including inflation). OMB gave specific
guidance that the FY17 CBJ metrics table should be expressed in only real or nominal terms. Given this
guidance, the Wind program has adopted the policy to express LCOE in real terms (2010 dollars) since the
end point targets were developed in 2010.
*Note: On an annual basis, the Wind program collects empirical market data and provides a non-biased levelized cost of electricity. The Offshore Wind LCOE In 2015 was high due to circumstances in the European industry (the basis for our calculation). European Offshore Wind experienced much higher than average costs due to a number of offshore wind installations at deeper and much further from shore sites. This cost trend is expected to be reversed in the coming year.
Documentation, Limitations, Methodology, Validation, and Verification

FY 2015 DOE ANNUAL PERFORMANCE REPORT 62 | P a g e
Program Wind Energy
Performance Goal (Measure) Wind - Onshore - Cost of land-based wind energy (cents/kWh) 2008 - 2012: measure for modeled reduction in cents/kWh; 2012+ are survey results.
Fiscal Year 2011 2012 2013 2014 2015
Target 0.1 cents/kWh reduction
8 cents/kwh 7.7 cents/kWh 7.2 cents/kWh 6.7
Result Met - 0.1 Met - 8 Met - 7.7 Met - 6.9 Not Met - 6.8
Endpoint Target 5.7 cents/kWh by 2020 using a 7% discount rate
Commentary on 2015 Results (Action Plan if Not Met)
The FY15 Land-based Cost of Energy was estimated at 6.8 cents/kWh, just above the targeted 6.7 cents/kWh. With an equivalent 2014 dollar year and when applying weighted average market derived financing terms rather than a fixed 7% real discount rate as stipulated by EERE, costs of 6.5 cents/kWh are estimated. In addition, when adjusting for aggregate economy wide inflation (to the year in which the baseline values and targets were established) costs are estimated at 6.3 cents per kWh in 2010 dollars, even with a fixed 7% real discount rate. Action Plan: Required action was completed as of the submission of FY17 CBJ (2/3/2016). The wind program has historically expressed LCOE in nominal terms (including inflation). OMB gave specific guidance that the FY17 CBJ metrics table should be expressed in only real or nominal terms. Given this guidance, the Wind program has adopted the policy to express LCOE in real terms (2010 dollars) since the end point targets were developed in 2010. *Note: With the program’s new policy, the FY15 Land Based Wind LCOE would be 6.3 cents/kWh (2010 dollars) which would be .1 cents/kWh less expensive than the 6.4 cents/kWh (2010 dollars) target. This would require no action plan.
Documentation, Limitations, Methodology, Validation, and Verification
Advanced Manufacturing Office
Reduce the energy intensity and life-cycle energy consumption of manufactured products by researching, developing, and demonstrating energy-efficient manufacturing processes and materials. Promote continuous improvement in energy efficiency among existing facilities and manufacturers. Our goal is to reduce energy consumption of manufactured goods across product life-cycles by 50 percent over 10 years.
Program Advanced Manufacturing Office

FY 2015 DOE ANNUAL PERFORMANCE REPORT 63 | P a g e
Performance Goal (Measure) AMO - Advanced Manufacturing R&D Projects - Advanced Manufacturing R&D Projects - Demonstrate new manufacturing process technologies capable of reducing energy consumption by at least 25% compared to current industrial processes (annual number of new manufacturing processes). 2012: increase the build speed of metal components and strength of polymer components. 7 ksi.
Fiscal Year 2011 2012 2013 2014 2015
Target N/A 1 manufacturing process
2 manufacturing processes
2 manufacturing processes
2 processes
Result Met - 1 Met - 2 Met - 2 Met - 2
Endpoint Target Demonstrate 10 manufacturing processes on an industrially relevant scale by 2024, leading to energy savings and increased U.S. competitiveness.
Commentary on 2015 Results (Action Plan if Not Met)
MET with 3 technologies. The Rapid Freeform Sheet Metal Forming (RAFFT) machine built by Ingersoll is a unique tool that employs a double-sided incremental forming process to form parts based on advanced computational model programmed toolpaths that eliminates stamping and forming dies. A novel hydrogen sintering near-net-shape titanium production process using low-cost powder metallurgy techniques was successfully developed. This process saves more than 25 percent of the energy used to make titanium parts by avoiding several high temperature melting and refining steps in the manufacturing process because near net shaped parts are made directly from sintered low cost powders. Cummins Power Generation demonstrated the operation of a 330 KWe CHP system suitable for “plug and play” installation in small industrial and commercial sites. With efficiency above 75%, this is one of the highest-efficiency CHP systems smaller than 1 MW in size.
Documentation, Limitations, Methodology, Validation, and Verification
Program Advanced Manufacturing Office
Performance Goal (Measure) AMO – Demonstration - Support clean manufacturing institute(s) to demonstrate advanced physical and virtual tools which optimize critical processes
Fiscal Year 2011 2012 2013 2014 2015
Target N/A N/A 1 tools 1 2 Institutes
Result Met - 1 Met - 1 Met - 2
Endpoint Target 9 demonstration facilities by 2017.

FY 2015 DOE ANNUAL PERFORMANCE REPORT 64 | P a g e
Commentary on 2015 Results (Action Plan if Not Met)
IACMI is a fully functional Institute with the Cooperative Agreement signed in June 2015. The Institute makes solid progress toward operational and technical milestones and is preparing for the second budget period of activity to commence Jan 01, 2016.
Documentation, Limitations, Methodology, Validation, and Verification
Building Technologies
EERE’s Building Technologies Program will continue to develop and demonstrate advanced building efficiency technologies and practices to make buildings in the U.S. more efficient, affordable, and comfortable
Program Building Technologies
Performance Goal (Measure) Buildings - Lighting - Decrease the manufacturing cost of a warm white LED package. (Lumens / $) 2012: Increase lighting efficacy of “warm white light” solid-state lighting in a lab device. 2008-2011 unit was "non-warm white light"
Fiscal Year 2011 2012 2013 2014 2015
Target 142 lumens per watt of “non-warm white
light”
127 lumens per watt of “warm white light”
148 lumens per watt of “warm white light”
128 lumens 114 dollars per lumens
Result Exceeded - 149 Exceeded - 133.1 Met - 148 Exceeded - 150 Exceeded - 176
Endpoint Target 217 lm/$ by 2020
Commentary on 2015 Results (Action Plan if Not Met)
Exceeded the 144 lm/$ goal by reaching 176 lm/$
Documentation, Limitations, Methodology, Validation, and Verification
Program Building Technologies
Performance Goal (Measure) Buildings - Standards - Final Rules - Annual number of products for which final rules for test procedures and standards will be issued,
Fiscal Year 2011 2012 2013 2014 2015
Target 16 products 17 products 31 products 13 products N/A
Result Met - 16 Exceeded - 29 Not Met - 19 Exceeded - 16 Exceeded
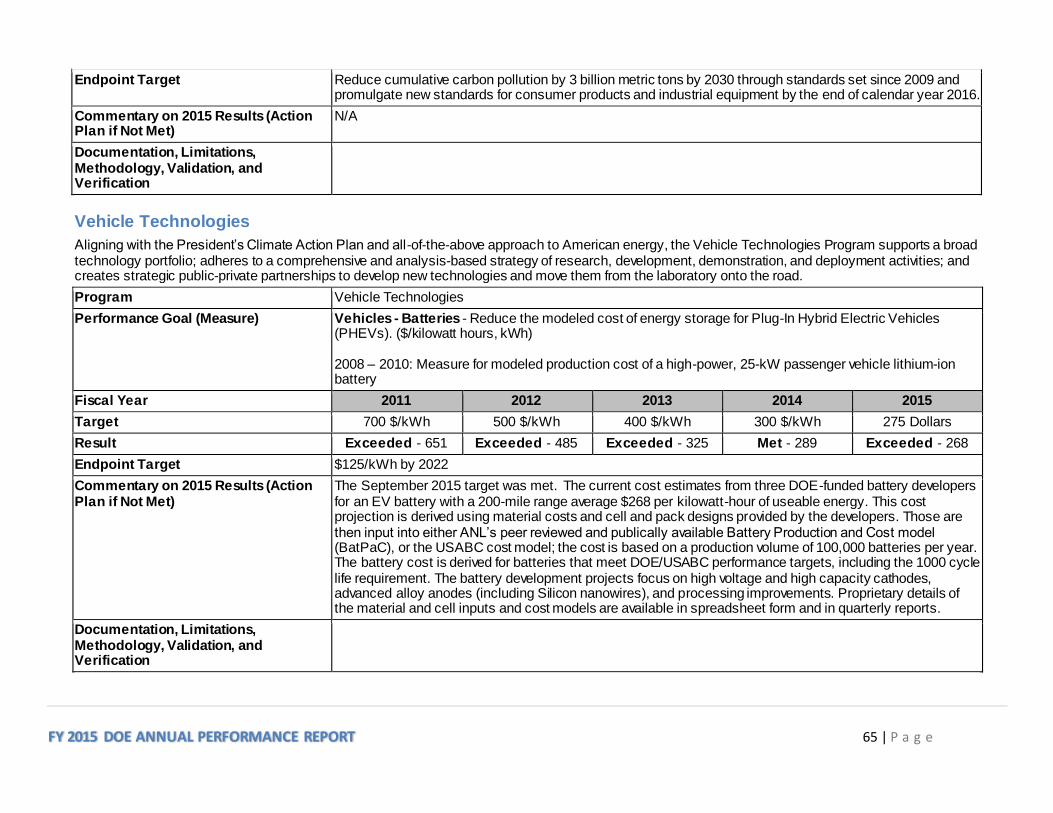
FY 2015 DOE ANNUAL PERFORMANCE REPORT 65 | P a g e
Endpoint Target Reduce cumulative carbon pollution by 3 billion metric tons by 2030 through standards set since 2009 and promulgate new standards for consumer products and industrial equipment by the end of calendar year 2016.
Commentary on 2015 Results (Action Plan if Not Met)
N/A
Documentation, Limitations, Methodology, Validation, and Verification
Vehicle Technologies
Aligning with the President’s Climate Action Plan and all-of-the-above approach to American energy, the Vehicle Technologies Program supports a broad technology portfolio; adheres to a comprehensive and analysis-based strategy of research, development, demonstration, and deployment activities; and creates strategic public-private partnerships to develop new technologies and move them from the laboratory onto the road.
Program Vehicle Technologies
Performance Goal (Measure) Vehicles - Batteries - Reduce the modeled cost of energy storage for Plug-In Hybrid Electric Vehicles (PHEVs). ($/kilowatt hours, kWh) 2008 – 2010: Measure for modeled production cost of a high-power, 25-kW passenger vehicle lithium-ion battery
Fiscal Year 2011 2012 2013 2014 2015
Target 700 $/kWh 500 $/kWh 400 $/kWh 300 $/kWh 275 Dollars
Result Exceeded - 651 Exceeded - 485 Exceeded - 325 Met - 289 Exceeded - 268
Endpoint Target $125/kWh by 2022
Commentary on 2015 Results (Action Plan if Not Met)
The September 2015 target was met. The current cost estimates from three DOE-funded battery developers for an EV battery with a 200-mile range average $268 per kilowatt-hour of useable energy. This cost projection is derived using material costs and cell and pack designs provided by the developers. Those are then input into either ANL’s peer reviewed and publically available Battery Production and Cost model (BatPaC), or the USABC cost model; the cost is based on a production volume of 100,000 batteries per year. The battery cost is derived for batteries that meet DOE/USABC performance targets, including the 1000 cycle life requirement. The battery development projects focus on high voltage and high capacity cathodes, advanced alloy anodes (including Silicon nanowires), and processing improvements. Proprietary details of the material and cell inputs and cost models are available in spreadsheet form and in quarterly reports.
Documentation, Limitations, Methodology, Validation, and Verification

FY 2015 DOE ANNUAL PERFORMANCE REPORT 66 | P a g e
Program Vehicle Technologies
Performance Goal (Measure) Vehicles - Electric Drive - Reduce the cost of electric-drive technologies ($/kilowatt, kW, peak power)
Fiscal Year 2011 2012 2013 2014 2015
Target 18 $/kilowatt peak power
17 $/kilowatt peak power
16 $/kilowatt peak power
15 $/kilowatt peak power
12 Dollars per kwh
Result Met - 18 Met - 17 Met - 16 Met - 15 Met - 12
Endpoint Target $12/kW by 2015 and $8/kW by 2020
Commentary on 2015 Results (Action Plan if Not Met)
The September 2015 target was met. Component testing, simulation, and modeling of inverter and motor designs innovations met the Electric Drive Technologies $12/kW target. Successful achievement of this high volume cost target is based on Delphi’s recent accomplishments with its advanced High Temperature Inverter and Integrated Controller along with ORNL’s innovative synchronous reluctance non-rare earth motor. These results will be included in the EDT FY 2015 Annual Report.
Documentation, Limitations, Methodology, Validation, and Verification
Program Vehicle Technologies
Performance Goal (Measure) Vehicles - Petroleum Use - Reduce the use of petroleum through the adoption of alternative fuel vehicles and infrastructure (million gallons per year)
Fiscal Year 2011 2012 2013 2014 2015
Target 570 million gallons per year
700 million gallons per year
775 million gallons per year
850 million gallons per year
1.15 gallons per year
Result Exceeded - 600 Exceeded - 750 Exceeded - 820 Met - 850 Met - 1.15
Endpoint Target By 2015, 1B gal/yr. (gge) of petroleum reduction with alternative fuel vehicles and infrastructure. By 2020, 2.5B gal/yr. (gge) of petroleum reduction with alternative fuel vehicles and infrastructure.
Commentary on 2015 Results (Action Plan if Not Met)
Annual progress reports were submitted by nearly 100 Clean Cities coalitions to document vehicle deployment activities and project results for the 2014 calendar year. This data was analyzed, verified, and rolled up with other program metrics into an annual report for the national program. Patterns and trends were identified to estimate petroleum/emission reduction impacts for 2015. - Coalition reported impacts = .77B - Impact from National Lab activities/projects = .32B - Impact from National Clean Fleet partner projects and activities = .06B

FY 2015 DOE ANNUAL PERFORMANCE REPORT 67 | P a g e
Total Petroleum Reduction estimate for 2015 = 1.15B gallons
Documentation, Limitations, Methodology, Validation, and Verification
Program Vehicle Technologies
Performance Goal (Measure) Vehicles - Powertrain - Improved fuel economy from advances in engine efficiency (% passenger vehicle/commercial vehicle) 2008 - 2010: measure for % engine efficiency improvement demonstrated
Fiscal Year 2011 2012 2013 2014 2015
Target 10 % passenger vehicles, 5% commercial
15 % passenger vehicles, 10% commercial
20 % passenger vehicles, 15% commercial
23 % passenger vehicles, 18% commercial
25 Percentage
Result Met - 10 Met - 15 Met - 20 Met - 23 Met - 25
Endpoint Target by 2015, 25% improved fuel economy for passenger vehicles & 20% for commercial vehicles
Commentary on 2015 Results (Action Plan if Not Met)
ORNL made use of the gasoline and diesel fuel reactivity controlled compression ignition (RCCI) engine map completed for the Q3 milestone to model the potential fuel economy improvement with RCCI compared to a 2009 port fuel injection (PFI) gasoline engine on the same vehicle platform. All simulations were carried out in Autonomie using a 1580 kg passenger vehicle (mid-size sedan i.e. Chevrolet Malibu) over numerous U.S. federal light-duty drive cycles. An engine map for a 2.7 L 2009 PFI gasoline engine was selected as the baseline and the production map was obtained from an OEM partner for use in the vehicle simulations. Vehicle systems simulation results showed a greater than 25% increase in combined cycle fuel economy on a gasoline equivalent basis was made possible with the multi-mode RCCI operating strategy as compared to the 2.7L 2009 PFI baseline on the same simulated vehicle with equivalent performance. ANL utilized an engine map for its Gasoline Compression Ignition (GCI) engine in Autonomie to model fuel economy improvement. The GCI engine enabled greater than 25% fuel economy improvement compared to a PFI baseline vehicle.
Documentation, Limitations, Methodology, Validation, and Verification
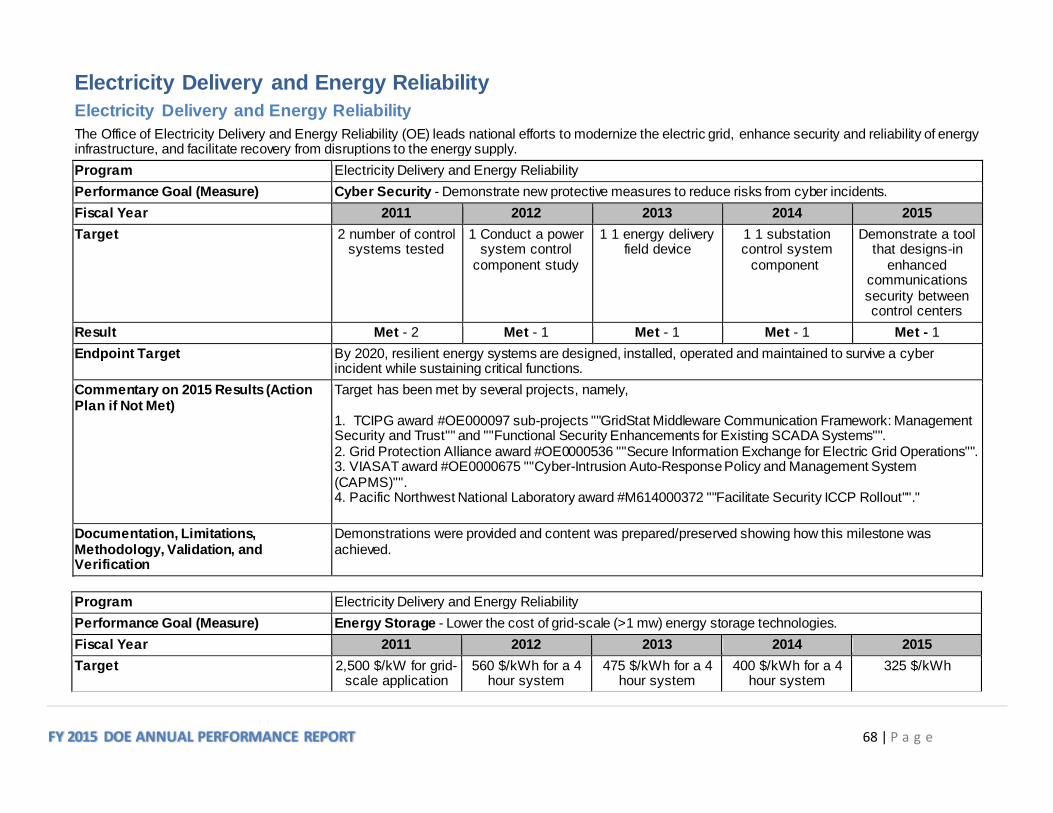
FY 2015 DOE ANNUAL PERFORMANCE REPORT 68 | P a g e
Electricity Delivery and Energy Reliability
Electricity Delivery and Energy Reliability
The Office of Electricity Delivery and Energy Reliability (OE) leads national efforts to modernize the electric grid, enhance security and reliability of energy infrastructure, and facilitate recovery from disruptions to the energy supply.
Program Electricity Delivery and Energy Reliability
Performance Goal (Measure) Cyber Security - Demonstrate new protective measures to reduce risks from cyber incidents.
Fiscal Year 2011 2012 2013 2014 2015
Target 2 number of control systems tested
1 Conduct a power system control
component study
1 1 energy delivery field device
1 1 substation control system
component
Demonstrate a tool that designs-in
enhanced communications security between control centers
Result Met - 2 Met - 1 Met - 1 Met - 1 Met - 1
Endpoint Target By 2020, resilient energy systems are designed, installed, operated and maintained to survive a cyber incident while sustaining critical functions.
Commentary on 2015 Results (Action Plan if Not Met)
Target has been met by several projects, namely, 1. TCIPG award #OE000097 sub-projects ""GridStat Middleware Communication Framework: Management Security and Trust"" and ""Functional Security Enhancements for Existing SCADA Systems"". 2. Grid Protection Alliance award #OE0000536 ""Secure Information Exchange for Electric Grid Operations"". 3. VIASAT award #OE0000675 ""Cyber-Intrusion Auto-Response Policy and Management System (CAPMS)"". 4. Pacific Northwest National Laboratory award #M614000372 ""Facilitate Security ICCP Rollout""."
Documentation, Limitations, Methodology, Validation, and Verification
Demonstrations were provided and content was prepared/preserved showing how this milestone was achieved.
Program Electricity Delivery and Energy Reliability
Performance Goal (Measure) Energy Storage - Lower the cost of grid-scale (>1 mw) energy storage technologies.
Fiscal Year 2011 2012 2013 2014 2015
Target 2,500 $/kW for grid-scale application
560 $/kWh for a 4 hour system
475 $/kWh for a 4 hour system
400 $/kWh for a 4 hour system
325 $/kWh
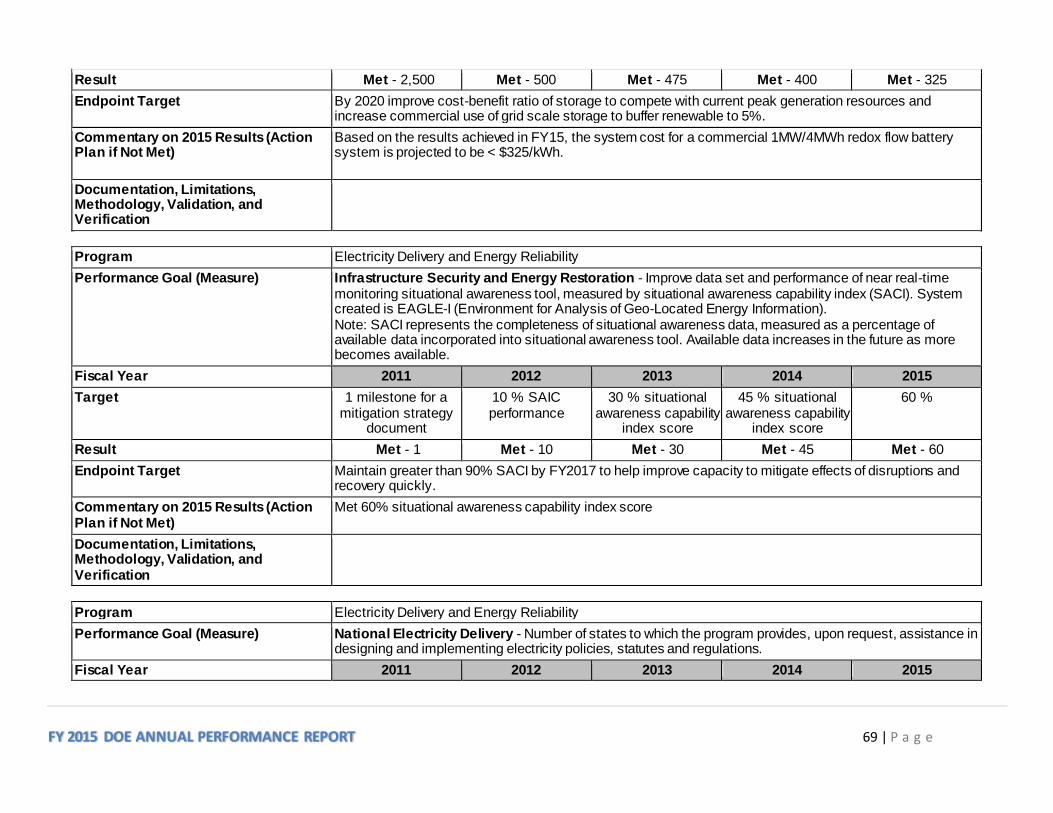
FY 2015 DOE ANNUAL PERFORMANCE REPORT 69 | P a g e
Result Met - 2,500 Met - 500 Met - 475 Met - 400 Met - 325
Endpoint Target By 2020 improve cost-benefit ratio of storage to compete with current peak generation resources and increase commercial use of grid scale storage to buffer renewable to 5%.
Commentary on 2015 Results (Action Plan if Not Met)
Based on the results achieved in FY15, the system cost for a commercial 1MW/4MWh redox flow battery system is projected to be < $325/kWh.
Documentation, Limitations, Methodology, Validation, and Verification
Program Electricity Delivery and Energy Reliability
Performance Goal (Measure) Infrastructure Security and Energy Restoration - Improve data set and performance of near real-time monitoring situational awareness tool, measured by situational awareness capability index (SACI). System created is EAGLE-I (Environment for Analysis of Geo-Located Energy Information). Note: SACI represents the completeness of situational awareness data, measured as a percentage of available data incorporated into situational awareness tool. Available data increases in the future as more becomes available.
Fiscal Year 2011 2012 2013 2014 2015
Target 1 milestone for a mitigation strategy
document
10 % SAIC performance
30 % situational awareness capability
index score
45 % situational awareness capability
index score
60 %
Result Met - 1 Met - 10 Met - 30 Met - 45 Met - 60
Endpoint Target Maintain greater than 90% SACI by FY2017 to help improve capacity to mitigate effects of disruptions and recovery quickly.
Commentary on 2015 Results (Action Plan if Not Met)
Met 60% situational awareness capability index score
Documentation, Limitations, Methodology, Validation, and Verification
Program Electricity Delivery and Energy Reliability
Performance Goal (Measure) National Electricity Delivery - Number of states to which the program provides, upon request, assistance in designing and implementing electricity policies, statutes and regulations.
Fiscal Year 2011 2012 2013 2014 2015

FY 2015 DOE ANNUAL PERFORMANCE REPORT 70 | P a g e
Target 30 states assisted 30 states/tribes assisted
35 states/tribes assisted
35 states/tribes assisted
40 states and tribes assisted
Result Met - 30 Met - 30 Met - 35 Met - 35 Met - 40
Endpoint Target Increased access to reliable, affordable and sustainable energy sources.
Commentary on 2015 Results (Action Plan if Not Met)
Provided technical assistance to 40 states and tribes
Documentation, Limitations, Methodology, Validation, and Verification
Program Electricity Delivery and Energy Reliability
Performance Goal (Measure) R&D Advanced Modeling - Development of capabilities in understanding, modeling and predicting grid behavior.
Fiscal Year 2011 2012 2013 2014 2015
Target N/A 1 Develop draft roadmap
1 final roadmap developed
1 Demonstrate (at laboratory scale) fast
state estimation
Demonstrate (at laboratory scale) high-performance
dynamic simulation capability for
assessing potentially destabilizing events
Result Not Met - 0 Met - 1 Met - 1 Met - 1
Endpoint Target Realization of advanced modeling capabilities, including dynamic operation, real-time analysis, and predictive response.
Commentary on 2015 Results (Action Plan if Not Met)
Demonstrated (at laboratory scale) high-performance dynamic simulation capability for assessing potentially destabilizing events
Documentation, Limitations, Methodology, Validation, and Verification
annual report from PNNL
Program Electricity Delivery and Energy Reliability
Performance Goal (Measure) Smart Grid R&D - Reductions in load factor (LF), duration of outages (SAIDI) on the distribution system, and outage time of critical loads on smart microgrids (CL)
Fiscal Year 2011 2012 2013 2014 2015
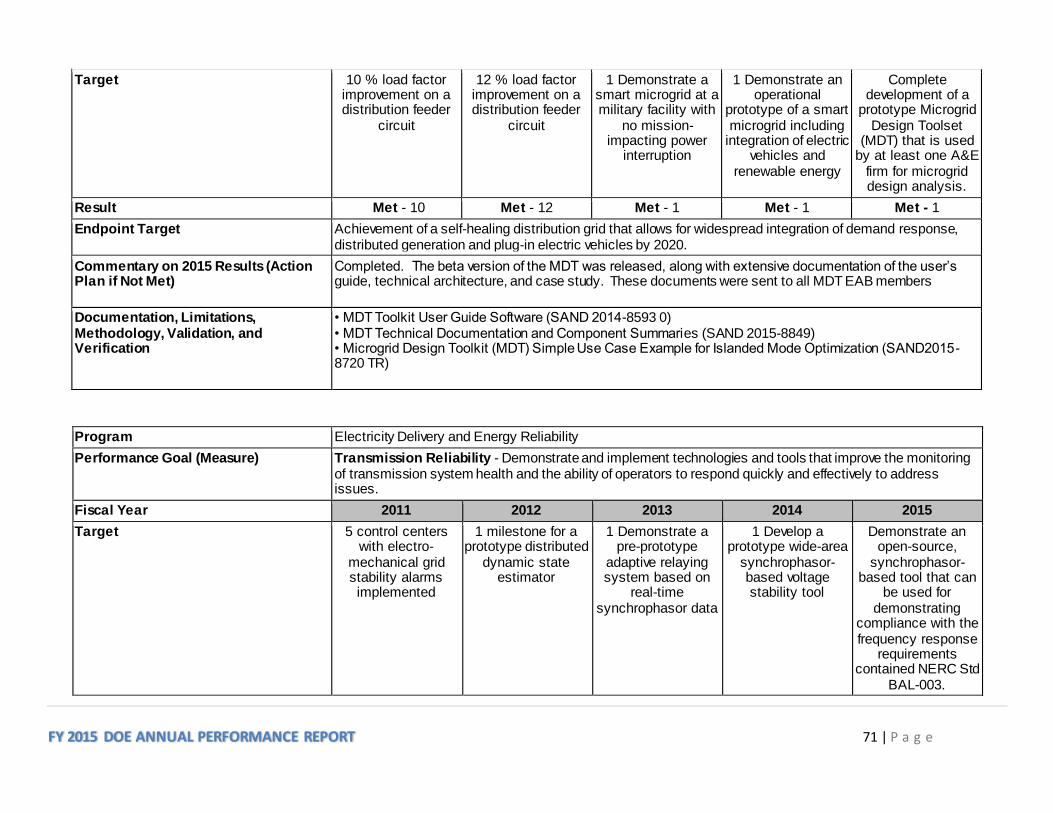
FY 2015 DOE ANNUAL PERFORMANCE REPORT 71 | P a g e
Target 10 % load factor improvement on a distribution feeder
circuit
12 % load factor improvement on a distribution feeder
circuit
1 Demonstrate a smart microgrid at a military facility with
no mission-impacting power
interruption
1 Demonstrate an operational
prototype of a smart microgrid including
integration of electric vehicles and
renewable energy
Complete development of a
prototype Microgrid Design Toolset
(MDT) that is used by at least one A&E
firm for microgrid design analysis.
Result Met - 10 Met - 12 Met - 1 Met - 1 Met - 1
Endpoint Target Achievement of a self-healing distribution grid that allows for widespread integration of demand response, distributed generation and plug-in electric vehicles by 2020.
Commentary on 2015 Results (Action Plan if Not Met)
Completed. The beta version of the MDT was released, along with extensive documentation of the user’s guide, technical architecture, and case study. These documents were sent to all MDT EAB members
Documentation, Limitations, Methodology, Validation, and Verification
• MDT Toolkit User Guide Software (SAND 2014-8593 0) • MDT Technical Documentation and Component Summaries (SAND 2015-8849) • Microgrid Design Toolkit (MDT) Simple Use Case Example for Islanded Mode Optimization (SAND2015-8720 TR)
Program Electricity Delivery and Energy Reliability
Performance Goal (Measure) Transmission Reliability - Demonstrate and implement technologies and tools that improve the monitoring of transmission system health and the ability of operators to respond quickly and effectively to address issues.
Fiscal Year 2011 2012 2013 2014 2015
Target 5 control centers with electro-
mechanical grid stability alarms implemented
1 milestone for a prototype distributed
dynamic state estimator
1 Demonstrate a pre-prototype
adaptive relaying system based on
real-time synchrophasor data
1 Develop a prototype wide-area
synchrophasor-based voltage stability tool
Demonstrate an open-source,
synchrophasor-based tool that can
be used for demonstrating
compliance with the frequency response
requirements contained NERC Std
BAL-003.

FY 2015 DOE ANNUAL PERFORMANCE REPORT 72 | P a g e
Result Not Met - 2 Met - 1 Met - 1 Met - 1 Met - 1
Endpoint Target Realization of a nationwide synchrophasor network with 100% sensor coverage of the transmission system by 2020, allowing for complete, real-time monitoring of transmission system health.
Commentary on 2015 Results (Action Plan if Not Met)
Demonstrated an open-source, synchrophasor-based tool that can be used for demonstrating compliance with the frequency response requirements contained NERC Std BAL-003. Tool can be accessed at https://svn.pnl.gov/FRTool.
Documentation, Limitations, Methodology, Validation, and Verification
Fossil Energy
Fossil Energy R&D
The Coal Program will ensure the availability of near-zero atmospheric emissions, abundant, affordable, domestic energy to fuel economic prosperity, strengthen energy security, and enhance environmental quality.
Program Fossil Energy R&D
Performance Goal (Measure) CCS Demonstrations - Initiate construction of CCS demonstration projects. Once constructed, initiate operation.
Fiscal Year 2011 2012 2013 2014 2015
Target N/A 3 CCS Demonstrations
initiated
2 CCS project initiated
1 CCS demonstration project initiated
1 CCS Demonstration
project
Result Met - 3 Met - 2 Met - 1 Not Met - 0
Endpoint Target Operations initiated at a minimum of five commercial scale CCS demonstrations by 2019 including the Clean Coal Power Initiative (CCPI), FutureGen 2.0, and the Industrial CCS Demonstration projects (funded by both annual appropriations and the American Recovery and Reinvestment Act). At least two of the five demonstrations to initiate operations by 2019 will be CCPI projects.
Commentary on 2015 Results (Action Plan if Not Met)
Construction was not initiated on at least one CCS Demonstration Project. The Summit Texas Clean Energy Project (TCEP) was planning to reach financial close and initiate construction by the end of the fourth quarter of fiscal year 2015. However, the project has not been successful in reaching financial close, and therefore, it has not initiated construction. Action Plan: The Summit Texas Clean Energy Project (TCEP) continues to negotiate price and terms with various contractors and suppliers in order to achieve financial close. If financial close can be achieved, construction will be initiated.

FY 2015 DOE ANNUAL PERFORMANCE REPORT 73 | P a g e
During fiscal year 2015, two CCS Demonstrations were ended due to progress toward project milestones leaving fewer projects to achieve the Endpoint Target.
Documentation, Limitations, Methodology, Validation, and Verification
Data sources include monthly reporting and weekly discussions with project participants.
Program Fossil Energy R&D
Performance Goal (Measure) Carbon Capture and Advanced Energy Systems - Achieving the target signifies that the Carbon Capture & Advanced Energy Systems programs are continuing to make progress in meeting the goal of developing cost-effective, reliable carbon capture technologies for pre-combustion, post-combustion, and oxy-combustion capture applications.
Fiscal Year 2011 2012 2013 2014 2015
Target N/A N/A < 55 $ per tonne CO2 captured
≤ 53 $ per tonne CO2 captured
51 dollars per tonne of CO2
Result Met - 53 Met - 53 Met - 51
Endpoint Target By 2020, Advanced Energy Systems with a CO2 capture cost of no more than $40 per tonne.
Commentary on 2015 Results (Action Plan if Not Met)
Engineering, systems, and cost analysis show that, when integrated together into a pulverized coal (PC) power plant with post-combustion capture, technology advancements in the Carbon Capture and Advanced Energy Systems program area provide a pathway to achieve a cost of capture less than $51 per tonne of CO2. R&D progress in post-combustion capture solvent development (Linde LLC), absorber process design (Linde LLC), and advanced heat integration (Southern Company Services, Inc./Mitsubishi Heavy Industries, Ltd.) provided the basis for this year’s independent assessment.
Documentation, Limitations, Methodology, Validation, and Verification
The analysis supporting the validation of the annual performance measure is documented in the FY 2015 Coal Program GPRA Annual Report.
Program Fossil Energy R&D
Performance Goal (Measure) Carbon Storage - Inject CO2 in large-volume field test sites to demonstrate the formations’ capacity to permanently, economically, and safely store carbon dioxide.
Fiscal Year 2011 2012 2013 2014 2015
Target N/A 3 MMTs injected (since 2009)
4 MMTs injected (since 2009)
5 MMTs injected (since 2009)
6 MMTs injected (since 2009)
Result Met - 3.6 Met - 4.7 Met - 7.6 Met - 8.9

FY 2015 DOE ANNUAL PERFORMANCE REPORT 74 | P a g e
Endpoint Target Inject 9.0 million metric tons of CO2 in large-volume field test sites representing different storage classes, since January 2009, to demonstrate and monitor for the formations’ capacity to permanently, economically, and safely store carbon dioxide. A long-term goal is to ensure the cost effective ability to ensure 99 percent storage permanence of CO2 while minimizing the environmental footprint of carbon storage activities.
Commentary on 2015 Results (Action Plan if Not Met)
The performance measure was met with 8,871,340 metric tons of CO2 injected at large-volume field projects conducted by the Southeast Regional Carbon Sequestration Partnership (SECARB), the Midwest Carbon Sequestration Consortium (MCSC), the Midwest Regional Carbon Sequestration Partnership (MRCSP), the Southwest Regional Carbon Sequestration Partnership (SWP), and the Plains CO2 Reduction (PCOR) Partnership.
Documentation, Limitations, Methodology, Validation, and Verification
SECARB (DE-FC26-05NT42590): The monthly report for January 2015 indicates an injection volume of 5,371,643 metric tons for the Cranfield Project. However, 627,744 metric tons are credited to the Phase II injection volumes, so a total of 4,743,898 metric tons were injected as part of Phase III. Injection volumes for the Citronelle Project are also documented in monthly reports. The monthly report for September 2014 indicates that 114,104 metric tons were injected into the Paluxy Formation. There was no further injection of CO2 because the source of CO2 (Plant Barry) was shut down. The decision from Denbury Resources to cease injection at both the Cranfield and Citronelle sites is documented in the February 2015 monthly report. MGSC (DE-FC26-05NT42588): The final injected volume of 999,215 metric tons was reported in the Quarterly Progress Report (September 18, 2014 – December 17, 2014) submitted by the Illinois State Geological Survey. MRCSP (DE-FC26-05NT42589): MRCSP reports injection volumes obtained from the field on a monthly basis. Quarterly progress reports also provide injection amounts. SWP (DE-FC26-05NT42591): SWP has reported monthly injection volumes through July 31, 2015, via a letter from Robert Balch and Brian McPherson, SWP Principal Investigators, to the NETL federal project manager. PCOR (DE-FC26-05NT42592): PCOR has reported monthly injection volumes up through April 30, 2015, via a letter from Charles D. Gorecki, PCOR Principal Investigator, to the NETL federal project manager.
Petroleum Reserves
The Strategic Petroleum Reserve (SPR) protects the U.S. from future disruptions in critical petroleum supplies and meets the U.S. obligations under the International Energy Program (Energy Policy and Conservation Act, P.L. 94-163, as amended, Section 151). SPR also includes Defense Department crude oil, stored for national defense purposes.
Program Petroleum Reserves
Performance Goal (Measure) Drawdown Readiness - Ensure drawdown readiness by achieving greater than 95% of monthly maintenance and accessibility goals.

FY 2015 DOE ANNUAL PERFORMANCE REPORT 75 | P a g e
Fiscal Year 2011 2012 2013 2014 2015
Target 95 % of monthly maintenance
achieved
> 95 % of monthly maintenance
achieved
95 % of monthly maintenance
achieved
≥ 95 % of monthly maintenance
achieved
≥ 95 % of monthly maintenance
achieved
Result Met - 98 Met - 95.98 Met - 96.45 Met - 96.8 Met – 97.6
Endpoint Target Achieve 95% of monthly maintenance and accessibility goals in all years.
Commentary on 2015 Results (Action Plan if Not Met)
Achieved target for FY 2015.
Documentation, Limitations, Methodology, Validation, and Verification
Program Petroleum Reserves
Performance Goal (Measure) SPR Operating Cost - Ensure cost efficiency of SPR operations by achieving low operating cost per barrel of capacity
Fiscal Year 2011 2012 2013 2014 2015
Target < 0.229 $ operating cost per barrel
< 0.225 $ operating cost per barrel
< 0.25 $ operating cost per barrel
< 0.25 $ operating cost per barrel
< 0.25 $ operating cost per barrel
Result Met - 0.224 Met - 0.221 Met - 0.239 Met - 0.239 Met - 0.233
Endpoint Target Achieve < $0.25 operating cost per barrel.
Commentary on 2015 Results (Action Plan if Not Met)
Achieved target for FY 2015.
Documentation, Limitations, Methodology, Validation, and Verification
Program Petroleum Reserves
Performance Goal (Measure) Sustained (90 day) Drawdown Rate - Enable ready distribution of SPR oil by achieving maximum sustained (90 day) drawdown rate of 4.4 million barrels per day.
Fiscal Year 2011 2012 2013 2014 2015
Target 4.4 million barrels per day
≥ 4.4 million barrels per day
4.25 MMB/Day drawdown readiness
rate
4.25 MMB/Day drawdown readiness
rate
4.25 MMB/Day drawdown readiness
rate

FY 2015 DOE ANNUAL PERFORMANCE REPORT 76 | P a g e
Result Met - 4.4 Not Met - 4.25 Met - 4.25 Met - 4.25 Met – 4.25
Endpoint Target Maintain a 90 day drawdown rate of 4.4 million barrels per day
Commentary on 2015 Results (Action Plan if Not Met)
Achieved target for FY 2015. Due to a damaged internal floating roof on a tank at Bryan Mound, the maximum Bryan Mound site drawdown rate is reduced by approximately 150,000 barrels per day, which reduces the drawdown rate from 4.4 million barrels per day to 4.25 million barrels per day.
Documentation, Limitations, Methodology, Validation, and Verification
Nuclear Energy
New Nuclear Generation Technologies
The mission of the Reactor Concepts Research, Development and Demonstration (RD&D) program is to develop new and advanced reactor designs and technologies that advance the state of reactor technology to improve its competitiveness, and help advance nuclear power as a resource capable of meeting the Nation’s energy, environmental, and national security needs.
Program New Nuclear Generation Technologies
Performance Goal (Measure) ART Activities - Complete 90% of annual program milestones to support the development of innovative reactor technologies that may offer improved safety, functionality and affordability, and build upon existing nuclear technology and operating experience.
Fiscal Year 2011 2012 2013 2014 2015
Target N/A 90 % of annual program milestones
met
90 % of annual program milestones
met
90 % of annual program milestones
met
≥ 90 percent
Result Met - 90 Met - 100 Not Met - 88 Met - 91
Endpoint Target ARC performance endpoints range from the mid-term (2030s) to very long term. ARC is focused on high value research for long term concepts, R&D needs of promising mid-range concepts, and development of innovative technologies that benefit multiple concepts and stimulation of new ideas for transformational future concepts.
Commentary on 2015 Results (Action Plan if Not Met)
The Advanced Reactor Technologies Program completed milestones have helped to reduce uncertainty in the viability of several advanced reactor designs. This directly assists our industry partners in advancing toward commercialization. The work accomplished has also been used to leverage collaborations with international research bodies to accelerate progress in these areas. Regarding the three milestones that were not met, revised plans have been developed to ensure completion as early as possible in the next fiscal year. Impact of the delayed milestones is minimal in the near term, but ultimately they do impact the long-term schedule for reaching our objectives in those areas.

FY 2015 DOE ANNUAL PERFORMANCE REPORT 77 | P a g e
Documentation, Limitations, Methodology, Validation, and Verification
ART FY 15 Performance Measure Memo; PICS-NE system.
Program New Nuclear Generation Technologies
Performance Goal (Measure) Fuel Cycle R&D - Complete Fuel Cycle research and development activities that allow the FCR&D program to support the attainment of a sustainable fuel cycle.
Fiscal Year 2011 2012 2013 2014 2015
Target N/A 90 % of annual milestones completed
90 % of annual milestones met
≥ 90 % of annual milestones met
≥ 90 percent
Result Met - 90 Met - 99 Met - 98 Met - 94
Endpoint Target The R&D milestones represent progress toward several key fuel cycle outcomes. For the once-through cycle, qualify fuel for licensing in the 2030 timeframe and the feasibility of storage options in the 2040 timeframe. In addition, prove the feasibility of advanced waste forms for modified open cycle options and full recycle options in the 2050 to 2060 timeframe.
Commentary on 2015 Results (Action Plan if Not Met)
The work accomplished in FY 2015 allows Fuel Cycle R&D to make progress towards its goal to demonstrate one or more light water reactor fuel concepts with enhanced accident tolerance in a commercial nuclear power plant and to conduct scientific research and technology development to enable storage, transportation, and disposal of used nuclear fuel and wastes generated by existing and future fuel cycles.
Documentation, Limitations, Methodology, Validation, and Verification
FY15 FCR&D Performance Measure Memo; INL Document Management System (DMS).
Program New Nuclear Generation Technologies
Performance Goal (Measure) Light Water Reactor Sustainability - This program is developing the scientific basis to extend existing nuclear power plant operating life beyond the current 60 year limit. The scient ific basis will assist the NRC in making life-extension regulatory decisions. For FY2012 and beyond the performance measure is to meet 90% of planned annual milestones.
Fiscal Year 2011 2012 2013 2014 2015
Target 57 scheduled deliverables
90 % of annual milestones completed
90 % annual program milestones
met
≥ 90 % annual program milestones
met
≥ 90 percent annual program milestones
met

FY 2015 DOE ANNUAL PERFORMANCE REPORT 78 | P a g e
Result Met - 57 Met - 100 Met - 96 Met - 100 Met - 100
Endpoint Target NE-developed tools and assessments will help establish the scientific bases for existing plants to receive license extensions from the NRC in the 2030 timeframe.
Commentary on 2015 Results (Action Plan if Not Met)
Significant progress was made on studying aging plant structures important to safety, specifically concrete and cables. This work will be critical for long-term safe and economic plant operation. Some initial research was completed on control room modernization with a major new pilot plant project in this area starting in fiscal year 2016. The first industry application of the Risk Informed Safety Margin Characterization (RISMC) methodology was completed this year with more complex industry applications planned in upcoming years.
Documentation, Limitations, Methodology, Validation, and Verification
LWRS FY15 Performance Measure Memo; PICS-NE system.
Program New Nuclear Generation Technologies
Performance Goal (Measure) NEET- Mod & Sim Hub - Complete 90% of annual program milestones to support the creation of a virtual reactor prototype for predictive simulation of Light Water Reactors by 2015
Fiscal Year 2011 2012 2013 2014 2015
Target 1 milestones to create a prototype of
a virtual reactor
90 % of annual program milestones
completed
90 % annual milestones met
≥ 90 % annual milestones met
≥ 90 percent annual program milestones
met
Result Met - 1 Met - 95 Met - 91 Met - 100 Met - 100
Endpoint Target The milestones represent annual progress toward the creation of a Light Water Reactor model by 2015 for use by industry to get more safe, clean, and reliable energy from nuclear power plants.
Commentary on 2015 Results (Action Plan if Not Met)
This was an important year for CASL. During the course of the year, CASL completed its first 5-year Phase. The completion of the first phase was marked by the use of the CASL Virtual Environment for Reactor Applications (VERA) Core Simulator (CS) to simulate the neutronics, thermal hydraulics, and fuel performance for all 12 fuel cycles of the TVA Watts Bar #1 pressurized water reactor (PWR). This simulation included tracking the depletion and shuffling of the reactor’s nuclear fuels. This year also saw the start of CASL’s second phase. During this phase, CASL will build on the tools developed in the first phase and will broaden their applicability to other reactor types. CASL will also work to deepen their technical capabilities to address other important challenge problems. This broadening and deepening was demonstrated by CASL in 2015, when the Hub used the parts of the VERA tool set was used to conditions in small modular reactors (SMRs) and Boiling Water Reactors (BWR). CASL also make some significant progress on addressing specific challenge problems. This included accurately calculating a core-

FY 2015 DOE ANNUAL PERFORMANCE REPORT 79 | P a g e
wide, pin-resolved simulation of the power shift caused by a CRUD build up during cycle 7 of the Watts Bar #1 reactor. Also, CASL used part of its VERA tool set to simulate the Pellet Clad Interface (PCI) issue.
Documentation, Limitations, Methodology, Validation, and Verification
Hub FY 15 Performance Measure Memo - see documentation section.
Program New Nuclear Generation Technologies
Performance Goal (Measure) SMR - Licensing Technical Support Program - Enable the submission of license application documentation to the Nuclear Regulatory Commission (NRC) by SMR vendors and utility partners by supporting design, engineering, certification, and licensing efforts for selected SMR projects.
Fiscal Year 2011 2012 2013 2014 2015
Target N/A 1 complete program milestones
1 complete program milestones
1 complete program milestones
complete program milestones
Result Not Met - 0 Met - 1 Not Met - 0 Met
Endpoint Target DOE-provided support for design, engineering, and regulatory processes will help encourage and accelerate industry partner decisions to submit certification and licensing applications in the 2018 timeframe.
Commentary on 2015 Results (Action Plan if Not Met)
The SMR Licensing Technical Support Program’s FY15 accomplishments are evidence of the program's
overall progress in supporting the commercial deployment of small modular reactors and its flexibility in
adapting to changing market conditions that are not under the control of either the Office of Nuclear Energy or
our industry partners. More specifically the accomplishments demonstrate coordination of design
development with regulatory and customer requirements in order to achieve deployment of clean, affordable
nuclear power options.
Documentation, Limitations, Methodology, Validation, and Verification
Documentation for each quarterly FY15 milestone is available in NE SMR LTS Performance Measure memo, 10.02.15.
Nuclear Infrastructure
The mission of the Idaho Facilities Management (IFM) program is to manage the planning, acquisition, operation, maintenance, and disposition of the Office of Nuclear Energy (NE)-owned facilities and capabilities at the Idaho National Laboratory (INL).
Program Nuclear Infrastructure
Performance Goal (Measure) Facility Availability - Idaho Facilities Management Program - Enable nuclear research and development activities by providing operational facilities and capabilities, as measured by availability percentages.

FY 2015 DOE ANNUAL PERFORMANCE REPORT 80 | P a g e
Fiscal Year 2011 2012 2013 2014 2015
Target 80 % availability 80 % availability 80 % availability ≥ 80 % availability ≥ 80 percent
Result Not Met - 71.6 Not Met - 70.5 Not Met - 64.2 Not Met - 77 Not Met - 77
Endpoint Target Maintain the percentage of facilities and capabilities that are available for research and development activities at 90% or better.
Commentary on 2015 Results (Action Plan if Not Met)
Major equipment issues have affected the ability of the reactor to meet its schedule and have negatively impacted research activities, which rely on irradiation in ATR. This highlights the need for ATR to accelerate the maintenance and/or refurbishment of ATR systems and equipment, in order to improve equipment reliability and increase confidence in the reactor's ability to meet its programmatic commitments to its customers, in a timely and cost effective manner. Early in FY15, MFC availability did not meet the 80% milestone because of equipment failures, lack of resources, and other operational issues. Research activities were impacted, including extended delays in restart of the Neutron Radiography Reactor (NRAD) and loss of the ability to utilize the AFCI glove box. However, BEA recovered from these events to mitigate research delays and impacts to customers. Throughout the year, increased focus from Idaho National Laboratory personnel for projects and operations and maintenance enabled MFC to meet its facility availability goal, and accomplish well over 80% of FY15 enabled outcomes on or ahead of schedule. MFC accomplished numerous FY15 programmatic milestones across all of its nuclear and radiological facilities, highlighting MFC's capabilities for National and Homeland Security, Fuel Cycle Research and Development, Idaho Facilities Management, High Performance Research Reactor Fuel Development, and external customers. These accomplishments have provided a springboard for programmatic work at MFC facilities in FY16. Action Plan: BEA has proposed a five-year strategic investment plan starting in FY17 for ATR leveraging both the Office of Nuclear Energy and the Naval Reactors programs. This strategic plan is intended to take the reactor to the next level, increasing reliability and availability. The plan prioritizes maintenance and refurbishment efforts specifically based on risk to plant availability. In addition, BEA is working with customers to revise irradiation plans and mitigate delays where possible.
Documentation, Limitations, Methodology, Validation, and Verification
Performance Memorandum provided by Alan L. Gunn, Acting Principal Deputy Manager for Nuclear Energy, dated October 7, 2015, providing performance information of IFM Facility Availability and IFM Line Item Construction Projects for the fourth quarter FY 2015.
Program Nuclear Infrastructure
Performance Goal (Measure) Plant and Construction: Cost and Schedule Baseline Variance - Execute line item construction projects within approved cost profiles and schedules, using cost performance index and schedule performance index

FY 2015 DOE ANNUAL PERFORMANCE REPORT 81 | P a g e
(using earned value measurement systems), with the green level maintaining indexes between 0.9 and 1.10, the yellow level between 0.8 and 1.20 and the red level less than 0.8 or greater than 1.20.
Fiscal Year 2011 2012 2013 2014 2015
Target 80 % of projects with cost performance
indexes and schedule
performance indexes between 0.9 and
1.15
80 % of projects with cost performance
indexes and schedule
performance indexes between 0.9 and
1.15
80 % of projects with cost performance
indexes and schedule
performance indexes between 0.9 and
1.15
≥ 80 % of projects with cost
performance indexes and schedule
performance indexes between 0.9 and
1.15
≥ 80 percent of projects with cost
performance indexes and schedule
performance indexes between 0.9 and
1.15
Result Met - 100 Met - 100 Met - 100 Not Met - 0.9 Met - 100
Endpoint Target Maintain the total percentage of projects with good cost and schedule indexes at 90% or better.
Commentary on 2015 Results (Action Plan if Not Met)
NE is tracking only one baselined project, Remote Handled Low Level Waste (RHLLW) Disposal Project. During the fiscal year, numerous issues were encountered with Areva's execution of the design-build contract that caused delays. However, BEA was actively engaged and took action by issuing two letters of concern to Areva’s Sr. Vice President of Used Fuel and Waste Management and appointed a new project manager for the project and project director for project execution and implementation. The project delays were the result of realized risks associated with the design-build contract, which was identified in the project baseline. The Federal Project Director (FPD) believes that BEA took appropriate and timely actions to minimize the impacts based on the realized risks.
Documentation, Limitations, Methodology, Validation, and Verification
Performance Memorandum provided by Alan L. Gunn, Acting Principal Deputy Manager for Nuclear Energy, dated October 7, 2015, providing performance information of IFM Facility Availability and IFM Line Item Construction Projects for the fourth quarter FY 2015.
Environmental Management
Tank Waste and Nuclear Materials
The EM program strategy is to work aggressively to reduce the footprint of our contaminated sites while bringing to bear the Department’s formidable research and development assets to develop and deploy transformational technologies that will both accelerate and lower the cost to disposition the Department’s highest curie materials that present high risk to public health and the environment.
Program Tank Waste and Nuclear Materials
Performance Goal (Measure) Depleted uranium and uranium (DU&U) packaged for disposition - Number of metric tons of DU and U packaged in a form suitable for disposition
Fiscal Year 2011 2012 2013 2014 2015

FY 2015 DOE ANNUAL PERFORMANCE REPORT 82 | P a g e
Target N/A 37,046 metric tons of depleted and other
uranium
56,901 metric tons of depleted and other
uranium
68,730 metric tons 93,624 Metric Tons
Result Not Met - 26,281 Not Met - 46,030 Not Met - 68,624 Not Met - 79,232
Endpoint Target This metric has a life cycle estimate of 737,408 cubic meters.
Commentary on 2015 Results (Action Plan if Not Met)
The EM program packaged for disposition a cumulative total of 79,232 metric tons of depleted and other uranium, 14,292 metric tons short of its target. Action Plan: The EM Program will evaluate its targets for FY 2016 to ensure the most safe and efficient operations of the Uranium Hexafluoride Conversion Facilities at both the Portsmouth and Paducah sites.
Documentation, Limitations, Methodology, Validation, and Verification
To validate and verify program performance, the EM program conducts various internal and external reviews and audits. EM’s programmatic activities are subject to continuing reviews by the Congress, the Government Accountability Office, the Department’s Inspector General, the Nuclear Regulatory Commiss ion, U.S. Environmental Protection Agency, state environmental and health agencies, the Defense Nuclear Facilities Safety Board, and the Department’s Office of Project Management Oversight and Assessments. EM also maintains a variety of sources for validation and verification of specific results for this metric the Daily Production Report, produced Depleted Uranium Hexafluoride Conversion Facilities for both the Portsmouth and Paducah sites.
Program Tank Waste and Nuclear Materials
Performance Goal (Measure) High Level Waste Packaged for Disposition - Package for disposition a cumulative total of high level waste.
Fiscal Year 2011 2012 2013 2014 2015
Target 3,571 canisters of high level waste
3,801 containers of high level waste
4,077 canisters of high level waste
4,153 canisters of high level waste
4,405 Number of Containers)
Result Not Met - 3,526 Met - 3,802 Not Met - 4,028 Met - 4,154 Not Met - 4,241
Endpoint Target This measure has a life cycle estimate of 24,054 canisters.
Commentary on 2015 Results (Action Plan if Not Met)
At the end of FY 2015 the EM program packaged 4,241 canisters of high level waste, 164 canisters short of its target. Action Plan: The EM Program will adjust its FY 2016 target for this metric to accurately reflect the planned activities for the coming year for the FY 2017 Congressional Budget Request
Documentation, Limitations, Methodology, Validation, and Verification
To validate and verify program performance, the EM program conducts various internal and external reviews and audits. EM’s programmatic activities are subject to continuing reviews by the Congress, the Government Accountability Office, the Department’s Inspector General, the Nuclear Regulatory Commission, U.S. Environmental Protection Agency, state environmental and health agencies, the Defense Nuclear Facilities

FY 2015 DOE ANNUAL PERFORMANCE REPORT 83 | P a g e
Safety Board, and the Department’s Office of Project Management Oversight and Assessments. EM also maintains a variety of sources for validation and verification of specific results for this metric: shift reports from the DWPF.
Program Tank Waste and Nuclear Materials
Performance Goal (Measure) Liquid Waste Eliminated (thousands of gallons) - Liquid Waste Eliminated (thousands of gallons)
Fiscal Year 2011 2012 2013 2014 2015
Target N/A 5,684 thousands of gallons
6,993 thousands of gallons
7,343 thousands of gallons
7,592 Thousands of gallons
Result Not Met - 5,340 Not Met - 6,133 Not Met - 6,592 Not Met - 6,862
Endpoint Target This metric has a life cycle estimate of 90,814 thousands of gallons.
Commentary on 2015 Results (Action Plan if Not Met)
At the end of FY 2015 the EM program eliminated a cumulative total of 6,862 thousands of gallon of liquid waste. Action Plan: The EM Program will adjust its FY 2016 target for this metric to reflect planned activities for the FY 2017 Congressional Budget Request.
Documentation, Limitations, Methodology, Validation, and Verification
To validate and verify program performance, the EM program conducts various internal and external reviews and audits. EM’s programmatic activities are subject to continuing reviews by the Congress, the Government Accountability Office, the Department’s Inspector General, the Nuclear Regulatory Commission, U.S. Environmental Protection Agency, state environmental and health agencies, the Defense Nuclear Facilities Safety Board, and the Department’s Office of Project Management Oversight and Assessments.
Program Tank Waste and Nuclear Materials
Performance Goal (Measure) Liquid Waste Tanks Closed - Close a cumulative total of liquid waste tanks.
Fiscal Year 2011 2012 2013 2014 2015
Target 9 tanks closed 15 tanks closed 11 tanks closed 13 tanks closed 15 Number of Tanks
Result Met - 9 Not Met - 11 Met - 11 Met - 13 Not Met - 14
Endpoint Target This metric has a life cycle estimate of 239 tanks closed.
Commentary on 2015 Results (Action Plan if Not Met)
At the end of FY 2015 the EM Program closed a cumulative total of 14 tanks, one tank short of its target for FY 2015 from the Savannah River Site. Action Plan: At the Savannah River Site the Department plans to pre-treat the tank waste from the remaining tank not closed in FY 2015.
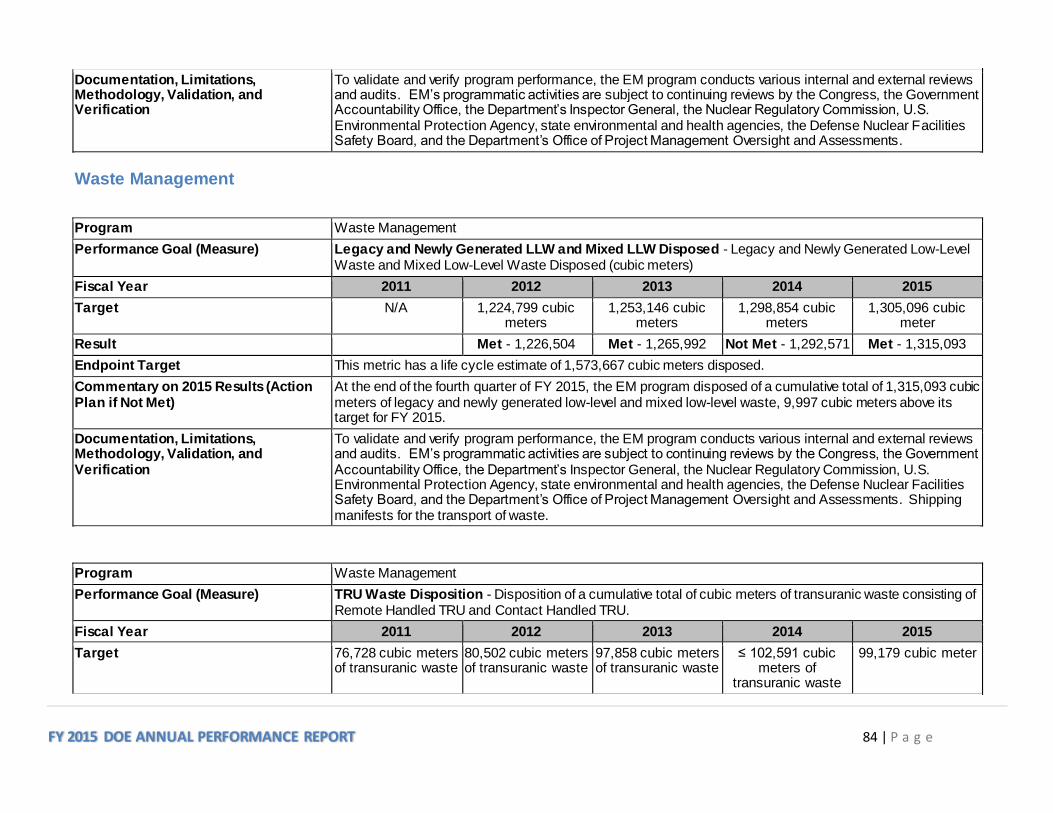
FY 2015 DOE ANNUAL PERFORMANCE REPORT 84 | P a g e
Documentation, Limitations, Methodology, Validation, and Verification
To validate and verify program performance, the EM program conducts various internal and external reviews and audits. EM’s programmatic activities are subject to continuing reviews by the Congress, the Government Accountability Office, the Department’s Inspector General, the Nuclear Regulatory Commission, U.S. Environmental Protection Agency, state environmental and health agencies, the Defense Nuclear Facilities Safety Board, and the Department’s Office of Project Management Oversight and Assessments.
Waste Management
Program Waste Management
Performance Goal (Measure) Legacy and Newly Generated LLW and Mixed LLW Disposed - Legacy and Newly Generated Low-Level Waste and Mixed Low-Level Waste Disposed (cubic meters)
Fiscal Year 2011 2012 2013 2014 2015
Target N/A 1,224,799 cubic meters
1,253,146 cubic meters
1,298,854 cubic meters
1,305,096 cubic meter
Result Met - 1,226,504 Met - 1,265,992 Not Met - 1,292,571 Met - 1,315,093
Endpoint Target This metric has a life cycle estimate of 1,573,667 cubic meters disposed.
Commentary on 2015 Results (Action Plan if Not Met)
At the end of the fourth quarter of FY 2015, the EM program disposed of a cumulative total of 1,315,093 cubic meters of legacy and newly generated low-level and mixed low-level waste, 9,997 cubic meters above its target for FY 2015.
Documentation, Limitations, Methodology, Validation, and Verification
To validate and verify program performance, the EM program conducts various internal and external reviews and audits. EM’s programmatic activities are subject to continuing reviews by the Congress, the Government Accountability Office, the Department’s Inspector General, the Nuclear Regulatory Commission, U.S. Environmental Protection Agency, state environmental and health agencies, the Defense Nuclear Facilities Safety Board, and the Department’s Office of Project Management Oversight and Assessments. Shipping manifests for the transport of waste.
Program Waste Management
Performance Goal (Measure) TRU Waste Disposition - Disposition of a cumulative total of cubic meters of transuranic waste consisting of Remote Handled TRU and Contact Handled TRU.
Fiscal Year 2011 2012 2013 2014 2015
Target 76,728 cubic meters of transuranic waste
80,502 cubic meters of transuranic waste
97,858 cubic meters of transuranic waste
≤ 102,591 cubic meters of
transuranic waste
99,179 cubic meter

FY 2015 DOE ANNUAL PERFORMANCE REPORT 85 | P a g e
Result Met - 76,494 Exceeded - 81,138 Not Met - 96,016 Not Met - 99,179 Not Met - 102,026
Endpoint Target This metric has a life cycle estimate of 148,526 cubic meters
Commentary on 2015 Results (Action Plan if Not Met)
At the end of the fourth quarter of FY 2015, the EM program dispositioned a cumulative total of 102,026 cubic meters of combined Remote Handled and Contact Handled Transuranic Waste which included TRU waste that was characterized and disposed as Low Level Waste or Mixed Low Level Waste. Action Plan: Since the February 2014 incidents, the Waste Isolation Pilot Plant is currently engaged in recovery efforts with a goal to emplace waste in WIPP in by the end of 2016.
Documentation, Limitations, Methodology, Validation, and Verification
To validate and verify program performance, the EM program conducts various internal and external reviews and audits. EM’s programmatic activities are subject to continuing reviews by the Congress, the Government Accountability Office, the Department’s Inspector General, the Nuclear Regulatory Commission, U.S. Environmental Protection Agency, state environmental and health agencies, the Defense Nuclear Facilities Safety Board, and the Department’s Office of Project Management Oversight and Assessments. The EM Program also maintains a means of documenting this specific performance metric: Shipping Manifests.
Site Restoration
Program Site Restoration
Performance Goal (Measure) Industrial facilities completed - Industrial facilities completed
Fiscal Year 2011 2012 2013 2014 2015
Target N/A 1,900 facilities completed
1,961 facilities completed
2,070 2,107 Number of Facilities
Result Not Met - 1,895 Met - 2,128 Met - 2,095 Met - 2,105
Endpoint Target This metric has a life cycle estimate of 4,107 facilities
Commentary on 2015 Results (Action Plan if Not Met)
At the end of the fourth quarter of FY 2015 the EM program completed a cumulative total of 2,105 Industrial facilities, two short of its target. Two facilities targeted for completion at the Oak Ridge site were demolished, however the required documentation was not provided to the regulators before the end of FY 2015.
Documentation, Limitations, Methodology, Validation, and Verification
To validate and verify program performance, the EM program conducts various internal and external reviews and audits. EM’s programmatic activities are subject to continuing reviews by the Congress, the Government Accountability Office, the Department’s Inspector General, the Nuclear Regulatory Commission, U.S. Environmental Protection Agency, state environmental and health agencies, the Defense Nuclear Facilities Safety Board, and the Department’s Office of Project Management Oversight and Assessments. EM also maintains a variety of sources for validation and verification of specific results for this metric, Decommissioning Project Final Report as well as State and federal regulator acceptance of completion report.

FY 2015 DOE ANNUAL PERFORMANCE REPORT 86 | P a g e
Program Site Restoration
Performance Goal (Measure) Nuclear Facility Completions (number of facilities) - Complete remediation work at a cumulative total of nuclear facilities.
Fiscal Year 2011 2012 2013 2014 2015
Target 94 130 facilities 131 facilities 138 facilities 153 Number of facilities
Result Met - 94 Not Met - 128 Met - 131 Not Met - 146 Not Met - 151
Endpoint Target This metric has a life cycle estimate of 487 facilities.
Commentary on 2015 Results (Action Plan if Not Met)
At the end of the fourth quarter of FY 2015 the EM program completed a cumulative total of 151 Nuclear Facilities. Action Plan: The EM Program will reassess its nuclear facility completion activities for FY 2016 and adjust its target accordingly in the FY 2017 Congressional Budget Request.
Documentation, Limitations, Methodology, Validation, and Verification
To validate and verify program performance, the EM program conducts various internal and external reviews and audits. EM’s programmatic activities are subject to continuing reviews by the Congress, the Government Accountability Office, the Department’s Inspector General, the Nuclear Regulatory Commission, U.S. Environmental Protection Agency, state environmental and health agencies, the Defense Nuclear Facilities Safety Board, and the Department’s Office of Acquisition and Project Management. EM also maintains a variety of sources for validation and verification of specific results for this metric,: Decommissioning Project Final Report as well as State and federal regulator acceptance of completion report.
Program Site Restoration
Performance Goal (Measure) Radioactive Facilities - Complete remediation work at a cumulative total of radioactive facilities.
Fiscal Year 2011 2012 2013 2014 2015
Target 393 radioactive facilities
525 radioactive facilities
534 radioactive facilities
561 radioactive facilities
563 number of facilities
Result Not Met - 386 Met - 408 Met - 555 Met - 561 Met - 566
Endpoint Target This metric has a life cycle estimate of 960 radioactive facilities
Commentary on 2015 Results (Action Plan if Not Met)
The EM Program exceeded its target for FY 2015 by three facilities.
Documentation, Limitations, Methodology, Validation, and Verification
To validate and verify program performance, the EM program conducts various internal and external reviews and audits. EM’s programmatic activities are subject to continuing reviews by the Congress, the Government Accountability Office, the Department’s Inspector General, the Nuclear Regulatory Commission, U.S.

FY 2015 DOE ANNUAL PERFORMANCE REPORT 87 | P a g e
Environmental Protection Agency, state environmental and health agencies, the Defense Nuclear Facilities Safety Board, and the Department’s Office of Acquisition and Project Management. EM also maintains a variety of sources for validation and verification of specific results for this metric : Decommissioning Project Final Report as well as State and federal regulator acceptance of completion report.
Program Site Restoration
Performance Goal (Measure) Release Site Remediation Completions - Complete remediation work at a cumulative total release sites.
Fiscal Year 2011 2012 2013 2014 2015
Target 7,157 release sites 7,361 release sites 7,627 release sites 8,035 release sites 8,201 release sites
Result Not Met - 7,118 Not Met - 7,496 Not Met - 7,849 Not Met - 7,945 Not Met - 8,021
Endpoint Target This metric has a life cycle estimate of 10,992 release sites.
Commentary on 2015 Results (Action Plan if Not Met)
At the end of the fourth Quarter of FY 2015 the EM program completed a cumulative total of 8,027 release sites in the EM Program. Action Plan: The EM Program is reevaluating the targets that were missed in FY 2015. These remaining targets will be distributed to FY 2016 and the remaining out years.
Documentation, Limitations, Methodology, Validation, and Verification
To validate and verify program performance, the EM program conducts various internal and external reviews and audits. EM’s programmatic activities are subject to cont inuing reviews by the Congress, the Government Accountability Office, the Department’s Inspector General, the Nuclear Regulatory Commission, U.S. Environmental Protection Agency, state environmental and health agencies, the Defense Nuclear Facilities Safety Board, and the Department’s Office of Acquisition and Project Management. State and federal regulator acceptance of the Remedial Action Report.
Legacy Management
Legacy Management
The mission of the LM program is to fulfill the Department’s post-closure responsibilities and ensure the future protection of human health and the environment. As part of the mission, LM performs long-term surveillance and maintenance. That activity is the target of LM’s performance measures
Program Legacy Management
Performance Goal (Measure) Environmental Remedies - Conduct surveillance and maintenance activities to ensure the effectiveness of cleanup remedies in accordance with legal agreements or identify sites subject to additional remedial action in order to ensure effectiveness at all sites within Legacy Management's responsibility.
Fiscal Year 2011 2012 2013 2014 2015
Target 87 sites inspected 87 activities 89 activities 89 sites 89 sites

FY 2015 DOE ANNUAL PERFORMANCE REPORT 88 | P a g e
Result Met - 87 Met - 87 Met - 89 Met - 89 Met - 89
Endpoint Target Continued inspections on all sites until risk has been reduced to the point that further inspections are not needed.
Commentary on 2015 Results (Action Plan if Not Met)
Continue striving for continued progress.
Documentation, Limitations, Methodology, Validation, and Verification
Program Legacy Management
Performance Goal (Measure) Surveillance and Maintenance Cost - Reduce the cost of performing long-term surveillance and monitoring activities while meeting all regulatory requirements to protect human health and the environment. Reduction is measured in percent from the life-cycle baseline. Goal is a 2 percent reduction below the baseline each year.
Fiscal Year 2011 2012 2013 2014 2015
Target 2 percent reduction below the baseline
4 percent reduction below the baseline
2 percent reduction 2 % cost savings ≥ 2 %
Result Met - 14.3 Met - 11.4 Met - 11.8 Exceeded - 7.9 Met - 2
Endpoint Target Achieve a 2 percent reduction below the baseline each year.
Commentary on 2015 Results (Action Plan if Not Met)
2% achieved
Documentation, Limitations, Methodology, Validation, and Verification
Office of Science
Advanced Scientific Computing Research
Support research to discover, develop, and deploy the computational and networking capabilities to analyze, model, simulate, and predict complex phenomena important to DOE
Program Advanced Scientific Computing Research
Performance Goal (Measure) ASCR Facility Operations - Average achieved operation time of ASCR user facilities as a percentage of total scheduled annual operation time
Fiscal Year 2011 2012 2013 2014 2015

FY 2015 DOE ANNUAL PERFORMANCE REPORT 89 | P a g e
Target N/A ≥ 90 % ≥ 90 % ≥ 90 % ≥ 90 %
Result Met Met Met Met
Endpoint Target Many of the research projects that are undertaken at the Office of Science’s scientific user facilities take a great deal of time, money, and effort to prepare and regularly have a very short window of opportunity to run. If the facility is not operating as expected the experiment could be ruined or critically setback. In addition, taxpayers have invested millions or even hundreds of millions of dollars in these facilities. The greater the period of reliable operations, the greater the return on the taxpayers’ investment.
Commentary on 2015 Results (Action Plan if Not Met)
Annual target met. Operation of the three scientific computing user facilities (NERSC, OLCF, and ALCF) was 99.3% of scheduled annual operating time.
Documentation, Limitations, Methodology, Validation, and Verification
Quarterly and EOY: This data comes directly from the batch queue accounting system at NERSC, OLCF and ALCF The Number of CPU hours accounted for by system failures and other unscheduled downtime. Reports detailing this progress reside in the files of the ASCR Office (SC-21).
Program Advanced Scientific Computing Research
Performance Goal (Measure) ASCR Research - Discovery of new applied mathematics and computer science tools and methods that enable DOE applications to deliver scientific and engineering insights with a significantly higher degree of fidelity and predictive power
Fiscal Year 2011 2012 2013 2014 2015
Target N/A 1 Accept and put into service 10 petaflop
upgrades at Argonne and Oak Ridge
Leadership Computing Facilities
Support at least two new teams to
conduct fundamental computer science
research and at least three applied mathematics
research teams that address issues of fault tolerance or
energy management for next-generation
computing systems.
Conduct an external peer review of the three original co-design centers to
document progress, impact, and lessons
learned.
Result Not Met Met Met Met
Endpoint Target Develop and deploy high-performance computing hardware and software systems through exascale platforms
Commentary on 2015 Results (Action Plan if Not Met)
Annual target met. Peer review of CO-design centers completed. Review documentation included impact and lessons learned to inform future recompete decision.

FY 2015 DOE ANNUAL PERFORMANCE REPORT 90 | P a g e
Documentation, Limitations, Methodology, Validation, and Verification
Quarterly and EOY: Research effort tracked through annual progress reports and quarterly program manager review of project accomplishments. Documents will be stored in ASCR files. New awards will be documented through PAMS.
Basic Energy Sciences
Support fundamental research to understand, predict, and ultimately control matter and energy at the electronic, atomic, and molecular levels in order to provide the foundations for new energy technologies and to support the DOE mission in energy, environment, and national security
Program Basic Energy Sciences
Performance Goal (Measure) BES Construction/MIE Cost & Schedule - Cost-weighted mean percentage variance from established cost and schedule baselines for major construction, upgrade, or equipment procurement projects
Fiscal Year 2011 2012 2013 2014 2015
Target < 10 % < 10 % < 10 % < 10 % < 10 %
Result Met Met Met Met Met
Endpoint Target Adhering to the cost and schedule baselines for a complex, large scale, science project is critical to meeting the scientific requirements for the project and for being good stewards of the taxpayers’ investment in the project.
Commentary on 2015 Results (Action Plan if Not Met)
Annual target met. Cost-weighted mean percent variance from cost baseline was 8% and from the schedule baseline was 4%.
Documentation, Limitations, Methodology, Validation, and Verification
BES Projects include those that have an approved performance baseline at the start of FY 2015, which include: NSLS-II and NEXT. Supporting data reside in the DOE Office of Engineering and Construction Management's (OECM, ME-50) Project Assessment and Reporting System (PARS) and with Basic Energy Science's Division of Scientific User Facilities (SC-22.3).
Program Basic Energy Sciences
Performance Goal (Measure) BES Energy Storage - Deliver two high‐performance research energy storage prototypes for transportation and the grid that project at the battery pack level to be five times the energy density at 1/5 the cost of the 2011 commercial baseline.
Fiscal Year 2011 2012 2013 2014 2015
Target N/A N/A N/A N/A Through the “electrolyte genome,”

FY 2015 DOE ANNUAL PERFORMANCE REPORT 91 | P a g e
demonstrate a framework for designing new
electrolytes using structure‐chemical trends extracted
from >10,000 first‐principles calculated
molecular motifs, modifications and
mutations.
Result Met
Endpoint Target Three specific outcomes: 1) A library of the fundamental science of the materials and phenomena of energy storage at atomic and molecular levels; 2) two prototypes, one for transportation and one for the electricity grid, that, when scaled up to manufacturing, have the potential to meet JCESR’s 5-5-5 goals; 3) A new paradigm for battery R&D that integrates discovery science, battery design, research prototyping and manufacturing collaboration in a single highly interactive organization.
Commentary on 2015 Results (Action Plan if Not Met)
Annual target met. The Electrolyte Genome database contains 16,591 molecule calculations at neutral, negatively, and positively charged states with various associated properties, such as structure, vibrational analysis, ionization, and electron affinity potentials. References: The methodology and evaluation for the Electrolyte Genome calculations was discussed in the scientific article, “The Electrolyte Genome project: A big data approach in battery materials discovery” (DOI: 10.1016/j.commatsci.2015.02.050) published in Computational Materials Sciences in June 2015. Additional information on their successful completion of the FY 2015 goal is in the 2015 Review document and the Q10 (April-June 2015) quarterly report.
Documentation, Limitations, Methodology, Validation, and Verification
The DOE Energy Innovation Hub for Batteries and Energy Storage is responsible for achieving this performance goal. The Hub’s performance during the initial five-year award period will be assessed using these metrics: completion of proposed milestones, assessment by annual peer review, scientific productivity, technology transfer to the private sector, integration of R&D across the energy storage community, and training of the next-generation of energy storage scientists and engineers. Performance against milestones will be evaluated by annual peer reviews and monitored by quarterly progress reports. Documentation on the annual peer reviews and quarterly progress reports reside in files in the BES program office (SC-22).
Program Basic Energy Sciences
Performance Goal (Measure) BES Facility Operations - Average achieved operation time of BES user facilities as a percentage of total scheduled annual operation time

FY 2015 DOE ANNUAL PERFORMANCE REPORT 92 | P a g e
Fiscal Year 2011 2012 2013 2014 2015
Target ≥ 90 % ≥ 90 % ≥ 90 % ≥ 90 % ≥ 90 %
Result Met Met Met Met Met
Endpoint Target Many of the research projects that are undertaken at the Office of Science’s scientific user facilities take a great deal of time, money, and effort to prepare and regularly have a very short window of opportunity to run. If the facility is not operating as expected the experiment could be ruined or critically setback. In addition, taxpayers have invested millions or even hundreds of millions of dollars in these facilities. The greater the period of reliable operations, the greater the return on the taxpayers’ investment.
Commentary on 2015 Results (Action Plan if Not Met)
Annual target met. Actual operating time at BES facilities was 30,258 hours, which is 100.5% of the planned 30,100 hours.
Documentation, Limitations, Methodology, Validation, and Verification
Supporting documents consist of the required quarterly and annual reports submitted to BES by the BES user facilities at the completion of each quarter and at the end of the fiscal year. These final reports reside in the files of the Office of Basic Energy Sciences (SC-22). The total planned operating hours for this goal is obtained from the planned operating hours of these individual user facilities in FY15: NSLS-II 2,100; SSRL 5,200; ALS 5,000; APS 5,000; LCLS 4,700; HFIR 3,400; and SNS 4,700 for a total of 30,100 hours (27,090 hours is 90%).
Biological and Environmental Research
Support fundamental research to address diverse and critical global challenges, from the sustainable and affordable production of renewable biofuels to understanding and predicting climate change and greenhouse gas emissions relevant to energy production and technology use
Program Biological and Environmental Research
Performance Goal (Measure) BER Climate Model - Develop a coupled climate model with fully interactive carbon and sulfur cycles, as well as dynamic vegetation to enable simulations of aerosol effects, carbon chemistry, and carbon sequestration by the land surface and oceans and the interactions between the carbon cycle and climate
Fiscal Year 2011 2012 2013 2014 2015
Target Earth system model to be used in
generating scenarios for IPCC Fifth
Assessment Report and provide
integrated aerosol sub-model that
includes direct and indirect forcing
Demonstrate coupled climate models at 20-
kilometer resolution
Use new climate model simulations to quantify interactions between clouds and
climate changes.
Use global models to estimate most
sensitive elements of terrestrial carbon to climate change for
tropics, mid-latitudes, and polar
regions
Develop capabilities to extend temporal resolution to sub-decadal for earth system models.

FY 2015 DOE ANNUAL PERFORMANCE REPORT 93 | P a g e
Result Met Met Met Met Met
Endpoint Target BER supports the Community Earth System Model, a leading U.S. climate model, and addresses two of the most critical areas of uncertainty in contemporary climate science—the impact of clouds and aerosols. Delivery of improved scientific data and models (with quantified uncertainties) about the potential response of the Earth atmosphere system to more accurately predict the Earth’s future climate is essential to plan for future energy needs, water resources, and land use. DOE will continue to advance the science necessary to further develop predictive climate and earth system models at the regional spatial scale and decadal to centennial time scales, involving close coordination with the U.S. Global Change Research Program and through the international science community.
Commentary on 2015 Results (Action Plan if Not Met)
Annual target met. Each quarter marked progress towards major model developments that have led to improved decadal predictability. All quarterly reports posted at http://www.climatemodeling.science.energy.gov/fy-2015-performance-metrics
Documentation, Limitations, Methodology, Validation, and Verification
Emails reporting the results and publication/availability of the results (per documented control process). Report is available at http://climatemodeling.science.energy.gov/about/metrics/
Program Biological and Environmental Research
Performance Goal (Measure) BER Predictive Understanding - Advance an iterative systems biology approach to the understanding and manipulation of plant and microbial genomes as a basis for biofuels development and predictive knowledge of carbon and nutrient cycling in the environment.
Fiscal Year 2011 2012 2013 2014 2015
Target N/A N/A N/A N/A Develop one new computationally
enabled approach to analyze complex
genomic datasets.
Result Met
Endpoint Target Deciphering the genomic blueprint of organisms and determining how this information is translated to integrated biological systems permits predictive modeling of bioprocesses and enables targeted redesign of plants and microbes. BER research will address fundamental knowledge gaps and provide foundational systems biology information necessary to advance development of sustainable bioenergy systems and predict impacts of changing environmental conditions on carbon cycling and other biogeochemical processes.
Commentary on 2015 Results (Action Plan if Not Met)
Annual target Met. End of year report on developing one new computationally enabled approach to analyze complex genomic datasets is posted at http://jgi.doe.gov/our-projects/statistics/

FY 2015 DOE ANNUAL PERFORMANCE REPORT 94 | P a g e
Documentation, Limitations, Methodology, Validation, and Verification
Quarterly - Emails from the designated performers reporting the research results (per documented control process). EOY - Emails reporting the results and publication/availability of the results (per documented control process). Report is available at http://jgi.doe.gov/our-projects/statistics/
Fusion Energy Sciences
Support research to expand the fundamental understanding of matter at very high temperatures and densities and to build the scientific foundation of fusion energy
Program Fusion Energy Sciences
Performance Goal (Measure) FES Construction/MIE Cost & Schedule - Cost-weighted mean percentage variance from established cost and schedule baselines for major construction, upgrade, or equipment procurement projects
Fiscal Year 2011 2012 2013 2014 2015
Target < 10 % < 10 % < 10 % < 10 % < 10 %
Result Met Met Met Met Met
Endpoint Target Adhering to the cost and schedule baselines for a complex, large scale, science project is critical to meeting the scientific requirements for the project and for being good stewards of the taxpayers’ investment in the project.
Commentary on 2015 Results (Action Plan if Not Met)
Annual target met. Cost variance was -5% and schedule variance was 0%.
Documentation, Limitations, Methodology, Validation, and Verification
Information is available in the PARS II System for NSTX Upgrade.
Program Fusion Energy Sciences
Performance Goal (Measure) FES Facility Based Experiments - Experiments conducted on major fusion facilities (DIII-D, Alcator C-Mod, NSTX) leading toward predictive capability for burning plasmas and configuration optimization
Fiscal Year 2011 2012 2013 2014 2015
Target Improve the understanding of the physics mechanisms responsible for the
structure of the
Conduct experiments and analysis on major
fusion facilities leading toward
Conduct experiments and
analysis to explore enhanced
confinement regimes
Conduct experiments and
analysis to investigate and quantify plasma
Conduct experiments and
analysis to quantify the impact of
broadened current

FY 2015 DOE ANNUAL PERFORMANCE REPORT 95 | P a g e
pedestal and compare with the predictive models described in the
companion theory milestone. Perform experiments to test theoretical physics
models in the pedestal region on
multiple devices over a broad range of
plasma parameters (e.g., collisionality, beta, and aspect ratio). Detailed
measurements of the height and width of the pedestal will
be performed, augmented by
measurements of the radial electric
field. The evolution of these parameters during the discharge will be studied. Initial
measurements of the turbulence in the pedestal region will also be performed to
improve understanding of the relationship between
edge turbulent transport and
pedestal structure.
improved understanding of
core transport and enhanced capability
to predict core temperature and density profiles.
Assess the level of agreement between
predictions from theoretical and computational
transport models and the available
experimental measurements of
core profiles, fluxes and fluctuations. The research is expected
to exploit the diagnostic
capabilities of the facilities (Alcator C-Mod, DIII-D, NSTX)
along with their abilities to run in both unique and
overlapping regimes. The work will emphasize
simultaneous comparison of model
predictions with experimental energy, particle and impurity transport levels and
fluctuations in various regimes, including those regimes with
without large edge instabilities, but with
acceptable edge particle transport
and a strong thermal transport barrier.
Coordinated experiments,
measurements, and analysis will be
carried out to assess and understand the operational space for these conditions. By
exploiting the complementary parameters and
tools of the devices, joint teams will work
to strengthen the basis for
extrapolation of these regimes to ITER and other
future fusion devices.
response to non-axisymmetric (3D) magnetic fields in
tokamaks. Effects of 3D fields can be
both beneficial and detrimental, and
research will aim to validate theoretical models in order to
predict plasma performance with varying levels and types of externally imposed 3D fields.
Dependence of response to multiple plasma parameters will be explored in
order to gain confidence in
predictive capability of the models.
and pressure profiles on tokamak plasma
confinement and stability. Broadened
pressure profiles generally improve global stability but
can also affect transport and
confinement, while broadened current profiles can have
both beneficial and adverse impacts on
confinement and stability. This research will
examine a variety of heating and current drive techniques in
order to validate theoretical models of
both the actuator performance and the transport and global stability response to varied heating and
current drive deposition.

FY 2015 DOE ANNUAL PERFORMANCE REPORT 96 | P a g e
significant excitation of electron modes.
Along with new experiments, work
will include analysis of relevant
previously-collected data and
collaboration among the research teams. The results achieved
will be used to improve confidence in transport models
used for extrapolations to
planned ITER operation.
Result Met Met Met Met Met
Endpoint Target Magnetic fields are the principal means of confining the hot ionized gas of a plasma long enough to make practical fusion energy. The detailed shape of these magnetic containers leads to many variations in how the plasma pressure is sustained within the magnetic bottle and the degree of control that experimenters can exercise over the plasma stability. These factors, in turn, influence the functional and economic credibility of the eventual realization of a fusion power reactor. The key to their success is a detailed physics understanding of the confinement characteristics of the plasmas in these magnetic configurations. The major fusion facilities can produce plasmas that provide a wide range of magnetic fields, plasma currents, and plasma shapes. By using a variety of plasma control tools, appropriate materials, and having the diagnostics needed to measure critical physics parameters, scientists will be able to develop optimum scenarios for achieving high performance plasmas in the International Thermonuclear Experimental Reactor and, ultimately, in reactors.
Commentary on 2015 Results (Action Plan if Not Met)
Annual target met. Research teams from the three major magnetic fusion facilities collaborated to conduct experiments and/or use previous data from the facilities to study the impact of broadened current and pressure profiles on tokamak plasma confinement and stability. The final report describes the progress in this area and identifies paths for future research.
Documentation, Limitations, Methodology, Validation, and Verification
V&V data are contained in progress reports maintained by the FES program office.

FY 2015 DOE ANNUAL PERFORMANCE REPORT 97 | P a g e
Program Fusion Energy Sciences
Performance Goal (Measure) FES Facility Operations - Average achieved operation time of FES user facilities as a percentage of total scheduled annual operation time
Fiscal Year 2011 2012 2013 2014 2015
Target ≥ 90 % ≥ 90 % ≥ 90 % ≥ 90 % ≥ 90 %
Result Not Met Met Met Met Not Met
Endpoint Target Many of the research projects that are undertaken at the Office of Science’s scientific user facilities take a great deal of time, money, and effort to prepare and regularly have a very short window of opportunity to run. If the facility is not operating as expected the experiment could be ruined or critically setback. In addition, taxpayers have invested millions or even hundreds of millions of dollars in these facilities. The greater the period of reliable operations, the greater the return on the taxpayers’ investment.
Commentary on 2015 Results (Action Plan if Not Met)
Annual target not met. Total hours achieved were 949 which is 65% of the planned 1,464 hours. Target missed due to an incident which delayed the restart of NSTX-U. Both Alcator C-Mod and DIII-D meet their operating target of achieving at least 90% of scheduled operating time. Action Plan: PPPL completed internal and external reviews and a root cause analysis to determine the cause of the incident. Problems identified in the reviews and analysis will be addressed to minimize the chance of this happening again. Additionally, the Fusion Facilities Operating Committee shall meet more often.
Documentation, Limitations, Methodology, Validation, and Verification
V&V data are contained in progress reports maintained by the FES program office. FES's major national fusion facilities are: - the DIII-D Tokamak at General Atomics in San Diego, California. (600 hours of operations are planned for DIII-D); - the Alcator C-Mod Tokamak at the Massachusetts Institute of Technology (384 hours of operations are planned for Alcator C-Mod); - the National Spherical Torus Experiment-Upgrade at the Princeton Plasma Physics Laboratory. (The major NSTX upgrade project will be completed this year and operations will resume, with 480 hours planned.) 1,464 hours total (baseline) are expected for FY15.
Program Fusion Energy Sciences
Performance Goal (Measure) FES Theory and Simulation - Performance of simulations with high physics fidelity codes to address and resolve critical challenges in the plasma science of magnetic confinement
Fiscal Year 2011 2012 2013 2014 2015

FY 2015 DOE ANNUAL PERFORMANCE REPORT 98 | P a g e
Target A focused analytic theory and
computational effort, including large-scale simulations, will be used to identify and
quantify relevant physics mechanisms
controlling the structure of the pedestal. The performance of future burning
plasmas is strongly correlated with the pressure at the top
of the edge transport barrier (or pedestal height). Predicting the pedestal height
has proved challenging due to a
wide and overlapping range of
relevant spatiotemporal
scales, geometrical complexity, and a
variety of potentially important physics
mechanisms. Predictive models will be developed
and key features of each model will be
tested against observations, to
clarify the relative importance of
various physics
Improve our understanding of the effects of relatively
small nonaxisymmetric fields in tokamak equilibria, with a
focus on effects that are of potential
importance for ITER. Focus particularly on
understanding experiments on the DIII-D tokamak in which relatively
small nonaxisymmetric fields are used to suppress edge
localized modes (ELMs). ELMs pose a threat to the goals
of the ITER experiment, and a similar method for
suppressing ELMs is under consideration
for ITER. An improved first-
principles understanding of the DIII-D experiments
will improve our ability to make
reliable predictions of ITER
performance.
Carry out advanced simulations to
address two of the most problematic consequences of
major disruptions in tokamaks: the generation and
subsequent loss of high-energy
electrons (runaway electrons), which
can damage the first wall, and the
generation of large electromagnetic loads induced by
disruptions. Assess the severity of these
effects on ITER.
Understanding alpha particle confinement in ITER, the world’s first burning plasma experiment, is a key priority for the fusion
program. Linear instability trends and
thresholds of energetic particle-driven shear Alfvén
eigenmodes in ITER are determined for a range of parameters and profiles using a
set of complementary
simulation models (gyrokinetic, hybrid, and gyrofluid). Initial
nonlinear simulations are
carried out to assess the effects of the
unstable modes on energetic particle
transport.
Perform massively parallel plasma
turbulence simulations to
determine expected transport in ITER. Starting from best
current estimates of ITER profiles, the
turbulent transport of heat and particles driven by various microinstabilities
(including electromagnetic
dynamics) will be computed.
Stabilization of turbulence by nonlinear self-
generated flows is expected to improve ITER performance,
and will be assessed with comprehensive
electromagnetic gyrokinetic
simulations.

FY 2015 DOE ANNUAL PERFORMANCE REPORT 99 | P a g e
mechanisms, and to make progress in
developing a validated physics
model for the pedestal height.
Result Met Met Met Met Met
Endpoint Target Advanced simulations based on high physics fidelity models offer the promise of advancing scientific discovery in the plasma science of magnetic fusion by exploiting the Science high performance computing resources and associated advances in computational science. These simulations are able to address the multiphysics and multiscale challenges of the burning plasma state and contribute to the FES goal of advancing the fundamental science of magnetically confined plasmas to develop the predictive capability needed for a sustainable fusion energy source.
Commentary on 2015 Results (Action Plan if Not Met)
Annual target met. The results highlighted the importance of including both the high and low wavenumber (k) turbulence in simulations focused on determining the performance of ITER. The high-k part of the turbulence spectrum, often omitted in previous work, contributes to the energy transport in ITER. This part of the spectrum is much more computationally expensive to model, requiring multiscale simulations. An additional benefit of this effort was the recalibration of the widely used TGLF reduced transport model to include the new effects.
Documentation, Limitations, Methodology, Validation, and Verification
V&V data are contained in progress reports maintained by the FES program office.
High Energy Physics
Support research toward understanding how the universe works at its most fundamental level by discovering the most elementary constituents of matter and energy, probing the interactions among them, and exploring the basic nature of space and time itself
Program High Energy Physics
Performance Goal (Measure) HEP Construction/MIE Cost & Schedule - Cost-weighted mean percentage variance from established cost and schedule baselines for major construction, upgrade, or equipment procurement projects
Fiscal Year 2011 2012 2013 2014 2015
Target < 10 % < 10 % < 10 % < 10 % < 10 %
Result Met Met Met Met Met
Endpoint Target Adhering to the cost and schedule baselines for a complex, large scale, science project is critical to meeting the scientific requirements for the project and for being good stewards of the taxpayers’ investment in the project.

FY 2015 DOE ANNUAL PERFORMANCE REPORT 100 | P a g e
Commentary on 2015 Results (Action Plan if Not Met)
Annual target met. For the five tracked projects, the cost-weighted cost variance was less than 1% and the cost-weighted schedule variance was less than 4%.
Documentation, Limitations, Methodology, Validation, and Verification
Derived from Quarterly Project Reports for the following projects: 1. LHC ATLAS Detector Upgrade 2. LHC CMS Detector Upgrade 3. LSSTcam Project 4. Muon to Electron Conversion Experiment 5. Muon g-2 Experiment Cost and schedule variance calculated by Earned Value for each project is averaged, weighted by the Total Project Cost for that project. The supporting documentation resides in the files of the HEP Office (SC-25), and a web site is under development.
Program High Energy Physics
Performance Goal (Measure) HEP Facility Operations - Average achieved operation time of HEP user facilities as a percentage of total scheduled annual operation time
Fiscal Year 2011 2012 2013 2014 2015
Target ≥ 80 % ≥ 80 % ≥ 80 % ≥ 80 % ≥ 80 %
Result Met Met Not Met Met Met
Endpoint Target Many of the research projects that are undertaken at the Office of Science’s scientific user facilities take a great deal of time, money, and effort to prepare and regularly have a very short window of opportunity to run. If the facility is not operating as expected the experiment could be ruined or critically setback. In addition, taxpayers have invested millions or even hundreds of millions of dollars in these facilities. The greater the period of reliable operations, the greater the return on the taxpayers’ investment.
Commentary on 2015 Results (Action Plan if Not Met)
Annual target met. Total actual hours were 8,018 which is 86% of the scheduled 9,376 hours of operations.
Documentation, Limitations, Methodology, Validation, and Verification
Derived from letters from Lab Directors or designee. Fermi data are reported at http://www-bdnew.fnal.gov/operations/lum/supertable.html. The scientific user facilities and scheduled hours: - Total hours scheduled is 9376 hours (7501 hours is 80%). - FACET is scheduled to for 5176 hours during Q1, Q2 and Q3 (4141 hours is 80%). - Fermilab Accelerator Complex is scheduled to run 4200 hours in FY 2015 (3360 is 80%). Unscheduled downtime reported by each facility is averaged, weighted by the Facility Operations cost. Facility Operations costs are defined in the Facilities Summary section of the HEP budget submission.

FY 2015 DOE ANNUAL PERFORMANCE REPORT 101 | P a g e
Program High Energy Physics
Performance Goal (Measure) HEP Neutrino Model – Carry out series of experiments to test the standard 3-neutrino model of mixing
Fiscal Year 2011 2012 2013 2014 2015
Target N/A N/A Measure the mixing angle between muon
neutrinos and electron neutrinos
(sin2(2θ13) by measuring the
disappearance of electron
antineutrinos with the Daya Bay
Reactor Experiment. This measurement
should have an uncertainty of 0.0075
or smaller.
Begin operation of full NovA detector
using neutrino beam from Fermilab for
purpose of measuring mixing
angle between muon neutrinos and
electron neutrinos (sin2(2θ13)) using the appearance
electron neutrinos.
Physics analyses results from the first year of data taking
with the full detector will be presented by
the NovA and MicroBooNE experimental
collaborations at the FY 2015 summer
conferences.
Result Met Met Not Met
Endpoint Target Like the quarks, it is believed that mixing between neutrinos can be described by a unitary matrix. Measuring the independent parameters of this matrix in different ways and with adequate precision will demonstrate whether this model of neutrinos is correct. Such a model is needed to correctly extract evidence for CP violation in the neutrino sector.
Commentary on 2015 Results (Action Plan if Not Met)
Annual target not met. NOvA took data and presented results at the summer conferences. However, the Booster neutrino beam became operational only several weeks before the summer shutdown, and MicroBooNE was not able complete filling its detector with liquid argon before the shutdown. Therefore no neutrino data was taken by MicroBooNE before the summer conferences. Summer conference results for MicroBoonNE was limited to commissioning results. Action Plan: (for MicroBooNE): collect data when available.
Documentation, Limitations, Methodology, Validation, and Verification
QTR: progress reports EOY: a letter or report from the Laboratory Director at Fermi National Accelerator Laboratory confirming that the full NOvA detector and the NuMI neutrino beam are operational. The supporting documentation resides in the files of the HEP Office (SC-25), and a web site is under development.

FY 2015 DOE ANNUAL PERFORMANCE REPORT 102 | P a g e
Nuclear Physics
Support research to discover, explore, and understand all forms of nuclear matter, supporting experimental and theoretical research to create, detect, and describe the different forms and complexities of nuclear matter that can exist in the universe, including those that are no longer found naturally
Program Nuclear Physics
Performance Goal (Measure) NP Construction/MIE Cost & Schedule - Cost-weighted mean percentage variance from established cost and schedule baselines for major construction, upgrade, or equipment procurement projects
Fiscal Year 2011 2012 2013 2014 2015
Target < 10 % < 10 % < 10 % < 10 % < 10 %
Result Met Met Met Met Met
Endpoint Target Adhering to the cost and schedule baselines for a complex, large scale, science project is critical to meeting the scientific requirements for the project and for being good stewards of the taxpayers’ investment in the project.
Commentary on 2015 Results (Action Plan if Not Met)
Annual target met. The 12 GeV project is within 10% of the cost and schedule variance: schedule variance 1% (SPI = 0.99); cost variance 3% (CPI =0.97).
Documentation, Limitations, Methodology, Validation, and Verification
Derived from the Monthly Report preceding the end of the quarter for the following projects: - 12 GeV CEBAF Upgrade Cost and schedule variance calculated by Earned Value for each project is averaged, weighted by the Total Project Cost for that project. The supporting documentation resides in the files of the ONP (SC-26).
Program Nuclear Physics
Performance Goal (Measure) NP Facility Operations - Average achieved operation time of NP user facilities as a percentage of total scheduled annual operation time
Fiscal Year 2011 2012 2013 2014 2015
Target ≥ 80 % ≥ 80 % ≥ 80 % ≥ 80 % ≥ 80 %
Result Met Met Met Met Met
Endpoint Target Many of the research projects that are undertaken at the Office of Science’s scientific user facilities take a great deal of time, money, and effort to prepare and regularly have a very short window of opportunity to run. If the facility is not operating as expected the experiment could be ruined or critically setback. In addition, taxpayers have invested millions or even hundreds of millions of dollars in these facilities. The greater the period of reliable operations, the greater the return on the taxpayers’ investment.

FY 2015 DOE ANNUAL PERFORMANCE REPORT 103 | P a g e
Commentary on 2015 Results (Action Plan if Not Met)
Annual target met. NP user facilities operated 10,091 hours, 116% of the planned operating hours of 8,670 hours. Operating hours were exceeded at both RHIC and ATLAS due to record reliability, and postponement of planned maintenance and installation of equipment, respectively. References: Email and official letter submitted to NP (SC-26) from ANL/ATLAS (Robert Janssens) and BNL/RHIC (Berndt Mueller). Supporting worksheets from the laboratory and a composite worksheet generated by NP.
Documentation, Limitations, Methodology, Validation, and Verification
The total planned operating hours for ATLAS and RHIC is 8,670 hours (80% is 6,936 hours). Quarterly: Emails from ANL (ATLAS) and BNL (RHIC) management to NP Office with statistics regarding breakout of beam hours (per documented control process); NP program office worksheet showing calculations. EOY: Official letters from ANL (ATLAS) and BNL (RHIC) management to NP Office reporting and certifying annual achieved operation time of the user facility (per documented control process); NP program office worksheet. Documentation resides in the Office of Nuclear Physics (SC-26) files. This target is met when the total operating time is 80% or greater.
Program Nuclear Physics
Performance Goal (Measure) NP Nuclear Structure - Conduct fundamental research to discover, explore, and understand all forms of nuclear matter.
Fiscal Year 2011 2012 2013 2014 2015
Target N/A N/A Complete initial measurements with high resolving power
tracking array, GRETINA, for
sensitive studies of structural evolution
and collective modes in nuclei.
Perform mass measurements and
nuclear reaction studies to infer weak interaction rates in nuclei in order to
constrain models of supernovae and stellar evolution.
Conduct fundamental
research to discover, explore, and
understand all forms of nuclear matter.
FY15: Measure bulk properties, particle
spectra, correlations and fluctuations in
gold + gold collisions at Relativistic Heavy

FY 2015 DOE ANNUAL PERFORMANCE REPORT 104 | P a g e
Ion Collider (RHIC) to search for
evidence of a critical point in the Quantum
Chromodynamics (QCD) matter phase
diagram.
Result Met Met Met
Endpoint Target Increase the understanding of the existence and properties of nuclear matter under extreme conditions, including that which existed at the beginning of the universe
Commentary on 2015 Results (Action Plan if Not Met)
Annual target met. Progress was made in advancing the search for evidence of the critical point from acquired RHIC data; preliminary results were shown at the recent Quark Matter conference. References: Email and letter from Berndt Mueller to SC-26 including quarterly report.
Documentation, Limitations, Methodology, Validation, and Verification
Quarterly: Emails from BNL RHIC Management to NP Office with progress towards achieving goals. EOY: Official letter from BNL RHIC Management to NP Office reporting and certifying progress made towards achieving goal. Documentation resides in the Office of Nuclear Physics (SC-26) files. The DOE PMM FY15 target is met when data is acquired in search of evidence of a critical point in the Quantum Chromodynams (QCD) matter phase diagram is provided by BNL RHIC.
ARPA-E
Continue to create new companies as a direct result of ARPA-E funding. From its FY 2013 baseline, it is assumed that ARPA-E's funding can contribute to the creation of 3 new companies per year.
Program Advanced Research Projects Agency - Energy
Performance Goal (Measure) New Company Formation - Number of new companies formed as a direct result of ARPA-E funding. This is a new performance measure for ARPA-E in FY 2015. As of the end of FY 2013 ARPA-E funded research has led to the formation of at least 24 new companies. That is the baseline from which we would expect to add at least 3 new companies per year.
Fiscal Year 2011 2012 2013 2014 2015
Target N/A N/A N/A N/A ≥ 3 new companies founded

FY 2015 DOE ANNUAL PERFORMANCE REPORT 105 | P a g e
Result Data Not Available
Endpoint Target No endpoint – continuous measure of impact of ARPA-E awards on creating new jobs and industries
Commentary on 2015 Results (Action Plan if Not Met)
As reported in the FY 2016 Congressional Budget Request, ARPA-E funded research has led to the formation of at least 24 new companies. ARPA-E expects this trend to continue at the rate of 3 company formations per year. Throughout the duration of FY 2015, ARPA-E will continue to monitor this metric and report the total in the end of FY 2015 annual report. FY 2015 EOY quantitative metrics should be available in February 2016.
Documentation, Limitations, Methodology, Validation, and Verification
ARPA-E Press Release: http://arpa-e.energy.gov/sites/default/files/documents/files/2015%20ARPA-E%20Summit%20Press%20Release%20Addendum_FINAL.pdf
Advanced Research Projects Agency - Energy
Fund specific high-risk, high-payoff, game-changing research and development projects to meet the nation's long-term energy challenges
Program Advanced Research Projects Agency - Energy
Performance Goal (Measure) Award Funding - Cumulative percentage of award funding committed 45 days after award selections are announced
Fiscal Year 2011 2012 2013 2014 2015
Target N/A ≥ 70 % ≥ 70 % ≥ 70 % ≥ 70 %
Result Met - 70 Met - 70 Met - 70 Met - 100
Endpoint Target No endpoint - continuous measure of efficiency in awarding funds
Commentary on 2015 Results (Action Plan if Not Met)
In FY15, per target, more than 70% of awardee funding was committed within 45 days of selection. After announcement, selected funds are reserved and tracked in ARPA-E planning worksheets. These worksheets are reviewed by ARPA-E leadership on a monthly basis. FOAs announced in FY15 (e.g., MOSAIC, TRANSNET, GENSETS, TERRA, ALPHA, ARID, DELTA, and MONITOR) had more than 70% of awardee funding committed within 45 days of selection. As such, "Met" has been reported in PMM and the FY 2017 OMB Budget Justification.
Documentation, Limitations, Methodology, Validation, and Verification
ARPA-E Internal Records

FY 2015 DOE ANNUAL PERFORMANCE REPORT 106 | P a g e
Chief Information Officer
Strengthen enterprise situational awareness to foster near-real-time risk management and combat the advanced persistent threat; forge interagency and sector partnerships to protect critical infrastructure, promote information sharing, and advance technologies for cyber defenses.
Program
Performance Goal (Measure) Continuous Monitoring - Provide ongoing observation, assessment, analysis, and diagnosis of an organization’s cybersecurity.
Fiscal Year 2011 2012 2013 2014 2015
Target N/A N/A N/A N/A All management capabilities
combined 63%.
Result Exceeded – 64%
Endpoint Target Improve awareness of security practices, vulnerabilities, and threats to the operating environment by limiting access to only authorized users and implementing technologies and processes that reduce the risk from malicious activity.
Commentary on 2015 Results (Action Plan if Not Met)
The Continuous Monitoring performance measure for all management capabilities combined exceeded the target goal of 63%.
Documentation, Limitations, Methodology, Validation, and Verification
Strengthen enterprise situational awareness to foster near-real-time risk management and combat the advanced persistent threat; forge interagency and sector partnerships to protect critical infrastructure, promote information sharing, and advance technologies for cyber defenses.
Program
Performance Goal (Measure) Strong Authentication PIV Access - Establish a Strong Authentication performance measure with the following capabilities/targets by Q4 FY15: Unprivileged Network Users (39%) and Privileged Network Users (10%).
Fiscal Year 2011 2012 2013 2014 2015
Target N/A N/A N/A N/A 26%
Result Not Met – 23%

FY 2015 DOE ANNUAL PERFORMANCE REPORT 107 | P a g e
Endpoint Target Improve awareness of security practices, vulnerabilities, and threats to the operating environment by limiting access to only authorized users and implementing technologies and processes that reduce the risk from malicious activity.
Commentary on 2015 Results (Action Plan if Not Met)
The Strong Authentication (PIV/ICAM) performance measure which includes Privileged and Unprivileged Network User capabilities did not meet their target goals throughout the year except for Q3 FY15. Per OMB, the target goals were not established until Q3 FY15. Action Plan: Target goals should be established and communicated before tracking a performance measure.
Documentation, Limitations, Methodology, Validation, and Verification
Strengthen enterprise situational awareness to foster near-real-time risk management and combat the advanced persistent threat; forge interagency and sector partnerships to protect critical infrastructure, promote information sharing, and advance technologies for cyber defenses.
Program
Performance Goal (Measure) Anti-Phishing and Malware Defense (APMD) - Establish an Anti-Phishing and Malware Defense (APMD) performance measure with the following capabilities/targets by Q4 FY15: Anti-Phishing Defense (48%), Malware Defense (49%), and Blended Defense (70%).
Fiscal Year 2011 2012 2013 2014 2015
Target N/A N/A N/A N/A 59%
Result Not Met – 51%
Endpoint Target Improve awareness of security practices, vulnerabilities, and threats to the operating environment by limiting access to only authorized users and implementing technologies and processes that reduce the risk from malicious activity.
Commentary on 2015 Results (Action Plan if Not Met)
The Anti-Phishing and Malware Defense (APMD) performance measure which includes Anti-Phishing, Malware, and Blended Defense capabilities did not meet their target goals throughout the year except for the Malware Defense capability in Q4 FY15. Per OMB, the target goals were not established until Q3 FY15. Action Plan: Target goals should be established and communicated before tracking a performance measure.
Documentation, Limitations, Methodology, Validation, and Verification

FY 2015 DOE ANNUAL PERFORMANCE REPORT 108 | P a g e
Departmental Administration
Strengthen enterprise situational awareness to foster near-real-time risk management and combat the advanced persistent threat; forge interagency and sector partnerships to protect critical infrastructure, promote information sharing, and advance technologies for cyber defenses.
Program Departmental Administration
Performance Goal (Measure) IT Sustainability and Data Center Optimization - 49. Generate savings through implementation of a 10% enterprise IT consolidation (e.g., servers) and sustainability plan and optimization of Federally-managed data centers.
Fiscal Year 2011 2012 2013 2014 2015
Target 1 data centers 5 $M Cost Savings 2 data centers closed
Pending executive approval of the
Energy Savings Performance
Contract (ESPC) project, the OCIO
will consolidate two data centers in FY14 & FY15 and begin accruing annual savings of $12
million in FY16. There will be no cost savings/avoidance
achieved in FY 2014.
$ 12 $M cost savings
Result Met - 1 Met - 5 Met - 2 N/A - 0 Not Met - 1.52
Endpoint Target By FY 2015, generate cost savings through implementation of a 10% enterprise IT consolidation (e.g., data centers) per the DOE Federal Data Center Consolidation Initiative (FDDCI) plan.
Commentary on 2015 Results (Action Plan if Not Met)
Initial savings of $12M was expected from the consolidation of two data centers in FY15 and FY16. By the end of FY15, only $1.52M savings was realized from the completed initiatives. Further savings expected in Q1 FY16 with the consolidation of the Sun Solaris / Oracle Application Servers. Action Plan: Review expected/realistic cost savings for FY2016.
Documentation, Limitations, Methodology, Validation, and Verification
CIO Status of IT Commodity Initiatives as of Aug 2015.

FY 2015 DOE ANNUAL PERFORMANCE REPORT 109 | P a g e
Program Departmental Administration
Performance Goal (Measure) IT Transformation - Implement the plan to transform the delivery of commodity IT services (people & processes) to achieve cost savings.
Fiscal Year 2011 2012 2013 2014 2015
Target Set baseline for assessing delivery of
IT services
3.2 $M Cost Savings 8.96 $M Cost Savings
$ 9.76 $Millions $ 4.834 $M cost savings
Result Met - 3.2 Exceeded - 9.48 Not Met - 1.8 Not Met - 1.41
Endpoint Target By FY 2015, achieve $31.4M in gross cost savings through transforming the delivery of commodity IT services (people and processes) to DOE federal and support service contractors in a secure manner.
Commentary on 2015 Results (Action Plan if Not Met)
The actual cost savings/avoidance for IT Commodity Savings initiatives ending Q4 FY2015 is $1.41M, up from new target of $1.2085M. The additional $200K cost savings was due to SC's Email and Collaboration Tools consolidation. Action Plan: New target amount was exceeded by $200K.
Documentation, Limitations, Methodology, Validation, and Verification
CIO Status of IT Commodity Initiatives dated Aug 2015.
Office of Management
Program Departmental Administration
Performance Goal (Measure) Expanded use of strategic sourcing - Execute expanded use of Federal Strategic Sourcing Initiative to DOE Federal Procurement Operations while continuing to focus on Contractor Supply Chain Council activities to achieve 3.25% in cost savings against actionable spend by Sep 2013. FY14: Institute a corporate approach (including the laboratories) for strategic sourcing to achieve at least a 4% cost savings target (about $261M) against spending on products and services.
Fiscal Year 2011 2012 2013 2014 2015
Target $250M $250M 195 $M Cost Savings
> 247 $M Cost Savings
261 $M
Result Met - 264.2 Met - 236 Met - 295.5 Met - 376
Endpoint Target

FY 2015 DOE ANNUAL PERFORMANCE REPORT 110 | P a g e
Commentary on 2015 Results (Action Plan if Not Met)
Above projection
Documentation, Limitations, Methodology, Validation, and Verification
Program Departmental Administration
Performance Goal (Measure) Maintain certified acquisition professionals - 34. Maintain levels of certified acquisition professionals
Fiscal Year 2011 2012 2013 2014 2015
Target 84% (baseline) 0.85 90 % > 90 % 85 %
Result Met - 0.93 Met - 95 Met - 93 Met - 85
Endpoint Target
Commentary on 2015 Results (Action Plan if Not Met)
Met; achieved 85% certified.
Documentation, Limitations, Methodology, Validation, and Verification
Program Departmental Administration
Performance Goal (Measure) Project Success - On a 3-year rolling basis, the percentage of departmental projects baselined since the start of FY 2008 that were completed within the original scope baseline and not to exceed 110% of the cost as reflected in the performance baseline established at Critical Decision 2. This measure was created on April 23, 2014, specifically for the purpose of tracking progress on the FY14-15 Management Agency Priority Goal. It tracks all projects post-root cause analysis (RCA), while the measure "Capital asset projects" tracks only construction projects.
Fiscal Year 2011 2012 2013 2014 2015
Target N/A N/A N/A 90 % 90 %
Result Not Met - 76 Not Met - 78
Endpoint Target On a three-year rolling basis, complete at least 90% of departmental projects baselined since the start of FY 2008 within the original scope baseline and not to exceed 110% of the cost as reflected in the performance baseline established at Critical Decision 2 through FY 2015.
Commentary on 2015 Results (Action Plan if Not Met)
Action Plan: Address performance at Secretarial-level Project Management Risk Committee.
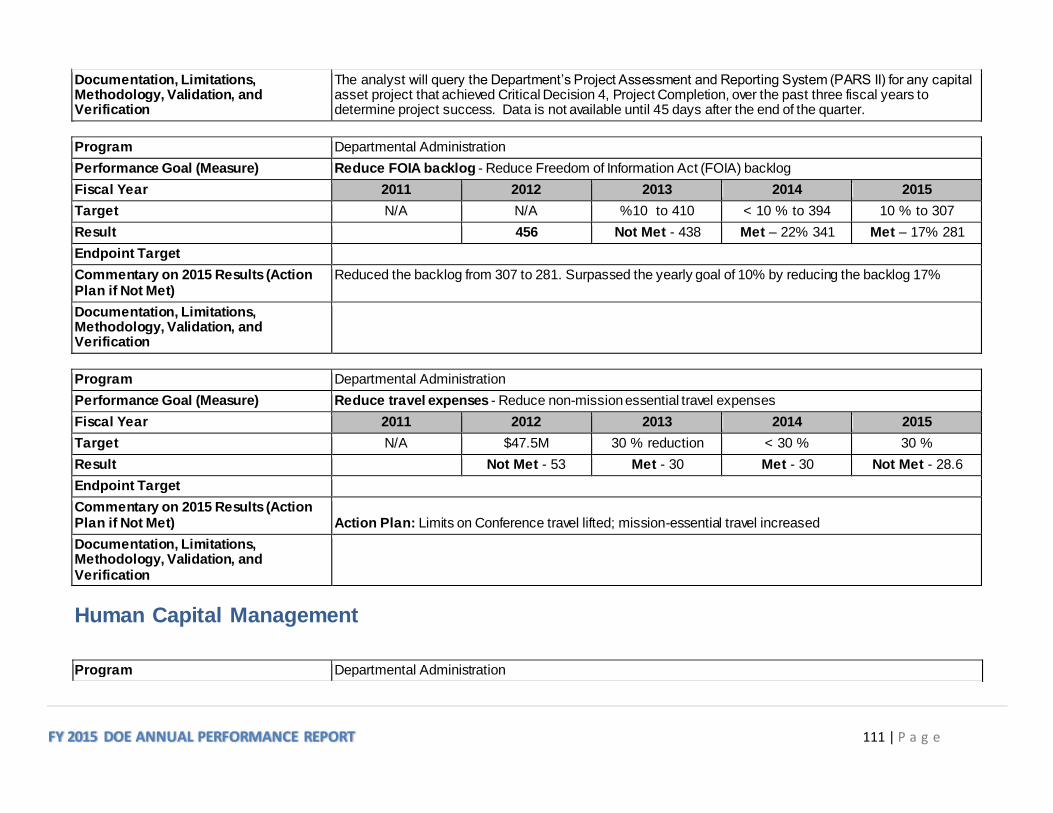
FY 2015 DOE ANNUAL PERFORMANCE REPORT 111 | P a g e
Documentation, Limitations, Methodology, Validation, and Verification
The analyst will query the Department’s Project Assessment and Reporting System (PARS II) for any capital asset project that achieved Critical Decision 4, Project Completion, over the past three fiscal years to determine project success. Data is not available until 45 days after the end of the quarter.
Program Departmental Administration
Performance Goal (Measure) Reduce FOIA backlog - Reduce Freedom of Information Act (FOIA) backlog
Fiscal Year 2011 2012 2013 2014 2015
Target N/A N/A %10 to 410 < 10 % to 394 10 % to 307
Result 456 Not Met - 438 Met – 22% 341 Met – 17% 281
Endpoint Target
Commentary on 2015 Results (Action Plan if Not Met)
Reduced the backlog from 307 to 281. Surpassed the yearly goal of 10% by reducing the backlog 17%
Documentation, Limitations, Methodology, Validation, and Verification
Program Departmental Administration
Performance Goal (Measure) Reduce travel expenses - Reduce non-mission essential travel expenses
Fiscal Year 2011 2012 2013 2014 2015
Target N/A $47.5M 30 % reduction < 30 % 30 %
Result Not Met - 53 Met - 30 Met - 30 Not Met - 28.6
Endpoint Target
Commentary on 2015 Results (Action Plan if Not Met)
Action Plan: Limits on Conference travel lifted; mission-essential travel increased
Documentation, Limitations, Methodology, Validation, and Verification
Human Capital Management
Program Departmental Administration

FY 2015 DOE ANNUAL PERFORMANCE REPORT 112 | P a g e
Performance Goal (Measure) Annual reductions in the average time-to-hire - 19. Annual reductions in the average time-to-hire (both agency-wide and for each HR office) from 174 days in FY09 to 100 days or less by end of FY 2011, and further to 80 days by end of FY 2012.
Fiscal Year 2011 2012 2013 2014 2015
Target 100-Day Goal ≤ 80 Calendar Days ≤ 80 Calendar Days 80 Calendar Days 80 calendar days
Result Not Met - 86 Not Met - 101 Met - 80 Not Met – 98.7
Endpoint Target Each HR Office will have an average time-to-hire of 80 days or less.
Commentary on 2015 Results (Action Plan if Not Met)
For Q4, the average hiring time for GS employees was 107.5 days. For FY15, the average hiring time for GS employees was 98.7 days.
Documentation, Limitations, Methodology, Validation, and Verification
Time to Hire reports, Hiring Management database
Program Departmental Administration
Performance Goal (Measure) Implement a framework for performance-based culture - Percent of SES with compliant plans.
Fiscal Year 2011 2012 2013 2014 2015
Target Pilot e-Performance System via small-
scale implementation
100 percent 100 % The target is to have all SES employees have an established performance plan in place according to
the timelines stated in ePerformance
≥ 90 percentage
Result Not Met Met Not Met Met - 95
Endpoint Target Improve and continue to refine DOE performance management systems/processes so they clearly link work to mission goals, expected outcomes and accomplishment measures. Ensure meaningful distinctions between levels of performance are identified and rewarded.
Commentary on 2015 Results (Action Plan if Not Met)
By the end of the 4th quarter, all SES should have their FY15 performance plans closed out. At the time of this reporting, 95% of all established SES performance plans have been closed.
Documentation, Limitations, Methodology, Validation, and Verification
ePerformance Reports

FY 2015 DOE ANNUAL PERFORMANCE REPORT 113 | P a g e
Hearings and Appeals
Program Departmental Administration
Performance Goal (Measure) OHA Effectiveness Measure - Improve the timeliness of security cases by reducing the number of cases over 120 days old.
Fiscal Year 2011 2012 2013 2014 2015
Target 6 4 cases 3 cases 4 cases 4 cases
Result Exceeded - 0 Met - 4 Met - 3 Met - 3 Met - 3
Endpoint Target 3
Commentary on 2015 Results (Action Plan if Not Met)
Fewer than 4 cases over 120 days old.
Documentation, Limitations, Methodology, Validation, and Verification
Loan Guarantee
The mission of Loan Programs Office (LPO) is to accelerate the domestic commercial deployment of innovative and advanced clean energy technologies at a scale sufficient to contribute meaningfully to the achievement of our national clean energy objectives.
Program
Performance Goal (Measure) ATVM Battery Production Capacity - Battery production capacity of 100,000 lithium-ion EV batteries (2,400,000 kWh) established
Fiscal Year 2011 2012 2013 2014 2015
Target N/A N/A ≥ 100,000 Batteries ≥ 100,000 Batteries ≥ 100,000 Batteries
Result Met - 100,000 Met - 100,000 Met - 100,000
Endpoint Target Assist in the development of advanced battery manufacturing capacity to support 100,000 electric vehicles each year, through 2016.
Commentary on 2015 Results (Action Plan if Not Met)
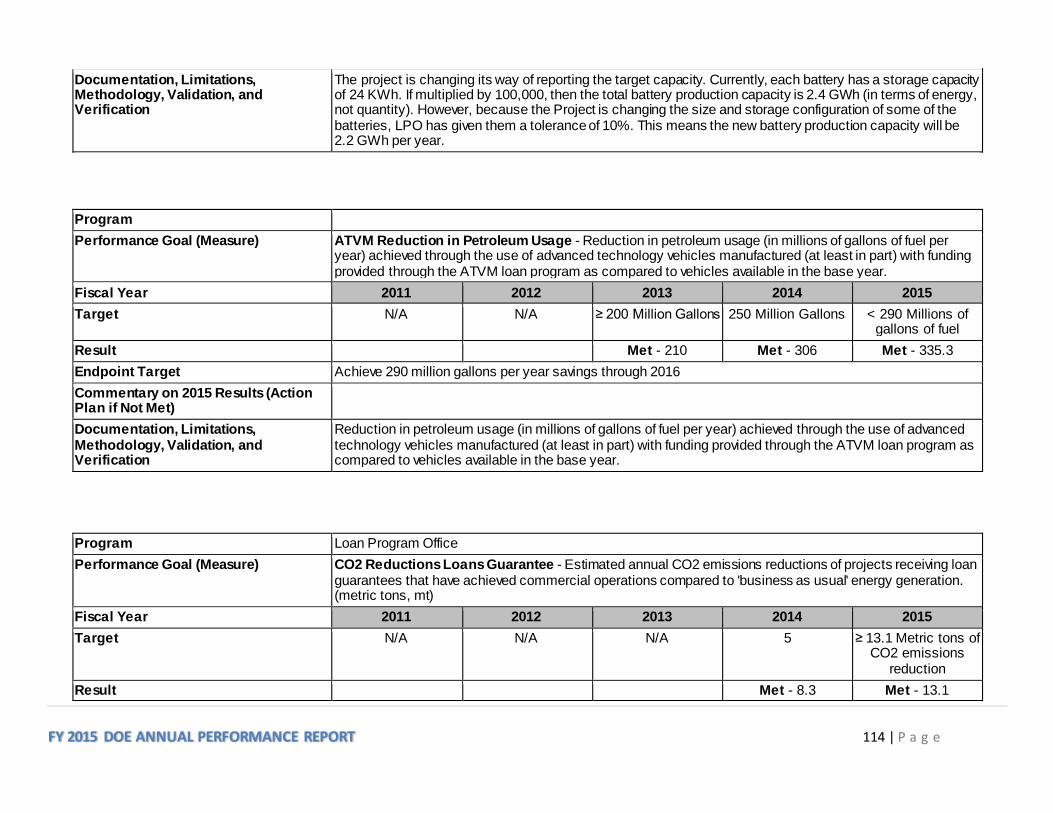
FY 2015 DOE ANNUAL PERFORMANCE REPORT 114 | P a g e
Documentation, Limitations, Methodology, Validation, and Verification
The project is changing its way of reporting the target capacity. Currently, each battery has a storage capacity of 24 KWh. If multiplied by 100,000, then the total battery production capacity is 2.4 GWh (in terms of energy, not quantity). However, because the Project is changing the size and storage configuration of some of the batteries, LPO has given them a tolerance of 10%. This means the new battery production capacity will be 2.2 GWh per year.
Program
Performance Goal (Measure) ATVM Reduction in Petroleum Usage - Reduction in petroleum usage (in millions of gallons of fuel per year) achieved through the use of advanced technology vehicles manufactured (at least in part) with funding provided through the ATVM loan program as compared to vehicles available in the base year.
Fiscal Year 2011 2012 2013 2014 2015
Target N/A N/A ≥ 200 Million Gallons 250 Million Gallons < 290 Millions of gallons of fuel
Result Met - 210 Met - 306 Met - 335.3
Endpoint Target Achieve 290 million gallons per year savings through 2016
Commentary on 2015 Results (Action Plan if Not Met)
Documentation, Limitations, Methodology, Validation, and Verification
Reduction in petroleum usage (in millions of gallons of fuel per year) achieved through the use of advanced technology vehicles manufactured (at least in part) with funding provided through the ATVM loan program as compared to vehicles available in the base year.
Program Loan Program Office
Performance Goal (Measure) CO2 Reductions Loans Guarantee - Estimated annual CO2 emissions reductions of projects receiving loan guarantees that have achieved commercial operations compared to 'business as usual' energy generation. (metric tons, mt)
Fiscal Year 2011 2012 2013 2014 2015
Target N/A N/A N/A 5 ≥ 13.1 Metric tons of CO2 emissions
reduction
Result Met - 8.3 Met - 13.1

FY 2015 DOE ANNUAL PERFORMANCE REPORT 115 | P a g e
Endpoint Target Achieve 16,400,000 mt of avoided CO2 emissions by the end of FY 2016.
Commentary on 2015 Results (Action Plan if Not Met)
Documentation, Limitations, Methodology, Validation, and Verification
Estimated annual CO2 emissions reductions of projects receiving loan guarantees that have achieved commercial operations compared to 'business as usual' energy generation.
Program Loan Program Office
Performance Goal (Measure) Generation Capacity of Projects Receiving Loan Guarantees - Annual generation capacity from projects receiving DOE loan guarantees that have achieved commercial operations. (Gigawatts, GW)
Fiscal Year 2011 2012 2013 2014 2015
Target ≥ 0.1 GW ≥ 1.3 GW ≥ 2.8 GW ≥ 3.8 GW ≥ 3.8 Gigawatts, GW of energy capacity
Result Met - 0.1 Met - 1.5 Not Met - 1.9 Not Met - 3.2 Met - 3.82
Endpoint Target Achieve 4.0 GW of annual electricity generation capacity by FY 2015
Commentary on 2015 Results (Action Plan if Not Met)
Documentation, Limitations, Methodology, Validation, and Verification
Current methodology involves keeping track of the period when a project comes online and how much capacity it has. The sum of all generation capacity within the FY is recorded and added to the cumulative capacity already online.
Health, Safety and Security
Departmental Administration
Ensuring the health, safety, and security of DOE workers and vital assets is HSS’s contribution to the Department’s vital mis sions in science, energy, and national security.
Program Departmental Administration
Performance Goal (Measure) Former Worker Satisfaction - Obtain an average rating of no less than satisfactory on 90 percent of customer satisfaction surveys from former worker medical screening program participants who receive medical screenings.
Fiscal Year 2011 2012 2013 2014 2015
Target 90 percent satisfactory rating on
90 percent satisfactory rating on
90 percent satisfactory rating on
90 percent satisfactory rating on
90

FY 2015 DOE ANNUAL PERFORMANCE REPORT 116 | P a g e
customer satisfaction surveys
customer satisfaction surveys
customer satisfaction surveys
customer satisfaction surveys
Result Met - 97 Met - 99 Met - 98 Met - 97 Met - 97
Endpoint Target N/A; ongoing
Commentary on 2015 Results (Action Plan if Not Met)
The survey satisfaction results demonstrate AU’s and the Department’s commitment to its employees and former employees regarding the implementation of the medical screening program.
Documentation, Limitations, Methodology, Validation, and Verification
Energy Information Administration
Energy Information Administration
EIA collects, analyzes, and disseminates independent and impartial energy information to promote sound policymaking, efficient markets, and public understanding of energy and its interaction with the economy and the environment
Program Energy Information Administration
Performance Goal (Measure) Quality of EIA Information Products - Percentage of customers who are satisfied or very satisfied with the quality of EIA information.
Fiscal Year 2011 2012 2013 2014 2015
Target 90 % customer satisfaction rating
90 % customer satisfaction rating
90 % customer satisfaction rating
90 % customer satisfaction rating
≥ 90 % of customers satisfaction rating
Result Met - 90 Met - 91 Met - 92 Met - 95 Met - 90
Endpoint Target This is an ongoing annual performance measure, as information quality is central to EIA’s mission.
Commentary on 2015 Results (Action Plan if Not Met)
EIA actively solicits external feedback by fielding an annual web customer survey to gain a better understanding of who uses the agency’s information products, how they are used, and most importantly, whether they meet customers’ diverse and evolving needs. This feedback spurs product innovation and ensures that EIA’s customers have access to information that is essential to inform a wide range of energy-related decisions.
Documentation, Limitations, Methodology, Validation, and Verification
EIA conducted the survey with OMB approval and the results are stored in the files of EIA’s Office of Communications.

FY 2015 DOE ANNUAL PERFORMANCE REPORT 117 | P a g e
Program Energy Information Administration
Performance Goal (Measure) Timeliness of EIA Information Products - Percentage of selected EIA recurring products meet their release date targets (all product types).
Fiscal Year 2011 2012 2013 2014 2015
Target 95 % of products released on schedule
95 % of products released on schedule
95 % of products released on schedule
95 % of products released on schedule
≥ 95 % of products released on time.
Result Met - 97 Met - 97 Met - 96 Met - 96 Met - 95
Endpoint Target This is an ongoing annual performance measure, as timely delivery of energy information is central to EIA’s mission.
Commentary on 2015 Results (Action Plan if Not Met)
As the nation's premier source of energy information, customers rely on EIA for timely delivery of independent, impartial statistics and analyses. This reliability promotes efficient energy markets while also contributing to sound policymaking and public understanding of energy and its interactions with the economy and the environment.
Documentation, Limitations, Methodology, Validation, and Verification
Internal tracking; EIA selected which products to track and is tracking the actual and scheduled release dates. The Quality Assurance Team within EIA’s Office of Energy Statistics verifies the calculations and stores the file.
Southeastern Power Administration
Southeastern Power Administration
Southeastern markets and delivers reliable, cost-based Federal hydroelectric power and provides related services throughout the Southeastern United States.
Program Southeastern Power Administration
Performance Goal (Measure) SEPA Repayment of Federal Power Investment - Repay annually to meet required payments as they come due and assure that all aged investments will be replaced on a timely basis now and in the future.
Fiscal Year 2011 2012 2013 2014 2015
Target ≥ 100 percent ≥ 100 percent ≥ 100 percent ≥ 100 percent < $2.141 million dollars AUI
Result Met - 100 Met - 100 Not Met - did not repay 100%
Met - 100 Met - $1,686 unpaid investment (UI)

FY 2015 DOE ANNUAL PERFORMANCE REPORT 118 | P a g e
Endpoint Target Meet legislated cost recovery requirements for timely repayment of Federal investment in maintaining financial integrity of projects/program.
Commentary on 2015 Results (Action Plan if Not Met)
Met - $1,686 thousand unpaid investment (UI) Tracking actual dollar amounts to be more descriptive and accurate going forward.
Documentation, Limitations, Methodology, Validation, and Verification
Program Southeastern Power Administration
Performance Goal (Measure) SEPA System Reliability Performance - NERC - Meet NERC Control Performance Standards (CPS) of CPS1>100 and CPS2>90. CPS1: minute by minute measures a generating system's ability to match supply to changing demand requirements and support desired system frequency (about 60 cycles per second); CPS2: measures systems ability to limit the magnitude of generation and demand imbalances
Fiscal Year 2011 2012 2013 2014 2015
Target > 100 CPS1 rating with CSP2>90
> 100 CPS1 rating with CSP2>90
> CPS1 100 rating with CSP2>90
> 100 CPS1 rating with CSP2>90
CPS 1 > 100; CPS 2 > 90
Result Met Met Met Met Met
Endpoint Target Ensure the integrity of the Nation’s integrated grid by operating in compliance with National Energy Reliability Standards.
Commentary on 2015 Results (Action Plan if Not Met)
CPS1 = 197.98 CPS2 = 99.98
Documentation, Limitations, Methodology, Validation, and Verification
Southwestern Power Administration
Southwestern Power Administration
To market and reliably deliver Federal hydropower with preference to public bodies and cooperatives. This is accomplished by maximizing the use of Federal assets to repay the Federal investment and participating with other water resource users in an effort to balance thei r diverse interests with power needs within broad parameters set by the U.S. Army Corps of Engineers and implementing public policy.
Program Southwestern Power Administration
Performance Goal (Measure) SWPA - System Reliability Performance - Outages - Effectively operate the transmission system to limit the number of accountable outages to no more than 3 annually.

FY 2015 DOE ANNUAL PERFORMANCE REPORT 119 | P a g e
Fiscal Year 2011 2012 2013 2014 2015
Target < 3 accountable outages
≤ 3 accountable outages
< 3 accountable outages
< 3 accountable outages
< 3 accountable outages
Result Met - 0 Met - 1 Met - 1 Met - 0 Met - 2
Endpoint Target Southwestern provides reliable service to customers each year, thereby maintaining power system reliability.
Commentary on 2015 Results (Action Plan if Not Met)
2 accountable outages all year
Documentation, Limitations, Methodology, Validation, and Verification
Program Southwestern Power Administration
Performance Goal (Measure) SWPA Annual Operating Cost Performance - Provide power at the lowest possible cost by keeping total operation and maintenance expense per kilowatt-hour generated below the national median for public power. ($/kilowatt hour, kWh)
Fiscal Year 2011 2012 2013 2014 2015
Target 0.062 $/kWh < 0.063 $/kWh < 0.063 $/kWh < 0.063 $/kWh <= 0.063$/kWh
Result Met - 0.0163 Met - 0.0156 Met - 0.0158 Met - 0.0182 Met - .0176/kWh
Endpoint Target Southwestern will continue to control annual Operations and Maintenance costs, thereby providing power at the lowest possible cost.
Commentary on 2015 Results (Action Plan if Not Met)
$.0176/kWh
Documentation, Limitations, Methodology, Validation, and Verification
Program Southwestern Power Administration
Performance Goal (Measure) SWPA Repayment of the Federal Power Investment Per - Ensure unpaid investment (UI) is equal to or less than the allowable unpaid investment (AUI) in accordance with DOE Order RA 6120.2 and Reclamation Law.
Fiscal Year 2011 2012 2013 2014 2015
Target 1,306 million dollars UI
1,336 million dollars UI
1,477 million dollars UI
1,477 million dollars UI
<=$1,387 million dollars AUI

FY 2015 DOE ANNUAL PERFORMANCE REPORT 120 | P a g e
Result Met - 1,306 Met – 1,336 Met – 1,477 Met – 1,477 Met – 1,387
Endpoint Target Continue to meet legislated cost recovery requirements for timely repayment of Federal investment in maintaining financial integrity of projects/program.
Commentary on 2015 Results (Action Plan if Not Met)
Documentation, Limitations, Methodology, Validation, and Verification
Program Southwestern Power Administration
Performance Goal (Measure) SWPA System Reliability Performance - NERC - Meet industry averages (CPS1: 162.3 and CPS2: 96.7) and at a minimum, meet NERC Control Performance Standards (CPS) of CPS1>100 and CPS2>90. CPS1: minute by minute measures a generating system's ability to match supply to changing demand requirements and support desired system frequency (about 60 cycles per second); CPS2: measures systems ability to limit the magnitude of generation and demand imbalances.
Fiscal Year 2011 2012 2013 2014 2015
Target > 100 CPS1 rating with CSP2>90
> 100 CPS1 rating with CSP2>90
> 100 CPS1 rating and CPS2>90
> 100 CPS1 rating with CSP2>90
CPS1>100; CPS2>90
Result Met - 199 Met - 187 Met - 186.74 Met - 187.97 Met - 168
Endpoint Target Southwestern ensures the integrity of the nation’s integrated grid by operating in compliance with National Energy Reliability Standards.
Commentary on 2015 Results (Action Plan if Not Met)
Southwestern achieved 6 out of 6 control compliance ratings. Southwesstern's average annual results are 237.2 for CPS1 & 99.7 for CPS2.
Documentation, Limitations, Methodology, Validation, and Verification
Western Area Power Administration
Western Area Power Administration
Western markets and delivers reliable, cost-based Federal hydroelectric power and provides related services throughout the central and western United States.
Program Western Area Power Administration

FY 2015 DOE ANNUAL PERFORMANCE REPORT 121 | P a g e
Performance Goal (Measure) WAPA - Repayment of Investment Performance - Ensure unpaid investment (UI) is equal to or less than the allowable unpaid investment (AUI) in accordance with DOE Order RA 6120.2 and Reclamation Law.
Fiscal Year 2011 2012 2013 2014 2015
Target ≤ 8.52 billion dollars UI
≤ 8.692 billion dollars UI
≤ 8.594 billion dollars UI
≤ 8.667 billion dollars UI
<=$8,632 million dollars AUI
Result Met - 6.136 Met - 6.166 Met - 6.204 Met - 5.476 Data Not Available
Endpoint Target Continue to meet legislated cost recovery requirements for timely repayment of Federal investment in maintaining financial integrity of projects/program.
Commentary on 2015 Results (Action Plan if Not Met)
Western will not have the missing data until August 2016. Power Repayment Studies for FY2015 are
required to complete the Repayment of Investment Performance metric and they will not be available until
August.
Documentation, Limitations, Methodology, Validation, and Verification
Repayment statistics are compiled annually by project from the most recent final power repayment studies developed by Rates/Power Marketing Offices using audited financial data. These studies identify project investment category totals for unpaid Federal investment (UI) and the amount of allowable unpaid Federal investment (AUI). AUI is the amount of investment for which repayment is not yet required based on the duration of the repayment period. If at any point, the unpaid levels exceed those allowed in accordance with the principles established in RA6120.2, repayment is behind schedule. As to the application of principal in the PRS, generally repayment is applied to the highest interest rate first. However, e.g. if in year 20 of a 20-year investment, AUI is zero, a "required payment" must be made regardless of the interest rate. Note: Annual planned repayment estimates are developed in the PRS, and are based on average hydrology that can vary greatly, adversely impacting both revenue and expenses. Moreover, annual repayment of Federal investment in infrastructure/facilities isn't required, but assumes repayment within the average service life up to a maximum of 50 years. Documentation: Final PRS
Program Western Area Power Administration
Performance Goal (Measure) WAPA - System Reliability Performance - NERC Rating - WAPA - System Reliability Performance - NERC Rating - System Reliability Performance: Attain acceptable North American Electric Reliability Corporation (NERC) ratings for the following Control Performance Standards (CPS) measuring the balance between power generation and load: 1) CPS1 measures generation/load balance and support system frequency on 1-minute intervals (rating>100); and 2) CPS2 limits any imbalance magnitude to acceptable levels (rating>90).
Fiscal Year 2011 2012 2013 2014 2015
Target > 100 CPS1 rating with CPS2>90
> 100 CPS1 rating with CPS2>90
> 100 CPS1 rating, CPS2>90
> 100 CPS1 rating with CPS2>90
CPS1>100; CPS2>90
Result Met - 164 Met - 165 Met - 152.91 Met - 171.78 Met - 162.18

FY 2015 DOE ANNUAL PERFORMANCE REPORT 122 | P a g e
Endpoint Target Ensure the integrity of the nation’s integrated grid by operating in compliance with National Energy Reliability Standards
Commentary on 2015 Results (Action Plan if Not Met)
CPS1 average: 162.18, CPS2 average: 87.9 Western control areas achieved a "Pass" rating for CPS1 and CPS2 during the 4th quarter of FY 2015. (Note: CPS2 compliance is currently waived to reflect participation in the WECC Reliability-based Control Trial.)
Documentation, Limitations, Methodology, Validation, and Verification
A balancing authority's (BA) ability to balance supply and demand is measured by its area control error (ACE), a real-time value that is continuously tracked in each BA's SCADA system. The NERC CPS establishes the statistical boundaries for ACE values, ensuring the system frequency is always within its scheduled value. CPS1 defines the permissible distribution of all ACE values in an interconnection, based on the expected frequency performance, and must be met 100 percent of the time. CPS2 limits the magnitude of the impact that a BA places on its respective interconnection and must be met at least 90 percent of the time. Per NERC standards, ACE values must be calculated and recorded at least every 4 seconds on a real-time basis. Documentation: NERC Control Performance Report.
Bonneville Power Administration
Bonneville Power Administration
The mission of Bonneville as a public service organization is to provide reliable and adequate power and transmission service at low rates for our customers and constituents in the Pacific Northwest and to mitigate impacts of the federal hydro system on fish and wildlife.
Program Bonneville Power Administration
Performance Goal (Measure) BPA Hydropower Generation Efficiency Performance - Achieve 97% Heavy-Load-Hour Availability HLHA through efficient performance of Federal hydro-system processes and assets, including joint efforts of BPA, Army Corps of Engineers, and Bureau of Reclamation. HLHA is actual machine capacity available during heavy-load hours (0700-2200 Monday-Saturday), divided by planned available capacity during heavy-load hours.
Fiscal Year 2011 2012 2013 2014 2015
Target ≥ 97.5 percent ≥ 97.5 percent ≥ 97.5 percent ≥ 97.5 percent ≥ 97.5 percent
Result Met - 100.6 Met - 102 Met - 102.3 Met - 100.7 Met - 100.6
Endpoint Target Maintain at least 97.5% Heavy-Load-Hour Availability
Commentary on 2015 Results (Action Plan if Not Met)
Target Met: Bonneville and its FCRPS partners met this operational goal for the hydropower system with a result of 100.6% through the end of the fourth quarter. Meeting this target demonstrates Bonneville's commitment and ability to provide reliable power to the region. By optimizing planned maintenance and taking into consideration expected forced outages, BPA's heavy load hour performance ensured that BPA had the system capacity to serve its system load.

FY 2015 DOE ANNUAL PERFORMANCE REPORT 123 | P a g e
Documentation, Limitations, Methodology, Validation, and Verification
Documented in the Quarterly Findings Memo (from BPA Chief Operating Officer to BPA Administrator).
Program Bonneville Power Administration
Performance Goal (Measure) BPA Repayment of Federal Power Investment - Meet planned annual repayment of principal on Federal power investments.
Fiscal Year 2011 2012 2013 2014 2015
Target ≥ 100 percent ≥ 100 percent ≥ 100 percent ≥ 100 percent 100 percent
Result Met - 100 Met - 100 Met - 100 Met - 100 Met - 100
Endpoint Target Continue to meet planned annual repayment of principal
Commentary on 2015 Results (Action Plan if Not Met)
Target Met: BPA made a total annual payment of $891 million of which $449 million was principal amortization. BPA met this performance target for the 32nd straight year, demonstrating Bonneville’s ongoing commitment to meeting its obligations to U.S. taxpayers.
Documentation, Limitations, Methodology, Validation, and Verification
Documented in the Quarterly Findings Memo (from BPA Chief Operating Officer to BPA Administrator).
Program Bonneville Power Administration
Performance Goal (Measure) BPA System Reliability Performance - NERC Rating - Attain average North American Reliability Council (NERC) compliance ratings for NERC Control Performance Standard 1 (CPS1) which measures generation/load balance on one-minute intervals (rating > or = 100).
Fiscal Year 2011 2012 2013 2014 2015
Target ≥ 100 CPS1 rating ≥ 100 CPS1 rating ≥ 100 CPS1 rating ≥ 100 CPS1 rating ≥ 100 percent
Result Met - 137.93 Met - 132.69 Met - 116.09 Met - 130.39 Met - 139.91
Endpoint Target Maintain CSP1 score of >= 100
Commentary on 2015 Results (Action Plan if Not Met)
Target Met: Through the end of the quarter, BPA achieved performance on CPS-1 of 139.91% against a target of no less than 100% (reported as a 12-month rolling average at the end of each quarter). Meeting this target demonstrates Bonneville's ongoing commitment and ability to provide reliable transmission for the region.
Documentation, Limitations, Methodology, Validation, and Verification
Documented in the Quarterly Findings Memo (from BPA Chief Operating Officer to BPA Administrator).