
Fuzzy-logic-based sensor fusion for mine and concealed weapon detection
11
Fuzzy logic based sensor fusion for mine and concealed weapon detection Thomas Meitzler a† , Darryl Bryk a , E.J. Sohn a , Kimberly Lane a , Jyoti Raj b , Harpreet Singh b a U.S. Army TACOM Survivability Technology Area Warren, MI, 48397-5000 b ECE Dept ,Wayne State University Detroit, MI ABSTRACT The use of near, mid wavelength and long wavelength infrared imagery for the detection of mines and concealed weapons is demonstrated using several techniques. The fusion algorithms used are wavelet based fusion and Fuzzy Logic Approach (FLA) fusion. The FLA is presented as one of several possible methods for combining images from different sensors for achieving an image that displays more information than either image separately. Metrics are suggested that could rate the fidelity of the fused images, such as, an entropy metric. 1. INTRODUCTION Even after the hostilities are over from an armed conflict, mines are still left buried under ground and armed. A requirement exists within the U.S. Army to develop technologies to detect and/or clear mine fields. There are several problems with existing sensor detection technologies, for example; there is no ‘silver bullet’ technology or sensor that detects all types of mines. Some sensors do not image well through wet soil, others have problems with a good signal to noise or clutter ratio, the scanning time of the sensors is usually slow and technologies are not suited well suited for wide area searching. Sensor fusion offers a way to improve the signal-to-clutter ratio by combing the images from several wave bands. The same algorithms that are used for fusion of multiband imagery for mine detection can also be used for the purpose of concealed weapon detection. As is the case of mine detection, concealed weapon detection ideally should be reliable and fast, however, as with any imaging and detection technology, there are tradeoffs to consider that involve technical as well as social issues. Portability and imaging speed place constraints on the size and resolution of sensors and the computer systems that are used to control the imaging devices for both mine detection and concealed weapon detection. The authors have obtained infrared images of buried mines from sensors in several wavelength regimes and describe in this paper the fusion of multiband infrared images. Combined with the afore mentioned images, the authors have tested several computational methods to combine and enhance the images from the sensors, such as wavelet edge processing, fuzzy logic fusion, Gaussian Laplacian pyramid fusion, and others. The advantages of using the infrared band for mine detection are the following: infrared can detect both surface and buried mines, images can be obtained through wet soil, there is shape-based discrimination possible and that can be enhanced with wavelets, and can be obtained at night. Disadvantages are mines buried for a long time loose thermal contrast, damp weather can also reduce contrast and there is the problem of clutter due to debris in the imaging area. 12 † For further information, contact Dr. Thomas Meitzler, [email protected]
-
Upload
independent -
Category
Documents
-
view
0 -
download
0
Transcript of Fuzzy-logic-based sensor fusion for mine and concealed weapon detection

Fuzzy logic based sensor fusion for mine and concealed weapon detection
Thomas Meitzler a†, Darryl Bryk a, E.J. Sohn a, Kimberly Lane a,
Jyoti Raj b , Harpreet Singh b
aU.S. Army TACOM Survivability Technology Area
Warren, MI, 48397-5000
b ECE Dept ,Wayne State University Detroit, MI
ABSTRACT The use of near, mid wavelength and long wavelength infrared imagery for the detection of mines and concealed weapons is demonstrated using several techniques. The fusion algorithms used are wavelet based fusion and Fuzzy Logic Approach (FLA) fusion. The FLA is presented as one of several possible methods for combining images from different sensors for achieving an image that displays more information than either image separately. Metrics are suggested that could rate the fidelity of the fused images, such as, an entropy metric.
1. INTRODUCTION Even after the hostilities are over from an armed conflict, mines are still left buried under ground and armed. A requirement exists within the U.S. Army to develop technologies to detect and/or clear mine fields. There are several problems with existing sensor detection technologies, for example; there is no ‘silver bullet’ technology or sensor that detects all types of mines. Some sensors do not image well through wet soil, others have problems with a good signal to noise or clutter ratio, the scanning time of the sensors is usually slow and technologies are not suited well suited for wide area searching. Sensor fusion offers a way to improve the signal-to-clutter ratio by combing the images from several wave bands. The same algorithms that are used for fusion of multiband imagery for mine detection can also be used for the purpose of concealed weapon detection. As is the case of mine detection, concealed weapon detection ideally should be reliable and fast, however, as with any imaging and detection technology, there are tradeoffs to consider that involve technical as well as social issues. Portability and imaging speed place constraints on the size and resolution of sensors and the computer systems that are used to control the imaging devices for both mine detection and concealed weapon detection. The authors have obtained infrared images of buried mines from sensors in several wavelength regimes and describe in this paper the fusion of multiband infrared images. Combined with the afore mentioned images, the authors have tested several computational methods to combine and enhance the images from the sensors, such as wavelet edge processing, fuzzy logic fusion, Gaussian Laplacian pyramid fusion, and others. The advantages of using the infrared band for mine detection are the following: infrared can detect both surface and buried mines, images can be obtained through wet soil, there is shape-based discrimination possible and that can be enhanced with wavelets, and can be obtained at night. Disadvantages are mines buried for a long time loose thermal contrast, damp weather can also reduce contrast and there is the problem of clutter due to debris in the imaging area.12
† For further information, contact Dr. Thomas Meitzler, [email protected]

2. METHOD
The images were combined by using either the MATLAB Fuzzy Inference System (FIS) combined with the fuzzy logic approach (FLA) or the FuseTool interface. In his book Multi-Sensor Fusion 1, Brooks points out that fuzzy logic is a technology that shows “promise for use with sensor problems.” He goes on to mention, however, that because of the numerous forms of membership functions, methods of recombination, etc., it is difficult to know exactly which implementation is best suited for use in sensor fusion technology. The fuzzy logic approach to image fusion algorithm is described as one option for fusion below. Future papers will define and compare other methods and algorithms for image fusion. A great deal of interest has been shown in the Fuzzy Logic Approach (FLA) during the last three decades for numerous technical areas 2, 3, 4, 5, 6. A strong point of the FLA is that it permits the encoding of expert knowledge directly and easily using rules with linguistic labels. A weak point is that it usually takes some time to design and tune the membership functions that quantitatively define the parameters of interest. To enable a system or process to deal with system level uncertainties, researchers have incorporated the concept of fuzzy logic into many control systems. It has been found that artificial neural network learning techniques can automate this process and substantially reduce development time while improving performance 5. In this paper, one of the techniques that the authors demonstrate sensor fusion for is the purpose of mine detection using the FLA. The basic algorithm for pixel level image fusion using the fuzzy logic approach is;
• Read first image in variable i1 and find its size (rows: z1, columns: s1). • Read second image in variable i2 and find its size (rows: z2, columns: s2). • Variables i1 and i2 are images in matrix form where each pixel value is in the range from 0-255. Use gray
color map. • Compare rows and columns of both input images, starting from the upper left. If the two images are not of
the same size, select the portions which are of same size. • Convert the images in column form which has C= z1*s1 entries. • Make a Fuzzy Inference System file which has two input images, (See Fig.’s 1 and 2). • Decide the number and type of membership functions for both the input images by adjusting the
membership functions. Input images in antecedent are resolved to a degree of membership between 0 to 255.
• Make rules for two input images which resolves the two antecedents to a single number from 0 to 255. • For num=1 to C in steps of one, apply fuzzification using the rules developed above on the corresponding
pixel values of the input images which gives a fuzzy set represented by a membership function and results in output image in column format.
• Convert the column form to matrix form and display the fused image.
Fig. 1: Mamdani FLA FIS Fig. 2: Mamdani MF’s

Fig.’s 1 through 4 show the various MATLAB interfaces that are generated as part of the FLA. Fig. 1 is the interface picture showing that the Mamdani approach with two input variables representing two wavebands is to be used. Fig. 2 indicates the use of Gaussian Membership functions to model the interaction of the two waveband inputs. Fig. 3 below shows the firing of the membership functions over the prescribed input wavelength ranges and Fig, 4 below shows the resulting 3D image.
Fig. 3: FIS firing diagram Fig. 4: FIS output surface
3. WAVELET ENHANCEMENT OF FUSED IMAGES Fusion of imagery usually brings more information to the observer. The information content can be increased if some kind of image processing is added to the fused images; for example edge enhancement or histogram stretching. One method used by the authors to enhance the image is wavelet processing of the images. A fairly old method of computing a local spectrum is to apply the Fourier Transform (FT) to one specific piece of the signal at a time. This is the idea behind what is called the Windowed Fourier Transform (WFT). Basically, the implementation involves using a rectangular window to isolate a portion of the signal of interest, which is then Fourier transformed. As the window slides along to different positions, the WFT gives the spectra at these positions. This kind of analysis has a fundamental problem however, whose mathematics is similar to the Heisenberg Uncertainty Principle in Quantum Mechanics (QM). Multiplying the signal by a window function results in convolving or mixing the signal spectrum with the spectrum of the window. Add this to the fact that as the window gets smaller, its spectrum gets wider, and we have the basic dilemma of localized spectra: the better we determine the position of the signal, the poorer we localize the spectrum. This is analogous to the case in QM where increased precision in a description of say the momentum of an electron reduces the precision available of the position of that electron. Very accurate determinations can be made or computed, but both are not available to an unlimited degree of precision. Correspondingly, there is a fundamental physical limit to the degree of precision of the frequency content of a signal at a particular position [7,8]. In 1946 Dennis Gabor [8,9] introduced a version of the WFT that reduced this uncertainty somewhat. The Gabor transform uses a Gaussian profile for the window since the Gaussian is the function that minimizes this uncertainty. However, the underlying idea of localizing a spectrum of a signal by windowing the signal needs to be reconsidered. Obviously, care must be taken in the selection of the signal. Careful attention to the placement of the window however is not an easy task for realistic time-varying signals. We are in fact trying to do two different things at

once. Frequency is a measure of cycles per unit time or signal length. So that high frequency oscillations take much less signal length or time than do low frequency oscillations. High frequencies can be well localized in the overall signal with a short window, but low frequency localization requires a long window. The wavelet transform takes an approach that permits the window size to scale to the particular frequency components being analyzed. The basic flow of processing in wavelet analysis is shown below in Fig. 5:
raw data wavelet decomposition
threshold wavelet compression
processed data
Fig. 5: Wavelet processing flow diagram
4. IMAGES The figures below are samples of the raw input images from the infrared sensors. Fig. 6 is the mid-wavelength IR image and Fig. 7 is the long-wavelength IR image of a minefield with buried mines. Fig’s 8 and 9 are the fused images of the two infrared bands using the approach of contrast enhancement and fuzzy logic respectively. Fig.’s 10, 11 and 12 are the separate mid and long wavelength band and fused images of a different minefield.
Fig. 6: amber_mwr Fig. 7: thermovision1000

Fig. 8: fused_fusetool_contrast Fig. 9: fuzed_fuzzy
Fig. 10 daytime IR
Fig. 11: nighttime IR

Fig. 12: fusetool_maximum A program was written to take the input of two or more sensors and then build a map of the mine location using the also using the FLA. The image in Fig. 13 is just a ‘dummy’ image in the sense that it was generated with synthetic sensor data, however, the idea is evident. The purpose of the image is to demonstrate the potential capability such a fuzzy based detection system could have. See Appendix 1 for the code.
Fig. 13: Output of mine detection program

Fig. 14: visual image11 Fig. 15: passive mmwave 11 Fig. 16: FLA fused Fig.’s 14, 15 and 16, show the imaging of a concealed weapon with passive millimeter-wave (mmwave). 11 Passive millimeter-wave forms an image from the radiation emitted from the body by virtue of it’s temperature, no additional incident radiation is needed. The image in Fig. 16 is fused using a Fuzzy Logic Approach (FLA) fusion algorithm to segment the location of the handgun. The visual image in Fig. 14 is fused with the mmwave image in Fig. 15. An entropy and texture based clutter metric were run over the images to see if there was a correlation of the visual quality of the fused imagery with the metrics. The entropy of an image is a measure of the information content, in terms of gray scale levels and is also related to the texture of the image. The maximum value the entropy metric can take on is eight and the minimum is zero. The equation used for the calculation of the entropy [10] is shown below,
L-1H= - ( ) log ( )2g=0
wherep(g)is the probability of gray value g, and the range of g is [0,...,L-1].
p g p g∑
5. CONCLUSIONS
In summary, the authors have shown some of the sensor combinations and algorithms that can be combined to detect buried mines and concealed weapons. Which sensors are used is going to be determined by factors such as cost, false alarm rate, and detector material costs. Using passive infrared and or millimeter-wave multiband imagery with sensor fusion and edge enhancement it is possible, in some circumstances, to detect buried mines and weapons concealed under clothing. When imaging through thick layers and a high degree of resolution is required, the best sensor may be active millimeter-wave imagers, however, this capability brings with it greater cost. The authors have shown some of the imaging possibilities using passive infrared imagery and millimeter-wave wave images. Future research could show how the passive infrared sensors used with image fusion and processing algorithms can detect buried mines in cluttered fields and concealed weapons such as handguns.

REFERENCES [1.]. R. Brooks, S. Iyengar, Multi-Sensor Fusion: Fundamentals and Applications with Software, Prentice Hall PTR, Upper Saddle River, N. J., p. 167, 1997 [2]. L. Zadeh, "Fuzzy Sets", Information and Control", 8, pp. 338-353, 1965. [3]. E. Mamdani and S. Assilian, "Applications of fuzzy algorithms for control of simple dynamic plant", Proc. Inst. Elec. Eng., Vol. 121, pp. 1585-1588, 1974. [4]. T. Munakata, and Y. Jani, "Fuzzy Systems: An Overview", Commun., ACM, Vol. 37, No. 3, pp. 69-76, Mar. 1994. [5]. E. Cox, The Fuzzy Systems Handbook: A Practitioner's Guide to Building, Using, and Maintaining Fuzzy Systems, AP Professional, 1994. [6]. D. Schwartz, G. Klir, H. Lewis, and Y. Ezawa, "Applications of Fuzzy Sets and Approximate Reasoning", IEEE Proc., Vol. 82, No. 4, pp. 482-498, Apr. 1994. [7]. T. Meitzler, and H. Singh, “Extension of 2-D wavelet transforms of images to 3-D transforms and their applications,” IEEE Transactions on Aerospace and Electronic Systems, Vol. 34, (3), p. 963, July, 1998. [8]. M. Freeman, “Wavelets-signal representations with important advantages,” Optics and Photonic News, 4, 8 (Aug. 1993), pp. 8-14. [9]. B. Vidakovic, and P. Muller, Wavelets for kids, Durham, N.C., Duke University [10]. Y. Wang, B. Lohmann, “Multisensor Image Fusion: Concept, Method and Applications,” Internet source. [11]. [email protected], D. Wikner, Army Research Laboratory, Millimeter-wave Branch, 301-394-0865. [12]. J. Ackenson, Q. Holmes, C. King, and J. Wright, Detection of Mines and Minefields, IRIA, Veridian Systems Division, Nov. 2001.
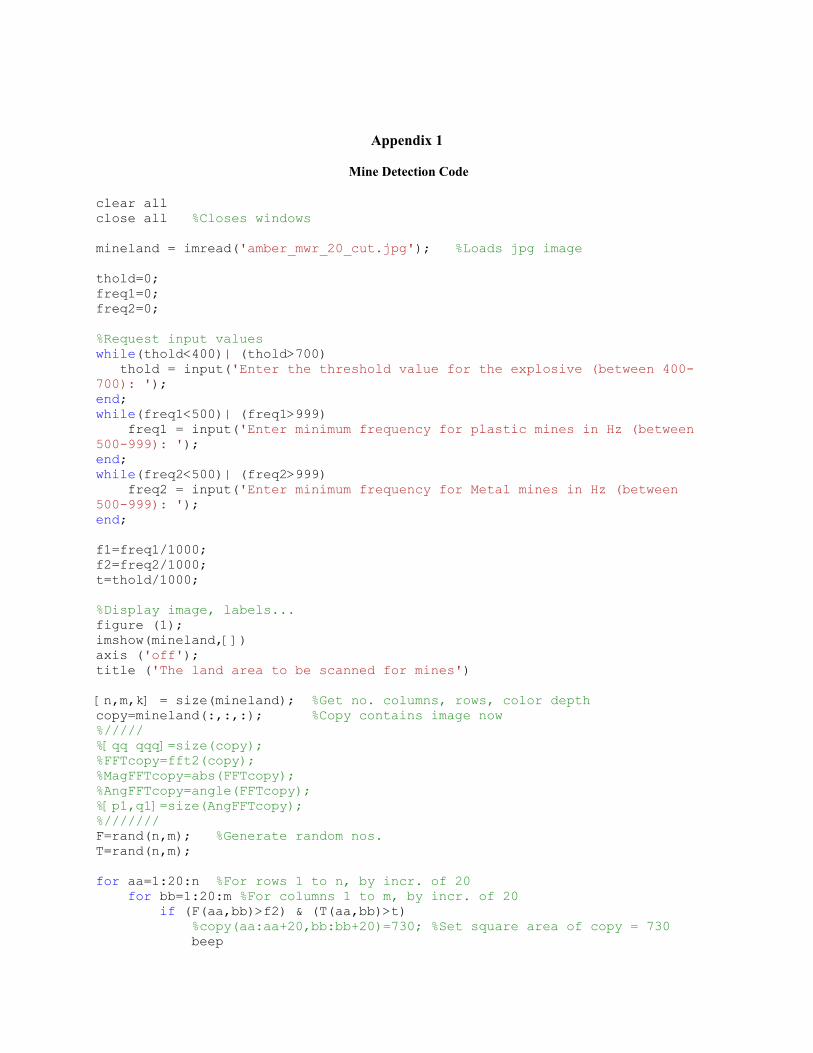
Appendix 1
Mine Detection Code
clear all close all %Closes windows mineland = imread('amber_mwr_20_cut.jpg'); %Loads jpg image thold=0; freq1=0; freq2=0; %Request input values while(thold<400)| (thold>700) thold = input('Enter the threshold value for the explosive (between 400-700): '); end; while(freq1<500)| (freq1>999) freq1 = input('Enter minimum frequency for plastic mines in Hz (between 500-999): '); end; while(freq2<500)| (freq2>999) freq2 = input('Enter minimum frequency for Metal mines in Hz (between 500-999): '); end; f1=freq1/1000; f2=freq2/1000; t=thold/1000; %Display image, labels... figure (1); imshow(mineland,[]) axis ('off'); title ('The land area to be scanned for mines') [n,m,k] = size(mineland); %Get no. columns, rows, color depth copy=mineland(:,:,:); %Copy contains image now %///// %[qq qqq]=size(copy); %FFTcopy=fft2(copy); %MagFFTcopy=abs(FFTcopy); %AngFFTcopy=angle(FFTcopy); %[p1,q1]=size(AngFFTcopy); %/////// F=rand(n,m); %Generate random nos. T=rand(n,m); for aa=1:20:n %For rows 1 to n, by incr. of 20 for bb=1:20:m %For columns 1 to m, by incr. of 20 if (F(aa,bb)>f2) & (T(aa,bb)>t) %copy(aa:aa+20,bb:bb+20)=730; %Set square area of copy = 730 beep

beep %pause(1) %p=p+1; elseif (F(aa,bb)>f1) & (T(aa,bb)>t) copy(aa:aa+20,bb:bb+20)=0; %Set square area of copy = 0 beep %pause(1) %m=m+1; end pause(0.00005) %imshow(copy); warp(copy); %Redisplays image w/texture(?) title ('Scanning for Mines') xlabel('East'); ylabel('North'); %legend('plastic mines'); %legend('metal mines'); %imshow(copy,[]); end end title('Mines detected'); ____________________________________________________________________________ % Mfile for Fuzzy Logic Detection of Mines clear all close all mineland = imread('.\images\land.jpg'); [n,m,k] = size(mineland); copy=mineland(:,:,:); img=mineland(:,:,:); figure (1); imshow(copy); % Displays the original image Threshold = (double(copy)*2); % Supposed Input Threshold Frequency = (double(copy) * 4); % Supposed Input Frequency f=readfis('mine.fis'); im=evalfis([Threshold(:) Frequency(:)],f); % evaluates the .fis file for the given inputs 'Threshold' and 'Frequency' % The following loop handles the display of the mines detected in the specific land area. for j=1:20:m for i=1:20:n p=(j-1)*m + i; if (im(p)>0.3100)&(im(p) < 0.4) img(i:i+20,j:j+20)=30; beep elseif im(p) > 0.4 img(i:i+20,j:j+20)=450; beep end end end