Future virialized structures: an analysis of superstructures in ...
13
Mon. Not. R. Astron. Soc. 415, 964–976 (2011) doi:10.1111/j.1365-2966.2011.18794.x Future virialized structures: an analysis of superstructures in the SDSS-DR7 H. Luparello, 1 M. Lares, 1 D. G. Lambas 1 and N. Padilla 2 1 Instituto de Astronom´ ıa Te´ orica y Experimental (CONICET-UNC), Observatorio Astron´ omico de C ´ ordoba, Laprida 854, X5000BGR, C´ ordoba, Argentina 2 Departamento de Astronom´ ıa y Astrof´ ısica, Pontificia Universidad Cat´ olica de Chile, Santiago, Chile Accepted 2011 March 24. Received 2011 March 22; in original form 2011 January 7 ABSTRACT We construct catalogues of present superstructures that, according to a cold dark matter (CDM) scenario, will evolve into isolated, virialized structures in the future. We use a smoothed luminosity density map derived from galaxies in SDSS-DR7, Abazajian et al., data and separate high-luminosity density peaks. The luminosity density map is obtained from a volume-limited sample of galaxies in the spectroscopic galaxy catalogue, within the SDSS- DR7 footprint area and in the redshift range 0.04 < z < 0.12. Other two samples are constructed for calibration and testing purposes, up to z = 0.10 and 0.15. The luminosity of each galaxy is spread using an Epanechnikov kernel of 8 Mpc h −1 radius, and the map is constructed on a 1 Mpc h −1 cubic cell grid. Future virialized structures (FVSs) are identified as regions with overdensity above a given threshold, calibrated using a CDM numerical simulation and the criteria presented by D ¨ unner et al. We assume a constant mass-to-luminosity ratio and impose the further condition of a minimum luminosity of 10 12 L . According to our calibrations with a numerical simulation, these criteria lead to a negligible contamination by less overdense (non-FVS) superstructures. We present a catalogue of superstructures in the SDSS-DR7 area within redshift 0.04 < z < 0.12 and test the reliability of our method by studying different subsamples as well as a mock catalogue. We compute the luminosity and volume distributions of the superstructures, finding that about 10 per cent of the luminosity (mass) will end up in future virialized structures. The fraction of groups and X-ray clusters in these superstructures is higher for groups/clusters of higher mass, suggesting that future cluster mergers will involve the most massive systems. We also analyse known structures in the present Universe and compare with our catalogue of FVSs. Key words: methods: data analysis – methods: statistical – catalogues – large-scale structure of Universe. 1 INTRODUCTION Structures in the universe are the result of a hierarchical process of accretion dominated, in almost all scales and during almost their en- tire history, by gravity. The first attempt to investigate the evidence for the existence of the so-called second-order clusters of galaxies was made by Shapley (1961), although there had been previous sug- gestions of the presence of large structures. Shapley & Ames (1930) suggested the presence of a large galaxy system in the Coma–Virgo region. Also, conglomerates composed by several clusters of galax- ies observed in plates of the Lick Astrographic Survey were reported by Shane & Wirtanen (1954) and Shane (1956). By analysing the distribution of rich clusters identified on the National Geographic Society – Palomar Observatory Sky Survey, Abell pointed out that E-mail: [email protected] the clusters did not appear to be distributed randomly over the sky, but forming associations of matter on greater scales. Different au- thors adopted different methods to search for groups of clusters and the term supercluster became widely used. Abell used counts in cells to statistically test the distribution of clusters and endorsed the existence of superclusters of the order of 50 h −1 Mpc in size. The first attempts to study superclusters on a statistical basis were made by linking Abell cluster positions (Zucca et al. 1993; Einasto et al. 1997). Later, the accomplishment of wide-area surveys of galaxies with spectroscopic follow-up, such as the Las Campanas Redshift Survey (Shectman et al. 1996), the 2-degree Field Galaxy Redshift Survey (2dFGRS, Colless et al. 2001) and the Sloan Digital Sky Sur- vey (SDSS, Stoughton et al. 2002), allowed for the identification of superclusters directly from the large-scale galaxy distribution. Einasto et al. (2007b) identified superclusters in the 2dFGRS using a density field method, and recently Costa-Duarte, Sodr´ e & Durret (2011) studied the morphology of superclusters of galaxies in the C 2011 The Authors Monthly Notices of the Royal Astronomical Society C 2011 RAS Downloaded from https://academic.oup.com/mnras/article/415/1/964/990139 by guest on 01 April 2022
-
Upload
khangminh22 -
Category
Documents
-
view
4 -
download
0
Transcript of Future virialized structures: an analysis of superstructures in ...
Mon. Not. R. Astron. Soc. 415, 964–976 (2011) doi:10.1111/j.1365-2966.2011.18794.x
Future virialized structures: an analysis of superstructuresin the SDSS-DR7
H. Luparello,1� M. Lares,1 D. G. Lambas1 and N. Padilla2
1Instituto de Astronomıa Teorica y Experimental (CONICET-UNC), Observatorio Astronomico de Cordoba, Laprida 854, X5000BGR, Cordoba, Argentina2Departamento de Astronomıa y Astrofısica, Pontificia Universidad Catolica de Chile, Santiago, Chile
Accepted 2011 March 24. Received 2011 March 22; in original form 2011 January 7
ABSTRACTWe construct catalogues of present superstructures that, according to a � cold dark matter(�CDM) scenario, will evolve into isolated, virialized structures in the future. We use asmoothed luminosity density map derived from galaxies in SDSS-DR7, Abazajian et al., dataand separate high-luminosity density peaks. The luminosity density map is obtained from avolume-limited sample of galaxies in the spectroscopic galaxy catalogue, within the SDSS-DR7 footprint area and in the redshift range 0.04 < z < 0.12. Other two samples are constructedfor calibration and testing purposes, up to z = 0.10 and 0.15. The luminosity of each galaxyis spread using an Epanechnikov kernel of 8 Mpc h−1 radius, and the map is constructed ona 1 Mpc h−1 cubic cell grid. Future virialized structures (FVSs) are identified as regions withoverdensity above a given threshold, calibrated using a �CDM numerical simulation and thecriteria presented by Dunner et al. We assume a constant mass-to-luminosity ratio and imposethe further condition of a minimum luminosity of 1012 L�. According to our calibrations witha numerical simulation, these criteria lead to a negligible contamination by less overdense(non-FVS) superstructures. We present a catalogue of superstructures in the SDSS-DR7 areawithin redshift 0.04 < z < 0.12 and test the reliability of our method by studying differentsubsamples as well as a mock catalogue. We compute the luminosity and volume distributionsof the superstructures, finding that about 10 per cent of the luminosity (mass) will end up infuture virialized structures. The fraction of groups and X-ray clusters in these superstructuresis higher for groups/clusters of higher mass, suggesting that future cluster mergers will involvethe most massive systems. We also analyse known structures in the present Universe andcompare with our catalogue of FVSs.
Key words: methods: data analysis – methods: statistical – catalogues – large-scale structureof Universe.
1 IN T RO D U C T I O N
Structures in the universe are the result of a hierarchical process ofaccretion dominated, in almost all scales and during almost their en-tire history, by gravity. The first attempt to investigate the evidencefor the existence of the so-called second-order clusters of galaxieswas made by Shapley (1961), although there had been previous sug-gestions of the presence of large structures. Shapley & Ames (1930)suggested the presence of a large galaxy system in the Coma–Virgoregion. Also, conglomerates composed by several clusters of galax-ies observed in plates of the Lick Astrographic Survey were reportedby Shane & Wirtanen (1954) and Shane (1956). By analysing thedistribution of rich clusters identified on the National GeographicSociety – Palomar Observatory Sky Survey, Abell pointed out that
�E-mail: [email protected]
the clusters did not appear to be distributed randomly over the sky,but forming associations of matter on greater scales. Different au-thors adopted different methods to search for groups of clusters andthe term supercluster became widely used. Abell used counts incells to statistically test the distribution of clusters and endorsed theexistence of superclusters of the order of 50 h−1 Mpc in size. Thefirst attempts to study superclusters on a statistical basis were madeby linking Abell cluster positions (Zucca et al. 1993; Einasto et al.1997). Later, the accomplishment of wide-area surveys of galaxieswith spectroscopic follow-up, such as the Las Campanas RedshiftSurvey (Shectman et al. 1996), the 2-degree Field Galaxy RedshiftSurvey (2dFGRS, Colless et al. 2001) and the Sloan Digital Sky Sur-vey (SDSS, Stoughton et al. 2002), allowed for the identificationof superclusters directly from the large-scale galaxy distribution.Einasto et al. (2007b) identified superclusters in the 2dFGRS usinga density field method, and recently Costa-Duarte, Sodre & Durret(2011) studied the morphology of superclusters of galaxies in the
C© 2011 The AuthorsMonthly Notices of the Royal Astronomical Society C© 2011 RAS
Dow
nloaded from https://academ
ic.oup.com/m
nras/article/415/1/964/990139 by guest on 01 April 2022
Future virialized structures 965
SDSS. The largest catalogue of superclusters has been constructedby Liivamagi, Tempel & Saar (2010) who implemented the densityfield method on the SDSS-DR7 main and luminous red galaxies(LRG) samples. In all cases, superclusters are operationally definedas objects within a region of positive galaxy density contrast andthus are subject to a certain degree of arbitrariness in the parameterselection.
Within the � cold dark matter (�CDM) concordance cosmo-logical model, an accelerated expansion dominates the present andfuture dynamics of the universe and thus determines the nature ofgravitationally bound structures. Therefore, an alternative definitionof these large-scale structures may be derived from the propertiesof overdense regions in the present-day universe that will becomebound and virialized structures in the future. Thus, under the as-sumption that luminosity is a somewhat unbiased tracer of mass onlarge scales, the integrated luminosity density of galaxies is com-monly used as an indicator of mass density.
The cosmological evolution of the large-scale structure has im-plications on the spatial distribution, frequency and properties ofsuperclusters and the galaxies they contain. Due to this relationship,superclusters can be used as cosmological probes, and their studyis oriented to constrain models and describe the formation of su-perstructures on a cosmological scale. Supercluster properties havebeen used to discriminate between cosmological models, favouringthe standard cosmological model in most cases (Basilakos, Plionis& Rowan-Robinson 2001; Peacock et al. 2001). On the other hand,there are claims of structures that are too massive or formed tooearly according to the standard model (Baugh et al. 2004).
First attempts to determine the characteristic scales of spatialinhomogeneities in the universe were made by Broadhurst et al.(1990) and Einasto et al. (1994). By studying the distribution of richclusters of galaxies from the Abell-ACO catalogue, Einasto et al.(1994) confirmed a 110–140 h−1 Mpc scale in the supercluster–voidnetwork. Given the observed regular pattern of superclusters andvoids, Frisch et al. (1995) investigated the properties of the initialpower spectrum giving rise to these large-scale fluctuations. Theauthors found that the supercluster–supervoid network forms at avery early stage of the evolution of the Universe from large-scaledensity fluctuations and are defined by the scale of the maximumof the power spectrum.
The large-scale structure of the universe is often described as asupercluster–void network (Shandarin, Sheth & Sahni 2004), andsuperclusters are closely related to filaments (Gonzalez & Padilla2010; Murphy, Eke & Frenk 2011) and voids (Icke 1984; Einasto,Saar & Klypin 1986; Einasto et al. 1997; Park & Lee 2007; Platen,van de Weygaert & Jones 2008). Such filaments may also play an im-portant role in the process of structure formation. Porter et al. (2008)find that star formation is significantly enhanced when galaxies fallinto clusters along supercluster filaments. Superclusters have alsobeen studied as hosts of Lyα absorbers (Stocke et al. 1995; Penton,Stocke & Shull 2002) and are known to produce signatures in thecosmic background radiation (Dolag et al. 2005; Genova-Santoset al. 2008; Flores-Cacho et al. 2009; Granett, Neyrinck & Szapudi2009; Genova-Santos et al. 2010).
The aim of this work is to present and analyse catalogues ofsuperstructures that will evolve into virialized systems. Using thetheoretical framework of Dunner et al. (2006) in a �CDM scenarioand by calibration with numerical simulations, we analyse volume-limited samples of galaxies from the SDSS-DR7.
This paper is organized as follows. In Section 2, we describethe data used in the computation of the density field. The method-ological description of the procedures implemented to obtain the
catalogue of future virialized structures (hereinafter FVSs) is ad-dressed in Section 3, along with a brief description of the previousmethodology employed in the search for superclusters. The cata-logue of FVSs is presented in Section 4, where we also discuss someof their properties. In Section 5, we compare known superclusterswith our identified structures and in Section 6 we study the fre-quency of clusters and groups of galaxies in FVSs. Our conclusionsare summarized in Section 8. Throughout this paper, we adopt aconcordance cosmological model (�� = 0.75, �matter = 0.25) inthe calculation of distances.
2 DATA A ND SAMPLES
Since FVSs are extended regions of several tens of Mpc in size,a large volume of space has to be surveyed in order to sample arepresentative population of these objects. The SDSS (Stoughtonet al. 2002) is the largest photometric and spectroscopic surveycarried out so far, covering an area of almost a quarter of the skywith a limiting magnitude that makes the construction of completesamples of several hundred Mpc possible. Several catalogues havebeen made public by successive releases since the Early Data Re-lease (Stoughton et al. 2002). The latest release of the spectroscopiccatalogue (DR7, Abazajian et al. 2009) comprises 929 555 galaxyspectra within a footprint area of 9380 deg2. The limiting apparentmagnitude for the spectroscopic catalogue in the r band is 17.77(Strauss et al. 2002), although we use a more conservative limit of17.5 to ensure completeness. We also limit the sample to galaxiesfainter than r = 14.5, since saturation effects in the photometricpipeline do not secure completeness below that limit. These limitswere adopted taking into account the analysis of the image qualityand efficiency detection of the SDSS.1
Given the dependence of the luminosity density field on the sam-ple of galaxies, we define three complete samples, with differentcuts in luminosity (Table 1). The closest sample comprises galaxiesbrighter than Mr = −20.5 up to z = 0.1. This is the sample withthe faintest luminosity limit, and it will be mainly used to explorethe effects of the luminosity cut in the detection of superstructures.This sample will be referred to as S1 and their characteristics aresummarized in Table 1. A larger volume-limited sample, referred toas S3, contains all galaxies brighter than Mr = −21.0 to z ≤ 0.15.An intermediate-redshift sample in the range 0.04 < z < 0.12 com-prises 89 513 galaxies. This sample, S2, containing galaxies withMr < −20.47 will be analysed into detail in Sections 4–6.
In order to test procedures and results, we use the Millen-nium numerical simulation (Springel et al. 2005) of a �CDMconcordance model, performed on a cubic box of 500 h−1 Mpcside. A semi-analytic model of galaxy formation (GALFORM, Bower,McCarthy & Benson 2008) collects information from the mergertrees extracted from the simulation and generates a population ofgalaxies within the simulation box. We use the semi-analytic galaxycatalogue in the full box of the simulation to test and set the param-eters involved in the identification of FVSs. We constructed a mockcatalogue from the semi-analytic galaxies by following the geom-etry of the SDSS-DR7 footprint area and reproducing the dilutionin the number of galaxies with redshift. In order to test the effectof peculiar velocities in the identification of FVSs, we defined asample of galaxies in real,space, MRsp, and a sample of galaxies inredshift space, MZsp, also described in Table 1.
1 http://www.sdss.org/dr7/products/general/target_quality.html
C© 2011 The Authors, MNRAS 415, 964–976Monthly Notices of the Royal Astronomical Society C© 2011 RAS
Dow
nloaded from https://academ
ic.oup.com/m
nras/article/415/1/964/990139 by guest on 01 April 2022
966 H. Luparello et al.
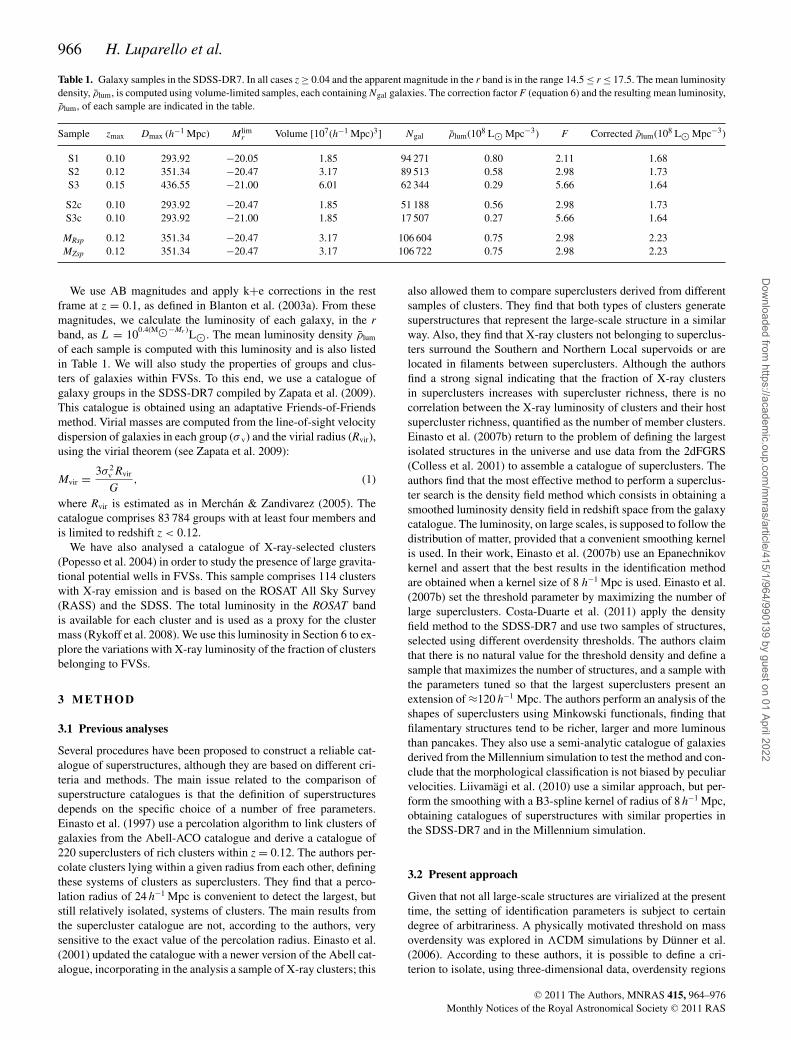
Table 1. Galaxy samples in the SDSS-DR7. In all cases z ≥ 0.04 and the apparent magnitude in the r band is in the range 14.5 ≤ r ≤ 17.5. The mean luminositydensity, ρlum, is computed using volume-limited samples, each containing Ngal galaxies. The correction factor F (equation 6) and the resulting mean luminosity,ρlum, of each sample are indicated in the table.
Sample zmax Dmax (h−1 Mpc) Mlimr Volume [107(h−1 Mpc)3] Ngal ρlum(108 L� Mpc−3) F Corrected ρlum(108 L� Mpc−3)
S1 0.10 293.92 −20.05 1.85 94 271 0.80 2.11 1.68S2 0.12 351.34 −20.47 3.17 89 513 0.58 2.98 1.73S3 0.15 436.55 −21.00 6.01 62 344 0.29 5.66 1.64
S2c 0.10 293.92 −20.47 1.85 51 188 0.56 2.98 1.73S3c 0.10 293.92 −21.00 1.85 17 507 0.27 5.66 1.64
MRsp 0.12 351.34 −20.47 3.17 106 604 0.75 2.98 2.23MZsp 0.12 351.34 −20.47 3.17 106 722 0.75 2.98 2.23
We use AB magnitudes and apply k+e corrections in the restframe at z = 0.1, as defined in Blanton et al. (2003a). From thesemagnitudes, we calculate the luminosity of each galaxy, in the rband, as L = 100.4(M�−Mr )L�. The mean luminosity density ρlum
of each sample is computed with this luminosity and is also listedin Table 1. We will also study the properties of groups and clus-ters of galaxies within FVSs. To this end, we use a catalogue ofgalaxy groups in the SDSS-DR7 compiled by Zapata et al. (2009).This catalogue is obtained using an adaptative Friends-of-Friendsmethod. Virial masses are computed from the line-of-sight velocitydispersion of galaxies in each group (σ v) and the virial radius (Rvir),using the virial theorem (see Zapata et al. 2009):
Mvir = 3σ 2v Rvir
G, (1)
where Rvir is estimated as in Merchan & Zandivarez (2005). Thecatalogue comprises 83 784 groups with at least four members andis limited to redshift z < 0.12.
We have also analysed a catalogue of X-ray-selected clusters(Popesso et al. 2004) in order to study the presence of large gravita-tional potential wells in FVSs. This sample comprises 114 clusterswith X-ray emission and is based on the ROSAT All Sky Survey(RASS) and the SDSS. The total luminosity in the ROSAT bandis available for each cluster and is used as a proxy for the clustermass (Rykoff et al. 2008). We use this luminosity in Section 6 to ex-plore the variations with X-ray luminosity of the fraction of clustersbelonging to FVSs.
3 ME T H O D
3.1 Previous analyses
Several procedures have been proposed to construct a reliable cat-alogue of superstructures, although they are based on different cri-teria and methods. The main issue related to the comparison ofsuperstructure catalogues is that the definition of superstructuresdepends on the specific choice of a number of free parameters.Einasto et al. (1997) use a percolation algorithm to link clusters ofgalaxies from the Abell-ACO catalogue and derive a catalogue of220 superclusters of rich clusters within z = 0.12. The authors per-colate clusters lying within a given radius from each other, definingthese systems of clusters as superclusters. They find that a perco-lation radius of 24 h−1 Mpc is convenient to detect the largest, butstill relatively isolated, systems of clusters. The main results fromthe supercluster catalogue are not, according to the authors, verysensitive to the exact value of the percolation radius. Einasto et al.(2001) updated the catalogue with a newer version of the Abell cat-alogue, incorporating in the analysis a sample of X-ray clusters; this
also allowed them to compare superclusters derived from differentsamples of clusters. They find that both types of clusters generatesuperstructures that represent the large-scale structure in a similarway. Also, they find that X-ray clusters not belonging to superclus-ters surround the Southern and Northern Local supervoids or arelocated in filaments between superclusters. Although the authorsfind a strong signal indicating that the fraction of X-ray clustersin superclusters increases with supercluster richness, there is nocorrelation between the X-ray luminosity of clusters and their hostsupercluster richness, quantified as the number of member clusters.Einasto et al. (2007b) return to the problem of defining the largestisolated structures in the universe and use data from the 2dFGRS(Colless et al. 2001) to assemble a catalogue of superclusters. Theauthors find that the most effective method to perform a superclus-ter search is the density field method which consists in obtaining asmoothed luminosity density field in redshift space from the galaxycatalogue. The luminosity, on large scales, is supposed to follow thedistribution of matter, provided that a convenient smoothing kernelis used. In their work, Einasto et al. (2007b) use an Epanechnikovkernel and assert that the best results in the identification methodare obtained when a kernel size of 8 h−1 Mpc is used. Einasto et al.(2007b) set the threshold parameter by maximizing the number oflarge superclusters. Costa-Duarte et al. (2011) apply the densityfield method to the SDSS-DR7 and use two samples of structures,selected using different overdensity thresholds. The authors claimthat there is no natural value for the threshold density and define asample that maximizes the number of structures, and a sample withthe parameters tuned so that the largest superclusters present anextension of ≈120 h−1 Mpc. The authors perform an analysis of theshapes of superclusters using Minkowski functionals, finding thatfilamentary structures tend to be richer, larger and more luminousthan pancakes. They also use a semi-analytic catalogue of galaxiesderived from the Millennium simulation to test the method and con-clude that the morphological classification is not biased by peculiarvelocities. Liivamagi et al. (2010) use a similar approach, but per-form the smoothing with a B3-spline kernel of radius of 8 h−1 Mpc,obtaining catalogues of superstructures with similar properties inthe SDSS-DR7 and in the Millennium simulation.
3.2 Present approach
Given that not all large-scale structures are virialized at the presenttime, the setting of identification parameters is subject to certaindegree of arbitrariness. A physically motivated threshold on massoverdensity was explored in �CDM simulations by Dunner et al.(2006). According to these authors, it is possible to define a cri-terion to isolate, using three-dimensional data, overdensity regions
C© 2011 The Authors, MNRAS 415, 964–976Monthly Notices of the Royal Astronomical Society C© 2011 RAS
Dow
nloaded from https://academ
ic.oup.com/m
nras/article/415/1/964/990139 by guest on 01 April 2022
Future virialized structures 967
enclosed by a spherical shell that will evolve into virialized systems.By the application of the spherical collapse model, the mean massdensity enclosed by the last bound shell of a structure must satisfy
ρmassshell
ρmassbck
= 7.88, (2)
where ρmassshell is the mean mass density enclosed by the critical shell
(the shell that maximizes the potential energy) and ρmassbck is the mean
density of the background. In observational catalogues, there is notan accurate estimation of the mass density field. However, giventhat at large scales the mass-to-luminosity ratio is nearly constant,we can apply a similar criterion to the luminosity map to derivestructures with an appropriate mass overdensity.
In the following subsections, we describe the identificationmethod implemented on the SDSS-DR7 spectroscopic data. We firstdefine the volume covered by the sample using a three-dimensionalmask and construct a luminosity density map with a 1 (h−1 Mpc)3
cell resolution. We then use a percolation method based on thesearch of high-density peaks on the three-dimensional smoothedmap. These overdensities are the basis of the superstructurecatalogue.
3.2.1 Luminosity density map
We construct smooth luminosity density maps from our completesamples of galaxies, in the region defined by a three-dimensionalmask. This mask, which represents an approximation of the geome-try of the SDSS-DR7 galaxy catalogue in both angular coordinatesand redshift, is built using cubic cells of 1 h−1 Mpc side. We startfrom a pixelized representation of the central region within the cat-alogue footprint area. To this end, we use an angular mask obtainedusing the software HEALPIX (Gorski et al. 2005) with a resolution pa-rameter Nside = 512 that splits the whole sphere in 3145 728 equal-area pixels. A cubic cell is part of the three-dimensional mask if atleast a fraction of its area includes part of the solid angle subtendedby the angular mask, and its radial position lies within the redshiftrange defined for a given sample. We define the volume of a cellwithin the three-dimensional mask as V ′
cell = V × f cell, where V =(1 h−1 Mpc)3 and f cell measures the fraction of the volume V into themask. We compute the fraction f cell by implementing a Monte Carloprocedure. Accordingly, cells that are completely contained withinthe geometry of the catalogue have f cell = 1, while external cellshave f cell = 0. The factor f cell allows us to correct for border effects;in our subsequent analysis, we will use only cells with f cell > 0.5,that is, only cells with at least 50 per cent of their volume inside themask. The continuous luminosity density map can be constructedby smoothing the galaxy distribution within the three-dimensionalmask. A standard procedure to accomplish this consists in using akernel function to convolve the discrete positions of galaxies andspread their luminosity. The resulting density field is then repre-sented at a resolution given by the cell size and corrected by theweight factor f cell. The result of the smoothing depends on the shapeand size of the chosen kernel function. Following previous analysesin the literature (Einasto et al. 2007c; Costa-Duarte et al. 2011), weuse an Epanechnikov kernel of r0 = 8 h−1 Mpc size, which givesthe contribution at position r from a source that is located at R:
k(r − R) = 3
4r0
[1 −
( |r − R|r0
)2]
. (3)
An Epanechnikov kernel is more suitable for this analysis since itsshape resembles that of a Gaussian, but it avoids excessive smooth-
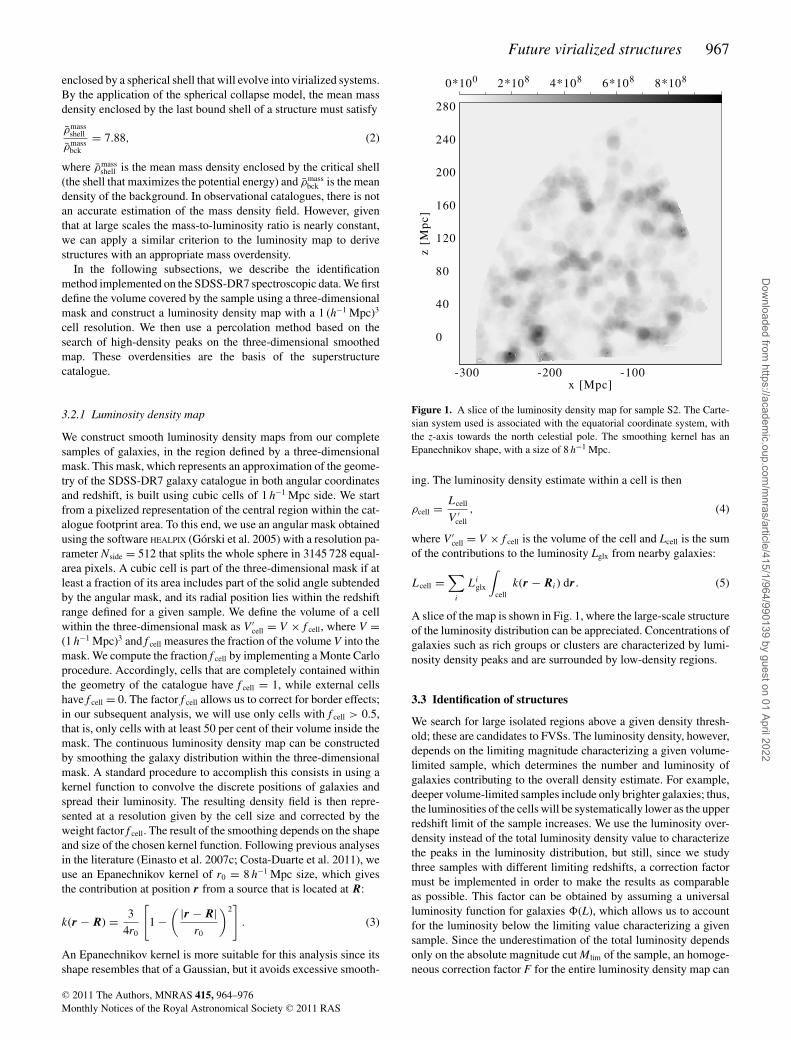
Figure 1. A slice of the luminosity density map for sample S2. The Carte-sian system used is associated with the equatorial coordinate system, withthe z-axis towards the north celestial pole. The smoothing kernel has anEpanechnikov shape, with a size of 8 h−1 Mpc.
ing. The luminosity density estimate within a cell is then
ρcell = Lcell
V ′cell
, (4)
where V ′cell = V × f cell is the volume of the cell and Lcell is the sum
of the contributions to the luminosity Lglx from nearby galaxies:
Lcell =∑
i
Liglx
∫cell
k(r − Ri) dr. (5)
A slice of the map is shown in Fig. 1, where the large-scale structureof the luminosity distribution can be appreciated. Concentrations ofgalaxies such as rich groups or clusters are characterized by lumi-nosity density peaks and are surrounded by low-density regions.
3.3 Identification of structures
We search for large isolated regions above a given density thresh-old; these are candidates to FVSs. The luminosity density, however,depends on the limiting magnitude characterizing a given volume-limited sample, which determines the number and luminosity ofgalaxies contributing to the overall density estimate. For example,deeper volume-limited samples include only brighter galaxies; thus,the luminosities of the cells will be systematically lower as the upperredshift limit of the sample increases. We use the luminosity over-density instead of the total luminosity density value to characterizethe peaks in the luminosity distribution, but still, since we studythree samples with different limiting redshifts, a correction factormust be implemented in order to make the results as comparableas possible. This factor can be obtained by assuming a universalluminosity function for galaxies �(L), which allows us to accountfor the luminosity below the limiting value characterizing a givensample. Since the underestimation of the total luminosity dependsonly on the absolute magnitude cut Mlim of the sample, an homoge-neous correction factor F for the entire luminosity density map can
C© 2011 The Authors, MNRAS 415, 964–976Monthly Notices of the Royal Astronomical Society C© 2011 RAS
Dow
nloaded from https://academ
ic.oup.com/m
nras/article/415/1/964/990139 by guest on 01 April 2022

968 H. Luparello et al.
be defined as
F =∫ ∞
0 L�(L) dL∫ ∞Mlim
L�(L) dL. (6)
We adopted the luminosity function presented by Blanton et al.(2003b). This correction ranges from 2 to �6 for samples withlimiting absolute magnitudes down to Mr = −21. In Table 1, thecorrection factor F and the corrected mean luminosity density arelisted for each sample.
We define superstructures by linking overdense cells using aFriends-of-Friends algorithm that connects overdense cells sharingat least one common vertex or side. To this end, we use the thresh-old luminosity overdensity criterion ρlum-cell ≥ DT ρlum. Since theproperties of the catalogue of superstructures may be affected bythe adopted value of the luminosity overdensity parameter DT, it isfundamental to study this issue in further detail.
3.4 Calibrating the method with numerical simulations
We use numerical simulations to test the ability of a luminosity-based algorithm to derive structures that will evolve into virializedsystems in the future. We have also used the simulations to analysewhether superstructures identified in redshift space with total lu-minosities above L = 1012 L� correspond to systems in real spaceabove this threshold. This is an important issue to be checked sincethe observations provide redshift-space data, whereas the FVS cri-terion requires real-space information. In Fig. 2, we show the distri-butions of mass overdensity (only known in the simulations) for thesample of structures that result from the identification algorithm for
Figure 2. Distribution of the mass overdensity of the superstructures identi-fied in the simulation box, for different values of the luminosity overdensityparameter (DT = 4.5, 5.5 and 9, in the top left-hand, top right-hand and bot-tom left-hand panels, respectively). The dashed vertical lines indicate thecritical mass overdensity that a region must have to be virialized, accordingto Dunner et al. (2006). The dotted histograms show the distributions for thetotal sample of superstructures and black continuous histograms show thecorresponding distributions for structures with the total luminosity greaterthan 1012 L�. Bottom right-hand panel: comparison between the distribu-tions of mass overdensity for the three values of DT.
Figure 3. Completeness and contamination of the FVS catalogue as a func-tion of DT. The chosen value of DT = 5.5 for the compilation of the cata-logue of FVSs shows the best balance between low contamination and highcompleteness.
three different values of DT and the corresponding distributions forsuperstructures with a luminosity above the threshold 1012 L�. Thisadopted luminosity threshold is approximately the maximum ob-served value for a rich cluster of galaxies; by imposing this luminos-ity cut-off, we exclude individual clusters from our FVS catalogue.The bottom right-hand panel of Fig. 2 shows the mass overdensityof superstructures with the luminosity cut-off for three values in theluminosity overdensity parameter. The vertical dashed line in thisfigure shows the minimum mass overdensity for a superstructure tobe virialized in the future according to Dunner et al. (2006). As canbe seen, the contamination in the catalogue depends on the choiceof the luminosity overdensity parameter. In order to select the mostconvenient value of this parameter, we explored the contaminationand completeness of superstructures for different values of DT. Wedefine the completeness as the ratio of the number of superstructuresresulting from a given value of DT and maximum number of su-perstructures obtained within the explored DT range. Similarly, thecontamination is defined as the fraction of identified superstructuresthat do not satisfy the future virialized criteria. In Fig. 3, we showthe completeness and contamination parameters for the range 4 <
DT < 9. By inspection of this figure, we chose a luminosity over-density threshold DT = 5.5. This adopted value provides a suitablecompromise of high completeness and low contamination.
3.5 Redshift-space versus real-space analysis
In this subsection, we analyse the effects of redshift-space distor-tions induced by peculiar velocities on the identification of FVSs,using the mock catalogue. We considered the mock catalogue toconstruct samples of galaxies in redshift-space (MZsp) and in real-space (MRsp), defined using the same redshift limits and limitingabsolute magnitudes as sample S2 (see Table 1). This allows tostudy FVSs identified in real space and compare them with thoseselected in redshift space. We have computed the distributions of theluminosity and volume derived for the FVS in these mock samples.
C© 2011 The Authors, MNRAS 415, 964–976Monthly Notices of the Royal Astronomical Society C© 2011 RAS
Dow
nloaded from https://academ
ic.oup.com/m
nras/article/415/1/964/990139 by guest on 01 April 2022

Future virialized structures 969
Figure 4. Histograms representing the luminosity (a) and volume (b) distributions of FVSs. The solid lines correspond to the sample of FVSs identified insample MZsp (redshift-space mock, see Section 2) and the dotted lines correspond to FVSs identified in sample MRsp (real-space mock).
A good agreement can be appreciated between the luminosity dis-tributions (Fig. 4a), indicating that the identification procedure de-livers reliable estimations of the total luminosity. It can also beinferred from the volume distributions, shown in Fig. 4(b), that thevolume of FVSs is not strongly affected by peculiar velocities.
We also analysed the correspondence between structures in realand redshift space in order to estimate the contamination and com-pleteness of the FVS catalogue. The first point we note is the lowernumber of FVSs identified in the redshift-space sample compared tothat of the real-space sample, in the same volume. About 20 per centof FVSs identified in real space are lost when analysing redshift-space data. This is a major drawback of redshift-space FVS iden-tification. On the other hand, only 2 per cent of FVSs identifiedin redshift space are not real-space FVSs. This indicates that theidentification of FVSs in observational catalogues is not likely toinclude fake FVS structures. We also found that approximately 3 percent of FVSs in the mock catalogue are associated with more than asingle FVS in real space. A similar percentage of real-space FVSsare identified as multiple FVSs in redshift space.
4 C ATA L O G U E O F FV S s
Taking into account the results of the previous sections, we haveadopted a luminosity overdensity threshold of DT = 5.5 and in orderto avoid the inclusion of spurious systems, a lower luminosity limitLstr > 1012 L�. In Table 2, we summarize some characteristics ofthe identified FVS.
Once the superstructures have been identified, it is important toassess their fundamental properties such as the total volume, thenumber of galaxies above a given luminosity, the total luminosity,shape parameters, etc. Given the small volume of sample S1, andthe large luminosity correction factor in sample S3, we provide ananalysis of sample S2 in what follows.
Table 2. Main results obtained for the samples of identified FVSs. For eachsample, we show the number of FVSs, NFVS, the percentage of volumeoccupied by FVSs, Fvol, the percentage of the luminosity of galaxies withinFVSs, Flum, and the total number of galaxies within FVSs, glxsin FVS.
Sample NFVS Fvol Flum glxsin FVS
S1 67 1.08 per cent 10.85 per cent 9707S2 150 1.26 per cent 13.54 per cent 11 394S3 412 1.66 per cent 20.61 per cent 11 682
MRsp 227 1.62 per cent 18.87 per cent 19 265MZsp 181 1.35 per cent 15.14 per cent 15 368
4.1 Analysis of the FVS catalogue (sample S2)
In Fig. 5(a), we show the distribution of luminosities of the su-perstructures we obtain for the SDSS-DR7. FVS luminosities varybetween 1012 and ∼1014 L�, in agreement with Einasto et al. (2006)and Costa-Duarte et al. (2011). However, Einasto et al. (2006) find alack of luminous superclusters in numerical simulations comparedto superclusters identified in observational catalogues. In a forth-coming paper (Luparello et al., in preparation), we will analyse thisissue in more detail.
Since the superstructures are obtained from a discrete densitymap, the volume can be directly calculated as the sum of the vol-umes of all the cells that belong to a given system. As all cellshave the same volume, equal to 1 (h−1 Mpc)3, the number of cellsthat form a structure is directly proportional to the volume. As itcan be appreciated in Fig. 5(b), the volume of the superstructuresranges between 102 and 105(h−1 Mpc)3. We also compute the frac-tion of the total volume that is in FVSs, finding that FVSs representonly 1.26 per cent of the volume covered by sample S2. Einastoet al. (2007a) found that the volume covered by superclusters in the2dFGRS represents 3.2 per cent of the Northern region of the cata-logue and 3.5 per cent of the Southern region. Our lower percentages
C© 2011 The Authors, MNRAS 415, 964–976Monthly Notices of the Royal Astronomical Society C© 2011 RAS
Dow
nloaded from https://academ
ic.oup.com/m
nras/article/415/1/964/990139 by guest on 01 April 2022
970 H. Luparello et al.
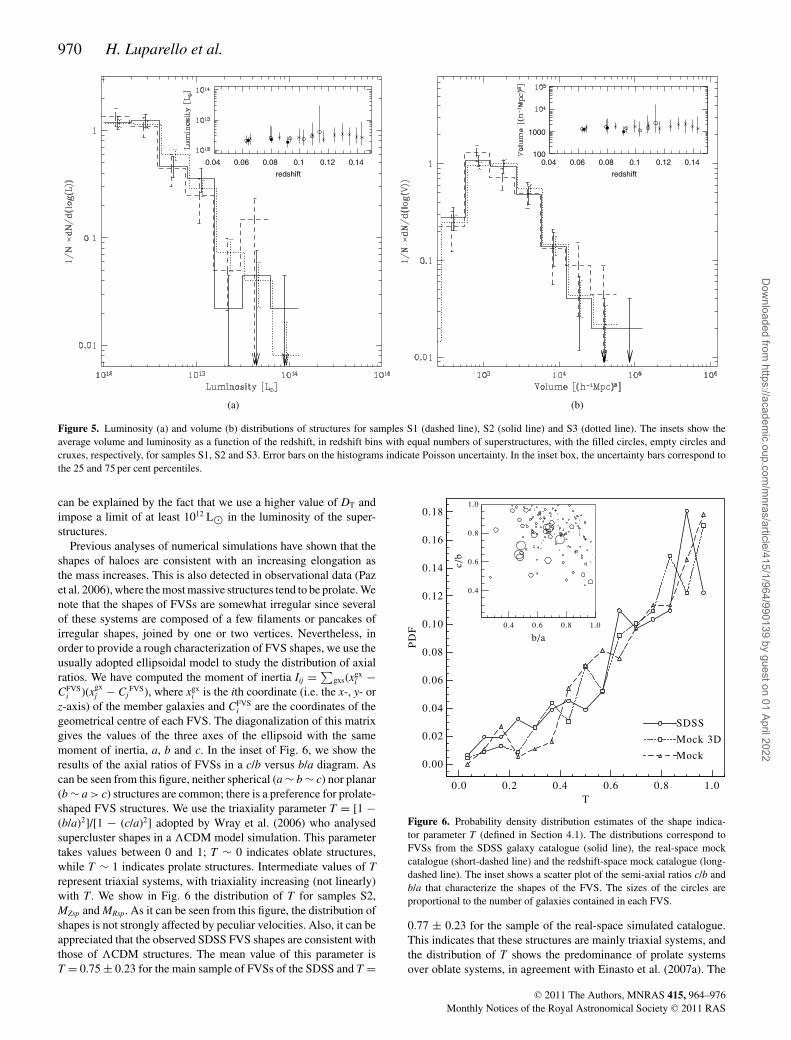
Figure 5. Luminosity (a) and volume (b) distributions of structures for samples S1 (dashed line), S2 (solid line) and S3 (dotted line). The insets show theaverage volume and luminosity as a function of the redshift, in redshift bins with equal numbers of superstructures, with the filled circles, empty circles andcruxes, respectively, for samples S1, S2 and S3. Error bars on the histograms indicate Poisson uncertainty. In the inset box, the uncertainty bars correspond tothe 25 and 75 per cent percentiles.
can be explained by the fact that we use a higher value of DT andimpose a limit of at least 1012 L� in the luminosity of the super-structures.
Previous analyses of numerical simulations have shown that theshapes of haloes are consistent with an increasing elongation asthe mass increases. This is also detected in observational data (Pazet al. 2006), where the most massive structures tend to be prolate. Wenote that the shapes of FVSs are somewhat irregular since severalof these systems are composed of a few filaments or pancakes ofirregular shapes, joined by one or two vertices. Nevertheless, inorder to provide a rough characterization of FVS shapes, we use theusually adopted ellipsoidal model to study the distribution of axialratios. We have computed the moment of inertia Iij = ∑
gxs(xgxi −
CFVSi )(xgx
j − CjFVS), where xgx
i is the ith coordinate (i.e. the x-, y- orz-axis) of the member galaxies and CFVS
i are the coordinates of thegeometrical centre of each FVS. The diagonalization of this matrixgives the values of the three axes of the ellipsoid with the samemoment of inertia, a, b and c. In the inset of Fig. 6, we show theresults of the axial ratios of FVSs in a c/b versus b/a diagram. Ascan be seen from this figure, neither spherical (a ∼ b ∼ c) nor planar(b ∼ a > c) structures are common; there is a preference for prolate-shaped FVS structures. We use the triaxiality parameter T = [1 −(b/a)2]/[1 − (c/a)2] adopted by Wray et al. (2006) who analysedsupercluster shapes in a �CDM model simulation. This parametertakes values between 0 and 1; T ∼ 0 indicates oblate structures,while T ∼ 1 indicates prolate structures. Intermediate values of Trepresent triaxial systems, with triaxiality increasing (not linearly)with T . We show in Fig. 6 the distribution of T for samples S2,MZsp and MRsp. As it can be seen from this figure, the distribution ofshapes is not strongly affected by peculiar velocities. Also, it can beappreciated that the observed SDSS FVS shapes are consistent withthose of �CDM structures. The mean value of this parameter isT = 0.75 ± 0.23 for the main sample of FVSs of the SDSS and T =
Figure 6. Probability density distribution estimates of the shape indica-tor parameter T (defined in Section 4.1). The distributions correspond toFVSs from the SDSS galaxy catalogue (solid line), the real-space mockcatalogue (short-dashed line) and the redshift-space mock catalogue (long-dashed line). The inset shows a scatter plot of the semi-axial ratios c/b andb/a that characterize the shapes of the FVS. The sizes of the circles areproportional to the number of galaxies contained in each FVS.
0.77 ± 0.23 for the sample of the real-space simulated catalogue.This indicates that these structures are mainly triaxial systems, andthe distribution of T shows the predominance of prolate systemsover oblate systems, in agreement with Einasto et al. (2007a). The
C© 2011 The Authors, MNRAS 415, 964–976Monthly Notices of the Royal Astronomical Society C© 2011 RAS
Dow
nloaded from https://academ
ic.oup.com/m
nras/article/415/1/964/990139 by guest on 01 April 2022
Future virialized structures 971
mean values of T reported by Wray et al. (2006) range betweenT = 0.65 and 0.69, depending on the linking length, in agreementwith our results. Costa-Duarte et al. (2011) present evidence of atrend between supercluster luminosities and shapes, where filamentsare on average more luminous than pancakes. We also explored thedependence of the T parameter on FVS luminosity and volume,finding a similar tendency. Larger values of T correspond to moreluminous, larger, FVSs.
4.2 Testing the reliability of the method
4.2.1 Redshift dependence
We have also searched for a possible redshift dependence of ourresults; note that, given the shallow depth of our samples, this con-stitutes a test of our method rather than a search for true timeevolution. To this aim, we use samples S1 and S3, defined in Sec-tion 2. The similarity of the three histograms in Figs 5(a) and (b)corresponding to these different subsamples shows a lack of red-shift dependence. This is also seen in the insets of Figs 5(a) and (b).As it can be seen, there is no significant dependence of the medianluminosities and volumes on redshift, indicating the reliability ofthe method and its lack of a redshift bias.
4.2.2 Luminosity cut-off dependence
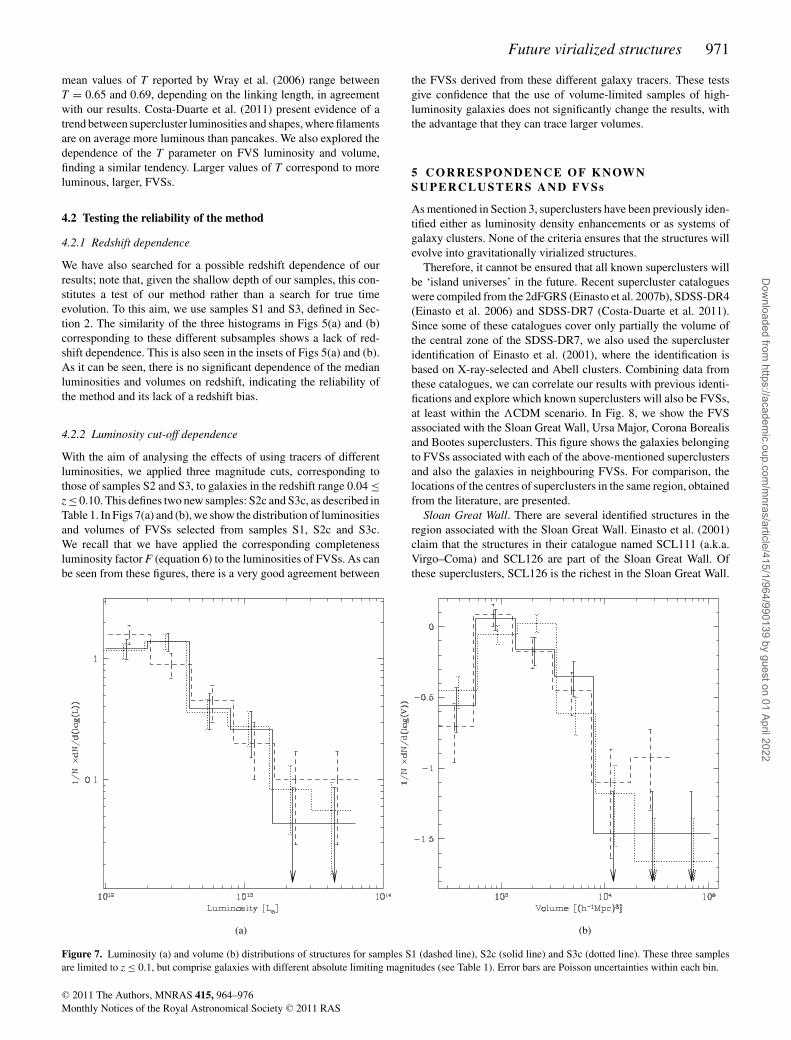
With the aim of analysing the effects of using tracers of differentluminosities, we applied three magnitude cuts, corresponding tothose of samples S2 and S3, to galaxies in the redshift range 0.04 ≤z ≤ 0.10. This defines two new samples: S2c and S3c, as described inTable 1. In Figs 7(a) and (b), we show the distribution of luminositiesand volumes of FVSs selected from samples S1, S2c and S3c.We recall that we have applied the corresponding completenessluminosity factor F (equation 6) to the luminosities of FVSs. As canbe seen from these figures, there is a very good agreement between
the FVSs derived from these different galaxy tracers. These testsgive confidence that the use of volume-limited samples of high-luminosity galaxies does not significantly change the results, withthe advantage that they can trace larger volumes.
5 C O R R E S P O N D E N C E O F K N OW NSUPERCLUSTERS A ND FVSs
As mentioned in Section 3, superclusters have been previously iden-tified either as luminosity density enhancements or as systems ofgalaxy clusters. None of the criteria ensures that the structures willevolve into gravitationally virialized structures.
Therefore, it cannot be ensured that all known superclusters willbe ‘island universes’ in the future. Recent supercluster catalogueswere compiled from the 2dFGRS (Einasto et al. 2007b), SDSS-DR4(Einasto et al. 2006) and SDSS-DR7 (Costa-Duarte et al. 2011).Since some of these catalogues cover only partially the volume ofthe central zone of the SDSS-DR7, we also used the superclusteridentification of Einasto et al. (2001), where the identification isbased on X-ray-selected and Abell clusters. Combining data fromthese catalogues, we can correlate our results with previous identi-fications and explore which known superclusters will also be FVSs,at least within the �CDM scenario. In Fig. 8, we show the FVSassociated with the Sloan Great Wall, Ursa Major, Corona Borealisand Bootes superclusters. This figure shows the galaxies belongingto FVSs associated with each of the above-mentioned superclustersand also the galaxies in neighbouring FVSs. For comparison, thelocations of the centres of superclusters in the same region, obtainedfrom the literature, are presented.
Sloan Great Wall. There are several identified structures in theregion associated with the Sloan Great Wall. Einasto et al. (2001)claim that the structures in their catalogue named SCL111 (a.k.a.Virgo–Coma) and SCL126 are part of the Sloan Great Wall. Ofthese superclusters, SCL126 is the richest in the Sloan Great Wall.
Figure 7. Luminosity (a) and volume (b) distributions of structures for samples S1 (dashed line), S2c (solid line) and S3c (dotted line). These three samplesare limited to z ≤ 0.1, but comprise galaxies with different absolute limiting magnitudes (see Table 1). Error bars are Poisson uncertainties within each bin.
C© 2011 The Authors, MNRAS 415, 964–976Monthly Notices of the Royal Astronomical Society C© 2011 RAS
Dow
nloaded from https://academ
ic.oup.com/m
nras/article/415/1/964/990139 by guest on 01 April 2022
972 H. Luparello et al.
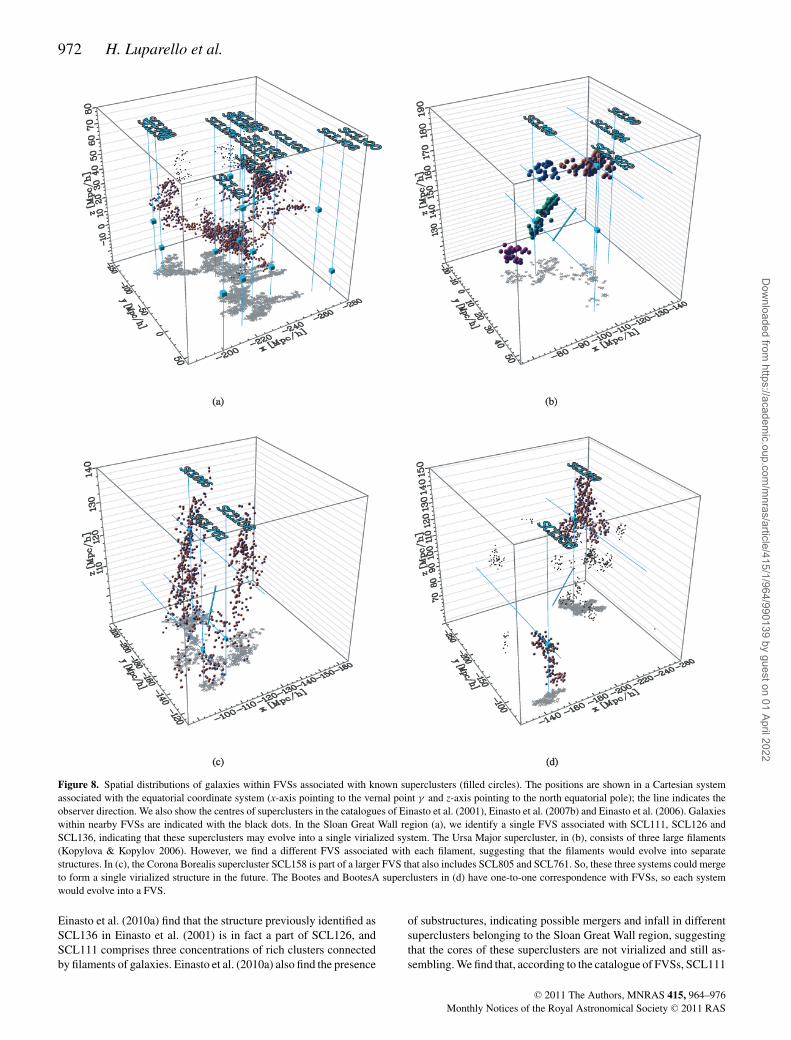
Figure 8. Spatial distributions of galaxies within FVSs associated with known superclusters (filled circles). The positions are shown in a Cartesian systemassociated with the equatorial coordinate system (x-axis pointing to the vernal point γ and z-axis pointing to the north equatorial pole); the line indicates theobserver direction. We also show the centres of superclusters in the catalogues of Einasto et al. (2001), Einasto et al. (2007b) and Einasto et al. (2006). Galaxieswithin nearby FVSs are indicated with the black dots. In the Sloan Great Wall region (a), we identify a single FVS associated with SCL111, SCL126 andSCL136, indicating that these superclusters may evolve into a single virialized system. The Ursa Major supercluster, in (b), consists of three large filaments(Kopylova & Kopylov 2006). However, we find a different FVS associated with each filament, suggesting that the filaments would evolve into separatestructures. In (c), the Corona Borealis supercluster SCL158 is part of a larger FVS that also includes SCL805 and SCL761. So, these three systems could mergeto form a single virialized structure in the future. The Bootes and BootesA superclusters in (d) have one-to-one correspondence with FVSs, so each systemwould evolve into a FVS.
Einasto et al. (2010a) find that the structure previously identified asSCL136 in Einasto et al. (2001) is in fact a part of SCL126, andSCL111 comprises three concentrations of rich clusters connectedby filaments of galaxies. Einasto et al. (2010a) also find the presence
of substructures, indicating possible mergers and infall in differentsuperclusters belonging to the Sloan Great Wall region, suggestingthat the cores of these superclusters are not virialized and still as-sembling. We find that, according to the catalogue of FVSs, SCL111
C© 2011 The Authors, MNRAS 415, 964–976Monthly Notices of the Royal Astronomical Society C© 2011 RAS
Dow
nloaded from https://academ
ic.oup.com/m
nras/article/415/1/964/990139 by guest on 01 April 2022

Future virialized structures 973
and SCL126 may evolve into a single virialized structure, while theneighbouring SCL91 could remain isolated. The structure SCL100(Einasto et al. 2001), associated with the Leo A supercluster and lo-cated near the Sloan Great Wall, has no FVSs that it can be directlyassociated with. We find several FVSs surrounding the centre ofSCL100, thus suggesting that this supercluster could be disruptedin the future.
Ursa Major supercluster. Ursa Major is a nearby z 0.06 andrelatively isolated supercluster. It has been found to be composed ofthree large filaments with the mean redshifts z = 0.051, 0.060 and0.071 (Kopylova & Kopylov 2006). Einasto et al. (2001) associateUrsa Major to the SLC109 superstructure in their catalogue andpresent its geometrical centre located at α = 177.◦1, δ = +55.◦0 andz = 0.06. Einasto et al. (2006) identified the more distant filament asanother individual supercluster (SCL384). We found four differentFVSs with filamentary structures associated with this superclus-ter. This indicates that the filaments would eventually evolve intoseparate structures.
Corona Borealis supercluster. The Corona Borealis superclus-ter (SCL158 in Einasto et al. 2001) is a prominent example of asupercluster in the northern sky. This structure comprises 500galaxies at z = 0.07, with a nearly spherical morphology. We findthat Corona Borealis is part of a larger FVS, which also includesthe superclusters SCL805 and SCL761 identified by Einasto et al.(2006). According to our analysis, since the total luminosity of thisFVS is well beyond the threshold luminosity calibrated using thesimulation, these structures are candidates to merge and form asingle virialized system in the future.
Bootes superclusters. The Bootes supercluster (SCL138 inEinasto et al. 2001) is located at z 0.065 and Bootes-A (SCL150)lies directly behind at z 0.11. These superclusters have not beenwidely studied. We find that a single FVS of filamentary shape canbe associated with each one of these superclusters.
The comparison presented in this section helps visualize the dif-ferences that can be found between different superstructure cat-alogues; our approach has the relative advantage of allowing aninterpretation of known structures in terms of whether they willevolve in the future into single virialized structures. However, weremind the reader that this interpretation depends on the assumedcosmology, which in the present case is the concordance �CDMmodel, as well as on the different hypotheses adopted.
6 C LUSTERS AND GROUPS WITHIN FVSs
Although it has been claimed that the clustering properties of darkmatter haloes depend exclusively on their total mass, recent analy-ses of numerical simulations have shown that they can be stronglyaffected by their assembly history (see e.g. Lacerna & Padilla 2011,and references therein). If galaxy groups and clusters within su-perstructures have undergone a different evolution, then systematicdifferences are to be expected at present. The following analysiscould help to address the role of the large-scale structure in theformation and evolution of galaxies. In this section, we derive asimple statistical analysis concerning groups of galaxies and theFVS. To this end, we use three different samples of galaxy systems:(i) groups of galaxies identified in the SDSS-DR7 (see Section 2),suitable to search for correlations between the halo mass and thelarge-scale environment they inhabit; (ii) Abell-ACO cluster cat-alogue (Andernach 1991) that provides redshift measurements of1059 clusters in the footprint area of the SDSS-DR7; and (iii) X-ray clusters of galaxies, from the RASS catalogue (Popesso et al.
Figure 9. Percentage of DR7 galaxy groups inside FVSs with respect to thetotal number of groups into virial mass bins. The first and second mass binscomprise 21 galaxy groups, although none of them is located into a FVS.
2004) providing a suitable sample of bright X-ray clusters withinthe SDSS area.
We have computed the fraction of galaxy groups/clusters withinFVSs as a function of their mass (Fig. 9). In this figure, error barsindicate Poisson uncertainties given by
σ(M (i)
vir
)=
√N
(i)in FVSs
/N
(i)all , (7)
where N(i)in FVS is the number of groups/clusters inside a FVS in the ith
mass bin and N(i)all is the total number of groups in the same mass bin.
As can be appreciated, the fraction of groups within FVSs is greaterfor higher group masses. This result is also present in the catalogueof Abell-ACO clusters. This catalogue supplies 177 clusters withinthe coverage area of the SDSS-DR7, out of which 119 lie withinthe supercluster sample defined by Einasto et al. (2001) and 63 liewithin FVSs. A total number of 55 Abell clusters are found in bothcatalogues. We compute the fraction of Abell clusters within FVSsas a function of the richness class parameter. We find only 14.5 percent of type 0 clusters within FVSs, a value that increases for richerAbell clusters: 24.4 per cent for type 1, 34.4 per cent for type 2 and41.7 per cent for type 3 clusters. Thus, there is a significantly largerprobability of the richest Abell clusters to be in FVSs, in contrastto poor clusters.
It is also worth studying X-ray-emitting clusters of galaxies.While Abell clusters have an estimate of their richness that is dis-crete and approximate, the X-ray cluster catalogue provides X-rayluminosities, known to be good indicators of the underlying gravi-tational potential well (Rykoff et al. 2008). The catalogue of X-rayclusters also allows to study the fraction of clusters inside FVSs asa function of the X-ray luminosity. We obtain the same trend in thisfraction as in the case of DR7 groups, as it can be seen from Fig. 10.However, while the fraction of systems inside FVSs is at most 0.3for the DR7 groups (except for the last virial mass bin, which hasa large uncertainty), we find that 85 per cent of the clusters withLX > 4 1037 W are part of a FVS. A similar value is found forsuperclusters by Einasto et al. (2001) using a compilation of X-ray
C© 2011 The Authors, MNRAS 415, 964–976Monthly Notices of the Royal Astronomical Society C© 2011 RAS
Dow
nloaded from https://academ
ic.oup.com/m
nras/article/415/1/964/990139 by guest on 01 April 2022

974 H. Luparello et al.
Figure 10. Percentage of X-ray clusters in FVSs with respect to the totalnumber of X-ray clusters, as a function of the X-ray luminosity.
clusters based on the RASS. The authors also found that in rich andvery rich superclusters the fraction of X-ray clusters is higher thanthe fraction of Abell clusters, consistent with our findings.
The results of this section are in agreement with the expectation ofan assembly bias scenario, where the oldest, most massive systemsare preferentially located in present-day overdense regions. Also,this suggests that the most frequent future cluster merger events willbe associated with the most massive clusters within FVSs.
7 D ISCUSSION
On the observational side, catalogues of superstructures have beenpresented on increasingly larger galaxy data sets (see Liivamagiet al. 2010, and references therein). These catalogues provide im-portant characterizations of the largest scale structures and allow fordifferent tests of structure formation models. Regarding the evolu-tion of these structures, numerical simulations reveal the conditionsby which these systems would evolve into isolation and dynamicalequilibrium within the �CDM scenario. Busha et al. (2005) con-sider the long-term evolution of large structures, up to a = 100,using numerical simulations, and analyse the definition of a radiusthat encloses all the mass that ultimately will form an isolated struc-ture. The authors find that a transition region is prevalent during thematter-dominated era (a < aeq), between an inner hydrostatic re-gion and an outer region that expands with the perturbed Hubbleflow. In this intermediate region, the accretion of matter towardsthe mass concentration is complex and gives rise to a variety ofdefinitions of scales to describe clusters. At later times, the ac-cretion region narrows and the hydrostatic and turnaround scalesmerge to form a single zero-velocity surface that unambiguouslydefines the halo mass. Araya-Melo et al. (2009) argue that, once �
has started to dominate the expansion of the universe, the cosmicweb growth stops, so that the spatial distribution of superclusters isessentially the same starting from the present epoch. The authorsidentify superclusters on the basis of criteria presented in Dunneret al. (2006). These criteria, based on the spherical collapse model
and implemented on N-body simulations, allow to develop a methodto isolate structures in the present universe in redshift space that willeventually form a bound structure. In a subsequent work, Dunneret al. (2007) presents a detailed method to be applied in observa-tional data. This method is based on the assumption of sphericalcollapse and makes use of projected velocity envelope templatesand mass profiles.
The ‘gravitationally bound’ criterion is widely used and wasalso applied to our nearby Universe. Nagamine & Loeb (2003)performed a numerical simulation with initial conditions at z = 0reproducing the observed galaxy distribution in the local Universe.They conclude that the mass overdensity of the Local Group isabove the required threshold to be a bound structure in the future.According to the authors, Andromeda and the Milky Way will prob-ably merge, while our Local Group and the Virgo cluster will notform a virialized structure in the future.
From a theoretical point of view, Einasto et al. (2010b) decom-pose the luminosity density field of Liivamagi et al. (2010) usinga wavelet analysis. They also study the formation of the cosmicweb based on the evolution of the density perturbation phases innumerical simulations. They state that very rich superclusters arethe result of large-scale (λ ≥ 32 h−1 Mpc) density waves, combinedin similar phases. Also, the cosmic web develops in early stages ofthe Universe evolution, and it is generated by the phase synchro-nization.
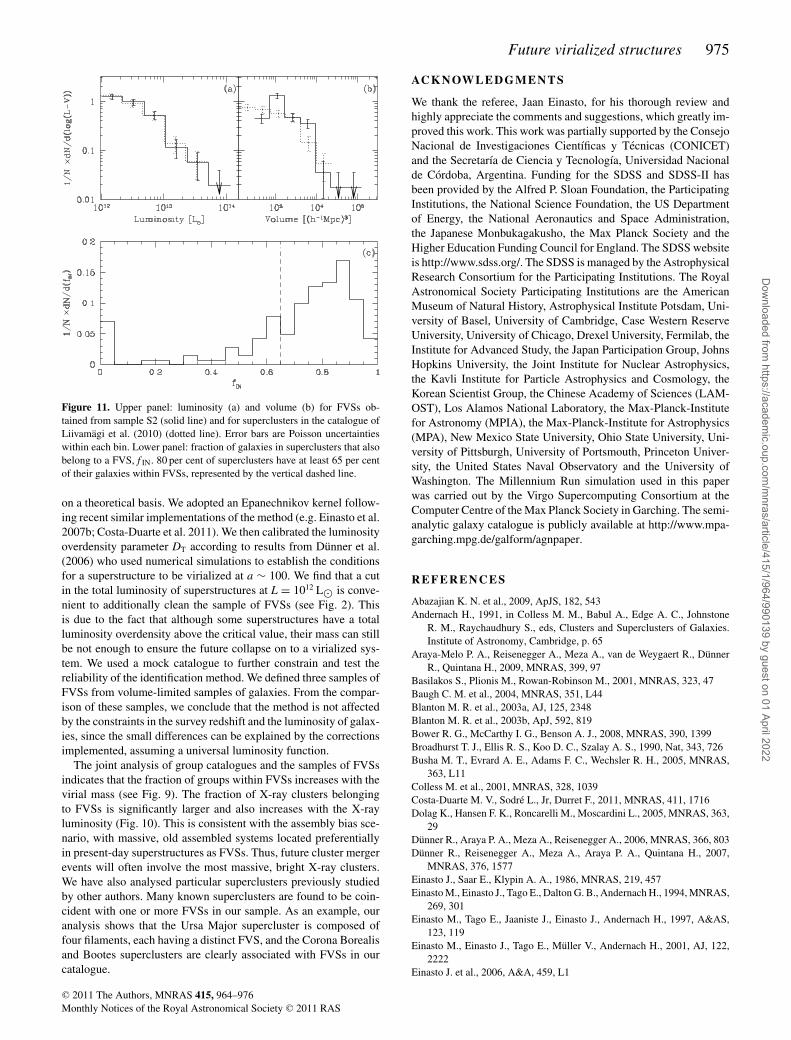
The largest supercluster catalogue constructed so far with SDSS-DR7 data (Liivamagi et al. 2010) allows to test our procedure andcompare the results. As they apply the density field method using awide range of threshold density parameters (analogues to our DT),we can directly contrast the final results of both catalogues for thesame value of DT = 5.5. The Liivamagi et al. (2010) catalogueis deeper, so we restrict the analysis to z = 0.12, the limit of ourmain sample of FVSs. Up to this distance, we identify 150 FVSscompared to 142 superclusters in the Liivamagi et al. (2010) cata-logue. In the upper panel of Fig. 11, we show the luminosity andvolume of these structures. From the available list of galaxies insuperclusters of Liivamagi et al. (2010), we selected a subsample of83.798 galaxies, with the same limits as our sample S2 (0.04 < z <
0.12 and Mr < −20.47). We find that 79.4 per cent of the galaxiesin superclusters also belong to a FVS and only the 3.4 per cent ofgalaxies outside superclusters are associated with a FVS. We alsoanalyse the galaxies within each supercluster separately, definingthe fraction of galaxies in the supercluster that are part of a FVS, f IN,and the fraction of galaxies in the supercluster that do not belong toany FVS, f OUT.
In the lower panel of Fig. 11, we show the f IN fraction for thegalaxies within each supercluster. We find that 80 per cent of su-perclusters have f IN over 0.65 and f OUT lower than 0.35. The pre-vious analyses indicate that the general features of the structuresof Liivamagi et al. (2010) and those of FVSs show a very goodagreement.
8 C O N C L U S I O N S
The properties of the largest structures in the Universe provideimportant information on the cosmological model. In this work,we have developed a physically motivated procedure to isolatestructures in the nearby universe that will evolve into gravitation-ally virialized systems in the future, within a �CDM framework.The method starts from a smoothed luminosity density map, wherehigh density peaks are separated as superstructure candidates. Thismethod depends on a number of free parameters that we determined
C© 2011 The Authors, MNRAS 415, 964–976Monthly Notices of the Royal Astronomical Society C© 2011 RAS
Dow
nloaded from https://academ
ic.oup.com/m
nras/article/415/1/964/990139 by guest on 01 April 2022
Future virialized structures 975
Figure 11. Upper panel: luminosity (a) and volume (b) for FVSs ob-tained from sample S2 (solid line) and for superclusters in the catalogue ofLiivamagi et al. (2010) (dotted line). Error bars are Poisson uncertaintieswithin each bin. Lower panel: fraction of galaxies in superclusters that alsobelong to a FVS, f IN. 80 per cent of superclusters have at least 65 per centof their galaxies within FVSs, represented by the vertical dashed line.
on a theoretical basis. We adopted an Epanechnikov kernel follow-ing recent similar implementations of the method (e.g. Einasto et al.2007b; Costa-Duarte et al. 2011). We then calibrated the luminosityoverdensity parameter DT according to results from Dunner et al.(2006) who used numerical simulations to establish the conditionsfor a superstructure to be virialized at a ∼ 100. We find that a cutin the total luminosity of superstructures at L = 1012 L� is conve-nient to additionally clean the sample of FVSs (see Fig. 2). Thisis due to the fact that although some superstructures have a totalluminosity overdensity above the critical value, their mass can stillbe not enough to ensure the future collapse on to a virialized sys-tem. We used a mock catalogue to further constrain and test thereliability of the identification method. We defined three samples ofFVSs from volume-limited samples of galaxies. From the compar-ison of these samples, we conclude that the method is not affectedby the constraints in the survey redshift and the luminosity of galax-ies, since the small differences can be explained by the correctionsimplemented, assuming a universal luminosity function.
The joint analysis of group catalogues and the samples of FVSsindicates that the fraction of groups within FVSs increases with thevirial mass (see Fig. 9). The fraction of X-ray clusters belongingto FVSs is significantly larger and also increases with the X-rayluminosity (Fig. 10). This is consistent with the assembly bias sce-nario, with massive, old assembled systems located preferentiallyin present-day superstructures as FVSs. Thus, future cluster mergerevents will often involve the most massive, bright X-ray clusters.We have also analysed particular superclusters previously studiedby other authors. Many known superclusters are found to be coin-cident with one or more FVSs in our sample. As an example, ouranalysis shows that the Ursa Major supercluster is composed offour filaments, each having a distinct FVS, and the Corona Borealisand Bootes superclusters are clearly associated with FVSs in ourcatalogue.
AC K N OW L E D G M E N T S
We thank the referee, Jaan Einasto, for his thorough review andhighly appreciate the comments and suggestions, which greatly im-proved this work. This work was partially supported by the ConsejoNacional de Investigaciones Cientıficas y Tecnicas (CONICET)and the Secretarıa de Ciencia y Tecnologıa, Universidad Nacionalde Cordoba, Argentina. Funding for the SDSS and SDSS-II hasbeen provided by the Alfred P. Sloan Foundation, the ParticipatingInstitutions, the National Science Foundation, the US Departmentof Energy, the National Aeronautics and Space Administration,the Japanese Monbukagakusho, the Max Planck Society and theHigher Education Funding Council for England. The SDSS websiteis http://www.sdss.org/. The SDSS is managed by the AstrophysicalResearch Consortium for the Participating Institutions. The RoyalAstronomical Society Participating Institutions are the AmericanMuseum of Natural History, Astrophysical Institute Potsdam, Uni-versity of Basel, University of Cambridge, Case Western ReserveUniversity, University of Chicago, Drexel University, Fermilab, theInstitute for Advanced Study, the Japan Participation Group, JohnsHopkins University, the Joint Institute for Nuclear Astrophysics,the Kavli Institute for Particle Astrophysics and Cosmology, theKorean Scientist Group, the Chinese Academy of Sciences (LAM-OST), Los Alamos National Laboratory, the Max-Planck-Institutefor Astronomy (MPIA), the Max-Planck-Institute for Astrophysics(MPA), New Mexico State University, Ohio State University, Uni-versity of Pittsburgh, University of Portsmouth, Princeton Univer-sity, the United States Naval Observatory and the University ofWashington. The Millennium Run simulation used in this paperwas carried out by the Virgo Supercomputing Consortium at theComputer Centre of the Max Planck Society in Garching. The semi-analytic galaxy catalogue is publicly available at http://www.mpa-garching.mpg.de/galform/agnpaper.
REFERENCES
Abazajian K. N. et al., 2009, ApJS, 182, 543Andernach H., 1991, in Colless M. M., Babul A., Edge A. C., Johnstone
R. M., Raychaudhury S., eds, Clusters and Superclusters of Galaxies.Institute of Astronomy, Cambridge, p. 65
Araya-Melo P. A., Reisenegger A., Meza A., van de Weygaert R., DunnerR., Quintana H., 2009, MNRAS, 399, 97
Basilakos S., Plionis M., Rowan-Robinson M., 2001, MNRAS, 323, 47Baugh C. M. et al., 2004, MNRAS, 351, L44Blanton M. R. et al., 2003a, AJ, 125, 2348Blanton M. R. et al., 2003b, ApJ, 592, 819Bower R. G., McCarthy I. G., Benson A. J., 2008, MNRAS, 390, 1399Broadhurst T. J., Ellis R. S., Koo D. C., Szalay A. S., 1990, Nat, 343, 726Busha M. T., Evrard A. E., Adams F. C., Wechsler R. H., 2005, MNRAS,
363, L11Colless M. et al., 2001, MNRAS, 328, 1039Costa-Duarte M. V., Sodre L., Jr, Durret F., 2011, MNRAS, 411, 1716Dolag K., Hansen F. K., Roncarelli M., Moscardini L., 2005, MNRAS, 363,
29Dunner R., Araya P. A., Meza A., Reisenegger A., 2006, MNRAS, 366, 803Dunner R., Reisenegger A., Meza A., Araya P. A., Quintana H., 2007,
MNRAS, 376, 1577Einasto J., Saar E., Klypin A. A., 1986, MNRAS, 219, 457Einasto M., Einasto J., Tago E., Dalton G. B., Andernach H., 1994, MNRAS,
269, 301Einasto M., Tago E., Jaaniste J., Einasto J., Andernach H., 1997, A&AS,
123, 119Einasto M., Einasto J., Tago E., Muller V., Andernach H., 2001, AJ, 122,
2222Einasto J. et al., 2006, A&A, 459, L1
C© 2011 The Authors, MNRAS 415, 964–976Monthly Notices of the Royal Astronomical Society C© 2011 RAS
Dow
nloaded from https://academ
ic.oup.com/m
nras/article/415/1/964/990139 by guest on 01 April 2022
976 H. Luparello et al.
Einasto J. et al., 2007a, A&A, 462, 397Einasto J. et al., 2007b, A&A, 462, 811Einasto M. et al., 2007c, A&A, 476, 697Einasto M. et al., 2010a, A&A, 522, A92Einasto J. et al., 2010b, preprint (arXiv:1012.3550)Flores-Cacho I. et al., 2009, MNRAS, 400, 1868Frisch P., Einasto J., Einasto M., Freudling W., Fricke K. J., Gramann M.,
Saar V., Toomet O., 1995, A&A, 296, 611Genova-Santos R., Rubino-Martın J. A., Rebolo R., Battye R. A., Blanco
F., Davies R. D., 2008, MNRAS, 391, 1127Genova-Santos R., Padilla Torres C. P., Rubino Martın J. A., Gutierrez
C. M., Rebolo R., 2010, MNRAS, 403, 1531Gonzalez R. E., Padilla N. D., 2010, MNRAS, 407, 1449Gorski K. M., Hivon E., Banday A. J., Wandelt B. D., Hansen F. K., Reinecke
M., Bartelmann M., 2005, ApJ, 622, 759Granett B., Neyrinck M., Szapudi I., 2009, BAAS, 41, 284Icke V., 1984, MNRAS, 206, 1P
Kopylova F. G., Kopylov A. I., 2006, Astron. Lett., 32, 84Lacerna I., Padilla N., 2011, MNRAS, 412, 1283Liivamagi L. J., Tempel E., Saar E., 2010, preprint (arXiv:1012.1989)Merchan M. E., Zandivarez A., 2005, ApJ, 630, 759Murphy D. N. A., Eke V. R., Frenk C. S., 2011, MNRAS, 413, 2288Nagamine K., Loeb A., 2003, New Astron., 8, 439Park D., Lee J., 2007, ApJ, 665, 96Paz D. J., Lambas D. G., Padilla N., Merchan M., 2006, MNRAS, 366, 1503Peacock J. A. et al., 2001, Nat, 410, 169Penton S. V., Stocke J. T., Shull J. M., 2002, ApJ, 565, 720
Platen E., van de Weygaert R., Jones B. J. T., 2008, MNRAS, 387, 128Popesso P., Bohringer H., Brinkmann J., Voges W., York D. G., 2004, A&A,
423, 449Porter S. C., Raychaudhury S., Pimbblet K. A., Drinkwater M. J., 2008,
MNRAS, 388, 1152Rykoff E. S. et al., 2008, MNRAS, 387, L28Shandarin S. F., Sheth J. V., Sahni V., 2004, MNRAS, 353, 162Shane C. D., 1956, Vistas Astron., 2, 1574Shane C. D., Wirtanen C. A., 1954, AJ, 59, 285Shapley H., 1961, J. R. Astron. Soc. Can., 55, 273Shapley H., Ames A., 1930, Harv. Coll. Obs. Bull., 880, 1Shectman S. A., Landy S. D., Oemler A., Tucker D. L., Lin H., Kirshner
R. P., Schechter P. L., 1996, ApJ, 470, 172Springel V. et al., 2005, Nat, 435, 629Stocke J. T., Shull J. M., Penton S., Donahue M., Carilli C., 1995, ApJ, 451,
24Stoughton C., Lupton R. H., Bernardi M., Blanton M. R., Burles S., Cas-
tander F. J., Connolly A. J., Eisenstein D. J., 2002, AJ, 123, 485Strauss M. A., Weinberg D. H., Lupton R. H., Narayanan V. K., Annis J.,
Bernardi M., Blanton M., Burles S., 2002, AJ, 124, 1810Wray J. J., Bahcall N. A., Bode P., Boettiger C., Hopkins P. F., 2006, ApJ,
652, 907Zapata T., Perez J., Padilla N., Tissera P., 2009, MNRAS, 394, 2229Zucca E., Zamorani G., Scaramella R., Vettolani G., 1993, ApJ, 407, 470
This paper has been typeset from a TEX/LATEX file prepared by the author.
C© 2011 The Authors, MNRAS 415, 964–976Monthly Notices of the Royal Astronomical Society C© 2011 RAS
Dow
nloaded from https://academ
ic.oup.com/m
nras/article/415/1/964/990139 by guest on 01 April 2022