
Impersonal null-subjects in Icelandic and elsewhere* - Lund ...

REVIEW OF PUBLIC ADMINISTRATION
IN NORTHERN IRELAND
BRIEFING PAPER:
FUNDING ARRANGEMENTS FOR
LOCAL GOVERNMENT IN THE UK
JURISDICTIONS AND ELSEWHERE
Peter A. Watt
Institute of Local Government Studies
School of Public Policy
The University of Birmingham 15 April 2004, with minor amendments 20 September 2004
Contact details Dr P.A. Watt, School of Public Policy, University of Birmingham, Birmingham, B15 2TT tel +44 121 41 44983, fax: + 44 121 41 44989 e-mail: [email protected]

BRIEFING PAPER:
FUNDING ARRANGEMENTS FOR LOCAL
GOVERNMENT IN THE UK JURISDICTIONS AND
ELSEWHERE
Peter A. Watt
Institute of Local Government Studies
School of Public Policy
The University of Birmingham
TABLE OF CONTENTS Executive summary............................................................................................................. 1 Introduction......................................................................................................................... 3
The overall UK public expenditure system .................................................................... 4 Funding for devolved administrations ................................................................................ 4
The operation of the Barnett Formula............................................................................. 5 The allocation of spending within the devolved administrations ....................................... 9 Local Government Funding .............................................................................................. 12
Local government grants and equalisation ................................................................... 14 Accountability and the balance of funding ................................................................... 17
Conclusions....................................................................................................................... 18 References......................................................................................................................... 19 TABLES Table 1: "Needs" and identifiable public expenditure per head indexed to England: ........ 5 Table 2: Comparability percentages of programme areas .................................................. 8 Table 3: Northern Ireland Public Expenditure Plans: 2004-05 to 2005-06 ...................... 10 Table 4: Regional and district rate poundages, 2004/05................................................... 11 Table 5: Sources of funds for Northern Ireland local authorities ..................................... 12 Table 6: Capital funding for Northern Ireland local authorities 2002/03 ......................... 12 Table 7: Northern Ireland District Councils Expenditure 2002/03................................... 14
i

Executive summary Local government in the UK receives funding from central government grant and from
local taxes and fees. For Northern Ireland, Scotland and Wales, funding flows via their
devolved administrations. The overall approach to local government funding is similar
for all the nations of the UK, although the Northern Ireland system is the most atypical as
local government has fewer functions and local finance is levied by rates rather than
council tax.
Central funding of local government in the UK is a component of the overall system of
fiscal policy and public expenditure allocation that is determined by the Treasury.
Because central funding flows from the UK government, it is relevant to consider the
overall system of UK public expenditure control before looking at the expenditure of the
devolved administrations.
The overall system of UK public expenditure takes as its control total an aggregate called
Total Managed Expenditure (TME) comprising Departmental Expenditure Limits (DELs)
and Annually Managed Expenditure (AME). Under the Spending Review, DELs are set
for most UK government departments and also for the devolved administrations, which
are treated analogously to UK government departments.
The vast bulk of DELs for devolved administrations are “assigned” which means that
how they are spent is decided by the recipient government. Each year the DEL is
calculated using the Barnett formula. This formula takes as its base the existing DEL and
adds to it increases which are equal per head to increases in comparable UK government
services in England.
Spending on the Northern Ireland DEL is allocated according to the devolved
administration’s priorities and set out in an annual budget. The budget includes an
allocation for local government which appears as part of the DEL for the Department of
the Environment.
1

Properties in Northern Ireland are subject to both a regional rate and district rates.
Regional rates are collected to support Northern Ireland government expenditure on such
services as education, housing, social services, roads, water and sewerage.
Local government funding comes from the district rates, described above and general and
specific government grant. Local authorities also receive income from fees and charges
and various capital funding mechanisms.
The question of whether expenditures have been appropriately assigned to levels of
government applies at all levels of inter-governmental relations, but is particularly
relevant to the case of local government in Northern Ireland because its local authorities
are responsible for a much smaller range of services than are local authorities in the rest
of the UK.
The main grant local authorities are paid is called the General Grant. This grant provides
partial equalisation with respect to needs and is in line with worldwide practice.
Equalisation mechanisms between local governments operate at two levels: firstly there is
the equalisation that occurs between the UK nations as a result of the Barnett formula and
local revenue contributions to spending. Secondly there is the equalisation that occurs
between local governments within each nation.
Accountability requires that those who decide on local spending also pay for it. The
central/local balance of funding for Northern Ireland is more towards local finance than
the rest of the UK, so this would appear to lead to more local accountability. However
this is partly achieved by what might be considered a centralisation of local government
functions towards the Northern Ireland administration. This centralisation may not be in
line with an ideal level of subsidiarity. The other component of this locally orientated
funding balance is local authorities’ control of the non-domestic rate, which has some
drawbacks in terms of democratic accountability.
2
Introduction Local government in the UK receives funding from central government grant and from
local taxes and fees. Central funding for local government comes from taxpayers
throughout the UK. For local authorities in England, central funding is from the
government ministries concerned. For Northern Ireland, Scotland and Wales, funding to
local government flows via the devolved administrations. The devolved administrations
receive payments from the United Kingdom government to support their functions, one
of which is grants to local government. The overall approach to local government funding
is similar for all the nations of the UK, although the Northern Ireland system is the most
atypical as local government has fewer functions and local finance is levied by rates
rather than council tax.
Central funding of local government in the UK is a component of the overall system of
fiscal policy and public expenditure allocation determined by the Treasury. Although the
Treasury determines overall budgets, the devolved administrations are free to allocate
assigned spending1 within the totals as they see fit (HM Treasury, 2002, p. 3).
Equalisation mechanisms between local governments operate at two levels2: firstly there
is the equalisation that occurs between the UK nations as a result of the Barnett formula
and local revenue contributions to spending. Secondly there is the equalisation that
occurs between local governments within each nation.
Because central funding flows from the UK government, it is relevant to consider the
overall system of UK public expenditure control before looking at the expenditure of the
devolved administrations.
1 For assigned budget items “the devolved administrations will have full discretion over their spending priorities” (HM Treasury, 2002, p. 4) 2 See Heald and McLeod, 2002, p. 16.
3
The overall UK public expenditure system The current UK system of public expenditure planning was introduced by the Labour
Government shortly after they came to power. The new system, based on Spending
Reviews is set out in detail in HM Treasury (1998a and 1998b). Spending reviews are
carried out every two years and set out plans for public expenditure over the forthcoming
three years, with the third year overtaken by the next spending review. Currently
Spending Review 2002 is in force, and Spending Review 2004 will be published in July
2004.
The Government emphasises two overall fiscal rules in its spending review system:
• The Golden Rule: over the economic cycle the Government will borrow only to
invest and not to fund current spending; and
• The Sustainable Investment Rule: net public debt as a proportion of GDP will be
held over the economic cycle at a stable and prudent level (HM Treasury,
1998a, p. 5)
The system of public expenditure planning takes as its control total an aggregate called
Total Managed Expenditure (TME) comprising Departmental Expenditure Limits (DELs)
and Annually Managed Expenditure (AME), i.e:
TME = DELs + AME.
Funding for the devolved administrations consists of both DELs and AME.
Funding for devolved administrations Annually Managed Expenditure covers expenditures that cannot be controlled on a multi-
year basis but are reviewed and set annually in March. For Northern Ireland, AME
comprises Common Agricultural Policy payments, social security benefits, NHS and
teachers’ pensions, accrual items such as capital charges for roads and water services,
district councils’ self financed expenditure and regional rates (HM Treasury, 2002, p. 35).
4

Under the Spending Review, DELs are set for most UK government departments and also
for the devolved administrations, which are treated analogously to UK government
departments. The UK government departments are largely concerned with expenditure in
England only, although other departmental programmes, such as for the Home Office,
cover England and Wales and other departmental categories of expenditure relate to
Great Britain (HM Treasury, 2002, p. 11).
For Northern Ireland, Scotland and Wales, DELs are set by means of the “Barnett
Formula”, which is now discussed.
The operation of the Barnett Formula The base level of public spending per head differs quite markedly for the UK nations and
has done at least since the 1970s. Table 1 presents some figures. There has been much
discussion of these differences in spending per head. Reasons analysts advance for their
existence revolve around “historical legacy” and differences in need3.
Table 1: "Needs" and identifiable public expenditure per head indexed to England:
Spending 1959-60
Spending 1971-72
Needs 1976-7
Spending 1976-7
Spending 1997-98
England 100 100 100 100 100
Northern Ireland
88 111 131 135 142
Scotland 105 125 116 122 127
Wales 95 104 109 106 120
Source: Adapted from Mackay (2001) and HM Treasury (1979)
In 1979, in preparation for prospective devolution, the Treasury carried out a needs
analysis of spending of the UK nations (HM Treasury, 1979). The report observed that,
“Since the underlying principle of enabling similar policies to be pursued in each country
3 For discussion see for example Heald (2003), Midwinter (2002), McLean and McMillan (2003).
5
is not new, it might be presumed that this was reflected in past expenditure allocations.”
(HM Treasury, 1979, quoted in MacKay, 2001)
At this time, Joel Barnett, the then Chief Secretary to the Treasury, instituted a system of
expenditure allocation based on applying equal per capita increases to these differing
bases – the so-called Barnett formula.
Under the current operation of Barnett formula, spending DELs for the nations are
determined by applying increases to their existing DELs which are equal per head to
increases in comparable United Kingdom Government services in England (HM Treasury
2002, p. 1). There are two major points to make about this. Firstly, the system is
incremental and the single most important determinant of any year’s DEL will be the
previous year’s DEL. Secondly, convergence is built into the Barnett process.
Mathematically, applying equal per head increases to different bases over a number of
years will tend to bring overall expenditure per head in each nation towards equality. This
is because over time successive equal increases will come to dominate the base4.
Although, the Barnett formula should lead to convergence of public expenditure per head
across the UK nations, in practice this has not been seen. The reason appears to be that
the Barnett approach has not always been fully used as some expenditures have
“bypassed” the formula.5
We can trace out the precise workings of the Barnett system in more detail for the
Northern Ireland case.6 Under the Barnett approach, increases in expenditure in UK
department i , (∆Di) are multiplied by the relevant comparability percentage Ci and by the
population proportion for Northern Ireland (P) to give the increase in the Northern
Ireland expenditure allocation for that category of expenditure (∆Ni).
4 For a brief explanation and further references, see Heald and McLeod, 2003. Heald (1996) provides a formal discussion. 5 See Heald, (1998) and references therein for discussion of exceptions to the use of the formula. The Barnett formula is also discussed in McLean and McMillan (2003) 6 The same system also applies to Scotland and Wales).
6

Hence for each expenditure category7 we have:
∆Ni = ∆Di × (Ci/100) × P.
The increase in the DEL for Northern Ireland, ∆N is given by:
∆N = ∑i [∆Di × (Ci/100)] × P.
The comparability percentages Ci used in the above formulae are specific to each
department i. They are calculated by considering the extent to which spending in each
departmental spending area compares with corresponding Northern Ireland expenditure.
Thus if a function carried out in England by a government department is also carried out
by the public sector in Northern Ireland, the comparability will be 100%
Table 2 below shows the comparability percentages of programme areas. Note that
comparability never exceeds 100%. This can be a problem for a devolved administration
where there is spending in an area which has no counterpart in England. For example,
water is a public sector function in Northern Ireland, but has been privatised in the UK.
Hence there is no English departmental expenditure category for this area to which to
apply the Barnett formula. This raises a range of issues. Although finance for water
would be expected to come under the Northern Ireland DEL aggregate, the Barnett
formula would not make provision for it8 so the effect would be to stretch the Northern
Ireland DEL over a wider range of expenditure than the UK equivalent. On the other
hand, the UK government might want to argue that water should be privatised, so there
should be no need to make provision for a publicly provided water service in the DEL.
As a temporary expedient, depreciation and capital charges for water are placed in AME
7 The categories are agriculture, trade and industry, employment, energy, roads and transport, housing, environment and water, fire, education, health, social security administration, public corporations and other public services, student loans, capital receipts initiative, trust debt remuneration, fossil fuel obligation, bus fuel duty rebate (see HM Treasury, 2002, p. 35) 8 See Heald (2003, p. 82-83)
7

as an exceptional item, partly as a result of this non-comparability9, and in anticipation of
commitments secured to move water to a self financing basis10.
As well as the comparability percentages described above, expenditures are multiplied a
population proportion (P). The population proportion is based on Northern Ireland’s
population as a percentage of the population of England.11 For 2001, Northern Ireland’s
population as a percentage of the population of England was 3.21. Hence an increase in a
100% comparable programme in England of £100 would lead to an increase in Northern
Ireland of £3.21, and these increases would be equal per capita for England and Northern
Ireland.
Table 2: Comparability percentages of programme areas
Programme Comparability percentage
Education and Employment 99.8 Health 99.7 Transport 87.1 Office of the Deputy Prime Minister 99.5 Local Government 40.7 Home Office 2.6 Legal Departments 1.6 Trade and Industry 26.8 Agriculture 85.5 Forestry 100.0 Culture, Media and Sport 97.1 Work and Pensions 100.0 Chancellor’s Departments 3.5 Cabinet Office 18.6 Source: HM Treasury (2002 pp. 43-63)
Table 1 above shows that each devolved nation has a higher level of spending per head
than England. If the devolved nations seek to preserve this situation, the Barnett formula
9 See DFPNI (2004, § 90, and NIE (2002, p. 10) 10 Heald, 2003, p. 83 argues “Notwithstanding the desirability of greater fiscal effort in Northern Ireland, towards which payments (i.e. taxes or charges) for water should play a part, the leverage now enjoyed by the Treasury over the staging of increases may well cause future difficulties on a politically sensitive issue”. 11 Unless a particular programme has wider coverage – in which case the divisor would be the population of England and Wales, or Great Britain, as appropriate.
8
has both an advantage and a disadvantage. The advantage is that the Barnett approach
takes existing expenditure levels (which are higher for the devolved nations) as its base.
The disadvantage is that equal per head increases will gradually converge spending per
head towards equality. Although simple logic would suggest a prima facie case for an
update to the 1979 needs assessment study, discussion in Heald (2003) and Midwinter
(2002) indicates that such an update could easily end up reducing relative expenditure
allocations to Northern Ireland. Applying pressure for such an update would therefore be
not without some dangers.
We now examine the allocation of spending within the devolved administrations and the
funding of local government, with an emphasis on the Northern Ireland case.
The allocation of spending within the devolved administrations As discussed above, Northern Ireland public expenditure is controlled as Annually
Managed Expenditure and the Departmental Expenditure Limit. The Treasury sets out
three years of DELs in the Spending Review, whereas it negotiates AME annually
(DFPNI, 2004, p. 35).
The vast bulk of the Northern Ireland DEL is assigned, meaning that it can be allocated
to spending priorities by decision of the devolved administration. This would be the
Northern Ireland Executive, but with the present suspension the decision is with the
Secretary of State. Non-assigned DEL consists of the EU Special Support Programme for
Peace and Reconciliation (DFPNI, 2004, p. 35).
Overall, the DEL for 2004-05 is £7,135.7m. This control total can be supplemented by
revenue from the Regional Rate, borrowing under the Reinvestment and Reform
initiative, planned over-commitments and asset sales, and other factors, which raises the
total amount available for allocation to services to £7927.0m for 2004-5 (DFPNI, 2004,
pp. 36-37). The distribution of this overall budget between the Northern Ireland
Departments is shown in Table 3. The Department of the Environment’s DEL, as
determined in consultation by the Secretary of State is £142.9m for 2004-05, of which
£54.4m is allocated to local government services (DFPNI, 2004, p. 113).
9

In England, support for local government appears in the Comprehensive Spending
Review, mainly under a separate local government heading for the government
department responsible – currently the Office of the Deputy Prime Minister.
In the Northern Ireland budget, there is a link between powers to borrow and the regional
rate, as borrowing is conditional on local revenue raising. The 2003-04 budget assumed
the introduction of rating of vacant property and the ending of industrial de-rating and
rate rises securing increased revenues of 8.8% in 2004-05 and 8.8% and 9.1% in the
subsequent two years. A 3.3% annual increase is assumed for the non-domestic rate.
(DFPNI, 2004, §§113-114.)
Table 3: Northern Ireland Public Expenditure Plans: 2004-05 to 2005-06 DEPARTMENT
2003-04 2004-05 2005-06
£m £m % £m % Department of Agriculture and Rural Development
253.4 264.7.0 4.5 282.1 6.6
Department of Culture, Arts and Leisure 97.1 103.8 6.8 112.2 8.1 Department of Education 1,529.7 1,650.5 7.9 1,696.0 2.8 Department for Employment and Learning 672.7 680.72 1.2 721.7 6.0 Department of Enterprise, Trade and Investment
248.7 270.6 8.8 257.7 -4.8
Department of Finance and Personnel 165.7 138.8 -16.2 180.8 30.2 Department of Health, Social Services and Public Safety
3,009.7 3,227.6 7.2 3,497.9 8.4
Department of the Environment 133.2 142.9 7.2 137.9 -3.5 Department for Regional Development 611.4 752.5 23.1 705.8 -6.2 Department for Social Development 489.7 537.8 9.8 555.4 3.3 Office of the First Minister and Deputy First Minister
49.2 57.1 16.0 60.8 6.5
Northern Ireland Assembly 49.2 49.2 0.0 49.2 0.0 Other Departments 10.5 11.8 12.0 12.2 4.1 Total Departmental DEL 7,320.3 7,888.0 8,269.8 Unallocated Executive Programme Funds 26.6 39.0 29.1 Unallocated Capital 0.0 0.0 50.0 Total Spend on Services 7,346.9 7,927.0 7.9 8,348.9 5.3 Planned Over commitment -136.2 -178.3 -186.5 - Regional Rates -375.1 -417.1 -453.8 Other Items 2.0 -57.9 -16.8 Planned Borrowing -125.0 -200.0 -200.0 Total Assigned DEL 6,712.6 7,073.7 7,491.8 EU Peace II 50.0 62.0 80.0 Total DEL 6,762 7135.7 5.5 7,571.8 6.1 Source: DFPNI, 2004, p. 34
10
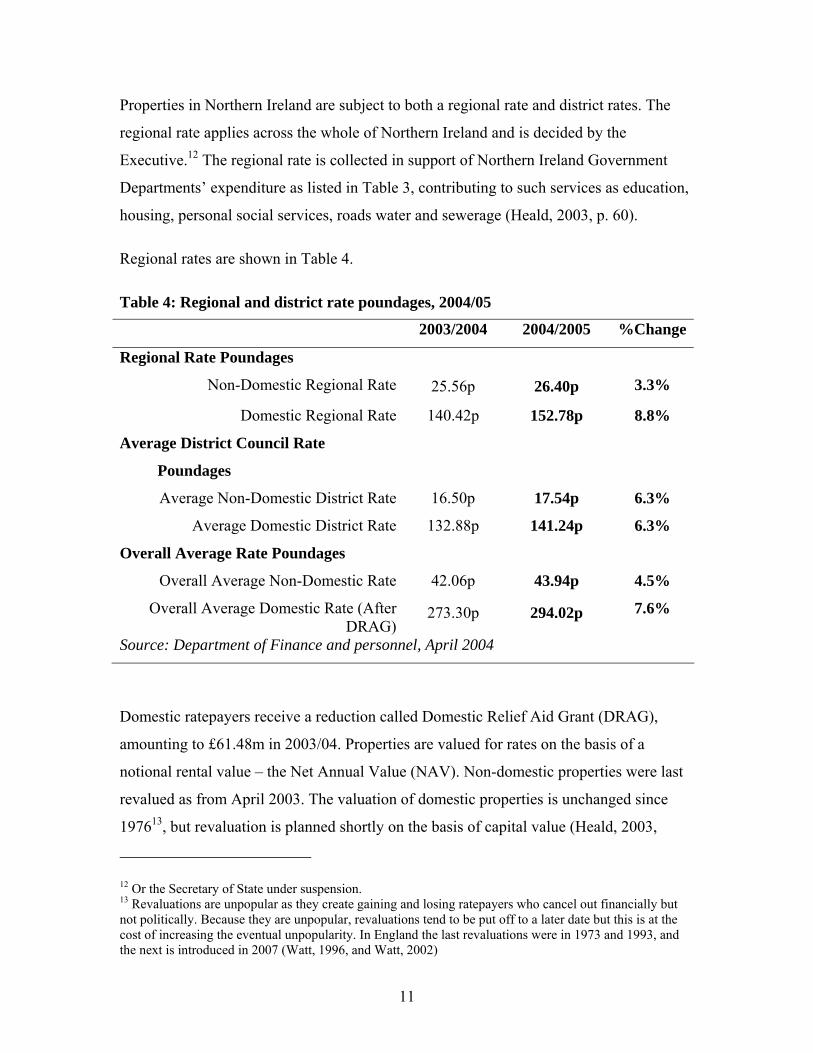
Properties in Northern Ireland are subject to both a regional rate and district rates. The
regional rate applies across the whole of Northern Ireland and is decided by the
Executive.12 The regional rate is collected in support of Northern Ireland Government
Departments’ expenditure as listed in Table 3, contributing to such services as education,
housing, personal social services, roads water and sewerage (Heald, 2003, p. 60).
Regional rates are shown in Table 4.
Table 4: Regional and district rate poundages, 2004/05
2003/2004 2004/2005 %Change
Regional Rate Poundages
Non-Domestic Regional Rate 25.56p 26.40p 3.3%
Domestic Regional Rate 140.42p 152.78p 8.8%
Average District Council Rate
Poundages
Average Non-Domestic District Rate 16.50p 17.54p 6.3%
Average Domestic District Rate 132.88p 141.24p 6.3%
Overall Average Rate Poundages
Overall Average Non-Domestic Rate 42.06p 43.94p 4.5%
Overall Average Domestic Rate (After DRAG)
273.30p 294.02p 7.6%
Source: Department of Finance and personnel, April 2004
Domestic ratepayers receive a reduction called Domestic Relief Aid Grant (DRAG),
amounting to £61.48m in 2003/04. Properties are valued for rates on the basis of a
notional rental value – the Net Annual Value (NAV). Non-domestic properties were last
revalued as from April 2003. The valuation of domestic properties is unchanged since
197613, but revaluation is planned shortly on the basis of capital value (Heald, 2003,
12 Or the Secretary of State under suspension. 13 Revaluations are unpopular as they create gaining and losing ratepayers who cancel out financially but not politically. Because they are unpopular, revaluations tend to be put off to a later date but this is at the cost of increasing the eventual unpopularity. In England the last revaluations were in 1973 and 1993, and the next is introduced in 2007 (Watt, 1996, and Watt, 2002)
11

p. 51). As the domestic and no-domestic values diverge strongly, a different rate is set
for each (CIPFA, 2003, p. 43-44).
As mentioned above, Northern Ireland currently applies industrial de-rating, based on the
1929 UK system but abolished elsewhere. Loss of this income is fully recovered from
General Grant (CIPFA, 2003, p. 41-43). There will be a phased removal of industrial de-
rating over seven years, beginning in April 2005 (Review of Rating Policy, 2003).
Local Government Funding Local government funding comes from the district rates, described above and general and
specific government grant. These sources for local government income for 2002/03 are
set out in Table 5.
Table 5: Sources of funds for Northern Ireland local authorities
Source of funds £m % District Rate £267m 64% General Grant £48m 12% Specific Grants and Income from Fees and Charges £102m 24% Source: CIPFA 2003, p. 38.
Local authorities also receive income from fees and charges. Capital financing is from
government capital grants, borrowing,14 use of capital receipts and revenue sources.
Table 6 shows sources of capital funding for 2002/03.
Table 6: Capital funding for Northern Ireland local authorities 2002/03
Source of funds £ % Borrowing 22,429,377 50% Grants 4,127,027 9 % Sale of Assets 1,203,519 3% Capital Receipts 1,524,434 3 % Revenue Contributions 14,851,904 33% Other 477,821 1 % Source: Department of the Environment.
14 As approved by the Department of the Environment in Northern Ireland
12
The question of funding of local government is inextricably linked with the issue of the
assignment of functions to levels of government15. In the local public finance literature,
the question of the assignment of functions is approached by considering the
geographical spread or benefit area of publicly provided goods and services.
Decentralising decision-making about services down to the level of jurisdiction that most
closely matches their benefit area is seen by theorists as generating welfare gains for
residents by enabling their preferences to be taken account of most accurately in the
tailoring of provision. This argument has its formal expression in Oates’s decentralisation
theorem (Oates, 1972, p. 35) and also has resonance with discussions of subsidiarity
(Warleigh, 2002). A further important principle is that of “fiscal equivalence” – that there
should be “a match between those who receive the benefits of [local spending] and those
who pay for it” (Olson, 1969, p. 483). Linking these principles together means that
decisions are made in local elections by local voters who not only receive the benefits of
local goods and services but also pay for them.
The issue of assignment of spending responsibilities applies at all levels of inter-
governmental relations, but is particularly relevant to the case of local government in
Northern Ireland because its local authorities are responsible for a much smaller range of
services than are local authorities in the rest of the UK.16 They principally provide leisure
and recreation facilities, environmental services and promote economic development.
Consequently local government expenditure is much lower than in other parts of the UK,
with a greater balance of services provided by Northern Ireland central departments. Yet,
the UK as a whole is more centralised than on average in Europe17. Though they have
few functions, Northern Ireland’s councils are, along with councils in the rest of the UK
the largest in Europe for population size18. An important question is therefore whether
there is a sufficient degree of subsidiarity in decision making in Northern Ireland.
Subsidiarity could be strengthened by decentralising more functions to local authorities,
along with adequate revenue raising powers.
15 “Finace follows function” Bahl (1999, p. 7)) 16 Knox calls it an “emasculated form of local government” (Knox, 2002, p.3) 17 Darby et al (2002, p.30) 18 Knox (2002)
13

Given the current assignment of expenditure responsibility, accountability for those local
services that are provided by local authorities is better than in other parts of the UK. Thus
Table 5 shows that 64% of current expenditure is financed by local rates. Although part
of this local funding comprises non-domestic rate, whose effective incidence does not lie
with local voters, local voters nevertheless are responsible for a much higher proportion
of local government funding than in the rest of the UK where in England, on average they
pay for only 25 of local current expenditure, and in Scotland and Wales, where they pay
for an even lower percentage.
In 2002/03 the total expenditure of local authorities was £417m, which is 6.5% of total
Departmental DEL for Northern Ireland, equal to £250 of gross expenditure per head of
population, compared to about £1,300 for England and Wales (CIPFA, 2003). Northern
Ireland Regional and District rate poundages are shown in Table 4 above. Table 7 below
shows the main categories of local government spending.
Table 7: Northern Ireland District Councils Expenditure 2002/03
% Tourism £20,112,795 6.32% Community Services £19,098,731 6.00% Refuse Collection £36,908,816 11.60% Street Cleansing £24,067,894 7.56% Economic Development £7,679,064 2.41% Other Services £210,420,516 66.11% Source: Department of the Environment.
Local government grants and equalisation In Northern Ireland, local authorities are paid both specific and general grant, as shown in
Table 4 above. The main grant paid to local authorities is called the General Grant. This
grant comprises a derating element to compensate for industrial derating, and a resources
element, which provides partial equalisation on the basis of needs versus wealth19. Needs
are calculated on a population basis on the principle that the greater the authority’s
population, the greater its needs. However, population is adjusted to take account of
19 The following section draws heavily on CIPFA (2003)
14
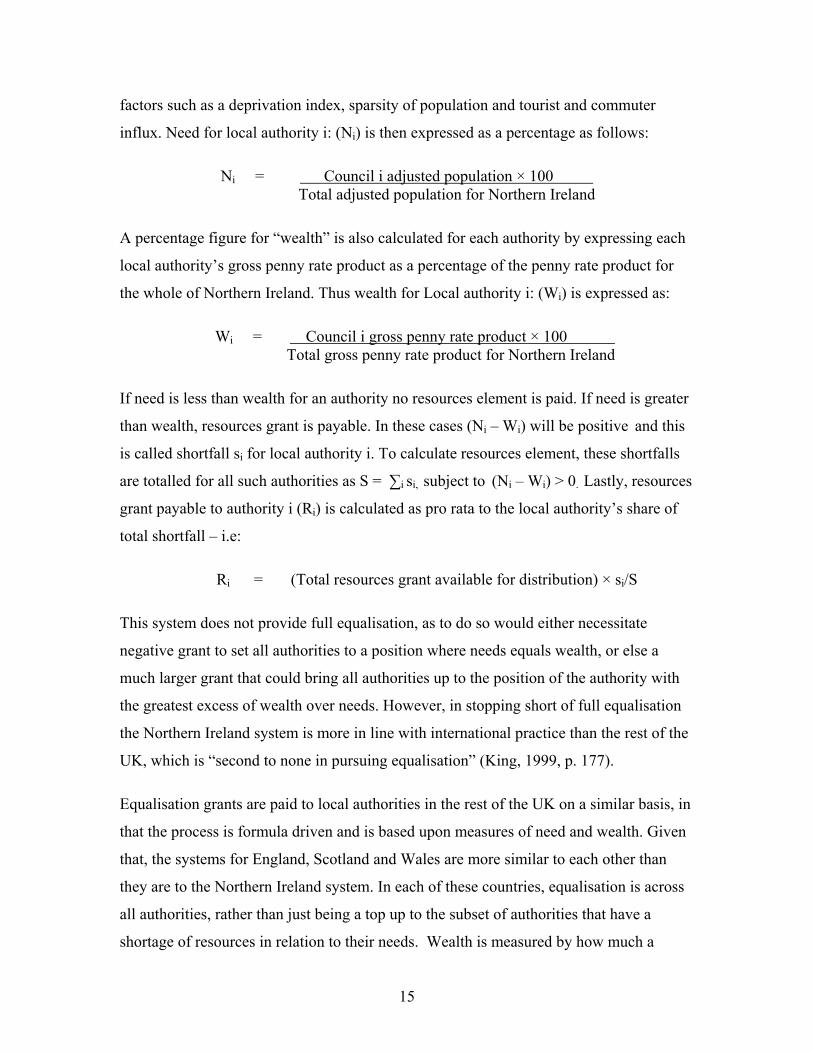
factors such as a deprivation index, sparsity of population and tourist and commuter
influx. Need for local authority i: (Ni) is then expressed as a percentage as follows:
Ni = Council i adjusted population × 100 Total adjusted population for Northern Ireland
A percentage figure for “wealth” is also calculated for each authority by expressing each
local authority’s gross penny rate product as a percentage of the penny rate product for
the whole of Northern Ireland. Thus wealth for Local authority i: (Wi) is expressed as:
Wi = Council i gross penny rate product × 100 Total gross penny rate product for Northern Ireland
If need is less than wealth for an authority no resources element is paid. If need is greater
than wealth, resources grant is payable. In these cases (Ni – Wi) will be positive and this
is called shortfall si for local authority i. To calculate resources element, these shortfalls
are totalled for all such authorities as S = ∑i si, subject to (Ni – Wi) > 0. Lastly, resources
grant payable to authority i (Ri) is calculated as pro rata to the local authority’s share of
total shortfall – i.e:
Ri = (Total resources grant available for distribution) × si/S
This system does not provide full equalisation, as to do so would either necessitate
negative grant to set all authorities to a position where needs equals wealth, or else a
much larger grant that could bring all authorities up to the position of the authority with
the greatest excess of wealth over needs. However, in stopping short of full equalisation
the Northern Ireland system is more in line with international practice than the rest of the
UK, which is “second to none in pursuing equalisation” (King, 1999, p. 177).
Equalisation grants are paid to local authorities in the rest of the UK on a similar basis, in
that the process is formula driven and is based upon measures of need and wealth. Given
that, the systems for England, Scotland and Wales are more similar to each other than
they are to the Northern Ireland system. In each of these countries, equalisation is across
all authorities, rather than just being a top up to the subset of authorities that have a
shortage of resources in relation to their needs. Wealth is measured by how much a
15

standard level of council tax will raise from the local authority’s tax base and needs are
measured by a formula structured around spending headings and client groups20.
The equalisation grant in England, Scotland and Wales is called Revenue Support Grant
(RSG) and in each country RSG is set so that if the authority spends at its centrally
assessed level of spending need, it will be able to levy a national standard level of council
tax21. This broad system of equalisation relating to needs and wealth is generally found
in most developed nations and is also prescribed by article 9 (5) of the European Charter
of Local Self-Government:
“The protection of financially weaker local authorities calls for the institution of
financial equalisation procedures or equivalent measures which are designed to
correct the effects of the unequal distribution of potential sources of finance and
of the financial burden they must support. Such procedures or measures shall not
diminish the discretion local authorities may exercise within their own sphere of
responsibility.” (Council of Europe, 1985)
An interesting example of extensive equalisation is the case of Australia, where the
Commonwealth Grants Commission equalises for both wealth and needs between states.
Because equalisation leads to gains and losses for sub units of government22 the form and
extent of equalisation, wherever practised, is usually the subject of strong political
controversy. The Commonwealth Grants Commission is an arms’ length and independent
body which may be able to take a relatively long term and non-partisan view. Appointing
such an independent body to determine intergovernmental transfers has been seen as a
possible improvement to the administration of design of mechanisms both for the
distributions of grants to devolved nations, and for the payment of equalisation grants to
UK local governments (Heald, 2003, p. 90, McLean, 2004).
20 These formulas are called Formula Spending Share (FSS) in England, Grant Aided Expenditure (GAE) in Scotland and Standard Spending Assessments (SSAs) in Wales. 21 See for example ODPM (undated) 22 Either explicitly of implicitly.
16

Lastly, although equalisation mechanisms between sub units of government are found in
most developed nations, an exception is New Zealand, where here are no arrangements
for equalisation (RPA, 2003).
Accountability and the balance of funding The proportion of local authority funding that stems from local taxes, as against the
proportion of funding that stems from central grant, is often called the balance of funding.
If the sources of taxation for each level of government match their spending
responsibilities, a state of vertical fiscal balance is said to obtain (King, 1984, p. 137).
Where local government spending responsibilities exceed their sources of taxation, as is
almost invariably the case, there will be vertical fiscal imbalance. In England there is a
high degree of vertical fiscal imbalance as local authorities receive 75% of their revenue
funding from central grant and distributed business rate and in Scotland and Wales the
proportion is slightly higher.
This contrasts strongly with local authorities in Northern Ireland, whose funding is
predominantly local, as is shown in Table 5. The balance of funding has important
implications for accountability. Accountability requires that those who decide on local
spending also pay for it. If funding is predominantly from the centre, the centre will seek
an account of the spending and wish to control it. If funding is predominantly from local
residents, this function can be performed locally and this arrangement will have
advantages in that information flows are shorter and control will be based on better
knowledge (Watt and Fender, 1999).
Looking in more detail, the question of accountability can be analysed in terms of two
concepts: marginal accountability, and overall or total accountability.23 Overall
accountability is the effect, described above, of a high proportion of central funding
leading to central scrutiny and control.
23 See Watt and Fender, 1999; and Mintz and Wilson (1991) cited in Barnett and Hutchinson (?)
17

In contrast, marginal accountability looks at the source of funding for increases (or
decreases) in expenditure at the margin. In Britain local government has full marginal
accountability because, once the grant has been announced, it is fixed, regardless of the
expenditure decisions local authorities subsequently make (Watt and Fender, 1999,
p. 17). Local authorities cannot therefore increase their central grant by increasing
spending and local residents are therefore 100% accountable at the margin. It can be
argued that marginal accountability makes expenditure capping unjustified (Fender and
Watt, 2002).
Full marginal accountability for local spending was introduced in Britain at the time of
the poll tax, and continued under the move to council tax. Northern Ireland does not have
full marginal accountability, although a move in that direction was made in April 2003.
Before that, grant payment was determined by the Local Government (Northern Ireland)
Order 1972, and the resources element acted to the effect placing the Executive in the
position of a supplementary ratepayer to councils with a low local tax base24. The reason
that the current system still does not offer full marginal accountability is that non-
domestic ratepayers, who do not have a vote, also contribute to funding at the margin
when rates are increased. In the rest of the UK, non-domestic rates are collected at a
uniform rate and distributed to local government as a fixed per capita sum that does not
vary with an authority’s expenditure.
Conclusions Local government in Northern Ireland is funded by local ratepayers, fees and charges,
borrowing and by grants that are funded ultimately by the UK government. Funding from
the UK government comes through the Northern Ireland DEL, which is determined by
the Barnett formula. Whilst the Barnett formula can be criticised, it is probably an
advantageous system from the point of view of each of the devolved nations.
Grant is used to equalise between local authorities, both to reduce disparities in wealth
and to even up their ability to meet need. Unlike the rest of the UK, grant does not fully
24 This system was the same as the old resources element of the Rate Support Grant in Britain, prior to the changes introduced at the same time as poll tax.
18

equalise in Northern Ireland, but in this respect the system is more in line with worldwide
practice than the rest of the UK.
The central/local balance of funding for local authorities in Northern Ireland is orientated
more towards local finance than the rest of the UK, and it has been argued above that this
is a desirable characteristic, as local government works best when local residents not only
vote on but also pay for local spending decisions whose benefits they receive25.
This desirable balance of funding is however, partly achieved as a result of the relatively
small number of functions assigned to local government in Northern Ireland compared to
the rest of the UK. There is therefore what might be considered a centralisation of what,
elsewhere in the UK, would be local government functions towards the Northern Ireland
administration. This centralisation may not be in line with an ideal level of subsidiarity.
The other component of this locally-orientated funding balance is local authorities’
control of the non-domestic rate, which has some drawbacks in terms of democratic
accountability.
References Bahl, J (1999) Implementation Rules for Fiscal Decentralization, Working Paper 99-1 Andrew Young School of Policy Studies, Georgia State University. http://isp-aysps.gsu.edu/papers/ispwp9901.html
Balls, E. and O’Donnell, G. (2002) Eds. Reforming Britain’s Economic and Financial Policy, Basingstoke, Palgrave.
Barnett, R and Hutchinson, G (1998) “Public expenditure on the eve of devolution” in Hard Choices Policy autonomy and priority-setting in public expenditure Report No. 10 by Democratic Dialogue, Northern Ireland Economic Council and Eastern Health and Social Services Board, http://cain.ulst.ac.uk/dd/report10/report10c.htm
Bird, R.M. (1999b) “Rethinking Subnational Taxes: A New Look at Tax Assignment”, International Monetary Fund, Fiscal Affairs Department Working Paper. http://www.imf.org/external/pubs/ft/wp/1999/wp99165.pdf
25 This point is based on a conclusion drawn by Bird (1999, especially p. 11) based on his extensive discussion of the literature.
19

CIPFA (2003) A Guide to Local Government Finance in Northern Ireland, CIPFA Northern Ireland
Council of Europe (1985) European Charter of Local Self-Government, Strasbourg. http://conventions.coe.int/Treaty/en/Treaties/Html/122.htm
Darby, J. Muscatelli, A. and Roy, G. (2002) “Fiscal Federalism and Fiscal Autonomy: Lessons for the UK from Other Industrialised Countries”, Scottish Affairs, n. 41, autumn.
DFPNI (2004) Northern Ireland Priorities and Budget 2004-2006, Department of Finance and Personnel, http://www.pfgni.gov.uk/priorities.pdf
Fender, J. and Watt, P.A. (2002) “Should central government seek to control the level of local authority expenditures?” Fiscal Studies, vol. 23, no 2. June, pp. 265-285.
Heald, D. (1996) “Formula Controlled Territorial Expenditure in the United Kingdom”, Public Finance/Finances Publiques, vol. 46, no 4, pp. 534-58
Heald, D. (1998) “Fiscal Opportunities” in Hard Choices Policy autonomy and priority-setting in public expenditure Report No. 10 by Democratic Dialogue, Northern Ireland Economic Council and Eastern Health and Social Services Board
Heald, D. (2003) Funding the Northern Ireland Assembly: Assessing the Options, Northern Ireland Economic Council, Research Monograph 10. April
Heald, D. and McLeod, A. (2002) “Fiscal Autonomy under Devolution: Introduction to Symposium”, Scottish Affairs, no. 41, Autumn, pp.5 – 25)
Heald, D. and McLeod, A. (2003) “Revenue-raising by UK Devolved Administrations in the Context of an Expenditure-based Financing System”, Regional and Federal Studies, Vol. 13, No. 4, Winter.
HM Treasury (1979) Needs Assessment Study – Report. The report of an Interdepartmental Study, co-ordinated by HM Treasury on the Relative Public Expenditure Needs in England, Scotland, Wales and Northern Ireland.
HM Treasury (1998) Modern Public Services for Britain: Investing in Reform. Comprehensive Spending Review: New Public Spending Plans 1999-2002, Cm 4011, July.
HM Treasury (1998a) Stability and Investment for the Long Term: Economic and Fiscal Strategy Report, Cm 3978, June. http://www.hm-treasury.gov.uk/documents/uk_economy/economic_and_fiscal_strategy_report_1998/ukecon_efsr_longterm.cfm
HM Treasury (1998b) Modern Public Services for Britain: Investing in Reform. Comprehensive Spending Review: New Public Spending Plans 1999-2002, Cm 4011,
20

July. http://www.hm-treasury.gov.uk/spending_review/spend_csr98/spend_csr98_index.cfm
HM Treasury (2002) Funding the Scottish Parliament, National Assembly for Wales and Northern Ireland Assembly, A Statement of Funding Policy, 3rd edn, July http://www.hm-treasury.gov.uk/media//5A6F9/funding_devolved.pdf
King, D. (1984) Fiscal Tiers, the Economics of Multi-Level Government, London, Allen and Unwin.
King, D. (1999) “Local governments in Great Britain”, in A. Fossati and G. Panella Eds. Fiscal Federalism in the European Union, Routledge, London.
Knox, C. (2002) Local Government Representation, Briefing Paper, Northern Ireland Executive, Review of Public Administration.
MacKay, R.R. (2001) “Regional Taxing and Spending: The Search for Balance”, Regional Studies, Vol. 35, no 6, pp. 563-575
McLean, I and McMillan, A, (2003) ‘The distribution of public expenditure across the UK regions’, Fiscal Studies 24:1, March, pp. 45-71.
McLean, Iain (2004) “Fiscal Federalism in Australia”, Public Administration, 82, (1), pp. 21-38,
Midwinter, A. (2002) Northern Ireland’s Expenditure Needs: A Preliminary Assessment, Research paper 81/02 Research and Library Services, Northern Ireland Assembly.
Mintz, J.M. and Wilson, T.A. (1991) “The Allocation of Tax Authority: the Canadian Federation” in R.W. Boadway, T.J. Courchene and D.D. Purvis eds, Economic Dimensions of Constitutional Change, John Deutsch Institute, Queens University, Ontario.
NIE (2002) Spending Review 2002 and What it Means for Northern Ireland’s Budget 2002, Research Paper 22/02, Research and Library Services, Northern Ireland Assembly, April.
Oates, W. (1972) Fiscal Federalism, New York, Jovanovitch.
ODPM (undated) A plain English guide to the Local Government Finance Settlement (3rd edition) http://www.local.odpm.gov.uk/finance/ssa/0001/data/plaineng.doc
Olson, M. Jr.(1969) “The Principle of ‘Fiscal Equivalence’: The Division of Responsibilities among Different Levels of Government”, American Economic Review, Vol. 59, No. 2, pp. 479
Review of Rating Policy (2003) The Rating of Vacant Property and the Removal of
21

Industrial Derating, Department of Finance and Personnel, April
RPA (2003) Study visit to New Zealand, Northern Ireland Executive, Review of Public Administration, http://www.rpani.gov.uk/studyvisit/newzealand.htm
Warleigh, A.(2002) Subsidarity, Research Briefing paper for the Northern Ireland Review of Public Administration. http://www.rpani.gov.uk/subsidiarity/index.htm
Watt, P.A. (1996) Local Government Principles and Practice, London, Witherby
Watt, P.A. and Fender, J. (1999) “Feasible changes in the UK controls on local government expenditure”, Public Money and Management, vol. 19 (3), July-September pp. 17 - 22
Watt, P.A.(2002) “Finance in the White Paper: Strong Local Leadership – Quality Public Services”, Local Governance, vol. 28, no 4, pp. 247-255.
22
Copyright © 2022 FDOKUMEN