Neural Substrates of Impaired Sensorimotor Timing in Adult Attention-Deficit/Hyperactivity Disorder
Upload
bioacademyCategory
view
4download
0
Development/Plasticity/Repair
Functional Connectivity between the Superficial and DeeperLayers of the Superior Colliculus: An Anatomical Substratefor Sensorimotor Integration
Timothy P. Doubell, Irini Skaliora, Jerome Baron, and Andrew J. KingUniversity Laboratory of Physiology, University of Oxford, Oxford OX1 3PT, United Kingdom
The superior colliculus (SC) transforms both visual and nonvisual sensory signals into motor commands that control orienting behavior.Although the afferent and efferent connections of this midbrain nucleus have been well characterized, little is know about the intrinsiccircuitry involved in sensorimotor integration. Transmission of visual signals from the superficial (sSC) to the deeper layers (dSC) of theSC has been implicated in both the triggering of orienting movements and the activity-dependent processes that align maps of differentsensory modalities during development. However, evidence for the synaptic connectivity appropriate for these functions is lacking. Inthis study, we used a variety of anatomical and physiological methods to examine the functional organization of the sSC– dSC pathway injuvenile and adult ferrets. Axonal tracing in adult ferrets showed that, as in other species, sSC neurons project topographically to the dSC,providing a route for the transmission of visual signals to the multisensory output layers of the SC. We found that sSC axons terminate ondSC neurons that stain prominently for the NR1 subunit of the NMDA receptor, a subpopulation of which were identified as tectoreticu-lospinal projection neurons. We also show that the sSC– dSC pathway is topographically organized and mediated by monosynapticexcitatory synapses even before eye opening in young ferrets, suggesting that visual signals routed via the sSC may influence the activityof dSC neurons before the emergence of their multisensory response properties. These findings indicate that superficial- to deep-layerprojections provide spatially ordered visual signals, both during development and into adulthood, directly to SC neurons that areinvolved in coordinating sensory inputs with motor outputs.
Key words: superior colliculus; sensorimotor integration; development; NMDA; predorsal bundle; whole-cell patch-clamp recordings;biotinylated dextran amine; electron microscopy
IntroductionThe capacity to use sensory information to control movementrepresents one of the primary integrative functions of the CNS.Because stimuli are often registered by more than one sensorymodality, this process typically involves the coordination andsynthesis of different sensory signals arising from a commonsource and their transformation into appropriate motorcommands.
The superior colliculus (SC) is widely used for investigatingthe principles underlying both multisensory and sensorimotorprocessing. This midbrain nucleus receives visual, auditory, andtactile inputs, encodes this information in a common coordinateframe, and uses it to initiate and guide orienting movementstoward the stimulus source (for review, see Stein et al., 1995;Sparks, 1988, 1999).
The SC comprises a purely sensory region, the superficial lay-
ers (sSC), which contain a map of the contralateral visual field,and a deeper region (dSC) in which neurons can exhibit bothsensory and motor-related activity. The receptive fields of dSCneurons are arranged to form superimposed maps of visual andauditory space and the body surface, whereas their movementfields constitute a motor map of eye and head movements (Gor-don, 1973; Sparks, 1988; Wallace et al., 1996).
Although the connections and physiological properties ofneurons in both the sSC and dSC have been studied extensively,we still have a poor understanding of how sensory signals arecombined and transformed into motor commands. This primar-ily reflects the paucity of information about the intrinsic organi-zation of the SC. For instance, anatomical (Grantyn et al., 1984;Moschovakis et al., 1988; Rhoades et al., 1989; Behan and Appell,1992; Hall and Lee, 1997; Doubell et al., 2000) and electrophysi-ological (Mooney et al., 1992; Lee et al., 1997; Isa et al., 1998;Ozen et al., 2000) studies have provided evidence for interlami-nar connections between the sSC and dSC, but their role in SCprocessing remains unclear.
Early models of sensorimotor integration proposed that visualsignals in the sSC are relayed to premotor or movement-relatedneurons in the dSC (Schiller and Stryker, 1972; Mohler andWurtz, 1976). However, the contribution of activity in the sSC tothe visual guidance of behavior remains controversial (Casa-
Received Sept. 12, 2002; revised May 2, 2003; accepted May 19, 2003.This work was supported by the Wellcome Trust. A.J.K. is a Wellcome Senior Research Fellow, and J.B. was a
Wellcome Prize Student. We are grateful for help and advice on confocal microscopy from Dr. Richard Adams.Correspondence should be addressed to Dr. Timothy P. Doubell, University Laboratory of Physiology, Parks Road,
Oxford OX1 3PT, UK. E-mail: [email protected]. Baron’s present address: Max Planck Institute for Brain Research, Deutschordenstrasse 46, D-60528 Frankfurt/
Main, Germany.Copyright © 2003 Society for Neuroscience 0270-6474/03/236596-12$15.00/0
6596 • The Journal of Neuroscience, July 23, 2003 • 23(16):6596 – 6607
grande and Diamond, 1974; Mays and Sparks, 1980; Chabli et al.,2000; Lomber et al., 2001; Isa, 2002). It has also been suggestedthat sSC activity is involved in aligning the different sensory mapsin the SC during development. Partial aspiration of the sSC inneonatal ferrets disrupts the emergence of topographic order inthe auditory map in the underlying dSC (King et al., 1998). Sim-ilar experiments in young barn owls further indicate that thedeveloping auditory space map conforms to a visual templatearising from the superficial layers of the optic tectum, the avianhomolog of the SC (Hyde and Knudsen, 2002).
Additional insights into the role of the interlaminar pathwaywill require more detailed information about the synaptic con-nectivity of sSC neurons. In this study, we show that sSC axonsmake excitatory, topographically organized contacts with dSCneurons, even before the onset of sensory function, and are there-fore well placed to coordinate the development of the differentsensory maps in the dSC. We also show that these axons termi-nate on predorsal bundle neurons that project to the brainstemand spinal cord, thus providing a direct route by which visualsignals are transformed into motor commands.
Materials and MethodsIn total, 29 darkly pigmented infant, juvenile, and adult (�1 yr of age)ferrets (Mustella putorious) were used in this study. All of the proceduresinvolving animals were approved and licensed by the United KingdomHome Office following local ethical committee review.
Carbocyanine dye tracing in fixed tissue from neonatal ferrets. Ferretsaged between postnatal day 4 (P4) and P30 were perfused with 50 ml ofPBS containing heparin (1000 U/l), followed by 250 ml of 4% parafor-maldehyde in phosphate buffer. In each case, the brain was dissected outand, after removal of the cortex, left in the same fixative at room temper-ature. Tiny crystals (�100 �m diameter) of the carbocyanine dyes 1,1�-dioctadecyl-3,3,3�,3�-tetramethylindocarbocyanine perchlorate (DiI)and 4-[4-(didecylamino)styryl]-N-methylpyridinium iodide (DiAsp)(Molecular Probes, Eugene, OR) were selected under the microscope andinserted into the dorsal surface of the SC (to label the sSC) or into theposterior tegmental commissure at the midline (to label the tectoreticu-lospinal output cells) with the aid of a syringe needle. Two combinationsof dye placements were used: DiAsp in the sSC and DiI in the posteriortegmental commissure; or DiI–DiAsp side by side in either the rostro-caudal or mediolateral plane of the sSC. The brains were left for 1– 6weeks for dye transport before sectioning and mounting in phosphatebuffer. Selected sections were photographed under the appropriate rho-damine or fluorescein filter set.
Electrophysiological recording in vitro. Coronal slices of the midbrain(500 �m) were prepared from young ferrets (n � 7) (P25–P30), as de-scribed previously (Doubell et al., 2000). Briefly, animals were deeplyanesthetized, and the brain was quickly removed and submerged in ice-cold saline containing (in mM): 124 NaCl, 26 NaHCO3, 2.5 CaCl2, 2.3KCl, 1.26 KHPO4, 1.0 MgSO4, and 10 D-glucose, bubbled with 95% O2
and 5% CO2. Slices were cut with a Vibroslice (Campden Instruments,Sileby, UK) and placed in oxygenated saline at room temperature. After30 – 60 min of incubation, the slices were transferred to the stage of anupright microscope (Axioskop FS; Zeiss, Welwyn Garden City, UK)equipped with video-enhanced differential interference contrast opticsand continuously superfused with saline. Under a low-power, 4� objec-tive, the slice boundaries and lamination of the SC were identified, anddrawn onto acetate sheets using a camera and video monitor. Recordingand stimulating electrodes were targeted to the appropriate region of theSC during the experiment, and all of the slices were subsequently pro-cessed for light microscopy. Individual cells in the dSC were visualizedwith Nomarski optics with the use of a 63� water immersion objective.Whole-cell patch-clamp recordings were made under visual control withelectrodes containing (in mM): 120 K-gluconate, 10 KCl, 10 EGTA, 10HEPES, 2 CaCl2, 2 MgCl2, and 2 ATP-Na, and 0.5% biocytin to stain therecorded neurons. The resistance of the electrodes was 8 –11 M� in the
bath solution. All of the recordings were performed at room temperature(23–24°C).
Electrical stimuli (monophasic; 0.02 msec square pulses ranging be-tween 3 and 100 V) were applied with a frequency of 0.6 –1.0 Hz througha �-shaped glass pipette filled with extracellular saline positioned in thesSC. Stimulus strength was increased gradually until an evoked EPSP wasvisible. Each file included 30 –50 repetitions of the stimulus. After con-ventional amplification (Axoclamp-2B; Axon Instruments, Foster City,CA), the data were digitized at 20 kHz and fed into a computer (PowerMac; Apple Computer, Cupertino, CA) (ITC-16 interface and Axographsoftware; Axon Instruments). EPSP latencies were measured manuallyfor each of the traces and plotted as a function of time. We used thefollowing measures to indicate the latency variability: (1) the averagelatency for all of the traces in each file, (2) the latency jitter, defined as therange (in msec) between the shortest and longest latency for a given inputonto a given cell, and (3) the SD of the latency values for any given input.We used a combination of all three measures to provide evidence fordirect connectivity of both EPSPs and IPSPs, as explained in Results.Patch pipettes were carefully detached from the cells, and the slices werefixed with 4% paraformaldehyde. Slices were resectioned at 50 �m, in-cubated in the ABC reagent (Vector Laboratories, Peterborough, UK),and processed as described below.
Tracer injections in adult ferrets: axon projections from the sSC to thedSC. Two adult ferrets was anesthetized with alphaxalone-alphadoloneacetate (Saffan; Mallinckrodt Veterinary, Uxbridge, UK), induced with 2ml/kg intramuscular injections and maintained with smaller doses of thesame anesthetic. After deflecting the skin and muscle over the skull, asmall craniotomy was made, and the overlying cortex was aspirated toreveal the midbrain. Small injections of 4% biocytin (in saline) weremade into the sSC by iontophoresis for 10 min at 5 �A on a 50% dutycycle. The aspirated space above the midbrain was filled with gel foam(Sterispon; Allen and Hanbury, London, UK), the cranial bone was re-placed, and the skin and muscle were sutured. After a survival period of20 hr, the animal was terminally anesthetized with sodium pentobarbi-tone and perfused with PBS, followed by fixative containing 4% parafor-maldehyde. Biocytin was visualized as described below for biotinylateddextran amine (BDA) in method 1, except that the midbrain was sec-tioned into 10 series, of which two were counterstained in cresyl violet.The section outline plus the laminar boundaries, injection sites, axons,and boutons within the SC were plotted for every third section using acomputer reconstruction program (Neurolucida; MicroBrightField,Colchester, VT). Plan projection maps of the main foci of terminals in theintermediate layers of the SC were prepared in the following manner. Themediolateral extent of the layer II–III boundary, together with those ofthe injection site in layer II–III and of the main terminal zone in layer IVwere plotted for every section from the rostral to the caudal end of the SC.Plotted points were connected for each pair of adjacent sections to pro-vide a dorsal view of both the injection site and the terminal zone withinthe SC.
Tracer injections in adult ferrets: colocalization of NR1 immunoreactivityand crossed tectoreticulospinal projection neurons. An additional two adultferrets were anesthetized with Saffan, and the midbrain was exposed.Glass micropipettes were back-filled with 2 �l of 5% 10 kDa BDA (Mo-lecular Probes), lysine fixable, and 100 mM NMDA (Sigma, St. Louis,MO) in 0.01 M PBS (Veenman et al., 1992; Jiang et al., 1993). The pipettewas fitted into a sealed electrode holder connected via a three-way tap toa compressed air source. The pipette was placed over the border of theinferior colliculus and cerebellum and lowered into the reticular forma-tion. A total of �500 nl was injected into the left side. The pipette wasthen left in place for 10 min before being withdrawn. After a survivalperiod of 7 d, the animals were perfused, as described above. The brainwas removed, trimmed to expose the midbrain, postfixed overnight,cryoprotected, and cut at 50 �m on a freezing microtome. After threeextensive rinses in PBS to remove unbound aldehydes, the tissue sectionswere stored at 4°C in the same buffer until additional histological pro-cessing. Every third section of the rostrocaudal series through the SC wasstained with method 1, another third was stained with method 2, and thefinal third was counterstained with cresyl violet.
Method 1 (nonfluorescent). Sections from the animals that had received
Doubell et al. • Visual Inputs to the Superior Colliculus J. Neurosci., July 23, 2003 • 23(16):6596 – 6607 • 6597
BDA injections were sequentially processed for BDA histochemistry andNMDA receptor 1 (NMDAR1) subunit immunocytochemistry, using atwo-color diaminobenzidine (DAB) protocol. As a result, nickel-intensified BDA label (blue– black precipitate) could be readily distin-guished from the NMDAR1 staining revealed by the DAB reaction prod-uct (brown precipitate).
The cellular incorporation of BDA (or biocytin) was revealed using theavidin– biotin peroxidase complex method (Vector Laboratories). Thetissue sections were incubated overnight at 4°C in the reagent solutionunder gentle agitation. The following day, they were rinsed in PBS and indistilled water. The peroxidase was visualized with a nickel-intensifiedDAB reaction to produce a dark blue– black reaction product. The sec-tions were preincubated for 10 min in a mixture of DAB (0.0125%;Sigma), nickel-ammonium sulfate (0.25%; BDH Chemicals, Poole, UK),and imidazole (0.35%; Sigma) in PBS. Hydrogen peroxidase (Sigma) wasthen added to the DAB solution at a concentration of 0.02%, and thetissue was incubated for an additional 5–15 min. The reaction wasstopped by three rinses in PBS.
For NR1 immunocytochemistry, the sections were preincubated for 1hr in 5% normal goat serum (NGS) (Vector Laboratories) and thenfurther incubated in a mouse monoclonal primary antibody (1:500 or1:600 with 1% NGS; clone 54.1; PharMingen, San Diego, CA) for 48 hr at4°C. The specificity of this primary antibody for brain tissue has beendemonstrated in several species, including adult and young ferrets (Cata-lano et al., 1997). The sections were washed in PBS and processed usinghorseradish peroxidase-conjugated goat anti-mouse IgG (Jackson Im-munoResearch, West Grove, PA). They were then rinsed, reacted in DABto produce a brown precipitate, mounted, and cleared.
Method 2 (fluorescent). Retrogradely transported BDA was visualizedusing indirect tyramide amplification and streptavidin– cyanine 5 fluo-rochrome (Cy5) (mouse; Jackson ImmunoResearch). Sections were in-cubated overnight in streptavidin-conjugated peroxidase (NEN Life Sci-ences, Boston, MA) diluted 1:500 in PBS, followed by washing in PBS andincubation in tyramide blocking buffer (NEN Life Sciences) for 1 hr.Sections were next placed into biotinylated tyramide (NEN Life Scienc-es), diluted 1:100, for 10 min and then washed in PBS. Finally, sectionswere incubated overnight in streptavidin–Cy5 (Jackson ImmunoRe-search). After washing, NR1 immunofluorescence was begun by incubat-ing sections for 48 hr in anti-NR1 (PharMingen) (diluted 1:300 in PBS).The sections were then washed in PBS and incubated for 3 hr in goatanti-mouse conjugated cyanine 2 (Cy2) (Jackson ImmunoResearch) di-luted 1:300, washed, incubated in sheep anti-goat Cy2 for 3 hr, and finallywashed again. Sections were mounted onto gelatin-subbed slides, air-dried, dehydrated, cleared in methylsalicylate, and mounted in DPXresin (BDH, Poole, UK).
Imaging of fluorescent staining was done using a scanning confocalmicroscope (Leica, Wetzlar, Germany) equipped with an air-cooledkrypton–argon laser. Cy2 fluorescence and Cy5 were scanned sequen-tially using the 488 and 647 nm excitation lines, respectively. Becauseboth excitation and emission spectra were well segregated, no bleed-through between the channels was observed in material stained singly forNR1 using Cy2 or BDA using Cy5. Two control experiments were per-formed for nonspecific staining: (1) reversal of the staining protocol (i.e.,the NR1 immunofluorescence was performed before the BDA visualiza-tion) and (2) omission of the primary antiserum and replacement bypreimmune serum. In (1), the staining pattern remained identical to thatseen before; in (2), all of the Cy2 fluorescence was lost, indicating that nocross-reaction occurred between the BDA and NR1 visualization meth-ods. Sections were kept in their rostrocaudal sequence; one of the firstfive was chosen as a random starting point, and every sixth section afterthat was used for counting labeled cells.
Projections from the sSC onto dSC cells immunoreactive for the NR1subunit. In two adult ferrets, BDA was injected into the sSC and com-bined with NR1 immunocytochemistry. Injections of BDA were made byiontophoresis, as described by Doubell et al. (2000). The brains were alsoprocessed for NR1 immunoreactivity using method 1.
Projections from the sSC onto crossed tectoreticulospinal neurons. An-other six adult ferrets were used in experiments in which two tracers wereinjected into the midbrain. BDA was injected into the left sSC and com-
bined with 10 kDa rhodamine dextran amine (RhDA) (MolecularProbes) injections into the reticular formation. BDA injections weremade as before in the sSC, and RhDA (500 nl; 10% in saline) was injectedas described above into the right reticular formation.
Four of these animals were processed for light microscopy. Briefly,they were terminally anesthetized and perfused with 4% paraformalde-hyde before their brains were removed, blocked, cryoprotected, and sec-tioned on a freezing microtome. The remaining two animals were usedfor electron microscopy (EM) and were perfused with PBS, followed by4% paraformaldehyde plus 0.5% glutaraldehyde. After postfixing over-night at 4°C, the blocked midbrain was embedded in agar (5% in saline)and sectioned on a vibratome (Ted Pella, Redding, CA).
The cellular incorporation of BDA was revealed using the avidin–biotin peroxidase complex method (Vector Laboratories) as described inmethod 1. These sections were next stained for RhDA immunocyto-chemistry. After BDA staining, sections were first blocked for 1 hr in 5%NGS (Vector Laboratories) and then incubated in a rabbit polyclonalprimary antibody against rhodamine (1:12,000 with 1% NGS; MolecularProbes) for 24 hr at 4°C. Next, the sections were washed in PBS and putinto the secondary goat anti-rabbit antibody conjugated to HRP (1:200in PBS; Vector Laboratories) for 3 hr at room temperature. After washingin PBS, the sections were reacted in diaminobenzidine (0.5 mg/ml;Sigma) and hydrogen peroxide (0.003%; Sigma). Sections for light mi-croscopy were mounted onto gelatin-subbed slides and left to air-dryovernight. Next, sections were dehydrated through graded alcohols, fol-lowed by clearing in xylene and coverslipping.
Sections for EM were washed thoroughly and incubated in 1% os-mium tetroxide (Agar Scientific, Stansted, Essex, UK) in 0.1 M phosphatebuffer for 10 min. After several washes in 0.1 M phosphate buffer, sectionswere dehydrated through a series of graded alcohols (including 70%alcohol with 1% uranyl acetate) and infiltrated with a 50/50 araldite–propylene oxide overnight and three changes through araldite resin(Agar Scientific). Finally, sections were flat-mounted onto glass slidescovered in resin, coverslipped with a small piece of acetate sheet, andpolymerized for 48 hr at 60°C in an oven.
Under the light microscope, areas of embedded SC were cut out with ascalpel blade and carefully glued flat onto araldite stubs. Ultrathin sec-tions were cut parallel to the original coronal plane of cutting with adiamond knife (Diatome, Biel, Switzerland) and mounted on formvar(Agar Scientific)-coated slot grids. Sections were analyzed on an electronmicroscope (JEOL, Welwyn Garden City, UK).
ResultsInterlaminar connections of the superior colliculus inneonatal ferretsThe organization of the descending projection from the sSC andthe relationship of these axons to neurons that provide the maincontralateral efferent pathway from the dSC were examined dur-ing the first postnatal month using carbocyanine dye tracing infixed tissue.
Placement of the DiI on the posterior tegmental commissureof P0 ferrets labeled a large wedge-shaped area of dSC cells, withthe majority located in the presumptive layer IV (Fig. 1A,B).Smaller numbers of cells were found scattered in the remainingdeeper layers, but no labeling was found in the sSC. Crystals ofDiAsp applied to the pial surface of the SC on P0 stained dorso-ventrally oriented bands of fibers that extended across the entirethickness of the SC, from the pial to the ventricular surfaces (Fig.1C,D). These fibers comprised at least two components, one ofwhich consisted of the processes of radial glial cells, which wereclosely intermeshed with axons descending from the sSC. Indi-vidual radial glial fibers, which closely resembled those reportedby Voigt (1989), using similar methods in ferret cortex, couldsometimes be seen. The labeled axon tract clearly separated fromthe glial fibers in the intermediate layers of the SC to head later-ally, following the same trajectory as the descending ipsilateralpathway from the sSC in adult ferrets (Doubell et al., 2000).
6598 • J. Neurosci., July 23, 2003 • 23(16):6596 – 6607 Doubell et al. • Visual Inputs to the Superior Colliculus
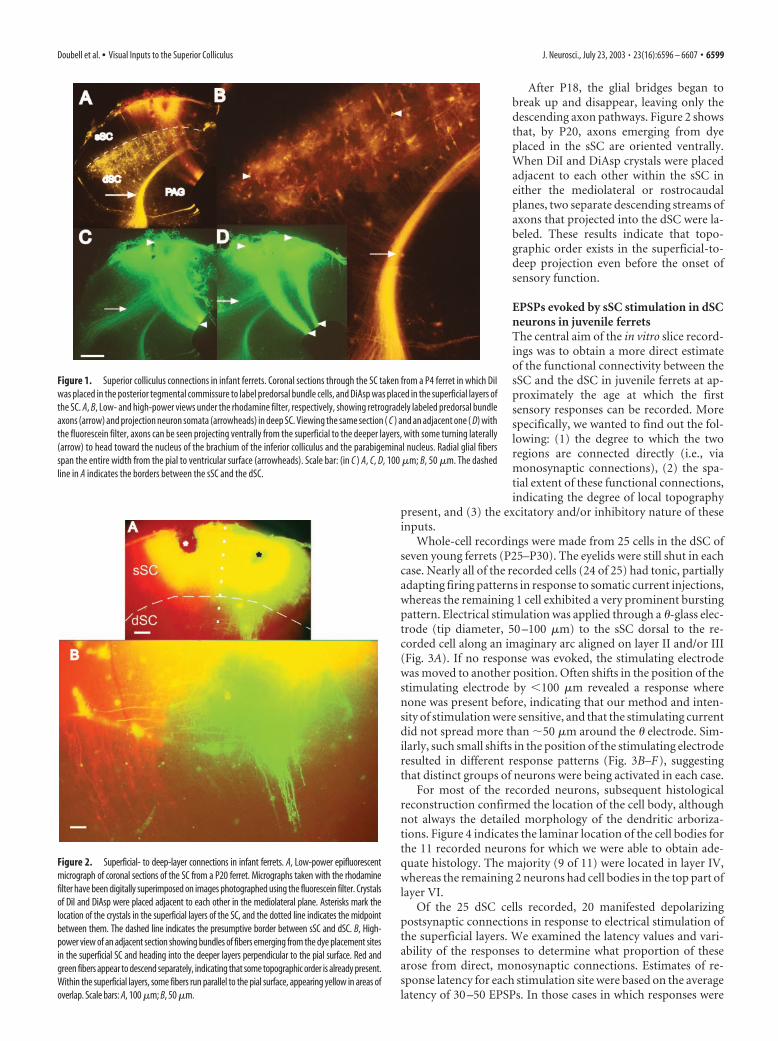
After P18, the glial bridges began tobreak up and disappear, leaving only thedescending axon pathways. Figure 2 showsthat, by P20, axons emerging from dyeplaced in the sSC are oriented ventrally.When DiI and DiAsp crystals were placedadjacent to each other within the sSC ineither the mediolateral or rostrocaudalplanes, two separate descending streams ofaxons that projected into the dSC were la-beled. These results indicate that topo-graphic order exists in the superficial-to-deep projection even before the onset ofsensory function.
EPSPs evoked by sSC stimulation in dSCneurons in juvenile ferretsThe central aim of the in vitro slice record-ings was to obtain a more direct estimateof the functional connectivity between thesSC and the dSC in juvenile ferrets at ap-proximately the age at which the firstsensory responses can be recorded. Morespecifically, we wanted to find out the fol-lowing: (1) the degree to which the tworegions are connected directly (i.e., viamonosynaptic connections), (2) the spa-tial extent of these functional connections,indicating the degree of local topography
present, and (3) the excitatory and/or inhibitory nature of theseinputs.
Whole-cell recordings were made from 25 cells in the dSC ofseven young ferrets (P25–P30). The eyelids were still shut in eachcase. Nearly all of the recorded cells (24 of 25) had tonic, partiallyadapting firing patterns in response to somatic current injections,whereas the remaining 1 cell exhibited a very prominent burstingpattern. Electrical stimulation was applied through a �-glass elec-trode (tip diameter, 50 –100 �m) to the sSC dorsal to the re-corded cell along an imaginary arc aligned on layer II and/or III(Fig. 3A). If no response was evoked, the stimulating electrodewas moved to another position. Often shifts in the position of thestimulating electrode by �100 �m revealed a response wherenone was present before, indicating that our method and inten-sity of stimulation were sensitive, and that the stimulating currentdid not spread more than �50 �m around the � electrode. Sim-ilarly, such small shifts in the position of the stimulating electroderesulted in different response patterns (Fig. 3B–F), suggestingthat distinct groups of neurons were being activated in each case.
For most of the recorded neurons, subsequent histologicalreconstruction confirmed the location of the cell body, althoughnot always the detailed morphology of the dendritic arboriza-tions. Figure 4 indicates the laminar location of the cell bodies forthe 11 recorded neurons for which we were able to obtain ade-quate histology. The majority (9 of 11) were located in layer IV,whereas the remaining 2 neurons had cell bodies in the top part oflayer VI.
Of the 25 dSC cells recorded, 20 manifested depolarizingpostsynaptic connections in response to electrical stimulation ofthe superficial layers. We examined the latency values and vari-ability of the responses to determine what proportion of thesearose from direct, monosynaptic connections. Estimates of re-sponse latency for each stimulation site were based on the averagelatency of 30 –50 EPSPs. In those cases in which responses were
Figure 1. Superior colliculus connections in infant ferrets. Coronal sections through the SC taken from a P4 ferret in which DiIwas placed in the posterior tegmental commissure to label predorsal bundle cells, and DiAsp was placed in the superficial layers ofthe SC. A, B, Low- and high-power views under the rhodamine filter, respectively, showing retrogradely labeled predorsal bundleaxons (arrow) and projection neuron somata (arrowheads) in deep SC. Viewing the same section ( C ) and an adjacent one ( D) withthe fluorescein filter, axons can be seen projecting ventrally from the superficial to the deeper layers, with some turning laterally(arrow) to head toward the nucleus of the brachium of the inferior colliculus and the parabigeminal nucleus. Radial glial fibersspan the entire width from the pial to ventricular surface (arrowheads). Scale bar: (in C ) A, C, D, 100 �m; B, 50 �m. The dashedline in A indicates the borders between the sSC and the dSC.
Figure 2. Superficial- to deep-layer connections in infant ferrets. A, Low-power epifluorescentmicrograph of coronal sections of the SC from a P20 ferret. Micrographs taken with the rhodaminefilter have been digitally superimposed on images photographed using the fluorescein filter. Crystalsof DiI and DiAsp were placed adjacent to each other in the mediolateral plane. Asterisks mark thelocation of the crystals in the superficial layers of the SC, and the dotted line indicates the midpointbetween them. The dashed line indicates the presumptive border between sSC and dSC. B, High-power view of an adjacent section showing bundles of fibers emerging from the dye placement sitesin the superficial SC and heading into the deeper layers perpendicular to the pial surface. Red andgreen fibers appear to descend separately, indicating that some topographic order is already present.Within the superficial layers, some fibers run parallel to the pial surface, appearing yellow in areas ofoverlap. Scale bars: A, 100 �m; B, 50 �m.
Doubell et al. • Visual Inputs to the Superior Colliculus J. Neurosci., July 23, 2003 • 23(16):6596 – 6607 • 6599

recorded from more than one stimulation site, the site with theshortest latency was included in the average population data,because this would be the most likely to represent monosynapticconnections.
Average response latencies ranged from 4.4 to 14.8 msec(mean � SD, 7.3 � 2.4), similar to the range reported by Isa et al.(1998) in their studies of rat SC. Several peaks were evident in thedistribution of response latency and latency variability, possiblyreflecting a combination of monosynaptic and disynaptic orpolysynaptic components (Fig. 5A,B). However, we found thatthe mean latency values did not correlate in any simple way withthe latency variability of evoked responses (Fig. 5C). Short la-tency responses (�6 msec) tended to have low jitter (�2 msec)and low SD (�1), but above this range, the correlation was poor,possibly reflecting variability in the degree of myelination of theimmature fibers. For this reason, a connection was judged to bemonosynaptic if either the average latency of 30 –50 evoked EP-SPs was �6 msec, or, for response latencies of �6 msec, if thejitter and SD of the latency were within 2 and 1 msec, respectively.The cutoff value of 6 msec was chosen for the following tworeasons: (1) using both latency variability measures, it repre-
sented the limit beyond which the relationship between latencyvariability and mean latency was no longer linear, and (2) it wasconsistent with the range for monosynaptic connections reportedpreviously (Isa et al., 1998). We further tested the monosynapticnature of these inputs by paired-pulse stimulation of the sSC at aninterval of 50 msec. The components of the EPSPs that weredesignated as monosynaptic according to the above criteria typ-ically responded to both stimulation pulses with a stable latency,whereas polysynaptic components gave reduced responses orshowed greater latency variability.
On the basis of this analysis, 13 of 20 cells recorded in the dSCwere adjudged to receive direct, monosynaptic connections fromthe sSC. Histological reconstruction was possible for 6 of these 13neurons, and, in each case, the cell bodies were located in layer IV,in keeping with the electrophysiological data of Lee et al. (1997)and Isa et al. (1998). It should be noted that these values representa conservative estimate of the incidence of direct connectivity,because the likelihood of detecting monosynaptic inputs in-creased with the number of stimulation locations tried.
This prompted us to look more carefully at the functionaltopography of these inputs. For four dSC cells from which whole-cell recordings were made, the � stimulating electrode was movedsystematically within the sSC to determine the area from whichresponses could be evoked. Figure 6 shows examples of three ofthe maps obtained, in which open circles indicate sites where stim-ulation was applied, but no response was evoked, and gray andblack-filled circles indicate locations from which identical stimula-tion conditions elicited polysynaptic and monosynaptic responses,
Figure 3. Stimulation of the superficial layers evokes EPSPs in deep-layer neurons in juvenileferrets. A, Schematic drawing of a midbrain slice cut in the coronal plane, indicating the posi-tions of the recording electrode in layer IV situated close to the border between sSC and dSC(dashed line) and the stimulating electrode in the superficial layers (sSC). The nucleus of thebrachium of the inferior colliculus (nBIC) is indicated by the dashed oval. The stimulating elec-trode was initially placed at position 1 and subsequently moved to position 2. B, Mean responsesrecorded from a layer IV cell after stimulation at sites 1 and 2. C, Examples of responses evokedfrom stimulation site 1. Two groups of traces can be distinguished, one with longer and one withshorter latency. This is better illustrated in D, in which latencies for each evoked response areplotted sequentially. Electrical stimulation at this location appeared to excite two sets of inputs,one with an average latency of 9 msec and a second with an average latency of �13 msec.Moving the � electrode to the nearby stimulation site 2 in the sSC revealed a different set ofinputs ( E) with an average latency of �7 msec ( F). Note that the response with the shorterlatency ( F) has a greater latency variability than the response with the longer latency (faster ofthe two components in D).
Figure 4. Laminar location of biocytin-filled dSC neurons from which EPSPs were recorded afterstimulation of the superficial layers. A, Camera lucida drawing of a Nissl-stained section, showing thelocation of 11 recorded neurons whose morphology was subsequently reconstructed and of the SClayers (I&II, III-VII). nBIC, Nucleus of the brachium of the inferior colliculus. B, Example of a biocytin-filled neuron that was located in layer IV. Scale bars: A, 250 �m; B, 6�m.
6600 • J. Neurosci., July 23, 2003 • 23(16):6596 – 6607 Doubell et al. • Visual Inputs to the Superior Colliculus
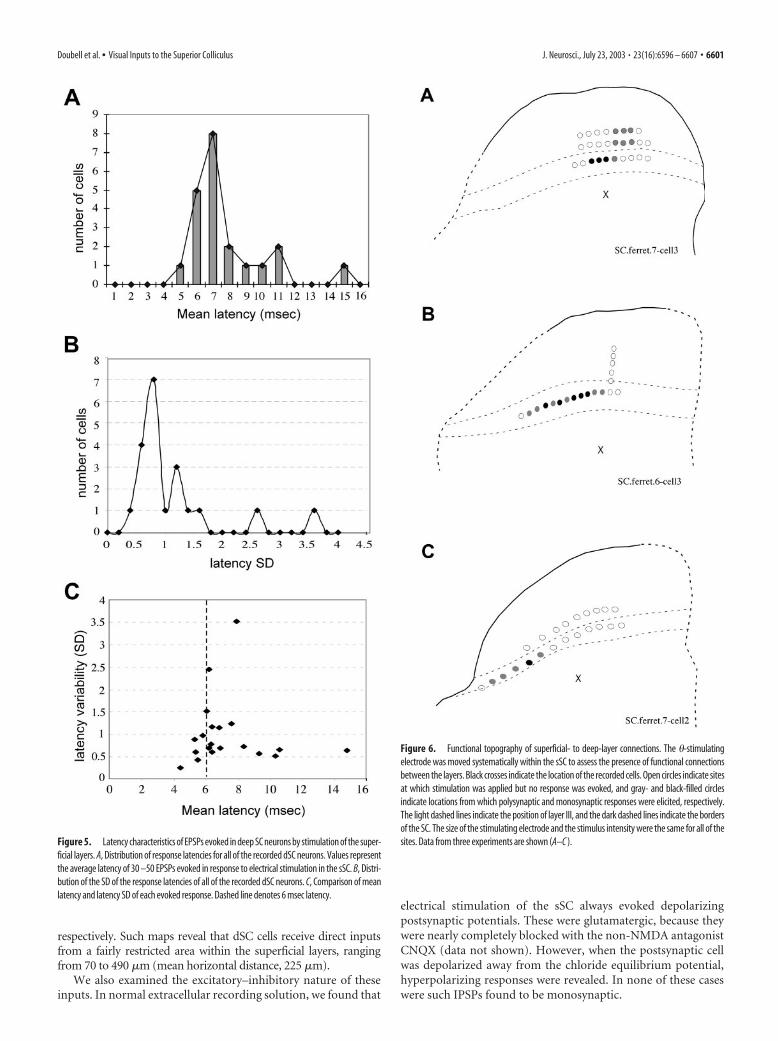
respectively. Such maps reveal that dSC cells receive direct inputsfrom a fairly restricted area within the superficial layers, rangingfrom 70 to 490 �m (mean horizontal distance, 225 �m).
We also examined the excitatory–inhibitory nature of theseinputs. In normal extracellular recording solution, we found that
electrical stimulation of the sSC always evoked depolarizingpostsynaptic potentials. These were glutamatergic, because theywere nearly completely blocked with the non-NMDA antagonistCNQX (data not shown). However, when the postsynaptic cellwas depolarized away from the chloride equilibrium potential,hyperpolarizing responses were revealed. In none of these caseswere such IPSPs found to be monosynaptic.
Figure 5. Latency characteristics of EPSPs evoked in deep SC neurons by stimulation of the super-ficial layers. A, Distribution of response latencies for all of the recorded dSC neurons. Values representthe average latency of 30 –50 EPSPs evoked in response to electrical stimulation in the sSC. B, Distri-bution of the SD of the response latencies of all of the recorded dSC neurons. C, Comparison of meanlatency and latency SD of each evoked response. Dashed line denotes 6 msec latency.
Figure 6. Functional topography of superficial- to deep-layer connections. The �-stimulatingelectrode was moved systematically within the sSC to assess the presence of functional connectionsbetween the layers. Black crosses indicate the location of the recorded cells. Open circles indicate sitesat which stimulation was applied but no response was evoked, and gray- and black-filled circlesindicate locations from which polysynaptic and monosynaptic responses were elicited, respectively.The light dashed lines indicate the position of layer III, and the dark dashed lines indicate the bordersof the SC. The size of the stimulating electrode and the stimulus intensity were the same for all of thesites. Data from three experiments are shown (A–C ).
Doubell et al. • Visual Inputs to the Superior Colliculus J. Neurosci., July 23, 2003 • 23(16):6596 – 6607 • 6601
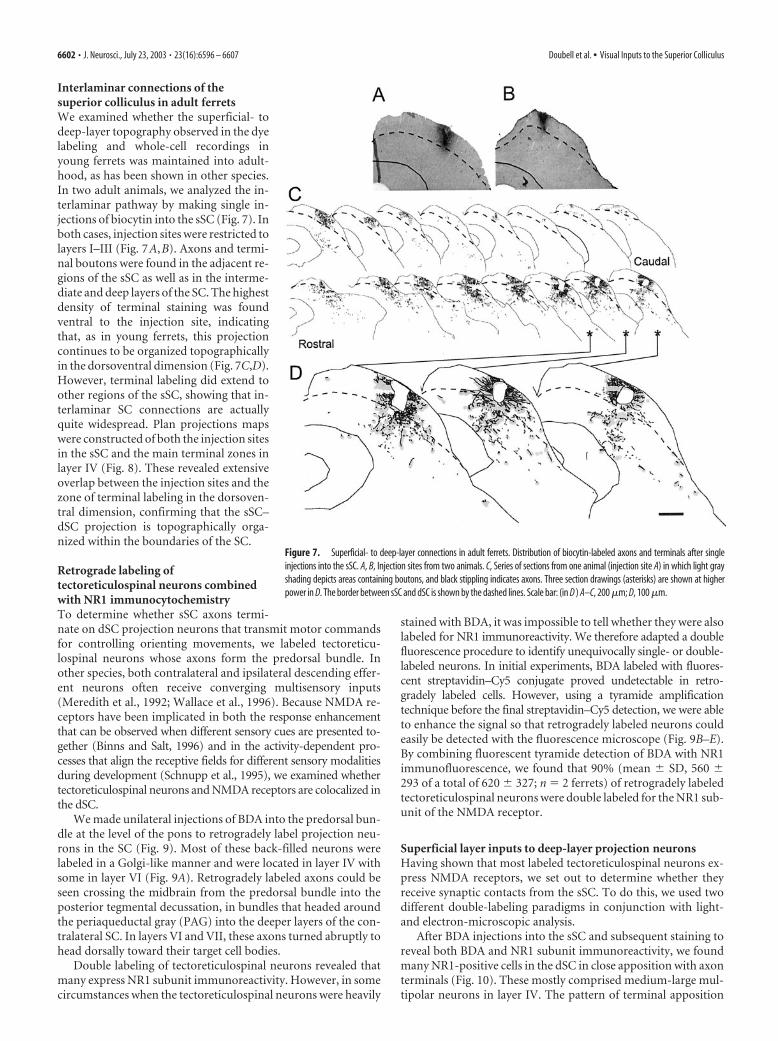
Interlaminar connections of thesuperior colliculus in adult ferretsWe examined whether the superficial- todeep-layer topography observed in the dyelabeling and whole-cell recordings inyoung ferrets was maintained into adult-hood, as has been shown in other species.In two adult animals, we analyzed the in-terlaminar pathway by making single in-jections of biocytin into the sSC (Fig. 7). Inboth cases, injection sites were restricted tolayers I–III (Fig. 7A,B). Axons and termi-nal boutons were found in the adjacent re-gions of the sSC as well as in the interme-diate and deep layers of the SC. The highestdensity of terminal staining was foundventral to the injection site, indicatingthat, as in young ferrets, this projectioncontinues to be organized topographicallyin the dorsoventral dimension (Fig. 7C,D).However, terminal labeling did extend toother regions of the sSC, showing that in-terlaminar SC connections are actuallyquite widespread. Plan projections mapswere constructed of both the injection sitesin the sSC and the main terminal zones inlayer IV (Fig. 8). These revealed extensiveoverlap between the injection sites and thezone of terminal labeling in the dorsoven-tral dimension, confirming that the sSC–dSC projection is topographically orga-nized within the boundaries of the SC.
Retrograde labeling oftectoreticulospinal neurons combinedwith NR1 immunocytochemistryTo determine whether sSC axons termi-nate on dSC projection neurons that transmit motor commandsfor controlling orienting movements, we labeled tectoreticu-lospinal neurons whose axons form the predorsal bundle. Inother species, both contralateral and ipsilateral descending effer-ent neurons often receive converging multisensory inputs(Meredith et al., 1992; Wallace et al., 1996). Because NMDA re-ceptors have been implicated in both the response enhancementthat can be observed when different sensory cues are presented to-gether (Binns and Salt, 1996) and in the activity-dependent pro-cesses that align the receptive fields for different sensory modalitiesduring development (Schnupp et al., 1995), we examined whethertectoreticulospinal neurons and NMDA receptors are colocalized inthe dSC.
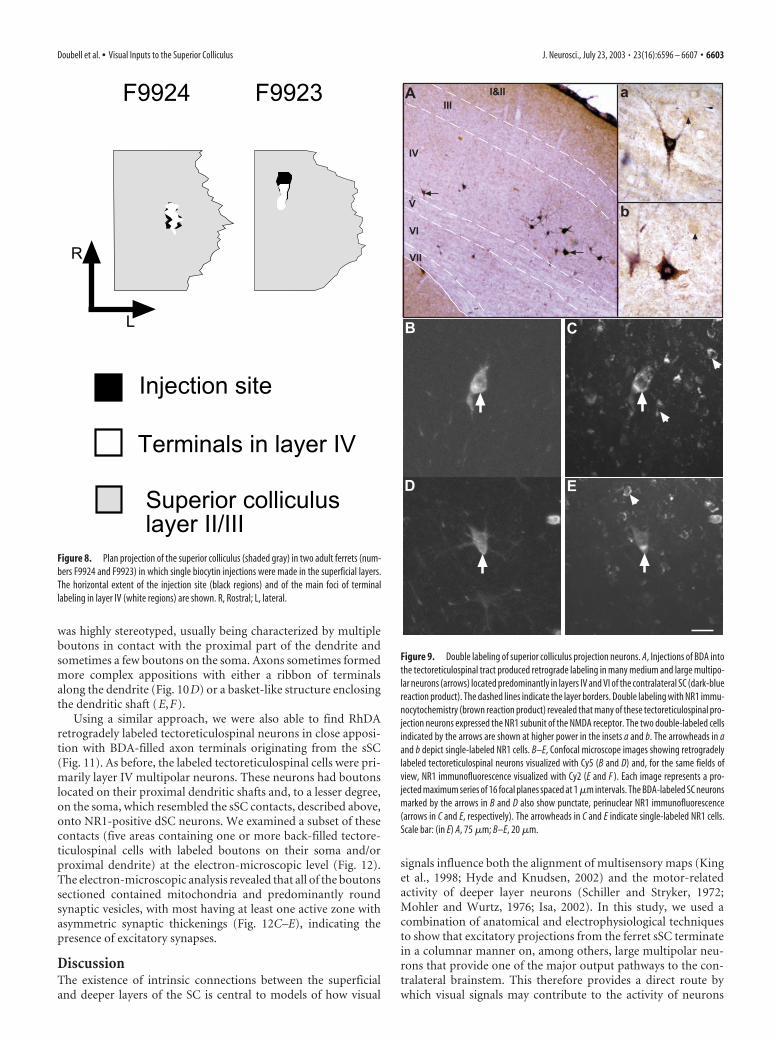
We made unilateral injections of BDA into the predorsal bun-dle at the level of the pons to retrogradely label projection neu-rons in the SC (Fig. 9). Most of these back-filled neurons werelabeled in a Golgi-like manner and were located in layer IV withsome in layer VI (Fig. 9A). Retrogradely labeled axons could beseen crossing the midbrain from the predorsal bundle into theposterior tegmental decussation, in bundles that headed aroundthe periaqueductal gray (PAG) into the deeper layers of the con-tralateral SC. In layers VI and VII, these axons turned abruptly tohead dorsally toward their target cell bodies.
Double labeling of tectoreticulospinal neurons revealed thatmany express NR1 subunit immunoreactivity. However, in somecircumstances when the tectoreticulospinal neurons were heavily
stained with BDA, it was impossible to tell whether they were alsolabeled for NR1 immunoreactivity. We therefore adapted a doublefluorescence procedure to identify unequivocally single- or double-labeled neurons. In initial experiments, BDA labeled with fluores-cent streptavidin–Cy5 conjugate proved undetectable in retro-gradely labeled cells. However, using a tyramide amplificationtechnique before the final streptavidin–Cy5 detection, we were ableto enhance the signal so that retrogradely labeled neurons couldeasily be detected with the fluorescence microscope (Fig. 9B–E).By combining fluorescent tyramide detection of BDA with NR1immunofluorescence, we found that 90% (mean � SD, 560 �293 of a total of 620 � 327; n � 2 ferrets) of retrogradely labeledtectoreticulospinal neurons were double labeled for the NR1 sub-unit of the NMDA receptor.
Superficial layer inputs to deep-layer projection neuronsHaving shown that most labeled tectoreticulospinal neurons ex-press NMDA receptors, we set out to determine whether theyreceive synaptic contacts from the sSC. To do this, we used twodifferent double-labeling paradigms in conjunction with light-and electron-microscopic analysis.
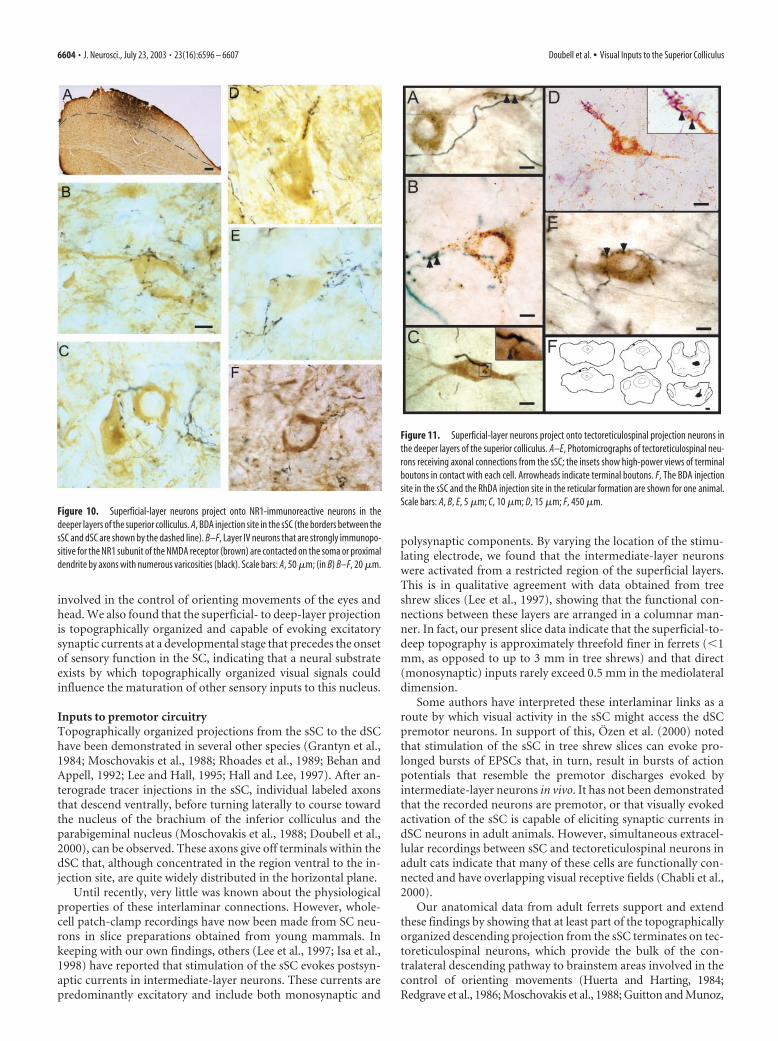
After BDA injections into the sSC and subsequent staining toreveal both BDA and NR1 subunit immunoreactivity, we foundmany NR1-positive cells in the dSC in close apposition with axonterminals (Fig. 10). These mostly comprised medium-large mul-tipolar neurons in layer IV. The pattern of terminal apposition
Figure 7. Superficial- to deep-layer connections in adult ferrets. Distribution of biocytin-labeled axons and terminals after singleinjections into the sSC. A, B, Injection sites from two animals. C, Series of sections from one animal (injection site A) in which light grayshading depicts areas containing boutons, and black stippling indicates axons. Three section drawings (asterisks) are shown at higherpower in D. The border between sSC and dSC is shown by the dashed lines. Scale bar: (in D ) A–C, 200 �m; D, 100 �m.
6602 • J. Neurosci., July 23, 2003 • 23(16):6596 – 6607 Doubell et al. • Visual Inputs to the Superior Colliculus
was highly stereotyped, usually being characterized by multipleboutons in contact with the proximal part of the dendrite andsometimes a few boutons on the soma. Axons sometimes formedmore complex appositions with either a ribbon of terminalsalong the dendrite (Fig. 10D) or a basket-like structure enclosingthe dendritic shaft (E,F).
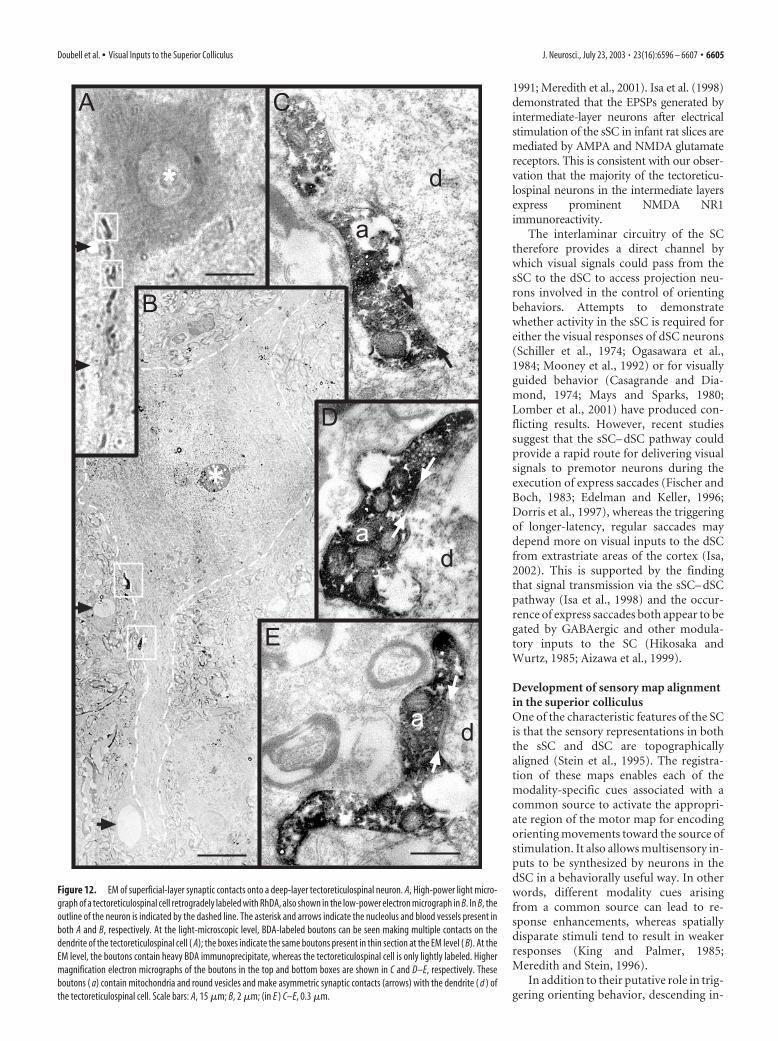
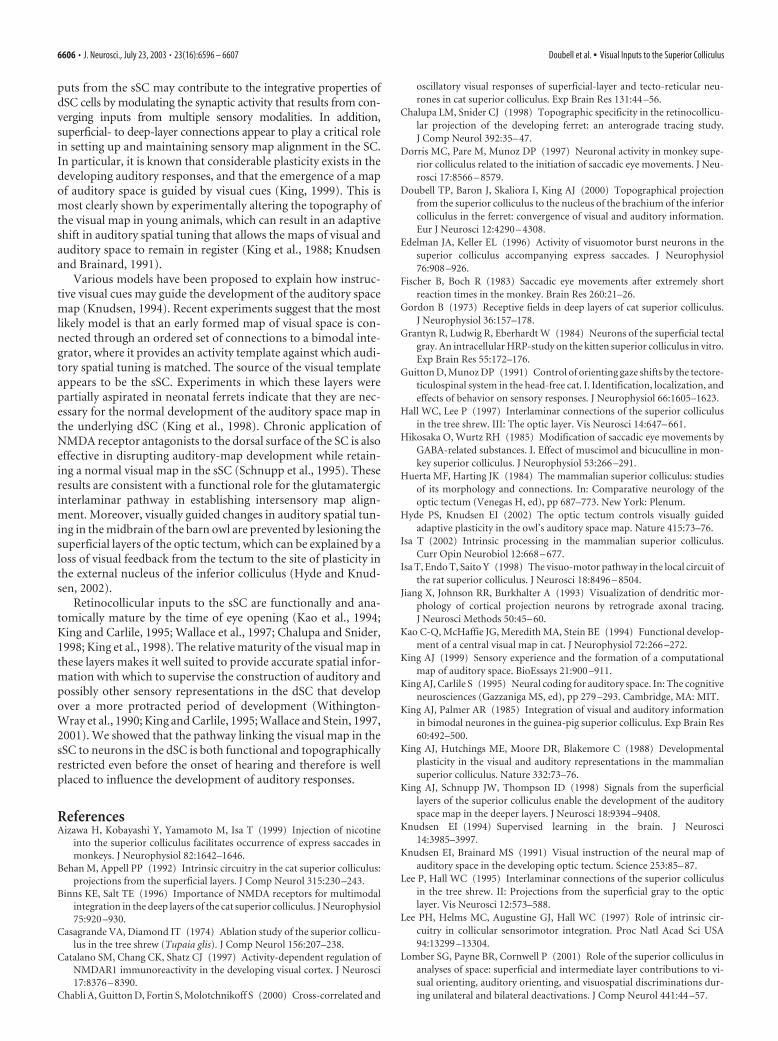
Using a similar approach, we were also able to find RhDAretrogradely labeled tectoreticulospinal neurons in close apposi-tion with BDA-filled axon terminals originating from the sSC(Fig. 11). As before, the labeled tectoreticulospinal cells were pri-marily layer IV multipolar neurons. These neurons had boutonslocated on their proximal dendritic shafts and, to a lesser degree,on the soma, which resembled the sSC contacts, described above,onto NR1-positive dSC neurons. We examined a subset of thesecontacts (five areas containing one or more back-filled tectore-ticulospinal cells with labeled boutons on their soma and/orproximal dendrite) at the electron-microscopic level (Fig. 12).The electron-microscopic analysis revealed that all of the boutonssectioned contained mitochondria and predominantly roundsynaptic vesicles, with most having at least one active zone withasymmetric synaptic thickenings (Fig. 12C–E), indicating thepresence of excitatory synapses.
DiscussionThe existence of intrinsic connections between the superficialand deeper layers of the SC is central to models of how visual
signals influence both the alignment of multisensory maps (Kinget al., 1998; Hyde and Knudsen, 2002) and the motor-relatedactivity of deeper layer neurons (Schiller and Stryker, 1972;Mohler and Wurtz, 1976; Isa, 2002). In this study, we used acombination of anatomical and electrophysiological techniquesto show that excitatory projections from the ferret sSC terminatein a columnar manner on, among others, large multipolar neu-rons that provide one of the major output pathways to the con-tralateral brainstem. This therefore provides a direct route bywhich visual signals may contribute to the activity of neurons
Figure 8. Plan projection of the superior colliculus (shaded gray) in two adult ferrets (num-bers F9924 and F9923) in which single biocytin injections were made in the superficial layers.The horizontal extent of the injection site (black regions) and of the main foci of terminallabeling in layer IV (white regions) are shown. R, Rostral; L, lateral.
Figure 9. Double labeling of superior colliculus projection neurons. A, Injections of BDA intothe tectoreticulospinal tract produced retrograde labeling in many medium and large multipo-lar neurons (arrows) located predominantly in layers IV and VI of the contralateral SC (dark-bluereaction product). The dashed lines indicate the layer borders. Double labeling with NR1 immu-nocytochemistry (brown reaction product) revealed that many of these tectoreticulospinal pro-jection neurons expressed the NR1 subunit of the NMDA receptor. The two double-labeled cellsindicated by the arrows are shown at higher power in the insets a and b. The arrowheads in aand b depict single-labeled NR1 cells. B–E, Confocal microscope images showing retrogradelylabeled tectoreticulospinal neurons visualized with Cy5 (B and D) and, for the same fields ofview, NR1 immunofluorescence visualized with Cy2 (E and F ). Each image represents a pro-jected maximum series of 16 focal planes spaced at 1 �m intervals. The BDA-labeled SC neuronsmarked by the arrows in B and D also show punctate, perinuclear NR1 immunofluorescence(arrows in C and E, respectively). The arrowheads in C and E indicate single-labeled NR1 cells.Scale bar: (in E) A, 75 �m; B–E, 20 �m.
Doubell et al. • Visual Inputs to the Superior Colliculus J. Neurosci., July 23, 2003 • 23(16):6596 – 6607 • 6603
involved in the control of orienting movements of the eyes andhead. We also found that the superficial- to deep-layer projectionis topographically organized and capable of evoking excitatorysynaptic currents at a developmental stage that precedes the onsetof sensory function in the SC, indicating that a neural substrateexists by which topographically organized visual signals couldinfluence the maturation of other sensory inputs to this nucleus.
Inputs to premotor circuitryTopographically organized projections from the sSC to the dSChave been demonstrated in several other species (Grantyn et al.,1984; Moschovakis et al., 1988; Rhoades et al., 1989; Behan andAppell, 1992; Lee and Hall, 1995; Hall and Lee, 1997). After an-terograde tracer injections in the sSC, individual labeled axonsthat descend ventrally, before turning laterally to course towardthe nucleus of the brachium of the inferior colliculus and theparabigeminal nucleus (Moschovakis et al., 1988; Doubell et al.,2000), can be observed. These axons give off terminals within thedSC that, although concentrated in the region ventral to the in-jection site, are quite widely distributed in the horizontal plane.
Until recently, very little was known about the physiologicalproperties of these interlaminar connections. However, whole-cell patch-clamp recordings have now been made from SC neu-rons in slice preparations obtained from young mammals. Inkeeping with our own findings, others (Lee et al., 1997; Isa et al.,1998) have reported that stimulation of the sSC evokes postsyn-aptic currents in intermediate-layer neurons. These currents arepredominantly excitatory and include both monosynaptic and
polysynaptic components. By varying the location of the stimu-lating electrode, we found that the intermediate-layer neuronswere activated from a restricted region of the superficial layers.This is in qualitative agreement with data obtained from treeshrew slices (Lee et al., 1997), showing that the functional con-nections between these layers are arranged in a columnar man-ner. In fact, our present slice data indicate that the superficial-to-deep topography is approximately threefold finer in ferrets (�1mm, as opposed to up to 3 mm in tree shrews) and that direct(monosynaptic) inputs rarely exceed 0.5 mm in the mediolateraldimension.
Some authors have interpreted these interlaminar links as aroute by which visual activity in the sSC might access the dSCpremotor neurons. In support of this, Ozen et al. (2000) notedthat stimulation of the sSC in tree shrew slices can evoke pro-longed bursts of EPSCs that, in turn, result in bursts of actionpotentials that resemble the premotor discharges evoked byintermediate-layer neurons in vivo. It has not been demonstratedthat the recorded neurons are premotor, or that visually evokedactivation of the sSC is capable of eliciting synaptic currents indSC neurons in adult animals. However, simultaneous extracel-lular recordings between sSC and tectoreticulospinal neurons inadult cats indicate that many of these cells are functionally con-nected and have overlapping visual receptive fields (Chabli et al.,2000).
Our anatomical data from adult ferrets support and extendthese findings by showing that at least part of the topographicallyorganized descending projection from the sSC terminates on tec-toreticulospinal neurons, which provide the bulk of the con-tralateral descending pathway to brainstem areas involved in thecontrol of orienting movements (Huerta and Harting, 1984;Redgrave et al., 1986; Moschovakis et al., 1988; Guitton and Munoz,
Figure 10. Superficial-layer neurons project onto NR1-immunoreactive neurons in thedeeper layers of the superior colliculus. A, BDA injection site in the sSC (the borders between thesSC and dSC are shown by the dashed line). B–F, Layer IV neurons that are strongly immunopo-sitive for the NR1 subunit of the NMDA receptor (brown) are contacted on the soma or proximaldendrite by axons with numerous varicosities (black). Scale bars: A, 50 �m; (in B) B–F, 20 �m.
Figure 11. Superficial-layer neurons project onto tectoreticulospinal projection neurons inthe deeper layers of the superior colliculus. A–E, Photomicrographs of tectoreticulospinal neu-rons receiving axonal connections from the sSC; the insets show high-power views of terminalboutons in contact with each cell. Arrowheads indicate terminal boutons. F, The BDA injectionsite in the sSC and the RhDA injection site in the reticular formation are shown for one animal.Scale bars: A, B, E, 5 �m; C, 10 �m; D, 15 �m; F, 450 �m.
6604 • J. Neurosci., July 23, 2003 • 23(16):6596 – 6607 Doubell et al. • Visual Inputs to the Superior Colliculus
1991; Meredith et al., 2001). Isa et al. (1998)demonstrated that the EPSPs generated byintermediate-layer neurons after electricalstimulation of the sSC in infant rat slices aremediated by AMPA and NMDA glutamatereceptors. This is consistent with our obser-vation that the majority of the tectoreticu-lospinal neurons in the intermediate layersexpress prominent NMDA NR1immunoreactivity.
The interlaminar circuitry of the SCtherefore provides a direct channel bywhich visual signals could pass from thesSC to the dSC to access projection neu-rons involved in the control of orientingbehaviors. Attempts to demonstratewhether activity in the sSC is required foreither the visual responses of dSC neurons(Schiller et al., 1974; Ogasawara et al.,1984; Mooney et al., 1992) or for visuallyguided behavior (Casagrande and Dia-mond, 1974; Mays and Sparks, 1980;Lomber et al., 2001) have produced con-flicting results. However, recent studiessuggest that the sSC– dSC pathway couldprovide a rapid route for delivering visualsignals to premotor neurons during theexecution of express saccades (Fischer andBoch, 1983; Edelman and Keller, 1996;Dorris et al., 1997), whereas the triggeringof longer-latency, regular saccades maydepend more on visual inputs to the dSCfrom extrastriate areas of the cortex (Isa,2002). This is supported by the findingthat signal transmission via the sSC– dSCpathway (Isa et al., 1998) and the occur-rence of express saccades both appear to begated by GABAergic and other modula-tory inputs to the SC (Hikosaka andWurtz, 1985; Aizawa et al., 1999).
Development of sensory map alignmentin the superior colliculusOne of the characteristic features of the SCis that the sensory representations in boththe sSC and dSC are topographicallyaligned (Stein et al., 1995). The registra-tion of these maps enables each of themodality-specific cues associated with acommon source to activate the appropri-ate region of the motor map for encodingorienting movements toward the source ofstimulation. It also allows multisensory in-puts to be synthesized by neurons in thedSC in a behaviorally useful way. In otherwords, different modality cues arisingfrom a common source can lead to re-sponse enhancements, whereas spatiallydisparate stimuli tend to result in weakerresponses (King and Palmer, 1985;Meredith and Stein, 1996).
In addition to their putative role in trig-gering orienting behavior, descending in-
Figure 12. EM of superficial-layer synaptic contacts onto a deep-layer tectoreticulospinal neuron. A, High-power light micro-graph of a tectoreticulospinal cell retrogradely labeled with RhDA, also shown in the low-power electron micrograph in B. In B, theoutline of the neuron is indicated by the dashed line. The asterisk and arrows indicate the nucleolus and blood vessels present inboth A and B, respectively. At the light-microscopic level, BDA-labeled boutons can be seen making multiple contacts on thedendrite of the tectoreticulospinal cell ( A); the boxes indicate the same boutons present in thin section at the EM level ( B). At theEM level, the boutons contain heavy BDA immunoprecipitate, whereas the tectoreticulospinal cell is only lightly labeled. Highermagnification electron micrographs of the boutons in the top and bottom boxes are shown in C and D–E, respectively. Theseboutons ( a) contain mitochondria and round vesicles and make asymmetric synaptic contacts (arrows) with the dendrite ( d ) ofthe tectoreticulospinal cell. Scale bars: A, 15 �m; B, 2 �m; (in E ) C–E, 0.3 �m.
Doubell et al. • Visual Inputs to the Superior Colliculus J. Neurosci., July 23, 2003 • 23(16):6596 – 6607 • 6605
puts from the sSC may contribute to the integrative properties ofdSC cells by modulating the synaptic activity that results from con-verging inputs from multiple sensory modalities. In addition,superficial- to deep-layer connections appear to play a critical rolein setting up and maintaining sensory map alignment in the SC.In particular, it is known that considerable plasticity exists in thedeveloping auditory responses, and that the emergence of a mapof auditory space is guided by visual cues (King, 1999). This ismost clearly shown by experimentally altering the topography ofthe visual map in young animals, which can result in an adaptiveshift in auditory spatial tuning that allows the maps of visual andauditory space to remain in register (King et al., 1988; Knudsenand Brainard, 1991).
Various models have been proposed to explain how instruc-tive visual cues may guide the development of the auditory spacemap (Knudsen, 1994). Recent experiments suggest that the mostlikely model is that an early formed map of visual space is con-nected through an ordered set of connections to a bimodal inte-grator, where it provides an activity template against which audi-tory spatial tuning is matched. The source of the visual templateappears to be the sSC. Experiments in which these layers werepartially aspirated in neonatal ferrets indicate that they are nec-essary for the normal development of the auditory space map inthe underlying dSC (King et al., 1998). Chronic application ofNMDA receptor antagonists to the dorsal surface of the SC is alsoeffective in disrupting auditory-map development while retain-ing a normal visual map in the sSC (Schnupp et al., 1995). Theseresults are consistent with a functional role for the glutamatergicinterlaminar pathway in establishing intersensory map align-ment. Moreover, visually guided changes in auditory spatial tun-ing in the midbrain of the barn owl are prevented by lesioning thesuperficial layers of the optic tectum, which can be explained by aloss of visual feedback from the tectum to the site of plasticity inthe external nucleus of the inferior colliculus (Hyde and Knud-sen, 2002).
Retinocollicular inputs to the sSC are functionally and ana-tomically mature by the time of eye opening (Kao et al., 1994;King and Carlile, 1995; Wallace et al., 1997; Chalupa and Snider,1998; King et al., 1998). The relative maturity of the visual map inthese layers makes it well suited to provide accurate spatial infor-mation with which to supervise the construction of auditory andpossibly other sensory representations in the dSC that developover a more protracted period of development (Withington-Wray et al., 1990; King and Carlile, 1995; Wallace and Stein, 1997,2001). We showed that the pathway linking the visual map in thesSC to neurons in the dSC is both functional and topographicallyrestricted even before the onset of hearing and therefore is wellplaced to influence the development of auditory responses.
ReferencesAizawa H, Kobayashi Y, Yamamoto M, Isa T (1999) Injection of nicotine
into the superior colliculus facilitates occurrence of express saccades inmonkeys. J Neurophysiol 82:1642–1646.
Behan M, Appell PP (1992) Intrinsic circuitry in the cat superior colliculus:projections from the superficial layers. J Comp Neurol 315:230 –243.
Binns KE, Salt TE (1996) Importance of NMDA receptors for multimodalintegration in the deep layers of the cat superior colliculus. J Neurophysiol75:920 –930.
Casagrande VA, Diamond IT (1974) Ablation study of the superior collicu-lus in the tree shrew (Tupaia glis). J Comp Neurol 156:207–238.
Catalano SM, Chang CK, Shatz CJ (1997) Activity-dependent regulation ofNMDAR1 immunoreactivity in the developing visual cortex. J Neurosci17:8376 – 8390.
Chabli A, Guitton D, Fortin S, Molotchnikoff S (2000) Cross-correlated and
oscillatory visual responses of superficial-layer and tecto-reticular neu-rones in cat superior colliculus. Exp Brain Res 131:44 –56.
Chalupa LM, Snider CJ (1998) Topographic specificity in the retinocollicu-lar projection of the developing ferret: an anterograde tracing study.J Comp Neurol 392:35– 47.
Dorris MC, Pare M, Munoz DP (1997) Neuronal activity in monkey supe-rior colliculus related to the initiation of saccadic eye movements. J Neu-rosci 17:8566 – 8579.
Doubell TP, Baron J, Skaliora I, King AJ (2000) Topographical projectionfrom the superior colliculus to the nucleus of the brachium of the inferiorcolliculus in the ferret: convergence of visual and auditory information.Eur J Neurosci 12:4290 – 4308.
Edelman JA, Keller EL (1996) Activity of visuomotor burst neurons in thesuperior colliculus accompanying express saccades. J Neurophysiol76:908 –926.
Fischer B, Boch R (1983) Saccadic eye movements after extremely shortreaction times in the monkey. Brain Res 260:21–26.
Gordon B (1973) Receptive fields in deep layers of cat superior colliculus.J Neurophysiol 36:157–178.
Grantyn R, Ludwig R, Eberhardt W (1984) Neurons of the superficial tectalgray. An intracellular HRP-study on the kitten superior colliculus in vitro.Exp Brain Res 55:172–176.
Guitton D, Munoz DP (1991) Control of orienting gaze shifts by the tectore-ticulospinal system in the head-free cat. I. Identification, localization, andeffects of behavior on sensory responses. J Neurophysiol 66:1605–1623.
Hall WC, Lee P (1997) Interlaminar connections of the superior colliculusin the tree shrew. III: The optic layer. Vis Neurosci 14:647– 661.
Hikosaka O, Wurtz RH (1985) Modification of saccadic eye movements byGABA-related substances. I. Effect of muscimol and bicuculline in mon-key superior colliculus. J Neurophysiol 53:266 –291.
Huerta MF, Harting JK (1984) The mammalian superior colliculus: studiesof its morphology and connections. In: Comparative neurology of theoptic tectum (Venegas H, ed), pp 687–773. New York: Plenum.
Hyde PS, Knudsen EI (2002) The optic tectum controls visually guidedadaptive plasticity in the owl’s auditory space map. Nature 415:73–76.
Isa T (2002) Intrinsic processing in the mammalian superior colliculus.Curr Opin Neurobiol 12:668 – 677.
Isa T, Endo T, Saito Y (1998) The visuo-motor pathway in the local circuit ofthe rat superior colliculus. J Neurosci 18:8496 – 8504.
Jiang X, Johnson RR, Burkhalter A (1993) Visualization of dendritic mor-phology of cortical projection neurons by retrograde axonal tracing.J Neurosci Methods 50:45– 60.
Kao C-Q, McHaffie JG, Meredith MA, Stein BE (1994) Functional develop-ment of a central visual map in cat. J Neurophysiol 72:266 –272.
King AJ (1999) Sensory experience and the formation of a computationalmap of auditory space. BioEssays 21:900 –911.
King AJ, Carlile S (1995) Neural coding for auditory space. In: The cognitiveneurosciences (Gazzaniga MS, ed), pp 279 –293. Cambridge, MA: MIT.
King AJ, Palmer AR (1985) Integration of visual and auditory informationin bimodal neurones in the guinea-pig superior colliculus. Exp Brain Res60:492–500.
King AJ, Hutchings ME, Moore DR, Blakemore C (1988) Developmentalplasticity in the visual and auditory representations in the mammaliansuperior colliculus. Nature 332:73–76.
King AJ, Schnupp JW, Thompson ID (1998) Signals from the superficiallayers of the superior colliculus enable the development of the auditoryspace map in the deeper layers. J Neurosci 18:9394 –9408.
Knudsen EI (1994) Supervised learning in the brain. J Neurosci14:3985–3997.
Knudsen EI, Brainard MS (1991) Visual instruction of the neural map ofauditory space in the developing optic tectum. Science 253:85– 87.
Lee P, Hall WC (1995) Interlaminar connections of the superior colliculusin the tree shrew. II: Projections from the superficial gray to the opticlayer. Vis Neurosci 12:573–588.
Lee PH, Helms MC, Augustine GJ, Hall WC (1997) Role of intrinsic cir-cuitry in collicular sensorimotor integration. Proc Natl Acad Sci USA94:13299 –13304.
Lomber SG, Payne BR, Cornwell P (2001) Role of the superior colliculus inanalyses of space: superficial and intermediate layer contributions to vi-sual orienting, auditory orienting, and visuospatial discriminations dur-ing unilateral and bilateral deactivations. J Comp Neurol 441:44 –57.
6606 • J. Neurosci., July 23, 2003 • 23(16):6596 – 6607 Doubell et al. • Visual Inputs to the Superior Colliculus
Mays LE, Sparks DL (1980) Dissociation of visual and saccade-related re-sponses in superior colliculus neurons. J Neurophysiol 43:207–232.
Meredith MA, Stein BE (1996) Spatial determinants of multisensory inte-gration in cat superior colliculus neurons. J Neurophysiol 75:1843–1857.
Meredith MA, Wallace MT, Stein BE (1992) Visual, auditory and somato-sensory convergence in output neurons of the cat superior colliculus:multisensory properties of the tecto-reticulo-spinal projection. Exp BrainRes 88:181–186.
Meredith MA, Miller LK, Ramoa AS, Clemo HR, Behan M (2001) Organi-zation of the neurons of origin of the descending pathways from the ferretsuperior colliculus. Neurosci Res 40:301–313.
Mohler CW, Wurtz RH (1976) Organization of monkey superior colliculus:intermediate layer cells discharging before eye movements. J Neuro-physiol 39:722–744.
Mooney RD, Huang X, Rhoades RW (1992) Functional influence of inter-laminar connections in the hamster’s superior colliculus. J Neurosci12:2417–2432.
Moschovakis AK, Karabelas AB, Highstein SM (1988) Structure-functionrelationships in the primate superior colliculus. I. Morphological classifi-cation of efferent neurons. J Neurophysiol 60:232–262.
Ogasawara K, McHaffie JG, Stein BE (1984) Two visual corticotectal sys-tems in cat. J Neurophysiol 52:1226 –1245.
Ozen G, Augustine GJ, Hall WC (2000) Contribution of superficial layerneurons to premotor bursts in the superior colliculus. J Neurophysiol84:460 – 471.
Redgrave P, Odekunle A, Dean P (1986) Tectal cells of origin of tectoreticu-lar in rat: location and segregation from ipsilateral descending pathway.Exp Brain Res 63:279 –293.
Rhoades RW, Mooney RD, Rohrer WH, Nikoletseas MM, Fish SE (1989) Or-ganization of the projection from the superficial to the deep layers of thehamster’s superior colliculus as demonstrated by the anterograde transport ofPhaseolus vulgaris leucoagglutinin. J Comp Neurol 283:54–70.
Schiller PH, Stryker M (1972) Single-unit recording and stimulation in su-perior colliculus of the alert rhesus monkey. J Neurophysiol 35:915–924.
Schiller PH, Stryker M, Cynader M, Berman N (1974) Response character-istics of single cells in the monkey superior colliculus following ablation orcooling of visual cortex. J Neurophysiol 37:181–194.
Schnupp JWH, King AJ, Smith AL, Thompson ID (1995) NMDA-receptorantagonists disrupt the formation of the auditory space map in the mam-malian superior colliculus. J Neurosci 15:1516 –1531.
Sparks DL (1988) Neural cartography: sensory and motor maps in the su-perior colliculus. Brain Behav Evol 31:49 –56.
Sparks DL (1999) Conceptual issues related to the role of the superior col-liculus in the control of gaze. Curr Opin Neurobiol 9:698 –707.
Stein BE, Wallace MT, Meredith MA (1995) Neural mechanisms mediatingattention and orientation to multisensory cues. In: The cognitive neuro-sciences (Gazzaniga MA, ed), pp 683–702. Cambridge, MA: MIT.
Veenman CL, Reiner A, Honig MG (1992) Biotinylated dextran amine as ananterograde tracer for single- and double-labeling studies. J NeurosciMethods 41:239 –254.
Voigt T (1989) Development of glial cells in the cerebral wall of ferrets:direct tracing of their transformation from radial glia into astrocytes.J Comp Neurol 289:74 – 88.
Wallace MT, Stein BE (1997) Development of multisensory neurons andmultisensory integration in cat superior colliculus. J Neurosci17:2429 –2444.
Wallace MT, Stein BE (2001) Sensory and multisensory responses in thenewborn monkey superior colliculus. J Neurosci 21:8886 – 8894.
Wallace MT, Wilkinson LK, Stein BE (1996) Representation and integra-tion of multiple sensory inputs in primate superior colliculus. J Neuro-physiol 76:1246 –1266.
Wallace MT, McHaffie JG, Stein BE (1997) Visual response properties andvisuotopic representation in the newborn monkey superior colliculus.J Neurophysiol 78:2732–2741.
Withington-Wray DJ, Binns KE, Keating MJ (1990) The developmentalemergence of a map of auditory space in the superior colliculus of theguinea pig. Brain Res Dev Brain Res 51:225–236.
Doubell et al. • Visual Inputs to the Superior Colliculus J. Neurosci., July 23, 2003 • 23(16):6596 – 6607 • 6607
Copyright © 2022 FDOKUMEN