FULL REPORT AAS
23
1.0 INTRODUCTION Calcium is a mineral abundantly found in the human body. It is the main constituent of the skeleton and helps in the formation and maintenance of our bones and teeth. Calcium plays a significant role in the contraction of muscles and secretion of certain hormones and enzymes. The expansion and contraction of blood vessels depends on calcium, it also plays an important role in the clotting of blood. This mineral is also required for muscle contractions and relaxation, nerve and hormone function, and blood pressure regulation. When calcium levels fall too low, the calcium is transferred from the bones to the blood in order to maintain the blood calcium level. Thus, nerve and muscle impairments can result. In contrast, receiving higher amounts of calcium over a long period of time raises the risk of kidney stones in some people. Therefore, calcium plays a very crucial role in the functioning of the body and it should be consumed in sufficient amounts regularly. In this experiment, the calcium content in a commercial tablet is determined by using Atomic-absorption spectroscopy (AAS) method. AAS uses the absorption of light to measure the concentration of gas-phase atoms. Since samples are usually liquids or solids, the analyte atoms or ions must be vaporized in a flame or graphite furnace. AAS is an instrument that is used to measure the amount of radiation energy absorbed by a ground-state atom in a flame for these energy transitions. The light source
Transcript of FULL REPORT AAS

1.0 INTRODUCTION
Calcium is a mineral abundantly found in the human body. It is
the main constituent of the skeleton and helps in the formation
and maintenance of our bones and teeth. Calcium plays a
significant role in the contraction of muscles and secretion of
certain hormones and enzymes. The expansion and contraction of
blood vessels depends on calcium, it also plays an important role
in the clotting of blood. This mineral is also required for
muscle contractions and relaxation, nerve and hormone function,
and blood pressure regulation. When calcium levels fall too low,
the calcium is transferred from the bones to the blood in order
to maintain the blood calcium level. Thus, nerve and muscle
impairments can result. In contrast, receiving higher amounts of
calcium over a long period of time raises the risk of kidney
stones in some people. Therefore, calcium plays a very crucial
role in the functioning of the body and it should be consumed in
sufficient amounts regularly.
In this experiment, the calcium content in a commercial
tablet is determined by using Atomic-absorption spectroscopy
(AAS) method. AAS uses the absorption of light to measure the
concentration of gas-phase atoms. Since samples are usually
liquids or solids, the analyte atoms or ions must be vaporized in
a flame or graphite furnace. AAS is an instrument that is used to
measure the amount of radiation energy absorbed by a ground-state
atom in a flame for these energy transitions. The light source
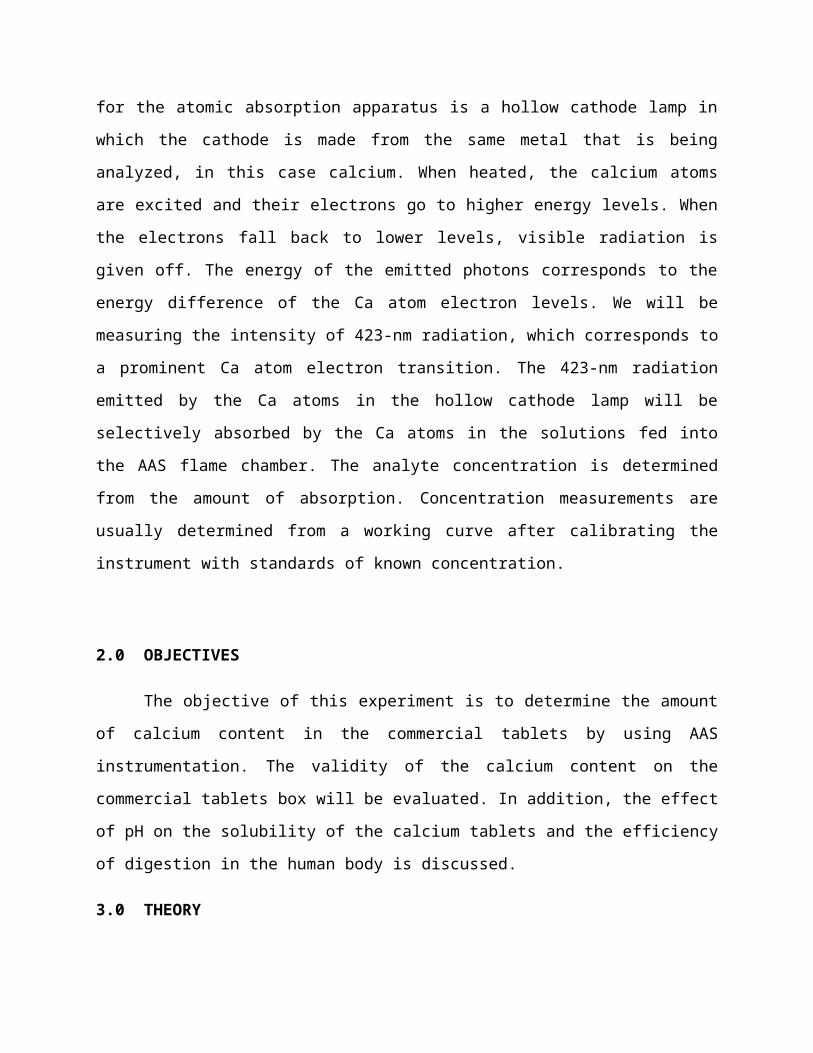
for the atomic absorption apparatus is a hollow cathode lamp in
which the cathode is made from the same metal that is being
analyzed, in this case calcium. When heated, the calcium atoms
are excited and their electrons go to higher energy levels. When
the electrons fall back to lower levels, visible radiation is
given off. The energy of the emitted photons corresponds to the
energy difference of the Ca atom electron levels. We will be
measuring the intensity of 423-nm radiation, which corresponds to
a prominent Ca atom electron transition. The 423-nm radiation
emitted by the Ca atoms in the hollow cathode lamp will be
selectively absorbed by the Ca atoms in the solutions fed into
the AAS flame chamber. The analyte concentration is determined
from the amount of absorption. Concentration measurements are
usually determined from a working curve after calibrating the
instrument with standards of known concentration.
2.0 OBJECTIVES
The objective of this experiment is to determine the amount
of calcium content in the commercial tablets by using AAS
instrumentation. The validity of the calcium content on the
commercial tablets box will be evaluated. In addition, the effect
of pH on the solubility of the calcium tablets and the efficiency
of digestion in the human body is discussed.
3.0 THEORY

Atomic Absorption Spectroscopy is an analytical technique used
for the qualitative and quantitative determination of the
elements present in different samples like food, nonmaterial,
biomaterials, forensics, and industrial wastes. Atomic absorption
is so sensitive that it can measure down to parts per billion of
a gram (μg dm–3) in a sample.
Atomic absorption spectroscopy (AAS) uses the absorption of
light to measure the concentration of gas-phase atoms. The
analyte atoms or ions must be vaporized in a flame or graphite
furnace since the samples used are usually liquids or solids. The
atoms absorb ultraviolet or visible light and energy excites the
atoms to make transitions to higher electronic energy levels.
When the homogeneous solution of a representative sample is
sprayed onto a flame (Air-Acetylene or Acetylene-Nitrous oxide),
free atoms formed in the flame absorb characteristic radiation of
the same element emitted by a hollow cathode lamp and undergo
transitions to excited energy levels. This energy absorption by
free atoms of the sample formed in the flame is proportional to
the concentration of atoms formed in the flame and is governed by
Lambert-Beer Law. Applying the Beer-Lambert law directly in AAS
spectroscopy is difficult due to variations in the atomization
efficiency from the sample matrix, and no uniformity of
concentration and path length of analyte atoms (in graphite
furnace AAS).

Atoms of different elements absorb characteristic
wavelengths of light. Analyzing a sample to see if it contains a
particular element simply means using light from that element.
For example with calcium, a lamp containing lead emits light from
excited calcium atoms that produce the right mix of wavelengths
to be absorbed by any calcium atoms from the sample. In AAS, the
sample is atomized – converted into ground state free atoms in
the vapor state – and a beam of electromagnetic radiation emitted
from excited lead atoms is passed through the vaporized sample.
Some of the radiation is absorbed by the lead atoms in the
sample. The greater the number of atoms there is in the vapor,
the more radiation is absorbed. The amount of light absorbed is
proportional to the number of calcium atoms. A calibration curve
is constructed by running several samples of known calcium
concentration under the same conditions as the unknown. The
amount the standard absorbs is compared with the calibration
curve and this enables the calculation of the calcium
concentration in the unknown sample. Consequently an atomic
absorption spectrometer needs the following three components: a
light source; a sample cell to produce gaseous atoms; and a means
of measuring the specific light absorbed.
The common source of light is a ‘hollow cathode lamp’
(Figure 3.1). This contains a tungsten anode and a cylindrical
hollow cathode made of the element to be determined. These are
sealed in a glass tube filled with an inert gas – neon or argon –

at a pressure of between 1 Nm–2 and 5 Nm–2. The shape of the
cathode concentrates the radiation into a beam which passes
through a quartz window, and the shape of the lamp is such that
most of the sputtered atoms are redeposit on the cathode.
Figure 3.1: ‘Hollow cathode lamp’
Modern spectrometers incorporate a beam splitter so that one
part of the beam passes through the sample cell and the other is
the reference (Figure 3.2). The intensity of the light source may
not stay constant during an analysis. If only a single beam is
used to pass through the atom cell, a blank reading containing no
analyte (substance to be analyzed) would have to be taken first,
setting the absorbance at zero. If the intensity of the source
changes by the time the sample is put in place, the measurement
will be inaccurate. In the double beam instrument there is a
constant monitoring between the reference beam and the light
source. To ensure that the spectrum does not suffer from loss of
sensitivity, the beam splitter is designed so that as high a

proportion as possible of the energy of the lamp beam passes
through the sample.
Figure 3.2: Double beam spectrometer
The instrument is calibrated using several solutions of
known concentrations. A calibration curve is produced which is
continually rescaled as more concentrated solutions are used –
the more concentrated solutions absorb more radiation up to a
certain absorbance. The calibration curve shows the concentration
against the amount of radiation absorbed. The sample solution is
fed into the instrument and the unknown concentration of the
element is then displayed on the calibration curve.
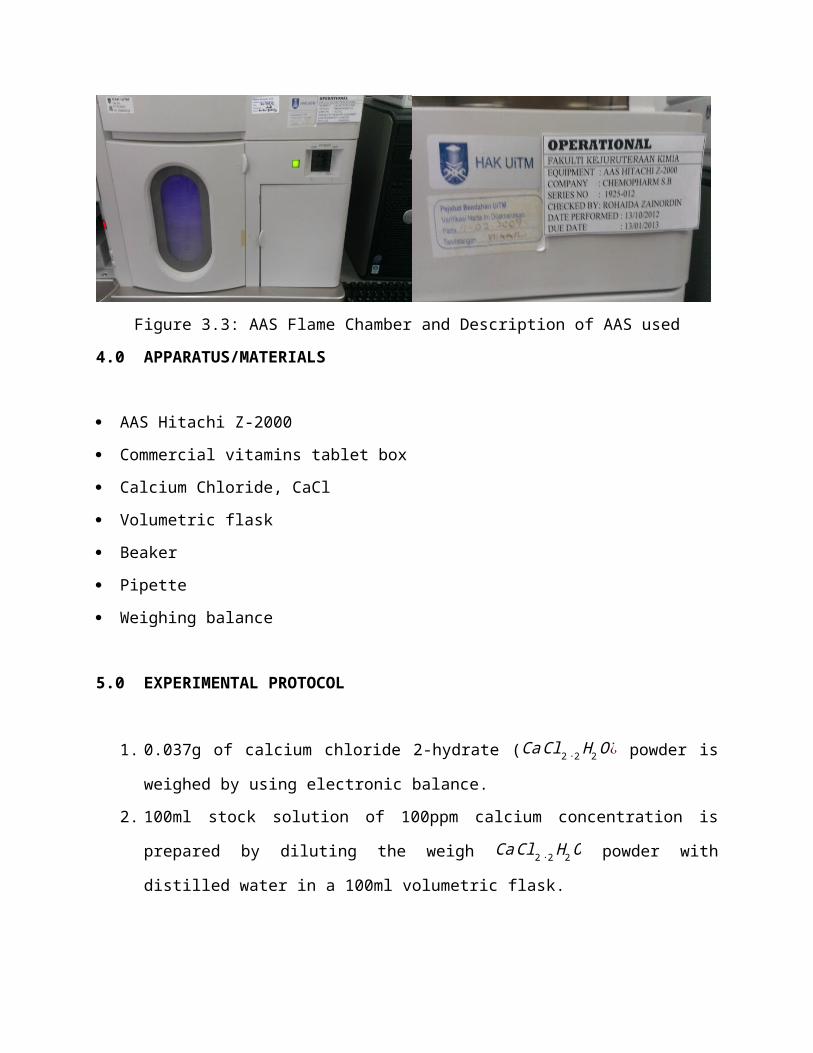
Figure 3.3: AAS Flame Chamber and Description of AAS used
4.0 APPARATUS/MATERIALS
AAS Hitachi Z-2000
Commercial vitamins tablet box
Calcium Chloride, CaCl
Volumetric flask
Beaker
Pipette
Weighing balance
5.0 EXPERIMENTAL PROTOCOL
1. 0.037g of calcium chloride 2-hydrate (CaCl2∙2H2O¿ powder is
weighed by using electronic balance.
2. 100ml stock solution of 100ppm calcium concentration is
prepared by diluting the weigh CaCl2∙2H2O powder with
distilled water in a 100ml volumetric flask.

3. The stock solution is then undergoing a serial dilution in
order to prepare a series of standard solution of 20ppm,
15ppm, 10ppm and 5ppm. The standard solution is prepared in
50ml of volumetric flask.
4. Each of the diluted standard solutions and four stock
solutions of commercial tablets with pH ranging 1 to 5 were
poured third quarter in the test tube provided and place on
a test tube holder.
5. The AAS Hitachi Z-2000 instrument supplied by Chemopharm
Company is turned on and the instrument software is
selected.
6. The flame and hollow cathode lamp that had been set up by
lab assistant is turned on.
7. The sucking tube which connected to AAS is placed into the
blank solution which is distilled water and soaked
approximately 30 seconds to zero the detector.
8. Each of the diluted sample solution from lower to higher
concentration of CaCl2∙2H2O is introduced with the sucking
tube. The intensity for each sample is observed and
recorded.
9. A calibration graph based on the intensity readings and the
concentrations of CaCl2∙2H2O sample is constructed.
10. Each of the commercial tablets sample solutions with
different pH range is next introduced to the sucking tube.
The intensity for each sample is observed and recorded.
11. The sucking tube is took off and inserted back to the
blank sample.
All the data is printed out for justifications.
6.0 RESULTS
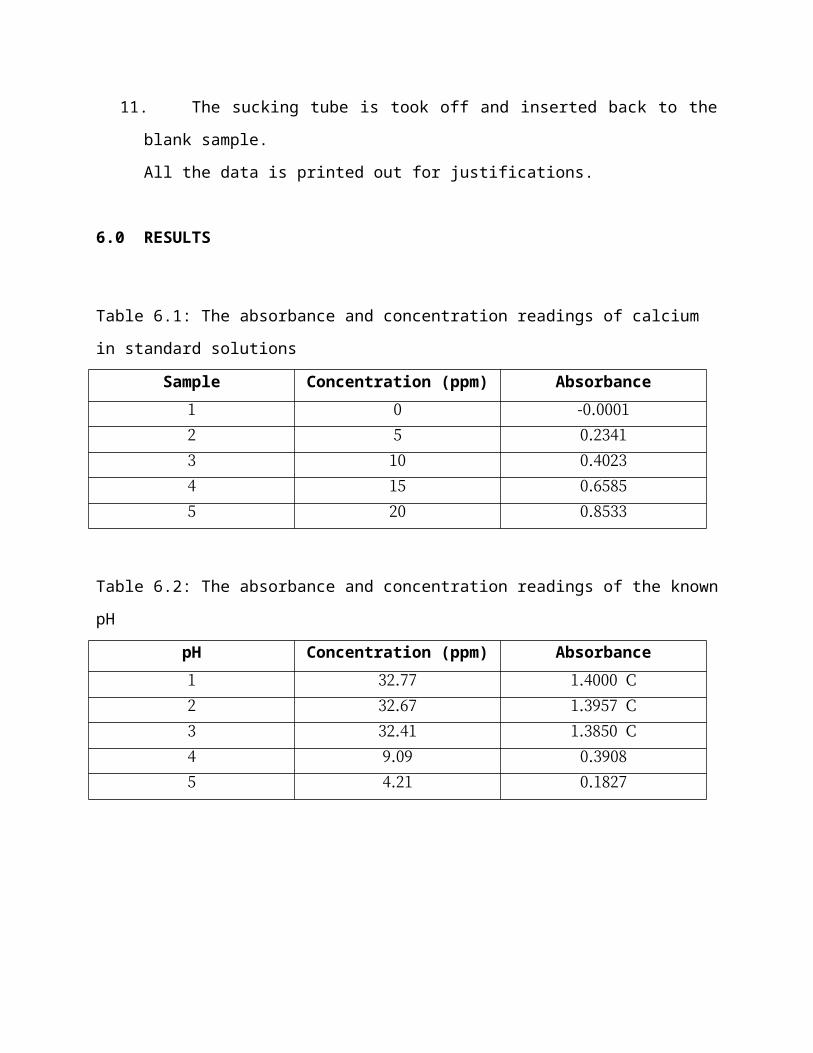
Table 6.1: The absorbance and concentration readings of calcium
in standard solutions
Sample Concentration (ppm) Absorbance1 0 -0.0001
2 5 0.2341
3 10 0.4023
4 15 0.6585
5 20 0.8533
Table 6.2: The absorbance and concentration readings of the known
pH
pH Concentration (ppm) Absorbance1 32.77 1.4000 C
2 32.67 1.3957 C
3 32.41 1.3850 C
4 9.09 0.3908
5 4.21 0.1827

0 5 10 15 20 25-0.20
0.20.40.60.81
f(x) = 0.042624 x + 0.00338000000000005R² = 0.997095251915831
Graph of Absorbance vs Concentration of Ca (ppm) in standard solution
Concentration (ppm)
Abso
rbance
Figure 6.1: The graph absorbance versus of concentration of Ca
(ppm) in the standard solution
1 2 3 4 505
101520253035
Graph of Concentration of Ca (ppm) vs pH
pH
Conc
entrat
ion
(ppm)
Figure 6.2: The graph of concentration of Ca (ppm) versus pH
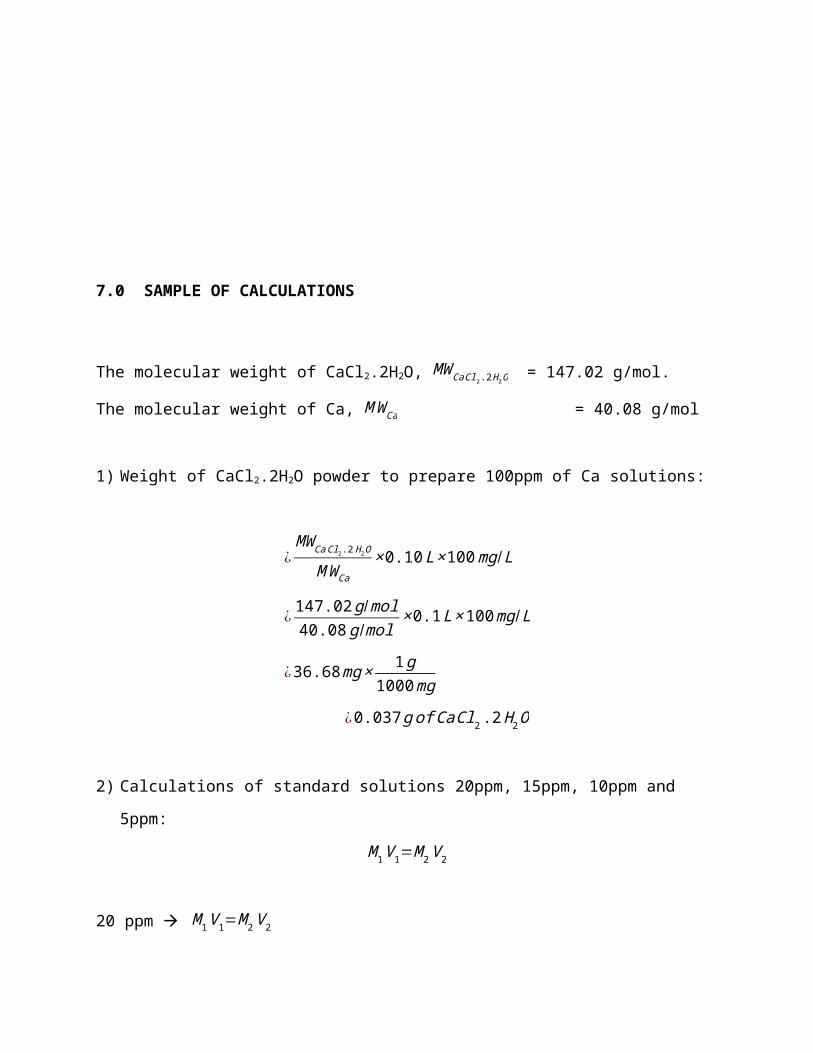
7.0 SAMPLE OF CALCULATIONS
The molecular weight of CaCl2.2H2O, MWCaCl2.2H2O = 147.02 g/mol.
The molecular weight of Ca, MWCa = 40.08 g/mol
1) Weight of CaCl2.2H2O powder to prepare 100ppm of Ca solutions:
¿MWCaCl2.2H2O
MWCa×0.10L×100mg/L
¿ 147.02g/mol40.08g /mol
×0.1L×100mg/L
¿36.68mg× 1g1000mg
¿0.037gofCaCl2.2H2O
2) Calculations of standard solutions 20ppm, 15ppm, 10ppm and
5ppm:
M1V1=M2V2
20 ppm M1V1=M2V2

50 x V1 = 20 x 50mL
V1 = 20 mL
15 ppm M1V1=M2V2
50 x V1 = 15 x 50mL
V1 = 15 mL
10 ppm M1V1=M2V2
50 x V1 = 10 x 50mL
V1 = 10 mL
5 ppm M1V1=M2V2
50 x V1 = 5 x 50mL
V1 = 5 mL
To calculate Ca dissolved in pH solution:
At pH 1, the concentration is 32.77ppm, hence,
Mass of Ca present = 32.77ppm x 1 L = 32.77 mg

8.0 DISCUSSION
The objective of this experiment is to determine the calcium
content present in commercial supplement tablets by using atomic
absorption spectroscopy analysis (AAS). The actual content of
calcium in the supplement is determined by using AAS. The first
step done before the experiment was the preparation of a series
of stock solution. The stock solution needed for this experiment

id 50ppm, which is prepared in a 100ml flask using CaCl2.2H2O
solid salts.
From the calculation, it was showed that 37 mg of Ca
contained in CaCl2.2H2O tablets. The amount was weighed by using
the electronic mass balance, which is more accurate to weigh a
small amount of substances. The standard solution of 20ppm,
15ppm, 10ppm, and 5ppm is prepared by diluting 50ppm of stock
solution. The concentration of commercial vitamins tablets with
five difference pH is compared with the calibration curve of the
standard solution. The blank solution (distilled water) is used
in the AAS instrument to get accurate reading for the
concentration of calcium.
The atomic absorption spectroscopy analysis can only
identified a specific type of element, where in this experiment,
only Ca can absorbed the energy emitted by the hallow cathode
lamp as the Ca material cathode lamp was used. From figure 6.2,
it showed that, the higher the concentration, the higher the
absorbance reading. It was also showed that, the higher the
concentration, the greater the energy absorbed to excite the
electrons in the samples.
The linear graph plotted, theoretically, the line with R2= 1
should be obtained, but from the experiment conducted, the line
with R2 = 0.9985 was obtained. The reading was quite not far from
the theoretical value, but it may because of the Ca salt weighed
was not exactly 0.037 mg, but it was 0.038 mg. It was quite hard
to find the smallest size of salts among the other salts and
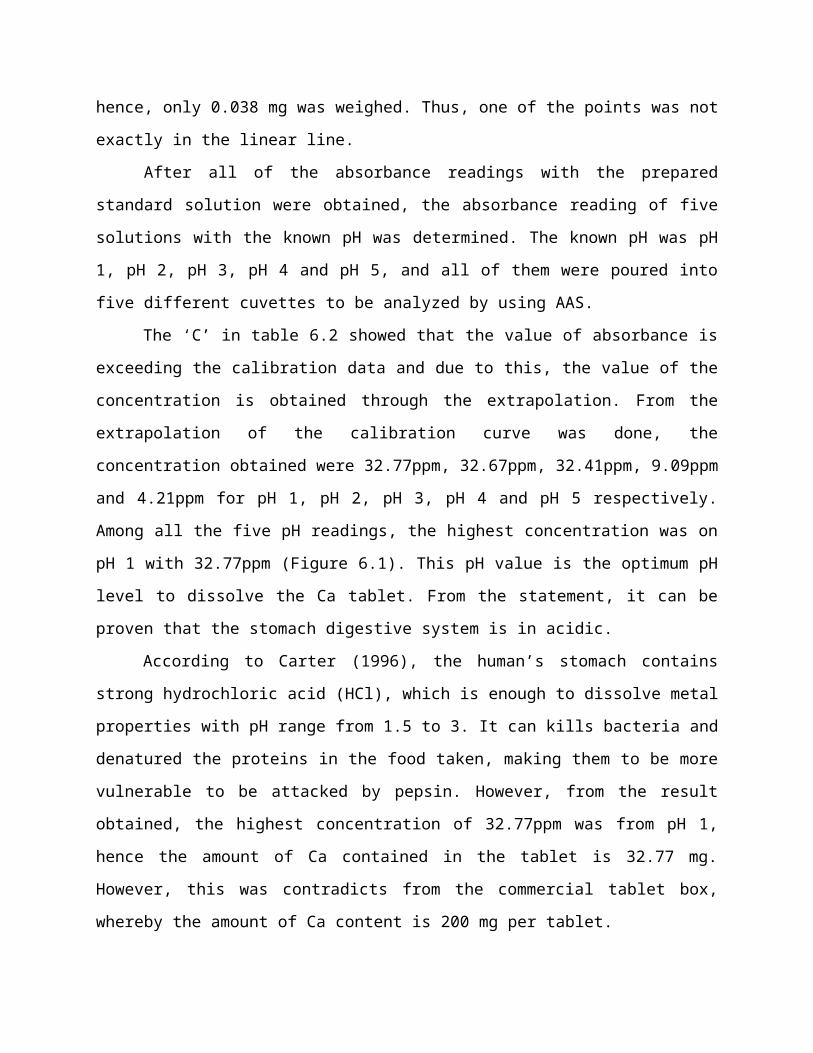
hence, only 0.038 mg was weighed. Thus, one of the points was not
exactly in the linear line.
After all of the absorbance readings with the prepared
standard solution were obtained, the absorbance reading of five
solutions with the known pH was determined. The known pH was pH
1, pH 2, pH 3, pH 4 and pH 5, and all of them were poured into
five different cuvettes to be analyzed by using AAS.
The ‘C’ in table 6.2 showed that the value of absorbance is
exceeding the calibration data and due to this, the value of the
concentration is obtained through the extrapolation. From the
extrapolation of the calibration curve was done, the
concentration obtained were 32.77ppm, 32.67ppm, 32.41ppm, 9.09ppm
and 4.21ppm for pH 1, pH 2, pH 3, pH 4 and pH 5 respectively.
Among all the five pH readings, the highest concentration was on
pH 1 with 32.77ppm (Figure 6.1). This pH value is the optimum pH
level to dissolve the Ca tablet. From the statement, it can be
proven that the stomach digestive system is in acidic.
According to Carter (1996), the human’s stomach contains
strong hydrochloric acid (HCl), which is enough to dissolve metal
properties with pH range from 1.5 to 3. It can kills bacteria and
denatured the proteins in the food taken, making them to be more
vulnerable to be attacked by pepsin. However, from the result
obtained, the highest concentration of 32.77ppm was from pH 1,
hence the amount of Ca contained in the tablet is 32.77 mg.
However, this was contradicts from the commercial tablet box,
whereby the amount of Ca content is 200 mg per tablet.

The stomach is kind-like J-shaped and has the ability to
expands, which located on the left side of the upper abdomen.
There are some muscles layers cover the stomach and enable it to
undergo the process of food churning (Carter, 1996). The stomach
has the capacity up to 2 L to hold the food by expansion. A
person may secrete up to 400 ml of gastric juice per meal and it
contains 50 to 300 μg pepsin/ml.
There are a few factors that affecting the human digestive
system beside the pH level. According to Bailey (2013), the
factors are included the nature of the food (the fats and the
proteins content) and also the degree of muscle actions. There is
also the optimum temperature as well as the pressure, which are
included as the factors affecting the human digestive system. As
the pH environment produced was not identically as the actual one
in the human stomach because in the stomach, the Ca tablet can be
dissolved completely. Thus, the claim that the tablet contains
200 mg of Ca still can be assumed as reasonable
9.0 CONCLUSION
Generally, in this experiment, the analytical technique
which Atomic Absorption Spectroscopy (AAS) is used in order to
determine the concentration of the calcium content in the unknown
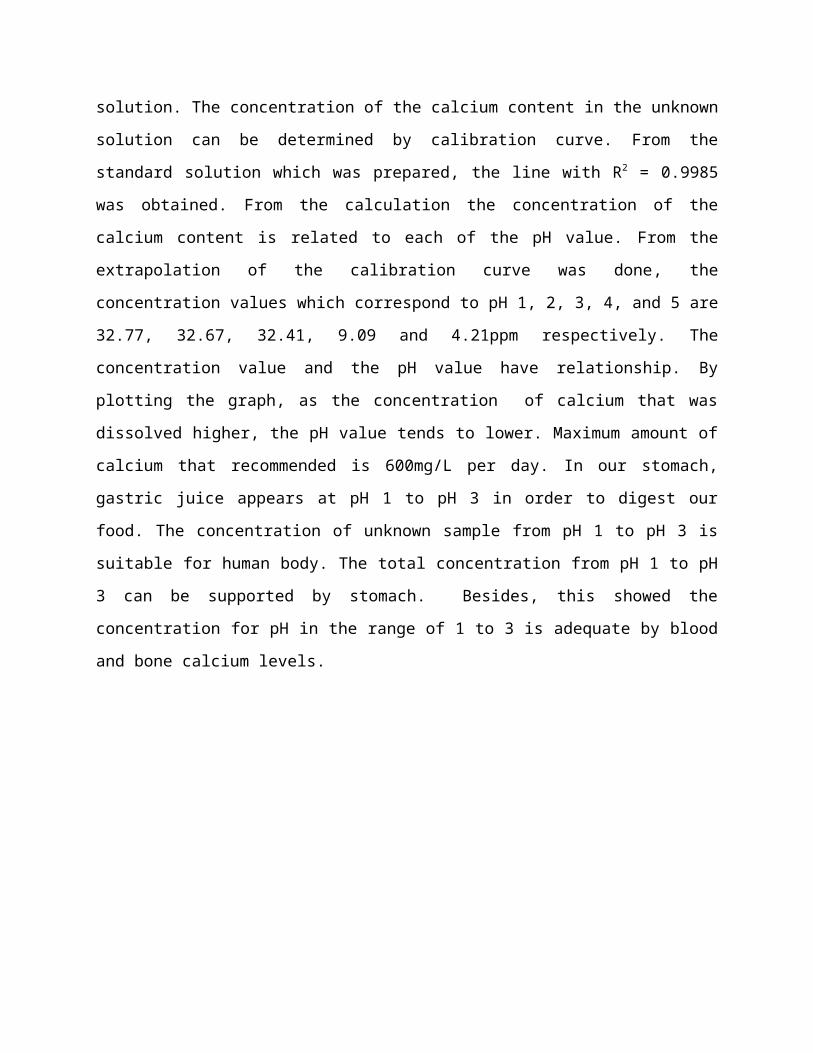
solution. The concentration of the calcium content in the unknown
solution can be determined by calibration curve. From the
standard solution which was prepared, the line with R2 = 0.9985
was obtained. From the calculation the concentration of the
calcium content is related to each of the pH value. From the
extrapolation of the calibration curve was done, the
concentration values which correspond to pH 1, 2, 3, 4, and 5 are
32.77, 32.67, 32.41, 9.09 and 4.21ppm respectively. The
concentration value and the pH value have relationship. By
plotting the graph, as the concentration of calcium that was
dissolved higher, the pH value tends to lower. Maximum amount of
calcium that recommended is 600mg/L per day. In our stomach,
gastric juice appears at pH 1 to pH 3 in order to digest our
food. The concentration of unknown sample from pH 1 to pH 3 is
suitable for human body. The total concentration from pH 1 to pH
3 can be supported by stomach. Besides, this showed the
concentration for pH in the range of 1 to 3 is adequate by blood
and bone calcium levels.

10.0 REFERENCES
Bailey, R. (2013). Digestive System. What is The Digestive System.
Retrieved May 20, 2013, from
http://biology.about.com/od/organsystems/a/aa032107a.htm.
Carter, J.S (1996). Digestive System. UC-Clermont College
Biology. Retrieved May 19, 2013, from
http://biology.clc.uc.edu/courses/bio105/digestiv.htm
National Institutes Of Health (n.d.). Retrieved May 19, 2013,
from
http://dietary-supplements.info.nih.gov/factsheets/
calcium.asp

Brian. M. Tissue. (1996). Atomic-Absorption spectroscopy (AAS).
Retrieved May 19, 2013, from
http://elchem.kaist.ac.kr/vt/chem-ed/spec/atomic/aa.htm
http://www.calciuminfo.com/about/foodsources.aspx
Skoog, D. A., Holler, F. J., & Nieman, T. A. (1998). Principles of
Instrumental Analysis. Brooks Cole.
Skoog, D. A., West, D. M., Holler, F. J., & Crouch, S. R. (2004).
Fundamentals of Analytical Chemistry. Brooks Cole.
http://weather.nmsu.edu/Teaching_Material/soil698/
Student_Reports/Spectroscopy/report.htm
http://elchem.kaist.ac.kr/vt/chem-ed/spec/atomic/aa.htm
http://www.cmetindia.org/aas.html
11.0 APPENDICES
APPENDIX B

Figure a: The CaCl2∙2H2O chemical powder used to prepare the stocksolution.
Figure b: The Nutrilite Calcium Magnesium used as commercial tablets.

Figure c: The Hitachi Z-2000 Polarized Zeeman AAS instrument.
Figure d: The AAS flame.

Figure e: The hollow cathode lamp used in the AAS intrument.

Figure f: The purified acetylene gas used to light up the AAS flame.