Full project
79
CHAPTER-I 1.1 INTRODUCTION Appraisal is the evolution of worth, quality or merit. Performance appraisal is the key ingredient of performance management. Each year, employees and their immediate bosses enter into an elaborate gaming exercise called the annual performance appraisal. Most of it is form filling but every company still goes through the ritual. Performance appraisal is a method of evaluating the behavior of employees in the work spot, normally inkling both the quantitative and qualitative aspects of job performance. Performance here refers to the degree of accomplishment of the tasks that makeup an individual’s job. It indicates how well an individual is fulfilling the job demands. Performance is always measured in term of results. A student, for Example, may exert a great deal of effort while preparing for examination but may manage to get a poor grad. In this came, the effort expended is high but performance is low. According to Mondy et al., “Performance appraisal is a system of review and evaluation of an individual’s (or team’s) Performance”. According to Gomej-Mejia et al., “Performance appraisal involves the identification, measurement, and management of human performance in organizations”. 1
Transcript of Full project
CHAPTER-I
1.1 INTRODUCTION
Appraisal is the evolution of worth, quality ormerit. Performance appraisal is the key ingredient of performancemanagement. Each year, employees and their immediate bosses enterinto an elaborate gaming exercise called the annual performanceappraisal. Most of it is form filling but every company stillgoes through the ritual.
Performance appraisal is a method of evaluating thebehavior of employees in the work spot, normally inkling both thequantitative and qualitative aspects of job performance.Performance here refers to the degree of accomplishment of thetasks that makeup an individual’s job. It indicates how well anindividual is fulfilling the job demands. Performance is alwaysmeasured in term of results. A student, for Example, may exert agreat deal of effort while preparing for examination but maymanage to get a poor grad. In this came, the effort expended ishigh but performance is low.
According to Mondy et al., “Performance appraisalis a system of review and evaluation of an individual’s (orteam’s) Performance”.
According to Gomej-Mejia et al., “Performanceappraisal involves the identification, measurement, andmanagement of human performance in organizations”.
1

According to DeNisi., “Performance appraisal isthe system whereby an organization assigns some score to indicatethe level of performance of a target person or group”.
2
Methods of Performance appraisal system:
The foregoing list of major program pitfalls represents a formidable challenge, even considering the available battery of appraisal techniques. But attempting to avoid these pitfalls by doing away with appraisals themselves is like trying to solve theproblems of life by committing suicide. The more logical task is to identify those appraisal practices that are (a) most likely toachieve a particular objective and (b) least vulnerable to the obstacles already discussed. Before relating the specific techniques to the goals of performance appraisal stated at the outset of the article, I shall briefly review each, taking them more or less in an order of increasing complexity. The best-knowntechniques will be treated most briefly.
Essay appraisal
In its simplest form, this technique asks the rater to writea paragraph or more covering an individual's strengths,weaknesses, potential, and so on. In most selection situations,particularly those involving professional, sales, or managerialpositions, essay appraisals from former employers, teachers, orassociates carry significant weight.
Graphic rating scale
This technique may not yield the depth of an essayappraisal, but it is more consistent and reliable. Typically, agraphic scale assesses a person on the quality and quantity ofhis work (is he outstanding, above average, average, orunsatisfactory?) and on a variety of other factors that vary with
3
the job but usually include personal traits like reliability andcooperation. It may also include specific performance items likeoral and written communication.
Field review
The field review is one of several techniques for doing this.A member of the personnel or central administrative staff meetswith small groups of raters from each supervisory unit and goesover each employee's rating with them to (a) identify areas ofinter-rater disagreement, (b) help the group arrive at a consensus,and (c) determine that each rater conceives the standardssimilarly.
4
Forced-choice rating
Like the field review, this technique was developed toreduce bias and establish objective standards of comparisonbetween individuals, but it does not involve the intervention ofa third party.
Management by objectives
To avoid, or to deal with, the feeling that they are beingjudged by unfairly high standards, employees in someorganizations are being asked to set - or help set - their ownperformance goals. Within the past five or six years, MBO hasbecome something of a fad and is so familiar to most managersthat I will not dwell on it here.
Ranking methods
For comparative purposes, particularly when it is necessaryto compare people who work for different supervisors, individualstatements, ratings, or appraisal forms are not particularlyuseful. Instead, it is necessary to recognize that comparisonsinvolve an overall subjective judgment to which a host ofadditional facts and impressions must somehow be added. There isno single form or way to do this. The best approach appears to bea ranking technique involving pooled judgment. The two mosteffective methods are alternation ranking and paired comparisonranking.
1. “Alternation ranking”:
Ranking of employees from best to worst on a trait or traits
5
is another method for evaluating employees. Since it is usuallyeasier to distinguish between the worst and the best employeesthan to rank them, an alternation ranking method is most popular.Here subordinates to be rated are listed and the names of thosenot well enough to rank are crossed. Then on a form as shownbelow, the employee who is highest on the characteristic beingmeasured and the one who is the lowest are indicated. Then chosethe next highest and the next lowest, alternating between highestand lowest until all the employees to be rated have been ranked.
6
2. “Paired-comparison ranking”:
This technique is probably just as accurate as alternationranking and might be more so. But with large numbers of employees it becomes extremely time consuming and cumbersome. Both ranking techniques, particularly when combined with multiple rankings (i.e., when two or more people are asked to make independent rankings of the same work group and their lists are averaged), are among the best available for generating valid order-of-merit rankings for salary administration purposes.
Assessment centers
So far, we have been talking about assessing past performance.What about the assessment of future performance or potential? Inany placement decision and even more so in promotion decisions,some prediction of future performance is necessary. How can thiskind of prediction be made most validly and most fairly?
360 Degree Feedback
Many firms have expanded the idea of upward feedback into whatthe call 360-degree feedback. The feedback is generally used fortraining and development, rather than for pay increases. Most 360Degree Feedback system contains several common features.Appropriate parties – peers, supervisors, subordinates andcustomers, for instance – complete survey, questionnaires on anindividual. 360 degree feedback is also known as the multi-raterfeedback, whereby ratings are not given just by the next managerup in the organizational hierarchy, but also by peers andsubordinates. Appropriates customer ratings are also included,
7
along with the element of self-appraisal. Once gathered in, theassessment from the various quarters are compared with oneanother and the results communicated to the manager concerned.
Another technique that is useful for coaching purposes is, ofcourse, MBO. Like the critical incident method, it focuses onactual behavior and actual results, which can be discussedobjectively and constructively, with little or no need for asupervisor to "play God."
8
1.2 INDUSTRY PROFILEHEAVY ENGINEERING UNITS
The first heavy engineering unit viz,Karachi Shipyard andEngineering Works Limited (KSEW Karachi Shipyard and EngineeringWorks) was established in 1954 and after a gap of 14 yearsPakistan Machine Tool Factory was set up in 1968 and then HeavyMechanical Complex in 1971. Heavy Foundry and Forge Limited cameinto operation in 1977. To this trend a new impetus was addedwith the commissioning of Pakistan Steel in 1984.
With the setting up of above mentioned units over a periodof about 15 years potential has been created for themanufacturing of a wide range of capital goods. Today Pakistan iscapable of producing basic metals from iron ore (serving as rawmaterial for many industries), complete plants on turn-key basis,construction machinery, material handling equipment, machinetools, electric motors, switchgears, transport equipment, cargoships, fishing trawlers etc)According to a survey conducted byWorld Bank Consultants, the total out-put of the engineeringindustries amounted to Rs.33.385 Billion during 1985-86 whichincluded out-put of only Rs.3.265 Billion contributed by capitalgoods sector. The value added in this sector was about 30 percent. The total demand of capital goods during 1985-86 wasreported as Rs.13.602 Billion, the local industry meeting onlyabout 30 per cent of the total requirement.
oIn 1955- The Heavy Engineering Division of the KCP Limited,established in 1955, is asprawling, hi-tech complex that can roll
9
out the entire range of heavy mechanical equipment for the coresector industries. This complex is one of the largest, wellintegrated workshops of its kind and has facilities for casting,fabricating and machining heavy equipment. KCP has a markedpresence in the supply of key mechanical machinery to the coresector industries.
oJan 1964- In January 1964, there was a devastating fire in HeavyEngineering Corporation(HEC), Ranchi, resulting in loss ofproperty worth Rs. 40 lakh, which in those days was quitecolossal. The incident was followed by communal disturbances atRanchi, Rourkela and Jamshedpur. These happenings brought thedrawbacks of the system of industrial security to prominentrelief.
10
o1973- Incepted in the year 1973, Himmalaya Machinery PrivateLimited (Heavy engineeringcompany) is one of the reputedmanufacturers, exporters and suppliers of industrial heavyengineering plate forming machinery. Our offered rangeencompasses shipyard machinery, boiler machines, back-hoe dozers,special machines, engineering process machinery, plate bendingroll, section bending machines, pipe forming machines, plateforming machines, plate bending machines, plate straightening.
o1980- The Wenco Group was established in 1980. As well as itsheavy engineering activitiesit also operates an Onshore/OffshoreServices division, which provides expertise in fibreglass pipingsystems to the mining and oil and gas industries. ‘’Our HeavyEngineering Division incorporates the manufacture of Dished Headsas well as general and specialised plate pressing, bending,rolling and structural section rolling operations,’’ Paul Pecasaid. ‘’Basically, if it can be engineered.
o1985- L&T is acknowledged as one of the top five fabricationcompanies in the world. TheHeavy Engineering Divisionmanufactures and supplies custom designed and engineered criticalequipment and systems to the needs of core-sector industries andthe defence sector. It is the preferred supplier of equipment fora select range of products, globally.
oShipbuilding: L&T has a shipyard capable of constructing vesselsof upto 150 metres longand displacement of 20000 tonnes as itsheavy engineering complex at Hazira. The shipyard is geared up to
11
take up construction of niche vessels such as specialised Heavylift Cargo Vessels, CNG carriers, chemical tankers, defence¶military vessels and other role specific vessels.Construction ofspecialisedmid size vessels is being undertaken and capacity isbeing augmented by additional infrastructure such as ship liftsystem and additional outfitting workshops to extend theactivities to ship repairs.The focus will be on construction ofcommercial vessels, warships for the navy and the coast guard.o1988-James Howden’s engineering works is one of the lastremaining Victorian heavyengineering works in Glasgow, and at theend of its life, this redbrick complex was the birthplace of thetunnel boring machines which dug out the Channel Tunnel. Thecompany, now called Howden Group, is still in business but lefttheir home of ninety years in Tradeston in 1988. The building’sfuture has been in doubt ever since, and it currently lies empty.
12
oMar 31,2001- This will be the first company in the heavyengineering sector (and a sickcompany that too) to besuccessfully privatised by the Union Government. As on March31,2001, the company’s net worth was a negative Rs 270crore. InJanuary, the CCD had cleared a financial restructuring packagefor Jessop & Company involving writing off/waiver of governmentloans and infusion of fresh funds. However, this will beimplemented only upon successful privatization of the company.
oApr 2003- The sector can be categorized into and light segments.Segment forms the majorityof the sector in India. In the year, outof the total production of US$ 22 Billion, the Heavy engineeringsegment forms the majority of the engineering sector in India. Inthe year 2003-04, out of the total engineering production of US$ 22Billion, the heavy engineering market contributed over 80 per centwith the light engineering segment accounting for the remaining. Akey driver for increased engineering exports is the trend towardsshifting of global manufacturing bases to low cost countries likeIndia. This trend is expected to boost exports of engineering.
13

1.3 COMPANY PROFILEBUSINESS
KCP is a diversified 100 million US$ business group withinterests in Heavy Engineering, Sugar, Cement, Hydel Power,Information Technology and Biotechnology.
Board of DirectorsDR.V.L. Dutt Chairman and Managing DirectorDr. Dutt was educated in London, England and secured the Grad BIMDegree.
Dr. Dutt is the Chairman of The KCP Ltd, Fives-Cail KCP Ltdand KCP Vietnam Industries Limited. Apart from KCP Group, Dr.Dutt is a Director on the Board of DCM Shriram IndustriesLimited, Chairman of Chennai Willingdon Corporate Foundation and
14

Director of V RamakrishnaSonsPrivateLtd. Dr. Dutt ispresently the Honorary Consul General of the Republic of Turkeyin Chennai, for the States of Tamilnadu, Kerala, Karnataka,Andhra Pradesh and Union Territory of Pondicherry
15
Smt. V.L India DuttJoint Managing director
Smt. V.L. Indira Dutt, B.A (Economics) from MadrasUniversity is the Joint Managing Director of the Company. Smt.Dutt serves as Director of Fives Cail - KCP Limtied, VelagapudiFoundation; KCP Vietnam Industries Limited; KCP TechnologiesLimited and V Ramakrishna Sons Private Limited.
Smt. KavithaDuttChitturiExecutive Director
Smt. KavithaDuttChitturi is a graduate in BusinessManagement with specialization in International Business fromCedar Crest College Allentown, Pennsylvania.
She also holds a Post-Graduate Diploma in Human Resources. She isalso a Director of V Ramakrishna Sons Private Limited.
Sri.V.GandhiTechnical Director
Sri. V. Gandhi is a part of the senior management of KCP Ltdwith 31 years of experience. He is a Metallurgist by profession.He served as General Manager in FCB KCP, looking after planningand procurement. He is also a Director of Fives-Cail KCP Limited.
Sri.V.H.RamakrishnanDirector
Sri.V.H.Ramakrishnan, a Chartered Accountant and a Cost
Accountant is a retired General Manager of the Bank of India, with
35 years of experience in India and abroad. He is on the panel for
nominee Directors in IDBI and other financial institutions.
Presently, he is a Director of Andhra Bank and a member of the
Group of Advisers of Shriram Group of Companies.16
Sri.O. SwaminathaReddy Director
Sri. O. Swaminatha Reddy, a Chartered Accountant by profession has vast banking and industrial experience spanning over decades. He has held various high ranking posts which include Chairman of Andhra Bank and Chairman and Managing Director of Andhra Pradesh State Financial Corporation.
Sri.PinnamaneniKoteswaraRaoDirector
Sri. PinnamaneniKoteswaraRao, is an agriculturist and servedas ZillaParishad Chairman in Krishna District of Andhra Pradesh.
Sri.A.RamakrishnaDirector
Dr. Anumolu Ramakrishna obtained his bachelors degree inCivil Engineering from the Andhra University and M.Sc. inStructural Engineering from the College of Engineering, Guindy,Chennai. He started his career in 1962 with EngineeringConstruction Corporation Limited (ECC), then a wholly ownedsubsidiary of Larsen & Toubro Limited. ECC was subsequentlyamalgamated with the parent company and is widely known as ECCConstruction Division of Larsen & Toubro. In 1966, Government ofIndia sponsored him for practical training in StructuralEngineering in the erstwhile German Democratic Republic.
His specialized knowledge in structural engineering - precast andprestressed concrete and industrialized methods of construction -has been recognized by Andhra University by conferring upon him
17
Honorary Degree of Doctorate of Science in 1997 and by JawaharlalNehru Technological University through an Honorary Degree ofDoctor of Philosophy in 2004.
After serving in various capacities Dr. Ramakrishna wasinducted into the Board of Directors of L&T in 1992 and wasappointed as operational head of the ECC Construction Division.He provided the leadership for the construction of scores ofcement plants, steel plants, power projects, refineries andpetrochemical complexes besides outstanding buildings, roads,bridges, harbours, airports, water supply projects and nuclearpower plants. He was elevated to the position of Deputy ManagingDirector in March 2000. Under his leadership, revenues of
18
L&T-ECC Division grew manifold - from Rs. 450 Cr. in 1992 to overRs. 6,900 Cr. in 2004 when he retired from the services of theCompany.
Sri, Vijay SankarDirector
Sri. Vijay Sankar holds a Masters in BusinessAdministration from J.L. Kellogg Graduate School of Management,Northwestern University and is also a qualified CharteredAccountant. He is a Deputy Chairman of Sanmar Group. Vijay alsoserving as the Honorary Consul for Spain in Chennai. He alsoserving as a Vice President of the Tamilnadu Tennis Association.
MILESTONES
KCP is a diversified 1000 Crores (USD 192 Million)business group with interests in Heavy Engineering, Sugar, Cement,Hydel Power, Information Technology and Biotechnology.
2011 Work On Hotel Project Commenced.
2011 The Second Cement Unit at Ramakrishnapuram Started.
2007 KCP Biotech Limited got merged with the KCP Limited.
2006 Wind Power generating Unit setup at Uthumalai village in TirunelveliDt of Tamil Nadu.
2002 KCP Biotech Limited setup at Biotech Park, Shameerpet,Hyderabad to manufacture biotech related products.
2001 KCP Heavy Engineering Plant II setup at Arakonam near Chennai,to execute medium to large sized fabrication projects.
19
1999 KCP Hydel Power Division setup at Nekkarikallu, Andhra Pradeshon the Guntur Canal of Krishna riverto generate 8 MW of power.
1999 KCP Vietnam Industries Limited, a fully owned subsidiary ofthe KCP Limited setup to manufacture sugar at ThuaThien HueProvince at Central Vietnam. This 2500 TCD plant was shifted to SonHoa District, Phuyen Province in 2001.
20
1999 KCP Technologies Limited setup to provide high quality ITSolutions & Engineering Technical Services.
1995 FCB-KCP Limited, (now Fives Cail-KCP) setup as a joint venturewith Fives Cail Group of France for the design and manufacture ofSugar Plants.
1995 KCP Sugar Manufacturing Division demerger into a separatecompany, KCP Sugar & Industries Limited.
1984 Arakonam Castings & Forgings Limited, started as a jointventure between The KCP Limited and the Tamilnadu IndustrialDevelopment Corporation (TIDCO).
1984 Fuller KCP Limited, a joint venture with Fuller InternationalInc, USA was launched, for the design and manufacture of large-sized cement plants and other mineral processing equipment. KCPdivested its stake to FL Smidth, Denmark in 1996.
1967 EIMCO-KCP Limited, started as a joint venture between The KCPLimited and EIMCO Corporatation, USA. Currently a 100% subsidiaryof KCP Sugar & Industries Limited.
1958 KCP Cement Division, setup at Macherla, Andhra Pradesh with astate-of-the-art cement manufacturing plant. India's first dryprocess kiln was installed at Macherla by HUMBOLDT AG, Germany in1958 (while still a prototype in Europe).
1955 KCP Heavy Engineering Division Plant I, setup at Tiruvottiyur,Chennai consisting of an integrated manufacturing facility, whichcaters to a wide range of heavy mechanical equipment and sub-systems for core sector industries.
1941 An 800 TCD Sugar Plant was setup at Vuyyuru, Andhra Pradesh,India by Sri. V. Ramakrishna, Founder Chairman of K
21

1.4NEED OF THE STUDY
The basic need of the study on the performance appraisalsystem is to know the awareness of the employees on theperformance appraisal system that is followed in by the company.
The purpose of the study is to know the evaluation processof performance appraisal system that is followed in by thecompany and to ensure whether this is appropriate for thecompany. The ineffective and inappropriate performance appraisalsystem may lead to decrease in output of the company.
22
1.5 OBJECTIVES OF THE STUDY
PRIMARY OBJECTIVE
A Study on Performance Appraisal System at KCP, Chennai
SECONDARY OBJECTIVE
To identify the need and understanding of performance
appraisal system in KCP to study the worker opinion
on performance appraisal system In KCP
To find the satisfaction level of employees in their performanceappraisal system
In KCPTo study the evaluation of performance appraisal system followed To find whether this system appropriates for the
Organization.
23
1.6 SCOPE OF THE STUDY
The scope of the study is to provide better performanceappraisal system that appropriates for the Organization. Throughthis study the evaluation process of performance appraisal systemthat is followed in by the company are analyzed.
This study helps to ensure and provide an appropriateperformance appraisal system that best suits the company andhelps to increase the productivity.
24

1.7 LIMITATIONS OF THE STUDY
The study covers only permanent workers & staffs. Executives, temporary workers and
Contact labours may not have a full knowledge about the concept.
Interaction with the employees in the work spot is very
less, because of their busy work schedule.Insisting the workers about the performance appraisal systemas it helps to set and
Achieve production targets.
The suggestion which is given by the employees is biased. Hence it was difficult to predict the real fact.
25
CHAPTER-II
2.1REVIEW OF LITERATURE:
1. Jiing-Lih Larry FarhHong Kong University of Science &Technology (HKUST) -Department of Management & Organization andJames D.WerbelIowa State University - Department of Managementand Marketing and author G.BedeianLouisiana State University,Baton Rouge - William W. & Catherine M.Rucks Department ofManagement This study investigated the effectiveness of a self-appraisal-based performance evaluation system (SABPE) thatincorporates self-assessment into traditional supervisoryevaluation procedures. Its subject sample consisted of 88 facultymembers and their chairpersons at a land-grant state university.Results indicated that (1) there was high congruency betweenself- and chairperson ratings, (2) both ratings had moderate tohigh level of criterion-related validity, and (3) both facultymembers and chairpersons reported high SABPE acceptance. Theimplications of these results for future self-appraisal researchare discussed.
2. KanikaGoyalHindu Girls College, JAGADHARI.AshokKhurana GuruNanak KhalsaCollege, YamunanagarNovember 24, 2010.The performanceappraisal system has anintrinsic motivational significance thatfacilitates learning and brings about role clarity which helps
people focus on performance development. It is a continuousprocess to understand the employee’s ability, competencies,relative merits and worth of the organization. The present studyexplores performance appraisal system (PAS) of National Thermal
26
Power Corporation Limited (NTPC), a leading public sectororganization in the power sector. It is descriptive in nature,and based on information obtained from secondary as well asprimary source. The study observed that NTPC believes inachieving organizational excellence through human resource. Theorganizations system is based upon the four building blocks i.e.competence building, commitment building, culture building, andsystems building. At NTPC, performance appraisal system evaluatesfive components namely performance, competencies, values,potential appraisal, performance and potential appraisal. Thestudy observed that the performance appraisal system in theorganization is capable to specifically address the developmentalneeds in order to overcome competency gaps in the employees underappraisal.
27
3. Michelle Brown University of Melbourne - Department ofManagement John Benson University of Melbourne - Department ofManagement Industrial Relations Journal, Vol. 34, pp. 67-81,March 2003.Performance appraisal systems are a popular toolwithin organisationsto enhance employee commitment andproductivity. This paper examines the consequences of threeaspects of a performance appraisal system (distributive justice,procedural justice and the performance rating) on the level ofemotional exhaustion reported by employees in a large publicsector research organisation.
4. Wien claw, Ruth A Performance Appraisal - Research StartersBusiness. Sep2010.Performance appraisal is the process ofevaluating an employee's performance andproviding feedback. It isnecessary not only for the individual to improve his/herperformance on the job so that s/he can earn the rewards (e.g.,money, prestige, power) for which s/he is working, but alsoimportant so that the organization can determine the degree towhich its employees are contributing toward meeting strategicgoals and objectives. There are many ways to judge an employee'sperformance on the job ranging from objective performance data toglobal rating scales to more detailed rating scales thatrepresent each of the important aspects of the job. No matter themethod used, however, it is vital that the rating scales beanchored to objective, well-defined criteria of job success.
5. Antoinette S. Hancock, Axia College of University of PhoenixA performance appraisal system is a very important part of any
28

successful organization. Both employees and organizationalmanagement and leaders benefit from a well-structured performanceappraisal system. The evaluation portion of an appraisal systemis normally performed by management. During this portion,management evaluates an employee's performance to determine ifthere are any areas that need improvement.
29
RESEARCH METHODOLOGY3.1 Meaning of Research
Research is refers to search for knowledge. Once can alsoresearch as a scientific and systematic search for pertinentinformation on a specific topic. In fact, research is and art ofscientific investigation.
Research is composed of two syllables, a prefix “Re” and a verb “Search” “Re” means again a new over again
“Search” means to examine closely and carefully to test and try to problem “Research” is an organized andsystematic way of finding answer to questions.
DEFINITION:Research defines as “systematized effort to gain new knowledge.
3.2 RESEARCH DESIGN
Research design constitutes the blue print for thecollection, measurement and analysis of date. It aids thescientist in the allocation of his/her limited resources byposting crucial choice.
Research design is the plan and structure of investigation to conceive as to obtain answer to research questions. The plan is the overall scheme or program of the research it includes an outline of what the investigator will dofrom writing hypothesis and their operational implication to the
30
final analysis of date.
3.3 METHOD OF DATA COLLECTION:
Data collection is an act of collecting relevant and adequate data required from the sample size. The research has used both primary and secondary data for the research.
1. Primary data 2. Secondary data
31
1. PRIMARY DATA:
Primary data are those data which is collected freshly or newly for a particular purpose. Here the data are collected freshly from the employer and employee at Kcp limited.
2. SECONDARY DATA:Any data, which have gathers earlier for some other purpose, are secondary data in the
hands of the research. The research has used secondary data from the following: books, company profile and websites.
3.4 SAMPLE METHODOLOGY
3.4.1 SAMPLE UNIT
It is the basic objects upon which study or experimentis carried out. The sampling unit is the study is at KCP limited Chennai
3.4.2 SAMPLE ELEMENT
The employees in KCP limited are selected are sampling element
3.4.3 TOTAL POPULATION
Population refers to entire group of people, events or things of interest that the researcher wishes to investigate. The total population of KCP is 1000
3.4.4 SAMPLE SIZE
Sample size is derived from population of the study. Asthe population size is 1000 in that 10% of the population is selected as sample. The sample size is 100
32

3.4.5 SAMPLE METHOD
The Sample method used is convenience sampling refers tocollection of information from respondent of the population who are conveniently available to prove it
33

3.5 STATISTICAL TOOLS AND ANALYSIS
The analysis for the study is one on the basis of the datacollection through questionnaire. For abstracting the meaningfulinformation from the data collected from the following tools wereused.
1. Simple percentage method. 2. Chi-square test. 3. Weight Average method
SIMPLE PERCENTAGE METHOD:
One of the tools used for analyzing the data is percentagemethod. Percentage refers to a special kind of ratio, which isused to describe the relationship percentage reduces everythingto common base and there by allows meaningful comparison to bemade.
Number of respondentsPercentage= --------------------------------------*100
Total number of respondents
CHI-SQUARE TEST:
Chi-square test (pronounced as chi-square) is one of thesimplest and most widely statistical tool. The symbol chi-squaretest is the greek letter it wasfirstusedkarl person in the year1990 the quality chi –square describes magnitude of thediscrepancy between theory and observations.The chi-square is
34
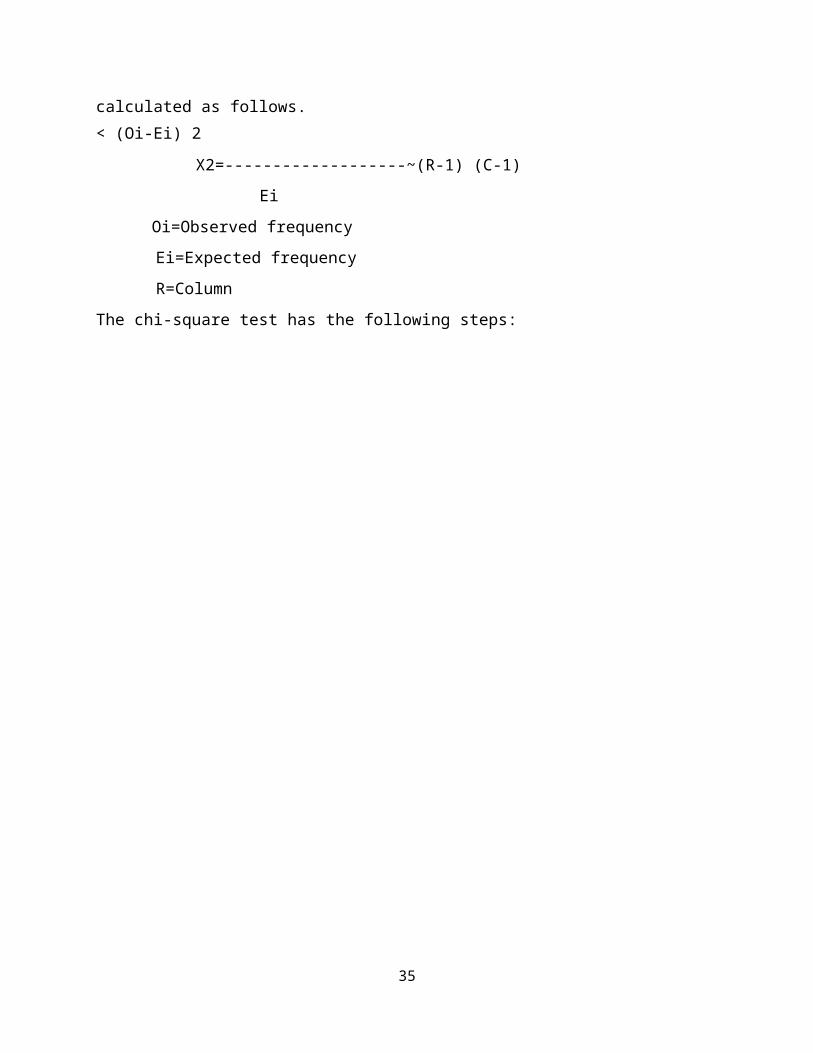
calculated as follows.< (Oi-Ei) 2
X2=-------------------~(R-1) (C-1)Ei
Oi=Observed frequencyEi=Expected frequencyR=Column
The chi-square test has the following steps:
35
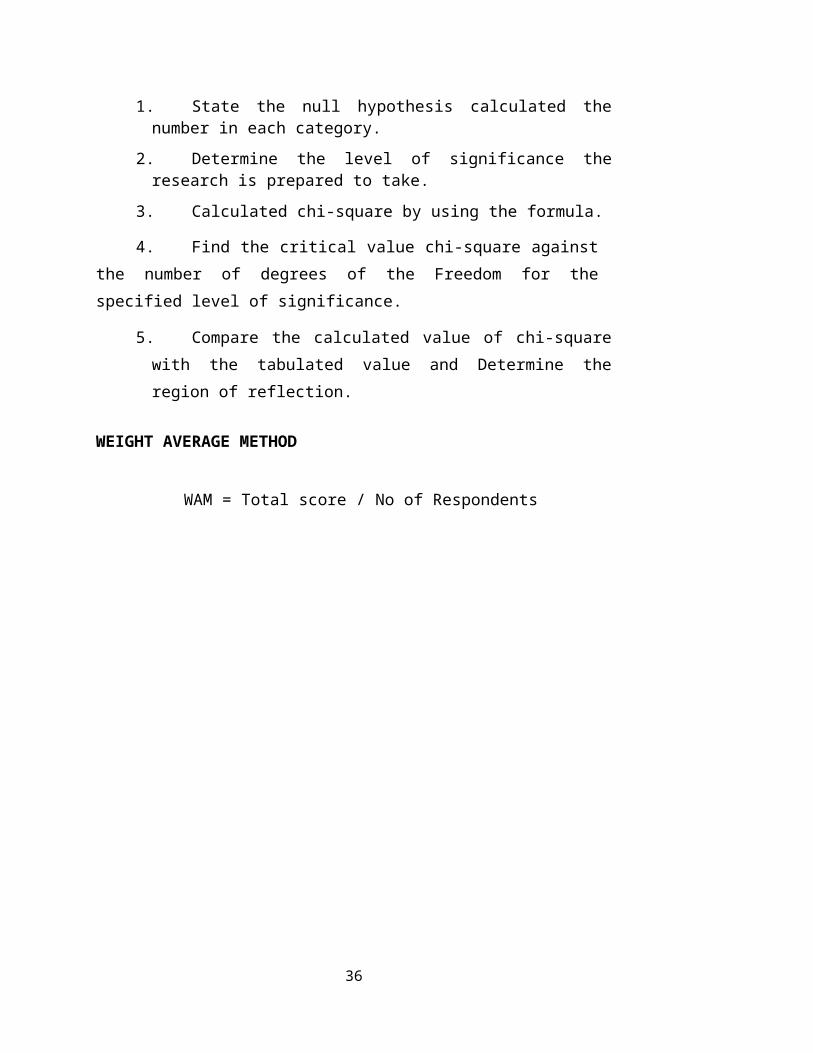
1. State the null hypothesis calculated thenumber in each category.
2. Determine the level of significance theresearch is prepared to take.
3. Calculated chi-square by using the formula.
4. Find the critical value chi-square againstthe number of degrees of the Freedom for thespecified level of significance.
5. Compare the calculated value of chi-squarewith the tabulated value and Determine theregion of reflection.
WEIGHT AVERAGE METHOD
WAM = Total score / No of Respondents
36
CHAPTER-IVDATA ANALYSIS AND INTERPRETATION:
Data analysis and interpretation refers to the tasks ofdrawing inferences from the collected facts after an analyticaland experimental study. Interpretation is the device throughwhich the factor explains what have been observed by researcherin the course of the study. Interpretation is essential for asimple reason that the usefulness and utility of research findinglie in proper interpretation.
It is through interpretation the researcher can understandthe abstract principle that works beneath his findings.Interpretation leads to the establishment of explanatory conceptsthat can serve as a guide for future research studies.
This chapter deals with the analysis and interpretation ofthe sample, data collected from questionnaires, which wereissued, to a sample of 100 employees. The company follows aparticular system regarding performance appraisal system in orderto assess the present satisfaction level among the workers andstaff. The effectiveness of this system can be ascertained byanalyzing the responses given to the questionnaires.
The analysis is done based on the sample data, which has been reflected in various tables, which helps to draw conclusions whether the measures followed by the organization to improve the performance appraisal system, are effective.
37
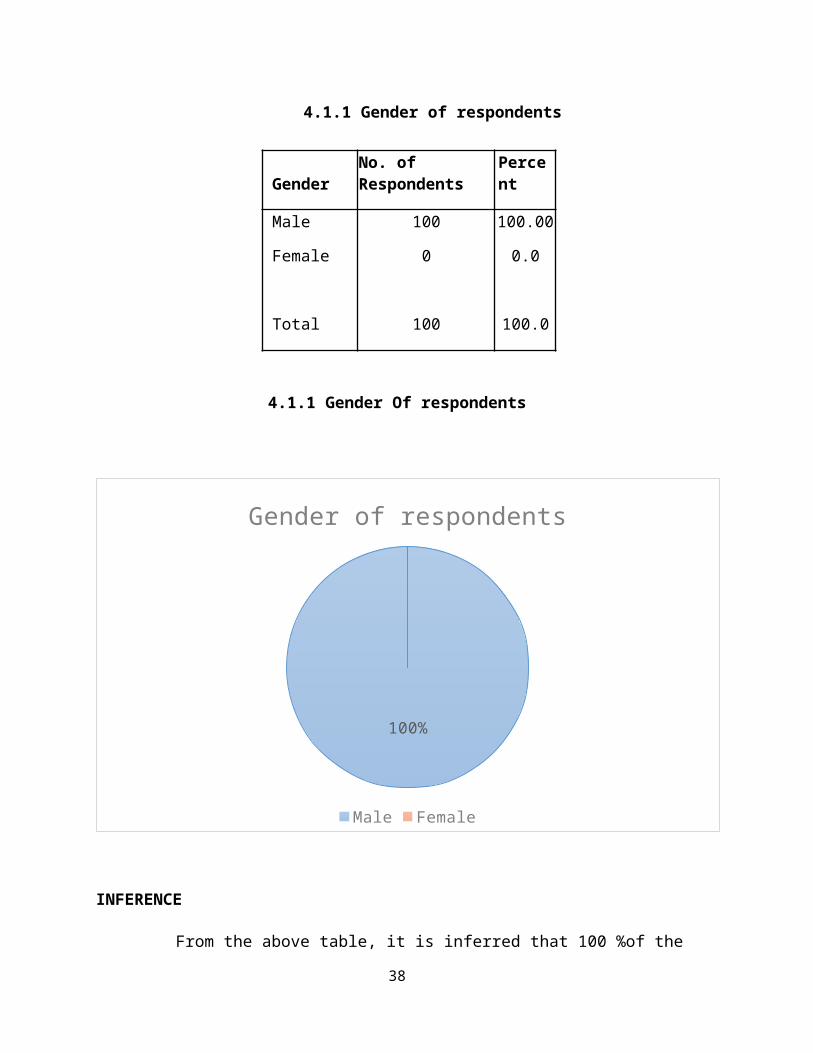
4.1.1 Gender of respondents
GenderNo. of Respondents
Percent
Male 100 100.00
Female 0 0.0
Total 100 100.0
4.1.1 Gender Of respondents
100%
Gender of respondents
Male Female
INFERENCE
From the above table, it is inferred that 100 %of the
38
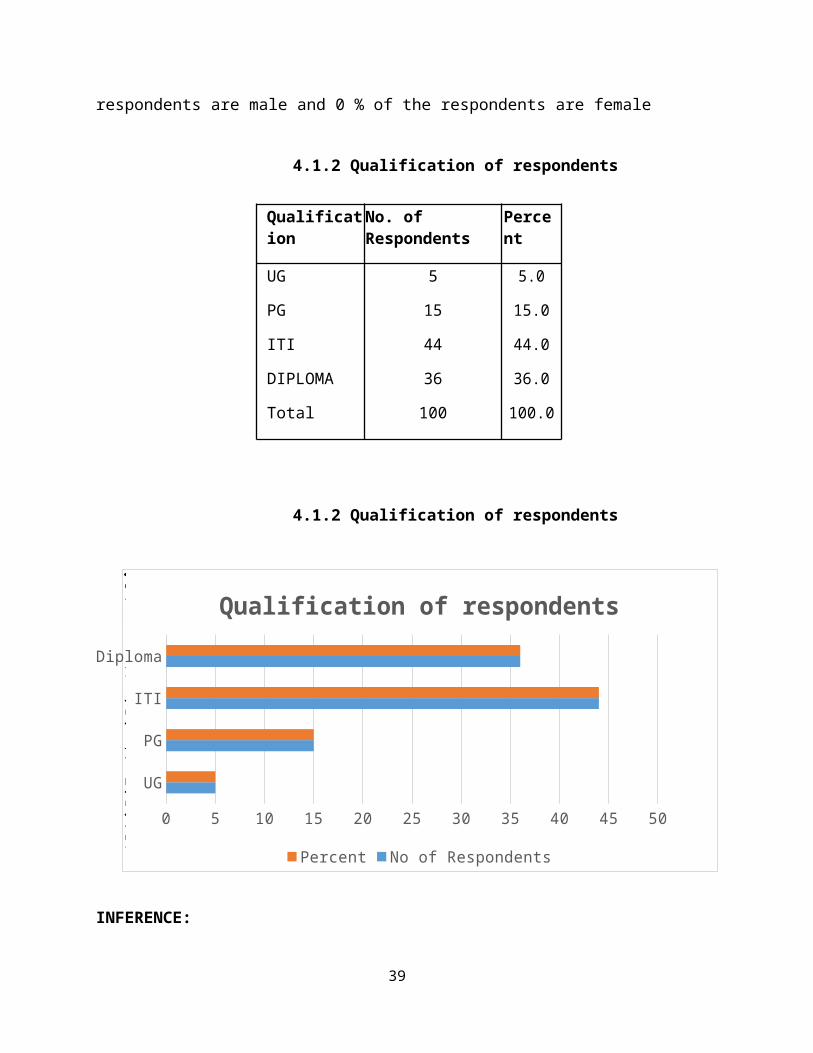
respondents are male and 0 % of the respondents are female
4.1.2 Qualification of respondents
Qualification
No. of Respondents
Percent
UG 5 5.0
PG 15 15.0
ITI 44 44.0
DIPLOMA 36 36.0
Total 100 100.0
4.1.2 Qualification of respondents
UG
PG
ITI
Diploma
0 5 10 15 20 25 30 35 40 45 50
Qualification of respondents
Percent No of Respondents
Qualification of respondents
INFERENCE:
39
The above table shows that 44% of respondents are in the education qualification of ITI, 5% of the respondents are in the education qualification of UG.
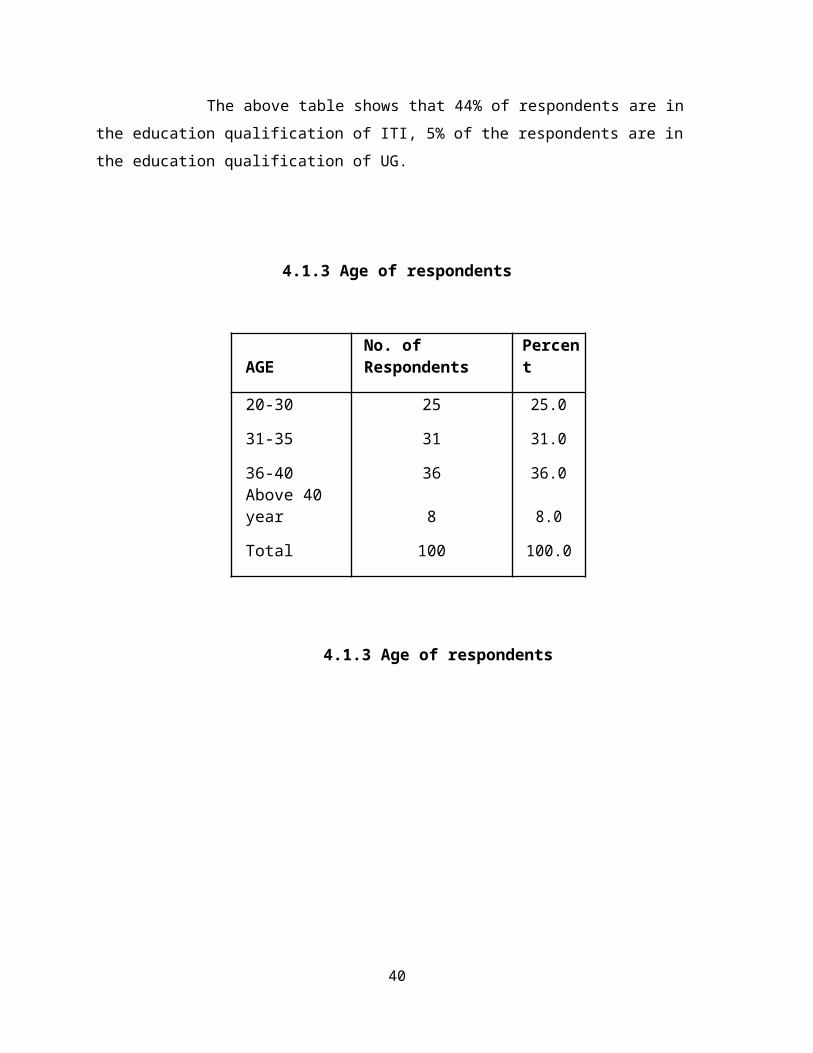
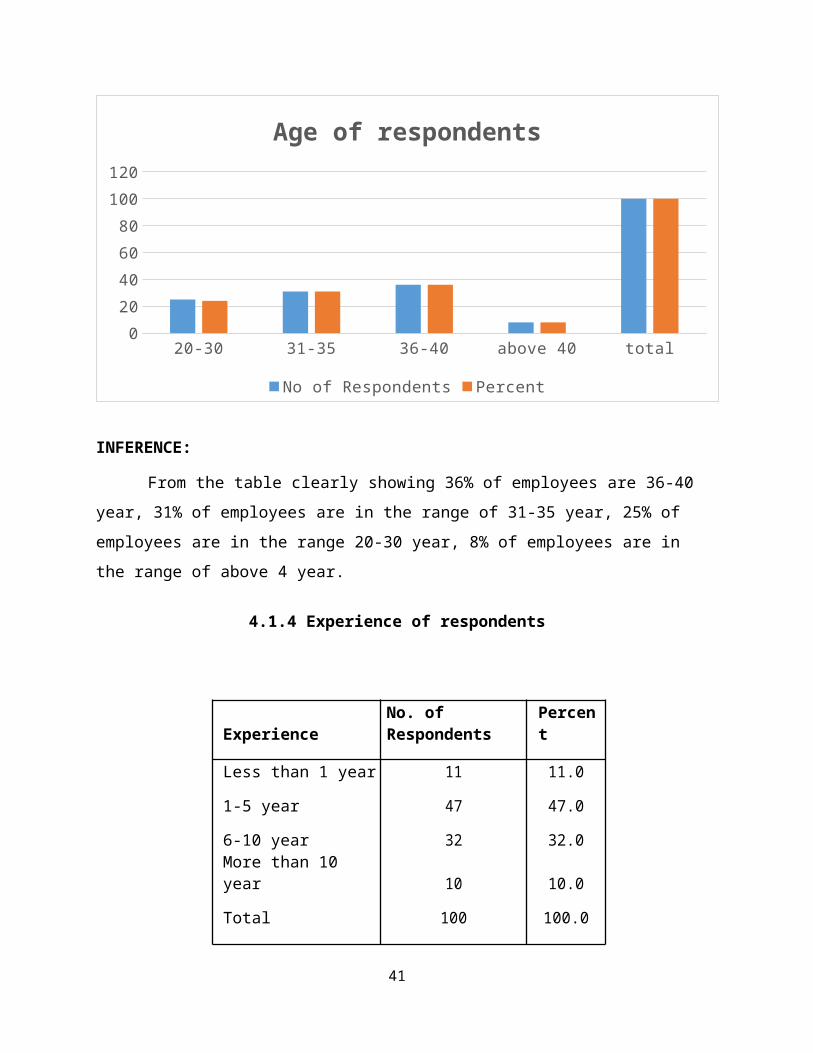
4.1.3 Age of respondents
AGENo. of Respondents
Percent
20-30 25 25.0
31-35 31 31.0
36-40 36 36.0Above 40 year 8 8.0
Total 100 100.0
4.1.3 Age of respondents
40
20-30 31-35 36-40 above 40 total0
20406080
100120
Age of respondents
No of Respondents Percent
INFERENCE:
From the table clearly showing 36% of employees are 36-40year, 31% of employees are in the range of 31-35 year, 25% of employees are in the range 20-30 year, 8% of employees are in the range of above 4 year.
4.1.4 Experience of respondents
ExperienceNo. of Respondents
Percent
Less than 1 year 11 11.0
1-5 year 47 47.0
6-10 year 32 32.0More than 10 year 10 10.0
Total 100 100.0
41
4.1.4 Experience of respondents
Less than 1 year11%
1-5 year47%
6-10 year32%
More than 10 year10%
Experience of respondents
INFERENCE:
From the above statistical analysis that 47% of respondents come under 1-5years. 10% of respondents come underabove more than 10 years.
4.1.5 Income level of respondents
Monthly income
No. of Respondents
Percent
Below 5000 15 15.0
5000-10000 22 22.0
10000-20000 44 44.0
42
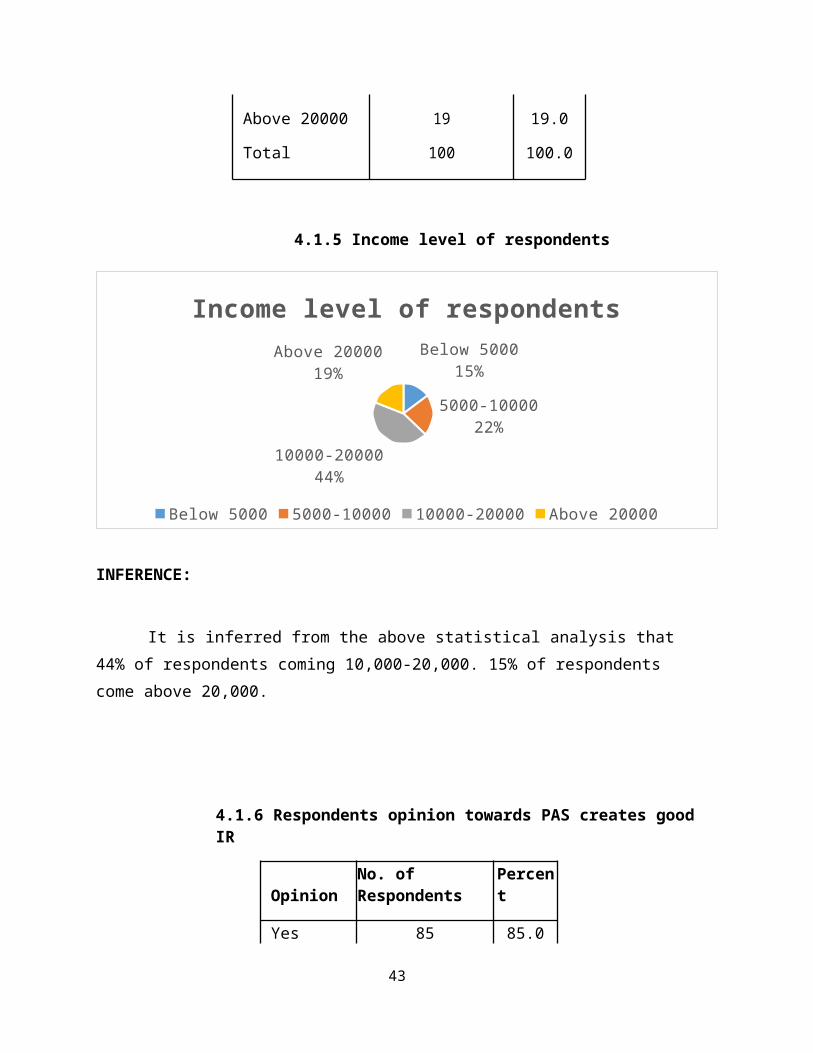
Above 20000 19 19.0
Total 100 100.0
4.1.5 Income level of respondents
Below 500015%
5000-1000022%
10000-2000044%
Above 2000019%
Income level of respondents
Below 5000 5000-10000 10000-20000 Above 20000
INFERENCE:
It is inferred from the above statistical analysis that 44% of respondents coming 10,000-20,000. 15% of respondents come above 20,000.
4.1.6 Respondents opinion towards PAS creates goodIR
OpinionNo. of Respondents
Percent
Yes 85 85.0
43
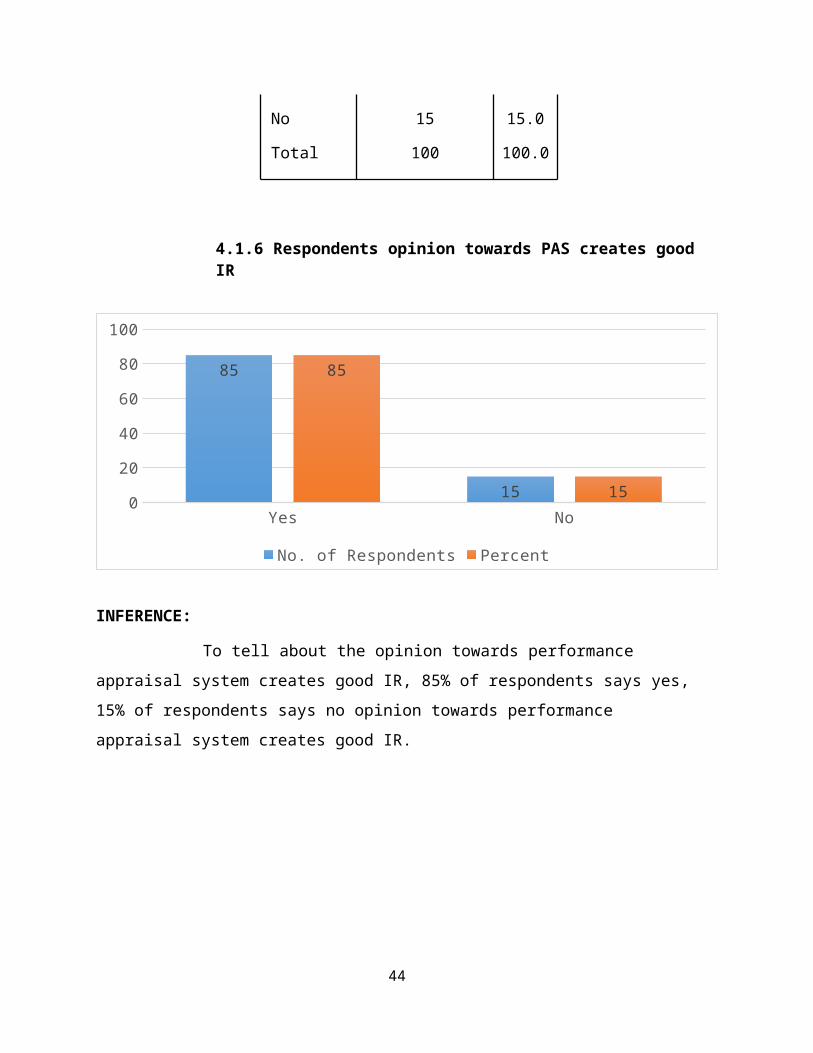
No 15 15.0
Total 100 100.0
4.1.6 Respondents opinion towards PAS creates goodIR
Yes No0
20
40
60
80
100
85
15
85
15
No. of Respondents Percent
INFERENCE:
To tell about the opinion towards performance appraisal system creates good IR, 85% of respondents says yes,15% of respondents says no opinion towards performance appraisal system creates good IR.
44
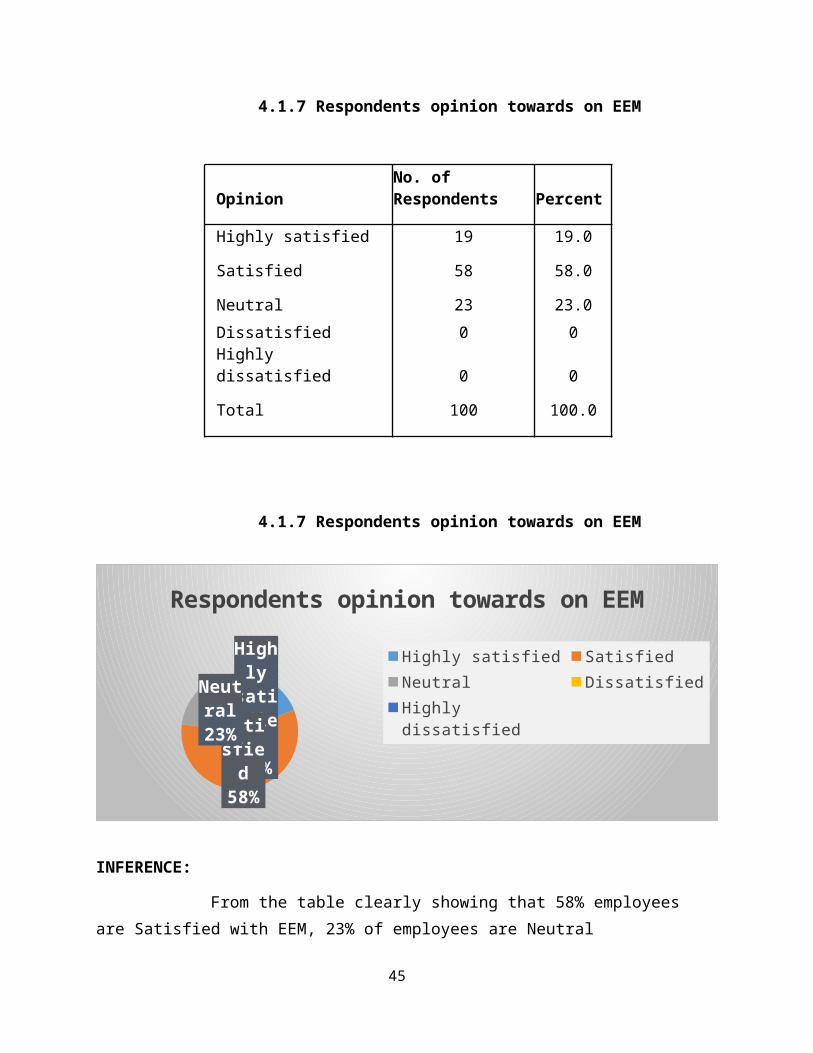
4.1.7 Respondents opinion towards on EEM
OpinionNo. of Respondents Percent
Highly satisfied 19 19.0
Satisfied 58 58.0
Neutral 23 23.0Dissatisfied 0 0Highly dissatisfied 0 0
Total 100 100.0
4.1.7 Respondents opinion towards on EEM
Highly
satisfied
19%
Satisfied
58%
Neutral23%
Respondents opinion towards on EEM
Highly satisfied SatisfiedNeutral DissatisfiedHighly dissatisfied
Respondents opinion towards on EEM
INFERENCE:
From the table clearly showing that 58% employees are Satisfied with EEM, 23% of employees are Neutral
45
satisfied, 19% of employees are Highly satisfied.
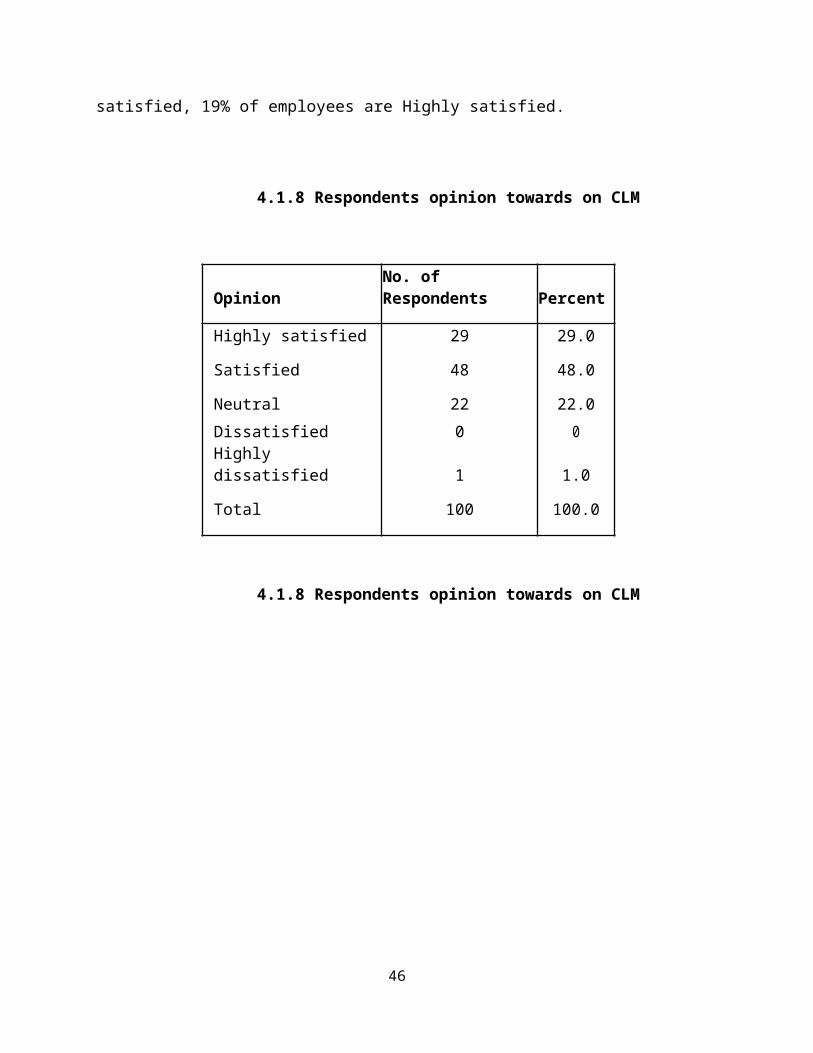
4.1.8 Respondents opinion towards on CLM
OpinionNo. of Respondents Percent
Highly satisfied 29 29.0
Satisfied 48 48.0
Neutral 22 22.0Dissatisfied 0 0Highly dissatisfied 1 1.0
Total 100 100.0
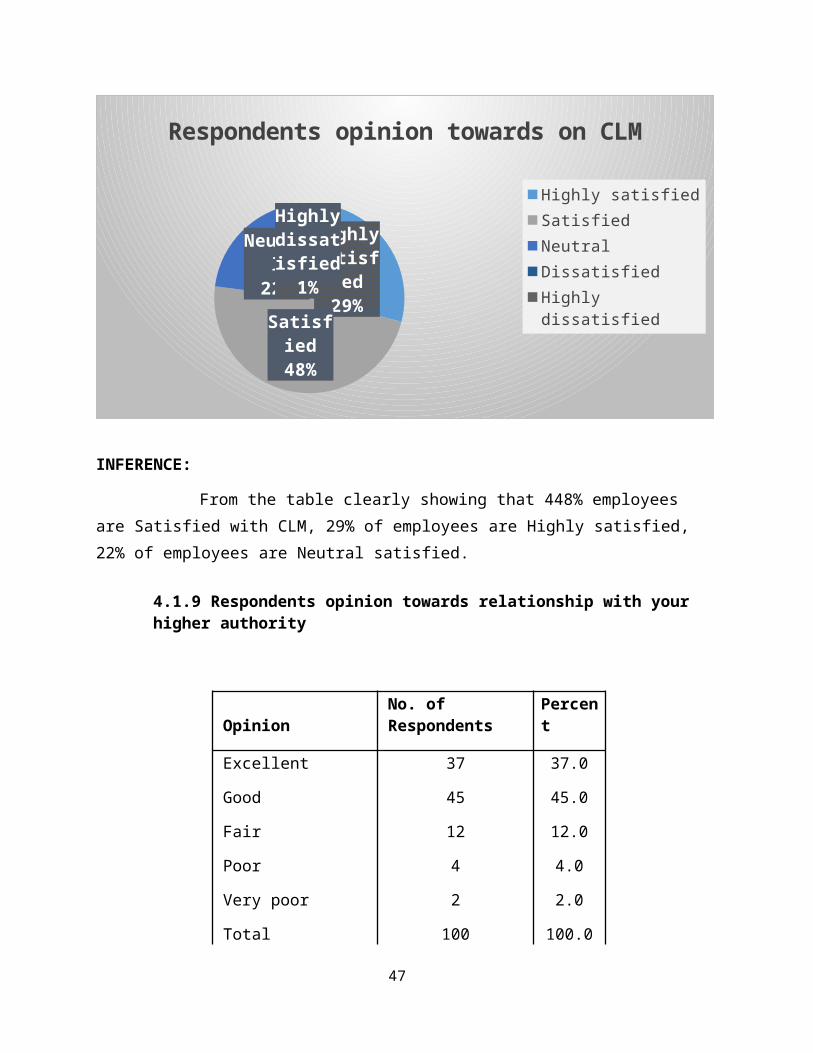
4.1.8 Respondents opinion towards on CLM
46
Highly satisfied29%
Satisfied48%
Neutral
22%
Highly dissatisfied
1%
Respondents opinion towards on CLM
Highly satisfiedSatisfiedNeutralDissatisfiedHighly dissatisfied
INFERENCE:
From the table clearly showing that 448% employees are Satisfied with CLM, 29% of employees are Highly satisfied,22% of employees are Neutral satisfied.
4.1.9 Respondents opinion towards relationship with yourhigher authority
OpinionNo. of Respondents
Percent
Excellent 37 37.0
Good 45 45.0
Fair 12 12.0
Poor 4 4.0
Very poor 2 2.0
Total 100 100.0
47
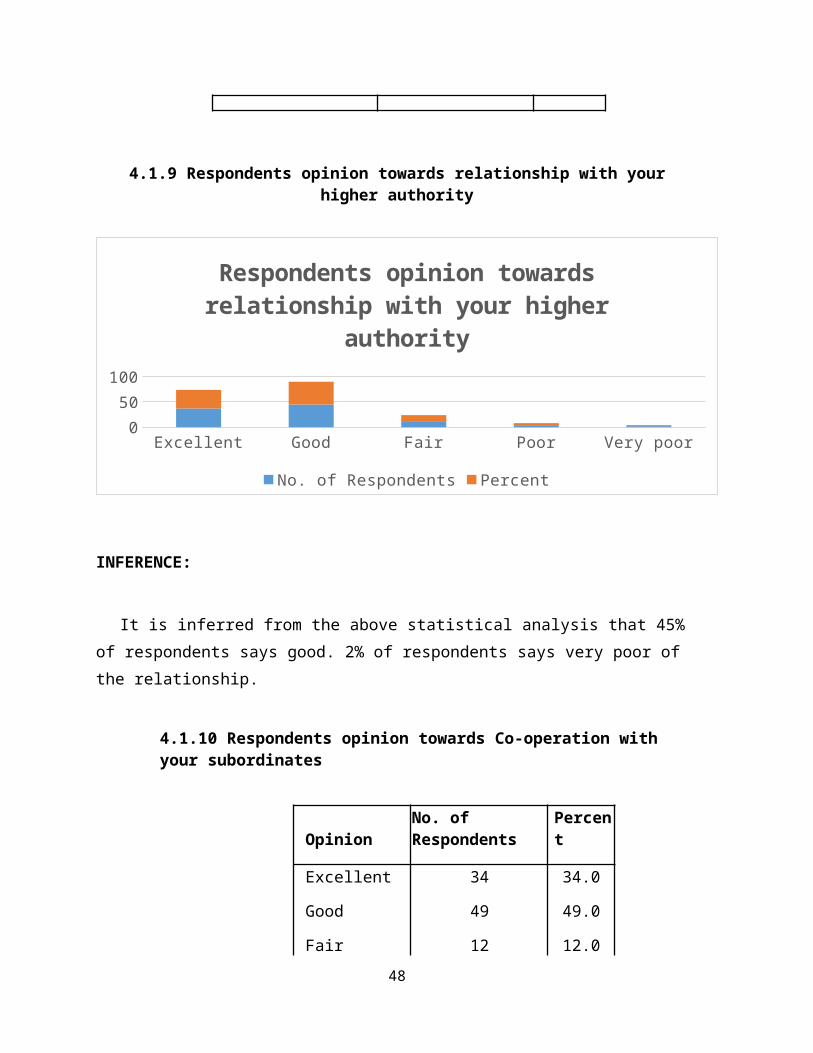
4.1.9 Respondents opinion towards relationship with yourhigher authority
Excellent Good Fair Poor Very poor0
50100
Respondents opinion towards relationship with your higher
authority
No. of Respondents Percent
INFERENCE:
It is inferred from the above statistical analysis that 45% of respondents says good. 2% of respondents says very poor of the relationship.
4.1.10 Respondents opinion towards Co-operation with your subordinates
OpinionNo. of Respondents
Percent
Excellent 34 34.0
Good 49 49.0
Fair 12 12.048
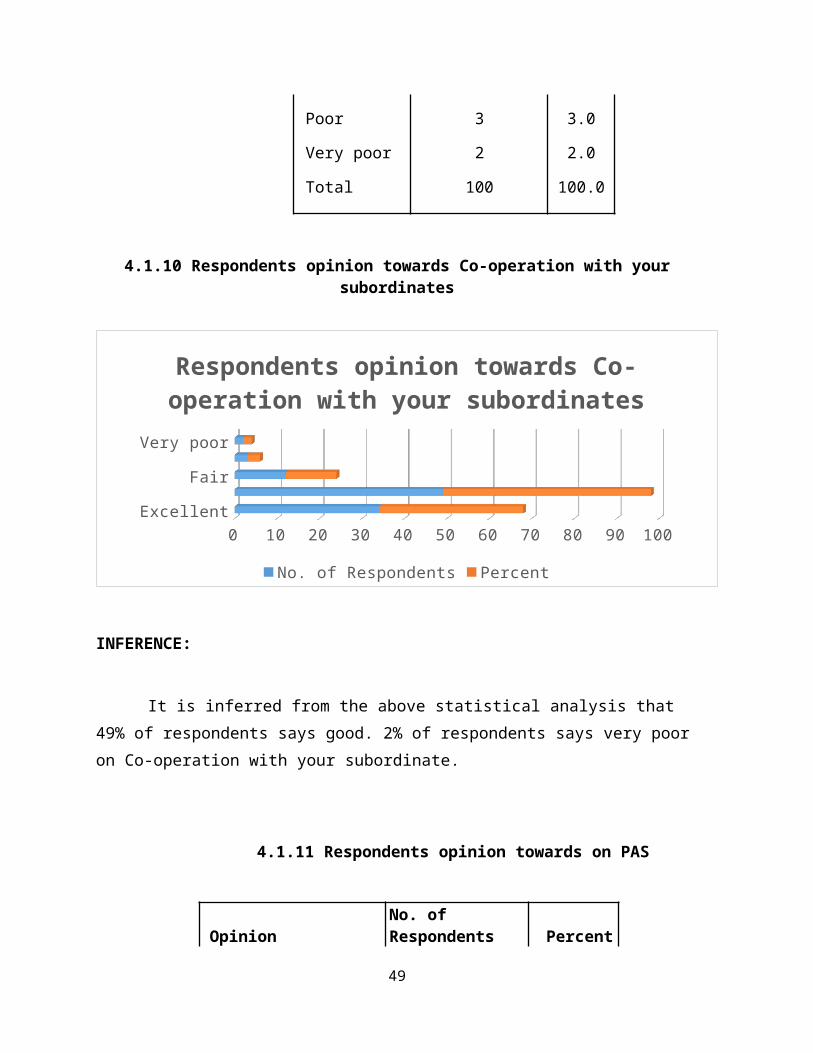
Poor 3 3.0
Very poor 2 2.0
Total 100 100.0
4.1.10 Respondents opinion towards Co-operation with yoursubordinates
Excellent
Fair
Very poor
0 10 20 30 40 50 60 70 80 90 100
Respondents opinion towards Co-operation with your subordinates
No. of Respondents Percent
INFERENCE:
It is inferred from the above statistical analysis that 49% of respondents says good. 2% of respondents says very pooron Co-operation with your subordinate.
4.1.11 Respondents opinion towards on PAS
OpinionNo. of Respondents Percent
49
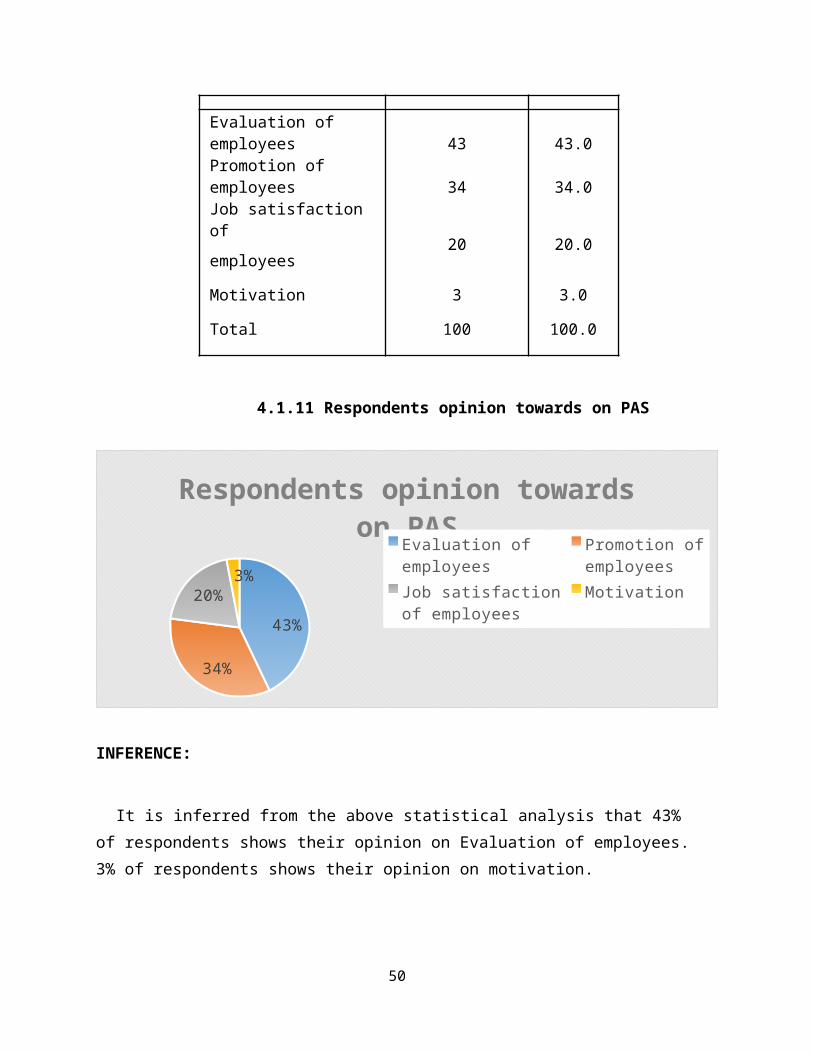
Evaluation of employees 43 43.0Promotion of employees 34 34.0Job satisfaction of
20 20.0employees
Motivation 3 3.0
Total 100 100.0
4.1.11 Respondents opinion towards on PAS
43%
34%
20%3%
Respondents opinion towards on PAS
Evaluation of employees
Promotion of employees
Job satisfaction of employees
Motivation
INFERENCE:
It is inferred from the above statistical analysis that 43% of respondents shows their opinion on Evaluation of employees.3% of respondents shows their opinion on motivation.
50
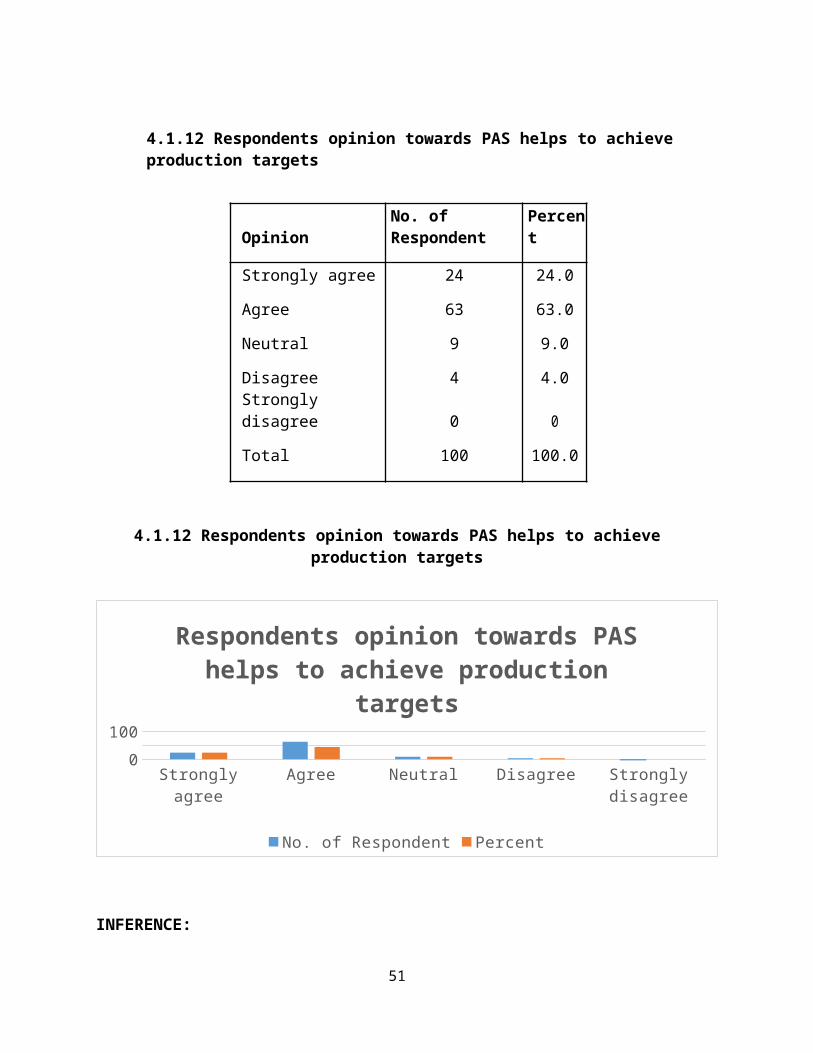
4.1.12 Respondents opinion towards PAS helps to achieve production targets
OpinionNo. of Respondent
Percent
Strongly agree 24 24.0
Agree 63 63.0
Neutral 9 9.0
Disagree 4 4.0Strongly disagree 0 0
Total 100 100.0
4.1.12 Respondents opinion towards PAS helps to achieveproduction targets
Strongly agree
Agree Neutral Disagree Strongly disagree
0100
Respondents opinion towards PAS helps to achieve production
targets
No. of Respondent Percent
INFERENCE:
51

Nearly 63% of respondents are Agree with the PAS, 4% of respondents disagree that PAS helps to achieve production targets.
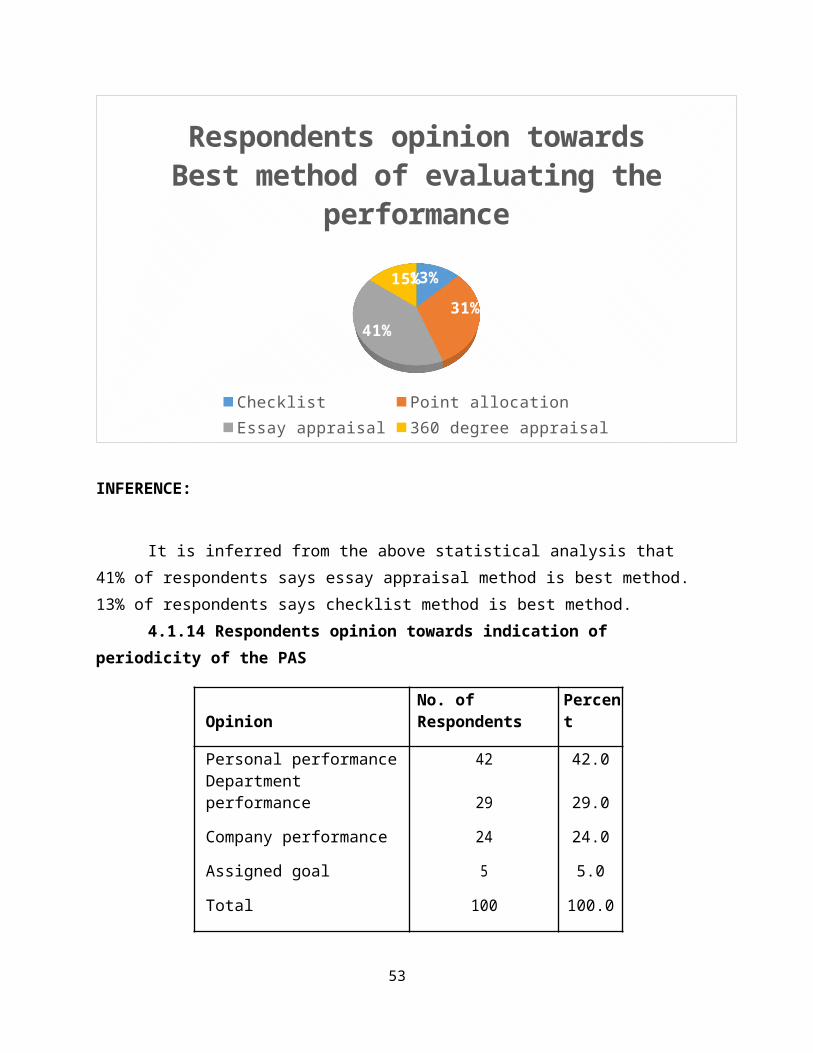
4.1.13 Respondents opinion towards Best method of evaluating the performance
OpinionNo. of Respondents
Percent
Checklist 13 13.0
Point allocation 31 31.0
Essay appraisal 41 41.0
360 degree appraisal 15 15.0
Total 100 100.0
4.1.13 Respondents opinion towards Best method of evaluating the performance
52
13%31%
41%
15%
Respondents opinion towards Best method of evaluating the
performance
Checklist Point allocationEssay appraisal 360 degree appraisal
INFERENCE:
It is inferred from the above statistical analysis that 41% of respondents says essay appraisal method is best method.13% of respondents says checklist method is best method.
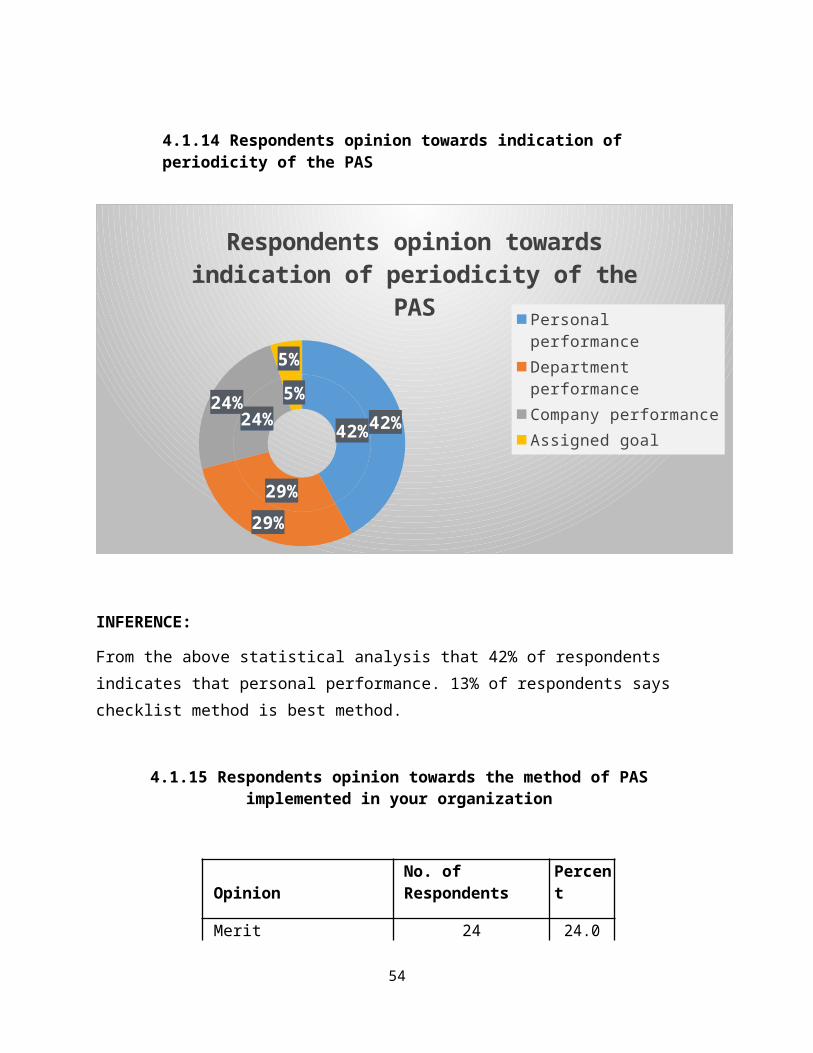
4.1.14 Respondents opinion towards indication of periodicity of the PAS
OpinionNo. of Respondents
Percent
Personal performance 42 42.0Department performance 29 29.0
Company performance 24 24.0
Assigned goal 5 5.0
Total 100 100.0
53
4.1.14 Respondents opinion towards indication of periodicity of the PAS
42%
29%
24%5%
42%
29%
24%
5%
Respondents opinion towards indication of periodicity of the
PAS Personal performanceDepartment performanceCompany performanceAssigned goal
INFERENCE:
From the above statistical analysis that 42% of respondents indicates that personal performance. 13% of respondents says checklist method is best method.
4.1.15 Respondents opinion towards the method of PASimplemented in your organization
OpinionNo. of Respondents
Percent
Merit 24 24.0
54
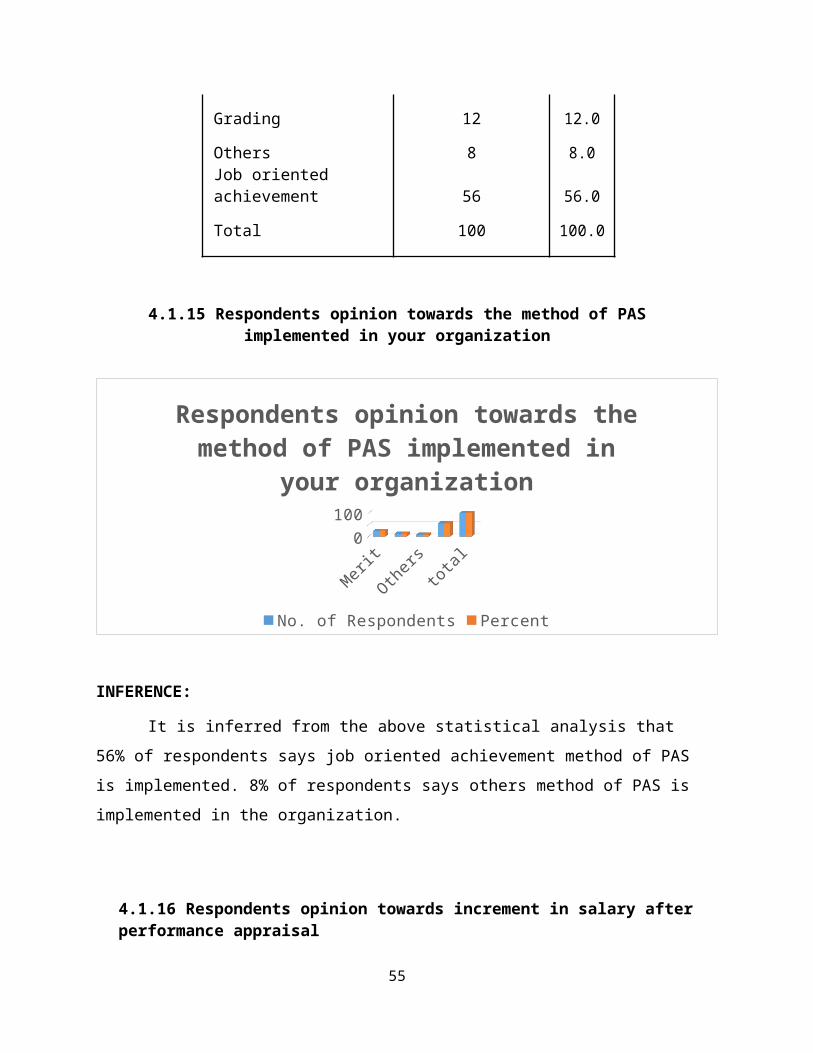
Grading 12 12.0
Others 8 8.0Job oriented achievement 56 56.0
Total 100 100.0
4.1.15 Respondents opinion towards the method of PASimplemented in your organization
Merit
Others
total
0100
Respondents opinion towards the method of PAS implemented in
your organization
No. of Respondents Percent
INFERENCE:
It is inferred from the above statistical analysis that 56% of respondents says job oriented achievement method of PASis implemented. 8% of respondents says others method of PAS isimplemented in the organization.
4.1.16 Respondents opinion towards increment in salary afterperformance appraisal
55
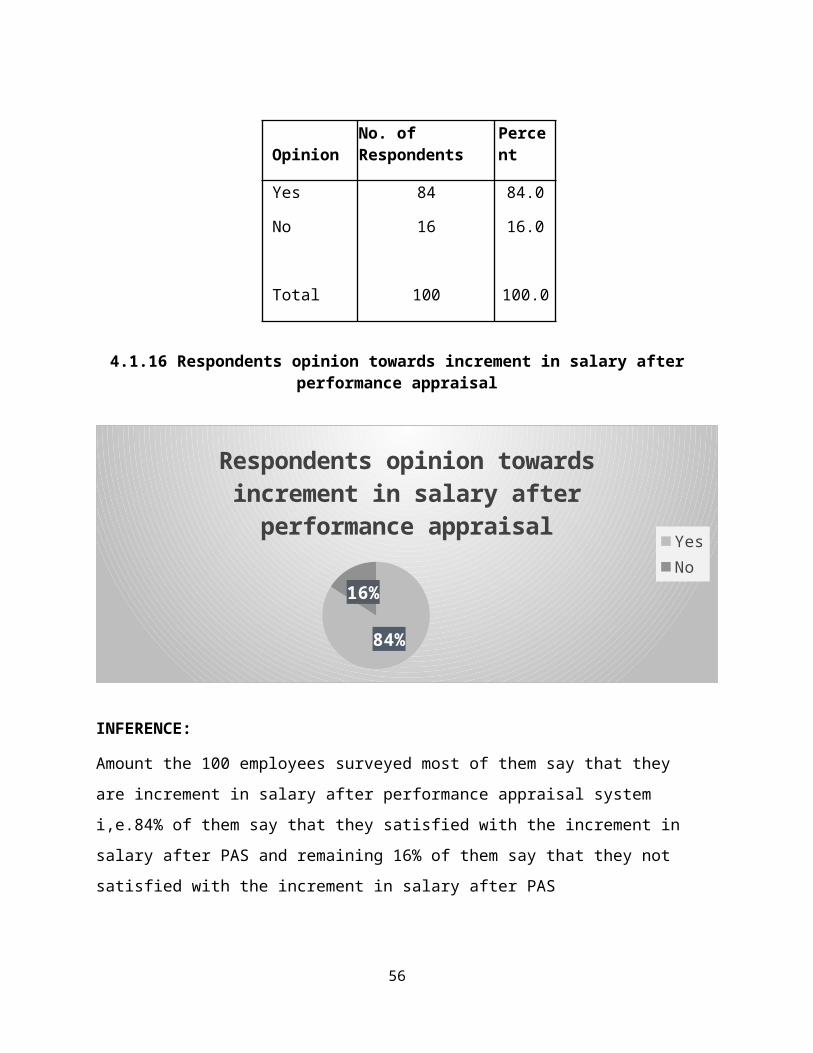
OpinionNo. of Respondents
Percent
Yes 84 84.0
No 16 16.0
Total 100 100.0
4.1.16 Respondents opinion towards increment in salary afterperformance appraisal
84%
16%
Respondents opinion towards increment in salary after performance appraisal Yes
No
INFERENCE:
Amount the 100 employees surveyed most of them say that they are increment in salary after performance appraisal system i,e.84% of them say that they satisfied with the increment in salary after PAS and remaining 16% of them say that they not satisfied with the increment in salary after PAS
56
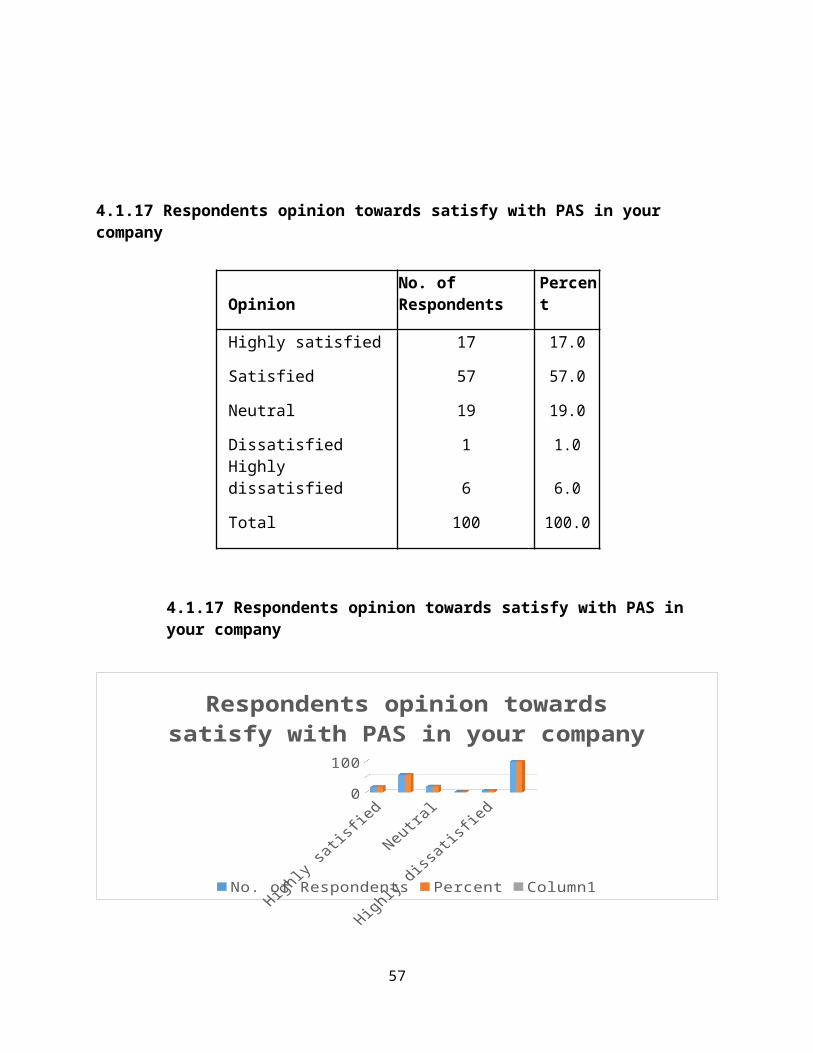
4.1.17 Respondents opinion towards satisfy with PAS in your company
OpinionNo. of Respondents
Percent
Highly satisfied 17 17.0
Satisfied 57 57.0
Neutral 19 19.0
Dissatisfied 1 1.0Highly dissatisfied 6 6.0
Total 100 100.0
4.1.17 Respondents opinion towards satisfy with PAS in your company
0
100
Respondents opinion towards satisfy with PAS in your company
No. of Respondents Percent Column1
57
INFERENCE:
It is inferred from the above statistical analysis that 57% of respondents are satisfied. 1% of respondents dissatisfied with the PAS in their company.
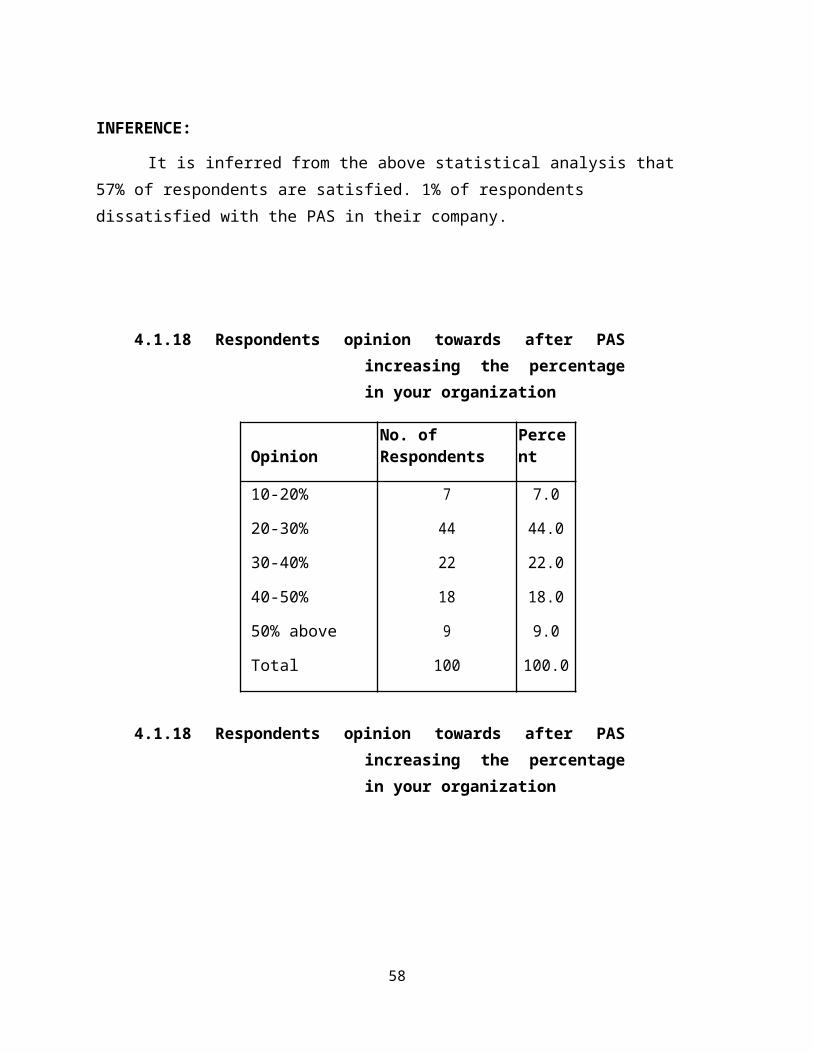
4.1.18 Respondents opinion towards after PASincreasing the percentagein your organization
OpinionNo. of Respondents
Percent
10-20% 7 7.0
20-30% 44 44.0
30-40% 22 22.0
40-50% 18 18.0
50% above 9 9.0
Total 100 100.0
4.1.18 Respondents opinion towards after PASincreasing the percentagein your organization
58

10-20%
Total
0 20 40 60 80 100 120
Respondents opinion towards after PAS increasing the
percentage in your organization
Percent No. of Respondents
INFERENCE:
From the above statistical analysis that 44% respondents saysthat 20-30% increases in after PAS in the organization. 9% ofrespondents says that 50% above increases in after PAS in theorganization.
4.1.19 Respondents opinion towards gained any recognitionafter being appraised under PAS
OpinionNo. of Respondents
Percent
Strongly agree 24 24.0
Agree 54 54.0
Neutral 16 16.0
Disagree 4 4.0
Strongly disagree 2 2.0
Total 100 100.0
59
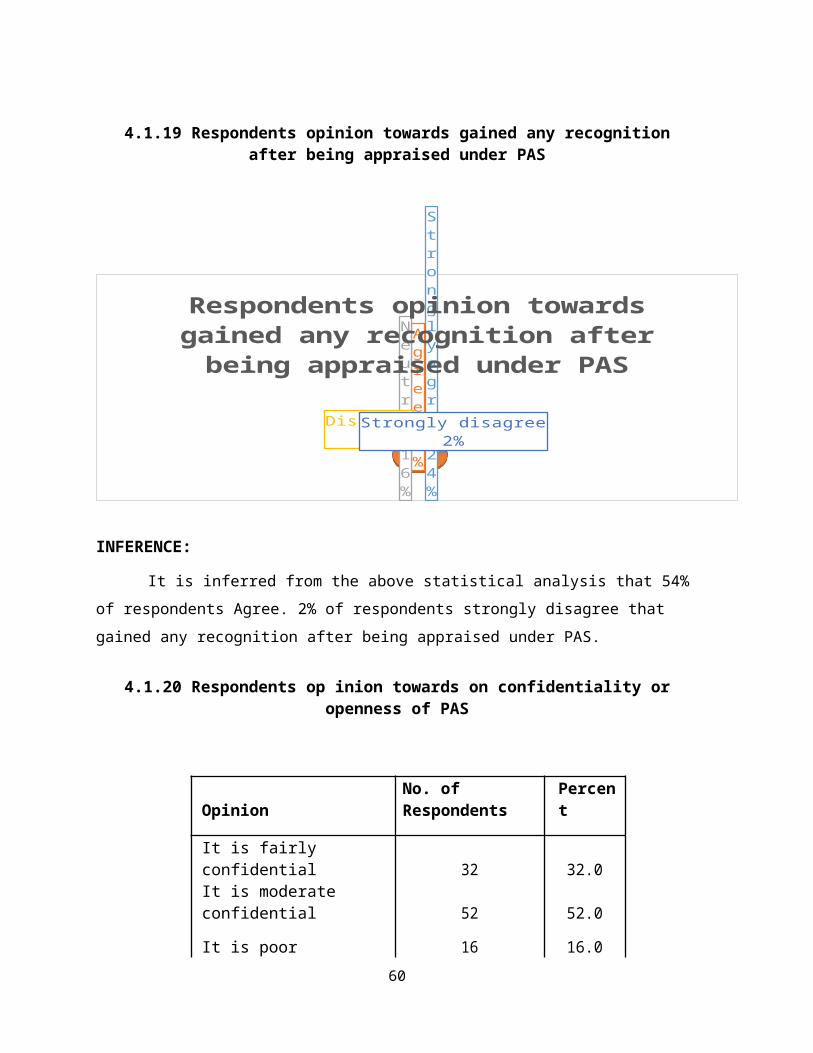
4.1.19 Respondents opinion towards gained any recognitionafter being appraised under PAS
Strongly agree24%
Agree54%
Neutral16%
Disagree4%Strongly disagree
2%
Respondents opinion towards gained any recognition after being appraised under PAS
INFERENCE:
It is inferred from the above statistical analysis that 54% of respondents Agree. 2% of respondents strongly disagree that gained any recognition after being appraised under PAS.
4.1.20 Respondents op inion towards on confidentiality oropenness of PAS
OpinionNo. of Respondents
Percent
It is fairly confidential 32 32.0It is moderate confidential 52 52.0
It is poor 16 16.060
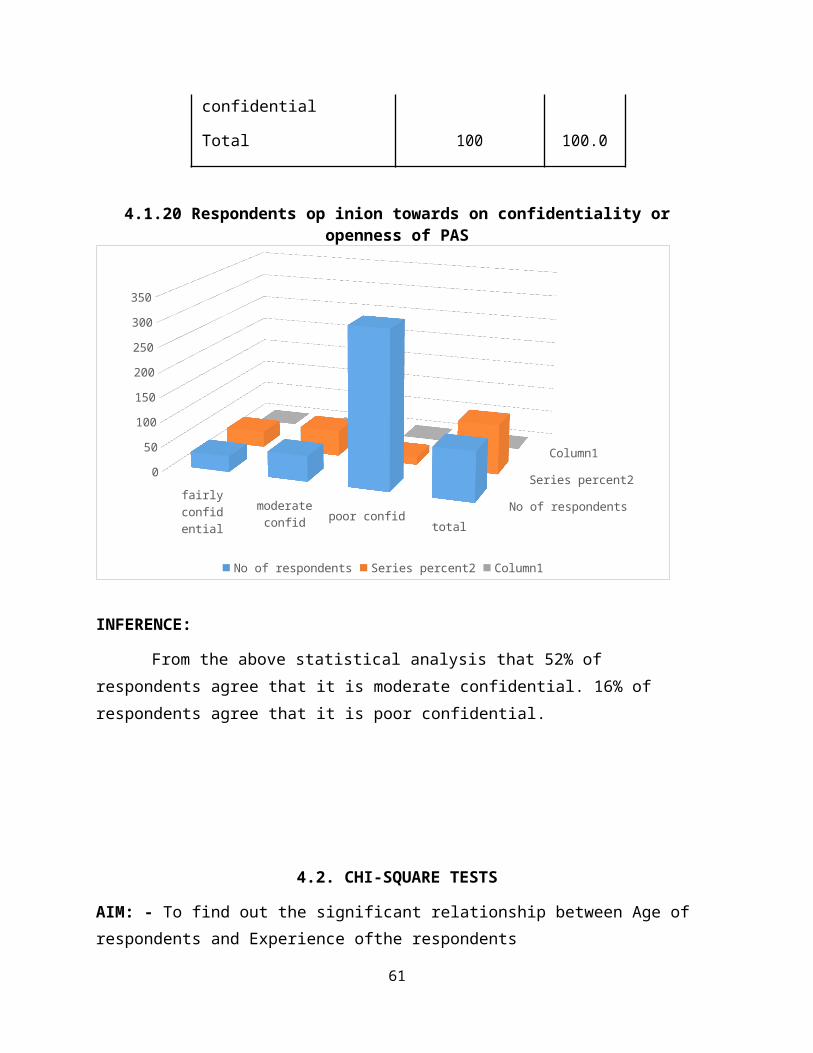
confidential
Total 100 100.0
4.1.20 Respondents op inion towards on confidentiality oropenness of PAS
fairly confid ential
moderate confid poor confid
total
0
50
100
150
200
250
300
350
No of respondents
Series percent2
Column1
No of respondents Series percent2 Column1
INFERENCE:
From the above statistical analysis that 52% of respondents agree that it is moderate confidential. 16% of respondents agree that it is poor confidential.
4.2. CHI-SQUARE TESTS
AIM: - To find out the significant relationship between Age ofrespondents and Experience ofthe respondents
61
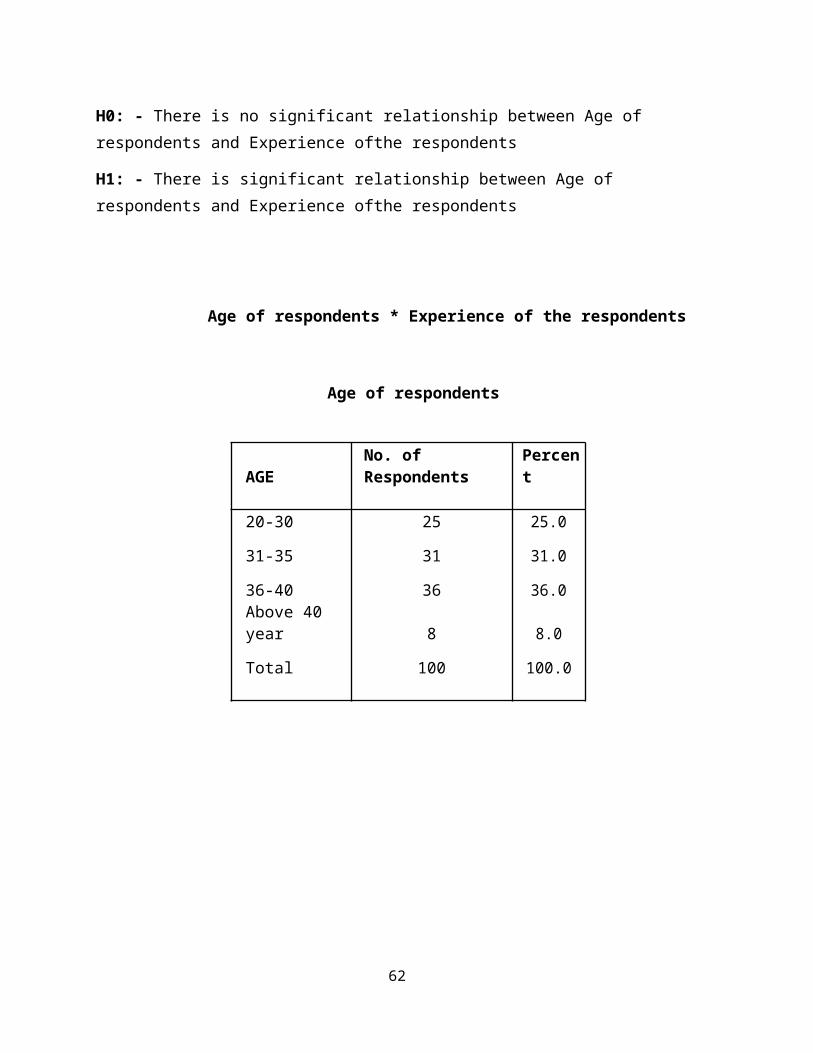
H0: - There is no significant relationship between Age of respondents and Experience ofthe respondents
H1: - There is significant relationship between Age of respondents and Experience ofthe respondents
Age of respondents * Experience of the respondents
Age of respondents
AGENo. of Respondents
Percent
20-30 25 25.0
31-35 31 31.0
36-40 36 36.0Above 40 year 8 8.0
Total 100 100.0
62
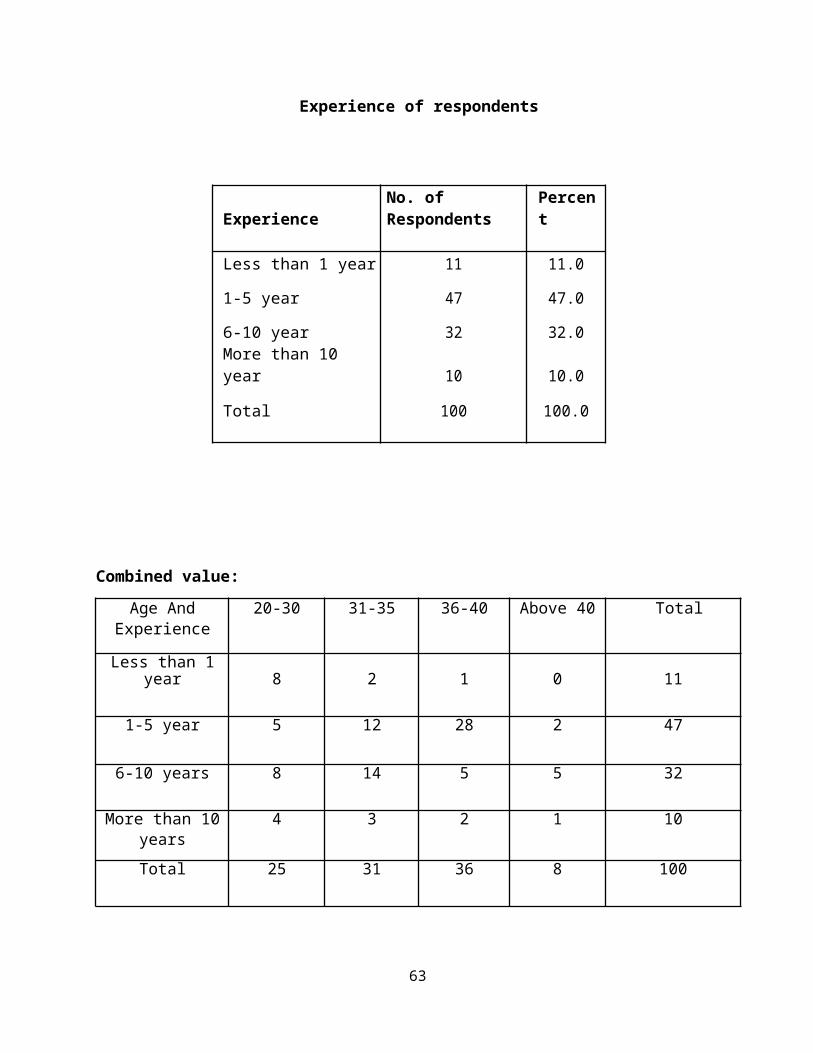
Experience of respondents
ExperienceNo. of Respondents
Percent
Less than 1 year 11 11.0
1-5 year 47 47.0
6-10 year 32 32.0More than 10 year 10 10.0
Total 100 100.0
Combined value:Age And 20-30 31-35 36-40 Above 40 Total
Experience
Less than 1year 8 2 1 0 11
1-5 year 5 12 28 2 47
6-10 years 8 14 5 5 32
More than 10 4 3 2 1 10yearsTotal 25 31 36 8 100
63
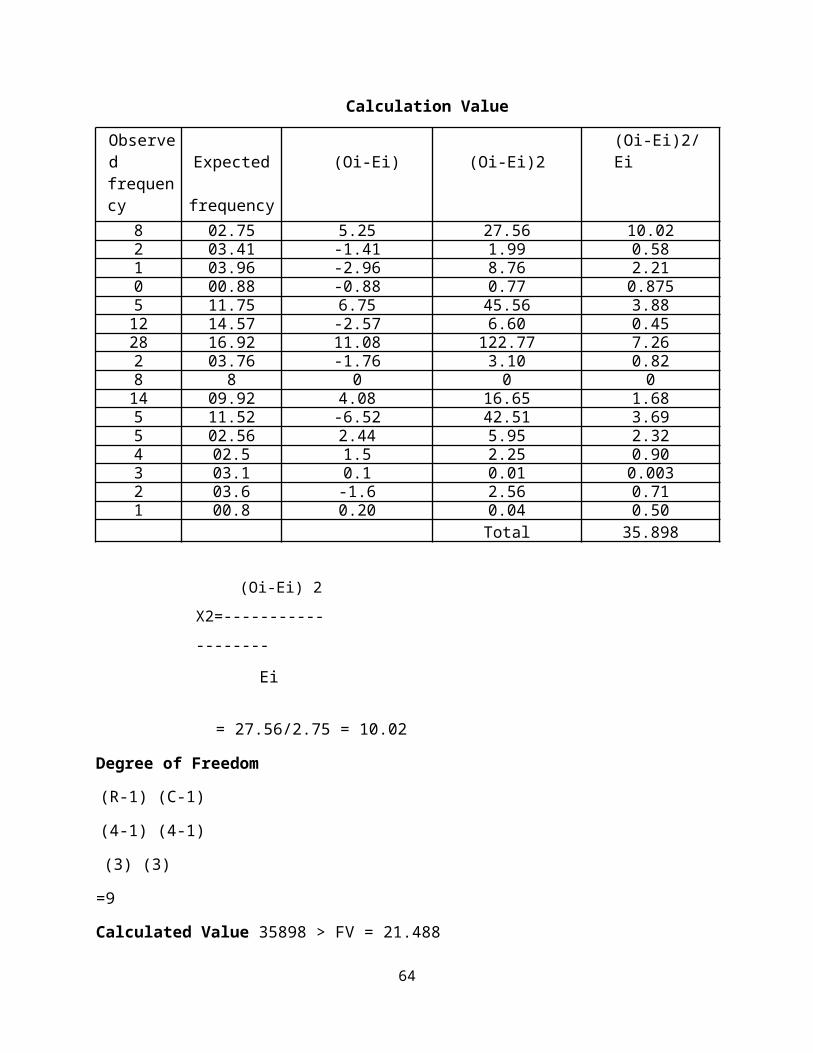
Calculation Value
Observed Expected (Oi-Ei) (Oi-Ei)2
(Oi-Ei)2/Ei
frequency frequency
8 02.75 5.25 27.56 10.022 03.41 -1.41 1.99 0.581 03.96 -2.96 8.76 2.210 00.88 -0.88 0.77 0.8755 11.75 6.75 45.56 3.8812 14.57 -2.57 6.60 0.4528 16.92 11.08 122.77 7.262 03.76 -1.76 3.10 0.828 8 0 0 014 09.92 4.08 16.65 1.685 11.52 -6.52 42.51 3.695 02.56 2.44 5.95 2.324 02.5 1.5 2.25 0.903 03.1 0.1 0.01 0.0032 03.6 -1.6 2.56 0.711 00.8 0.20 0.04 0.50
Total 35.898
(Oi-Ei) 2X2=-------------------
Ei
= 27.56/2.75 = 10.02
Degree of Freedom
(R-1) (C-1)
(4-1) (4-1)
(3) (3)
=9
Calculated Value 35898 > FV = 21.488
64

Inference:
Since the Calculated value is greater that tabularvalue the alternative hypothesis is accepted. Hence there is an association between two variables Age of respondents and Experience of the respondents.
65
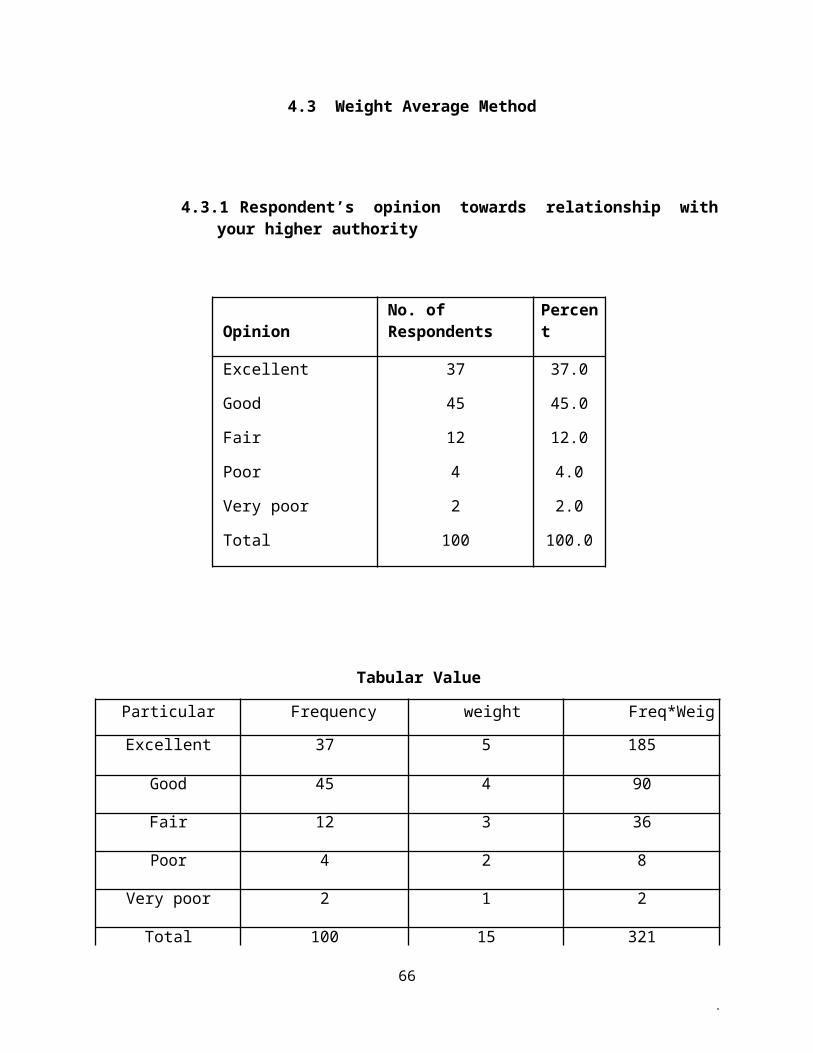
4.3 Weight Average Method
4.3.1 Respondent’s opinion towards relationship withyour higher authority
OpinionNo. of Respondents
Percent
Excellent 37 37.0
Good 45 45.0
Fair 12 12.0
Poor 4 4.0
Very poor 2 2.0
Total 100 100.0
Tabular Value
Particular Frequency weight Freq*Weig
Excellent 37 5 185
Good 45 4 90
Fair 12 3 36
Poor 4 2 8
Very poor 2 1 2
Total 100 15 321
66

67

WAM = Total score / No of Respondents
T.S = 321
No of R = 100
WAM = 321 / 100 = 3.1.
Inference:
As the WAM comes nearly to it after that the relationship of the higher authority for respondents
68
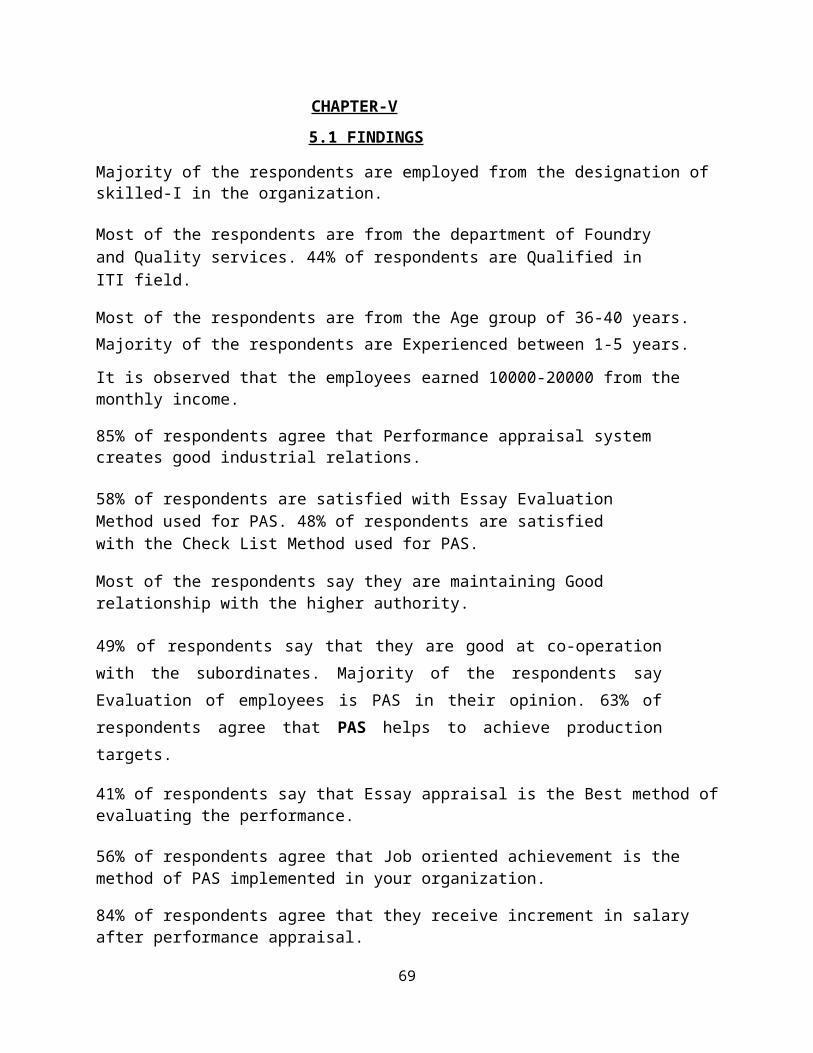
CHAPTER-V5.1 FINDINGS
Majority of the respondents are employed from the designation of skilled-I in the organization.
Most of the respondents are from the department of Foundry and Quality services. 44% of respondents are Qualified in ITI field.
Most of the respondents are from the Age group of 36-40 years.Majority of the respondents are Experienced between 1-5 years.
It is observed that the employees earned 10000-20000 from the monthly income.
85% of respondents agree that Performance appraisal system creates good industrial relations.
58% of respondents are satisfied with Essay Evaluation Method used for PAS. 48% of respondents are satisfied with the Check List Method used for PAS.
Most of the respondents say they are maintaining Good relationship with the higher authority.
49% of respondents say that they are good at co-operationwith the subordinates. Majority of the respondents sayEvaluation of employees is PAS in their opinion. 63% ofrespondents agree that PAS helps to achieve productiontargets.
41% of respondents say that Essay appraisal is the Best method ofevaluating the performance.
56% of respondents agree that Job oriented achievement is the method of PAS implemented in your organization.
84% of respondents agree that they receive increment in salary after performance appraisal.
69
57% of respondents are satisfied with the PAS in the company. 20-30% increase is there after PAS in the organization.
54% of respondents agree that recognition is gained after being appraised under PAS. 52% of respondents say that the confidentiality is moderate.
Since the Calculated value is greater that tabular value the alternative hypothesis is accepted. Hence there is an association between two variables Age of respondents and Experience of the respondents.
As the WAM comes nearly to it after that the relationship of the higher authority for respondents
70
5.2 SUGGESTIONS
360 degree performance appraisal May be implemented in the organizationThe organization can appoint the effective person as an appraiserPromotion of employees should be based on performance and not just on experience
Workers are motivated by providing influencing factors such asawards, salaries, intrinsic And extrinsic rewards, promotion.
71
CONCLUSION
The relationship between the workers and the higherauthority has been increased due performance appraisal system.The workers are motivated by providing influencing factors suchas awards, salaries, intrinsic & extrinsic rewards, promotion. Byevaluating the employees performance, the productivity level hasbeen increased due to the appraisal of the workers performance.
72
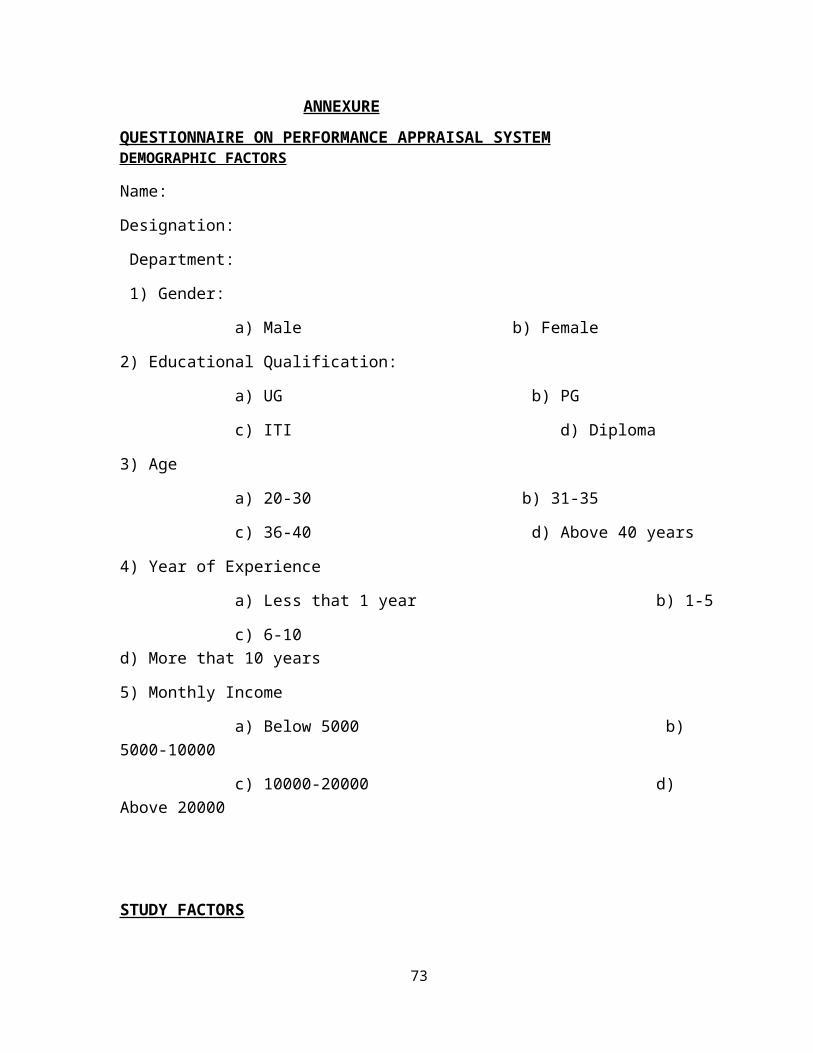
ANNEXUREQUESTIONNAIRE ON PERFORMANCE APPRAISAL SYSTEMDEMOGRAPHIC FACTORS
Name:
Designation:
Department:
1) Gender:
a) Male b) Female
2) Educational Qualification:
a) UG b) PG
c) ITI d) Diploma
3) Age
a) 20-30 b) 31-35
c) 36-40 d) Above 40 years
4) Year of Experience
a) Less that 1 year b) 1-5
c) 6-10 d) More that 10 years
5) Monthly Income
a) Below 5000 b) 5000-10000
c) 10000-20000 d) Above 20000
STUDY FACTORS
73
6) Whether the performance appraisal system creates good industrial relation?
a) Yes b) No
7) Give your opinion about the check list method used for performance appraisal system?
a) Highly satisfied b) Satisfied c) Neutral
d) Dissatisfied e) highly dissatisfied
8) Give your opinion about the essay evaluation method used for performance Appraisal System ?
a) Highly satisfied b) Satisfied c) Neutral
d) Dissatisfied e) highly dissatisfied
9) How would you rate your relationship with your higher authority?
a) Excellent b) Good c) Fair
d) poor e) very poor
10) What is your opinion about co-operation with your subordinates?
a) Excellent b) Good c) Fair
d) poor e) very poor
11) Do you think performance appraisal system helps to change the behavior of employees?
74
a) Highly satisfied b) Satisfied c) Neutral
d) Dissatisfied e) highly dissatisfied
12) In your opinion performance appraisal system is?
a) Evaluation of employees b)Promotion of employees
c) Job satisfaction of employees d) Motivation
13) Do you think performance appraisal system helps people to set and achieve production targets?
a) Highly satisfied b) Satisfied c) Neutral
d) Dissatisfied e) highly dissatisfied
14) Which do you think best method of evaluating the performance?
a) Checklist b) Point allocation
c) Essay appraisal d) 360 degree appraisal
15) Please indicate the periodicity of the following performance appraisal system?
(Monthly, Quarterly, half yearly, yearly)
a) Personal performance b) Departmentperformance
c) Company performance c) Assigned goal
75
16) Which method of performance appraisal system is implemented in your organization?
a) Merit b) Grading
c) Others d) Job oriented achievement
17) Do you receive any increment in your salary after performance appraisal?
a) Yes b) No
18) Do you satisfy with the performance appraisal system in your company?
a) Highly satisfied b) Satisfied c) Neutral
d) Dissatisfied e) highly dissatisfied
19) How much percentage increasing in after performance appraisal system in your Organization?
a) 10-20% b) 20-30% c) 30-40%
d) 40-50% e) 50% Above
20) Have you gained any recognition after being appraised under performance appraisal system?
a) Highly satisfied b) Satisfied c) Neutral
d) Dissatisfied e) highly dissatisfied
21) Give your opinion on confidentiality are openness of performance appraisal system?
76
a) It is fairly confidential b) It is moderate confidential
c) It is poor confidential
BIBLIOGRAPHY
WEBSITES: http://www.kcp.co.in/KCP/index.html http://performance-appraisals.org/ http://www.amazon.com/Complete-Guide.../dp/0814403131 http://humanresources.about.com/od/b...p/perfmgmt.htm http://www.managementhelp.org/perf_mng/appraisl.htm © 2013 Social Science Electronic Publishing, Inc
77

78

79