A coupled forage-grazer model predicts viability of livestock ...
Upload
independentCategory
view
0download
0
Fuels Reduction in a Western Coniferous Forest: Effects on Quantity and Quality ofForage for Elk
Ryan A. Long,1 Janet L. Rachlow,2 John G. Kie,3 and Martin Vavra4
Authors are 1Graduate Student, Department of Biological Sciences, Idaho State University, Pocatello, ID 83209, USA; 2Associate Professor, Departmentof Fish and Wildlife Resources, University of Idaho, Moscow, ID 83844, USA; 3Research Professor, Department of Biological Sciences, Idaho StateUniversity, Pocatello, ID 83209, USA; and 4Disturbance Ecology and Management Team Leader, USDA Forest Service, Pacific Northwest Research
Station, La Grande, OR 97850, USA.
Abstract
Use of mechanical thinning and prescribed fire to reduce fuels in dry forest ecosystems has become increasingly common inwestern North America. Nevertheless, few studies have quantified effects of fuels reduction treatments on wildlife. Weevaluated effects of fuels reduction on quantity and quality of forage available to elk (Cervus elaphus) in northeastern Oregon.From 2001 to 2003, 26 stands of true fir (Abies spp.) and Douglas-fir (Pseudotsuga menziesii [Mirbel] Franco) were thinned andburned, whereas 27 similar stands were left untreated to serve as experimental controls. We estimated percentage of cover,percentage of in vitro dry-matter digestibility (digestibility), and percentage of nitrogen (%N) of 16 important forage speciesand genera in treatment and control stands during spring (May–June) and summer (July–August) of 2005 and 2006. Quantityand quality of forage were lower in summer than spring in both stand types. In contrast, total cover of forage was higher intreatment than in control stands during spring, whereas the opposite was true during summer. For graminoids, %N was higherin control than in treatment stands whereas digestibility did not differ between stand types. For forbs, neither index of foragequality differed between stand types. When treatment stands were separated by years since burning, %N and digestibility offorbs and %N of graminoids increased from 2 to 5 yr following treatment, and by the fifth year after burning had exceededmaximum values observed in control stands in both seasons. As a result of the interacting effects of fuels reduction and seasonon forage characteristics, treated stands provided better foraging opportunities for elk during spring, whereas control standsprovided better foraging opportunities during summer. Consequently, maintaining a mosaic of burned and unburned (latesuccessional) habitat may be of greater benefit to elk than burning a large proportion of a landscape.
Resumen
El uso del raleo mecanico y los fuegos prescritos para reducir combustibles en ecosistemas de bosques secos ha comenzado sercomun cada vez mas en el oeste de America del Norte. Sin embargo, pocos estudios han cuantificado los efectos de los tratamientosde reduccion de combustible en la vida silvestre. Nosotros evaluamos los efectos de la reduccion de combustible sobre la cantidad ycalidad del forraje para el alce (Cervus elaphus) en el noreste de Oregon. Desde el 2001 al 2003, 26 rodales de pino verdadero(Abies spp.) y pino de Oregon (Pseudotsuga menziesii [Mirbel] Franco) fueron reducidos y quemados, mientras que 27 rodalessimilares fueron dejados sin tratar como controles experimentales. Nosotros estimamos el porcentaje de cobertura, el porcentaje invitro de digestibilidad de materia seca y el porcentaje de nitrogeno (%N) de 16 especie y generos de forrajes importantes de losrodales en el tratamiento y el control durante la primavera (Mayo y Junio) y el verano (Julio y Agosto) del 2005 y 2006. Lacantidad y calidad del forraje fueron mas bajas en el verano que en primavera en ambos tipos de rodales. Por el contrario, el total decobertura de forraje fue mas alto en los rodales de tratamiento que en el control durante la primavera, mientras que lo opuesto fueobservado durante el verano. Para las gramıneas, el % de N fue mas alto en los rodales de control que en el tratamiento, mientrasque la digestibilidad no cambio entre los tipos de rodales. Para las herbaceas, ninguno de los ındices de calidad de forraje cambioentre los tipos de rodales. Cuando los rodales de tratamiento fueron separados por anos, no obstante, el % de N y la digestibilidadde las herbaceas y el % de N de las gramıneas aumentaron desde los 2 a los 5 anos seguido del tratamiento, y para el quinto anodespues de la quema excedieron los valores maximos observados en los rodales de control en ambas estaciones. Como resultado delefecto de las interacciones de la reduccion de fuego y caracterısticas de la estacionalidad del forraje, los rodales tratados brindaronmejores oportunidades de forrajeo durante el verano. Por consiguiente, mantener un mosaico de habitats quemados y noquemados (sucesion tardıa) podrıa ser de mayor beneficio para el alce mas que quemar una porcion grande del paisaje.
Key Words: Cervus elaphus, in vitro dry-matter digestibility, nitrogen, nutrition, Oregon, percentage of cover, prescribed fire
INTRODUCTION
Over the past century, fire exclusion has altered natural fireregimes across much of western North America, and as a resultecological relationships and processes occurring in many forestecosystems have been modified (Dodge 1972; Belsky andBlumenthal 1997; McCullough et al. 1998; Mast et al. 1999).
Research was funded by the Joint Fire Science Program, the Rocky Mountain Elk Foundation,
and the USDA Forest Service Pacific Northwest Research Station.
At the time of the research, Long was graduate research assistant, Dept of Fish and Wildlife
Resources, University of Idaho, Moscow, ID, USA.
Correspondence: Ryan A. Long, Dept of Biological Sciences, Idaho State University,
Pocatello, ID 83209, USA. Email: [email protected]
Manuscript received 13 May 2007; manuscript accepted 21 December 2007.
Rangeland Ecol Manage 61:302–313 | May 2008
302 RANGELAND ECOLOGY & MANAGEMENT 61(3) May 2008

Ecological consequences of fire exclusion have includedincreased likelihood of large, severe fires (Dodge 1972; Pyne1997); denser, more spatially uniform forests (Parsons andDeBenedetti 1979; Ottmar and Sandberg 2001); increasedvulnerability of stands to disease and insect outbreaks(McCullough et al. 1998; Tiedemann et al. 2000; Hayes andDaterman 2001); substantial alteration of species compositionand structure (Dodge 1972; Jourdonnais and Bedunah 1990);and a reduction in high-quality wildlife habitat (Peck and Peek1991; Craighead et al. 1995). Consideration of these effects hasled to increased use of mechanical thinning and prescribed fireto reduce fuels in fire-adapted ecosystems (Dodge 1972; Belskyand Blumenthal 1997; Covington et al. 1997; Tiedemann et al.2000). Nevertheless, relatively few studies have examinedeffects of fuels reduction treatments on wildlife, particularly inan experimental framework, and although fuels reduction oftenis assumed to benefit wildlife, existing literature documentsboth positive and negative effects for a variety of species(Jourdonnais and Bedunah 1990; Peck and Peek 1991;Connelly et al. 2000; Maehr and Larkin 2004).
Application of mechanical thinning or prescribed fire canaffect wildlife in a variety of ways (McMahon and deCalesta1990). Perhaps the most important of these, however, isthrough alteration of quality, availability, or distribution offorage resources (Parker and Morton 1978; Carlson et al. 1993;Masters et al. 1993; Perryman et al. 2002). Nutritional qualityand rates of primary production of herbaceous forage speciesoften have been reported to increase following fire (Carlson etal. 1993; Grogan et al. 2000; Perryman et al. 2002; Van Dykeand Darragh 2007). The two primary mechanisms for thisresponse are increased availability of light and water resultingfrom a reduction in tree canopy cover (Metlen et al. 2004) andincreased availability of nutrients (primarily nitrogen) in thesoil (Grogan et al. 2000; Carter and Foster 2004; but seeKlemmedson 1976). Mechanical thinning may produce similarresults, although response of understory vegetation to thinningoften is slower than response to burning (Metlen et al. 2004).Published effects of fire on woody browse have been lessconsistent. For example, some authors have reported decreasedabundance of shrubs after burning (Busse et al. 2000; Weekleyand Menges 2003; Metlen et al. 2004; Metlen and Fiedler2006), whereas others have reported either very little effect offire (Quinlan et al. 2003) or increased abundance of shrubsfollowing fire (Carlson et al. 1993; Pendergrass et al. 1998;Ayers et al. 1999). Such variability among studies likely resultsfrom species-specific differences in ability of shrubs to resproutfollowing fire.
Although differential responses of vegetation to similar typesof disturbance result from a variety of factors, site-specificdifferences in historical disturbance regime and initial speciescomposition likely contribute to much of the variability. Plantsexhibit a wide range of unique adaptations to disturbance(Agee 1993). As a result of this diversity, as well as differencesin life-history characteristics such as growth phenology andreproductive strategy (Metlen et al. 2004), vegetative commu-nities with different species assemblages and disturbancehistories are not likely to respond to fuels reduction in thesame way. Consequently, effects of fuels reduction treatmentson quantity and quality of forage for wildlife may differmarkedly across space and time. This highlights the need to
evaluate effects of fuels reduction at multiple sites, ideally in anexperimental framework with spatial and temporal replicationof treatments (Hurlbert 1984).
We studied effects of an experimental fuels reductionprogram conducted over a relatively large geographic area(78 km2) on quantity (percentage of cover) and nutritionalquality (percentage of nitrogen [%N] and digestibility) offorage available to elk (Cervus elaphus) at the StarkeyExperimental Forest and Range (hereafter Starkey) in north-eastern Oregon. Fifty-three stands of true fir (Abies spp.) andDouglas-fir (Pseudotsuga menziesii [Mirbel] Franco) at Starkeysuffered high rates of mortality from a spruce budworm(Choristoneura occidentalis) outbreak in the 1980s, whicheventually resulted in high loads of dead and standing woodyfuels. Half of those stands were subjected to fuels reductiontreatments (mechanical thinning followed by prescribed fire)over a 3-yr period (2001–2003) and half were left untreated toserve as experimental controls. We estimated percentage ofcover and nutritional quality of several key forage species ineach stand during spring and summer of 2005 and 2006 (2–5 yr after treatment). In addition we characterized stands withrespect to overstory conditions and abiotic ground cover (deadand downed material, rocks, and bare ground). We used thosedata to test the following hypotheses. First, because weanticipate increased availability of light and water followingfuels reduction, we hypothesize that percentage of cover of live(green) forage species will be higher on average in treatmentthan in control stands. Second, because prescribed fire likelywill increase availability of soil nutrients (particularly nitro-gen), we hypothesize that nutritional quality of forage specieswill be higher in treatment than in control stands. Third,quantity (percentage of cover) of forage species will increasefrom 2 to 5 yr after treatment, but quality will either remainstable or slowly decline as nutrients again become limited.Finally, differences between treatment and control stands willbe most evident in spring, as a combination of hightemperatures and lack of precipitation during summer willcause plants in both treatment and control stands to rapidlysenesce. We tested these hypotheses in an experimentalframework to evaluate ecological consequences of two com-monly applied forest management techniques.
METHODS
Study AreaStarkey is a 101-km2 research area located in the BlueMountains of northeastern Oregon (lat 45u139N, long118u319W) and managed by the US Forest Service (USFS).The site is enclosed by a 2.4-m high fence, which also dividesStarkey into several distinct research areas (Bryant et al. 1993;Rowland et al. 1997). We conducted research in Main StudyArea, which is the largest at Starkey at 78 km2. Elevations atStarkey range from 1 120 to 1 500 m, and the site supports amosaic of coniferous forests, shrublands, and grasslands, withmoderately sloping uplands dissected by numerous drainages(Stewart et al. 2002). Common plant communities includebunchgrasses (Festuca idahoensis Elmer, Poa secunda J. Presl,and Pseudoroegneria spicata [Pursh] A. Love), ponderosa pine(Pinus ponderosa P. & C. Lawson), Douglas-fir, grand fir
61(3) May 2008 303
(Abies grandis [Dougl. ex D. Don] Lindl.), and lodgepole pine(Pinus contorta Dougl. ex Loud.). Botanical nomenclaturethroughout our paper follows that of the US Department ofAgriculture Natural Resources Conservation Service (2007).Cattle (about 500 cow–calf pairs) were introduced to MainStudy Area each year around 15 June and were moved in adeferred-rotation system among three pastures separated bybarbed-wire fence and an additional pasture outside the studyarea. Detailed descriptions of Starkey are provided by Skovlin(1991), Wisdom et al. (1993), and Rowland et al. (1997, 1998).
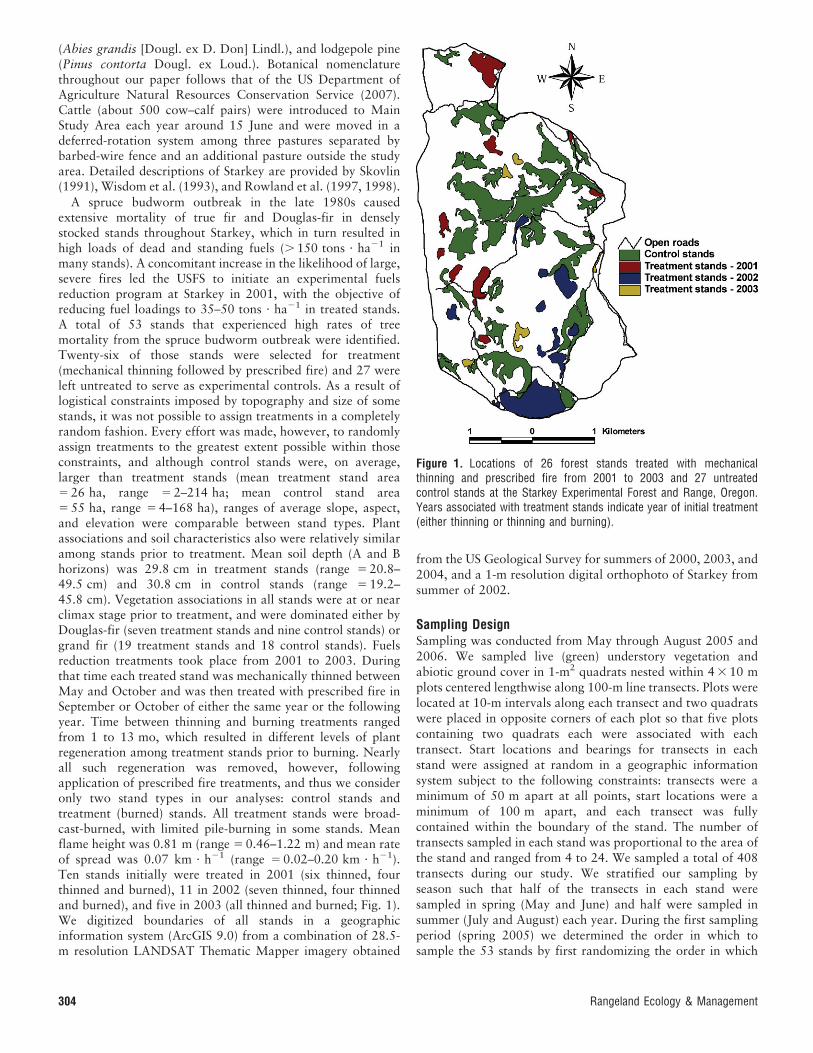
A spruce budworm outbreak in the late 1980s causedextensive mortality of true fir and Douglas-fir in denselystocked stands throughout Starkey, which in turn resulted inhigh loads of dead and standing fuels (. 150 tons ? ha21 inmany stands). A concomitant increase in the likelihood of large,severe fires led the USFS to initiate an experimental fuelsreduction program at Starkey in 2001, with the objective ofreducing fuel loadings to 35–50 tons ? ha21 in treated stands.A total of 53 stands that experienced high rates of treemortality from the spruce budworm outbreak were identified.Twenty-six of those stands were selected for treatment(mechanical thinning followed by prescribed fire) and 27 wereleft untreated to serve as experimental controls. As a result oflogistical constraints imposed by topography and size of somestands, it was not possible to assign treatments in a completelyrandom fashion. Every effort was made, however, to randomlyassign treatments to the greatest extent possible within thoseconstraints, and although control stands were, on average,larger than treatment stands (mean treatment stand area5 26 ha, range 5 2–214 ha; mean control stand area5 55 ha, range 5 4–168 ha), ranges of average slope, aspect,and elevation were comparable between stand types. Plantassociations and soil characteristics also were relatively similaramong stands prior to treatment. Mean soil depth (A and Bhorizons) was 29.8 cm in treatment stands (range 5 20.8–49.5 cm) and 30.8 cm in control stands (range 5 19.2–45.8 cm). Vegetation associations in all stands were at or nearclimax stage prior to treatment, and were dominated either byDouglas-fir (seven treatment stands and nine control stands) orgrand fir (19 treatment stands and 18 control stands). Fuelsreduction treatments took place from 2001 to 2003. Duringthat time each treated stand was mechanically thinned betweenMay and October and was then treated with prescribed fire inSeptember or October of either the same year or the followingyear. Time between thinning and burning treatments rangedfrom 1 to 13 mo, which resulted in different levels of plantregeneration among treatment stands prior to burning. Nearlyall such regeneration was removed, however, followingapplication of prescribed fire treatments, and thus we consideronly two stand types in our analyses: control stands andtreatment (burned) stands. All treatment stands were broad-cast-burned, with limited pile-burning in some stands. Meanflame height was 0.81 m (range 5 0.46–1.22 m) and mean rateof spread was 0.07 km ? h21 (range 5 0.02–0.20 km ? h21).Ten stands initially were treated in 2001 (six thinned, fourthinned and burned), 11 in 2002 (seven thinned, four thinnedand burned), and five in 2003 (all thinned and burned; Fig. 1).We digitized boundaries of all stands in a geographicinformation system (ArcGIS 9.0) from a combination of 28.5-m resolution LANDSAT Thematic Mapper imagery obtained
from the US Geological Survey for summers of 2000, 2003, and2004, and a 1-m resolution digital orthophoto of Starkey fromsummer of 2002.
Sampling DesignSampling was conducted from May through August 2005 and2006. We sampled live (green) understory vegetation andabiotic ground cover in 1-m2 quadrats nested within 4 3 10 mplots centered lengthwise along 100-m line transects. Plots werelocated at 10-m intervals along each transect and two quadratswere placed in opposite corners of each plot so that five plotscontaining two quadrats each were associated with eachtransect. Start locations and bearings for transects in eachstand were assigned at random in a geographic informationsystem subject to the following constraints: transects were aminimum of 50 m apart at all points, start locations were aminimum of 100 m apart, and each transect was fullycontained within the boundary of the stand. The number oftransects sampled in each stand was proportional to the area ofthe stand and ranged from 4 to 24. We sampled a total of 408transects during our study. We stratified our sampling byseason such that half of the transects in each stand weresampled in spring (May and June) and half were sampled insummer (July and August) each year. During the first samplingperiod (spring 2005) we determined the order in which tosample the 53 stands by first randomizing the order in which
Figure 1. Locations of 26 forest stands treated with mechanicalthinning and prescribed fire from 2001 to 2003 and 27 untreatedcontrol stands at the Starkey Experimental Forest and Range, Oregon.Years associated with treatment stands indicate year of initial treatment(either thinning or thinning and burning).
304 Rangeland Ecology & Management

control stands were sampled. After sampling a control stand,we then sampled the closest treatment stand in an effort tominimize effects of stand location on our results. Despite thisapproach, however, distances between each control stand andthe nearest treatment stand ranged from , 100 m to 5 500 m,and thus our design cannot be considered paired (K. Steinhorst,personal communication, December 2006). All stands weresampled in the same order during each subsequent samplingperiod (summer 2005 and spring and summer 2006), and nopart of any transect was sampled more than once for theduration of our study. Delineation of seasons was based on pastpatterns of temperature and precipitation at Starkey, andreflected seasonal changes in plant phenology (Stewart et al.2002, 2006).
We used handheld global positioning system units tonavigate to the start location of each transect, and compassesadjusted for declination to position transects on the groundbased on preassigned bearings. Actual stand boundaries werenot always as discrete as digitized boundaries and, consequent-ly, transects occasionally appeared to run into edge habitatbordering the stands. When this occurred, we retained thetransect and sampled all associated quadrats if . 50% of itslength appeared to be located inside the stand, and used analternate transect if . 50% of its length appeared to be outsidethe stand. Start locations and bearings for alternate transectswere assigned in the same manner and were subject to the sameconstraints as primary transects. Of 408 transects sampled inour study, , 10% were alternates, and we estimate that , 2%of sampled quadrats were located in edge habitat.
Percentage of CoverWe focused our collection of cover data on species and generapresumed to be important to female elk at Starkey based onprevious microhistological analysis of fecal samples (Stewart etal. 2003). Fresh (, 2 d old) fecal samples were obtained fromelk on the study site by Stewart et al. (2003) while samplingvegetation during July and August of 1997, and were analyzedfor diet composition at the Wildlife Habitat NutritionLaboratory at Washington State University. We sampled atotal of 16 species or genera comprising roughly 60% ofundigested dry matter in the feces. Graminoids sampled werewheatgrass (Pseudoroegneria spp.), smooth brome (Bromusinermis Leyss.), mountain brome (Bromus marginatus Nees exSteud.), pinegrass (Calamagrostis rubescens Buckl.), Geyer’ssedge (Carex geyeri Boott), Ross’ sedge (Carex rossii Boott),orchardgrass (Dactylis glomerata L.), oatgrass (Danthoniaspp.), fescue (Festuca spp.), and bluegrass (Poa spp.). Sampledforbs were western yarrow (Achillea millefolium L. var.occidentalis DC.), arnica (Arnica spp.), milkvetch (Astragalusspp.), Indian paintbrush (Castilleja spp.), and lupine (Lupinusspp.). The only shrub that constituted $ 1% of undigested drymatter in the feces (Stewart et al. 2003) was creeping barberry(Mahonia repens [Lindl.] G. Don), and thus creeping barberrywas the only woody species we sampled. Most of these speciesand genera also are known to constitute an importantcomponent of elk diets in other areas of northeastern Oregon(Miller et al. 1981). In each sampling quadrat, we made ocularestimates of percentage of cover (Bonham 1989) for each of the16 species or genera, as well as for total vegetation and
vegetation categories (graminoids, forbs, and shrubs). Tominimize effects of observer bias (Mitchell et al. 1988), werecorded cover data categorically based on a standard coverclass scale (McCune and Grace 2002). Classes 0 through 8included the following percentages, respectively: 0%, 0%–1%,1%–5%, 5%–25%, 25%–50%, 50%–75%, 75%–95%, 95%–99%, and 99%–100% (McCune and Grace 2002). We alsorecorded cover class estimates for five categories of abioticground cover: litter and fine fuels (twigs, bark, leaves, needles,branches, or other organic matter lying above the mineral soil),coarse woody debris (downed woody material . 10 cm indiameter and . 1 m in length), snags and stumps, rock, andbare ground. Cover data were recorded using an Allegro CXfield computer (Juniper Systems Inc., Logan, UT).
Forage QualityIn order to maximize the number of quadrats that could beclipped for nutritional analysis in each stand and season, wetruncated our species list and clipped the top 10 species orgenera (based on percentage of undigested dry matter in thefeces; Stewart et al. 2003). Species or genera that we included incover estimation but did not clip were wheatgrass, smoothbrome, mountain brome, arnica, milkvetch, and Indianpaintbrush. Plants were clipped in four quadrats per standduring each of the four sampling periods in our study. Toencompass spatial variation among plants, we separatedclipped quadrats within stands to the greatest extent possiblebased on the number of transects in each stand. For example,when only one transect was sampled, we clipped the first,fourth, seventh, and tenth quadrats, and when four transectswere sampled we clipped the first quadrat on each transect. Ineach quadrat we clipped portions of plants typically eaten byelk, including the inflorescence and basal leaves in forbs andgraminoids and current annual growth in shrubs (Beck andPeek 2005). In addition we removed all dead material from oursamples. Within each sampling period, samples from clippedquadrats within a stand were combined into functional groups(graminoids, forbs, and shrubs) in proportion to theiroccurrence in the clipped quadrats and dried in a forced-airoven for 24 h at 40uC within 8 h of collection. We grounddried samples to 1 mm and stored them in plastic bags at roomtemperature prior to laboratory analysis. We collected a totalof 237 forage samples in spring (104, 97, and 36 forgraminoids, forbs, and shrubs, respectively) and 230 samplesin summer (106, 90, and 34 for graminoids, forbs, and shrubs,respectively). Sample sizes for nutritional analysis wereapproximately equal across stand types in both seasons(n 5 121 for control stands and n 5 116 for treatment standsin spring; n 5 117 for control stands and n 5 113 for treatmentstands in summer). Ground plant samples were analyzed for invitro dry-matter digestibility (digestibility) and %N at theUniversity of Alaska, Fairbanks. Rumen inoculum wasobtained from fistulated reindeer (Rangifer tarandus) housedat the Institute of Arctic Biology’s Large Animal ResearchStation. Reindeer were not preinoculated with forage from thestudy area, but, similar to elk at Starkey, reindeer diets duringspring and summer included a large proportion of forbs andgraminoids. Regardless, our results should be interpreted asrelative rather than absolute differences in forage quality
61(3) May 2008 305
between treatment and control stands. Apparent digestibilitywas estimated using techniques described by Tilley and Terry(1963), and %N was determined by Kjeldahl’s analysis.
Characterization of Overstory ConditionsWe characterized overstory conditions in each treatment andcontrol stand by estimating tree densities for individual speciesand size classes. For each transect we identified all trees in thefive 40-m2 plots to species and recorded either height (trees# 135 cm tall) or diameter at breast height (DBH; trees. 135 cm tall). We then estimated species-specific tree densitiesfor three size classes (trees # 135 cm tall, trees . 135 cm tallbut , 23 cm DBH, and trees $ 23 cm DBH) in each stand bydividing the total number of trees measured by the total areasampled during our study. All tree species sampled during ourstudy were conifers, and thus we pooled tree data across yearsand seasons based on the assumption that there was minimaltransition of trees from one size class to another during the 2 yrof our study. We report all density estimates as means6 standard errors (SE).
Statistical AnalysesWe converted cover class data to their class-specific medianvalues for analysis of cover as a continuous variable (Bonham1989). We then averaged median cover values across quadratswithin a transect and transects within a stand to produce anestimate for each forage species or genus, total vegetation,graminoids, forbs, and shrubs for each stand and samplingperiod. Median values of abiotic cover also were averagedacross seasons. We arcsine–square root transformed percentageof cover estimates prior to statistical analysis to meetassumptions of normality (Neter et al. 1996). In fall 2005, asmall wildfire completely burned one control stand. Conse-quently, data for that stand were obtained during 2005 only,and total sample sizes for analyses of biotic and abiotic coverdata were 210 and 105, respectively.
We evaluated effects of stand type, season, and year onpercentage of cover of forage species, and stand type and yearon abiotic ground cover using multivariate analysis of variance(MANOVA). The design in each case was a double split plot (intime and space for analyses of forage cover) or split plot (inspace only for analyses of abiotic cover) approach to arandomized complete block with repeated measures. In eachcase the stand was the sampling unit, and we blocked by standidentification nested within stand type in both analyses tocontrol for effects of interstand variability. We sampled eachstand once per season in 2005 and again in 2006, and thus boththe season and year effects were repeated measures in analysesof forage cover. Likewise, because all stands were sampled oncein spring and once in summer during both years, seasonrepresented the first (temporal) split plot. Stand type (treatmentor control) represented the second (spatial) split plot. Interac-tions among treatment effects also were included in eachanalysis. Prior to interpretation of results, we evaluatedresidual plots for dependent variables to assess adherence toassumptions of MANOVA. In both cases this evaluationindicated marginal normality of all transformed dependentvariables. Following multivariate significance of a main effect,we used canonical correlation analysis to determine which
dependent variables were responsible for overall significance ofthat effect (Johnson and Wichern 2002). For dependentvariables identified in the canonical analysis, we conductedanalyses of variance (ANOVAs) that included all main effectsthat were significant in the MANOVA and, where appropriate,significant interaction terms. We report means and standarderrors for those variables by stand type and season forvegetative cover and stand type and year for abiotic groundcover. We set statistical significance at a# 0.05. All statisticalanalyses were performed using SAS software (PROC GLM;SAS Institute 2002).
We conducted an additional MANOVA using vegetativecover data from treatment stands only. Season and years sinceburning (2, 3, 4, or 5) were included as treatment effects andwe blocked by stand nested within years since burning. Totalsample size was 104, and we generally proceeded with thisanalysis in the manner described previously for cover data. Inaddition, we followed univariate ANOVAs with multiplecomparison procedures using Tukey’s honestly significantdifference test for years since burning. It was not possible,however, to perform within-season ANOVAs blocked by unitnested within years since burning for purposes of multiplecomparisons as a result of insufficient error degrees of freedom.Consequently we only conducted multiple comparisons foryears since burning when ANOVA results indicated anonsignificant season affect.
We also used a series of MANOVAs to evaluate effects ofstand type, season, year, and years since burning on digestibil-ity and %N of forage. We were unable to obtain a foragesample for each functional group in all stands, seasons, andyears. Consequently, sample sizes differed among the threefunctional groups, so we chose to analyze each groupindependently. Sample sizes were 207, 185, and 67 forgraminoids, forbs, and shrubs, respectively. In addition, wedid not analyze effects of season and years since burning onquality of shrubs because it was not possible to block thatanalysis by unit nested within years since burning as a result ofinsufficient replication.
RESULTS
Forage AbundanceThe effects of fuels reduction treatments on forage abundanceat Starkey varied among species. Percentage of cover of nearlyall species, however, was higher in spring than summer, and formany species cover was higher in 2006 than 2005. Althoughthe season 3 year interaction term was significant in theMANOVA for vegetative cover (P 5 0.02), that significanceresulted from a difference in magnitude between seasonsamong years rather than direction of the seasonal effectbetween years. Consequently, we chose to move forward withinterpretation of main effects in that analysis, all three of whichwere statistically significant (Wilk’s L5 0.27, F20, 136 5 18.27,P , 0.0001 for stand type; Wilk’s L5 0.47, F20, 136 5 7.78,P , 0.0001 for season; Wilk’s L5 0.61, F20, 136 5 4.17,P , 0.0001 for year). Canonical correlation analysis indicatedthat 11 of 20 vegetative dependent variables contributed to theoverall significance of the stand type effect, six variablescontributed to the season effect, and four variables contributed
306 Rangeland Ecology & Management
to the year effect. Only total forb cover contributed to the effectof season but not stand type. We plotted mean values of thefour variables responsible for the year effect by stand type,season, and year to determine whether it was reasonable toaverage cover estimates for those variables across years.Although cover of each variable generally was higher in 2006than 2005, differences between seasons and stand types wereconsistent in magnitude and direction across years. Therefore,we report mean cover values averaged across years by standtype and season for all 12 vegetative variables that differedbetween stand types, seasons, or both (P # 0.05 based onANOVA; Table 1).
Of nine forage species or genera that differed significantly incover between stand types, four (bluegrass, oatgrass, Ross’sedge, and western yarrow) were more abundant in treatedstands whereas five (orchardgrass, pinegrass, smooth brome,arnica, and creeping barberry) were more abundant in controlstands (Table 1). During both spring and summer, arnicacomprised the largest proportion of combined cover of all nineof those species or genera ($ 51% in spring and 27% insummer; Table 1), and was more abundant in control thantreatment stands. Arnica, however, also was the only species orgenus for which estimated use by elk (percentage of undigesteddry matter in the feces) was ever less than availability(percentage of cover; Table 1), potentially indicating avoidanceof arnica by elk at this high abundance. Although combinedcover of all nine forage species was higher in control thantreatment stands across seasons (Table 1), when arnica wasexcluded, combined cover of the other eight forage species orgenera was roughly 20% higher in treatment than in controlstands in spring (2.84% and 2.36%, respectively) and 4%lower in treatment than in control stands in summer (2.77%and 2.88%, respectively). Percentage of cover of total
vegetation and shrubs was higher in control than in treatmentstands (P , 0.0001), whereas total cover of forbs andgraminoids did not differ between stand types (P $ 0.10). Withrespect to seasonal differences in forage abundance, cover ofbluegrass, smooth brome, and arnica was higher in spring thanin summer in both stand types (P # 0.001) whereas the oppositewas true for pinegrass (P 5 0.0009; Table 1). In addition, coverof total vegetation and forbs was higher in spring than insummer (P , 0.0001), whereas total cover of graminoids andshrubs did not differ between seasons (P $ 0.52).
Forage abundance in treated stands increased slightly from 2to 5 yr since burning. Canonical correlation analysis, however,indicated that the only three variables contributing to overallsignificance (Wilk’s L5 0.10, F48,108 5 2.65, P , 0.0001) ofthe years-since-burning effect were total vegetation, totalshrubs, and oatgrass. Subsequent ANOVAs indicated that theeffect of years since burning on total forb cover also was nearlysignificant (P 5 0.08). Percentage of cover of total vegetationand forbs also differed between seasons (P # 0.03), so multiplecomparisons for years since burning were not conducted forthose variables because of insufficient error degrees of freedom.Despite the lack of formal statistical analysis, however,percentage of cover of total vegetation in treatment standsappeared to increase steadily from 3 to 5 yr since burning inspring and from 2 to 5 yr since burning in summer (Fig. 2). Nochange in total forb cover with years since burning was evidentin treatment stands during spring. During summer, however,total forb cover appeared to increase substantially from 2 to3 yr since burning and continued to increase slowly from 3 to5 yr since burning (Fig. 2). Total shrub cover increased steadilyfrom 2 to 4 yr since burning and was significantly higher in 4-yr-old burns than in 2-yr-old burns (P , 0.05; Fig. 2). Meancover of oatgrass was significantly higher in 3-yr-old than in 2-
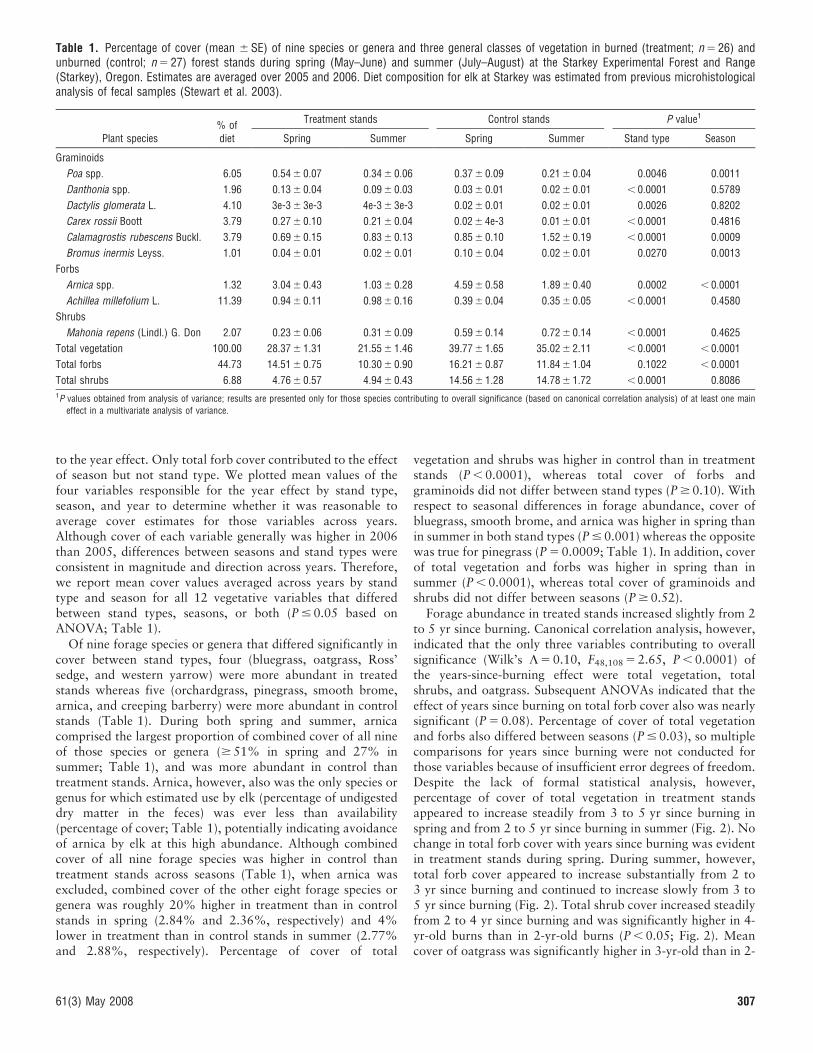
Table 1. Percentage of cover (mean 6 SE) of nine species or genera and three general classes of vegetation in burned (treatment; n 5 26) andunburned (control; n 5 27) forest stands during spring (May–June) and summer (July–August) at the Starkey Experimental Forest and Range(Starkey), Oregon. Estimates are averaged over 2005 and 2006. Diet composition for elk at Starkey was estimated from previous microhistologicalanalysis of fecal samples (Stewart et al. 2003).
Plant species% ofdiet
Treatment stands Control stands P value1
Spring Summer Spring Summer Stand type Season
Graminoids
Poa spp. 6.05 0.54 6 0.07 0.34 6 0.06 0.37 6 0.09 0.21 6 0.04 0.0046 0.0011
Danthonia spp. 1.96 0.13 6 0.04 0.09 6 0.03 0.03 6 0.01 0.02 6 0.01 , 0.0001 0.5789
Dactylis glomerata L. 4.10 3e-3 6 3e-3 4e-3 6 3e-3 0.02 6 0.01 0.02 6 0.01 0.0026 0.8202
Carex rossii Boott 3.79 0.27 6 0.10 0.21 6 0.04 0.02 6 4e-3 0.01 6 0.01 , 0.0001 0.4816
Calamagrostis rubescens Buckl. 3.79 0.69 6 0.15 0.83 6 0.13 0.85 6 0.10 1.52 6 0.19 , 0.0001 0.0009
Bromus inermis Leyss. 1.01 0.04 6 0.01 0.02 6 0.01 0.10 6 0.04 0.02 6 0.01 0.0270 0.0013
Forbs
Arnica spp. 1.32 3.04 6 0.43 1.03 6 0.28 4.59 6 0.58 1.89 6 0.40 0.0002 , 0.0001
Achillea millefolium L. 11.39 0.94 6 0.11 0.98 6 0.16 0.39 6 0.04 0.35 6 0.05 , 0.0001 0.4580
Shrubs
Mahonia repens (Lindl.) G. Don 2.07 0.23 6 0.06 0.31 6 0.09 0.59 6 0.14 0.72 6 0.14 , 0.0001 0.4625
Total vegetation 100.00 28.37 6 1.31 21.55 6 1.46 39.77 6 1.65 35.02 6 2.11 , 0.0001 , 0.0001
Total forbs 44.73 14.51 6 0.75 10.30 6 0.90 16.21 6 0.87 11.84 6 1.04 0.1022 , 0.0001
Total shrubs 6.88 4.76 6 0.57 4.94 6 0.43 14.56 6 1.28 14.78 6 1.72 , 0.0001 0.80861P values obtained from analysis of variance; results are presented only for those species contributing to overall significance (based on canonical correlation analysis) of at least one main
effect in a multivariate analysis of variance.
61(3) May 2008 307

yr-old burns (P , 0.05) but did not change from 3 to 5 yr sinceburning (Fig. 2).
Forage QualityEffects of fuels reduction on forage quality were similar forgraminoids and forbs. In MANOVAs for both functionalgroups the stand type 3 season and year 3 season interactionswere at least moderately significant (P # 0.06). Furtherinvestigation revealed that differences in effects of stand typeacross seasons and season across years generally were inmagnitude, not direction. Nevertheless, because this observa-tion was not universal, and because all response variablescontributed to significance of the interaction terms, we retained
both interaction terms in all subsequent analyses to control fortheir effects, and we report all means and SEs by stand type,season, and year. Overall nutritional quality of graminoids intreatment and control stands at Starkey differed between standtypes (Wilk’s L5 0.92, F2,149 5 6.27, P 5 0.002), seasons(Wilk’s L5 0.42, F2,149 5 104.05, P , 0.0001), and years(Wilk’s L5 0.62, F2,149 5 46.28, P , 0.0001). Both digestibil-ity and %N were higher in spring (May and June) than insummer (July and August; P , 0.0001) across years and standtypes and were higher in 2006 than in 2005 (P 5 0.003 fordigestibility, P , 0.0001 for %N; Table 2). Digestibility,however, did not differ between stand types (P 5 0.16),whereas %N was higher in control than in treatment stands(P 5 0.009; Table 2). In addition, overall quality of graminoidsin treatment stands was affected by years since burning (Wilk’sL5 0.52, F6,96 5 6.13, P , 0.0001). Digestibility did not varywith years since burning (P 5 0.80), but %N increased from 2to 5 yr since burning (P , 0.0001; Fig. 3). Overall nutritionalquality of forbs in treatment and control stands at Starkeydiffered between seasons (Wilk’s L5 0.56, F2,128 5 51.09,P , 0.0001) and years (Wilk’s L5 0.96, F2,128 5 2.96,P 5 0.05), but did not differ between stand types (Wilk’sL5 0.98, F2,128 5 1.15, P 5 0.32). Both digestibility and %Nwere higher in spring than in summer (P , 0.0001; Table 2).Only %N differed between years (P 5 0.03), however, and itwas higher in 2006 than in 2005 across seasons and stand types(Table 2). Overall quality of forbs in treatment stands also wasaffected by years since burning (Wilk’s L5 0.72, F6,86 5 2.57,P 5 0.02). Digestibility of forbs declined slightly from 2 to 3 yrsince burning and increased from 3 to 5 yr since burning(P 5 0.04; Fig. 3). Similarly, %N values were comparable from2 to 3 yr since burning and increased from 3 to 5 yr sinceburning (P 5 0.02; Fig. 3). Both patterns were consistent acrossseasons, although spring values always were higher thansummer values (P 5 0.0003 for digestibility, P , 0.0001 for%N; Fig. 3).
Effects of fuels reduction on nutritional quality of shrubs(creeping barberry only) differed slightly from effects ongraminoids and forbs. Overall quality of shrubs differedbetween stand types (Wilk’s L5 0.48, F2,22 5 11.90,P 5 0.0003) and seasons (Wilk’s L5 0.60, F2,22 5 7.24,P 5 0.0038), but did not differ between years (Wilk’sL5 0.93, F2,22 5 0.84, P 5 0.45). Both digestibility and %Nwere higher in spring than in summer (P 5 0.0008 fordigestibility, P 5 0.04 for %N; Table 2). In contrast tograminoids and forbs, however, both measures of foragequality were higher in treatment than in control stands acrossyears and seasons (Table 2). This effect was highly significantfor digestibility (P , 0.0001) and nearly significant for %N(P 5 0.07).
Abiotic Ground Cover and Overstory CharacterizationThe relative composition of abiotic ground cover at Starkeychanged in response to fuels reduction. Abiotic cover differedbetween stand types (Wilk’s L5 0.07, F5,47 5 130.15,P , 0.0001) and years (Wilk’s L5 0.40, F5,47 5 14.26,P , 0.0001), and canonical correlation analysis followed byANOVA indicated that fuels reduction increased bare groundand reduced cover of litter and fine fuels and coarse woody
Figure 2. Percentage of cover (mean 6 SE). A, Total vegetation inspring (closed circles) and summer (open circles) and total forbs inspring (closed triangles) and summer (open triangles). B, Total shrubs(closed circles) and oatgrass (Danthonia spp.; open circles) averagedacross seasons in forest stands at the Starkey Experimental Forest andRange, Oregon, from 2 to 5 yr following treatment with prescribed fire.Spring was May–June and summer was July–August. Analysis ofvariance indicated no significant effect of season on percentage of coverof shrubs and oatgrass (P $ 0.22), and unshared letters among meanpercentages for those variables indicate significant pairwise differences(P , 0.05) based on Tukey’s honestly significant difference test.Multiple comparisons were not performed within seasons for totalvegetation and forbs as a result of insufficient degrees of freedom (seetext for details).
308 Rangeland Ecology & Management
debris (P , 0.0001; Table 3). In addition, cover of litter andfine fuels was lower in 2006 than in 2005 (P , 0.0001) whereascover of coarse woody debris and snags and stumps was higherin 2006 than in 2005 (P 5 0.001 for coarse woody debris,P 5 0.003 for snags and stumps; Table 3).
Tree densities at Starkey generally were substantially higher incontrol than in treatment stands across species and size classes(Fig. 4). Exceptions were densities of western larch (Larixoccidentalis Nutt.) and lodgepole pine in the smallest size class(height , 135 cm), which were comparable between treatmentand control stands (likely as a result of regeneration), and densityof ponderosa pine in the largest size class (DBH $ 23 cm), whichwas higher in treatment than in control stands (Fig. 4).
DISCUSSION
The effects of fuels reduction on quantity of forage available toelk at Starkey varied among forage species and betweenseasons. Although total cover of forbs, which represent thelargest component of elk diets at Starkey during spring andsummer (Stewart et al. 2003; Findholt et al. 2004), did notdiffer between treatment and control stands, cover of nineforage species or genera did change following fuels reduction.Of those nine forage species or genera, only arnica appeared tobe of negligible importance to elk based on the magnitude ofdifferences in ratios of use to availability between arnica andother species or genera (range of use/availability 5 0.3–1.3 forarnica and 2.5–1 184.3 for other species or genera). Thisconclusion, however, is based on the assumption thatavailability of arnica does not vary greatly among yearsbecause fecal samples were collected prior to fuels reduction(Stewart et al. 2003). Fuels reduction increased cover ofbluegrass, oatgrass, Ross’ sedge, and western yarrow, anddecreased cover of orchardgrass, pinegrass, smooth brome, and
creeping barberry. Prior to fuels reduction, however, the formerfour species or genera comprised roughly 23% of undigesteddry matter in elk feces whereas the latter four comprised only11% (Stewart et al. 2003). Consequently, increased abundanceof bluegrass, oatgrass, Ross’ sedge, and western yarrow mayrepresent a more biologically significant effect of fuelsreduction than decreased abundance of the other four species.We note, however, that the relative importance of each of thosespecies to elk in general varies across study sites (Kufeld 1973),and thus extrapolation of our results to other systems willrequire site-specific information on diet composition of elk.
Even without considering the relative contribution ofdifferent species or genera to elk diets at Starkey, overalleffects of fuels reduction on percentage of cover of live (green)forage species were consistent with our hypotheses for the eightspecies and genera (excluding arnica) that differed significantlyin cover between stand types. Combined cover of those speciesand genera was roughly 20% higher in treatment than incontrol stands in spring. In summer, however, combined coverof the same eight species and genera was slightly lower intreatment than in control stands. Although removal of forageby elk and other species in treatment stands during spring mayhave been partially responsible for this effect, we suggest thatthe most likely cause was an interaction between seasonalchanges in plant phenology and substantial reduction of canopycover in treatment stands following fuels reduction. Averagesummer temperatures at Starkey are considerably higher thantemperatures in spring (Stewart et al. 2002). Consequently, inareas with relatively open tree canopy cover most grass speciesand many forbs have cured or senesced by about mid-July as aresult of increased exposure to direct sunlight. Conversely, inareas with denser tree canopy cover those species often remainphotosynthetically active for several weeks longer. As a result,control stands may actually provide better foraging opportu-nities for elk than treatment stands during hotter summer
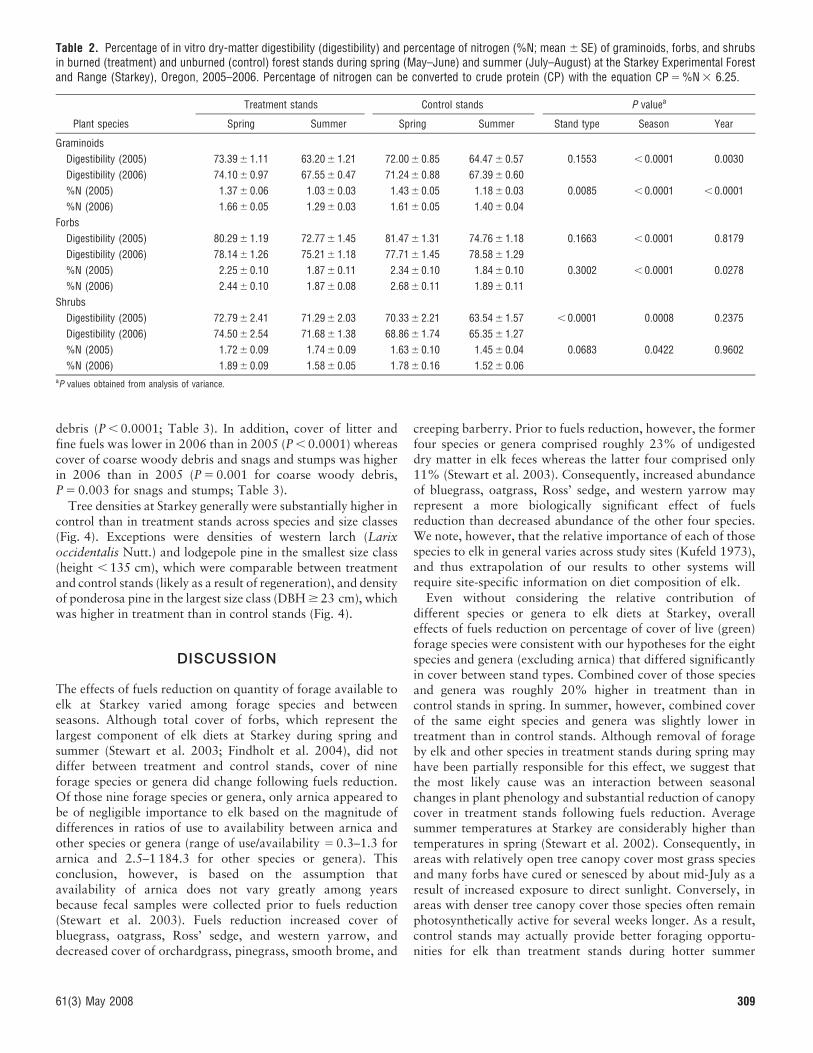
Table 2. Percentage of in vitro dry-matter digestibility (digestibility) and percentage of nitrogen (%N; mean 6 SE) of graminoids, forbs, and shrubsin burned (treatment) and unburned (control) forest stands during spring (May–June) and summer (July–August) at the Starkey Experimental Forestand Range (Starkey), Oregon, 2005–2006. Percentage of nitrogen can be converted to crude protein (CP) with the equation CP 5 %N 3 6.25.
Plant species
Treatment stands Control stands P valuea
Spring Summer Spring Summer Stand type Season Year
Graminoids
Digestibility (2005) 73.39 6 1.11 63.20 6 1.21 72.00 6 0.85 64.47 6 0.57 0.1553 , 0.0001 0.0030
Digestibility (2006) 74.10 6 0.97 67.55 6 0.47 71.24 6 0.88 67.39 6 0.60
%N (2005) 1.37 6 0.06 1.03 6 0.03 1.43 6 0.05 1.18 6 0.03 0.0085 , 0.0001 , 0.0001
%N (2006) 1.66 6 0.05 1.29 6 0.03 1.61 6 0.05 1.40 6 0.04
Forbs
Digestibility (2005) 80.29 6 1.19 72.77 6 1.45 81.47 6 1.31 74.76 6 1.18 0.1663 , 0.0001 0.8179
Digestibility (2006) 78.14 6 1.26 75.21 6 1.18 77.71 6 1.45 78.58 6 1.29
%N (2005) 2.25 6 0.10 1.87 6 0.11 2.34 6 0.10 1.84 6 0.10 0.3002 , 0.0001 0.0278
%N (2006) 2.44 6 0.10 1.87 6 0.08 2.68 6 0.11 1.89 6 0.11
Shrubs
Digestibility (2005) 72.79 6 2.41 71.29 6 2.03 70.33 6 2.21 63.54 6 1.57 , 0.0001 0.0008 0.2375
Digestibility (2006) 74.50 6 2.54 71.68 6 1.38 68.86 6 1.74 65.35 6 1.27
%N (2005) 1.72 6 0.09 1.74 6 0.09 1.63 6 0.10 1.45 6 0.04 0.0683 0.0422 0.9602
%N (2006) 1.89 6 0.09 1.58 6 0.05 1.78 6 0.16 1.52 6 0.06aP values obtained from analysis of variance.
61(3) May 2008 309
months. This possibility is supported by results of a concurrentstudy, which indicated that use of control stands by elk insummer was consistently higher than use of those stands inspring, whereas the opposite was true for treatment stands(Long et al. 2008).
Cover of total vegetation and forbs, as well as oatgrass andmountain brome, also differed between years. In each case,
however, cover was higher in 2006 than in 2005. Thisdifference may have resulted from higher total precipitationbetween April and August at Starkey in 2006 (17.0 cm) than in2005 (14.9 cm). Regardless, because only one of nine speciesthat differed significantly in percentage of cover between standtypes also was subject to a significant year effect, there seemslittle potential for annual variation in cover during the courseof our study to have confounded our results regarding effects offuels reduction on forage quantity.
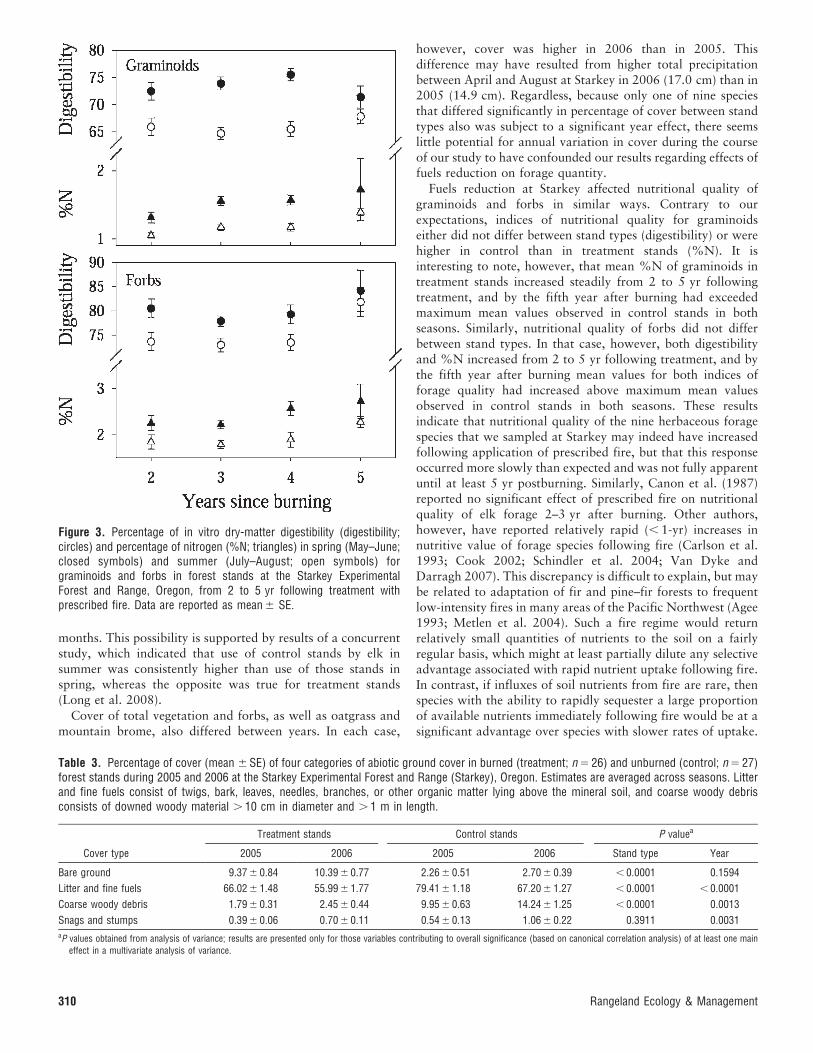
Fuels reduction at Starkey affected nutritional quality ofgraminoids and forbs in similar ways. Contrary to ourexpectations, indices of nutritional quality for graminoidseither did not differ between stand types (digestibility) or werehigher in control than in treatment stands (%N). It isinteresting to note, however, that mean %N of graminoids intreatment stands increased steadily from 2 to 5 yr followingtreatment, and by the fifth year after burning had exceededmaximum mean values observed in control stands in bothseasons. Similarly, nutritional quality of forbs did not differbetween stand types. In that case, however, both digestibilityand %N increased from 2 to 5 yr following treatment, and bythe fifth year after burning mean values for both indices offorage quality had increased above maximum mean valuesobserved in control stands in both seasons. These resultsindicate that nutritional quality of the nine herbaceous foragespecies that we sampled at Starkey may indeed have increasedfollowing application of prescribed fire, but that this responseoccurred more slowly than expected and was not fully apparentuntil at least 5 yr postburning. Similarly, Canon et al. (1987)reported no significant effect of prescribed fire on nutritionalquality of elk forage 2–3 yr after burning. Other authors,however, have reported relatively rapid (, 1-yr) increases innutritive value of forage species following fire (Carlson et al.1993; Cook 2002; Schindler et al. 2004; Van Dyke andDarragh 2007). This discrepancy is difficult to explain, but maybe related to adaptation of fir and pine–fir forests to frequentlow-intensity fires in many areas of the Pacific Northwest (Agee1993; Metlen et al. 2004). Such a fire regime would returnrelatively small quantities of nutrients to the soil on a fairlyregular basis, which might at least partially dilute any selectiveadvantage associated with rapid nutrient uptake following fire.In contrast, if influxes of soil nutrients from fire are rare, thenspecies with the ability to rapidly sequester a large proportionof available nutrients immediately following fire would be at asignificant advantage over species with slower rates of uptake.
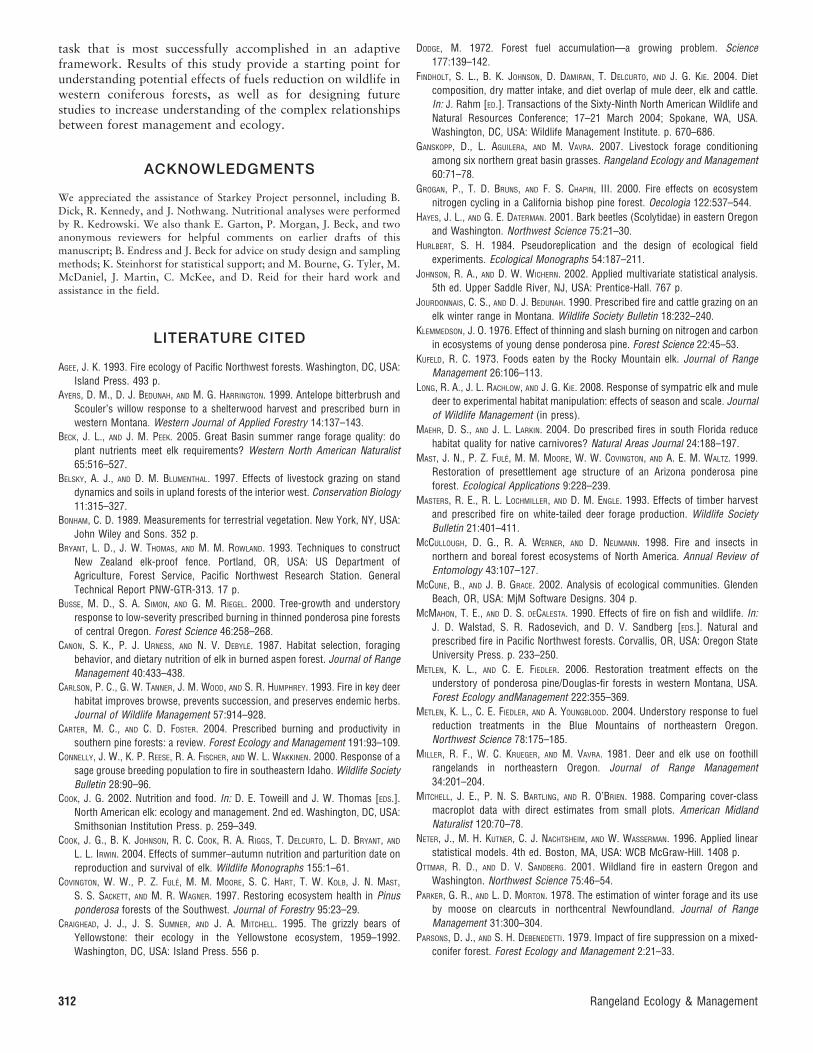
Table 3. Percentage of cover (mean 6 SE) of four categories of abiotic ground cover in burned (treatment; n 5 26) and unburned (control; n 5 27)forest stands during 2005 and 2006 at the Starkey Experimental Forest and Range (Starkey), Oregon. Estimates are averaged across seasons. Litterand fine fuels consist of twigs, bark, leaves, needles, branches, or other organic matter lying above the mineral soil, and coarse woody debrisconsists of downed woody material . 10 cm in diameter and . 1 m in length.
Cover type
Treatment stands Control stands P valuea
2005 2006 2005 2006 Stand type Year
Bare ground 9.37 6 0.84 10.39 6 0.77 2.26 6 0.51 2.70 6 0.39 , 0.0001 0.1594
Litter and fine fuels 66.02 6 1.48 55.99 6 1.77 79.41 6 1.18 67.20 6 1.27 , 0.0001 , 0.0001
Coarse woody debris 1.79 6 0.31 2.45 6 0.44 9.95 6 0.63 14.24 6 1.25 , 0.0001 0.0013
Snags and stumps 0.39 6 0.06 0.70 6 0.11 0.54 6 0.13 1.06 6 0.22 0.3911 0.0031aP values obtained from analysis of variance; results are presented only for those variables contributing to overall significance (based on canonical correlation analysis) of at least one main
effect in a multivariate analysis of variance.
Figure 3. Percentage of in vitro dry-matter digestibility (digestibility;circles) and percentage of nitrogen (%N; triangles) in spring (May–June;closed symbols) and summer (July–August; open symbols) forgraminoids and forbs in forest stands at the Starkey ExperimentalForest and Range, Oregon, from 2 to 5 yr following treatment withprescribed fire. Data are reported as mean 6 SE.
310 Rangeland Ecology & Management

In contrast to graminoids and forbs, digestibility and %N ofcreeping barberry were higher in treatment than in controlstands. Although we did not obtain shrub samples from alltreatment and control stands during each sampling period inour study, consistency of the effect of fuels reduction onnutritive value of shrubs across seasons and years indicates thatthis effect was not strongly confounded with potential standeffects. Our results also are consistent with results of otherstudies in which effects of fire on nutritional quality of woodybrowse were evaluated. For example, Carlson et al. (1993) andSchindler et al. (2004) reported short-term increases in nutritive
value (crude protein and digestibility) of woody browsefollowing fire. Also in contrast to herbaceous species, however,shrubs historically have comprised only a small proportion ofelk diets at Starkey (roughly 7%; Stewart et al. 2003), withonly one shrub species (creeping barberry) comprising . 1% ofundigested dry matter in the feces. This likely is due in part to alack of availability of woody browse, as we observed very lowdensities of palatable shrubs throughout Starkey during ourstudy. As a result, it seems unlikely that the increase wedocumented in nutritive value of creeping barberry followingfuels reduction would be of substantial benefit to elk, becausefuels reduction also reduced already low abundances of thatand other palatable shrubs.
Lower nutritional quality of forage in summer than in springacross plant functional groups in our study was consistent withour hypotheses, and similar patterns have been reported byother authors (Canon et al. 1987; Cook 2002; Beck and Peek2005; Ganskopp et al. 2007). Comparable to our results forforage quantity, the decline in both digestibility and %Nbetween spring and summer often was greater in treatmentthan in control stands, particularly for graminoids. This resultadds further support to the hypothesis that control stands mayprovide higher-quality forage for elk during hotter summermonths because denser tree canopy cover in those standsreduces exposure of plants to direct sunlight. Results for abioticground cover and tree density also reflected conversion oftreatment stands to earlier successional stages (Perryman et al.2002). We note, however, that nutritional quality of foragespecies sampled in our study was relatively high in bothtreatment and control stands across seasons, and thus forageconditions in all stands may have consistently exceededrequirements for elk (Cook et al. 2004).
MANAGEMENT IMPLICATIONS
Although prescribed fire often is assumed to benefit largeherbivores by increasing quantity or quality of forage, plantswith different life-history characteristics exhibit a wide range ofadaptations to disturbance, and thus sites with different speciesassemblages and disturbance histories are not likely to respondto fuels reduction in the same way (Agee 1993). Wedocumented moderate effects of fuels reduction from 2 to5 yr posttreatment on quantity and quality of forage for elk innortheastern Oregon, as well as a season effect that oftendiffered in magnitude between stand types. As a result of theinteracting effects of fuels reduction and season on foragecharacteristics, treated stands provided better foraging oppor-tunities for elk during spring, whereas control stands providedbetter foraging opportunities during summer. These resultsindicate that in systems similar to Starkey, maintaining amosaic of burned and unburned (i.e., late successional) foresthabitat may provide better long-term foraging opportunities forelk than burning a large proportion of the stands on alandscape. In addition, although some of our results wereconsistent with those of previous studies, others were not. Suchvariation highlights the importance of understanding ecologicalconsequences of fuels reduction across a wide variety of taxaand ecosystems. Management of multiple-use forest landscapesfor the benefit of both humans and wildlife is a complicated
Figure 4. Density of six tree species in burned (treatment; n 5 26) andunburned (control; n 5 27) forest stands at the Starkey ExperimentalForest and Range, Oregon, 2005–2006. Data are stratified by size class.A, Trees # 135 cm tall. B, Trees . 135 cm tall and , 23 cm diameter atbreast height (DBH). C, Trees $ 23 cm DBH. Species abbreviations areas follows: grand fir (Abies grandis [Dougl. ex D. Don] Lindl.; ABGR),western larch (Larix occidentalis Nutt.; LAOC), lodgepole pine (Pinuscontorta Dougl. ex Loud.; PICO), Engelmann spruce (Picea engelmanniiParry ex Engelm.; PIEN), ponderosa pine (Pinus ponderosa P. & C.Lawson; PIPO), and Douglas-fir (Pseudotsuga menziesii [Mirbel]Franco; PSME).
61(3) May 2008 311
task that is most successfully accomplished in an adaptiveframework. Results of this study provide a starting point forunderstanding potential effects of fuels reduction on wildlife inwestern coniferous forests, as well as for designing futurestudies to increase understanding of the complex relationshipsbetween forest management and ecology.
ACKNOWLEDGMENTS
We appreciated the assistance of Starkey Project personnel, including B.
Dick, R. Kennedy, and J. Nothwang. Nutritional analyses were performed
by R. Kedrowski. We also thank E. Garton, P. Morgan, J. Beck, and twoanonymous reviewers for helpful comments on earlier drafts of this
manuscript; B. Endress and J. Beck for advice on study design and sampling
methods; K. Steinhorst for statistical support; and M. Bourne, G. Tyler, M.McDaniel, J. Martin, C. McKee, and D. Reid for their hard work and
assistance in the field.
LITERATURE CITED
AGEE, J. K. 1993. Fire ecology of Pacific Northwest forests. Washington, DC, USA:Island Press. 493 p.
AYERS, D. M., D. J. BEDUNAH, AND M. G. HARRINGTON. 1999. Antelope bitterbrush andScouler’s willow response to a shelterwood harvest and prescribed burn inwestern Montana. Western Journal of Applied Forestry 14:137–143.
BECK, J. L., AND J. M. PEEK. 2005. Great Basin summer range forage quality: doplant nutrients meet elk requirements? Western North American Naturalist65:516–527.
BELSKY, A. J., AND D. M. BLUMENTHAL. 1997. Effects of livestock grazing on standdynamics and soils in upland forests of the interior west. Conservation Biology11:315–327.
BONHAM, C. D. 1989. Measurements for terrestrial vegetation. New York, NY, USA:John Wiley and Sons. 352 p.
BRYANT, L. D., J. W. THOMAS, AND M. M. ROWLAND. 1993. Techniques to constructNew Zealand elk-proof fence. Portland, OR, USA: US Department ofAgriculture, Forest Service, Pacific Northwest Research Station. GeneralTechnical Report PNW-GTR-313. 17 p.
BUSSE, M. D., S. A. SIMON, AND G. M. RIEGEL. 2000. Tree-growth and understoryresponse to low-severity prescribed burning in thinned ponderosa pine forestsof central Oregon. Forest Science 46:258–268.
CANON, S. K., P. J. URNESS, AND N. V. DEBYLE. 1987. Habitat selection, foragingbehavior, and dietary nutrition of elk in burned aspen forest. Journal of RangeManagement 40:433–438.
CARLSON, P. C., G. W. TANNER, J. M. WOOD, AND S. R. HUMPHREY. 1993. Fire in key deerhabitat improves browse, prevents succession, and preserves endemic herbs.Journal of Wildlife Management 57:914–928.
CARTER, M. C., AND C. D. FOSTER. 2004. Prescribed burning and productivity insouthern pine forests: a review. Forest Ecology and Management 191:93–109.
CONNELLY, J. W., K. P. REESE, R. A. FISCHER, AND W. L. WAKKINEN. 2000. Response of asage grouse breeding population to fire in southeastern Idaho. Wildlife SocietyBulletin 28:90–96.
COOK, J. G. 2002. Nutrition and food. In: D. E. Toweill and J. W. Thomas [EDS.].North American elk: ecology and management. 2nd ed. Washington, DC, USA:Smithsonian Institution Press. p. 259–349.
COOK, J. G., B. K. JOHNSON, R. C. COOK, R. A. RIGGS, T. DELCURTO, L. D. BRYANT, AND
L. L. IRWIN. 2004. Effects of summer–autumn nutrition and parturition date onreproduction and survival of elk. Wildlife Monographs 155:1–61.
COVINGTON, W. W., P. Z. FULE, M. M. MOORE, S. C. HART, T. W. KOLB, J. N. MAST,S. S. SACKETT, AND M. R. WAGNER. 1997. Restoring ecosystem health in Pinusponderosa forests of the Southwest. Journal of Forestry 95:23–29.
CRAIGHEAD, J. J., J. S. SUMNER, AND J. A. MITCHELL. 1995. The grizzly bears ofYellowstone: their ecology in the Yellowstone ecosystem, 1959–1992.Washington, DC, USA: Island Press. 556 p.
DODGE, M. 1972. Forest fuel accumulation—a growing problem. Science177:139–142.
FINDHOLT, S. L., B. K. JOHNSON, D. DAMIRAN, T. DELCURTO, AND J. G. KIE. 2004. Dietcomposition, dry matter intake, and diet overlap of mule deer, elk and cattle.In: J. Rahm [ED.]. Transactions of the Sixty-Ninth North American Wildlife andNatural Resources Conference; 17–21 March 2004; Spokane, WA, USA.Washington, DC, USA: Wildlife Management Institute. p. 670–686.
GANSKOPP, D., L. AGUILERA, AND M. VAVRA. 2007. Livestock forage conditioningamong six northern great basin grasses. Rangeland Ecology and Management60:71–78.
GROGAN, P., T. D. BRUNS, AND F. S. CHAPIN, III. 2000. Fire effects on ecosystemnitrogen cycling in a California bishop pine forest. Oecologia 122:537–544.
HAYES, J. L., AND G. E. DATERMAN. 2001. Bark beetles (Scolytidae) in eastern Oregonand Washington. Northwest Science 75:21–30.
HURLBERT, S. H. 1984. Pseudoreplication and the design of ecological fieldexperiments. Ecological Monographs 54:187–211.
JOHNSON, R. A., AND D. W. WICHERN. 2002. Applied multivariate statistical analysis.5th ed. Upper Saddle River, NJ, USA: Prentice-Hall. 767 p.
JOURDONNAIS, C. S., AND D. J. BEDUNAH. 1990. Prescribed fire and cattle grazing on anelk winter range in Montana. Wildlife Society Bulletin 18:232–240.
KLEMMEDSON, J. O. 1976. Effect of thinning and slash burning on nitrogen and carbonin ecosystems of young dense ponderosa pine. Forest Science 22:45–53.
KUFELD, R. C. 1973. Foods eaten by the Rocky Mountain elk. Journal of RangeManagement 26:106–113.
LONG, R. A., J. L. RACHLOW, AND J. G. KIE. 2008. Response of sympatric elk and muledeer to experimental habitat manipulation: effects of season and scale. Journalof Wildlife Management (in press).
MAEHR, D. S., AND J. L. LARKIN. 2004. Do prescribed fires in south Florida reducehabitat quality for native carnivores? Natural Areas Journal 24:188–197.
MAST, J. N., P. Z. FULE, M. M. MOORE, W. W. COVINGTON, AND A. E. M. WALTZ. 1999.Restoration of presettlement age structure of an Arizona ponderosa pineforest. Ecological Applications 9:228–239.
MASTERS, R. E., R. L. LOCHMILLER, AND D. M. ENGLE. 1993. Effects of timber harvestand prescribed fire on white-tailed deer forage production. Wildlife SocietyBulletin 21:401–411.
MCCULLOUGH, D. G., R. A. WERNER, AND D. NEUMANN. 1998. Fire and insects innorthern and boreal forest ecosystems of North America. Annual Review ofEntomology 43:107–127.
MCCUNE, B., AND J. B. GRACE. 2002. Analysis of ecological communities. GlendenBeach, OR, USA: MjM Software Designs. 304 p.
MCMAHON, T. E., AND D. S. DECALESTA. 1990. Effects of fire on fish and wildlife. In:J. D. Walstad, S. R. Radosevich, and D. V. Sandberg [EDS.]. Natural andprescribed fire in Pacific Northwest forests. Corvallis, OR, USA: Oregon StateUniversity Press. p. 233–250.
METLEN, K. L., AND C. E. FIEDLER. 2006. Restoration treatment effects on theunderstory of ponderosa pine/Douglas-fir forests in western Montana, USA.Forest Ecology andManagement 222:355–369.
METLEN, K. L., C. E. FIEDLER, AND A. YOUNGBLOOD. 2004. Understory response to fuelreduction treatments in the Blue Mountains of northeastern Oregon.Northwest Science 78:175–185.
MILLER, R. F., W. C. KRUEGER, AND M. VAVRA. 1981. Deer and elk use on foothillrangelands in northeastern Oregon. Journal of Range Management34:201–204.
MITCHELL, J. E., P. N. S. BARTLING, AND R. O’BRIEN. 1988. Comparing cover-classmacroplot data with direct estimates from small plots. American MidlandNaturalist 120:70–78.
NETER, J., M. H. KUTNER, C. J. NACHTSHEIM, AND W. WASSERMAN. 1996. Applied linearstatistical models. 4th ed. Boston, MA, USA: WCB McGraw-Hill. 1408 p.
OTTMAR, R. D., AND D. V. SANDBERG. 2001. Wildland fire in eastern Oregon andWashington. Northwest Science 75:46–54.
PARKER, G. R., AND L. D. MORTON. 1978. The estimation of winter forage and its useby moose on clearcuts in northcentral Newfoundland. Journal of RangeManagement 31:300–304.
PARSONS, D. J., AND S. H. DEBENEDETTI. 1979. Impact of fire suppression on a mixed-conifer forest. Forest Ecology and Management 2:21–33.
312 Rangeland Ecology & Management
PECK, V. R., AND J. M. PEEK. 1991. Elk, Cervus elaphus, habitat use related to prescribedfire, Tuchodi River, British Columbia. Canadian Field-Naturalist 105:354–362.
PENDERGRASS, K. L., P. M. MILLER, AND J. B. KAUFFMAN. 1998. Prescribed fire and theresponse of woody species in Willamette Valley wetland prairies. RestorationEcology 6:303–311.
PERRYMAN, B. L., R. A. OLSON, S. PETERSBURG, AND T. NAUMANN. 2002. Vegetationresponse to prescribed fire in Dinosaur National Monument. Western NorthAmerican Naturalist 62:414–422.
PYNE, S. J. 1997. Fire in America: a cultural history of wildland and rural fire.Seattle, WA, USA: University of Washington Press. 654 p.
QUINLAN, A., M. R. T. DALE, AND C. C. GATES. 2003. Effects of prescribed burning onherbaceous and woody vegetation in northern lowland meadows. RestorationEcology 11:343–350.
ROWLAND, M. M., L. D. BRYANT, B. K. JOHNSON, J. H. NOYES, M. J. WISDOM, AND
J. W. THOMAS. 1997. The Starkey Project: history, facilities, and data collectionmethods for ungulate research. Portland, OR, USA: US Department ofAgriculture, Forest Service, Pacific Northwest Research Station, GeneralTechnical Report PNW-GTR-296. 62 p.
ROWLAND, M. M., P. K. COE, R. J. STUSSY, A. A. AGER, N. J. CIMON, B. K. JOHNSON, AND
M. J. WISDOM. 1998. The Starkey habitat database for ungulate research:construction, documentation, and use. Portland, OR, USA: US Department ofAgriculture, Forest Service, Pacific Northwest Research Station. GeneralTechnical Report PNW-GTR-430. 48 p.
SAS INSTITUTE [computer program]. 2002. SAS OnlineDocH, Version 9.1.3. Cary,NC, USA: SAS Institute, Inc.
SCHINDLER, J. R., T. E. FULBRIGHT, AND T. D. A. FORBES. 2004. Shrub regrowth,antiherbivore defenses, and nutritional value following fire. Journal of RangeManagement 57:178–186.
SKOVLIN, J. M. 1991. Fifty years of research progress: a historical document on theStarkey Experimental Forest and Range. Portland, OR, USA: US Department of
Agriculture, Forest Service, Pacific Northwest Research Station, GeneralTechnical Report PNW-GTR-266. 58 p.
STEWART, K. M., R. T. BOWYER, J. G. KIE, N. J. CIMON, AND B. K. JOHNSON. 2002.Temporospatial distributions of elk, mule deer, and cattle: resource partitioningand competitive displacement. Journal of Mammalogy 83:229–244.
STEWART, K. M., R. T. BOWYER, J. G. KIE, B. L. DICK, AND M. BEN-DAVID. 2003. Nichepartitioning among mule deer, elk, and cattle: do stable isotopes reflect dietaryniche? Ecoscience 10:297–302.
STEWART, K. M., R. T. BOWYER, R. W. RUESS, B. L. DICK, AND J. G. KIE. 2006. Herbivoreoptimization by North American elk: consequences for theory and manage-ment. Wildlife Monographs 167:1–24.
TIEDEMANN, A. R., J. O. KLEMMEDSON, AND E. L. BULL. 2000. Solution of forest healthproblems with prescribed fire: are forest productivity and wildlife at risk?Forest Ecology and Management 127:1–18.
TILLEY, J. M. A., AND R. A. TERRY. 1963. A two-stage technique for the in vitrodigestion of forage crops. Journal of the British Grassland Society 18:104–111.
US DEPARTMENT OF AGRICULTURE NATURAL RESOURCES CONSERVATION SERVICE. 2007. ThePLANTS Database. Baton Rouge, LA, USA: National Plant Data Center.Available at: http://plants.usda.gov. Accessed 5 March 2007.
VAN DYKE, F., AND J. A. DARRAGH. 2007. Response of elk to changes in plantproduction and nutrition following prescribed burning. Journal of WildlifeManagement 71:23–29.
WEEKLEY, C. W., AND E. S. MENGES. 2003. Species and vegetation responses toprescribed fire in a long-unburned, endemic-rich Lake Wales Ridge scrub.Journal of the Torrey Botanical Society 130:265–282.
WISDOM, M. J., J. G. COOK, M. M. ROWLAND, AND J. H. NOYES. 1993. Protocols for careand handling of deer and elk at the Starkey Experimental Forest and Range.Portland, OR, USA: US Department of Agriculture, Forest Service, PacificNorthwest Research Station, General Technical Report PNW-GTR-311. 49 p.
61(3) May 2008 313
Copyright © 2022 FDOKUMEN