pressure relief valve engineering handbook - Cornerstone ...
Upload
independentCategory
view
3download
0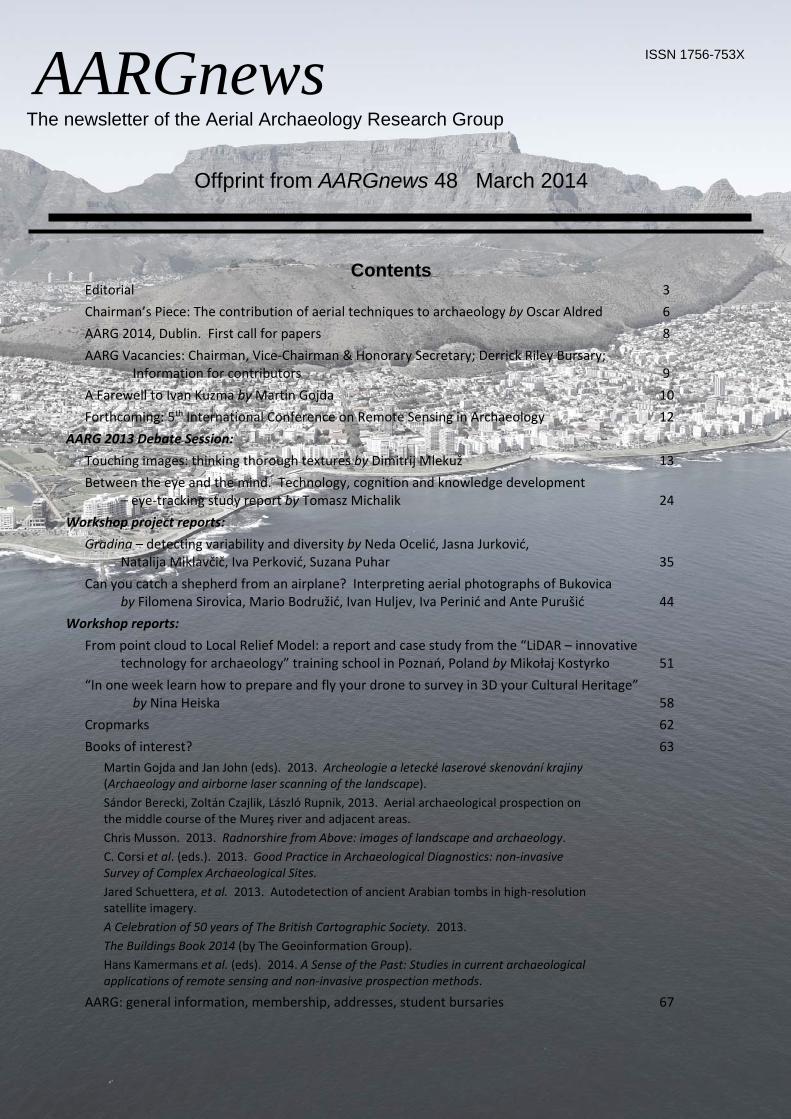
1
Offprint from AARGnews 48 March 2014
Contents Editorial 3 Chairman’s Piece: The contribution of aerial techniques to archaeology by Oscar Aldred 6 AARG 2014, Dublin. First call for papers 8 AARG Vacancies: Chairman, Vice‐Chairman & Honorary Secretary; Derrick Riley Bursary;
Information for contributors 9 A Farewell to Ivan Kuzma by Martin Gojda 10 Forthcoming: 5th International Conference on Remote Sensing in Archaeology 12
AARG 2013 Debate Session: Touching images: thinking thorough textures by Dimitrij Mlekuž 13 Between the eye and the mind. Technology, cognition and knowledge development
– eye‐tracking study report by Tomasz Michalik 24 Workshop project reports:
Gradina – detecting variability and diversity by Neda Ocelić, Jasna Jurković, Natalija Miklavčič, Iva Perković, Suzana Puhar 35
Can you catch a shepherd from an airplane? Interpreting aerial photographs of Bukovica by Filomena Sirovica, Mario Bodružić, Ivan Huljev, Iva Perinić and Ante Purušić 44
Workshop reports: From point cloud to Local Relief Model: a report and case study from the “LiDAR – innovative
technology for archaeology” training school in Poznań, Poland by Mikołaj Kostyrko 51 “In one week learn how to prepare and fly your drone to survey in 3D your Cultural Heritage”
by Nina Heiska 58 Cropmarks 62 Books of interest? 63 Martin Gojda and Jan John (eds). 2013. Archeologie a letecké laserové skenování krajiny
(Archaeology and airborne laser scanning of the landscape). Sándor Berecki, Zoltán Czajlik, László Rupnik, 2013. Aerial archaeological prospection on
the middle course of the Mureş river and adjacent areas. Chris Musson. 2013. Radnorshire from Above: images of landscape and archaeology. C. Corsi et al. (eds.). 2013. Good Practice in Archaeological Diagnostics: non‐invasive
Survey of Complex Archaeological Sites. Jared Schuettera, et al. 2013. Autodetection of ancient Arabian tombs in high‐resolution
satellite imagery. A Celebration of 50 years of The British Cartographic Society. 2013. The Buildings Book 2014 (by The Geoinformation Group). Hans Kamermans et al. (eds). 2014. A Sense of the Past: Studies in current archaeological applications of remote sensing and non‐invasive prospection methods.
AARG: general information, membership, addresses, student bursaries 67
ISSN 1756-753X AARGnews The newsletter of the Aerial Archaeology Research Group
AARGnews 48 (March 2014)
51
From point cloud to Local Relief Model: a report and case study from the “LiDAR – innovative technology for archaeology” training school in
Poznań, Poland
Mikołaj Kostyrko1
2
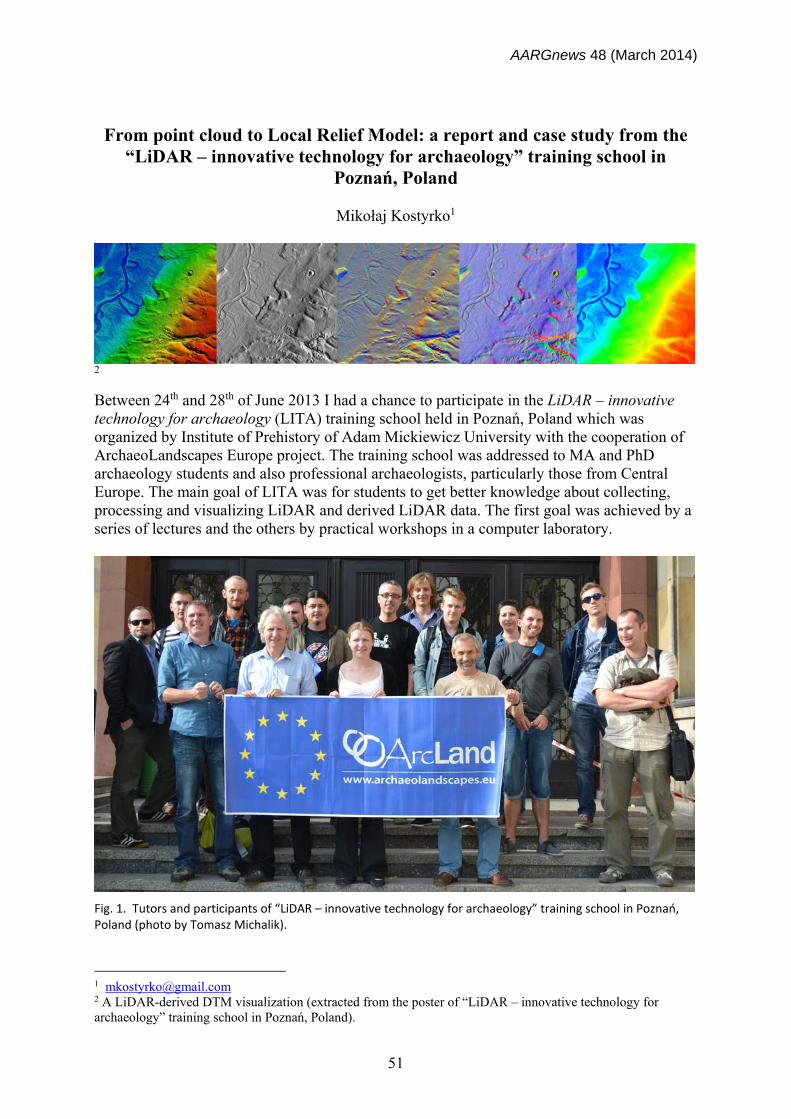
Between 24th and 28th of June 2013 I had a chance to participate in the LiDAR – innovative technology for archaeology (LITA) training school held in Poznań, Poland which was organized by Institute of Prehistory of Adam Mickiewicz University with the cooperation of ArchaeoLandscapes Europe project. The training school was addressed to MA and PhD archaeology students and also professional archaeologists, particularly those from Central Europe. The main goal of LITA was for students to get better knowledge about collecting, processing and visualizing LiDAR and derived LiDAR data. The first goal was achieved by a series of lectures and the others by practical workshops in a computer laboratory.
Fig. 1. Tutors and participants of “LiDAR – innovative technology for archaeology” training school in Poznań, Poland (photo by Tomasz Michalik).
1 [email protected] 2 A LiDAR-derived DTM visualization (extracted from the poster of “LiDAR – innovative technology for archaeology” training school in Poznań, Poland).
AARGnews 48 (March 2014)
52
One of the big advantages of this training school, from my perspective, was a chance to learn about collecting LiDAR data and processing not only from the archaeologists who work with this data, but also from the software developers. Learning from people who collect the data and use them in projects, who have goals other than managing the heritage, gave us an idea of the potential of this technique for archaeology. On the first day we were introduced to the LiDAR concept by Martin Isenburg (rapidlasso GmbH), the creator of LAStools3 software for processing LiDAR data. The idea of full-waveform data was described and we were shown how a LiDAR point-cloud can be efficiently compressed in to laz format [some of M. Isenburg’s lectures can be found on his You Tube profile4]. Later we had our hands in action working and processing point cloud data in LAStools. Unfortunately, due to other obligations, Martin Isenburg could not stay with us longer. The second day started with lectures about the use of LiDAR in archaeology and how aerial gathered data can be interpreted. This session was conducted by Rebecca Bennett (South Downs National Park Authority) and Simon Crutchley (English Heritage), afterwards we moved to computer laboratory to start learning the workflow of different techniques and the possibilities of LiDAR-derived data visualization in QGIS and GRASS, open-source GIS software. The third day started with presentations by Simon Crutchley of a series of case studies using LiDAR data. These were followed by talks about interpretation of aerial photographs by Włodzimierz Rączkowski which gave us a broader background into survey techniques Later, Piotr Wężyk, from the Agricultural University of Cracow, shared his experience of using airborne data in forest management and his work with the Polish government to collect LiDAR data for the whole country (ISOK project). After this, in the computer laboratory, we were able to upgrade our skills in techniques of LiDAR-derived data visualization using QGIS, GRASS GIS and Lidar Visualization Toolbox (LiVT)5 and to use Cumulative Viewshead, Principal Component Analysis and Local Relief Model to perform different types of analysis6. On the last day we were working in pairs with our own data or that provided by the tutors. The goal was to use the skills we learned during the training school and to present our own case studies as a way of summarising those five days of learning about LiDAR data.
3 LAStools can be downloaded from http://rapidlasso.com/lastools/ 4 http://www.youtube.com/user/downtownfarm/videos or http://rapidlasso.com/category/tutorials/ for tutorials and downloading the software (both accessed 31.12.2013) 5 LiVT can be downloaded from http://sourceforge.net/projects/livt/ 6 All the LiVT lidar tutorials for QGIS and GRASS can be accessed at http://www.pushingthesensors.com/teaching-materials/

AARGnews 48 (March 2014)
53
Fig. 2. Aerial photograph of Szamotuły taken by Włodzimierz Rączkowski in 2006. My partner, Leszek Gardeła (Rzeszów University) and I had access to LiDAR data bought from the Polish Government – Geodesic and Cartography Authority (ISOK project7) and to aerial photographs taken by Włodzimierz Rączkowski. The LiDAR data covered the area of an archaeological site located in Mutowo, Wielkopolska Region (40 km north of Poznań) which was first recorded by Włodzimierz Rączkowski during an aerial survey in 2006. The site is the original location of the town of Szamotuły which was abandoned after a fire in 12th/13th century during which the city got burned down (some called it the Polish Pompeii). After the discovery of this site it has been constantly observed and studied using non-destructive remote sensing techniques from sky and ground8. The site is listed and has been excluded from any forms of invasive archaeology techniques.
7 IT System of Country’s Protection against Extreme Hazards (http://www.isok.gov.pl/en/ accessed 18.01.2013) 8 Kijowski A., Słowik M., Rączkowski W., 2010 – A Medieval Town (Szamotuły) as a Testing Area for Non-invasive Methods – GPR MALA ProEx. [W:] Remote Sensing for Science, Education, and Natural and Cultural Heritage, Reiner Reuter (Editor.), University of Oldenburg, Germany: 95-100 [Available on http://www.earsel.org/symposia/2010-symposium-Paris/Proceedings/EARSeL-Symposium-2010_2-06.pdf (accessed 06.01.2014)]
AARGnews 48 (March 2014)
54
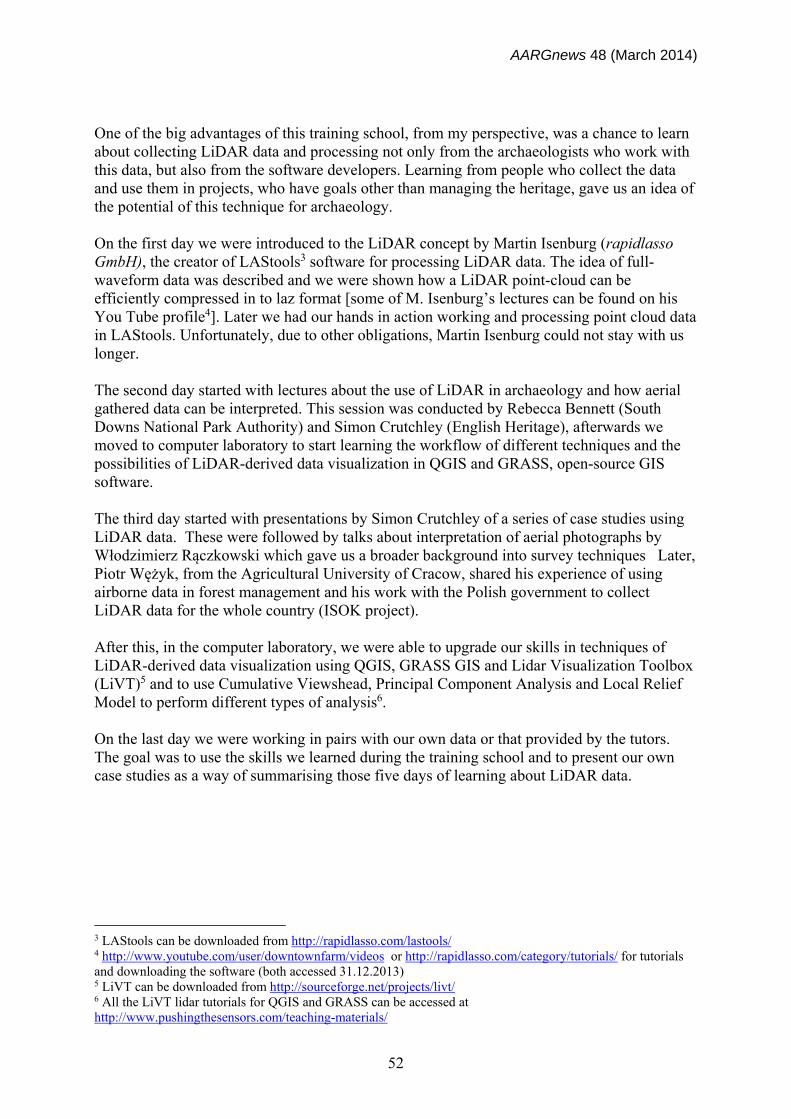
Fig. 3. Data visualized in QGIS. Left is the coloured DTM superimposed on a hill shade layer. Right is the same area on which has been added the author’s rapid interpretation (from aerial photographs) of the pits (households) and a road that leads through the market on north‐south axis. The problem with this particular archaeological site (from LiDAR data perspective) is that, although from air it can be seen through cropmarks, it has been ploughed out and is relatively flat. It might seem this is not the best situation in which to use the LiDAR data if our intention was to use micromorphology to detect archaeological remains. Our goal was to answer the question: can this kind of data, collected at 4 points/m2, help to detect such an archaeological site? The first view of the LiDAR-derived data did not seemed to be too promising.
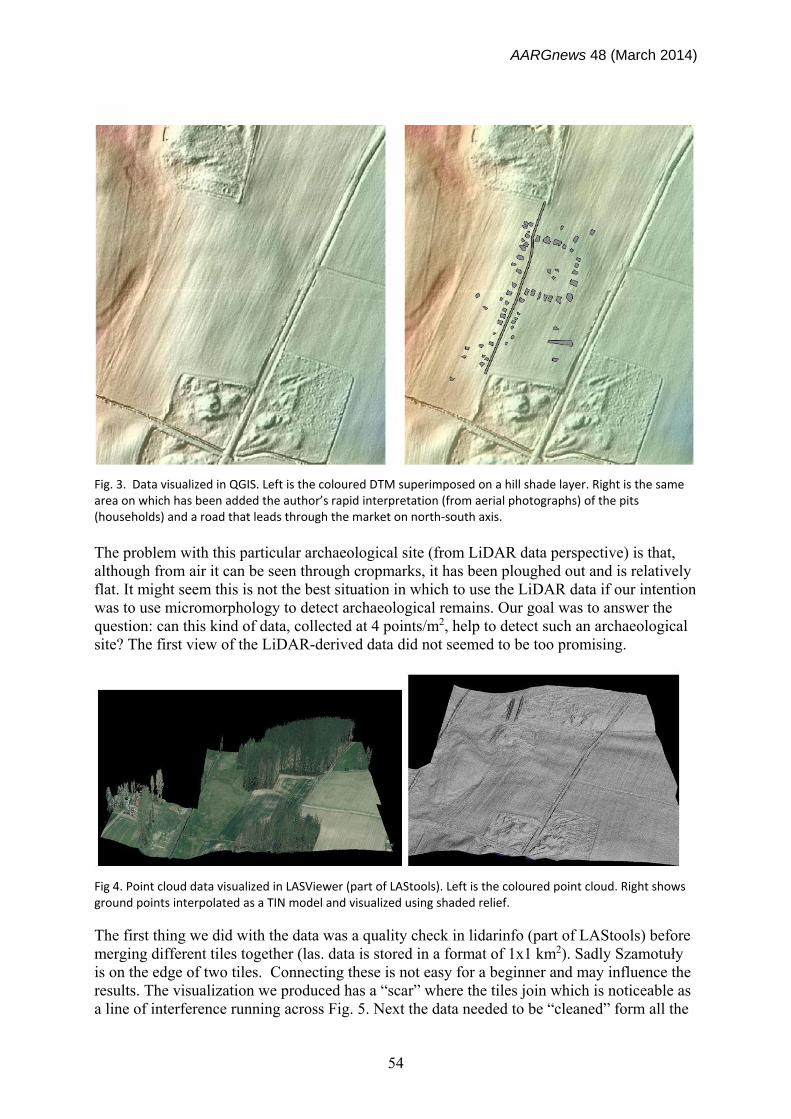
Fig 4. Point cloud data visualized in LASViewer (part of LAStools). Left is the coloured point cloud. Right shows ground points interpolated as a TIN model and visualized using shaded relief. The first thing we did with the data was a quality check in lidarinfo (part of LAStools) before merging different tiles together (las. data is stored in a format of 1x1 km2). Sadly Szamotuły is on the edge of two tiles. Connecting these is not easy for a beginner and may influence the results. The visualization we produced has a “scar” where the tiles join which is noticeable as a line of interference running across Fig. 5. Next the data needed to be “cleaned” form all the
AARGnews 48 (March 2014)
55
points that where registered to high or too low by deleting all that were above 20 and below -5 m. Although the las data provided from the ISOK project were already classified, using LAStools it was possible for us to reclassify them to match our own needs and to have control over the characteristics of the algorithms for surface extraction. After that it was possible to extract a DEM to bil (Band Interleaved by Line) format, which is a very light format for saving spatial data and is for the moment the only format that can be processed in LiVT. Getting familiar with LiVT to process and visualize LiDAR-derived data was one of the goals of this training school. This standalone software provides and easier and faster way to expose archaeological remains through different techniques than using different open-source software (such as Saga GIS or GRASS GIS). The second biggest advantage of this Lidar Visualization Toolbox, from my perspective, is that it is very easy to use and the layout of the program is very intuitive. One only needs to know the effects of different processing algorithms (i.e. sky-view factor, local relief model or trend removal), and how they may change the image that we later perceive
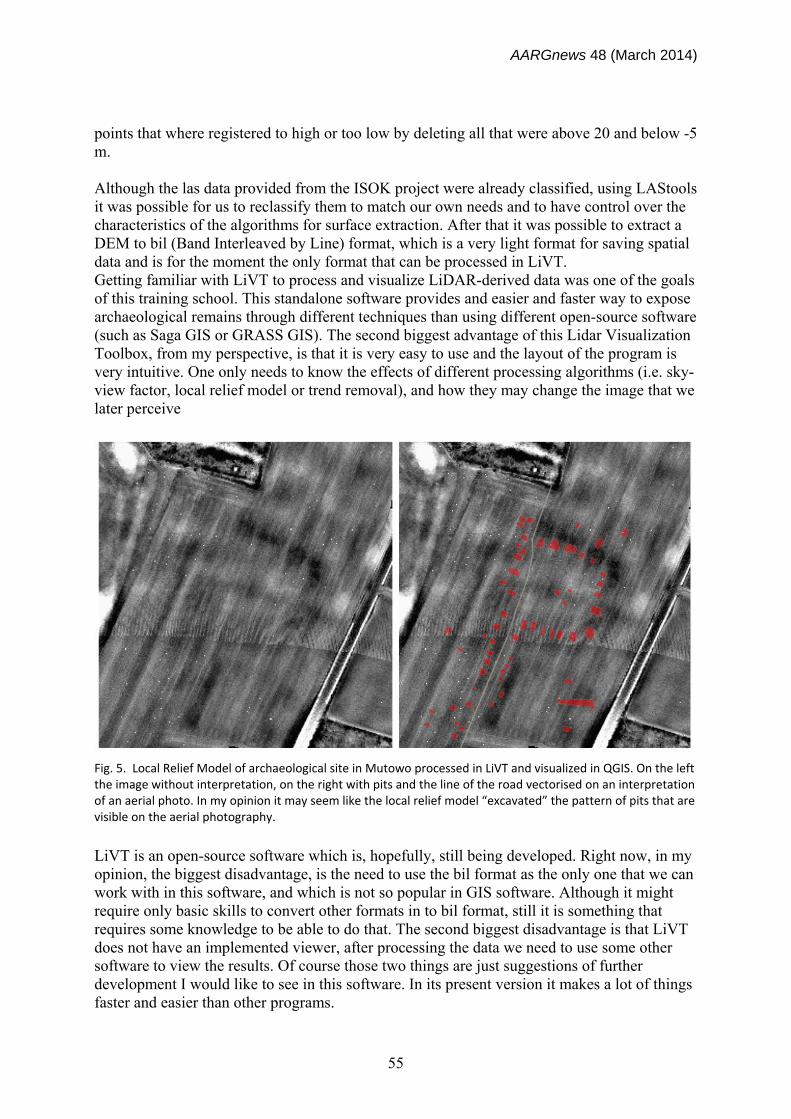
Fig. 5. Local Relief Model of archaeological site in Mutowo processed in LiVT and visualized in QGIS. On the left the image without interpretation, on the right with pits and the line of the road vectorised on an interpretation of an aerial photo. In my opinion it may seem like the local relief model “excavated” the pattern of pits that are visible on the aerial photography. LiVT is an open-source software which is, hopefully, still being developed. Right now, in my opinion, the biggest disadvantage, is the need to use the bil format as the only one that we can work with in this software, and which is not so popular in GIS software. Although it might require only basic skills to convert other formats in to bil format, still it is something that requires some knowledge to be able to do that. The second biggest disadvantage is that LiVT does not have an implemented viewer, after processing the data we need to use some other software to view the results. Of course those two things are just suggestions of further development I would like to see in this software. In its present version it makes a lot of things faster and easier than other programs.

AARGnews 48 (March 2014)
56
We processed Mutowo data in LiVT using most of the algorithms and manipulated with different variabilities, but the one that produced the most interesting image was the Local Relief Model with the program’s default input options (Fig. 5 ). Although without seeing the aerial photo it would be almost impossible to recognize the patterns of the pits, it may look as if there are some kind of micromorphological forms of the ground that indicate the shape of the market place and the line of houses that were standing by the street that lead to it. The results we came up with may not seem spectacular as we would like them to be, but still in my opinion we managed to show that there may be a potential of using LiDAR data while using different kind of algorithms for studying landscape which is relatively flat or ploughed away.
Fig. 6. Grzegorz Kiarszys from the University of Szczecin presenting his work (photo by Włodzimierz Rączkowski). After few hours of processing LiDAR data, making visualization of LiDAR-derived data and discussions about how we can perceive and interpret them we had a chance to present our work to other participants of the training school. Although our outcome may not have shown that the data from the ISOK project are effective for such archaeological sites it has shown that there may be a potential of studying such a landscape using LiDAR data and, as has been suggested by others, that a more detailed survey with more points per meter might bring better results.

AARGnews 48 (March 2014)
57
It may look as if it’s becoming a small tradition in Poznań that, with the help of the ArchaeoLandscapes Europe project, we are having chances to attend workshops focusing on bringing new remote sensing techniques to archaeologists from Central Europe (this time from Romania, Czech Republic, Montenegro and Poland). The previous one was on the “Potential of satellite images and hyper-/multispectral recording in archaeology”9. I hope that more similar events will be organised, as they provide opportunities to learn new techniques and to integrate with people interested in remote sensing from different parts of Europe.
9 Jitka Jizerova, 2012. Report on summer school of “Potential of satellite images and hyper-/multispectral recording in archaeology” 30th July – 3rd August 2012. AARGnews 45, 14-16.
Copyright © 2022 FDOKUMEN