Frequency-Dependent Attentional Modulation of Local Field Potential Signals in (PDF)
9
doi: 10.1152/jn.00263.2005 94:1904-1911, 2005. First published 18 May 2005; J Neurophysiol Charles E. Schroeder Peter Lakatos, Ankoor S. Shah, Kevin H. Knuth, Istvan Ulbert, George Karmos and Cortex Excitability and Stimulus Processing in the Auditory An Oscillatory Hierarchy Controlling Neuronal You might find this additional info useful... 44 articles, 20 of which you can access for free at: This article cites http://jn.physiology.org/content/94/3/1904.full#ref-list-1 91 other HighWire-hosted articles: This article has been cited by http://jn.physiology.org/content/94/3/1904#cited-by including high resolution figures, can be found at: Updated information and services http://jn.physiology.org/content/94/3/1904.full can be found at: Journal of Neurophysiology about Additional material and information http://www.the-aps.org/publications/jn This information is current as of May 30, 2013. at http://www.the-aps.org/. Copyright © 2005 by the American Physiological Society. ISSN: 0022-3077, ESSN: 1522-1598. Visit our website times a year (monthly) by the American Physiological Society, 9650 Rockville Pike, Bethesda MD 20814-3991. publishes original articles on the function of the nervous system. It is published 12 Journal of Neurophysiology by guest on May 30, 2013 http://jn.physiology.org/ Downloaded from
-
Upload
independent -
Category
Documents
-
view
1 -
download
0
Transcript of Frequency-Dependent Attentional Modulation of Local Field Potential Signals in (PDF)
doi: 10.1152/jn.00263.200594:1904-1911, 2005. First published 18 May 2005;J Neurophysiol
Charles E. SchroederPeter Lakatos, Ankoor S. Shah, Kevin H. Knuth, Istvan Ulbert, George Karmos andCortexExcitability and Stimulus Processing in the Auditory An Oscillatory Hierarchy Controlling Neuronal
You might find this additional info useful...
44 articles, 20 of which you can access for free at: This article citeshttp://jn.physiology.org/content/94/3/1904.full#ref-list-1
91 other HighWire-hosted articles: This article has been cited by http://jn.physiology.org/content/94/3/1904#cited-by
including high resolution figures, can be found at: Updated information and serviceshttp://jn.physiology.org/content/94/3/1904.full
can be found at: Journal of Neurophysiology about Additional material and informationhttp://www.the-aps.org/publications/jn
This information is current as of May 30, 2013.
at http://www.the-aps.org/. Copyright © 2005 by the American Physiological Society. ISSN: 0022-3077, ESSN: 1522-1598. Visit our websitetimes a year (monthly) by the American Physiological Society, 9650 Rockville Pike, Bethesda MD 20814-3991.
publishes original articles on the function of the nervous system. It is published 12Journal of Neurophysiology
by guest on May 30, 2013
http://jn.physiology.org/D
ownloaded from

An Oscillatory Hierarchy Controlling Neuronal Excitabilityand Stimulus Processing in the Auditory Cortex
Peter Lakatos,1,2 Ankoor S. Shah,1,4 Kevin H. Knuth,3 Istvan Ulbert,2 George Karmos,2
and Charles E. Schroeder1,4
1Cognitive Neuroscience and Schizophrenia Program, Nathan Kline Institute, Orangeburg, New York; 2Institute for Psychology, HungarianAcademy of Sciences, Budapest, Hungary; 3Computational Sciences Division, National Aeronautics and Space Administration AmesResearch Center, Moffett Field, California; and 4Department of Neuroscience, Albert Einstein College of Medicine, Bronx, New York
Submitted 11 March 2005; accepted in final form 6 May 2005
Lakatos, Peter, Ankoor S. Shah, Kevin H. Knuth, Istvan Ulbert,George Karmos, and Charles E. Schroeder. An oscillatory hierar-chy controlling neuronal excitability and stimulus processing in theauditory cortex. J Neurophysiol 94: 1904–1911, 2005. First publishedMay 18, 2005; doi:10.1152/jn.00263.2005. EEG oscillations are hy-pothesized to reflect cyclical variations in the neuronal excitability,with particular frequency bands reflecting differing spatial scales ofbrain operation. However, despite decades of clinical and scientificinvestigation, there is no unifying theory of EEG organization, and therole of ongoing activity in sensory processing remains controversial.This study analyzed laminar profiles of synaptic activity [currentsource density CSD] and multiunit activity (MUA), both spontaneousand stimulus-driven, in primary auditory cortex of awake macaquemonkeys. Our results reveal that the EEG is hierarchically organized;delta (1–4 Hz) phase modulates theta (4–10 Hz) amplitude, and thetaphase modulates gamma (30–50 Hz) amplitude. This oscillatoryhierarchy controls baseline excitability and thus stimulus-related re-sponses in a neuronal ensemble. We propose that the hierarchicalorganization of ambient oscillatory activity allows auditory cortex tostructure its temporal activity pattern so as to optimize the processing ofrhythmic inputs.
I N T R O D U C T I O N
The EEG has been widely used for over 75 yr as a measureof human brain function (see e.g., Berger 1929). However,because of the dynamic complexity of the EEG, our under-standing of its control and functional significance remainsrudimentary. Recent studies have begun to link specific brainoperations to specific components of the EEG, including“gamma” (Bertrand and Tallon-Baudry 2000; Engel et al.2001; Fries et al. 2001b; Singer and Gray 1995), “theta”(Buzsaki and Draguhn 2004; Chrobak et al. 2000; Kahana et al.2001), and “alpha” (Makeig et al. 2004; Worden et al. 2000).This study exploits and extends these findings.
Our study focused on three issues. The first issue is theintrinsic oscillatory “structure” of the EEG. There is an appar-ent relationship between theta oscillatory phase and gammaoscillatory amplitude in hippocampus (Bragin et al. 1995;Buzsaki et al. 2003; Csicsvari et al. 2003) and entorhinal cortex(Chrobak and Buzsaki 1998; Cunningham et al. 2003). Humanrecordings also show that periodic high-frequency oscillationsare nested in lower frequencies and appear rhythmically in thespontaneous EEG (Freeman and Rogers 2002; Vanhatalo et al.2004). We predict a more extensive systematic dependence of
higher frequency oscillatory amplitude on lower frequencyphase than that outlined by these studies. The second issue isthe relationship between the EEG and neuronal excitability.EEG oscillations are hypothesized to reflect cyclical variationin the excitability of neuronal ensembles (Bishop 1933), butthis idea has been explored mainly with regard to the low (�1Hz) frequency oscillations (Contreras et al. 1996; Sanchez-Vives and McCormick 2000; Steriade et al. 1993). The finalissue is the effect of the ambient EEG on sensory processing.While ongoing activity apparently can influence sensory re-sponses (Arieli et al. 1996; Fiser et al. 2004; Fries et al. 2001a;Kruglikov and Schiff 2003; Massimini et al. 2003; Polich 1997;Truccolo et al. 2002), the extent of these effects and mechanismsby which they are controlled are poorly understood.
We analyzed both the spontaneous and stimulus-drivenoscillatory activity present in cortical laminar profiles of fieldpotentials and concomitant multiunit activity (MUA). Theseprofiles were recorded with linear array multielectrodes duringpenetrations through primary auditory cortex (A1) in awakerhesus monkeys. Rather than analyzing the laminar field po-tential distribution itself, we analyzed its second spatial deriv-ative, the current source density (CSD) profile, because thisapproach eliminates effects of volume conduction and allowsmore direct interpretation of field potential oscillations in termsof the underlying synaptic activity in the local neuronal en-semble (Nicholson 1973; Schroeder et al. 1995). We introducea novel hypothesis about the “hierarchical” organization of EEGoscillations, the “oscillatory hierarchy hypothesis.” This hypoth-esis states that the amplitude of the oscillations at each character-istic frequency (gamma, theta, etc.) is modulated by the oscillatoryphase of a local lower frequency oscillation. We present evidencethat the phase of these spontaneous oscillations controls theexcitability of the local cortical neuronal ensembles and thusstrongly influences stimulus processing. Because the oscillatoryhierarchy can entrain to repetitive stimulation, ambient activitycan adapt so as to optimize the processing of rhythmic compo-nents present in many natural acoustic stimuli.
M E T H O D S
Surgery
Four male macaques (Maccaca mulatta), weighing 5–7 kg, wereprepared for chronic awake electrophysiological recording. All pro-
Address for reprint requests and other correspondence: C. E. Schroeder,Cognitive Neuroscience and Schizophrenia Program, Nathan Kline Inst.,Orangeburg, NY 10962 (E-mail: [email protected]).
The costs of publication of this article were defrayed in part by the paymentof page charges. The article must therefore be hereby marked “advertisement”in accordance with 18 U.S.C. Section 1734 solely to indicate this fact.
J Neurophysiol 94: 1904–1911, 2005.First published May 18, 2005; doi:10.1152/jn.00263.2005.
1904 www.jn.org
by guest on May 30, 2013
http://jn.physiology.org/D
ownloaded from
cedures were approved in advance by the Animal Care and UseCommittee of the Nathan Kline Institute. Before surgery, each animalwas adapted to a custom-fitted primate chair and to the recordingchamber. Surgery was performed under anesthesia (1–2% isoflou-rane), using standard aseptic surgical methods (Schroeder et al. 2001).The tissue overlying the calvarium was resected, and appropriateportions of the cranium were removed. The neocortex and overlyingdura were left intact. To allow electrode access to the brain and topromote an orderly pattern of sampling across the surface of theauditory cortices, matrices of 18-gauge stainless steel guide tubeswere placed over auditory cortex. These matrices were angled so thatthe electrode track would be perpendicular to the plane of auditorycortex, as determined by preimplant MRI (Schroeder et al. 1998).They were placed within small, appropriately shaped craniotomies, torest against the intact dura. The matrices, along with socketed Plexi-glas bars (permitting painless head restraint), were secured to the skullwith titanium orthopaedic screws and embedded in dental acrylic.
Electrophysiological recording
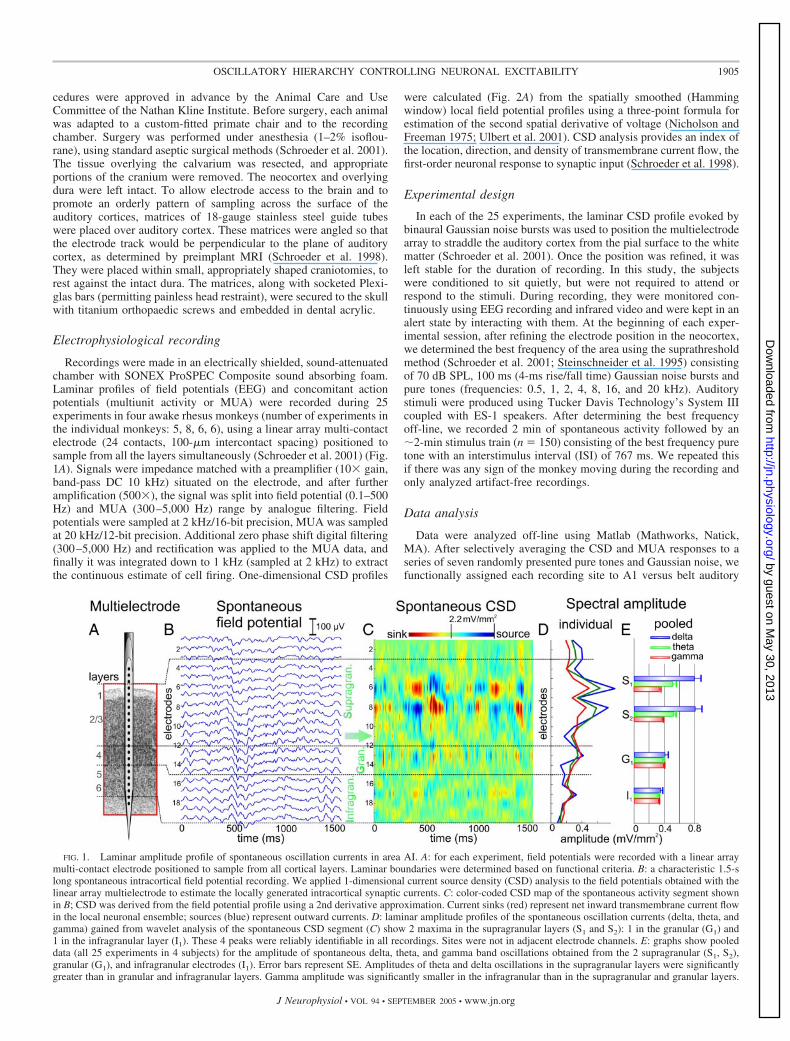
Recordings were made in an electrically shielded, sound-attenuatedchamber with SONEX ProSPEC Composite sound absorbing foam.Laminar profiles of field potentials (EEG) and concomitant actionpotentials (multiunit activity or MUA) were recorded during 25experiments in four awake rhesus monkeys (number of experiments inthe individual monkeys: 5, 8, 6, 6), using a linear array multi-contactelectrode (24 contacts, 100-�m intercontact spacing) positioned tosample from all the layers simultaneously (Schroeder et al. 2001) (Fig.1A). Signals were impedance matched with a preamplifier (10� gain,band-pass DC 10 kHz) situated on the electrode, and after furtheramplification (500�), the signal was split into field potential (0.1–500Hz) and MUA (300–5,000 Hz) range by analogue filtering. Fieldpotentials were sampled at 2 kHz/16-bit precision, MUA was sampledat 20 kHz/12-bit precision. Additional zero phase shift digital filtering(300–5,000 Hz) and rectification was applied to the MUA data, andfinally it was integrated down to 1 kHz (sampled at 2 kHz) to extractthe continuous estimate of cell firing. One-dimensional CSD profiles
were calculated (Fig. 2A) from the spatially smoothed (Hammingwindow) local field potential profiles using a three-point formula forestimation of the second spatial derivative of voltage (Nicholson andFreeman 1975; Ulbert et al. 2001). CSD analysis provides an index ofthe location, direction, and density of transmembrane current flow, thefirst-order neuronal response to synaptic input (Schroeder et al. 1998).
Experimental design
In each of the 25 experiments, the laminar CSD profile evoked bybinaural Gaussian noise bursts was used to position the multielectrodearray to straddle the auditory cortex from the pial surface to the whitematter (Schroeder et al. 2001). Once the position was refined, it wasleft stable for the duration of recording. In this study, the subjectswere conditioned to sit quietly, but were not required to attend orrespond to the stimuli. During recording, they were monitored con-tinuously using EEG recording and infrared video and were kept in analert state by interacting with them. At the beginning of each exper-imental session, after refining the electrode position in the neocortex,we determined the best frequency of the area using the suprathresholdmethod (Schroeder et al. 2001; Steinschneider et al. 1995) consistingof 70 dB SPL, 100 ms (4-ms rise/fall time) Gaussian noise bursts andpure tones (frequencies: 0.5, 1, 2, 4, 8, 16, and 20 kHz). Auditorystimuli were produced using Tucker Davis Technology’s System IIIcoupled with ES-1 speakers. After determining the best frequencyoff-line, we recorded 2 min of spontaneous activity followed by an�2-min stimulus train (n � 150) consisting of the best frequency puretone with an interstimulus interval (ISI) of 767 ms. We repeated thisif there was any sign of the monkey moving during the recording andonly analyzed artifact-free recordings.
Data analysis
Data were analyzed off-line using Matlab (Mathworks, Natick,MA). After selectively averaging the CSD and MUA responses to aseries of seven randomly presented pure tones and Gaussian noise, wefunctionally assigned each recording site to A1 versus belt auditory
FIG. 1. Laminar amplitude profile of spontaneous oscillation currents in area AI. A: for each experiment, field potentials were recorded with a linear arraymulti-contact electrode positioned to sample from all cortical layers. Laminar boundaries were determined based on functional criteria. B: a characteristic 1.5-slong spontaneous intracortical field potential recording. We applied 1-dimensional current source density (CSD) analysis to the field potentials obtained with thelinear array multielectrode to estimate the locally generated intracortical synaptic currents. C: color-coded CSD map of the spontaneous activity segment shownin B; CSD was derived from the field potential profile using a 2nd derivative approximation. Current sinks (red) represent net inward transmembrane current flowin the local neuronal ensemble; sources (blue) represent outward currents. D: laminar amplitude profiles of the spontaneous oscillation currents (delta, theta, andgamma) gained from wavelet analysis of the spontaneous CSD segment (C) show 2 maxima in the supragranular layers (S1 and S2): 1 in the granular (G1) and1 in the infragranular layer (I1). These 4 peaks were reliably identifiable in all recordings. Sites were not in adjacent electrode channels. E: graphs show pooleddata (all 25 experiments in 4 subjects) for the amplitude of spontaneous delta, theta, and gamma band oscillations obtained from the 2 supragranular (S1, S2),granular (G1), and infragranular electrodes (I1). Error bars represent SE. Amplitudes of theta and delta oscillations in the supragranular layers were significantlygreater than in granular and infragranular layers. Gamma amplitude was significantly smaller in the infragranular than in the supragranular and granular layers.
1905OSCILLATORY HIERARCHY CONTROLLING NEURONAL EXCITABILITY
J Neurophysiol • VOL 94 • SEPTEMBER 2005 • www.jn.org
by guest on May 30, 2013
http://jn.physiology.org/D
ownloaded from
cortex (Fu et al. 2004; Schroeder et al. 2001; Steinschneider et al.1995). In this study, only recordings obtained from area A1 were used.Our data set consisted of two parts: 1) 2-min spontaneous recordingsand 2) event-related responses evoked by a stimulus train (n � 150,ISI � 767 ms) of best frequency pure tones (also recorded continu-ously and epoched off-line from �2,000 to 2,000 ms to avoid edgeeffects of the wavelet transformation). For the analysis of spontaneousand event-related oscillations, instantaneous power and phase wereextracted by wavelet decomposition (Morlet wavelet) on 84 scales
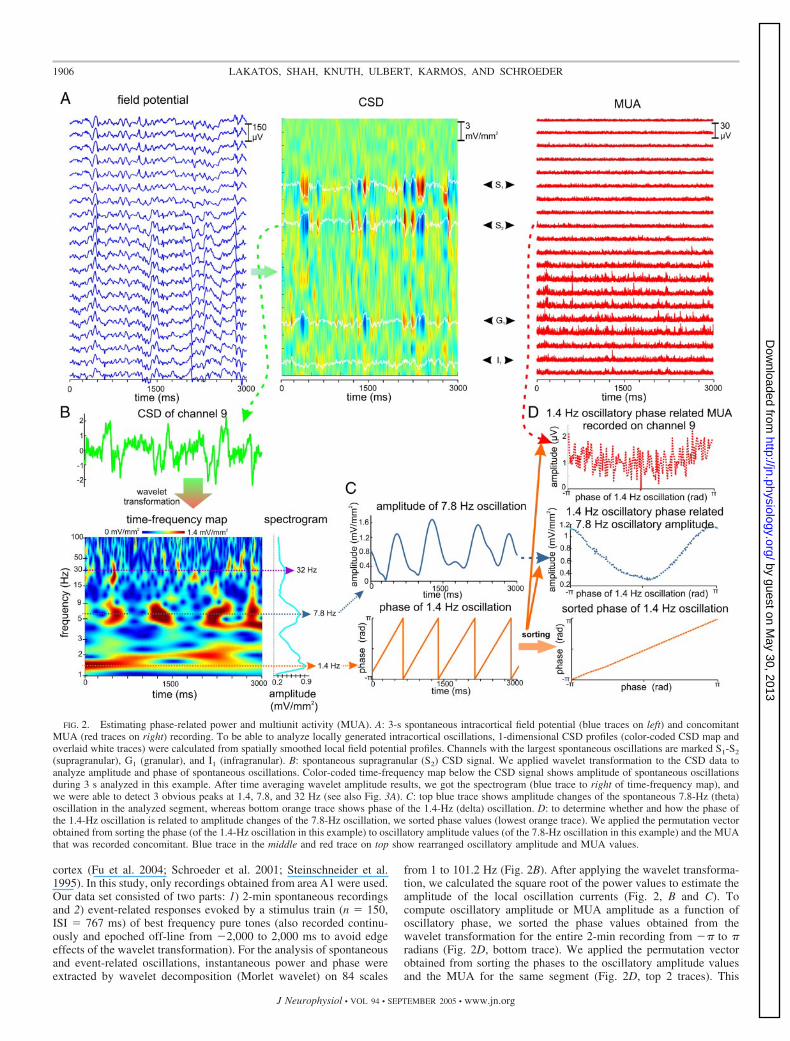
from 1 to 101.2 Hz (Fig. 2B). After applying the wavelet transforma-tion, we calculated the square root of the power values to estimate theamplitude of the local oscillation currents (Fig. 2, B and C). Tocompute oscillatory amplitude or MUA amplitude as a function ofoscillatory phase, we sorted the phase values obtained from thewavelet transformation for the entire 2-min recording from �� to �radians (Fig. 2D, bottom trace). We applied the permutation vectorobtained from sorting the phases to the oscillatory amplitude valuesand the MUA for the same segment (Fig. 2D, top 2 traces). This
FIG. 2. Estimating phase-related power and multiunit activity (MUA). A: 3-s spontaneous intracortical field potential (blue traces on left) and concomitantMUA (red traces on right) recording. To be able to analyze locally generated intracortical oscillations, 1-dimensional CSD profiles (color-coded CSD map andoverlaid white traces) were calculated from spatially smoothed local field potential profiles. Channels with the largest spontaneous oscillations are marked S1-S2
(supragranular), G1 (granular), and I1 (infragranular). B: spontaneous supragranular (S2) CSD signal. We applied wavelet transformation to the CSD data toanalyze amplitude and phase of spontaneous oscillations. Color-coded time-frequency map below the CSD signal shows amplitude of spontaneous oscillationsduring 3 s analyzed in this example. After time averaging wavelet amplitude results, we got the spectrogram (blue trace to right of time-frequency map), andwe were able to detect 3 obvious peaks at 1.4, 7.8, and 32 Hz (see also Fig. 3A). C: top blue trace shows amplitude changes of the spontaneous 7.8-Hz (theta)oscillation in the analyzed segment, whereas bottom orange trace shows phase of the 1.4-Hz (delta) oscillation. D: to determine whether and how the phase ofthe 1.4-Hz oscillation is related to amplitude changes of the 7.8-Hz oscillation, we sorted phase values (lowest orange trace). We applied the permutation vectorobtained from sorting the phase (of the 1.4-Hz oscillation in this example) to oscillatory amplitude values (of the 7.8-Hz oscillation in this example) and the MUAthat was recorded concomitant. Blue trace in the middle and red trace on top show rearranged oscillatory amplitude and MUA values.
1906 LAKATOS, SHAH, KNUTH, ULBERT, KARMOS, AND SCHROEDER
J Neurophysiol • VOL 94 • SEPTEMBER 2005 • www.jn.org
by guest on May 30, 2013
http://jn.physiology.org/D
ownloaded from
means we rearranged the oscillatory amplitude and MUA time seriesusing the data gained from sorting the phase values from �� to �radians. If, for example, the fifth data point is closest to �� in theoriginal phase series, in the rearranged phase series, it will be the first,and after applying the permutation vector gained from rearranging thephase values, the fifth point of the oscillatory amplitude time seriesand concomitant MUA will also be the first in the rearranged series.After rearranging, the data were down-sampled to 360 data points.
Pooled amplitude and frequency values were evaluated statisticallyby ANOVA. When significant changes were detected with ANOVA,multiple comparisons (Statistical Toolbox of Matlab) were used todetermine which pairs of means were significantly different. Phasevalues were analyzed by circular statistics methods. Pooled phaseswere compared using the Watson U2 test for circular data. Significantdeviation from uniform (random) phase distribution was tested withRayleigh’s uniformity test.
R E S U L T S
Laminar profile of spontaneous oscillations in area A1 of theauditory cortex
Spontaneous rhythmic activity was observed in all corticallayers, but four locations had higher amplitude oscillationsthan the surrounding ones (Fig. 1, D and E). Two of theselocations were in the supragranular layers (S1 and S2), one inthe granular layer (G1), and one in the infragranular layers (I1).For each penetration, these sites were identified empirically bynoting the peaks in the spontaneous oscillatory spectrum (Fig.1D). Across penetrations, mean distance was 324 �m betweenthe S1 and S2 (SD � 88), 488 �m between the S2 and G1(SD � 112), and 364 �m (SD � 86) between the G1 and I1electrodes. Subsequent analyses focused on these sites.
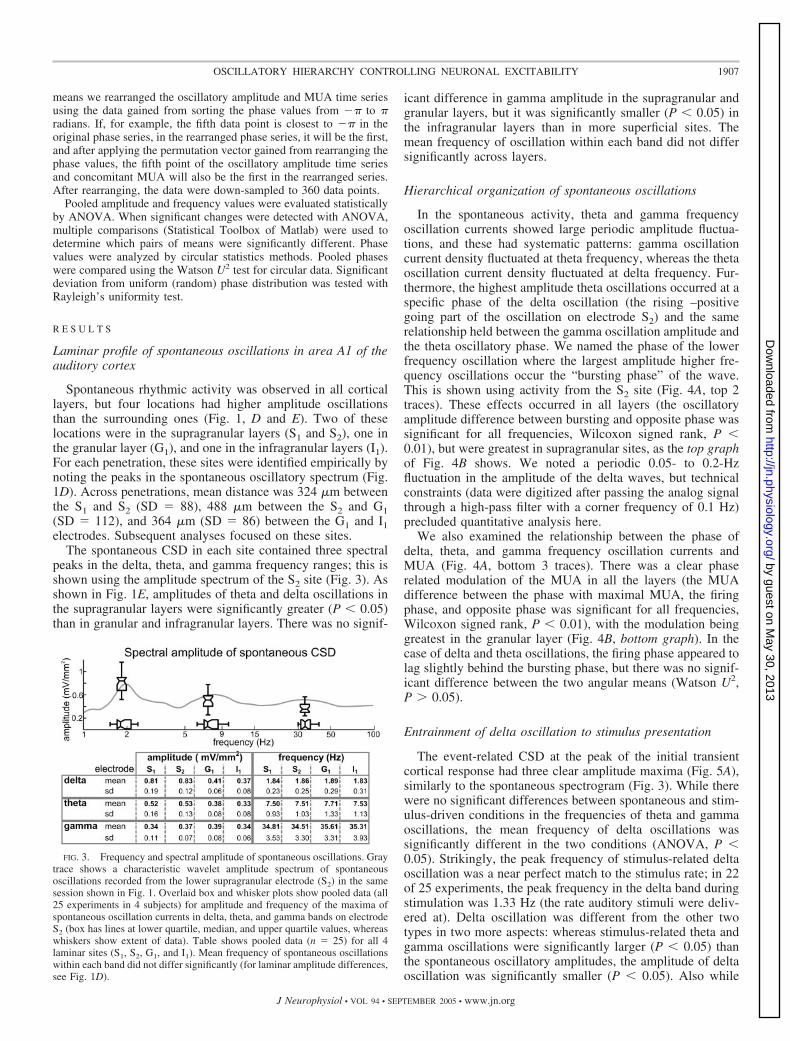
The spontaneous CSD in each site contained three spectralpeaks in the delta, theta, and gamma frequency ranges; this isshown using the amplitude spectrum of the S2 site (Fig. 3). Asshown in Fig. 1E, amplitudes of theta and delta oscillations inthe supragranular layers were significantly greater (P � 0.05)than in granular and infragranular layers. There was no signif-
icant difference in gamma amplitude in the supragranular andgranular layers, but it was significantly smaller (P � 0.05) inthe infragranular layers than in more superficial sites. Themean frequency of oscillation within each band did not differsignificantly across layers.
Hierarchical organization of spontaneous oscillations
In the spontaneous activity, theta and gamma frequencyoscillation currents showed large periodic amplitude fluctua-tions, and these had systematic patterns: gamma oscillationcurrent density fluctuated at theta frequency, whereas the thetaoscillation current density fluctuated at delta frequency. Fur-thermore, the highest amplitude theta oscillations occurred at aspecific phase of the delta oscillation (the rising –positivegoing part of the oscillation on electrode S2) and the samerelationship held between the gamma oscillation amplitude andthe theta oscillatory phase. We named the phase of the lowerfrequency oscillation where the largest amplitude higher fre-quency oscillations occur the “bursting phase” of the wave.This is shown using activity from the S2 site (Fig. 4A, top 2traces). These effects occurred in all layers (the oscillatoryamplitude difference between bursting and opposite phase wassignificant for all frequencies, Wilcoxon signed rank, P �0.01), but were greatest in supragranular sites, as the top graphof Fig. 4B shows. We noted a periodic 0.05- to 0.2-Hzfluctuation in the amplitude of the delta waves, but technicalconstraints (data were digitized after passing the analog signalthrough a high-pass filter with a corner frequency of 0.1 Hz)precluded quantitative analysis here.
We also examined the relationship between the phase ofdelta, theta, and gamma frequency oscillation currents andMUA (Fig. 4A, bottom 3 traces). There was a clear phaserelated modulation of the MUA in all the layers (the MUAdifference between the phase with maximal MUA, the firingphase, and opposite phase was significant for all frequencies,Wilcoxon signed rank, P � 0.01), with the modulation beinggreatest in the granular layer (Fig. 4B, bottom graph). In thecase of delta and theta oscillations, the firing phase appeared tolag slightly behind the bursting phase, but there was no signif-icant difference between the two angular means (Watson U2,P � 0.05).
Entrainment of delta oscillation to stimulus presentation
The event-related CSD at the peak of the initial transientcortical response had three clear amplitude maxima (Fig. 5A),similarly to the spontaneous spectrogram (Fig. 3). While therewere no significant differences between spontaneous and stim-ulus-driven conditions in the frequencies of theta and gammaoscillations, the mean frequency of delta oscillations wassignificantly different in the two conditions (ANOVA, P �0.05). Strikingly, the peak frequency of stimulus-related deltaoscillation was a near perfect match to the stimulus rate; in 22of 25 experiments, the peak frequency in the delta band duringstimulation was 1.33 Hz (the rate auditory stimuli were deliv-ered at). Delta oscillation was different from the other twotypes in two more aspects: whereas stimulus-related theta andgamma oscillations were significantly larger (P � 0.05) thanthe spontaneous oscillatory amplitudes, the amplitude of deltaoscillation was significantly smaller (P � 0.05). Also while
FIG. 3. Frequency and spectral amplitude of spontaneous oscillations. Graytrace shows a characteristic wavelet amplitude spectrum of spontaneousoscillations recorded from the lower supragranular electrode (S2) in the samesession shown in Fig. 1. Overlaid box and whisker plots show pooled data (all25 experiments in 4 subjects) for amplitude and frequency of the maxima ofspontaneous oscillation currents in delta, theta, and gamma bands on electrodeS2 (box has lines at lower quartile, median, and upper quartile values, whereaswhiskers show extent of data). Table shows pooled data (n � 25) for all 4laminar sites (S1, S2, G1, and I1). Mean frequency of spontaneous oscillationswithin each band did not differ significantly (for laminar amplitude differences,see Fig. 1D).
1907OSCILLATORY HIERARCHY CONTROLLING NEURONAL EXCITABILITY
J Neurophysiol • VOL 94 • SEPTEMBER 2005 • www.jn.org
by guest on May 30, 2013
http://jn.physiology.org/D
ownloaded from

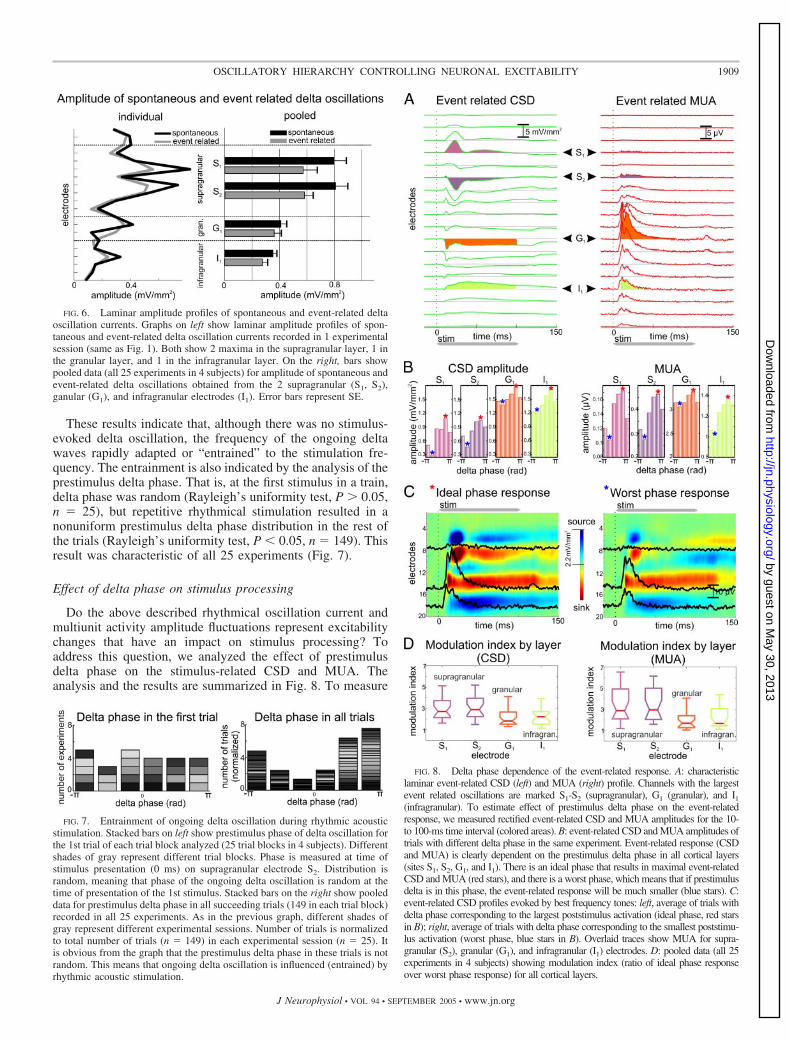
there was a clear pre- to poststimulus amplitude increase in thetheta and gamma range, the amplitude of the delta oscillationshowed no stimulus-related change (Fig. 5B). While the am-plitude and frequency of spontaneous and stimulus relateddelta oscillations were significantly different, there was nodifference in their laminar distribution (Fig. 6). This arguesagainst the general possibility that spontaneous and entraineddelta oscillations are generated by different neural elements.
FIG. 4. Oscillatory phase, oscillatory amplitude, and MUA relationships ofspontaneous oscillation currents. A: top 2 traces show delta phase-thetaamplitude and theta phase-gamma amplitude relationship in an individualexperiment. Three cycles are shown for illustration purposes. Oscillatoryamplitude is clearly modulated by lower frequency oscillatory phase. Burstingphase of the lower frequency oscillation is the phase with the maximal higherfrequency oscillation amplitude. For example, in the case of delta oscillation,it is the phase where the largest amplitude theta oscillations occur. Overlaidbox and whisker plot show pooled data for the bursting phase from all 25experiments in 4 subjects (box has lines at lower quartile, median, and upperquartile values, whereas whiskers show extent of data). Bottom 3 traces showmodulation of concomitant MUA by the phase of different frequency sponta-neous oscillations in an individual experiment (same as above). Firing phase isthe phase of the spontaneous oscillation currents during which cells are mostlikely to generate action potentials (largest MUA). Overlaid box and whiskerplots show pooled data for firing phase (n � 25). All data shown in figure wererecorded on the lower supragranular (S2) electrode, but table shows pooleddata (n � 25) for bursting and firing phases for all sites (S1, S2, G1, and I1). B:phase-dependent oscillation current and MUA modulation in the supragranular(S1, S2), granular (G), and infragranular (I) layers. Top box and whisker plotsshow pooled delta (left) oscillatory phase-dependent theta AM ratio and pooledtheta (right) oscillatory phase-dependent gamma AM ratio. Bottom plots showpooled delta (left), theta (middle), and gamma (right) oscillatory phase-dependent MUA modulation ratio. Ratios were calculated as (mean amplitudeof phase modulated oscillation currents/MUA in the pi/3 radian phase intervalcentered on the bursting/firing phase)/(mean amplitude of phase modulatedoscillation currents/MUA in the pi/3 radian phase interval opposite to thebursting/firing phase). Whereas the phase-related oscillation current modula-tion is largest in the supragranular layers, phase-related MUA modulation islargest in the granular layer.
FIG. 5. Frequency and spectral amplitude of event-related oscillations. A:gray trace shows wavelet amplitude spectrum of stimulus-related CSD at thelower supragranular site (S2) 30 ms poststimulus in the same experiment forwhich the spontaneous spectrum was shown in Fig. 3. Box and whisker plotsshow pooled data (all 25 experiments in 4 subjects) for amplitude maxima andfrequency of event-related oscillation currents in delta, theta, and gammabands. Outliers are marked by a red cross. B: pooled (n � 25) single trialwavelet amplitude data show time-course of event-related oscillation ampli-tudes. Note that, whereas theta and gamma oscillation currents show stimulus-related increase, there is no change in amplitude of the ongoing delta oscilla-tion. Apparent prestimulus oscillatory amplitude increase in theta and gammabands is a side effect of temporal smearing caused by wavelet transformation.
1908 LAKATOS, SHAH, KNUTH, ULBERT, KARMOS, AND SCHROEDER
J Neurophysiol • VOL 94 • SEPTEMBER 2005 • www.jn.org
by guest on May 30, 2013
http://jn.physiology.org/D
ownloaded from
These results indicate that, although there was no stimulus-evoked delta oscillation, the frequency of the ongoing deltawaves rapidly adapted or “entrained” to the stimulation fre-quency. The entrainment is also indicated by the analysis of theprestimulus delta phase. That is, at the first stimulus in a train,delta phase was random (Rayleigh’s uniformity test, P � 0.05,n � 25), but repetitive rhythmical stimulation resulted in anonuniform prestimulus delta phase distribution in the rest ofthe trials (Rayleigh’s uniformity test, P � 0.05, n � 149). Thisresult was characteristic of all 25 experiments (Fig. 7).
Effect of delta phase on stimulus processing
Do the above described rhythmical oscillation current andmultiunit activity amplitude fluctuations represent excitabilitychanges that have an impact on stimulus processing? Toaddress this question, we analyzed the effect of prestimulusdelta phase on the stimulus-related CSD and MUA. Theanalysis and the results are summarized in Fig. 8. To measure
FIG. 6. Laminar amplitude profiles of spontaneous and event-related deltaoscillation currents. Graphs on left show laminar amplitude profiles of spon-taneous and event-related delta oscillation currents recorded in 1 experimentalsession (same as Fig. 1). Both show 2 maxima in the supragranular layer, 1 inthe granular layer, and 1 in the infragranular layer. On the right, bars showpooled data (all 25 experiments in 4 subjects) for amplitude of spontaneous andevent-related delta oscillations obtained from the 2 supragranular (S1, S2),ganular (G1), and infragranular electrodes (I1). Error bars represent SE.
FIG. 7. Entrainment of ongoing delta oscillation during rhythmic acousticstimulation. Stacked bars on left show prestimulus phase of delta oscillation forthe 1st trial of each trial block analyzed (25 trial blocks in 4 subjects). Differentshades of gray represent different trial blocks. Phase is measured at time ofstimulus presentation (0 ms) on supragranular electrode S2. Distribution israndom, meaning that phase of the ongoing delta oscillation is random at thetime of presentation of the 1st stimulus. Stacked bars on the right show pooleddata for prestimulus delta phase in all succeeding trials (149 in each trial block)recorded in all 25 experiments. As in the previous graph, different shades ofgray represent different experimental sessions. Number of trials is normalizedto total number of trials (n � 149) in each experimental session (n � 25). Itis obvious from the graph that the prestimulus delta phase in these trials is notrandom. This means that ongoing delta oscillation is influenced (entrained) byrhythmic acoustic stimulation.
FIG. 8. Delta phase dependence of the event-related response. A: characteristiclaminar event-related CSD (left) and MUA (right) profile. Channels with the largestevent related oscillations are marked S1-S2 (supragranular), G1 (granular), and I1(infragranular). To estimate effect of prestimulus delta phase on the event-relatedresponse, we measured rectified event-related CSD and MUA amplitudes for the 10-to 100-ms time interval (colored areas). B: event-related CSD and MUA amplitudes oftrials with different delta phase in the same experiment. Event-related response (CSDand MUA) is clearly dependent on the prestimulus delta phase in all cortical layers(sites S1, S2, G1, and I1). There is an ideal phase that results in maximal event-relatedCSD and MUA (red stars), and there is a worst phase, which means that if prestimulusdelta is in this phase, the event-related response will be much smaller (blue stars). C:event-related CSD profiles evoked by best frequency tones: left, average of trials withdelta phase corresponding to the largest poststimulus activation (ideal phase, red starsin B); right, average of trials with delta phase corresponding to the smallest poststimu-lus activation (worst phase, blue stars in B). Overlaid traces show MUA for supra-granular (S2), granular (G1), and infragranular (I1) electrodes. D: pooled data (all 25experiments in 4 subjects) showing modulation index (ratio of ideal phase responseover worst phase response) for all cortical layers.
1909OSCILLATORY HIERARCHY CONTROLLING NEURONAL EXCITABILITY
J Neurophysiol • VOL 94 • SEPTEMBER 2005 • www.jn.org
by guest on May 30, 2013
http://jn.physiology.org/D
ownloaded from

the influence of the prestimulus delta phase on the single trialevent-related responses, we created two variables for eachindividual trial. These were the rectified CSD and the MUAamplitudes in the 10- (response onset) to 100-ms (offset of theauditory stimulus) poststimulus interval (Fig. 8A). We foundthat the amplitude of the evoked response is influenced by thephase of ongoing delta oscillation. This is shown in two waysfor a single experiment in Fig. 8. Figure 8B shows the distri-bution of single trial response amplitudes (CSD, left; MUA,right) as a function of delta phase. Delta phase was systemat-ically related to stimulus-evoked response amplitude in all thecortical layers, with the modulation being largest in the supra-granular layers (Fig. 8D). Figure 8C shows the laminar profileof response (CSD with superimposed MUA) to a pure tone,averaged across trials with ideal prestimulus delta phase (left)and worst prestimulus delta phase (right).
The ideal prestimulus phase, which resulted in the largestevent related activation (� mean � 1.98 rad, � dev � 0.88)was counter-phase to the worst phase, which resulted in thesmallest event related CSD and MUA (� mean � �1.54 rad,� dev � 1.09). Statistical comparison of the ideal phase to thespontaneous bursting phase across all experiments revealed nosignificant difference (Watson U2, P � 0.05). This fits with theidea that the bursting phase of the spontaneous oscillationsrepresents increased excitability.
Effects were quantified across experiments using a modula-tion index (amplitude in ideal phase trials/amplitude in worstphase trials; Fig. 8D). Laminar differences in delta phasedependence are noteworthy. The extreme extent of delta phasedependence in the superficial layers indicates that processing inthese layers is determined largely by “context,” that is, theinstantaneous cortical state (in terms of frequency, amplitude,and phase of ongoing activity) in which inputs arrive.
D I S C U S S I O N
An early hypothesis (Bishop 1933) suggested that spontane-ous EEG reflects rhythmic variation of cortical excitability.Although the relationship of the EEG to neuronal activity wasrelatively neglected over the intervening years, recent studieshave rekindled interest in this topic. Intracellular recordings incarnivores provided a striking demonstration of neuronal mem-brane potentials undergoing slow rhythmic shifts betweendepolarized and hyperpolarized states during slow wave sleep(Sanchez-Vives and McCormick 2000; Steriade et al. 1993).Other recent findings have pointed to an underlying structure tothe EEG spectrum. As mentioned above 1) in humans, cats,and rats, higher frequency oscillations display amplitude fluc-tuations with periodicity matching that of lower frequencyoscillations (Amzica and Steriade 1998; Freeman and Rogers2002; Lakatos et al. 2004; Steriade et al. 1996; Vanhatalo et al.2004); 2) moreover, dependence of gamma oscillation ampli-tude on theta oscillatory phase is well characterized in rodenthippocampus (Bragin et al. 1995; Buzsaki et al. 2003; Csics-vari et al. 2003) and entorhinal cortex (Chrobak and Buzsaki1998; Cunningham et al. 2003), and 3) there is gatheringevidence that ongoing cortical activity has an effect on sensoryprocessing (Arieli et al. 1996; Fiser et al. 2004; Fries et al.2001a; Jansen and Brandt 1991; Kisley and Gerstein 1999;Kruglikov and Schiff 2003; Massimini et al. 2003; Polich1997).
This study provides a way to organize these importantfindings. First, we show that there is a hierarchical structure tothe EEG, with amplitude at each oscillatory frequency beingmodulated by the phase of a lower frequency oscillation. Thisstructure seems to extend from slow waves up through thegamma frequencies, although technical constraints in this studyprecluded quantitative assessment of the interrelationship ofdelta and very slow oscillations. Earlier findings from intracel-lular recordings in vitro suggest that layer 5 pyramidal cellsplay a key role in organizing and promoting slow oscillationsin cortical neurons (Sanchez-Vives and McCormick 2000).The fact that, in our recordings, delta and theta oscillations areby far largest in the supragranular layers suggests that thepyramidal neuron ensembles there are also important in con-trolled cortical processing. The relationship between thesefindings remains to be established.
A second key aspect of our findings is that like the slowoscillation, the higher frequency oscillations reflect concertedexcitability variations in cortical ensembles. This is reflected inlocal neuronal firing (MUA), which is clearly related to thephase of delta, theta, and gamma oscillations.
Finally, we confirm that ambient oscillatory activity hassignificant effects on stimulus processing (i.e., stimulus-relatedactivity), in that, for each band of oscillation, there are bothideal and worst phases, during which stimulus responsivenessis enhanced or suppressed. The facts that spontaneous andevent-related oscillations occur in the same frequency bands,are both phasic, and have similar laminar distributions impliesthat they use the same neural circuitry. However, whether theoscillatory hierarchy present in spontaneous activity is pre-served in stimulus-related activity remains an important ques-tion for future studies.
Our findings have important implications for cortical pro-cessing of natural acoustic stimuli. While stimulus processingclearly is structured by the ambient context (Arieli et al. 1996),the onset of a sound can instantly reset the phase of the ambientdelta oscillation, which effectively phase-locks the entire hier-archical structure of oscillatory activity to the stimulus. Thuseffects of ambient activity on cortical processing should bemore dramatic for more complex rhythmic inputs that aretypical of a natural environment. For example, resetting of theambient oscillatory hierarchy should be enormously useful inprocessing sounds that occur with a period of 1–4 Hz and haverelatively phase-locked, rhythmic components at 4–10 (theta)and 30–50 Hz (gamma). It so happens that for primates,including humans, the temporal structure of numerous biolog-ically relevant stimuli (Singh and Theunissen 2003), especiallyvocalizations (Shannon et al. 1995; Wang et al. 1995), fit thispattern remarkably well.
A C K N O W L E D G M E N T S
We thank Dr. Gyorgy Buzsaki and his laboratory for helpful discussions ofmethods and theory, Drs. Zsuzsa Pincze and Csaba Rajkai for helpful com-ments on an earlier version of the manuscript, T. McGinnis, M. O’Connell, andA. Mills for invaluable assistance in collecting the data, and an anonymousreferee for extremely valuable comments during the review process.
R E F E R E N C E S
Amzica F and Steriade M. Cellular substrates and laminar profile of sleepK-complex. Neuroscience 82: 671–686, 1998.
Arieli A, Sterkin A, Grinvald A, and Aertsen A. Dynamics of ongoingactivity: explanation of the large variability in evoked cortical responses.Science 273: 1868–1871, 1996.
1910 LAKATOS, SHAH, KNUTH, ULBERT, KARMOS, AND SCHROEDER
J Neurophysiol • VOL 94 • SEPTEMBER 2005 • www.jn.org
by guest on May 30, 2013
http://jn.physiology.org/D
ownloaded from
Berger H. Uber das Elektrenkephalogramm des Menschen. Arch F Psychiat.87: 527–570, 1929.
Bertrand O and Tallon-Baudry C. Oscillatory gamma activity in humans: apossible role for object representation. Int J Psychophysiol 38: 211–223,2000.
Bishop G. Cyclic changes in excitability of the optic pathway of the rabbit.Am J Physiol 103: 213–224, 1933.
Bragin A, Jando G, Nadasdy Z, Hetke J, Wise K, and Buzsaki G. Gamma(40–100 Hz) oscillation in the hippocampus of the behaving rat. J Neurosci15: 47–60, 1995.
Buzsaki G, Buhl DL, Harris KD, Csicsvari J, Czeh B, and Morozov A.Hippocampal network patterns of activity in the mouse. Neuroscience 116:201–211, 2003.
Buzsaki G and Draguhn A. Neuronal oscillations in cortical networks.Science 304: 1926–1929, 2004.
Chrobak JJ and Buzsaki G. Gamma oscillations in the entorhinal cortex ofthe freely behaving rat. J Neurosci 18: 388–398, 1998.
Chrobak JJ, Lorincz A, and Buzsaki G. Physiological patterns in thehippocampo-entorhinal cortex system. Hippocampus 10: 457–465, 2000.
Contreras D, Timofeev I, and Steriade M. Mechanisms of long-lastinghyperpolarizations underlying slow sleep oscillations in cat corticothalamicnetworks. J Physiol 494: 251–264, 1996.
Csicsvari J, Jamieson B, Wise KD, and Buzsaki G. Mechanisms of gammaoscillations in the hippocampus of the behaving rat. Neuron 37: 311–322,2003.
Cunningham MO, Davies CH, Buhl EH, Kopell N, and Whittington MA.Gamma oscillations induced by kainate receptor activation in the entorhinalcortex in vitro. J Neurosci 23: 9761–9769, 2003.
Engel AK, Fries P, and Singer W. Dynamic predictions: oscillations andsynchrony in top-down processing. Nat Rev Neurosci 2: 704–716, 2001.
Fiser J, Chiu C, and Weliky M. Small modulation of ongoing corticaldynamics by sensory input during natural vision. Nature 431: 573–578,2004.
Freeman WJ and Rogers LJ. Fine temporal resolution of analytic phasereveals episodic synchronization by state transitions in gamma EEGs.J Neurophysiol 87: 937–945, 2002.
Fries P, Neuenschwander S, Engel AK, Goebel R, and Singer W. Rapidfeature selective neuronal synchronization through correlated latency shift-ing. Nat Neurosci 4: 194–200, 2001a.
Fries P, Reynolds JH, Rorie AE, and Desimone R. Modulation of oscillatoryneuronal synchronization by selective visual attention. Science 291: 1560–1563, 2001b.
Fu KM, Shah AS, O’Connell MN, McGinnis T, Eckholdt H, Lakatos P,Smiley J, and Schroeder CE. Timing and laminar profile of eye-positioneffects on auditory responses in primate auditory cortex. J Neurophysiol 92:3522–3531, 2004.
Jansen BH and Brandt ME. The effect of the phase of prestimulus alphaactivity on the averaged visual evoked response. Electroencephalogr ClinNeurophysiol 80: 241–250, 1991.
Kahana MJ, Seelig D, and Madsen JR. Theta returns. Curr Opin Neurobiol11: 739–744, 2001.
Kisley MA and Gerstein GL. Trial-to-trial variability and state-dependentmodulation of auditory-evoked responses in cortex. J Neurosci 19: 10451–10460, 1999.
Kruglikov SY and Schiff SJ. Interplay of electroencephalogram phase andauditory-evoked neural activity. J Neurosci 23: 10122–10127, 2003.
Lakatos P, Szilagyi N, Pincze Z, Rajkai C, Ulbert I, and Karmos G.Attention and arousal related modulation of spontaneous gamma-activity inthe auditory cortex of the cat. Brain Res Cogn Brain Res 19: 1–9, 2004.
Makeig S, Debener S, Onton J, and Delorme A. Mining event-related braindynamics. Trends Cogn Sci 8: 204–210, 2004.
Massimini M, Rosanova M, and Mariotti M. EEG slow (approximately 1Hz) waves are associated with nonstationarity of thalamo-cortical sensoryprocessing in the sleeping human. J Neurophysiol 89: 1205–1213, 2003.
Nicholson C. Theoretical analysis of field potentials in anisotropic ensemblesof neuronal elements. IEEE Trans Biomed Eng 20: 278–288, 1973.
Nicholson C and Freeman JA. Theory of current source-density analysis anddetermination of conductivity tensor for anuran cerebellum. J Neurophysiol38: 356–368, 1975.
Polich J. On the relationship between EEG and P300: individual differences,aging, and ultradian rhythms. Int J Psychophysiol 26: 299–317, 1997.
Sanchez-Vives MV and McCormick DA. Cellular and network mechanismsof rhythmic recurrent activity in neocortex. Nat Neurosci 3: 1027–1034,2000.
Schroeder CE, Lindsley RW, Specht C, Marcovici A, Smiley JF, andJavitt DC. Somatosensory input to auditory association cortex in themacaque monkey. J Neurophysiol 85: 1322–1327, 2001.
Schroeder CE, Mehta AD, and Givre SJ. A spatiotemporal profile of visualsystem activation revealed by current source density analysis in the awakemacaque. Cereb Cortex 8: 575–592, 1998.
Schroeder CE, Steinschneider M, Javitt DC, Tenke CE, Givre SJ, MehtaAD, Simpson GV, Arezzo JC, and Vaughan HG Jr. Localization of ERPgenerators and identification of underlying neural processes. Electroen-cephalogr Clin Neurophysiol Suppl 44: 55–75, 1995.
Shannon RV, Zeng FG, Kamath V, Wygonski J, and Ekelid M. Speechrecognition with primarily temporal cues. Science 270: 303–304, 1995.
Singer W and Gray CM. Visual feature integration and the temporal corre-lation hypothesis. Annu Rev Neurosci 18: 555–586, 1995.
Singh NC and Theunissen FE. Modulation spectra of natural sounds andethological theories of auditory processing. J Acoust Soc Am 114: 3394–3411, 2003.
Steinschneider M, Reser D, Schroeder CE, and Arezzo JC. Tonotopicorganization of responses reflecting stop consonant place of articulation inprimary auditory cortex (A1) of the monkey. Brain Res 674: 147–152, 1995.
Steriade M, Contreras D, Amzica F, and Timofeev I. Synchronization offast (30–40 Hz) spontaneous oscillations in intrathalamic and thalamocor-tical networks. J Neurosci 16: 2788–2808, 1996.
Steriade M, Nunez A, and Amzica F. A novel slow (� 1 Hz) oscillation ofneocortical neurons in vivo: depolarizing and hyperpolarizing components.J Neurosci 13: 3252–3265, 1993.
Truccolo WA, Ding M, Knuth KH, Nakamura R, and Bressler SL.Trial-to-trial variability of cortical evoked responses: implications for theanalysis of functional connectivity. Clin Neurophysiol 113: 206–226, 2002.
Ulbert I, Halgren E, Heit G, and Karmos G. Multiple microelectrode-recording system for human intracortical applications. J Neurosci Methods106: 69–79, 2001.
Vanhatalo S, Palva JM, Holmes MD, Miller JW, Voipio J, and Kaila K.Infraslow oscillations modulate excitability and interictal epileptic activityin the human cortex during sleep. Proc Natl Acad Sci USA 101: 5053–5057,2004.
Wang X, Merzenich MM, Beitel R, and Schreiner CE. Representation of aspecies-specific vocalization in the primary auditory cortex of the commonmarmoset: temporal and spectral characteristics. J Neurophysiol 74: 2685–2706, 1995.
Worden MS, Foxe JJ, Wang N, and Simpson GV. Anticipatory biasing ofvisuospatial attention indexed by retinotopically specific alpha-band elec-troencephalography increases over occipital cortex. J Neurosci 20: RC63,2000.
1911OSCILLATORY HIERARCHY CONTROLLING NEURONAL EXCITABILITY
J Neurophysiol • VOL 94 • SEPTEMBER 2005 • www.jn.org
by guest on May 30, 2013
http://jn.physiology.org/D
ownloaded from