Frequency-dependence of Myocardial Energetics in Failing Human Myocardium as Quantified by a New...
12
J Mol Cell Cardiol 30, 1459–1470 (1998) Article No. mc980706 Feature Article Frequency-dependence of Myocardial Energetics in Failing Human Myocardium as Quantified by a New Method for the Measurement of Oxygen Consumption in Muscle Strip Preparations Markus Meyer, Boris Keweloh, Konrad Gu ¨ th 1 , Jeffrey W. Holmes 2 , Burkert Pieske, Stephan E. Lehnart, Hanjo ¨rg Just and Gerd Hasenfuss Medizinische Klinik, Abteilung fu ¨r Kardiologie und Angiologie, Universita ¨t Freiburg, Germany; 1 Scientific Instruments, Heidelberg, Germany; 2 Department of Bioengineering, University of California, San Diego, USA (Received 3 December 1997, accepted in revised form 9 April 1998) M. M, B. K, K. G ¨ , J. W. H, B. P, S. E. L, H. J G. H. Frequency- dependence of Myocardial Energetics in Failing Human Myocardium as Quantified by a New Method for the Measurement of Oxygen Consumption in Muscle Strip Preparations. Journal of Molecular and Cellular Cardiology (1998) 30, 1459–1470. Diastolic dysfunction at high heart rates may be associated with increased myocardial energy consumption. Frequency-dependent changes of isometric force and oxygen consumption (MVO 2 ) were investigated in strip preparations from endstage failing human hearts exhibiting various degrees of diastolic dysfunction. MVO 2 was determined by a new method which was validated. When stimulation rate was increased from 40 to 200 min -1 (n=7), developed force decreased from 16.5±4.3 to 7.9±2.9 mN/mm 2 (P<0.01), diastolic force increased from 15.9±3.2 to 22.0±3.0 mN/mm 2 (P<0.01), and total MVO 2 increased from 2.6±0.6 to 4.7±0.9 ml/min/100 g (P<0.025). Resting MVO 2 and resting force were 1.8±0.4 ml/min/100 g and 15.9±3.0 mN/mm 2 , respectively. After addition of 30 m 2,3-butanedione monoxime (BDM) to inhibit cross- bridges, resting MVO 2 and resting force decreased by 46% (P<0.05) and 15% (P<0.01), respectively, indicating the presence of active force generation in unstimulated failing human myocardium. In each muscle preparation, there was a significant correlation between force-time integral (FTI) and total MVO 2 (r=0.96±0.01). The strength of these correlations did not vary with the contribution of diastolic FTI to total FTI. The ratio of activity related MVO 2 to developed FTI, an inverse index of the economy of contraction, increased depending on the rise of diastolic FTI at higher stimulation rates. In conclusion, in failing human myocardium, diastolic force development is occurring at the same energy expenditure as systolic force generation. Therefore, in muscle preparations with disturbed diastolic function economy of contraction decreases with higher stimulation rates, depending on the rise of diastolic force. 1998 Academic Press K W: Diastolic function; Heart failure; Cross-bridge cycling; Force-frequency relation; Myocardial oxygen consumption. Please address all correspondence to: Prof. Dr Gerd Hasenfuss, Abt. Kardiologie und Pneumologie, Klinikum Georg-August-Universita ¨t, Zentrum Innere Medizin, Robert-Koch-Straße 40, 37075 Go ¨ttingen, Germany. 0022–2828/98/081459+12 $30.00/0 1998 Academic Press
-
Upload
independent -
Category
Documents
-
view
1 -
download
0
Transcript of Frequency-dependence of Myocardial Energetics in Failing Human Myocardium as Quantified by a New...

J Mol Cell Cardiol 30, 1459–1470 (1998)Article No. mc980706
Feature Article
Frequency-dependence of MyocardialEnergetics in Failing Human Myocardiumas Quantified by a New Method for theMeasurement of Oxygen Consumption inMuscle Strip PreparationsMarkus Meyer, Boris Keweloh, Konrad Guth1, Jeffrey W. Holmes2, BurkertPieske, Stephan E. Lehnart, Hanjorg Just and Gerd HasenfussMedizinische Klinik, Abteilung fur Kardiologie und Angiologie, Universitat Freiburg, Germany;1Scientific Instruments, Heidelberg, Germany; 2Department of Bioengineering, University of California,San Diego, USA
(Received 3 December 1997, accepted in revised form 9 April 1998)
M. M, B. K, K. G, J. W. H, B. P, S. E. L, H. J G. H. Frequency-dependence of Myocardial Energetics in Failing Human Myocardium as Quantified by a New Method for theMeasurement of Oxygen Consumption in Muscle Strip Preparations. Journal of Molecular and Cellular Cardiology(1998) 30, 1459–1470. Diastolic dysfunction at high heart rates may be associated with increased myocardialenergy consumption. Frequency-dependent changes of isometric force and oxygen consumption (MVO2) wereinvestigated in strip preparations from endstage failing human hearts exhibiting various degrees of diastolicdysfunction. MVO2 was determined by a new method which was validated. When stimulation rate was increasedfrom 40 to 200 min−1 (n=7), developed force decreased from 16.5±4.3 to 7.9±2.9 mN/mm2 (P<0.01), diastolicforce increased from 15.9±3.2 to 22.0±3.0 mN/mm2 (P<0.01), and total MVO2 increased from 2.6±0.6 to4.7±0.9 ml/min/100 g (P<0.025). Resting MVO2 and resting force were 1.8±0.4 ml/min/100 g and15.9±3.0 mN/mm2, respectively. After addition of 30 m 2,3-butanedione monoxime (BDM) to inhibit cross-bridges, resting MVO2 and resting force decreased by 46% (P<0.05) and 15% (P<0.01), respectively, indicatingthe presence of active force generation in unstimulated failing human myocardium.
In each muscle preparation, there was a significant correlation between force-time integral (FTI) and totalMVO2 (r=0.96±0.01). The strength of these correlations did not vary with the contribution of diastolic FTI tototal FTI. The ratio of activity related MVO2 to developed FTI, an inverse index of the economy of contraction,increased depending on the rise of diastolic FTI at higher stimulation rates.
In conclusion, in failing human myocardium, diastolic force development is occurring at the same energyexpenditure as systolic force generation. Therefore, in muscle preparations with disturbed diastolic functioneconomy of contraction decreases with higher stimulation rates, depending on the rise of diastolic force.
1998 Academic Press
K W: Diastolic function; Heart failure; Cross-bridge cycling; Force-frequency relation; Myocardialoxygen consumption.
Please address all correspondence to: Prof. Dr Gerd Hasenfuss, Abt. Kardiologie und Pneumologie, Klinikum Georg-August-Universitat,Zentrum Innere Medizin, Robert-Koch-Straße 40, 37075 Gottingen, Germany.
0022–2828/98/081459+12 $30.00/0 1998 Academic Press

M. Meyer et al.1460
developed that allows fast measurements of MVO2Introductionand enables recognition of inadequate oxygenationof the muscle preparations. The new method isAn increase in contractile force induced by elevation
of frequency of stimulation is an important regu- termed the “diffusion method” with reference tothe Fick law of diffusion, and is based on thelatory mechanism for performance of ventricular
myocardium in most animal species (Bowditch, measurement of oxygen concentration transientsclose to the surface of the muscle preparation.1871; Wohlfart and Noble, 1982). The existence
of a positive force–frequency relation has been dem- Validation of the method was performed by com-parison with a conventional closed chamber systemonstrated in the non-failing human heart under in
vitro and in vivo conditions (Feldman et al., 1988a; (Lee, 1960; McDonald, 1966).Mulieri et al., 1992; Hasenfuss et al., 1994a). Incontrast, in the failing human heart frequencypotentiation of contractile force was shown to be Materials and Methodsblunted or inverse (Feldman et al., 1988a, 1988b;Gwathmey et al., 1990; Mulieri et al., 1992; Hasen-
Patientsfuss et al., 1994a). Alteration of the force–frequencyrelation in failing human myocardium was shown
Validation of the diffusion method was performedto result primarily from a decreased systolic forcein human left-ventricular myocardium obtainedgeneration at higher stimulation frequencies (Mu-from 15 patients with end-stage failing cardio-lieri et al., 1992). However, in most muscle pre-myopathy (four with ischemic cardiomyopathy andparations, an increase in diastolic force development11 with dilated cardiomyopathy) who underwenthas also been observed in the upper frequencycardiac transplantation. Twelve patients were malerange (Hasenfuss et al., 1994b). At a molecularand three were female. Mean age of the patients waslevel, alteration of the force–frequency relation may57±2 years. Mean ejection fraction was 24±1%.result from reduced expression or activity of sar-Frequency-dependence of myocardial energeticscoplasmic reticulum Ca2+-ATPase (Hasenfuss et al.,was investigated in left-ventricular myocardium1994b; Studer et al., 1994; Meyer et al., 1995),from seven additional hearts with end-stage dilatedwhich in turn may lead to decreased calcium se-cardiomyopathy. The clinical characteristics ofquestration by the sarcoplasmic reticulum (SR) atthese patients are given in Table 1. The study washigher stimulation rates. Accordingly, decreasedreviewed and approved by the Ethics Committee offorce generation at higher stimulation rates wasthe University Clinics of Freiburg.suggested to result from decreased calcium release
from the SR, while the rise of diastolic force may beexplained by an accumulation of cytosolic calcium(Hasenfuss et al., 1994b). Under those cir- Muscle preparation and mechanical parameterscumstances, active cross-bridge cycling underlyingthe rise of diastolic force in the upper frequency Immediately after cardiectomy, a portion of the left-
ventricular free wall was excised and submerged inrange may be associated with considerable energycosts if the stoichiometry of energy consumption to oxygenated cardioplegic solution containing
(mmol/l): Na+ 152, K+ 3.6, Cl− 135, HCO3− 25,myocardial performance is similar during systolic
and diastolic force generation. H2PO4− 1.3, SO4
2− 0.6, Mg2+ 0.6, Ca2+ 2.5, glucose11.2, 2,3-butanedione monoxime 30 and 10 IU/lIt was the goal of the present study to investigate
frequency-dependence of myocardial energetics in insulin. Preparation of the excised myocardium wasperformed as described previously (Mulieri et al.,failing human myocardium exhibiting disturbed
diastolic function at higher frequencies. In par- 1989; Hasenfuss et al., 1992).The muscle preparations were transferred to theticular, we were interested in the energy costs of
diastolic force development. Because in myocardial muscle chamber containing oxygenated Krebs–Ringer solution at 37°C (95% O2, 5% CO2) andtissue recovery metabolism occurs almost ex-
clusively under aerobic conditions (Challoner, fixed between two steel clamps. After wash-out ofthe protective solution, the muscle preparation was1968), oxygen consumption (MVO2) was chosen
as an index for myocardial energy turnover (Rohde, stimulated 25% above threshold voltage with aduration of 5 ms at a stimulation frequency of1912; Evans and Matsuko, 1915). A prerequisite
of these studies is adequate oxygenation of the 60 min−1. After an equilibration period of 30 min,the muscle was stretched gradually (0.05–0.1 mmentire muscle cross-section even at the highest
stimulation rate. Therefore, a new technique was steps) to the length at which maximum steady state

Frequency-dependence of Myocardial Energetics 1461
Table 1 Clinical characteristics of patients
Age Sex EF CI PCW Previous medication(years) (m/f) (%) (l/min/m2) (mmHg)
1 51 m 23 2.6 31 Digoxin, Furosemide, Spironolactone, Amiodarone2 42 m 12 1.5 20 Digoxin, Captopril, Furosemide, Bisoprolol3 45 f 18 2.0 25 Digoxin, Captopril, Furosemide4 58 m 28 1.8 22 Digitoxin, Captopril, Furosemide, Spironolactone5 58 m 20 1.9 22 Digoxin, Enalapril, Furosemide, Spironolactone, ISMN6 62 m 22 1.6 32 Digoxin, Enalapril, Furosemide, Spironolactone, Amiodarone7 57 m 25 1.6 22 Digoxin, Ramipril, Furosemide
EF, ejection fraction; CI, cardiac index; PCW, mean pulmonary capillary wedge pressure; ISMN, isosorbide mononitrate.
twitch force was reached (Lmax). Force was measured channels provide an inlet and outlet for the solution.The fifth channel, which is perpendicular to the longwith a force transducer (KG4, Scientific In-
struments, Heidelberg, FRG), and force parameters axis of the muscle, contains the oxygen electrode.For measurement of oxygen partial pressure, awere obtained from the recorded charts (WR 3310,
Graphtec, Ettlingen, FRG). polarographic oxygen electrode (Clark et al., 1953)is used. The position of the probe tip can be observedDeveloped force is defined as the difference be-
tween peak systolic force and the lowest diastolic under a microscope and precisely regulated by amicrometer screw. For calibration of the oxygenforce during the stimulus interval. Developed force-
time integral (FTI) is defined as the area between probe a sample of oxygenated Krebs–Ringer solutionis drawn from the chamber inlet and oxygen partialthe systolic twitch force curve and the diastolic
force. Diastolic FTI is defined as the area between pressure is measured (Radiometer Kopenhagen ABL510). In order to evaluate the delay of the electrode,the diastolic force level and the force measured after
addition of 30 mmol/l 2,3-butanedione monoxime response to change in oxygen partial pressure from600 to 300 mmHg was measured. The new steadyto inhibit cross-bridge cycling (Mulieri et al., 1989;
Perreault et al., 1992). Total FTI is the sum of state level was reached in 5.3±0.5 s (n=7).developed FTI and diastolic FTI. For comparison ofmechanical performance with myocardial oxygen
Closed chamber methodconsumption, FTI is given per min (mN·s/min/mm2). Cross-sectional area for normalization of To measure oxygen consumption of the muscleforce values was calculated as the ratio of blotted preparation, the decrease of oxygen partial pressuremuscle weight to muscle length. In the experiments of the stirred Krebs–Ringer solution was registeredfor validation of the diffusion method, average over a period of 60 s after the perfusion had beenmuscle cross-sectional area was 0.40±0.03 mm2. stopped. In the first seconds after stopping theAverage muscle cross-sectional area was perfusion, the decline of oxygen partial pressure is0.27±0.06 mm2 in muscle preparations used for pronounced compared to the ensuing linear decline,the energetic measurements. as can be seen in Figure 1 (effect is explained below).
For the calculation of the oxygen consumption, onlythe linear part of the decline was taken. Decline ofoxygen partial pressure was recorded on a personal
Measurement of oxygen consumption computer. The amount of utilized oxygen was cal-culated with a solubility coefficient of 0.024 mlO2/
Apparatus ml/atm (Grote and Thews, 1962) and divided bythe blotted weight of the muscle preparation.The apparatus (Scientific Instruments, Heidelberg,
FRG) consists of a brass cylinder with a centralheating unit and a Plexiglas block containing the
Diffusion methodmuscle chamber (volume: 36 mm3). The musclechamber can be closed with a brass lid containing For these measurements, the perfusion with oxy-
gen-enriched solution was stopped and the solutiona central glass window. Five channels enter thechamber through the Plexiglas block. Steel clamps was not stirred. At a defined distance from the
muscle surface, the time-dependent decrease of oxy-for fixation of the muscle preparation occupy twochannels. One steel clamp is connected to a force gen partial pressure was measured and recorded
on a personal computer (Fig. 1). Although thetransducer and the other to a servo motor. Two

M. Meyer et al.1462
measuring interval, the muscle was identified ashypoxic and excluded from the study.
Experimental protocol
Validation of the diffusion method
For comparison of the diffusion method with theclosed chamber method the following meas-urements were performed in 15 muscle pre-parations. The muscles were stimulated to contractisometrically (Ca2+=2.5 mmol/l, 60 min−1, 37°C).Isometric force and oxygen partial pressure tran-sients were measured with both methods. There-after, the calcium concentration was increased to4.5 and 6.5 mmol/l, and measurements were takenfor each calcium concentration during steady-stateconditions. In some muscle preparations, calciumconcentration was further increased to 8.5 mmol/l
60
600
400
0Time (s)
Oxy
gen
par
tial
pre
ssu
re
(mm
Hg)
500
Diffusion method
Chamber method
1
8
2
0Time (s)
For
ce (
mN
)
4
(b)
(a)
6
(n=8). After the measurements at the final calciumconcentration, the stimulation of the muscle pre-Figure 1 Original recordings of isometric force and oxy-
gen partial pressure in a muscle preparation at calcium parations was switched off, and after an equi-concentrations of 2.5 mmol/l (solid line) and 6.5 mmol/ libration period of 3 min resting oxygenl (dashed line). (a) Isometric contractions. (b) Decrease consumption was registered. In eight preparations,of oxygen partial pressure as determined by the diffusion
isotonic shortening experiments were additionallymethod with an oxygen electrode close to the surface ofperformed at each calcium concentration. Duringthe muscle and with the conventional closed chamber
method. the isotonic shortening, force was kept at the dia-stolic force level.
Frequency-dependence of myocardial energeticsoxygen consumption of the measuring probe wasnegligible, an artifact was present in the first few Frequency-dependence of myocardial energetics
was evaluated using the diffusion method. Becauseseconds, while a small local concentration gradientdeveloped around the probe tip. To quantify this we were interested in the energetic consequences
of disturbed diastolic function associated with in-effect, measurements were performed without amuscle. When the perfusion was stopped, the oxy- creased heart rate, only those muscle strips that
exhibited a rise in diastolic force when stimulationgen partial pressure fell from 575 mmHg to a newsteady-state level of 525±3 mmHg in 4.5±0.5 s rate was increased above 80 min−1 were included.
Four muscle preparations were excluded by this(n=12).Determination of oxygen consumption of the criterion. After steady-state conditions were reached
at Lmax, stimulation was switched off for 3 min andmuscle was done as follows. Prior to the ex-periments, sets of theoretical transients were com- resting oxygen consumption was measured (37°C,
Ca2+=2.5 mmol/l). Thereafter, the preparation wasputed for various distances of the oxygen probe frommuscles with a wide range of oxygen consumption stimulated to contract isometrically at 40, 80, 120,
160 and 200 min−1 and force parameters and MVO2rates and radii (Appendix). During the experiment,the two calculated curves which bracketed the were recorded during steady-state conditions at
each frequency. At the end of each experiment,measured partial pressures were selected from theappropriate set of precalculated profiles. Muscle stimulation was switched off and resting force and
MVO2 were measured again after 3 min of rest.oxygen consumption was then interpolated fromthe precalculated curves. If the measured oxygen Thereafter, 30 mmol/l 2,3-butanedione monoxime
was added to the solution to inhibit cross-bridgepartial pressure transient was bracketed by pre-calculated curves that predict a zero oxygen partial cycling (Mulieri et al., 1989; Perreault et al., 1992).
The force value after application of 2,3-butanedionepressure within the center of the muscle during the

Frequency-dependence of Myocardial Energetics 1463
monoxime is defined as basal force. The cor-responding oxygen consumption value is termedbasal MVO2.
Statistical analysis
Data are expressed as mean±... One-way re-peated measures ANOVA was performed for thestatistical evaluation of the influence of frequencyon force parameters and MVO2. If frequency sig-nificantly affected a parameter, a closed paired t-test procedure was applied (Marcus et al., 1976). Anon-paired t-test was used for comparisons betweengroups. A value of P<0.05 was accepted as stat-istically significant.
Results
Validation of the diffusion method
Resting MVO2 of the unstimulated myocardiumwas 1.8±0.2 ml/min/100 g for the closed chambermethod and 1.7±0.2 ml/min/100 g for the dif-fusion method (..). At a calcium concentrationof 2.5 mmol/l (37°C, 60 min−1) mean developedforce under isometric conditions was10.6±3.3 mN/mm2. Total MVO2 was 2.9±0.4 ml/
12
12
MVO2 (Chamber method) (ml/min/100 g)
MV
O2
(Dif
fusi
on m
eth
od)
(ml/
min
/100
g)
2
y = 1.17x + 0.59
108642
4
6
8
10
r = 0.89 P < 0.001
(b)
12
12
MVO2 (Chamber method) (ml/min/100 g)
MV
O2
(Dif
fusi
on m
eth
od)
(ml/
min
/100
g)
2
y = 1.07x + 0.35
108642
4
6
8
10
r = 0.85 P < 0.001
(a)
min/100 g as measured with the closed chamberFigure 2 Graphs showing comparisons of MVO2 meas-method and 3.2±0.5 ml/min/100 g with the dif-urements by the diffusion method and by the closedfusion method (..). With increasing extracellular chamber method. (a) MVO2 was obtained at rest and at
calcium concentrations, there was a concomitant a stimulation rate of 60 min−1 (isometric conditions) inincrease in mechanical output and MVO2 (Fig. 1). 15 muscle strip preparations. Calcium concentrations
were 2.5, 4.5, 6.5 and 8.5 mmol/l. The regression lineAt 6.5 mmol/l extracellular calcium concentrationcalculated from all data points and the 95% confidencedeveloped force increased to 15.6±4.6 mN/mm2
limits are given. (b) MVO2 was obtained at rest and at a(P<0.01) and total MVO2 increased to 4.8±0.6 ml/ stimulation rate of 60 min−1 (isotonic conditions, after-min/100 g (closed chamber method, P<0.01) and load=preload) in eight muscle strip preparations. Cal-5.3±0.9 ml/min/100 g (diffusion method, cium concentrations were 2.5, 4.5, 6.5 and 8.5 mmol/l.
The regression line calculated from all data points andP<0.01). Total MVO2 obtained at the different cal-the 95% confidence limits are given.cium concentrations is plotted in Figure 2 for com-
parison of the diffusion method with the closedchamber method. Including measurements fromall muscle preparations, the correlation coefficientbetween the two methods was r=0.85 (P<0.001) method (Fig. 3). The average correlation coefficient
for the individual experiments was 0.84±0.04 forand the slope of the regression line was 1.07.Total MVO2 obtained with both methods was also both methods. The point of intercept with the or-
dinate was 1.1±0.1 ml/min/100 g with the dif-related to total FTI. The isometric FTI was chosenbecause it has been shown to be closely related fusion method, not significantly different from the
value of 1.2±0.2 ml/min/100 g as measured withto myocardial energy consumption (Sarnoff et al.,1958; McDonald, 1966; Gibbs and Gibson, 1970). the chamber method.
In order to demonstrate that the diffusion methodThe correlation coefficient between total FTI andtotal MVO2 was r=0.93 (P<0.001) for the diffusion also allows measurements of MVO2 during isotonic
shortening, experiments were performed in eightmethod and r=0.84 (P<0.001) for the chamber
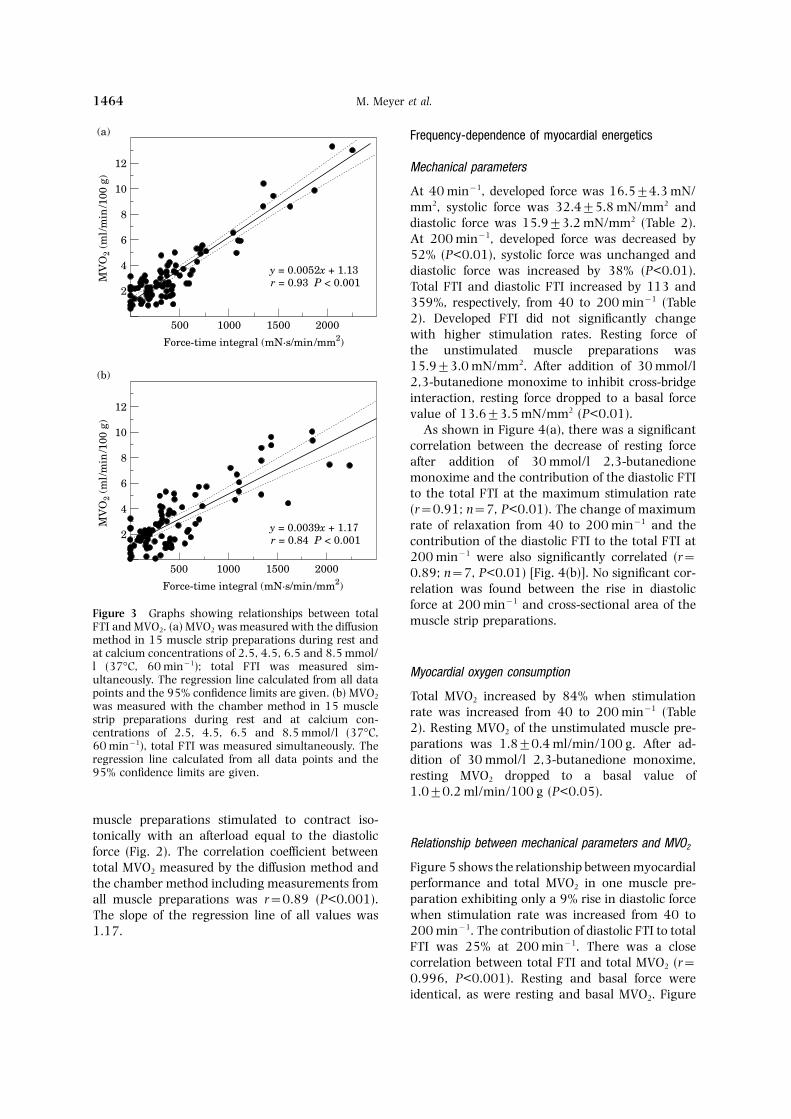
M. Meyer et al.1464
Frequency-dependence of myocardial energetics
Mechanical parameters
At 40 min−1, developed force was 16.5±4.3 mN/mm2, systolic force was 32.4±5.8 mN/mm2 anddiastolic force was 15.9±3.2 mN/mm2 (Table 2).At 200 min−1, developed force was decreased by52% (P<0.01), systolic force was unchanged anddiastolic force was increased by 38% (P<0.01).Total FTI and diastolic FTI increased by 113 and359%, respectively, from 40 to 200 min−1 (Table2). Developed FTI did not significantly changewith higher stimulation rates. Resting force ofthe unstimulated muscle preparations was15.9±3.0 mN/mm2. After addition of 30 mmol/l2,3-butanedione monoxime to inhibit cross-bridgeinteraction, resting force dropped to a basal forcevalue of 13.6±3.5 mN/mm2 (P<0.01).
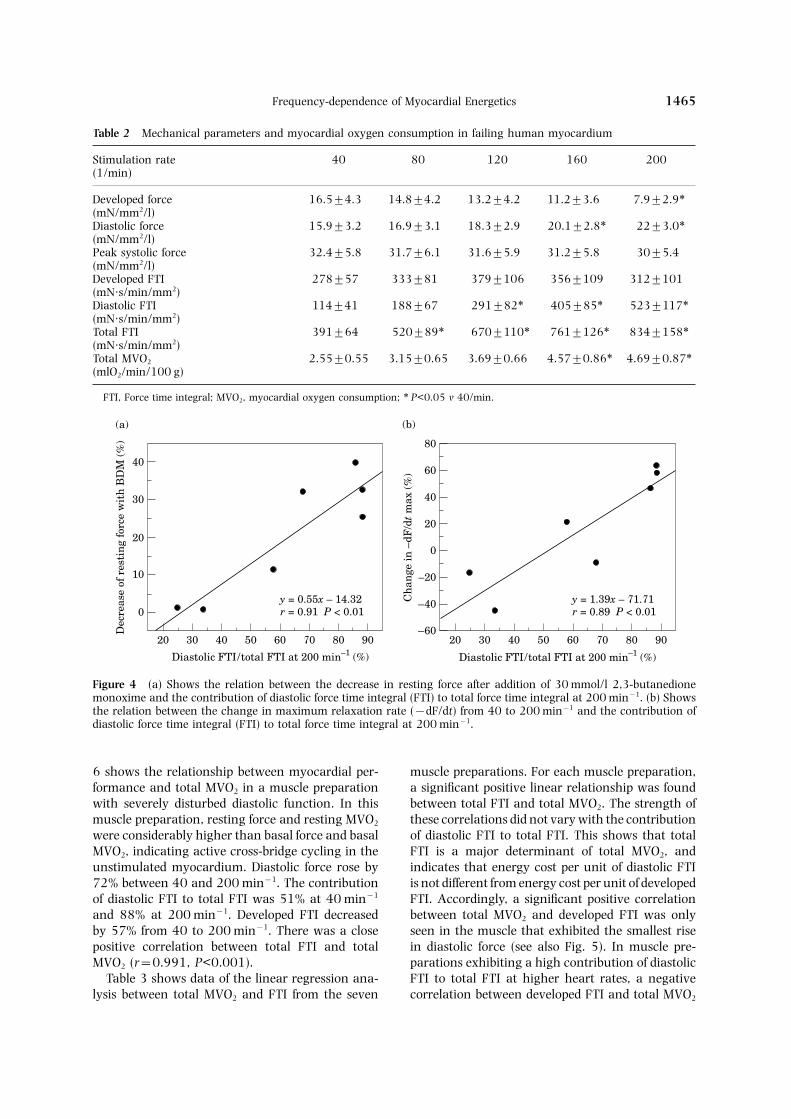
As shown in Figure 4(a), there was a significantcorrelation between the decrease of resting forceafter addition of 30 mmol/l 2,3-butanedionemonoxime and the contribution of the diastolic FTIto the total FTI at the maximum stimulation rate(r=0.91; n=7, P<0.01). The change of maximumrate of relaxation from 40 to 200 min−1 and thecontribution of the diastolic FTI to the total FTI at200 min−1 were also significantly correlated (r=0.89; n=7, P<0.01) [Fig. 4(b)]. No significant cor-relation was found between the rise in diastolic
2000
12
Force-time integral (mN·s/min/mm2)
MV
O2
(ml/
min
/100
g)
2y = 0.0039x + 1.17
15001000500
4
6
8
10
r = 0.84 P < 0.001
(b)
12
2
y = 0.0052x + 1.134
6
8
10
r = 0.93 P < 0.001
(a)
2000
Force-time integral (mN·s/min/mm2)
15001000500
MV
O2
(ml/
min
/100
g)
force at 200 min−1 and cross-sectional area of theFigure 3 Graphs showing relationships between total muscle strip preparations.FTI and MVO2. (a) MVO2 was measured with the diffusionmethod in 15 muscle strip preparations during rest andat calcium concentrations of 2.5, 4.5, 6.5 and 8.5 mmol/l (37°C, 60 min−1); total FTI was measured sim- Myocardial oxygen consumptionultaneously. The regression line calculated from all datapoints and the 95% confidence limits are given. (b) MVO2 Total MVO2 increased by 84% when stimulationwas measured with the chamber method in 15 muscle rate was increased from 40 to 200 min−1 (Tablestrip preparations during rest and at calcium con-
2). Resting MVO2 of the unstimulated muscle pre-centrations of 2.5, 4.5, 6.5 and 8.5 mmol/l (37°C,parations was 1.8±0.4 ml/min/100 g. After ad-60 min−1), total FTI was measured simultaneously. The
regression line calculated from all data points and the dition of 30 mmol/l 2,3-butanedione monoxime,95% confidence limits are given. resting MVO2 dropped to a basal value of
1.0±0.2 ml/min/100 g (P<0.05).
muscle preparations stimulated to contract iso-tonically with an afterload equal to the diastolic Relationship between mechanical parameters and MVO2force (Fig. 2). The correlation coefficient between
Figure 5 shows the relationship between myocardialtotal MVO2 measured by the diffusion method andperformance and total MVO2 in one muscle pre-the chamber method including measurements fromparation exhibiting only a 9% rise in diastolic forceall muscle preparations was r=0.89 (P<0.001).when stimulation rate was increased from 40 toThe slope of the regression line of all values was200 min−1. The contribution of diastolic FTI to total1.17.FTI was 25% at 200 min−1. There was a closecorrelation between total FTI and total MVO2 (r=0.996, P<0.001). Resting and basal force wereidentical, as were resting and basal MVO2. Figure
Frequency-dependence of Myocardial Energetics 1465
Table 2 Mechanical parameters and myocardial oxygen consumption in failing human myocardium
Stimulation rate 40 80 120 160 200(1/min)
Developed force 16.5±4.3 14.8±4.2 13.2±4.2 11.2±3.6 7.9±2.9∗(mN/mm2/l)Diastolic force 15.9±3.2 16.9±3.1 18.3±2.9 20.1±2.8∗ 22±3.0∗(mN/mm2/l)Peak systolic force 32.4±5.8 31.7±6.1 31.6±5.9 31.2±5.8 30±5.4(mN/mm2/l)Developed FTI 278±57 333±81 379±106 356±109 312±101(mN·s/min/mm2)Diastolic FTI 114±41 188±67 291±82∗ 405±85∗ 523±117∗(mN·s/min/mm2)Total FTI 391±64 520±89∗ 670±110∗ 761±126∗ 834±158∗(mN·s/min/mm2)Total MVO2 2.55±0.55 3.15±0.65 3.69±0.66 4.57±0.86∗ 4.69±0.87∗(mlO2/min/100 g)
FTI, Force time integral; MVO2, myocardial oxygen consumption; ∗ P<0.05 v 40/min.
90
40
Diastolic FTI/total FTI at 200 min–1 (%)
Dec
reas
e of
res
tin
g fo
rce
wit
h B
DM
(%
)
0y = 0.55x – 14.32
7060504020
10
20
30
r = 0.91 P < 0.01
8030 90
80
Diastolic FTI/total FTI at 200 min–1 (%)
Ch
ange
in –
dF/d
t m
ax (
%)
–60
y = 1.39x – 71.71
7060504020
–40
–20
0
r = 0.89 P < 0.01
8030
20
40
60
(a) (b)
Figure 4 (a) Shows the relation between the decrease in resting force after addition of 30 mmol/l 2,3-butanedionemonoxime and the contribution of diastolic force time integral (FTI) to total force time integral at 200 min−1. (b) Showsthe relation between the change in maximum relaxation rate (−dF/dt) from 40 to 200 min−1 and the contribution ofdiastolic force time integral (FTI) to total force time integral at 200 min−1.
6 shows the relationship between myocardial per- muscle preparations. For each muscle preparation,a significant positive linear relationship was foundformance and total MVO2 in a muscle preparation
with severely disturbed diastolic function. In this between total FTI and total MVO2. The strength ofthese correlations did not vary with the contributionmuscle preparation, resting force and resting MVO2
were considerably higher than basal force and basal of diastolic FTI to total FTI. This shows that totalFTI is a major determinant of total MVO2, andMVO2, indicating active cross-bridge cycling in the
unstimulated myocardium. Diastolic force rose by indicates that energy cost per unit of diastolic FTIis not different from energy cost per unit of developed72% between 40 and 200 min−1. The contribution
of diastolic FTI to total FTI was 51% at 40 min−1 FTI. Accordingly, a significant positive correlationbetween total MVO2 and developed FTI was onlyand 88% at 200 min−1. Developed FTI decreased
by 57% from 40 to 200 min−1. There was a close seen in the muscle that exhibited the smallest risein diastolic force (see also Fig. 5). In muscle pre-positive correlation between total FTI and total
MVO2 (r=0.991, P<0.001). parations exhibiting a high contribution of diastolicFTI to total FTI at higher heart rates, a negativeTable 3 shows data of the linear regression ana-
lysis between total MVO2 and FTI from the seven correlation between developed FTI and total MVO2

M. Meyer et al.1466
600
6
MV
O2
(ml/
min
/100
g)
1r = 0.996
400200
2
4
5
y = 0.0073x + 0.66
(b)
Force-time integral (mN·s/min/mm2)
3
40
80
120
120
200 200
160
160
6
For
ce (
mN
)
3
5
(a)
4
2001601208040
Basal force (+30 mM BDM)
1.5 s
1000
6
MV
O2
(ml/
min
/100
g)
1r = 0.991
600200
2
4
5
y = 0.0032x + 2.07
(b)
Force-time integral (mN·s/min/mm2)
3resting
8040
120
200
200160
12
For
ce (
mN
)
3
9
(a)
6
2001601208040
Basal force (+30 mM BDM)
1.5 s
160120
80 40
basal
Figure 5 Frequency-dependence of MVO2 and mech- Figure 6 Frequency-dependence of MVO2 and mech-anical performance in a muscle preparation exhibiting aanical performance in a muscle preparation exhibiting
only a small rise in diastolic force at higher stimulation pronounced rise of diastolic force with increasing stimu-lation rates. (a) Stimulation frequency was stepwise in-rates. (a) Stimulation frequency was stepwise increased
from 40 to 200 min−1 and force was recorded (37°C, creased from 40 to 200 min−1 and force was recorded(37°C, Ca2+ 2.5 mmol/l). At the end of the experimentCa2+ 2.5 mmol/l). At the end of the experiment 30 mmol/
l 2,3-butanedione monoxime was added to the un- 30 mmol/l 2,3-butanedione monoxime was added to theunstimulated muscle to determine the basal force (dashedstimulated muscle to determine the basal force (dashed
line) and MVO2. (b) Total MVO2 is plotted v total FTI line) and MVO2. Note that resting force dropped afteraddition of 2,3-butanedione monoxime from 12.2 to(solid circles). The regression analysis was calculated
from measurements at different frequencies and during 8.3 mN/mm2, indicating considerable force generation inresting muscle by cycling cross-bridges. (b) MVO2 isresting and basal conditions. Open circles reflect de-
veloped FTI. Developed FTI was not different from total plotted v total FTI (solid circles). The regression analysiswas calculated from measurements at different fre-FTI at 40 and 80 min−1 but was lower than total FTI at
frequencies above 80 min−1. quencies and during resting and basal conditions. Opencircles reflect developed FTI. Developed FTI was lowerthan total FTI at all stimulation frequencies.
was observed (see also Fig. 6), so that the highestoxygen consumption was associated with lowest Discussiondeveloped FTI at high frequencies.
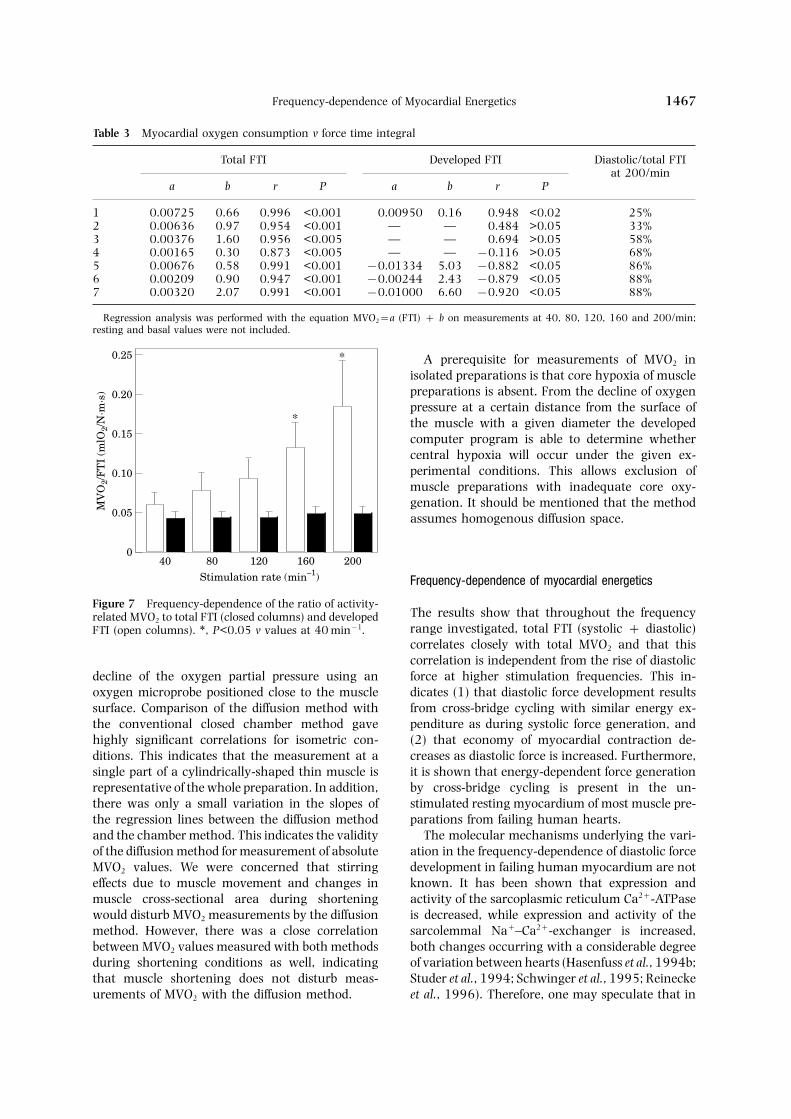
When the ratio of activity related MVO2 to total Validation of the diffusion methodFTI was calculated, there was no significant changethroughout the force–frequency range (Fig. 7). In The present study demonstrates the feasibility andcontrast, the ratio of activity related MVO2 to de- accuracy of the new diffusion method for measuringveloped FTI, which is an inverse index of economy MVO2 in isolated muscle strip preparations. Thisof myocardial contraction, increased continuously method allows fast measurements of MVO2 (<25 s)with higher stimulation rates. without the requirement of an air-tight closed
chamber system and enables on-line prediction ofcentral hypoxia in individual muscle strips.
Determination of MVO2 with the diffusion methodis based on the measurement of the time-dependent
Frequency-dependence of Myocardial Energetics 1467
Table 3 Myocardial oxygen consumption v force time integral
Total FTI Developed FTI Diastolic/total FTIat 200/min
a b r P a b r P
1 0.00725 0.66 0.996 <0.001 0.00950 0.16 0.948 <0.02 25%2 0.00636 0.97 0.954 <0.001 — — 0.484 >0.05 33%3 0.00376 1.60 0.956 <0.005 — — 0.694 >0.05 58%4 0.00165 0.30 0.873 <0.005 — — −0.116 >0.05 68%5 0.00676 0.58 0.991 <0.001 −0.01334 5.03 −0.882 <0.05 86%6 0.00209 0.90 0.947 <0.001 −0.00244 2.43 −0.879 <0.05 88%7 0.00320 2.07 0.991 <0.001 −0.01000 6.60 −0.920 <0.05 88%
Regression analysis was performed with the equation MVO2=a (FTI) + b on measurements at 40, 80, 120, 160 and 200/min;resting and basal values were not included.
A prerequisite for measurements of MVO2 inisolated preparations is that core hypoxia of musclepreparations is absent. From the decline of oxygenpressure at a certain distance from the surface ofthe muscle with a given diameter the developedcomputer program is able to determine whethercentral hypoxia will occur under the given ex-perimental conditions. This allows exclusion ofmuscle preparations with inadequate core oxy-genation. It should be mentioned that the methodassumes homogenous diffusion space.
Frequency-dependence of myocardial energetics
0.25
0
Stimulation rate (min–1)
MV
O2/
FT
I (m
lO2/
N·m
·s) 0.20
0.15
0.10
0.05
40 80 120 160 200
*
*
Figure 7 Frequency-dependence of the ratio of activity-The results show that throughout the frequencyrelated MVO2 to total FTI (closed columns) and developedrange investigated, total FTI (systolic + diastolic)FTI (open columns). ∗, P<0.05 v values at 40 min−1.correlates closely with total MVO2 and that thiscorrelation is independent from the rise of diastolicforce at higher stimulation frequencies. This in-decline of the oxygen partial pressure using an
oxygen microprobe positioned close to the muscle dicates (1) that diastolic force development resultsfrom cross-bridge cycling with similar energy ex-surface. Comparison of the diffusion method with
the conventional closed chamber method gave penditure as during systolic force generation, and(2) that economy of myocardial contraction de-highly significant correlations for isometric con-
ditions. This indicates that the measurement at a creases as diastolic force is increased. Furthermore,it is shown that energy-dependent force generationsingle part of a cylindrically-shaped thin muscle is
representative of the whole preparation. In addition, by cross-bridge cycling is present in the un-stimulated resting myocardium of most muscle pre-there was only a small variation in the slopes of
the regression lines between the diffusion method parations from failing human hearts.The molecular mechanisms underlying the vari-and the chamber method. This indicates the validity
of the diffusion method for measurement of absolute ation in the frequency-dependence of diastolic forcedevelopment in failing human myocardium are notMVO2 values. We were concerned that stirring
effects due to muscle movement and changes in known. It has been shown that expression andactivity of the sarcoplasmic reticulum Ca2+-ATPasemuscle cross-sectional area during shortening
would disturb MVO2 measurements by the diffusion is decreased, while expression and activity of thesarcolemmal Na+–Ca2+-exchanger is increased,method. However, there was a close correlation
between MVO2 values measured with both methods both changes occurring with a considerable degreeof variation between hearts (Hasenfuss et al., 1994b;during shortening conditions as well, indicating
that muscle shortening does not disturb meas- Studer et al., 1994; Schwinger et al., 1995; Reineckeet al., 1996). Therefore, one may speculate that inurements of MVO2 with the diffusion method.

M. Meyer et al.1468
hearts with preserved diastolic function, decreased with disturbed diastolic function, diastolic forcedevelopment at higher heart rates is associated withsarcoplasmic reticulum calcium sequestration may
be compensated by increased trans-sarcolemmal significant energy consumption.In order to determine whether active cross-bridgecalcium removal. Accordingly, a significant inverse
correlation between sodium–calcium-exchanger cycling contributes to resting force generation andresting oxygen consumption of the unstimulatedprotein levels and the frequency-dependent rise
of diastolic force was observed in another study human myocardium, 2,3-butanedione monoxime(30 mmol/l) was applied. 2,3-butanedione monox-(Hasenfuss et al., 1996). Impaired calcium removal
as the cause of disturbed diastolic function is further ime at this concentration prevents acto–myosininteraction by influencing excitation–contractionsupported by the finding that the frequency-de-
pendent change in maximum relaxation rate is coupling and by direct effects on cross-bridges (Mu-lieri et al., 1989; Perreault et al., 1992). Mostclosely correlated with the contribution of the dia-
stolic FTI to the total FTI at 200 min−1 [Fig. 4(b)]. interestingly, resting force decreased significantlyby 15% and resting oxygen consumption decreasedDisturbed diastolic function could also result from
energy lack due to hypoxia or altered mitochondrial by 46%. This indicates that even in the un-stimulated failing human myocardium, cross-bridgefunction. Hypoxia was unlikely for the following
reasons: (1) only muscle preparations for which cycling can contribute to resting force. When therelative decrease of the resting force after additioncore hypoxia was excluded by the computer analysis
of oxygen partial pressure changes were included of 2,3-butanedione monoxime was plotted v thecontribution of the diastolic FTI to the total FTI, ain the study; (2) in control experiments in which
oxygen partial pressure was decreased at 200 min−1 significant correlation was found (Fig. 4). This mayindicate that muscle preparations with limited abil-no additional rise of diastolic force was observed;
(3) there was no correlation between the rise in ity to remove intracellular calcium under restingconditions are prone to a further rise of diastolicdiastolic force at 200 min−1 and cross-sectional area
of the muscle strip preparation; (4) myocardial force at higher stimulation frequencies. Of note, 2,3-butanedione monoxime was suggested to influenceoxygen consumption increased continuously with
increasing rates of stimulation and was linearly mitochondrial function, which may have influencedresting oxygen consumption measurements (Heb-correlated with total FTI (see below).
In order to evaluate frequency-dependence of isch et al., 1993). However, when the same ex-periments were carried out in non-failing rabbitmyocardial energetics, MVO2 was related to iso-
metric FTI. FTI of the muscle preparation is con- myocardium, application of 30 m 2,3-bu-tanedione monoxime did neither influence restingsidered to result from the summation of all
individual cross-bridge interactions consuming force nor resting oxygen consumption (J. Holmeset al., unpublished data), indicating that under themost of the energy during a contraction–relaxation
cycle (Alpert et al., 1992). In each muscle pre- present conditions 2,3-butanedione monoxime hasno relevant effect on energy metabolism in-paration, there was a close linear correlation be-
tween total MVO2 and total FTI which was dependent from its effects on excitation–contractioncoupling and contraction.independent from the contribution of diastolic FTI
to total FTI (Figs 5 and 6). This indicates that It should be stated that the analysis performedin the paper does not allow us to conclude that thediastolic force development at higher stimulation
rates is an active energy-consuming process of observed contribution of cross-bridge activity toresting force is a pathological phenomenon whichacto–myosin cross-bridge interaction, and that en-
ergy consumption per unit FTI is similar for systolic is not present in non-failing human myocardium.Furthermore, no conclusion can be drawn re-and diastolic force generation. Accordingly, when
the ratio of activity-related MVO2 (total−basal) to garding any difference in the frequency-dependentchange of diastolic force and resulting energetictotal FTI was calculated, no changes were observed
with increasing stimulation rates. However, the consequences between failing and non-failinghuman myocardium.ratio of activity-related MVO2 to developed FTI,
which is an inverse index of the economy of myo- In summary, the present study demonstrates thevalidity of the developed diffusion method to ac-cardial contraction (Hasenfuss et al., 1994c), in-
creased with increasing diastolic force development curately measure MVO2 in isolated myocardial strippreparations. The method allows fast measurementsat higher stimulation rates. In other words, eco-
nomy of myocardial contraction decreases as dia- of MVO2 without the requirement of an air-tightclosed chamber system, and enables the recognitionstolic force increases. This finding may be of great
clinical relevance. It indicates that in failing hearts of inadequate oxygenation of the muscle pre-

Frequency-dependence of Myocardial Energetics 1469
paration. Using this method, it is shown that in iteratively throughout the muscle and fluid cham-ber, decreasing both DR and Dt until a 50% re-failing human myocardium, diastolic force de-
velopment at higher rates of stimulation is an duction in both produced no further alteration inthe calculated concentration profiles. The followingenergy-consuming process with energy costs com-
parable to those of systolic force development. As boundary conditions were applied: (1) no diffusionof oxygen occurred across the walls of the chambera consequence, economy of contraction decreases
if diastolic force is increased. (radius 2 mm); and (2) within the muscle, the rateof oxygen consumption (S) was constant, whilein the remainder of the chamber no oxygen wasconsumed. While the solution was vigorously per-Acknowledgmentsfused, oxygen partial pressure was assumed thesame throughout the chamber and a stable, steady-This study was supported by grants from the Deut-state profile was calculated in the muscle. Whensche Forschungsgemeinschaft (HA 1233/3-2) andperfusion was stopped, this steady-state profile wasfrom the Bundesministerium fur Wissenschaft, Bi-used as a starting point, and the additional re-ldung, Forschung und Technologie (BMFTquirement that muscle and solution oxygen con-0311006). G. Hasenfuss is an Established In-centrations match at the muscle border was applied.vestigator of the Deutsche Forschungsgemeinschaft
(DFG, Heisenberg-Stipendium HA 1233/4-1). J.Holmes was supported by the Alexander-von-Hum-boldt Stiftung. References
A NR, M LA, H G, 1992. MyocardialAppendix chemomechanical energy transduction. In: Fozzard
HA, Jennings RB, Haber E, Katz AM (eds). The Heartand Cardiovascular System. New York: Raven Press Ltd,Calculation of theoretical oxygen transients111–128.
B HP, 1871. Uber die Eigenthumlichkeiten derTo calculate the theoretical transients for various Reizbarkeit, welche die Muskelfasern des Herzensdistances of the oxygen probe from the muscle zeigen. Ber Sachs Ges (Akad) Wiss 23: 652–689.
C DR, 1968. Respiration in myocardium. Naturesurface, various muscle radii, and various oxygen217: 78–80.consumption rates, the Fick law of diffusion was
C LC J, W R, G D, T Z, 1953.used: Continuous recording of blood oxygen tensions by
polarography. J Appl Physiol 6: 189–193.E CL, M Y, 1915. The effect of variousJ=−D Κc (1)
mechanical conditions on gaseous metabolism andefficiency of the mammalian heart. J Physiol 49: 378–where D is the diffusion coefficient, J the oxygen 406.
flux across a surface, and Κc the spatial gradient F MD, A JD, A JM, R HD,of concentration at that surface, which in the case F JJ, O RM, G W, MK RG,
1988a. Depression of systolic and diastolic myocardialof a long, cylindrically symmetric chamber andreserve during atrial pacing tachycardia in patientsmuscle reduces to dc/dr (gradient of concentrationwith dilated cardiomyopathy. J Clin Invest 82: 1661–with respect to radius). The muscle and chamber 1669.
were divided into a series of concentric cylindrical F MD, G JK, P P, S F, M-elements, and the equation of conservation of mass JP, 1988b. Reversal of the force–frequency re-
lationship in working myocardium from patients withwas formulated discretely for these elements:end-stage heart failure. J Appl Cardiol 3: 273–283.
G CL, G WR, 1970. Effect of alterations in the(Cn,t+Dt−Cn,t) Vn=
(2)stimulus rate upon energy output, tension developmentand tension-time integral of cardiac muscle in rabbit.
[−D 2ph G(Cn,t−Cn−1,t)RDR
+(Cn,t−Cn+1,t)R+DR)
DR H−S] Dt Circ Res 27: 611–619.G J, T G, 1962. Die Bedingungen fur die Sauer-
stoffversorgung des Herzmuskelgewebes. Pflugers Arch276: 142–165.where Cn,t is the concentration in the nth shell at
G JK, S MT, H RJ, B GM,time t, D the diffusion coefficient for oxygen withinM JP, 1990. Role of intracellular calcium hand-the shell, R the radius of the shell, DR the thicknessling in force-interval relationship of human ventricular
of the shell, h the length of the shell, S the rate of myocardium. J Clin Invest 85: 1599–1613.oxygen consumption within the shell, and Vn the H G, M LA, L BJ, A PD, H-
JR, A NR, 1992. Alterations of contractilevolume of the nth shell. This equation was solved
M. Meyer et al.1470
function and excitation-contraction coupling in dilated H, H G, 1995. Alterations of sarcoplasmicproteins in failing human dilated cardiomyopathy. Cir-cardiomyopathy. Circ Res 70: 1225–1232.
H G, H C, H H-P, A culation 92: 778–784.M LA, H G, I F, B EM,K, P B, J H, 1994a. Influence of the force–
frequency relationship on haemodynamics and left A NR, 1989. Protection of human left ventricularmyocardium from cutting injury with 2,3-butanedioneventricular function in patients with non-failing hearts
and in patients with dilated cardiomyopathy. Eur Heart monoxime. Circ Res 65: 1441–1444.M LA, H G, L B, A PD, AJ 15: 164–170.
H G, R H, S R, M M, P B, NR, 1992. Altered myocardial force-frequency relationin human heart failure. Circulation 85: 1743–1750.H J, H C, P H, J H, D
H, 1994b. Relation between myocardial function and P CL, M LA, A NR, R BJ, APD, M JP, 1992. Cellular basis of negative ino-expression of sarcoplasmic reticulum Ca2+-ATPase in
failing and nonfailing human myocardium. Circ Res tropic effect of 2,3-butanedione monoxime in humanmyocardium. Am J Physiol 263: H503–H510.75: 434–442.
H G, M LA, L BJ, A NR, 1994c. R H, S R, V R, H I, D H,1996. Cardiac Na+/Ca2+ exchange activity in patientsInfluence of isoproterenol on contractile protein func-
tion, excitation-contraction coupling, and energy turn- with end-stage heart failure. Cardiovasc Res 31: 48–54.R E, 1912. Uber den Einfluss der mechanischenover of the isolated nonfailing human myocardium. J
Mol Cell Cardiol 26: 1461–1469. Bedingungen auf die Tatigkeit und den Sauer-stoffverbrauch des Warmblutlerherzens. Arch Exp Pa-H G, P M, L S, P J, M M,
J H, 1996. Relationship between diastolic function thol Pharmakol 68: 401–434.S SJ, B E, W GH, C RB, Sand protein levels of sodium-calcium-exchanger in end-
stage failing human hearts. Circulation 94 (Suppl. 1): WN, M R, 1958. Hemodynamic determinants ofoxygen consumption of the heart with special reference433.
H S, B E, S S, 1993. Influence of 2,3- to the tension-time index. Am J Physiol 192: 148–156.S RH, B M, S U, K P,butanedione monoxime on heart energy metabolism.
Bas Res Cardiol 88: 566–575. B U, F M, K EG, E E, 1995.Unchanged protein levels of SERCA II and phos-L KS, 1960. The relationship of the oxygen con-
sumption to the contraction of the cat papillary muscle. pholamban but reduced Ca2+ uptake and Ca2+-ATPaseactivity of cardiac sarcoplasmic reticulum from dilatedJ Physiol 151: 186–201.
M R, P E, G KR, 1976. On closed testing cardiomyopathy patients compared with patients withnonfailing hearts. Circulation 92: 3220–3228.procedures with special reference to ordered analysis
of variance. Biometrica 63: 655–660. S R, R H, B J, E T, BM, H G, J H, H J, D H, 1994.MD RH J, 1966. Developed tension: a major
determinant of myocardial oxygen consumption. Am Gene expression of the cardiac Na+–Ca2+ exchanger inend-stage human heart failure. Circ Res 75: 443–453.J Physiol 210: 351–356.
M M, S W, P B, H C, H- W B, N MIM, 1982. The cardiac excitation-contraction-cycle. Pharmacol Ther 16: 1–43. C, P H, K G, M K, J


![Conservation in tropical Pacific Island countries: why most current approaches are failing [2012]](https://static.fdokumen.com/doc/165x107/63368ffc4e9c1ac02e082302/conservation-in-tropical-pacific-island-countries-why-most-current-approaches-are.jpg)