Quality Control Review of the Independent Auditor's Report on ...
Upload
khangminh22Category
view
0download
0
PwC Bedrijfsrevisoren BV - PwC Reviseurs d'Entreprises SRL - Financial Assurance Services Maatschappelijke zetel/Siège social: Culliganlaan 5, 1831 Diegem T: +32 (0)2 710 4211, F: +32 (0)2 710 4299, www.pwc.com BTW/TVA BE 0429.501.944 / RPR Brussel - RPM Bruxelles / ING BE43 3101 3811 9501 - BIC BBRUBEBB / BELFIUS BE92 0689 0408 8123 - BIC GKCC BEBB
FREE TRANSLATION
STATUTORY AUDITOR'S REPORT TO THE GENERAL SHAREHOLDERS’ MEETING OF DPAM CAPITAL B SA (PUBLIC INVESTMENT COMPANY WITH VARIABLE CAPITAL UNDER BELGIAN LAW) ON THE ANNUAL ACCOUNTS FOR THE YEAR ENDED 31 DECEMBER 2021
We present to you our statutory auditor’s report in the context of our statutory audit of the annual accounts of DPAM Capital B SA (Public Investment Company with variable capital under Belgian law) (the “Company”). This report includes our report on the annual accounts, as well as the other legal and regulatory requirements. This forms part of an integrated whole and is indivisible.
We have been appointed as statutory auditor by the general meeting d.d. 14 May 2019, following the proposal formulated by the board of directors. Our mandate will expire on the date of the general meeting which will deliberate on the annual accounts for the year ended 31 December 2021. We have performed the statutory audit of the Company’s annual accounts for 3 consecutive years.
Report on the annual accounts
Unqualified opinion
We have performed the statutory audit of the Company’s annual accounts, which comprise the balance sheet as at 31 December 2021, and the profit and loss account for the year then ended, and the notes to the annual accounts, with a globalised statement of total net assets of EUR 4.549.274.224,87and of which the globalised result statement shows a profit for the financial year of EUR 997.739.192,89. An overview of the total net assets and the result of the financial year per sub-fund is provided in the table below: Sub-fund Currency Net Assets Result DPAM CAPITAL B Bonds EUR Medium Term EUR 262.835.157,05 -3.409.912,65 DPAM CAPITAL B Equities EMU Behavioral Value EUR 585.233.331,27 101.627.067,78
DPAM CAPITAL B Equities EMU Index EUR 135.117.423,26 29.031.064,13 DPAM CAPITAL B Equities Europe Index EUR 300.050.469,35 65.894.901,14 DPAM CAPITAL B Equities Japan Index EUR 87.130.066,83 10.916.169,63 DPAM CAPITAL B Equities US Behavioral Value EUR 790.182.267,16 219.935.498,46
DPAM CAPITAL B Equities US Dividend Sustainable EUR 492.602.369,32 109.845.796,74
DPAM CAPITAL B Equities US Index EUR 285.804.330,46 73.678.337,35 DPAM CAPITAL B Equities World ex Japan, Europe & USA Index EUR 92.441.146,57 16.153.712,01
DPAM CAPITAL B Real Estate EMU Dividend Sustainable EUR 89.340.394,73 10.133.262,13
DPAM CAPITAL B Corporate EUR 2023 EUR 173.816.130,28 -212.559,22 DPAM CAPITAL B Real Estate EMU Sustainable EUR 146.897.361,25 10.734.324,40
DPAM CAPITAL B Equities US ESG Leaders Index EUR 1.107.823.777,34 353.411.530,99
In our opinion, the annual accounts give a true and fair view of the Company’s net equity and financial position as at 31 December 2021, and of its results for the year then ended, in accordance with the financial-reporting framework applicable to Collective Investment Funds in Belgium (and in particular the Royal Decree of 10 November 2006).

2 of 4
FREE TRANSLATION
Basis for unqualified opinion
We conducted our audit in accordance with International Standards on Auditing (ISAs) as applicable in Belgium. Furthermore, we have applied the International Standards on Auditing as approved by the IAASB which are applicable to the year-end and which are not yet approved at the national level. Our responsibilities under those standards are further described in the “Statutory Auditor’s responsibilities for the audit of the annual accounts” section of our report. We have fulfilled our ethical responsibilities in accordance with the ethical requirements that are relevant to our audit of the annual accounts in Belgium, including the requirements related to independence.
We have obtained from the board of directors and Company officials the explanations and information necessary for performing our audit.
We believe that the audit evidence we have obtained is sufficient and appropriate to provide a basis for our opinion.
Responsibilities of the board of directors for the preparation of the annual accounts
The board of directors is responsible for the preparation of annual accounts that give a true and fair view in accordance with the financial-reporting framework applicable in Belgium, and for such internal control as the board of directors determines is necessary to enable the preparation of annual accounts that are free from material misstatement, whether due to fraud or error.
In preparing the annual accounts, the board of directors is responsible for assessing the Company’s ability to continue as a going concern, disclosing, as applicable, matters related to going concern and using the going concern basis of accounting unless the board of directors either intends to liquidate the Company or to cease operations, or has no realistic alternative but to do so.
Statutory auditor’s responsibilities for the audit of the annual accounts
Our objectives are to obtain reasonable assurance about whether the annual accounts as a whole are free from material misstatement, whether due to fraud or error, and to issue an auditor’s report that includes our opinion. Reasonable assurance is a high level of assurance, but is not a guarantee that an audit conducted in accordance with ISAs will always detect a material misstatement when it exists. Misstatements can arise from fraud or error and are considered material if, individually or in the aggregate, they could reasonably be expected to influence the economic decisions of users taken on the basis of these annual accounts.
In performing our audit, we comply with the legal, regulatory and normative framework applicable to the audit of the annual accounts in Belgium. A statutory audit does not provide any assurance as to the Company’s future viability nor as to the efficiency or effectiveness of the board of directors’ current or future business management. Our responsibilities in respect of the use of the going concern basis of accounting by the board of directors are described below.
3 of 4
FREE TRANSLATION
As part of an audit in accordance with ISAs, we exercise professional judgment and maintain professional skepticism throughout the audit. We also:
• identify and assess the risks of material misstatement of the annual accounts, whether due to fraud or error, design and perform audit procedures responsive to those risks, and obtain audit evidence that is sufficient and appropriate to provide a basis for our opinion. The risk of not detecting a material misstatement resulting from fraud is higher than for one resulting from error, as fraud may involve collusion, forgery, intentional omissions, misrepresentations, or the override of internal control;
• obtain an understanding of internal control relevant to the audit in order to design audit procedures that are appropriate in the circumstances, but not for the purpose of expressing an opinion on the effectiveness of the Company’s internal control;
• evaluate the appropriateness of accounting policies used and the reasonableness of accounting estimates and related disclosures made by the board of directors;
• conclude on the appropriateness of the board of directors use of the going concern basis of accounting and, based on the audit evidence obtained, whether a material uncertainty exists related to events or conditions that may cast significant doubt on the Company’s ability to continue as a going concern. If we conclude that a material uncertainty exists, we are required to draw attention in our statutory auditor’s report to the related disclosures in the annual accounts or, if such disclosures are inadequate, to modify our opinion. Our conclusions are based on the audit evidence obtained up to the date of our statutory auditor’s report. However, future events or conditions may cause the Company to cease to continue as a going concern;
• evaluate the overall presentation, structure and content of the annual accounts, including the disclosures, and whether the annual accounts represent the underlying transactions and events in a manner that achieves fair presentation;
We communicate with the board of directors regarding, among other matters, the planned scope and timing of the audit and significant audit findings, including any significant deficiencies in internal control that we identify during our audit.
Other legal and regulatory requirements
Responsibilities of the board of directors
The board of directors is responsible for the preparation and the content of the directors’ report, as well as for the compliance with the legal and regulatory requirements regarding bookkeeping, with the Companies’ and Associations’ Code and the Company’s articles of association.

4 of 4
FREE TRANSLATION
Statutory auditor’s responsibilities
In the context of our engagement and in accordance with the Belgian standard which is complementary to the International Standards on Auditing (ISAs) as applicable in Belgium, our responsibility is to verify, in all material respects, the directors’ report, as well as compliance with the articles of association and of certain requirements of the Companies’ and Associations’ Code and to report on these matters.
Aspects related to the directors’ report
In our opinion, after having performed specific procedures in relation to the directors’ report, the directors’ report is consistent with the annual accounts for the year under audit, and is prepared in accordance with the articles 3:5 and 3:6 of the Companies’ and Associations’ Code.
In the context of our audit of the annual accounts, we are also responsible for considering, in particular based on the knowledge acquired resulting from the audit, whether the directors’ report is materially misstated or contains information which is inadequately disclosed or otherwise misleading. In light of the procedures we have performed, there are no material misstatements we have to report to you.
Statement related to independence
Our registered audit firm and our network did not provide services which are incompatible with the statutory audit of the annual accounts and our registered audit firm remained independent of the Company in the course of our mandate. Other statements • Without prejudice to formal aspects of minor importance, the accounting records were maintained
in accordance with the legal and regulatory requirements applicable in Belgium.
• The appropriation of results proposed to the general meeting complies with the legal provisions and the provisions of the articles of association.
• There are no transactions undertaken or decisions taken in breach of the Company‘s articles of
association or the Companies’ and Associations’ Code that we have to report to you.
Diegem, 2 March 2022
The statutory auditor PwC Reviseurs d’Entreprises SRL / PwC Bedrijfsrevisoren BV represented by
Brieuc Lefrancq Réviseur d’Entreprises / Bedrijfsrevisor

DPAM CAPITAL B
Limited Company
Annual Report
DPAM CAPITAL B
at 31 December 2021
Public UCIT with variable capital under Belgian law
having opted to undertake investment fulfilling Directive 2009/65/EC
No subscriptions may be accepted on the basis of this report. Subscriptions are only valid if they are made after the
key investor information or the prospectus has been provided free of charge.
DPAM CAPITAL B
2
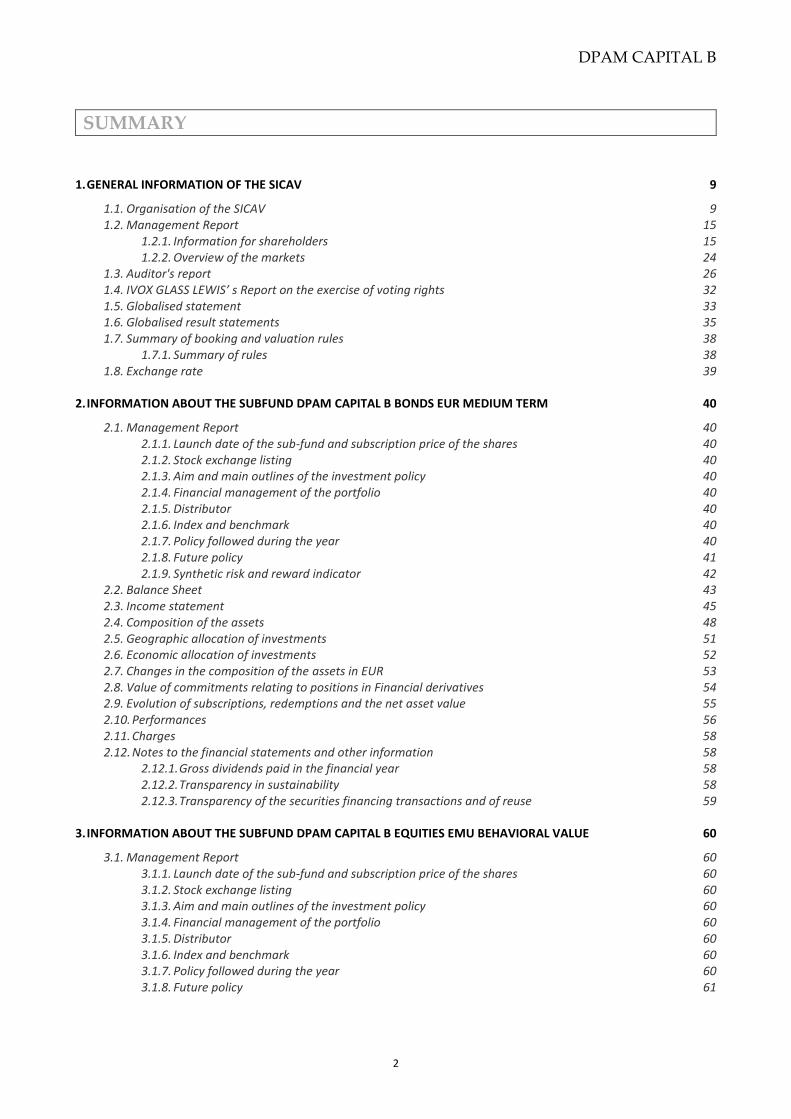
SUMMARY
1. GENERAL INFORMATION OF THE SICAV 9
1.1. Organisation of the SICAV 9 1.2. Management Report 15
1.2.1. Information for shareholders 15 1.2.2. Overview of the markets 24
1.3. Auditor's report 26 1.4. IVOX GLASS LEWIS’ s Report on the exercise of voting rights 32 1.5. Globalised statement 33 1.6. Globalised result statements 35 1.7. Summary of booking and valuation rules 38
1.7.1. Summary of rules 38 1.8. Exchange rate 39
2. INFORMATION ABOUT THE SUBFUND DPAM CAPITAL B BONDS EUR MEDIUM TERM 40
2.1. Management Report 40 2.1.1. Launch date of the sub-fund and subscription price of the shares 40 2.1.2. Stock exchange listing 40 2.1.3. Aim and main outlines of the investment policy 40 2.1.4. Financial management of the portfolio 40 2.1.5. Distributor 40 2.1.6. Index and benchmark 40 2.1.7. Policy followed during the year 40 2.1.8. Future policy 41 2.1.9. Synthetic risk and reward indicator 42
2.2. Balance Sheet 43 2.3. Income statement 45 2.4. Composition of the assets 48 2.5. Geographic allocation of investments 51 2.6. Economic allocation of investments 52 2.7. Changes in the composition of the assets in EUR 53 2.8. Value of commitments relating to positions in Financial derivatives 54 2.9. Evolution of subscriptions, redemptions and the net asset value 55 2.10. Performances 56 2.11. Charges 58 2.12. Notes to the financial statements and other information 58
2.12.1. Gross dividends paid in the financial year 58 2.12.2. Transparency in sustainability 58 2.12.3. Transparency of the securities financing transactions and of reuse 59
3. INFORMATION ABOUT THE SUBFUND DPAM CAPITAL B EQUITIES EMU BEHAVIORAL VALUE 60
3.1. Management Report 60 3.1.1. Launch date of the sub-fund and subscription price of the shares 60 3.1.2. Stock exchange listing 60 3.1.3. Aim and main outlines of the investment policy 60 3.1.4. Financial management of the portfolio 60 3.1.5. Distributor 60 3.1.6. Index and benchmark 60 3.1.7. Policy followed during the year 60 3.1.8. Future policy 61
DPAM CAPITAL B
3
3.1.9. Synthetic risk and reward indicator 61 3.2. Balance Sheet 62 3.3. Income statement 64 3.4. Composition of the assets 67 3.5. Geographic allocation of investments 70 3.6. Economic allocation of investments 71 3.7. Changes in the composition of the assets in EUR 72 3.8. Evolution of subscriptions, redemptions and the net asset value 73 3.9. Performances 74 3.10. Charges 77 3.11. Notes to the financial statements and other information 77
3.11.1. Gross dividends paid in the financial year 77 3.11.2. transparency of securities financing transactions and of reuse 77 3.11.3. Transparency in sustainability 77 3.11.4. Transparency of the securities financing transactions and of reuse 78
4. INFORMATION ABOUT THE SUBFUND DPAM CAPITAL B EQUITIES EMU INDEX 79
4.1. Management Report 79 4.1.1. Launch date of the sub-fund and subscription price of the shares 79 4.1.2. Stock exchange listing 79 4.1.3. Aim and main outlines of the investment policy 79 4.1.4. Financial management of the portfolio 79 4.1.5. Distributor 79 4.1.6. Index and benchmark 79 4.1.7. Policy followed during the year 79 4.1.8. Future policy 80 4.1.9. Synthetic risk and reward indicator 80
4.2. Balance Sheet 81 4.3. Income statement 83 4.4. Composition of the assets 85 4.5. Geographic allocation of investments 90 4.6. Economic allocation of investments 91 4.7. Changes in the composition of the assets in EUR 92 4.8. Evolution of subscriptions, redemptions and the net asset value 93 4.9. Performances 94 4.10. Charges 96 4.11. Notes to the financial statements and other information 96
4.11.1. Gross dividends paid in the financial year 96 4.11.2. Transparency in sustainability 96 4.11.3. Transparency of the securities financing transactions and of reuse 96
5. INFORMATION ABOUT THE SUBFUND DPAM CAPITAL B EQUITIES EUROPE INDEX 97
5.1. Management Report 97 5.1.1. Launch date of the sub-fund and subscription price of the shares 97 5.1.2. Stock exchange listing 97 5.1.3. Aim and main outlines of the investment policy 97 5.1.4. Financial management of the portfolio 97 5.1.5. Distributor 97 5.1.6. Index and benchmark 97 5.1.7. Policy followed during the year 97 5.1.8. Future policy 98 5.1.9. Synthetic risk and reward indicator 98
5.2. Balance Sheet 99 5.3. Income statement 101

DPAM CAPITAL B
4
5.4. Composition of the assets 104 5.5. Geographic allocation of investments 112 5.6. Economic allocation of investments 113 5.7. Changes in the composition of the assets in EUR 114 5.8. Value of commitments relating to positions in Financial derivatives 115 5.9. Evolution of subscriptions, redemptions and the net asset value 116 5.10. Performances 117 5.11. Charges 119 5.12. Notes to the financial statements and other information 119
5.12.1. Gross dividends paid in the financial year 119 5.12.2. Investment restrictions and overruns 119 5.12.3. Transparency in sustainability 119 5.12.4. Transparency of the securities financing transactions and of reuse 120
6. INFORMATION ABOUT THE SUBFUND DPAM CAPITAL B EQUITIES JAPAN INDEX 121
6.1. Management Report 121 6.1.1. Launch date of the sub-fund and subscription price of the shares 121 6.1.2. Stock exchange listing 121 6.1.3. Aim and main outlines of the investment policy 121 6.1.4. Financial management of the portfolio 121 6.1.5. Distributor 121 6.1.6. Index and benchmark 121 6.1.7. Policy followed during the year 121 6.1.8. Future policy 122 6.1.9. Synthetic risk and reward indicator 122
6.2. Balance Sheet 123 6.3. Income statement 125 6.4. Composition of the assets 128 6.5. Geographic allocation of investments 133 6.6. Economic allocation of investments 134 6.7. Changes in the composition of the assets in EUR 135 6.8. Value of commitments relating to positions in Financial derivatives 136 6.9. Evolution of subscriptions, redemptions and the net asset value 137 6.10. Performances 138 6.11. Charges 140 6.12. Notes to the financial statements and other information 140
6.12.1. Gross dividends paid in the financial year 140 6.12.2. Transparency in sustainability 140 6.12.3. Transparency of the securities financing transactions and of reuse 140
7. INFORMATION ABOUT THE SUBFUND DPAM CAPITAL B EQUITIES US BEHAVIORAL VALUE 141
7.1. Management Report 141 7.1.1. Launch date of the sub-fund and subscription price of the shares 141 7.1.2. Stock exchange listing 141 7.1.3. Aim and main outlines of the investment policy 141 7.1.4. Financial management of the portfolio 141 7.1.5. Distributor 141 7.1.6. Index and benchmark 141 7.1.7. Policy followed during the year 141 7.1.8. Future policy 142 7.1.9. Synthetic risk and reward indicator 142
7.2. Balance Sheet 143 7.3. Income statement 145 7.4. Composition of the assets 148
DPAM CAPITAL B
5
7.5. Geographic allocation of investments 151 7.6. Economic allocation of investments 152 7.7. Changes in the composition of the assets in EUR 153 7.8. Evolution of subscriptions, redemptions and the net asset value 154 7.9. Performances 156 7.10. Charges 160 7.11. Notes to the financial statements and other information 160
7.11.1. Gross dividends paid in the financial year 160 7.11.2. Transparency in sustainability 160 7.11.3. Transparency of the securities financing transactions and of reuse 161
8. INFORMATION ABOUT THE SUBFUND DPAM CAPITAL B EQUITIES US DIVIDEND SUSTAINABLE 162
8.1. Management Report 162 8.1.1. Launch date of the sub-fund and subscription price of the shares 162 8.1.2. Stock exchange listing 162 8.1.3. Aim and main outlines of the investment policy 162 8.1.4. Financial management of the portfolio 162 8.1.5. Distributor 162 8.1.6. Index and benchmark 162 8.1.7. Policy followed during the year 162 8.1.8. Future policy 163 8.1.9. Synthetic risk and reward indicator 163
8.2. Balance Sheet 164 8.3. Income statement 166 8.4. Composition of the assets 169 8.5. Geographic allocation of investments 171 8.6. Economic allocation of investments 172 8.7. Changes in the composition of the assets in EUR 173 8.8. Evolution of subscriptions, redemptions and the net asset value 174 8.9. Performances 175 8.10. Charges 178 8.11. Notes to the financial statements and other information 178
8.11.1. Gross dividends paid in the financial year 178 8.11.2. Transparency in sustainability 178 8.11.3. Transparency of the securities financing transactions and of reuse 180
9. INFORMATION ABOUT THE SUBFUND DPAM CAPITAL B EQUITIES US INDEX 181
9.1. Management Report 181 9.1.1. Launch date of the sub-fund and subscription price of the shares 181 9.1.2. Stock exchange listing 181 9.1.3. Aim and main outlines of the investment policy 181 9.1.4. Financial management of the portfolio 181 9.1.5. Distributor 181 9.1.6. Index and benchmark 181 9.1.7. Policy followed during the year 181 9.1.8. Future policy 182 9.1.9. Synthetic risk and reward indicator 182
9.2. Balance Sheet 183 9.3. Income statement 185 9.4. Composition of the assets 188 9.5. Geographic allocation of investments 198 9.6. Economic allocation of investments 199 9.7. Changes in the composition of the assets in EUR 200 9.8. Value of commitments relating to positions in Financial derivatives 201

DPAM CAPITAL B
6
9.9. Evolution of subscriptions, redemptions and the net asset value 202 9.10. Performances 203 9.11. Charges 206 9.12. Notes to the financial statements and other information 206
9.12.1. Gross dividends paid in the financial year 206 9.12.2. Investment restrictions and overruns 207 9.12.3. Transparency in sustainability 207 9.12.4. Transparency of the securities financing transactions and of reuse 207
10. INFORMATION ABOUT THE SUBFUND DPAM CAPITAL B EQUITIES WORLD EX JAPAN, EUROPE & USA INDEX 208
10.1. Management Report 208 10.1.1. Launch date of the sub-fund and subscription price of the shares 208 10.1.2. Stock exchange listing 208 10.1.3. Aim and main outlines of the investment policy 208 10.1.4. Financial management of the portfolio 208 10.1.5. Distributor 208 10.1.6. Index and benchmark 208 10.1.7. Policy followed during the year 208 10.1.8. Future policy 209 10.1.9. Synthetic risk and reward indicator 209
10.2. Balance Sheet 210 10.3. Income statement 212 10.4. Composition of the assets 214 10.5. Geographic allocation of investments 219 10.6. Economic allocation of investments 220 10.7. Changes in the composition of the assets in EUR 221 10.8. Evolution of subscriptions, redemptions and the net asset value 222 10.9. Performances 223 10.10. Charges 225 10.11. Notes to the financial statements and other information 225
10.11.1. Gross dividends paid in the financial year 225 10.11.2. Transparency in sustainability 225 10.11.3. Transparency of the securities financing transactions and of reuse 225
11. INFORMATION ABOUT THE SUBFUND DPAM CAPITAL B REAL ESTATE EMU DIVIDEND SUSTAINABLE 226
11.1. Management Report 226 11.1.1. Launch date of the sub-fund and subscription price of the shares 226 11.1.2. Stock exchange listing 226 11.1.3. Aim and main outlines of the investment policy 226 11.1.4. Financial management of the portfolio 226 11.1.5. Distributor 226 11.1.6. Index and benchmark 226 11.1.7. Policy followed during the year 226 11.1.8. Future policy 227 11.1.9. Synthetic risk and reward indicator 227
11.2. Balance Sheet 228 11.3. Income statement 230 11.4. Composition of the assets 232 11.5. Geographic allocation of investments 234 11.6. Economic allocation of investments 235 11.7. Changes in the composition of the assets in EUR 236 11.8. Evolution of subscriptions, redemptions and the net asset value 237 11.9. Performances 238 11.10. Charges 240
DPAM CAPITAL B
7
11.11. Notes to the financial statements and other information 240 11.11.1. Gross dividends paid in the financial year 240 11.11.2. Investment restrictions and overruns 240 11.11.3. Transparency in sustainability 242 11.11.4. Transparency of the securities financing transactions and of reuse 243
12. INFORMATION ABOUT THE SUBFUND DPAM CAPITAL B CORPORATE BONDS EUR 2023 244
12.1. Management Report 244 12.1.1. Launch date of the sub-fund and subscription price of the shares 244 12.1.2. Stock exchange listing 244 12.1.3. Aim and main outlines of the investment policy 244 12.1.4. Financial management of the portfolio 244 12.1.5. Distributor 244 12.1.6. Index and benchmark 244 12.1.7. Policy followed during the year 245 12.1.8. Future policy 245 12.1.9. Synthetic risk and reward indicator 245
12.2. Balance Sheet 246 12.3. Income statement 248 12.4. Composition of the assets 250 12.5. Geographic allocation of investments 253 12.6. Economic allocation of investments 254 12.7. Changes in the composition of the assets in EUR 255 12.8. Evolution of subscriptions, redemptions and the net asset value 256 12.9. Performances 257 12.10. Charges 259 12.11. Notes to the financial statements and other information 259
12.11.1. Gross dividends paid in the financial year 259 12.11.2. transparency of securities financing transactions and of reuse 259 12.11.3. Transparency in sustainability 259 12.11.4. Transparency of the securities financing transactions and of reuse 260
13. INFORMATION ABOUT THE SUBFUND DPAM CAPITAL B REAL ESTATE EMU SUSTAINABLE 261
13.1. Management Report 261 13.1.1. Launch date of the sub-fund and subscription price of the shares 261 13.1.2. Stock exchange listing 261 13.1.3. Aim and main outlines of the investment policy 261 13.1.4. Financial management of the portfolio 261 13.1.5. Distributor 261 13.1.6. Index and benchmark 261 13.1.7. Policy followed during the year 262 13.1.8. Future policy 262 13.1.9. Synthetic risk and reward indicator 262
13.2. Balance Sheet 263 13.3. Income statement 265 13.4. Composition of the assets 268 13.5. Geographic allocation of investments 270 13.6. Economic allocation of investments 271 13.7. Changes in the composition of the assets in EUR 272 13.8. Evolution of subscriptions, redemptions and the net asset value 273 13.9. Performances 274 13.10. Charges 277 13.11. Notes to the financial statements and other information 277
13.11.1. Gross dividends paid in the financial year 277
DPAM CAPITAL B
8
13.11.2. Investment restrictions and overruns 277 13.11.3. Transparency in sustainability 278 13.11.4. Transparency of the securities financing transactions and of reuse 279
14. INFORMATION ABOUT THE SUBFUND DPAM CAPITAL B EQUITIES US ESG LEADERS INDEX 280
14.1. Management Report 280 14.1.1. Launch date of the sub-fund and subscription price of the shares 280 14.1.2. Stock exchange listing 280 14.1.3. Aim and main outlines of the investment policy 280 14.1.4. Financial management of the portfolio 280 14.1.5. Distributor 280 14.1.6. Index and benchmark 280 14.1.7. Policy followed during the year 280 14.1.8. Future policy 281 14.1.9. Synthetic risk and reward indicator 281
14.2. Balance Sheet 282 14.3. Income statement 284 14.4. Composition of the assets 287 14.5. Geographic allocation of investments 292 14.6. Economic allocation of investments 293 14.7. Changes in the composition of the assets in EUR 294 14.8. Evolution of subscriptions, redemptions and the net asset value 295 14.9. Performances 296 14.10. Charges 299 14.11. Notes to the financial statements and other information 299
14.11.1. transparency of securities financing transactions and of reuse 299 14.11.2. Investment restrictions and overruns 299 14.11.3. Transparency in sustainability 300 14.11.4. Transparency of the securities financing transactions and of reuse 301
DPAM CAPITAL B
9
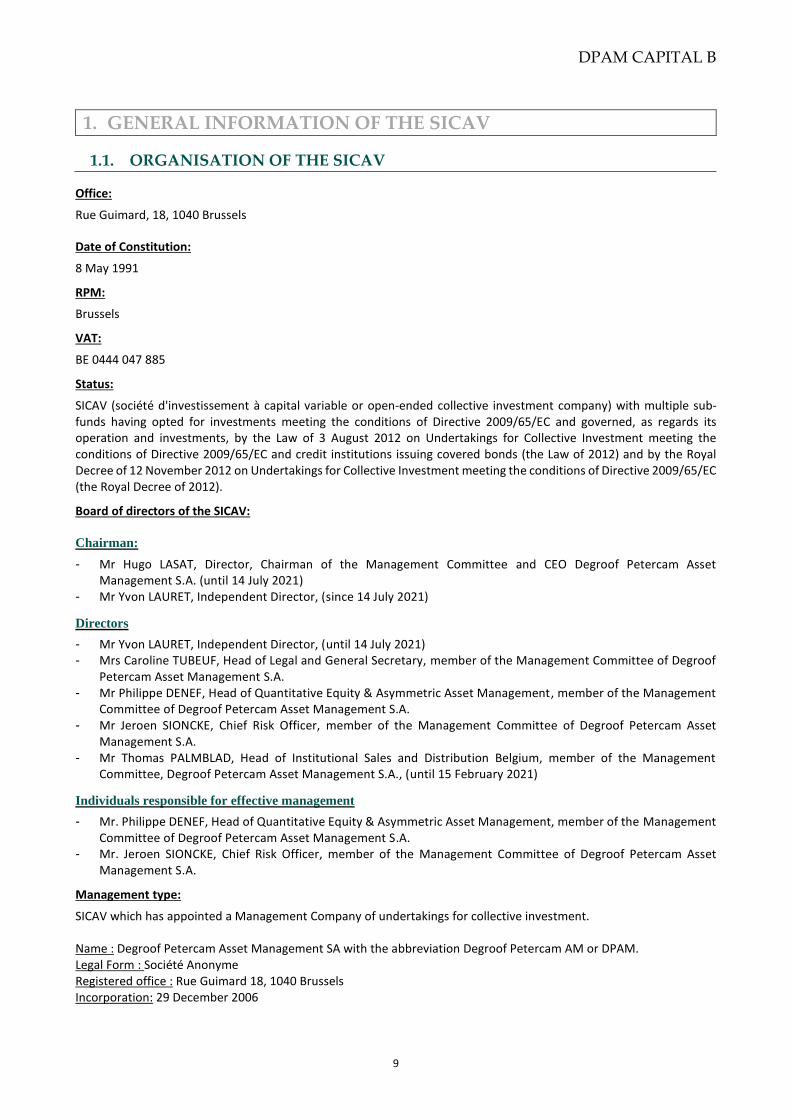
1. GENERAL INFORMATION OF THE SICAV DPAM CAPITAL B
1.1. ORGANISATION OF THE SICAV
Office:
Rue Guimard, 18, 1040 Brussels
Date of Constitution:
8 May 1991
RPM:
Brussels
VAT:
BE 0444 047 885
Status:
SICAV (société d'investissement à capital variable or open-ended collective investment company) with multiple sub-funds having opted for investments meeting the conditions of Directive 2009/65/EC and governed, as regards its operation and investments, by the Law of 3 August 2012 on Undertakings for Collective Investment meeting the conditions of Directive 2009/65/EC and credit institutions issuing covered bonds (the Law of 2012) and by the Royal Decree of 12 November 2012 on Undertakings for Collective Investment meeting the conditions of Directive 2009/65/EC (the Royal Decree of 2012).
Board of directors of the SICAV:
Chairman:
- Mr Hugo LASAT, Director, Chairman of the Management Committee and CEO Degroof Petercam Asset Management S.A. (until 14 July 2021)
- Mr Yvon LAURET, Independent Director, (since 14 July 2021)
Directors
- Mr Yvon LAURET, Independent Director, (until 14 July 2021) - Mrs Caroline TUBEUF, Head of Legal and General Secretary, member of the Management Committee of Degroof
Petercam Asset Management S.A. - Mr Philippe DENEF, Head of Quantitative Equity & Asymmetric Asset Management, member of the Management
Committee of Degroof Petercam Asset Management S.A. - Mr Jeroen SIONCKE, Chief Risk Officer, member of the Management Committee of Degroof Petercam Asset
Management S.A. - Mr Thomas PALMBLAD, Head of Institutional Sales and Distribution Belgium, member of the Management
Committee, Degroof Petercam Asset Management S.A., (until 15 February 2021)
Individuals responsible for effective management
- Mr. Philippe DENEF, Head of Quantitative Equity & Asymmetric Asset Management, member of the Management Committee of Degroof Petercam Asset Management S.A.
- Mr. Jeroen SIONCKE, Chief Risk Officer, member of the Management Committee of Degroof Petercam Asset Management S.A.
Management type:
SICAV which has appointed a Management Company of undertakings for collective investment. Name : Degroof Petercam Asset Management SA with the abbreviation Degroof Petercam AM or DPAM. Legal Form : Société Anonyme Registered office : Rue Guimard 18, 1040 Brussels Incorporation: 29 December 2006
DPAM CAPITAL B
10
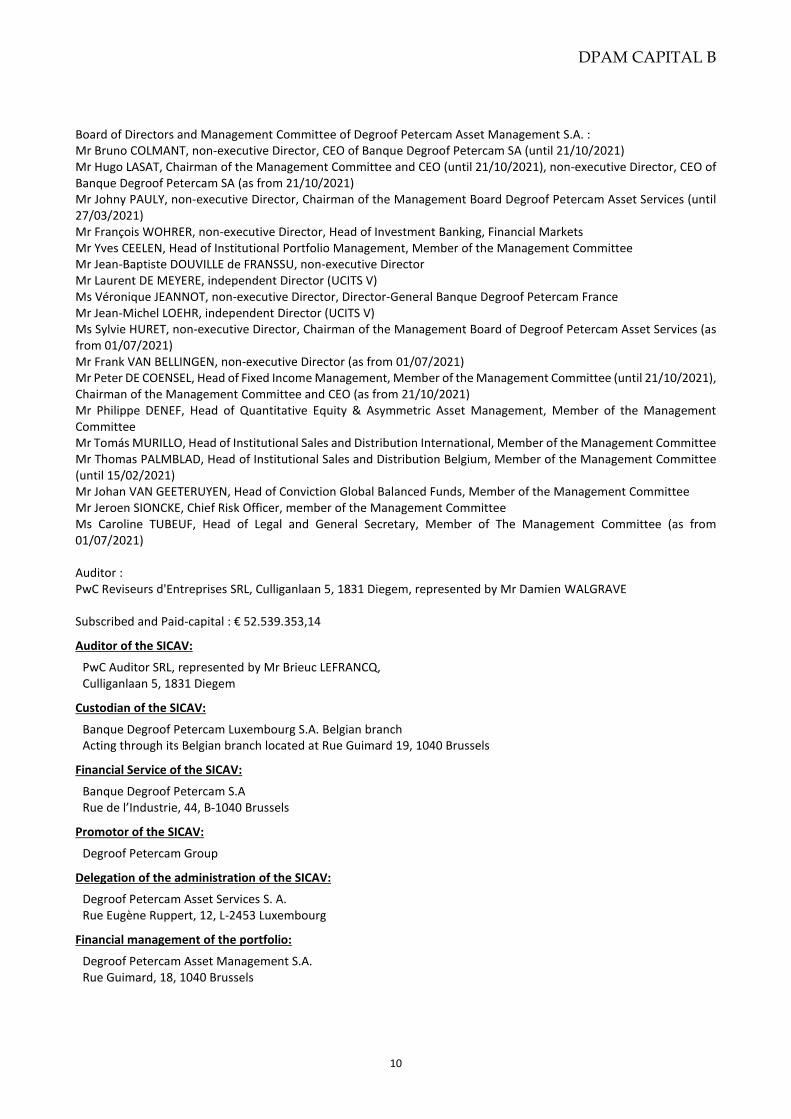
Board of Directors and Management Committee of Degroof Petercam Asset Management S.A. : Mr Bruno COLMANT, non-executive Director, CEO of Banque Degroof Petercam SA (until 21/10/2021) Mr Hugo LASAT, Chairman of the Management Committee and CEO (until 21/10/2021), non-executive Director, CEO of Banque Degroof Petercam SA (as from 21/10/2021) Mr Johny PAULY, non-executive Director, Chairman of the Management Board Degroof Petercam Asset Services (until 27/03/2021) Mr François WOHRER, non-executive Director, Head of Investment Banking, Financial Markets Mr Yves CEELEN, Head of Institutional Portfolio Management, Member of the Management Committee Mr Jean-Baptiste DOUVILLE de FRANSSU, non-executive Director Mr Laurent DE MEYERE, independent Director (UCITS V) Ms Véronique JEANNOT, non-executive Director, Director-General Banque Degroof Petercam France Mr Jean-Michel LOEHR, independent Director (UCITS V) Ms Sylvie HURET, non-executive Director, Chairman of the Management Board of Degroof Petercam Asset Services (as from 01/07/2021) Mr Frank VAN BELLINGEN, non-executive Director (as from 01/07/2021) Mr Peter DE COENSEL, Head of Fixed Income Management, Member of the Management Committee (until 21/10/2021), Chairman of the Management Committee and CEO (as from 21/10/2021) Mr Philippe DENEF, Head of Quantitative Equity & Asymmetric Asset Management, Member of the Management Committee Mr Tomás MURILLO, Head of Institutional Sales and Distribution International, Member of the Management Committee Mr Thomas PALMBLAD, Head of Institutional Sales and Distribution Belgium, Member of the Management Committee (until 15/02/2021) Mr Johan VAN GEETERUYEN, Head of Conviction Global Balanced Funds, Member of the Management Committee Mr Jeroen SIONCKE, Chief Risk Officer, member of the Management Committee Ms Caroline TUBEUF, Head of Legal and General Secretary, Member of The Management Committee (as from 01/07/2021) Auditor : PwC Reviseurs d'Entreprises SRL, Culliganlaan 5, 1831 Diegem, represented by Mr Damien WALGRAVE Subscribed and Paid-capital : € 52.539.353,14
Auditor of the SICAV:
PwC Auditor SRL, represented by Mr Brieuc LEFRANCQ, Culliganlaan 5, 1831 Diegem
Custodian of the SICAV:
Banque Degroof Petercam Luxembourg S.A. Belgian branch Acting through its Belgian branch located at Rue Guimard 19, 1040 Brussels
Financial Service of the SICAV:
Banque Degroof Petercam S.A Rue de l’Industrie, 44, B-1040 Brussels
Promotor of the SICAV:
Degroof Petercam Group
Delegation of the administration of the SICAV:
Degroof Petercam Asset Services S. A. Rue Eugène Ruppert, 12, L-2453 Luxembourg
Financial management of the portfolio:
Degroof Petercam Asset Management S.A. Rue Guimard, 18, 1040 Brussels

DPAM CAPITAL B
11
Administration and accounting management:
DEGROOF PETERCAM ASSET SERVICES - 12 rue Eugène Ruppert – L-2453 Luxembourg
Distributor of the SICAV:
Degroof Petercam Asset Management S.A. Rue Guimard, 18, 1040 Brussels
List of sub-funds and share classes marketed by the SICAV : DPAM CAPITAL B Equities US Behavioral Value (class A-A USD-B-B USD-E-E USD-F-F USD-J-L-L
USD-M-M USD-N-N USD-P-V-W) DPAM CAPITAL B Equities Europe Index (class A-B-E-F-J-M-N-P) DPAM CAPITAL B Real Estate EMU Dividend Sustainable (class A-B-E-F-J-M-N-P-V-W) DPAM CAPITAL B Equities US Index (class A-A USD-B-B USD-E-F- J-M-M USD-N-N
USD-P) DPAM CAPITAL B Bonds EUR Medium Term (class A-B-E-F-J-M-N-P-V-W) DPAM CAPITAL B Equities Japan Index (class A-B-E-F-J-M-N-P) DPAM CAPITAL B Equities World ex Japan, Europe & USA Index (class A-B-E-F-J-M-N-P) DPAM CAPITAL B Equities EMU Index (class A-B-E-F-J-M-N-P) DPAM CAPITAL B Equities US Dividend Sustainable (class A-A USD-B-B EUR Hedged-B LC-B USD-E-E
USD-F-F EUR Hedged-F LC-F USD-J-M-N-P-V-W-W EUR Hedged)
DPAM CAPITAL B Equities EMU Behavioral Value (class A-B-E-F-J-L-M-N-P-V-W) DPAM CAPITAL B Corporate Bonds EUR 2023 (class A-B-E-F-J-M-N-P) DPAM CAPITAL B Real Estate EMU Sustainable (class A-B-E-F-J-M-N-P-V-W) DPAM CAPITAL B Equities US ESG Leaders Index (class A-A USD-B-B USD-E-F-J-M-M USD-N-N USD-
P) Description of share classes : Class A : distribution shares offered to the public
Class A USD :
distribution shares which differ from class A shares due to the fact that they are denominated in United States dollars.
Class E :
distribution shares which differ from class A shares due to the fact that (i) they are reserved for eligible investors* dealing
on behalf of their own name, (ii) they have a minimum initial subscription amount, (iii) a different management fee and (iv)
a different annual tax.
Class E USD :
distribution shares which differ from class E shares due to the fact that they are denominated in United States dollars.
Class V :
distribution shares which differ from class A shares due to the fact that (i) at the discretion of the Management Company
they may be offered to distributors and platforms in the United Kingdom, Switzerland and European Union Member States,
excluding Banque Degroof Petercam Belgium and Banque Degroof Petercam Luxembourg, (ii) they may be offered by
distributors and platforms that have entered into separate remuneration agreements with their customers that are not
subject to any rebate, and (iii) they are not subject to a rebate on management fees.
Class M :
distribution shares which differ from class A shares due to the fact that (i) they are reserved for investors having one or
more current discretionary management mandates with one or more companies belonging to Degroof Petercam Group,
(ii) they are reserved for the account(s) to which these discretionary management mandates apply, (iii) they are reserved
for mandates with “all in” pricing and in that (iv) they have a different management fee.
DPAM CAPITAL B
12
In this context, "all in" includes at least the management fees and custody fees charged to the account (s) to which these
"all in" discretionary management mandates apply.
Class M USD :
distribution shares which differ from class M shares due to the fact that they are denominated in United States dollar.
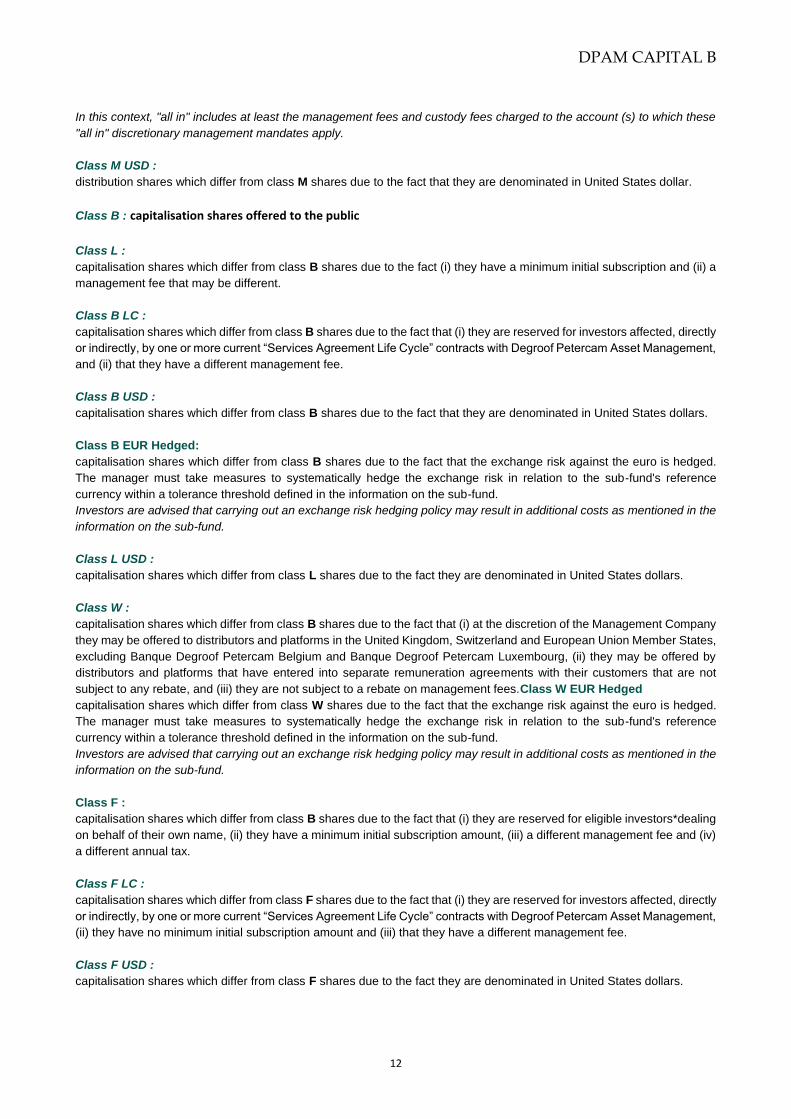
Class B : capitalisation shares offered to the public
Class L :
capitalisation shares which differ from class B shares due to the fact (i) they have a minimum initial subscription and (ii) a
management fee that may be different.
Class B LC :
capitalisation shares which differ from class B shares due to the fact that (i) they are reserved for investors affected, directly
or indirectly, by one or more current “Services Agreement Life Cycle” contracts with Degroof Petercam Asset Management,
and (ii) that they have a different management fee.
Class B USD :
capitalisation shares which differ from class B shares due to the fact that they are denominated in United States dollars.
Class B EUR Hedged:
capitalisation shares which differ from class B shares due to the fact that the exchange risk against the euro is hedged.
The manager must take measures to systematically hedge the exchange risk in relation to the sub-fund's reference
currency within a tolerance threshold defined in the information on the sub-fund.
Investors are advised that carrying out an exchange risk hedging policy may result in additional costs as mentioned in the
information on the sub-fund.
Class L USD :
capitalisation shares which differ from class L shares due to the fact they are denominated in United States dollars.
Class W :
capitalisation shares which differ from class B shares due to the fact that (i) at the discretion of the Management Company
they may be offered to distributors and platforms in the United Kingdom, Switzerland and European Union Member States,
excluding Banque Degroof Petercam Belgium and Banque Degroof Petercam Luxembourg, (ii) they may be offered by
distributors and platforms that have entered into separate remuneration agreements with their customers that are not
subject to any rebate, and (iii) they are not subject to a rebate on management fees.Class W EUR Hedged
capitalisation shares which differ from class W shares due to the fact that the exchange risk against the euro is hedged.
The manager must take measures to systematically hedge the exchange risk in relation to the sub-fund's reference
currency within a tolerance threshold defined in the information on the sub-fund.
Investors are advised that carrying out an exchange risk hedging policy may result in additional costs as mentioned in the
information on the sub-fund.
Class F :
capitalisation shares which differ from class B shares due to the fact that (i) they are reserved for eligible investors*dealing
on behalf of their own name, (ii) they have a minimum initial subscription amount, (iii) a different management fee and (iv)
a different annual tax.
Class F LC :
capitalisation shares which differ from class F shares due to the fact that (i) they are reserved for investors affected, directly
or indirectly, by one or more current “Services Agreement Life Cycle” contracts with Degroof Petercam Asset Management,
(ii) they have no minimum initial subscription amount and (iii) that they have a different management fee.
Class F USD :
capitalisation shares which differ from class F shares due to the fact they are denominated in United States dollars.

DPAM CAPITAL B
13
Class F EUR Hedged:
capitalisation shares which differ from class F shares due to the fact that the exchange risk against the euro is hedged.
The manager must take measures to systematically hedge the exchange risk in relation to the sub-fund's reference
currency within a tolerance threshold defined in the information on the sub-fund.
Investors are advised that carrying out an exchange risk hedging policy may result in additional costs as mentioned in the
information on the sub-fund.
Class J :
capitalisation shares which differ from class F shares due to the fact that (i) they are reserved for investors for which there
are currently one or more discretionary management mandates with one or several companies of the Degroof Petercam
Group, (ii) accounts to which these discretionary management mandates apply, due to the fact that (iii) they have no
minimum initial subscription amount and (iv) they have a different management fee.
Class N :
capitalisation shares which differ from class B shares due to the fact that (i) they are reserved for investors for which there
are currently one or more discretionary management mandates with one or several companies of the Degroof Petercam
Group, and (ii) accounts to which these discretionary management mandates apply, (iii) they are reserved for mandates
with “all in” pricing and in that (iv) they have a different management fee.
In this context, “all in” includes at least the management fees and custody fees charged to the account (s) to which these
"all in" discretionary management mandates apply.
Class N USD :
capitalisation shares which differ from class N shares due to the fact that they are denominated in United States dollar.
Class P :
capitalisation shares which differ from class F shares by the absence of (i) a management fee and (ii) a minimum initial
subscription amount, due to the fact that (iii) they are reserved for investors that have one of more discretionary mandates
with Degroof Petercam Asset Management and (iv) they are reserved for the accounts where this discretionary mandates
are applicable.
*"eligible investors" are investors within the meaning of Article 5 of the Law of 3 August 2012, namely the corporate
customers referred to in Appendix A of the Royal Decree of 3 June 2007 on the rules transposing the Directive on markets
in financial instruments (MiFID), as well as eligible counterparties within the meaning of Article 3, §1 of the above-
mentioned Royal Decree of 3 June 2007 and legal entities which are not considered corporate investors and which have
asked to be entered in the FSMA register of eligible investors. The natural person, also the legal person that are not part
of the definition eligible investors as mentioned above, have no access to this share class, also if the subscription are made
in the context of a discretionary mandate.
Distribution outside Belgium : Netherlands : Financial service: Bank Degroof Petercam SA, Rue de l’Industrie 44, 1040 Brussels Spain : Representative of the SICAV: AllFunds Bank NV, C/ de los Padres Dominicos 7,28050 Madrid Switserland : Representative and bank responsible for the payment service: Banque Degroof Petercam (Suisse) SA, Place de l’Université 8, CH-1205 Genève France : Centralisator correspondent : Caceis Bank France, 1-3 place Valhubert, F-75206 Paris Cedex 13 Luxembourg : Financial service : Banque Degroof Petercam Luxembourg SA, 12 rue Eugène Ruppert, L-2453 Luxembourg Germany : Paying Agent: Marcard, Stein & Co AG, Ballindamm 36, D-20095 Hamburg Italy : Paying Agent: Allfunds Bank S.A.U, Milan Branch, Via Bocchetto 6, 20123 Milano, Italy and Société Générale Securities Services S.p.A., Via Benigno Crespi 19A, IT-MAC2 Milano Austria : Paying Agent: Erste Bank der oesterreichischen Sparkassen AG, Am Belvedere 1, 1100 Wien, Österreich

DPAM CAPITAL B
14
COUNTRIES OF COMMERCIALIZATION
The consolidated balance sheet covers all the existing sub funds, regardless of whether they are distributed in the following countries: - Germany - Austria - Spain - France - Italy - Luxemburg - The Netherlands - Switzerland
Su
bF
un
dN
am
e
Au
str
ia
Belg
ium
Sw
itzerl
an
d
Germ
an
y
Sp
ain
Fra
nce
Italy
*
Lu
xem
bu
rg
Neth
erl
an
ds
DPAM CAPITAL B Bonds EUR Medium Term x x x x x x x
DPAM CAPITAL B Corporate Bonds EUR 2023 x x
DPAM CAPITAL B Equities Belgium x x x x x x
DPAM CAPITAL B Equities EMU Behavioral Value x x x x x x x x x
DPAM CAPITAL B Equities EMU Index x x x x
DPAM CAPITAL B Equities Europe Index x x x x
DPAM CAPITAL B Equities Japan Index x x x x x
DPAM CAPITAL B Equities US Behavioral Value x x x x x x x x x
DPAM CAPITAL B Equities US Dividend Sustainable x x x x x x x x x
DPAM CAPITAL B Equities US ESG Leaders Index x
DPAM CAPITAL B Equities US Index x x x x x
DPAM CAPITAL B Equities World ex Japan, Europe & USA Index x x x x x
DPAM CAPITAL B Real Estate EMU Dividend Sustainable x x x x x x x x
DPAM CAPITAL B Real Estate EMU Sustainable x x x x x x x x x
*institutional only

DPAM CAPITAL B
15
1.2. MANAGEMENT REPORT DPAM CAPITAL B
1.2.1. Information for shareholders
Generalities
DPAM CAPITAL B is an undertaking for collective investment (UCI), hereinafter SICAV. The Board of Directors of 4 February 2021 took note of the resignation of Mr Thomas Palmblad from his function as Director of the SICAV with effect from 15 February 2021. The Board of Directors of 4 February 2021 also took note of the classification of the sub-funds of the SICAV proposed by DPAM in its capacity as management company within the framework of the Regulation EU 2019/2088 of 27 November 2019 on the publication of sustainability-related information in the financial services sector (SFDR) which entered into force on 10 March 2021 and agreed with the amendments to be made to the prospectus and KIID following the entry into force of this Regulation. The extraordinary general meeting of 18 February 2021 approved the merger by absorption of the sub-fund DPAM CAPITAL B Equities Belgium of the SICAV to the sub-fund DPAM INVEST B Equities Europe Small Caps Sustainable of the SICAV DPAM INVEST B. The ordinary general meeting of 18 March 2021 approved, among other things, the annual accounts closed on 31 December 2020 and the distribution of a dividend to the holders of distribution shares of certain sub-funds of the SICAV as mentioned in the notice published on March 19 March 2021. The ordinary general meeting of 18 March 2021 also granted discharge to Mr Thomas Palmblad for his function as Director until 15 February 2021 for the current financial year ending 31 December 2021. The Board of Directors of 18 May 2021 decided to change the administration fee and the portfolio management fee of some sub-funds with effect from 1st October 2021. The Board of Directors of 18 May 2021 also decided to change the objective of the sub-fund DPAM CAPITAL B Real Estate EMU Dividend Sustainable and to activate B EUR Hedged, F EUR Hedged and W EUR Hedged share classes in the sub-fund DPAM CAPITAL B Equities US Dividend Sustainable. On 26 August 2021, the Board of Directors decided to reclassify the DPAM CAPITAL B Bonds Eur Medium Term and Corporate Bonds EUR 2023 sub-funds of the SICAV from an Article 6 (or "other") classification to an Article 8 classification in accordance with EU Regulation 2019/2088 (SFDR). The meeting of the Board of Directors on 26 August also acknowledged the resignation of Mr Hugo Lasat from his office as Director and Chairman of the Board on 14 July 2021, and appointed Mr Yvon Lauret as Chairman of the Board to replace Mr Hugo Lasat.
Fee Sharing agreements
Fee-sharing agreements between, on the one hand, the SICAV or where applicable the distributor and the investment portfolio manager and, on the other hand, other distributors mentioned where applicable in the prospectus and third parties (including investors in the undertaking for collective investment), may exist but are in no case exclusive. These agreements do not affect the manager's ability to perform its duties freely in the interests of the shareholders of the SICAV. The management fee is shared in accordance with market conditions and particularly according to the size of their investment. The information concerning the remuneration retroceded by the manager is taken up at the level of each sub-fund concerned under point "Charges”

DPAM CAPITAL B
16
Aberdeen and Fokus Bank
As the result of the Aberdeen and Fokus Bank rulings by the European Union Court of Justice concerning discrimination in the tax laws of certain EU Member States towards foreign UCIs, DPAM CAPITAL B has taken steps, with the help of the management company and external consultants, to reclaim the supplementary withholding tax paid and not recovered. The costs will be charged immediately to the current financial year. The SICAV did not make any redemptions during 2021.
Class Action
During 2021, the SICAV was credited with the following amounts under a "Class Action »:
Sub-fund Class action Amount
DPAM CAPITAL B Equities US Index FleetCor Technologies USD 79,727.02
DPAM CAPITAL B Equities US Behavioral Value
FleetCor Technologies (Second Distribution) USD 5,843.58
Information required under Article 3 :6 §1 of the Company and Association Code
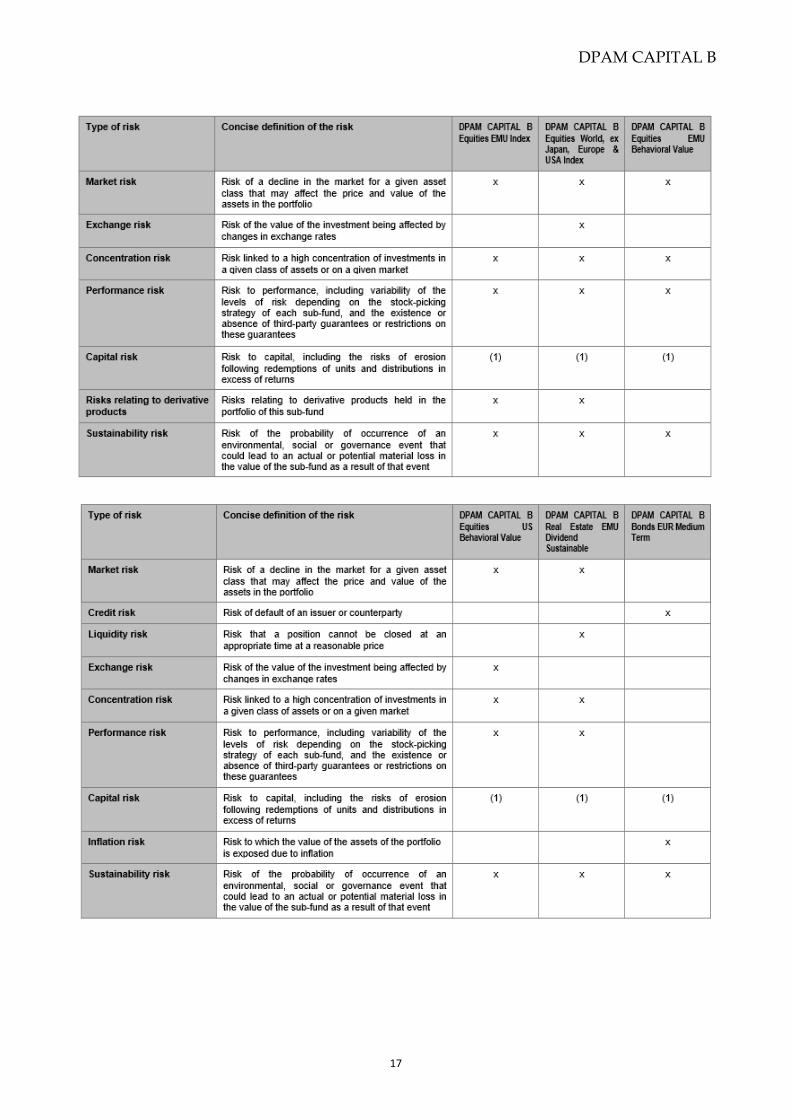
Risk factors
In view of the status of DPAM CAPITAL B as a société d’investissement au capital variable (SICAV, or open-ended investment company), its development and results are influenced by various risk factors, including two over which the Board of Directors has little or no control:
- subscription and redemption applications, - direct and indirect risks inherent in financial markets. The risk factors, which are also described in the prospectus, can be broken down as follows:
DPAM CAPITAL B
17

DPAM CAPITAL B
18
(1): The sub-fund has no capital protection or guarantee

DPAM CAPITAL B
19
Other information:
No significant event has occurred since the closing date of the financial year and no circumstance is likely to have a significant influence on the development of the SICAV with the exception of those mentioned under the heading “Events after the reporting period". All circumstances likely to have a significant influence on the SICAV are set out in this annual report. The SICAV has not carried out any research and development activities. The SICAV employs no staff and has no branches. This report includes all the information that must be included in accordance with the Companies Code. In accordance with its status, the SICAV acquires its own shares with a view to meeting redemption requests. Information on this subject is given each sub-fund. Remuneration and mission of the auditor
The auditor’s fees in respect of its auditor mandate amount 3,250.00 EUR per year and per subfund. During the financial year neither the statutory auditor nor persons that have developed a professional cooperation with him carried out any exceptional service or any special assignment. Concerning the use of financial instruments by the company, and where relevant for the valuation of its assets, liabilities, financial situation and profit or loss:
1/ Statement of the SICAV’s objectives and financial risk management policy: please refer to the chapters on each sub-fund in this report. 2/ Indications regarding the SICAV’s exposure to price risk, credit risk, liquidity risk and cash-flow risk: please refer to the section on risk factors.
Comments on the balance sheet
The balance sheet total, which is identical to equity, amounted to EUR 4,549,274,224.87, of which EUR 4,517,732,094.23 in transferable securities, money market instruments, UCIs and financial derivative instruments. For the year 2021, the result amounts to EUR 997,739,192.89, the result carried forward amounts to EUR 967,600,716.56 and the profit sharing received amounts to EUR -22,608,794.44.
Appropriation of profits
Profit for the year to be allocated amounted to EUR 1,942,731,115.01. The Board of Directors will propose to the general meeting of shareholders that this profit be appropriated as follows: a distribution of EUR 3,219,477.00 to the following distribution shares:
Subfund ISIN Class Dividend per
share Coupon n°
DPAM CAPITAL B Bonds EUR Medium Term BE6261452054 A 5.83 EUR
DPAM CAPITAL B Bonds EUR Medium Term BE6299510394 M 6.45 EUR
DPAM CAPITAL B Corporate Bonds EUR 2023 BE6292995238 A 1.18 EUR
DPAM CAPITAL B Corporate Bonds EUR 2023 BE6299514438 M 1.2 EUR
DPAM CAPITAL B Equities EMU Behavioral Value BE6289166744 A 1.47 EUR
DPAM CAPITAL B Equities EMU Behavioral Value BE6299524536 M 1.49 EUR
DPAM CAPITAL B Equities EMU Index BE6289162701 A 2.55 EUR
DPAM CAPITAL B Equities EMU Index BE6299528578 M 2.55 EUR
DPAM CAPITAL B Equities Europe Index BE6289131391 A 2.79 EUR
DPAM CAPITAL B Equities Europe Index BE6299532612 M 2.81 EUR

DPAM CAPITAL B
20
DPAM CAPITAL B Equities Japan Index BE6289154625 A 2.2 EUR
DPAM CAPITAL B Equities Japan Index BE6299536654 M 2.21 EUR
DPAM CAPITAL B Equities US Behavioral Value BE6289193045 A 1.13 EUR
DPAM CAPITAL B Equities US Behavioral Value BE6299541704 M 1.14 EUR
DPAM CAPITAL B Equities US Behavioral Value BE6304435173 M USD 1.48 USD
DPAM CAPITAL B Equities US Dividend Sustainable
BE6289210211 A 3.01 EUR
DPAM CAPITAL B Equities US Dividend Sustainable
BE6289214254 E 3.58 EUR
DPAM CAPITAL B Equities US Dividend Sustainable
BE6299545747 M 3.22 EUR
DPAM CAPITAL B Equities US Dividend Sustainable
BE6289226373 V 3.63 EUR
DPAM CAPITAL B Equities US ESG Leaders Index BE6317165403 A 1.66 EUR
DPAM CAPITAL B Equities US ESG Leaders Index BE6317466504 A USD 2.04 USD
DPAM CAPITAL B Equities US ESG Leaders Index BE6317172474 M 1.67 EUR
DPAM CAPITAL B Equities US ESG Leaders Index BE6317467510 M USD 2.05 USD
DPAM CAPITAL B Equities US Index BE6289146548 A 2.69 EUR
DPAM CAPITAL B Equities US Index BE6289147553 A USD 3.08 USD
DPAM CAPITAL B Equities US Index BE6289150581 E 0.34 EUR
DPAM CAPITAL B Equities US Index BE6299549780 M 2.7 EUR
DPAM CAPITAL B Equities World ex-Japan Europe & USA Index
BE6289164723 A 3.99 EUR
DPAM CAPITAL B Real Estate EMU Dividend Sustainable
BE0947578820 E 2.15 EUR
DPAM CAPITAL B Real Estate EMU Dividend Sustainable
BE6299347706 M 61.61 EUR
DPAM CAPITAL B Real Estate EMU Sustainable BE6289023283 A 1.9 EUR
DPAM CAPITAL B Real Estate EMU Sustainable BE6299320430 M 1.92 EUR
- to carry forward the balance of the profit to be appropriated, amounting to EUR 1,939,511,638.01.
Events after the closure
In order to allow the DPAM CAPITAL B Bonds EUR Medium Term and DPAM CAPITAL B Corporate Bonds EUR 2023 sub-funds to promote environmental and social characteristics within the meaning of Regulation (EU) 2019/2088 of the European Parliament and of the Council of 27 November 2019 on sustainability information in the financial services sector (Regulation 2019/2088), changes and clarifications have been made to the investment policy of these sub-funds in the Prospectus of the SICAV with effect from 1 January 2022. As from 1 January 2022, the representative of the SICAV in Switzerland is ACOLIN Fund Services AG, Leutschenbachstrasse 50, CH-8050 Zurich, and the paying agent is Banque Degroof Petercam (Suisse) SA, Place de l'Université 8 – 1205 Geneva. Further to a proposal of the board of directors of 25 November 2021, on 1 February 2022 the FSMA approved the following merger by absorption: all of the assets and liabilities of each sub-fund of the DPAM CAPITAL B Sicav and of each sub-fund of the DPAM HORIZON B Sicav will be transferred simultaneously (sub-fund by sub-fund) to the new sub-funds created in the DPAM INVEST B Sicav (absorbing sub-funds). Following the transaction, the DPAM INVEST B Sicav will be renamed DPAM B. All sub-funds will be renamed accordingly.
DPAM CAPITAL B
21
These merger transactions in accordance with Article 163 of the Royal Decree of 2012 will take place sub-fund by sub-fund, under the following conditions: - 1° as a result of the transaction, all the assets and liabilities of each sub-fund of the DPAM CAPITAL B Sicav and of each sub-fund of the DPAM HORIZON B Sicav will be transferred to each of the corresponding new sub-funds of the DPAM INVEST B Sicav; these new sub-funds will be launched following the transfer of all the assets and liabilities as a result of the merger by absorption of each sub-fund; - 2° following the transaction, each shareholder of each sub-fund to be absorbed will be entitled to one share of the same type (and with the same definition) and belonging to a similar share class of the corresponding absorbing sub-fund; share classes identical to the existing share classes of each sub-fund to be absorbed will be created in the corresponding absorbing sub-fund following the transfer of all assets and liabilities, as a result of the merger by absorption, so that all existing ISIN codes in each sub-fund to be absorbed will remain unchanged and identical in the corresponding absorbing sub-fund. On 14 February 2022, shareholders were convened to the extraordinary general meetings of 24 March 2022 and received all information relating to this merger. Subject to the approval of the general meeting of each of the sub-funds of the DPAM CAPITAL B Sicav and DPAM HORIZON B Sicav to be absorbed, and to the approval of the general meeting of the DPAM INVEST B Sicav of 24 March 2022, the merger will take effect on 1 April 2022. Following the merger of all of their sub-funds, the DPAM CAPITAL B Sicav and DPAM HORIZON B Sicav will cease to exist and the DPAM INVEST B Sicav (renamed DPAM B) will consist of 37 sub-funds.
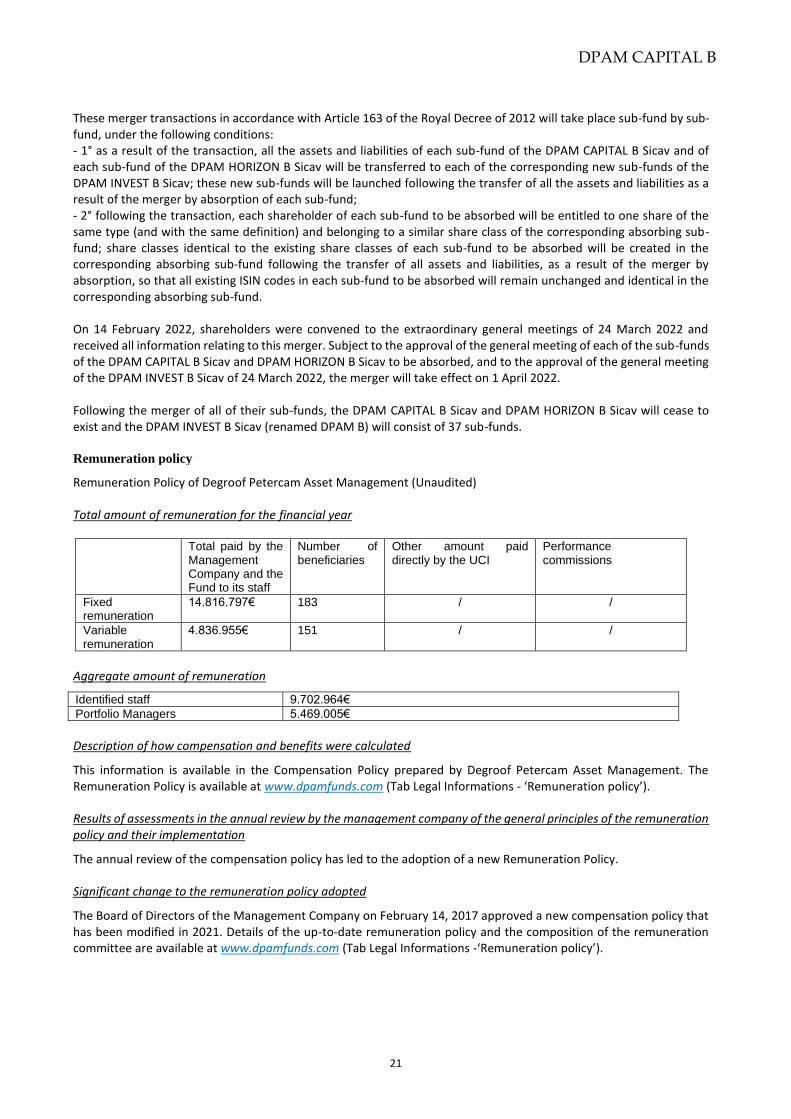
Remuneration policy
Remuneration Policy of Degroof Petercam Asset Management (Unaudited)
Total amount of remuneration for the financial year
Total paid by the Management Company and the Fund to its staff
Number of beneficiaries
Other amount paid directly by the UCI
Performance commissions
Fixed remuneration
14.816.797€ 183 / /
Variable remuneration
4.836.955€ 151 / /
Aggregate amount of remuneration
Identified staff 9.702.964€
Portfolio Managers 5.469.005€
Description of how compensation and benefits were calculated
This information is available in the Compensation Policy prepared by Degroof Petercam Asset Management. The Remuneration Policy is available at www.dpamfunds.com (Tab Legal Informations - ‘Remuneration policy’).
Results of assessments in the annual review by the management company of the general principles of the remuneration policy and their implementation
The annual review of the compensation policy has led to the adoption of a new Remuneration Policy.
Significant change to the remuneration policy adopted
The Board of Directors of the Management Company on February 14, 2017 approved a new compensation policy that has been modified in 2021. Details of the up-to-date remuneration policy and the composition of the remuneration committee are available at www.dpamfunds.com (Tab Legal Informations -‘Remuneration policy’).

DPAM CAPITAL B
22
Regulation EU 2015/2365 of the European Parliament and the council of November 25th, 2015:
Transparency of securities financing transactions and of reuse (hereinafter the Regulation) In accordance with Article 13 and Section A of the Annex to the Regulation, the SICAV must inform investors of the use it makes of securities financing transactions and total return swaps in its annual and half-yearly reports. The information for the sub funds concerned by the obligations of this Regulation, can be found under the item « Notes to the financial statements and other information ».
Use of liquidity management tools The Directors decided, pursuant to the Royal Decree of October 15, 2018 regarding the liquidity tools, to introduce the possibility of using the following liquidity tools:
I. SWING PRICING
1. List of sub-funds that may use swing pricing:
DPAM CAPITAL B Equities US Behavioral Value DPAM CAPITAL B Equities Europe Index DPAM CAPITAL B Real Estate EMU Dividend Sustainable DPAM CAPITAL B Equities US Index DPAM CAPITAL B Bonds EUR Medium Term DPAM CAPITAL B Equities Japan Index DPAM CAPITAL B Equities World ex Japan, Europe & USA Index DPAM CAPITAL B Equities EMU Index DPAM CAPITAL B Equities US Dividend Sustainable DPAM CAPITAL B Equities EMU Behavioral Value DPAM CAPITAL B Corporate Bonds EUR 2023 DPAM CAPITAL B Real Estate EMU Sustainable DPAM CAPITAL B Equities US ESG Leaders Index
2. Description of the objective, operation and methodology of swing pricing: Objective : The objective is to reduce performance dilution due to net inputs or outputs. The performance of the SICAV may be eroded by frequent transactions due to large inflows or outflows and the SICAV may suffer from (in)direct trading costs involved in capital movements. Swing pricing offers investors already invested in the Sicav the possibility of not having to bear the transaction costs or the cost of illiquidity in the underlying financial markets generated by the entry or exit of investors. With swing pricing, existing investors should, in principle, no longer indirectly incur the transaction fees, which will now be directly integrated into the calculation of the net asset value (NAV) and borne by the entering and exiting investors. Swing pricing protects long-term investors, as an investor can only be affected by swing pricing on the day of subscription/redemption. Methodology and operation : The swing pricing method adopted is based on the following principles: - It is a partial swing, which implies that a certain threshold must be crossed before the NAV is adjusted; - It is a symmetrical swing, which is activated for both subscriptions and redemptions; - The use of swing pricing is systematic, without favouring one or more categories of investors. The swing threshold is the value determined as a trigger event for net subscriptions and redemptions. This threshold value is expressed as a percentage of the total net assets of the sub-fund in question.

DPAM CAPITAL B
23
The swing threshold is always applied. Swing factor: the direction of the swing depends on the net flow of capital applicable to a NAV. In the case of a net inflow of capital, the swing factor linked to subscriptions of shares in the sub-fund will be added to the NAV. For net redemptions, the swing factor linked to redemptions of shares in the sub-fund in question will be deducted from the NAV. In both cases, all entering/exiting investors on a given date will have the same NAV applied.
3. Maximum swing factor: The maximum swing factor is set to a maximum of 5% of the unadjusted NAV. The threshold and swing factor will be published on the website www.dpamfunds.com in the “Fees” section
4. Use of the swing pricing during the period :
During the period covered by this report, no sub-fund of the Sicav used swing pricing.
II. ANTI-DILUTION LEVY
1. List of sub-funds that may use the anti-dilution levy: DPAM CAPITAL B Equities US Behavioral Value DPAM CAPITAL B Equities Europe Index DPAM CAPITAL B Real Estate EMU Dividend Sustainable DPAM CAPITAL B Equities US Index DPAM CAPITAL B Bonds EUR Medium Term DPAM CAPITAL B Equities Japan Index DPAM CAPITAL B Equities World ex Japan, Europe & USA Index DPAM CAPITAL B Equities EMU Index DPAM CAPITAL B Equities US Dividend Sustainable DPAM CAPITAL B Equities EMU Behavioral Value DPAM CAPITAL B Corporate Bonds EUR 2023 DPAM CAPITAL B Real Estate EMU Sustainable DPAM CAPITAL B Equities US ESG Leaders Index
2. Description of the objective, operation and methodology of the anti-dilution levy
Objective : The objective of this mechanism is to transfer the negative impact on the NAV of a sub-fund of the SICAV to the investors who generated this impact. Methodology and operation: If redemptions / subscriptions exceed a threshold, the SICAV may decide to impose an additional cost on incoming or outgoing investors, which will benefit the SICAV. Higher exit fees may be charged for large net outflows, and higher entry fees may be charged for large net inflows. The anti-dilution levy will only be applied after an explicit decision of the Board of Directors of the SICAV. There is no automatic application of this mechanism. The Board of Director's decision relates both to the level of the threshold and the additional costs and whether or not to apply the mechanism if the threshold is exceeded.

DPAM CAPITAL B
24
3. Use of the anti-dilution levy during the period : During the period covered by this report, no sub-fund of the Sicav used anti-dilution levy.
III. Redemption gates This mechanism allows the SICAV to partially suspend the execution of requests for the redemption and/or repayment of units (“redemption gates”) when the negative change in the balance of the liabilities of the company or sub-fund for a given day exceeds, for the day in question, a percentage (or threshold) determined by the Board of Directors. The threshold above which this mechanism may be applied is set at 5% for all sub-funds. The NAV calculation itself is not suspended as orders are partially executed. Only the part of the requests for redemptions which exceeds the threshold is affected by this partial suspension. It must be applied proportionally to all requests for individual redemptions submitted by the closing date concerned. The portion of the redemption requests not executed following this partial suspension will be postponed automatically to the next closing date, except in the event of revocation by the shareholder or if this mechanism is reapplied. The partial suspension is always provisional. This suspension will be carried out in accordance with the provisions of Article 198/1 of the Royal Decree of 2012. In the event of a partial suspension of the execution of redemption and/or repayment requests, a notice to shareholders will be published on the website www.dpamfunds.com in the “News” section.
1.2.2. Overview of the markets
DPAM CAPITAL B
Global equities (excluding dividends) rose by 23% in euro terms during the financial year. Behind this good performance, there are marked differences between regions. In common currency terms (euros), emerging market (+4%) and Japanese (+10%) equities significantly underperformed US (+33.9%) and European (+22.4%) equities. The US and European indices even broke new records during the year. Risk-free rates rose strongly during the period, with a more pronounced rise in the US than in the eurozone. The US 10-year reference rate rose from 0.92% at the end of 2020 to 1.51% at the end of 2021. The German government rate with the same maturity climbed from -0.57% to -0.18% over the same period. The rise in 10-year bond yields was fuelled by the rapid vaccination of the population, which allowed some of the restrictive measures to be lifted during the year. In addition, the fiscal support packages approved by the US Congress in December 2020 and March 2021 placed upward pressure on long-term rates. The dollar appreciated by a little over 7% against the euro in 2021. In the bond portfolio, the performance of eurozone and US government bonds was negative in local currency. Corporate bonds outperformed government bonds due to the contraction of credit spreads and their lower duration. That said, the performance of these bonds was also negative in 2021. In contrast, inflation-linked government bonds stood out and offered investors a positive return thanks to the significant rise in implied inflation expectations during the year. United States of America The speed of the vaccine roll-out allowed the US to lift some restrictions from the first quarter of 2021. Business confidence in the services sector reached a record high during the year. Confidence indicators in the industrial sector during the year pointed to a serious lengthening of delivery times and a rise in input prices as a result of semi-conductor shortages, the rise in commodity prices and higher sea freight costs. Aid packages approved in December 2020 and March 2021 supported US consumption through the spring. Economic growth decelerated in the second half of the year due to rising inflation and the withdrawal of fiscal support, both of which had a negative impact on real household incomes. The labour market situation improved significantly during the period, with the unemployment rate falling from

DPAM CAPITAL B
25
6.7% at the end of 2020 to 4.2% in November 2021. US inflation rose sharply during the year due to large base effects, higher goods and energy prices and price increases in the sectors that benefited most from the reopening of the economy. Headline inflation peaked at 6.9% in November, while core inflation climbed to 5% by year-end. On the monetary policy side, Fed members advanced their projections for rate hikes during the year. In November the Fed announced a slowdown in the pace of its asset purchases. At its December meeting, the Fed decided to accelerate its asset purchase cuts, which will end in March. On the political side, in November, Biden signed the bipartisan infrastructure bill. In late December, Senator Manchin refused to support Biden's "Build Back Better" plan, threatening its approval by Congress. Eurozone Starting in spring 2020, the restrictions were gradually lifted. As a result, in June, business confidence in the services sector reached an all-time high. The unemployment rate continued to decline during the year, falling from 8.1% in December 2020 to 7.3% in October 2021, reflecting the economic improvement. In the third quarter, economic growth reached 2.2% quarter-on-quarter, which means that the economy was only half a percentage point below its pre-pandemic level. The main disappointment remains Spain, where growth of 2.0% in Q3 compared to the previous quarter was much weaker than expected, leaving the economy 6.6% below its pre-pandemic level. Consumer sentiment indicators worsened in the fourth quarter following the implementation of new restrictive measures in most countries. In contrast, industrial production rose at the end of the year, especially in the automotive sector in Germany. This is probably a first sign of improvement in supply chains and component shortages. Inflation rose strongly during the year in the eurozone. In November, general inflation was 4.9%, while core inflation was 2.6%. Both measures of inflation were at their highest levels since the creation of the euro. On the monetary policy front, in March, in response to rising long-term rates, the ECB announced an increase in the pace of its government bond purchases. In December, the European Central Bank confirmed that it will end its net asset purchases under the Pandemic Purchase Programme (PPP) in March 2022. But, as expected, the ECB is committed to simultaneously increasing regular purchases under the Asset Purchase Programme (APP). Japan At the end of 2021, the economic recovery was constrained by the record number of hospitalisations associated with Covid-19. The restrictive measures were lifted in the fourth quarter due to the significant decrease in new infections. At the end of the year, the Japanese government announced new stimulus measures to support households and businesses via subsidies. In March, the Japanese central bank expanded its tolerance band for the 10-year rate to around 0% as part of its control of the yield curve. At its December meeting, the Bank of Japan extended the application deadline for its Covid-19 lending operations from March 2022 to September 2022. Emerging markets The Chinese economy entered a slowdown phase from the first quarter of 2021. Credit growth slowed steadily during the year but showed signs of stabilising towards the end of the period. In the summer, investors fled Chinese equities as the Chinese government has stepped up regulatory pressure. In September, fears of a default by Evergrande resurfaced due to the financing difficulties facing the world’s most indebted property company. In response to the risks to economic activity arising from financing problems in the real estate sector, at the end of the year the People's Bank of China announced a cut in the regulatory reserve rate for banks as well as a modest reduction (by 5 basis points) in the base rate for one-year loans. Among other emerging markets, Taiwan and South Korea benefited from the high demand for semiconductors in the first part of the period. In Brazil, activity remained constrained by the increase in infections at the beginning of 2021. Faced with rising inflation in Latin America and emerging Europe, several central banks have been forced to tighten their monetary policy quite sharply (Brazil, Russia, Czech Republic). In Asia, inflation remained more contained

DPAM CAPITAL B
26
1.3. AUDITOR'S REPORT DPAM CAPITAL B

DPAM CAPITAL B
27
DPAM CAPITAL B

DPAM CAPITAL B
28
DPAM CAPITAL B

DPAM CAPITAL B
29
DPAM CAPITAL B

DPAM CAPITAL B
30
DPAM CAPITAL B

DPAM CAPITAL B
31
DPAM CAPITAL B

DPAM CAPITAL B
32
DPAM CAPITAL B
1.4. IVOX GLASS LEWIS’ S REPORT ON THE EXERCISE OF VOTING RIGHTS

DPAM CAPITAL B
33
1.5. GLOBALISED STATEMENT DPAM CAPITAL B
31 December 2021
EUR 31 December 2020
EUR
Section 1: Balance Sheet
TOTAL NET ASSETS 4,549,274,224.87 3,657,520,826.07
I. Fixed assets
A. Incorporation and organisation expenses
B. Intangible assets
C. Tangible assets
II. Transferable securities, money market instruments, UCIs and Financial derivatives
4,517,732,094.23 3,641,937,380.08
A. Bonds and other debt securities 379,724,415.10 396,754,572.74
a. Bonds 379,724,415.10 396,754,572.74
B. Money market instruments 37,499,476.50 2,650,559.08
C. Shares and other securities similar to shares 4,100,103,303.46 3,241,235,983.14
a. Shares 4,100,103,303.46 3,241,235,983.14
D. Other transferable securities 40,416.47
E. UCI with variable number of shares 404,899.17 1,255,848.65
F. financial derivatives
III. Receivables and payables on more than one year
A. Receivables
B. Payables
IV. Receivables and payables up to a year -4,016,772.79 -3,405,407.80
A. Receivables 8,165,892.68 3,533,733.59
a. Receivables 5,736,085.06 1,185,999.67
d. Others 2,429,807.62 2,347,733.92
B. Payables -12,182,665.47 -6,939,141.39
a. Payable amounts (-) -6,452,930.05 -2,612,465.74
c. Borrowing (-) -18,433.68 -122,392.91
e. Others (-) -5,711,301.74 -4,204,282.74
V. Deposits and liquidity 32,686,049.61 16,162,298.08
A. Demand bank deposits 32,686,049.61 16,162,298.08
B. Term bank deposits
C. Others
VI. Deferred charges and accrued income 2,872,853.82 2,826,555.71
A. Expenses carried forward
B. Accrued income 2,872,853.82 2,826,555.71
C. Accrued expenses (-)
D. Income carried forward (-)
TOTAL SHAREHOLDERS’ EQUITY 4,549,274,224.87 3,657,520,826.07
A. Capital 2,606,543,109.86 2,663,174,289.24
B. Income equalisation -22,608,794.44 74,686,856.08
C. Retained earnings 967,600,716.56 1,049,068,248.55
D. Result of the financial year 997,739,192.89 -129,408,567.80

DPAM CAPITAL B
34
31 December 2021
EUR 31 December 2020
EUR
Section 2: Off-balance sheet
OFF-BALANCE-SHEET 11,202,176.25 9,306,628.27
I. Collateral (+/-)
A. Collateral (+/-)
B. Other collateral
II. Underlying securities of the option contracts and warrants (+)
A. Option contracts and warrants bought
B. Option contracts and warrants sold
III. Notional amount of futures contracts (+) 11,202,176.25 9,306,628.27
A. Futures contracts bought and Forward contracts 2,016,396.25 217,216.72
B. Futures contracts sold and Forward Contracts 9,185,780.00 9,089,411.55
IV. Notional amount of the swap contracts (+)
A. Purchased swap contracts
B. Sold swap contracts
V. Notional amount of other financial derivatives (+)
A. Purchased contracts
B. Sold contracts
VI. Uncalled amounts on shares
VII. Commitments to resell on account of purchase-repurchase agreements
VIII. Commitments to repurchase on account of purchase-repurchase agreements
IX. Lent financial instruments

DPAM CAPITAL B
35
1.6. GLOBALISED RESULT STATEMENTS
31 December 2021
EUR 31 December 2020
EUR
Section 3: Income and expenditure account
I. Depreciation, capital loss and capital gain 945,571,166.53 -184,380,175.07
A. Bonds and other debt securities -10,078,348.13 -1,008,773.61
a. Bonds -10,078,348.13 -1,008,773.61
Realised gain 875,546.39 836,606.89
Realised loss -979,413.38 -3,669,813.69
Unrealised gain and loss -9,974,481.14 1,824,433.19
B. Money market instruments
C. Shares and other securities similar to shares 955,538,414.77 -181,936,495.83
a. Shares 955,538,414.77 -181,907,695.83
Realised gain 381,062,307.17 230,428,244.15
Realised loss -105,946,408.81 -572,880,524.92
Unrealised gain and loss 680,422,516.41 160,544,584.94
b. UCI with fixed number of shares -28,800.00
Realised loss -28,800.00
D. Other Transferable Securities 30,890.17 80,310.46
Realised gain 71,306.64 39,893.99
Unrealised gain and loss -40,416.47 40,416.47
E. UCI with variable number of shares 210,158.34 -302,224.60
Realised gain 85,531.64 36,075.39
Realised loss -141,896.88 -57,097.17
Unrealised gain and loss 266,523.58 -281,202.82
F. financial derivatives 352,576.41 -308,252.51
a. On bonds 179,090.00 -689,230.00
ii. Futures 179,090.00 -689,230.00
Realised gain and loss 21,790.00 -692,900.00
Unrealised gain and loss 157,300.00 3,670.00
l. On financial indexes 173,486.41 380,977.49
ii. Futures 173,486.41 380,977.49
Realised gain and loss 159,611.57 381,135.81
Unrealised gain and loss 13,874.84 -158.32
G. Receivables, deposits, liquidity and payables
H. Foreign exchange positions and transactions -482,525.03 -904,738.98
a. financial derivatives -243.65 -98,911.04
ii. Futures and forward contracts -243.65 -98,911.04
Realised gain and loss -243.65 -98,911.04
b. Other exchange positions and operations -482,281.38 -805,827.94
iv. Other -482,281.38 -805,827.94
Realised gain and loss -482,281.38 -805,827.94
II. Investment income and expenses 75,550,275.92 75,188,251.11
A. Dividends 77,125,043.44 75,974,339.73
B. Interest (+/-) 7,251,615.72 8,553,993.02
a. Transferable securities and money market instruments 7,220,981.82 8,261,710.36
b. Deposits and liquidity 30,633.90 292,282.66
Interest on loans (-) -157,404.01 -156,530.60
Swap contracts (+/-)
Withholding tax (-) -8,668,979.23 -9,330,005.71
Belgian -726,949.50 -1,271,210.71
Foreign -7,942,029.73 -8,058,795.00
F. Other investment income 146,454.67
III. Other income 1,011,460.86 2,242,093.47
A. Anti dilution fee 1,011,460.86 2,242,093.46
B. Other 0.01
IV. Operating expenses -24,393,710.42 -22,458,737.31
A. Investment transaction and delivery costs (-) -6,985,609.97 -8,686,057.84
B. Financial expenses (-) -4,280.21 -4,689.24
C. Custodian’s fee (-) -1,369,290.92 -931,164.03
D. Manager’s fee (-) -14,544,005.76 -13,301,216.68
a. Financial Management of the Portfolio -11,787,254.82 -10,045,734.99
Class A (Dis) -222,023.30 -287,981.21
Class A USD (Dis) -9,063.72 -4,618.17
Class B (Cap) -2,482,417.72 -2,875,743.47
Class B USD (Cap) -540,528.60 -426,216.04
Class E (Dis) -546.02 -8,869.56
Class F (Cap) -3,505,504.04 -2,198,055.82
Class F LC (Cap) -25.23
Class J (Cap) -3,814,326.05 -3,126,301.58
Class L (Cap) -4,254.48 -8,335.46

DPAM CAPITAL B
36
31 December 2021
EUR 31 December 2020
EUR
Class L USD (Cap) -674.16 -833.63
Class M (Dis) -341,713.35 -324,460.30
Class N (Cap) -591,206.40 -615,742.73
Class P (Cap) 1,112.74
Class V (Dis) -6,488.13 -2,456.15
Class W (Cap) -27,128.56 -12,137.64
Class M USD (Cap) -3,802.79 -2,026.14
Class N USD (Dis) -237,552.27 -153,069.83
b. Administration and accounting -2,765,871.74 -3,255,481.69
c. Commercial remuneration 9,120.80
E. Administrative expenses (-) -445,793.46 -571,189.51
F. Incorporation and organisation expenses (-) -46,423.30 -26,254.49
G. Salaries and wages, social security charges and pensions (-) -6,824.63 -4,512.71
H. Services and various goods (-) -251,049.15 -217,025.75
I. Depreciation and provisions for liabilities and charges (-)
J. Taxes -551,589.29 -567,265.28
Class A (Dis) -53,661.41 -80,262.23
Class A USD (Dis) -932.06 -1,004.97
Class B (Cap) -156,452.13 -160,653.67
Class B USD (Cap) -3,958.46 -4,656.32
Class E (Dis) -19.96 44.09
Class F (Cap) -55,703.87 -41,553.95
Class F LC (Cap) -0.60
Class J (Cap) 2,419.15 9,668.49
Class L (Cap) 0.38 -144.43
Class L USD (Cap) 0.03 0.02
Class M (Dis) -182,504.83 -182,930.49
Class N (Cap) -97,443.31 -106,708.82
Class P (Cap) -701.06 3,728.78
Class V (Dis) 15.02 3.31
Class W (Cap) 38.34 -24.32
Class N USD (Cap) -2,606.10 -2,731.63
Class M USD (Dis) -78.42 -39.14
K. Other expenses (-) -188,843.73 1,850,638.22
Income and expenditure for the financial year Sub-Total II + III + IV 52,168,026.36 54,971,607.27
V. Current profit (loss) before income tax 997,739,192.89 -129,408,567.80
VI. Income tax
VII. Result of the financial year 997,739,192.89 -129,408,567.80

DPAM CAPITAL B
37
31 December 2021
EUR 31 December 2020
EUR
Section 4: Allocation of the result
I. Profit (Loss) to be allocated 1,942,731,115.01 994,346,536.83
a. Profit carried forward (Loss carried forward) from the previous period 967,600,716.56 (*)
b. Profit (loss) of the financial year 997,739,192.89 -129,408,567.80
c. Income equalisation received (Income equalisation paid out) -22,608,794.44 74,686,856.08
II. (Appropriation to) Deduction from the capital
III. (Profit to be carried forward) Loss to be carried forward -1,939,511,638.01 -993,117,248.29
IV. Dividend distribution -3,219,477.00 -1,229,288,54
(*) The difference of EUR 25,516,531.73 between the amount of (Profit to be carried forward) Loss to be carried forward as at 31 December 2020 and the amount shown under Profit carried forward (Loss carried forward) from the previous period as at 31 December 2021 is justified by the merger of the DPAM CAPITAL B Equities Belgium sub-fund on 26 February 2021.

DPAM CAPITAL B
38
1.7. SUMMARY OF BOOKING AND VALUATION RULES
1.7.1. Summary of rules
The valuation of the Company’s assets, subdivided by compartments, is determined as follows :
a. for securities which are officially listed on a stock exchange or traded on another organized market: at the last known stock exchange or market price, unless this price is not representative;
b. for securities of which the latest price is not representative or for securities not officially listed on a stock exchange or traded on another organized market, the valuation is based on the probably realization value estimated prudently and in good faith;
c. for liquid assets: at nominal value plus accrued interest;
d. unmatured loans and advances will be determined pro rata temporis based on their exact amount when known or, failing this, on the basis of their estimated amount;
e. securities expressed in a currency other than that of the compartment concerned will be converted into the currency of the compartment on the basis of the most recent known exchange rates;
f. the notional amount of the future contracts will be recorded in Off balance sheet heading “III, Notional Amount of the future contracts”. The future contracts are accounted for in the off balance sheet captions on the basis of the following calculation: number of contracts multiplied by the price at acquisition date multiplied by the lot size; to be converted into the currency of the compartment concerned based on the last known exchange rates where the futures are expressed in a currency other than that of the compartment. Futures are valued whenever the net asset value is calculated, on the basis of the last known market price, except where this is not representative. The differences resulting from price variations are imputed to the Income and Expenditure Account are not realized capital gains or depreciation in caption “ii. Future contracts”of the relevant captions in the heading“I. Depreciation, capital loss and capital gain – F. Financial derivatives”or in the heading“I. Depreciation, capital loss and capital gain – H. Foreign exchange positions and transactions – a. Financial derivatives – ii. Future contracts”if the underlying value concerns currencies;
g. option contracts are valued whenever the net asset value is calculated, on the basis of the last known market price, except where this is not representative. The differences resulting from variations in the value of the contract premiums are imputed to the Income and Expenditure Account as depreciation or unrealized capital gains in caption“i. Option contracts” of the relevant captions in the heading I. Depreciation, capital loss and capital gain – F. Financial derivatives“or in the heading”I. Depreciation, capital loss and capital gain – H. Foreign exchange positions and transactions – a. Financial derivatives – i. Option contracts“if the underlying value concerns currencies. Where option contracts are exercised, the premiums are recorded as part of the purchase or sales price of the underlying securities. The underlying values of the option contracts are accounted for in the off balance sheet heading”II. Underlying values of the option contracts and warrants"on the basis of the following calculation: number of contracts multiplied by the exercise price multiplied by the quantity of underlying assets;
h. the notional amount of the swap contracts will be recorded in Off balance sheet heading“IV, Notional Amount of the swap contracts”. The swap contracts are valued whenever the net asset value is calculated, on the basis of the last known market price, except where this is not representative. The differences resulting from variations in the value of the swap contracts are imputed to the Income and Expenditure Account as depreciation or unrealized capital gains in caption “iii. Swap contracts” of the relevant captions in the heading I. Depreciation, capital loss and capital gain – F. Financial derivatives“or in the heading”I. Depreciation, capital loss and capital gain – H. Foreign exchange positions and transactions – a. Financial derivatives – iii. Swap contracts" if the underlying value concerns currencies;
i. underlying UCIs are valued whenever the net asset value is calculated, on the basis of the last known net asset values, except where these prices are not representative.
To obtain the net assets, the resulting valuation is reduced by the liabilities of the Company.
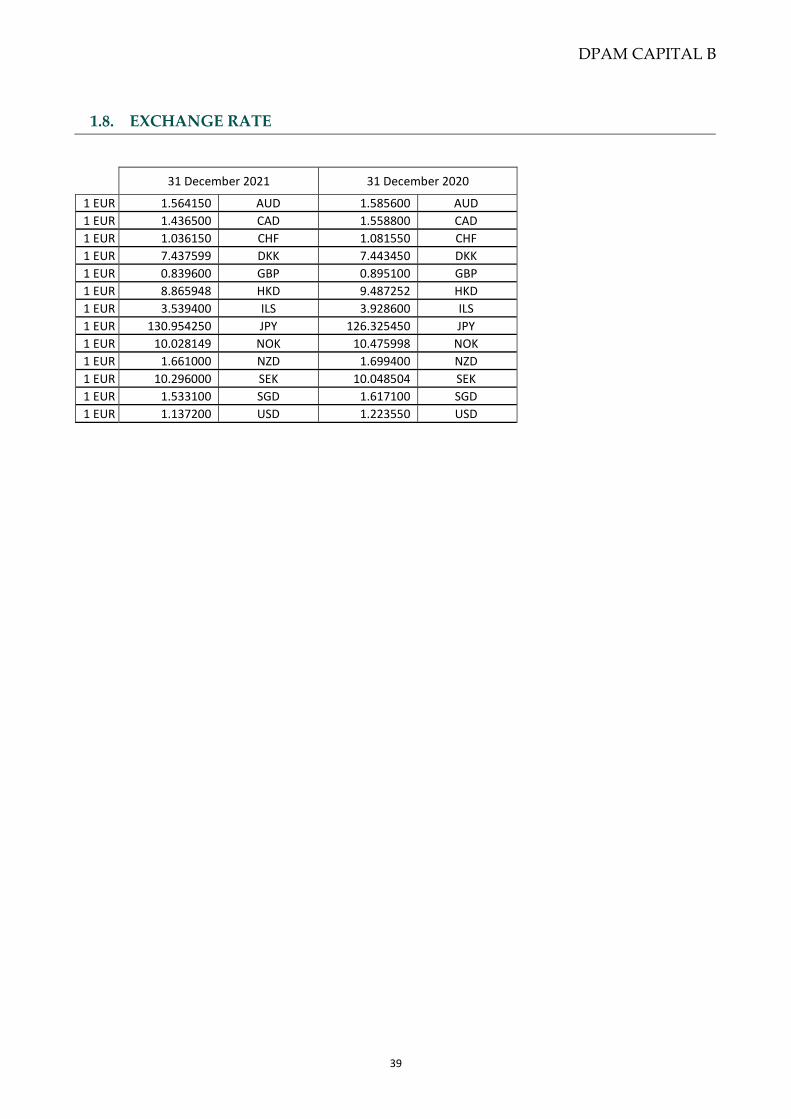
DPAM CAPITAL B
39
1.8. EXCHANGE RATE
31 December 2021 31 December 2020
1 EUR 1.564150 AUD 1.585600 AUD
1 EUR 1.436500 CAD 1.558800 CAD
1 EUR 1.036150 CHF 1.081550 CHF
1 EUR 7.437599 DKK 7.443450 DKK
1 EUR 0.839600 GBP 0.895100 GBP
1 EUR 8.865948 HKD 9.487252 HKD
1 EUR 3.539400 ILS 3.928600 ILS
1 EUR 130.954250 JPY 126.325450 JPY
1 EUR 10.028149 NOK 10.475998 NOK
1 EUR 1.661000 NZD 1.699400 NZD
1 EUR 10.296000 SEK 10.048504 SEK
1 EUR 1.533100 SGD 1.617100 SGD
1 EUR 1.137200 USD 1.223550 USD

DPAM CAPITAL B
Bonds EUR Medium Term
40
2. INFORMATION ABOUT THE SUBFUND DPAM CAPITAL B BONDS EUR MEDIUM TERM
Bonds EUR Medium Term
2.1. MANAGEMENT REPORT
2.1.1. Launch date of the sub-fund and subscription price of the shares
Initial subscription day: September 30, 1992 Initial subscription price: EUR 2 478.93 Class B shares were split by 20 on March 31, 2005.
2.1.2. Stock exchange listing
The shares of the sub-fund are not listed on an exchange.
2.1.3. Aim and main outlines of the investment policy
The objective is to provide shareholders with as high a global return as possible, with an accent on investments in bonds (without sector limitation) denominated in one or more European currencies and issued or guaranteed by debtors with "Investment Grade" quality. This is an actively managed sub-fund, which means that the portfolio manager does not aim to replicate the performance of a benchmark.
2.1.4. Financial management of the portfolio
Degroof Petercam Asset Management S.A. Rue Guimard, 18, 1040 Brussels
2.1.5. Distributor
Degroof Petercam Asset Management S.A. Rue Guimard, 18, 1040 Brussels
2.1.6. Index and benchmark
The sub-fund uses the following index as its benchmark: JPM EMU Government Investment Grade 1-10 years This index is a bond index representing bonds issued by the governments of European countries where the euro is the official currency, rated "investment grade" by each of the three major rating agencies (Standard & Poor's, Moody's and Fitch). The performance is calculated by reinvesting the coupons paid by the debt securities included in the index. The index contains bonds with a residual maturity between a minimum of 1 year and a maximum of 10 years. It is an actively managed sub-fund, which means that the portfolio manager does not aim to replicate the performance of a benchmark. The benchmark is used as a means of comparing performance.
2.1.7. Policy followed during the year
If you would have told someone that US inflation would be above 5% since September 2021 with still no sign of abating in December and even moving in on a 7% handle for the start of 2022, while at the same time asking what this means for their expectation of the policy rate and US rates, this would most likely be very far of what currently can be observed. The average market participant continues to stick to a transitory call on inflation and interprets market pricing especially from the 5Y point as proof that they are correct. Throughout the year they have continuously tried to rationalize current inflation dynamics by finding new metrics to interpret why inflation is not persistent (MA’s, rolling MA’s, Covid-sensitive categories…). However, we believe that consistency in inflation
DPAM CAPITAL B
Bonds EUR Medium Term
41
analysis is key and that the same or very similar metrics should be used when assessing a low-inflation or deflationary environment (as we observed around 2015 in Europe). The continuous emotional rationalization of the current inflation dynamics is a vicious circle that will break at some point. We believe that this break will be one where we see a significant increase in global developed market rates and as such continue to keep an underweight duration stance as it provides the highest risk-return reward. Looking at the US, the 10Y rate started the year below 1% while ending it just above 1.5% and in Europe the 10Y German bond moved from -0.55% at the start of the year to end at -0.20%. This global situation is also very present in Europe where inflation across metrics (headline, core, supercore) continues to print numbers that we have not observed since the global financial crisis of more than a decade ago. But also there, the representation of these dynamics into financial market pricing of nominal rates is almost fully absent. We believe the main culprit to this is the reluctance of central banks to react to this higher inflation regime as they are still scarred (especially the ECB) from their previous hiking cycle when inflation did indeed prove to be transitory. In terms of consequences, on the negative this reluctance increases the probability that they are too far behind the curve and might have to hike aggressively with negative effects on risk markets. But on the positive, this continued higher inflation prints increase the probability that firms and the consumer will anchor inflation expectations at higher levels and that policymakers will finally be able to create the much-needed monetary policy space to be able to react to future recessions. What has been represented in financial market pricing however is the enormous increase of breakeven pricing of inflation-linked bonds which added significant performance to the fund as at one point we had an allocation of 10% to this type of instrument. As it also took a while for inflation to be priced in this type of instrument, we believe that eventually our nominal rates view will also start getting priced. The fund gained 0.11% versus the reference index over 2021, mainly driven by a positive performance from our duration stance, our inflation-linked bond allocations, and in general peripheral outperformance. Some of our Central European country allocations did not perform well due to increase political volatility.
2.1.8. Future policy
Looking at the implied policy path for the ECB, a 10bps hike at the end of 2022 does look realistic to us given our view on especially inflation and a limited impact of monetary policy tightening on expected growth numbers. Also, in the dynamics of the end of PEPP and the quarterly decrease in the size of the APP, this implied hike and the ensuing path of rate normalization is acceptable and should help steepen core curves, especially in the front end. In Europe, this expected monetary policy normalization will remove quite a lot of monetary accommodation that has helped peripheral spreads significantly over the last years given that one of the goals of the PEPP program has been to limit potential market fragmentation which did translate in convergence of interest rates between riskier and safe have assets. However we believe that the ECB is aware of this sensitivity of peripheral interest rates and will eventually be able to clearly communicate their continued support via flexible and forceful monetary policy tools to give peripheral countries time to continue to fully commit their NGEU funding to tackle structural deficiencies. As we believe this will significantly help these countries to positively change the structural course of their economies, the need for monetary accommodation in terms of spread support will be less and less needed. Consequently, we believe that it remains appropriate to have a peripheral overweight over the medium-term, but where a more active and flexible approach will become more pertinent as the removal of QE does imply that spread volatility might increase over the short-term. Italian spreads have started moving up somewhat over the last weeks to 135bps over the German Bund from 115bps at the start of the year following this removal of monetary accommodation but also due to the risk of new elections with an again completely changed political environment. However, the portfolio did not suffer from this due to significant selection effects on the Italian curve and the presence of inflation-linked bonds over the last quarters.

DPAM CAPITAL B
Bonds EUR Medium Term
42
2.1.9. Synthetic risk and reward indicator
The synthetic risk and return indicator gives an indication of the risk associated with investing in a sub-fund. It places this risk on a scale ranging from one (lowest risk) to seven (highest risk). Risk and reward profile: 3

DPAM CAPITAL B
Bonds EUR Medium Term
43
2.2. BALANCE SHEET
31 December 2021
EUR 31 December 2020
EUR
Section 1: Balance Sheet
TOTAL NET ASSETS 262,835,157.05 206,289,009.66
I. Fixed assets
A. Incorporation and organisation expenses B. Intangible assets C. Tangible assets
II. Transferable securities, money market instruments, UCIs and Financial derivatives
250,853,535.66 201,400,822.27
A. Bonds and other debt securities 229,675,472.16 198,750,263.19 a. Bonds 229,675,472.16 198,750,263.19 B. Money market instruments 21,178,063.50 2,650,559.08 C. Shares and other securities similar to shares D. Other transferable securities E. UCI with variable number of shares F. financial derivatives
III. Receivables and payables on more than one year
A. Receivables B. Payables
IV. Receivables and payables up to a year 49,319.32 12,726.65
A. Receivables 206,519.70 158,022.00 d. Others 206,519.70 158,022.00 B. Payables -157,200.38 -145,295.35 c. Borrowing (-) -4,928.17 -1,257.47 e. Others (-) -152,272.21 -144,037.88
V. Deposits and liquidity 9,921,834.64 3,259,877.52
A. Demand bank deposits 9,921,834.64 3,259,877.52 B. Term bank deposits C. Others
VI. Deferred charges and accrued income 2,010,467.43 1,615,583.22
A. Expenses carried forward B. Accrued income 2,010,467.43 1,615,583.22 C. Accrued expenses (-) D. Income carried forward (-)
TOTAL SHAREHOLDERS’ EQUITY 262,835,157.05 206,289,009.66
A. Capital 251,170,490.96 191,531,866.60 B. Income equalisation 339,337.41 -463,300.39 C. Retained earnings 14,735,241.33 12,171,838.89 D. Result of the financial year -3,409,912.65 3,048,604.56
Bonds EUR Medi um Ter m

DPAM CAPITAL B
Bonds EUR Medium Term
44
31 December 2021
EUR 31 December 2020
EUR
Section 2: Off-balance sheet
OFF-BALANCE-SHEET 9,185,780.00 9,089,413.00
I. Collateral (+/-)
A. Collateral (+/-) B. Other collateral
II. Underlying securities of the option contracts and warrants (+)
A. Option contracts and warrants bought B. Option contracts and warrants sold
III. Notional amount of futures contracts (+) 9,185,780.00 9,089,413.00
A. Futures contracts bought and Forward contracts B. Futures contracts sold and Forward Contracts 9,185,780.00 9,089,413.00
IV. Notional amount of the swap contracts (+)
A. Purchased swap contracts B. Sold swap contracts
V. Notional amount of other financial derivatives (+)
A. Purchased contracts B. Sold contracts
VI. Uncalled amounts on shares
VII. Commitments to resell on account of purchase-repurchase agreements
VIII. Commitments to repurchase on account of purchase-repurchase agreements
IX. Lent financial instruments

DPAM CAPITAL B
Bonds EUR Medium Term
45
2.3. INCOME STATEMENT
31 December 2021
EUR 31 December 2020
EUR
Section 3: Income and expenditure account
I. Depreciation, capital loss and capital gain -7,627,755.41 -2,262,877.58
A. Bonds and other debt securities -7,806,845.41 -1,573,647.58
a. Bonds -7,806,845.41 -1,573,647.58
Realised gain 502,384.68 671,316.09
Realised loss -401,512.98 -3,360,756.96
Unrealised gain and loss -7,907,717.11 1,115,793.29
B. Money market instruments
C. Shares and other securities similar to shares
D. Other Transferable Securities
E. UCI with variable number of shares
F. financial derivatives 179,090.00 -689,230.00
a. On bonds 179,090.00 -689,230.00
ii. Futures 179,090.00 -689,230.00
Realised gain and loss 21,790.00 -692,900.00
Unrealised gain and loss 157,300.00 3,670.00
G. Receivables, deposits, liquidity and payables
H. Foreign exchange positions and transactions
II. Investment income and expenses 4,743,636.09 5,785,552.03
A. Dividends
B. Interest (+/-) 4,801,618.40 5,816,117.60
a. Transferable securities and money market instruments 4,792,609.07 5,804,255.74
b. Deposits and liquidity 9,009.33 11,861.86
Interest on loans (-) -56,577.93 -29,753.06
Swap contracts (+/-)
Withholding tax (-) -1,404.38 -812.51
Foreign -1,404.38 -812.51
F. Other investment income
III. Other income
A. Anti dilution fee
B. Other
IV. Operating expenses -525,793.33 -474,069.89
A. Investment transaction and delivery costs (-) -27,503.81 -40,853.26
B. Financial expenses (-) -1,924.00 -2,042.00
C. Custodian’s fee (-) -83,922.46 -68,242.12
D. Manager’s fee (-) -352,000.21 -460,087.09
a. Financial Management of the Portfolio -173,013.01 -259,002.76
Class A (Dis) -1,594.02 -3,711.22
Class B (Cap) -8,732.22 -12,640.48
Class E (Dis) -7,918.29
Class F (Cap) -101,608.80 -168,209.08
Class J (Cap) -58,379.22 -61,715.38
Class M (Dis) -1,478.93 -3,333.56
Class N (Cap) -1,219.82 -1,474.75
b. Administration and accounting -178,987.20 -201,084.33
E. Administrative expenses (-) -26,602.05 -42,446.72
F. Incorporation and organisation expenses (-) -2,666.17 -2,295.44
G. Salaries and wages, social security charges and pensions (-) -430.89 -681.04
H. Services and various goods (-) -13,968.35 -17,692.78
I. Depreciation and provisions for liabilities and charges (-)
J. Taxes -9,811.52 -9,686.53
Class A (Dis) -466.03 -608.66
Class B (Cap) -1,556.84 -2,082.17
Class E (Dis) 64.73
Class F (Cap) -7,157.62 -6,095.14
Class J (Cap) 148.73 207.17
Class M (Dis) -760.96 -978.89
Class N (Cap) -224.10 -398.88
Class P (Cap) 205.30 205.31
K. Other expenses (-) -6,963.87 169,957.09
Income and expenditure for the financial year Sub-Total II + III + IV 4,217,842.76 5,311,482.14
V. Current profit (loss) before income tax -3,409,912.65 3,048,604.56
VI. Income tax

DPAM CAPITAL B
Bonds EUR Medium Term
46
31 December 2021
EUR 31 December 2020
EUR
VII. Result of the financial year -3,409,912.65 3,048,604.56

DPAM CAPITAL B
Bonds EUR Medium Term
47
31 December 2021
EUR 31 December 2020
EUR
Section 4: Allocation of the result
I. Profit (Loss) to be allocated 11,664,666.09 14,757,143.06
a. Profit carried forward (Loss carried forward) from the previous period 14,735,241.33 12,171,838.89
b. Profit (loss) of the financial year -3,409,912.65 3,048,604.56
c. Income equalisation received (Income equalisation paid out) 339,337.41 -463,300.39
II. (Appropriation to) Deduction from the capital
III. (Profit to be carried forward) Loss to be carried forward -11,647,022.65 -14,735,241.33
IV. Dividend distribution -17,643.44 -21,901.73
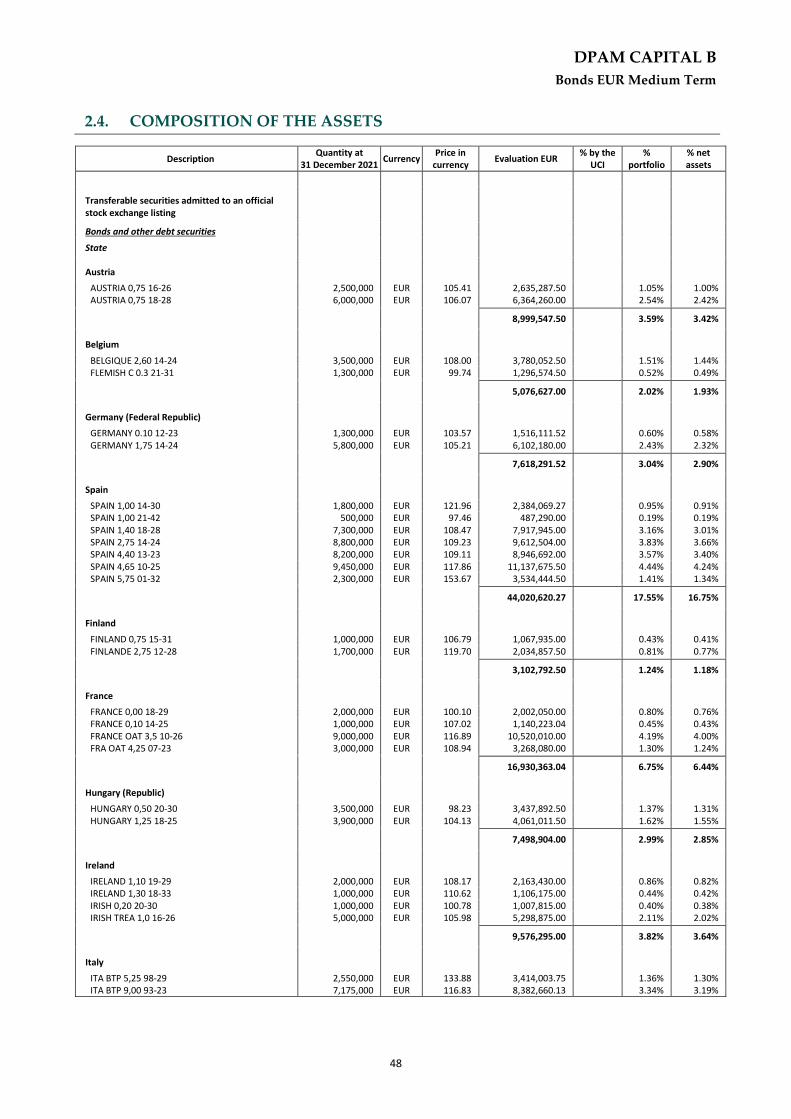
DPAM CAPITAL B
Bonds EUR Medium Term
48
2.4. COMPOSITION OF THE ASSETS
Bonds EUR Medium Term
Description Quantity at
31 December 2021 Currency
Price in currency
Evaluation EUR % by the
UCI %
portfolio % net assets
Transferable securities admitted to an official stock exchange listing
Bonds and other debt securities
State
Austria
AUSTRIA 0,75 16-26 2,500,000 EUR 105.41 2,635,287.50 1.05% 1.00% AUSTRIA 0,75 18-28 6,000,000 EUR 106.07 6,364,260.00 2.54% 2.42%
8,999,547.50 3.59% 3.42%
Belgium
BELGIQUE 2,60 14-24 3,500,000 EUR 108.00 3,780,052.50 1.51% 1.44% FLEMISH C 0.3 21-31 1,300,000 EUR 99.74 1,296,574.50 0.52% 0.49%
5,076,627.00 2.02% 1.93%
Germany (Federal Republic)
GERMANY 0.10 12-23 1,300,000 EUR 103.57 1,516,111.52 0.60% 0.58% GERMANY 1,75 14-24 5,800,000 EUR 105.21 6,102,180.00 2.43% 2.32%
7,618,291.52 3.04% 2.90%
Spain
SPAIN 1,00 14-30 1,800,000 EUR 121.96 2,384,069.27 0.95% 0.91% SPAIN 1,00 21-42 500,000 EUR 97.46 487,290.00 0.19% 0.19% SPAIN 1,40 18-28 7,300,000 EUR 108.47 7,917,945.00 3.16% 3.01% SPAIN 2,75 14-24 8,800,000 EUR 109.23 9,612,504.00 3.83% 3.66% SPAIN 4,40 13-23 8,200,000 EUR 109.11 8,946,692.00 3.57% 3.40% SPAIN 4,65 10-25 9,450,000 EUR 117.86 11,137,675.50 4.44% 4.24% SPAIN 5,75 01-32 2,300,000 EUR 153.67 3,534,444.50 1.41% 1.34%
44,020,620.27 17.55% 16.75%
Finland
FINLAND 0,75 15-31 1,000,000 EUR 106.79 1,067,935.00 0.43% 0.41% FINLANDE 2,75 12-28 1,700,000 EUR 119.70 2,034,857.50 0.81% 0.77%
3,102,792.50 1.24% 1.18%
France
FRANCE 0,00 18-29 2,000,000 EUR 100.10 2,002,050.00 0.80% 0.76% FRANCE 0,10 14-25 1,000,000 EUR 107.02 1,140,223.04 0.45% 0.43% FRANCE OAT 3,5 10-26 9,000,000 EUR 116.89 10,520,010.00 4.19% 4.00% FRA OAT 4,25 07-23 3,000,000 EUR 108.94 3,268,080.00 1.30% 1.24%
16,930,363.04 6.75% 6.44%
Hungary (Republic)
HUNGARY 0,50 20-30 3,500,000 EUR 98.23 3,437,892.50 1.37% 1.31% HUNGARY 1,25 18-25 3,900,000 EUR 104.13 4,061,011.50 1.62% 1.55%
7,498,904.00 2.99% 2.85%
Ireland
IRELAND 1,10 19-29 2,000,000 EUR 108.17 2,163,430.00 0.86% 0.82% IRELAND 1,30 18-33 1,000,000 EUR 110.62 1,106,175.00 0.44% 0.42% IRISH 0,20 20-30 1,000,000 EUR 100.78 1,007,815.00 0.40% 0.38% IRISH TREA 1,0 16-26 5,000,000 EUR 105.98 5,298,875.00 2.11% 2.02%
9,576,295.00 3.82% 3.64%
Italy
ITA BTP 5,25 98-29 2,550,000 EUR 133.88 3,414,003.75 1.36% 1.30% ITA BTP 9,00 93-23 7,175,000 EUR 116.83 8,382,660.13 3.34% 3.19%

DPAM CAPITAL B
Bonds EUR Medium Term
49
Description Quantity at
31 December 2021 Currency
Price in currency
Evaluation EUR % by the
UCI %
portfolio % net assets
ITALY 0,40 16-24 1,700,000 EUR 104.40 1,787,079.72 0.71% 0.68% ITALY 0,85 19-27 3,500,000 EUR 102.00 3,570,175.00 1.42% 1.36% ITALY 0,95 16-23 8,500,000 EUR 101.63 8,638,762.50 3.44% 3.29% ITALY 1,35 19-30 3,000,000 EUR 103.32 3,099,540.00 1.24% 1.18% ITALY 1,60 16-26 7,500,000 EUR 105.52 7,914,112.50 3.15% 3.01% ITALY 2,95 18-38 4,900,000 EUR 119.99 5,879,387.50 2.34% 2.24% ITALY BTP 1,50 15-25 8,500,000 EUR 104.55 8,886,792.50 3.54% 3.38% ITALY BTPS FRN 16-28 2,800,000 EUR 114.55 3,483,244.73 1.39% 1.33%
55,055,758.33 21.95% 20.95%
Luxembourg (Grand Duchy)
LUXEMBG 0,625 17-27 2,000,000 EUR 103.86 2,077,130.00 0.83% 0.79%
2,077,130.00 0.83% 0.79%
Netherlands
NETHERL 0,25 19-29 4,000,000 EUR 103.39 4,135,440.00 1.65% 1.57% NETHERLDS 2,50 12-33 500,000 EUR 127.47 637,372.50 0.25% 0.24%
4,772,812.50 1.90% 1.82%
Portugal
PORTUGAL 0,475 20-30 1,700,000 EUR 101.61 1,727,455.00 0.69% 0.66% PORTUGAL 2,125 18-28 5,300,000 EUR 113.98 6,040,887.00 2.41% 2.30% PORTUGAL 2,875 16-26 3,000,000 EUR 114.34 3,430,200.00 1.37% 1.31% PORTUGAL 4,10 15-45 800,000 EUR 161.94 1,295,532.00 0.52% 0.49% PORTUGAL 5,65 13-24 3,000,000 EUR 113.32 3,399,615.00 1.36% 1.29%
15,893,689.00 6.34% 6.05%
Romania
ROMANIA 1,375 20-29 2,300,000 EUR 95.67 2,200,502.00 0.88% 0.84% ROMANIA 2,00 19-26 2,500,000 EUR 105.06 2,626,537.50 1.05% 1.00% ROMANIA 2,00 20-32 5,300,000 EUR 93.13 4,935,890.00 1.97% 1.88% ROMANIA 3,50 19-34 3,000,000 EUR 105.57 3,167,205.00 1.26% 1.21%
12,930,134.50 5.15% 4.92%
Slovenia (Republic)
SLOVENIA 0,00 21-31 600,000 EUR 96.53 579,198.00 0.23% 0.22% SLOVENIA 0,125 21-31 2,000,000 EUR 97.86 1,957,100.00 0.78% 0.74% SLOVENIA 0,875 20-30 1,000,000 EUR 104.75 1,047,545.00 0.42% 0.40% SLOVENIA 1,00 18-28 500,000 EUR 106.42 532,115.00 0.21% 0.20%
4,115,958.00 1.64% 1.57%
Total - State 197,668,923.16 78.80% 75.21%
International institution
Belgium
EUROPEAN 0,40 21-37 400,000 EUR 101.07 404,294.00 0.16% 0.15%
404,294.00 0.16% 0.15%
Luxembourg (Grand Duchy)
EIB 0,00 16-24 1,000,000 EUR 101.02 1,010,200.00 0.40% 0.38% ESM 0,10 18-23 1,700,000 EUR 101.01 1,717,221.00 0.68% 0.65% ESM 0,125 16-24 2,500,000 EUR 101.36 2,534,125.00 1.01% 0.96% ESM 0,75 17-27 3,000,000 EUR 104.71 3,141,285.00 1.25% 1.20% EUROP UN 0,00 21-31 1,000,000 EUR 99.34 993,450.00 0.40% 0.38%
9,396,281.00 3.75% 3.57%
Total - International institution 9,800,575.00 3.91% 3.73%
Public Sector Bond
Belgium
FLEMISH 0,375 16-26 2,800,000 EUR 102.46 2,868,782.00 1.14% 1.09% FLEMISH 1,341 15-25 4,200,000 EUR 105.54 4,432,638.00 1.77% 1.69%

DPAM CAPITAL B
Bonds EUR Medium Term
50
Description Quantity at
31 December 2021 Currency
Price in currency
Evaluation EUR % by the
UCI %
portfolio % net assets
7,301,420.00 2.91% 2.78%
Total - Public Sector Bond 7,301,420.00 2.91% 2.78%
Private corporation
Belgium
BNPPB 0,50 17-24 3,000,000 EUR 101.95 3,058,395.00 1.22% 1.16%
3,058,395.00 1.22% 1.16%
Spain
ADIFAL 0,55 21-31 300,000 EUR 98.70 296,095.50 0.12% 0.11% ICO 0,00 21-27 4,500,000 EUR 100.10 4,504,545.00 1.80% 1.71%
4,800,640.50 1.91% 1.83%
Italy
BTPS 1,50 20-45 900,000 EUR 93.90 845,068.50 0.34% 0.32%
845,068.50 0.34% 0.32%
Netherlands
BNG 0,25 15-25 2,000,000 EUR 101.59 2,031,800.00 0.81% 0.77% BNG 0,75 18-28 2,000,000 EUR 104.58 2,091,580.00 0.83% 0.80% BNG 1,125 14-24 2,000,000 EUR 103.85 2,077,070.00 0.83% 0.79%
6,200,450.00 2.47% 2.36%
Total - Private corporation 14,904,554.00 5.94% 5.67%
Total - Bonds and other debt securities 229,675,472.16 91.56% 87.38%
Money market instruments AUSTRIA 3,65 11-22 3,000,000 EUR 101.30 3,038,955.00 1.21% 1.16% FLEMISH 0,854 15-22 3,000,000 EUR 100.73 3,021,765.00 1.20% 1.15% ING BANK 3,375 12-22 1,000,000 EUR 100.07 1,000,680.00 0.40% 0.38% ITALY BTP 5,5 12-22 10,200,000 EUR 103.94 10,601,421.00 4.23% 4.03% VUBSK 0,375 17-22 3,500,000 EUR 100.44 3,515,242.50 1.40% 1.34%
Total - Money market instruments 21,178,063.50 8.44% 8.06%
Total - Transferable securities admitted to an official stock exchange listing
250,853,535.66 100.00% 95.44%
Total - portfolio 250,853,535.66 100.00% 95.44%
Collatéral 0.00 0.00%
Deposits and liquid assets
deposit and liquid assets
Banque Degroof Petercam EUR 9,921,834.64 3.77%
Total - deposit and liquid assets 9,921,834.64 3.77%
Total - Deposits and liquid assets 9,921,834.64 3.77%
Other receivables and other payables 49,319.32 0.02%
Others 2,010,467.43 0.76%
Total net assets 262,835,157.05 100,00%
Bonds EUR Medium Term

DPAM CAPITAL B
Bonds EUR Medium Term
51
2.5. GEOGRAPHIC ALLOCATION OF INVESTMENTS
By country % Portfolio
ITALY 26.51%
SPAIN 19.46%
BELGIUM 7.52%
FRANCE 6.75%
PORTUGAL 6.34%
ROMANIA 5.15%
AUSTRIA 4.80%
NETHERLANDS 4.77%
LUXEMBOURG (GRAND DUCHY) 4.57%
IRELAND 3.82%
GERMANY (FEDERAL REPUBLIC) 3.04%
HUNGARY (REPUBLIC) 2.99%
SLOVENIA (REPUBLIC) 1.64%
SLOVAKIA (SLOVAK REPUBLIC) 1.40%
FINLAND 1.24%
Total 100.00%
These allocations of assets were established on basis of data (gross) used by the entity responsible for the administration and bookkeeping and do not reflect inevitably the economic analysis which directed the assets selection.
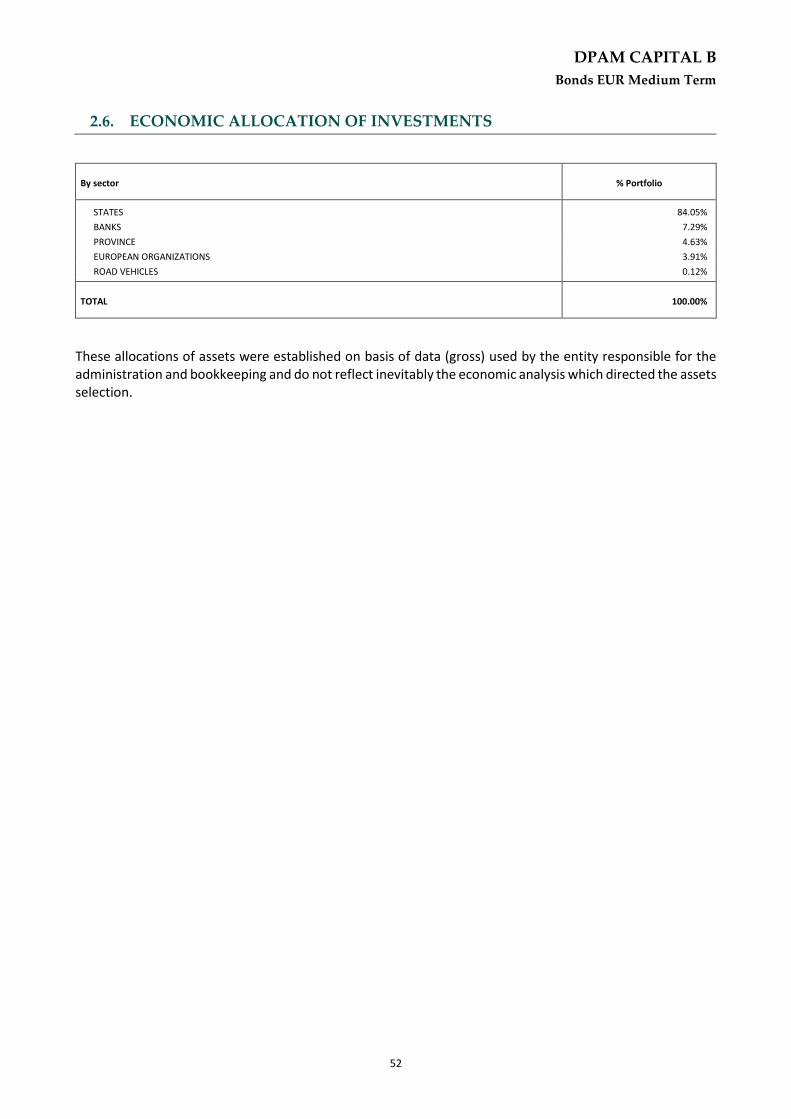
DPAM CAPITAL B
Bonds EUR Medium Term
52
2.6. ECONOMIC ALLOCATION OF INVESTMENTS
By sector % Portfolio
STATES 84.05%
BANKS 7.29%
PROVINCE 4.63%
EUROPEAN ORGANIZATIONS 3.91%
ROAD VEHICLES 0.12%
TOTAL 100.00%
These allocations of assets were established on basis of data (gross) used by the entity responsible for the administration and bookkeeping and do not reflect inevitably the economic analysis which directed the assets selection.

DPAM CAPITAL B
Bonds EUR Medium Term
53
2.7. CHANGES IN THE COMPOSITION OF THE ASSETS IN EUR Bonds EUR Medium Term
1st semester 2nd semester Total
Purchases 55,439,772.91 44,035,854.51 99,475,627.42 Sales 21,323,735.12 19,892,333.50 41,216,068.62 Total 1 76,763,508.03 63,928,188.01 140,691,696.04 Subscriptions 45,857,408.63 41,752,072.00 87,609,480.63 Redemptions 11,805,225.03 15,829,415.32 27,634,640.35 Total 2 57,662,633.66 57,581,487.32 115,244,120.98 Reference average of the total net asset 216,690,583.65 259,487,479.87 238,264,909.42
Rotation Percentage 8.81% 2.45% 10.68%
The rotation rate gives the annual average of the transactions. A figure close to 0% shows that the transactions relating to the securities or the assets with the exception of deposits and liquid assets during a given period, were done exclusively in function of the subscriptions and redemptions. A negative percentage indicates that the subscriptions and redemptions give rise to only few or, as the case may be, no transactions in the portfolio.
A detailed list of the transactions carried out during the financial year can be consulted, free of charge, at Banque Degroof Petercam S.A with its registered office at Rue de l’Industrie 44 - B-1040 Brussels which provides the financial services.

DPAM CAPITAL B
54
2.8. VALUE OF COMMITMENTS RELATING TO POSITIONS IN FINANCIAL DERIVATIVES
Commitment on futures
Description Currency In currency En EUR Lot-size
EURO BOBL FUTURES MARCH EUR 2,044,520.00 2,044,520.00 100,000.00
EURO BUND FUTURE MARCH EUR 7,141,260.00 7,141,260.00 100,000.00

DPAM CAPITAL B
Bonds EUR Medium Term
55
2.9. EVOLUTION OF SUBSCRIPTIONS, REDEMPTIONS AND THE NET ASSET
VALUE Bonds EUR Medium Term
Evolution of the number of shares in circulation
31 December 2019 31 December 2020 31 December 2021
Class Subscriptions Redemptions End of Period Subscriptions Redemptions End of Period Subscriptions Redemptions End of Period
A (Dis) 322.26 806.00 6,425.26 58.00 5,012.00 1,471.26 75.00 396.00 1,150.26
B (Cap) 1,500.00 5,066.00 11,977.00 859.00 6,146.00 6,690.00 30.00 1,331.00 5,389.00
E (Dis) 44,000.00 0.00 44,000.00 0.00 0.00 0.00 0.00 0.00 0.00
F (Cap) 71,702.00 194,881.00 295,353.51 22,100.07 188,196.15 129,257.43 64,184.99 47,299.19 146,143.23
I (Dis) 0.00 0.00 0.00 0.00 0.00 0.00 0.00 0.00 0.00
J (Cap) 0.00 0.00 4,519.00 549.00 2,150.00 2,918.00 0.00 0.00 2,918.00
M (Dis) 0.00 259.94 6,165.96 0.00 3,372.39 2,793.58 0.00 1,097.85 1,695.72
N (Cap) 0.00 129.96 2,044.44 0.00 85.00 1,959.44 0.00 559.85 1,399.59
P (Cap) 22.00 1,401.00 2,266.00 112.00 320.00 2,058.00 2,055.00 70.00 4,043.00
V (Dis) 0.00 0.00 0.00 0.00 0.00 0.00 0.00 0.00 0.00
W (Cap) 0.00 0.00 0.00 0.00 0.00 0.00 0.00 0.00 0.00
Z 0.00 0.00 0.00 0.00 0.00 0.00 0.00 0.00 0.00
TOTAL 372,751.17 147,147.71 162,738.80
Payable and receivable amounts for the UCI
EUR 31 December 2019 31 December 2020 31 December 2021
Class Subscriptions Redemptions Subscriptions Redemptions Subscriptions Redemptions
A (Dis) 143,223.36 359,311.38 26,255.80 2,192,822.23 33,129.25 177,735.29
B (Cap) 745,260.00 2,510,477.49 430,512.79 3,042,215.03 14,974.80 666,170.39
E (Dis) 19,901,640.00 0.00 0.00 0.00 0.00 0.00
F (Cap) 35,778,036.90 97,252,001.28 11,211,559.13 94,740,106.87 32,611,855.88 24,150,657.40
I (Dis) 0.00 0.00 0.00 0.00 0.00 0.00
J (Cap) 0.00 0.00 14,341,053.70 55,681,167.25 0.00 0.00
M (Dis) 0.00 117,329.88 0.00 1,500,974.65 0.00 488,623.19
N (Cap) 0.00 63,191.59 0.00 42,675.10 0.00 282,484.18
P (Cap) 580,662.50 35,968,588.03 2,957,754.22 8,485,975.20 54,949,520.70 1,868,969.90
V (Dis) 0.00 0.00 0.00 0.00 0.00 0.00
W (Cap) 0.00 0.00 0.00 0.00 0.00 0.00
Z 0.00 0.00 0.00 0.00 0.00 0.00
TOTAL 57,148,822.76 136,270,899.65 28,967,135.64 165,685,936.33 87,609,480.63 27,634,640.35
net asset value
EUR 31 December 2019 31 December 2020 31 December 2021
Class of the subfund Per share of the subfund Per share of the subfund Per share
A (Dis)
B (Cap)
E (Dis)
F (Cap)
I (Dis)
J (Cap)
M (Dis)
N (Cap)
P (Cap)
V (Dis)
W (Cap)
Z
359,399,169.07
449.42
496.25
449.56
502.47
0.00
26,308.91
449.81
497.74
26,346.32
0.00
0.00
0.00
206,289,009.66
451.60
505.15
0.00
512.48
0.00
26,854.36
451.75
507.47
26,912.72
0.00
0.00
0.00
262,835,157.05
438.91
496.31
0.00
504.48
0.00
26,457.85
439.08
499.47
26,535.25
0.00
0.00
0.00
TOTAL 359,399,169.07 206,289,009.66 262,835,157.05
On the date of publication of this report, the net asset value per share is published on the following websites: www.dpamfunds.com and www.beama.be. This information is also available at the counters of the financial services department.

DPAM CAPITAL B
Bonds EUR Medium Term
56
2.10. PERFORMANCES
Figures reflect past performance and are not an indicator of future performance. These figures do not include any restructuring. Returns are determined at the end of the financial year. The annual return is defined as the absolute return earned over a year. For the semi-annual report, the accounting year is 12-month period preceding the end of the half-year. From 2011, the calculation of the performance of the capitalization units is calculated similarly to the distribution units. This change is also applied to past performance. This change of method does not bring any significant difference compared to the method used previously. Bar chart showing annual returns of the last 10 years (in % and calculated in EUR) as of 31 December 2021: Class A (Dis) Table showing historical performance (actuarial returns):
Average cumulated returns Since
1 year 3 year 5 year 10 year
Year Value
Class A (Dis) -1.78 % (in EUR)
1.03 % (in EUR)
0.70 % (in EUR)
27/12/2013 1.84 % (in EUR)
Class B (Cap) Annual return:
This is an actively managed sub-fund, which means that the portfolio manager does not aim to replicate the performance of a benchmark. The benchmark is used to compare performance.
12
.6%
2.7
%
8.9
%
1.3
%
1.1
%
-0.7
%
-0.4
%
3.2
%
1.8
%
-1.7
%
10
.6%
2.1
%
9.0
%
1.4
%
1.9
%
0.3
%
0.4
%
3.3
%
2.2
%
-1.7
%
-4.00%
-2.00%
0.00%
2.00%
4.00%
6.00%
8.00%
10.00%
12.00%
14.00%
2012 2013 2014 2015 2016 2017 2018 2019 2020 2021
Class B (Cap) JPM EMU Government Investment Grade 1-10 years

DPAM CAPITAL B
Bonds EUR Medium Term
57
Table showing historical performance (actuarial returns):
Average cumulated returns Since
1 year 3 year 5 year 10 year
Year Value
Class B (Cap) -1.75 % (in EUR)
1.05 % (in EUR)
0.69 % (in EUR)
2.91 % (in EUR)
29/09/1992 4.86 % (in EUR)
Class F (Cap) Table showing historical performance (actuarial returns):
Average cumulated returns Since
1 year 3 year 5 year 10 year
Year Value
Class F (Cap) -1.56 % (in EUR)
1.25 % (in EUR)
0.91 % (in EUR)
3.07 % (in EUR)
20/12/2007 3.19 % (in EUR)
Class J (Cap) Table showing historical performance (actuarial returns):
Average cumulated returns Since
1 year 3 year 5 year 10 year
Year Value
Class J (Cap) -1.48 % (in EUR)
1.33 % (in EUR)
20/02/2018 1.12 % (in EUR)
Class M (Dis) Table showing historical performance (actuarial returns):
Average cumulated returns Since
1 year 3 year 5 year 10 year
Year Value
Class M (Dis) -1.63 % (in EUR)
1.20 % (in EUR)
29/12/2017 0.83 % (in EUR)
Class N (Cap) Table showing historical performance (actuarial returns):
Average cumulated returns Since
1 year 3 year 5 year 10 year
Year Value
Class N (Cap) -1.58 % (in EUR)
1.22 % (in EUR)
29/12/2017 0.85 % (in EUR)
Class P (Cap) Table showing historical performance (actuarial returns):
Average cumulated returns Since
1 year 3 year 5 year 10 year
Year Value
Class P (Cap) -1.40 % (in EUR)
1.41 % (in EUR)
29/12/2017 1.26 % (in EUR)
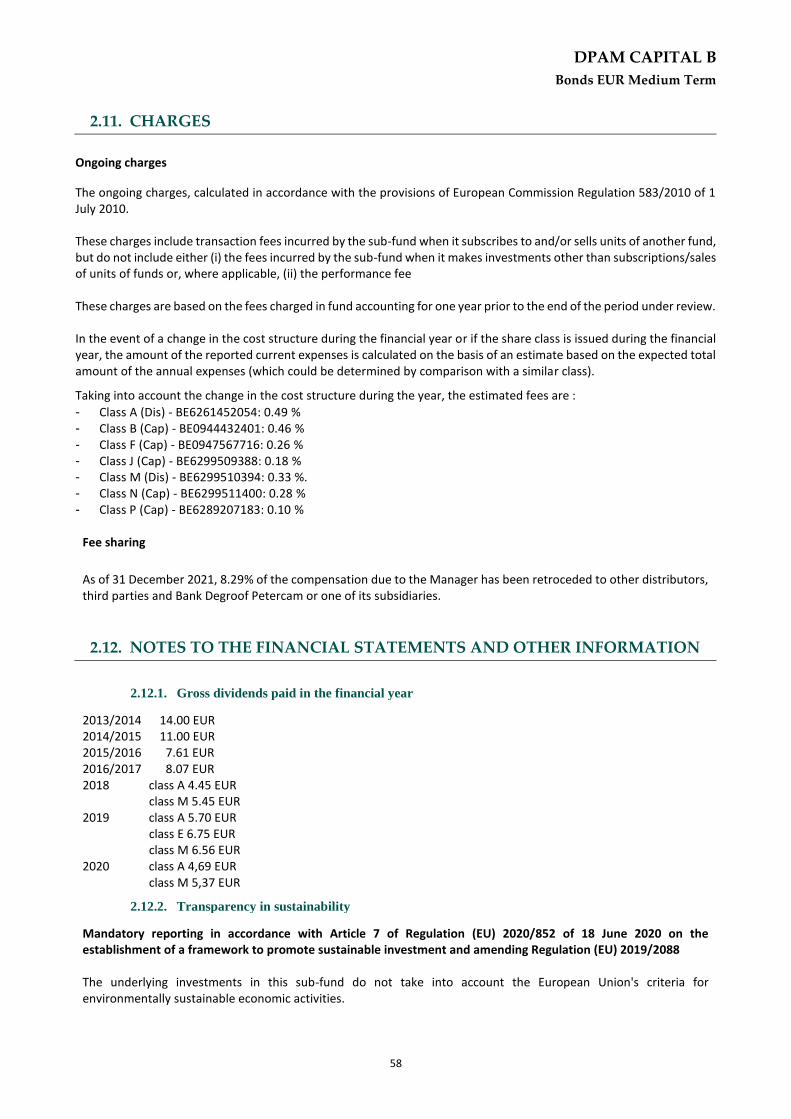
DPAM CAPITAL B
Bonds EUR Medium Term
58
2.11. CHARGES Bonds EUR Medium Term
Ongoing charges
The ongoing charges, calculated in accordance with the provisions of European Commission Regulation 583/2010 of 1 July 2010. These charges include transaction fees incurred by the sub-fund when it subscribes to and/or sells units of another fund, but do not include either (i) the fees incurred by the sub-fund when it makes investments other than subscriptions/sales of units of funds or, where applicable, (ii) the performance fee These charges are based on the fees charged in fund accounting for one year prior to the end of the period under review. In the event of a change in the cost structure during the financial year or if the share class is issued during the financial year, the amount of the reported current expenses is calculated on the basis of an estimate based on the expected total amount of the annual expenses (which could be determined by comparison with a similar class).
Taking into account the change in the cost structure during the year, the estimated fees are :
- Class A (Dis) - BE6261452054: 0.49 % - Class B (Cap) - BE0944432401: 0.46 % - Class F (Cap) - BE0947567716: 0.26 % - Class J (Cap) - BE6299509388: 0.18 % - Class M (Dis) - BE6299510394: 0.33 %. - Class N (Cap) - BE6299511400: 0.28 % - Class P (Cap) - BE6289207183: 0.10 %
Fee sharing
As of 31 December 2021, 8.29% of the compensation due to the Manager has been retroceded to other distributors, third parties and Bank Degroof Petercam or one of its subsidiaries.
2.12. NOTES TO THE FINANCIAL STATEMENTS AND OTHER INFORMATION
2.12.1. Gross dividends paid in the financial year
2013/2014 14.00 EUR 2014/2015 11.00 EUR 2015/2016 7.61 EUR 2016/2017 8.07 EUR 2018 class A 4.45 EUR class M 5.45 EUR 2019 class A 5.70 EUR class E 6.75 EUR class M 6.56 EUR 2020 class A 4,69 EUR class M 5,37 EUR
2.12.2. Transparency in sustainability
Mandatory reporting in accordance with Article 7 of Regulation (EU) 2020/852 of 18 June 2020 on the establishment of a framework to promote sustainable investment and amending Regulation (EU) 2019/2088 The underlying investments in this sub-fund do not take into account the European Union's criteria for environmentally sustainable economic activities.

DPAM CAPITAL B
Bonds EUR Medium Term
59
2.12.3. Transparency of the securities financing transactions and of reuse
In accordance with Article 13 and Section A of the Annex to Regulation EU 2015/2365 (hereinafter the Regulation), the Sicav must inform investors of its use of securities financing transactions and total return swaps in the annual report and the half-yearly report. The portfolio does not contain any loaned assets at the date of this report.
Bonds EUR Medium Term

DPAM CAPITAL B
Equities EMU Behavioral Value
60
3. INFORMATION ABOUT THE SUBFUND DPAM CAPITAL B EQUITIES EMU BEHAVIORAL VALUE
Equities EMU Behavioral Value
3.1. MANAGEMENT REPORT
3.1.1. Launch date of the sub-fund and subscription price of the shares
Initial subscription day: February 20, 2002 Initial subscription price: EUR 500.00
3.1.2. Stock exchange listing
The shares of the sub-fund are not listed on an exchange.
3.1.3. Aim and main outlines of the investment policy
The objective of the sub-fund is to provide the shareholders with as high a global return as possible. The sub-fund invests at least 50% in listed equities (without sector limitation) from the European Union member countries participating in the European Monetary Union (EMU). The investment policy embraces the principles of Behavioral Finance, a psychology-based academic field that analyses the financial markets. The sub-fund invests in equities which are deemed undervalued and exhibit a good price momentum. The fund will continue to widely spread the risks, mainly by a large sector diversification. This is an actively managed sub-fund, which means that the portfolio manager does not aim to replicate the performance of a benchmark.
3.1.4. Financial management of the portfolio
Degroof Petercam Asset Management S.A. Rue Guimard, 18, 1040 Brussels
3.1.5. Distributor
Degroof Petercam Asset Management S.A. Rue Guimard, 18, 1040 Brussels
3.1.6. Index and benchmark
The sub-fund uses the following index as its benchmark: MSCI EMU Net Return. This index is representative of the large- and mid-cap equity market of developed countries (as defined by MSCI and mainly based on the country of incorporation and the country of primary listing of its securities) in the EMU zone. The performance of this index is calculated by reinvesting net dividends (Net Return). This is an actively managed sub-fund, which means that the portfolio manager does not aim to replicate the performance of a benchmark. The benchmark is used for performance comparison purposes.
3.1.7. Policy followed during the year
The value style and strategy had good year in absolute or relatively to market, especially in the first half of the year as equities kept their momentum from good news on covid vaccines and progressive re-opening of the economies. The second half of the year was more volatile and undecisive as markets started to price in somewhat more hawkish (US) central bank, still weakening China economy and slower global growth momentum in general. New covid waves and omicron variant added to the uncertainties and risk of harsher confinement measures. After the summer, long term bond yields fell and curve flattened which hurt relative performance of value styles. Though, over the entire period, the fund benefited from its exposure to value factors as well as from sectors tilts in favor of financials, utilities, and energy while keeping a small underweight in bond proxies or long duration industry like real estate and technologies. All in all, stocks delivered above expectation in every quarterly results seasons. In absolute terms, the

DPAM CAPITAL B
Equities EMU Behavioral Value
61
best contributing stock selection was in the financials as the fund benefited from BNP Paribas, Raiffeisen Bank, UniCredit, or Bank of Ireland. In the insurances, Axa or NN contributed very positively so as CNP. Technology also contributed positively but the fund trailed the market in that sector as missing ASML was costly. Industrials picks were beneficial helped by Saint-Gobain, CNH Industrial, Kion, or Rexel among others. The most detrimental stock selection was in the consumer staples as the fund suffered from Beiersdorf and Henkel underperformance, as well as very weak returns from ABInbev, Danone or JDE Peet’s. In the first semester, missing Volkswagen rebound and overweighting Renault hurt the performance in the consumer durables.
3.1.8. Future policy
The current macro and policy conditions still offer favorable conditions for value factors exposure. The rotation in favor of undervalued and neglected stocks will have legs early next year as macro-economic background stay constructive and supported by massive fiscal stimulus, healthy consumer balance sheet and pent-up demand, rising capex, and falling global uncertainties. From here, the main downside risks are uncontrolled covid variants, uncontrolled inflation (and energy crisis), China not recovering strongly enough, and geopolitical risks in general. We will continue to implement the behavioral value systematic strategy by replacing relatively more expensive stocks (within industry group) by cheaper ones, avoiding value trapped, more financially challenged stocks, as well as highly controversial companies, paying close attention to the quality of the balance sheet so as to the Environmental, Social, and Governance dimensions. The funds will keep a diversified and close to neutral allocation at the sector level although keeping a small tilt in favor of the more cyclical and value ones and careful positioning on bond proxies and long duration stocks.
3.1.9. Synthetic risk and reward indicator
The synthetic risk and return indicator gives an indication of the risk associated with investing in a sub-fund. It places this risk on a scale ranging from one (lowest risk) to seven (highest risk). Risk and reward profile: 6

DPAM CAPITAL B
Equities EMU Behavioral Value
62
3.2. BALANCE SHEET
31 December 2021
EUR 31 December 2020
EUR
Section 1: Balance Sheet
TOTAL NET ASSETS 585,233,331.27 420,988,078.99
I. Fixed assets
A. Incorporation and organisation expenses B. Intangible assets C. Tangible assets
II. Transferable securities, money market instruments, UCIs and Financial derivatives
585,826,381.54 420,537,851.24
A. Bonds and other debt securities B. Money market instruments C. Shares and other securities similar to shares 585,826,381.54 420,537,851.24 a. Shares 585,826,381.54 420,537,851.24 D. Other transferable securities E. UCI with variable number of shares F. financial derivatives
III. Receivables and payables on more than one year
A. Receivables B. Payables
IV. Receivables and payables up to a year -722,042.94 -1,627,626.03
A. Receivables 34,785.48 a. Receivables 4,440.48 d. Others 30,345.00 B. Payables -722,042.94 -1,662,411.51 a. Payable amounts (-) -103.46 -1,230,261.00 c. Borrowing (-) -867.55 -525.55 e. Others (-) -721,071.93 -431,624.96
V. Deposits and liquidity 128,992.67 2,077,853.78
A. Demand bank deposits 128,992.67 2,077,853.78 B. Term bank deposits C. Others
VI. Deferred charges and accrued income
A. Expenses carried forward B. Accrued income C. Accrued expenses (-) D. Income carried forward (-)
TOTAL SHAREHOLDERS’ EQUITY 585,233,331.27 420,988,078.99
A. Capital 396,017,054.73 338,878,473.59 B. Income equalisation 5,479,603.36 34,179,869.37 C. Retained earnings 82,109,605.40 127,115,372.68 D. Result of the financial year 101,627,067.78 -79,185,636.65
Equities EMU Behavioral Value
DPAM CAPITAL B
Equities EMU Behavioral Value
63
31 December 2021
EUR 31 December 2020
EUR
Section 2: Off-balance sheet
I. Collateral (+/-)
A. Collateral (+/-) B. Other collateral
II. Underlying securities of the option contracts and warrants (+)
A. Option contracts and warrants bought B. Option contracts and warrants sold
III. Notional amount of futures contracts (+)
A. Futures contracts bought and Forward contracts B. Futures contracts sold and Forward Contracts
IV. Notional amount of the swap contracts (+)
A. Purchased swap contracts B. Sold swap contracts
V. Notional amount of other financial derivatives (+)
A. Purchased contracts B. Sold contracts
VI. Uncalled amounts on shares
VII. Commitments to resell on account of purchase-repurchase agreements
VIII. Commitments to repurchase on account of purchase-repurchase agreements
IX. Lent financial instruments

DPAM CAPITAL B
Equities EMU Behavioral Value
64
3.3. INCOME STATEMENT
31 December 2021
EUR 31 December 2020
EUR
Section 3: Income and expenditure account
I. Depreciation, capital loss and capital gain 94,097,591.76 -84,486,260.41
A. Bonds and other debt securities
B. Money market instruments
C. Shares and other securities similar to shares 94,099,285.78 -84,346,270.76
a. Shares 94,099,285.78 -84,346,270.76
Realised gain 84,174,754.80 39,630,999.12
Realised loss -16,172,717.64 -159,341,597.28
Unrealised gain and loss 26,097,248.62 35,364,327.40
D. Other Transferable Securities
E. UCI with variable number of shares
F. financial derivatives
G. Receivables, deposits, liquidity and payables
H. Foreign exchange positions and transactions -1,694.02 -139,989.65
a. financial derivatives 2,435.73
ii. Futures and forward contracts 2,435.73
Realised gain and loss 2,435.73
b. Other exchange positions and operations -1,694.02 -142,425.38
iv. Other -1,694.02 -142,425.38
Realised gain and loss -1,694.02 -142,425.38
II. Investment income and expenses 12,288,633.42 10,180,265.27
A. Dividends 13,155,514.53 10,912,813.22
B. Interest (+/-) 3.72 6,731.47
b. Deposits and liquidity 3.72 6,731.47
Interest on loans (-) -8,946.00 -21,501.74
Swap contracts (+/-)
Withholding tax (-) -857,938.83 -757,188.81
Belgian -211,635.00 -251,025.00
Foreign -646,303.83 -506,163.81
F. Other investment income 39,411.13
III. Other income
A. Anti dilution fee
B. Other
IV. Operating expenses -4,759,157.40 -4,879,641.51
A. Investment transaction and delivery costs (-) -2,625,539.91 -3,209,721.12
B. Financial expenses (-)
C. Custodian’s fee (-) -174,502.05 -107,664.84
D. Manager’s fee (-) -1,831,528.82 -1,636,938.53
a. Financial Management of the Portfolio -1,471,479.48 -1,221,123.53
Class A (Dis) -4,819.99 -5,419.74
Class B (Cap) -450,812.88 -379,486.02
Class F (Cap) -107,920.59 -57,167.23
Class J (Cap) -839,204.56 -702,641.28
Class L (Cap) -2,323.38 -1,792.82
Class M (Dis) -14,938.18 -9,777.18
Class N (Cap) -49,908.37 -62,995.76
Class W (Cap) -1,551.53 -1,843.50
b. Administration and accounting -360,049.34 -415,815.00
E. Administrative expenses (-) -38,344.61 -71,334.16
F. Incorporation and organisation expenses (-) -6,770.73 -5,296.05
G. Salaries and wages, social security charges and pensions (-) -871.13 -1,542.87
H. Services and various goods (-) -33,387.20 -19,206.61
I. Depreciation and provisions for liabilities and charges (-)
J. Taxes -37,379.82 -23,238.54
Class A (Dis) -566.75 -280.51
Class B (Cap) -29,247.21 -25,809.93
Class F (Cap) -71.14 365.32
Class J (Cap) 647.80 8,045.16
Class L (Cap) 0.32 3.96
Class M (Dis) -2,495.70 -1,563.28
Class N (Cap) -5,996.90 -7,436.03
Class P (Cap) 349.20 3,426.88
Class W (Cap) 0.56 9.89
K. Other expenses (-) -10,833.13 195,301.21
Income and expenditure for the financial year Sub-Total II + III + IV 7,529,476.02 5,300,623.76
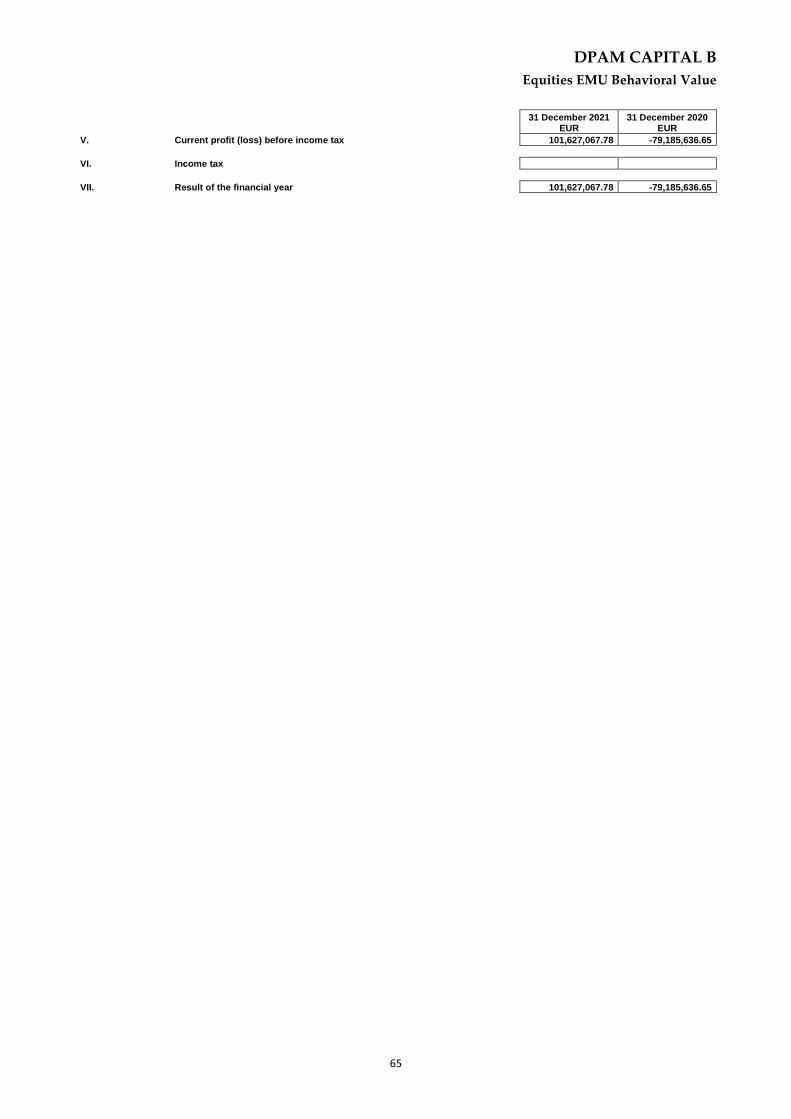
DPAM CAPITAL B
Equities EMU Behavioral Value
65
31 December 2021
EUR 31 December 2020
EUR
V. Current profit (loss) before income tax 101,627,067.78 -79,185,636.65
VI. Income tax
VII. Result of the financial year 101,627,067.78 -79,185,636.65

DPAM CAPITAL B
Equities EMU Behavioral Value
66
31 December 2021
EUR 31 December 2020
EUR
Section 4: Allocation of the result
I. Profit (Loss) to be allocated 189,216,276.54 82,109,605.40
a. Profit carried forward (Loss carried forward) from the previous period 82,109,605.40 127,115,372.68
b. Profit (loss) of the financial year 101,627,067.78 -79,185,636.65
c. Income equalisation received (Income equalisation paid out) 5,479,603.36 34,179,869.37
II. (Appropriation to) Deduction from the capital
III. (Profit to be carried forward) Loss to be carried forward -189,165,455.62 -82,109,605.40
IV. Dividend distribution -50,820.92

DPAM CAPITAL B
Equities EMU Behavioral Value
67
3.4. COMPOSITION OF THE ASSETS
Equities EMU Behavioral Value
Description Quantity at
31 December 2021 Currency
Price in currency
Evaluation EUR % by the
UCI %
portfolio % net assets
Transferable securities admitted to an official stock exchange listing
Shares
Austria
ANDRITZ 75,000 EUR 45.38 3,403,500.00 0.58% 0.58% OMV 110,000 EUR 49.95 5,494,500.00 0.94% 0.94% RAIFFEISEN BK INTER 170,000 EUR 25.88 4,399,600.00 0.75% 0.75% VOESTALPINE 200,000 EUR 32.00 6,400,000.00 1.09% 1.09%
19,697,600.00 3.36% 3.37%
Belgium
ANHEUSER-BUSCH INBEV 200,000 EUR 53.17 10,634,000.00 1.82% 1.82% SOLVAY 80,000 EUR 102.20 8,176,000.00 1.40% 1.40% UCB 55,000 EUR 100.35 5,519,250.00 0.94% 0.94%
24,329,250.00 4.15% 4.16%
Germany (Federal Republic)
ADIDAS AG NA O.N. 30,000 EUR 253.20 7,596,000.00 1.30% 1.30% BEIERSDORF 75,000 EUR 90.38 6,778,500.00 1.16% 1.16% BMW 105,000 EUR 88.49 9,291,450.00 1.59% 1.59% BRENNTAG SE 90,000 EUR 79.58 7,162,200.00 1.22% 1.22% COMMERZBANK AG 1,050,000 EUR 6.69 7,023,450.00 1.20% 1.20% COVESTRO 160,000 EUR 54.20 8,672,000.00 1.48% 1.48% DEUTSCHE POST 190,000 EUR 56.54 10,742,600.00 1.83% 1.84% DEUTSCHE TELEKOM NOM 600,000 EUR 16.30 9,780,000.00 1.67% 1.67% FRESENIUS SE CO 170,000 EUR 35.40 6,018,000.00 1.03% 1.03% GERRESHEIMER 45,000 EUR 84.70 3,811,500.00 0.65% 0.65% HENKEL 100,000 EUR 71.14 7,114,000.00 1.21% 1.22% INFINEON 360,000 EUR 40.76 14,673,600.00 2.50% 2.51% KION GROUP AG 70,000 EUR 96.48 6,753,600.00 1.15% 1.15% LEG IMMOBILIEN SE 16,000 EUR 122.70 1,963,200.00 0.34% 0.34% MERCK 25,000 EUR 227.00 5,675,000.00 0.97% 0.97% PORSCHE AUTOMOBIL 110,000 EUR 83.44 9,178,400.00 1.57% 1.57% RWE AG A 260,000 EUR 35.72 9,287,200.00 1.59% 1.59% SAP 175,000 EUR 124.90 21,857,500.00 3.73% 3.73% SIEMENS ENERGY AG 330,000 EUR 22.49 7,421,700.00 1.27% 1.27% UNITED INTERNET 110,000 EUR 34.94 3,843,400.00 0.66% 0.66%
164,643,300.00 28.10% 28.13%
Spain
GRIFOLS SA 240,880 EUR 16.88 4,064,850.00 0.69% 0.69% IBERDROLA SA 1,050,000 EUR 10.41 10,930,500.00 1.87% 1.87% MERLIN PROPERTIES 152,000 EUR 9.57 1,454,640.00 0.25% 0.25%
16,449,990.00 2.81% 2.81%
Finland
NOKIA-A-NEW 2,000,000 EUR 5.57 11,148,000.00 1.90% 1.90%
11,148,000.00 1.90% 1.90%
France
ACCOR 170,000 EUR 28.45 4,836,500.00 0.83% 0.83% AMUNDI 50,000 EUR 72.55 3,627,500.00 0.62% 0.62% ARKEMA 65,000 EUR 123.85 8,050,250.00 1.37% 1.38% AXA 480,000 EUR 26.18 12,568,800.00 2.15% 2.15% BOUYGUES 230,000 EUR 31.49 7,242,700.00 1.24% 1.24% CAPGEMINI 50,000 EUR 215.50 10,775,000.00 1.84% 1.84% CARREFOUR SA 300,000 EUR 16.11 4,831,500.00 0.82% 0.83% COVIVIO 25,000 EUR 72.20 1,805,000.00 0.31% 0.31% CREDIT AGRICOLE 600,000 EUR 12.55 7,530,000.00 1.29% 1.29%
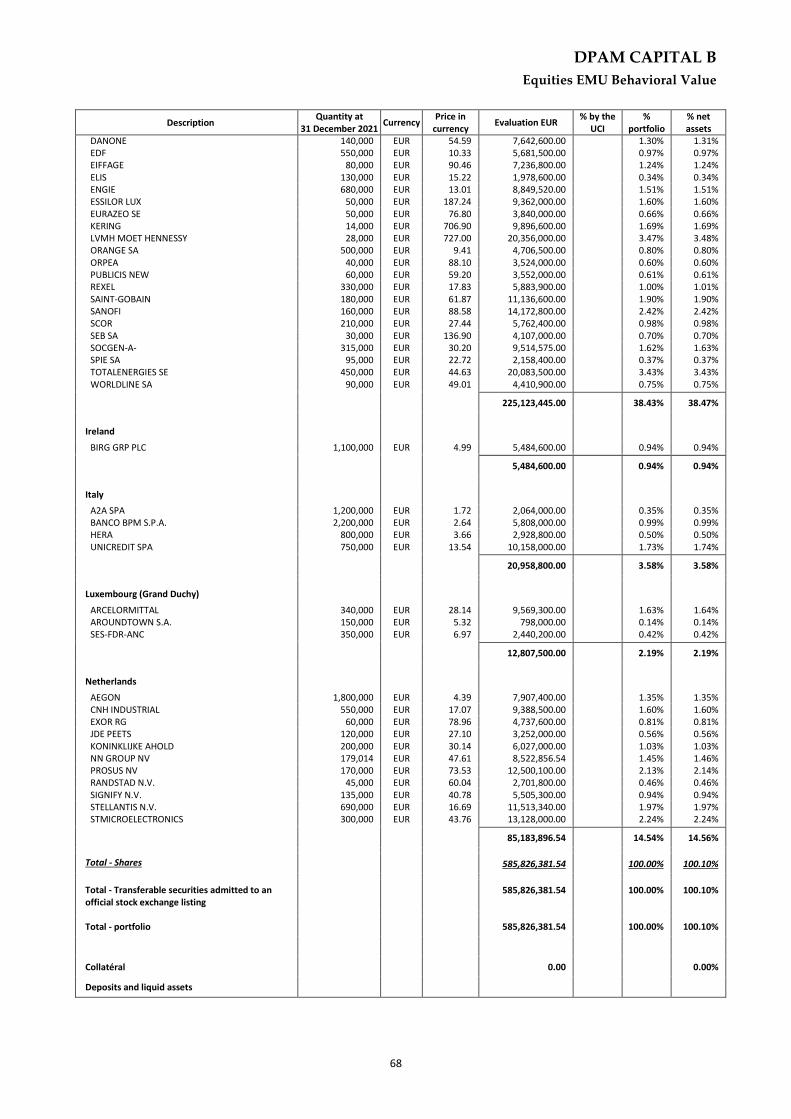
DPAM CAPITAL B
Equities EMU Behavioral Value
68
Description Quantity at
31 December 2021 Currency
Price in currency
Evaluation EUR % by the
UCI %
portfolio % net assets
DANONE 140,000 EUR 54.59 7,642,600.00 1.30% 1.31% EDF 550,000 EUR 10.33 5,681,500.00 0.97% 0.97% EIFFAGE 80,000 EUR 90.46 7,236,800.00 1.24% 1.24% ELIS 130,000 EUR 15.22 1,978,600.00 0.34% 0.34% ENGIE 680,000 EUR 13.01 8,849,520.00 1.51% 1.51% ESSILOR LUX 50,000 EUR 187.24 9,362,000.00 1.60% 1.60% EURAZEO SE 50,000 EUR 76.80 3,840,000.00 0.66% 0.66% KERING 14,000 EUR 706.90 9,896,600.00 1.69% 1.69% LVMH MOET HENNESSY 28,000 EUR 727.00 20,356,000.00 3.47% 3.48% ORANGE SA 500,000 EUR 9.41 4,706,500.00 0.80% 0.80% ORPEA 40,000 EUR 88.10 3,524,000.00 0.60% 0.60% PUBLICIS NEW 60,000 EUR 59.20 3,552,000.00 0.61% 0.61% REXEL 330,000 EUR 17.83 5,883,900.00 1.00% 1.01% SAINT-GOBAIN 180,000 EUR 61.87 11,136,600.00 1.90% 1.90% SANOFI 160,000 EUR 88.58 14,172,800.00 2.42% 2.42% SCOR 210,000 EUR 27.44 5,762,400.00 0.98% 0.98% SEB SA 30,000 EUR 136.90 4,107,000.00 0.70% 0.70% SOCGEN-A- 315,000 EUR 30.20 9,514,575.00 1.62% 1.63% SPIE SA 95,000 EUR 22.72 2,158,400.00 0.37% 0.37% TOTALENERGIES SE 450,000 EUR 44.63 20,083,500.00 3.43% 3.43% WORLDLINE SA 90,000 EUR 49.01 4,410,900.00 0.75% 0.75%
225,123,445.00 38.43% 38.47%
Ireland
BIRG GRP PLC 1,100,000 EUR 4.99 5,484,600.00 0.94% 0.94%
5,484,600.00 0.94% 0.94%
Italy
A2A SPA 1,200,000 EUR 1.72 2,064,000.00 0.35% 0.35% BANCO BPM S.P.A. 2,200,000 EUR 2.64 5,808,000.00 0.99% 0.99% HERA 800,000 EUR 3.66 2,928,800.00 0.50% 0.50% UNICREDIT SPA 750,000 EUR 13.54 10,158,000.00 1.73% 1.74%
20,958,800.00 3.58% 3.58%
Luxembourg (Grand Duchy)
ARCELORMITTAL 340,000 EUR 28.14 9,569,300.00 1.63% 1.64% AROUNDTOWN S.A. 150,000 EUR 5.32 798,000.00 0.14% 0.14% SES-FDR-ANC 350,000 EUR 6.97 2,440,200.00 0.42% 0.42%
12,807,500.00 2.19% 2.19%
Netherlands
AEGON 1,800,000 EUR 4.39 7,907,400.00 1.35% 1.35% CNH INDUSTRIAL 550,000 EUR 17.07 9,388,500.00 1.60% 1.60% EXOR RG 60,000 EUR 78.96 4,737,600.00 0.81% 0.81% JDE PEETS 120,000 EUR 27.10 3,252,000.00 0.56% 0.56% KONINKLIJKE AHOLD 200,000 EUR 30.14 6,027,000.00 1.03% 1.03% NN GROUP NV 179,014 EUR 47.61 8,522,856.54 1.45% 1.46% PROSUS NV 170,000 EUR 73.53 12,500,100.00 2.13% 2.14% RANDSTAD N.V. 45,000 EUR 60.04 2,701,800.00 0.46% 0.46% SIGNIFY N.V. 135,000 EUR 40.78 5,505,300.00 0.94% 0.94% STELLANTIS N.V. 690,000 EUR 16.69 11,513,340.00 1.97% 1.97% STMICROELECTRONICS 300,000 EUR 43.76 13,128,000.00 2.24% 2.24%
85,183,896.54 14.54% 14.56%
Total - Shares 585,826,381.54 100.00% 100.10%
Total - Transferable securities admitted to an official stock exchange listing
585,826,381.54 100.00% 100.10%
Total - portfolio 585,826,381.54 100.00% 100.10%
Collatéral 0.00 0.00%
Deposits and liquid assets

DPAM CAPITAL B
Equities EMU Behavioral Value
69
Description Quantity at
31 December 2021 Currency
Price in currency
Evaluation EUR % by the
UCI %
portfolio % net assets
deposit and liquid assets
Banque Degroof Petercam EUR 116,509.38 0.02%
Banque Degroof Petercam USD 12,483.29 0.00%
Total - deposit and liquid assets 128,992.67 0.02%
Total - Deposits and liquid assets 128,992.67 0.02%
Other receivables and other payables -722,042.94 -0.12%
Others 0.00 0.00%
Total net assets 585,233,331.27 100,00%
Equities EMU Behavioral Value
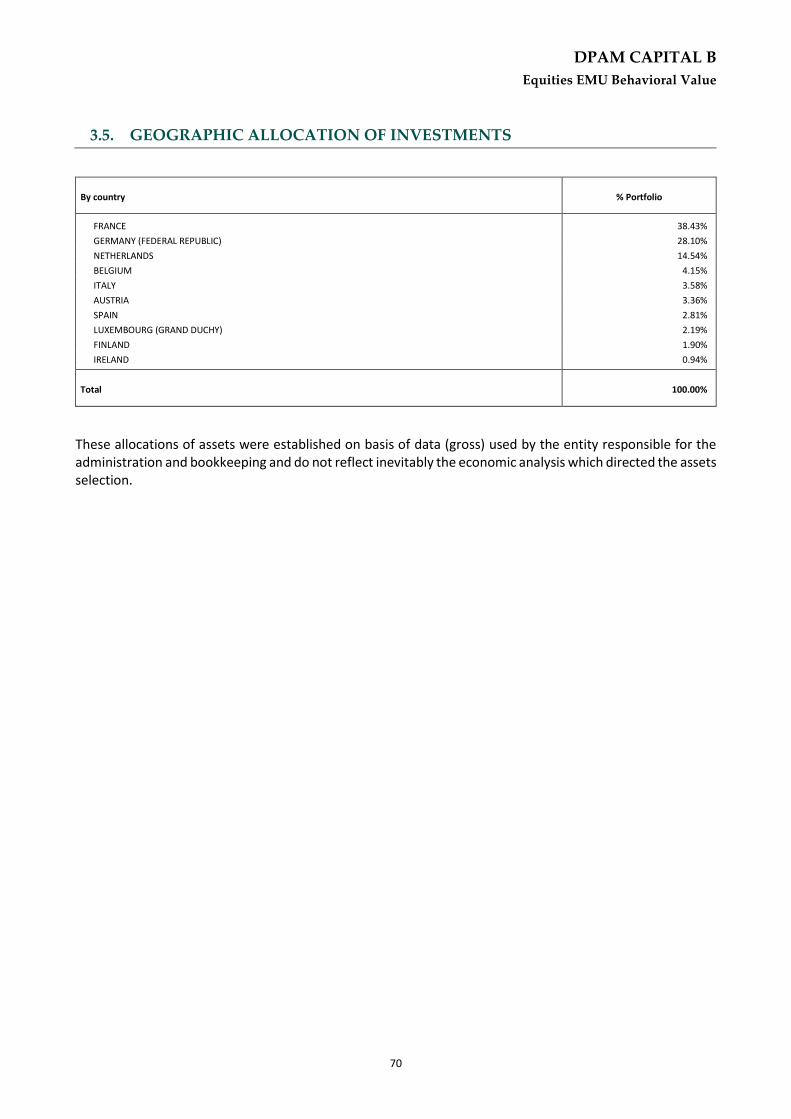
DPAM CAPITAL B
Equities EMU Behavioral Value
70
3.5. GEOGRAPHIC ALLOCATION OF INVESTMENTS
By country % Portfolio
FRANCE 38.43%
GERMANY (FEDERAL REPUBLIC) 28.10%
NETHERLANDS 14.54%
BELGIUM 4.15%
ITALY 3.58%
AUSTRIA 3.36%
SPAIN 2.81%
LUXEMBOURG (GRAND DUCHY) 2.19%
FINLAND 1.90%
IRELAND 0.94%
Total 100.00%
These allocations of assets were established on basis of data (gross) used by the entity responsible for the administration and bookkeeping and do not reflect inevitably the economic analysis which directed the assets selection.

DPAM CAPITAL B
Equities EMU Behavioral Value
71
3.6. ECONOMIC ALLOCATION OF INVESTMENTS
By sector % Portfolio
BANKS 8.54%
PHARMACOLOGY & PERSONAL CARE 8.11%
ENERGY SOURCES 6.78%
IT & INTERNET 6.23%
INSURANCE COMPANIES 5.93%
CHEMICAL PRODUCTS 5.47%
TELECOMMUNICATIONS 4.79%
TEXTILE & GARMENTS 4.77%
ELECTRIC & ELECTRONIC COMPONANTS 4.75%
OIL & DERIVED 4.37%
BUILDING MATERIALS 4.37%
MISCELLANEOUS CONSUMER GOODS 3.88%
ROAD VEHICLES 3.15%
MECHANICAL CONSTRUCTION 3.00%
FINANCIAL SERVICES - HOLDINGS 2.98%
PUBLISHING & BROADCASTING 2.74%
INTERMEDIATE INDUSTRY PRODUCTS 2.73%
RETAIL TRADING, DEPARTMENT STORES 2.51%
MISCELLANEOUS 1.97%
ELECTRIC & ELECTRONIC MATERIALS 1.94%
ROAD & RAILWAY TRANSPORTS 1.83%
TOBACCO & SPIRITS 1.82%
CONSUMER GOODS 1.49%
FOOD & CLEANING MATERIALS 1.30%
OTHER SERVICES 1.00%
LEISURES & TOURISM 0.83%
REAL ESTATE 0.78%
BIOTECHNOLOGY 0.69%
CAPITAL GOODS (MISCELLANEOUS) 0.65%
HEALTH CARE & SERVICES 0.60%
TOTAL 100.00%
These allocations of assets were established on basis of data (gross) used by the entity responsible for the administration and bookkeeping and do not reflect inevitably the economic analysis which directed the assets selection.

DPAM CAPITAL B
Equities EMU Behavioral Value
72
3.7. CHANGES IN THE COMPOSITION OF THE ASSETS IN EUR Equities EMU Behavioral Value
1st semester 2nd semester Total
Purchases 334,071,005.70 372,817,799.49 706,888,805.19 Sales 277,796,330.59 357,903,230.08 635,699,560.67 Total 1 611,867,336.29 730,721,029.57 1,342,588,365.86 Subscriptions 63,020,448.73 58,189,674.90 121,210,123.63 Redemptions 15,135,391.10 43,456,548.03 58,591,939.13 Total 2 78,155,839.83 101,646,222.93 179,802,062.76 Reference average of the total net asset 484,318,285.25 541,637,900.72 39,159,883.89
Rotation Percentage 110.20% 116.14% 2,969.33%
The rotation rate gives the annual average of the transactions. A figure close to 0% shows that the transactions relating to the securities or the assets with the exception of deposits and liquid assets during a given period, were done exclusively in function of the subscriptions and redemptions. A negative percentage indicates that the subscriptions and redemptions give rise to only few or, as the case may be, no transactions in the portfolio.
A detailed list of the transactions carried out during the financial year can be consulted, free of charge, at Banque Degroof Petercam S.A with its registered office at Rue de l’Industrie 44 - B-1040 Brussels which provides the financial services.
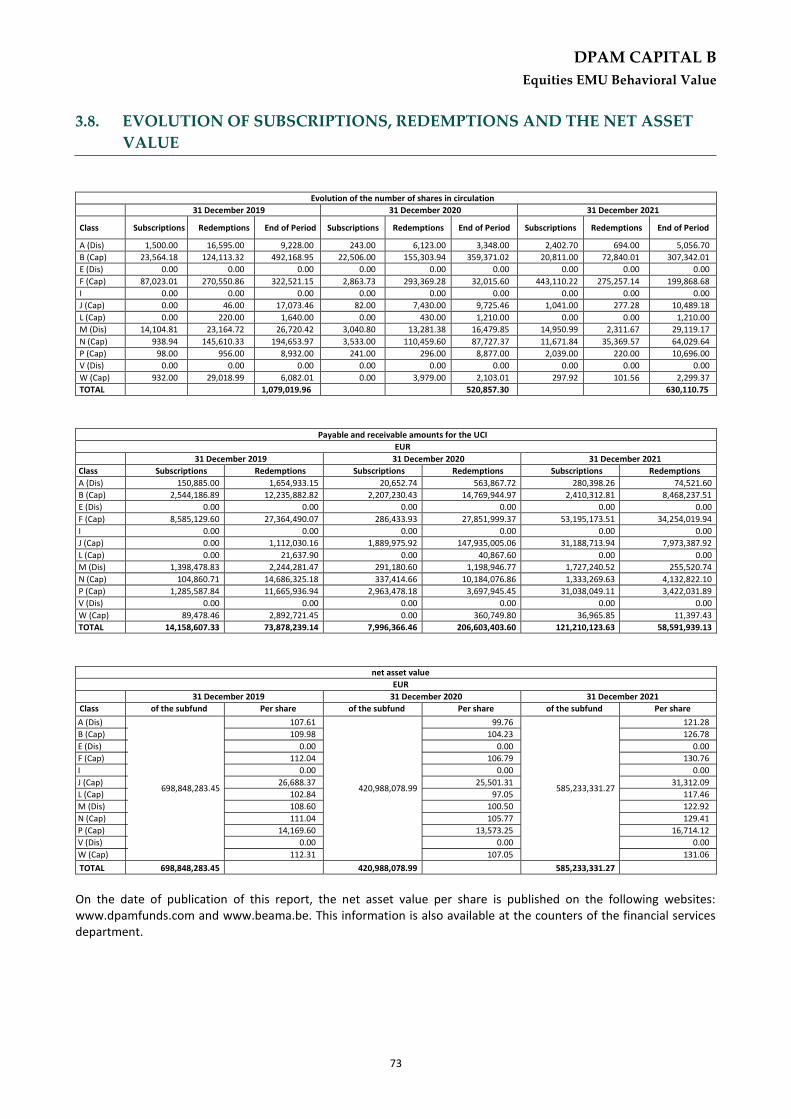
DPAM CAPITAL B
Equities EMU Behavioral Value
73
3.8. EVOLUTION OF SUBSCRIPTIONS, REDEMPTIONS AND THE NET ASSET
VALUE Equities EMU Behavioral Value
Evolution of the number of shares in circulation
31 December 2019 31 December 2020 31 December 2021
Class Subscriptions Redemptions End of Period Subscriptions Redemptions End of Period Subscriptions Redemptions End of Period
A (Dis) 1,500.00 16,595.00 9,228.00 243.00 6,123.00 3,348.00 2,402.70 694.00 5,056.70
B (Cap) 23,564.18 124,113.32 492,168.95 22,506.00 155,303.94 359,371.02 20,811.00 72,840.01 307,342.01
E (Dis) 0.00 0.00 0.00 0.00 0.00 0.00 0.00 0.00 0.00
F (Cap) 87,023.01 270,550.86 322,521.15 2,863.73 293,369.28 32,015.60 443,110.22 275,257.14 199,868.68
I 0.00 0.00 0.00 0.00 0.00 0.00 0.00 0.00 0.00
J (Cap) 0.00 46.00 17,073.46 82.00 7,430.00 9,725.46 1,041.00 277.28 10,489.18
L (Cap) 0.00 220.00 1,640.00 0.00 430.00 1,210.00 0.00 0.00 1,210.00
M (Dis) 14,104.81 23,164.72 26,720.42 3,040.80 13,281.38 16,479.85 14,950.99 2,311.67 29,119.17
N (Cap) 938.94 145,610.33 194,653.97 3,533.00 110,459.60 87,727.37 11,671.84 35,369.57 64,029.64
P (Cap) 98.00 956.00 8,932.00 241.00 296.00 8,877.00 2,039.00 220.00 10,696.00
V (Dis) 0.00 0.00 0.00 0.00 0.00 0.00 0.00 0.00 0.00
W (Cap) 932.00 29,018.99 6,082.01 0.00 3,979.00 2,103.01 297.92 101.56 2,299.37
TOTAL 1,079,019.96 520,857.30 630,110.75
Payable and receivable amounts for the UCI
EUR 31 December 2019 31 December 2020 31 December 2021
Class Subscriptions Redemptions Subscriptions Redemptions Subscriptions Redemptions
A (Dis) 150,885.00 1,654,933.15 20,652.74 563,867.72 280,398.26 74,521.60
B (Cap) 2,544,186.89 12,235,882.82 2,207,230.43 14,769,944.97 2,410,312.81 8,468,237.51
E (Dis) 0.00 0.00 0.00 0.00 0.00 0.00
F (Cap) 8,585,129.60 27,364,490.07 286,433.93 27,851,999.37 53,195,173.51 34,254,019.94
I 0.00 0.00 0.00 0.00 0.00 0.00
J (Cap) 0.00 1,112,030.16 1,889,975.92 147,935,005.06 31,188,713.94 7,973,387.92
L (Cap) 0.00 21,637.90 0.00 40,867.60 0.00 0.00
M (Dis) 1,398,478.83 2,244,281.47 291,180.60 1,198,946.77 1,727,240.52 255,520.74
N (Cap) 104,860.71 14,686,325.18 337,414.66 10,184,076.86 1,333,269.63 4,132,822.10
P (Cap) 1,285,587.84 11,665,936.94 2,963,478.18 3,697,945.45 31,038,049.11 3,422,031.89
V (Dis) 0.00 0.00 0.00 0.00 0.00 0.00
W (Cap) 89,478.46 2,892,721.45 0.00 360,749.80 36,965.85 11,397.43
TOTAL 14,158,607.33 73,878,239.14 7,996,366.46 206,603,403.60 121,210,123.63 58,591,939.13
net asset value
EUR 31 December 2019 31 December 2020 31 December 2021
Class of the subfund Per share of the subfund Per share of the subfund Per share
A (Dis)
B (Cap)
E (Dis)
F (Cap)
I
J (Cap)
L (Cap)
M (Dis)
N (Cap)
P (Cap)
V (Dis)
W (Cap)
698,848,283.45
107.61
109.98
0.00
112.04
0.00
26,688.37
102.84
108.60
111.04
14,169.60
0.00
112.31
420,988,078.99
99.76
104.23
0.00
106.79
0.00
25,501.31
97.05
100.50
105.77
13,573.25
0.00
107.05
585,233,331.27
121.28
126.78
0.00
130.76
0.00
31,312.09
117.46
122.92
129.41
16,714.12
0.00
131.06
TOTAL 698,848,283.45 420,988,078.99 585,233,331.27
On the date of publication of this report, the net asset value per share is published on the following websites: www.dpamfunds.com and www.beama.be. This information is also available at the counters of the financial services department.

DPAM CAPITAL B
Equities EMU Behavioral Value
74
3.9. PERFORMANCES
Figures reflect past performance and are not an indicator of future performance. These figures do not include any restructuring. Returns are determined at the end of the financial year. The annual return is defined as the absolute return earned over a year. For the semi-annual report, the accounting year is 12-month period preceding the end of the half-year. From 2011, the calculation of the performance of the capitalization units is calculated similarly to the distribution units. This change is also applied to past performance. This change of method does not bring any significant difference compared to the method used previously. Bar chart showing annual returns of the last 10 years (in % and calculated in EUR) as of 31 December 2021: Class A (Dis) Table showing historical performance (actuarial returns):
Average cumulated returns Since
1 year 3 year 5 year 10 year
Year Value
Class A (Dis) 21.57 % (in EUR)
12.60 % (in EUR)
6.08 % (in EUR)
30/12/2016 6.08 % (in EUR)
Class B (Cap) Annual return:
This is an actively managed sub-fund, which means that the portfolio manager does not aim to replicate the performance of a benchmark. The benchmark is used to compare performance.
22
.4% 26
.7%
2.1
%
13
.9%
4.6
%
13
.2%
-16
.8%
23
.9%
-5.2
%
21
.6%
19
.3% 23
.3%
4.3
%
9.8
%
4.4
%
12
.5%
-12
.7%
25
.5%
-1.0
%
22
.2%
-20.00%
-15.00%
-10.00%
-5.00%
0.00%
5.00%
10.00%
15.00%
20.00%
25.00%
30.00%
2012 2013 2014 2015 2016 2017 2018 2019 2020 2021
Class B (Cap) MSCI EMU Net Return
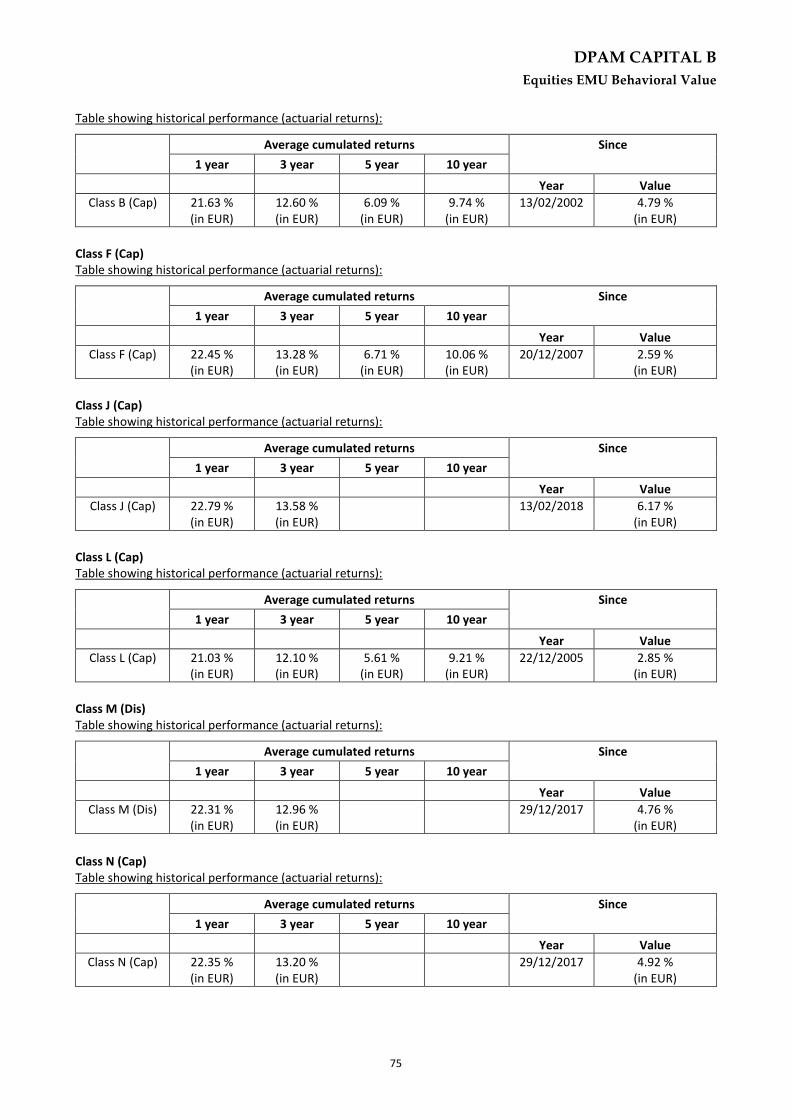
DPAM CAPITAL B
Equities EMU Behavioral Value
75
Table showing historical performance (actuarial returns):
Average cumulated returns Since
1 year 3 year 5 year 10 year
Year Value
Class B (Cap) 21.63 % (in EUR)
12.60 % (in EUR)
6.09 % (in EUR)
9.74 % (in EUR)
13/02/2002 4.79 % (in EUR)
Class F (Cap) Table showing historical performance (actuarial returns):
Average cumulated returns Since
1 year 3 year 5 year 10 year
Year Value
Class F (Cap) 22.45 % (in EUR)
13.28 % (in EUR)
6.71 % (in EUR)
10.06 % (in EUR)
20/12/2007 2.59 % (in EUR)
Class J (Cap) Table showing historical performance (actuarial returns):
Average cumulated returns Since
1 year 3 year 5 year 10 year
Year Value
Class J (Cap) 22.79 % (in EUR)
13.58 % (in EUR)
13/02/2018 6.17 % (in EUR)
Class L (Cap) Table showing historical performance (actuarial returns):
Average cumulated returns Since
1 year 3 year 5 year 10 year
Year Value
Class L (Cap) 21.03 % (in EUR)
12.10 % (in EUR)
5.61 % (in EUR)
9.21 % (in EUR)
22/12/2005 2.85 % (in EUR)
Class M (Dis) Table showing historical performance (actuarial returns):
Average cumulated returns Since
1 year 3 year 5 year 10 year
Year Value
Class M (Dis) 22.31 % (in EUR)
12.96 % (in EUR)
29/12/2017 4.76 % (in EUR)
Class N (Cap) Table showing historical performance (actuarial returns):
Average cumulated returns Since
1 year 3 year 5 year 10 year
Year Value
Class N (Cap) 22.35 % (in EUR)
13.20 % (in EUR)
29/12/2017 4.92 % (in EUR)

DPAM CAPITAL B
Equities EMU Behavioral Value
76
Class P (Cap) Table showing historical performance (actuarial returns):
Average cumulated returns Since
1 year 3 year 5 year 10 year
Year Value
Class P (Cap) 23.14 % (in EUR)
13.88 % (in EUR)
7.26 % (in EUR)
19/01/2015 7.52 % (in EUR)
Class W (Cap) Table showing historical performance (actuarial returns):
Average cumulated returns Since
1 year 3 year 5 year 10 year
Year Value
Class W (Cap) 22.43 % (in EUR)
13.28 % (in EUR)
6.79 % (in EUR)
13/12/2016 7.03 % (in EUR)

DPAM CAPITAL B
Equities EMU Behavioral Value
77
3.10. CHARGES Equities EMU Behavioral Value
Ongoing charges
The ongoing charges, calculated in accordance with the provisions of European Commission Regulation 583/2010 of 1 July 2010. These charges include transaction fees incurred by the sub-fund when it subscribes to and/or sells units of another fund, but do not include either (i) the fees incurred by the sub-fund when it makes investments other than subscriptions/sales of units of funds or, where applicable, (ii) the performance fee These charges are based on the fees charged in fund accounting for one year prior to the end of the period under review. In the event of a change in the cost structure during the financial year or if the share class is issued during the financial year, the amount of the reported current expenses is calculated on the basis of an estimate based on the expected total amount of the annual expenses (which could be determined by comparison with a similar class).
Taking into account the change in the cost structure during the year, the estimated fees are : Class A (Dis) - BE6289166744: 1.79 % Class B (Cap) - BE0948777207: 1.78 % Class F (Cap) - BE0948779229: 0.90 % Class J (Cap) - BE6299523520: 0.50 % Class L (Cap) - BE0948778213: 2.50 % Class M (Dis) - BE6299524536: 1.00 % Class N (Cap) - BE6299525541: 0.97 % Class P (Cap) - BE6249815083: 0.10 % Class W (Cap) - BE6289169771: 0.90 % Fee sharing On 31 December 2021, 12.49% of the remuneration due to the Manager was retroceded to other distributors, third parties and Bank Degroof Petercam or one of its subsidiaries.
3.11. NOTES TO THE FINANCIAL STATEMENTS AND OTHER INFORMATION
3.11.1. Gross dividends paid in the financial year
2016/2017 2.21 EUR 2018 - 2019 class A 1.66 EUR class M 2.16 EUR
3.11.2. transparency of securities financing transactions and of reuse
In accordance with Article 13 and Section A of the Annex to Regulation EU 2015/2365 (hereinafter the Regulation), the Sicav must inform investors of its use of securities financing transactions and total return swaps in the annual report and the half-yearly report. The portfolio does not contain any loaned assets at the date of this report.
3.11.3. Transparency in sustainability
This information is published in accordance with Article 11 of Regulation (EU) 2019/2088 of 27 November 2019 on sustainability-related disclosures in the financial services sector ("SFDR Regulation"), as amended by Article 25 of

DPAM CAPITAL B
Equities EMU Behavioral Value
78
Regulation (EU) 2020/852 of 18 June 2020 on the establishment of a framework to promote sustainable investment and amending Regulation (EU) 2019/2088 ("Taxonomy Regulation"), as well as in respect of the Taxonomy Regulation. 1. Extent to which environmental or social characteristics are met A) Sustainability indicators The sub-fund does not aim for sustainable investment but promotes environmental and social aspects within the meaning of the SFDR Regulation. The sustainability indicators used to measure compliance with the environmental or social characteristics promoted by this sub-fund correspond to the binding investment restrictions mentioned in the prospectus. In accordance with these investment restrictions, the sub-fund's portfolio during the period under review had:
a) Zero exposure to issuers deemed non-compliant with the 10 principles of the United Nations Global Compact
(which are part of the Global Standards) at the time the positions were purchased;
b) Zero exposure to issuers involved in controversial activities that meet the exclusion criteria set out in DPAM's
Controversial Activities Policy (available at www.dpamfunds.com), both at the time of purchase of the
positions and during the time the portfolio positions were held;
c) Zero exposure to issuers facing ESG controversies of maximum severity on environmental or social issues at
the time of purchase of the positions;
More information about the indicators and their methodology can be found in the prospectus and on the website www.dpamfunds.com. B) Use of derivatives The sub-fund does not use derivatives, if any are held, for the purpose of promoting environmental and/or social characteristics as described in the prospectus. 2. Statement on the Taxonomy Regulation The investments underlying this product do not take into account the European Union's criteria for environmentally sustainable economic activities.
3.11.4. Transparency of the securities financing transactions and of reuse
In accordance with Article 13 and Section A of the Annex to Regulation EU 2015/2365 (hereinafter the Regulation), the Sicav must inform investors of its use of securities financing transactions and total return swaps in the annual report and the half-yearly report. The portfolio does not contain any loaned assets at the date of this report.
Equities EMU Behavioral Value

DPAM CAPITAL B
Equities EMU Index
79
4. INFORMATION ABOUT THE SUBFUND DPAM CAPITAL B EQUITIES EMU INDEX
Equities EMU Index
4.1. MANAGEMENT REPORT
4.1.1. Launch date of the sub-fund and subscription price of the shares
Initial subscription day: April 20, 1998 Initial subscription price: 247.89 EUR. The shares of the B class were divided into 4 on July 30, 2015.
4.1.2. Stock exchange listing
The shares of the sub-fund are not listed on an exchange.
4.1.3. Aim and main outlines of the investment policy
The objective of the sub-fund is to provide shareholders with as high a global return as possible, with an accent on investments in equities from European Union member countries participating in the European Monetary Union (EMU). This is a passively managed sub-fund, which means that the portfolio manager's objective is to replicate the performance of a benchmark.
4.1.4. Financial management of the portfolio
Degroof Petercam Asset Management S.A. Rue Guimard, 18, 1040 Brussels
4.1.5. Distributor
Degroof Petercam Asset Management S.A. Rue Guimard, 18, 1040 Brussels
4.1.6. Index and benchmark
This benchmark is used in managing the sub-fund. MSCI EMU Net Return covers approximately 85% of the floating market capitalization of the countries in the EMU zone included in the index. Additional information on this index and its composition can be found at www.msci.com. The performance of the benchmark index is calculated by reinvesting net dividends (Net Return). This is a passively managed sub-fund, which means that the portfolio manager's objective is to replicate the performance of a benchmark. The possible composition and the value of the benchmark are shown on the website www.dpamfunds.com. The tracking error is of the order of 0.80%.
4.1.7. Policy followed during the year
The “Net Asset Value” of the fund (B share) on December 31, 2021 was 156.76 EUR and its performance between December 31, 2020 and December 31, 2021 is 22.50% (in EUR). The benchmark of the Equities EMU Index sub-fund is the MSCI EMU Net DTR index. The MSCI Emu Net DTR index, dividends net of local withholding tax reinvested, covers Eurozone countries and is established by MSCI. All the countries of Eurozone are included in this index, except Luxembourg given its low market capitalization. Greece was classified as an emerging country by the MSCI index at the end of 2013.

DPAM CAPITAL B
Equities EMU Index
80
As of December 31, 2021, the index had 233 positions. The index value can be viewed on MSCI's website, www.msci.com/end-of-day-data-search. The composition of its indices can be viewed on the MSCI’s website, www.msci.com/constituents. The objective of the fund is to physically and fully replicate the composition of the underlying index (MSCI EMU). As in the past, full investment continued in this compartment. The level of cash, after deduction of futures contracts on stock market indices, was kept at a very low level. The use of futures on the Dow Jones EuroStoxx 50 index supplemented positions in equities and allowed to be fully invested through liquid instrument without disrupting the portfolio structure during daily subscriptions and redemptions.
4.1.8. Future policy
As in the past, the Equities EMU Index sub-fund will pursue an investment policy based on geographic and sector indexation. The benchmark remains the EMU index published by MSCI.
4.1.9. Synthetic risk and reward indicator
The synthetic risk and return indicator gives an indication of the risk associated with investing in a sub-fund. It places this risk on a scale ranging from one (lowest risk) to seven (highest risk). Risk and reward profile: 6

DPAM CAPITAL B
Equities EMU Index
81
4.2. BALANCE SHEET
31 December 2021
EUR 31 December 2020
EUR
Section 1: Balance Sheet
TOTAL NET ASSETS 135,117,423.26 136,573,907.09
I. Fixed assets
A. Incorporation and organisation expenses B. Intangible assets C. Tangible assets
II. Transferable securities, money market instruments, UCIs and Financial derivatives
135,080,814.65 136,345,556.93
A. Bonds and other debt securities B. Money market instruments C. Shares and other securities similar to shares 135,080,814.65 136,345,556.93 a. Shares 135,080,814.65 136,345,556.93 D. Other transferable securities E. UCI with variable number of shares F. financial derivatives
III. Receivables and payables on more than one year
A. Receivables B. Payables
IV. Receivables and payables up to a year -171,787.56 -190,795.35
A. Receivables 167,450.68 317,449.91 a. Receivables 163,382.05 272,433.00 d. Others 4,068.63 45,016.91 B. Payables -339,238.24 -508,245.26 a. Payable amounts (-) -129,651.74 -292,478.04 c. Borrowing (-) -108.64 -179.68 e. Others (-) -209,477.86 -215,587.54
V. Deposits and liquidity 208,396.17 419,145.51
A. Demand bank deposits 208,396.17 419,145.51 B. Term bank deposits C. Others
VI. Deferred charges and accrued income
A. Expenses carried forward B. Accrued income C. Accrued expenses (-) D. Income carried forward (-)
TOTAL SHAREHOLDERS’ EQUITY 135,117,423.26 136,573,907.09
A. Capital 53,412,216.87 83,173,311.65 B. Income equalisation -726,453.18 1,816,406.59 C. Retained earnings 53,400,595.44 61,462,901.76 D. Result of the financial year 29,031,064.13 -9,878,712.91
Equities EMU I ndex
DPAM CAPITAL B
Equities EMU Index
82
31 December 2021
EUR 31 December 2020
EUR
Section 2: Off-balance sheet
I. Collateral (+/-)
A. Collateral (+/-) B. Other collateral
II. Underlying securities of the option contracts and warrants (+)
A. Option contracts and warrants bought B. Option contracts and warrants sold
III. Notional amount of futures contracts (+)
A. Futures contracts bought and Forward contracts B. Futures contracts sold and Forward Contracts
IV. Notional amount of the swap contracts (+)
A. Purchased swap contracts B. Sold swap contracts
V. Notional amount of other financial derivatives (+)
A. Purchased contracts B. Sold contracts
VI. Uncalled amounts on shares
VII. Commitments to resell on account of purchase-repurchase agreements
VIII. Commitments to repurchase on account of purchase-repurchase agreements
IX. Lent financial instruments

DPAM CAPITAL B
Equities EMU Index
83
4.3. INCOME STATEMENT
31 December 2021
EUR 31 December 2020
EUR
Section 3: Income and expenditure account
I. Depreciation, capital loss and capital gain 25,764,100.56 -13,678,913.22
A. Bonds and other debt securities
B. Money market instruments
C. Shares and other securities similar to shares 25,746,113.21 -13,638,040.88
a. Shares 25,746,113.21 -13,638,040.88
Realised gain 5,608,090.29 2,585,806.06
Realised loss -2,450,062.41 -15,019,214.44
Unrealised gain and loss 22,588,085.33 -1,204,632.50
D. Other Transferable Securities
E. UCI with variable number of shares
F. financial derivatives 15,180.00 -18,850.00
l. On financial indexes 15,180.00 -18,850.00
ii. Futures 15,180.00 -18,850.00
Realised gain and loss 15,180.00 -18,850.00
G. Receivables, deposits, liquidity and payables
H. Foreign exchange positions and transactions 2,807.35 -22,022.34
b. Other exchange positions and operations 2,807.35 -22,022.34
iv. Other 2,807.35 -22,022.34
Realised gain and loss 2,807.35 -22,022.34
II. Investment income and expenses 3,983,587.42 4,293,041.83
A. Dividends 4,223,241.23 4,374,834.73
B. Interest (+/-) 353.57 229,663.41
b. Deposits and liquidity 353.57 229,663.41
Interest on loans (-) -1,680.84 -5,013.47
Swap contracts (+/-)
Withholding tax (-) -238,326.54 -309,162.22
Belgian -26,421.73 -21,964.54
Foreign -211,904.81 -287,197.68
F. Other investment income 2,719.38
III. Other income 64,267.12 125,732.32
A. Anti dilution fee 64,267.12 125,732.32
B. Other
IV. Operating expenses -780,890.97 -618,573.84
A. Investment transaction and delivery costs (-) -68,990.10 -146,439.87
B. Financial expenses (-) -304.00 -222.00
C. Custodian’s fee (-) -47,194.50 -36,709.56
D. Manager’s fee (-) -580,358.29 -637,985.26
a. Financial Management of the Portfolio -478,457.45 -500,327.70
Class A (Dis) -21,414.40 -27,965.35
Class B (Cap) -222,197.15 -234,316.51
Class F (Cap) -104,113.06 -99,728.47
Class M (Dis) -17,240.48 -17,334.43
Class N (Cap) -113,492.36 -120,982.94
b. Administration and accounting -101,900.84 -137,657.56
E. Administrative expenses (-) -20,278.28 -25,772.79
F. Incorporation and organisation expenses (-) -1,281.68 -641.75
G. Salaries and wages, social security charges and pensions (-) 116.20 -564.13
H. Services and various goods (-) -13,256.52 -15,827.06
I. Depreciation and provisions for liabilities and charges (-)
J. Taxes -45,070.54 -47,579.42
Class A (Dis) -499.17 -5,094.79
Class B (Cap) -18,057.98 -17,150.41
Class F (Cap) -3,914.49 -2,680.93
Class M (Dis) -5,773.05 -4,965.83
Class N (Cap) -16,825.85 -17,690.21
Class P (Cap) 2.75
K. Other expenses (-) -4,273.26 293,168.00
Income and expenditure for the financial year Sub-Total II + III + IV 3,266,963.57 3,800,200.31
V. Current profit (loss) before income tax 29,031,064.13 -9,878,712.91
VI. Income tax
VII. Result of the financial year 29,031,064.13 -9,878,712.91
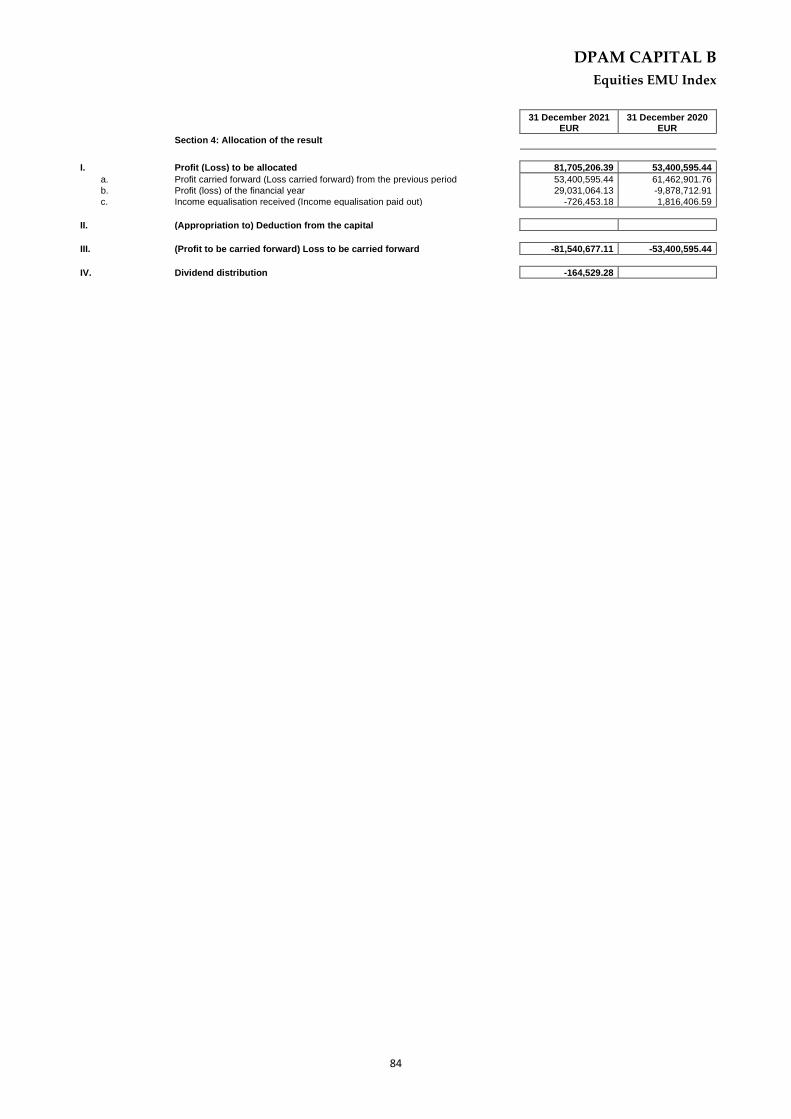
DPAM CAPITAL B
Equities EMU Index
84
31 December 2021
EUR 31 December 2020
EUR
Section 4: Allocation of the result
I. Profit (Loss) to be allocated 81,705,206.39 53,400,595.44
a. Profit carried forward (Loss carried forward) from the previous period 53,400,595.44 61,462,901.76
b. Profit (loss) of the financial year 29,031,064.13 -9,878,712.91
c. Income equalisation received (Income equalisation paid out) -726,453.18 1,816,406.59
II. (Appropriation to) Deduction from the capital
III. (Profit to be carried forward) Loss to be carried forward -81,540,677.11 -53,400,595.44
IV. Dividend distribution -164,529.28
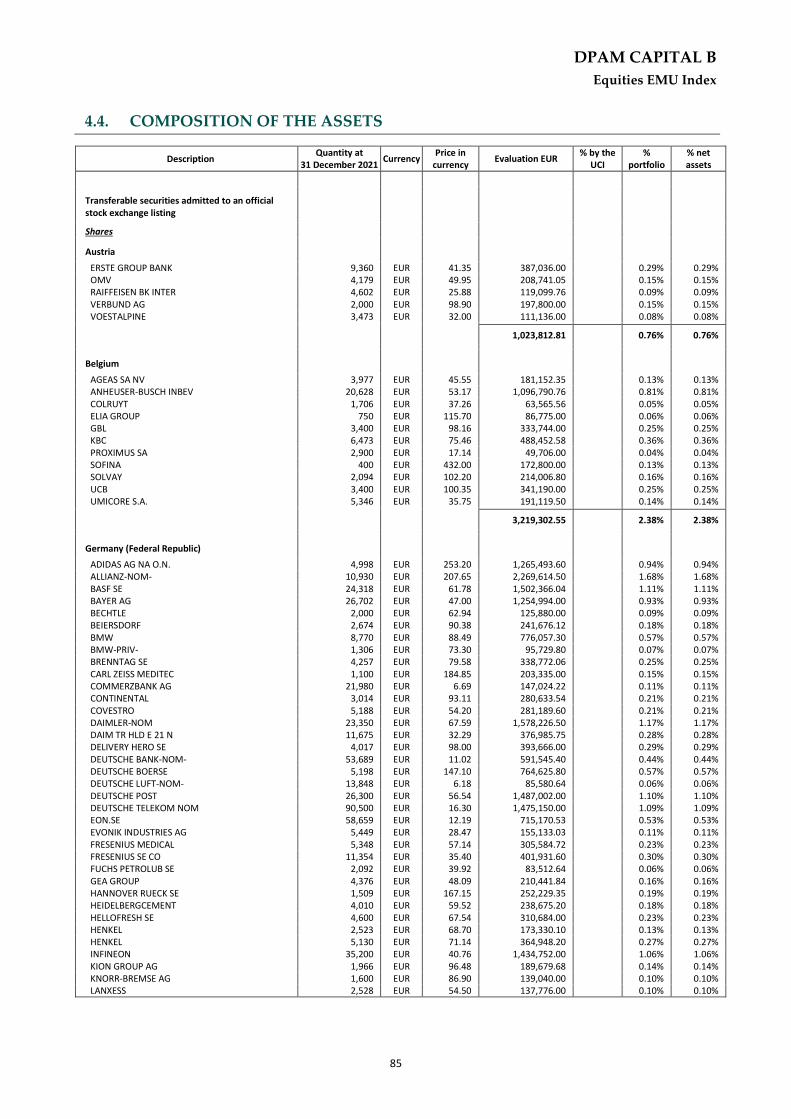
DPAM CAPITAL B
Equities EMU Index
85
4.4. COMPOSITION OF THE ASSETS
Equities EMU Index
Description Quantity at
31 December 2021 Currency
Price in currency
Evaluation EUR % by the
UCI %
portfolio % net assets
Transferable securities admitted to an official stock exchange listing
Shares
Austria
ERSTE GROUP BANK 9,360 EUR 41.35 387,036.00 0.29% 0.29% OMV 4,179 EUR 49.95 208,741.05 0.15% 0.15% RAIFFEISEN BK INTER 4,602 EUR 25.88 119,099.76 0.09% 0.09% VERBUND AG 2,000 EUR 98.90 197,800.00 0.15% 0.15% VOESTALPINE 3,473 EUR 32.00 111,136.00 0.08% 0.08%
1,023,812.81 0.76% 0.76%
Belgium
AGEAS SA NV 3,977 EUR 45.55 181,152.35 0.13% 0.13% ANHEUSER-BUSCH INBEV 20,628 EUR 53.17 1,096,790.76 0.81% 0.81% COLRUYT 1,706 EUR 37.26 63,565.56 0.05% 0.05% ELIA GROUP 750 EUR 115.70 86,775.00 0.06% 0.06% GBL 3,400 EUR 98.16 333,744.00 0.25% 0.25% KBC 6,473 EUR 75.46 488,452.58 0.36% 0.36% PROXIMUS SA 2,900 EUR 17.14 49,706.00 0.04% 0.04% SOFINA 400 EUR 432.00 172,800.00 0.13% 0.13% SOLVAY 2,094 EUR 102.20 214,006.80 0.16% 0.16% UCB 3,400 EUR 100.35 341,190.00 0.25% 0.25% UMICORE S.A. 5,346 EUR 35.75 191,119.50 0.14% 0.14%
3,219,302.55 2.38% 2.38%
Germany (Federal Republic)
ADIDAS AG NA O.N. 4,998 EUR 253.20 1,265,493.60 0.94% 0.94% ALLIANZ-NOM- 10,930 EUR 207.65 2,269,614.50 1.68% 1.68% BASF SE 24,318 EUR 61.78 1,502,366.04 1.11% 1.11% BAYER AG 26,702 EUR 47.00 1,254,994.00 0.93% 0.93% BECHTLE 2,000 EUR 62.94 125,880.00 0.09% 0.09% BEIERSDORF 2,674 EUR 90.38 241,676.12 0.18% 0.18% BMW 8,770 EUR 88.49 776,057.30 0.57% 0.57% BMW-PRIV- 1,306 EUR 73.30 95,729.80 0.07% 0.07% BRENNTAG SE 4,257 EUR 79.58 338,772.06 0.25% 0.25% CARL ZEISS MEDITEC 1,100 EUR 184.85 203,335.00 0.15% 0.15% COMMERZBANK AG 21,980 EUR 6.69 147,024.22 0.11% 0.11% CONTINENTAL 3,014 EUR 93.11 280,633.54 0.21% 0.21% COVESTRO 5,188 EUR 54.20 281,189.60 0.21% 0.21% DAIMLER-NOM 23,350 EUR 67.59 1,578,226.50 1.17% 1.17% DAIM TR HLD E 21 N 11,675 EUR 32.29 376,985.75 0.28% 0.28% DELIVERY HERO SE 4,017 EUR 98.00 393,666.00 0.29% 0.29% DEUTSCHE BANK-NOM- 53,689 EUR 11.02 591,545.40 0.44% 0.44% DEUTSCHE BOERSE 5,198 EUR 147.10 764,625.80 0.57% 0.57% DEUTSCHE LUFT-NOM- 13,848 EUR 6.18 85,580.64 0.06% 0.06% DEUTSCHE POST 26,300 EUR 56.54 1,487,002.00 1.10% 1.10% DEUTSCHE TELEKOM NOM 90,500 EUR 16.30 1,475,150.00 1.09% 1.09% EON.SE 58,659 EUR 12.19 715,170.53 0.53% 0.53% EVONIK INDUSTRIES AG 5,449 EUR 28.47 155,133.03 0.11% 0.11% FRESENIUS MEDICAL 5,348 EUR 57.14 305,584.72 0.23% 0.23% FRESENIUS SE CO 11,354 EUR 35.40 401,931.60 0.30% 0.30% FUCHS PETROLUB SE 2,092 EUR 39.92 83,512.64 0.06% 0.06% GEA GROUP 4,376 EUR 48.09 210,441.84 0.16% 0.16% HANNOVER RUECK SE 1,509 EUR 167.15 252,229.35 0.19% 0.19% HEIDELBERGCEMENT 4,010 EUR 59.52 238,675.20 0.18% 0.18% HELLOFRESH SE 4,600 EUR 67.54 310,684.00 0.23% 0.23% HENKEL 2,523 EUR 68.70 173,330.10 0.13% 0.13% HENKEL 5,130 EUR 71.14 364,948.20 0.27% 0.27% INFINEON 35,200 EUR 40.76 1,434,752.00 1.06% 1.06% KION GROUP AG 1,966 EUR 96.48 189,679.68 0.14% 0.14% KNORR-BREMSE AG 1,600 EUR 86.90 139,040.00 0.10% 0.10% LANXESS 2,528 EUR 54.50 137,776.00 0.10% 0.10%

DPAM CAPITAL B
Equities EMU Index
86
Description Quantity at
31 December 2021 Currency
Price in currency
Evaluation EUR % by the
UCI %
portfolio % net assets
LEG IMMOBILIEN SE 1,763 EUR 122.70 216,320.10 0.16% 0.16% MERCK 3,494 EUR 227.00 793,138.00 0.59% 0.59% MTU AERO ENGINES AG 1,363 EUR 179.40 244,522.20 0.18% 0.18% MUNCHENER-NOM 3,812 EUR 260.50 993,026.00 0.74% 0.73% NEMETSCHEK 1,600 EUR 112.80 180,480.00 0.13% 0.13% PORSCHE AUTOMOBIL 4,034 EUR 83.44 336,596.96 0.25% 0.25% PUMA 2,667 EUR 107.50 286,702.50 0.21% 0.21% RATIONAL 110 EUR 900.40 99,044.00 0.07% 0.07% RWE AG A 17,500 EUR 35.72 625,100.00 0.46% 0.46% SAP 28,067 EUR 124.90 3,505,568.30 2.60% 2.59% SARTORIUS VZ 660 EUR 595.20 392,832.00 0.29% 0.29% SCOUT24 SE 2,000 EUR 61.42 122,840.00 0.09% 0.09% SIEMENS ENERGY AG 11,401 EUR 22.49 256,408.49 0.19% 0.19% SIEMENS HEALTH 7,723 EUR 65.82 508,327.86 0.38% 0.38% SIEMENS-NOM- 20,437 EUR 152.68 3,120,321.16 2.31% 2.31% SYMRISE AG 3,431 EUR 130.30 447,059.30 0.33% 0.33% TELEFONICA DT H N 31,800 EUR 2.44 77,623.80 0.06% 0.06% UNIPER SE 2,841 EUR 41.80 118,753.80 0.09% 0.09% UNITED INTERNET 3,060 EUR 34.94 106,916.40 0.08% 0.08% VONOVIA SE 20,395 EUR 48.50 989,157.50 0.73% 0.73% VW 970 EUR 258.40 250,648.00 0.19% 0.19% VW-PRIV- 5,100 EUR 177.48 905,148.00 0.67% 0.67% ZALANDO 5,738 EUR 71.14 408,201.32 0.30% 0.30%
35,633,172.45 26.38% 26.37%
Spain
ACS 6,157 EUR 23.57 145,120.49 0.11% 0.11% AENA S.A. 2,200 EUR 138.80 305,360.00 0.23% 0.23% AMADEUS IT GROUP SA 12,101 EUR 59.64 721,703.64 0.53% 0.53% BANCO BILBAO 185,041 EUR 5.25 971,465.25 0.72% 0.72% BANCO SANTANDER 464,536 EUR 2.94 1,365,968.11 1.01% 1.01% CAIXABANK S.A 114,000 EUR 2.41 275,196.00 0.20% 0.20% CELLNEX TELECOM 13,926 EUR 51.18 712,732.68 0.53% 0.53% EDP RNOVAVEIS 8,500 EUR 21.90 186,150.00 0.14% 0.14% ENAGAS 5,552 EUR 20.40 113,260.80 0.08% 0.08% ENDESA 10,046 EUR 20.20 202,929.20 0.15% 0.15% FERROVIAL S.A 13,172 EUR 27.56 363,020.32 0.27% 0.27% GRIFOLS SA 6,600 EUR 16.88 111,375.00 0.08% 0.08% IBERDROLA SA 151,500 EUR 10.41 1,577,115.00 1.17% 1.17% INDITEX 29,772 EUR 28.53 849,395.16 0.63% 0.63% NATURGY ENERGY GROUP 4,069 EUR 28.63 116,495.47 0.09% 0.09% RED ELECTRICA CORP 11,593 EUR 19.02 220,556.83 0.16% 0.16% REPSOL 40,523 EUR 10.44 422,898.03 0.31% 0.31% SIEMENS GAMESA 5,277 EUR 21.07 111,186.39 0.08% 0.08% TELEFONICA 136,936 EUR 3.85 527,477.47 0.39% 0.39%
9,299,405.84 6.88% 6.88%
Finland
ELISA -A- 4,378 EUR 54.12 236,937.36 0.18% 0.18% FORTUM CORP 11,989 EUR 26.99 323,583.11 0.24% 0.24% KESKO CORP 7,600 EUR 29.34 222,984.00 0.17% 0.17% KONE B 9,200 EUR 63.04 579,968.00 0.43% 0.43% NESTE CORPORATION 10,718 EUR 43.36 464,732.48 0.34% 0.34% NOKIA-A-NEW 138,504 EUR 5.57 772,021.30 0.57% 0.57% ORION -B- NEW 2,994 EUR 36.52 109,340.88 0.08% 0.08% SAMPO OYJ 13,956 EUR 44.06 614,901.36 0.46% 0.46% STORA ENSO-R- 14,122 EUR 16.14 227,929.08 0.17% 0.17% UPM-KYMMENE 13,430 EUR 33.46 449,367.80 0.33% 0.33% WARTSILA -B- 13,029 EUR 12.36 161,038.44 0.12% 0.12%
4,162,803.81 3.08% 3.08%
France
ACCOR 4,996 EUR 28.45 142,136.20 0.11% 0.11% ADP 800 EUR 113.30 90,640.00 0.07% 0.07% AIR LIQUIDE 12,912 EUR 153.32 1,979,667.84 1.47% 1.47% ALSTOM 7,658 EUR 31.22 239,082.76 0.18% 0.18% AMUNDI 1,585 EUR 72.55 114,991.75 0.09% 0.09% ARKEMA 1,800 EUR 123.85 222,930.00 0.17% 0.16%

DPAM CAPITAL B
Equities EMU Index
87
Description Quantity at
31 December 2021 Currency
Price in currency
Evaluation EUR % by the
UCI %
portfolio % net assets
AXA 52,197 EUR 26.18 1,366,778.45 1.01% 1.01% BIOMERIEUX S.A. 1,149 EUR 124.90 143,510.10 0.11% 0.11% BNP 30,419 EUR 60.77 1,848,562.63 1.37% 1.37% BOLLORE 21,482 EUR 4.92 105,691.44 0.08% 0.08% BOUYGUES 5,984 EUR 31.49 188,436.16 0.14% 0.14% BUREAU VERITAS SA 8,663 EUR 29.18 252,786.34 0.19% 0.19% CAPGEMINI 4,400 EUR 215.50 948,200.00 0.70% 0.70% CARREFOUR SA 18,389 EUR 16.11 296,154.85 0.22% 0.22% CNP ASSURANCES 4,043 EUR 21.75 87,935.25 0.07% 0.07% COINTREAU 550 EUR 214.00 117,700.00 0.09% 0.09% COVIVIO 1,281 EUR 72.20 92,488.20 0.07% 0.07% CREDIT AGRICOLE 31,000 EUR 12.55 389,050.00 0.29% 0.29% DANONE 17,042 EUR 54.59 930,322.78 0.69% 0.69% DASSAULT AVIA 790 EUR 95.00 75,050.00 0.06% 0.06% DASSAULT SYSTEMES SE 17,300 EUR 52.31 904,963.00 0.67% 0.67% EDENRED SA 6,619 EUR 40.57 268,532.83 0.20% 0.20% EDF 13,846 EUR 10.33 143,029.18 0.11% 0.11% EIFFAGE 2,052 EUR 90.46 185,623.92 0.14% 0.14% ENGIE 50,811 EUR 13.01 661,254.35 0.49% 0.49% ESSILOR LUX 7,700 EUR 187.24 1,441,748.00 1.07% 1.07% EURAZEO SE 893 EUR 76.80 68,582.40 0.05% 0.05% FAURECIA 2,946 EUR 41.83 123,231.18 0.09% 0.09% FDJ 2,300 EUR 38.94 89,562.00 0.07% 0.07% GECINA 1,204 EUR 122.90 147,971.60 0.11% 0.11% GETLINK 11,044 EUR 14.56 160,800.64 0.12% 0.12% HERMES 853 EUR 1,536.00 1,310,208.00 0.97% 0.97% IPSEN 974 EUR 80.50 78,407.00 0.06% 0.06% KERING 1,972 EUR 706.90 1,394,006.80 1.03% 1.03% KLEPIERRE 5,700 EUR 20.85 118,845.00 0.09% 0.09% LEGRAND-PROV.OPO 7,398 EUR 102.90 761,254.20 0.56% 0.56% L OREAL 6,740 EUR 416.95 2,810,243.00 2.08% 2.08% LVMH MOET HENNESSY 7,477 EUR 727.00 5,435,779.00 4.02% 4.02% MICHELIN-B- 4,360 EUR 144.15 628,494.00 0.47% 0.47% ORANGE SA 53,656 EUR 9.41 505,063.93 0.37% 0.37% ORPEA 1,300 EUR 88.10 114,530.00 0.08% 0.08% PERNOD-RICARD 5,500 EUR 211.50 1,163,250.00 0.86% 0.86% PUBLICIS NEW 6,088 EUR 59.20 360,409.60 0.27% 0.27% RENAULT 5,546 EUR 30.55 169,402.57 0.13% 0.13% SAFRAN 9,400 EUR 107.66 1,012,004.00 0.75% 0.75% SAINT-GOBAIN 13,619 EUR 61.87 842,607.53 0.62% 0.62% SANOFI 30,477 EUR 88.58 2,699,652.66 2.00% 2.00% SARTORIUS STEDIM 801 EUR 482.40 386,402.40 0.29% 0.29% SCHNEIDER ELECTRIC 14,327 EUR 172.46 2,470,834.42 1.83% 1.83% SEB SA 763 EUR 136.90 104,454.70 0.08% 0.08% SOCGEN-A- 21,000 EUR 30.20 634,305.00 0.47% 0.47% SODEXO 2,087 EUR 77.06 160,824.22 0.12% 0.12% SUEZ SA 8,808 EUR 19.81 174,486.48 0.13% 0.13% TELEPERFORMANCE 1,516 EUR 392.00 594,272.00 0.44% 0.44% THALES 2,798 EUR 74.80 209,290.40 0.15% 0.15% TOTALENERGIES SE 66,800 EUR 44.63 2,981,284.00 2.21% 2.21% UBISOFT 3,000 EUR 43.07 129,210.00 0.10% 0.10% UNIBAIL RODAMCO WEST 3,625 EUR 61.62 223,372.50 0.17% 0.17% VALEO SA 6,516 EUR 26.58 173,195.28 0.13% 0.13% VEOLIA ENVIRON. 17,127 EUR 32.26 552,517.02 0.41% 0.41% VINCI SA 14,242 EUR 92.91 1,323,224.22 0.98% 0.98% VIVENDI 17,862 EUR 11.89 212,379.18 0.16% 0.16% WENDEL 678 EUR 105.40 71,461.20 0.05% 0.05% WORLDLINE SA 5,820 EUR 49.01 285,238.20 0.21% 0.21%
43,918,322.36 32.51% 32.50%
United Kingdom
COCA-COLA EUROPACIF 5,456 USD 55.93 268,338.09 0.20% 0.20%
268,338.09 0.20% 0.20%
Ireland
CRH 21,622 EUR 46.52 1,005,855.44 0.74% 0.74% FLUTTER ENTERT 4,600 EUR 139.00 639,400.00 0.47% 0.47% KERRY 4,400 EUR 113.25 498,300.00 0.37% 0.37% KINGSPAN GROUP PLC 4,095 EUR 105.00 429,975.00 0.32% 0.32%

DPAM CAPITAL B
Equities EMU Index
88
Description Quantity at
31 December 2021 Currency
Price in currency
Evaluation EUR % by the
UCI %
portfolio % net assets
SMURFIT KAPPA 6,178 EUR 48.44 299,262.32 0.22% 0.22%
2,872,792.76 2.13% 2.13%
Italy
AMPLIFON SPA 3,000 EUR 47.45 142,350.00 0.11% 0.11% ATLANTIA SPA 12,355 EUR 17.45 215,656.53 0.16% 0.16% DIASORIN SPA 801 EUR 167.45 134,127.45 0.10% 0.10% ENEL NEW 216,231 EUR 7.05 1,523,563.63 1.13% 1.13% ENI SPA 66,407 EUR 12.22 811,493.54 0.60% 0.60% FINECOBANK SPA 15,000 EUR 15.44 231,525.00 0.17% 0.17% GENERALI 31,500 EUR 18.63 586,845.00 0.43% 0.43% INFRASTRUTTURE WIREL 10,000 EUR 10.68 106,800.00 0.08% 0.08% INTESA SANPAOLO 458,390 EUR 2.27 1,042,378.86 0.77% 0.77% MEDIOBANCA 17,383 EUR 10.11 175,742.13 0.13% 0.13% MONCLER SPA 5,751 EUR 64.02 368,179.02 0.27% 0.27% NEXI SPA 12,500 EUR 13.99 174,875.00 0.13% 0.13% POSTE ITALIANE 14,847 EUR 11.54 171,334.38 0.13% 0.13% PRYSMIAN SPA 6,181 EUR 33.11 204,652.91 0.15% 0.15% RECORDATI IND-NEW 2,700 EUR 56.50 152,550.00 0.11% 0.11% SNAM SPA 57,986 EUR 5.30 307,325.80 0.23% 0.23% TELECOM ITALIA 237,055 EUR 0.43 102,929.28 0.08% 0.08% TERNA 37,274 EUR 7.11 265,167.24 0.20% 0.20% UNICREDIT SPA 55,232 EUR 13.54 748,062.21 0.55% 0.55%
7,465,557.98 5.53% 5.53%
Luxembourg (Grand Duchy)
ARCELORMITTAL 17,013 EUR 28.14 478,830.89 0.35% 0.35% AROUNDTOWN S.A. 24,000 EUR 5.32 127,680.00 0.09% 0.09% EUROFINS SCIENTIFIC 3,390 EUR 108.80 368,832.00 0.27% 0.27% INPOST S.A. 7,000 EUR 10.60 74,186.00 0.05% 0.05% TENARIS 11,558 EUR 9.21 106,449.18 0.08% 0.08%
1,155,978.07 0.86% 0.86%
Netherlands
ABN AMRO DR 12,412 EUR 12.92 160,313.39 0.12% 0.12% ADYEN N.V. 525 EUR 2,311.50 1,213,537.50 0.90% 0.90% AEGON 41,683 EUR 4.39 183,113.42 0.14% 0.14% AIRBUS 15,950 EUR 112.36 1,792,142.00 1.33% 1.33% AKZO NOBEL NV 4,962 EUR 96.50 478,833.00 0.35% 0.35% ARGEN-X N.V. 1,300 EUR 315.30 409,890.00 0.30% 0.30% ASM INTERNATIONAL 1,330 EUR 388.70 516,971.00 0.38% 0.38% ASML HOLDING NV 11,070 EUR 706.70 7,823,169.00 5.79% 5.79% CNH INDUSTRIAL 27,964 EUR 17.07 477,345.48 0.35% 0.35% DAVIDE CAMP MIL 13,999 EUR 12.86 179,957.15 0.13% 0.13% DSM 4,600 EUR 198.00 910,800.00 0.67% 0.67% EURONEXT NV 2,200 EUR 91.25 200,750.00 0.15% 0.15% EXOR RG 2,900 EUR 78.96 228,984.00 0.17% 0.17% FERRARI NV 3,340 EUR 227.50 759,850.00 0.56% 0.56% HEINEKEN 2,894 EUR 81.15 234,848.10 0.17% 0.17% HEINEKEN- 6,793 EUR 98.86 671,555.98 0.50% 0.50% IMCD N.V. 1,500 EUR 194.70 292,050.00 0.22% 0.22% ING GROUP 104,500 EUR 12.24 1,279,289.00 0.95% 0.95% JDE PEETS 2,700 EUR 27.10 73,170.00 0.05% 0.05% JUST EAT TAKEAWAY 4,782 EUR 48.47 231,783.54 0.17% 0.17% KONINKLIJKE AHOLD 27,471 EUR 30.14 827,838.59 0.61% 0.61% KPN NEW 78,743 EUR 2.73 214,968.39 0.16% 0.16% NN GROUP NV 7,100 EUR 47.61 338,031.00 0.25% 0.25% PHILIPS NV 23,686 EUR 32.77 776,071.79 0.57% 0.57% PROSUS NV 24,810 EUR 73.53 1,824,279.30 1.35% 1.35% QIAGEN NV 5,608 EUR 48.99 274,735.92 0.20% 0.20% RANDSTAD N.V. 3,000 EUR 60.04 180,120.00 0.13% 0.13% STELLANTIS N.V. 53,000 EUR 16.69 884,358.00 0.65% 0.65% STMICROELECTRONICS 18,179 EUR 43.76 795,513.04 0.59% 0.59% UNIVERSAL MUSIC 19,862 EUR 24.78 492,180.36 0.36% 0.36% WOLTERS KLUWER 7,078 EUR 103.60 733,280.80 0.54% 0.54%
25,459,729.75 18.85% 18.84%

DPAM CAPITAL B
Equities EMU Index
89
Description Quantity at
31 December 2021 Currency
Price in currency
Evaluation EUR % by the
UCI %
portfolio % net assets
Portugal
BANCO ESPIRITO 583,007 EUR 0.00 0.00 0.00% 0.00% EDP-ENERGIAS-REG 73,313 EUR 4.83 354,248.42 0.26% 0.26% GALP ENERGIA -B- 14,688 EUR 8.52 125,141.76 0.09% 0.09% JERONIMO 6,080 EUR 20.10 122,208.00 0.09% 0.09%
601,598.18 0.45% 0.45%
Total - Shares 135,080,814.65 100.00% 99.97%
Total - Transferable securities admitted to an official stock exchange listing
135,080,814.65 100.00% 99.97%
Total - portfolio 135,080,814.65 100.00% 99.97%
Collatéral 0.00 0.00%
Deposits and liquid assets
deposit and liquid assets
Banque Degroof Petercam GBP 4,223.63 0.00%
Banque Degroof Petercam USD 2,177.08 0.00%
Banque Degroof Petercam EUR 201,995.46 0.15%
Total - deposit and liquid assets 208,396.17 0.15%
Total - Deposits and liquid assets 208,396.17 0.15%
Other receivables and other payables -171,787.56 -0.13%
Others 0.00 0.00%
Total net assets 135,117,423.26 100,00%
Equities EMU Index

DPAM CAPITAL B
Equities EMU Index
90
4.5. GEOGRAPHIC ALLOCATION OF INVESTMENTS
By country % Portfolio
FRANCE 32.50%
GERMANY (FEDERAL REPUBLIC) 26.38%
NETHERLANDS 18.85%
SPAIN 6.88%
ITALY 5.53%
FINLAND 3.08%
BELGIUM 2.38%
IRELAND 2.13%
LUXEMBOURG (GRAND DUCHY) 0.86%
AUSTRIA 0.76%
PORTUGAL 0.45%
UNITED KINGDOM 0.20%
Total 100.00%
These allocations of assets were established on basis of data (gross) used by the entity responsible for the administration and bookkeeping and do not reflect inevitably the economic analysis which directed the assets selection.

DPAM CAPITAL B
Equities EMU Index
91
4.6. ECONOMIC ALLOCATION OF INVESTMENTS
By sector % Portfolio
ELECTRIC & ELECTRONIC COMPONANTS 8.38%
PHARMACOLOGY & PERSONAL CARE 8.19%
BANKS 7.37%
TEXTILE & GARMENTS 6.72%
IT & INTERNET 6.26%
CHEMICAL PRODUCTS 5.93%
ENERGY SOURCES 5.89%
INSURANCE COMPANIES 5.09%
TELECOMMUNICATIONS 4.88%
ROAD VEHICLES 4.11%
OIL & DERIVED 3.95%
BUILDING MATERIALS 3.23%
FINANCIAL SERVICES - HOLDINGS 2.81%
ELECTRIC & ELECTRONIC MATERIALS 2.73%
TOBACCO & SPIRITS 2.56%
PUBLISHING & BROADCASTING 2.32%
CAPITAL GOODS (MISCELLANEOUS) 2.31%
RETAIL TRADING, DEPARTMENT STORES 2.18%
AEROSPACE INDUSTRY & DEFENCE 1.91%
ROAD & RAILWAY TRANSPORTS 1.78%
MECHANICAL CONSTRUCTION 1.43%
REAL ESTATE 1.42%
FOOD & CLEANING MATERIALS 1.26%
MISCELLANEOUS CONSUMER GOODS 1.13%
MISCELLANEOUS 0.77%
CONSUMER GOODS 0.75%
TYRES & RUBBER 0.67%
BIOTECHNOLOGY 0.59%
LEISURES & TOURISM 0.58%
INTERMEDIATE INDUSTRY PRODUCTS 0.57%
OTHER SERVICES 0.55%
FOREST PRODUCTS & PAPER INDUSTRY 0.50%
AIRLIFT 0.36%
HEALTH CARE & SERVICES 0.24%
PHOTOGRAPHY & OPTICAL 0.23%
NONFERROUS METALS 0.14%
UTILITIES 0.14%
FINANCE MISCELLANEOUS 0.07%
TOTAL 100.00%
These allocations of assets were established on basis of data (gross) used by the entity responsible for the administration and bookkeeping and do not reflect inevitably the economic analysis which directed the assets selection.
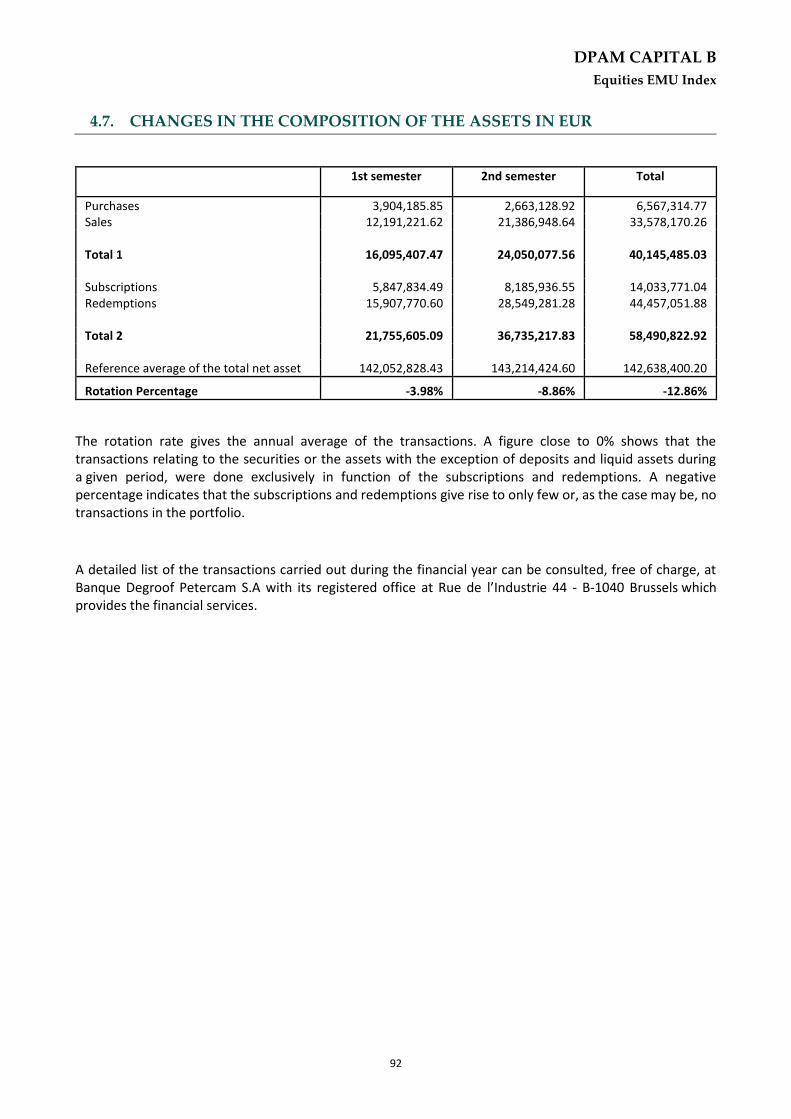
DPAM CAPITAL B
Equities EMU Index
92
4.7. CHANGES IN THE COMPOSITION OF THE ASSETS IN EUR Equities EMU Index
1st semester 2nd semester Total
Purchases 3,904,185.85 2,663,128.92 6,567,314.77 Sales 12,191,221.62 21,386,948.64 33,578,170.26 Total 1 16,095,407.47 24,050,077.56 40,145,485.03 Subscriptions 5,847,834.49 8,185,936.55 14,033,771.04 Redemptions 15,907,770.60 28,549,281.28 44,457,051.88 Total 2 21,755,605.09 36,735,217.83 58,490,822.92 Reference average of the total net asset 142,052,828.43 143,214,424.60 142,638,400.20
Rotation Percentage -3.98% -8.86% -12.86%
The rotation rate gives the annual average of the transactions. A figure close to 0% shows that the transactions relating to the securities or the assets with the exception of deposits and liquid assets during a given period, were done exclusively in function of the subscriptions and redemptions. A negative percentage indicates that the subscriptions and redemptions give rise to only few or, as the case may be, no transactions in the portfolio.
A detailed list of the transactions carried out during the financial year can be consulted, free of charge, at Banque Degroof Petercam S.A with its registered office at Rue de l’Industrie 44 - B-1040 Brussels which provides the financial services.

DPAM CAPITAL B
Equities EMU Index
93
4.8. EVOLUTION OF SUBSCRIPTIONS, REDEMPTIONS AND THE NET ASSET
VALUE Equities EMU Index
Evolution of the number of shares in circulation
31 December 2019 31 December 2020 31 December 2021
Class Subscriptions Redemptions End of Period Subscriptions Redemptions End of Period Subscriptions Redemptions End of Period
A (Dis) 6,540.00 27,809.85 56,714.91 1,867.68 10,264.97 48,317.62 145.03 39,351.62 9,111.03
B (Cap) 44,791.85 334,255.60 577,000.06 13,819.85 264,199.99 326,619.93 12,615.14 72,827.72 266,407.35
E (Dis) 0.00 0.00 0.00 0.00 0.00 0.00 0.00 0.00 0.00
F (Cap) 25,985.00 105,709.00 98,926.12 19,480.00 43,615.00 74,791.12 5,746.00 12,265.00 68,272.12
I 0.00 0.00 0.00 0.00 0.00 0.00 0.00 0.00 0.00
J (Cap) 0.00 1,229.68 0.00 0.00 0.00 0.00 0.00 0.00 0.00
M (Dis) 13,693.00 47,852.76 74,682.86 17,874.55 41,787.82 50,769.59 29,725.47 25,084.81 55,410.25
N (Cap) 32,951.68 269,519.84 482,867.20 80,776.01 221,985.44 341,657.77 31,432.08 118,086.05 255,003.80
P (Cap) 132.00 2,404.00 925.00 14.00 931.00 0.00 0.00 8.00 0.00
TOTAL 1,291,116.15 842,156.03 654,204.56
Payable and receivable amounts for the UCI
EUR 31 December 2019 31 December 2020 31 December 2021
Class Subscriptions Redemptions Subscriptions Redemptions Subscriptions Redemptions
A (Dis) 705,555.00 2,972,847.81 165,953.88 1,069,779.98 20,030.37 5,379,995.27
B (Cap) 5,206,455.41 38,601,393.61 1,581,681.08 31,233,378.78 1,865,809.66 10,788,209.06
E (Dis) 0.00 0.00 0.00 0.00 0.00 0.00
F (Cap) 11,834,757.35 48,716,934.47 8,751,587.80 19,802,846.53 3,410,036.50 7,148,473.60
I 0.00 0.00 0.00 0.00 0.00 0.00
J (Cap) 0.00 30,249,941.07 0.00 0.00 0.00 0.00
M (Dis) 1,551,017.00 5,302,553.48 1,783,682.48 4,684,032.55 4,093,684.70 3,324,894.59
N (Cap) 3,798,769.11 31,322,872.77 9,985,294.78 25,213,464.75 4,644,209.81 17,662,792.70
P (Cap) 2,240,733.08 41,715,749.91 254,525.48 14,025,214.28 0.00 152,686.66
TOTAL 25,337,286.95 198,882,293.12 22,522,725.50 96,028,716.87 14,033,771.04 44,457,051.88
net asset value
EUR 31 December 2019 31 December 2020 31 December 2021
Class of the subfund Per share of the subfund Per share of the subfund Per share
A (Dis)
B (Cap)
E (Dis)
F (Cap)
I
J (Cap)
M (Dis)
N (Cap)
P (Cap)
220,412,968.72
121.21
128.41
0.00
521.18
0.00
0.00
121.39
129.00
17,872.35
136,573,907.09
117.53
127.97
0.00
520.84
0.00
0.00
117.59
128.87
0.00
135,117,423.26
144.10
156.76
0.00
639.83
0.00
0.00
144.35
158.27
0.00
TOTAL 220,412,968.72 136,573,907.09 135,117,423.26
On the date of publication of this report, the net asset value per share is published on the following websites: www.dpamfunds.com and www.beama.be. This information is also available at the counters of the financial services department.

DPAM CAPITAL B
Equities EMU Index
94
4.9. PERFORMANCES
Figures reflect past performance and are not an indicator of future performance. These figures do not include any restructuring. Returns are determined at the end of the financial year. The annual return is defined as the absolute return earned over a year. For the semi-annual report, the accounting year is 12-month period preceding the end of the half-year. From 2011, the calculation of the performance of the capitalization units is calculated similarly to the distribution units. This change is also applied to past performance. This change of method does not bring any significant difference compared to the method used previously. Bar chart showing annual returns of the last 10 years (in % and calculated in EUR) as of 31 December 2021: Class A (Dis) Table showing historical performance (actuarial returns):
Average cumulated returns Since
1 year 3 year 5 year 10 year
Year Value
Class A (Dis) 22.61 % (in EUR)
15.62 % (in EUR)
8.58 % (in EUR)
09/11/2016 9.78 % (in EUR)
Class B (Cap) Annual return:
It is a passively managed sub-fund, which means that the portfolio manager aims to replicate the performance of a benchmark.
18
.9% 22
.9%
4.3
%
9.6
%
4.4
%
12
.3%
-12
.8%
26
.6%
-0.3
%
22
.5%
19
.3% 23
.3%
4.3
%
9.8
%
4.4
%
12
.5%
-12
.7%
25
.5%
-1.0
%
22
.2%
-15.00%
-10.00%
-5.00%
0.00%
5.00%
10.00%
15.00%
20.00%
25.00%
30.00%
2012 2013 2014 2015 2016 2017 2018 2019 2020 2021
Class B (Cap) MSCI EMU Net Return
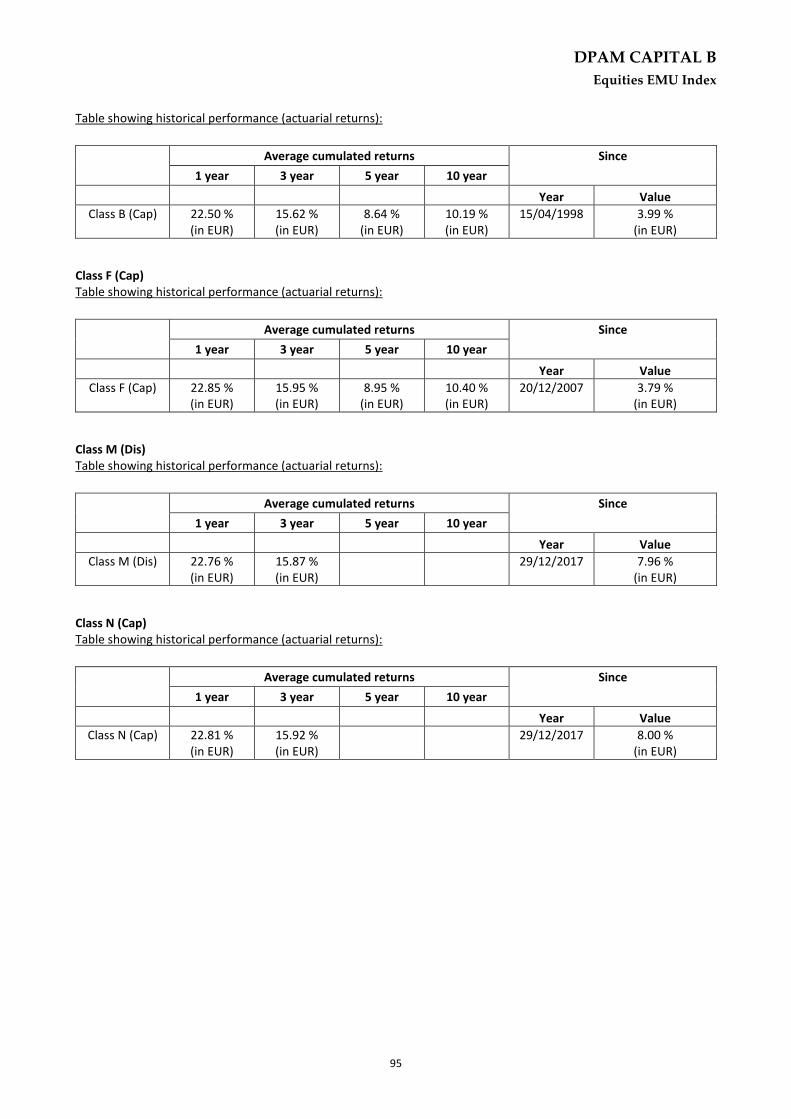
DPAM CAPITAL B
Equities EMU Index
95
Table showing historical performance (actuarial returns):
Average cumulated returns Since
1 year 3 year 5 year 10 year
Year Value
Class B (Cap) 22.50 % (in EUR)
15.62 % (in EUR)
8.64 % (in EUR)
10.19 % (in EUR)
15/04/1998 3.99 % (in EUR)
Class F (Cap) Table showing historical performance (actuarial returns):
Average cumulated returns Since
1 year 3 year 5 year 10 year
Year Value
Class F (Cap) 22.85 % (in EUR)
15.95 % (in EUR)
8.95 % (in EUR)
10.40 % (in EUR)
20/12/2007 3.79 % (in EUR)
Class M (Dis) Table showing historical performance (actuarial returns):
Average cumulated returns Since
1 year 3 year 5 year 10 year
Year Value
Class M (Dis) 22.76 % (in EUR)
15.87 % (in EUR)
29/12/2017 7.96 % (in EUR)
Class N (Cap) Table showing historical performance (actuarial returns):
Average cumulated returns Since
1 year 3 year 5 year 10 year
Year Value
Class N (Cap) 22.81 % (in EUR)
15.92 % (in EUR)
29/12/2017 8.00 % (in EUR)

DPAM CAPITAL B
Equities EMU Index
96
4.10. CHARGES Equities EMU Index
Ongoing charges
The ongoing charges, calculated in accordance with the provisions of European Commission Regulation 583/2010 of 1 July 2010. These charges include transaction fees incurred by the sub-fund when it subscribes to and/or sells units of another fund, but do not include either (i) the fees incurred by the sub-fund when it makes investments other than subscriptions/sales of units of funds or, where applicable, (ii) the performance fee These charges are based on the fees charged in fund accounting for one year prior to the end of the period under review. In the event of a change in the cost structure during the financial year or if the share class is issued during the financial year, the amount of the reported current expenses is calculated on the basis of an estimate based on the expected total amount of the annual expenses (which could be determined by comparison with a similar class).
Taking into account the change in the cost structure during the year, the estimated fees are :
- Class A (Dis) - BE6289162701: 0.63 - Class B (Cap) - BE6278392673: 0.66 - Class F (Cap) - BE0947573771: 0.37 - Class M (Dis) - BE6299528578: 0.45 - Class N (Cap) - BE6299529584: 0.40 Fee sharing On 31 December 2021, 11.01% of the remuneration due to the manager was retroceded to other distributors, third parties and Bank Degroof Petercam or one of its subsidiaries.
4.11. NOTES TO THE FINANCIAL STATEMENTS AND OTHER INFORMATION
4.11.1. Gross dividends paid in the financial year
2016/2017 2.53 EUR 2018 class A 3.55 EUR class M 3.90 EUR 2019 class A 2.40 EUR class M 2.73 EUR
4.11.2. Transparency in sustainability
Mandatory reporting in accordance with Article 7 of Regulation (EU) 2020/852 of 18 June 2020 on the establishment of a framework to promote sustainable investment and amending Regulation (EU) 2019/2088 The underlying investments in this sub-fund do not take into account the European Union's criteria for environmentally sustainable economic activities.
4.11.3. Transparency of the securities financing transactions and of reuse
In accordance with Article 13 and Section A of the Annex to Regulation EU 2015/2365 (hereinafter the Regulation), the Sicav must inform investors of its use of securities financing transactions and total return swaps in the annual report and the half-yearly report.
The portfolio does not contain any loaned assets at the date of this report. Equities EMU Index

DPAM CAPITAL B
Equities Europe Index
97
5. INFORMATION ABOUT THE SUBFUND DPAM CAPITAL B EQUITIES EUROPE INDEX
Equities Europe Index
5.1. MANAGEMENT REPORT
5.1.1. Launch date of the sub-fund and subscription price of the shares
Initial subscription day:December 15, 1992 Initial subscription price: EUR 2 478.93 Class B shares were divided by 10 on January 14, 1997, by 5 on March 31, 2005, and by 3 on July 30, 2015.
5.1.2. Stock exchange listing
The shares of the sub-fund are not listed on an exchange.
5.1.3. Aim and main outlines of the investment policy
The objective of the sub-fund is to provide shareholders with as high a global return as possible, with an accent on investments in European equities. This is a passively managed sub-fund, which means that the portfolio manager aims to replicate the performance of a benchmark.
5.1.4. Financial management of the portfolio
Degroof Petercam Asset Management S.A. Rue Guimard, 18, 1040 Brussels
5.1.5. Distributor
Degroof Petercam Asset Management S.A. Rue Guimard, 18, 1040 Brussels
5.1.6. Index and benchmark
The sub-fund uses the following index as a benchmark: MSCI Europe Net Return. This benchmark is used in managing the sub-fund. MSCI Europe Net Return covers approximately 85% of the floating market capitalisation of the countries in EUROPE zone. Additional information on this index and its composition can be found at www.msci.com. The performance of the benchmark index is calculated by reinvesting net dividends (Net Return). The tracking error is of the order of 1.3%. This is a passively managed sub-fund, which means that the portfolio manager's objective is to replicate the performance of a benchmark.
5.1.7. Policy followed during the year
The “Net Asset Value” of the fund (B share) on December 31, 2021 was 138.88 EUR and its performance between December 31, 2020 and December 31, 2021 is 24.93% (in EUR). The benchmark of the Equities Europe Index sub-fund is the MSCI Europe Net DTR index. The MSCI Europe Net DTR index, dividends net of local withholding tax reinvested, covers European countries and is established by MSCI. All the countries of Europe are included in this index, except Luxembourg given its low market capitalization. Greece was classified as an emerging country by the MSCI index at the end of 2013.

DPAM CAPITAL B
Equities Europe Index
98
As of December 31, 2021, the index had 432 positions. The index value can be viewed on MSCI's website, www.msci.com/end-of-day-data-search. The composition of its indices can be viewed on the MSCI’s website, www.msci.com/constituents. The objective of the fund is to physically and fully replicate the composition of the underlying index (MSCI EUROPE). As in the past, full investment continued in this compartment. The level of liquidity, after deduction of futures contracts on stock market indices, was kept at a very low level. The use of futures on the Dow Jones Stoxx 50 index supplemented positions in equities and allowed to be fully invested through liquid instrument without disrupting the portfolio structure during daily subscriptions and redemptions.
5.1.8. Future policy
As in the past, the Equities Europe Index sub-fund will pursue an investment policy based on geographic and sector indexation. The benchmark remains the European index published by MSCI.
5.1.9. Synthetic risk and reward indicator
The synthetic risk and return indicator gives an indication of the risk associated with investing in a sub-fund. It places this risk on a scale ranging from one (lowest risk) to seven (highest risk). Risk and reward profile: 6

DPAM CAPITAL B
Equities Europe Index
99
5.2. BALANCE SHEET
31 December 2021
EUR 31 December 2020
EUR
Section 1: Balance Sheet
TOTAL NET ASSETS 300,050,469.35 284,340,723.04
I. Fixed assets
A. Incorporation and organisation expenses B. Intangible assets C. Tangible assets
II. Transferable securities, money market instruments, UCIs and Financial derivatives
298,817,264.98 283,994,820.42
A. Bonds and other debt securities B. Money market instruments C. Shares and other securities similar to shares 298,817,264.98 283,994,820.42 a. Shares 298,817,264.98 283,994,820.42 D. Other transferable securities E. UCI with variable number of shares F. financial derivatives
III. Receivables and payables on more than one year
A. Receivables B. Payables
IV. Receivables and payables up to a year -139,660.58 -106,881.14
A. Receivables 194,692.77 234,665.37 a. Receivables 4,282.50 d. Others 190,410.27 234,665.37 B. Payables -334,353.35 -341,546.51 a. Payable amounts (-) -346.73 c. Borrowing (-) -508.77 -290.31 e. Others (-) -333,844.58 -340,909.47
V. Deposits and liquidity 1,372,864.95 452,783.76
A. Demand bank deposits 1,372,864.95 452,783.76 B. Term bank deposits C. Others
VI. Deferred charges and accrued income
A. Expenses carried forward B. Accrued income C. Accrued expenses (-) D. Income carried forward (-)
TOTAL SHAREHOLDERS’ EQUITY 300,050,469.35 284,340,723.04
A. Capital 132,374,464.75 181,842,445.57 B. Income equalisation -717,174.01 6,079,700.98 C. Retained earnings 102,498,277.47 132,638,372.07 D. Result of the financial year 65,894,901.14 -36,219,795.58
Equities Europe Index

DPAM CAPITAL B
Equities Europe Index
100
31 December 2021
EUR 31 December 2020
EUR
Section 2: Off-balance sheet
OFF-BALANCE-SHEET 956,097.50
I. Collateral (+/-)
A. Collateral (+/-) B. Other collateral
II. Underlying securities of the option contracts and warrants (+)
A. Option contracts and warrants bought B. Option contracts and warrants sold
III. Notional amount of futures contracts (+) 956,097.50
A. Futures contracts bought and Forward contracts 956,097.50 B. Futures contracts sold and Forward Contracts
IV. Notional amount of the swap contracts (+)
A. Purchased swap contracts B. Sold swap contracts
V. Notional amount of other financial derivatives (+)
A. Purchased contracts B. Sold contracts
VI. Uncalled amounts on shares
VII. Commitments to resell on account of purchase-repurchase agreements
VIII. Commitments to repurchase on account of purchase-repurchase agreements
IX. Lent financial instruments
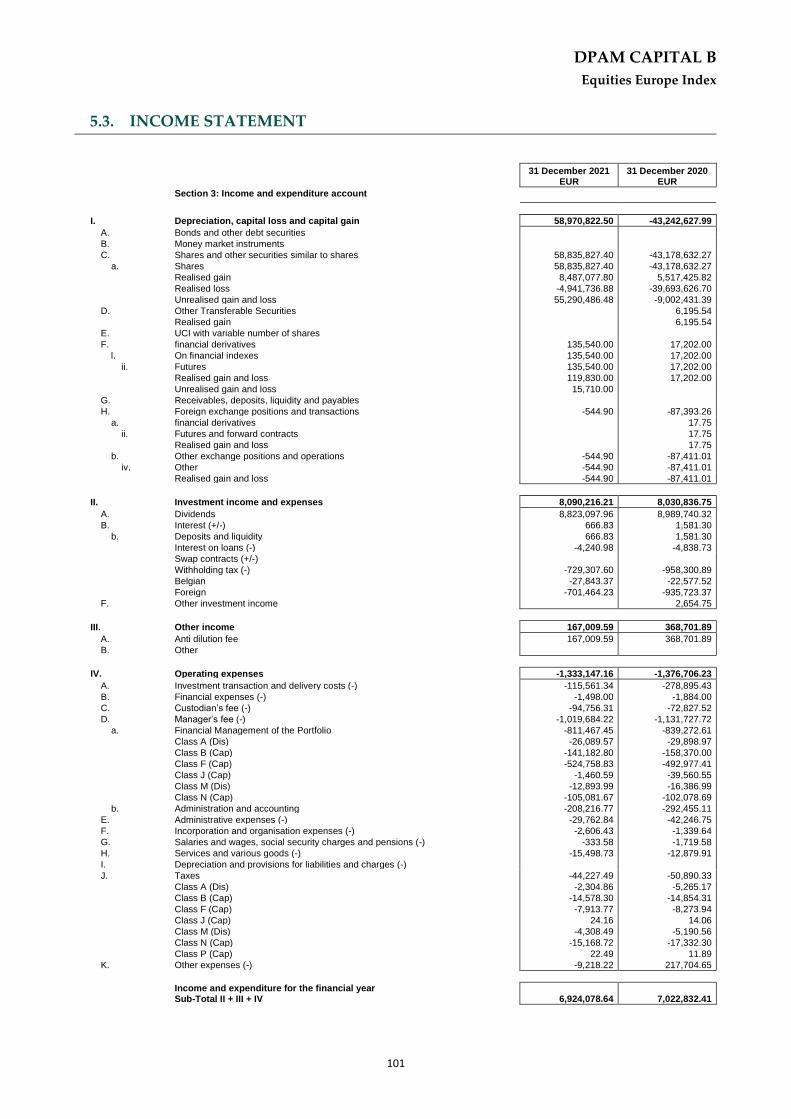
DPAM CAPITAL B
Equities Europe Index
101
5.3. INCOME STATEMENT
31 December 2021
EUR 31 December 2020
EUR
Section 3: Income and expenditure account
I. Depreciation, capital loss and capital gain 58,970,822.50 -43,242,627.99
A. Bonds and other debt securities
B. Money market instruments
C. Shares and other securities similar to shares 58,835,827.40 -43,178,632.27
a. Shares 58,835,827.40 -43,178,632.27
Realised gain 8,487,077.80 5,517,425.82
Realised loss -4,941,736.88 -39,693,626.70
Unrealised gain and loss 55,290,486.48 -9,002,431.39
D. Other Transferable Securities 6,195.54
Realised gain 6,195.54
E. UCI with variable number of shares
F. financial derivatives 135,540.00 17,202.00
l. On financial indexes 135,540.00 17,202.00
ii. Futures 135,540.00 17,202.00
Realised gain and loss 119,830.00 17,202.00
Unrealised gain and loss 15,710.00
G. Receivables, deposits, liquidity and payables
H. Foreign exchange positions and transactions -544.90 -87,393.26
a. financial derivatives 17.75
ii. Futures and forward contracts 17.75
Realised gain and loss 17.75
b. Other exchange positions and operations -544.90 -87,411.01
iv. Other -544.90 -87,411.01
Realised gain and loss -544.90 -87,411.01
II. Investment income and expenses 8,090,216.21 8,030,836.75
A. Dividends 8,823,097.96 8,989,740.32
B. Interest (+/-) 666.83 1,581.30
b. Deposits and liquidity 666.83 1,581.30
Interest on loans (-) -4,240.98 -4,838.73
Swap contracts (+/-)
Withholding tax (-) -729,307.60 -958,300.89
Belgian -27,843.37 -22,577.52
Foreign -701,464.23 -935,723.37
F. Other investment income 2,654.75
III. Other income 167,009.59 368,701.89
A. Anti dilution fee 167,009.59 368,701.89
B. Other
IV. Operating expenses -1,333,147.16 -1,376,706.23
A. Investment transaction and delivery costs (-) -115,561.34 -278,895.43
B. Financial expenses (-) -1,498.00 -1,884.00
C. Custodian’s fee (-) -94,756.31 -72,827.52
D. Manager’s fee (-) -1,019,684.22 -1,131,727.72
a. Financial Management of the Portfolio -811,467.45 -839,272.61
Class A (Dis) -26,089.57 -29,898.97
Class B (Cap) -141,182.80 -158,370.00
Class F (Cap) -524,758.83 -492,977.41
Class J (Cap) -1,460.59 -39,560.55
Class M (Dis) -12,893.99 -16,386.99
Class N (Cap) -105,081.67 -102,078.69
b. Administration and accounting -208,216.77 -292,455.11
E. Administrative expenses (-) -29,762.84 -42,246.75
F. Incorporation and organisation expenses (-) -2,606.43 -1,339.64
G. Salaries and wages, social security charges and pensions (-) -333.58 -1,719.58
H. Services and various goods (-) -15,498.73 -12,879.91
I. Depreciation and provisions for liabilities and charges (-)
J. Taxes -44,227.49 -50,890.33
Class A (Dis) -2,304.86 -5,265.17
Class B (Cap) -14,578.30 -14,854.31
Class F (Cap) -7,913.77 -8,273.94
Class J (Cap) 24.16 14.06
Class M (Dis) -4,308.49 -5,190.56
Class N (Cap) -15,168.72 -17,332.30
Class P (Cap) 22.49 11.89
K. Other expenses (-) -9,218.22 217,704.65
Income and expenditure for the financial year Sub-Total II + III + IV 6,924,078.64 7,022,832.41

DPAM CAPITAL B
Equities Europe Index
102
31 December 2021
EUR 31 December 2020
EUR
V. Current profit (loss) before income tax 65,894,901.14 -36,219,795.58
VI. Income tax
VII. Result of the financial year 65,894,901.14 -36,219,795.58

DPAM CAPITAL B
Equities Europe Index
103
31 December 2021
EUR 31 December 2020
EUR
Section 4: Allocation of the result
I. Profit (Loss) to be allocated 167,676,004.60 102,498,277.47
a. Profit carried forward (Loss carried forward) from the previous period 102,498,277.47 132,638,372.07
b. Profit (loss) of the financial year 65,894,901.14 -36,219,795.58
c. Income equalisation received (Income equalisation paid out) -717,174.01 6,079,700.98
II. (Appropriation to) Deduction from the capital
III. (Profit to be carried forward) Loss to be carried forward -167,489,686.47 -102,498,277.47
IV. Dividend distribution -186,318.13

DPAM CAPITAL B
Equities Europe Index
104
5.4. COMPOSITION OF THE ASSETS
Equities Europe Index
Description Quantity at
31 December 2021 Currency
Price in currency
Evaluation EUR % by the
UCI %
portfolio % net assets
Transferable securities admitted to an official stock exchange listing
Shares
Austria
ERSTE GROUP BANK 10,700 EUR 41.35 442,445.00 0.15% 0.15% OMV 4,917 EUR 49.95 245,604.15 0.08% 0.08% RAIFFEISEN BK INTER 2,882 EUR 25.88 74,586.16 0.02% 0.02% VERBUND AG 2,000 EUR 98.90 197,800.00 0.07% 0.07% VOESTALPINE 4,500 EUR 32.00 144,000.00 0.05% 0.05%
1,104,435.31 0.37% 0.37%
Belgium
AGEAS SA NV 5,385 EUR 45.55 245,286.75 0.08% 0.08% ANHEUSER-BUSCH INBEV 24,100 EUR 53.17 1,281,397.00 0.43% 0.43% COLRUYT 1,785 EUR 37.26 66,509.10 0.02% 0.02% ELIA GROUP 900 EUR 115.70 104,130.00 0.03% 0.03% GBL 3,150 EUR 98.16 309,204.00 0.10% 0.10% KBC 7,742 EUR 75.46 584,211.32 0.20% 0.19% PROXIMUS SA 3,000 EUR 17.14 51,420.00 0.02% 0.02% SOFINA 500 EUR 432.00 216,000.00 0.07% 0.07% SOLVAY 2,500 EUR 102.20 255,500.00 0.09% 0.09% UCB 3,800 EUR 100.35 381,330.00 0.13% 0.13% UMICORE S.A. 6,086 EUR 35.75 217,574.50 0.07% 0.07%
3,712,562.67 1.24% 1.24%
Switzerland
ABB-NOM-NEW 50,616 CHF 34.90 1,704,867.44 0.57% 0.57% ADECCO-NOM-NEW- 4,858 CHF 46.60 218,484.58 0.07% 0.07% ALCON SA 14,580 CHF 80.74 1,136,118.52 0.38% 0.38% BACHEM HLDG-B- 150 CHF 716.00 103,652.95 0.03% 0.03% BALOISE HOLDING 1,418 CHF 149.10 204,047.48 0.07% 0.07% BARRY CALLEBAUT-NOM- 110 CHF 2,216.00 235,255.51 0.08% 0.08% CLARIANT-NOM-NEW 4,800 CHF 19.00 88,018.14 0.03% 0.03% COCA-COLA HBC 13,000 GBP 25.55 395,605.05 0.13% 0.13% CREDIT SUISSE NEW 73,000 CHF 8.87 625,060.08 0.21% 0.21% EMS-CHEM HLDG N 200 CHF 1,021.00 197,075.71 0.07% 0.07% FINANCIERE RICHEMONT 15,500 CHF 136.95 2,048,665.73 0.69% 0.68% GEBERIT 1,050 CHF 745.20 755,160.93 0.25% 0.25% GIVAUDAN 285 CHF 4,792.00 1,318,071.71 0.44% 0.44% HOLCIM LTD 14,401 CHF 46.51 646,422.34 0.22% 0.22% JULIUS BAER GRP N 6,786 CHF 61.18 400,682.80 0.13% 0.13% KUEHNE NAGEL 1,500 CHF 294.40 426,193.12 0.14% 0.14% LINDT NOM 4 CHF 122,200.00 471,746.37 0.16% 0.16% LINDT SPRUENGLI 38 CHF 12,630.00 463,195.48 0.16% 0.15% LOGITECH N 5,100 CHF 76.88 378,408.53 0.13% 0.13% LONZA-NOM- NEW 2,200 CHF 761.60 1,617,063.17 0.54% 0.54% NESTLE NOM 87,000 CHF 127.44 10,700,458.43 3.58% 3.57% NOVARTIS-NOM- 64,900 CHF 80.28 5,028,395.50 1.68% 1.68% PARTNERS GRP HLDG 700 CHF 1,512.50 1,021,811.51 0.34% 0.34% ROCHE HOLDING -GE- 21,070 CHF 379.10 7,708,958.16 2.58% 2.57% ROCHE-PTR- 950 CHF 408.80 374,810.60 0.13% 0.12% SCHINDLER HDG AG-REG 600 CHF 244.40 141,523.91 0.05% 0.05% SCHINDLER HD-PART CT 1,370 CHF 245.50 324,600.69 0.11% 0.11% SGS S.A. 180 CHF 3,047.00 529,324.90 0.18% 0.18% SIKA AG 4,200 CHF 380.20 1,541,128.22 0.52% 0.51% SONOVA HOLDING 1,649 CHF 357.80 569,427.40 0.19% 0.19% STRAUMANN HOLDING 300 CHF 1,937.00 560,826.14 0.19% 0.19% SWATCH GROUP NEW 886 CHF 279.00 238,569.71 0.08% 0.08% SWATCH GROUP-NOM-NEW 1,556 CHF 53.45 80,266.56 0.03% 0.03% SWISSCOM-NOM- 750 CHF 514.60 372,484.68 0.12% 0.12% SWISS LIFE-NOM- 950 CHF 559.00 512,522.32 0.17% 0.17% SWISS PRIME SITE 1,600 CHF 89.65 138,435.55 0.05% 0.05%
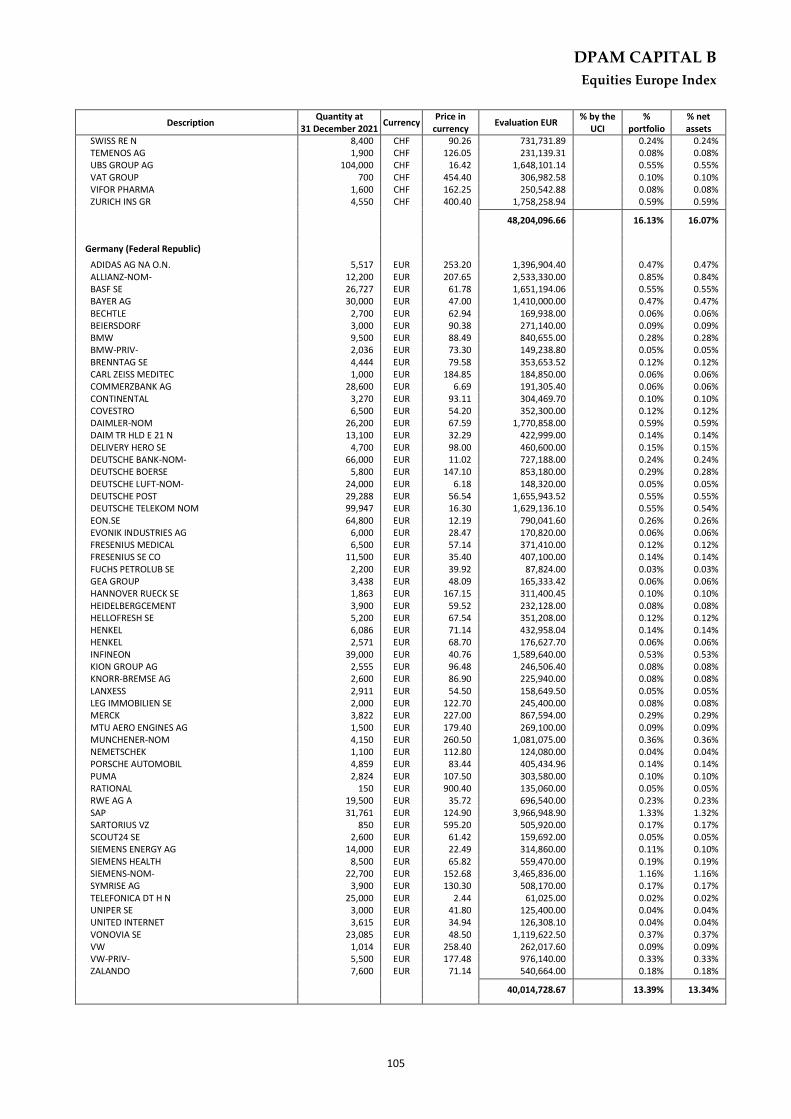
DPAM CAPITAL B
Equities Europe Index
105
Description Quantity at
31 December 2021 Currency
Price in currency
Evaluation EUR % by the
UCI %
portfolio % net assets
SWISS RE N 8,400 CHF 90.26 731,731.89 0.24% 0.24% TEMENOS AG 1,900 CHF 126.05 231,139.31 0.08% 0.08% UBS GROUP AG 104,000 CHF 16.42 1,648,101.14 0.55% 0.55% VAT GROUP 700 CHF 454.40 306,982.58 0.10% 0.10% VIFOR PHARMA 1,600 CHF 162.25 250,542.88 0.08% 0.08% ZURICH INS GR 4,550 CHF 400.40 1,758,258.94 0.59% 0.59%
48,204,096.66 16.13% 16.07%
Germany (Federal Republic)
ADIDAS AG NA O.N. 5,517 EUR 253.20 1,396,904.40 0.47% 0.47% ALLIANZ-NOM- 12,200 EUR 207.65 2,533,330.00 0.85% 0.84% BASF SE 26,727 EUR 61.78 1,651,194.06 0.55% 0.55% BAYER AG 30,000 EUR 47.00 1,410,000.00 0.47% 0.47% BECHTLE 2,700 EUR 62.94 169,938.00 0.06% 0.06% BEIERSDORF 3,000 EUR 90.38 271,140.00 0.09% 0.09% BMW 9,500 EUR 88.49 840,655.00 0.28% 0.28% BMW-PRIV- 2,036 EUR 73.30 149,238.80 0.05% 0.05% BRENNTAG SE 4,444 EUR 79.58 353,653.52 0.12% 0.12% CARL ZEISS MEDITEC 1,000 EUR 184.85 184,850.00 0.06% 0.06% COMMERZBANK AG 28,600 EUR 6.69 191,305.40 0.06% 0.06% CONTINENTAL 3,270 EUR 93.11 304,469.70 0.10% 0.10% COVESTRO 6,500 EUR 54.20 352,300.00 0.12% 0.12% DAIMLER-NOM 26,200 EUR 67.59 1,770,858.00 0.59% 0.59% DAIM TR HLD E 21 N 13,100 EUR 32.29 422,999.00 0.14% 0.14% DELIVERY HERO SE 4,700 EUR 98.00 460,600.00 0.15% 0.15% DEUTSCHE BANK-NOM- 66,000 EUR 11.02 727,188.00 0.24% 0.24% DEUTSCHE BOERSE 5,800 EUR 147.10 853,180.00 0.29% 0.28% DEUTSCHE LUFT-NOM- 24,000 EUR 6.18 148,320.00 0.05% 0.05% DEUTSCHE POST 29,288 EUR 56.54 1,655,943.52 0.55% 0.55% DEUTSCHE TELEKOM NOM 99,947 EUR 16.30 1,629,136.10 0.55% 0.54% EON.SE 64,800 EUR 12.19 790,041.60 0.26% 0.26% EVONIK INDUSTRIES AG 6,000 EUR 28.47 170,820.00 0.06% 0.06% FRESENIUS MEDICAL 6,500 EUR 57.14 371,410.00 0.12% 0.12% FRESENIUS SE CO 11,500 EUR 35.40 407,100.00 0.14% 0.14% FUCHS PETROLUB SE 2,200 EUR 39.92 87,824.00 0.03% 0.03% GEA GROUP 3,438 EUR 48.09 165,333.42 0.06% 0.06% HANNOVER RUECK SE 1,863 EUR 167.15 311,400.45 0.10% 0.10% HEIDELBERGCEMENT 3,900 EUR 59.52 232,128.00 0.08% 0.08% HELLOFRESH SE 5,200 EUR 67.54 351,208.00 0.12% 0.12% HENKEL 6,086 EUR 71.14 432,958.04 0.14% 0.14% HENKEL 2,571 EUR 68.70 176,627.70 0.06% 0.06% INFINEON 39,000 EUR 40.76 1,589,640.00 0.53% 0.53% KION GROUP AG 2,555 EUR 96.48 246,506.40 0.08% 0.08% KNORR-BREMSE AG 2,600 EUR 86.90 225,940.00 0.08% 0.08% LANXESS 2,911 EUR 54.50 158,649.50 0.05% 0.05% LEG IMMOBILIEN SE 2,000 EUR 122.70 245,400.00 0.08% 0.08% MERCK 3,822 EUR 227.00 867,594.00 0.29% 0.29% MTU AERO ENGINES AG 1,500 EUR 179.40 269,100.00 0.09% 0.09% MUNCHENER-NOM 4,150 EUR 260.50 1,081,075.00 0.36% 0.36% NEMETSCHEK 1,100 EUR 112.80 124,080.00 0.04% 0.04% PORSCHE AUTOMOBIL 4,859 EUR 83.44 405,434.96 0.14% 0.14% PUMA 2,824 EUR 107.50 303,580.00 0.10% 0.10% RATIONAL 150 EUR 900.40 135,060.00 0.05% 0.05% RWE AG A 19,500 EUR 35.72 696,540.00 0.23% 0.23% SAP 31,761 EUR 124.90 3,966,948.90 1.33% 1.32% SARTORIUS VZ 850 EUR 595.20 505,920.00 0.17% 0.17% SCOUT24 SE 2,600 EUR 61.42 159,692.00 0.05% 0.05% SIEMENS ENERGY AG 14,000 EUR 22.49 314,860.00 0.11% 0.10% SIEMENS HEALTH 8,500 EUR 65.82 559,470.00 0.19% 0.19% SIEMENS-NOM- 22,700 EUR 152.68 3,465,836.00 1.16% 1.16% SYMRISE AG 3,900 EUR 130.30 508,170.00 0.17% 0.17% TELEFONICA DT H N 25,000 EUR 2.44 61,025.00 0.02% 0.02% UNIPER SE 3,000 EUR 41.80 125,400.00 0.04% 0.04% UNITED INTERNET 3,615 EUR 34.94 126,308.10 0.04% 0.04% VONOVIA SE 23,085 EUR 48.50 1,119,622.50 0.37% 0.37% VW 1,014 EUR 258.40 262,017.60 0.09% 0.09% VW-PRIV- 5,500 EUR 177.48 976,140.00 0.33% 0.33% ZALANDO 7,600 EUR 71.14 540,664.00 0.18% 0.18%
40,014,728.67 13.39% 13.34%

DPAM CAPITAL B
Equities Europe Index
106
Description Quantity at
31 December 2021 Currency
Price in currency
Evaluation EUR % by the
UCI %
portfolio % net assets
Denmark
AMBU AS -B- 5,200 DKK 173.00 120,953.00 0.04% 0.04% AP MOELLER-MAERS -A- 100 DKK 21,780.00 292,836.40 0.10% 0.10% AP MOELLER-MAERS -B- 175 DKK 23,450.00 551,757.29 0.18% 0.18% CARLSBERG-B- 3,796 DKK 1,129.50 576,473.86 0.19% 0.19% CHR. HANSEN HOLDING 3,000 DKK 515.40 207,889.64 0.07% 0.07% COLOPLAST AS B 3,235 DKK 1,151.00 500,629.91 0.17% 0.17% DANSKE BANK 21,093 DKK 112.95 320,325.69 0.11% 0.11% DSV AS 6,300 DKK 1,527.50 1,293,864.96 0.43% 0.43% GENMAB A-S 2,050 DKK 2,630.00 724,897.82 0.24% 0.24% GN STORE N 4,200 DKK 411.30 232,260.41 0.08% 0.08% NOVO NORDISK -B- 50,200 DKK 735.00 4,960,874.48 1.66% 1.65% NOVOZYMES -B- 6,635 DKK 537.20 479,230.13 0.16% 0.16% ORSTED 6,000 DKK 835.20 673,765.73 0.23% 0.22% PANDORA AS 2,800 DKK 815.40 306,969.99 0.10% 0.10% ROCKWOOL INTL 250 DKK 2,860.00 96,133.16 0.03% 0.03% TRYG 10,000 DKK 161.50 217,139.94 0.07% 0.07% VESTAS WIND SYSTEMS 30,200 DKK 200.00 812,089.92 0.27% 0.27% WILLIAM DEMANT HLDG 2,470 DKK 335.10 111,285.50 0.04% 0.04%
12,479,377.83 4.18% 4.16%
Spain
ACS 7,734 EUR 23.57 182,290.38 0.06% 0.06% AENA S.A. 2,000 EUR 138.80 277,600.00 0.09% 0.09% AMADEUS IT GROUP SA 14,000 EUR 59.64 834,960.00 0.28% 0.28% BANCO BILBAO 208,000 EUR 5.25 1,092,000.00 0.37% 0.36% BANCO SANTANDER 510,000 EUR 2.94 1,499,655.00 0.50% 0.50% CAIXABANK S.A 137,347 EUR 2.41 331,555.66 0.11% 0.11% CELLNEX TELECOM 15,500 EUR 51.18 793,290.00 0.27% 0.26% EDP RNOVAVEIS 10,000 EUR 21.90 219,000.00 0.07% 0.07% ENAGAS 8,619 EUR 20.40 175,827.60 0.06% 0.06% ENDESA 8,500 EUR 20.20 171,700.00 0.06% 0.06% FERROVIAL S.A 15,806 EUR 27.56 435,613.36 0.15% 0.15% GRIFOLS SA 10,894 EUR 16.88 183,836.25 0.06% 0.06% IBERDROLA SA 170,000 EUR 10.41 1,769,700.00 0.59% 0.59% INDITEX 32,400 EUR 28.53 924,372.00 0.31% 0.31% NATURGY ENERGY GROUP 5,152 EUR 28.63 147,501.76 0.05% 0.05% RED ELECTRICA CORP 13,000 EUR 19.02 247,325.00 0.08% 0.08% REPSOL 40,000 EUR 10.44 417,440.00 0.14% 0.14% SIEMENS GAMESA 6,600 EUR 21.07 139,062.00 0.05% 0.05% TELEFONICA 165,384 EUR 3.85 637,059.17 0.21% 0.21%
10,479,788.18 3.51% 3.49%
Finland
ELISA -A- 4,245 EUR 54.12 229,739.40 0.08% 0.08% FORTUM CORP 15,000 EUR 26.99 404,850.00 0.14% 0.13% KESKO CORP 9,000 EUR 29.34 264,060.00 0.09% 0.09% KONE B 10,500 EUR 63.04 661,920.00 0.22% 0.22% NESTE CORPORATION 13,400 EUR 43.36 581,024.00 0.19% 0.19% NOKIA-A-NEW 153,000 EUR 5.57 852,822.00 0.29% 0.28% NORDEA BANK ABP 100,000 SEK 110.50 1,073,232.32 0.36% 0.36% ORION -B- NEW 3,444 EUR 36.52 125,774.88 0.04% 0.04% SAMPO OYJ 15,727 EUR 44.06 692,931.62 0.23% 0.23% STORA ENSO-R- 16,000 EUR 16.14 258,240.00 0.09% 0.09% UPM-KYMMENE 15,507 EUR 33.46 518,864.22 0.17% 0.17% WARTSILA -B- 11,989 EUR 12.36 148,184.04 0.05% 0.05%
5,811,642.48 1.94% 1.94%
France
ACCOR 6,000 EUR 28.45 170,700.00 0.06% 0.06% ADP 1,190 EUR 113.30 134,827.00 0.05% 0.04% AIR LIQUIDE 14,273 EUR 153.32 2,188,336.36 0.73% 0.73% ALSTOM 9,000 EUR 31.22 280,980.00 0.09% 0.09% AMUNDI 1,300 EUR 72.55 94,315.00 0.03% 0.03% ARKEMA 2,112 EUR 123.85 261,571.20 0.09% 0.09% AXA 56,800 EUR 26.18 1,487,308.00 0.50% 0.50% BIOMERIEUX S.A. 1,400 EUR 124.90 174,860.00 0.06% 0.06%

DPAM CAPITAL B
Equities Europe Index
107
Description Quantity at
31 December 2021 Currency
Price in currency
Evaluation EUR % by the
UCI %
portfolio % net assets
BNP 33,000 EUR 60.77 2,005,410.00 0.67% 0.67% BOLLORE 23,172 EUR 4.92 114,006.24 0.04% 0.04% BOUYGUES 7,270 EUR 31.49 228,932.30 0.08% 0.08% BUREAU VERITAS SA 8,717 EUR 29.18 254,362.06 0.09% 0.08% CAPGEMINI 4,582 EUR 215.50 987,421.00 0.33% 0.33% CARREFOUR SA 17,000 EUR 16.11 273,785.00 0.09% 0.09% CNP ASSURANCES 5,354 EUR 21.75 116,449.50 0.04% 0.04% COINTREAU 926 EUR 214.00 198,164.00 0.07% 0.07% COVIVIO 1,558 EUR 72.20 112,487.60 0.04% 0.04% CREDIT AGRICOLE 37,696 EUR 12.55 473,084.80 0.16% 0.16% DANONE 21,038 EUR 54.59 1,148,464.42 0.38% 0.38% DASSAULT AVIA 710 EUR 95.00 67,450.00 0.02% 0.02% DASSAULT SYSTEMES SE 20,015 EUR 52.31 1,046,984.65 0.35% 0.35% EDENRED SA 7,322 EUR 40.57 297,053.54 0.10% 0.10% EDF 10,000 EUR 10.33 103,300.00 0.03% 0.03% EIFFAGE 2,500 EUR 90.46 226,150.00 0.08% 0.08% ENGIE 55,687 EUR 13.01 724,710.62 0.24% 0.24% ESSILOR LUX 8,300 EUR 187.24 1,554,092.00 0.52% 0.52% EURAZEO SE 600 EUR 76.80 46,080.00 0.02% 0.02% FAURECIA 2,959 EUR 41.83 123,774.97 0.04% 0.04% FDJ 2,800 EUR 38.94 109,032.00 0.04% 0.04% GECINA 1,400 EUR 122.90 172,060.00 0.06% 0.06% GETLINK 15,100 EUR 14.56 219,856.00 0.07% 0.07% HERMES 960 EUR 1,536.00 1,474,560.00 0.49% 0.49% IPSEN 1,300 EUR 80.50 104,650.00 0.04% 0.03% KERING 2,250 EUR 706.90 1,590,525.00 0.53% 0.53% KLEPIERRE 8,000 EUR 20.85 166,800.00 0.06% 0.06% LEGRAND-PROV.OPO 8,300 EUR 102.90 854,070.00 0.29% 0.28% L OREAL 7,400 EUR 416.95 3,085,430.00 1.03% 1.03% LVMH MOET HENNESSY 8,300 EUR 727.00 6,034,100.00 2.02% 2.01% MICHELIN-B- 5,000 EUR 144.15 720,750.00 0.24% 0.24% ORANGE SA 60,000 EUR 9.41 564,780.00 0.19% 0.19% ORPEA 1,800 EUR 88.10 158,580.00 0.05% 0.05% PERNOD-RICARD 6,741 EUR 211.50 1,425,721.50 0.48% 0.48% PUBLICIS NEW 6,000 EUR 59.20 355,200.00 0.12% 0.12% RENAULT 6,473 EUR 30.55 197,717.79 0.07% 0.07% SAFRAN 10,200 EUR 107.66 1,098,132.00 0.37% 0.37% SAINT-GOBAIN 14,632 EUR 61.87 905,281.84 0.30% 0.30% SANOFI 33,700 EUR 88.58 2,985,146.00 1.00% 0.99% SARTORIUS STEDIM 750 EUR 482.40 361,800.00 0.12% 0.12% SCHNEIDER ELECTRIC 16,200 EUR 172.46 2,793,852.00 0.93% 0.93% SEB SA 880 EUR 136.90 120,472.00 0.04% 0.04% SOCGEN-A- 23,000 EUR 30.20 694,715.00 0.23% 0.23% SODEXO 2,784 EUR 77.06 214,535.04 0.07% 0.07% SUEZ SA 12,346 EUR 19.81 244,574.26 0.08% 0.08% TELEPERFORMANCE 1,700 EUR 392.00 666,400.00 0.22% 0.22% THALES 2,984 EUR 74.80 223,203.20 0.07% 0.07% TOTALENERGIES SE 73,800 EUR 44.63 3,293,694.00 1.10% 1.10% UBISOFT 3,000 EUR 43.07 129,210.00 0.04% 0.04% UNIBAIL RODAMCO WEST 3,700 EUR 61.62 227,994.00 0.08% 0.08% VALEO SA 6,800 EUR 26.58 180,744.00 0.06% 0.06% VEOLIA ENVIRON. 18,802 EUR 32.26 606,552.52 0.20% 0.20% VINCI SA 16,100 EUR 92.91 1,495,851.00 0.50% 0.50% VIVENDI 23,300 EUR 11.89 277,037.00 0.09% 0.09% WENDEL 1,027 EUR 105.40 108,245.80 0.04% 0.04% WORLDLINE SA 7,384 EUR 49.01 361,889.84 0.12% 0.12%
49,118,222.05 16.44% 16.37%
United Kingdom
3I GROUP 29,346 GBP 14.49 506,459.67 0.17% 0.17% ABRDN PLC 65,800 GBP 2.41 188,794.90 0.06% 0.06% ADMIRAL GROUP 6,453 GBP 31.57 242,640.79 0.08% 0.08% ANGLO AMERICAN 40,000 GBP 30.16 1,436,874.70 0.48% 0.48% ANTOFAGASTA 11,581 GBP 13.38 184,625.64 0.06% 0.06% ASHTEAD GROUP 14,000 GBP 59.42 990,805.15 0.33% 0.33% ASTRAZENECA 47,000 GBP 86.78 4,857,860.89 1.63% 1.62% AUTO TRADER GRP 25,000 GBP 7.40 220,343.02 0.07% 0.07% AVEVA GROUP PLC 4,444 GBP 34.04 180,173.61 0.06% 0.06% AVIVA 121,924 GBP 4.10 595,969.63 0.20% 0.20% BAE SYSTEMS 93,000 GBP 5.50 608,997.14 0.20% 0.20%

DPAM CAPITAL B
Equities Europe Index
108
Description Quantity at
31 December 2021 Currency
Price in currency
Evaluation EUR % by the
UCI %
portfolio % net assets
BARCLAYS NEW 490,000 GBP 1.87 1,091,353.03 0.37% 0.36% BARRATT DEVELOPMENT 29,100 GBP 7.48 259,252.02 0.09% 0.09% BERKELEY GRP 4,340 GBP 47.75 246,825.87 0.08% 0.08% BHP GROUP PLC 63,000 GBP 22.00 1,650,410.91 0.55% 0.55% BP PLC 597,000 GBP 3.31 2,350,029.78 0.79% 0.78% BRITISH FOODS 17,000 GBP 20.08 406,574.56 0.14% 0.14% BRITISH LAND 25,318 GBP 5.31 160,122.18 0.05% 0.05% BT GROUP 281,044 GBP 1.70 567,544.19 0.19% 0.19% BUNZL NEW 11,000 GBP 28.85 377,977.61 0.13% 0.13% BURBERRY GROUP 12,346 GBP 18.18 267,256.49 0.09% 0.09% COCA-COLA EUROPACIF 7,500 USD 55.93 368,866.51 0.12% 0.12% COMPASS GROUP 53,000 GBP 16.51 1,042,198.67 0.35% 0.35% CRODA INTERNATIONAL 4,073 GBP 101.20 490,933.30 0.16% 0.16% DIAGEO 78,000 GBP 40.36 3,749,499.76 1.25% 1.25% EVRAZ PLC 20,000 GBP 6.02 143,306.34 0.05% 0.05% GLAXOSMITHKLINE 151,900 GBP 16.07 2,906,652.45 0.97% 0.97% HALMA PLC 11,500 GBP 32.00 438,303.95 0.15% 0.15% HARGREAVES LANSD 12,000 GBP 13.55 193,663.65 0.06% 0.06% HIKMA PHARMA 5,000 GBP 22.19 132,146.26 0.04% 0.04% HSBC HOLDINGS 625,000 GBP 4.49 3,339,760.00 1.12% 1.11% INFORMA PLC 41,396 GBP 5.17 254,706.69 0.09% 0.08% INTERCONT HOTELS 5,464 GBP 47.81 311,140.83 0.10% 0.10% INTERTEK GROUP 4,826 GBP 56.30 323,611.01 0.11% 0.11% JD SPORTS FASHION 80,000 GBP 2.18 207,527.39 0.07% 0.07% JOHNSON MATTHEY 5,853 GBP 20.46 142,630.28 0.05% 0.05% KINGFISHER NEW 68,408 GBP 3.38 275,636.33 0.09% 0.09% LAND SECS REIT 25,207 GBP 7.76 233,095.70 0.08% 0.08% LEGAL 190,000 GBP 2.98 673,237.26 0.23% 0.22% LLOYDS BK GROUP PLC 2,100,000 GBP 0.48 1,195,569.32 0.40% 0.40% LONDON STOCK EXCHANG 10,410 GBP 69.30 859,234.16 0.29% 0.29% MELROSE IND 153,481 GBP 1.60 292,301.24 0.10% 0.10% M-G PLC 75,800 GBP 2.00 180,110.77 0.06% 0.06% MONDI PLC 14,000 GBP 18.26 304,478.32 0.10% 0.10% NATIONAL GRID PLC 110,000 GBP 10.60 1,388,494.52 0.46% 0.46% NATWEST GROUP 190,000 GBP 2.26 510,755.12 0.17% 0.17% NEXT 3,995 GBP 81.50 387,794.78 0.13% 0.13% NMC HEALTH PLC 5,000 GBP 0.00 0.00 0.00% 0.00% OCADO GROUP PLC 14,100 GBP 16.78 281,798.48 0.09% 0.09% PEARSON 21,696 GBP 6.13 158,456.25 0.05% 0.05% PERSIMMON 10,900 GBP 28.56 370,776.56 0.12% 0.12% PHOENIX GRP 17,000 GBP 6.53 132,258.22 0.04% 0.04% PRUDENTIAL 80,000 GBP 12.74 1,214,387.80 0.41% 0.40% RECKITT BENCKISER 21,000 GBP 63.42 1,586,255.36 0.53% 0.53% RELX PLC 56,500 GBP 24.02 1,616,400.67 0.54% 0.54% RENTOKIL INITIAL NEW 61,900 GBP 5.84 430,557.41 0.14% 0.14% RIO TINTO-LONDON- 33,500 GBP 48.92 1,951,905.67 0.65% 0.65% ROLLS-ROYCE HLDGS 274,620 GBP 1.23 401,921.22 0.13% 0.13% ROYAL DUTCH SHELL-A 124,000 EUR 19.31 2,394,440.00 0.80% 0.80% ROYAL DUTCH SHELL-B 110,000 GBP 16.22 2,125,583.61 0.71% 0.71% SAGE GRP 36,526 GBP 8.53 370,915.53 0.12% 0.12% SAINSBURY 67,439 GBP 2.76 221,530.20 0.07% 0.07% SCHRODERS NEW 4,073 GBP 35.60 172,699.86 0.06% 0.06% SEGRO PLC -REIT- 37,000 GBP 14.37 633,045.50 0.21% 0.21% SEVERN TRENT 5,486 GBP 29.47 192,558.86 0.06% 0.06% SMITH NEPHEW 28,577 GBP 12.94 440,261.43 0.15% 0.15% SMITHS GROUP 11,000 GBP 15.79 206,937.83 0.07% 0.07% SPIRAX SARCO ENG 2,300 GBP 160.50 439,673.65 0.15% 0.15% SSE PLC 34,410 GBP 16.49 675,822.89 0.23% 0.23% ST.JAMES PLACE 14,000 GBP 16.84 280,717.01 0.09% 0.09% STANDARD CHARTERED-N 84,151 GBP 4.48 449,420.06 0.15% 0.15% TAYLOR WIMPEY 132,900 GBP 1.75 277,798.36 0.09% 0.09% TESCO PLC 216,526 GBP 2.90 747,628.48 0.25% 0.25% UNILEVER PLC 78,000 GBP 39.45 3,665,424.01 1.23% 1.22% UNITED UTILITIES GRP 23,000 GBP 10.89 298,320.63 0.10% 0.10% VODAFONE GROUP 870,000 GBP 1.12 1,163,246.78 0.39% 0.39% WHITBREAD PLC 6,252 GBP 29.95 223,019.77 0.07% 0.07%
60,860,308.49 20.37% 20.28%
Ireland
CRH 24,000 EUR 46.52 1,116,480.00 0.37% 0.37%

DPAM CAPITAL B
Equities Europe Index
109
Description Quantity at
31 December 2021 Currency
Price in currency
Evaluation EUR % by the
UCI %
portfolio % net assets
DCC 2,500 GBP 60.50 180,145.31 0.06% 0.06% FLUTTER ENTERT 4,853 EUR 139.00 674,567.00 0.23% 0.22% KERRY 5,164 EUR 113.25 584,823.00 0.20% 0.19% KINGSPAN GROUP PLC 4,600 EUR 105.00 483,000.00 0.16% 0.16% SMURFIT KAPPA 7,400 EUR 48.44 358,456.00 0.12% 0.12%
3,397,471.31 1.14% 1.13%
Isle of Man
ENTAIN PLC 19,000 GBP 16.83 380,859.93 0.13% 0.13%
380,859.93 0.13% 0.13%
Italy
AMPLIFON SPA 4,000 EUR 47.45 189,800.00 0.06% 0.06% ATLANTIA SPA 13,000 EUR 17.45 226,915.00 0.08% 0.08% DIASORIN SPA 900 EUR 167.45 150,705.00 0.05% 0.05% ENEL NEW 244,681 EUR 7.05 1,724,022.33 0.58% 0.57% ENI SPA 78,700 EUR 12.22 961,714.00 0.32% 0.32% FINECOBANK SPA 17,000 EUR 15.44 262,395.00 0.09% 0.09% GENERALI 31,570 EUR 18.63 588,149.10 0.20% 0.20% INFRASTRUTTURE WIREL 8,000 EUR 10.68 85,440.00 0.03% 0.03% INTESA SANPAOLO 500,000 EUR 2.27 1,137,000.00 0.38% 0.38% MEDIOBANCA 21,948 EUR 10.11 221,894.28 0.07% 0.07% MONCLER SPA 5,500 EUR 64.02 352,110.00 0.12% 0.12% NEXI SPA 14,000 EUR 13.99 195,860.00 0.07% 0.07% POSTE ITALIANE 18,300 EUR 11.54 211,182.00 0.07% 0.07% PRYSMIAN SPA 8,707 EUR 33.11 288,288.77 0.10% 0.10% RECORDATI IND-NEW 2,500 EUR 56.50 141,250.00 0.05% 0.05% SNAM SPA 60,947 EUR 5.30 323,019.10 0.11% 0.11% TELECOM ITALIA 344,299 EUR 0.43 149,494.63 0.05% 0.05% TERNA 40,000 EUR 7.11 284,560.00 0.10% 0.09% UNICREDIT SPA 59,748 EUR 13.54 809,226.91 0.27% 0.27%
8,303,026.12 2.78% 2.77%
Jersey
EXPERIAN 28,000 GBP 36.32 1,211,243.45 0.41% 0.40% FERGUSON NEWCO PLC 6,964 GBP 131.05 1,086,984.52 0.36% 0.36% GLENCORE PLC 290,000 GBP 3.75 1,295,086.95 0.43% 0.43% WPP PLC 40,000 GBP 11.20 533,349.21 0.18% 0.18%
4,126,664.13 1.38% 1.38%
Luxembourg (Grand Duchy)
ARCELORMITTAL 21,409 EUR 28.14 602,556.31 0.20% 0.20% AROUNDTOWN S.A. 28,000 EUR 5.32 148,960.00 0.05% 0.05% EUROFINS SCIENTIFIC 4,100 EUR 108.80 446,080.00 0.15% 0.15% INPOST S.A. 5,000 EUR 10.60 52,990.00 0.02% 0.02% TENARIS 11,000 EUR 9.21 101,310.00 0.03% 0.03%
1,351,896.31 0.45% 0.45%
Netherlands
ABN AMRO DR 16,000 EUR 12.92 206,656.00 0.07% 0.07% ADYEN N.V. 580 EUR 2,311.50 1,340,670.00 0.45% 0.45% AEGON 50,734 EUR 4.39 222,874.46 0.07% 0.07% AIRBUS 17,336 EUR 112.36 1,947,872.96 0.65% 0.65% AKZO NOBEL NV 5,419 EUR 96.50 522,933.50 0.18% 0.17% ARGEN-X N.V. 1,400 EUR 315.30 441,420.00 0.15% 0.15% ASM INTERNATIONAL 1,450 EUR 388.70 563,615.00 0.19% 0.19% ASML HOLDING NV 12,330 EUR 706.70 8,713,611.00 2.92% 2.90% CNH INDUSTRIAL 30,777 EUR 17.07 525,363.39 0.18% 0.18% DAVIDE CAMP MIL 21,000 EUR 12.86 269,955.00 0.09% 0.09% DSM 5,223 EUR 198.00 1,034,154.00 0.35% 0.34% EURONEXT NV 3,000 EUR 91.25 273,750.00 0.09% 0.09% EXOR RG 3,360 EUR 78.96 265,305.60 0.09% 0.09% FERRARI NV 3,817 EUR 227.50 868,367.50 0.29% 0.29% HEINEKEN 4,000 EUR 81.15 324,600.00 0.11% 0.11% HEINEKEN- 8,900 EUR 98.86 879,854.00 0.29% 0.29%
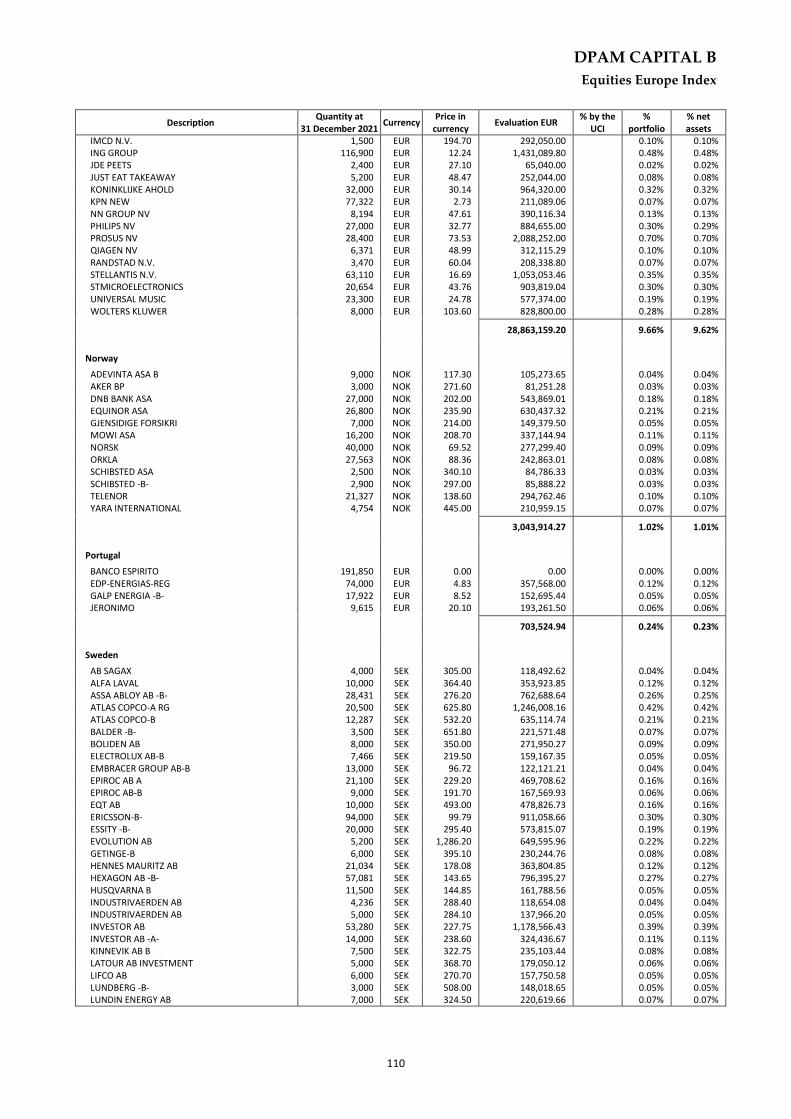
DPAM CAPITAL B
Equities Europe Index
110
Description Quantity at
31 December 2021 Currency
Price in currency
Evaluation EUR % by the
UCI %
portfolio % net assets
IMCD N.V. 1,500 EUR 194.70 292,050.00 0.10% 0.10% ING GROUP 116,900 EUR 12.24 1,431,089.80 0.48% 0.48% JDE PEETS 2,400 EUR 27.10 65,040.00 0.02% 0.02% JUST EAT TAKEAWAY 5,200 EUR 48.47 252,044.00 0.08% 0.08% KONINKLIJKE AHOLD 32,000 EUR 30.14 964,320.00 0.32% 0.32% KPN NEW 77,322 EUR 2.73 211,089.06 0.07% 0.07% NN GROUP NV 8,194 EUR 47.61 390,116.34 0.13% 0.13% PHILIPS NV 27,000 EUR 32.77 884,655.00 0.30% 0.29% PROSUS NV 28,400 EUR 73.53 2,088,252.00 0.70% 0.70% QIAGEN NV 6,371 EUR 48.99 312,115.29 0.10% 0.10% RANDSTAD N.V. 3,470 EUR 60.04 208,338.80 0.07% 0.07% STELLANTIS N.V. 63,110 EUR 16.69 1,053,053.46 0.35% 0.35% STMICROELECTRONICS 20,654 EUR 43.76 903,819.04 0.30% 0.30% UNIVERSAL MUSIC 23,300 EUR 24.78 577,374.00 0.19% 0.19% WOLTERS KLUWER 8,000 EUR 103.60 828,800.00 0.28% 0.28%
28,863,159.20 9.66% 9.62%
Norway
ADEVINTA ASA B 9,000 NOK 117.30 105,273.65 0.04% 0.04% AKER BP 3,000 NOK 271.60 81,251.28 0.03% 0.03% DNB BANK ASA 27,000 NOK 202.00 543,869.01 0.18% 0.18% EQUINOR ASA 26,800 NOK 235.90 630,437.32 0.21% 0.21% GJENSIDIGE FORSIKRI 7,000 NOK 214.00 149,379.50 0.05% 0.05% MOWI ASA 16,200 NOK 208.70 337,144.94 0.11% 0.11% NORSK 40,000 NOK 69.52 277,299.40 0.09% 0.09% ORKLA 27,563 NOK 88.36 242,863.01 0.08% 0.08% SCHIBSTED ASA 2,500 NOK 340.10 84,786.33 0.03% 0.03% SCHIBSTED -B- 2,900 NOK 297.00 85,888.22 0.03% 0.03% TELENOR 21,327 NOK 138.60 294,762.46 0.10% 0.10% YARA INTERNATIONAL 4,754 NOK 445.00 210,959.15 0.07% 0.07%
3,043,914.27 1.02% 1.01%
Portugal
BANCO ESPIRITO 191,850 EUR 0.00 0.00 0.00% 0.00% EDP-ENERGIAS-REG 74,000 EUR 4.83 357,568.00 0.12% 0.12% GALP ENERGIA -B- 17,922 EUR 8.52 152,695.44 0.05% 0.05% JERONIMO 9,615 EUR 20.10 193,261.50 0.06% 0.06%
703,524.94 0.24% 0.23%
Sweden
AB SAGAX 4,000 SEK 305.00 118,492.62 0.04% 0.04% ALFA LAVAL 10,000 SEK 364.40 353,923.85 0.12% 0.12% ASSA ABLOY AB -B- 28,431 SEK 276.20 762,688.64 0.26% 0.25% ATLAS COPCO-A RG 20,500 SEK 625.80 1,246,008.16 0.42% 0.42% ATLAS COPCO-B 12,287 SEK 532.20 635,114.74 0.21% 0.21% BALDER -B- 3,500 SEK 651.80 221,571.48 0.07% 0.07% BOLIDEN AB 8,000 SEK 350.00 271,950.27 0.09% 0.09% ELECTROLUX AB-B 7,466 SEK 219.50 159,167.35 0.05% 0.05% EMBRACER GROUP AB-B 13,000 SEK 96.72 122,121.21 0.04% 0.04% EPIROC AB A 21,100 SEK 229.20 469,708.62 0.16% 0.16% EPIROC AB-B 9,000 SEK 191.70 167,569.93 0.06% 0.06% EQT AB 10,000 SEK 493.00 478,826.73 0.16% 0.16% ERICSSON-B- 94,000 SEK 99.79 911,058.66 0.30% 0.30% ESSITY -B- 20,000 SEK 295.40 573,815.07 0.19% 0.19% EVOLUTION AB 5,200 SEK 1,286.20 649,595.96 0.22% 0.22% GETINGE-B 6,000 SEK 395.10 230,244.76 0.08% 0.08% HENNES MAURITZ AB 21,034 SEK 178.08 363,804.85 0.12% 0.12% HEXAGON AB -B- 57,081 SEK 143.65 796,395.27 0.27% 0.27% HUSQVARNA B 11,500 SEK 144.85 161,788.56 0.05% 0.05% INDUSTRIVAERDEN AB 4,236 SEK 288.40 118,654.08 0.04% 0.04% INDUSTRIVAERDEN AB 5,000 SEK 284.10 137,966.20 0.05% 0.05% INVESTOR AB 53,280 SEK 227.75 1,178,566.43 0.39% 0.39% INVESTOR AB -A- 14,000 SEK 238.60 324,436.67 0.11% 0.11% KINNEVIK AB B 7,500 SEK 322.75 235,103.44 0.08% 0.08% LATOUR AB INVESTMENT 5,000 SEK 368.70 179,050.12 0.06% 0.06% LIFCO AB 6,000 SEK 270.70 157,750.58 0.05% 0.05% LUNDBERG -B- 3,000 SEK 508.00 148,018.65 0.05% 0.05% LUNDIN ENERGY AB 7,000 SEK 324.50 220,619.66 0.07% 0.07%

DPAM CAPITAL B
Equities Europe Index
111
Description Quantity at
31 December 2021 Currency
Price in currency
Evaluation EUR % by the
UCI %
portfolio % net assets
NIBE INDUSTRIER AK B 42,000 SEK 136.75 557,838.00 0.19% 0.19% SANDVIK-AB- 32,000 SEK 252.60 785,081.59 0.26% 0.26% SECURITAS 11,012 SEK 124.65 133,318.36 0.04% 0.04% SINCH AB 15,000 SEK 115.10 167,686.48 0.06% 0.06% SKANDINAVISKA 52,000 SEK 125.85 635,606.06 0.21% 0.21% SKANSKA-B- 10,236 SEK 234.20 232,835.20 0.08% 0.08% SKF-B-ANC 12,179 SEK 214.50 253,729.17 0.08% 0.08% SVENSKA CELLULOSA 20,000 SEK 160.75 312,257.19 0.10% 0.10% SVENSKA HANDELSBK A 40,000 SEK 97.86 380,186.48 0.13% 0.13% SWEDBANK A 27,000 SEK 182.10 477,534.97 0.16% 0.16% TELE2 17,891 SEK 129.10 224,332.57 0.08% 0.07% TELIA COMPANY AB 80,000 SEK 35.41 275,097.13 0.09% 0.09% VOLVO-A- 6,000 SEK 212.60 123,892.77 0.04% 0.04% VOLVO-B 44,601 SEK 209.65 908,177.90 0.30% 0.30%
16,861,586.43 5.64% 5.62%
Total - Shares 298,817,264.98 100.00% 99.59%
Total - Transferable securities admitted to an official stock exchange listing
298,817,264.98 100.00% 99.59%
Total - portfolio 298,817,264.98 100.00% 99.59%
Collatéral 0.00 0.00%
Deposits and liquid assets
deposit and liquid assets
Banque Degroof Petercam SEK 752.83 0.00%
Banque Degroof Petercam CHF 19,954.50 0.01%
Banque Degroof Petercam USD 72,992.46 0.02%
Banque Degroof Petercam DKK 17,225.20 0.01%
Banque Degroof Petercam GBP 49,987.28 0.02%
Banque Degroof Petercam AUD 0.58 0.00%
Banque Degroof Petercam EUR 1,209,422.53 0.40%
Banque Degroof Petercam NOK 2,529.57 0.00%
Total - deposit and liquid assets 1,372,864.95 0.46%
Total - Deposits and liquid assets 1,372,864.95 0.46%
Other receivables and other payables -139,660.58 -0.05%
Others 0.00 0.00%
Total net assets 300,050,469.35 100,00%
Equities Europe Index

DPAM CAPITAL B
Equities Europe Index
112
5.5. GEOGRAPHIC ALLOCATION OF INVESTMENTS
By country % Portfolio
UNITED KINGDOM 20.36%
FRANCE 16.44%
SWITZERLAND 16.13%
GERMANY (FEDERAL REPUBLIC) 13.39%
NETHERLANDS 9.66%
SWEDEN 5.64%
DENMARK 4.18%
SPAIN 3.51%
ITALY 2.78%
FINLAND 1.94%
JERSEY 1.38%
BELGIUM 1.24%
IRELAND 1.14%
NORWAY 1.02%
LUXEMBOURG (GRAND DUCHY) 0.45%
AUSTRIA 0.37%
PORTUGAL 0.24%
ISLE OF MAN 0.13%
Total 100.00%
These allocations of assets were established on basis of data (gross) used by the entity responsible for the administration and bookkeeping and do not reflect inevitably the economic analysis which directed the assets selection.

DPAM CAPITAL B
Equities Europe Index
113
5.6. ECONOMIC ALLOCATION OF INVESTMENTS
By sector % Portfolio
PHARMACOLOGY & PERSONAL CARE 13.62%
BANKS 7.29%
FOOD & CLEANING MATERIALS 6.32%
FINANCIAL SERVICES - HOLDINGS 4.94%
CHEMICAL PRODUCTS 4.91%
OIL & DERIVED 4.86%
INSURANCE COMPANIES 4.81%
ELECTRIC & ELECTRONIC COMPONANTS 4.38%
ENERGY SOURCES 3.89%
TELECOMMUNICATIONS 3.80%
BUILDING MATERIALS 3.73%
IT & INTERNET 3.68%
TEXTILE & GARMENTS 3.47%
TOBACCO & SPIRITS 2.91%
MECHANICAL CONSTRUCTION 2.68%
ELECTRIC & ELECTRONIC MATERIALS 2.58%
ROAD VEHICLES 2.42%
RETAIL TRADING, DEPARTMENT STORES 1.94%
PUBLISHING & BROADCASTING 1.92%
ROAD & RAILWAY TRANSPORTS 1.80%
AEROSPACE INDUSTRY & DEFENCE 1.33%
REAL ESTATE 1.29%
MISCELLANEOUS CONSUMER GOODS 1.28%
NONFERROUS METALS 1.27%
CAPITAL GOODS (MISCELLANEOUS) 1.16%
LEISURES & TOURISM 1.03%
INTERMEDIATE INDUSTRY PRODUCTS 1.01%
JEWELLERY & WATCHMAKING 0.79%
OTHER SERVICES 0.65%
HEALTH CARE & SERVICES 0.64%
BIOTECHNOLOGY 0.56%
MISCELLANEOUS 0.50%
FOREST PRODUCTS & PAPER INDUSTRY 0.49%
INFORMATION, TECHNOLOGY & COPIERS 0.39%
CONSUMER GOODS 0.39%
TYRES & RUBBER 0.34%
COMMERCIAL & PUBLIC SERVICES 0.26%
AGRICULTURE & FISHING 0.18%
AIRLIFT 0.15%
PHOTOGRAPHY & OPTICAL 0.12%
UTILITIES 0.07%
ASSET & MORTGAGE BACKED SECURITIES 0.06%
PRECIOUS METALS & STONES 0.05%
FINANCE MISCELLANEOUS 0.04%
TOTAL 100.00%
These allocations of assets were established on basis of data (gross) used by the entity responsible for the administration and bookkeeping and do not reflect inevitably the economic analysis which directed the assets selection.

DPAM CAPITAL B
Equities Europe Index
114
5.7. CHANGES IN THE COMPOSITION OF THE ASSETS IN EUR Equities Europe Index
1st semester 2nd semester Total
Purchases 6,156,848.71 11,239,209.29 17,396,058.00 Sales 35,912,606.84 25,496,830.87 61,409,437.71 Total 1 42,069,455.55 36,736,040.16 78,805,495.71 Subscriptions 11,871,664.80 22,212,920.15 34,084,584.95 Redemptions 44,695,192.59 39,407,537.60 84,102,730.19 Total 2 56,566,857.39 61,620,457.75 118,187,315.14 Reference average of the total net asset 288,886,980.00 296,742,043.43 292,846,792.79
Rotation Percentage -5.02% -8.39% -13.45%
The rotation rate gives the annual average of the transactions. A figure close to 0% shows that the transactions relating to the securities or the assets with the exception of deposits and liquid assets during a given period, were done exclusively in function of the subscriptions and redemptions. A negative percentage indicates that the subscriptions and redemptions give rise to only few or, as the case may be, no transactions in the portfolio.
A detailed list of the transactions carried out during the financial year can be consulted, free of charge, at Banque Degroof Petercam S.A with its registered office at Rue de l’Industrie 44 - B-1040 Brussels which provides the financial services.

DPAM CAPITAL B
115
5.8. VALUE OF COMMITMENTS RELATING TO POSITIONS IN FINANCIAL DERIVATIVES
Commitment on futures
Description Currency In currency En EUR Lot-size
STOXX 50 FUTURE MARCH 2022 EUR 956,097.50 956,097.50 10.00

DPAM CAPITAL B
Equities Europe Index
116
5.9. EVOLUTION OF SUBSCRIPTIONS, REDEMPTIONS AND THE NET ASSET
VALUE Equities Europe Index
Evolution of the number of shares in circulation
31 December 2019 31 December 2020 31 December 2021
Class Subscriptions Redemptions End of Period Subscriptions Redemptions End of Period Subscriptions Redemptions End of Period
A (Dis) 8,575.50 36,528.39 59,819.63 16,561.00 17,160.56 59,220.06 6,217.25 43,302.90 22,134.41
B (Cap) 53,242.53 241,343.18 433,325.98 12,047.73 200,261.29 245,112.42 14,061.87 58,729.22 200,445.06
E (Dis) 0.00 0.00 0.00 0.00 0.00 0.00 0.00 0.00 0.00
F (Cap) 113,423.51 180,832.79 645,253.57 127,226.86 166,337.01 606,143.42 54,786.61 156,375.92 504,554.11
I (Dis) 0.00 0.00 0.00 0.00 0.00 0.00 0.00 0.00 0.00
J (Cap) 105.00 6,058.00 5,028.44 8.00 4,979.44 57.00 0.00 57.00
M (Dis) 27,781.00 17,805.48 74,577.75 43,310.28 74,911.37 42,976.65 5,800.44 4,448.58 44,328.52
N (Cap) 91,544.61 177,420.10 463,650.43 59,402.96 188,897.35 334,156.04 66,920.37 55,382.79 345,693.62
P (Cap) 177.00 373.00 1,090.00 38.00 1,042.00 86.00 7.00 86.00 7.00
TOTAL 1,682,745.79 1,287,751.59 1,117,162.71
Payable and receivable amounts for the UCI
EUR 31 December 2019 31 December 2020 31 December 2021
Class Subscriptions Redemptions Subscriptions Redemptions Subscriptions Redemptions
A (Dis) 843,509.98 3,616,144.54 1,418,019.69 1,607,720.67 721,477.29 5,082,643.26
B (Cap) 5,695,524.97 25,800,123.26 1,277,155.26 20,986,867.93 1,820,561.54 7,499,142.51
E (Dis) 0.00 0.00 0.00 0.00 0.00 0.00
F (Cap) 36,734,989.23 57,770,619.92 38,056,451.37 52,656,666.73 21,824,423.45 60,358,256.14
I (Dis) 0.00 0.00 0.00 0.00 0.00 0.00
J (Cap) 2,766,185.66 168,585,020.42 178,821.52 126,933,514.19 0.00 1,912,523.90
M (Dis) 2,792,403.97 1,769,256.45 3,715,837.97 7,077,907.84 652,915.79 510,268.22
N (Cap) 10,436,339.07 18,624,451.79 6,546,612.47 19,654,592.52 8,928,911.91 7,087,640.72
P (Cap) 2,512,490.11 5,771,139.53 579,977.11 14,457,376.00 136,294.97 1,652,255.44
TOTAL 61,781,442.99 281,936,755.91 51,772,875.39 243,374,645.88 34,084,584.95 84,102,730.19
net asset value
EUR 31 December 2019 31 December 2020 31 December 2021
Class of the subfund Per share of the subfund Per share of the subfund Per share
A (Dis)
B (Cap)
E (Dis)
F (Cap)
I (Dis)
J (Cap)
M (Dis)
N (Cap)
P (Cap)
512,926,347.37
108.50
115.36
0.00
352.11
0.00
109.08
115.86
16,621.08
284,340,723.04
101.31
111.17
0.00
340.33
0.00
101.76
111.95
16,105.84
300,050,469.35
126.58
138.88
0.00
426.41
0.00
127.40
140.22
20,231.36
TOTAL 512,926,347.37 284,340,723.04 300,050,469.35
On the date of publication of this report, the net asset value per share is published on the following websites: www.dpamfunds.com and www.beama.be. This information is also available at the counters of the financial services department.

DPAM CAPITAL B
Equities Europe Index
117
5.10. PERFORMANCES
Figures reflect past performance and are not an indicator of future performance. These figures do not include any restructuring. Returns are determined at the end of the financial year. The annual return is defined as the absolute return earned over a year. For the semi-annual report, the accounting year is 12-month period preceding the end of the half-year. From 2011, the calculation of the performance of the capitalization units is calculated similarly to the distribution units. This change is also applied to past performance. This change of method does not bring any significant difference compared to the method used previously. Bar chart showing annual returns of the last 10 years (in % and calculated in EUR) as of 31 December 2021: Class A (Dis) Table showing historical performance (actuarial returns):
Average cumulated returns Since
1 year 3 year 5 year 10 year
Year Value
Class A (Dis) 24.94 % (in EUR)
14.79 % (in EUR)
8.14 % (in EUR)
09/11/2016 9.25 % (in EUR)
Class B (Cap) Annual return:
This is a passively managed sub-fund, which means that the portfolio manager's objective is to replicate the performance of a benchmark.
16
.6%
19
.1%
6.5
%
7.8
%
2.0
%
9.9
%
-10
.8%
25
.7%
-3.6
%
24
.9%
17
.3%
19
.8%
6.8
%
8.2
%
2.6
%
10
.2%
-10
.6%
26
.0%
-3.3
%
25
.1%
-15.00%
-10.00%
-5.00%
0.00%
5.00%
10.00%
15.00%
20.00%
25.00%
30.00%
2012 2013 2014 2015 2016 2017 2018 2019 2020 2021
Class B (Cap) MSCI Europe Net Return

DPAM CAPITAL B
Equities Europe Index
118
Table showing historical performance (actuarial returns):
Average cumulated returns Since
1 year 3 year 5 year 10 year
Year Value
Class B (Cap) 24.93 % (in EUR)
14.81 % (in EUR)
8.19 % (in EUR)
9.20 % (in EUR)
16/12/1992 7.61 % (in EUR)
Class F (Cap) Table showing historical performance (actuarial returns):
Average cumulated returns Since
1 year 3 year 5 year 10 year
Year Value
Class F (Cap) 25.29 % (in EUR)
15.15 % (in EUR)
8.51 % (in EUR)
9.43 % (in EUR)
16/11/2007 4.46 % (in EUR)
Class M (Dis) Table showing historical performance (actuarial returns):
Average cumulated returns Since
1 year 3 year 5 year 10 year
Year Value
Class M (Dis) 25.20 % (in EUR)
15.06 % (in EUR)
29/12/2017 7.99 % (in EUR)
Class N (Cap) Table showing historical performance (actuarial returns):
Average cumulated returns Since
1 year 3 year 5 year 10 year
Year Value
Class N (Cap) 25.25 % (in EUR)
15.10 % (in EUR)
27/12/2017 7.92 % (in EUR)
Class P (Cap) Table showing historical performance (actuarial returns):
Average cumulated returns Since
1 year 3 year 5 year 10 year
Year Value
Class P (Cap) 25.62 % (in EUR)
15.44 % (in EUR)
8.79 % (in EUR)
20/03/2013 8.31 % (in EUR)

DPAM CAPITAL B
Equities Europe Index
119
5.11. CHARGES Equities Europe Index
Ongoing charges
The ongoing charges, calculated in accordance with the provisions of European Commission Regulation 583/2010 of 1 July 2010. These charges include transaction fees incurred by the sub-fund when it subscribes to and/or sells units of another fund, but do not include either (i) the fees incurred by the sub-fund when it makes investments other than subscriptions/sales of units of funds or, where applicable, (ii) the performance fee These charges are based on the fees charged in fund accounting for one year prior to the end of the period under review. In the event of a change in the cost structure during the financial year or if the share class is issued during the financial year, the amount of the reported current expenses is calculated on the basis of an estimate based on the expected total amount of the annual expenses (which could be determined by comparison with a similar class).
Taking into account the change in the cost structure during the year, the estimated fees are :
- Class A (Dis) - BE6289131391: 0.65 % - Class B (Cap) - BE6278393689: 0.65 % - Class F (Cap) - BE0947566700: 0.36 % - Class M (Dis) - BE6299532612: 0.44 % - Class N (Cap) - BE6299533628: 0.39 % - Class P (Cap) - BE6249809029: 0.10 %. Fee sharing As at 31 December 2021, 36.35% of the remuneration due to the manager has been retroceded to other distributors, third parties and Bank Degroof Petercam or one of its subsidiaries.
5.12. NOTES TO THE FINANCIAL STATEMENTS AND OTHER INFORMATION
5.12.1. Gross dividends paid in the financial year
2016/2017 2.75 EUR 2018 class A 3.15 EUR class M 3.15 EUR 2019 class A 2.53 EUR class M 2.82 EUR
5.12.2. Investment restrictions and overruns
Between NAV Dates 7/06/2021 and 16/06/2021 a prospectus passive breach was open in the DPAM Capital B Equities Europe Index subfund. Indeed, due to corporate action, the fund received shares in Thungela Resources Ltd. (ISIN: ZAE000296554). This is a South African company, which is not within the benchmark (0.002% of the NAV as of 07/06/2021). The breach was resolved by selling the position.
5.12.3. Transparency in sustainability
Mandatory reporting in accordance with Article 7 of Regulation (EU) 2020/852 of 18 June 2020 on the establishment of a framework to promote sustainable investment and amending Regulation (EU) 2019/2088 The underlying investments in this sub-fund do not take into account the European Union's criteria for environmentally sustainable economic activities.

DPAM CAPITAL B
Equities Europe Index
120
5.12.4. Transparency of the securities financing transactions and of reuse
In accordance with Article 13 and Section A of the Annex to Regulation EU 2015/2365 (hereinafter the Regulation), the Sicav must inform investors of its use of securities financing transactions and total return swaps in the annual report and the half-yearly report. The portfolio does not contain any loaned assets at the date of this report.
Equities Europe Index
DPAM CAPITAL B
Equities Japan Index
121
6. INFORMATION ABOUT THE SUBFUND DPAM CAPITAL B EQUITIES JAPAN INDEX
Equities Japan Index
6.1. MANAGEMENT REPORT
6.1.1. Launch date of the sub-fund and subscription price of the shares
Initial subscription day: October 1, 1996 Initial subscription price: EUR 1 239.47 Class B shares were divided by 5 on March 31, 2005 and by 3 on July 30, 2015.
6.1.2. Stock exchange listing
The shares of the sub-fund are not listed on an exchange.
6.1.3. Aim and main outlines of the investment policy
The objective of the sub-fund is to provide shareholders with as high a global return as possible, with an accent on investments in Japanese equities. This is a passively managed sub-fund, which means that the portfolio manager's objective is to replicate the performance of a benchmark.
6.1.4. Financial management of the portfolio
Degroof Petercam Asset Management S.A. Rue Guimard, 18, 1040 Brussels
6.1.5. Distributor
Degroof Petercam Asset Management S.A. Rue Guimard, 18, 1040 Brussels
6.1.6. Index and benchmark
The sub-fund uses the following index as benchmark: MSCI Japan Net Return
This benchmark is used in managing the sub-fund. MSCI Japan Net Return covers approximately 85% of the floating market capitalization of the countries in the JAPAN zone included in the index. Additional information on this index and its composition can be found at www.msci.com. The performance of the benchmark index is calculated by reinvesting net dividends (Net Return). The tracking error is of the order of 2.0%. This is a passively managed sub-fund, which means that the portfolio manager's objective is to replicate the performance of a benchmark.
6.1.7. Policy followed during the year
The “Net Asset Value” of the fund (B share) as of December 31, 2021 was 143.35 EUR and its performance between December 31, 2020 and December 31, 2021 is 8.65% (in EUR). The benchmark of the Equities Japan Index sub-fund is the MSCI JAPAN Net DTR index. The MSCI JAPAN Net DTR Index, Net Dividends Reinvested, covers Japan and is established by MSCI.

DPAM CAPITAL B
Equities Japan Index
122
As of December 31, 2021, the index had 259 positions. The index value can be viewed on MSCI's website, www.msci.com/end-of-day-data-search. The composition of its indices can be viewed on the MSCI’s website, www.msci.com/constituents. The objective of the fund is to physically and fully replicate the composition of the underlying index (MSCI JAPAN). The use of futures on the Nikkei 225 index supplemented positions in equities and allowed to be fully invested through a liquid instrument without disrupting the portfolio structure during daily subscriptions and redemptions. The Nikkei 225 Index correlates well with the MSCI Japan Index. The results obtained on these futures are therefore close to those which would have been obtained directly in securities.
6.1.8. Future policy
The Equities Japan Index sub-fund, whose vocation is to be representative of the Japanese market, will continue its investment policy based on broad sector diversification with the Japan index published by MSCI as a benchmark.
6.1.9. Synthetic risk and reward indicator
The synthetic risk and return indicator gives an indication of the risk associated with investing in a sub-fund. It places this risk on a scale ranging from one (lowest risk) to seven (highest risk). Risk and reward profile: 6

DPAM CAPITAL B
Equities Japan Index
123
6.2. BALANCE SHEET
31 December 2021
EUR 31 December 2020
EUR
Section 1: Balance Sheet
TOTAL NET ASSETS 87,130,066.83 133,635,374.32
I. Fixed assets
A. Incorporation and organisation expenses B. Intangible assets C. Tangible assets
II. Transferable securities, money market instruments, UCIs and Financial derivatives
86,834,349.20 133,523,424.35
A. Bonds and other debt securities B. Money market instruments C. Shares and other securities similar to shares 86,690,566.16 133,354,128.30 a. Shares 86,690,566.16 133,354,128.30 D. Other transferable securities E. UCI with variable number of shares 143,783.04 169,296.05 F. financial derivatives
III. Receivables and payables on more than one year
A. Receivables B. Payables
IV. Receivables and payables up to a year -125,561.01 4,185.42
A. Receivables 108,883.79 160,424.81 a. Receivables 20,372.80 d. Others 88,510.99 160,424.81 B. Payables -234,444.80 -156,239.39 a. Payable amounts (-) -116,054.32 -5,899.95 c. Borrowing (-) -45.03 -142.75 e. Others (-) -118,345.45 -150,196.69
V. Deposits and liquidity 421,278.64 107,764.55
A. Demand bank deposits 421,278.64 107,764.55 B. Term bank deposits C. Others
VI. Deferred charges and accrued income
A. Expenses carried forward B. Accrued income C. Accrued expenses (-) D. Income carried forward (-)
TOTAL SHAREHOLDERS’ EQUITY 87,130,066.83 133,635,374.32
A. Capital 41,032,345.28 96,579,741.24 B. Income equalisation -1,874,081.16 2,473,335.76 C. Retained earnings 37,055,633.08 39,166,548.08 D. Result of the financial year 10,916,169.63 -4,584,250.76
Equities Japan Index

DPAM CAPITAL B
Equities Japan Index
124
31 December 2021
EUR 31 December 2020
EUR
Section 2: Off-balance sheet
OFF-BALANCE-SHEET 219,860.83 217,249.73
I. Collateral (+/-)
A. Collateral (+/-) B. Other collateral
II. Underlying securities of the option contracts and warrants (+)
A. Option contracts and warrants bought B. Option contracts and warrants sold
III. Notional amount of futures contracts (+) 219,860.83 217,249.73
A. Futures contracts bought and Forward contracts 219,860.83 217,249.73 B. Futures contracts sold and Forward Contracts
IV. Notional amount of the swap contracts (+)
A. Purchased swap contracts B. Sold swap contracts
V. Notional amount of other financial derivatives (+)
A. Purchased contracts B. Sold contracts
VI. Uncalled amounts on shares
VII. Commitments to resell on account of purchase-repurchase agreements
VIII. Commitments to repurchase on account of purchase-repurchase agreements
IX. Lent financial instruments

DPAM CAPITAL B
Equities Japan Index
125
6.3. INCOME STATEMENT
31 December 2021
EUR 31 December 2020
EUR
Section 3: Income and expenditure account
I. Depreciation, capital loss and capital gain 9,164,509.37 -6,792,020.85
A. Bonds and other debt securities
B. Money market instruments
C. Shares and other securities similar to shares 9,222,455.29 -6,358,001.47
a. Shares 9,222,455.29 -6,358,001.47
Realised gain 11,763,692.73 5,572,579.77
Realised loss -6,491,688.59 -17,944,470.77
Unrealised gain and loss 3,950,451.15 6,013,889.53
D. Other Transferable Securities
E. UCI with variable number of shares 8,586.99 -71,361.43
Realised gain 3,169.72
Realised loss -9,225.10 -26,069.57
Unrealised gain and loss 17,812.09 -48,461.58
F. financial derivatives 2,443.27 299,734.71
l. On financial indexes 2,443.27 299,734.71
ii. Futures 2,443.27 299,734.71
Realised gain and loss -382.14 299,893.03
Unrealised gain and loss 2,825.41 -158.32
G. Receivables, deposits, liquidity and payables
H. Foreign exchange positions and transactions -68,976.18 -662,392.66
a. financial derivatives 3,242.49
ii. Futures and forward contracts 3,242.49
Realised gain and loss 3,242.49
b. Other exchange positions and operations -68,976.18 -665,635.15
iv. Other -68,976.18 -665,635.15
Realised gain and loss -68,976.18 -665,635.15
II. Investment income and expenses 2,263,589.33 2,655,166.49
A. Dividends 2,476,372.01 2,939,687.87
B. Interest (+/-) 24.17 64.29
b. Deposits and liquidity 24.17 64.29
Interest on loans (-) -1,309.84 -1,872.33
Swap contracts (+/-)
Withholding tax (-) -211,497.01 -282,713.34
Foreign -211,497.01 -282,713.34
F. Other investment income
III. Other income 100,673.11 174,745.96
A. Anti dilution fee 100,673.11 174,745.96
B. Other
IV. Operating expenses -612,602.18 -622,142.36
A. Investment transaction and delivery costs (-) -122,315.44 -175,520.60
B. Financial expenses (-) -228.55 -426.70
C. Custodian’s fee (-) -43,622.26 -38,449.14
D. Manager’s fee (-) -385,167.42 -430,671.59
a. Financial Management of the Portfolio -297,412.93 -304,124.79
Class A (Dis) -5,945.99 -6,807.54
Class B (Cap) -67,057.69 -74,369.40
Class F (Cap) -168,159.34 -164,529.87
Class J (Cap) -10,623.47
Class M (Dis) -3,046.15 -1,846.82
Class N (Cap) -53,203.76 -45,947.69
b. Administration and accounting -87,754.49 -126,546.80
E. Administrative expenses (-) -20,870.33 -22,633.49
F. Incorporation and organisation expenses (-) -1,423.48 -798.42
G. Salaries and wages, social security charges and pensions (-) -220.14 542.41
H. Services and various goods (-) -14,049.94 -13,440.67
I. Depreciation and provisions for liabilities and charges (-)
J. Taxes -17,777.55 -16,869.33
Class A (Dis) -1,160.97 -1,084.16
Class B (Cap) -4,896.12 -6,484.90
Class F (Cap) -5,009.92 -4,998.06
Class M (Dis) -895.49 -606.67
Class N (Cap) -5,591.65 -4,157.31
Class P (Cap) -223.40 461.77
K. Other expenses (-) -6,927.07 76,125.17
Income and expenditure for the financial year Sub-Total II + III + IV 1,751,660.26 2,207,770.09
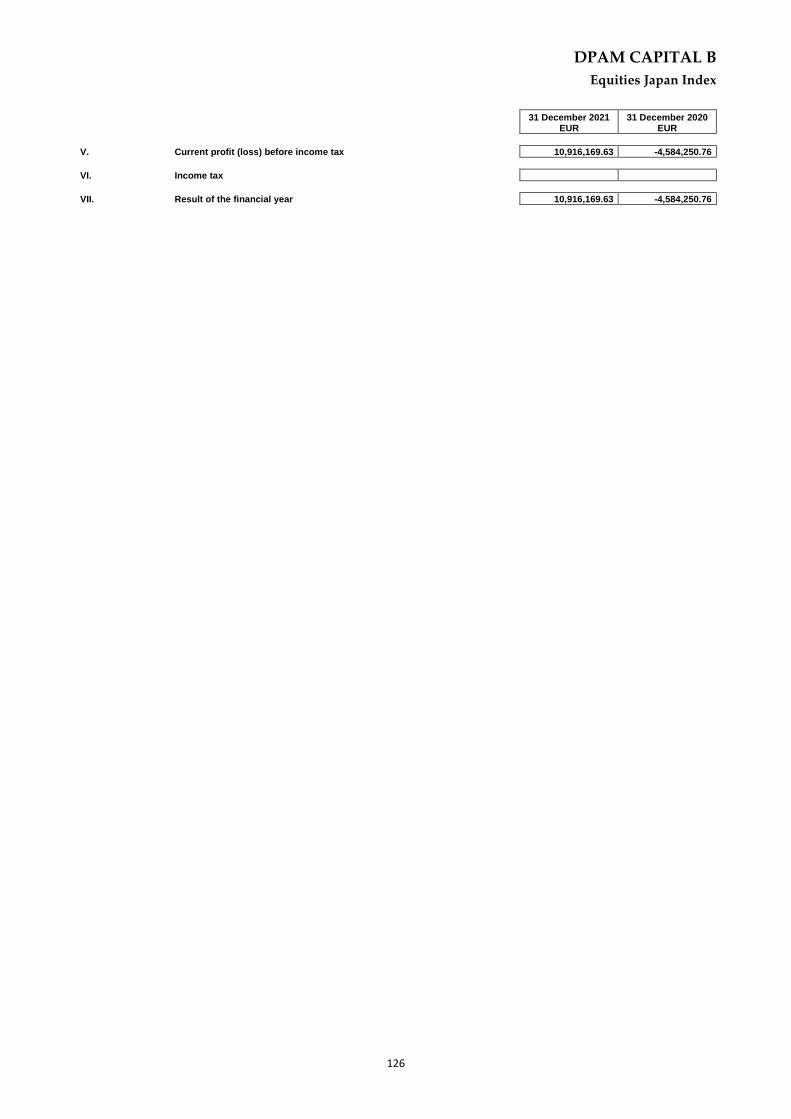
DPAM CAPITAL B
Equities Japan Index
126
31 December 2021
EUR 31 December 2020
EUR
V. Current profit (loss) before income tax 10,916,169.63 -4,584,250.76
VI. Income tax
VII. Result of the financial year 10,916,169.63 -4,584,250.76

DPAM CAPITAL B
Equities Japan Index
127
31 December 2021
EUR 31 December 2020
EUR
Section 4: Allocation of the result
I. Profit (Loss) to be allocated 46,097,721.55 37,055,633.08
a. Profit carried forward (Loss carried forward) from the previous period 37,055,633.08 39,166,548.08
b. Profit (loss) of the financial year 10,916,169.63 -4,584,250.76
c. Income equalisation received (Income equalisation paid out) -1,874,081.16 2,473,335.76
II. (Appropriation to) Deduction from the capital
III. (Profit to be carried forward) Loss to be carried forward -46,069,838.06 -37,055,633.08
IV. Dividend distribution -27,883.49

DPAM CAPITAL B
Equities Japan Index
128
6.4. COMPOSITION OF THE ASSETS
Equities Japan Index
Description Quantity at
31 December 2021 Currency
Price in currency
Evaluation EUR % by the
UCI %
portfolio % net assets
Transferable securities admitted to an official stock exchange listing
Shares
Japan
ADVANTEST 5,100 JPY 10,900 424,499.40 0.49% 0.49% AEON 16,226 JPY 2,709 335,661.00 0.39% 0.39% AGC INC 5,400 JPY 5,490 226,384.41 0.26% 0.26% AISIN CORPORATION 4,000 JPY 4,410 134,703.53 0.16% 0.15% AJINOMOTO 13,500 JPY 3,497 360,503.76 0.42% 0.41% ANA HDLG 3,000 JPY 2,404 55,084.12 0.06% 0.06% ASAHI BREWERIES 13,500 JPY 4,474 461,222.14 0.53% 0.53% ASAHI INTECC 5,900 JPY 2,471 111,328.19 0.13% 0.13% ASAHI KASEI 31,100 JPY 1,081 256,724.01 0.30% 0.29% ASTELLAS PHARMA 47,985 JPY 1,870 685,399.24 0.79% 0.79% AZBIL CORP 3,400 JPY 5,240 136,047.51 0.16% 0.16% BANDAI NAMCO HLDG 5,250 JPY 8,994 360,572.49 0.42% 0.41% BENEFIT ONE INC 2,000 JPY 4,935 75,369.83 0.09% 0.09% BRIDGESTONE 14,000 JPY 4,949 529,085.54 0.61% 0.61% BROTHER INDUSTRIES 6,300 JPY 2,211 106,367.68 0.12% 0.12% CANON 24,800 JPY 2,801 530,450.90 0.61% 0.61% CAPCOM CO LTD 4,900 JPY 2,708 101,326.99 0.12% 0.12% CENTRAL JAPAN RAILW 3,800 JPY 15,345 445,277.64 0.51% 0.51% CHIBA 14,000 JPY 659 70,452.09 0.08% 0.08% CHUBU ELECTRIC POWER 17,000 JPY 1,212 157,337.39 0.18% 0.18% CHUGAI PHARMA 16,500 JPY 3,735 470,603.28 0.54% 0.54% CONCORDIA FIN GROUP 25,500 JPY 418 81,394.84 0.09% 0.09% COSMOS PHARMA 500 JPY 16,930 64,640.90 0.07% 0.07% CYBERAGENT 11,400 JPY 1,914 166,620.02 0.19% 0.19% DAIFUKU 2,400 JPY 9,400 172,273.90 0.20% 0.20% DAI-ICHI LIFE HLDGS 26,000 JPY 2,326 461,710.86 0.53% 0.53% DAIICHI SANKYO CO 44,198 JPY 2,925 987,208.51 1.14% 1.13% DAIKIN 6,240 JPY 26,090 1,243,194.47 1.43% 1.43% DAI NIPPON PRINTING 5,650 JPY 2,893 124,818.02 0.14% 0.14% DAINIPPON SUMITOMO 4,500 JPY 1,325 45,531.17 0.05% 0.05% DAITO 1,700 JPY 13,170 170,968.11 0.20% 0.20% DAIWA HOUSE 13,900 JPY 3,308 351,124.15 0.40% 0.40% DAIWA H REIT INV 56 JPY 348,500 149,029.15 0.17% 0.17% DAIWA SECURITIES 36,100 JPY 649 178,826.35 0.21% 0.21% DENSO 11,172 JPY 9,529 812,940.31 0.94% 0.93% DENTSU GROUP INC 5,600 JPY 4,100 175,328.41 0.20% 0.20% DISCO CORP 700 JPY 35,150 187,890.05 0.22% 0.22% EAST JAPAN 7,900 JPY 7,073 426,688.71 0.49% 0.49% EISAI 5,900 JPY 6,531 294,247.04 0.34% 0.34% ENEOS HOLDINGS 80,010 JPY 430 262,903.29 0.30% 0.30% FANUC CORP 4,821 JPY 24,380 897,534.67 1.03% 1.03% FAST RETAILING 1,500 JPY 65,310 748,085.69 0.86% 0.86% FUJI ELECTRIC CO 3,400 JPY 6,280 163,049.31 0.19% 0.19% FUJIFILM HOLDINGS C 9,300 JPY 8,526 605,492.38 0.70% 0.69% FUJITSU LTD 5,100 JPY 19,730 768,382.85 0.88% 0.88% GLP J-REIT 112 JPY 198,900 170,111.32 0.20% 0.20% GMO PAYMENT GATEWAY 1,000 JPY 14,350 109,580.25 0.13% 0.13% HAKUHODO DY HLDG 5,600 JPY 1,916 81,933.96 0.09% 0.09% HAMAMATSU PHOTONICS 3,500 JPY 7,340 196,175.38 0.23% 0.23% HANKYU HANSHIN HLDG 5,700 JPY 3,265 142,114.52 0.16% 0.16% HIKARI TSUSHIN 600 JPY 17,710 81,142.84 0.09% 0.09% HINO MOTORS 7,600 JPY 948 55,017.69 0.06% 0.06% HIROSE 757 JPY 19,340 111,797.67 0.13% 0.13% HITACHI CONST MACH 2,300 JPY 3,325 58,398.26 0.07% 0.07% HITACHI LTD 24,300 JPY 6,230 1,156,044.95 1.33% 1.33% HITACHI METALS 5,300 JPY 2,131 86,246.15 0.10% 0.10% HONDA 40,581 JPY 3,230 1,000,934.52 1.15% 1.15% HOSHIZAKI CORP 1,300 JPY 8,650 85,869.68 0.10% 0.10% HOYA 9,274 JPY 17,110 1,211,706.68 1.40% 1.39% HULIC CO LTD 8,700 JPY 1,092 72,547.47 0.08% 0.08% IBIDEN 2,700 JPY 6,840 141,026.35 0.16% 0.16%

DPAM CAPITAL B
Equities Japan Index
129
Description Quantity at
31 December 2021 Currency
Price in currency
Evaluation EUR % by the
UCI %
portfolio % net assets
IDEMITSU KOSAN 5,204 JPY 2,937 116,713.65 0.13% 0.13% IIDA GRP HLDGS 3,800 JPY 2,676 77,651.55 0.09% 0.09% INPEX 27,000 JPY 1,002 206,591.23 0.24% 0.24% ISUZU MOTORS LTD 14,000 JPY 1,431 152,984.73 0.18% 0.18% IT HOLDGINGS 5,300 JPY 3,425 138,617.11 0.16% 0.16% ITOCHU 30,500 JPY 3,518 819,362.49 0.94% 0.94% ITOCHU TECHNO-SOL 2,500 JPY 3,700 70,635.36 0.08% 0.08% ITO EN 1,900 JPY 6,040 87,633.66 0.10% 0.10% JAPAN AIRLINES CO 4,400 JPY 2,196 73,784.55 0.08% 0.08% JAPAN EXCHANGE 12,300 JPY 2,518 236,505.50 0.27% 0.27% JAPAN POST BANK CO 10,300 JPY 1,055 82,979.36 0.10% 0.10% JAPAN POST HLDGS 63,000 JPY 897 431,436.17 0.50% 0.50% JAPAN POST INSUR 6,300 JPY 1,850 89,000.55 0.10% 0.10% JFE HOLDINGS 13,942 JPY 1,467 156,183.66 0.18% 0.18% JP RL EST INV 36 JPY 653,000 179,513.07 0.21% 0.21% JSR 5,500 JPY 4,375 183,747.38 0.21% 0.21% KAJIMA 13,650 JPY 1,321 137,694.27 0.16% 0.16% KAKAKU.COM 3,498 JPY 3,070 82,004.67 0.09% 0.09% KANSAI 17,400 JPY 1,074 142,703.27 0.16% 0.16% KANZAI PAINT CO 4,400 JPY 2,500 83,998.80 0.10% 0.10% KAO 12,500 JPY 6,019 574,532.71 0.66% 0.66% KDDI 40,600 JPY 3,362 1,042,327.38 1.20% 1.20% KEIO CORP 2,800 JPY 5,070 108,404.27 0.12% 0.12% KEISEI ELECTRIC RAIL 3,300 JPY 3,110 78,370.88 0.09% 0.09% KEYENCE CORP 4,946 JPY 72,280 2,729,937.21 3.14% 3.13% KIKKOMAN 4,700 JPY 9,670 347,060.14 0.40% 0.40% KINTETSU GROUP HLDGS 3,817 JPY 3,215 93,709.48 0.11% 0.11% KIRIN HOLDINGS 26,300 JPY 1,847 370,939.47 0.43% 0.43% KOBAYASHI PHARM 1,200 JPY 9,040 82,838.09 0.10% 0.10% KOBE BUSSAN CO LTD 3,700 JPY 4,455 125,872.20 0.14% 0.14% KOEI TECMO HLDG 1,250 JPY 4,525 43,192.57 0.05% 0.05% KOITO MANUFACT 2,500 JPY 6,090 116,261.98 0.13% 0.13% KOMATSU 23,028 JPY 2,694 473,645.70 0.55% 0.54% KONAMI 2,400 JPY 5,520 101,165.10 0.12% 0.12% KOSE 900 JPY 13,050 89,687.81 0.10% 0.10% KUBOTA 25,250 JPY 2,554 492,354.20 0.57% 0.57% KURITA 2,400 JPY 5,460 100,065.48 0.12% 0.11% KYOCERA 8,300 JPY 7,187 455,518.63 0.52% 0.52% KYOWA HAKKO KIRIN 7,370 JPY 3,135 176,435.28 0.20% 0.20% LASERTEC CORP 1,900 JPY 35,290 512,018.51 0.59% 0.59% LAWSON 1,000 JPY 5,450 41,617.59 0.05% 0.05% LION CORP 6,000 JPY 1,537 70,421.54 0.08% 0.08% LIXIL CORPORATION 7,800 JPY 3,065 182,559.94 0.21% 0.21% M3 11,000 JPY 5,793 486,605.05 0.56% 0.56% MAKITA 5,400 JPY 4,883 201,354.29 0.23% 0.23% MARUBENI 40,800 JPY 1,120 348,790.51 0.40% 0.40% MAZDA MOTOR CORP 16,200 JPY 885 109,480.98 0.13% 0.13% MCDONALD S HOLDINGS 1,700 JPY 5,090 66,076.51 0.08% 0.08% MEDIPAL SHS 4,100 JPY 2,155 67,470.13 0.08% 0.08% MEIJI HOLDINGS 4,248 JPY 6,860 222,530.23 0.26% 0.26% MERCARI INC 2,600 JPY 5,860 116,345.98 0.13% 0.13% MINEBEA MITSUMI INC 9,200 JPY 3,265 229,377.82 0.26% 0.26% MISUMI GROUP INC 7,700 JPY 4,720 277,532.04 0.32% 0.32% MITSUBI HEAVY IND 7,450 JPY 2,659 151,270.77 0.17% 0.17% MITSUBISHI 314,069 JPY 625 1,498,704.46 1.73% 1.72% MITSUBISHI 31,599 JPY 3,652 881,220.33 1.01% 1.01% MITSUBISHI ELECTRIC 45,500 JPY 1,458 506,755.22 0.58% 0.58% MITSUBISHI ESTATE 29,500 JPY 1,594 359,192.24 0.41% 0.41% MITSUBISHI GAS CHEM 3,700 JPY 1,948 55,039.07 0.06% 0.06% MITSUBISHI HC CAP 14,000 JPY 569 60,830.40 0.07% 0.07% MITSU CHEM HLDGS 32,000 JPY 852 208,194.85 0.24% 0.24% MITSUI 37,700 JPY 2,724 784,059.70 0.90% 0.90% MITSUI CHEMICALS 4,500 JPY 3,090 106,182.12 0.12% 0.12% MITSUI FUDOSAN 22,500 JPY 2,278 391,482.14 0.45% 0.45% MIURA CO LTD 2,300 JPY 3,960 69,551.01 0.08% 0.08% MIZUHO FINANCIAL 62,943 JPY 1,463 703,189.16 0.81% 0.81% MONOTARO CO LTD 7,100 JPY 2,073 112,392.69 0.13% 0.13% MS AND AD INSUR GRP 10,649 JPY 3,549 288,599.27 0.33% 0.33% MURATA MANUFACTURING 14,700 JPY 9,157 1,027,900.20 1.18% 1.18% NEC 6,600 JPY 5,310 267,620.18 0.31% 0.31% NEXON CO LTD 12,200 JPY 2,224 207,192.97 0.24% 0.24%

DPAM CAPITAL B
Equities Japan Index
130
Description Quantity at
31 December 2021 Currency
Price in currency
Evaluation EUR % by the
UCI %
portfolio % net assets
NGK 6,500 JPY 1,944 96,491.71 0.11% 0.11% NIDEC CORP 11,179 JPY 13,520 1,154,144.14 1.33% 1.32% NIHON M AND A CENTER 7,500 JPY 2,821 161,564.06 0.19% 0.19% NINTENDO 2,828 JPY 53,650 1,158,589.35 1.33% 1.33% NIPPON EXPRESS CO 2,000 JPY 6,910 105,533.04 0.12% 0.12% NIPPON PAINT 16,500 JPY 1,254 158,001.74 0.18% 0.18% NIPPON SANSO HLDGS 4,400 JPY 2,513 84,435.59 0.10% 0.10% NIPPON SHINYAKU 1,300 JPY 8,010 79,516.32 0.09% 0.09% NIPPON STEEL CORP 20,501 JPY 1,878 294,080.79 0.34% 0.34% NIPPON TELEGRAPH TEL 33,044 JPY 3,150 794,847.06 0.92% 0.91% NIPPON YUSEN KK 4,302 JPY 8,760 287,776.23 0.33% 0.33% NISSAN 61,300 JPY 556 260,171.32 0.30% 0.30% NISSAN CHEMICAL INDU 3,300 JPY 6,680 168,333.60 0.19% 0.19% NISSHIN SEIFUN GRP 7,199 JPY 1,658 91,145.89 0.10% 0.10% NISSIN FOOD 2,000 JPY 8,390 128,136.35 0.15% 0.15% NITORI HOLDINGS 1,945 JPY 17,225 255,834.58 0.29% 0.29% NITTO 3,684 JPY 8,890 250,093.14 0.29% 0.29% NOMURA 77,866 JPY 502 298,313.13 0.34% 0.34% NOMURA REAL ESTATE 110 JPY 161,800 135,910.06 0.16% 0.16% NOMURA REAL ESTATE 2,900 JPY 2,647 58,618.18 0.07% 0.07% NOMURA RESEARCH 8,697 JPY 4,935 327,745.72 0.38% 0.38% NP BUILDING FUND 35 JPY 670,000 179,070.17 0.21% 0.21% NP PROLOGIS REIT 53 JPY 407,000 164,721.65 0.19% 0.19% NTT DATA CORP 15,500 JPY 2,466 291,880.56 0.34% 0.33% OBAYASHI 16,000 JPY 890 108,740.27 0.13% 0.12% OBIC 1,700 JPY 21,600 280,403.27 0.32% 0.32% ODAKYU ELECTRIC RWY 7,800 JPY 2,136 127,226.11 0.15% 0.15% OJI PAPER 25,000 JPY 557 106,334.85 0.12% 0.12% OLYMPUS CORP 29,400 JPY 2,650 594,828.35 0.69% 0.68% OMRON 4,500 JPY 11,460 393,801.65 0.45% 0.45% ONO PHARMACEUTICAL 9,900 JPY 2,856 215,910.52 0.25% 0.25% OPEN HOUSE GROUP 2,000 JPY 6,020 91,940.51 0.11% 0.11% ORACLE JAPAN 1,000 JPY 8,740 66,740.87 0.08% 0.08% ORIENTAL LAND 4,980 JPY 19,395 737,563.69 0.85% 0.85% ORIX 31,500 JPY 2,348 564,672.40 0.65% 0.65% ORIX JREIT 63 JPY 179,800 86,498.91 0.10% 0.10% OSAKA GAS 10,000 JPY 1,901 145,165.20 0.17% 0.17% OTSUKA CORP 2,400 JPY 5,490 100,615.29 0.12% 0.12% OTSUKA HOLDINGS CO 10,400 JPY 4,169 331,089.67 0.38% 0.38% PANASONIC CORP 55,102 JPY 1,265 532,277.72 0.61% 0.61% PAN PACIFIC INTL 11,500 JPY 1,587 139,365.47 0.16% 0.16% PERSOL HOLDINGS CO 4,400 JPY 3,340 112,222.40 0.13% 0.13% POLA ORBIS HOLDINGS 2,000 JPY 1,917 29,277.40 0.03% 0.03% RAKUTEN GROUP INC 22,400 JPY 1,154 197,394.13 0.23% 0.23% RECRUIT HLDG 34,245 JPY 6,972 1,823,202.68 2.10% 2.09% RENESAS ELECT CORP 30,900 JPY 1,423 335,771.46 0.39% 0.39% RESONA HOLDINGS NEW 51,000 JPY 447 174,239.48 0.20% 0.20% RICOH 16,700 JPY 1,071 136,579.76 0.16% 0.16% RINNAI CORP 1,100 JPY 10,380 87,190.76 0.10% 0.10% ROHM 2,200 JPY 10,470 175,893.49 0.20% 0.20% RYOHIN KEIKAKU 4,000 JPY 1,754 53,575.96 0.06% 0.06% SANTEN PHARMA CO 8,850 JPY 1,407 95,086.26 0.11% 0.11% SBI HOLDINGS 7,120 JPY 3,135 170,450.37 0.20% 0.20% SCSK CORP 4,200 JPY 2,289 73,413.42 0.08% 0.08% SECOM 5,600 JPY 7,986 341,505.53 0.39% 0.39% SEIKO EPSON CORP 6,000 JPY 2,071 94,888.10 0.11% 0.11% SEKISUI CHEMICAL 10,000 JPY 1,922 146,768.81 0.17% 0.17% SEKISUI HOUSE 16,847 JPY 2,469 317,631.87 0.37% 0.36% SEVEN-I HOLDINGS 19,000 JPY 5,056 733,569.17 0.84% 0.84% SG HOLDINGS CO. LTD. 8,100 JPY 2,693 166,571.91 0.19% 0.19% SHARP CORPORATION 5,000 JPY 1,321 50,437.46 0.06% 0.06% SHIMADZU 6,000 JPY 4,855 222,444.10 0.26% 0.26% SHIMANO 1,878 JPY 30,660 439,691.57 0.51% 0.50% SHIMIZU 17,500 JPY 713 95,281.37 0.11% 0.11% SHIN ETSU 8,915 JPY 19,920 1,356,098.03 1.56% 1.56% SHIONOGI 6,800 JPY 8,125 421,903.07 0.49% 0.48% SHISEIDO 10,400 JPY 6,414 509,380.95 0.59% 0.58% SHIZUOKA 11,400 JPY 822 71,557.82 0.08% 0.08% SMC 1,450 JPY 77,590 859,120.65 0.99% 0.99% SOFTBANK 71,500 JPY 1,454 794,145.67 0.91% 0.91% SOFTBANK GROUP CORP 30,298 JPY 5,434 1,257,227.86 1.45% 1.44%

DPAM CAPITAL B
Equities Japan Index
131
Description Quantity at
31 December 2021 Currency
Price in currency
Evaluation EUR % by the
UCI %
portfolio % net assets
SOHGO SECURITY SERV 1,500 JPY 4,570 52,346.53 0.06% 0.06% SOMPO HOLDINGS INC 7,700 JPY 4,859 285,705.12 0.33% 0.33% SONY GROUP CORP 31,929 JPY 14,475 3,529,265.18 4.06% 4.05% SQUARE ENIX CO LTD 2,000 JPY 5,900 90,107.80 0.10% 0.10% STANLEY ELEC CO 3,100 JPY 2,879 68,152.81 0.08% 0.08% S TOMO MITSUI 32,900 JPY 3,943 990,610.84 1.14% 1.14% SUBARU CORP 15,800 JPY 2,057 248,182.86 0.29% 0.28% SUMCO 8,200 JPY 2,349 147,088.01 0.17% 0.17% SUMITOMO CHEMICAL 33,100 JPY 542 136,995.94 0.16% 0.16% SUMITOMO ELECTRIC 17,428 JPY 1,500 199,560.43 0.23% 0.23% SUMITOMO METAL 6,300 JPY 4,350 209,271.56 0.24% 0.24% SUMITOMO MITSUI T H 8,569 JPY 3,843 251,466.96 0.29% 0.29% SUMITOMO REALTY 7,800 JPY 3,383 201,500.91 0.23% 0.23% SUMITOMO SHOJI 28,300 JPY 1,700 367,488.26 0.42% 0.42% SUNTORY BF 5,000 JPY 4,160 158,834.10 0.18% 0.18% SUZUKI 9,551 JPY 4,429 323,024.10 0.37% 0.37% SYSMEX CORP 4,200 JPY 15,550 498,723.79 0.57% 0.57% TAISEI 5,200 JPY 3,495 138,781.29 0.16% 0.16% TAISHO PHARMACEUTIC 860 JPY 5,290 34,740.38 0.04% 0.04% TAKEDA PHARMA 39,500 JPY 3,137 946,219.77 1.09% 1.09% T D HOLDINGS INC 14,400 JPY 1,472 161,864.16 0.19% 0.19% TDK 10,200 JPY 4,490 349,725.19 0.40% 0.40% TERUMO CORP 16,500 JPY 4,860 612,351.26 0.71% 0.70% TOBU RAILWAY 4,900 JPY 2,622 98,109.07 0.11% 0.11% TOHO CO 2,800 JPY 4,925 105,303.95 0.12% 0.12% TOKIO MARINE HLD LTD 15,700 JPY 6,392 766,331.75 0.88% 0.88% TOKYO CENTURY CORP 900 JPY 5,580 38,349.27 0.04% 0.04% TOKYO ELECTRIC 38,000 JPY 297 86,182.77 0.10% 0.10% TOKYO ELECTRON 3,800 JPY 66,280 1,923,297.64 2.21% 2.21% TOKYO GAS RG 10,200 JPY 2,062 160,608.76 0.18% 0.18% TOKYU CORP 13,000 JPY 1,528 151,686.56 0.17% 0.17% TOPPAN INC. 6,900 JPY 2,156 113,599.98 0.13% 0.13% TORAY 35,000 JPY 682 182,223.94 0.21% 0.21% TOSHIBA CORP 10,480 JPY 4,730 378,532.20 0.44% 0.43% TOSOH CORP 7,000 JPY 1,706 91,192.15 0.11% 0.10% TOTO LTD 4,100 JPY 5,290 165,622.73 0.19% 0.19% TOYO SUISAN KAISHA 3,000 JPY 4,875 111,680.22 0.13% 0.13% TOYOTA INDUSTRIES 3,400 JPY 9,190 238,602.41 0.27% 0.27% TOYOTA MOTOR CORP 269,540 JPY 2,106 4,333,700.28 4.99% 4.97% TOYOTA TSUSHO 5,500 JPY 5,300 222,596.82 0.26% 0.26% TREND MICRO 3,600 JPY 6,390 175,664.40 0.20% 0.20% TSURUHA HOLDINGS 1,000 JPY 11,040 84,304.25 0.10% 0.10% UNI CHARM 10,400 JPY 4,999 397,005.82 0.46% 0.46% USS 5,400 JPY 1,796 74,059.45 0.09% 0.08% WELCIA HDG 3,000 JPY 3,590 82,242.46 0.09% 0.09% WEST JAPAN RAILWAY 4,600 JPY 4,810 168,959.77 0.19% 0.19% YAKULT 4,300 JPY 6,000 197,015.37 0.23% 0.23% YAMAHA 3,500 JPY 5,670 151,541.47 0.17% 0.17% YAMAHA MOTOR CO 8,000 JPY 2,759 168,547.41 0.19% 0.19% YAMATO 7,700 JPY 2,703 158,934.13 0.18% 0.18% YASKAWA ELEC 6,500 JPY 5,640 279,945.10 0.32% 0.32% YOKOGAWA ELECTRIC 6,000 JPY 2,074 95,025.55 0.11% 0.11% Z HOLDINGS CORP 69,364 JPY 667 353,509.21 0.41% 0.41% ZOZO INC 3,100 JPY 3,590 84,983.88 0.10% 0.10%
86,690,566.16 99.83% 99.50%
Total - Shares 86,690,566.16 99.83% 99.50%
UCI with variable number of shares
Shares
Non Directive 2009/65/CE - Non FSMA
JAPAN METROPOLITAN 190 JPY 99,100 143,783.04 0.17% 0.17%
Total - Non Directive 2009/65/CE - Non FSMA 143,783.04 0.17% 0.17%
Total - Shares 143,783.04 0.17% 0.17%
Total - UCI with variable number of shares 143,783.04 0.17% 0.17%

DPAM CAPITAL B
Equities Japan Index
132
Description Quantity at
31 December 2021 Currency
Price in currency
Evaluation EUR % by the
UCI %
portfolio % net assets
Total - Transferable securities admitted to an official stock exchange listing
86,834,349.20 100.00% 99.66%
Total - portfolio 86,834,349.20 100.00% 99.66%
Collatéral 0.00 0.00%
Deposits and liquid assets
deposit and liquid assets
Banque Degroof Petercam JPY 276,416.71 0.32%
Banque Degroof Petercam EUR 144,861.93 0.17%
Total - deposit and liquid assets 421,278.64 0.48%
Total - Deposits and liquid assets 421,278.64 0.48%
Other receivables and other payables -125,561.01 -0.14%
Others 0.00 0.00%
Total net assets 87,130,066.83 100,00%
Equities Japan Index

DPAM CAPITAL B
Equities Japan Index
133
6.5. GEOGRAPHIC ALLOCATION OF INVESTMENTS
By country % Portfolio
JAPAN 100.00%
Total 100.00%
These allocations of assets were established on basis of data (gross) used by the entity responsible for the administration and bookkeeping and do not reflect inevitably the economic analysis which directed the assets selection.

DPAM CAPITAL B
Equities Japan Index
134
6.6. ECONOMIC ALLOCATION OF INVESTMENTS
By sector % Portfolio
ELECTRIC & ELECTRONIC COMPONANTS 14.31%
FINANCIAL SERVICES - HOLDINGS 13.64%
ROAD VEHICLES 10.01%
PHARMACOLOGY & PERSONAL CARE 9.34%
INFORMATION, TECHNOLOGY & COPIERS 6.22%
TELECOMMUNICATIONS 4.88%
ELECTRIC & ELECTRONIC MATERIALS 4.60%
MECHANICAL CONSTRUCTION 4.53%
CONGLOMERATES 4.07%
IT & INTERNET 3.99%
CHEMICAL PRODUCTS 3.79%
BUILDING MATERIALS 2.90%
REAL ESTATE 2.68%
BANKS 2.13%
AIRLIFT 1.71%
FOOD & CLEANING MATERIALS 1.56%
ROAD & RAILWAY TRANSPORTS 1.03%
TOBACCO & SPIRITS 0.96%
LEISURES & TOURISM 0.85%
ENERGY SOURCES 0.80%
PUBLISHING & BROADCASTING 0.79%
PHOTOGRAPHY & OPTICAL 0.70%
RETAIL TRADING, DEPARTMENT STORES 0.68%
INSURANCE COMPANIES 0.63%
TYRES & RUBBER 0.61%
INTERMEDIATE INDUSTRY PRODUCTS 0.58%
HEALTH CARE & SERVICES 0.56%
MISCELLANEOUS CONSUMER GOODS 0.36%
SHIPPING 0.33%
OTHER SERVICES 0.33%
OIL & DERIVED 0.13%
FOREST PRODUCTS & PAPER INDUSTRY 0.12%
NONFERROUS METALS 0.10%
TEXTILE & GARMENTS 0.08%
TOTAL 100.00%
These allocations of assets were established on basis of data (gross) used by the entity responsible for the administration and bookkeeping and do not reflect inevitably the economic analysis which directed the assets selection.

DPAM CAPITAL B
Equities Japan Index
135
6.7. CHANGES IN THE COMPOSITION OF THE ASSETS IN EUR Equities Japan Index
1st semester 2nd semester Total
Purchases 13,126,512.57 1,373,934.50 14,500,447.07 Sales 33,695,244.43 36,725,320.07 70,420,564.50 Total 1 46,821,757.00 38,099,254.57 84,921,011.57 Subscriptions 15,161,437.26 6,599,313.96 21,760,751.22 Redemptions 35,648,999.12 43,432,556.11 79,081,555.23 Total 2 50,810,436.38 50,031,870.07 100,842,306.45 Reference average of the total net asset 136,360,390.29 104,052,564.37 120,073,705.44
Rotation Percentage -2.93% -11.47% -13.26%
The rotation rate gives the annual average of the transactions. A figure close to 0% shows that the transactions relating to the securities or the assets with the exception of deposits and liquid assets during a given period, were done exclusively in function of the subscriptions and redemptions. A negative percentage indicates that the subscriptions and redemptions give rise to only few or, as the case may be, no transactions in the portfolio.
A detailed list of the transactions carried out during the financial year can be consulted, free of charge, at Banque Degroof Petercam S.A with its registered office at Rue de l’Industrie 44 - B-1040 Brussels which provides the financial services.
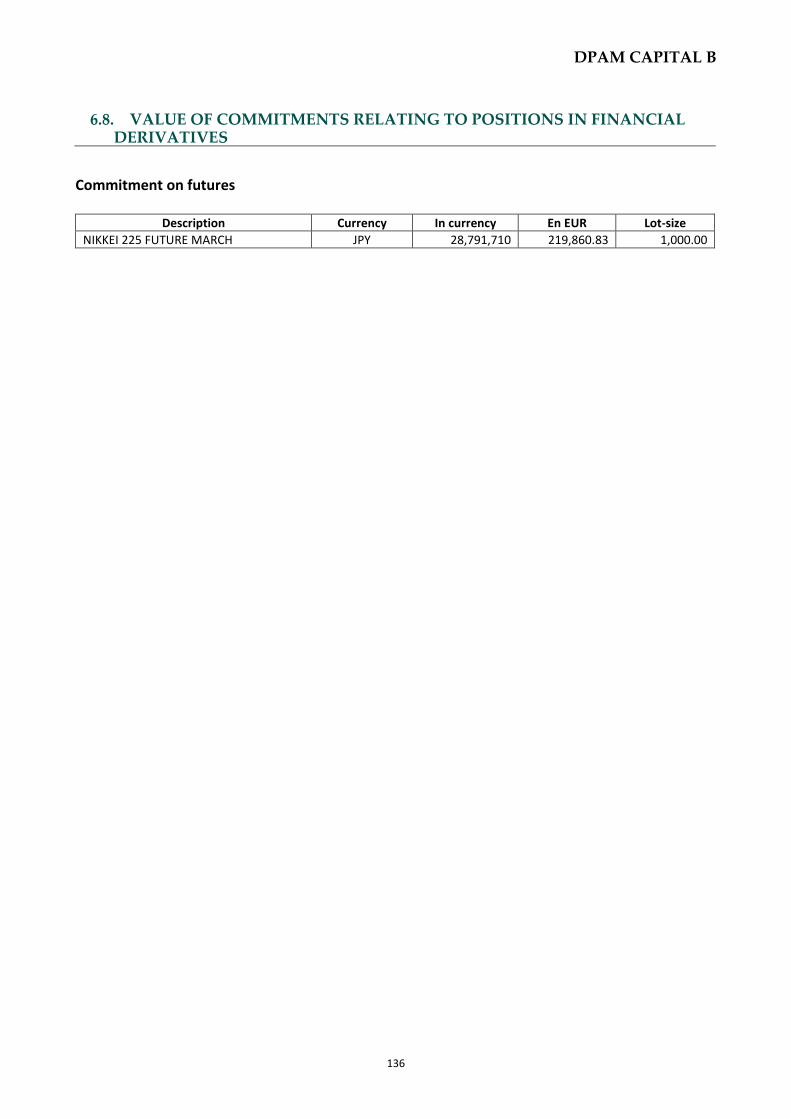
DPAM CAPITAL B
136
6.8. VALUE OF COMMITMENTS RELATING TO POSITIONS IN FINANCIAL DERIVATIVES
Commitment on futures
Description Currency In currency En EUR Lot-size
NIKKEI 225 FUTURE MARCH JPY 28,791,710 219,860.83 1,000.00

DPAM CAPITAL B
Equities Japan Index
137
6.9. EVOLUTION OF SUBSCRIPTIONS, REDEMPTIONS AND THE NET ASSET
VALUE Equities Japan Index
Evolution of the number of shares in circulation
31 December 2019 31 December 2020 31 December 2021
Class Subscriptions Redemptions End of Period Subscriptions Redemptions End of Period Subscriptions Redemptions End of Period
A (Dis) 1,249.00 4,099.00 2,559.91 26,929.00 19,844.00 9,644.91 823.40 1,365.00 9,103.31
B (Cap) 32,032.85 75,605.48 137,414.84 48,865.08 66,755.24 119,524.68 4,590.74 52,372.59 71,742.83
E (Dis) 0.00 0.00 0.00 0.00 0.00 0.00 0.00 0.00 0.00
F (Cap) 45,100.51 158,958.34 169,680.17 114,266.92 115,821.42 168,125.67 39,996.24 96,936.73 111,185.19
I 0.00 0.00 0.00 0.00 0.00 0.00 0.00 0.00 0.00
J (Cap) 0.00 1,625.60 1,701.08 0.00 0.00 0.00 0.00 0.00 0.00
M (Dis) 120.00 5,589.55 2,950.87 11,335.47 2,111.50 12,174.84 0.00 8,620.00 3,554.84
N (Cap) 36,440.21 27,065.30 123,479.83 96,193.43 35,255.83 184,417.43 23,679.25 71,092.04 137,004.65
P (Cap) 82.00 47.00 2,018.00 133.00 927.00 1,224.00 41.00 950.00 315.00
TOTAL 439,804.69 495,111.54 332,905.82
Payable and receivable amounts for the UCI
EUR 31 December 2019 31 December 2020 31 December 2021
Class Subscriptions Redemptions Subscriptions Redemptions Subscriptions Redemptions
A (Dis) 137,022.42 452,540.18 3,037,399.68 2,335,733.12 109,845.99 176,020.90
B (Cap) 3,667,123.02 8,617,144.78 5,806,346.34 7,863,647.01 625,583.03 7,275,194.14
E (Dis) 0.00 0.00 0.00 0.00 0.00 0.00
F (Cap) 16,921,296.10 56,405,666.00 42,828,381.32 40,214,926.15 16,817,998.05 41,700,194.47
I 0.00 0.00 0.00 0.00 0.00 0.00
J (Cap) 0.00 42,043,738.18 0.00 0.00 0.00 0.00
M (Dis) 14,163.60 613,645.53 1,286,054.70 245,666.38 0.00 1,152,419.35
N (Cap) 4,121,013.66 3,096,875.02 11,465,880.99 4,039,719.49 3,342,552.98 9,822,748.27
P (Cap) 1,410,210.50 762,080.87 2,419,433.96 16,057,171.62 864,771.17 18,954,978.10
TOTAL 26,270,829.30 111,991,690.56 66,843,496.99 70,756,863.77 21,760,751.22 79,081,555.23
net asset value
EUR 31 December 2019 31 December 2020 31 December 2021
Class of the subfund Per share of the subfund Per share of the subfund Per share
A (Dis)
B (Cap)
E (Dis)
F (Cap)
I
J (Cap)
M (Dis)
N (Cap)
P (Cap)
181,608,530.90
121.73
126.21
0.00
384.88
0.00
27,571.41
121.91
126.81
17,703.76
133,635,374.32
125.25
131.94
0.00
403.51
0.00
0.00
125.36
132.93
18,608.47
87,130,066.83
135.99
143.35
0.00
439.58
0.00
0.00
136.50
144.85
20,324.15
TOTAL 181,608,530.90 133,635,374.32 87,130,066.83
On the date of publication of this report, the net asset value per share is published on the following websites: www.dpamfunds.com and www.beama.be. This information is also available at the counters of the financial services department.

DPAM CAPITAL B
Equities Japan Index
138
6.10. PERFORMANCES
Figures reflect past performance and are not an indicator of future performance. These figures do not include any restructuring. Returns are determined at the end of the financial year. The annual return is defined as the absolute return earned over a year. For the semi-annual report, the accounting year is 12-month period preceding the end of the half-year. From 2011, the calculation of the performance of the capitalization units is calculated similarly to the distribution units. This change is also applied to past performance. This change of method does not bring any significant difference compared to the method used previously. Bar chart showing annual returns of the last 10 years (in % and calculated in EUR) as of 31 December 2021: Class A (Dis) Table showing historical performance (actuarial returns):
Average cumulated returns Since
1 year 3 year 5 year 10 year
Year Value
Class A (Dis) 8.57 % (in EUR)
11.14 % (in EUR)
6.14 % (in EUR)
09/11/2016 6.57 % (in EUR)
Class B (Cap) Annual return:
This is a passively managed sub-fund, which means that the portfolio manager's objective is to replicate the performance of a benchmark.
5.7
%
20
.2%
8.5
%
21
.2%
4.7
% 8.1
%
-9.1
%
21
.0%
4.5
%
8.6
%
6.5
%
21
.6%
9.3
%
22
.1%
5.4
% 8.9
%
-8.5
%
21
.8%
5.0
%
9.4
%
-15.00%
-10.00%
-5.00%
0.00%
5.00%
10.00%
15.00%
20.00%
25.00%
2012 2013 2014 2015 2016 2017 2018 2019 2020 2021
Class B (Cap) MSCI Japan Net Return

DPAM CAPITAL B
Equities Japan Index
139
Table showing historical performance (actuarial returns):
Average cumulated returns Since
1 year 3 year 5 year 10 year
Year Value
Class B (Cap) 8.65 % (in EUR)
11.17 % (in EUR)
6.18 % (in EUR)
8.97 % (in EUR)
02/10/1996 2.21 % (in EUR)
Class F (Cap) Table showing historical performance (actuarial returns):
Average cumulated returns Since
1 year 3 year 5 year 10 year
Year Value
Class F (Cap) 8.94 % (in EUR)
11.48 % (in EUR)
6.49 % (in EUR)
9.18 % (in EUR)
14/12/2007 5.02 % (in EUR)
Class M (Dis) Table showing historical performance (actuarial returns):
Average cumulated returns Since
1 year 3 year 5 year 10 year
Year Value
Class M (Dis) 8.89 % (in EUR)
11.41 % (in EUR)
28/12/2017 5.92 % (in EUR)
Class N (Cap) Table showing historical performance (actuarial returns):
Average cumulated returns Since
1 year 3 year 5 year 10 year
Year Value
Class N (Cap) 8.97 % (in EUR)
11.48 % (in EUR)
28/12/2017 5.97 % (in EUR)
Class P (Cap) Table showing historical performance (actuarial returns):
Average cumulated returns Since
1 year 3 year 5 year 10 year
Year Value
Class P (Cap) 9.22 % (in EUR)
11.77 % (in EUR)
6.76 % (in EUR)
31/03/2013 8.37 % (in EUR)

DPAM CAPITAL B
Equities Japan Index
140
6.11. CHARGES Equities Japan Index
Ongoing charges
The ongoing charges, calculated in accordance with the provisions of European Commission Regulation 583/2010 of 1 July 2010.
These charges include transaction fees incurred by the sub-fund when it subscribes to and/or sells units of another fund, but do not include either (i) the fees incurred by the sub-fund when it makes investments other than subscriptions/sales of units of funds or, where applicable, (ii) the performance fee
These charges are based on the fees charged in fund accounting for one year prior to the end of the period under review.
In the event of a change in the cost structure during the financial year or if the share class is issued during the financial year, the amount of the reported current expenses is calculated on the basis of an estimate based on the expected total amount of the annual expenses (which could be determined by comparison with a similar class).
Taking into account the change in the cost structure during the year, the estimated fees are :
- Class A (Dis) - BE6289154625: 0.73 % - Class B (Cap) - BE6278394695: 0.66 % - Class F (Cap) - BE0947568722: 0.38 % - Class M (Dis) - BE6299536654: 0.45 % - Class N (Cap) - BE6299537660: 0.40 % - Class P (Cap) - BE6249812056: 0.12 % Fee sharing
On 31 December 2021, 24.88% of the remuneration due to the manager was retroceded to other distributors, third parties and Bank Degroof Petercam or one of its subsidiaries.
6.12. NOTES TO THE FINANCIAL STATEMENTS AND OTHER INFORMATION
6.12.1. Gross dividends paid in the financial year
2016/2017 1.67 EUR 2018 class A 2.15 EUR class M 2.45 EUR 2019 class A 1.57 EUR class M 1.86 EUR
6.12.2. Transparency in sustainability
Mandatory reporting in accordance with Article 7 of Regulation (EU) 2020/852 of 18 June 2020 on the establishment of a framework to promote sustainable investment and amending Regulation (EU) 2019/2088 The underlying investments in this sub-fund do not take into account the European Union's criteria for environmentally sustainable economic activities.
6.12.3. Transparency of the securities financing transactions and of reuse
In accordance with Article 13 and Section A of the Annex to Regulation EU 2015/2365 (hereinafter the Regulation), the Sicav must inform investors of its use of securities financing transactions and total return swaps in the annual report and the half-yearly report.
The portfolio does not contain any loaned assets at the date of this report. Equities Japan Index
DPAM CAPITAL B
Equities US Behavioral Value
141
7. INFORMATION ABOUT THE SUBFUND DPAM CAPITAL B EQUITIES US BEHAVIORAL VALUE
Equities US Behavioral Value
7.1. MANAGEMENT REPORT
7.1.1. Launch date of the sub-fund and subscription price of the shares
Initial subscription period: from 20 September 2004 to 30 September 2004. Initial subscription price: 500 EUR. On 30/07/2015 the shares of the class B have been divided in 12.
7.1.2. Stock exchange listing
The shares of the sub-fund are not listed on an exchange.
7.1.3. Aim and main outlines of the investment policy
The objective of the sub-fund is to provide the shareholders with as high a global return as possible. The sub-fund invests in listed American equities. The investment policy embraces the principles of Behavioral Finance, a psychology-based academic field that analyses the financial markets. The sub-fund invests in equities which are deemed undervalued and exhibit a good price momentum. The fund will continue to widely spread the risks, mainly by a large sector diversification. This is an actively managed sub-fund, which means that the portfolio manager does not aim to replicate the performance of a benchmark.
7.1.4. Financial management of the portfolio
Degroof Petercam Asset Management S.A. Rue Guimard, 18, 1040 Brussels
7.1.5. Distributor
Degroof Petercam Asset Management S.A. Rue Guimard, 18, 1040 Brussels
7.1.6. Index and benchmark
The sub-fund uses the following index as its benchmark: MSCI USA Net Return. This index is representative of the large- and mid-cap equity market of developed countries (as defined by MSCI and mainly based on the country of incorporation and the country of primary listing of its securities) in the United States. The performance of this index is calculated by reinvesting net dividends (Net Return). This is an actively managed sub-fund, which means that the portfolio manager does not aim to replicate the performance of a benchmark. The benchmark is used for performance comparison purposes.
7.1.7. Policy followed during the year
The value style and strategy had good year in absolute terms or relatively to market, especially in the first half of the year as equities kept their momentum from good news on covid vaccines and progressive re-opening of the economies. The second half of the year was more volatile and undecisive as markets started to price in somewhat more hawkish (US) central bank, still weakening China economy and slower global growth momentum in general. New covid waves and omicron variant added to the uncertainties and risk of harsher confinement measures. After the summer, long term bond yields fell and curve flattened which hurt relative performance of value styles. In absolute terms all sectors were positive for the year with IT, consumer discretionary and financials adding the most
DPAM CAPITAL B
Equities US Behavioral Value
142
in absolute terms. In relative terms, consumer discretionary, communication services and industrials added the most. Relative to the benchmark we underperformed the most in the IT sector by not having Apple and NVIDIA. In consumer discretionary several strong picks helped the strong relative performance in that sector with Carmax, Ford and Lowe’s having a stellar year to name a few. In industrials United rentals and Carrier Global performed well among others and helped the outperformance in that sector. Energy performed well in absolute terms this year and being overweight Devon Energy helped the performance in absolute and relative terms. In materials we also posted strong results relative to the benchmark with Steel Dynamics and Sealed Air contributing the most. Financials overall have performed strongly. Our position in Morgan Stanley, Fifth Third Bancorp and Citizens Financial Group helped the performance the most in that sector. Overall the fund had a strong year outperforming the overall US stock market and posting strong returns in all sectors.
7.1.8. Future policy
We will continue to implement the behavioral value systematic strategy by replacing relatively more expensive stocks (within industry group) by cheaper ones, avoiding value trapped, more financially challenged stocks, as well as highly controversial companies, paying close attention to the quality of the balance sheet as to the Environmental, Social, and Governance dimensions. The funds will keep a diversified and close to neutral allocation at the sector level although keeping a tilt in favor of the more cyclical and value ones.
7.1.9. Synthetic risk and reward indicator
The synthetic risk and return indicator gives an indication of the risk associated with investing in a sub-fund. It places this risk on a scale ranging from one (lowest risk) to seven (highest risk). Risk and Reward Profile: 6

DPAM CAPITAL B
Equities US Behavioral Value
143
7.2. BALANCE SHEET
31 December 2021
EUR 31 December 2020
EUR
Section 1: Balance Sheet
TOTAL NET ASSETS 790,182,267.16 493,410,713.70
I. Fixed assets
A. Incorporation and organisation expenses B. Intangible assets C. Tangible assets
II. Transferable securities, money market instruments, UCIs and Financial derivatives
789,837,837.67 491,281,823.38
A. Bonds and other debt securities B. Money market instruments C. Shares and other securities similar to shares 789,837,837.67 491,281,823.38 a. Shares 789,837,837.67 491,281,823.38 D. Other transferable securities E. UCI with variable number of shares F. financial derivatives
III. Receivables and payables on more than one year
A. Receivables B. Payables
IV. Receivables and payables up to a year -362,243.97 -22,976.97
A. Receivables 2,174,900.69 450,538.71 a. Receivables 1,607,326.94 d. Others 567,573.75 450,538.71 B. Payables -2,537,144.66 -473,515.68 a. Payable amounts (-) -1,632,950.37 -18,959.75 c. Borrowing (-) -516.61 -43.88 e. Others (-) -903,677.68 -454,512.05
V. Deposits and liquidity 706,673.46 2,151,867.29
A. Demand bank deposits 706,673.46 2,151,867.29 B. Term bank deposits C. Others
VI. Deferred charges and accrued income
A. Expenses carried forward B. Accrued income C. Accrued expenses (-) D. Income carried forward (-)
TOTAL SHAREHOLDERS’ EQUITY 790,182,267.16 493,410,713.70
A. Capital 368,397,605.10 277,288,920.10 B. Income equalisation -14,272,630.00 43,153,705.22 C. Retained earnings 216,121,793.60 189,831,120.26 D. Result of the financial year 219,935,498.46 -16,863,031.88
Equities US Be havioral Value

DPAM CAPITAL B
Equities US Behavioral Value
144
31 December 2021
EUR 31 December 2020
EUR
Section 2: Off-balance sheet
I. Collateral (+/-)
A. Collateral (+/-) B. Other collateral
II. Underlying securities of the option contracts and warrants (+)
A. Option contracts and warrants bought B. Option contracts and warrants sold
III. Notional amount of futures contracts (+)
A. Futures contracts bought and Forward contracts B. Futures contracts sold and Forward Contracts
IV. Notional amount of the swap contracts (+)
A. Purchased swap contracts B. Sold swap contracts
V. Notional amount of other financial derivatives (+)
A. Purchased contracts B. Sold contracts
VI. Uncalled amounts on shares
VII. Commitments to resell on account of purchase-repurchase agreements
VIII. Commitments to repurchase on account of purchase-repurchase agreements
IX. Lent financial instruments

DPAM CAPITAL B
Equities US Behavioral Value
145
7.3. INCOME STATEMENT
31 December 2021
EUR 31 December 2020
EUR
Section 3: Income and expenditure account
I. Depreciation, capital loss and capital gain 214,572,087.25 -20,910,278.34
A. Bonds and other debt securities
B. Money market instruments
C. Shares and other securities similar to shares 214,594,345.97 -20,942,589.57
a. Shares 214,594,345.97 -20,942,589.57
Realised gain 141,298,515.73 91,903,336.05
Realised loss -31,650,367.22 -150,381,547.53
Unrealised gain and loss 104,946,197.46 37,535,621.91
D. Other Transferable Securities
E. UCI with variable number of shares
F. financial derivatives
G. Receivables, deposits, liquidity and payables
H. Foreign exchange positions and transactions -22,258.72 32,311.23
b. Other exchange positions and operations -22,258.72 32,311.23
iv. Other -22,258.72 32,311.23
Realised gain and loss -22,258.72 32,311.23
II. Investment income and expenses 10,587,089.60 8,523,289.62
A. Dividends 12,436,298.25 10,031,609.42
B. Interest (+/-) 389.71 9,481.42
b. Deposits and liquidity 389.71 9,481.42
Interest on loans (-) -3,632.27 -5,780.01
Swap contracts (+/-)
Withholding tax (-) -1,845,966.09 -1,537,159.62
Foreign -1,845,966.09 -1,537,159.62
F. Other investment income 25,138.41
III. Other income 0.01
A. Anti dilution fee
B. Other 0.01
IV. Operating expenses -5,223,678.39 -4,476,043.17
A. Investment transaction and delivery costs (-) -2,404,756.86 -2,652,848.00
B. Financial expenses (-)
C. Custodian’s fee (-) -198,658.72 -101,105.52
D. Manager’s fee (-) -2,454,774.92 -1,846,937.56
a. Financial Management of the Portfolio -1,973,307.07 -1,350,572.47
Class A (Dis) -3,156.39 -5,014.74
Class B (Cap) -156,732.76 -119,710.36
Class B USD (Cap) -85,009.32 -98,468.25
Class F (Cap) -168,624.65 -7,144.54
Class J (Cap) -1,496,011.71 -1,010,196.62
Class L (Cap) -1,931.10 -1,434.18
Class L USD (Cap) -674.16 -833.63
Class M (Dis) -2,252.13 -7,714.59
Class N (Cap) -27,339.42 -31,751.60
Class W (Cap) -1,902.48 -1,217.26
Class M USD (Cap) -1,129.07 -733.98
Class N USD (Dis) -28,543.88 -66,352.72
b. Administration and accounting -481,467.85 -496,365.09
E. Administrative expenses (-) -84,900.04 -87,927.82
F. Incorporation and organisation expenses (-) -8,619.13 -6,288.39
G. Salaries and wages, social security charges and pensions (-) -281.56 -2,981.92
H. Services and various goods (-) -42,271.88 -18,716.84
I. Depreciation and provisions for liabilities and charges (-)
J. Taxes -14,239.39 -13,668.02
Class A (Dis) -428.40 -207.70
Class B (Cap) -8,453.73 -8,015.74
Class B USD (Cap) -1,638.92 -1,369.19
Class F (Cap) -56.73 0.47
Class J (Cap) 313.75 114.16
Class L (Cap) 0.06 0.02
Class L USD (Cap) 0.03 0.02
Class M (Dis) -170.29 -518.34
Class N (Cap) -3,713.42 -3,547.74
Class P (Cap) 82.54 21.20
Class W (Cap) -4.09 0.02
Class N USD (Cap) -170.31 -145.24
Class M USD (Dis) 0.12 0.04
K. Other expenses (-) -15,175.89 254,430.90
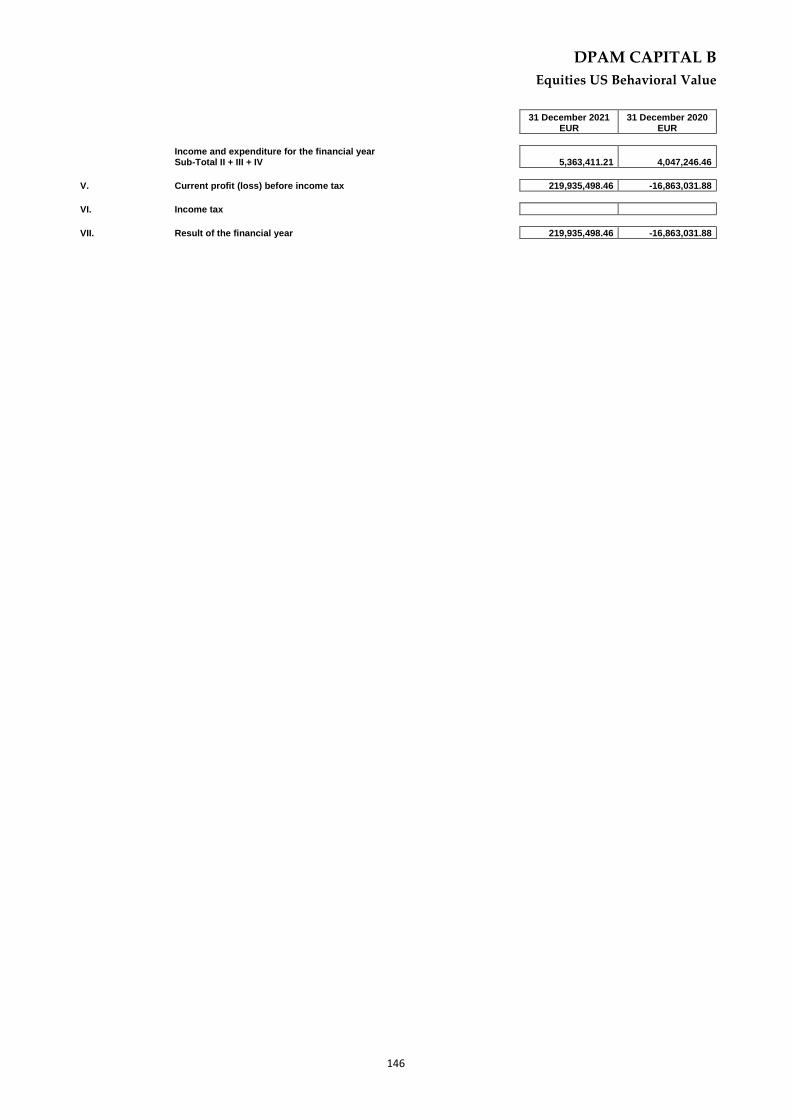
DPAM CAPITAL B
Equities US Behavioral Value
146
31 December 2021
EUR 31 December 2020
EUR
Income and expenditure for the financial year Sub-Total II + III + IV 5,363,411.21 4,047,246.46
V. Current profit (loss) before income tax 219,935,498.46 -16,863,031.88
VI. Income tax
VII. Result of the financial year 219,935,498.46 -16,863,031.88

DPAM CAPITAL B
Equities US Behavioral Value
147
31 December 2021
EUR 31 December 2020
EUR
Section 4: Allocation of the result
I. Profit (Loss) to be allocated 421,784,662.06 216,121,793.60
a. Profit carried forward (Loss carried forward) from the previous period 216,121,793.60 189,831,120.26
b. Profit (loss) of the financial year 219,935,498.46 -16,863,031.88
c. Income equalisation received (Income equalisation paid out) -14,272,630.00 43,153,705.22
II. (Appropriation to) Deduction from the capital
III. (Profit to be carried forward) Loss to be carried forward -421,778,441.64 -216,121,793.60
IV. Dividend distribution -6,220.42

DPAM CAPITAL B
Equities US Behavioral Value
148
7.4. COMPOSITION OF THE ASSETS
Equities US Behavioral Value
Description Quantity at
31 December 2021 Currency
Price in currency
Evaluation EUR % by the
UCI %
portfolio % net assets
Transferable securities admitted to an official stock exchange listing
Shares
United Kingdom
LIBERTY GLOBAL A 200,000 USD 27.75 4,879,528.67 0.62% 0.62% SENSATA TECHNO 95,000 EUR 53.50 5,082,500.00 0.64% 0.64%
9,962,028.67 1.26% 1.26%
Ireland
JAZZ PHARMACEUTICAL 30,000 USD 127.40 3,360,886.39 0.43% 0.43% SEAGATE HLDGS 65,000 USD 112.98 6,457,703.13 0.82% 0.82%
9,818,589.52 1.24% 1.24%
Netherlands
LYONDELLBASELL IND 50,000 USD 92.23 4,055,135.42 0.51% 0.51% NXP SEMICONDUCTORS 55,000 USD 227.78 11,016,443.90 1.39% 1.39%
15,071,579.32 1.91% 1.91%
United States of America
ABBVIE 85,000 USD 135.40 10,120,471.33 1.28% 1.28% ADOBE INC 10,000 USD 567.06 4,986,457.97 0.63% 0.63% ADVANCE AUTO PARTS 33,000 USD 239.88 6,960,991.91 0.88% 0.88% AFLAC INC 130,000 USD 58.39 6,674,903.27 0.85% 0.84% ALEXANDRIA REIT 19,000 USD 222.96 3,725,149.49 0.47% 0.47% ALLY FINANCIAL 125,000 USD 47.61 5,233,248.33 0.66% 0.66% ALPHABET INC -A- 10,000 USD 2,897.04 25,475,202.25 3.23% 3.22% AMGEN 30,000 USD 224.97 5,934,839.96 0.75% 0.75% ANTHEM 15,000 USD 463.54 6,114,227.93 0.77% 0.77% APPLIED MATERIALS 100,000 USD 157.36 13,837,495.60 1.75% 1.75% ARROW 75,000 USD 134.27 8,855,302.50 1.12% 1.12% ATMOS ENERGY CORP 60,000 USD 104.77 5,527,787.55 0.70% 0.70% ATT 380,000 USD 24.60 8,220,189.94 1.04% 1.04% AUTODESK 30,000 USD 281.19 7,417,956.38 0.94% 0.94% BANK OF NY MELLON 120,000 USD 58.08 6,128,737.25 0.78% 0.78% BEST BUY 35,000 USD 101.60 3,126,978.54 0.40% 0.40% BIOGEN INC 10,000 USD 239.92 2,109,743.23 0.27% 0.27% BLACK KNIGHT 80,000 USD 82.89 5,831,164.26 0.74% 0.74% BOOKING HLDG 3,000 USD 2,399.23 6,329,308.83 0.80% 0.80% BORGWARNER 125,000 USD 45.07 4,954,053.82 0.63% 0.63% BRISTOL-MYERS 110,000 USD 62.35 6,031,041.15 0.76% 0.76% CARMAX NEW 48,000 USD 130.23 5,496,869.50 0.70% 0.70% CENTENE CORP 120,000 USD 82.40 8,695,040.45 1.10% 1.10% CHIPOTLE MEXICAN A 2,000 USD 1,748.25 3,074,657.05 0.39% 0.39% CHURCH - DWIGHT CO 80,000 USD 102.50 7,210,692.93 0.91% 0.91% CIGNA CORPORATION 28,000 USD 229.63 5,653,921.91 0.72% 0.72% CITIGROUP INC 35,000 USD 60.39 1,858,644.04 0.24% 0.24% CITIZENS FINL GROUP 250,000 USD 47.25 10,387,354.91 1.32% 1.31% CITRIX 40,000 USD 94.59 3,327,119.24 0.42% 0.42% COGNIZANT TECHNOLOGY 80,000 USD 88.72 6,241,294.41 0.79% 0.79% COLGATE-PALMOLIVE 110,000 USD 85.34 8,254,836.44 1.05% 1.04% COMCAST-A 220,000 USD 50.33 9,736,721.77 1.23% 1.23% CONSTELLATION BRAND 30,000 USD 250.97 6,620,735.14 0.84% 0.84% CORNING 220,000 USD 37.23 7,202,427.01 0.91% 0.91% CUMMINS INC 30,000 USD 218.14 5,754,660.57 0.73% 0.73% CVS HEALTH CORP 80,000 USD 103.16 7,257,122.76 0.92% 0.92% D.R. HORTON 44,000 USD 108.45 4,196,095.67 0.53% 0.53% DARDEN 30,000 USD 150.64 3,973,971.16 0.50% 0.50% DELL TECH -C 165,000 USD 56.17 8,149,885.68 1.03% 1.03% DENTSPLY SIRONA 95,000 USD 55.79 4,660,613.79 0.59% 0.59% DEVON ENERGY 75,000 USD 44.05 2,905,161.80 0.37% 0.37% DISCOVERY COMMUNIC A 160,000 USD 23.54 3,311,994.37 0.42% 0.42%

DPAM CAPITAL B
Equities US Behavioral Value
149
Description Quantity at
31 December 2021 Currency
Price in currency
Evaluation EUR % by the
UCI %
portfolio % net assets
EDISON INT 100,000 USD 68.25 6,001,582.84 0.76% 0.76% EQUITABLE HOLDINGS 208,000 USD 32.79 5,997,467.46 0.76% 0.76% F5 INC 40,000 USD 244.71 8,607,456.91 1.09% 1.09% FEDEX 15,000 USD 258.64 3,411,537.11 0.43% 0.43% FIDELITY NATL INFOR 50,000 USD 109.15 4,799,067.89 0.61% 0.61% FIFTH THIRD 120,000 USD 43.55 4,595,497.71 0.58% 0.58% FISERV INC 50,000 USD 103.79 4,563,401.34 0.58% 0.58% FORD MOTOR 600,000 USD 20.77 10,958,494.55 1.39% 1.39% FOX CORP 40,000 USD 36.90 1,297,924.73 0.16% 0.16% FRANKLIN RESOURCES 220,000 USD 33.49 6,478,895.53 0.82% 0.82% GILEAD SCIENCES 100,000 USD 72.61 6,384,980.65 0.81% 0.81% GLOBAL PAYMENTS INC 40,000 USD 135.18 4,754,836.44 0.60% 0.60% HARTFORD 50,000 USD 69.04 3,035,525.85 0.38% 0.38% HCA HEALTHCARE INC 15,000 USD 256.92 3,388,849.81 0.43% 0.43% HEWLETT PACKARD WI 600,000 USD 15.77 8,320,436.16 1.05% 1.05% HOME DEPOT 38,000 USD 415.01 13,867,727.75 1.76% 1.76% HOWMET AERSPCACE 180,000 USD 31.83 5,038,163.91 0.64% 0.64% INTERPUBLIC 200,000 USD 37.45 6,586,352.44 0.83% 0.83% INVITATION 95,000 USD 45.34 3,787,636.30 0.48% 0.48% IPG PHOTONICS CORP 55,000 USD 172.14 8,325,448.47 1.05% 1.05% JUNIPER 250,000 USD 35.71 7,850,422.09 0.99% 0.99% KEURIG DR PEPPER 170,000 USD 36.86 5,510,200.49 0.70% 0.70% KEYCORP 400,000 USD 23.13 8,135,772.07 1.03% 1.03% KINDER MORGAN 440,000 USD 15.86 6,136,475.55 0.78% 0.78% KNGHT-SWIFT TRANSP 75,000 USD 60.94 4,019,081.96 0.51% 0.51% KROGER CO 200,000 USD 45.26 7,959,901.51 1.01% 1.01% LABORATORY 22,000 USD 314.21 6,078,631.73 0.77% 0.77% LIBERTY-C-SIRIUSXM 115,000 USD 50.85 5,142,235.31 0.65% 0.65% LIBERTY MEDIA CORP 100,000 USD 63.24 5,561,027.08 0.70% 0.70% LOWE 45,000 USD 258.48 10,228,279.99 1.29% 1.29% MASCO 80,000 USD 70.22 4,939,852.27 0.63% 0.63% METLIFE 140,000 USD 62.49 7,693,105.87 0.97% 0.97% MICROSOFT 145,000 USD 336.32 42,882,870.21 5.43% 5.43% MODERNA INC 20,000 USD 253.98 4,466,760.46 0.57% 0.57% MOHAWK INDUSTRIES 20,000 USD 182.18 3,204,009.85 0.41% 0.41% MOLSON COORS 140,000 USD 46.35 5,706,120.30 0.72% 0.72% MORGAN STANLEY 120,000 USD 98.16 10,358,072.46 1.31% 1.31% NORFOLK SOUTHERN 19,000 USD 297.71 4,974,050.30 0.63% 0.63% OMNICOM 100,000 USD 73.27 6,443,017.94 0.82% 0.82% ON SEMICONDUCTOR 130,000 USD 67.92 7,764,333.45 0.98% 0.98% O REILLY AUTO 13,000 USD 706.23 8,073,329.23 1.02% 1.02% OWENS CORNING 70,000 USD 90.50 5,570,699.96 0.71% 0.70% PFIZER 200,000 USD 59.05 10,385,156.52 1.31% 1.31% PIONEER NAT RES CO 45,000 USD 181.88 7,197,150.90 0.91% 0.91% PROLOGIS 40,000 USD 168.36 5,921,913.47 0.75% 0.75% PTC INC 35,000 USD 121.15 3,728,675.69 0.47% 0.47% PUBLIC SERVICE 90,000 USD 66.73 5,281,129.09 0.67% 0.67% PULTE GROUP INC 60,000 USD 57.16 3,015,828.35 0.38% 0.38% QORVO INC 42,000 USD 156.39 5,775,923.32 0.73% 0.73% QUEST 42,000 USD 173.01 6,389,746.75 0.81% 0.81% REGENERON PHARMA INC 8,000 USD 631.52 4,442,631.02 0.56% 0.56% REGIONS FINANCIAL 400,000 USD 21.80 7,667,956.38 0.97% 0.97% REPUBLIC SERVICES 33,000 USD 139.45 4,046,649.67 0.51% 0.51% ROBERT HALF 30,000 USD 111.52 2,941,962.72 0.37% 0.37% SALESFORCE.COM 34,000 USD 254.13 7,597,977.49 0.96% 0.96% SEALED AIR-1998 100,000 USD 67.47 5,932,993.32 0.75% 0.75% SEMPRA 50,000 USD 132.28 5,816,039.40 0.74% 0.74% SKYWORKS SOLUTIONS 48,000 USD 155.14 6,548,294.06 0.83% 0.83% SNAP-ON 25,000 USD 215.38 4,734,875.13 0.60% 0.60% SPLUNK INC 35,000 USD 115.72 3,561,554.70 0.45% 0.45% STANLEY BLACK DECK 36,000 USD 188.62 5,971,086.88 0.76% 0.76% STEEL DYNAMICS 85,000 USD 62.07 4,639,421.39 0.59% 0.59% SYNCHRONY FINANCIAL 120,000 USD 46.39 4,895,181.15 0.62% 0.62% SYNOPSYS 15,000 USD 368.50 4,860,622.58 0.62% 0.62% TARGET CORP 38,000 USD 231.44 7,733,661.63 0.98% 0.98% THE KRAFT HEINZ 130,000 USD 35.90 4,103,939.50 0.52% 0.52% UNITED RENTALS 17,000 USD 332.29 4,967,402.39 0.63% 0.63% VALERO ENERGY 110,000 USD 75.11 7,265,300.74 0.92% 0.92% VERTEX 25,000 USD 219.60 4,827,646.85 0.61% 0.61% VICI PROPERTIES INC 100,000 USD 30.11 2,647,731.27 0.34% 0.34% VISA-A 60,000 USD 216.71 11,433,872.67 1.45% 1.45%

DPAM CAPITAL B
Equities US Behavioral Value
150
Description Quantity at
31 December 2021 Currency
Price in currency
Evaluation EUR % by the
UCI %
portfolio % net assets
VMWARE 40,000 USD 115.88 4,075,976.08 0.52% 0.52% WESTROCK CO 120,000 USD 44.36 4,680,970.81 0.59% 0.59% WEYERHAEUSER 150,000 USD 41.18 5,431,762.22 0.69% 0.69%
754,985,640.16 95.59% 95.55%
Total - Shares 789,837,837.67 100.00% 99.96%
Total - Transferable securities admitted to an official stock exchange listing
789,837,837.67 100.00% 99.96%
Total - portfolio 789,837,837.67 100.00% 99.96%
Collatéral 0.00 0.00%
Deposits and liquid assets
deposit and liquid assets
Banque Degroof Petercam CHF 5.90 0.00%
Banque Degroof Petercam USD 452,270.04 0.06%
Banque Degroof Petercam EUR 254,397.52 0.03%
Total - deposit and liquid assets 706,673.46 0.09%
Total - Deposits and liquid assets 706,673.46 0.09%
Other receivables and other payables -362,243.97 -0.05%
Others 0.00 0.00%
Total net assets 790,182,267.16 100,00%
Equities US Behavioral Value

DPAM CAPITAL B
Equities US Behavioral Value
151
7.5. GEOGRAPHIC ALLOCATION OF INVESTMENTS
By country % Portfolio
UNITED STATES OF AMERICA 95.59%
NETHERLANDS 1.91%
UNITED KINGDOM 1.26%
IRELAND 1.24%
Total 100.00%
These allocations of assets were established on basis of data (gross) used by the entity responsible for the administration and bookkeeping and do not reflect inevitably the economic analysis which directed the assets selection.

DPAM CAPITAL B
Equities US Behavioral Value
152
7.6. ECONOMIC ALLOCATION OF INVESTMENTS
By sector % Portfolio
IT & INTERNET 18.36%
FINANCIAL SERVICES - HOLDINGS 11.15%
ELECTRIC & ELECTRONIC COMPONANTS 7.87%
RETAIL TRADING, DEPARTMENT STORES 6.94%
PHARMACOLOGY & PERSONAL CARE 6.52%
MISCELLANEOUS CONSUMER GOODS 3.95%
BANKS 3.59%
INFORMATION, TECHNOLOGY & COPIERS 3.24%
PUBLISHING & BROADCASTING 3.17%
BIOTECHNOLOGY 3.00%
OIL & DERIVED 2.98%
ENERGY SOURCES 2.86%
BUILDING MATERIALS 2.76%
TELECOMMUNICATIONS 2.37%
INSURANCE COMPANIES 2.20%
REAL ESTATE 2.04%
ROAD VEHICLES 2.01%
HEALTH CARE & SERVICES 1.87%
FOOD & CLEANING MATERIALS 1.61%
TOBACCO & SPIRITS 1.56%
OTHER SERVICES 1.45%
MECHANICAL CONSTRUCTION 1.33%
FOREST PRODUCTS & PAPER INDUSTRY 1.28%
ROAD & RAILWAY TRANSPORTS 1.06%
ASSET & MORTGAGE BACKED SECURITIES 0.92%
PACKAGING INDUSTRY 0.75%
AEROSPACE INDUSTRY & DEFENCE 0.64%
INTERMEDIATE INDUSTRY PRODUCTS 0.59%
AIRLIFT 0.51%
UTILITIES 0.51%
LEISURES & TOURISM 0.50%
CAPITAL GOODS (MISCELLANEOUS) 0.41%
TOTAL 100.00%
These allocations of assets were established on basis of data (gross) used by the entity responsible for the administration and bookkeeping and do not reflect inevitably the economic analysis which directed the assets selection.

DPAM CAPITAL B
Equities US Behavioral Value
153
7.7. CHANGES IN THE COMPOSITION OF THE ASSETS IN EUR Equities US Behavioral Value
1st semester 2nd semester Total
Purchases 603,043,601.40 408,120,187.27 1,011,163,788.67 Sales 428,356,823.43 500,314,589.23 928,671,412.66 Total 1 1,031,400,424.83 908,434,776.50 1,939,835,201.33 Subscriptions 203,123,595.83 13,556,910.97 216,680,506.80 Redemptions 31,008,279.10 108,836,172.70 139,844,451.80 Total 2 234,131,874.93 122,393,083.67 356,524,958.60 Reference average of the total net asset 661,889,063.50 763,357,237.28 713,040,142.88
Rotation Percentage 120.45% 102.97% 222.05%
The rotation rate gives the annual average of the transactions. A figure close to 0% shows that the transactions relating to the securities or the assets with the exception of deposits and liquid assets during a given period, were done exclusively in function of the subscriptions and redemptions. A negative percentage indicates that the subscriptions and redemptions give rise to only few or, as the case may be, no transactions in the portfolio.
A detailed list of the transactions carried out during the financial year can be consulted, free of charge, at Banque Degroof Petercam S.A with its registered office at Rue de l’Industrie 44 - B-1040 Brussels which provides the financial services.

DPAM CAPITAL B
Equities US Behavioral Value
154
7.8. EVOLUTION OF SUBSCRIPTIONS, REDEMPTIONS AND THE NET ASSET
VALUE Equities US Behavioral Value
Evolution of the number of shares in circulation
31 December 2019 31 December 2020 31 December 2021
Class Subscriptions Redemptions End of Period Subscriptions Redemptions End of Period Subscriptions Redemptions End of Period
A (Dis) 820.54 1,394.00 7,221.55 300.00 5,444.00 2,077.55 1,809.72 1,150.00 2,737.27
B (Cap) 17,158.14 94,092.23 135,352.31 1,014.75 51,007.10 85,359.97 42,491.17 58,074.95 69,776.18
B USD (Cap) 7,385.00 26,870.28 122,342.00 2,811.00 55,759.00 69,394.00 237.00 47,148.00 22,483.00
E (Dis) 0.00 0.00 0.00 0.00 0.00 0.00 0.00 0.00 0.00
F (Cap) 1,077.60 15,760.05 1,458.86 138.00 742.86 854.00 39,561.02 35,371.04 5,043.98
F USD (Cap) 0.00 0.00 0.00 0.00 0.00 0.00 0.00 0.00 0.00
I 0.00 0.00 0.00 0.00 0.00 0.00 0.00 0.00 0.00
J (Cap) 0.00 193.50 20,327.95 0.00 8,522.00 11,805.95 2,501.00 23.00 14,283.95
L (Cap) 0.00 40.00 86.00 0.00 19.00 67.00 0.00 8.00 59.00
L USD (Cap) 0.00 55.00 42.00 0.00 0.00 42.00 28.00 42.00 0.00
M (Dis) 15,272.48 20,379.62 33,210.89 1,000.00 29,695.89 4,515.00 450.00 3,890.00 1,075.00
M USD (Dis) 0.00 0.00 1,285.00 0.00 0.00 1,285.00 0.00 0.00 1,285.00
N (Cap) 978.63 117,456.26 122,076.14 301.00 87,495.95 34,881.19 0.00 8,664.01 26,217.18
N USD (Cap) 10,817.85 17,697.56 88,489.73 53,410.96 27,523.62 114,377.08 8,648.27 117,813.12 5,212.23
P (Cap) 352.00 3,687.00 8,654.00 538.00 4,378.00 4,814.00 2,223.00 1,372.00 5,665.00
V (Dis) 0.00 0.00 0.00 0.00 0.00 0.00 0.00 0.00 0.00
W (Cap) 998.23 26,260.52 3,579.28 4,091.31 6,658.81 1,011.78 22,408.98 555.35 22,865.40
TOTAL 544,125.71 330,484.52 176,703.21
Payable and receivable amounts for the UCI
EUR 31 December 2019 31 December 2020 31 December 2021
Class Subscriptions Redemptions Subscriptions Redemptions Subscriptions Redemptions
A (Dis) 99,814.21 158,838.60 27,300.00 599,489.06 279,452.68 157,023.50
B (Cap) 2,105,317.39 11,100,771.49 115,374.21 6,228,137.82 6,212,882.26 9,068,172.85
B USD (Cap) 885,727.56 3,115,379.95 351,109.85 6,923,974.28 37,214.75 7,551,357.74
E (Dis) 0.00 0.00 0.00 0.00 0.00 0.00
F (Cap) 1,609,124.09 22,201,397.23 202,659.02 1,147,377.38 71,253,254.93 69,894,169.56
F USD (Cap) 0.00 0.00 0.00 0.00 0.00 0.00
I 0.00 0.00 0.00 0.00 0.00 0.00
J (Cap) 0.00 5,189,777.10 0.00 241,385,325.06 85,083,670.87 757,960.63
L (Cap) 0.00 55,706.04 0.00 28,437.54 0.00 14,202.64
L USD (Cap) 0.00 72,847.35 0.00 0.00 51,008.16 71,584.38
M (Dis) 1,722,204.42 2,304,874.85 125,993.75 3,614,844.27 66,636.00 596,478.50
M USD (Dis) 0.00 0.00 0.00 0.00 0.00 0.00
N (Cap) 125,509.24 13,418,445.10 36,107.96 11,112,868.38 0.00 1,344,838.72
N USD (Cap) 1,274,621.95 2,073,935.69 6,864,560.60 3,148,411.76 1,254,904.07 17,859,052.15
P (Cap) 5,989,444.20 63,328,691.33 8,240,690.75 79,553,759.36 48,447,665.87 32,441,097.69
V (Dis) 0.00 0.00 0.00 0.00 0.00 0.00
W (Cap) 115,788.92 3,073,597.28 482,110.00 791,265.64 3,993,817.21 88,513.44
TOTAL 13,927,551.98 126,094,262.01 16,445,906.14 354,533,890.55 216,680,506.80 139,844,451.80

DPAM CAPITAL B
Equities US Behavioral Value
155
net asset value
EUR 31 December 2019 31 December 2020 31 December 2021
Class of the subfund Per share of the subfund Per share of the subfund Per share
A (Dis)
B (Cap)
B USD (Cap)
E (Dis)
F (Cap)
F USD (Cap)
I
J (Cap)
L (Cap)
L USD (Cap)
M (Dis)
M USD (Dis)
N (Cap)
N USD (Cap)
P (Cap)
V (Dis)
W (Cap)
848,384,029.49
124.45
128.16
144.43
0.00
1,575.68
0.00
0.00
30,328.16
1,499.27
1,623.32
125.32
140.79
129.35
145.56
18,874.58
0.00
131.09
493,410,713.70
123.59
127.81
157.09
0.00
1,580.26
0.00
0.00
30,492.38
1,488.68
0.00
124.28
151.98
129.66
159.12
19,024.28
0.00
131.47
790,182,267.16
169.28
175.21
200.22
0.00
2,180.31
0.00
0.00
42,190.06
2,030.38
0.00
171.37
194.87
178.74
204.00
26,398.37
0.00
181.38
TOTAL 848,384,029.49 493,410,713.70 790,182,267.16
On the date of publication of this report, the net asset value per share is published on the following websites: www.dpamfunds.com and www.beama.be. This information is also available at the counters of the financial services department.

DPAM CAPITAL B
Equities US Behavioral Value
156
7.9. PERFORMANCES
Figures reflect past performance and are not an indicator of future performance. These figures do not include any restructuring. Returns are determined at the end of the financial year. The annual return is defined as the absolute return earned over a year. For the semi-annual report, the accounting year is 12-month period preceding the end of the half-year. From 2011, the calculation of the performance of the capitalization units is calculated similarly to the distribution units. This change is also applied to past performance. This change of method does not bring any significant difference compared to the method used previously. Bar chart showing annual returns of the last 10 years (in % and calculated in EUR) as of 31 December 2021: Class A (Dis) Table showing historical performance (actuarial returns):
Average cumulated returns Since
1 year 3 year 5 year 10 year
Year Value
Class A (Dis) 36.97 % (in EUR)
20.33 % (in EUR)
10.06 % (in EUR)
04/11/2016 12.75 % (in EUR)
Class B (Cap) Annual return:
This is an actively managed sub-fund, which means that the portfolio manager does not aim to replicate the performance of a benchmark. The benchmark is used to compare performance.
14
.2%
32
.0%
28
.3%
6.2
%
14
.1%
3.8
%
-10
.7%
27
.4%
-0.3
%
37
.1%
13
.6%
26
.1%
28
.3%
12
.2%
14
.2%
6.4
%
-0.3
%
33
.3%
10
.8%
36
.1%
-20.00%
-10.00%
0.00%
10.00%
20.00%
30.00%
40.00%
2012 2013 2014 2015 2016 2017 2018 2019 2020 2021
Class B (Cap) MSCI USA Net Return

DPAM CAPITAL B
Equities US Behavioral Value
157
Table showing historical performance (actuarial returns):
Average cumulated returns Since
1 year 3 year 5 year 10 year
Year Value
Class B (Cap) 37.09 % (in EUR)
20.31 % (in EUR)
10.06 % (in EUR)
14.24 % (in EUR)
30/09/2004 8.68 % (in EUR)
Class B USD (Cap) Table showing historical performance (actuarial returns):
Average cumulated returns Since
1 year 3 year 5 year 10 year
Year Value
Class B USD (Cap)
27.46 % (in EUR)
20.16 % (in EUR)
11.76 % (in EUR)
12.77 % (in EUR)
07/12/2007 7.02 % (in EUR)
Class F (Cap) Table showing historical performance (actuarial returns):
Average cumulated returns Since
1 year 3 year 5 year 10 year
Year Value
Class F (Cap) 37.97 % (in EUR)
21.02 % (in EUR)
10.69 % (in EUR)
14.62 % (in EUR)
14/12/2007 9.31 % (in EUR)
Class J (Cap) Table showing historical performance (actuarial returns):
Average cumulated returns Since
1 year 3 year 5 year 10 year
Year Value
Class J (Cap) 38.36 % (in EUR)
21.34 % (in EUR)
12/02/2018 14.09 % (in EUR)
Class L (Cap) Table showing historical performance (actuarial returns):
Average cumulated returns Since
1 year 3 year 5 year 10 year
Year Value
Class L (Cap) 36.39 % (in EUR)
19.76 % (in EUR)
9.54 % (in EUR)
02/06/2014 11.34 % (in EUR)

DPAM CAPITAL B
Equities US Behavioral Value
158
Class L USD (Cap) Table showing historical performance (actuarial returns):
Average cumulated returns Since
1 year 3 year 5 year 10 year
Year Value
Class L USD (Cap)
15/09/2021 5.92 % (in EUR)
Class M (Dis) Table showing historical performance (actuarial returns):
Average cumulated returns Since
1 year 3 year 5 year 10 year
Year Value
Class M (Dis) 37.89 % (in EUR)
20.96 % (in EUR)
29/12/2017 12.24 % (in EUR)
Class M USD (Dis) Table showing historical performance (actuarial returns):
Average cumulated returns Since
1 year 3 year 5 year 10 year
Year Value
Class M USD (Dis)
28.22 % (in EUR)
20.81 % (in EUR)
24/07/2018 12.31 % (in EUR)
Class N (Cap) Table showing historical performance (actuarial returns):
Average cumulated returns Since
1 year 3 year 5 year 10 year
Year Value
Class N (Cap) 37.85 % (in EUR)
20.93 % (in EUR)
29/12/2017 12.22 % (in EUR)
Class N USD (Cap) Table showing historical performance (actuarial returns):
Average cumulated returns Since
1 year 3 year 5 year 10 year
Year Value
Class N USD (Cap)
28.21 % (in EUR)
20.80 % (in EUR)
21/01/2018 12.59 % (in EUR)

DPAM CAPITAL B
Equities US Behavioral Value
159
Class P (Cap) Table showing historical performance (actuarial returns):
Average cumulated returns Since
1 year 3 year 5 year 10 year
Year Value
Class P (Cap) 38.76 % (in EUR)
21.66 % (in EUR)
11.26 % (in EUR)
10/01/2014 12.99 % (in EUR)
Class W (Cap) Table showing historical performance (actuarial returns):
Average cumulated returns Since
1 year 3 year 5 year 10 year
Year Value
Class W (Cap) 37.96 % (in EUR)
21.02 % (in EUR)
9.64 % (in EUR)
15/12/2016 10.08 % (in EUR)

DPAM CAPITAL B
Equities US Behavioral Value
160
7.10. CHARGES Equities US Behavioral Value
Ongoing charges
The ongoing charges, calculated in accordance with the provisions of European Commission Regulation 583/2010 of 1 July 2010. These charges include transaction fees incurred by the sub-fund when it subscribes to and/or sells units of another fund, but do not include either (i) the fees incurred by the sub-fund when it makes investments other than subscriptions/sales of units of funds or, where applicable, (ii) the performance fee These charges are based on the fees charged in fund accounting for one year prior to the end of the period under review. In the event of a change in the cost structure during the financial year or if the share class is issued during the financial year, the amount of the reported current expenses is calculated on the basis of an estimate based on the expected total amount of the annual expenses (which could be determined by comparison with a similar class).
Taking into account the change in the cost structure during the year, the estimated fees are :
- Class A (Dis) - BE6289193045: 1.78 % - Class B (Cap) - BE6278396716: 1.76 % - Class B USD (Cap) - BE6278399744: 1.72 % - Class F (Cap) - BE0947579836: 0.90 % - Class J (Cap) - BE6299540698: 0.50 % - Class L (Cap) - BE0945682293: 2.50 % - Class L USD (Cap) - BE0947583879: 2.50 % - Class M (Dis) - BE6299541704: 0.99 % - Class M USD (Dis) - BE6304435173: 0.90 % - Class N (Cap) - BE6299542710: 0.98 % - Class N USD (Cap) - BE6304436189: 0.90 % - Class P (Cap) - BE6249816099: 0.10 % - Class W (Cap) - BE6289204156: 0.90 % Fee sharing On 31 December 2021, 10.83% of the remuneration due to the manager has been retroceded to other distributors, third parties and Bank Degroof Petercam or one of its subsidiaries.
7.11. NOTES TO THE FINANCIAL STATEMENTS AND OTHER INFORMATION
7.11.1. Gross dividends paid in the financial year
2016/2017 1.04 EUR 2018 class A 2.30 EUR class M 2.45 EUR class M USD 2.47 USD 2019 class A 0.41 EUR class M 1.02 EUR class M USD 1.26 USD
7.11.2. Transparency in sustainability
This information is published in accordance with Article 11 of Regulation (EU) 2019/2088 of 27 November 2019 on sustainability-related disclosures in the financial services sector ("SFDR Regulation"), as amended by Article 25 of Regulation (EU) 2020/852 of 18 June 2020 on the establishment of a framework to promote sustainable investment

DPAM CAPITAL B
Equities US Behavioral Value
161
and amending Regulation (EU) 2019/2088 ("Taxonomy Regulation"), as well as in respect of the Taxonomy Regulation. 1. Extent to which environmental or social characteristics are met A) Sustainability indicators The sub-fund does not aim for sustainable investment but promotes environmental and social aspects within the meaning of the SFDR Regulation. The sustainability indicators used to measure compliance with the environmental or social characteristics promoted by this sub-fund correspond to the binding investment restrictions mentioned in the prospectus. In accordance with these investment restrictions, the sub-fund's portfolio during the period under review had:
a) Zero exposure to issuers deemed non-compliant with the 10 principles of the United Nations Global Compact
(which are part of the Global Standards) at the time the positions were purchased;
b) Zero exposure to issuers involved in controversial activities that meet the exclusion criteria set out in DPAM's
Controversial Activities Policy (available at www.dpamfunds.com), both at the time of purchase of the
positions and during the time the portfolio positions were held;
c) Zero exposure to issuers facing ESG controversies of maximum severity on environmental or social issues at
the time of purchase of the positions;
More information about the indicators and their methodology can be found in the prospectus and on the website www.dpamfunds.com. B) Use of derivatives The sub-fund does not use derivatives, if any are held, for the purpose of promoting environmental and/or social characteristics as described in the prospectus. 2. Statement on the Taxonomy Regulation The investments underlying this product do not take into account the European Union's criteria for environmentally sustainable economic activities.
7.11.3. Transparency of the securities financing transactions and of reuse
In accordance with Article 13 and Section A of the Annex to Regulation EU 2015/2365 (hereinafter the Regulation), the Sicav must inform investors of its use of securities financing transactions and total return swaps in the annual report and the half-yearly report. The portfolio does not contain any loaned assets at the date of this report.
Equities US Behavioral Value
DPAM CAPITAL B
Equities US Dividend Sustainable
162
8. INFORMATION ABOUT THE SUBFUND DPAM CAPITAL B EQUITIES US DIVIDEND SUSTAINABLE
Equities US Dividend Sustainable
8.1. MANAGEMENT REPORT
8.1.1. Launch date of the sub-fund and subscription price of the shares
Initial subscription period: from January 2 to January 4, 2008. Initial subscription price: 100 EUR
8.1.2. Stock exchange listing
The shares of the sub-fund are not listed on an exchange.
8.1.3. Aim and main outlines of the investment policy
The objective of the sub-fund is to provide the shareholders with as high a global return as possible. The sub-fund invests in American listed equities as well as any security giving entitlement to the capital of these companies, selected on the basis of compliance with environmental, social and governance (ESG) criteria. The sub-fund uses a rigorous ESG methodology and strict exclusions in order not to undermine other environmental and social objectives and to ensure the required good governance practices. The risks are widely spread, among others by a broad sector diversification. The allocation of the portfolio will change depending on the assessment of the macroeconomic outlook and the situation on the financial markets. The sub-fund can for example prefer or avoid certain sectors or investment styles based among others on the economic outlook. At least 50% of the portfolio must be composed of equities and other securities referred to above generating a higher actual or expected dividend yield than the market average. This is an actively managed sub-fund, which means that the portfolio manager does not aim to replicate the performance of a benchmark.
8.1.4. Financial management of the portfolio
Degroof Petercam Asset Management S.A. Rue Guimard, 18, 1040 Brussels
8.1.5. Distributor
Degroof Petercam Asset Management S.A. Rue Guimard, 18, 1040 Brussels
8.1.6. Index and benchmark
The sub-fund uses the following index as its benchmark: MSCI USA Net Return. This index is representative of the large- and mid-cap equity market of developed countries (as defined by MSCI and mainly based on the country of incorporation and the country of primary listing of its securities) in the United States. The performance of this index is calculated by reinvesting net dividends (Net Return). This is an actively managed sub-fund, which means that the portfolio manager does not aim to replicate the performance of a benchmark. The benchmark is used for performance comparison purposes.
8.1.7. Policy followed during the year
The fund is investing only in US companies paying a dividend. The strategy is not to invest in companies having the highest dividend yield but to find companies with a growing dividend profile and a sustainable balance sheet and cash flow in order to sustain and grow the dividend even during tougher times.

DPAM CAPITAL B
Equities US Dividend Sustainable
163
The fund is diversified and invested across the main sectors with some industry exclusions related due to ESG concerns (i.e. tobacco, gambling, etc.). The fund has a quantitative best-in-class ESG screening based on third-party data and integrates ESG elements all along the investment process either with both quantitative and qualitative fundamental analysis. After the major transition in 2020 towards a sustainable fund, some incremental improvements have been done this year. The exposure in the energy sector has been reduced during the year with the sale of Oneok and the sector has been completely divested in December with the sale of the remaining refiners Valero and Philips 66. Their exposure and investments in biofuels such as renewable diesel do not compensate enough their legacy refining activities in the traditional US Oil & Gas market. CenterPoint and Eastman Chemicals have also been sold as their sustainable profile is lagging the rest of the portfolio. The main changes have been done in the cyclical sectors. The industrial sector has been reinforced by the addition of AO Smith, leader in water heaters and in water treatment solutions for residential and commercial buildings, OTIS, one of the largest global elevator companies, and Hubbell which is exposed to the electric grid modernization. International Flavors & Fragrances and Sherwin-Williams have been added to increase the exposure in the materials sector. In terms of performance, 2021 has been an excellent year for the fund. The Industrial sector has been again one of the best contributors thanks to the positioning in companies exposed to energy efficiency thematic like Trane, Eaton and the recent addition of AO Smith. The Healthcare sector performed well thanks to Pfizer and the boost from its Covid-19 vaccine and Hill-Rom acquisition by Baxter. The materials sector performed well driven by CF industries, leader in fertilizers, the best pick of this year. The Communication Services sector was the biggest laggard due to the exposure of Activision Blizzard which disappointed due to its social scandals. The good performance of non-paying dividends mega companies like Alphabet, Facebook or Netflix didn’t help neither.
8.1.8. Future policy
The fund will continue to focus on well-established US companies paying a sustainable and growing dividend. We will continue the work on the sustainable profile of the fund with continuous monitoring of the positions but also with engagements with the companies on environmental, social and governance topics and by investing in companies contributing positively for the society.
8.1.9. Synthetic risk and reward indicator
The synthetic risk and return indicator gives an indication of the risk associated with investing in a sub-fund. It places this risk on a scale ranging from one (lowest risk) to seven (highest risk). Risk and Reward Profile: 6 except for classes A USD, B USD, E USD, F USD: 5

DPAM CAPITAL B
Equities US Dividend Sustainable
164
8.2. BALANCE SHEET
31 December 2021
EUR 31 December 2020
EUR
Section 1: Balance Sheet
TOTAL NET ASSETS 492,602,369.32 199,824,802.95
I. Fixed assets
A. Incorporation and organisation expenses B. Intangible assets C. Tangible assets
II. Transferable securities, money market instruments, UCIs and Financial derivatives
486,721,370.19 196,549,128.38
A. Bonds and other debt securities B. Money market instruments C. Shares and other securities similar to shares 486,721,370.19 196,549,128.38 a. Shares 486,721,370.19 196,549,128.38 D. Other transferable securities E. UCI with variable number of shares F. financial derivatives
III. Receivables and payables on more than one year
A. Receivables B. Payables
IV. Receivables and payables up to a year -610,897.41 -240,031.87
A. Receivables 471,822.69 165,386.25 a. Receivables 131,513.63 9,195.66 d. Others 340,309.06 156,190.59 B. Payables -1,082,720.10 -405,418.12 a. Payable amounts (-) -11,479.39 -59,026.92 c. Borrowing (-) -4,744.03 -1,122.44 e. Others (-) -1,066,496.68 -345,268.76
V. Deposits and liquidity 6,491,896.54 3,515,706.44
A. Demand bank deposits 6,491,896.54 3,515,706.44 B. Term bank deposits C. Others
VI. Deferred charges and accrued income
A. Expenses carried forward B. Accrued income C. Accrued expenses (-) D. Income carried forward (-)
TOTAL SHAREHOLDERS’ EQUITY 492,602,369.32 199,824,802.95
A. Capital 346,020,787.63 165,386,368.35 B. Income equalisation 2,297,350.35 -2,924,271.13 C. Retained earnings 34,438,434.60 49,360,118.38 D. Result of the financial year 109,845,796.74 -11,997,412.65
Equities US Dividend Sustaina ble

DPAM CAPITAL B
Equities US Dividend Sustainable
165
31 December 2021
EUR 31 December 2020
EUR
Section 2: Off-balance sheet
I. Collateral (+/-)
A. Collateral (+/-) B. Other collateral
II. Underlying securities of the option contracts and warrants (+)
A. Option contracts and warrants bought B. Option contracts and warrants sold
III. Notional amount of futures contracts (+)
A. Futures contracts bought and Forward contracts B. Futures contracts sold and Forward Contracts
IV. Notional amount of the swap contracts (+)
A. Purchased swap contracts B. Sold swap contracts
V. Notional amount of other financial derivatives (+)
A. Purchased contracts B. Sold contracts
VI. Uncalled amounts on shares
VII. Commitments to resell on account of purchase-repurchase agreements
VIII. Commitments to repurchase on account of purchase-repurchase agreements
IX. Lent financial instruments

DPAM CAPITAL B
Equities US Dividend Sustainable
166
8.3. INCOME STATEMENT
31 December 2021
EUR 31 December 2020
EUR
Section 3: Income and expenditure account
I. Depreciation, capital loss and capital gain 107,149,428.09 -13,864,994.83
A. Bonds and other debt securities
B. Money market instruments
C. Shares and other securities similar to shares 107,392,081.05 -13,709,012.07
a. Shares 107,392,081.05 -13,709,012.07
Realised gain 8,154,022.33 7,678,246.13
Realised loss -1,971,378.15 -27,219,705.25
Unrealised gain and loss 101,209,436.87 5,832,447.05
D. Other Transferable Securities
E. UCI with variable number of shares
F. financial derivatives
G. Receivables, deposits, liquidity and payables
H. Foreign exchange positions and transactions -242,652.96 -155,982.76
a. financial derivatives -108,358.91
ii. Futures and forward contracts -108,358.91
Realised gain and loss -108,358.91
b. Other exchange positions and operations -242,652.96 -47,623.85
iv. Other -242,652.96 -47,623.85
Realised gain and loss -242,652.96 -47,623.85
II. Investment income and expenses 5,737,694.29 3,245,115.67
A. Dividends 6,805,751.32 3,845,170.85
B. Interest (+/-) 6,423.30 5,892.99
b. Deposits and liquidity 6,423.30 5,892.99
Interest on loans (-) -32,220.75 -11,745.43
Swap contracts (+/-)
Withholding tax (-) -1,042,259.58 -594,202.74
Foreign -1,042,259.58 -594,202.74
F. Other investment income
III. Other income 10.00
A. Anti dilution fee 10.00
B. Other
IV. Operating expenses -3,041,335.64 -1,377,533.49
A. Investment transaction and delivery costs (-) -379,903.38 -331,115.15
B. Financial expenses (-)
C. Custodian’s fee (-) -92,443.67 -28,863.30
D. Manager’s fee (-) -2,454,607.55 -1,126,348.55
a. Financial Management of the Portfolio -2,227,211.01 -991,156.29
Class A (Dis) -19,438.86 -11,928.21
Class B (Cap) -562,248.61 -381,222.51
Class B USD (Cap) -343,035.54 -239,504.49
Class E (Dis) -2.58
Class F (Cap) -1,243,890.76 -269,539.70
Class F LC (Cap) -25.23
Class J (Cap) -10,722.83
Class M (Dis) -10,484.25 -51,123.47
Class N (Cap) -19,609.34 -15,582.05
Class V (Dis) -6,488.13 -2,456.15
Class W (Cap) -21,987.71 -9,076.88
b. Administration and accounting -227,396.54 -135,192.26
E. Administrative expenses (-) -42,735.89 -36,464.40
F. Incorporation and organisation expenses (-) -7,346.45 -2,316.39
G. Salaries and wages, social security charges and pensions (-) -485.78 -267.39
H. Services and various goods (-) -27,039.10 -14,407.49
I. Depreciation and provisions for liabilities and charges (-)
J. Taxes -26,928.08 -20,205.18
Class A (Dis) -1,290.83 -432.00
Class B (Cap) -8,732.12 -6,024.36
Class B USD (Cap) -747.22 -647.67
Class E (Dis) -0.05
Class F (Cap) -15,009.08 -8,179.89
Class F LC (Cap) -0.60
Class J (Cap) 43.65
Class M (Dis) -1,073.53 -2,841.66
Class N (Cap) -555.39 -2,110.24
Class P (Cap) 422.22 17.91
Class V (Dis) 15.02 3.31
Class W (Cap) 43.50 -34.23
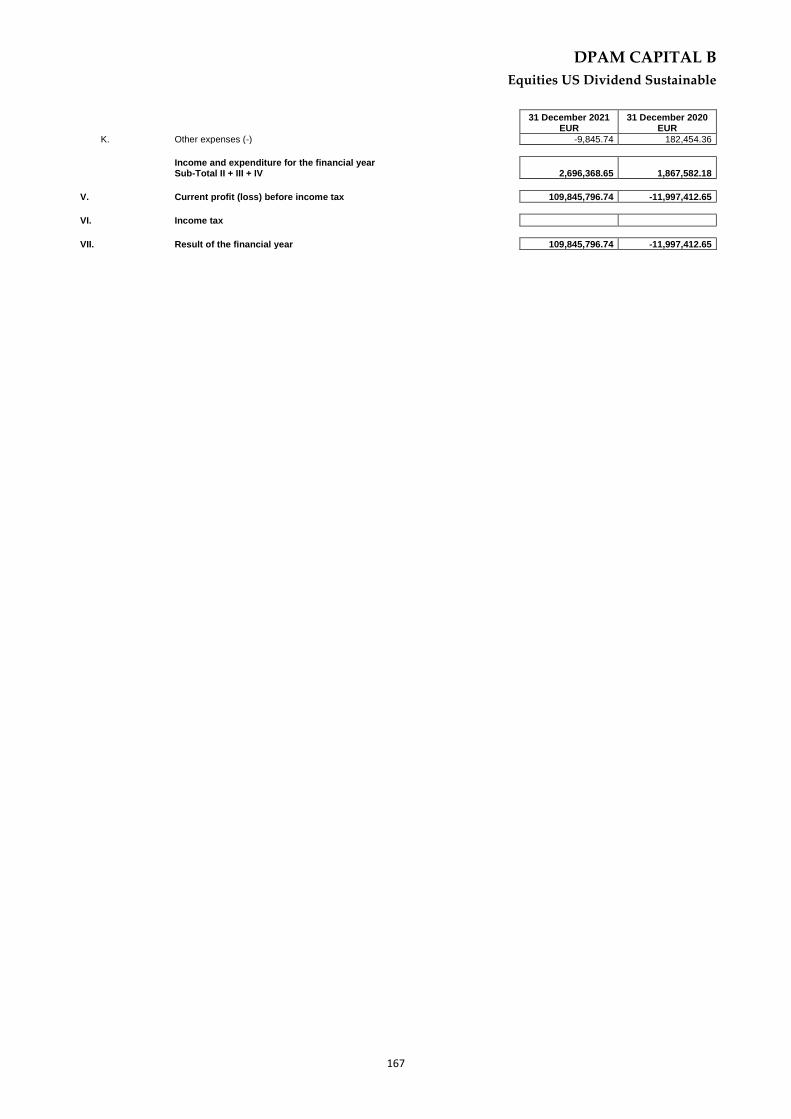
DPAM CAPITAL B
Equities US Dividend Sustainable
167
31 December 2021
EUR 31 December 2020
EUR
K. Other expenses (-) -9,845.74 182,454.36
Income and expenditure for the financial year Sub-Total II + III + IV 2,696,368.65 1,867,582.18
V. Current profit (loss) before income tax 109,845,796.74 -11,997,412.65
VI. Income tax
VII. Result of the financial year 109,845,796.74 -11,997,412.65

DPAM CAPITAL B
Equities US Dividend Sustainable
168
31 December 2021
EUR 31 December 2020
EUR
Section 4: Allocation of the result
I. Profit (Loss) to be allocated 146,581,581.69 34,438,434.60
a. Profit carried forward (Loss carried forward) from the previous period 34,438,434.60 49,360,118.38
b. Profit (loss) of the financial year 109,845,796.74 -11,997,412.65
c. Income equalisation received (Income equalisation paid out) 2,297,350.35 -2,924,271.13
II. (Appropriation to) Deduction from the capital
III. (Profit to be carried forward) Loss to be carried forward -146,535,225.44 -34,438,434.60
IV. Dividend distribution -46,356.25

DPAM CAPITAL B
Equities US Dividend Sustainable
169
8.4. COMPOSITION OF THE ASSETS
Equities US Dividend Sustainable
Description Quantity at
31 December 2021 Currency
Price in currency
Evaluation EUR % by the
UCI %
portfolio % net assets
Transferable securities admitted to an official stock exchange listing
Shares
Switzerland
TE CONNECTIVITY 45,000 USD 161.34 6,384,365.11 1.31% 1.30%
6,384,365.11 1.31% 1.30%
Ireland
ACCENTURE PLC CL A 25,000 USD 414.55 9,113,392.54 1.87% 1.85% EATON CORP -NPV- 45,000 USD 172.82 6,838,638.76 1.41% 1.39% STERIS PLC 22,907 USD 243.41 4,903,089.05 1.01% 1.00% TRANE TECHNOLOGIES 32,000 USD 202.03 5,684,980.65 1.17% 1.15%
26,540,101.00 5.45% 5.39%
United States of America
A.O.SMITH CORP 80,000 USD 85.85 6,039,395.01 1.24% 1.23% ABBOTT LABORATORIES 65,000 USD 140.74 8,044,407.32 1.65% 1.63% ABBVIE 65,000 USD 135.40 7,739,183.96 1.59% 1.57% ACTIVISION BLIZZARD 110,000 USD 66.53 6,435,367.57 1.32% 1.31% AIR PRODUCTS 23,000 USD 304.26 6,153,693.28 1.26% 1.25% ALLSTATE 49,000 USD 117.65 5,069,336.97 1.04% 1.03% AMERICAN EXPRESS 47,000 USD 163.60 6,761,519.52 1.39% 1.37% AMERICAN HOMES 4 REN 115,000 USD 43.61 4,410,086.18 0.91% 0.90% AMGEN 18,477 USD 224.97 3,655,267.93 0.75% 0.74% ANTHEM 19,000 USD 463.54 7,744,688.71 1.59% 1.57% APPLE 172,000 USD 177.57 26,857,228.28 5.52% 5.45% APPLIED MATERIALS 55,000 USD 157.36 7,610,622.58 1.56% 1.54% ASSURANT 25,829 USD 155.86 3,540,017.53 0.73% 0.72% BLACKROCK INC 8,000 USD 915.56 6,440,801.97 1.32% 1.31% BROADCOM INC 16,000 USD 665.41 9,362,082.31 1.92% 1.90% CDW 32,000 USD 204.78 5,762,363.70 1.18% 1.17% CF INDUSTRIES HLDGS 105,000 USD 70.78 6,535,262.05 1.34% 1.33% CISCO 160,000 USD 63.37 8,915,933.87 1.83% 1.81% COMCAST-A 142,000 USD 50.33 6,284,611.33 1.29% 1.28% DIGITAL REALTY 36,000 USD 176.87 5,599,120.65 1.15% 1.14% EMERSON ELECTRIC 78,000 USD 92.97 6,376,767.50 1.31% 1.29% ENTERGY 37,981 USD 112.65 3,762,363.39 0.77% 0.76% FIDELITY NATL INFOR 61,000 USD 109.15 5,854,862.82 1.20% 1.19% GENTEX CORP 165,000 USD 34.85 5,056,498.42 1.04% 1.03% GILEAD SCIENCES 72,975 USD 72.61 4,659,439.63 0.96% 0.95% HASBRO 60,000 USD 101.78 5,370,031.66 1.10% 1.09% HUBBELL 26,000 USD 208.27 4,761,712.98 0.98% 0.97% HUNTINGTON BANCSHARE 340,000 USD 15.42 4,610,270.84 0.95% 0.94% INSPERITY INC 45,723 USD 118.11 4,748,807.18 0.98% 0.96% INTEL 126,974 USD 51.50 5,750,229.51 1.18% 1.17% INTL FLAVORS-FRAGR 50,000 USD 150.65 6,623,724.94 1.36% 1.34% JPMORGAN CHASE 60,000 USD 158.35 8,354,730.92 1.72% 1.70% J WILEY SONS A 115,000 USD 57.27 5,791,461.48 1.19% 1.18% LOWE 34,000 USD 258.48 7,728,033.77 1.59% 1.57% MCCORMIC CO INC 65,000 USD 96.61 5,522,027.79 1.13% 1.12% MCDONALD 34,000 USD 268.07 8,014,755.54 1.65% 1.63% MERCK AND CO INC 109,000 USD 76.64 7,345,902.22 1.51% 1.49% METLIFE 69,848 USD 62.49 3,838,200.42 0.79% 0.78% MICROSOFT 90,000 USD 336.32 26,616,953.92 5.47% 5.40% MORGAN STANLEY 70,000 USD 98.16 6,042,208.93 1.24% 1.23% MOTOROLA SOLTN 23,943 USD 271.70 5,720,465.27 1.18% 1.16% MSC INDL DIRECT-A 75,000 USD 84.06 5,543,879.70 1.14% 1.13% NASDAQ INC 33,000 USD 210.01 6,094,205.07 1.25% 1.24% NEXTERA ENERGY INC 91,000 USD 93.36 7,470,770.31 1.53% 1.52% ORACLE 74,504 USD 87.21 5,713,589.38 1.17% 1.16% OTS WORLDWIDE CORP 70,000 USD 87.07 5,359,567.36 1.10% 1.09% PEPSICO 57,000 USD 173.71 8,706,885.33 1.79% 1.77%

DPAM CAPITAL B
Equities US Dividend Sustainable
170
Description Quantity at
31 December 2021 Currency
Price in currency
Evaluation EUR % by the
UCI %
portfolio % net assets
PFIZER 180,000 USD 59.05 9,346,640.87 1.92% 1.90% PNC 26,515 USD 200.52 4,675,332.22 0.96% 0.95% PROCTER 72,000 USD 163.58 10,356,806.19 2.13% 2.10% PROLOGIS 42,000 USD 168.36 6,218,009.15 1.28% 1.26% RESMED INC 25,000 USD 260.48 5,726,345.41 1.18% 1.16% SEMPRA 40,000 USD 132.28 4,652,831.52 0.96% 0.94% SHERWIN-WILLIAMS CO 19,000 USD 352.16 5,883,784.73 1.21% 1.19% TARGET CORP 32,000 USD 231.44 6,512,557.16 1.34% 1.32% TELEPHONE DATA SYST 265,000 USD 20.15 4,695,524.09 0.96% 0.95% TEXAS 45,000 USD 188.47 7,457,922.97 1.53% 1.51% TJX COS INC 100,000 USD 75.92 6,676,046.43 1.37% 1.36% TYSON FOODS 52,100 USD 87.16 3,993,172.70 0.82% 0.81% UNITEDHEALTH 25,000 USD 502.14 11,038,955.33 2.27% 2.24% UNITED PARCEL 40,000 USD 214.34 7,539,219.13 1.55% 1.53% VERIZON 140,000 USD 51.96 6,396,763.98 1.31% 1.30% VF CORP 87,000 USD 73.22 5,601,600.42 1.15% 1.14% WASTE 47,000 USD 166.90 6,897,907.14 1.42% 1.40% WYNDHAM HOTELS 65,630 USD 89.65 5,173,873.99 1.06% 1.05% ZIONS BANCORPORATION 82,000 USD 63.16 4,554,273.65 0.94% 0.92%
453,796,904.08 93.24% 92.12%
Total - Shares 486,721,370.19 100.00% 98.81%
Total - Transferable securities admitted to an official stock exchange listing
486,721,370.19 100.00% 98.81%
Total - portfolio 486,721,370.19 100.00% 98.81%
Collatéral 0.00 0.00%
Deposits and liquid assets
deposit and liquid assets
Banque Degroof Petercam USD 82,320.44 0.02%
Banque Degroof Petercam EUR 6,409,576.10 1.30%
Total - deposit and liquid assets 6,491,896.54 1.32%
Total - Deposits and liquid assets 6,491,896.54 1.32%
Other receivables and other payables -610,897.41 -0.12%
Others 0.00 0.00%
Total net assets 492,602,369.32 100,00%
Equities US Dividend Sustainable

DPAM CAPITAL B
Equities US Dividend Sustainable
171
8.5. GEOGRAPHIC ALLOCATION OF INVESTMENTS
By country % Portfolio
UNITED STATES OF AMERICA 93.24%
IRELAND 5.45%
SWITZERLAND 1.31%
Total 100.00%
These allocations of assets were established on basis of data (gross) used by the entity responsible for the administration and bookkeeping and do not reflect inevitably the economic analysis which directed the assets selection.

DPAM CAPITAL B
Equities US Dividend Sustainable
172
8.6. ECONOMIC ALLOCATION OF INVESTMENTS
By sector % Portfolio
PHARMACOLOGY & PERSONAL CARE 10.22%
IT & INTERNET 9.17%
TELECOMMUNICATIONS 8.97%
BANKS 7.27%
MISCELLANEOUS CONSUMER GOODS 6.39%
RETAIL TRADING, DEPARTMENT STORES 5.44%
INFORMATION, TECHNOLOGY & COPIERS 4.94%
FINANCIAL SERVICES - HOLDINGS 4.78%
ELECTRIC & ELECTRONIC COMPONANTS 4.28%
HEALTH CARE & SERVICES 3.86%
CHEMICAL PRODUCTS 3.82%
FOOD & CLEANING MATERIALS 3.74%
REAL ESTATE 3.33%
ENERGY SOURCES 3.26%
LEISURES & TOURISM 2.71%
MECHANICAL CONSTRUCTION 2.57%
INSURANCE COMPANIES 2.56%
ELECTRIC & ELECTRONIC MATERIALS 2.29%
ROAD VEHICLES 2.28%
BIOTECHNOLOGY 1.71%
ROAD & RAILWAY TRANSPORTS 1.55%
UTILITIES 1.42%
PUBLISHING & BROADCASTING 1.19%
TEXTILE & GARMENTS 1.15%
AEROSPACE INDUSTRY & DEFENCE 1.10%
TOTAL 100.00%
These allocations of assets were established on basis of data (gross) used by the entity responsible for the administration and bookkeeping and do not reflect inevitably the economic analysis which directed the assets selection.
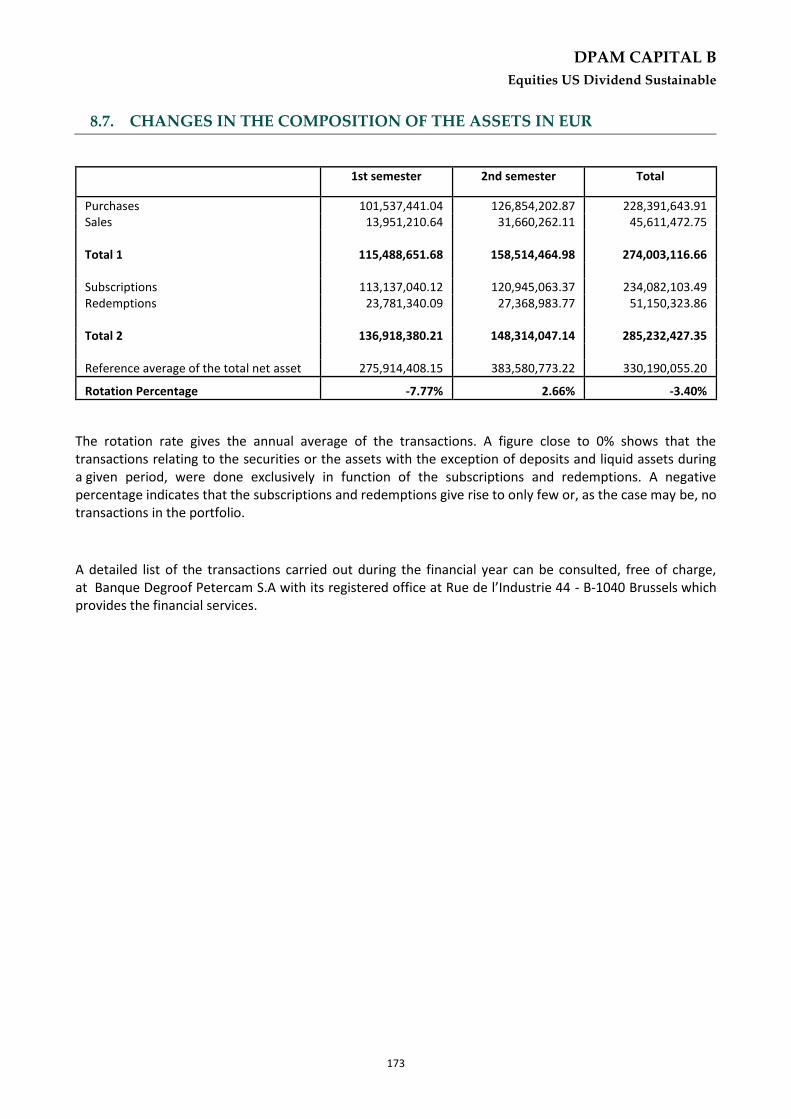
DPAM CAPITAL B
Equities US Dividend Sustainable
173
8.7. CHANGES IN THE COMPOSITION OF THE ASSETS IN EUR Equities US Dividend Sustainable
1st semester 2nd semester Total
Purchases 101,537,441.04 126,854,202.87 228,391,643.91 Sales 13,951,210.64 31,660,262.11 45,611,472.75 Total 1 115,488,651.68 158,514,464.98 274,003,116.66 Subscriptions 113,137,040.12 120,945,063.37 234,082,103.49 Redemptions 23,781,340.09 27,368,983.77 51,150,323.86 Total 2 136,918,380.21 148,314,047.14 285,232,427.35 Reference average of the total net asset 275,914,408.15 383,580,773.22 330,190,055.20
Rotation Percentage -7.77% 2.66% -3.40%
The rotation rate gives the annual average of the transactions. A figure close to 0% shows that the transactions relating to the securities or the assets with the exception of deposits and liquid assets during a given period, were done exclusively in function of the subscriptions and redemptions. A negative percentage indicates that the subscriptions and redemptions give rise to only few or, as the case may be, no transactions in the portfolio.
A detailed list of the transactions carried out during the financial year can be consulted, free of charge, at Banque Degroof Petercam S.A with its registered office at Rue de l’Industrie 44 - B-1040 Brussels which provides the financial services.

DPAM CAPITAL B
Equities US Dividend Sustainable
174
8.8. EVOLUTION OF SUBSCRIPTIONS, REDEMPTIONS AND THE NET ASSET
VALUE Equities US Dividend Sustainable
Evolution of the number of shares in circulation
31 December 2019 31 December 2020 31 December 2021
Class Subscriptions Redemptions End of Period Subscriptions Redemptions End of Period Subscriptions Redemptions End of Period
A (Dis) 2,832.19 1,809.00 3,783.96 1,510.53 2,119.00 3,175.49 2,638.74 466.95 5,347.28
B (Cap) 26,973.13 50,545.18 123,782.38 24,762.22 30,786.99 117,757.60 23,227.73 20,858.59 120,126.75
B USD (Cap) 8,632.39 25,078.09 77,587.04 9,830.57 16,931.25 70,486.37 6,979.49 5,327.47 72,138.40
E (Dis) 0.00 0.00 0.00 0.00 0.00 0.00 1.00 0.00 1.00
F (Cap) 83,025.09 159,520.10 191,337.53 257,700.51 113,559.07 335,478.97 388,056.33 60,266.25 663,269.05
F LC (Cap) 0.00 0.00 0.00 0.00 1,286.67 286.67 1,000.00
F USD (Cap) 0.00 0.00 0.00 0.00 0.00 0.00 0.00 0.00 0.00
I 0.00 0.00 0.00 0.00 0.00 0.00 0.00 0.00 0.00
M (Dis) 28,330.35 2,264.00 36,267.49 5,820.61 31,423.42 10,664.68 200.00 8,201.53 2,663.16
N (Cap) 57.95 3,584.81 12,073.77 5,965.96 10,177.73 7,862.00 3,634.22 2,217.31 9,278.91
P (Cap) 183.00 248.00 930.00 722.00 1,476.00 176.00 1,162.00 244.00 1,094.00
V (Dis) 2,621.00 1,271.00 1,350.00 695.00 300.00 1,745.00 4,256.00 28.00 5,973.00
W (Cap) 2,828.95 431.52 2,446.43 8,457.23 6,126.62 4,777.04 11,869.12 1,880.79 14,765.37
TOTAL 449,752.21 552,123.16 895,656.91
Payable and receivable amounts for the UCI
EUR 31 December 2019 31 December 2020 31 December 2021
Class Subscriptions Redemptions Subscriptions Redemptions Subscriptions Redemptions
A (Dis) 825,978.38 526,511.19 467,667.37 642,457.86 1,041,996.48 184,073.49
B (Cap) 8,315,198.75 15,572,630.43 7,967,073.15 9,889,369.64 9,601,225.70 8,360,340.54
B USD (Cap) 2,692,935.70 7,603,284.32 3,189,748.26 5,297,103.01 2,845,929.92 2,148,473.08
E (Dis) 0.00 0.00 0.00 0.00 344.30 0.00
F (Cap) 27,210,554.72 50,178,266.85 89,541,855.89 35,910,156.50 166,500,999.55 26,343,296.46
F LC (Cap) 0.00 0.00 6,637.11 1,711.76
F USD (Cap) 0.00 0.00 0.00 0.00 0.00 0.00
I 0.00 0.00 0.00 0.00 0.00 0.00
M (Dis) 8,199,426.11 687,372.29 1,916,140.02 9,835,537.41 72,244.00 3,033,418.04
N (Cap) 20,328.62 1,104,481.99 2,059,277.04 3,327,683.43 1,581,676.36 924,129.99
P (Cap) 5,769,985.22 7,623,514.80 22,844,758.70 42,153,711.73 45,429,529.69 9,345,877.10
V (Dis) 784,471.43 376,775.24 207,972.52 87,408.00 1,822,745.64 10,454.36
W (Cap) 900,697.09 144,250.61 2,694,939.50 2,069,819.24 5,178,774.74 798,549.04
TOTAL 54,719,576.02 83,817,087.72 130,889,432.45 109,213,246.82 234,082,103.49 51,150,323.86
net asset value
EUR 31 December 2019 31 December 2020 31 December 2021
Class of the subfund Per share of the subfund Per share of the subfund Per share
A (Dis)
B (Cap)
B USD (Cap)
E (Dis)
F (Cap)
F LC (Cap)
F USD (Cap)
I
M (Dis)
N (Cap)
P (Cap)
V (Dis)
W (Cap)
196,581,740.86
333.85
348.69
392.93
0.00
356.52
0.00
0.00
0.00
334.70
351.71
34,814.11
334.81
351.26
199,824,802.95
329.15
345.29
424.18
0.00
354.84
0.00
0.00
0.00
329.83
349.88
34,826.93
329.63
349.63
492,602,369.32
456.65
479.31
547.35
459.33
495.46
6.15
0.00
0.00
460.31
488.49
48,914.10
460.30
488.23
TOTAL 196,581,740.86 199,824,802.95 492,602,369.32
On the date of publication of this report, the net asset value per share is published on the following websites: www.dpamfunds.com and www.beama.be. This information is also available at the counters of the financial services department.

DPAM CAPITAL B
Equities US Dividend Sustainable
175
8.9. PERFORMANCES
Figures reflect past performance and are not an indicator of future performance. These figures do not include any restructuring. Returns are determined at the end of the financial year. The annual return is defined as the absolute return earned over a year. For the semi-annual report, the accounting year is 12-month period preceding the end of the half-year. From 2011, the calculation of the performance of the capitalization units is calculated similarly to the distribution units. This change is also applied to past performance. This change of method does not bring any significant difference compared to the method used previously. Bar chart showing annual returns of the last 10 years (in % and calculated in EUR) as of 31 December 2021: Class A (Dis) Table showing historical performance (actuarial returns):
Average cumulated returns Since
1 year 3 year 5 year 10 year
Year Value
Class A (Dis) 38.74 % (in EUR)
21.77 % (in EUR)
12.85 % (in EUR)
27/10/2016 14.48 % (in EUR)
Class B (Cap) Annual return:
This is an actively managed sub-fund, which means that the portfolio manager does not aim to replicate the performance of a benchmark. The benchmark is used to compare performance.
12
.9%
31
.1%
25
.8%
10
.4%
19
.0%
3.5
%
-2.1
%
31
.5%
-1.0
%
38
.8%
13
.6%
26
.1%
28
.3%
12
.2%
14
.2%
6.4
%
-0.3
%
33
.3%
10
.8%
36
.1%
-5.00%
0.00%
5.00%
10.00%
15.00%
20.00%
25.00%
30.00%
35.00%
40.00%
45.00%
2012 2013 2014 2015 2016 2017 2018 2019 2020 2021
Class B (Cap) MSCI USA Net Return

DPAM CAPITAL B
Equities US Dividend Sustainable
176
Table showing historical performance (actuarial returns):
Average cumulated returns Since
1 year 3 year 5 year 10 year
Year Value
Class B (Cap) 38.81 % (in EUR)
21.82 % (in EUR)
12.87 % (in EUR)
16.19 % (in EUR)
16/05/2008 12.19 % (in EUR)
Class B USD (Cap) Table showing historical performance (actuarial returns):
Average cumulated returns Since
1 year 3 year 5 year 10 year
Year Value
Class B USD (Cap)
29.04 % (in EUR)
21.63 % (in EUR)
14.61 % (in EUR)
06/10/2016 12.47 % (in EUR)
Class E (Dis) Table showing historical performance (actuarial returns):
Average cumulated returns Since
1 year 3 year 5 year 10 year
Year Value
Class E (Dis) 05/02/2021 33.33 % (in EUR)
Class F (Cap) Table showing historical performance (actuarial returns):
Average cumulated returns Since
1 year 3 year 5 year 10 year
Year Value
Class F (Cap) 39.63 % (in EUR)
22.48 % (in EUR)
13.43 % (in EUR)
16.54 % (in EUR)
16/05/2008 12.48 % (in EUR)
Class F LC (Cap) Table showing historical performance (actuarial returns):
Average cumulated returns Since
1 year 3 year 5 year 10 year
Year Value
Class F LC (Cap) 08/04/2021 4.79 % (in EUR)
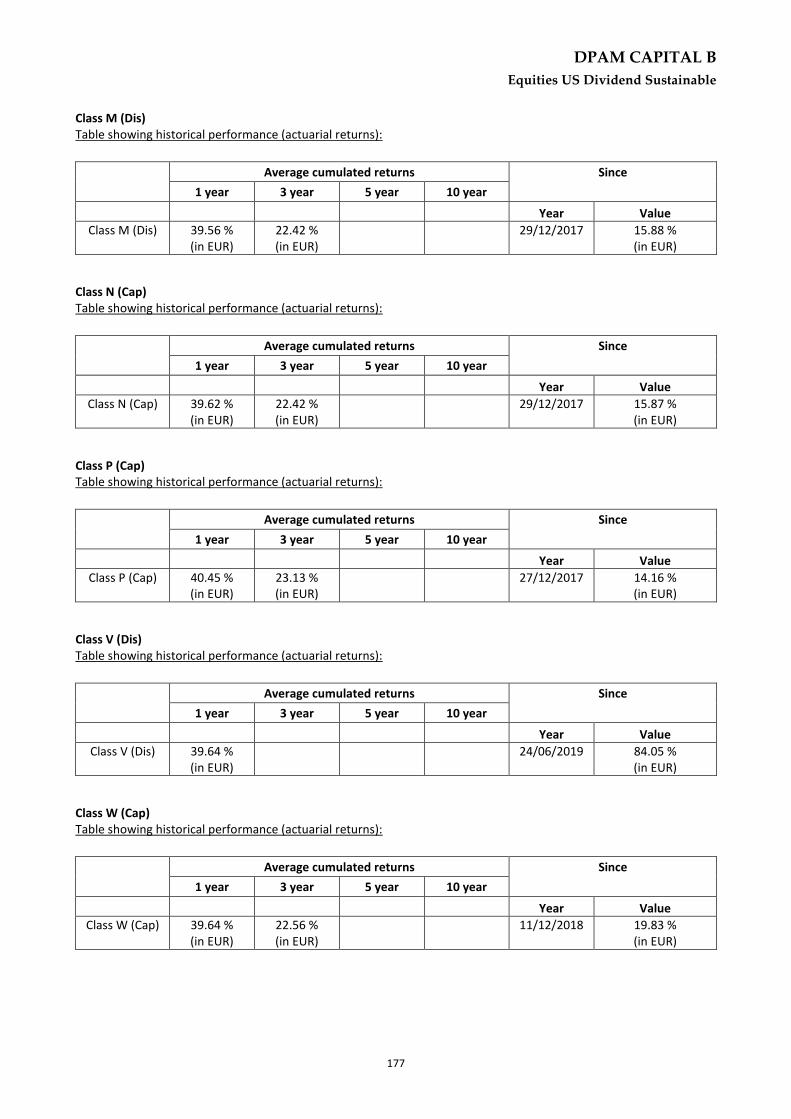
DPAM CAPITAL B
Equities US Dividend Sustainable
177
Class M (Dis) Table showing historical performance (actuarial returns):
Average cumulated returns Since
1 year 3 year 5 year 10 year
Year Value
Class M (Dis) 39.56 % (in EUR)
22.42 % (in EUR)
29/12/2017 15.88 % (in EUR)
Class N (Cap) Table showing historical performance (actuarial returns):
Average cumulated returns Since
1 year 3 year 5 year 10 year
Year Value
Class N (Cap) 39.62 % (in EUR)
22.42 % (in EUR)
29/12/2017 15.87 % (in EUR)
Class P (Cap) Table showing historical performance (actuarial returns):
Average cumulated returns Since
1 year 3 year 5 year 10 year
Year Value
Class P (Cap) 40.45 % (in EUR)
23.13 % (in EUR)
27/12/2017 14.16 % (in EUR)
Class V (Dis) Table showing historical performance (actuarial returns):
Average cumulated returns Since
1 year 3 year 5 year 10 year
Year Value
Class V (Dis) 39.64 % (in EUR)
24/06/2019 84.05 % (in EUR)
Class W (Cap) Table showing historical performance (actuarial returns):
Average cumulated returns Since
1 year 3 year 5 year 10 year
Year Value
Class W (Cap) 39.64 % (in EUR)
22.56 % (in EUR)
11/12/2018 19.83 % (in EUR)
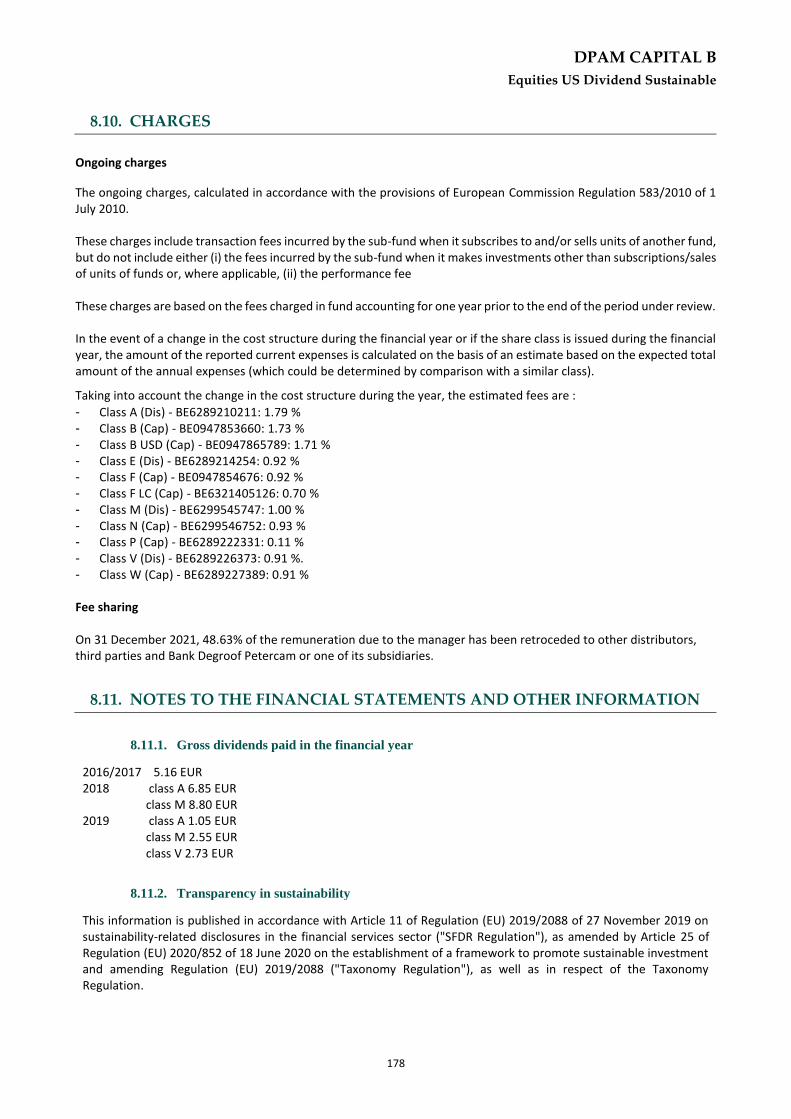
DPAM CAPITAL B
Equities US Dividend Sustainable
178
8.10. CHARGES Equities US Dividend Sustainable
Ongoing charges
The ongoing charges, calculated in accordance with the provisions of European Commission Regulation 583/2010 of 1 July 2010. These charges include transaction fees incurred by the sub-fund when it subscribes to and/or sells units of another fund, but do not include either (i) the fees incurred by the sub-fund when it makes investments other than subscriptions/sales of units of funds or, where applicable, (ii) the performance fee These charges are based on the fees charged in fund accounting for one year prior to the end of the period under review. In the event of a change in the cost structure during the financial year or if the share class is issued during the financial year, the amount of the reported current expenses is calculated on the basis of an estimate based on the expected total amount of the annual expenses (which could be determined by comparison with a similar class).
Taking into account the change in the cost structure during the year, the estimated fees are :
- Class A (Dis) - BE6289210211: 1.79 % - Class B (Cap) - BE0947853660: 1.73 % - Class B USD (Cap) - BE0947865789: 1.71 % - Class E (Dis) - BE6289214254: 0.92 % - Class F (Cap) - BE0947854676: 0.92 % - Class F LC (Cap) - BE6321405126: 0.70 % - Class M (Dis) - BE6299545747: 1.00 % - Class N (Cap) - BE6299546752: 0.93 % - Class P (Cap) - BE6289222331: 0.11 % - Class V (Dis) - BE6289226373: 0.91 %. - Class W (Cap) - BE6289227389: 0.91 % Fee sharing On 31 December 2021, 48.63% of the remuneration due to the manager has been retroceded to other distributors, third parties and Bank Degroof Petercam or one of its subsidiaries.
8.11. NOTES TO THE FINANCIAL STATEMENTS AND OTHER INFORMATION
8.11.1. Gross dividends paid in the financial year
2016/2017 5.16 EUR 2018 class A 6.85 EUR class M 8.80 EUR 2019 class A 1.05 EUR class M 2.55 EUR class V 2.73 EUR
8.11.2. Transparency in sustainability
This information is published in accordance with Article 11 of Regulation (EU) 2019/2088 of 27 November 2019 on sustainability-related disclosures in the financial services sector ("SFDR Regulation"), as amended by Article 25 of Regulation (EU) 2020/852 of 18 June 2020 on the establishment of a framework to promote sustainable investment and amending Regulation (EU) 2019/2088 ("Taxonomy Regulation"), as well as in respect of the Taxonomy Regulation.

DPAM CAPITAL B
Equities US Dividend Sustainable
179
1. Extent to which environmental or social characteristics are met This sub-fund invests at least 90% of its assets (excluding cash, undertaking for collective investment and derivatives) in securities that meet the environmental and social criteria it promotes. 20% of these assets will also pursue a sustainable investment objective, as defined by the SFDR Regulation. A) Sustainability indicators The sustainability indicators used to measure compliance with the environmental or social characteristics promoted by this sub-fund correspond to the binding investment restrictions mentioned in the prospectus. In accordance with these investment restrictions, the sub-fund's portfolio during the period under review had:
a) Zero exposure to issuers deemed non-compliant with the 10 principles of the United Nations Global Compact
(which are part of the Global Standards) at the time the positions were purchased;
In the event that a company's ESG profile deteriorated during the course of the portfolio holding, leading it
to be downgraded to Global Compact non-compliant status, the relevant investment has been sold in the
interest of the sub-fund's shareholders within three months.
b) Zero exposure to issuers involved in controversial activities that meet the exclusion criteria set out in DPAM's
Controversial Activities Policy (available at www.dpamfunds.com), both at the time of purchase of the
positions and during the time the portfolio positions were held;
c) Zero exposure to issuers facing major ESG controversies on environmental or social issues at the time of
purchase of the positions;
In the event of a major controversy concerning a company during the course of the portfolio holding, the
investment concerned was sold in the interest of the sub-fund's shareholders within three months.
d) Zero exposure to companies in the bottom quartile of the economic sector ranking based on the quality of
the ESG profile assessed by the non-financial rating agencies;
e) A carbon intensity (direct scope 1 and 2 emissions) below the average carbon intensity of the reference
universe before the ESG and sustainable investment selection methodology was applied;
f) A lower average ESG profile risk than the reference universe before the ESG and sustainable investment
selection methodology was applied;
In order to achieve the sustainable objective of a portion of the investments, over the period 10 March 2021 to 31 December 2021, a minimum of 20% of the companies in which the portfolio was invested made a net positive contribution to sustainable development objectives. The net impact contribution is the difference between the positive and negative impact contributions and is calculated at the level of the invested company and the overall portfolio. Based on the UN SDG framework, the impact contribution takes into account both (1) the extent to which the products and services of the invested company contribute to the achievement of the SDGs and (2) the negative impacts associated with their activities along the value chain. More information about the indicators and their methodology can be found in the prospectus and on the website www.dpamfunds.com.

DPAM CAPITAL B
Equities US Dividend Sustainable
180
B) Use of derivatives The sub-fund does not use derivatives, if any are held, for the purpose of promoting environmental and/or social characteristics as described in the prospectus. 2. Statement on the Taxonomy Regulation The investments underlying this product do not take into account the European Union's criteria for environmentally sustainable economic activities.
8.11.3. Transparency of the securities financing transactions and of reuse
In accordance with Article 13 and Section A of the Annex to Regulation EU 2015/2365 (hereinafter the Regulation), the Sicav must inform investors of its use of securities financing transactions and total return swaps in the annual report and the half-yearly report. The portfolio does not contain any loaned assets at the date of this report.
Equities US Dividend Sustainable

DPAM CAPITAL B
Equities US Index
181
9. INFORMATION ABOUT THE SUBFUND DPAM CAPITAL B EQUITIES US INDEX
Equities US Index
9.1. MANAGEMENT REPORT
9.1.1. Launch date of the sub-fund and subscription price of the shares
Initial subscription day: March 28, 1996 Initial subscription price: EUR 1 239.47 Class B shares were divided by 10 on March 31, 2005 and by 6 on July 30, 2015.
9.1.2. Stock exchange listing
The shares of the sub-fund are not listed on an exchange.
9.1.3. Aim and main outlines of the investment policy
The objective of the sub-fund is to provide shareholders with as high a global return as possible, with an accent on investments in U.S. equities. This is a passively managed sub-fund, which means that the portfolio manager's objective is to replicate the performance of a benchmark.
9.1.4. Financial management of the portfolio
Degroof Petercam Asset Management S.A. Rue Guimard, 18, 1040 Brussels
9.1.5. Distributor
Degroof Petercam Asset Management S.A. Rue Guimard, 18, 1040 Brussels
9.1.6. Index and benchmark
The sub-fund uses the following index as its benchmark: MSCI USA Net Return. This index is representative of the large- and mid-cap equity market of developed countries (as defined by MSCI and mainly based on the country of incorporation and the country of primary listing of its securities) in the United States. The performance of this index is calculated by reinvesting net dividends (Net Return). The tracking error is about 1.5%. This is an actively managed sub-fund, which means that the portfolio manager does not aim to replicate the performance of a benchmark. The benchmark is used for performance comparison purposes.
9.1.7. Policy followed during the year
The “Net Asset Value” of the fund (B share) on December 31, 2021 was 230.41 EUR and its performance between December 31, 2020 and December 31, 2021 is 35.39% (in EUR). The benchmark of the Equities US Index sub-fund is the MSCI Daily Net Total Return USA Euro index. The MSCI Daily Net Total Return USA Euro, dividends net of local withholding tax reinvested, covers the United States and is established by MSCI. As of December 31, 2021, the index had 628 positions. The index value can be viewed on MSCI's website, www.msci.com/end-of-day-data-search. The composition of its indices can be viewed on the MSCI’s website, www.msci.com/constituents.

DPAM CAPITAL B
Equities US Index
182
The objective of the fund is to physically and fully replicate the composition of the underlying index (MSCI USA). As in the past, full investment continued in this compartment. The level of cash, after deduction of futures contracts on stock market indices, was kept at a very low level. The use of futures on the S&P 500 index supplemented positions in equities and allowed to be fully invested through liquid instruments without disrupting the portfolio structure during daily subscriptions and redemptions.
9.1.8. Future policy
As in the past, the Equities USA Index sub-fund will pursue an investment policy based on geographic and sector indexation. The benchmark remains the USA index published by MSCI.
9.1.9. Synthetic risk and reward indicator
The synthetic risk and return indicator gives an indication of the risk associated with investing in a sub-fund. It places this risk on a scale ranging from one (lowest risk) to seven (highest risk). Risk and Reward Profile: 6

DPAM CAPITAL B
Equities US Index
183
9.2. BALANCE SHEET
31 December 2021
EUR 31 December 2020
EUR
Section 1: Balance Sheet
TOTAL NET ASSETS 285,804,330.46 260,611,496.71
I. Fixed assets
A. Incorporation and organisation expenses B. Intangible assets C. Tangible assets
II. Transferable securities, money market instruments, UCIs and Financial derivatives
284,693,050.13 260,295,481.94
A. Bonds and other debt securities B. Money market instruments C. Shares and other securities similar to shares 284,587,545.38 260,154,143.21 a. Shares 284,587,545.38 260,154,143.21 D. Other transferable securities E. UCI with variable number of shares 105,504.75 141,338.73 F. financial derivatives
III. Receivables and payables on more than one year
A. Receivables B. Payables
IV. Receivables and payables up to a year -194,245.12 -251,700.20
A. Receivables 305,825.23 192,694.77 a. Receivables 133,033.41 51,616.50 d. Others 172,791.82 141,078.27 B. Payables -500,070.35 -444,394.97 a. Payable amounts (-) -83,675.44 -11,640.96 c. Borrowing (-) -167.14 -75.77 e. Others (-) -416,227.77 -432,678.24
V. Deposits and liquidity 1,305,525.45 567,714.97
A. Demand bank deposits 1,305,525.45 567,714.97 B. Term bank deposits C. Others
VI. Deferred charges and accrued income
A. Expenses carried forward B. Accrued income C. Accrued expenses (-) D. Income carried forward (-)
TOTAL SHAREHOLDERS’ EQUITY 285,804,330.46 260,611,496.71
A. Capital -89,513,069.98 -47,680,931.56 B. Income equalisation -6,653,365.18 -17,267,831.22 C. Retained earnings 308,292,428.27 321,201,136.74 D. Result of the financial year 73,678,337.35 4,359,122.75
Equities US Index
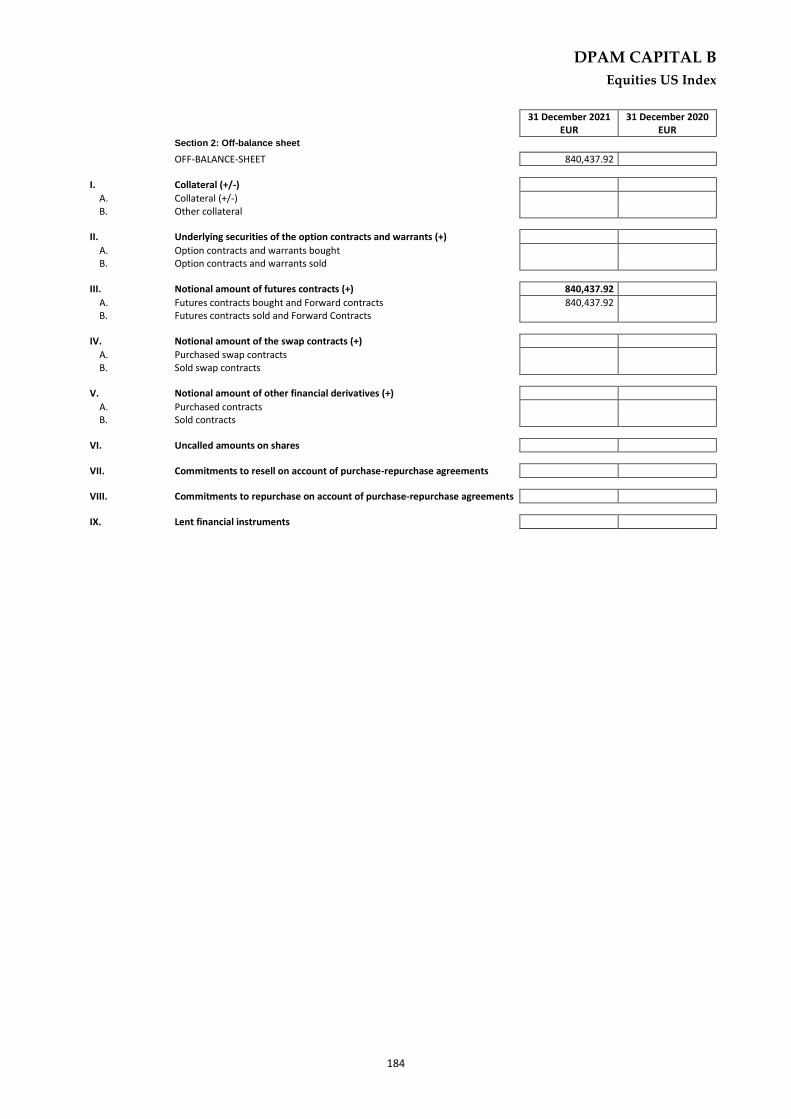
DPAM CAPITAL B
Equities US Index
184
31 December 2021
EUR 31 December 2020
EUR
Section 2: Off-balance sheet
OFF-BALANCE-SHEET 840,437.92
I. Collateral (+/-)
A. Collateral (+/-) B. Other collateral
II. Underlying securities of the option contracts and warrants (+)
A. Option contracts and warrants bought B. Option contracts and warrants sold
III. Notional amount of futures contracts (+) 840,437.92
A. Futures contracts bought and Forward contracts 840,437.92 B. Futures contracts sold and Forward Contracts
IV. Notional amount of the swap contracts (+)
A. Purchased swap contracts B. Sold swap contracts
V. Notional amount of other financial derivatives (+)
A. Purchased contracts B. Sold contracts
VI. Uncalled amounts on shares
VII. Commitments to resell on account of purchase-repurchase agreements
VIII. Commitments to repurchase on account of purchase-repurchase agreements
IX. Lent financial instruments

DPAM CAPITAL B
Equities US Index
185
9.3. INCOME STATEMENT
31 December 2021
EUR 31 December 2020
EUR
Section 3: Income and expenditure account
I. Depreciation, capital loss and capital gain 72,051,028.51 -1,607,753.91
A. Bonds and other debt securities
B. Money market instruments
C. Shares and other securities similar to shares 72,047,782.49 -3,219,454.43
a. Shares 72,047,782.49 -3,219,454.43
Realised gain 22,936,678.23 65,914,322.73
Realised loss -7,179,139.51 -93,812,448.22
Unrealised gain and loss 56,290,243.77 24,678,671.06
D. Other Transferable Securities 3,404.35
Realised gain 3,404.35
E. UCI with variable number of shares 45,377.39 -44,020.19
Realised gain 32,884.72
Realised loss -22,797.54 -31,027.60
Unrealised gain and loss 68,174.93 -45,877.31
F. financial derivatives 20,323.14 82,890.78
l. On financial indexes 20,323.14 82,890.78
ii. Futures 20,323.14 82,890.78
Realised gain and loss 24,983.71 82,890.78
Unrealised gain and loss -4,660.57
G. Receivables, deposits, liquidity and payables
H. Foreign exchange positions and transactions -62,454.51 1,569,425.58
a. financial derivatives 3,490.14
ii. Futures and forward contracts 3,490.14
Realised gain and loss 3,490.14
b. Other exchange positions and operations -62,454.51 1,565,935.44
iv. Other -62,454.51 1,565,935.44
Realised gain and loss -62,454.51 1,565,935.44
II. Investment income and expenses 2,823,403.72 7,092,353.35
A. Dividends 3,321,150.00 8,357,987.25
B. Interest (+/-) 862.13 5,477.97
b. Deposits and liquidity 862.13 5,477.97
Interest on loans (-) -2,390.58 -5,039.37
Swap contracts (+/-)
Withholding tax (-) -496,217.83 -1,269,411.93
Foreign -496,217.83 -1,269,411.93
F. Other investment income 3,339.43
III. Other income 167,341.13 1,046,545.90
A. Anti dilution fee 167,341.13 1,046,545.90
B. Other
IV. Operating expenses -1,363,436.01 -2,172,022.59
A. Investment transaction and delivery costs (-) -163,470.37 -614,555.63
B. Financial expenses (-) -325.66 -114.54
C. Custodian’s fee (-) -67,710.47 -77,868.60
D. Manager’s fee (-) -953,322.71 -1,582,722.73
a. Financial Management of the Portfolio -790,011.61 -1,144,428.39
Class A (Dis) -66,686.21 -72,772.72
Class A USD (Dis) -4,062.08 -4,573.33
Class B (Cap) -386,555.85 -377,553.52
Class B USD (Cap) -33,266.96 -74,525.80
Class E (Dis) -170.57 -525.98
Class F (Cap) -87,509.52 -158,779.24
Class J (Cap) -171,989.29
Class M (Dis) -50,378.69 -69,770.94
Class N (Cap) -125,062.31 -148,346.22
Class M USD (Cap) -878.02
Class N USD (Dis) -36,319.42 -64,713.33
b. Administration and accounting -172,431.90 -438,294.34
c. Commercial remuneration 9,120.80
E. Administrative expenses (-) -32,369.54 -66,001.20
F. Incorporation and organisation expenses (-) -2,165.87 -1,996.70
G. Salaries and wages, social security charges and pensions (-) -1,415.94 -1,045.71
H. Services and various goods (-) -10,236.45 -19,888.44
I. Depreciation and provisions for liabilities and charges (-)
J. Taxes -122,794.01 -136,737.87
Class A (Dis) -7,084.50 -14,760.97
Class A USD (Dis) -766.18 -772.68
Class B (Cap) -48,413.47 -39,019.63
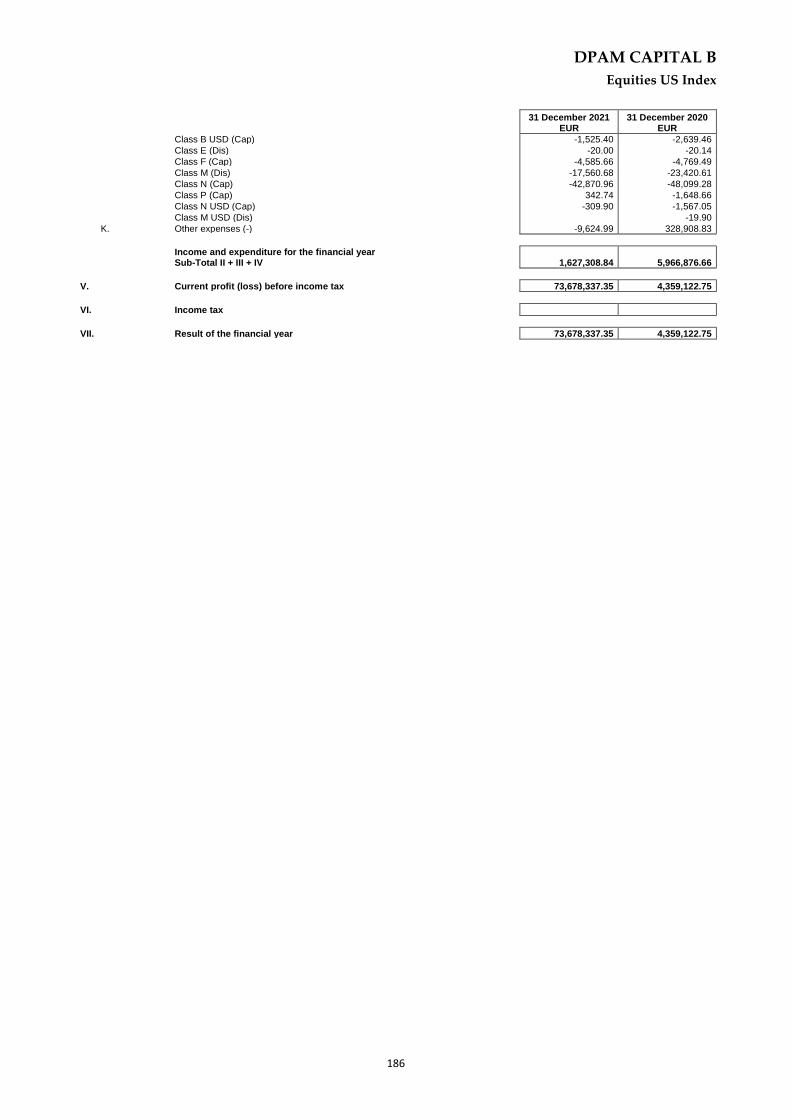
DPAM CAPITAL B
Equities US Index
186
31 December 2021
EUR 31 December 2020
EUR
Class B USD (Cap) -1,525.40 -2,639.46
Class E (Dis) -20.00 -20.14
Class F (Cap) -4,585.66 -4,769.49
Class M (Dis) -17,560.68 -23,420.61
Class N (Cap) -42,870.96 -48,099.28
Class P (Cap) 342.74 -1,648.66
Class N USD (Cap) -309.90 -1,567.05
Class M USD (Dis) -19.90
K. Other expenses (-) -9,624.99 328,908.83
Income and expenditure for the financial year Sub-Total II + III + IV 1,627,308.84 5,966,876.66
V. Current profit (loss) before income tax 73,678,337.35 4,359,122.75
VI. Income tax
VII. Result of the financial year 73,678,337.35 4,359,122.75

DPAM CAPITAL B
Equities US Index
187
31 December 2021
EUR 31 December 2020
EUR
Section 4: Allocation of the result
I. Profit (Loss) to be allocated 375,317,400.44 308,292,428.27
a. Profit carried forward (Loss carried forward) from the previous period 308,292,428.27 321,201,136.74
b. Profit (loss) of the financial year 73,678,337.35 4,359,122.75
c. Income equalisation received (Income equalisation paid out) -6,653,365.18 -17,267,831.22
II. (Appropriation to) Deduction from the capital
III. (Profit to be carried forward) Loss to be carried forward -374,945,761.32 -308,292,428.27
IV. Dividend distribution -371,639.12
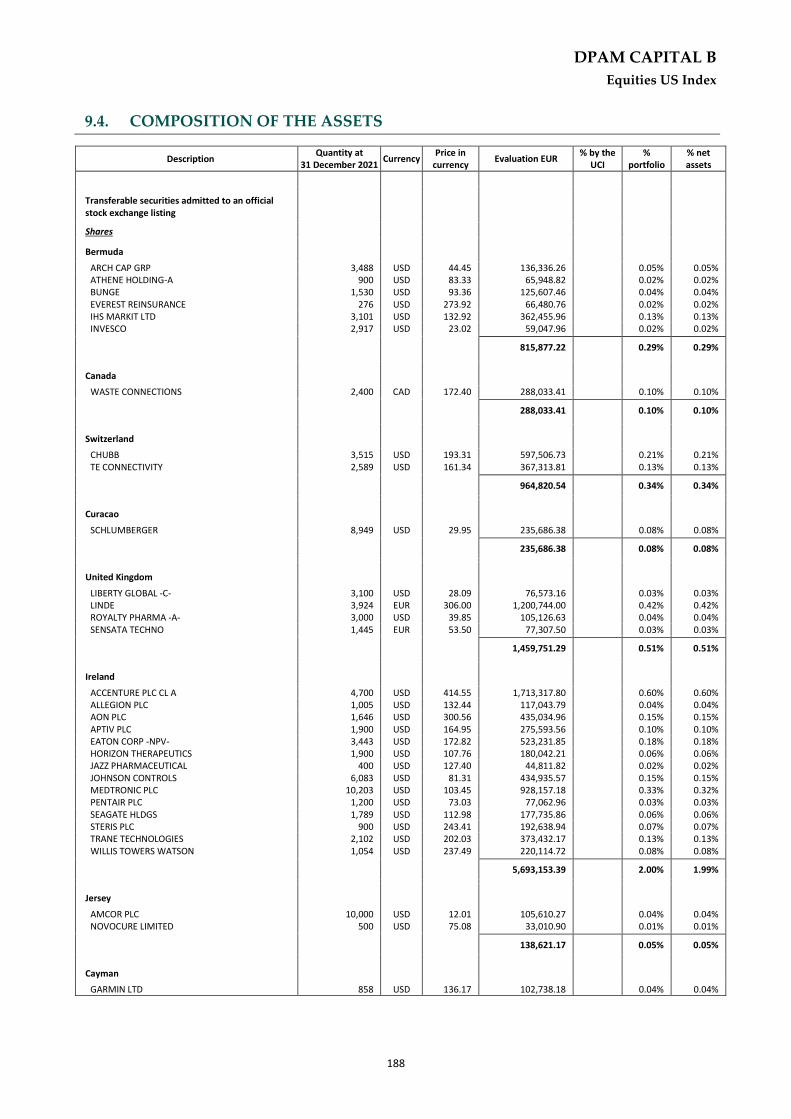
DPAM CAPITAL B
Equities US Index
188
9.4. COMPOSITION OF THE ASSETS
Equities US Index
Description Quantity at
31 December 2021 Currency
Price in currency
Evaluation EUR % by the
UCI %
portfolio % net assets
Transferable securities admitted to an official stock exchange listing
Shares
Bermuda
ARCH CAP GRP 3,488 USD 44.45 136,336.26 0.05% 0.05% ATHENE HOLDING-A 900 USD 83.33 65,948.82 0.02% 0.02% BUNGE 1,530 USD 93.36 125,607.46 0.04% 0.04% EVEREST REINSURANCE 276 USD 273.92 66,480.76 0.02% 0.02% IHS MARKIT LTD 3,101 USD 132.92 362,455.96 0.13% 0.13% INVESCO 2,917 USD 23.02 59,047.96 0.02% 0.02%
815,877.22 0.29% 0.29%
Canada
WASTE CONNECTIONS 2,400 CAD 172.40 288,033.41 0.10% 0.10%
288,033.41 0.10% 0.10%
Switzerland
CHUBB 3,515 USD 193.31 597,506.73 0.21% 0.21% TE CONNECTIVITY 2,589 USD 161.34 367,313.81 0.13% 0.13%
964,820.54 0.34% 0.34%
Curacao
SCHLUMBERGER 8,949 USD 29.95 235,686.38 0.08% 0.08%
235,686.38 0.08% 0.08%
United Kingdom
LIBERTY GLOBAL -C- 3,100 USD 28.09 76,573.16 0.03% 0.03% LINDE 3,924 EUR 306.00 1,200,744.00 0.42% 0.42% ROYALTY PHARMA -A- 3,000 USD 39.85 105,126.63 0.04% 0.04% SENSATA TECHNO 1,445 EUR 53.50 77,307.50 0.03% 0.03%
1,459,751.29 0.51% 0.51%
Ireland
ACCENTURE PLC CL A 4,700 USD 414.55 1,713,317.80 0.60% 0.60% ALLEGION PLC 1,005 USD 132.44 117,043.79 0.04% 0.04% AON PLC 1,646 USD 300.56 435,034.96 0.15% 0.15% APTIV PLC 1,900 USD 164.95 275,593.56 0.10% 0.10% EATON CORP -NPV- 3,443 USD 172.82 523,231.85 0.18% 0.18% HORIZON THERAPEUTICS 1,900 USD 107.76 180,042.21 0.06% 0.06% JAZZ PHARMACEUTICAL 400 USD 127.40 44,811.82 0.02% 0.02% JOHNSON CONTROLS 6,083 USD 81.31 434,935.57 0.15% 0.15% MEDTRONIC PLC 10,203 USD 103.45 928,157.18 0.33% 0.32% PENTAIR PLC 1,200 USD 73.03 77,062.96 0.03% 0.03% SEAGATE HLDGS 1,789 USD 112.98 177,735.86 0.06% 0.06% STERIS PLC 900 USD 243.41 192,638.94 0.07% 0.07% TRANE TECHNOLOGIES 2,102 USD 202.03 373,432.17 0.13% 0.13% WILLIS TOWERS WATSON 1,054 USD 237.49 220,114.72 0.08% 0.08%
5,693,153.39 2.00% 1.99%
Jersey
AMCOR PLC 10,000 USD 12.01 105,610.27 0.04% 0.04% NOVOCURE LIMITED 500 USD 75.08 33,010.90 0.01% 0.01%
138,621.17 0.05% 0.05%
Cayman
GARMIN LTD 858 USD 136.17 102,738.18 0.04% 0.04%

DPAM CAPITAL B
Equities US Index
189
Description Quantity at
31 December 2021 Currency
Price in currency
Evaluation EUR % by the
UCI %
portfolio % net assets
102,738.18 0.04% 0.04%
Liberia
ROYAL CARIBBEAN 1,473 USD 76.90 99,607.54 0.03% 0.03%
99,607.54 0.03% 0.03%
Netherlands
LYONDELLBASELL IND 1,707 USD 92.23 138,442.32 0.05% 0.05% NXP SEMICONDUCTORS 2,200 USD 227.78 440,657.76 0.15% 0.15%
579,100.08 0.20% 0.20%
Panama
CARNIVAL CORP NEW 7,000 USD 20.12 123,848.05 0.04% 0.04%
123,848.05 0.04% 0.04%
United States of America
10X GENOMICS INC A 600 USD 148.96 78,593.04 0.03% 0.03% 3M 5,071 USD 177.63 792,087.35 0.28% 0.28% A.O.SMITH CORP 1,000 USD 85.85 75,492.44 0.03% 0.03% ABBOTT LABORATORIES 13,000 USD 140.74 1,608,881.46 0.57% 0.56% ABBVIE 13,373 USD 135.40 1,592,247.80 0.56% 0.56% ABIOMED INC 389 USD 359.17 122,860.65 0.04% 0.04% ACTIVISION BLIZZARD 6,449 USD 66.53 377,288.05 0.13% 0.13% ADOBE INC 3,531 USD 567.06 1,760,718.31 0.62% 0.62% ADVANCE AUTO PARTS 388 USD 239.88 81,844.39 0.03% 0.03% ADVANCED MICRO 9,136 USD 143.90 1,156,059.09 0.41% 0.40% AES 4,500 USD 24.30 96,157.23 0.03% 0.03% AFFIRM HOLDINGS INC 500 USD 100.56 44,213.86 0.02% 0.02% AFLAC INC 4,278 USD 58.39 219,655.66 0.08% 0.08% AGILENT 2,279 USD 159.65 319,945.79 0.11% 0.11% AGNC INVESTMENT CORP 6,274 USD 15.04 82,976.57 0.03% 0.03% AIRBNB INC 1,700 USD 166.49 248,885.86 0.09% 0.09% AIR PRODUCTS 1,822 USD 304.26 487,479.53 0.17% 0.17% AKAMAI 1,057 USD 117.04 108,785.86 0.04% 0.04% ALBEMARLE CORP 700 USD 233.77 143,896.41 0.05% 0.05% ALEXANDRIA REIT 930 USD 222.96 182,336.26 0.06% 0.06% ALIGN TECHNOLOGY 500 USD 657.18 288,946.54 0.10% 0.10% ALLEGHANY 134 USD 667.59 78,664.32 0.03% 0.03% ALLIANT ENERGY CORP 2,424 USD 61.50 131,090.40 0.05% 0.05% ALLSTATE 2,500 USD 117.65 258,639.64 0.09% 0.09% ALLY FINANCIAL 2,500 USD 47.61 104,664.97 0.04% 0.04% ALNYLAM PHARMA INC 820 USD 169.58 122,278.93 0.04% 0.04% ALPHABET INC -A- 2,250 USD 2,897.04 5,731,920.51 2.01% 2.01% ALPHABET INC -C- 2,180 USD 2,893.59 5,546,980.48 1.95% 1.94% AMAZON COM 3,440 USD 3,334.34 10,086,290.54 3.54% 3.53% AMC ENTERT HLDGS-A 4,000 USD 27.20 95,673.58 0.03% 0.03% AMERCO 100 USD 726.23 63,861.24 0.02% 0.02% AMERICAN EXPRESS 5,197 USD 163.60 747,651.42 0.26% 0.26% AMERICAN INTL GROUP 7,500 USD 56.86 375,000.00 0.13% 0.13% AMERICAN TWR CORP 3,482 USD 292.50 895,607.63 0.31% 0.31% AMERICAN WATER WORKS 1,501 USD 188.86 249,277.93 0.09% 0.09% AMERIPRISE 700 USD 301.66 185,685.90 0.07% 0.06% AMERISOURCEBERGEN CP 1,200 USD 132.89 140,228.63 0.05% 0.05% AMETEK INC -NEW- 2,092 USD 147.04 270,495.67 0.10% 0.09% AMGEN 4,415 USD 224.97 873,410.61 0.31% 0.31% AMPHENOL CORP A 4,156 USD 87.46 319,630.46 0.11% 0.11% ANALOG 3,763 USD 175.74 581,524.46 0.20% 0.20% ANNALY MORTGAGE 8,159 USD 7.82 56,105.68 0.02% 0.02% ANSYS INC 750 USD 401.12 264,544.50 0.09% 0.09% ANTHEM 1,931 USD 463.54 787,104.94 0.28% 0.28% APOLLO GL MANAGEMENT 1,300 USD 72.43 82,798.98 0.03% 0.03% APPLE 124,200 USD 177.57 19,393,417.16 6.81% 6.79% APPLIED MATERIALS 6,812 USD 157.36 942,610.20 0.33% 0.33% ARAMARK 2,600 USD 36.85 84,250.79 0.03% 0.03% ARCHER 5,925 USD 67.59 352,155.07 0.12% 0.12% ARISTA NETWORKS INC 1,472 USD 143.75 186,071.05 0.07% 0.07%
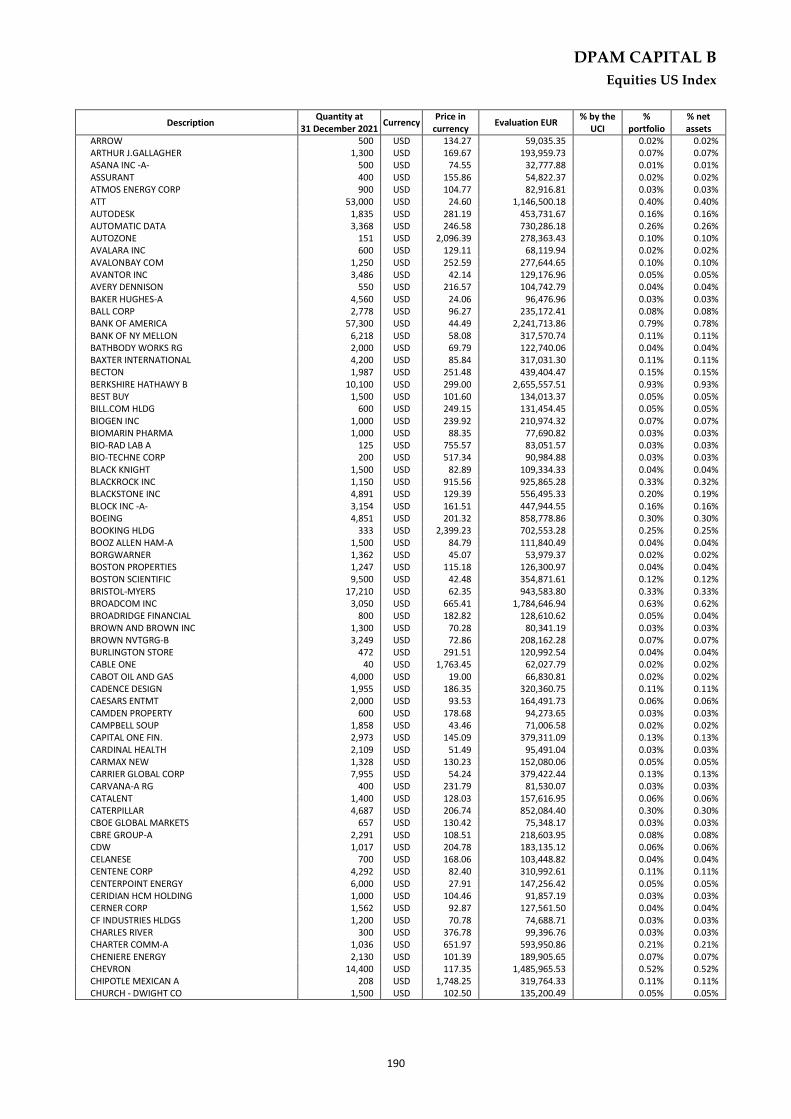
DPAM CAPITAL B
Equities US Index
190
Description Quantity at
31 December 2021 Currency
Price in currency
Evaluation EUR % by the
UCI %
portfolio % net assets
ARROW 500 USD 134.27 59,035.35 0.02% 0.02% ARTHUR J.GALLAGHER 1,300 USD 169.67 193,959.73 0.07% 0.07% ASANA INC -A- 500 USD 74.55 32,777.88 0.01% 0.01% ASSURANT 400 USD 155.86 54,822.37 0.02% 0.02% ATMOS ENERGY CORP 900 USD 104.77 82,916.81 0.03% 0.03% ATT 53,000 USD 24.60 1,146,500.18 0.40% 0.40% AUTODESK 1,835 USD 281.19 453,731.67 0.16% 0.16% AUTOMATIC DATA 3,368 USD 246.58 730,286.18 0.26% 0.26% AUTOZONE 151 USD 2,096.39 278,363.43 0.10% 0.10% AVALARA INC 600 USD 129.11 68,119.94 0.02% 0.02% AVALONBAY COM 1,250 USD 252.59 277,644.65 0.10% 0.10% AVANTOR INC 3,486 USD 42.14 129,176.96 0.05% 0.05% AVERY DENNISON 550 USD 216.57 104,742.79 0.04% 0.04% BAKER HUGHES-A 4,560 USD 24.06 96,476.96 0.03% 0.03% BALL CORP 2,778 USD 96.27 235,172.41 0.08% 0.08% BANK OF AMERICA 57,300 USD 44.49 2,241,713.86 0.79% 0.78% BANK OF NY MELLON 6,218 USD 58.08 317,570.74 0.11% 0.11% BATHBODY WORKS RG 2,000 USD 69.79 122,740.06 0.04% 0.04% BAXTER INTERNATIONAL 4,200 USD 85.84 317,031.30 0.11% 0.11% BECTON 1,987 USD 251.48 439,404.47 0.15% 0.15% BERKSHIRE HATHAWY B 10,100 USD 299.00 2,655,557.51 0.93% 0.93% BEST BUY 1,500 USD 101.60 134,013.37 0.05% 0.05% BILL.COM HLDG 600 USD 249.15 131,454.45 0.05% 0.05% BIOGEN INC 1,000 USD 239.92 210,974.32 0.07% 0.07% BIOMARIN PHARMA 1,000 USD 88.35 77,690.82 0.03% 0.03% BIO-RAD LAB A 125 USD 755.57 83,051.57 0.03% 0.03% BIO-TECHNE CORP 200 USD 517.34 90,984.88 0.03% 0.03% BLACK KNIGHT 1,500 USD 82.89 109,334.33 0.04% 0.04% BLACKROCK INC 1,150 USD 915.56 925,865.28 0.33% 0.32% BLACKSTONE INC 4,891 USD 129.39 556,495.33 0.20% 0.19% BLOCK INC -A- 3,154 USD 161.51 447,944.55 0.16% 0.16% BOEING 4,851 USD 201.32 858,778.86 0.30% 0.30% BOOKING HLDG 333 USD 2,399.23 702,553.28 0.25% 0.25% BOOZ ALLEN HAM-A 1,500 USD 84.79 111,840.49 0.04% 0.04% BORGWARNER 1,362 USD 45.07 53,979.37 0.02% 0.02% BOSTON PROPERTIES 1,247 USD 115.18 126,300.97 0.04% 0.04% BOSTON SCIENTIFIC 9,500 USD 42.48 354,871.61 0.12% 0.12% BRISTOL-MYERS 17,210 USD 62.35 943,583.80 0.33% 0.33% BROADCOM INC 3,050 USD 665.41 1,784,646.94 0.63% 0.62% BROADRIDGE FINANCIAL 800 USD 182.82 128,610.62 0.05% 0.04% BROWN AND BROWN INC 1,300 USD 70.28 80,341.19 0.03% 0.03% BROWN NVTGRG-B 3,249 USD 72.86 208,162.28 0.07% 0.07% BURLINGTON STORE 472 USD 291.51 120,992.54 0.04% 0.04% CABLE ONE 40 USD 1,763.45 62,027.79 0.02% 0.02% CABOT OIL AND GAS 4,000 USD 19.00 66,830.81 0.02% 0.02% CADENCE DESIGN 1,955 USD 186.35 320,360.75 0.11% 0.11% CAESARS ENTMT 2,000 USD 93.53 164,491.73 0.06% 0.06% CAMDEN PROPERTY 600 USD 178.68 94,273.65 0.03% 0.03% CAMPBELL SOUP 1,858 USD 43.46 71,006.58 0.02% 0.02% CAPITAL ONE FIN. 2,973 USD 145.09 379,311.09 0.13% 0.13% CARDINAL HEALTH 2,109 USD 51.49 95,491.04 0.03% 0.03% CARMAX NEW 1,328 USD 130.23 152,080.06 0.05% 0.05% CARRIER GLOBAL CORP 7,955 USD 54.24 379,422.44 0.13% 0.13% CARVANA-A RG 400 USD 231.79 81,530.07 0.03% 0.03% CATALENT 1,400 USD 128.03 157,616.95 0.06% 0.06% CATERPILLAR 4,687 USD 206.74 852,084.40 0.30% 0.30% CBOE GLOBAL MARKETS 657 USD 130.42 75,348.17 0.03% 0.03% CBRE GROUP-A 2,291 USD 108.51 218,603.95 0.08% 0.08% CDW 1,017 USD 204.78 183,135.12 0.06% 0.06% CELANESE 700 USD 168.06 103,448.82 0.04% 0.04% CENTENE CORP 4,292 USD 82.40 310,992.61 0.11% 0.11% CENTERPOINT ENERGY 6,000 USD 27.91 147,256.42 0.05% 0.05% CERIDIAN HCM HOLDING 1,000 USD 104.46 91,857.19 0.03% 0.03% CERNER CORP 1,562 USD 92.87 127,561.50 0.04% 0.04% CF INDUSTRIES HLDGS 1,200 USD 70.78 74,688.71 0.03% 0.03% CHARLES RIVER 300 USD 376.78 99,396.76 0.03% 0.03% CHARTER COMM-A 1,036 USD 651.97 593,950.86 0.21% 0.21% CHENIERE ENERGY 2,130 USD 101.39 189,905.65 0.07% 0.07% CHEVRON 14,400 USD 117.35 1,485,965.53 0.52% 0.52% CHIPOTLE MEXICAN A 208 USD 1,748.25 319,764.33 0.11% 0.11% CHURCH - DWIGHT CO 1,500 USD 102.50 135,200.49 0.05% 0.05%

DPAM CAPITAL B
Equities US Index
191
Description Quantity at
31 December 2021 Currency
Price in currency
Evaluation EUR % by the
UCI %
portfolio % net assets
CIGNA CORPORATION 2,756 USD 229.63 556,507.46 0.20% 0.19% CINCINNATI FINANCIAL 1,163 USD 113.93 116,514.76 0.04% 0.04% CINTAS 847 USD 443.17 330,078.25 0.12% 0.12% CISCO 32,500 USD 63.37 1,811,049.07 0.64% 0.63% CITIGROUP INC 15,600 USD 60.39 828,424.20 0.29% 0.29% CITIZENS FINL GROUP 2,900 USD 47.25 120,493.32 0.04% 0.04% CITRIX 623 USD 94.59 51,819.88 0.02% 0.02% CLOROX 814 USD 174.36 124,805.70 0.04% 0.04% CLOUDFLARE INC -A- 1,800 USD 131.50 208,142.81 0.07% 0.07% CME GROUP -A- 2,605 USD 228.46 523,336.53 0.18% 0.18% CMS ENERGY CORP 1,983 USD 65.05 113,431.37 0.04% 0.04% COCA-COLA CO 33,894 USD 59.21 1,764,741.24 0.62% 0.62% COGNEX CORP 1,473 USD 77.76 100,721.49 0.04% 0.04% COGNIZANT TECHNOLOGY 3,430 USD 88.72 267,595.50 0.09% 0.09% COINBASE GLOBAL INC 280 USD 252.37 62,138.23 0.02% 0.02% COLGATE-PALMOLIVE 6,500 USD 85.34 487,785.79 0.17% 0.17% COMCAST-A 33,999 USD 50.33 1,504,721.83 0.53% 0.53% CONAGRA BRANDS INC 5,406 USD 34.15 162,341.63 0.06% 0.06% CONOCOPHILLIPS 10,672 USD 72.18 677,369.82 0.24% 0.24% CONSOLIDATED EDISON 3,312 USD 85.32 248,487.37 0.09% 0.09% CONSTELLATION BRAND 1,700 USD 250.97 375,174.99 0.13% 0.13% COOPER COMPANIES 377 USD 418.94 138,885.31 0.05% 0.05% COPART INC 1,952 USD 151.62 260,255.22 0.09% 0.09% CORNING 5,900 USD 37.23 193,156.00 0.07% 0.07% CORTEVA INC 6,046 USD 47.28 251,367.29 0.09% 0.09% COSTAR GROUP INC 3,430 USD 79.03 238,368.71 0.08% 0.08% COSTCO WHOLESALE 3,359 USD 567.70 1,676,841.63 0.59% 0.59% COUPA SOFTWARE RG 676 USD 158.05 93,951.64 0.03% 0.03% CROWDSTRIKE HLDGS 1,243 USD 204.75 223,799.02 0.08% 0.08% CROWN CASTLE REIT 3,460 USD 208.74 635,104.12 0.22% 0.22% CROWN HOLDINGS INC 765 USD 110.62 74,414.61 0.03% 0.03% CSX CORP 17,072 USD 37.60 564,462.89 0.20% 0.20% CUMMINS INC 1,100 USD 218.14 211,004.22 0.07% 0.07% CVS HEALTH CORP 9,400 USD 103.16 852,711.92 0.30% 0.30% D.R. HORTON 2,394 USD 108.45 228,305.75 0.08% 0.08% DANAHER CORP 4,808 USD 329.01 1,391,030.67 0.49% 0.49% DARDEN 800 USD 150.64 105,972.56 0.04% 0.04% DATADOG-A 1,495 USD 178.11 234,149.18 0.08% 0.08% DAVITA INC 500 USD 113.76 50,017.59 0.02% 0.02% DEERE 2,410 USD 342.89 726,666.29 0.26% 0.25% DELL TECH -C 1,917 USD 56.17 94,686.85 0.03% 0.03% DELTA AIR LINES 1,636 USD 39.08 56,221.32 0.02% 0.02% DENTSPLY SIRONA 1,264 USD 55.79 62,010.69 0.02% 0.02% DEVON ENERGY 6,000 USD 44.05 232,412.94 0.08% 0.08% DEXCOM INC 693 USD 536.95 327,212.76 0.11% 0.11% DIAMONDBACK ENERGY 1,000 USD 107.85 94,838.20 0.03% 0.03% DIGITAL REALTY 2,068 USD 176.87 321,638.37 0.11% 0.11% DISCOVER FINANCIAL 2,074 USD 115.56 210,755.75 0.07% 0.07% DISCOVERY COMM-C 2,435 USD 22.90 49,034.03 0.02% 0.02% DISCOVERY COMMUNIC A 350 USD 23.54 7,244.99 0.00% 0.00% DISH NETWORK ECHOST 2,234 USD 32.44 63,727.54 0.02% 0.02% DOCUSIGN 1,620 USD 152.31 216,973.44 0.08% 0.08% DOLLAR GENERAL CORP 1,709 USD 235.83 354,408.61 0.12% 0.12% DOLLAR TREE 1,682 USD 140.52 207,839.11 0.07% 0.07% DOMINION ENERGY 6,904 USD 78.56 476,941.82 0.17% 0.17% DOMINO S PIZZA 300 USD 564.33 148,873.55 0.05% 0.05% DOORDASH INC 600 USD 148.90 78,561.38 0.03% 0.03% DOVER 1,375 USD 181.60 219,574.39 0.08% 0.08% DOW INC W-I 5,500 USD 56.72 274,322.90 0.10% 0.10% DRAFTKINGS INC -A- 2,000 USD 27.47 48,311.64 0.02% 0.02% DROPBOX INC 2,500 USD 24.54 53,948.29 0.02% 0.02% DTE ENERGY 1,578 USD 119.54 165,875.94 0.06% 0.06% DUKE ENERGY CORP 5,500 USD 104.90 507,342.60 0.18% 0.18% DUKE REALTY 2,173 USD 65.64 125,427.12 0.04% 0.04% DUPONT DE NEMOURS 4,534 USD 80.78 322,068.70 0.11% 0.11% DYNATRACE INC 1,000 USD 60.35 53,068.94 0.02% 0.02% EASTMAN CHEMICAL 1,000 USD 120.91 106,322.55 0.04% 0.04% EBAY 4,636 USD 66.50 271,099.19 0.10% 0.09% ECOLAB INC 1,700 USD 234.59 350,688.53 0.12% 0.12% EDISON INT 3,300 USD 68.25 198,052.23 0.07% 0.07% EDWARDS LIFESCIENCES 4,617 USD 129.55 525,969.35 0.18% 0.18%

DPAM CAPITAL B
Equities US Index
192
Description Quantity at
31 December 2021 Currency
Price in currency
Evaluation EUR % by the
UCI %
portfolio % net assets
ELANCO ANIMAL HEALTH 4,000 USD 28.38 99,824.13 0.04% 0.03% ELECTRONIC ARTS 2,000 USD 131.90 231,973.27 0.08% 0.08% ELI 6,084 USD 276.22 1,477,772.14 0.52% 0.52% EMERSON ELECTRIC 5,100 USD 92.97 416,942.49 0.15% 0.15% ENPHASE ENERGY INC 1,000 USD 182.94 160,868.80 0.06% 0.06% ENTEGRIS INC 800 USD 138.58 97,488.57 0.03% 0.03% ENTERGY 2,009 USD 112.65 199,009.72 0.07% 0.07% EOG RESOURCES INC 4,201 USD 88.83 328,152.33 0.12% 0.11% EPAM SYSTEMS INC 439 USD 668.45 258,045.68 0.09% 0.09% EQUIFAX 935 USD 292.79 240,730.43 0.08% 0.08% EQUINIX INC 739 USD 845.84 549,662.12 0.19% 0.19% EQUITABLE HOLDINGS 3,000 USD 32.79 86,501.93 0.03% 0.03% EQUITY LIFESTYLE PRO 978 USD 87.66 75,388.22 0.03% 0.03% EQUITY RESIDENTIAL 2,598 USD 90.50 206,752.55 0.07% 0.07% ERIE INDEMNITY -A- 165 USD 192.66 27,953.66 0.01% 0.01% ESSENTIAL UTILITIES 1,400 USD 53.69 66,097.43 0.02% 0.02% ESSEX PROPERTY REIT 518 USD 352.23 160,442.44 0.06% 0.06% ESTEE LAUDER CIE 1,861 USD 370.20 605,823.25 0.21% 0.21% ETSY 1,100 USD 218.94 211,778.05 0.07% 0.07% EVERSOURCE ENERGY 2,791 USD 90.98 223,289.82 0.08% 0.08% EXACT SCIENCES 1,500 USD 77.87 102,712.80 0.04% 0.04% EXELON 8,073 USD 57.76 410,039.11 0.14% 0.14% EXPEDIA GROUP INC 1,063 USD 180.72 168,928.39 0.06% 0.06% EXPEDITORS INTL WASH 907 USD 134.29 107,106.08 0.04% 0.04% EXTRA SP ST REIT 1,080 USD 226.73 215,325.71 0.08% 0.08% EXXON MOBIL CORP 31,395 USD 61.19 1,689,289.53 0.59% 0.59% F5 INC 440 USD 244.71 94,682.03 0.03% 0.03% FACTSET RESERACH 250 USD 486.01 106,843.56 0.04% 0.04% FAIR ISAAC 250 USD 433.67 95,337.23 0.03% 0.03% FASTENAL CO 5,200 USD 64.06 292,922.97 0.10% 0.10% FEDEX 1,708 USD 258.64 388,460.36 0.14% 0.14% FIDELITY NAT FIN-WI 1,453 USD 52.18 66,670.37 0.02% 0.02% FIDELITY NATL INFOR 4,807 USD 109.15 461,382.39 0.16% 0.16% FIFTH THIRD 4,000 USD 43.55 153,183.26 0.05% 0.05% FIRSTENERGY 5,153 USD 41.59 188,456.97 0.07% 0.07% FIRST HORIZON FRACT 19,687 USD 0.00 0.00 0.00% 0.00% FIRST REPUBLIC BANK 1,204 USD 206.51 218,640.56 0.08% 0.08% FISERV INC 4,825 USD 103.79 440,368.23 0.15% 0.15% FLEETCOR TECHNOLOGIE 657 USD 223.84 129,320.15 0.05% 0.05% FMC CORP 1,234 USD 109.89 119,243.99 0.04% 0.04% FORD MOTOR 29,158 USD 20.77 532,546.31 0.19% 0.19% FORTINET INC 900 USD 359.40 284,435.46 0.10% 0.10% FORTIVE-WI 3,171 USD 76.29 212,729.15 0.07% 0.07% FORTUNE BRANDS HOME 1,400 USD 106.90 131,603.94 0.05% 0.05% FOX -B 1,093 USD 34.27 32,938.01 0.01% 0.01% FOX CORP 2,322 USD 36.90 75,344.53 0.03% 0.03% FRANKLIN RESOURCES 1,871 USD 33.49 55,100.06 0.02% 0.02% FREEPORT MCMORAN 10,649 USD 41.72 390,675.59 0.14% 0.14% GARTNER INC A 690 USD 334.32 202,849.81 0.07% 0.07% GENERAC HLDGS 500 USD 351.92 154,730.92 0.05% 0.05% GENERAL ELECTRIC CO 9,100 USD 94.47 755,959.37 0.27% 0.26% GENERAL MILLS INC 6,700 USD 67.38 396,980.30 0.14% 0.14% GENERAL MOTORS CO 8,900 USD 58.63 458,852.44 0.16% 0.16% GENUINE PARTS 962 USD 140.20 118,600.42 0.04% 0.04% GILEAD SCIENCES 9,838 USD 72.61 628,154.40 0.22% 0.22% GLOBAL PAYMENTS INC 2,060 USD 135.18 244,874.08 0.09% 0.09% GLOBE LIFE INC 818 USD 93.72 67,413.79 0.02% 0.02% GODADDY INC-A- 1,000 USD 84.87 74,630.67 0.03% 0.03% GOLDMAN SACHS 2,604 USD 382.55 875,976.26 0.31% 0.31% GRAINGER 344 USD 518.24 156,766.23 0.06% 0.05% GUIDEWIRE SOFTWARE 700 USD 113.53 69,883.05 0.02% 0.02% HALLIBURTON 5,414 USD 22.87 108,879.86 0.04% 0.04% HARTFORD 2,324 USD 69.04 141,091.24 0.05% 0.05% HASBRO 1,393 USD 101.78 124,674.23 0.04% 0.04% HCA HEALTHCARE INC 2,148 USD 256.92 485,283.29 0.17% 0.17% HEALTHPEAK PROPERTIE 3,673 USD 36.09 116,565.75 0.04% 0.04% HEICO. 500 USD 144.22 63,410.13 0.02% 0.02% HEICO CORP -A- 700 USD 128.52 79,110.09 0.03% 0.03% HENRY JACK ASSOCIAT 681 USD 166.99 100,000.17 0.04% 0.03% HENRY SCHEIN 800 USD 77.53 54,540.98 0.02% 0.02% HERSHEY 1,524 USD 193.47 259,275.66 0.09% 0.09%

DPAM CAPITAL B
Equities US Index
193
Description Quantity at
31 December 2021 Currency
Price in currency
Evaluation EUR % by the
UCI %
portfolio % net assets
HESS 2,635 USD 74.03 171,534.51 0.06% 0.06% HEWLETT PACKARD WI 9,251 USD 15.77 128,287.26 0.05% 0.04% HILTON INC 2,200 USD 155.99 301,764.86 0.11% 0.11% HOLOGIC INC 2,564 USD 76.56 172,616.81 0.06% 0.06% HOME DEPOT 7,964 USD 415.01 2,906,383.78 1.02% 1.02% HONEYWELL INT. 5,713 USD 208.51 1,047,500.55 0.37% 0.37% HORMEL FOODS 3,000 USD 48.81 128,763.63 0.05% 0.05% HOST HOTELS RESORTS 7,000 USD 17.39 107,043.62 0.04% 0.04% HOWMET AERSPCACE 3,000 USD 31.83 83,969.40 0.03% 0.03% HP 8,800 USD 37.67 291,501.93 0.10% 0.10% HUBSPOT INC 300 USD 659.15 173,887.62 0.06% 0.06% HUMANA 900 USD 463.86 367,106.93 0.13% 0.13% HUNTINGTON BANCSHARE 11,187 USD 15.42 151,691.47 0.05% 0.05% IAC INTERACTIVE 559 USD 130.71 64,251.57 0.02% 0.02% IBM 6,850 USD 133.66 805,109.92 0.28% 0.28% IDEX CORP 700 USD 236.32 145,466.06 0.05% 0.05% IDEXX LABS 713 USD 658.46 412,840.29 0.15% 0.14% ILLINOIS TOOL 2,822 USD 246.80 612,442.49 0.22% 0.21% ILLUMINA INC 1,254 USD 380.44 419,514.39 0.15% 0.15% INCYTE CORP 862 USD 73.40 55,637.35 0.02% 0.02% INGERSOLL RAND 3,286 USD 61.87 178,776.66 0.06% 0.06% INSULET CORP 500 USD 266.07 116,984.70 0.04% 0.04% INTEL 31,400 USD 51.50 1,422,001.41 0.50% 0.50% INTERCON EXCHANGE 4,485 USD 136.77 539,406.83 0.19% 0.19% INTERPUBLIC 2,500 USD 37.45 82,329.41 0.03% 0.03% INTL FLAVORS-FRAGR 1,673 USD 150.65 221,629.84 0.08% 0.08% INTUIT 2,072 USD 643.22 1,171,959.06 0.41% 0.41% INTUITIVE SURGICAL 2,771 USD 359.30 875,501.49 0.31% 0.31% INVITATION 4,500 USD 45.34 179,414.35 0.06% 0.06% IPG PHOTONICS CORP 400 USD 172.14 60,548.72 0.02% 0.02% IQVIA HOLDINGS INC 1,536 USD 282.14 381,082.52 0.13% 0.13% IRON MOUNTAIN REIT 2,053 USD 52.33 94,471.94 0.03% 0.03% J.B.HUNT TRANSP 408 USD 204.40 73,333.80 0.03% 0.03% JM SMUCKER 1,622 USD 135.82 193,721.46 0.07% 0.07% JOHNSON 19,917 USD 171.07 2,996,131.89 1.05% 1.05% JPMORGAN CHASE 22,800 USD 158.35 3,174,797.75 1.12% 1.11% JUNIPER 2,000 USD 35.71 62,803.38 0.02% 0.02% KELLOGG 3,000 USD 64.42 169,943.72 0.06% 0.06% KEURIG DR PEPPER 7,000 USD 36.86 226,890.61 0.08% 0.08% KEYCORP 9,000 USD 23.13 183,054.87 0.06% 0.06% KEYSIGHT TECH-WI 1,456 USD 206.51 264,402.53 0.09% 0.09% KIMBERLY-CLARK 2,400 USD 142.92 301,625.04 0.11% 0.11% KINDER MORGAN 18,000 USD 15.86 251,037.64 0.09% 0.09% KKR AND CO -A- 4,526 USD 74.50 296,506.33 0.10% 0.10% KLA CORPORATION 1,200 USD 430.11 453,862.12 0.16% 0.16% KROGER CO 5,000 USD 45.26 198,997.54 0.07% 0.07% LABORATORY 800 USD 314.21 221,041.15 0.08% 0.08% LAM RESEARCH 1,019 USD 719.15 644,401.91 0.23% 0.23% LAS VEGAS SANDS 2,000 USD 37.64 66,197.68 0.02% 0.02% LEAR CORP 300 USD 183.05 48,289.66 0.02% 0.02% LEIDOS HOLDG 1,000 USD 88.90 78,174.46 0.03% 0.03% LENNAR CORP 2,177 USD 116.16 222,371.02 0.08% 0.08% LENNOX INTL 400 USD 324.36 114,090.75 0.04% 0.04% LIBERTY BROADBAND C 1,300 USD 161.10 184,162.86 0.06% 0.06% LIBERTY-C-SIRIUSXM 1,151 USD 50.85 51,467.07 0.02% 0.02% LIBERTY MEDIA CORP 1,184 USD 63.24 65,842.56 0.02% 0.02% LINCOLN NATIONAL 954 USD 68.26 57,263.49 0.02% 0.02% LIVE NATION ENTERT 1,424 USD 119.69 149,875.62 0.05% 0.05% LKQ CORP 1,815 USD 60.03 95,809.40 0.03% 0.03% LOEWS CORP 1,300 USD 57.76 66,028.84 0.02% 0.02% LOWE 5,380 USD 258.48 1,222,847.70 0.43% 0.43% LUCID GROUP INC 2,500 USD 38.05 83,648.43 0.03% 0.03% LULULEMON ATHLETICA 874 USD 391.52 300,904.40 0.11% 0.11% LUMEN TECH 6,880 USD 12.55 75,926.84 0.03% 0.03% LYFT INC -A- 2,000 USD 42.73 75,149.49 0.03% 0.03% MARATHON PETROLEUM 5,760 USD 63.99 324,113.96 0.11% 0.11% MARKEL 104 USD 1,234.00 112,852.62 0.04% 0.04% MARKETAXESS HLD 210 USD 411.27 75,946.80 0.03% 0.03% MARRIOT 1,869 USD 165.24 271,573.65 0.10% 0.10% MARSH 4,033 USD 173.82 616,440.43 0.22% 0.22% MARTIN MARIETTA 552 USD 440.52 213,829.62 0.08% 0.07%

DPAM CAPITAL B
Equities US Index
194
Description Quantity at
31 December 2021 Currency
Price in currency
Evaluation EUR % by the
UCI %
portfolio % net assets
MARVELL TECHNOLOGY 6,788 USD 87.49 522,231.90 0.18% 0.18% MASCO 2,000 USD 70.22 123,496.31 0.04% 0.04% MASIMO CORP 300 USD 292.78 77,237.07 0.03% 0.03% MASTERCARD-A 6,750 USD 359.32 2,132,791.07 0.75% 0.75% MATCH GROUP INC 2,261 USD 132.25 262,941.65 0.09% 0.09% MCCORMIC CO INC 3,204 USD 96.61 272,193.49 0.10% 0.10% MCDONALD 5,661 USD 268.07 1,334,456.80 0.47% 0.47% MCKESSON 1,332 USD 248.57 291,149.53 0.10% 0.10% MEDICAL PROPERTIES 3,000 USD 23.63 62,337.32 0.02% 0.02% MERCADOLIBRE INC 372 USD 1,348.40 441,087.58 0.15% 0.15% MERCK AND CO INC 19,000 USD 76.64 1,280,478.37 0.45% 0.45% META PLATFORMS INC 18,000 USD 336.35 5,323,865.63 1.87% 1.86% METLIFE 5,264 USD 62.49 289,260.78 0.10% 0.10% METTLER TOLEDO INTL 140 USD 1,697.21 208,942.49 0.07% 0.07% MGM RESORTS INTL 2,669 USD 44.88 105,333.03 0.04% 0.04% MICROCHIP TECH. 3,608 USD 87.06 276,215.69 0.10% 0.10% MICRON TECHNOLOGY 8,491 USD 93.15 695,512.35 0.24% 0.24% MICROSOFT 53,700 USD 336.32 15,881,449.17 5.58% 5.56% MID-AMERICA APART 900 USD 229.44 181,582.84 0.06% 0.06% MODERNA INC 2,657 USD 253.98 593,409.13 0.21% 0.21% MOHAWK INDUSTRIES 185 USD 182.18 29,637.09 0.01% 0.01% MOLINA HEALTHCARE 500 USD 318.08 139,852.27 0.05% 0.05% MOLSON COORS 2,000 USD 46.35 81,516.00 0.03% 0.03% MONDELEZ INTL 12,300 USD 66.31 717,211.57 0.25% 0.25% MONGODB INC -A- 451 USD 529.35 209,933.92 0.07% 0.07% MONOLITHIC POWER 250 USD 493.33 108,452.78 0.04% 0.04% MONSTER BEVERAGE 4,084 USD 96.04 344,906.23 0.12% 0.12% MOODY 1,350 USD 390.58 463,667.78 0.16% 0.16% MORGAN STANLEY 10,526 USD 98.16 908,575.59 0.32% 0.32% MOSAIC CO 2,600 USD 39.29 89,829.41 0.03% 0.03% MOTOROLA SOLTN 1,500 USD 271.70 358,380.23 0.13% 0.13% MSCI 659 USD 612.69 355,049.87 0.12% 0.12% MT BANK CORPORATION 755 USD 153.58 101,963.51 0.04% 0.04% NASDAQ INC 700 USD 210.01 129,271.02 0.05% 0.05% NETAPP INC 1,755 USD 92.01 141,994.20 0.05% 0.05% NETFLIX 3,307 USD 602.44 1,751,907.39 0.62% 0.61% NEUROCRINE BIOSC 600 USD 85.17 44,936.69 0.02% 0.02% NEWELL BRANDS 2,625 USD 21.84 50,413.30 0.02% 0.02% NEWMONT CORPORATION 5,500 USD 62.02 299,956.03 0.11% 0.10% NEWS CORP A 3,711 USD 22.32 72,836.37 0.03% 0.03% NEXTERA ENERGY INC 15,500 USD 93.36 1,272,493.84 0.45% 0.45% NIKE INC -B- 9,800 USD 166.67 1,436,304.96 0.50% 0.50% NISOURCE 4,000 USD 27.61 97,115.72 0.03% 0.03% NORDSON CORP 500 USD 255.27 112,236.19 0.04% 0.04% NORFOLK SOUTHERN 2,200 USD 297.71 575,942.67 0.20% 0.20% NORTHERN TRUST 1,167 USD 119.61 122,744.35 0.04% 0.04% NORTONLIFELOCK INC 4,163 USD 25.98 95,106.17 0.03% 0.03% NOVAVAX INC 400 USD 143.07 50,323.60 0.02% 0.02% NRG ENERGY 1,500 USD 43.08 56,823.78 0.02% 0.02% NUANCE COMMUNICATION 2,100 USD 55.32 102,156.17 0.04% 0.04% NUCOR 2,318 USD 114.15 232,676.49 0.08% 0.08% NVIDIA CORP 18,911 USD 294.11 4,890,884.81 1.72% 1.71% NVR 33 USD 5,908.87 171,467.38 0.06% 0.06% OCCIDENTAL PETROLEUM 6,000 USD 28.99 152,954.63 0.05% 0.05% OKTA INC 1,093 USD 224.17 215,457.10 0.08% 0.08% OLD DOMINION FRE 908 USD 358.38 286,149.35 0.10% 0.10% OMNICOM 1,046 USD 73.27 67,393.97 0.02% 0.02% ONEOK NEW 3,287 USD 58.76 169,841.82 0.06% 0.06% ON SEMICONDUCTOR 3,031 USD 67.92 181,028.42 0.06% 0.06% ORACLE 12,500 USD 87.21 958,604.47 0.34% 0.34% O REILLY AUTO 605 USD 706.23 375,720.32 0.13% 0.13% OTS WORLDWIDE CORP 3,553 USD 87.07 272,036.33 0.10% 0.10% OWENS CORNING 1,203 USD 90.50 95,736.46 0.03% 0.03% PACCAR 3,463 USD 88.26 268,769.24 0.09% 0.09% PACKAGING CORP AMER 600 USD 136.15 71,834.33 0.03% 0.03% PALANTIR TECH -A- 10,000 USD 18.21 160,130.14 0.06% 0.06% PALO ALTO NET 721 USD 556.76 352,993.28 0.12% 0.12% PAPER 2,300 USD 46.98 95,017.59 0.03% 0.03% PARKER HANNIFIN 1,148 USD 318.12 321,141.19 0.11% 0.11% PAYCHEX 2,700 USD 136.50 324,085.47 0.11% 0.11% PAYCOM SOFTWARE 300 USD 415.19 109,529.55 0.04% 0.04%

DPAM CAPITAL B
Equities US Index
195
Description Quantity at
31 December 2021 Currency
Price in currency
Evaluation EUR % by the
UCI %
portfolio % net assets
PAYPAL HOLDINGS-WI 8,401 USD 188.58 1,393,123.97 0.49% 0.49% PELOTON INTERA RG-A 1,727 USD 35.76 54,306.65 0.02% 0.02% PEPSICO 11,300 USD 173.71 1,726,101.83 0.61% 0.60% PERKINELMER 900 USD 201.06 159,122.41 0.06% 0.06% PFIZER 41,500 USD 59.05 2,154,919.98 0.76% 0.75% PG E 11,000 USD 12.14 117,428.77 0.04% 0.04% PHILLIPS 66-WI 3,102 USD 72.46 197,652.94 0.07% 0.07% PINTEREST INC 3,521 USD 36.35 112,546.91 0.04% 0.04% PIONEER NAT RES CO 1,685 USD 181.88 269,493.32 0.09% 0.09% PLUG POWER INC 4,000 USD 28.23 99,296.52 0.03% 0.03% PNC 3,234 USD 200.52 570,244.18 0.20% 0.20% POOL CORP 200 USD 566.00 99,542.74 0.03% 0.03% PPG INDUSTRIES INC 1,505 USD 172.44 228,211.57 0.08% 0.08% PPL CORP 8,108 USD 30.06 214,321.56 0.08% 0.07% PRINCIPAL FIN 2,172 USD 72.34 138,166.09 0.05% 0.05% PROCTER 18,592 USD 163.58 2,674,357.51 0.94% 0.94% PROGRESSIVE 4,629 USD 102.65 417,839.30 0.15% 0.15% PROLOGIS 5,895 USD 168.36 872,742.00 0.31% 0.31% PRUDENTIAL FINANCIAL 3,299 USD 108.24 314,002.60 0.11% 0.11% PTC INC 1,093 USD 121.15 116,441.22 0.04% 0.04% PUBLIC SERVICE 4,421 USD 66.73 259,420.80 0.09% 0.09% PUBLIC STORAGE R 1,178 USD 374.56 387,998.31 0.14% 0.14% PULTE GROUP INC 2,418 USD 57.16 121,537.88 0.04% 0.04% QORVO INC 900 USD 156.39 123,769.79 0.04% 0.04% QUALCOMM 8,416 USD 182.87 1,353,353.78 0.48% 0.47% QUEST 755 USD 173.01 114,863.30 0.04% 0.04% RAYMOND JAMES FIN 1,000 USD 100.40 88,287.02 0.03% 0.03% RAYTHEON TECHNO 12,789 USD 86.06 967,834.45 0.34% 0.34% REALTY INCOME REIT 3,757 USD 71.59 236,513.92 0.08% 0.08% REGENCY CENTERS 1,221 USD 75.35 80,902.52 0.03% 0.03% REGENERON PHARMA INC 814 USD 631.52 452,037.71 0.16% 0.16% REGIONS FINANCIAL 6,084 USD 21.80 116,629.62 0.04% 0.04% REPUBLIC SERVICES 1,764 USD 139.45 216,311.82 0.08% 0.08% RESMED INC 1,077 USD 260.48 246,690.96 0.09% 0.09% RINGCENTRAL A INC 585 USD 187.37 96,387.14 0.03% 0.03% RIVIAN AUTOMOTIVE 1,700 USD 103.69 155,006.16 0.05% 0.05% ROBERT HALF 800 USD 111.52 78,452.34 0.03% 0.03% ROBINHOOD MARKETS 1,700 USD 17.76 26,549.42 0.01% 0.01% ROBINSON WORLDWIDE 600 USD 107.63 56,786.84 0.02% 0.02% ROCKWELL 1,109 USD 348.85 340,199.31 0.12% 0.12% ROKU INC 777 USD 228.20 155,919.28 0.05% 0.05% ROLLINS INC 2,475 USD 34.21 74,454.58 0.03% 0.03% ROPER TECHNOLOGIES 843 USD 491.86 364,613.07 0.13% 0.13% ROSS STORES 2,651 USD 114.28 266,405.45 0.09% 0.09% RPM INTERNATIONAL 900 USD 101.00 79,933.17 0.03% 0.03% SALESFORCE.COM 7,500 USD 254.13 1,676,024.45 0.59% 0.59% SBA COMMUNICATIONS 715 USD 389.02 244,591.36 0.09% 0.09% SCHWAB 11,586 USD 84.10 856,826.06 0.30% 0.30% SEAGEN INC USD 1,113 USD 154.60 151,310.06 0.05% 0.05% SEALED AIR-1998 2,000 USD 67.47 118,659.87 0.04% 0.04% SEI INVESTMENTS 1,113 USD 60.94 59,643.18 0.02% 0.02% SEMPRA 2,260 USD 132.28 262,884.98 0.09% 0.09% SERVICENOW INC 1,520 USD 649.11 867,610.97 0.30% 0.30% SHERWIN-WILLIAMS CO 2,005 USD 352.16 620,894.13 0.22% 0.22% SIGNATURE BANK 350 USD 323.47 99,555.49 0.03% 0.03% SIMON PROPERTY GROUP 2,733 USD 159.77 383,970.64 0.13% 0.13% SIRIUS XM HLDGS 8,000 USD 6.35 44,671.12 0.02% 0.02% SKYWORKS SOLUTIONS 1,000 USD 155.14 136,422.79 0.05% 0.05% SNAP-A 7,710 USD 47.03 318,854.47 0.11% 0.11% SNAP-ON 560 USD 215.38 106,061.20 0.04% 0.04% SNOWFLAKE INC 1,500 USD 338.75 446,821.14 0.16% 0.16% SOFI TECH RG 3,800 USD 15.81 52,829.76 0.02% 0.02% SOLAREDGE TECH 500 USD 280.57 123,360.01 0.04% 0.04% SOUTHERN 8,019 USD 68.58 483,593.93 0.17% 0.17% SOUTHWEST AIRLINES 1,713 USD 42.84 64,531.23 0.02% 0.02% SP GLOBAL 1,900 USD 471.93 788,486.63 0.28% 0.28% SPLUNK INC 800 USD 115.72 81,406.96 0.03% 0.03% SSC TECH HLDGS 2,100 USD 81.98 151,387.62 0.05% 0.05% STANLEY BLACK DECK 1,269 USD 188.62 210,480.81 0.07% 0.07% STARBUCKS CORP 9,227 USD 116.97 949,069.81 0.33% 0.33% STATE STREET 2,662 USD 93.00 217,697.85 0.08% 0.08%

DPAM CAPITAL B
Equities US Index
196
Description Quantity at
31 December 2021 Currency
Price in currency
Evaluation EUR % by the
UCI %
portfolio % net assets
STEEL DYNAMICS 2,300 USD 62.07 125,537.28 0.04% 0.04% STRYKER 2,657 USD 267.42 624,810.89 0.22% 0.22% SUN COMMUNITIES INC 900 USD 209.97 166,173.94 0.06% 0.06% SVB FINANCIAL GROUP 400 USD 678.24 238,564.90 0.08% 0.08% SYNCHRONY FINANCIAL 3,200 USD 46.39 130,538.16 0.05% 0.05% SYNOPSYS 1,052 USD 368.50 340,891.66 0.12% 0.12% SYSCO 3,500 USD 78.55 241,756.07 0.08% 0.08% TAKE-TWO INTERACT 1,081 USD 177.72 168,937.14 0.06% 0.06% TARGET CORP 3,800 USD 231.44 773,366.16 0.27% 0.27% TELADOC 800 USD 91.82 64,593.74 0.02% 0.02% TELEDYNE TECH 300 USD 436.89 115,254.13 0.04% 0.04% TELEFLEX INC 250 USD 328.48 72,212.45 0.03% 0.03% TERADYNE INC 1,200 USD 163.53 172,560.68 0.06% 0.06% TESLA 6,370 USD 1,056.78 5,919,529.19 2.08% 2.07% TEXAS 7,000 USD 188.47 1,160,121.35 0.41% 0.41% THE CARLYLE GROUP 2,000 USD 54.90 96,552.94 0.03% 0.03% THE KRAFT HEINZ 6,500 USD 35.90 205,196.98 0.07% 0.07% THERMO FISHER SCIEN 2,950 USD 667.24 1,730,881.11 0.61% 0.61% THE TRADE DESK INC A 3,000 USD 91.64 241,751.67 0.08% 0.08% TJX COS INC 9,548 USD 75.92 637,428.91 0.22% 0.22% T-MOBILE US INC 5,003 USD 115.98 510,242.65 0.18% 0.18% TRACTOR SUPPLY 879 USD 238.60 184,426.13 0.06% 0.06% TRADEWEB MARKETS INC 1,000 USD 100.14 88,058.39 0.03% 0.03% TRANSUNION 1,300 USD 118.58 135,555.75 0.05% 0.05% TRAVELERS COMP 2,275 USD 156.43 312,942.53 0.11% 0.11% TRIMBLE 1,500 USD 87.19 115,006.16 0.04% 0.04% T ROWE PRICE GROUP 1,854 USD 196.64 320,586.14 0.11% 0.11% TRUIST FINANCIAL 10,500 USD 58.55 540,604.12 0.19% 0.19% TWILIO-A 1,152 USD 263.34 266,767.22 0.09% 0.09% TWITTER INC 7,000 USD 43.22 266,039.40 0.09% 0.09% TYLER TECHNOLOGIES 261 USD 537.95 123,465.49 0.04% 0.04% TYSON FOODS 3,191 USD 87.16 244,572.25 0.09% 0.09% UBER TECHNOLOGIES 10,071 USD 41.93 371,330.49 0.13% 0.13% UGI CORP 2,300 USD 45.91 92,853.50 0.03% 0.03% ULTA BEAUTY INC 363 USD 412.34 131,621.02 0.05% 0.05% UNION PACIFIC 5,056 USD 251.93 1,120,082.73 0.39% 0.39% UNITEDHEALTH 7,150 USD 502.14 3,157,141.22 1.11% 1.10% UNITED PARCEL 5,290 USD 214.34 997,061.73 0.35% 0.35% UNITED RENTALS 800 USD 332.29 233,760.11 0.08% 0.08% UNITY SOFTWARE INC 500 USD 142.99 62,869.33 0.02% 0.02% UNIV HEALTH SERV-B 779 USD 129.66 88,819.15 0.03% 0.03% US BANCORP-FIRSTAR- 11,190 USD 56.17 552,710.43 0.19% 0.19% VAIL RESORTS INC 300 USD 327.90 86,501.93 0.03% 0.03% VALERO ENERGY 3,271 USD 75.11 216,043.62 0.08% 0.08% VEEVA SYSTEMS-A 1,001 USD 255.48 224,881.71 0.08% 0.08% VENTAS INC 2,000 USD 51.12 89,905.03 0.03% 0.03% VERISIGN 847 USD 253.82 189,048.14 0.07% 0.07% VERISK ANALYTCS 951 USD 228.73 191,278.78 0.07% 0.07% VERIZON 30,945 USD 51.96 1,413,913.30 0.50% 0.49% VERTEX 1,842 USD 219.60 355,701.02 0.12% 0.12% VF CORP 1,947 USD 73.22 125,359.95 0.04% 0.04% VIACOMCBS INC-B 3,500 USD 30.18 92,886.04 0.03% 0.03% VIATRIS INC 9,904 USD 13.53 117,834.26 0.04% 0.04% VICI PROPERTIES INC 4,000 USD 30.11 105,909.25 0.04% 0.04% VISA-A 12,800 USD 216.71 2,439,226.17 0.86% 0.85% VISTRA CORP 4,000 USD 22.77 80,091.45 0.03% 0.03% VMWARE 1,715 USD 115.88 174,757.47 0.06% 0.06% VORNADO REALTY TRUST 23 USD 41.86 846.62 0.00% 0.00% VULCAN 858 USD 207.58 156,615.93 0.06% 0.05% W.P. CAREY REIT 1,300 USD 82.05 93,796.17 0.03% 0.03% WABTEC 1,675 USD 92.11 135,670.29 0.05% 0.05% WALGREENS BOOTS 5,800 USD 52.16 266,028.84 0.09% 0.09% WAL MART 11,396 USD 144.69 1,449,953.61 0.51% 0.51% WALT DISNEY 13,500 USD 154.89 1,838,739.89 0.65% 0.64% WASTE 3,087 USD 166.90 453,060.41 0.16% 0.16% WATERS 393 USD 372.60 128,765.21 0.05% 0.05% WAYFAIR INC -A- 500 USD 189.97 83,525.33 0.03% 0.03% WEC ENERGY GROUP INC 2,697 USD 97.07 230,212.62 0.08% 0.08% WELLS FARGO 30,751 USD 47.98 1,297,426.12 0.46% 0.45% WELLTOWER INC 3,634 USD 85.77 274,083.87 0.10% 0.10% WESTERN DIGITAL 2,340 USD 65.21 134,181.67 0.05% 0.05%

DPAM CAPITAL B
Equities US Index
197
Description Quantity at
31 December 2021 Currency
Price in currency
Evaluation EUR % by the
UCI %
portfolio % net assets
WESTERN UNION 2,000 USD 17.84 31,375.31 0.01% 0.01% WEST PHARMACEUTICAL 650 USD 469.01 268,076.42 0.09% 0.09% WESTROCK CO 2,832 USD 44.36 110,470.91 0.04% 0.04% WEYERHAEUSER 6,476 USD 41.18 234,507.28 0.08% 0.08% WHIRLPOOL 508 USD 234.66 104,825.26 0.04% 0.04% WILLIAMS COMPANIES 10,967 USD 26.04 251,126.17 0.09% 0.09% WORKDAY INC -A- 1,300 USD 273.11 312,208.05 0.11% 0.11% WR BERKLEY 736 USD 82.39 53,323.11 0.02% 0.02% WYNN RESORTS 655 USD 85.04 48,981.01 0.02% 0.02% XCEL ENERGY 4,000 USD 67.70 238,128.74 0.08% 0.08% XILINX 1,872 USD 212.03 349,032.85 0.12% 0.12% XYLEM INC 1,739 USD 119.92 183,381.01 0.06% 0.06% YUM BRANDS 1,874 USD 138.86 228,828.39 0.08% 0.08% ZEBRA TECHNO 400 USD 595.20 209,356.31 0.07% 0.07% ZENDESK 1,200 USD 104.29 110,049.24 0.04% 0.04% ZILLOW GROUP-A 800 USD 62.22 43,770.66 0.02% 0.02% ZILLOW GROUP-C 1,042 USD 63.85 58,504.84 0.02% 0.02% ZIMMER BIOMET 1,519 USD 127.04 169,692.02 0.06% 0.06% ZOETIS-A 3,724 USD 244.03 799,127.44 0.28% 0.28% ZOOMINFO TECHNO 1,300 USD 64.20 73,390.78 0.03% 0.03% ZOOM VIDEO COMM 1,876 USD 183.91 303,390.05 0.11% 0.11% ZSCALER INC 600 USD 321.33 169,537.46 0.06% 0.06%
274,086,308.13 96.27% 95.90%
Total - Shares 284,587,545.38 99.96% 99.57%
UCI with variable number of shares
Real estate
Non Directive 2009/65/CE - Non FSMA
UNITED DOMINION RE D 2,000 USD 59.99 105,504.75 0.04% 0.04%
Total - Non Directive 2009/65/CE - Non FSMA 105,504.75 0.04% 0.04%
Total - Real estate 105,504.75 0.04% 0.04%
Total - UCI with variable number of shares 105,504.75 0.04% 0.04%
Total - Transferable securities admitted to an official stock exchange listing
284,693,050.13 100.00% 99.61%
Total - portfolio 284,693,050.13 100.00% 99.61%
Collatéral 0.00 0.00%
Deposits and liquid assets
deposit and liquid assets
Banque Degroof Petercam USD 950,506.96 0.33%
Banque Degroof Petercam CHF 563.34 0.00%
Banque Degroof Petercam EUR 353,445.62 0.12%
Banque Degroof Petercam GBP 1.16 0.00%
Banque Degroof Petercam CAD 1,008.37 0.00%
Total - deposit and liquid assets 1,305,525.45 0.46%
Total - Deposits and liquid assets 1,305,525.45 0.46%
Other receivables and other payables -194,245.12 -0.07%
Others 0.00 0.00%
Total net assets 285,804,330.46 100,00%

DPAM CAPITAL B
Equities US Index
198
9.5. GEOGRAPHIC ALLOCATION OF INVESTMENTS
By country % Portfolio
UNITED STATES OF AMERICA 96.32%
IRELAND 2.00%
UNITED KINGDOM 0.51%
SWITZERLAND 0.34%
BERMUDA 0.29%
NETHERLANDS 0.20%
CANADA 0.10%
CURACAO 0.08%
JERSEY 0.05%
CAYMAN 0.04%
PANAMA 0.04%
LIBERIA 0.03%
Total 100.00%
These allocations of assets were established on basis of data (gross) used by the entity responsible for the administration and bookkeeping and do not reflect inevitably the economic analysis which directed the assets selection.
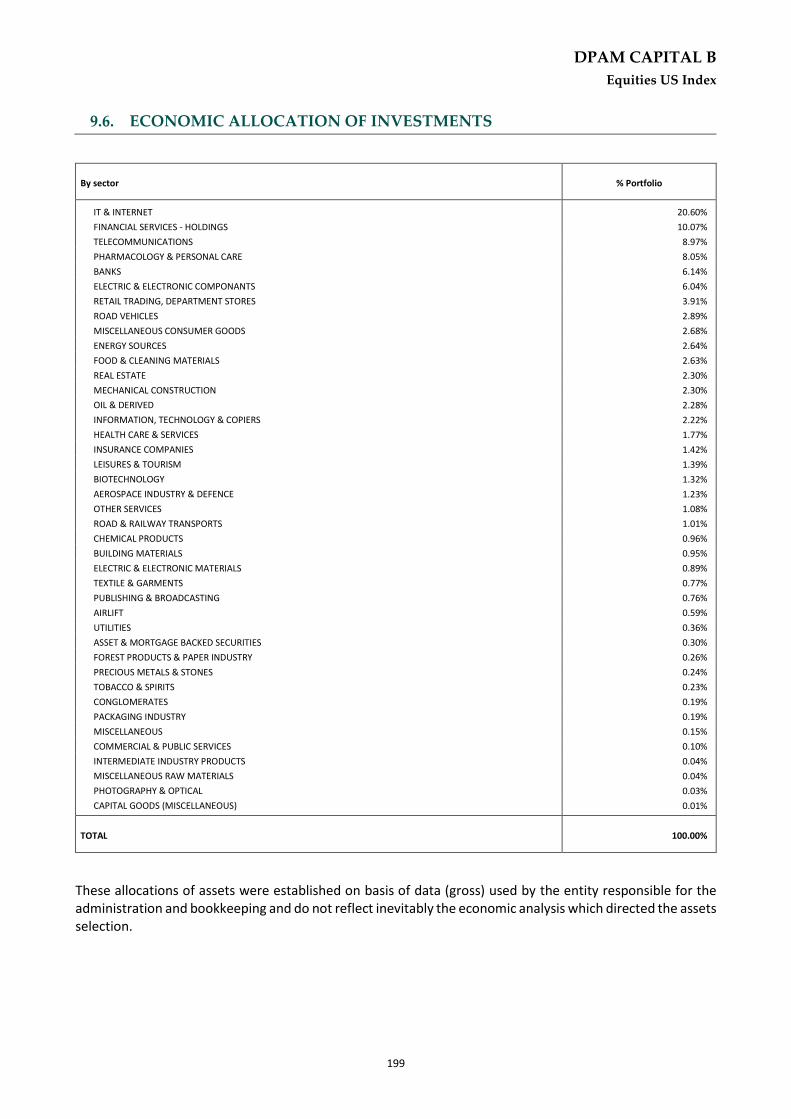
DPAM CAPITAL B
Equities US Index
199
9.6. ECONOMIC ALLOCATION OF INVESTMENTS
By sector % Portfolio
IT & INTERNET 20.60%
FINANCIAL SERVICES - HOLDINGS 10.07%
TELECOMMUNICATIONS 8.97%
PHARMACOLOGY & PERSONAL CARE 8.05%
BANKS 6.14%
ELECTRIC & ELECTRONIC COMPONANTS 6.04%
RETAIL TRADING, DEPARTMENT STORES 3.91%
ROAD VEHICLES 2.89%
MISCELLANEOUS CONSUMER GOODS 2.68%
ENERGY SOURCES 2.64%
FOOD & CLEANING MATERIALS 2.63%
REAL ESTATE 2.30%
MECHANICAL CONSTRUCTION 2.30%
OIL & DERIVED 2.28%
INFORMATION, TECHNOLOGY & COPIERS 2.22%
HEALTH CARE & SERVICES 1.77%
INSURANCE COMPANIES 1.42%
LEISURES & TOURISM 1.39%
BIOTECHNOLOGY 1.32%
AEROSPACE INDUSTRY & DEFENCE 1.23%
OTHER SERVICES 1.08%
ROAD & RAILWAY TRANSPORTS 1.01%
CHEMICAL PRODUCTS 0.96%
BUILDING MATERIALS 0.95%
ELECTRIC & ELECTRONIC MATERIALS 0.89%
TEXTILE & GARMENTS 0.77%
PUBLISHING & BROADCASTING 0.76%
AIRLIFT 0.59%
UTILITIES 0.36%
ASSET & MORTGAGE BACKED SECURITIES 0.30%
FOREST PRODUCTS & PAPER INDUSTRY 0.26%
PRECIOUS METALS & STONES 0.24%
TOBACCO & SPIRITS 0.23%
CONGLOMERATES 0.19%
PACKAGING INDUSTRY 0.19%
MISCELLANEOUS 0.15%
COMMERCIAL & PUBLIC SERVICES 0.10%
INTERMEDIATE INDUSTRY PRODUCTS 0.04%
MISCELLANEOUS RAW MATERIALS 0.04%
PHOTOGRAPHY & OPTICAL 0.03%
CAPITAL GOODS (MISCELLANEOUS) 0.01%
TOTAL 100.00%
These allocations of assets were established on basis of data (gross) used by the entity responsible for the administration and bookkeeping and do not reflect inevitably the economic analysis which directed the assets selection.

DPAM CAPITAL B
Equities US Index
200
9.7. CHANGES IN THE COMPOSITION OF THE ASSETS IN EUR Equities US Index
1st semester 2nd semester Total
Purchases 3,683,055.86 40,268,099.51 43,951,155.37 Sales 62,287,803.44 29,358,943.62 91,646,747.06 Total 1 65,970,859.30 69,627,043.13 135,597,902.43 Subscriptions 11,497,021.33 48,267,435.02 59,764,456.35 Redemptions 70,945,119.75 37,137,982.05 108,083,101.80 Total 2 82,442,141.08 85,405,417.07 167,847,558.15 Reference average of the total net asset 238,324,765.67 249,539,036.64 243,977,987.20
Rotation Percentage -6.91% -6.32% -13.22%
The rotation rate gives the annual average of the transactions. A figure close to 0% shows that the transactions relating to the securities or the assets with the exception of deposits and liquid assets during a given period, were done exclusively in function of the subscriptions and redemptions. A negative percentage indicates that the subscriptions and redemptions give rise to only few or, as the case may be, no transactions in the portfolio.
A detailed list of the transactions carried out during the financial year can be consulted, free of charge, at Banque Degroof Petercam S.A with its registered office at Rue de l’Industrie 44 - B-1040 Brussels which provides the financial services.

DPAM CAPITAL B
201
9.8. VALUE OF COMMITMENTS RELATING TO POSITIONS IN FINANCIAL DERIVATIVES
Commitment on futures
Description Currency In currency En EUR Lot-size
SP 500 EMINI FUTURE USD 955,746.00 840,437.92 50.00

DPAM CAPITAL B
Equities US Index
202
9.9. EVOLUTION OF SUBSCRIPTIONS, REDEMPTIONS AND THE NET ASSET
VALUE Equities US Index
Evolution of the number of shares in circulation
31 December 2019 31 December 2020 31 December 2021
Class Subscriptions Redemptions End of Period Subscriptions Redemptions End of Period Subscriptions Redemptions End of Period
A (Dis) 36,896.31 28,113.00 93,670.91 28,371.37 21,725.80 100,316.49 10,581.66 72,458.10 38,440.06
A USD (Dis) 4,390.00 8,251.90 13,080.00 517.00 8,690.00 4,907.00 346.84 1,480.00 3,773.84
B (Cap) 109,294.68 181,160.12 547,768.30 101,978.54 207,387.40 442,359.45 119,026.07 135,851.57 425,533.95
B USD (Cap) 14,331.00 29,289.49 142,659.00 5,179.51 111,356.00 36,482.51 554.76 8,494.00 28,543.26
E (Dis) 220.00 1,953.82 319.54 0.00 0.00 0.00 3,794.17 0.00 3,794.17
E USD (Dis) 0.00 0.00 0.00 0.00 0.00 0.00 0.00 0.00 0.00
F (Cap) 19,896.00 26,807.00 84,345.00 9,690.00 57,311.00 36,724.00 19,588.00 14,163.00 42,149.00
F USD (Cap) 0.00 0.00 0.00 0.00 0.00 0.00 0.00 0.00 0.00
I 0.00 0.00 0.00 0.00 0.00 0.00 0.00 0.00 0.00
J (Cap) 0.00 1,279.00 23,380.90 0.00 0.00 0.00 0.00 0.00 0.00
M (Dis) 98,720.52 19,540.56 228,034.32 24,926.26 109,808.69 143,151.89 16,354.62 64,942.84 94,563.68
M USD (Dis) 0.00 277.00 1,844.01 0.00 0.00 0.00 0.00 0.00 0.00
N (Cap) 99,907.75 65,121.89 499,328.40 14,335.00 210,823.12 302,840.27 828.00 80,630.83 223,037.45
N USD (Cap) 24,495.93 36,674.43 192,062.25 49,538.00 167,581.04 74,019.21 4,200.00 7,076.25 71,142.96
P (Cap) 402.00 1,999.00 3,388.00 75.00 2,226.00 1,237.00 1.00 681.00 557.00
TOTAL 1,829,880.63 1,142,037.82 931,535.35
Payable and receivable amounts for the UCI
EUR 31 December 2019 31 December 2020 31 December 2021
Class Subscriptions Redemptions Subscriptions Redemptions Subscriptions Redemptions
A (Dis) 4,860,883.96 3,975,707.76 4,106,568.33 3,218,113.73 2,051,511.55 13,945,466.55
A USD (Dis) 530,659.13 1,121,444.81 84,157.23 1,114,666.13 62,965.35 268,007.15
B (Cap) 14,879,398.49 25,945,506.83 14,625,316.89 31,154,714.70 25,679,691.24 25,806,008.12
B USD (Cap) 1,945,782.17 4,007,830.10 810,497.55 17,711,603.63 113,777.31 1,751,746.55
E (Dis) 175,740.40 1,494,358.21 0.00 0.00 800,796.67 0.00
E USD (Dis) 0.00 0.00 0.00 0.00 0.00 0.00
F (Cap) 16,599,281.42 22,902,631.71 8,793,006.02 53,438,727.08 26,915,994.78 15,834,229.61
F USD (Cap) 0.00 0.00 0.00 0.00 0.00 0.00
I 0.00 0.00 0.00 0.00 0.00 0.00
J (Cap) 0.00 40,263,532.56 0.00 0.00 0.00 0.00
M (Dis) 13,470,702.56 2,580,432.87 3,727,922.16 16,095,976.88 2,981,942.05 11,558,932.52
M USD (Dis) 0.00 37,717.96 0.00 0.00 0.00 0.00
N (Cap) 14,965,177.60 9,071,417.18 2,139,845.38 32,805,383.00 158,962.93 15,443,053.41
N USD (Cap) 3,340,462.53 5,071,877.25 7,812,324.72 26,366,633.20 962,902.15 1,487,762.80
P (Cap) 9,450,448.35 48,662,842.01 1,744,391.43 56,685,267.12 35,912.32 21,987,895.09
TOTAL 80,218,536.61 165,135,299.25 43,844,029.71 238,591,085.47 59,764,456.35 108,083,101.80
net asset value
EUR 31 December 2019 31 December 2020 31 December 2021
Class of the subfund Per share of the subfund Per share of the subfund Per share
A (Dis)
A USD (Dis)
B (Cap)
B USD (Cap)
E (Dis)
E USD (Dis)
F (Cap)
F USD (Cap)
I
J (Cap)
M (Dis)
M USD (Dis)
N (Cap)
N USD (Cap)
P (Cap)
1,220,823,119.62
149.56
168.77
154.08
173.83
923.67
0.00
941.13
0.00
0.00
33,762.81
149.78
168.51
154.76
174.64
25,880.52
260,611,496.71
163.43
200.90
170.18
209.34
0.00
0.00
1,042.48
0.00
0.00
0.00
163.59
0.00
171.31
210.86
28,740.44
285,804,330.46
221.31
252.72
230.41
263.53
221.35
0.00
1,415.68
0.00
0.00
0.00
221.99
0.00
232.46
266.16
39,131.67
TOTAL 1,220,823,119.62 260,611,496.71 285,804,330.46
On the date of publication of this report, the net asset value per share is published on the following websites: www.dpamfunds.com and www.beama.be. This information is also available at the counters of the financial services department.

DPAM CAPITAL B
Equities US Index
203
9.10. PERFORMANCES
Figures reflect past performance and are not an indicator of future performance. These figures do not include any restructuring. Returns are determined at the end of the financial year. The annual return is defined as the absolute return earned over a year. For the semi-annual report, the accounting year is 12-month period preceding the end of the half-year. From 2011, the calculation of the performance of the capitalization units is calculated similarly to the distribution units. This change is also applied to past performance. This change of method does not bring any significant difference compared to the method used previously. Bar chart showing annual returns of the last 10 years (in % and calculated in EUR) as of 31 December 2021: Class A (Dis) Table showing historical performance (actuarial returns):
Average cumulated returns Since
1 year 3 year 5 year 10 year
Year Value
Class A (Dis) 35.42 % (in EUR)
25.64 % (in EUR)
15.83 % (in EUR)
09/11/2016 16.98 % (in EUR)
Class A USD (Dis) Table showing historical performance (actuarial returns):
Average cumulated returns Since
1 year 3 year 5 year 10 year
Year Value
Class A USD (Dis)
25.79 % (in EUR)
25.42 % (in EUR)
17.62 % (in EUR)
19/10/2016 17.87 % (in EUR)

DPAM CAPITAL B
Equities US Index
204
Class B (Cap) Annual return:
It is a passively managed sub-fund, which means that the portfolio manager aims to replicate the performance of a benchmark. Table showing historical performance (actuarial returns):
Average cumulated returns Since
1 year 3 year 5 year 10 year
Year Value
Class B (Cap) 35.39 % (in EUR)
25.66 % (in EUR)
15.88 % (in EUR)
16.98 % (in EUR)
27/03/1996 9.81 % (in EUR)
Class B USD (Cap) Table showing historical performance (actuarial returns):
Average cumulated returns Since
1 year 3 year 5 year 10 year
Year Value
Class B USD (Cap)
25.89 % (in EUR)
25.49 % (in EUR)
17.68 % (in EUR)
15.50 % (in EUR)
21/11/2007 10.29 % (in EUR)
Class E (Dis) Table showing historical performance (actuarial returns):
Average cumulated returns Since
1 year 3 year 5 year 10 year
Year Value
Class E (Dis) 02/12/2021 3.33 % (in EUR)
13
.1%
25
.5%
27
.5%
11
.6%
13
.7%
6.0
%
-0.6
%
32
.7%
10
.4%
35
.4%
13
.6%
26
.1%
28
.3%
12
.2%
14
.2%
6.4
%
-0.3
%
33
.3%
10
.8%
36
.1%
-5.00%
0.00%
5.00%
10.00%
15.00%
20.00%
25.00%
30.00%
35.00%
40.00%
2012 2013 2014 2015 2016 2017 2018 2019 2020 2021
Class B (Cap) MSCI USA Net Return

DPAM CAPITAL B
Equities US Index
205
Class F (Cap) Table showing historical performance (actuarial returns):
Average cumulated returns Since
1 year 3 year 5 year 10 year
Year Value
Class F (Cap) 35.80 % (in EUR)
26.04 % (in EUR)
16.24 % (in EUR)
17.23 % (in EUR)
14/12/2017 12.07 % (in EUR)
Class M (Dis) Table showing historical performance (actuarial returns):
Average cumulated returns Since
1 year 3 year 5 year 10 year
Year Value
Class M (Dis) 35.70 % (in EUR)
25.94 % (in EUR)
29/12/2017 18.73 % (in EUR)
Class N (Cap) Table showing historical performance (actuarial returns):
Average cumulated returns Since
1 year 3 year 5 year 10 year
Year Value
Class N (Cap) 35.70 % (in EUR)
25.94 % (in EUR)
29/12/2017 18.73 % (in EUR)
Class N USD (Cap) Table showing historical performance (actuarial returns):
Average cumulated returns Since
1 year 3 year 5 year 10 year
Year Value
Class N USD (Cap)
26.23 % (in EUR)
25.82 % (in EUR)
01/01/2013 19.09 % (in EUR)
Class P (Cap) Table showing historical performance (actuarial returns):
Average cumulated returns Since
1 year 3 year 5 year 10 year
Year Value
Class P (Cap) 36.16 % (in EUR)
26.36 % (in EUR)
16.54 % (in EUR)
12/04/2013 16.95 % (in EUR)

DPAM CAPITAL B
Equities US Index
206
9.11. CHARGES Equities US Index
Ongoing charges
The ongoing charges, calculated in accordance with the provisions of European Commission Regulation 583/2010 of 1 July 2010. These charges include transaction fees incurred by the sub-fund when it subscribes to and/or sells units of another fund, but do not include either (i) the fees incurred by the sub-fund when it makes investments other than subscriptions/sales of units of funds or, where applicable, (ii) the performance fee These charges are based on the fees charged in fund accounting for one year prior to the end of the period under review. In the event of a change in the cost structure during the financial year or if the share class is issued during the financial year, the amount of the reported current expenses is calculated on the basis of an estimate based on the expected total amount of the annual expenses (which could be determined by comparison with a similar class).
Taking into account the change in the cost structure during the year, the estimated fees are :
- Class A (Dis) - BE6289146548: 0.69 % - Class A USD (Dis) - BE6289147553: 0.69 % - Class B (Cap) - BE6278404791: 0.65 % - Class B USD (Cap) - BE6278409840: 0.62 % - Class E (Dis) - BE6289150581: 0.36 % - Class F (Cap) - BE0947570744: 0.36 % - Class M (Dis) - BE6299549780: 0.44 % - Class N (Cap) - BE6299550796: 0.43 % - Class N USD (Cap) - BE6304438201: 0.35 % - Class P (Cap) - BE6249811041: 0.10 % Fee sharing On 31 December 2021, 0.49% of the remuneration due to the manager has been retroceded to other distributors, third parties and Bank Degroof Petercam or one of its subsidiaries.
9.12. NOTES TO THE FINANCIAL STATEMENTS AND OTHER INFORMATION
9.12.1. Gross dividends paid in the financial year
2016/2017 2.81 EUR 2018 class A 1.85 EUR class E 15.00 EUR class A USD 2.17 EUR (2.46 USD) class M 2.30 EUR class M USD 2.68 EUR (3.03 USD) 2019 class A 1.20 EUR class A USD 1.40 USD class E 10.50 EUR class M 1.57 EUR class M USD 1.93 USD
DPAM CAPITAL B
Equities US Index
207
9.12.2. Investment restrictions and overruns
Between the NAV dates of 9/11/2021 and 10/11/2021, a passive violation of the prospectus was opened in the sub-fund DPAM Capital B Equities US Index. The violation was caused by the fact that the sub-fund must be invested only in issues of the MSCI index. On the NAV date 09/11/2021, as a result of a split, the fund received shares of KYNDRYL HOLDINGS INCORPORATION that are not part of the index. The breakout was resolved as the position was sold.
9.12.3. Transparency in sustainability
Mandatory reporting in accordance with Article 7 of Regulation (EU) 2020/852 of 18 June 2020 on the establishment of a framework to promote sustainable investment and amending Regulation (EU) 2019/2088 The investments underlying this sub-fund do not take into account the European Union's criteria for environmentally sustainable economic activities.
9.12.4. Transparency of the securities financing transactions and of reuse
In accordance with Article 13 and Section A of the Annex to Regulation EU 2015/2365 (hereinafter the Regulation), the Sicav must inform investors of its use of securities financing transactions and total return swaps in the annual report and the half-yearly report. The portfolio does not contain any loaned assets at the date of this report.
Equities US Index

DPAM CAPITAL B
Equities World ex Japan, Europe & USA Index
208
10. INFORMATION ABOUT THE SUBFUND DPAM CAPITAL B EQUITIES WORLD EX JAPAN, EUROPE & USA INDEX
Equities World ex Japan, Europe & USA Index
10.1. MANAGEMENT REPORT
10.1.1. Launch date of the sub-fund and subscription price of the shares
Initial subscription day: March 19, 2001 Initial subscription price: 100.00 EUR. On July 30, 2015 the shares of class B were divided into 2.
10.1.2. Stock exchange listing
The shares of the sub-fund are not listed on an exchange.
10.1.3. Aim and main outlines of the investment policy
The objective of the sub-fund is to provide shareholders with as high a global return as possible, with an accent on investments in equities from Pacific Basin countries (ex-Japan), Canada and Israel. This is a passively managed sub-fund, which means that the portfolio manager's objective is to replicate the performance of a benchmark.
10.1.4. Financial management of the portfolio
Degroof Petercam Asset Management S.A. Rue Guimard, 18, 1040 Brussels
10.1.5. Distributor
Degroof Petercam Asset Management S.A. Rue Guimard, 18, 1040 Brussels
10.1.6. Index and benchmark
The sub-fund uses the following index as a benchmark: MSCI World ex JEU Net Return MSCI World ex JEU Net Return: Composite index based on the MSCI [Daily Total Return Net] Australia, Canada, Hong Kong, New Zealand, Singapore and Israel indices of MSCI Inc. This benchmark is used for the management of the sub-fund. MSCI World ex JEU Net Return covers approximately 85% of the free float market capitalization of the countries in the zone Australia, Canada, Hong Kong, New Zealand, Singapore and Israel included in the index. Additional information on the index and its composition is available at www.msci.com. The performance of the benchmark is calculated by reinvesting net dividends (Net Return). The “tracking error” is of the order of 1.4%. This is a passively managed sub-fund, which means that the portfolio manager aims to replicate the performance of a benchmark.
10.1.7. Policy followed during the year
The “Net Asset Value” of the fund (B share) on December 31, 2021 was 179.80 EUR and its performance between December 31, 2020 and December 31, 2021 is 22.45% (in EUR). The benchmark of the Equities World ex Japan, Europe and USA index is the MSCI Daily Net Total Return Index Australia, Canada, Hong Kong, New Zealand, Singapore and Israel.

DPAM CAPITAL B
Equities World ex Japan, Europe & USA Index
209
The Benchmark, dividends net of local withholding tax reinvested, is based on the market capitalization of the MSCI indices for Australia, Canada, Hong Kong, New Zealand, Singapore and Israel. As of December 31, 2021, the index had 227 positions. The index value can be viewed on MSCI's website, www.msci.com/end-of-day-data-search. The composition of its indices can be viewed on the MSCI’s website, www.msci.com/constituents. The objective of the fund is to physically and fully replicate the composition of the underlying index. As in the past, full investment continued in this compartment. The level of cash was kept at a very low level.
10.1.8. Future policy
As in the past, the Equities World Ex Japan, Europe and USA Index sub-fund will pursue an investment policy based on geographic and sector indexation. The benchmark remains the same.
10.1.9. Synthetic risk and reward indicator
The synthetic risk and return indicator gives an indication of the risk associated with investing in a sub-fund. It places this risk on a scale ranging from one (lowest risk) to seven (highest risk). Risk and reward profile: 6
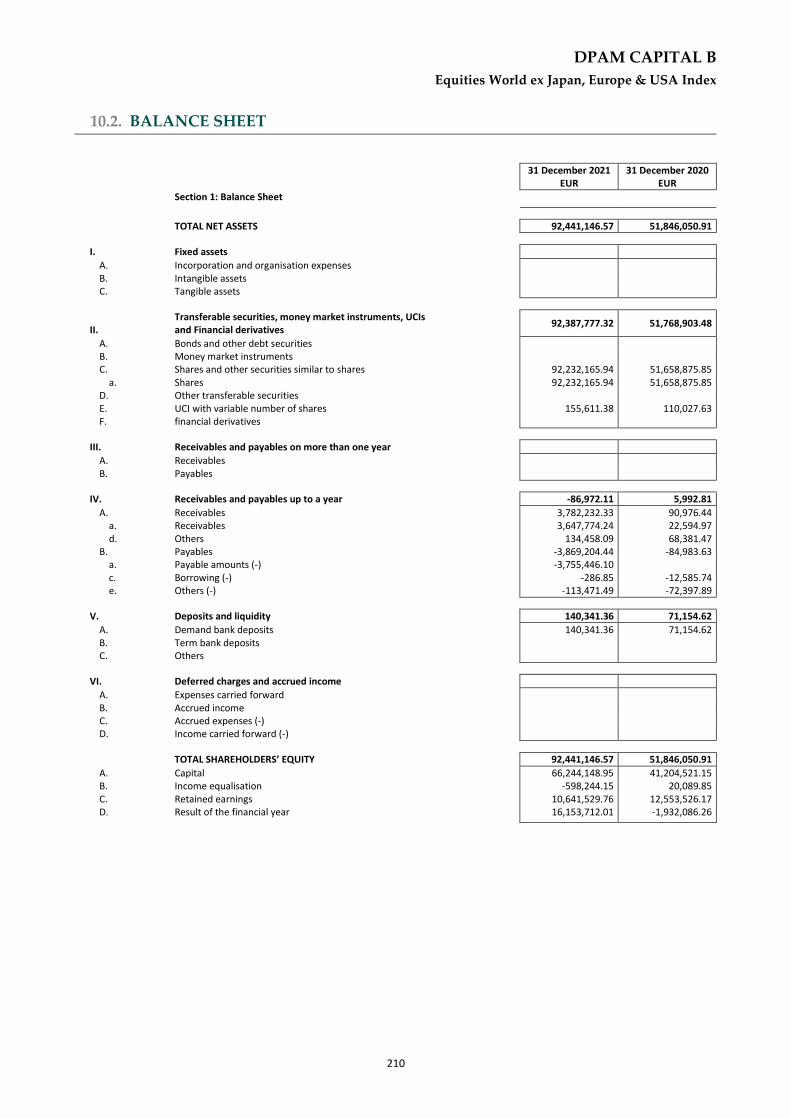
DPAM CAPITAL B
Equities World ex Japan, Europe & USA Index
210
10.2. BALANCE SHEET
31 December 2021
EUR 31 December 2020
EUR
Section 1: Balance Sheet
TOTAL NET ASSETS 92,441,146.57 51,846,050.91
I. Fixed assets
A. Incorporation and organisation expenses B. Intangible assets C. Tangible assets
II. Transferable securities, money market instruments, UCIs and Financial derivatives
92,387,777.32 51,768,903.48
A. Bonds and other debt securities B. Money market instruments C. Shares and other securities similar to shares 92,232,165.94 51,658,875.85 a. Shares 92,232,165.94 51,658,875.85 D. Other transferable securities E. UCI with variable number of shares 155,611.38 110,027.63 F. financial derivatives
III. Receivables and payables on more than one year
A. Receivables B. Payables
IV. Receivables and payables up to a year -86,972.11 5,992.81
A. Receivables 3,782,232.33 90,976.44 a. Receivables 3,647,774.24 22,594.97 d. Others 134,458.09 68,381.47 B. Payables -3,869,204.44 -84,983.63 a. Payable amounts (-) -3,755,446.10 c. Borrowing (-) -286.85 -12,585.74 e. Others (-) -113,471.49 -72,397.89
V. Deposits and liquidity 140,341.36 71,154.62
A. Demand bank deposits 140,341.36 71,154.62 B. Term bank deposits C. Others
VI. Deferred charges and accrued income
A. Expenses carried forward B. Accrued income C. Accrued expenses (-) D. Income carried forward (-)
TOTAL SHAREHOLDERS’ EQUITY 92,441,146.57 51,846,050.91
A. Capital 66,244,148.95 41,204,521.15 B. Income equalisation -598,244.15 20,089.85 C. Retained earnings 10,641,529.76 12,553,526.17 D. Result of the financial year 16,153,712.01 -1,932,086.26
Equities World ex Japan, Europe & USA Index

DPAM CAPITAL B
Equities World ex Japan, Europe & USA Index
211
31 December 2021
EUR 31 December 2020
EUR
Section 2: Off-balance sheet
I. Collateral (+/-)
A. Collateral (+/-) B. Other collateral
II. Underlying securities of the option contracts and warrants (+)
A. Option contracts and warrants bought B. Option contracts and warrants sold
III. Notional amount of futures contracts (+)
A. Futures contracts bought and Forward contracts B. Futures contracts sold and Forward Contracts
IV. Notional amount of the swap contracts (+)
A. Purchased swap contracts B. Sold swap contracts
V. Notional amount of other financial derivatives (+)
A. Purchased contracts B. Sold contracts
VI. Uncalled amounts on shares
VII. Commitments to resell on account of purchase-repurchase agreements
VIII. Commitments to repurchase on account of purchase-repurchase agreements
IX. Lent financial instruments

DPAM CAPITAL B
Equities World ex Japan, Europe & USA Index
212
10.3. INCOME STATEMENT
31 December 2021
EUR 31 December 2020
EUR
Section 3: Income and expenditure account
I. Depreciation, capital loss and capital gain 13,775,582.37 -3,173,215.46
A. Bonds and other debt securities
B. Money market instruments
C. Shares and other securities similar to shares 13,766,474.28 -3,119,016.22
a. Shares 13,766,474.28 -3,119,016.22
Realised gain 5,596,084.76 865,489.53
Realised loss -2,289,147.16 -2,439,297.65
Unrealised gain and loss 10,459,536.68 -1,545,208.10
D. Other Transferable Securities 4,017.29 2,252.77
Realised gain 4,017.29 2,252.77
E. UCI with variable number of shares 16,649.84 -30,684.96
Realised gain 163.00
Realised loss -7,870.75
Unrealised gain and loss 24,357.59 -30,684.96
F. financial derivatives
G. Receivables, deposits, liquidity and payables
H. Foreign exchange positions and transactions -11,559.04 -25,767.05
b. Other exchange positions and operations -11,559.04 -25,767.05
iv. Other -11,559.04 -25,767.05
Realised gain and loss -11,559.04 -25,767.05
II. Investment income and expenses 2,775,036.95 1,483,976.84
A. Dividends 2,992,766.64 1,617,977.51
B. Interest (+/-) 1,187.92 763.46
b. Deposits and liquidity 1,187.92 763.46
Interest on loans (-) -5,247.03 -2,302.38
Swap contracts (+/-)
Withholding tax (-) -213,670.58 -132,461.75
Foreign -213,670.58 -132,461.75
F. Other investment income
III. Other income 189,293.07 32,945.33
A. Anti dilution fee 189,293.07 32,945.33
B. Other
IV. Operating expenses -586,200.38 -275,792.97
A. Investment transaction and delivery costs (-) -205,189.62 -54,287.48
B. Financial expenses (-)
C. Custodian’s fee (-) -30,343.53 -12,293.55
D. Manager’s fee (-) -310,025.21 -188,862.48
a. Financial Management of the Portfolio -244,369.48 -142,138.53
Class A (Dis) -411.47 -527.17
Class B (Cap) -38,547.11 -28,665.95
Class F (Cap) -196,721.39 -103,607.71
Class N (Cap) -8,689.51 -9,337.70
b. Administration and accounting -65,655.73 -46,723.95
E. Administrative expenses (-) -15,913.88 -9,718.53
F. Incorporation and organisation expenses (-) -737.09 -332.72
G. Salaries and wages, social security charges and pensions (-) -240.43 1,552.94
H. Services and various goods (-) -6,403.22 -13,256.51
I. Depreciation and provisions for liabilities and charges (-)
J. Taxes -14,746.29 -9,596.52
Class A (Dis) -4.55 -27.26
Class B (Cap) -6,260.11 -5,135.81
Class F (Cap) -8,056.78 -3,882.21
Class N (Cap) -437.23 -553.30
Class P (Cap) 12.38 2.06
K. Other expenses (-) -2,601.11 11,001.88
Income and expenditure for the financial year Sub-Total II + III + IV 2,378,129.64 1,241,129.20
V. Current profit (loss) before income tax 16,153,712.01 -1,932,086.26
VI. Income tax
VII. Result of the financial year 16,153,712.01 -1,932,086.26
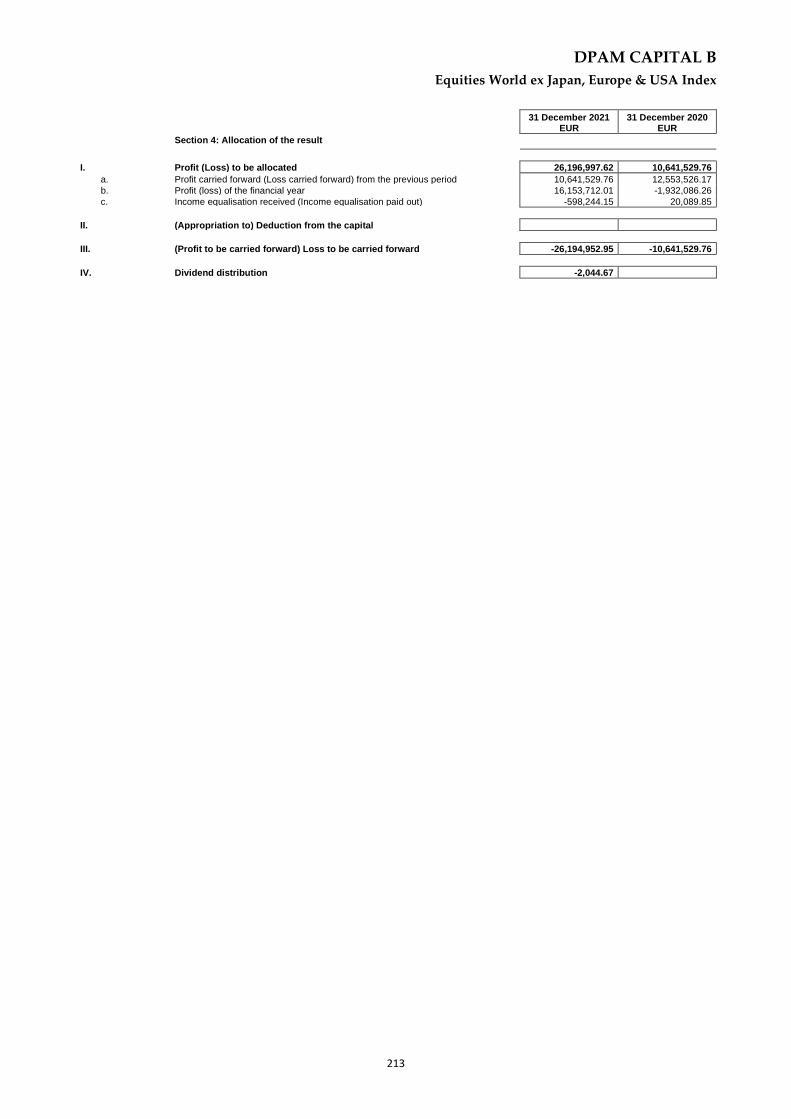
DPAM CAPITAL B
Equities World ex Japan, Europe & USA Index
213
31 December 2021
EUR 31 December 2020
EUR
Section 4: Allocation of the result
I. Profit (Loss) to be allocated 26,196,997.62 10,641,529.76
a. Profit carried forward (Loss carried forward) from the previous period 10,641,529.76 12,553,526.17
b. Profit (loss) of the financial year 16,153,712.01 -1,932,086.26
c. Income equalisation received (Income equalisation paid out) -598,244.15 20,089.85
II. (Appropriation to) Deduction from the capital
III. (Profit to be carried forward) Loss to be carried forward -26,194,952.95 -10,641,529.76
IV. Dividend distribution -2,044.67
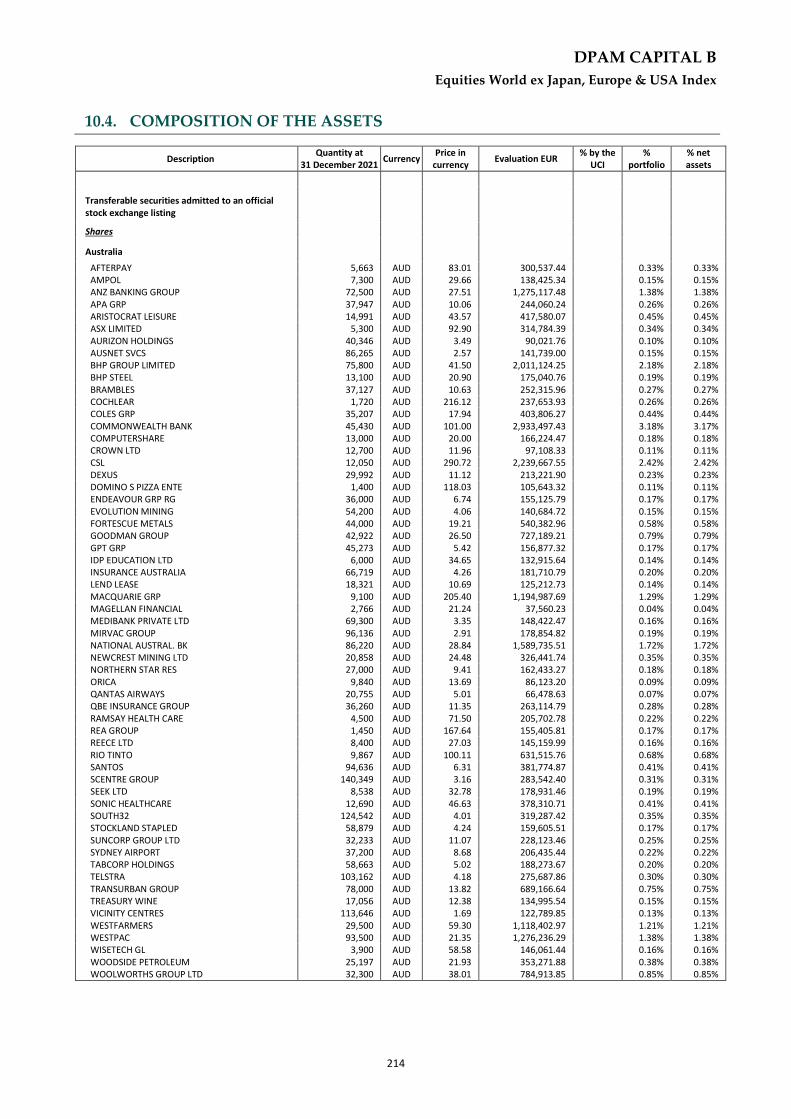
DPAM CAPITAL B
Equities World ex Japan, Europe & USA Index
214
10.4. COMPOSITION OF THE ASSETS
Equities World ex Japan, Europe & USA Index
Description Quantity at
31 December 2021 Currency
Price in currency
Evaluation EUR % by the
UCI %
portfolio % net assets
Transferable securities admitted to an official stock exchange listing
Shares
Australia
AFTERPAY 5,663 AUD 83.01 300,537.44 0.33% 0.33% AMPOL 7,300 AUD 29.66 138,425.34 0.15% 0.15% ANZ BANKING GROUP 72,500 AUD 27.51 1,275,117.48 1.38% 1.38% APA GRP 37,947 AUD 10.06 244,060.24 0.26% 0.26% ARISTOCRAT LEISURE 14,991 AUD 43.57 417,580.07 0.45% 0.45% ASX LIMITED 5,300 AUD 92.90 314,784.39 0.34% 0.34% AURIZON HOLDINGS 40,346 AUD 3.49 90,021.76 0.10% 0.10% AUSNET SVCS 86,265 AUD 2.57 141,739.00 0.15% 0.15% BHP GROUP LIMITED 75,800 AUD 41.50 2,011,124.25 2.18% 2.18% BHP STEEL 13,100 AUD 20.90 175,040.76 0.19% 0.19% BRAMBLES 37,127 AUD 10.63 252,315.96 0.27% 0.27% COCHLEAR 1,720 AUD 216.12 237,653.93 0.26% 0.26% COLES GRP 35,207 AUD 17.94 403,806.27 0.44% 0.44% COMMONWEALTH BANK 45,430 AUD 101.00 2,933,497.43 3.18% 3.17% COMPUTERSHARE 13,000 AUD 20.00 166,224.47 0.18% 0.18% CROWN LTD 12,700 AUD 11.96 97,108.33 0.11% 0.11% CSL 12,050 AUD 290.72 2,239,667.55 2.42% 2.42% DEXUS 29,992 AUD 11.12 213,221.90 0.23% 0.23% DOMINO S PIZZA ENTE 1,400 AUD 118.03 105,643.32 0.11% 0.11% ENDEAVOUR GRP RG 36,000 AUD 6.74 155,125.79 0.17% 0.17% EVOLUTION MINING 54,200 AUD 4.06 140,684.72 0.15% 0.15% FORTESCUE METALS 44,000 AUD 19.21 540,382.96 0.58% 0.58% GOODMAN GROUP 42,922 AUD 26.50 727,189.21 0.79% 0.79% GPT GRP 45,273 AUD 5.42 156,877.32 0.17% 0.17% IDP EDUCATION LTD 6,000 AUD 34.65 132,915.64 0.14% 0.14% INSURANCE AUSTRALIA 66,719 AUD 4.26 181,710.79 0.20% 0.20% LEND LEASE 18,321 AUD 10.69 125,212.73 0.14% 0.14% MACQUARIE GRP 9,100 AUD 205.40 1,194,987.69 1.29% 1.29% MAGELLAN FINANCIAL 2,766 AUD 21.24 37,560.23 0.04% 0.04% MEDIBANK PRIVATE LTD 69,300 AUD 3.35 148,422.47 0.16% 0.16% MIRVAC GROUP 96,136 AUD 2.91 178,854.82 0.19% 0.19% NATIONAL AUSTRAL. BK 86,220 AUD 28.84 1,589,735.51 1.72% 1.72% NEWCREST MINING LTD 20,858 AUD 24.48 326,441.74 0.35% 0.35% NORTHERN STAR RES 27,000 AUD 9.41 162,433.27 0.18% 0.18% ORICA 9,840 AUD 13.69 86,123.20 0.09% 0.09% QANTAS AIRWAYS 20,755 AUD 5.01 66,478.63 0.07% 0.07% QBE INSURANCE GROUP 36,260 AUD 11.35 263,114.79 0.28% 0.28% RAMSAY HEALTH CARE 4,500 AUD 71.50 205,702.78 0.22% 0.22% REA GROUP 1,450 AUD 167.64 155,405.81 0.17% 0.17% REECE LTD 8,400 AUD 27.03 145,159.99 0.16% 0.16% RIO TINTO 9,867 AUD 100.11 631,515.76 0.68% 0.68% SANTOS 94,636 AUD 6.31 381,774.87 0.41% 0.41% SCENTRE GROUP 140,349 AUD 3.16 283,542.40 0.31% 0.31% SEEK LTD 8,538 AUD 32.78 178,931.46 0.19% 0.19% SONIC HEALTHCARE 12,690 AUD 46.63 378,310.71 0.41% 0.41% SOUTH32 124,542 AUD 4.01 319,287.42 0.35% 0.35% STOCKLAND STAPLED 58,879 AUD 4.24 159,605.51 0.17% 0.17% SUNCORP GROUP LTD 32,233 AUD 11.07 228,123.46 0.25% 0.25% SYDNEY AIRPORT 37,200 AUD 8.68 206,435.44 0.22% 0.22% TABCORP HOLDINGS 58,663 AUD 5.02 188,273.67 0.20% 0.20% TELSTRA 103,162 AUD 4.18 275,687.86 0.30% 0.30% TRANSURBAN GROUP 78,000 AUD 13.82 689,166.64 0.75% 0.75% TREASURY WINE 17,056 AUD 12.38 134,995.54 0.15% 0.15% VICINITY CENTRES 113,646 AUD 1.69 122,789.85 0.13% 0.13% WESTFARMERS 29,500 AUD 59.30 1,118,402.97 1.21% 1.21% WESTPAC 93,500 AUD 21.35 1,276,236.29 1.38% 1.38% WISETECH GL 3,900 AUD 58.58 146,061.44 0.16% 0.16% WOODSIDE PETROLEUM 25,197 AUD 21.93 353,271.88 0.38% 0.38% WOOLWORTHS GROUP LTD 32,300 AUD 38.01 784,913.85 0.85% 0.85%

DPAM CAPITAL B
Equities World ex Japan, Europe & USA Index
215
Description Quantity at
31 December 2021 Currency
Price in currency
Evaluation EUR % by the
UCI %
portfolio % net assets
26,335,417.00 28.51% 28.49%
Bermuda
CK INFRASTRUCTURE 27,000 HKD 49.65 151,202.07 0.16% 0.16% HONGKONG LAND HLDGS 31,100 USD 5.20 142,208.93 0.15% 0.15% JARDINE 5,400 USD 55.01 261,215.27 0.28% 0.28%
554,626.27 0.60% 0.60%
Canada
1ST QUANTUM MINLS 15,922 CAD 30.27 335,509.18 0.36% 0.36% AGNICO EAGLE MINES 6,900 CAD 67.19 322,736.51 0.35% 0.35% AIR CANADA VTG 3,700 CAD 21.13 54,424.64 0.06% 0.06% ALGONQUIN POWER 15,300 CAD 18.27 194,591.72 0.21% 0.21% ALIMENTATION COUCHE 21,000 CAD 53.00 774,799.86 0.84% 0.84% ALTAGAS LTD 9,300 CAD 27.31 176,806.82 0.19% 0.19% BALLARD POWER SYST 5,300 CAD 15.89 58,626.52 0.06% 0.06% BANK OF NOVA SCOTIA 31,000 CAD 89.55 1,932,509.57 2.09% 2.09% BARRICK 47,881 CAD 24.05 801,627.60 0.87% 0.87% BAUSCH HEALTH CIES 7,450 CAD 34.94 181,206.40 0.20% 0.20% BCE 1,792 CAD 65.81 82,096.43 0.09% 0.09% BLACKBERRY LTD 11,690 CAD 11.82 96,189.21 0.10% 0.10% BROOKFIELD ASSET MAN 36,058 CAD 76.39 1,917,487.38 2.08% 2.07% BROOKFIELD RN CORP A 3,950 USD 36.83 127,926.93 0.14% 0.14% CAE 8,685 CAD 31.91 192,926.11 0.21% 0.21% CANADIAN APARTMENT 1,600 CAD 59.96 66,784.55 0.07% 0.07% CANADIAN IMPERIAL 11,600 CAD 147.45 1,190,685.69 1.29% 1.29% CANADIAN NAT RAILWAY 18,200 CAD 155.38 1,968,615.38 2.13% 2.13% CANADIAN NAT RES LTD 31,000 CAD 53.45 1,153,463.28 1.25% 1.25% CANADIAN TIRE CORP 1,550 CAD 181.44 195,775.84 0.21% 0.21% CANADIAN UTILITIES 3,856 CAD 36.69 98,487.04 0.11% 0.11% CANOPY GROWTH 5,700 CAD 11.04 43,806.47 0.05% 0.05% CCL INDUSTRIES B 4,200 CAD 67.83 198,319.53 0.21% 0.21% CDN PACIFIC RAILWAY 23,750 CAD 90.98 1,504,194.22 1.63% 1.63% CENOVUS ENERGY INC 36,839 CAD 15.51 397,753.49 0.43% 0.43% CGI INC 5,800 CAD 111.85 451,604.59 0.49% 0.49% CONSTELLATION SOFTW 530 CAD 2,346.94 865,908.95 0.94% 0.94% DOLLARAMA 7,528 CAD 63.31 331,777.01 0.36% 0.36% EMERA 7,200 CAD 63.22 316,870.17 0.34% 0.34% EMPIRE CO LTD 4,700 CAD 38.54 126,096.76 0.14% 0.14% ENBRIDGE 54,000 CAD 49.41 1,857,389.49 2.01% 2.01% FAIRFAX FINANCIAL 630 CAD 622.24 272,893.28 0.30% 0.30% FIRSTSERVICE CORP 1,050 CAD 248.60 181,712.50 0.20% 0.20% FORTIS 13,244 CAD 61.03 562,674.08 0.61% 0.61% FRANCO-NEVADA 5,000 CAD 174.94 608,910.55 0.66% 0.66% GEORGE WESTON 1,902 CAD 146.66 194,185.40 0.21% 0.21% GFL ENVIRONMENTAL 4,400 CAD 47.83 146,503.31 0.16% 0.16% GILDAN ACTIVEWEAR 4,936 CAD 53.63 184,279.62 0.20% 0.20% GREAT WEST LIFECO 6,819 CAD 37.96 180,194.39 0.20% 0.19% HYDRO ONE 9,000 CAD 32.91 206,188.65 0.22% 0.22% IA FINANCIAL CORP 2,677 CAD 72.38 134,884.27 0.15% 0.15% IGM FINANCIAL INC 2,500 CAD 45.62 79,394.36 0.09% 0.09% IMPERIAL OIL 7,481 CAD 45.62 237,579.69 0.26% 0.26% INTACT FINANCIAL 4,580 CAD 164.42 524,221.09 0.57% 0.57% IVANHOE MINES -A- 18,600 CAD 10.32 133,624.78 0.14% 0.14% KEYERA 5,500 CAD 28.53 109,234.25 0.12% 0.12% KINROSS GOLD 40,668 CAD 7.34 207,798.90 0.22% 0.22% KIRKLAND LAKE GOLD 8,256 CAD 53.01 304,664.50 0.33% 0.33% LIGHTSPD COMM 2,700 CAD 51.08 96,008.35 0.10% 0.10% LOBLAW COMPANIES 4,219 CAD 103.64 304,390.64 0.33% 0.33% LUNDIN MINING 20,400 CAD 9.88 140,307.69 0.15% 0.15% MAGNA INTERNATIONAL 7,281 CAD 102.35 518,768.08 0.56% 0.56% MANULIFE FINANCIAL 50,300 CAD 24.11 844,227.64 0.91% 0.91% METRO INC 5,971 CAD 67.32 279,824.38 0.30% 0.30% MONTREAL 16,850 CAD 136.19 1,597,494.95 1.73% 1.73% NATIONAL BANK CANADA 8,950 CAD 96.44 600,861.82 0.65% 0.65% NORTHLAND POWER INC 5,900 CAD 37.95 155,868.43 0.17% 0.17% NUTRIEN LTD 15,226 CAD 95.08 1,007,788.43 1.09% 1.09% NUVEI CORPORATION 1,800 CAD 82.00 102,749.74 0.11% 0.11% ONEX CORP 1,950 CAD 99.28 134,769.23 0.15% 0.15%

DPAM CAPITAL B
Equities World ex Japan, Europe & USA Index
216
Description Quantity at
31 December 2021 Currency
Price in currency
Evaluation EUR % by the
UCI %
portfolio % net assets
OPEN TEXT 6,524 CAD 60.04 272,677.31 0.30% 0.29% PAN AMERICAN SILVER 6,600 CAD 31.56 145,002.44 0.16% 0.16% PARKLAND 4,900 CAD 34.77 118,602.85 0.13% 0.13% PEMBINA PIPELINE 14,121 CAD 38.37 377,182.58 0.41% 0.41% POWER 14,800 CAD 41.80 430,657.85 0.47% 0.47% QUEBECOR INC -B- 4,600 CAD 28.55 91,423.60 0.10% 0.10% RESTAURANT BRANDS 7,200 USD 60.68 384,185.72 0.42% 0.42% RIOCAN REAL ESTATE 3,272 CAD 22.94 52,251.78 0.06% 0.06% RITCHIE BROTHERS 2,600 USD 61.21 139,945.48 0.15% 0.15% ROGERS COMMUNICATION 9,705 CAD 60.23 406,914.13 0.44% 0.44% ROYAL BANK CANADA 36,500 CAD 134.25 3,411,155.59 3.69% 3.69% SAPUTO 5,882 CAD 28.50 116,698.22 0.13% 0.13% SHAW COMM 11,000 CAD 38.39 293,971.46 0.32% 0.32% SHOPIFY SVTG-A 2,900 USD 1,377.39 3,512,514.07 3.80% 3.80% SUNCOR ENERGY INC 37,754 USD 25.03 830,973.11 0.90% 0.90% SUN LIFE FINANCIAL 15,138 CAD 70.41 741,988.57 0.80% 0.80% TC ENERGY CORP 25,900 CAD 58.83 1,060,701.01 1.15% 1.15% TELUS 11,300 CAD 29.79 234,338.32 0.25% 0.25% TFI INTL 2,200 CAD 141.87 217,273.93 0.24% 0.24% THOMSON REUTERS CORP 4,705 CAD 151.27 495,457.95 0.54% 0.54% TMX GROUP LTD 1,600 CAD 128.25 142,847.20 0.15% 0.15% TOROMONT INDUSTRIES 2,100 CAD 114.36 167,181.34 0.18% 0.18% TORONTO DOMINION BK 46,600 CAD 96.98 3,146,027.15 3.41% 3.40% TOURMALINE OIL 9,000 CAD 40.84 255,871.91 0.28% 0.28% WEST FRASER TIMBER 3,000 CAD 120.68 252,029.24 0.27% 0.27% WHEATON PRECIOUS MET 11,600 CAD 54.28 438,320.92 0.47% 0.47% WSP GLOBAL 3,000 CAD 183.63 383,494.60 0.42% 0.41%
46,188,688.67 49.99% 49.97%
Hongkong
AIA GROUP LTD 312,800 HKD 78.60 2,773,090.31 3.00% 3.00% BOC HONG KONG 91,056 HKD 25.55 262,406.26 0.28% 0.28% GALAXY ENTERTAINMENT 57,000 HKD 40.40 259,735.28 0.28% 0.28% HANG LUNG PROP 61,169 HKD 16.04 110,665.05 0.12% 0.12% HANG SENG BANK 20,000 HKD 142.70 321,905.72 0.35% 0.35% HENDERSON LAND DEV 32,901 HKD 33.20 123,203.18 0.13% 0.13% HK CHINA GAS 372,291 HKD 12.14 509,771.96 0.55% 0.55% HONG KONG EXCH CLEAR 30,923 HKD 455.40 1,588,361.56 1.72% 1.72% LINK REIT 54,300 HKD 68.65 420,450.71 0.46% 0.45% MTR CORP 37,871 HKD 41.85 178,762.72 0.19% 0.19% NEW WORLD DEV 40,654 HKD 30.85 141,459.84 0.15% 0.15% POWER ASSETS HLDGS 51,400 HKD 48.60 281,756.61 0.30% 0.30% SINO LAND CO 99,531 HKD 9.71 109,006.48 0.12% 0.12% SUN HUNG KAI PROP 35,300 HKD 94.60 376,652.25 0.41% 0.41% SWIRE PACIFIC 11,998 HKD 44.35 60,017.40 0.06% 0.06% SWIRE PROPERTIES 22,800 HKD 19.54 50,249.78 0.05% 0.05% TECHTRONIC INDUSTRIE 35,500 HKD 155.20 621,433.69 0.67% 0.67%
8,188,928.80 8.86% 8.86%
Ireland
JAMES HARDIES IND 12,138 AUD 55.30 429,134.93 0.46% 0.46%
429,134.93 0.46% 0.46%
Israel
AZRIELI GROUP 1,468 ILS 297.00 123,183.59 0.13% 0.13% BANK HAPOALIM B.M 31,149 ILS 32.10 282,500.68 0.31% 0.31% BANK LEUMI LE-ISRAEL 41,530 ILS 33.45 392,489.83 0.42% 0.42% CHECK POINT 2,800 USD 116.56 286,992.61 0.31% 0.31% CYBER-ARK SOFTWARE 1,150 USD 173.28 175,230.39 0.19% 0.19% FIVERR INTERNATIONAL 800 USD 113.70 79,985.93 0.09% 0.09% INMODE LTD 1,400 USD 70.58 86,890.61 0.09% 0.09% ISRAEL DISCOUNT BANK 34,000 ILS 20.94 201,152.74 0.22% 0.22% KORNIT DIGITAL 1,300 USD 152.25 174,045.90 0.19% 0.19% MIZRAHI TEFAHOT BANK 3,300 ILS 120.00 111,883.37 0.12% 0.12% NICE SYSTEMS 1,700 ILS 951.70 457,108.55 0.49% 0.49% TEVA-ADR- 31,000 USD 8.01 218,352.09 0.24% 0.24% WIX.COM LTD 1,400 USD 157.79 194,254.31 0.21% 0.21%

DPAM CAPITAL B
Equities World ex Japan, Europe & USA Index
217
Description Quantity at
31 December 2021 Currency
Price in currency
Evaluation EUR % by the
UCI %
portfolio % net assets
2,784,070.60 3.01% 3.01%
Cayman
BUDWEISER BREWING CO 53,000 HKD 20.45 122,248.60 0.13% 0.13% CHOW TAI FOOK JEWEL 43,000 HKD 14.02 67,997.23 0.07% 0.07% CK ASSET HL 52,000 HKD 49.15 288,271.42 0.31% 0.31% CK HUTCHISON HLDGS 73,424 HKD 50.30 416,563.05 0.45% 0.45% ESR CAYMAN LTD 57,000 HKD 26.35 169,406.55 0.18% 0.18% FUTU HLDG SP ADR-A 1,300 USD 43.30 49,498.77 0.05% 0.05% HKT LTD 114,922 HKD 10.48 135,843.60 0.15% 0.15% MELCO CROWN ADR 6,000 USD 10.18 53,710.87 0.06% 0.06% SANDS CHINA REG S 67,439 HKD 18.16 138,134.35 0.15% 0.15% SEA SP ADR 3,620 USD 223.71 712,126.45 0.77% 0.77% SITC INTL HLDGS 40,000 HKD 28.20 127,228.33 0.14% 0.14% WHARF REIC 46,758 HKD 39.60 208,845.84 0.23% 0.23% WH GRP-144A-S 205,000 HKD 4.89 113,067.41 0.12% 0.12% XINYI GLASS HLDGS 57,000 HKD 19.50 125,367.28 0.14% 0.14%
2,728,309.75 2.95% 2.95%
New Zealand
AUCKLD INTL AIRP 30,518 NZD 7.70 141,474.17 0.15% 0.15% FISH PAYK HEALTH 15,545 NZD 32.76 306,594.94 0.33% 0.33% MERCURY NZ 20,000 NZD 6.12 73,690.55 0.08% 0.08% MERIDIAN ENERGY LTD 43,539 NZD 4.85 127,130.73 0.14% 0.14% RYMAN HEALTHCAR 9,367 NZD 12.25 69,082.33 0.07% 0.07% SPARK NEW ZEALAND 48,000 NZD 4.52 130,620.11 0.14% 0.14% XERO LTD 3,612 AUD 141.44 326,619.11 0.35% 0.35%
1,175,211.94 1.27% 1.27%
Singapore
ASCENDAS REIT 80,673 SGD 2.95 155,231.46 0.17% 0.17% CAPITALAND INV 74,820 SGD 3.41 166,418.50 0.18% 0.18% CITY DEVELOPMENTS 6,587 SGD 6.81 29,259.32 0.03% 0.03% DBS GROUP HOLD 47,073 SGD 32.66 1,002,807.50 1.09% 1.08% GENTING SINGAPORE 147,085 SGD 0.78 74,353.19 0.08% 0.08% KEPPEL 36,897 SGD 5.12 123,222.65 0.13% 0.13% MAPLETREE COMMERCIAL 68,000 SGD 2.00 88,709.15 0.10% 0.10% MAPLETREE LOGISTICS 67,950 SGD 1.90 84,211.73 0.09% 0.09% OVERSEA-CHINESE BK 89,092 SGD 11.40 662,480.46 0.72% 0.72% SINGAPORE AIRLINES 33,700 SGD 4.99 109,688.21 0.12% 0.12% SINGAPORE EXCHANGE 20,000 SGD 9.30 121,322.81 0.13% 0.13% SINGAPORE TECHNO 50,400 SGD 3.76 123,608.38 0.13% 0.13% SINGAP TELECOM 1000 213,800 SGD 2.32 323,537.93 0.35% 0.35% UNITED OVERSEAS BANK 30,300 SGD 26.90 531,648.29 0.58% 0.58% UOL GROUP 12,300 SGD 7.09 56,882.79 0.06% 0.06% VENTURE CORPO 5,700 SGD 18.31 68,075.79 0.07% 0.07% WILMAR INTL LTD 46,778 SGD 4.14 126,319.82 0.14% 0.14%
3,847,777.98 4.16% 4.16%
Total - Shares 92,232,165.94 99.83% 99.77%
UCI with variable number of shares
Real estate
Non Directive 2009/65/CE - Non FSMA
CAPITALAND INT COMM 116,945 SGD 2.04 155,611.38 0.17% 0.17%
Total - Non Directive 2009/65/CE - Non FSMA 155,611.38 0.17% 0.17%
Total - Real estate 155,611.38 0.17% 0.17%
Total - UCI with variable number of shares 155,611.38 0.17% 0.17%
Total - Transferable securities admitted to an official stock exchange listing
92,387,777.32 100.00% 99.94%

DPAM CAPITAL B
Equities World ex Japan, Europe & USA Index
218
Description Quantity at
31 December 2021 Currency
Price in currency
Evaluation EUR % by the
UCI %
portfolio % net assets
Total - portfolio 92,387,777.32 100.00% 99.94%
Collatéral 0.00 0.00%
Deposits and liquid assets
deposit and liquid assets
Banque Degroof Petercam ILS 21,643.14 0.02%
Banque Degroof Petercam HKD 15,685.80 0.02%
Banque Degroof Petercam CAD 32,803.43 0.04%
Banque Degroof Petercam AUD 1,702.16 0.00%
Banque Degroof Petercam USD 26,627.33 0.03%
Banque Degroof Petercam CHF 75.40 0.00%
Banque Degroof Petercam EUR 35,317.45 0.04%
Banque Degroof Petercam SGD 3,310.43 0.00%
Banque Degroof Petercam NZD 3,176.22 0.00%
Total - deposit and liquid assets 140,341.36 0.15%
Total - Deposits and liquid assets 140,341.36 0.15%
Other receivables and other payables -86,972.11 -0.09%
Others 0.00 0.00%
Total net assets 92,441,146.57 100,00%
Equities World ex Japan, Europe & USA Index

DPAM CAPITAL B
Equities World ex Japan, Europe & USA Index
219
10.5. GEOGRAPHIC ALLOCATION OF INVESTMENTS
By country % Portfolio
CANADA 50.01%
AUSTRALIA 28.51%
HONGKONG 8.86%
SINGAPORE 4.33%
ISRAEL 3.01%
CAYMAN 2.95%
NEW ZEALAND 1.27%
BERMUDA 0.60%
IRELAND 0.46%
Total 100.00%
These allocations of assets were established on basis of data (gross) used by the entity responsible for the administration and bookkeeping and do not reflect inevitably the economic analysis which directed the assets selection.

DPAM CAPITAL B
Equities World ex Japan, Europe & USA Index
220
10.6. ECONOMIC ALLOCATION OF INVESTMENTS
By sector % Portfolio
BANKS 28.51%
IT & INTERNET 8.24%
FINANCIAL SERVICES - HOLDINGS 7.10%
INSURANCE COMPANIES 6.41%
OIL & DERIVED 6.32%
ENERGY SOURCES 4.96%
ROAD & RAILWAY TRANSPORTS 4.89%
REAL ESTATE 4.73%
INTERMEDIATE INDUSTRY PRODUCTS 4.40%
PRECIOUS METALS & STONES 3.08%
RETAIL TRADING, DEPARTMENT STORES 3.05%
BIOTECHNOLOGY 2.42%
TELECOMMUNICATIONS 2.19%
ELECTRIC & ELECTRONIC MATERIALS 1.57%
PHARMACOLOGY & PERSONAL CARE 1.30%
AGRICULTURE & FISHING 1.09%
BUILDING MATERIALS 1.07%
NONFERROUS METALS 0.91%
OTHER SERVICES 0.87%
AIRLIFT 0.85%
UNIT TRUSTS, UCIT 0.79%
ROAD VEHICLES 0.77%
HEALTH CARE & SERVICES 0.71%
LEISURES & TOURISM 0.60%
FOOD & CLEANING MATERIALS 0.57%
ELECTRIC & ELECTRONIC COMPONANTS 0.36%
TOBACCO & SPIRITS 0.28%
FOREST PRODUCTS & PAPER INDUSTRY 0.27%
PACKAGING INDUSTRY 0.21%
AEROSPACE INDUSTRY & DEFENCE 0.19%
MECHANICAL CONSTRUCTION 0.19%
MISCELLANEOUS CONSUMER GOODS 0.19%
CONGLOMERATES 0.18%
PUBLISHING & BROADCASTING 0.17%
UTILITIES 0.16%
COMMERCIAL & PUBLIC SERVICES 0.15%
CHEMICAL PRODUCTS 0.09%
PHOTOGRAPHY & OPTICAL 0.09%
JEWELLERY & WATCHMAKING 0.07%
TOTAL 100.00%
These allocations of assets were established on basis of data (gross) used by the entity responsible for the administration and bookkeeping and do not reflect inevitably the economic analysis which directed the assets selection.

DPAM CAPITAL B
Equities World ex Japan, Europe & USA Index
221
10.7. CHANGES IN THE COMPOSITION OF THE ASSETS IN EUR Equities World ex Japan, Europe & USA Index
1st semester 2nd semester Total
Purchases 58,974,727.93 15,480,620.09 74,455,348.02 Sales 7,623,963.42 39,954,713.39 47,578,676.81 Total 1 66,598,691.35 55,435,333.48 122,034,024.83 Subscriptions 58,794,506.13 16,683,843.43 75,478,349.56 Redemptions 8,301,991.55 42,545,681.29 50,847,672.84 Total 2 67,096,497.68 59,229,524.72 126,326,022.40 Reference average of the total net asset 82,378,391.72 102,844,098.62 92,695,350.82
Rotation Percentage -0.60% -3.69% -4.63%
The rotation rate gives the annual average of the transactions. A figure close to 0% shows that the transactions relating to the securities or the assets with the exception of deposits and liquid assets during a given period, were done exclusively in function of the subscriptions and redemptions. A negative percentage indicates that the subscriptions and redemptions give rise to only few or, as the case may be, no transactions in the portfolio.
A detailed list of the transactions carried out during the financial year can be consulted, free of charge, at Banque Degroof Petercam S.A with its registered office at Rue de l’Industrie 44 - B-1040 Brussels which provides the financial services.

DPAM CAPITAL B
Equities World ex Japan, Europe & USA Index
222
10.8. EVOLUTION OF SUBSCRIPTIONS, REDEMPTIONS AND THE NET ASSET
VALUE Equities World ex Japan, Europe & USA Index
Evolution of the number of shares in circulation
31 December 2019 31 December 2020 31 December 2021
Class Subscriptions Redemptions End of Period Subscriptions Redemptions End of Period Subscriptions Redemptions End of Period
A (Dis) 628.00 155.00 838.00 80.00 365.00 553.00 29.45 70.00 512.45
B (Cap) 9,596.64 15,970.00 45,199.64 2,507.39 6,154.00 41,553.03 14,386.00 14,977.00 40,962.03
E (Dis) 0.00 0.00 0.00 0.00 0.00 0.00 0.00 0.00 0.00
F (Cap) 45,740.00 54,480.00 154,567.50 26,919.00 43,267.30 138,219.20 196,799.00 113,260.00 221,758.20
I 0.00 0.00 0.00 0.00 0.00 0.00 0.00 0.00 0.00
J (Cap) 0.00 0.00 0.00 0.00 0.00 0.00 0.00 0.00 0.00
M (Dis) 0.00 630.00 0.00 0.00 0.00 0.00 0.00 0.00 0.00
N (Cap) 3,090.00 2,904.10 30,729.66 0.00 5,708.64 25,021.01 200.00 10,579.71 14,641.30
P (Cap) 17.00 6.00 22.00 0.00 5.00 17.00 173.22 173.22 17.00
TOTAL 231,356.79 205,363.24 277,890.98
Payable and receivable amounts for the UCI
EUR 31 December 2019 31 December 2020 31 December 2021
Class Subscriptions Redemptions Subscriptions Redemptions Subscriptions Redemptions
A (Dis) 84,214.80 22,140.20 9,832.80 49,632.70 4,757.03 11,221.00
B (Cap) 1,324,777.78 2,293,138.42 340,762.01 813,964.50 2,400,428.43 2,584,931.75
E (Dis) 0.00 0.00 0.00 0.00 0.00 0.00
F (Cap) 12,864,593.85 16,383,579.13 7,539,831.43 12,313,525.76 67,186,301.84 40,261,916.00
I 0.00 0.00 0.00 0.00 0.00 0.00
J (Cap) 0.00 0.00 0.00 0.00 0.00 0.00
M (Dis) 0.00 84,136.50 0.00 0.00 0.00 0.00
N (Cap) 428,164.50 423,456.24 0.00 777,996.69 30,546.00 1,823,523.49
P (Cap) 516,742.13 177,061.16 0.00 137,415.80 5,856,316.26 6,166,080.60
TOTAL 15,218,493.06 19,383,511.65 7,890,426.24 14,092,535.45 75,478,349.56 50,847,672.84
net asset value
EUR 31 December 2019 31 December 2020 31 December 2021
Class of the subfund Per share of the subfund Per share of the subfund Per share
A (Dis)
B (Cap)
E (Dis)
F (Cap)
I
J (Cap)
M (Dis)
N (Cap)
P (Cap)
60,016,032.53
144.60
151.54
0.00
308.47
0.00
0.00
0.00
152.44
30,983.84
51,846,050.91
135.76
146.83
0.00
299.88
0.00
0.00
0.00
148.18
30,198.91
92,441,146.57
166.36
179.80
0.00
368.39
0.00
0.00
0.00
182.03
37,211.24
TOTAL 60,016,032.53 51,846,050.91 92,441,146.57
On the date of publication of this report, the net asset value per share is published on the following websites: www.dpamfunds.com and www.beama.be. This information is also available at the counters of the financial services department.

DPAM CAPITAL B
Equities World ex Japan, Europe & USA Index
223
10.9. PERFORMANCES
Figures reflect past performance and are not an indicator of future performance. These figures do not include any restructuring. Returns are determined at the end of the financial year. The annual return is defined as the absolute return earned over a year. For the semi-annual report, the accounting year is 12-month period preceding the end of the half-year. From 2011, the calculation of the performance of the capitalization units is calculated similarly to the distribution units. This change is also applied to past performance. This change of method does not bring any significant difference compared to the method used previously. Bar chart showing annual returns of the last 10 years (in % and calculated in EUR) as of 31 December 2021: Class A (Dis) Table showing historical performance (actuarial returns):
Average cumulated returns Since
1 year 3 year 5 year 10 year
Year Value
Class A (Dis) 22.54 % (in EUR)
13.59 % (in EUR)
6.99 % (in EUR)
09/11/2016 7.83 % (in EUR)
Class B (Cap) Annual return:
This is a passively managed sub-fund, which means that the portfolio manager aims to replicate the performance of a benchmark.
13
.7%
0.6
%
14
.2%
-6.0
%
15
.9%
5.4
%
-9.4
%
23
.3%
-3.1
%
22
.5%
14
.7%
1.1
%
14
.9%
-5.3
%
16
.6%
6.2
%
-8.9
%
24
.3%
-2.6
%
23
.4%
-15.00%
-10.00%
-5.00%
0.00%
5.00%
10.00%
15.00%
20.00%
25.00%
30.00%
2012 2013 2014 2015 2016 2017 2018 2019 2020 2021
Class B (Cap) MSCI World ex JEU Net Return

DPAM CAPITAL B
Equities World ex Japan, Europe & USA Index
224
Table showing historical performance (actuarial returns):
Average cumulated returns Since
1 year 3 year 5 year 10 year
Year Value
Class B (Cap) 22.45 % (in EUR)
13.52 % (in EUR)
6.93 % (in EUR)
7.12 % (in EUR)
28/03/2001 6.36 % (in EUR)
Class F (Cap) Table showing historical performance (actuarial returns):
Average cumulated returns Since
1 year 3 year 5 year 10 year
Year Value
Class F (Cap) 22.85 % (in EUR)
13.89 % (in EUR)
7.28 % (in EUR)
7.35 % (in EUR)
26/12/2007 4.94 % (in EUR)
Class N (Cap) Table showing historical performance (actuarial returns):
Average cumulated returns Since
1 year 3 year 5 year 10 year
Year Value
Class N (Cap) 22.84 % (in EUR)
13.88 % (in EUR)
29/12/2017 7.63 % (in EUR)
Class P (Cap) Table showing historical performance (actuarial returns):
Average cumulated returns Since
1 year 3 year 5 year 10 year
Year Value
Class P (Cap) 23.22 % (in EUR)
14.20 % (in EUR)
28/03/2018 10.83 % (in EUR)

DPAM CAPITAL B
Equities World ex Japan, Europe & USA Index
225
10.10. CHARGES Equities World ex Japan, Europe & USA Index
Ongoing charges
The ongoing charges, calculated in accordance with the provisions of European Commission Regulation 583/2010 of 1 July 2010. These charges include transaction fees incurred by the sub-fund when it subscribes to and/or sells units of another fund, but do not include either (i) the fees incurred by the sub-fund when it makes investments other than subscriptions/sales of units of funds or, where applicable, (ii) the performance fee These charges are based on the fees charged in fund accounting for one year prior to the end of the period under review. In the event of a change in the cost structure during the financial year or if the share class is issued during the financial year, the amount of the reported current expenses is calculated on the basis of an estimate based on the expected total amount of the annual expenses (which could be determined by comparison with a similar class).
Given the change in cost structure during the year, the estimated fees are: Class A (Dis) - BE6289164723: 0.62 % Class B (Cap) - BE6278413883: 0.69 % Class F (Cap) - BE0947574787: 0.37 % Class N (Cap) - BE6299342657: 0.38 % Class P (Cap) - BE6249814078: 0.11 %. Fee sharing On 31 December 2021, 34.68% of the remuneration due to the manager has been retroceded to other distributors, third parties and Bank Degroof Petercam or one of its subsidiaries.
10.11. NOTES TO THE FINANCIAL STATEMENTS AND OTHER
INFORMATION
10.11.1. Gross dividends paid in the financial year
2016/2017 2.51 EUR 2018 class A 3.90 EUR class M 4.35 EUR 2019 class A 3.39 EUR
10.11.2. Transparency in sustainability
Déclaration obligatoire conformément à l’article 7 du règlement (UE) 2020/852 du 18 juin 2020 sur l’établissement d’un cadre visant à favoriser les investissements durables et modifiant le règlement (UE) 2019/2088 Les investissements sous-jacents à ce compartiment ne prennent pas en compte les critères de l’Union européenne en matière d’activités économiques durables sur le plan environnemental.
10.11.3. Transparency of the securities financing transactions and of reuse
In accordance with Article 13 and Section A of the Annex to Regulation EU 2015/2365 (hereinafter the Regulation), the Sicav must inform investors of its use of securities financing transactions and total return swaps in the annual report and the half-yearly report.
The portfolio does not contain any loaned assets at the date of this report. Equities World ex Japan, Europe & USA Index
DPAM CAPITAL B
Real Estate EMU Dividend Sustainable
226
11. INFORMATION ABOUT THE SUBFUND DPAM CAPITAL B REAL ESTATE EMU DIVIDEND SUSTAINABLE
Real Estate EMU Dividend Sustainable
11.1. MANAGEMENT REPORT
11.1.1. Launch date of the sub-fund and subscription price of the shares
Initial subscription day: November 26, 2003 Initial subscription price: EUR 1,000.00. Class B, E and F shares were split by 30 on May 29, 2018.
11.1.2. Stock exchange listing
The shares of the sub-fund are not listed on an exchange.
11.1.3. Aim and main outlines of the investment policy
The objective of this sub-fund is to offer shareholders the highest long-term return by investing its assets in securities representative of the real estate sector in the broad sense in the EMU zone. The weighted average dividend yield of the sub-fund's assets must be higher than the dividend yield of the FTSE EPRA/NAREIT Eurozone Capped Net Return Index. These companies are selected on the basis of their compliance with environmental, social and governance (ESG) criteria. The sub-fund uses a rigorous ESG methodology and strict exclusions in order not to undermine other environmental and social objectives and to ensure the required good governance practices This is an actively managed fund, which means that the portfolio manager does not aim to replicate the performance of a benchmark. The sub-fund will not invest more than 10% of its net assets in units of other undertakings for collective investment.
11.1.4. Financial management of the portfolio
Degroof Petercam Asset Management S.A. Rue Guimard, 18, 1040 Brussels
11.1.5. Distributor
Degroof Petercam Asset Management S.A. Rue Guimard, 18, 1040 Brussels
11.1.6. Index and benchmark
The sub-fund uses the following index as its benchmark: FTSE EPRA/NAREIT Eurozone Capped Net Return index This index is representative of the market for listed real estate companies in developed countries (as defined in the index methodology) in the EMU zone. The performance of this index is calculated by reinvesting net dividends (Net Return). This is an actively managed sub-fund, which means that the portfolio manager does not aim to replicate the performance of a benchmark. The benchmark is used for performance comparison purposes.
11.1.7. Policy followed during the year
The B share class of the fund increased by 10.24% in 2021. This positive performance, in sharp contrast with 2020, results from a significant increase in earnings visibility of several subsectors impacted by the global pandemic in 2020. All sub-sectors contributed positively to this performance. The logistics sector was the best performing sub-sector due to increased demand for warehouses coming from more e-commerce and supply change evolutions, as well as

DPAM CAPITAL B
Real Estate EMU Dividend Sustainable
227
better than expected rental growth. Offices and retail also contributed positively as uncertainty on future cash-flows eased. Both sub-sectors are still challenged by the evolution of demand and we expect the coming year to be important to get a clearer view on how valuations will evolve for the longer term. The residential sub-sector was the weakest performer over this year, due to perceived risks of higher regulation and higher interest rates. In this challenging environment, our strategy was to continue to gradually increase our exposure to the stronger sectors and within these, to cherry pick the companies that still offer a compelling valuation. With the M&A activity the exposure to residential companies decreased. We expect to find attractive pricing levels of our favorite companies to increase its weight again in the year to come. In retail we started the year with a very low exposure and have built positions when valuation was attractive. We remain prudent on this sub-sector, as well as for offices, as the supply demand balance is still more in favor of the tenants. On a geographical view, our exposure to Germany decreased most due to the bid on Deutsche Wohnen. Main countries that benefited from an increased weight were Belgium and the Netherlands.
11.1.8. Future policy
Following the increased appetite for real estate assets and the better earnings visibility, the outlook for the sector massively improved throughout 2021 with net asset values expected to rise by 8 to 9% on average per year on a 3-year outlook, compared to only 1 to 2 % annual growth outlook at the end of 2020. Main uncertainty remains the valuation within the retail and office sub-sectors. In retail we are probably getting closer to trough valuations. For offices, prime well-located and modern assets trade at high values. The challenge will be to retrofit older assets to the latest standards at an acceptable cost, which may continue to depress values for this kind of buildings. We will therefore continue to favor the sub-sectors showing sound growth, investing mainly in companies which are not priced for perfection and paying an attractive, sustainable, and growing dividend.
11.1.9. Synthetic risk and reward indicator
The synthetic risk and return indicator gives an indication of the risk associated with investing in a sub-fund. It places this risk on a scale ranging from one (lowest risk) to seven (highest risk). Risk and reward profile: 6

DPAM CAPITAL B
Real Estate EMU Dividend Sustainable
228
11.2. BALANCE SHEET
31 December 2021
EUR 31 December 2020
EUR
Section 1: Balance Sheet
TOTAL NET ASSETS 89,340,394.73 86,495,399.30
I. Fixed assets
A. Incorporation and organisation expenses B. Intangible assets C. Tangible assets
II. Transferable securities, money market instruments, UCIs and Financial derivatives
89,137,650.03 86,350,604.08
A. Bonds and other debt securities B. Money market instruments C. Shares and other securities similar to shares 89,137,650.03 86,350,604.08 a. Shares 89,137,650.03 86,350,604.08 D. Other transferable securities E. UCI with variable number of shares F. financial derivatives
III. Receivables and payables on more than one year
A. Receivables B. Payables
IV. Receivables and payables up to a year -156,742.08 -449,594.40
A. Receivables 53,647.58 253,613.39 a. Receivables 167,635.89 d. Others 53,647.58 85,977.50 B. Payables -210,389.66 -703,207.79 a. Payable amounts (-) -563,669.52 c. Borrowing (-) -765.51 -372.12 e. Others (-) -209,624.15 -139,166.15
V. Deposits and liquidity 359,486.78 594,389.62
A. Demand bank deposits 359,486.78 594,389.62 B. Term bank deposits C. Others
VI. Deferred charges and accrued income
A. Expenses carried forward B. Accrued income C. Accrued expenses (-) D. Income carried forward (-)
TOTAL SHAREHOLDERS’ EQUITY 89,340,394.73 86,495,399.30
A. Capital 70,095,427.05 77,618,823.08 B. Income equalisation 235,129.33 -5,376.09 C. Retained earnings 8,876,576.22 18,988,881.13 D. Result of the financial year 10,133,262.13 -10,106,928.82
Real Estate EMU Dividend Sustaina ble

DPAM CAPITAL B
Real Estate EMU Dividend Sustainable
229
31 December 2021
EUR 31 December 2020
EUR
Section 2: Off-balance sheet
I. Collateral (+/-)
A. Collateral (+/-) B. Other collateral
II. Underlying securities of the option contracts and warrants (+)
A. Option contracts and warrants bought B. Option contracts and warrants sold
III. Notional amount of futures contracts (+)
A. Futures contracts bought and Forward contracts B. Futures contracts sold and Forward Contracts
IV. Notional amount of the swap contracts (+)
A. Purchased swap contracts B. Sold swap contracts
V. Notional amount of other financial derivatives (+)
A. Purchased contracts B. Sold contracts
VI. Uncalled amounts on shares
VII. Commitments to resell on account of purchase-repurchase agreements
VIII. Commitments to repurchase on account of purchase-repurchase agreements
IX. Lent financial instruments

DPAM CAPITAL B
Real Estate EMU Dividend Sustainable
230
11.3. INCOME STATEMENT
31 December 2021
EUR 31 December 2020
EUR
Section 3: Income and expenditure account
I. Depreciation, capital loss and capital gain 7,856,038.71 -12,671,657.14
A. Bonds and other debt securities
B. Money market instruments
C. Shares and other securities similar to shares 7,856,038.71 -12,671,657.14
a. Shares 7,856,038.71 -12,671,657.14
Realised gain 4,885,704.43 1,587,114.13
Realised loss -5,663,209.64 -7,551,412.09
Unrealised gain and loss 8,633,543.92 -6,707,359.18
D. Other Transferable Securities
E. UCI with variable number of shares
F. financial derivatives
G. Receivables, deposits, liquidity and payables
H. Foreign exchange positions and transactions
II. Investment income and expenses 3,134,619.01 3,291,797.83
A. Dividends 3,525,739.81 3,652,465.31
B. Interest (+/-) 1,484.79 4,567.94
b. Deposits and liquidity 1,484.79 4,567.94
Interest on loans (-) -6,519.64 -14,065.92
Swap contracts (+/-)
Withholding tax (-) -386,085.95 -351,169.50
Belgian -224,798.90 -128,356.97
Foreign -161,287.05 -222,812.53
F. Other investment income
III. Other income
A. Anti dilution fee
B. Other
IV. Operating expenses -857,395.59 -727,069.51
A. Investment transaction and delivery costs (-) -204,265.40 -199,588.71
B. Financial expenses (-)
C. Custodian’s fee (-) -28,677.11 -19,830.61
D. Manager’s fee (-) -583,444.32 -492,344.87
a. Financial Management of the Portfolio -519,728.82 -418,208.65
Class B (Cap) -12,391.41 -15,344.71
Class E (Dis) -372.87 -248.53
Class F (Cap) -505,948.89 -401,393.73
Class M (Dis) -145.97 -377.87
Class N (Cap) -869.68 -843.81
b. Administration and accounting -63,715.50 -74,136.22
E. Administrative expenses (-) -21,580.14 -14,933.31
F. Incorporation and organisation expenses (-) -1,801.02 -1,540.11
G. Salaries and wages, social security charges and pensions (-) -262.80 1,180.83
H. Services and various goods (-) -13,206.45 -10,995.22
I. Depreciation and provisions for liabilities and charges (-)
J. Taxes -350.33 -1,453.69
Class B (Cap) -504.08 -624.45
Class E (Dis) 0.09 -0.64
Class F (Cap) 179.36 -762.72
Class M (Dis) -26.14 -63.71
Class N (Cap) 0.44 -2.17
K. Other expenses (-) -3,808.02 12,436.18
Income and expenditure for the financial year Sub-Total II + III + IV 2,277,223.42 2,564,728.32
V. Current profit (loss) before income tax 10,133,262.13 -10,106,928.82
VI. Income tax
VII. Result of the financial year 10,133,262.13 -10,106,928.82

DPAM CAPITAL B
Real Estate EMU Dividend Sustainable
231
31 December 2021
EUR 31 December 2020
EUR
Section 4: Allocation of the result
I. Profit (Loss) to be allocated 19,244,967.68 8,876,576.22
a. Profit carried forward (Loss carried forward) from the previous period 8,876,576.22 18,988,881.13
b. Profit (loss) of the financial year 10,133,262.13 -10,106,928.82
c. Income equalisation received (Income equalisation paid out) 235,129.33 -5,376.09
II. (Appropriation to) Deduction from the capital
III. (Profit to be carried forward) Loss to be carried forward -19,242,815.14 -8,876,576.22
IV. Dividend distribution -2,152.54
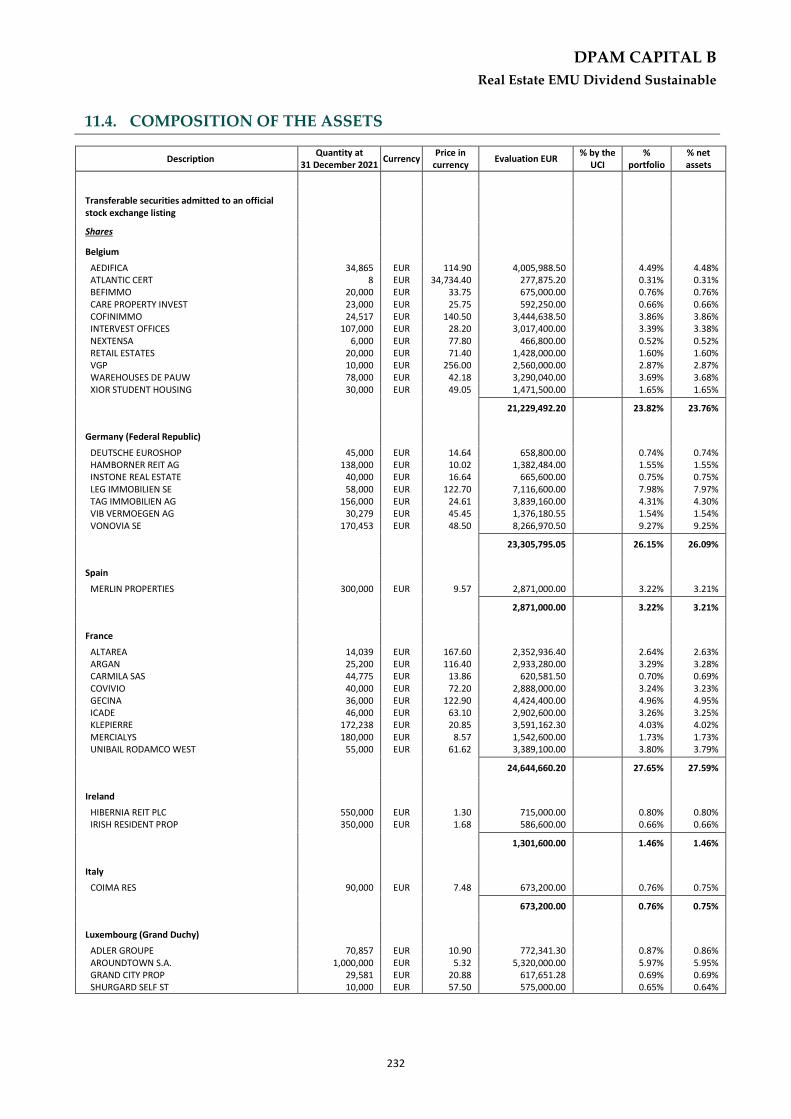
DPAM CAPITAL B
Real Estate EMU Dividend Sustainable
232
11.4. COMPOSITION OF THE ASSETS
Real Estate EMU Dividend Sustainable
Description Quantity at
31 December 2021 Currency
Price in currency
Evaluation EUR % by the
UCI %
portfolio % net assets
Transferable securities admitted to an official stock exchange listing
Shares
Belgium
AEDIFICA 34,865 EUR 114.90 4,005,988.50 4.49% 4.48% ATLANTIC CERT 8 EUR 34,734.40 277,875.20 0.31% 0.31% BEFIMMO 20,000 EUR 33.75 675,000.00 0.76% 0.76% CARE PROPERTY INVEST 23,000 EUR 25.75 592,250.00 0.66% 0.66% COFINIMMO 24,517 EUR 140.50 3,444,638.50 3.86% 3.86% INTERVEST OFFICES 107,000 EUR 28.20 3,017,400.00 3.39% 3.38% NEXTENSA 6,000 EUR 77.80 466,800.00 0.52% 0.52% RETAIL ESTATES 20,000 EUR 71.40 1,428,000.00 1.60% 1.60% VGP 10,000 EUR 256.00 2,560,000.00 2.87% 2.87% WAREHOUSES DE PAUW 78,000 EUR 42.18 3,290,040.00 3.69% 3.68% XIOR STUDENT HOUSING 30,000 EUR 49.05 1,471,500.00 1.65% 1.65%
21,229,492.20 23.82% 23.76%
Germany (Federal Republic)
DEUTSCHE EUROSHOP 45,000 EUR 14.64 658,800.00 0.74% 0.74% HAMBORNER REIT AG 138,000 EUR 10.02 1,382,484.00 1.55% 1.55% INSTONE REAL ESTATE 40,000 EUR 16.64 665,600.00 0.75% 0.75% LEG IMMOBILIEN SE 58,000 EUR 122.70 7,116,600.00 7.98% 7.97% TAG IMMOBILIEN AG 156,000 EUR 24.61 3,839,160.00 4.31% 4.30% VIB VERMOEGEN AG 30,279 EUR 45.45 1,376,180.55 1.54% 1.54% VONOVIA SE 170,453 EUR 48.50 8,266,970.50 9.27% 9.25%
23,305,795.05 26.15% 26.09%
Spain
MERLIN PROPERTIES 300,000 EUR 9.57 2,871,000.00 3.22% 3.21%
2,871,000.00 3.22% 3.21%
France
ALTAREA 14,039 EUR 167.60 2,352,936.40 2.64% 2.63% ARGAN 25,200 EUR 116.40 2,933,280.00 3.29% 3.28% CARMILA SAS 44,775 EUR 13.86 620,581.50 0.70% 0.69% COVIVIO 40,000 EUR 72.20 2,888,000.00 3.24% 3.23% GECINA 36,000 EUR 122.90 4,424,400.00 4.96% 4.95% ICADE 46,000 EUR 63.10 2,902,600.00 3.26% 3.25% KLEPIERRE 172,238 EUR 20.85 3,591,162.30 4.03% 4.02% MERCIALYS 180,000 EUR 8.57 1,542,600.00 1.73% 1.73% UNIBAIL RODAMCO WEST 55,000 EUR 61.62 3,389,100.00 3.80% 3.79%
24,644,660.20 27.65% 27.59%
Ireland
HIBERNIA REIT PLC 550,000 EUR 1.30 715,000.00 0.80% 0.80% IRISH RESIDENT PROP 350,000 EUR 1.68 586,600.00 0.66% 0.66%
1,301,600.00 1.46% 1.46%
Italy
COIMA RES 90,000 EUR 7.48 673,200.00 0.76% 0.75%
673,200.00 0.76% 0.75%
Luxembourg (Grand Duchy)
ADLER GROUPE 70,857 EUR 10.90 772,341.30 0.87% 0.86% AROUNDTOWN S.A. 1,000,000 EUR 5.32 5,320,000.00 5.97% 5.95% GRAND CITY PROP 29,581 EUR 20.88 617,651.28 0.69% 0.69% SHURGARD SELF ST 10,000 EUR 57.50 575,000.00 0.65% 0.64%
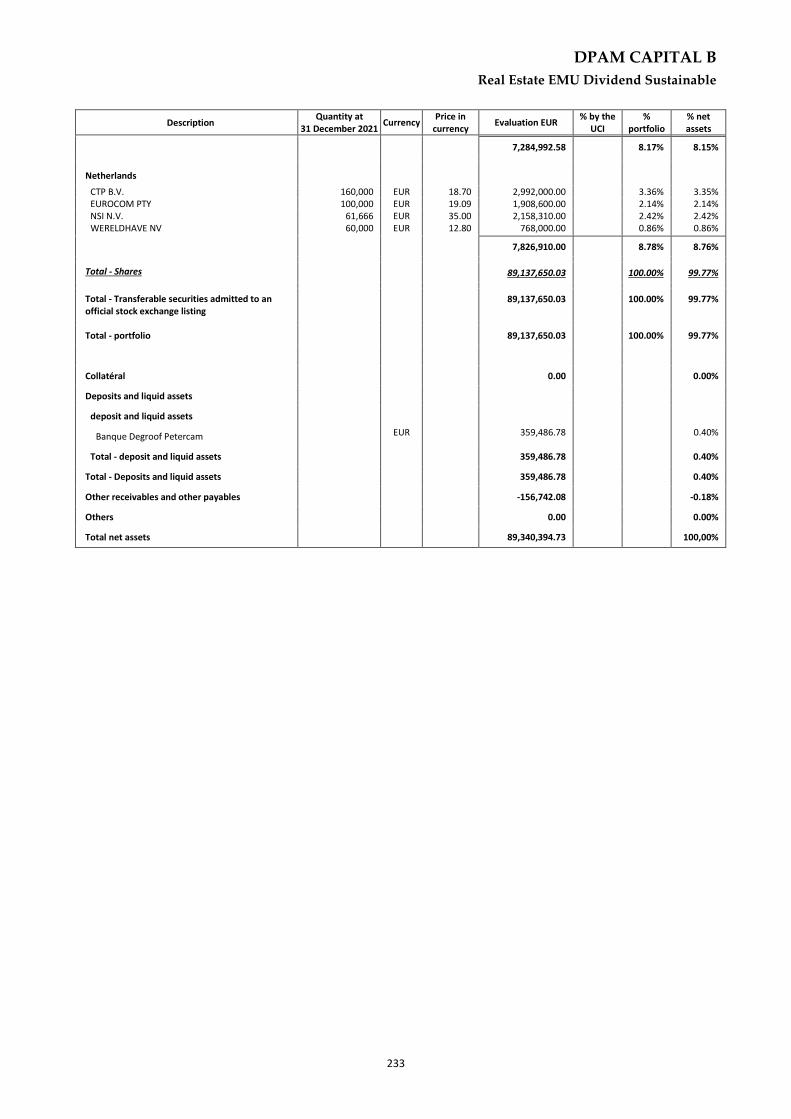
DPAM CAPITAL B
Real Estate EMU Dividend Sustainable
233
Description Quantity at
31 December 2021 Currency
Price in currency
Evaluation EUR % by the
UCI %
portfolio % net assets
7,284,992.58 8.17% 8.15%
Netherlands
CTP B.V. 160,000 EUR 18.70 2,992,000.00 3.36% 3.35% EUROCOM PTY 100,000 EUR 19.09 1,908,600.00 2.14% 2.14% NSI N.V. 61,666 EUR 35.00 2,158,310.00 2.42% 2.42% WERELDHAVE NV 60,000 EUR 12.80 768,000.00 0.86% 0.86%
7,826,910.00 8.78% 8.76%
Total - Shares 89,137,650.03 100.00% 99.77%
Total - Transferable securities admitted to an official stock exchange listing
89,137,650.03 100.00% 99.77%
Total - portfolio 89,137,650.03 100.00% 99.77%
Collatéral 0.00 0.00%
Deposits and liquid assets
deposit and liquid assets
Banque Degroof Petercam EUR 359,486.78 0.40%
Total - deposit and liquid assets 359,486.78 0.40%
Total - Deposits and liquid assets 359,486.78 0.40%
Other receivables and other payables -156,742.08 -0.18%
Others 0.00 0.00%
Total net assets 89,340,394.73 100,00%
Real Estate EMU Dividend Sustainable

DPAM CAPITAL B
Real Estate EMU Dividend Sustainable
234
11.5. GEOGRAPHIC ALLOCATION OF INVESTMENTS
By country % Portfolio
FRANCE 27.64%
GERMANY (FEDERAL REPUBLIC) 26.15%
BELGIUM 23.82%
NETHERLANDS 8.78%
LUXEMBOURG (GRAND DUCHY) 8.17%
SPAIN 3.22%
IRELAND 1.46%
ITALY 0.76%
Total 100.00%
These allocations of assets were established on basis of data (gross) used by the entity responsible for the administration and bookkeeping and do not reflect inevitably the economic analysis which directed the assets selection.

DPAM CAPITAL B
Real Estate EMU Dividend Sustainable
235
11.6. ECONOMIC ALLOCATION OF INVESTMENTS
By sector % Portfolio
REAL ESTATE 90.55%
FINANCIAL SERVICES - HOLDINGS 6.23%
OTHER SERVICES 3.22%
TOTAL 100.00%
These allocations of assets were established on basis of data (gross) used by the entity responsible for the administration and bookkeeping and do not reflect inevitably the economic analysis which directed the assets selection.

DPAM CAPITAL B
Real Estate EMU Dividend Sustainable
236
11.7. CHANGES IN THE COMPOSITION OF THE ASSETS IN EUR Real Estate EMU Dividend Sustainable
1st semester 2nd semester Total
Purchases 38,628,445.40 20,002,609.42 58,631,054.82 Sales 43,735,663.06 20,615,973.47 64,351,636.53 Total 1 82,364,108.46 40,618,582.89 122,982,691.35 Subscriptions 4,917,899.40 7,608,900.87 12,526,800.27 Redemptions 10,806,025.60 9,009,041.37 19,815,066.97 Total 2 15,723,925.00 16,617,942.24 32,341,867.24 Reference average of the total net asset 88,812,395.18 89,916,050.68 89,368,758.50
Rotation Percentage 75.03% 26.69% 101.42%
The rotation rate gives the annual average of the transactions. A figure close to 0% shows that the transactions relating to the securities or the assets with the exception of deposits and liquid assets during a given period, were done exclusively in function of the subscriptions and redemptions. A negative percentage indicates that the subscriptions and redemptions give rise to only few or, as the case may be, no transactions in the portfolio.
A detailed list of the transactions carried out during the financial year can be consulted, free of charge, at Banque Degroof Petercam S.A with its registered office at Rue de l’Industrie 44 - B-1040 Brussels which provides the financial services.

DPAM CAPITAL B
Real Estate EMU Dividend Sustainable
237
11.8. EVOLUTION OF SUBSCRIPTIONS, REDEMPTIONS AND THE NET ASSET
VALUE Real Estate EMU Dividend Sustainable
Evolution of the number of shares in circulation
31 December 2019 31 December 2020 31 December 2021
Class Subscriptions Redemptions End of Period Subscriptions Redemptions End of Period Subscriptions Redemptions End of Period
A (Dis) 0.00 0.00 0.00 0.00 0.00 0.00 0.00 0.00 0.00
B (Cap) 6,102.00 1,288.07 16,824.26 4,315.66 9,703.57 11,436.35 1,246.40 4,719.00 7,963.75
E (Dis) 295.00 4,500.00 295.00 305.00 0.00 600.00 0.00 0.00 600.00
F (Cap) 137,910.72 158,337.29 660,152.55 236,474.51 126,992.98 769,634.08 107,286.14 157,395.68 719,524.53
I 0.00 0.00 0.00 0.00 0.00 0.00 0.00 0.00 0.00
J (Cap) 0.00 0.00 0.00 0.00 0.00 0.00 0.00 0.00 0.00
M (Dis) 7.00 0.00 31.82 0.00 24.82 7.00 7.00 0.00 14.00
N (Cap) 8.00 35.96 29.00 32.00 0.00 61.00 5.80 26.80 40.00
V (Dis) 0.00 0.00 0.00 0.00 0.00 0.00 0.00 0.00 0.00
W (Cap) 0.00 0.00 0.00 0.00 0.00 0.00 0.00 0.00 0.00
TOTAL 677,332.63 781,738.43 728,142.29
Payable and receivable amounts for the UCI
EUR 31 December 2019 31 December 2020 31 December 2021
Class Subscriptions Redemptions Subscriptions Redemptions Subscriptions Redemptions
A (Dis) 0.00 0.00 0.00 0.00 0.00 0.00
B (Cap) 737,353.05 145,647.68 518,050.13 923,700.15 144,288.01 521,127.47
E (Dis) 32,600.45 532,935.00 23,445.35 0.00 0.00 0.00
F (Cap) 15,741,481.58 19,110,080.11 22,419,238.45 13,610,346.97 12,341,015.48 19,204,769.23
I 0.00 0.00 0.00 0.00 0.00 0.00
J (Cap) 0.00 0.00 0.00 0.00 0.00 0.00
M (Dis) 23,309.23 0.00 0.00 66,509.66 22,718.99 0.00
N (Cap) 27,684.96 110,188.45 119,382.40 0.00 18,777.79 89,170.27
V (Dis) 0.00 0.00 0.00 0.00 0.00 0.00
W (Cap) 0.00 0.00 0.00 0.00 0.00 0.00
TOTAL 16,562,429.27 19,898,851.24 23,080,116.33 14,600,556.78 12,526,800.27 19,815,066.97
net asset value
EUR 31 December 2019 31 December 2020 31 December 2021
Class of the subfund Per share of the subfund Per share of the subfund Per share
A (Dis)
B (Cap)
E (Dis)
F (Cap)
I
J (Cap)
M (Dis)
N (Cap)
V (Dis)
W (Cap)
88,127,707.78
0.00
127.30
121.75
129.85
0.00
0.00
3,653.73
3,859.75
0.00
0.00
86,495,399.30
0.00
107.67
99.71
110.42
0.00
0.00
2,993.91
3,282.11
0.00
0.00
89,340,394.73
0.00
118.70
110.61
122.49
0.00
0.00
3,317.97
3,640.97
0.00
0.00
TOTAL 88,127,707.78 86,495,399.30 89,340,394.73
On the date of publication of this report, the net asset value per share is published on the following websites: www.dpamfunds.com and www.beama.be. This information is also available at the counters of the financial services department.

DPAM CAPITAL B
Real Estate EMU Dividend Sustainable
238
11.9. PERFORMANCES
Figures reflect past performance and are not an indicator of future performance. These figures do not include any restructuring. Returns are determined at the end of the financial year. The annual return is defined as the absolute return earned over a year. For the semi-annual report, the accounting year is 12-month period preceding the end of the half-year. From 2011, the calculation of the performance of the capitalization units is calculated similarly to the distribution units. This change is also applied to past performance. This change of method does not bring any significant difference compared to the method used previously. Bar chart showing annual returns of the last 10 years (in % and calculated in EUR) as of 31 December 2021: Class A (Dis) Table showing historical performance (actuarial returns)::
Average cumulated returns Since
1 year 3 year 5 year 10 year
Year Value
Class A (Dis) 8,09 % (en EUR)
5,49 % (en EUR)
4,94 % (en EUR)
10/10/2016 4,64 % (en EUR)
Class B (Cap) Annual return:
This is an actively managed sub-fund, which means that the portfolio manager does not aim to replicate the performance of a benchmark. The benchmark is used to compare performance.
18
.6%
8.0
%
19
.6%
16
.1%
3.5
%
13
.7%
-8.7
%
24
.8%
-15
.4%
10
.2%
24
.6%
5.8
%
23
.4%
17
.0%
3.8
%
17
.6%
-7.5
%
22
.2%
-10
.9%
6.4
%
-20.00%
-15.00%
-10.00%
-5.00%
0.00%
5.00%
10.00%
15.00%
20.00%
25.00%
30.00%
2012 2013 2014 2015 2016 2017 2018 2019 2020 2021
Class B (Cap) FTSE EPRA/NAREIT Eurozone Capped Net Return index

DPAM CAPITAL B
Real Estate EMU Dividend Sustainable
239
Table showing historical performance (actuarial returns):
Average cumulated returns Since
1 year 3 year 5 year 10 year
Year Value
Class B (Cap) 10.24 % (in EUR)
5.18 % (in EUR)
3.86 % (in EUR)
8.32 % (in EUR)
11/12/2003 7.32 % (in EUR)
Class E (Dis) Table showing historical performance (actuarial returns):
Average cumulated returns Since
1 year 3 year 5 year 10 year
Year Value
Class E (Dis) 10.93 % (in EUR)
5.81 % (in EUR)
03/05/2018 2.08 % (in EUR)
Class F (Cap) Table showing historical performance (actuarial returns):
Average cumulated returns Since
1 year 3 year 5 year 10 year
Year Value
Class F (Cap) 10.93 % (in EUR)
5.79 % (in EUR)
4.39 % (in EUR)
8.64 % (in EUR)
27/12/2007 5.49 % (in EUR)
Class M (Dis) Table showing historical performance (actuarial returns):
Average cumulated returns Since
1 year 3 year 5 year 10 year
Year Value
Class M (Dis) 10.82 % (in EUR)
5.70 % (in EUR)
04/01/2018 1.79 % (in EUR)
Class N (Cap) Table showing historical performance (actuarial returns):
Average cumulated returns Since
1 year 3 year 5 year 10 year
Year Value
Class N (Cap) 10.93 % (in EUR)
5.79 % (in EUR)
29/12/2017 2.10 % (in EUR)
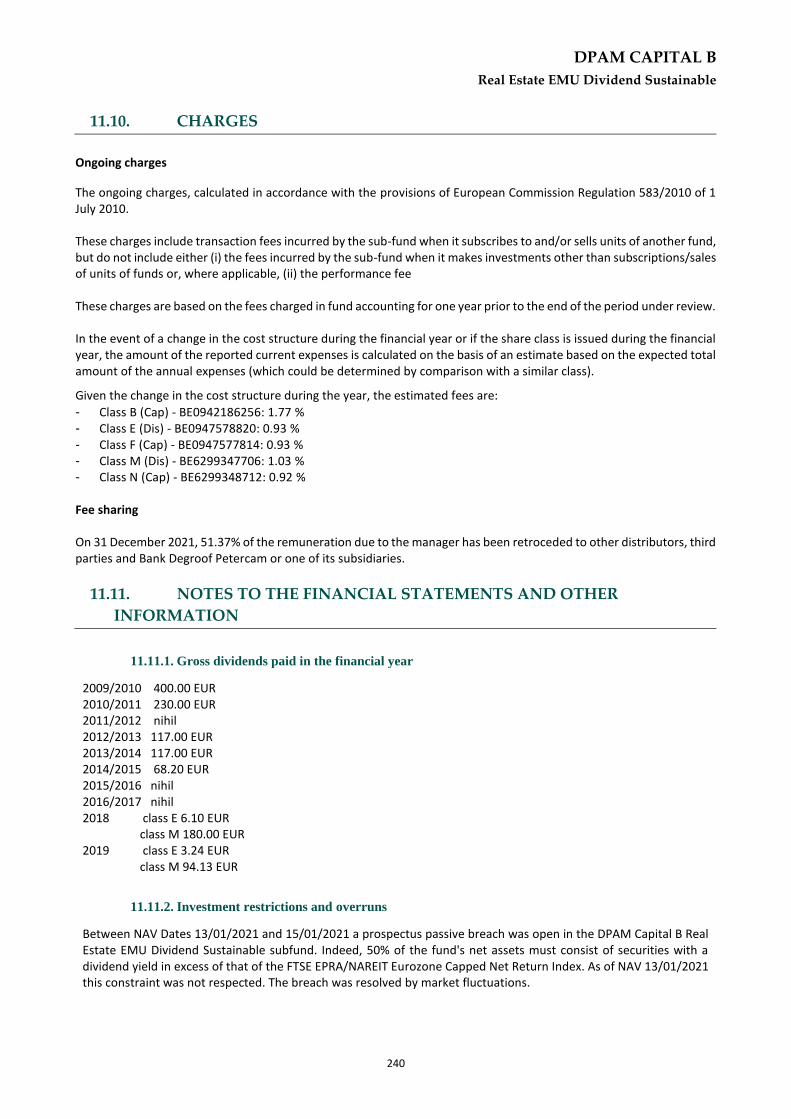
DPAM CAPITAL B
Real Estate EMU Dividend Sustainable
240
11.10. CHARGES Real Estate EMU Dividend Sustainable
Ongoing charges
The ongoing charges, calculated in accordance with the provisions of European Commission Regulation 583/2010 of 1 July 2010. These charges include transaction fees incurred by the sub-fund when it subscribes to and/or sells units of another fund, but do not include either (i) the fees incurred by the sub-fund when it makes investments other than subscriptions/sales of units of funds or, where applicable, (ii) the performance fee These charges are based on the fees charged in fund accounting for one year prior to the end of the period under review. In the event of a change in the cost structure during the financial year or if the share class is issued during the financial year, the amount of the reported current expenses is calculated on the basis of an estimate based on the expected total amount of the annual expenses (which could be determined by comparison with a similar class).
Given the change in the cost structure during the year, the estimated fees are:
- Class B (Cap) - BE0942186256: 1.77 % - Class E (Dis) - BE0947578820: 0.93 % - Class F (Cap) - BE0947577814: 0.93 % - Class M (Dis) - BE6299347706: 1.03 % - Class N (Cap) - BE6299348712: 0.92 % Fee sharing On 31 December 2021, 51.37% of the remuneration due to the manager has been retroceded to other distributors, third parties and Bank Degroof Petercam or one of its subsidiaries.
11.11. NOTES TO THE FINANCIAL STATEMENTS AND OTHER
INFORMATION
11.11.1. Gross dividends paid in the financial year
2009/2010 400.00 EUR 2010/2011 230.00 EUR 2011/2012 nihil 2012/2013 117.00 EUR 2013/2014 117.00 EUR 2014/2015 68.20 EUR 2015/2016 nihil 2016/2017 nihil 2018 class E 6.10 EUR class M 180.00 EUR 2019 class E 3.24 EUR class M 94.13 EUR
11.11.2. Investment restrictions and overruns
Between NAV Dates 13/01/2021 and 15/01/2021 a prospectus passive breach was open in the DPAM Capital B Real Estate EMU Dividend Sustainable subfund. Indeed, 50% of the fund's net assets must consist of securities with a dividend yield in excess of that of the FTSE EPRA/NAREIT Eurozone Capped Net Return Index. As of NAV 13/01/2021 this constraint was not respected. The breach was resolved by market fluctuations.
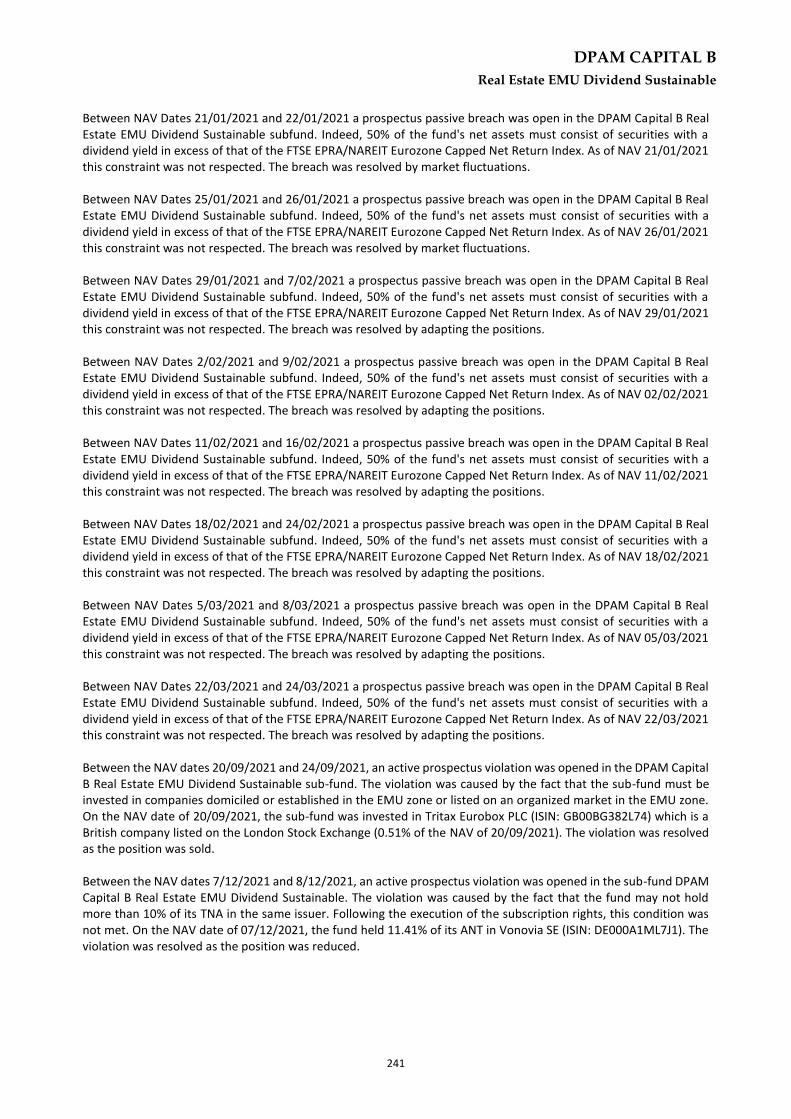
DPAM CAPITAL B
Real Estate EMU Dividend Sustainable
241
Between NAV Dates 21/01/2021 and 22/01/2021 a prospectus passive breach was open in the DPAM Capital B Real Estate EMU Dividend Sustainable subfund. Indeed, 50% of the fund's net assets must consist of securities with a dividend yield in excess of that of the FTSE EPRA/NAREIT Eurozone Capped Net Return Index. As of NAV 21/01/2021 this constraint was not respected. The breach was resolved by market fluctuations. Between NAV Dates 25/01/2021 and 26/01/2021 a prospectus passive breach was open in the DPAM Capital B Real Estate EMU Dividend Sustainable subfund. Indeed, 50% of the fund's net assets must consist of securities with a dividend yield in excess of that of the FTSE EPRA/NAREIT Eurozone Capped Net Return Index. As of NAV 26/01/2021 this constraint was not respected. The breach was resolved by market fluctuations. Between NAV Dates 29/01/2021 and 7/02/2021 a prospectus passive breach was open in the DPAM Capital B Real Estate EMU Dividend Sustainable subfund. Indeed, 50% of the fund's net assets must consist of securities with a dividend yield in excess of that of the FTSE EPRA/NAREIT Eurozone Capped Net Return Index. As of NAV 29/01/2021 this constraint was not respected. The breach was resolved by adapting the positions. Between NAV Dates 2/02/2021 and 9/02/2021 a prospectus passive breach was open in the DPAM Capital B Real Estate EMU Dividend Sustainable subfund. Indeed, 50% of the fund's net assets must consist of securities with a dividend yield in excess of that of the FTSE EPRA/NAREIT Eurozone Capped Net Return Index. As of NAV 02/02/2021 this constraint was not respected. The breach was resolved by adapting the positions. Between NAV Dates 11/02/2021 and 16/02/2021 a prospectus passive breach was open in the DPAM Capital B Real Estate EMU Dividend Sustainable subfund. Indeed, 50% of the fund's net assets must consist of securities with a dividend yield in excess of that of the FTSE EPRA/NAREIT Eurozone Capped Net Return Index. As of NAV 11/02/2021 this constraint was not respected. The breach was resolved by adapting the positions. Between NAV Dates 18/02/2021 and 24/02/2021 a prospectus passive breach was open in the DPAM Capital B Real Estate EMU Dividend Sustainable subfund. Indeed, 50% of the fund's net assets must consist of securities with a dividend yield in excess of that of the FTSE EPRA/NAREIT Eurozone Capped Net Return Index. As of NAV 18/02/2021 this constraint was not respected. The breach was resolved by adapting the positions. Between NAV Dates 5/03/2021 and 8/03/2021 a prospectus passive breach was open in the DPAM Capital B Real Estate EMU Dividend Sustainable subfund. Indeed, 50% of the fund's net assets must consist of securities with a dividend yield in excess of that of the FTSE EPRA/NAREIT Eurozone Capped Net Return Index. As of NAV 05/03/2021 this constraint was not respected. The breach was resolved by adapting the positions. Between NAV Dates 22/03/2021 and 24/03/2021 a prospectus passive breach was open in the DPAM Capital B Real Estate EMU Dividend Sustainable subfund. Indeed, 50% of the fund's net assets must consist of securities with a dividend yield in excess of that of the FTSE EPRA/NAREIT Eurozone Capped Net Return Index. As of NAV 22/03/2021 this constraint was not respected. The breach was resolved by adapting the positions. Between the NAV dates 20/09/2021 and 24/09/2021, an active prospectus violation was opened in the DPAM Capital B Real Estate EMU Dividend Sustainable sub-fund. The violation was caused by the fact that the sub-fund must be invested in companies domiciled or established in the EMU zone or listed on an organized market in the EMU zone. On the NAV date of 20/09/2021, the sub-fund was invested in Tritax Eurobox PLC (ISIN: GB00BG382L74) which is a British company listed on the London Stock Exchange (0.51% of the NAV of 20/09/2021). The violation was resolved as the position was sold. Between the NAV dates 7/12/2021 and 8/12/2021, an active prospectus violation was opened in the sub-fund DPAM Capital B Real Estate EMU Dividend Sustainable. The violation was caused by the fact that the fund may not hold more than 10% of its TNA in the same issuer. Following the execution of the subscription rights, this condition was not met. On the NAV date of 07/12/2021, the fund held 11.41% of its ANT in Vonovia SE (ISIN: DE000A1ML7J1). The violation was resolved as the position was reduced.

DPAM CAPITAL B
Real Estate EMU Dividend Sustainable
242
11.11.3. Transparency in sustainability
This information is published in accordance with Article 11 of Regulation (EU) 2019/2088 of 27 November 2019 on sustainability-related disclosures in the financial services sector ("SFDR Regulation"), as amended by Article 25 of Regulation (EU) 2020/852 of 18 June 2020 on the establishment of a framework to promote sustainable investment and amending Regulation (EU) 2019/2088 ("Taxonomy Regulation"), as well as in respect of the Taxonomy Regulation. 1. Extent to which environmental or social characteristics are met This sub-fund invests at least 90% of its assets (excluding cash, undertaking for collective investment and derivatives) in securities that meet the environmental and social criteria it promotes. 20% of these assets will also pursue a sustainable investment objective, as defined by the SFDR Regulation. A) Sustainability indicators The sustainability indicators used to measure compliance with the environmental or social characteristics promoted by this sub-fund correspond to the binding investment restrictions mentioned in the prospectus. In accordance with these investment restrictions, the sub-fund's portfolio during the period under review had:
a) Zero exposure to issuers deemed non-compliant with the 10 principles of the United Nations Global Compact
(which are part of the Global Standards) at the time the positions were purchased;
In the event that a company's ESG profile deteriorated during the course of the portfolio holding, leading it
to be downgraded to Global Compact non-compliant status, the relevant investment has been sold in the
interest of the sub-fund's shareholders within three months.
b) Zero exposure to issuers involved in controversial activities that meet the exclusion criteria set out in DPAM's
Controversial Activities Policy (available at www.dpamfunds.com), both at the time of purchase of the
positions and during the time the portfolio positions were held;
c) Zero exposure to issuers facing major ESG controversies on environmental or social issues at the time of
purchase of the positions;
In the event of a major controversy concerning a company during the course of the portfolio holding, the
investment concerned was sold in the interest of the sub-fund's shareholders within three months.
d) A carbon intensity (direct scope 1 and 2 emissions) below the average carbon intensity of the reference
universe before the ESG and sustainable investment selection methodology was applied;
e) A lower average ESG profile risk than the reference universe before the ESG and sustainable investment
selection methodology was applied;
In order to achieve the sustainable objective of a portion of the investments, over the period 10 March 2021 to 31 December 2021, a minimum of 20% of the companies in which the portfolio was invested made a net positive contribution to sustainable development objectives. The net impact contribution is the difference between the positive and negative impact contributions and is calculated at the level of the invested company and the overall portfolio. Based on the UN SDG framework, the impact contribution takes into account both (1) the extent to which the products and services of the invested company contribute to the achievement of the SDGs and (2) the negative impacts associated with their activities along the value chain.

DPAM CAPITAL B
Real Estate EMU Dividend Sustainable
243
More information about the indicators and their methodology can be found in the prospectus and on the website www.dpamfunds.com. B) Use of derivatives The sub-fund does not use derivatives, if any are held, for the purpose of promoting environmental and/or social characteristics as described in the prospectus. 2. Statement on the Taxonomy Regulation The investments underlying this product do not take into account the European Union's criteria for environmentally sustainable economic activities.
11.11.4. Transparency of the securities financing transactions and of reuse
In accordance with Article 13 and Section A of the Annex to Regulation EU 2015/2365 (hereinafter the Regulation), the SICAV must inform investors of its use of securities financing transactions and total return swaps in the annual report and the half-yearly report. The portfolio does not contain any loaned assets at the date of this report.
Real Estate EMU Dividend Sustainable
DPAM CAPITAL B
Corporate Bonds EUR 2023
244
12. INFORMATION ABOUT THE SUBFUND DPAM CAPITAL B CORPORATE BONDS EUR 2023
Corporate Bonds EUR 2023
12.1. MANAGEMENT REPORT
12.1.1. Launch date of the sub-fund and subscription price of the shares
Initial subscription period: 31 May 2017 to 15 June 2017. Initial subscription price: EUR 100.00.
12.1.2. Stock exchange listing
The shares of the sub-fund are not listed on an exchange.
12.1.3. Aim and main outlines of the investment policy
Objective
The objective of this sub-fund is to offer shareholders exposure to the corporate bonds market. The sub-fund is a sub-fund of limited duration, the maturity of which is set at 30 June 2023. The objective of the sub-fund is to achieve, over a period of six years, a capital gain on maturity. On maturity, the sub-fund will be dissolved automatically. At least one month before 30 June 2023, the Board of Directors will propose to the shareholders to subscribe to a new sub-fund with a similar objective and investment policy. Any shareholders not wishing to invest in the new sub-fund will be reimbursed at the last net asset value of the sub-fund applicable as at 30 June 2023. This is an actively managed sub-fund, which means that the portfolio manager does not aim to replicate the performance of a benchmark. No benchmarks are used in the management of the sub-fund. Quantitative information from a broader market can be used for risk management and evaluation by the manager.
Investment policy
The sub-fund's portfolio will consist principally of euro-denominated corporate bonds whose issuers have an Investment grade rating with one of the rating agencies such as Standard & Poor's, Moody's or Fitch. "Non-rated" corporate bonds may also account for up to 10% of the portfolio's net assets. Corporate bonds denominated in a currency other than the Euro are in principle covered, all or in part, against the Euro, but the Manager may decide, based on his assessment of the evolution of the markets not to cover a position in a currency other than the Euro. Cash and other liquid assets and short-term fixed income instruments may also be held, particularly during the period preceding the maturity of the sub-fund. Whilst the portfolio composition is required to respect general rules and limits prescribed by law or by the articles of incorporation, a concentration of risks can still occur in more limited asset categories or economic or geographic sectors. The sub-fund will not invest more than 10% of its net assets in units of other undertakings for collective investment.
12.1.4. Financial management of the portfolio
Degroof Petercam Asset Management S.A. Rue Guimard, 18, 1040 Brussels
12.1.5. Distributor
Degroof Petercam Asset Management S.A. Rue Guimard, 18, 1040 Brussels
12.1.6. Index and benchmark
This is an actively managed sub-fund, which means that the portfolio manager does not aim to replicate the performance of a benchmark. No benchmark is used in the management of the sub-fund.

DPAM CAPITAL B
Corporate Bonds EUR 2023
245
12.1.7. Policy followed during the year
During 2021 we saw continued accommodative monetary policy and further fiscal stimulus leading to a global economic recovery underpinned by rapid progress towards Covid vaccines. Looking back at realized performance, we see that the first half of the year was marked by solid credit performance as compression themes dominated and fundamentals improved rapidly. Increasing variants and expectations of tightening of monetary policy by some central banks sent credit spreads to trade within a narrow range, with spikes of volatility becoming more frequent at the end of the year. At December 31, 2021, net assets amounted to 173,816,130.28 euros compared to 174,550,480.78 euros at June 30, 2021. The net asset value, capitalizing share (Cl. B. Cap), amounted to 102.84 euros compared to a value of 103.06 euros at June 30, 2021. The Fund aims to provide investors with a predictable yield through an exposure to the European Investment Grade Corporate market with a predictable maturity (target maturity of 30/06/2023). In order to achieve this objective, the Fund can only invest in bonds that mature between 30/06/2022 and 31/12/2023. The Investment Process is mainly based on a bottom-up approach. Our credit research team adopts a fundamental and value approach to credit management. Our resources are geared towards identifying fundamentally sound credits, while avoiding low or deteriorating ones. The Fund invests in a diversified portfolio of Corporate bonds rated between AAA and BBB3 (explicit or implicit), with a maximum weight of 60% of its assets under management in BBB rated bonds.
12.1.8. Future policy
We expect a solid start to the year in EUR IG Corps as money is “put to work” while dealer inventories are low, but the upside should be capped by upcoming supply, inflation uncertainty and tight valuations. For 2022 we expect a mild widening trajectory as central banks progressively remove the accommodation. We see a fair amount of volatility around that trend.
12.1.9. Synthetic risk and reward indicator
The synthetic risk and return indicator gives an indication of the risk associated with investing in a sub-fund. It places this risk on a scale ranging from one (lowest risk) to seven (highest risk). Risk and reward profile: 3

DPAM CAPITAL B
Corporate Bonds EUR 2023
246
12.2. BALANCE SHEET
31 December 2021
EUR 31 December 2020
EUR
Section 1: Balance Sheet
TOTAL NET ASSETS 173,816,130.28 199,417,757.79
I. Fixed assets
A. Incorporation and organisation expenses B. Intangible assets C. Tangible assets
II. Transferable securities, money market instruments, UCIs and Financial derivatives
166,370,355.94 198,004,309.55
A. Bonds and other debt securities 150,048,942.94 198,004,309.55 a. Bonds 150,048,942.94 198,004,309.55 B. Money market instruments 16,321,413.00 C. Shares and other securities similar to shares D. Other transferable securities E. UCI with variable number of shares F. financial derivatives
III. Receivables and payables on more than one year
A. Receivables B. Payables
IV. Receivables and payables up to a year -257,719.70 202,475.75
A. Receivables 522,306.79 a. Receivables 522,306.79 B. Payables -257,719.70 -319,831.04 a. Payable amounts (-) -92,222.40 -33,798.15 c. Borrowing (-) -3,438.31 -103,958.05 e. Others (-) -162,058.99 -182,074.84
V. Deposits and liquidity 6,841,107.65
A. Demand bank deposits 6,841,107.65 B. Term bank deposits C. Others
VI. Deferred charges and accrued income 862,386.39 1,210,972.49
A. Expenses carried forward B. Accrued income 862,386.39 1,210,972.49 C. Accrued expenses (-) D. Income carried forward (-)
TOTAL SHAREHOLDERS’ EQUITY 173,816,130.28 199,417,757.79
A. Capital 170,631,050.49 194,749,197.28 B. Income equalisation -63,534.69 -120,071.98 C. Retained earnings 3,461,173.70 2,058,979.95 D. Result of the financial year -212,559.22 2,729,652.54
Corporate Bonds EUR 20 23

DPAM CAPITAL B
Corporate Bonds EUR 2023
247
31 December 2021
EUR 31 December 2020
EUR
Section 2: Off-balance sheet
I. Collateral (+/-)
A. Collateral (+/-) B. Other collateral
II. Underlying securities of the option contracts and warrants (+)
A. Option contracts and warrants bought B. Option contracts and warrants sold
III. Notional amount of futures contracts (+)
A. Futures contracts bought and Forward contracts B. Futures contracts sold and Forward Contracts
IV. Notional amount of the swap contracts (+)
A. Purchased swap contracts B. Sold swap contracts
V. Notional amount of other financial derivatives (+)
A. Purchased contracts B. Sold contracts
VI. Uncalled amounts on shares
VII. Commitments to resell on account of purchase-repurchase agreements
VIII. Commitments to repurchase on account of purchase-repurchase agreements
IX. Lent financial instruments

DPAM CAPITAL B
Corporate Bonds EUR 2023
248
12.3. INCOME STATEMENT
31 December 2021
EUR 31 December 2020
EUR
Section 3: Income and expenditure account
I. Depreciation, capital loss and capital gain -2,271,502.72 564,873.97
A. Bonds and other debt securities -2,271,502.72 564,873.97
a. Bonds -2,271,502.72 564,873.97
Realised gain 373,161.71 165,290.80
Realised loss -577,900.40 -309,056.73
Unrealised gain and loss -2,066,764.03 708,639.90
B. Money market instruments
C. Shares and other securities similar to shares
D. Other Transferable Securities
E. UCI with variable number of shares
F. financial derivatives
G. Receivables, deposits, liquidity and payables
H. Foreign exchange positions and transactions
II. Investment income and expenses 2,416,819.25 2,460,388.91
A. Dividends 19,403.75
B. Interest (+/-) 2,435,342.10 2,465,184.85
a. Transferable securities and money market instruments 2,428,372.75 2,457,454.62
b. Deposits and liquidity 6,969.35 7,730.23
Interest on loans (-) -17,573.56 -21,564.94
Swap contracts (+/-)
Withholding tax (-) -949.29 -2,634.75
Foreign -949.29 -2,634.75
F. Other investment income
III. Other income
A. Anti dilution fee
B. Other
IV. Operating expenses -357,875.75 -295,610.34
A. Investment transaction and delivery costs (-) -23,745.92 -31,833.19
B. Financial expenses (-)
C. Custodian’s fee (-) -63,724.37 -53,788.97
D. Manager’s fee (-) -94,772.79 -96,301.14
a. Financial Management of the Portfolio -49,392.04 -50,305.71
Class A (Dis) -21,061.52 -20,776.49
Class B (Cap) -2,365.26 -2,458.23
Class F (Cap) -2,032.47 -2,453.46
Class M (Dis) -22,368.11 -23,264.41
Class N (Cap) -1,564.68 -1,353.12
b. Administration and accounting -45,380.75 -45,995.43
E. Administrative expenses (-) -23,292.42 -27,984.14
F. Incorporation and organisation expenses (-) -1,518.69 -377.39
G. Salaries and wages, social security charges and pensions (-) -330.57 1,619.02
H. Services and various goods (-) -12,268.21 -10,620.33
I. Depreciation and provisions for liabilities and charges (-)
J. Taxes -125,053.69 -136,992.33
Class A (Dis) -35,899.26 -44,961.39
Class B (Cap) -3,587.31 -3,144.68
Class F (Cap) -1,568.00 -1,544.22
Class M (Dis) -81,539.77 -86,968.14
Class N (Cap) -451.33 -388.00
Class P (Cap) -2,008.02 14.10
K. Other expenses (-) -13,169.09 60,668.13
Income and expenditure for the financial year Sub-Total II + III + IV 2,058,943.50 2,164,778.57
V. Current profit (loss) before income tax -212,559.22 2,729,652.54
VI. Income tax
VII. Result of the financial year -212,559.22 2,729,652.54

DPAM CAPITAL B
Corporate Bonds EUR 2023
249
31 December 2021
EUR 31 December 2020
EUR
Section 4: Allocation of the result
I. Profit (Loss) to be allocated 3,185,079.79 4,668,560.51
a. Profit carried forward (Loss carried forward) from the previous period 3,461,173.70 2,058,979.95
b. Profit (loss) of the financial year -212,559.22 2,729,652.54
c. Income equalisation received (Income equalisation paid out) -63,534.69 -120,071.98
II. (Appropriation to) Deduction from the capital
III. (Profit to be carried forward) Loss to be carried forward -1,812,856.97 -3,461,173.70
IV. Dividend distribution -1,372,222.82 -1,207,386.81

DPAM CAPITAL B
Corporate Bonds EUR 2023
250
12.4. COMPOSITION OF THE ASSETS
Corporate Bonds EUR 2023
Description Quantity at
31 December 2021 Currency
Price in currency
Evaluation EUR % by the
UCI %
portfolio % net assets
Transferable securities admitted to an official stock exchange listing
Bonds and other debt securities
Private corporation
Austria
IMMOFIN 2,625 19-23 1,000,000 EUR 101.98 1,019,835.00 0.61% 0.59% OMV AG 0,00 20-23 3,000,000 EUR 100.39 3,011,745.00 1.81% 1.73%
4,031,580.00 2.42% 2.32%
Belgium
EANDIS 2,875 13-23 2,000,000 EUR 105.55 2,110,950.00 1.27% 1.21% UCB SA 5,125 13-23 1,000,000 EUR 108.80 1,088,025.00 0.65% 0.63%
3,198,975.00 1.92% 1.84%
Germany (Federal Republic)
ALSTRIA 2,125 16-23 100,000 EUR 101.65 101,645.50 0.06% 0.06% BASF 0,101 20-23 2,000,000 EUR 100.50 2,009,950.00 1.21% 1.16% CONTINENT 0,00 19-23 2,500,000 EUR 100.21 2,505,212.50 1.51% 1.44% INFINEON 0,75 20-23 500,000 EUR 101.23 506,175.00 0.30% 0.29% MERCK 0,005 19-23 1,000,000 EUR 100.49 1,004,885.00 0.60% 0.58% SAP SE 0,00 20-23 500,000 EUR 100.41 502,035.00 0.30% 0.29% VOLKSWG 0,00 21-23 1,000,000 EUR 100.17 1,001,690.00 0.60% 0.58% VOLKSWG 2,50 20-23 600,000 EUR 103.33 619,962.00 0.37% 0.36% VONOVIA 0,00 21-23 1,500,000 EUR 100.31 1,504,612.50 0.90% 0.87% VW FIN 1,375 18-23 1,500,000 EUR 102.53 1,537,942.50 0.92% 0.88%
11,294,110.00 6.79% 6.50%
Denmark
CARLSB 0,50 17-23 2,100,000 EUR 101.00 2,120,916.00 1.27% 1.22%
2,120,916.00 1.27% 1.22%
Spain
BCO SAB 1,75 20-23 1,000,000 EUR 100.84 1,008,445.00 0.61% 0.58% CAIXABANK 1,75 18-23 2,000,000 EUR 103.11 2,062,220.00 1.24% 1.19% FCC 0,815 19-23 2,100,000 EUR 101.38 2,128,896.00 1.28% 1.22%
5,199,561.00 3.13% 2.99%
Finland
CHR FIN 0,875 20-23 1,000,000 EUR 101.75 1,017,500.00 0.61% 0.59%
1,017,500.00 0.61% 0.59%
France
ALD 0,375 19-23 1,800,000 EUR 100.78 1,814,022.00 1.09% 1.04% ALD SA 0,375 20-23 1,200,000 EUR 100.83 1,209,972.00 0.73% 0.70% ARGAN 3,25 17-23 500,000 EUR 93.89 469,450.00 0.28% 0.27% BNP PB 1,125 17-23 3,000,000 EUR 102.26 3,067,890.00 1.84% 1.77% CAP GEM 2,50 15-23 2,500,000 EUR 103.42 2,585,600.00 1.55% 1.49% ESSILOR 0,00 19-23 500,000 EUR 100.39 501,932.50 0.30% 0.29% PERNOD 0,00 19-23 1,600,000 EUR 100.37 1,605,888.00 0.97% 0.92% RCI 0,75 19-23 3,500,000 EUR 100.70 3,524,657.50 2.12% 2.03% SOCGEN 4,00 13-23 2,000,000 EUR 105.64 2,112,890.00 1.27% 1.22%
16,892,302.00 10.15% 9.72%
United Kingdom
BARCLAYS 1,875 16-23 2,500,000 EUR 103.86 2,596,475.00 1.56% 1.49% DIAGEO 0,125 19-23 1,000,000 EUR 100.56 1,005,620.00 0.60% 0.58% LLOYDS BK 1,00 16-23 2,500,000 EUR 102.11 2,552,687.50 1.53% 1.47%

DPAM CAPITAL B
Corporate Bonds EUR 2023
251
Description Quantity at
31 December 2021 Currency
Price in currency
Evaluation EUR % by the
UCI %
portfolio % net assets
NATWEST 1,125 18-23 2,000,000 EUR 101.92 2,038,350.00 1.23% 1.17%
8,193,132.50 4.92% 4.71%
Ireland
ABBOT 0,875 18-23 3,500,000 EUR 101.94 3,567,777.50 2.14% 2.05% CRH FIN 3,125 13-23 2,000,000 EUR 104.13 2,082,650.00 1.25% 1.20%
5,650,427.50 3.40% 3.25%
Italy
BUZZI 2,125 16-23 1,800,000 EUR 102.38 1,842,849.00 1.11% 1.06% FCA BANK 0,50 20-23 700,000 EUR 100.76 705,302.50 0.42% 0.41% INTESA 4,00 13-23 3,000,000 EUR 107.48 3,224,385.00 1.94% 1.86% UNICREDIT 1,00 18-23 2,000,000 EUR 101.13 2,022,550.00 1.22% 1.16%
7,795,086.50 4.69% 4.48%
Jersey
SWISS RE 1,375 16-23 1,000,000 EUR 102.15 1,021,500.00 0.61% 0.59% WPP FIN 3,00 13-23 1,200,000 EUR 105.92 1,271,046.00 0.76% 0.73%
2,292,546.00 1.38% 1.32%
Japan
NISSAN MT 1,94 20-23 1,000,000 EUR 103.09 1,030,920.00 0.62% 0.59% SUMITOMO 0,819 18-23 1,500,000 EUR 101.58 1,523,625.00 0.92% 0.88%
2,554,545.00 1.54% 1.47%
Cayman
CK HUTCH 1,25 16-23 3,000,000 EUR 101.74 3,052,155.00 1.83% 1.76%
3,052,155.00 1.83% 1.76%
Luxembourg (Grand Duchy)
BECTON 0,632 19-23 1,800,000 EUR 100.97 1,817,424.00 1.09% 1.05% BLACKSTONE 0,5 19-23 1,400,000 EUR 100.56 1,407,910.00 0.85% 0.81% GLENCORE 1,875 16-23 3,500,000 EUR 102.73 3,595,515.00 2.16% 2.07% HIGHLAND 0,00 21-23 1,300,000 EUR 100.14 1,301,761.50 0.78% 0.75% HOLCIM 1,375 16-23 151,000 EUR 101.82 153,745.94 0.09% 0.09% MEDTRONIC 0,00 20-23 1,500,000 EUR 100.35 1,505,280.00 0.90% 0.87%
9,781,636.44 5.88% 5.63%
Mexico
AMER MOV 3,259 13-23 2,000,000 EUR 105.15 2,103,040.00 1.26% 1.21%
2,103,040.00 1.26% 1.21%
Netherlands
BMW FIN 0,625 19-23 2,000,000 EUR 101.53 2,030,500.00 1.22% 1.17% CONTI-GM 2,125 20-23 2,500,000 EUR 103.95 2,598,637.50 1.56% 1.50% CTP BV 0,625 20-23 2,000,000 EUR 101.15 2,022,990.00 1.22% 1.16% EDP 2,375 16-23 2,100,000 EUR 103.35 2,170,339.50 1.30% 1.25% ENEL 5,25 03-23 2,500,000 EUR 109.61 2,740,287.50 1.65% 1.58% IBERDROLA 1,75 15-23 2,500,000 EUR 103.48 2,586,925.00 1.55% 1.49% LEASEPLA 0,125 19-23 2,500,000 EUR 100.30 2,507,412.50 1.51% 1.44% LEASEPLAN 1,00 18-23 1,800,000 EUR 101.56 1,828,053.00 1.10% 1.05% NE PROP FRN 19-23 1,000,000 EUR 103.20 1,031,955.00 0.62% 0.59% NN BANK 0,375 19-23 1,000,000 EUR 100.79 1,007,915.00 0.61% 0.58% PHILIPS 0,50 17-23 2,500,000 EUR 101.04 2,525,900.00 1.52% 1.45% RABOBK 0,74 18-23 2,500,000 EUR 101.60 2,540,050.00 1.53% 1.46% VOLKSWAG 0,875 15-23 1,000,000 EUR 101.22 1,012,235.00 0.61% 0.58% VONOVIA 0,875 18-23 1,500,000 EUR 101.24 1,518,667.50 0.91% 0.87% VONOVIA 2,25 15-23 1,000,000 EUR 104.61 1,046,090.00 0.63% 0.60%
29,167,957.50 17.53% 16.78%
Portugal
BRISA CON 2,00 16-23 2,200,000 EUR 102.63 2,257,893.00 1.36% 1.30%

DPAM CAPITAL B
Corporate Bonds EUR 2023
252
Description Quantity at
31 December 2021 Currency
Price in currency
Evaluation EUR % by the
UCI %
portfolio % net assets
2,257,893.00 1.36% 1.30%
Sweden
CASTELLU 2,125 18-23 2,500,000 EUR 103.76 2,593,962.50 1.56% 1.49% SCANIA 0,50 20-23 600,000 EUR 100.87 605,241.00 0.36% 0.35% VOLVO 0,00 20-23 1,000,000 EUR 100.29 1,002,875.00 0.60% 0.58%
4,202,078.50 2.53% 2.42%
United States of America
AT T 1,05 18-23 2,600,000 EUR 101.99 2,651,714.00 1.59% 1.53% AT T INC 1,95 19-23 1,600,000 EUR 103.11 1,649,744.00 0.99% 0.95% ATT INC 2,50 13-23 1,100,000 EUR 102.63 1,128,941.00 0.68% 0.65% BECTON 1,401 18-23 1,500,000 EUR 101.98 1,529,752.50 0.92% 0.88% BERKSHIRE 0,75 15-23 3,000,000 EUR 101.04 3,031,155.00 1.82% 1.74% CITIGROUP 0,75 16-23 2,800,000 EUR 101.45 2,840,600.00 1.71% 1.63% FIDELITY 0,75 19-23 2,300,000 EUR 101.13 2,326,047.50 1.40% 1.34% FISERV 0,375 19-23 600,000 EUR 100.67 603,990.00 0.36% 0.35% GENERAL 0,955 16-23 3,000,000 EUR 101.61 3,048,420.00 1.83% 1.75% HJ HEINZ 2,00 15-23 1,500,000 EUR 102.42 1,536,247.50 0.92% 0.88% IBM 1,25 14-23 1,500,000 EUR 102.05 1,530,787.50 0.92% 0.88% ILLINOIS 1,25 15-23 2,200,000 EUR 101.70 2,237,422.00 1.34% 1.29% MC DONAL 1,00 16-23 1,000,000 EUR 102.25 1,022,485.00 0.61% 0.59% MORGAN S 1,875 14-23 3,000,000 EUR 102.67 3,080,040.00 1.85% 1.77% TIME WAR 1,95 15-23 1,000,000 EUR 102.62 1,026,155.00 0.62% 0.59%
29,243,501.00 17.58% 16.82%
Total - Private corporation 150,048,942.94 90.19% 86.33%
Total - Bonds and other debt securities 150,048,942.94 90.19% 86.33%
Money market instruments BLACKSTO 1,40 18-22 1,000,000 EUR 100.40 1,004,035.00 0.60% 0.58% BOOKING 2,15 15-22 3,000,000 EUR 101.63 3,048,795.00 1.83% 1.75% FCA BK 0,625 19-22 2,500,000 EUR 100.68 2,517,025.00 1.51% 1.45% FIDELITY 0,125 19-22 1,200,000 EUR 100.33 1,203,978.00 0.72% 0.69% HEIDELBERG 0,5 18-22 2,000,000 EUR 100.29 2,005,840.00 1.21% 1.15% MEDIOBCA 0,625 17-22 2,000,000 EUR 100.67 2,013,480.00 1.21% 1.16% SCANIA CV 0,00 20-22 1,500,000 EUR 100.16 1,502,385.00 0.90% 0.86% UBI 0,75 17-22 3,000,000 EUR 100.86 3,025,875.00 1.82% 1.74%
Total - Money market instruments 16,321,413.00 9.81% 9.39%
Total - Transferable securities admitted to an official stock exchange listing
166,370,355.94 100.00% 95.72%
Total - portfolio 166,370,355.94 100.00% 95.72%
Collatéral 0.00 0.00%
Deposits and liquid assets
deposit and liquid assets
Banque Degroof Petercam EUR 6,841,107.65 3.94%
Total - deposit and liquid assets 6,841,107.65 3.94%
Total - Deposits and liquid assets 6,841,107.65 3.94%
Other receivables and other payables -257,719.70 -0.15%
Others 862,386.39 0.50%
Total net assets 173,816,130.28 100,00%
Corporate Bonds EUR 2023

DPAM CAPITAL B
Corporate Bonds EUR 2023
253
12.5. GEOGRAPHIC ALLOCATION OF INVESTMENTS
By country % Portfolio
UNITED STATES OF AMERICA 20.14%
NETHERLANDS 17.53%
FRANCE 10.15%
ITALY 9.23%
LUXEMBOURG (GRAND DUCHY) 7.69%
GERMANY (FEDERAL REPUBLIC) 6.79%
UNITED KINGDOM 4.92%
SWEDEN 3.43%
IRELAND 3.40%
SPAIN 3.13%
AUSTRIA 2.42%
BELGIUM 1.92%
CAYMAN 1.83%
JAPAN 1.54%
JERSEY 1.38%
PORTUGAL 1.36%
DENMARK 1.27%
MEXICO 1.26%
FINLAND 0.61%
Total 100.00%
These allocations of assets were established on basis of data (gross) used by the entity responsible for the administration and bookkeeping and do not reflect inevitably the economic analysis which directed the assets selection.

DPAM CAPITAL B
Corporate Bonds EUR 2023
254
12.6. ECONOMIC ALLOCATION OF INVESTMENTS
By sector % Portfolio
FINANCIAL SERVICES - HOLDINGS 29.54%
BANKS 25.96%
IT & INTERNET 6.17%
REAL ESTATE 4.96%
TELECOMMUNICATIONS 4.53%
PHARMACOLOGY & PERSONAL CARE 2.78%
TOBACCO & SPIRITS 2.24%
ASSET & MORTGAGE BACKED SECURITIES 2.14%
ROAD VEHICLES 1.89%
ELECTRIC & ELECTRONIC COMPONANTS 1.82%
OIL & DERIVED 1.81%
BUILDING MATERIALS 1.72%
ELECTRIC & ELECTRONIC MATERIALS 1.55%
TYRES & RUBBER 1.51%
PUBLISHING & BROADCASTING 1.38%
AIRLIFT 1.36%
MECHANICAL CONSTRUCTION 1.34%
UTILITIES 1.28%
ENERGY SOURCES 1.27%
CHEMICAL PRODUCTS 1.21%
MISCELLANEOUS CONSUMER GOODS 1.09%
INFORMATION, TECHNOLOGY & COPIERS 0.92%
FOOD & CLEANING MATERIALS 0.92%
LEISURES & TOURISM 0.61%
TOTAL 100.00%
These allocations of assets were established on basis of data (gross) used by the entity responsible for the administration and bookkeeping and do not reflect inevitably the economic analysis which directed the assets selection.

DPAM CAPITAL B
Corporate Bonds EUR 2023
255
12.7. CHANGES IN THE COMPOSITION OF THE ASSETS IN EUR Corporate Bonds EUR 2023
1st semester 2nd semester Total
Purchases 999,630.00 28,837,222.00 29,836,852.00 Sales 17,872,381.02 32,568,395.60 50,440,776.62 Total 1 18,872,011.02 61,405,617.60 80,277,628.62 Subscriptions 4,427,892.31 42,669,375.25 47,097,267.56 Redemptions 28,347,236.09 43,046,185.24 71,393,421.33 Total 2 32,775,128.40 85,715,560.49 118,490,688.89 Reference average of the total net asset 183,836,652.25 179,151,245.10 181,474,693.58
Rotation Percentage -7.56% -13.57% -21.06%
The rotation rate gives the annual average of the transactions. A figure close to 0% shows that the transactions relating to the securities or the assets with the exception of deposits and liquid assets during a given period, were done exclusively in function of the subscriptions and redemptions. A negative percentage indicates that the subscriptions and redemptions give rise to only few or, as the case may be, no transactions in the portfolio.
A detailed list of the transactions carried out during the financial year can be consulted, free of charge, at Banque Degroof Petercam S.A with its registered office at Rue de l’Industrie 44 - B-1040 Brussels which provides the financial services.

DPAM CAPITAL B
Corporate Bonds EUR 2023
256
12.8. EVOLUTION OF SUBSCRIPTIONS, REDEMPTIONS AND THE NET ASSET
VALUE Corporate Bonds EUR 2023
Evolution of the number of shares in circulation
31 December 2019 31 December 2020 31 December 2021
Class Subscriptions Redemptions End of Period Subscriptions Redemptions End of Period Subscriptions Redemptions End of Period
A (Dis) 145,387.89 27,392.99 304,472.55 253,524.38 96,988.67 461,008.25 178,346.07 277,548.58 361,805.75
B (Cap) 20,205.00 3,330.00 44,375.00 14,368.80 13,650.00 45,093.80 14,750.00 24,315.80 35,528.00
F (Cap) 20,149.00 0.00 49,964.00 57,720.00 32,480.00 75,204.00 19,100.31 0.00 94,304.31
I 0.00 0.00 0.00 0.00 0.00 0.00 0.00 0.00 0.00
J (Cap) 0.00 0.00 0.00 0.00 0.00 0.00 0.00 0.00 0.00
M (Dis) 499,886.05 43,912.37 771,313.67 471,171.91 171,209.89 1,071,275.68 110,774.62 394,306.93 787,743.37
N (Cap) 52,705.00 1,855.00 50,850.00 13,308.00 3,639.00 60,519.00 25,858.33 14,431.98 71,945.35
P (Cap) 0.00 0.00 0.00 1,855.00 845.00 1,010.00 460.00 0.00 1,470.00
Z 0.00 0.00 0.00 0.00 0.00 0.00 0.00 0.00 0.00
TOTAL 1,220,975.22 1,714,110.74 1,352,796.78
Payable and receivable amounts for the UCI
EUR 31 December 2019 31 December 2020 31 December 2021
Class Subscriptions Redemptions Subscriptions Redemptions Subscriptions Redemptions
A (Dis) 14,718,299.92 2,766,326.05 24,978,869.97 9,725,346.82 17,873,025.87 27,807,154.47
B (Cap) 2,073,440.10 343,670.55 1,446,712.46 1,397,480.30 1,519,700.00 2,504,955.25
F (Cap) 2,052,325.12 0.00 5,944,159.80 3,357,132.80 1,974,781.26 0.00
I 0.00 0.00 0.00 0.00 0.00 0.00
J (Cap) 0.00 0.00 0.00 0.00 0.00 0.00
M (Dis) 50,605,621.58 4,457,002.17 46,749,571.69 17,165,723.42 11,102,252.37 39,592,377.10
N (Cap) 5,459,882.55 190,786.00 1,363,271.52 371,407.67 2,667,811.66 1,488,934.51
P (Cap) 0.00 0.00 46,696,236.45 21,937,264.70 11,959,696.40 0.00
Z 0.00 0.00 0.00 0.00 0.00 0.00
TOTAL 74,909,569.27 7,757,784.77 127,178,821.89 53,954,355.71 47,097,267.56 71,393,421.33
net asset value
EUR 31 December 2019 31 December 2020 31 December 2021
Class of the subfund Per share of the subfund Per share of the subfund Per share
A (Dis)
B (Cap)
F (Cap)
I
J (Cap)
M (Dis)
N (Cap)
P (Cap)
Z
124,608,017.44
101.89
102.87
103.14
0.00
0.00
101.95
102.86
0.00
0.00
199,417,757.79
100.82
102.99
103.34
0.00
0.00
100.90
103.06
25,938.27
0.00
173,816,130.28
99.91
102.84
103.27
0.00
0.00
99.96
103.00
25,931.63
0.00
TOTAL 124,608,017.44 199,417,757.79 173,816,130.28
On the date of publication of this report, the net asset value per share is published on the following websites: www.dpamfunds.com and www.beama.be. This information is also available at the counters of the financial services department.

DPAM CAPITAL B
Corporate Bonds EUR 2023
257
12.9. PERFORMANCES
Figures reflect past performance and are not an indicator of future performance. These figures do not include any restructuring.
Returns are determined at the end of the financial year.
The annual return is defined as the absolute return earned over a year. For the semi-annual report, the accounting year is 12-month period preceding the end of the half-year.
From 2011, the calculation of the performance of the capitalization units is calculated similarly to the distribution units. This change is also applied to past performance. This change of method does not bring any significant difference compared to the method used previously.
Bar chart showing annual returns of the last 10 years (in % and calculated in EUR) as of 31 December 2021: Class A (Dis) Table showing historical performance (actuarial returns):
Average cumulated returns Since
1 year 3 year 5 year 10 year
Year Value
Class A (Dis) -0.15 % (in EUR)
0.98 % (in EUR)
16/06/2017 0.64 % (in EUR)
Class B (Cap)
Annual return:
No benchmarks are used in the management of the sub-fund.
-0.8
%
3.1
%
0.1
%
-0.1
%
-1.0%
-0.5%
0.0%
0.5%
1.0%
1.5%
2.0%
2.5%
3.0%
3.5%
2018 2019 2020 2021
Class B (Cap)

DPAM CAPITAL B
Corporate Bonds EUR 2023
258
Table showing historical performance (actuarial returns):
Average cumulated returns Since
1 year 3 year 5 year 10 year
Year Value
Class B (Cap) -0.15 % (in EUR)
1.02 % (in EUR)
08/08/2017 0.64 % (in EUR)
Class F (Cap) Table showing historical performance (actuarial returns):
Average cumulated returns Since
1 year 3 year 5 year 10 year
Year Value
Class F (Cap) -0.07 % (in EUR)
1.10 % (in EUR)
16/06/2017 0.73 % (in EUR)
Class M (Dis) Table showing historical performance (actuarial returns):
Average cumulated returns Since
1 year 3 year 5 year 10 year
Year Value
Class M (Dis) -0.14 % (in EUR)
1.03 % (in EUR)
29/12/2017 0.60 % (in EUR)
Class N (Cap) Table showing historical performance (actuarial returns):
Average cumulated returns Since
1 year 3 year 5 year 10 year
Year Value
Class N (Cap) -0.06 % (in EUR)
26/08/2019 -0.26 % (in EUR)
Class P (Cap) Table showing historical performance (actuarial returns):
Average cumulated returns Since
1 year 3 year 5 year 10 year
Year Value
Class P (Cap) -0.03 % (in EUR)
15/04/2020 2.16 % (in EUR)

DPAM CAPITAL B
Corporate Bonds EUR 2023
259
12.10. CHARGES Corporate Bonds EUR 2023
Ongoing charges
The ongoing charges, calculated in accordance with the provisions of European Commission Regulation 583/2010 of 1 July 2010. These charges include transaction fees incurred by the sub-fund when it subscribes to and/or sells units of another fund, but do not include either (i) the fees incurred by the sub-fund when it makes investments other than subscriptions/sales of units of funds or, where applicable, (ii) the performance fee These charges are based on the fees charged in fund accounting for one year prior to the end of the period under review. In the event of a change in the cost structure during the financial year or if the share class is issued during the financial year, the amount of the reported current expenses is calculated on the basis of an estimate based on the expected total amount of the annual expenses (which could be determined by comparison with a similar class).
Given the change in the cost structure during the year, the estimated fees are:
- Class A (Dis) - BE6292995238: 0.25 % - Class B (Cap) - BE6296101254: 0.24 % - Class F (Cap) - BE6292994223: 0.16 % - Class M (Dis) - BE6299514438: 0.23 % - Class N (Cap) - BE6299515443: 0.15 % - Class P (Cap) - BE6292996244: 0.12 %
12.11. NOTES TO THE FINANCIAL STATEMENTS AND OTHER
INFORMATION
12.11.1. Gross dividends paid in the financial year
2017/2018 class A 1.05 EUR 2018 class A 1.05 EUR class M 1.15 EUR 2019 class A 1.08 EUR class M 1.11 EUR 2020 class A 0.76 EUR class M 0,80 EUR
12.11.2. transparency of securities financing transactions and of reuse
In accordance with Article 13 and Section A of the Annex to Regulation EU 2015/2365 (hereinafter the Regulation), the Sicav must inform investors of its use of securities financing transactions and total return swaps in the annual report and the half-yearly report.
The portfolio does not contain any loaned assets at the date of this report.
12.11.3. Transparency in sustainability
Déclaration obligatoire conformément à l’article 7 du règlement (UE) 2020/852 du 18 juin 2020 sur l’établissement d’un cadre visant à favoriser les investissements durables et modifiant le règlement (UE) 2019/2088 Les investissements sous-jacents à ce compartiment ne prennent pas en compte les critères de l’Union européenne en matière d’activités économiques durables sur le plan environnemental.

DPAM CAPITAL B
Corporate Bonds EUR 2023
260
12.11.4. Transparency of the securities financing transactions and of reuse
In accordance with Article 13 and Section A of the Annex to Regulation EU 2015/2365 (hereinafter the Regulation), the Sicav must inform investors of its use of securities financing transactions and total return swaps in the annual report and the half-yearly report. The portfolio does not contain any loaned assets at the date of this report.
Corporate Bonds EUR 2023
DPAM CAPITAL B
Real Estate EMU Sustainable
261
13. INFORMATION ABOUT THE SUBFUND DPAM CAPITAL B REAL ESTATE EMU SUSTAINABLE
Real Estate EMU Sustainable
13.1. MANAGEMENT REPORT
13.1.1. Launch date of the sub-fund and subscription price of the shares
Initial subscription day: October 24, 2018. On October 16, 2018, the sub-fund received the entire assets of the Real Estate EMU sub-fund of ATLAS SICAV through a merger by absorption. On October 24, 2018, the sub-fund was launched following the effectiveness of the merger. The initial subscription price corresponds to the Net Asset Value of the shares of the Real Estate EMU sub-fund of the ATLAS SICAV on October 24, 2018.
13.1.2. Stock exchange listing
The shares of the sub-fund are not listed on an exchange
13.1.3. Aim and main outlines of the investment policy
The objective is to provide its shareholders with the highest possible overall return over the long term, with a focus on representative investments in the real estate sector in the euro zone. The sub-fund will not invest more than 40% of its assets in receivables of any kind. The companies in which the sub-fund invests are selected on the basis of compliance with environmental, social and governance (ESG) criteria. The sub-fund uses a rigorous ESG methodology and strict exclusions in order not to undermine other environmental and social objectives and to ensure the required good governance practices. This is an actively managed sub-fund, which means that the portfolio manager does not aim to replicate the performance of a benchmark. The sub-fund will not invest more than 10% of its net assets in units of other undertakings for collective investment.
13.1.4. Financial management of the portfolio
Degroof Petercam Asset Management S.A. Rue Guimard, 18, 1040 Brussels
13.1.5. Distributor
Degroof Petercam Asset Management S.A. Rue Guimard, 18, 1040 Brussels
13.1.6. Index and benchmark
The sub-fund uses the following index as a benchmark: FTSE EPRA/NAREIT Eurozone Capped Net Return index This index is representative of the market for listed real estate companies in developed countries (as defined in the index methodology) in the EMU zone. The performance of this index is calculated by reinvesting net dividends (Net Return). This is an actively managed sub-fund, which means that the portfolio manager does not aim to replicate the performance of a benchmark. The benchmark is used for performance comparison purposes. The possible composition and the value of the benchmark can be found on the website www.dpamfunds.com.

DPAM CAPITAL B
Real Estate EMU Sustainable
262
13.1.7. Policy followed during the year
The B share class of the fund increased by 8.14% in 2021. This positive performance, in sharp contrast with 2020, results from a significant increase in earnings visibility of several subsectors impacted by the global pandemic in 2020. All sub-sectors contributed positively to this performance. The logistics sector was the best performing sub-sector due to increased demand for warehouses coming from more e-commerce and supply change evolutions, as well as better than expected rental growth. Offices and retail also contributed positively as uncertainty on future cash-flows eased. Both sub-sectors are still challenged by the evolution of demand and we expect the coming year to be important to get a clearer view on how valuations will evolve for the longer term. The residential sub-sector was the weakest performer over this year, due to perceived risks of higher regulation and higher interest rates. In this challenging environment, our strategy was to continue to gradually increase our exposure to the stronger sectors and within these, to cherry pick the companies that still offer a compelling valuation. With the M&A activity the exposure to residential companies decreased. We expect to find attractive pricing levels of our favorite companies to increase its weight again in the year to come. In retail we started the year with a very low exposure and have built positions when valuation was attractive. We remain prudent on this sub-sector, as well as for offices, as the supply demand balance is still more in favor of the tenants. On a geographical view, our exposure to Germany decreased most due to the bid on Deutsche Wohnen. Main countries that benefited from an increased weight were Belgium, the Netherlands and France.
13.1.8. Future policy
Following the increased appetite for real estate assets and the better earnings visibility, the outlook for the sector massively improved throughout 2021 with net asset values expected to rise by 8 to 9% on average per year on a 3-year outlook, compared to only 1 to 2 % annual growth outlook at the end of 2020. Main uncertainty remains the valuation within the retail and office sub-sectors. In retail we are probably getting closer to trough valuations. For offices, prime well-located and modern assets trade at high values. The challenge will be to retrofit older assets to the latest standards at an acceptable cost, which may continue to depress values for this kind of buildings. We will therefore continue to favor the sub-sectors showing sound growth, investing mainly in companies which are not priced for perfection and paying an attractive, sustainable, and growing dividend.
13.1.9. Synthetic risk and reward indicator
The synthetic risk and return indicator gives an indication of the risk associated with investing in a sub-fund. It places this risk on a scale ranging from one (lowest risk) to seven (highest risk).. Risk and reward profile: 6.

DPAM CAPITAL B
Real Estate EMU Sustainable
263
13.2. BALANCE SHEET
31 December 2021
EUR 31 December 2020
EUR
Section 1: Balance Sheet
TOTAL NET ASSETS 146,897,361.25 149,243,559.14
I. Fixed assets
A. Incorporation and organisation expenses B. Intangible assets C. Tangible assets
II. Transferable securities, money market instruments, UCIs and Financial derivatives
143,712,643.78 148,348,069.60
A. Bonds and other debt securities B. Money market instruments C. Shares and other securities similar to shares 143,712,643.78 148,348,069.60 a. Shares 143,712,643.78 148,348,069.60 D. Other transferable securities E. UCI with variable number of shares F. financial derivatives
III. Receivables and payables on more than one year
A. Receivables B. Payables
IV. Receivables and payables up to a year -279,663.99 -142,118.56
A. Receivables 67,754.95 173,300.89 a. Receivables 421.25 d. Others 67,333.70 173,300.89 B. Payables -347,418.94 -315,419.45 a. Payable amounts (-) -66,189.62 c. Borrowing (-) -1,785.86 -566.92 e. Others (-) -345,633.08 -248,662.91
V. Deposits and liquidity 3,464,381.46 1,037,608.10
A. Demand bank deposits 3,464,381.46 1,037,608.10 B. Term bank deposits C. Others
VI. Deferred charges and accrued income
A. Expenses carried forward B. Accrued income C. Accrued expenses (-) D. Income carried forward (-)
TOTAL SHAREHOLDERS’ EQUITY 146,897,361.25 149,243,559.14
A. Capital 117,429,341.42 131,039,441.65 B. Income equalisation 529,577.94 2,045,504.19 C. Retained earnings 18,204,117.49 43,595,566.75 D. Result of the financial year 10,734,324.40 -27,436,953.45
Real Estate EMU Sustaina ble

DPAM CAPITAL B
Real Estate EMU Sustainable
264
31 December 2021
EUR 31 December 2020
EUR
Section 2: Off-balance sheet
I. Collateral (+/-)
A. Collateral (+/-) B. Other collateral
II. Underlying securities of the option contracts and warrants (+)
A. Option contracts and warrants bought B. Option contracts and warrants sold
III. Notional amount of futures contracts (+)
A. Futures contracts bought and Forward contracts B. Futures contracts sold and Forward Contracts
IV. Notional amount of the swap contracts (+)
A. Purchased swap contracts B. Sold swap contracts
V. Notional amount of other financial derivatives (+)
A. Purchased contracts B. Sold contracts
VI. Uncalled amounts on shares
VII. Commitments to resell on account of purchase-repurchase agreements
VIII. Commitments to repurchase on account of purchase-repurchase agreements
IX. Lent financial instruments

DPAM CAPITAL B
Real Estate EMU Sustainable
265
13.3. INCOME STATEMENT
31 December 2021
EUR 31 December 2020
EUR
Section 3: Income and expenditure account
I. Depreciation, capital loss and capital gain 7,868,138.15 -31,757,215.87
A. Bonds and other debt securities
B. Money market instruments
C. Shares and other securities similar to shares 7,868,138.15 -31,775,947.20
a. Shares 7,868,138.15 -31,747,147.20
Realised gain 9,274,957.71 2,593,188.68
Realised loss -8,082,492.27 -25,655,113.57
Unrealised gain and loss 6,675,672.71 -8,685,222.31
b. UCI with fixed number of shares -28,800.00
Realised loss -28,800.00
D. Other Transferable Securities 18,731.33
Realised gain 18,731.33
E. UCI with variable number of shares
F. financial derivatives
G. Receivables, deposits, liquidity and payables
H. Foreign exchange positions and transactions
II. Investment income and expenses 4,164,557.58 5,578,941.07
A. Dividends 4,617,407.85 6,127,453.69
B. Interest (+/-) 2,177.82 3,492.94
b. Deposits and liquidity 2,177.82 3,492.94
Interest on loans (-) -13,051.98 -12,474.84
Swap contracts (+/-)
Withholding tax (-) -441,976.11 -539,530.72
Belgian -236,250.50 -223,516.56
Foreign -205,725.61 -316,014.16
F. Other investment income
III. Other income
A. Anti dilution fee
B. Other
IV. Operating expenses -1,298,371.33 -1,258,678.65
A. Investment transaction and delivery costs (-) -302,100.22 -223,768.57
B. Financial expenses (-)
C. Custodian’s fee (-) -46,875.75 -40,043.21
D. Manager’s fee (-) -870,258.36 -940,317.59
a. Financial Management of the Portfolio -771,656.05 -793,203.01
Class A (Dis) -31,602.04 -36,615.20
Class B (Cap) -433,593.98 -433,201.77
Class E (Dis) -176.76
Class F (Cap) -223,242.08 -209,588.58
Class J (Cap) -3,327.81 -48,561.96
Class M (Dis) -2,012.08 -2,587.53
Class N (Cap) -76,191.22 -62,471.21
Class W (Cap) -1,686.84
b. Administration and accounting -98,602.31 -147,114.58
E. Administrative expenses (-) -24,500.01 -32,640.39
F. Incorporation and organisation expenses (-) -2,443.07 -1,810.96
G. Salaries and wages, social security charges and pensions (-) -185.60 300.09
H. Services and various goods (-) -24,754.61 -12,984.67
I. Depreciation and provisions for liabilities and charges (-)
J. Taxes -21,314.50 -23,152.66
Class A (Dis) -1,679.19 -2,127.22
Class B (Cap) -12,164.86 -15,964.65
Class E (Dis) 0.14
Class F (Cap) -2,563.98 -927.64
Class J (Cap) -58.06 85.71
Class M (Dis) -230.11 -226.61
Class N (Cap) -4,710.16 -4,111.10
Class P (Cap) 93.49 118.71
Class W (Cap) -1.63
K. Other expenses (-) -5,939.21 15,739.31
Income and expenditure for the financial year Sub-Total II + III + IV 2,866,186.25 4,320,262.42
V. Current profit (loss) before income tax 10,734,324.40 -27,436,953.45

DPAM CAPITAL B
Real Estate EMU Sustainable
266
31 December 2021
EUR 31 December 2020
EUR
VI. Income tax
VII. Result of the financial year 10,734,324.40 -27,436,953.45
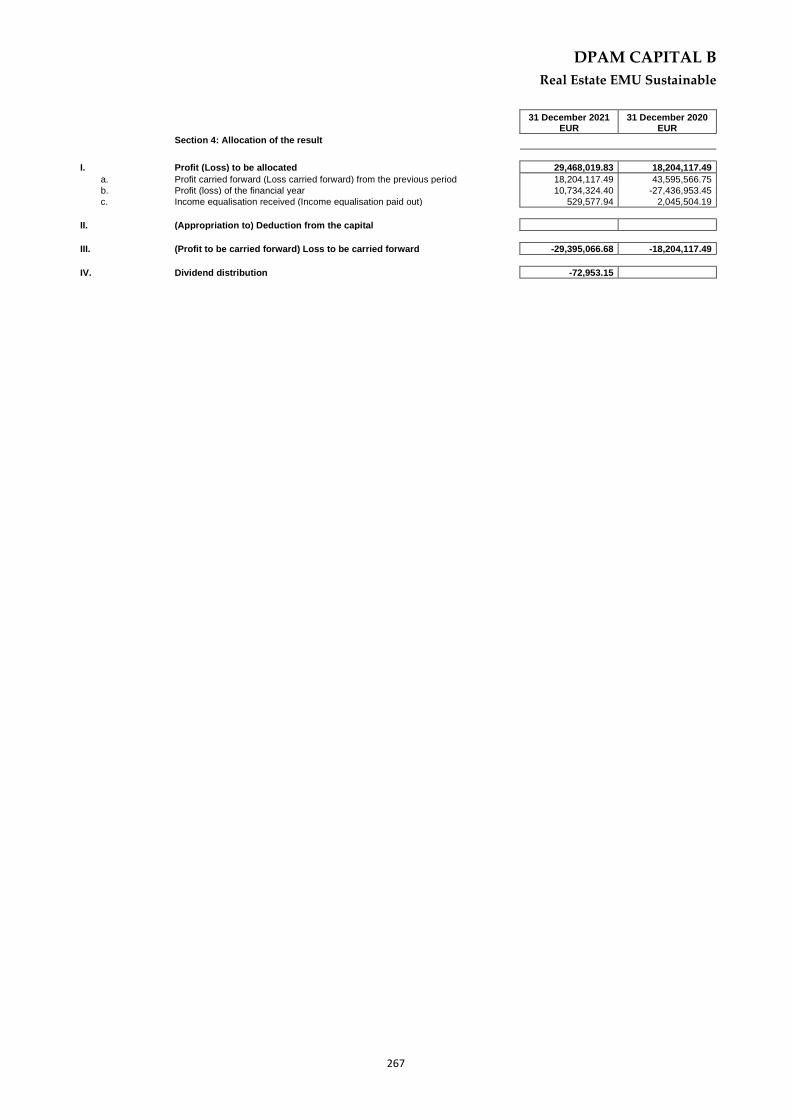
DPAM CAPITAL B
Real Estate EMU Sustainable
267
31 December 2021
EUR 31 December 2020
EUR
Section 4: Allocation of the result
I. Profit (Loss) to be allocated 29,468,019.83 18,204,117.49
a. Profit carried forward (Loss carried forward) from the previous period 18,204,117.49 43,595,566.75
b. Profit (loss) of the financial year 10,734,324.40 -27,436,953.45
c. Income equalisation received (Income equalisation paid out) 529,577.94 2,045,504.19
II. (Appropriation to) Deduction from the capital
III. (Profit to be carried forward) Loss to be carried forward -29,395,066.68 -18,204,117.49
IV. Dividend distribution -72,953.15
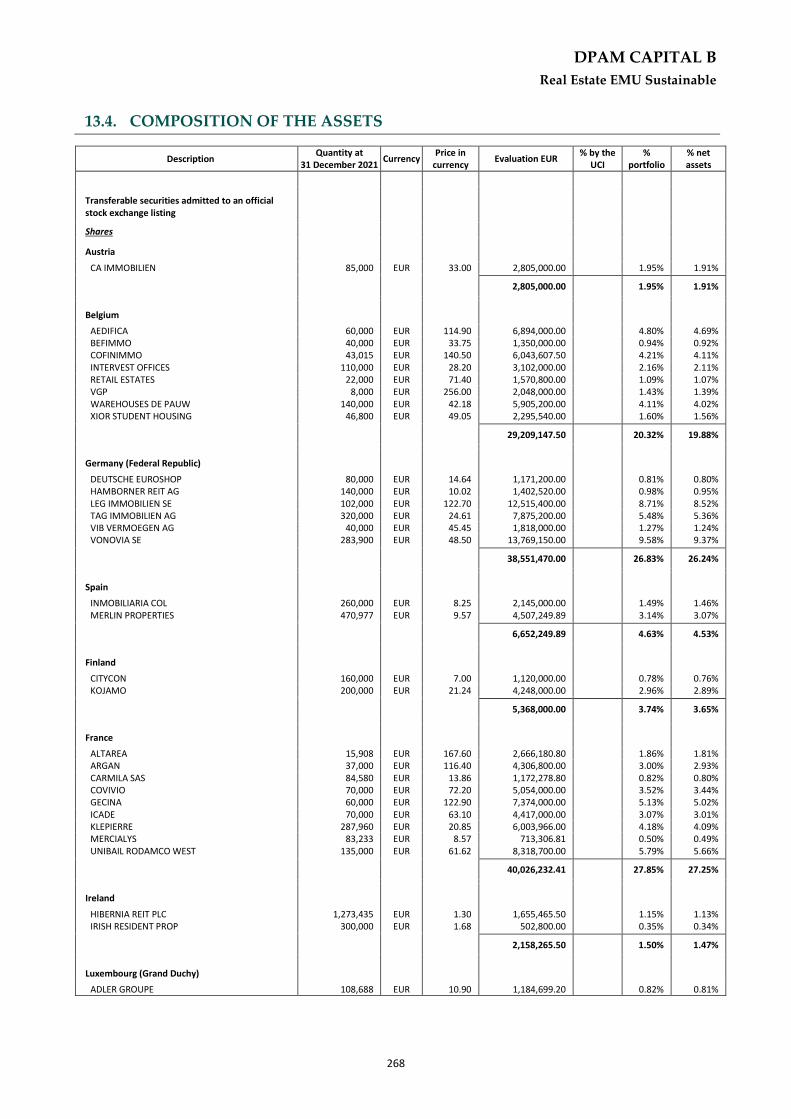
DPAM CAPITAL B
Real Estate EMU Sustainable
268
13.4. COMPOSITION OF THE ASSETS
Real Estate EMU Sustainable
Description Quantity at
31 December 2021 Currency
Price in currency
Evaluation EUR % by the
UCI %
portfolio % net assets
Transferable securities admitted to an official stock exchange listing
Shares
Austria
CA IMMOBILIEN 85,000 EUR 33.00 2,805,000.00 1.95% 1.91%
2,805,000.00 1.95% 1.91%
Belgium
AEDIFICA 60,000 EUR 114.90 6,894,000.00 4.80% 4.69% BEFIMMO 40,000 EUR 33.75 1,350,000.00 0.94% 0.92% COFINIMMO 43,015 EUR 140.50 6,043,607.50 4.21% 4.11% INTERVEST OFFICES 110,000 EUR 28.20 3,102,000.00 2.16% 2.11% RETAIL ESTATES 22,000 EUR 71.40 1,570,800.00 1.09% 1.07% VGP 8,000 EUR 256.00 2,048,000.00 1.43% 1.39% WAREHOUSES DE PAUW 140,000 EUR 42.18 5,905,200.00 4.11% 4.02% XIOR STUDENT HOUSING 46,800 EUR 49.05 2,295,540.00 1.60% 1.56%
29,209,147.50 20.32% 19.88%
Germany (Federal Republic)
DEUTSCHE EUROSHOP 80,000 EUR 14.64 1,171,200.00 0.81% 0.80% HAMBORNER REIT AG 140,000 EUR 10.02 1,402,520.00 0.98% 0.95% LEG IMMOBILIEN SE 102,000 EUR 122.70 12,515,400.00 8.71% 8.52% TAG IMMOBILIEN AG 320,000 EUR 24.61 7,875,200.00 5.48% 5.36% VIB VERMOEGEN AG 40,000 EUR 45.45 1,818,000.00 1.27% 1.24% VONOVIA SE 283,900 EUR 48.50 13,769,150.00 9.58% 9.37%
38,551,470.00 26.83% 26.24%
Spain
INMOBILIARIA COL 260,000 EUR 8.25 2,145,000.00 1.49% 1.46% MERLIN PROPERTIES 470,977 EUR 9.57 4,507,249.89 3.14% 3.07%
6,652,249.89 4.63% 4.53%
Finland
CITYCON 160,000 EUR 7.00 1,120,000.00 0.78% 0.76% KOJAMO 200,000 EUR 21.24 4,248,000.00 2.96% 2.89%
5,368,000.00 3.74% 3.65%
France
ALTAREA 15,908 EUR 167.60 2,666,180.80 1.86% 1.81% ARGAN 37,000 EUR 116.40 4,306,800.00 3.00% 2.93% CARMILA SAS 84,580 EUR 13.86 1,172,278.80 0.82% 0.80% COVIVIO 70,000 EUR 72.20 5,054,000.00 3.52% 3.44% GECINA 60,000 EUR 122.90 7,374,000.00 5.13% 5.02% ICADE 70,000 EUR 63.10 4,417,000.00 3.07% 3.01% KLEPIERRE 287,960 EUR 20.85 6,003,966.00 4.18% 4.09% MERCIALYS 83,233 EUR 8.57 713,306.81 0.50% 0.49% UNIBAIL RODAMCO WEST 135,000 EUR 61.62 8,318,700.00 5.79% 5.66%
40,026,232.41 27.85% 27.25%
Ireland
HIBERNIA REIT PLC 1,273,435 EUR 1.30 1,655,465.50 1.15% 1.13% IRISH RESIDENT PROP 300,000 EUR 1.68 502,800.00 0.35% 0.34%
2,158,265.50 1.50% 1.47%
Luxembourg (Grand Duchy)
ADLER GROUPE 108,688 EUR 10.90 1,184,699.20 0.82% 0.81%
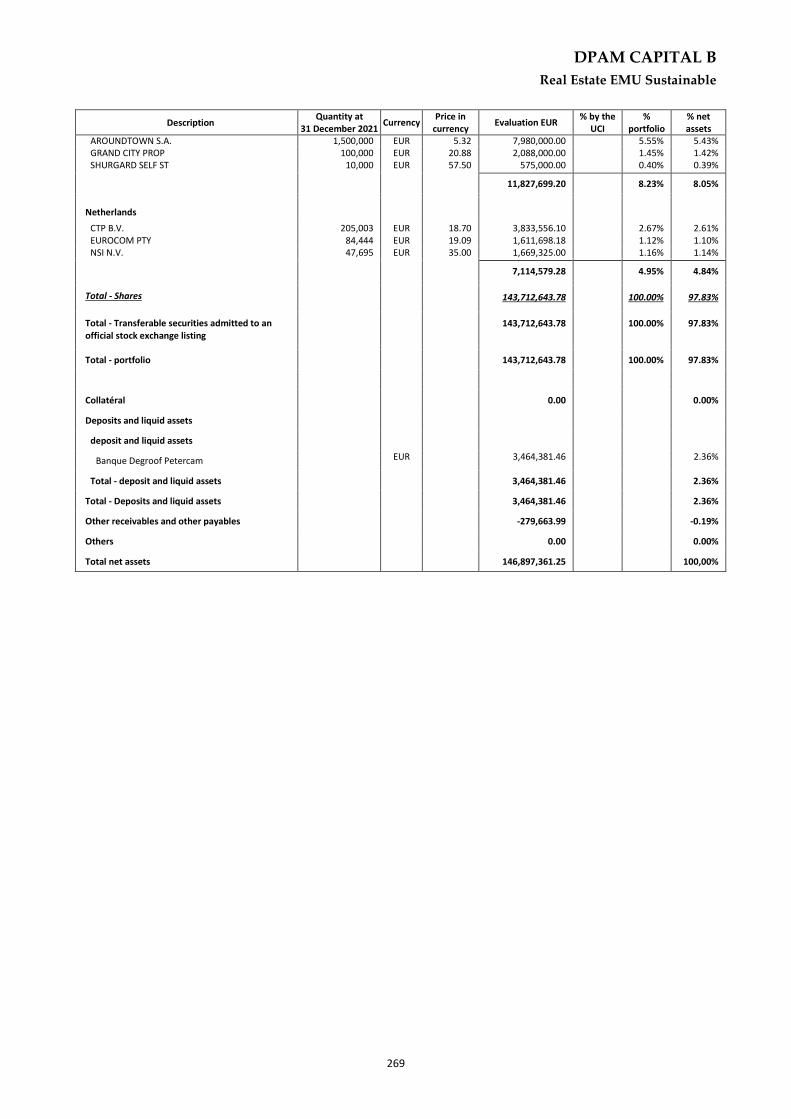
DPAM CAPITAL B
Real Estate EMU Sustainable
269
Description Quantity at
31 December 2021 Currency
Price in currency
Evaluation EUR % by the
UCI %
portfolio % net assets
AROUNDTOWN S.A. 1,500,000 EUR 5.32 7,980,000.00 5.55% 5.43% GRAND CITY PROP 100,000 EUR 20.88 2,088,000.00 1.45% 1.42% SHURGARD SELF ST 10,000 EUR 57.50 575,000.00 0.40% 0.39%
11,827,699.20 8.23% 8.05%
Netherlands
CTP B.V. 205,003 EUR 18.70 3,833,556.10 2.67% 2.61% EUROCOM PTY 84,444 EUR 19.09 1,611,698.18 1.12% 1.10% NSI N.V. 47,695 EUR 35.00 1,669,325.00 1.16% 1.14%
7,114,579.28 4.95% 4.84%
Total - Shares 143,712,643.78 100.00% 97.83%
Total - Transferable securities admitted to an official stock exchange listing
143,712,643.78 100.00% 97.83%
Total - portfolio 143,712,643.78 100.00% 97.83%
Collatéral 0.00 0.00%
Deposits and liquid assets
deposit and liquid assets
Banque Degroof Petercam EUR 3,464,381.46 2.36%
Total - deposit and liquid assets 3,464,381.46 2.36%
Total - Deposits and liquid assets 3,464,381.46 2.36%
Other receivables and other payables -279,663.99 -0.19%
Others 0.00 0.00%
Total net assets 146,897,361.25 100,00%
Real Estate EMU Sustainable

DPAM CAPITAL B
Real Estate EMU Sustainable
270
13.5. GEOGRAPHIC ALLOCATION OF INVESTMENTS
By country % Portfolio
FRANCE 27.85%
GERMANY (FEDERAL REPUBLIC) 26.83%
BELGIUM 20.32%
LUXEMBOURG (GRAND DUCHY) 8.23%
NETHERLANDS 4.95%
SPAIN 4.63%
FINLAND 3.74%
AUSTRIA 1.95%
IRELAND 1.50%
Total 100.00%
These allocations of assets were established on basis of data (gross) used by the entity responsible for the administration and bookkeeping and do not reflect inevitably the economic analysis which directed the assets selection.
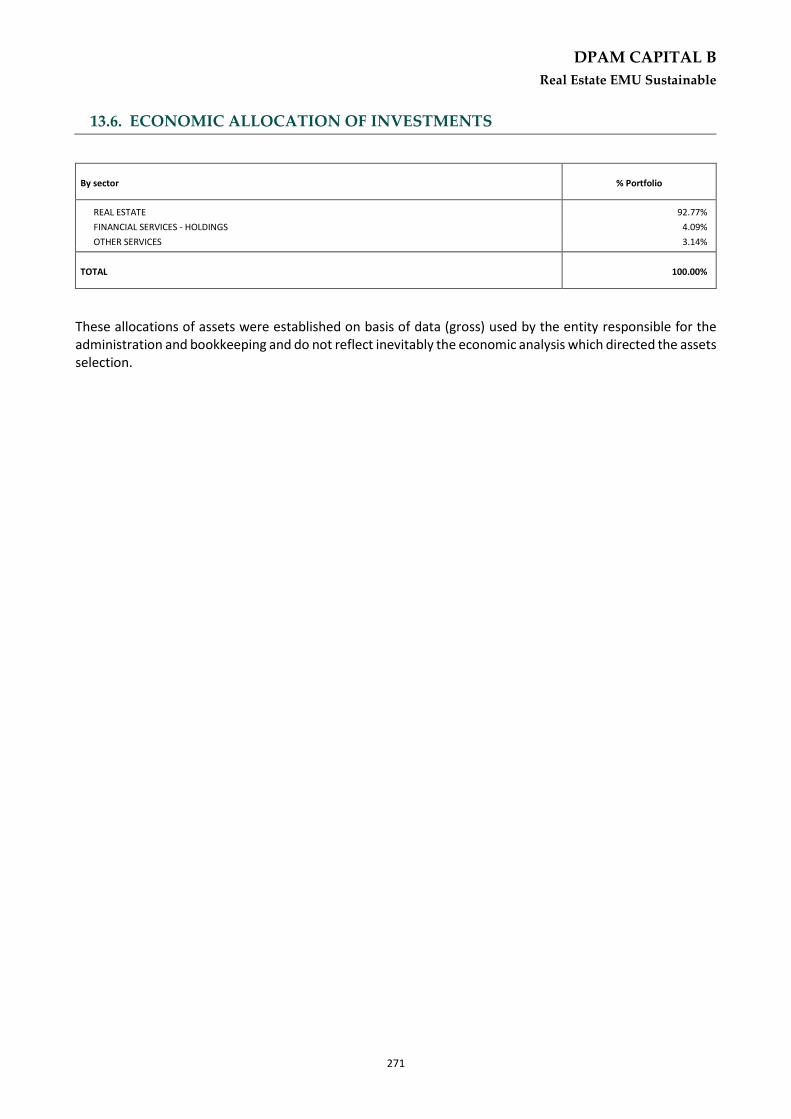
DPAM CAPITAL B
Real Estate EMU Sustainable
271
13.6. ECONOMIC ALLOCATION OF INVESTMENTS
By sector % Portfolio
REAL ESTATE 92.77%
FINANCIAL SERVICES - HOLDINGS 4.09%
OTHER SERVICES 3.14%
TOTAL 100.00%
These allocations of assets were established on basis of data (gross) used by the entity responsible for the administration and bookkeeping and do not reflect inevitably the economic analysis which directed the assets selection.

DPAM CAPITAL B
Real Estate EMU Sustainable
272
13.7. CHANGES IN THE COMPOSITION OF THE ASSETS IN EUR Real Estate EMU Sustainable
1st semester 2nd semester Total
Purchases 50,390,633.04 32,057,271.72 82,447,904.76 Sales 60,454,013.66 34,497,446.54 94,951,460.20 Total 1 110,844,646.70 66,554,718.26 177,399,364.96 Subscriptions 19,681,901.20 15,460,706.84 35,142,608.04 Redemptions 33,566,103.67 14,657,026.66 48,223,130.33 Total 2 53,248,004.87 30,117,733.50 83,365,738.37 Reference average of the total net asset 131,889,408.57 146,180,280.96 139,093,574.38
Rotation Percentage 43.67% 24.93% 67.60%
The rotation rate gives the annual average of the transactions. A figure close to 0% shows that the transactions relating to the securities or the assets with the exception of deposits and liquid assets during a given period, were done exclusively in function of the subscriptions and redemptions. A negative percentage indicates that the subscriptions and redemptions give rise to only few or, as the case may be, no transactions in the portfolio.
A detailed list of the transactions carried out during the financial year can be consulted, free of charge, at Banque Degroof Petercam S.A with its registered office at Rue de l’Industrie 44 - B-1040 Brussels which provides the financial services.

DPAM CAPITAL B
Real Estate EMU Sustainable
273
13.8. EVOLUTION OF SUBSCRIPTIONS, REDEMPTIONS AND THE NET ASSET
VALUE Real Estate EMU Sustainable
Evolution of the number of shares in circulation
31 December 2019 31 December 2020 31 December 2021
Class Subscriptions Redemptions End of Period Subscriptions Redemptions End of Period Subscriptions Redemptions End of Period
A (Dis) 22,959.72 10,351.93 58,409.61 7,529.97 23,791.79 42,147.79 6,680.00 14,667.00 34,160.79
B (Cap) 100,430.56 96,259.18 688,021.05 130,333.28 301,384.56 516,969.77 64,338.72 139,585.86 441,722.63
F (Cap) 271,952.75 267,525.20 759,108.23 284,465.10 640,703.36 402,869.97 303,016.00 181,762.67 524,123.30
J (Cap) 0.00 50.00 84.00 0.00 25.00 0.00 0.00 59.00 0.00
M (Dis) 5,556.00 0.00 7,486.09 0.00 0.00 7,486.09 0.00 3,294.61 4,191.48
N (Cap) 18,490.71 17,776.51 147,947.73 53,061.00 41,896.10 159,112.63 22,896.84 20,465.51 161,543.96
P (Cap) 0.00 0.00 128.00 12.00 0.00 140.00 2.00 2.00 140.00
W (Cap) 0.00 0.00 0.00 0.00 6,766.72 1,485.43 5,281.29
TOTAL 1,661,184.72 1,128,726.25 1,171,163.45
Payable and receivable amounts for the UCI
EUR 31 December 2019 31 December 2020 31 December 2021
Class Subscriptions Redemptions Subscriptions Redemptions Subscriptions Redemptions
A (Dis) 1,756,059.64 801,020.12 532,333.68 1,609,359.80 519,457.75 1,060,809.39
B (Cap) 8,165,194.43 7,938,150.94 9,502,599.90 22,378,093.40 5,278,531.20 11,211,055.97
F (Cap) 21,957,419.73 23,123,129.08 20,428,310.94 47,701,782.64 26,123,921.94 16,025,858.73
J (Cap) 0.00 14,853,068.50 0.00 6,351,056.63 0.00 17,234,348.91
M (Dis) 441,798.76 0.00 0.00 0.00 0.00 234,288.04
N (Cap) 1,511,298.13 1,502,744.18 4,417,491.40 3,122,906.72 1,966,130.72 1,723,019.14
P (Cap) 0.00 0.00 3,945,312.96 0.00 695,628.20 604,712.32
W (Cap) 0.00 0.00 558,938.23 129,037.83
TOTAL 33,831,770.69 48,218,112.82 38,826,048.88 81,163,199.19 35,142,608.04 48,223,130.33
net asset value
EUR 31 December 2019 31 December 2020 31 December 2021
Class of the subfund Per share of the subfund Per share of the subfund Per share
A (Dis)
B (Cap)
F (Cap)
J (Cap)
M (Dis)
N (Cap)
P (Cap)
W (Cap)
219,163,987.55
82.96
87.82
89.76
338,595.19
83.55
88.66
340,154.66
0.00
149,243,559.14
71.53
77.92
80.08
0.00
71.86
79.07
304,981.27
0.00
146,897,361.25
77.32
84.26
87.11
0.00
78.12
85.99
333,691.86
84.60
TOTAL 219,163,987.55 149,243,559.14 146,897,361.25
On the date of publication of this report, the net asset value per share is published on the following websites: www.dpamfunds.com and www.beama.be. This information is also available at the counters of the financial services department.

DPAM CAPITAL B
Real Estate EMU Sustainable
274
13.9. PERFORMANCES
Figures reflect past performance and are not an indicator of future performance. These figures do not include any restructuring. Returns are determined at the end of the financial year. The annual return is defined as the absolute return earned over a year. For the semi-annual report, the accounting year is 12-month period preceding the end of the half-year. From 2011, the calculation of the performance of the capitalization units is calculated similarly to the distribution units. This change is also applied to past performance. This change of method does not bring any significant difference compared to the method used previously. Bar chart showing annual returns of the last 10 years (in % and calculated in EUR) as of 31 December 2021: Class A (Dis) Table showing historical performance (actuarial returns):
Average cumulated returns Since
1 year 3 year 5 year 10 year
Year Value
Class A (Dis) 8.09 % (in EUR)
5.49 % (in EUR)
4.94 % (in EUR)
10/10/2016 4.64 % (in EUR)
Class B (Cap) Annual return:
This is an actively managed sub-fund, which means that the portfolio manager does not aim to replicate the performance of a benchmark. The benchmark is used to compare performance.
22
.7%
6.8
%
23
.4%
17
.0%
3.6
%
17
.4%
-7.6
%
22
.5%
-11
.3%
8.1
%
24
.6%
5.8
%
23
.4%
17
.0%
3.8
%
17
.6%
-7.5
%
22
.2%
-10
.9%
6.4
%
-15.00%
-10.00%
-5.00%
0.00%
5.00%
10.00%
15.00%
20.00%
25.00%
30.00%
2012 2013 2014 2015 2016 2017 2018 2019 2020 2021
Class B (Cap) FTSE EPRA/NAREIT Eurozone Capped Net Return index

DPAM CAPITAL B
Real Estate EMU Sustainable
275
Table showing historical performance (actuarial returns):
Average cumulated returns Since
1 year 3 year 5 year 10 year
Year Value
Class B (Cap) 8.14 % (in EUR)
5.53 % (in EUR)
4.98 % (in EUR)
9.59 % (in EUR)
07/10/1999 6.68 % (in EUR)
Class F (Cap) Table showing historical performance (actuarial returns):
Average cumulated returns Since
1 year 3 year 5 year 10 year
Year Value
Class F (Cap) 8.78 % (in EUR)
6.12 % (in EUR)
5.58 % (in EUR)
9.94 % (in EUR)
31/12/2018 9.22 % (in EUR)
Class M (Dis) Table showing historical performance (actuarial returns):
Average cumulated returns Since
1 year 3 year 5 year 10 year
Year Value
Class M (Dis) 8.71 % (in EUR)
6.03 % (in EUR)
27/06/2019 2.12 % (in EUR)
Class N (Cap) Table showing historical performance (actuarial returns):
Average cumulated returns Since
1 year 3 year 5 year 10 year
Year Value
Class N (Cap) 8.75 % (in EUR)
6.08 % (in EUR)
29/12/2017 2.60 % (in EUR)
Class P (Cap) Table showing historical performance (actuarial returns):
Average cumulated returns Since
1 year 3 year 5 year 10 year
Year Value
Class P (Cap) 9.41 % (in EUR)
6.68 % (in EUR)
6.14 % (in EUR)
19/10/2016 5.71 % (in EUR)

DPAM CAPITAL B
Real Estate EMU Sustainable
276
Class W (Cap) Table showing historical performance (actuarial returns):
Average cumulated returns Since
1 year 3 year 5 year 10 year
Year Value
Class W (Cap) 20/05/2021 5.30 % (in EUR)

DPAM CAPITAL B
Real Estate EMU Sustainable
277
13.10. CHARGES Real Estate EMU Sustainable
Ongoing charges
The ongoing charges, calculated in accordance with the provisions of European Commission Regulation 583/2010 of 1 July 2010. These charges include transaction fees incurred by the sub-fund when it subscribes to and/or sells units of another fund, but do not include either (i) the fees incurred by the sub-fund when it makes investments other than subscriptions/sales of units of funds or, where applicable, (ii) the performance fee These charges are based on the fees charged in fund accounting for one year prior to the end of the period under review. In the event of a change in the cost structure during the financial year or if the share class is issued during the financial year, the amount of the reported current expenses is calculated on the basis of an estimate based on the expected total amount of the annual expenses (which could be determined by comparison with a similar class). Given the change in the cost structure during the year, the estimated fees are:
- Class A (Dis) - BE6289023283: 1.79 % - Class B (Cap) - BE6271654228: 1.76 % - Class F (Cap) - BE6271655233: 0.94 % - Class M (Dis) - BE6299320430: 1.00 % - Class N (Cap) - BE6299325488: 0.97 % - Class P (Cap) - BE6289025304: 0.13 % - Class W (Cap) - BE6289027326: 1.03 %. Fee sharing As at 31 December 2021, 58.22% of the fee due to the manager has been retroceded to other distributors, third parties and Bank Degroof Petercam or one of its subsidiaries.
13.11. NOTES TO THE FINANCIAL STATEMENTS AND OTHER
INFORMATION
13.11.1. Gross dividends paid in the financial year
2019 class A 1.74 EUR class E 2.26 EUR class M 2.21 EUR
13.11.2. Investment restrictions and overruns
Between NAV Dates 1/02/2021 and 2/02/2021 a legal passive breach was open in the DPAM Capital B Real Estate EMU Sustainable subfund. Indeed, the sum of all positions weighing more than 5% of the portfolio must not surpass 40% of the portfolio (Royal Decree of 12/11/2012). As at NAV 01/02/2021 this constraint was not respected. The breach was resolved through market fluctuations. Between NAV Dates 9/02/2021 and 10/02/2021 a legal active breach was open in the DPAM Capital B Real Estate EMU Sustainable subfund. Indeed, as at NAV date 09/02/2021, the sum of the issuers representing more than 5% of the NAV weighed more than 40% together. The breach was resolved by reducing the relevant positions. Between NAV Dates 17/02/2021 and 18/02/2021 a legal passive breach was open in the DPAM Capital B Real Estate EMU Sustainable subfund. Indeed, the sum of all positions weighing more than 5% of the portfolio must not surpass

DPAM CAPITAL B
Real Estate EMU Sustainable
278
40% of the portfolio (Royal Decree of 12/11/2012). As at NAV 09/02/2021 this constraint was not respected. The breach was resolved by reducing the relevant positions. Between NAV Dates 2/03/2021 and 4/03/2021 a legal passive breach was open in the DPAM Capital B Real Estate EMU Sustainable subfund. Indeed, as at NAV date 02/03/2021, the Vonovia SE (ISIN: DE000A1ML7J1) represented more than 10% of the sub-fund’s TNA (10.039% as at NAV 02/03/2021). The breach was resolved by reducing the relevant positions. Between the NAV dates of 7/12/2021 and 8/12/2021, there was a legal active overrun in the DPAM Capital B Real Estate EMU Sustainable subfund. The overhang was caused by the fact that the fund may not hold more than 10% of its TNA in the same issuer. Following the execution of the subscription rights, this condition was not met. On the NAV date of 07/12/2021, the fund held 11.91% of its ANT in Vonovia SE (ISIN: DE000A1ML7J1). The overrun was resolved as the position was reduced.
13.11.3. Transparency in sustainability
This information is published in accordance with Article 11 of Regulation (EU) 2019/2088 of 27 November 2019 on sustainability-related disclosures in the financial services sector ("SFDR Regulation"), as amended by Article 25 of Regulation (EU) 2020/852 of 18 June 2020 on the establishment of a framework to promote sustainable investment and amending Regulation (EU) 2019/2088 ("Taxonomy Regulation"), as well as in respect of the Taxonomy Regulation. 1. Extent to which environmental or social characteristics are met This sub-fund invests at least 90% of its assets (excluding cash, undertaking for collective investment and derivatives) in securities that meet the environmental and social criteria it promotes. 20% of these assets will also pursue a sustainable investment objective, as defined by the SFDR Regulation. A) Sustainability indicators The sustainability indicators used to measure compliance with the environmental or social characteristics promoted by this sub-fund correspond to the binding investment restrictions mentioned in the prospectus. In accordance with these investment restrictions, the sub-fund's portfolio during the period under review had:
a) Zero exposure to issuers deemed non-compliant with the 10 principles of the United Nations Global Compact
(which are part of the Global Standards) at the time the positions were purchased;
In the event that a company's ESG profile deteriorated during the course of the portfolio holding, leading it
to be downgraded to Global Compact non-compliant status, the relevant investment has been sold in the
interest of the sub-fund's shareholders within three months.
b) Zero exposure to issuers involved in controversial activities that meet the exclusion criteria set out in DPAM's
Controversial Activities Policy (available at www.dpamfunds.com), both at the time of purchase of the
positions and during the time the portfolio positions were held;
c) Zero exposure to issuers facing major ESG controversies on environmental or social issues at the time of
purchase of the positions;
In the event of a major controversy concerning a company during the course of the portfolio holding, the
investment concerned was sold in the interest of the sub-fund's shareholders within three months.
d) A carbon intensity (direct scope 1 and 2 emissions) below the average carbon intensity of the reference
universe before the ESG and sustainable investment selection methodology was applied;
DPAM CAPITAL B
Real Estate EMU Sustainable
279
e) A lower average ESG profile risk than the reference universe before the ESG and sustainable investment
selection methodology was applied;
In order to achieve the sustainable objective of a portion of the investments, over the period 10 March 2021 to 31 December 2021, a minimum of 20% of the companies in which the portfolio was invested made a net positive contribution to sustainable development objectives. The net impact contribution is the difference between the positive and negative impact contributions and is calculated at the level of the invested company and the overall portfolio. Based on the UN SDG framework, the impact contribution takes into account both (1) the extent to which the products and services of the invested company contribute to the achievement of the SDGs and (2) the negative impacts associated with their activities along the value chain. More information about the indicators and their methodology can be found in the prospectus and on the website www.dpamfunds.com. B) Use of derivatives The sub-fund does not use derivatives, if any are held, for the purpose of promoting environmental and/or social characteristics as described in the prospectus. 2. Statement on the Taxonomy Regulation The investments underlying this product do not take into account the European Union's criteria for environmentally sustainable economic activities.
13.11.4. Transparency of the securities financing transactions and of reuse
In accordance with Article 13 and Section A of the Annex to Regulation EU 2015/2365 (hereinafter the Regulation), the Sicav must inform investors of its use of securities financing transactions and total return swaps in the annual report and the half-yearly report. The portfolio does not contain any loaned assets at the date of this report.
Real Estate EMU Sustainable
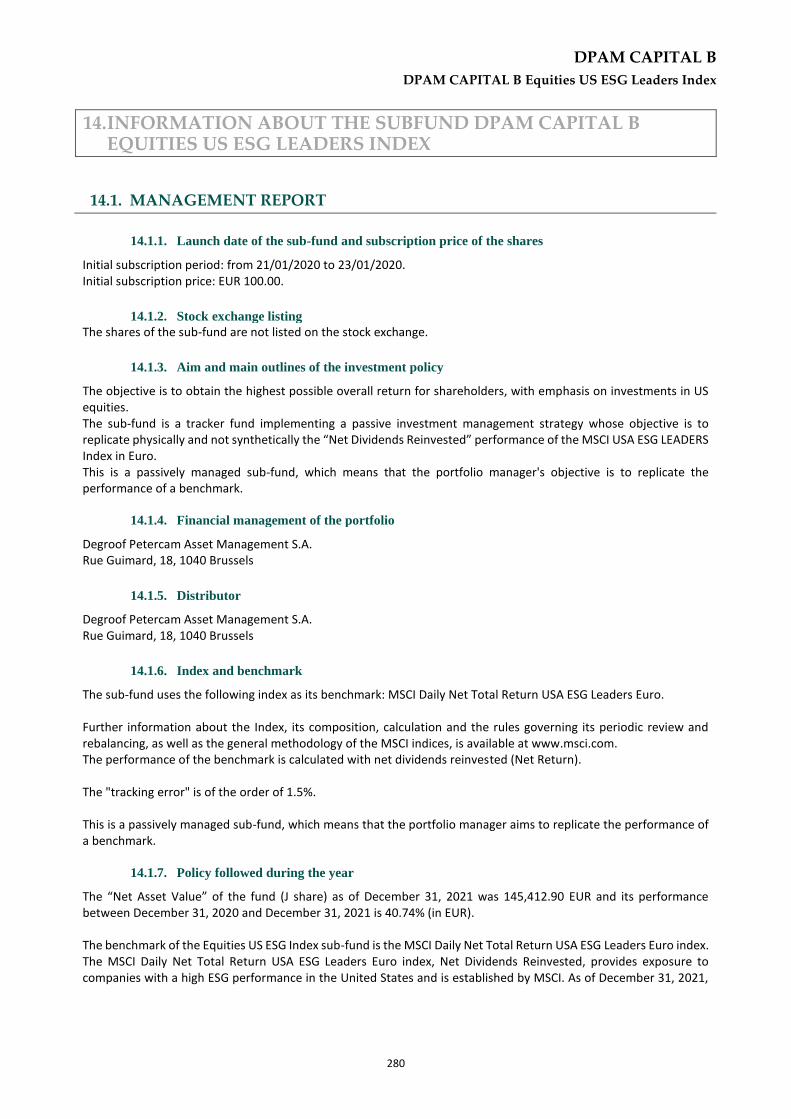
DPAM CAPITAL B
DPAM CAPITAL B Equities US ESG Leaders Index
280
14. INFORMATION ABOUT THE SUBFUND DPAM CAPITAL B EQUITIES US ESG LEADERS INDEX
DPAM CAPITAL B Equities US ESG Leaders Index
14.1. MANAGEMENT REPORT
14.1.1. Launch date of the sub-fund and subscription price of the shares
Initial subscription period: from 21/01/2020 to 23/01/2020. Initial subscription price: EUR 100.00.
14.1.2. Stock exchange listing
The shares of the sub-fund are not listed on the stock exchange.
14.1.3. Aim and main outlines of the investment policy
The objective is to obtain the highest possible overall return for shareholders, with emphasis on investments in US equities. The sub-fund is a tracker fund implementing a passive investment management strategy whose objective is to replicate physically and not synthetically the “Net Dividends Reinvested” performance of the MSCI USA ESG LEADERS Index in Euro. This is a passively managed sub-fund, which means that the portfolio manager's objective is to replicate the performance of a benchmark.
14.1.4. Financial management of the portfolio
Degroof Petercam Asset Management S.A. Rue Guimard, 18, 1040 Brussels
14.1.5. Distributor
Degroof Petercam Asset Management S.A. Rue Guimard, 18, 1040 Brussels
14.1.6. Index and benchmark
The sub-fund uses the following index as its benchmark: MSCI Daily Net Total Return USA ESG Leaders Euro. Further information about the Index, its composition, calculation and the rules governing its periodic review and rebalancing, as well as the general methodology of the MSCI indices, is available at www.msci.com. The performance of the benchmark is calculated with net dividends reinvested (Net Return). The "tracking error" is of the order of 1.5%. This is a passively managed sub-fund, which means that the portfolio manager aims to replicate the performance of a benchmark.
14.1.7. Policy followed during the year
The “Net Asset Value” of the fund (J share) as of December 31, 2021 was 145,412.90 EUR and its performance between December 31, 2020 and December 31, 2021 is 40.74% (in EUR). The benchmark of the Equities US ESG Index sub-fund is the MSCI Daily Net Total Return USA ESG Leaders Euro index. The MSCI Daily Net Total Return USA ESG Leaders Euro index, Net Dividends Reinvested, provides exposure to companies with a high ESG performance in the United States and is established by MSCI. As of December 31, 2021,

DPAM CAPITAL B
DPAM CAPITAL B Equities US ESG Leaders Index
281
the index had 270 positions. The index value can be viewed on MSCI's website, www.msci.com/end-of-day-data-search. The composition of its indices can be viewed on the MSCI’s website, www.msci.com/constituents. The almost full physical replication policy has been followed throughout the year.
14.1.8. Future policy
The Equities US ESG Leaders Index sub-fund, whose vocation is to be representative of American companies with a high ESG performance, will continue its investment policy based on broad sector diversification with the US ESG Leaders index published by MSCI as a benchmark.
14.1.9. Synthetic risk and reward indicator
The synthetic risk and return indicator gives an indication of the risk associated with investing in a sub-fund. It places this risk on a scale ranging from one (lowest risk) to seven (highest risk). Risk and reward profile: 5

DPAM CAPITAL B
DPAM CAPITAL B Equities US ESG Leaders Index
282
14.2. BALANCE SHEET
31 December 2021
EUR 31 December 2020
EUR
Section 1: Balance Sheet
TOTAL NET ASSETS 1,107,823,777.34 976,653,518.30
I. Fixed assets
A. Incorporation and organisation expenses B. Intangible assets C. Tangible assets
II. Transferable securities, money market instruments, UCIs and Financial derivatives
1,107,459,063.14 975,936,114.46
A. Bonds and other debt securities B. Money market instruments C. Shares and other securities similar to shares 1,107,459,063.14 975,060,511.75 a. Shares 1,107,459,063.14 975,060,511.75 D. Other transferable securities 40,416.47 E. UCI with variable number of shares 835,186.24 F. financial derivatives
III. Receivables and payables on more than one year
A. Receivables B. Payables
IV. Receivables and payables up to a year -958,555.64 -317,250.83
A. Receivables 632,162.27 779,028.76 a. Receivables 27,978.24 135,236.36 d. Others 604,184.03 643,792.40 B. Payables -1,590,717.91 -1,096,279.59 a. Payable amounts (-) -631,346.83 -325,371.04 c. Borrowing (-) -271.21 -151.32 e. Others (-) -959,099.87 -770,757.23
V. Deposits and liquidity 1,323,269.84 1,034,654.67
A. Demand bank deposits 1,323,269.84 1,034,654.67 B. Term bank deposits C. Others
VI. Deferred charges and accrued income
A. Expenses carried forward B. Accrued income C. Accrued expenses (-) D. Income carried forward (-)
TOTAL SHAREHOLDERS’ EQUITY 1,107,823,777.34 976,653,518.30
A. Capital 683,231,246.61 898,888,208.10 B. Income equalisation -6,584,310.46 -491,462.47 C. Retained earnings 77,765,310.20 D. Result of the financial year 353,411,530.99 78,256,772.67
DPAM CAPITAL B Equities US ESG Leaders Index

DPAM CAPITAL B
DPAM CAPITAL B Equities US ESG Leaders Index
283
31 December 2021
EUR 31 December 2020
EUR
Section 2: Off-balance sheet
I. Collateral (+/-)
A. Collateral (+/-) B. Other collateral
II. Underlying securities of the option contracts and warrants (+)
A. Option contracts and warrants bought B. Option contracts and warrants sold
III. Notional amount of futures contracts (+)
A. Futures contracts bought and Forward contracts B. Futures contracts sold and Forward Contracts
IV. Notional amount of the swap contracts (+)
A. Purchased swap contracts B. Sold swap contracts
V. Notional amount of other financial derivatives (+)
A. Purchased contracts B. Sold contracts
VI. Uncalled amounts on shares
VII. Commitments to resell on account of purchase-repurchase agreements
VIII. Commitments to repurchase on account of purchase-repurchase agreements
IX. Lent financial instruments
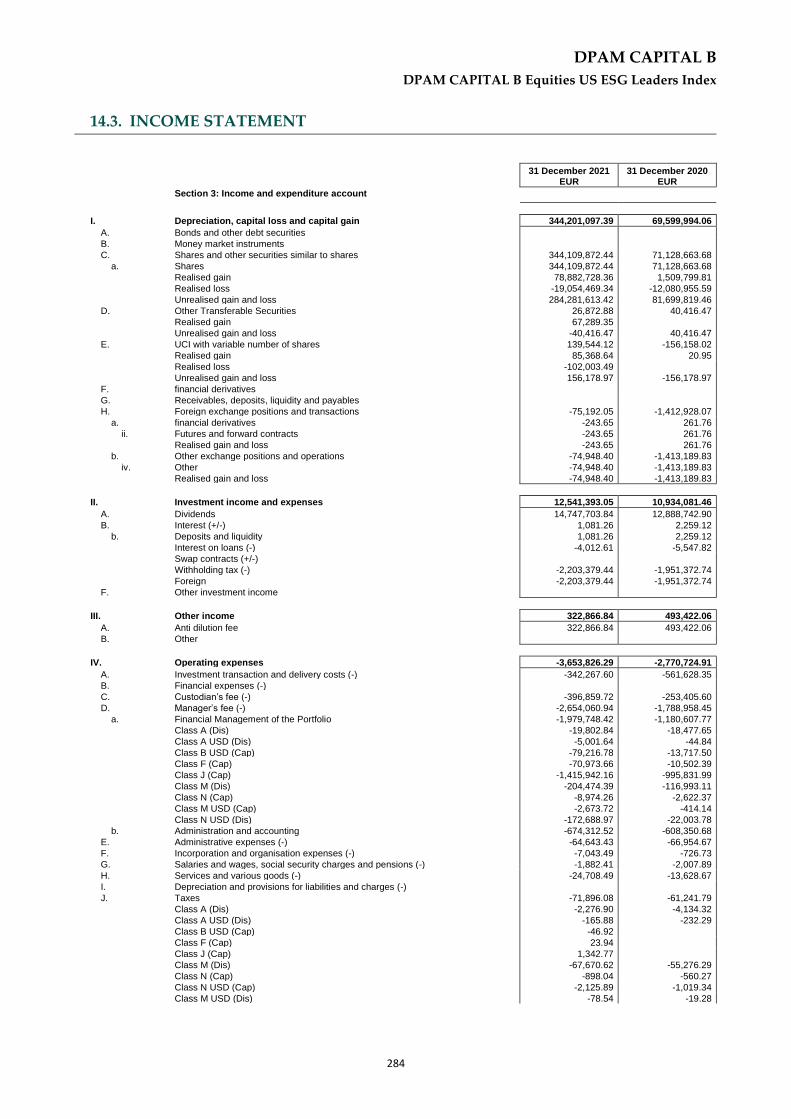
DPAM CAPITAL B
DPAM CAPITAL B Equities US ESG Leaders Index
284
14.3. INCOME STATEMENT
31 December 2021
EUR 31 December 2020
EUR
Section 3: Income and expenditure account
I. Depreciation, capital loss and capital gain 344,201,097.39 69,599,994.06
A. Bonds and other debt securities
B. Money market instruments
C. Shares and other securities similar to shares 344,109,872.44 71,128,663.68
a. Shares 344,109,872.44 71,128,663.68
Realised gain 78,882,728.36 1,509,799.81
Realised loss -19,054,469.34 -12,080,955.59
Unrealised gain and loss 284,281,613.42 81,699,819.46
D. Other Transferable Securities 26,872.88 40,416.47
Realised gain 67,289.35
Unrealised gain and loss -40,416.47 40,416.47
E. UCI with variable number of shares 139,544.12 -156,158.02
Realised gain 85,368.64 20.95
Realised loss -102,003.49
Unrealised gain and loss 156,178.97 -156,178.97
F. financial derivatives
G. Receivables, deposits, liquidity and payables
H. Foreign exchange positions and transactions -75,192.05 -1,412,928.07
a. financial derivatives -243.65 261.76
ii. Futures and forward contracts -243.65 261.76
Realised gain and loss -243.65 261.76
b. Other exchange positions and operations -74,948.40 -1,413,189.83
iv. Other -74,948.40 -1,413,189.83
Realised gain and loss -74,948.40 -1,413,189.83
II. Investment income and expenses 12,541,393.05 10,934,081.46
A. Dividends 14,747,703.84 12,888,742.90
B. Interest (+/-) 1,081.26 2,259.12
b. Deposits and liquidity 1,081.26 2,259.12
Interest on loans (-) -4,012.61 -5,547.82
Swap contracts (+/-)
Withholding tax (-) -2,203,379.44 -1,951,372.74
Foreign -2,203,379.44 -1,951,372.74
F. Other investment income
III. Other income 322,866.84 493,422.06
A. Anti dilution fee 322,866.84 493,422.06
B. Other
IV. Operating expenses -3,653,826.29 -2,770,724.91
A. Investment transaction and delivery costs (-) -342,267.60 -561,628.35
B. Financial expenses (-)
C. Custodian’s fee (-) -396,859.72 -253,405.60
D. Manager’s fee (-) -2,654,060.94 -1,788,958.45
a. Financial Management of the Portfolio -1,979,748.42 -1,180,607.77
Class A (Dis) -19,802.84 -18,477.65
Class A USD (Dis) -5,001.64 -44.84
Class B USD (Cap) -79,216.78 -13,717.50
Class F (Cap) -70,973.66 -10,502.39
Class J (Cap) -1,415,942.16 -995,831.99
Class M (Dis) -204,474.39 -116,993.11
Class N (Cap) -8,974.26 -2,622.37
Class M USD (Cap) -2,673.72 -414.14
Class N USD (Dis) -172,688.97 -22,003.78
b. Administration and accounting -674,312.52 -608,350.68
E. Administrative expenses (-) -64,643.43 -66,954.67
F. Incorporation and organisation expenses (-) -7,043.49 -726.73
G. Salaries and wages, social security charges and pensions (-) -1,882.41 -2,007.89
H. Services and various goods (-) -24,708.49 -13,628.67
I. Depreciation and provisions for liabilities and charges (-)
J. Taxes -71,896.08 -61,241.79
Class A (Dis) -2,276.90 -4,134.32
Class A USD (Dis) -165.88 -232.29
Class B USD (Cap) -46.92
Class F (Cap) 23.94
Class J (Cap) 1,342.77
Class M (Dis) -67,670.62 -55,276.29
Class N (Cap) -898.04 -560.27
Class N USD (Cap) -2,125.89 -1,019.34
Class M USD (Dis) -78.54 -19.28

DPAM CAPITAL B
DPAM CAPITAL B Equities US ESG Leaders Index
285
31 December 2021
EUR 31 December 2020
EUR
K. Other expenses (-) -90,464.13 -22,172.76
Income and expenditure for the financial year Sub-Total II + III + IV 9,210,433.60 8,656,778.61
V. Current profit (loss) before income tax 353,411,530.99 78,256,772.67
VI. Income tax
VII. Result of the financial year 353,411,530.99 78,256,772.67

DPAM CAPITAL B
DPAM CAPITAL B Equities US ESG Leaders Index
286
31 December 2021
EUR 31 December 2020
EUR
Section 4: Allocation of the result
I. Profit (Loss) to be allocated 424,592,530.73 77,765,310.20
a. Profit carried forward (Loss carried forward) from the previous period 77,765,310.20
b. Profit (loss) of the financial year 353,411,530.99 78,256,772.67
c. Income equalisation received (Income equalisation paid out) -6,584,310.46 -491,462.47
II. (Appropriation to) Deduction from the capital
III. (Profit to be carried forward) Loss to be carried forward -423,693,837.96 -77,765,310.20
IV. Dividend distribution -898,692.77
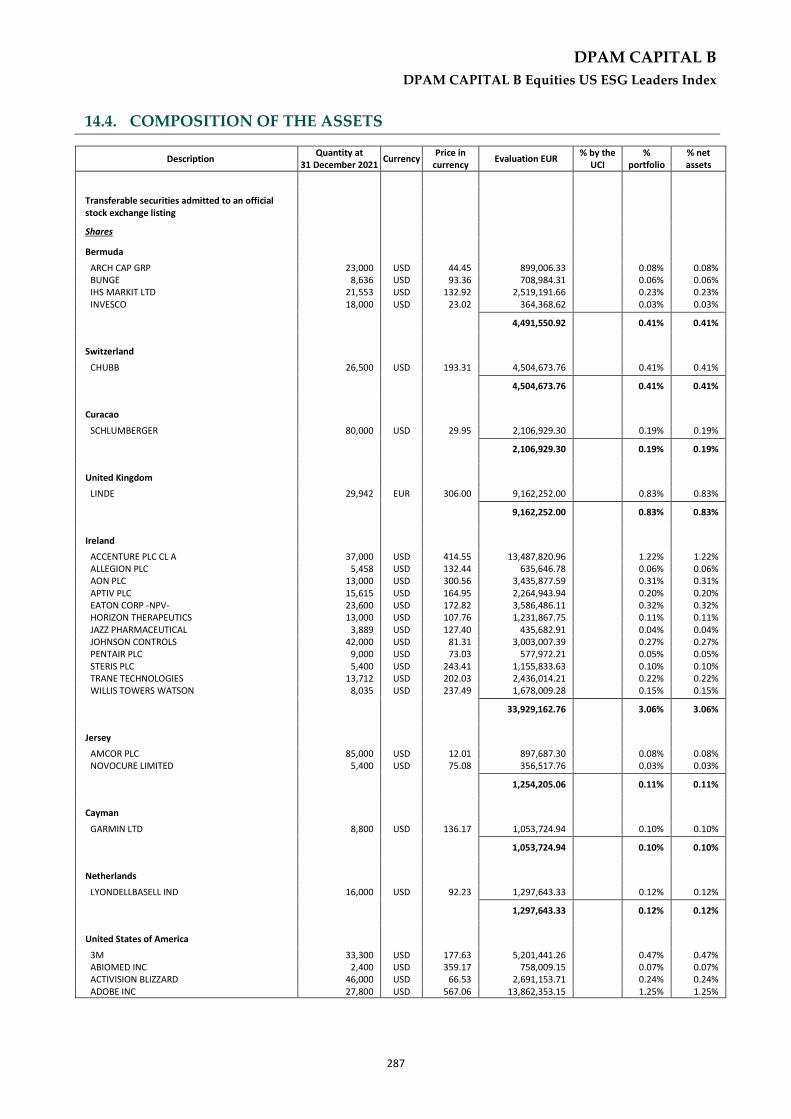
DPAM CAPITAL B
DPAM CAPITAL B Equities US ESG Leaders Index
287
14.4. COMPOSITION OF THE ASSETS
DPAM CAPITAL B Equities US ESG Leaders Index
Description Quantity at
31 December 2021 Currency
Price in currency
Evaluation EUR % by the
UCI %
portfolio % net assets
Transferable securities admitted to an official stock exchange listing
Shares
Bermuda
ARCH CAP GRP 23,000 USD 44.45 899,006.33 0.08% 0.08% BUNGE 8,636 USD 93.36 708,984.31 0.06% 0.06% IHS MARKIT LTD 21,553 USD 132.92 2,519,191.66 0.23% 0.23% INVESCO 18,000 USD 23.02 364,368.62 0.03% 0.03%
4,491,550.92 0.41% 0.41%
Switzerland
CHUBB 26,500 USD 193.31 4,504,673.76 0.41% 0.41%
4,504,673.76 0.41% 0.41%
Curacao
SCHLUMBERGER 80,000 USD 29.95 2,106,929.30 0.19% 0.19%
2,106,929.30 0.19% 0.19%
United Kingdom
LINDE 29,942 EUR 306.00 9,162,252.00 0.83% 0.83%
9,162,252.00 0.83% 0.83%
Ireland
ACCENTURE PLC CL A 37,000 USD 414.55 13,487,820.96 1.22% 1.22% ALLEGION PLC 5,458 USD 132.44 635,646.78 0.06% 0.06% AON PLC 13,000 USD 300.56 3,435,877.59 0.31% 0.31% APTIV PLC 15,615 USD 164.95 2,264,943.94 0.20% 0.20% EATON CORP -NPV- 23,600 USD 172.82 3,586,486.11 0.32% 0.32% HORIZON THERAPEUTICS 13,000 USD 107.76 1,231,867.75 0.11% 0.11% JAZZ PHARMACEUTICAL 3,889 USD 127.40 435,682.91 0.04% 0.04% JOHNSON CONTROLS 42,000 USD 81.31 3,003,007.39 0.27% 0.27% PENTAIR PLC 9,000 USD 73.03 577,972.21 0.05% 0.05% STERIS PLC 5,400 USD 243.41 1,155,833.63 0.10% 0.10% TRANE TECHNOLOGIES 13,712 USD 202.03 2,436,014.21 0.22% 0.22% WILLIS TOWERS WATSON 8,035 USD 237.49 1,678,009.28 0.15% 0.15%
33,929,162.76 3.06% 3.06%
Jersey
AMCOR PLC 85,000 USD 12.01 897,687.30 0.08% 0.08% NOVOCURE LIMITED 5,400 USD 75.08 356,517.76 0.03% 0.03%
1,254,205.06 0.11% 0.11%
Cayman
GARMIN LTD 8,800 USD 136.17 1,053,724.94 0.10% 0.10%
1,053,724.94 0.10% 0.10%
Netherlands
LYONDELLBASELL IND 16,000 USD 92.23 1,297,643.33 0.12% 0.12%
1,297,643.33 0.12% 0.12%
United States of America
3M 33,300 USD 177.63 5,201,441.26 0.47% 0.47% ABIOMED INC 2,400 USD 359.17 758,009.15 0.07% 0.07% ACTIVISION BLIZZARD 46,000 USD 66.53 2,691,153.71 0.24% 0.24% ADOBE INC 27,800 USD 567.06 13,862,353.15 1.25% 1.25%

DPAM CAPITAL B
DPAM CAPITAL B Equities US ESG Leaders Index
288
Description Quantity at
31 December 2021 Currency
Price in currency
Evaluation EUR % by the
UCI %
portfolio % net assets
ADVANCE AUTO PARTS 3,306 USD 239.88 697,364.83 0.06% 0.06% AFLAC INC 35,000 USD 58.39 1,797,089.34 0.16% 0.16% AGILENT 17,200 USD 159.65 2,414,685.19 0.22% 0.22% ALIGN TECHNOLOGY 4,300 USD 657.18 2,484,940.20 0.22% 0.22% ALLSTATE 18,500 USD 117.65 1,913,933.35 0.17% 0.17% ALLY FINANCIAL 22,000 USD 47.61 921,051.71 0.08% 0.08% ALPHABET INC -A- 17,630 USD 2,897.04 44,912,781.57 4.06% 4.05% ALPHABET INC -C- 16,874 USD 2,893.59 42,935,664.49 3.88% 3.88% AMERCO 689 USD 726.23 440,003.93 0.04% 0.04% AMERICAN EXPRESS 40,200 USD 163.60 5,783,257.12 0.52% 0.52% AMERICAN INTL GROUP 47,000 USD 56.86 2,350,000.00 0.21% 0.21% AMERICAN TWR CORP 26,300 USD 292.50 6,764,641.22 0.61% 0.61% AMERICAN WATER WORKS 10,791 USD 188.86 1,792,110.68 0.16% 0.16% AMERIPRISE 6,700 USD 301.66 1,777,279.28 0.16% 0.16% AMERISOURCEBERGEN CP 9,232 USD 132.89 1,078,825.61 0.10% 0.10% AMGEN 33,200 USD 224.97 6,567,889.55 0.59% 0.59% ANNALY MORTGAGE 79,000 USD 7.82 543,246.57 0.05% 0.05% ANSYS INC 4,800 USD 401.12 1,693,084.77 0.15% 0.15% APPLIED MATERIALS 53,000 USD 157.36 7,333,872.67 0.66% 0.66% ARTHUR J.GALLAGHER 11,894 USD 169.67 1,774,582.29 0.16% 0.16% ASSURANT 4,200 USD 155.86 575,634.89 0.05% 0.05% ATMOS ENERGY CORP 7,500 USD 104.77 690,973.44 0.06% 0.06% AUTODESK 13,000 USD 281.19 3,214,447.77 0.29% 0.29% AUTOMATIC DATA 25,000 USD 246.58 5,420,770.31 0.49% 0.49% BAKER HUGHES-A 48,000 USD 24.06 1,015,546.96 0.09% 0.09% BALL CORP 18,000 USD 96.27 1,523,795.29 0.14% 0.14% BANK OF NY MELLON 47,787 USD 58.08 2,440,616.39 0.22% 0.22% BAXTER INTERNATIONAL 28,500 USD 85.84 2,151,283.86 0.19% 0.19% BEST BUY 13,000 USD 101.60 1,161,449.17 0.10% 0.10% BIOGEN INC 9,000 USD 239.92 1,898,768.91 0.17% 0.17% BIOMARIN PHARMA 11,000 USD 88.35 854,599.02 0.08% 0.08% BIO-TECHNE CORP 2,300 USD 517.34 1,046,326.06 0.09% 0.09% BLACKROCK INC 8,800 USD 915.56 7,084,882.17 0.64% 0.64% BOOKING HLDG 2,400 USD 2,399.23 5,063,447.06 0.46% 0.46% BORGWARNER 15,764 USD 45.07 624,765.63 0.06% 0.06% BOSTON PROPERTIES 9,000 USD 115.18 911,554.70 0.08% 0.08% BRISTOL-MYERS 129,200 USD 62.35 7,083,731.97 0.64% 0.64% BURLINGTON STORE 3,500 USD 291.51 897,190.47 0.08% 0.08% CABLE ONE 300 USD 1,763.45 465,208.41 0.04% 0.04% CADENCE DESIGN 16,176 USD 186.35 2,650,718.96 0.24% 0.24% CAMPBELL SOUP 11,925 USD 43.46 455,733.82 0.04% 0.04% CARDINAL HEALTH 14,000 USD 51.49 633,890.26 0.06% 0.06% CARMAX NEW 10,000 USD 130.23 1,145,181.15 0.10% 0.10% CATALENT 10,000 USD 128.03 1,125,835.39 0.10% 0.10% CATERPILLAR 31,500 USD 206.74 5,726,618.01 0.52% 0.52% CBOE GLOBAL MARKETS 6,458 USD 130.42 740,636.97 0.07% 0.07% CBRE GROUP-A 19,000 USD 108.51 1,812,952.87 0.16% 0.16% CENTENE CORP 34,000 USD 82.40 2,463,594.79 0.22% 0.22% CERNER CORP 18,628 USD 92.87 1,521,264.83 0.14% 0.14% CHENIERE ENERGY 15,069 USD 101.39 1,343,515.57 0.12% 0.12% CIGNA CORPORATION 20,000 USD 229.63 4,038,515.65 0.36% 0.36% CISCO 248,000 USD 63.37 13,819,697.50 1.25% 1.25% CITIZENS FINL GROUP 25,143 USD 47.25 1,044,677.06 0.09% 0.09% CITRIX 8,187 USD 94.59 680,978.13 0.06% 0.06% CLOROX 7,218 USD 174.36 1,106,692.30 0.10% 0.10% CME GROUP -A- 20,892 USD 228.46 4,197,138.87 0.38% 0.38% COCA-COLA CO 238,000 USD 59.21 12,391,822.02 1.12% 1.12% COGNEX CORP 11,000 USD 77.76 752,163.21 0.07% 0.07% COLGATE-PALMOLIVE 45,997 USD 85.34 3,451,797.38 0.31% 0.31% CONAGRA BRANDS INC 27,000 USD 34.15 810,807.25 0.07% 0.07% CONSOLIDATED EDISON 18,979 USD 85.32 1,423,925.68 0.13% 0.13% COPART INC 12,200 USD 151.62 1,626,595.15 0.15% 0.15% CROWN CASTLE REIT 25,500 USD 208.74 4,680,680.62 0.42% 0.42% CSX CORP 129,077 USD 37.60 4,267,758.71 0.39% 0.39% CUMMINS INC 8,809 USD 218.14 1,689,760.17 0.15% 0.15% DARDEN 7,906 USD 150.64 1,047,273.87 0.09% 0.09% DAVITA INC 4,000 USD 113.76 400,140.70 0.04% 0.04% DEERE 17,200 USD 342.89 5,186,166.02 0.47% 0.47% DELTA AIR LINES 9,324 USD 39.08 320,420.26 0.03% 0.03% DENTSPLY SIRONA 13,836 USD 55.79 678,781.60 0.06% 0.06% DEXCOM INC 5,463 USD 536.95 2,579,456.43 0.23% 0.23%

DPAM CAPITAL B
DPAM CAPITAL B Equities US ESG Leaders Index
289
Description Quantity at
31 December 2021 Currency
Price in currency
Evaluation EUR % by the
UCI %
portfolio % net assets
DISCOVER FINANCIAL 18,500 USD 115.56 1,879,933.17 0.17% 0.17% DISCOVERY COMM-C 14,219 USD 22.90 286,330.55 0.03% 0.03% DISCOVERY COMMUNIC A 10,176 USD 23.54 210,642.84 0.02% 0.02% DOMINO S PIZZA 2,100 USD 564.33 1,042,114.84 0.09% 0.09% DOVER 8,863 USD 181.60 1,415,336.62 0.13% 0.13% DUPONT DE NEMOURS 31,700 USD 80.78 2,251,781.57 0.20% 0.20% EBAY 40,000 USD 66.50 2,339,078.44 0.21% 0.21% ECOLAB INC 15,000 USD 234.59 3,094,310.59 0.28% 0.28% EDISON INT 23,667 USD 68.25 1,420,394.61 0.13% 0.13% EDWARDS LIFESCIENCES 36,000 USD 129.55 4,101,125.57 0.37% 0.37% ELECTRONIC ARTS 17,507 USD 131.90 2,030,578.00 0.18% 0.18% ELI 47,400 USD 276.22 11,513,214.91 1.04% 1.04% EQUINIX INC 5,400 USD 845.84 4,016,475.55 0.36% 0.36% EQUITABLE HOLDINGS 22,000 USD 32.79 634,347.52 0.06% 0.06% EQUITY RESIDENTIAL 21,000 USD 90.50 1,671,209.99 0.15% 0.15% ERIE INDEMNITY -A- 1,000 USD 192.66 169,416.11 0.02% 0.02% ESSENTIAL UTILITIES 13,000 USD 53.69 613,761.87 0.06% 0.06% ESTEE LAUDER CIE 13,800 USD 370.20 4,492,402.39 0.41% 0.41% EVERSOURCE ENERGY 21,499 USD 90.98 1,719,995.62 0.16% 0.16% EXPEDITORS INTL WASH 10,000 USD 134.29 1,180,882.87 0.11% 0.11% FACTSET RESERACH 2,253 USD 486.01 962,874.19 0.09% 0.09% FASTENAL CO 32,000 USD 64.06 1,802,602.88 0.16% 0.16% FIRST REPUBLIC BANK 10,500 USD 206.51 1,906,749.03 0.17% 0.17% FORTIVE-WI 19,000 USD 76.29 1,274,630.67 0.12% 0.12% FORTUNE BRANDS HOME 6,000 USD 106.90 564,016.88 0.05% 0.05% FRANKLIN RESOURCES 16,898 USD 33.49 497,638.08 0.04% 0.04% GENERAC HLDGS 3,700 USD 351.92 1,145,008.79 0.10% 0.10% GENERAL MILLS INC 34,500 USD 67.38 2,044,152.30 0.18% 0.18% GENUINE PARTS 8,000 USD 140.20 986,282.10 0.09% 0.09% GILEAD SCIENCES 74,000 USD 72.61 4,724,885.68 0.43% 0.43% GRAINGER 2,689 USD 518.24 1,225,419.77 0.11% 0.11% HARTFORD 19,421 USD 69.04 1,179,058.95 0.11% 0.11% HASBRO 7,000 USD 101.78 626,503.69 0.06% 0.06% HCA HEALTHCARE INC 16,000 USD 256.92 3,614,773.13 0.33% 0.33% HEALTHPEAK PROPERTIE 28,000 USD 36.09 888,603.59 0.08% 0.08% HEWLETT PACKARD WI 86,262 USD 15.77 1,196,229.11 0.11% 0.11% HILTON INC 15,925 USD 155.99 2,184,366.10 0.20% 0.20% HOLOGIC INC 16,186 USD 76.56 1,089,694.13 0.10% 0.10% HOME DEPOT 61,400 USD 415.01 22,407,328.53 2.02% 2.02% HORMEL FOODS 19,771 USD 48.81 848,595.24 0.08% 0.08% HOST HOTELS RESORTS 35,006 USD 17.39 535,309.83 0.05% 0.05% HOWMET AERSPCACE 24,976 USD 31.83 699,073.23 0.06% 0.06% HP 70,000 USD 37.67 2,318,765.39 0.21% 0.21% HUMANA 7,600 USD 463.86 3,100,014.07 0.28% 0.28% HUNTINGTON BANCSHARE 90,000 USD 15.42 1,220,365.81 0.11% 0.11% IBM 52,000 USD 133.66 6,111,783.33 0.55% 0.55% IDEX CORP 4,000 USD 236.32 831,234.61 0.08% 0.08% IDEXX LABS 5,000 USD 658.46 2,895,093.21 0.26% 0.26% ILLINOIS TOOL 18,500 USD 246.80 4,014,949.00 0.36% 0.36% ILLUMINA INC 8,600 USD 380.44 2,877,052.41 0.26% 0.26% INSULET CORP 3,900 USD 266.07 912,480.65 0.08% 0.08% INTEL 234,693 USD 51.50 10,628,464.21 0.96% 0.96% INTERCON EXCHANGE 33,000 USD 136.77 3,968,879.70 0.36% 0.36% INTERPUBLIC 23,000 USD 37.45 757,430.53 0.07% 0.07% INTL FLAVORS-FRAGR 13,800 USD 150.65 1,828,148.08 0.17% 0.17% INTUIT 16,000 USD 643.22 9,049,876.89 0.82% 0.82% JM SMUCKER 6,700 USD 135.82 800,205.77 0.07% 0.07% JOHNSON 153,800 USD 171.07 23,136,269.79 2.09% 2.09% KELLOGG 16,367 USD 64.42 927,156.30 0.08% 0.08% KEURIG DR PEPPER 37,000 USD 36.86 1,199,278.93 0.11% 0.11% KEYCORP 52,859 USD 23.13 1,075,121.94 0.10% 0.10% KEYSIGHT TECH-WI 10,288 USD 206.51 1,868,250.86 0.17% 0.17% KIMBERLY-CLARK 19,500 USD 142.92 2,450,703.48 0.22% 0.22% KROGER CO 40,000 USD 45.26 1,591,980.30 0.14% 0.14% LABORATORY 5,700 USD 314.21 1,574,918.22 0.14% 0.14% LAM RESEARCH 8,500 USD 719.15 5,375,285.79 0.49% 0.49% LENNOX INTL 2,342 USD 324.36 668,001.34 0.06% 0.06% LINCOLN NATIONAL 11,000 USD 68.26 660,270.84 0.06% 0.06% LKQ CORP 15,094 USD 60.03 796,775.26 0.07% 0.07% LOEWS CORP 12,000 USD 57.76 609,497.01 0.06% 0.06% LOWE 41,000 USD 258.48 9,319,099.54 0.84% 0.84%

DPAM CAPITAL B
DPAM CAPITAL B Equities US ESG Leaders Index
290
Description Quantity at
31 December 2021 Currency
Price in currency
Evaluation EUR % by the
UCI %
portfolio % net assets
LULULEMON ATHLETICA 7,063 USD 391.52 2,431,679.35 0.22% 0.22% MARATHON PETROLEUM 40,000 USD 63.99 2,250,791.42 0.20% 0.20% MARKETAXESS HLD 2,000 USD 411.27 723,302.85 0.07% 0.07% MARSH 29,000 USD 173.82 4,432,623.99 0.40% 0.40% MASCO 14,880 USD 70.22 918,812.52 0.08% 0.08% MASTERCARD-A 51,600 USD 359.32 16,304,002.81 1.47% 1.47% MCCORMIC CO INC 15,884 USD 96.61 1,349,413.68 0.12% 0.12% MCDONALD 43,700 USD 268.07 10,301,318.15 0.93% 0.93% MERCADOLIBRE INC 2,650 USD 1,348.40 3,142,156.17 0.28% 0.28% MERCK AND CO INC 146,837 USD 76.64 9,895,873.80 0.89% 0.89% METTLER TOLEDO INTL 1,400 USD 1,697.21 2,089,424.90 0.19% 0.19% MICROSOFT 417,000 USD 336.32 123,325,219.84 11.14% 11.13% MOHAWK INDUSTRIES 3,509 USD 182.18 562,143.53 0.05% 0.05% MOODY 9,500 USD 390.58 3,262,847.34 0.29% 0.29% MORGAN STANLEY 80,000 USD 98.16 6,905,381.64 0.62% 0.62% MOSAIC CO 22,006 USD 39.29 760,302.27 0.07% 0.07% MOTOROLA SOLTN 9,800 USD 271.70 2,341,417.52 0.21% 0.21% MT BANK CORPORATION 7,000 USD 153.58 945,357.02 0.09% 0.09% NASDAQ INC 6,600 USD 210.01 1,218,841.01 0.11% 0.11% NEWELL BRANDS 23,174 USD 21.84 445,058.18 0.04% 0.04% NEWMONT CORPORATION 47,000 USD 62.02 2,563,260.64 0.23% 0.23% NIKE INC -B- 75,800 USD 166.67 11,109,379.18 1.00% 1.00% NORFOLK SOUTHERN 14,386 USD 297.71 3,766,141.45 0.34% 0.34% NORTHERN TRUST 11,000 USD 119.61 1,156,973.27 0.10% 0.10% NVIDIA CORP 145,500 USD 294.11 37,630,148.61 3.40% 3.40% NVR 210 USD 5,908.87 1,091,156.09 0.10% 0.10% OKTA INC 7,500 USD 224.17 1,478,433.87 0.13% 0.13% OMNICOM 11,000 USD 73.27 708,731.97 0.06% 0.06% ONEOK NEW 25,000 USD 58.76 1,291,769.26 0.12% 0.12% OWENS CORNING 7,263 USD 90.50 577,999.91 0.05% 0.05% PACCAR 20,000 USD 88.26 1,552,233.56 0.14% 0.14% PAPER 23,000 USD 46.98 950,175.87 0.09% 0.09% PEPSICO 80,000 USD 173.71 12,220,189.94 1.10% 1.10% PHILLIPS 66-WI 24,300 USD 72.46 1,548,345.06 0.14% 0.14% PNC 25,000 USD 200.52 4,408,195.57 0.40% 0.40% POOL CORP 2,400 USD 566.00 1,194,512.84 0.11% 0.11% PPG INDUSTRIES INC 13,800 USD 172.44 2,092,571.23 0.19% 0.19% PRINCIPAL FIN 16,561 USD 72.34 1,053,484.65 0.10% 0.10% PROCTER 142,500 USD 163.58 20,497,845.59 1.85% 1.85% PROGRESSIVE 35,000 USD 102.65 3,159,294.76 0.29% 0.29% PROLOGIS 44,000 USD 168.36 6,514,104.82 0.59% 0.59% PRUDENTIAL FINANCIAL 23,000 USD 108.24 2,189,166.37 0.20% 0.20% QUEST 8,111 USD 173.01 1,233,981.81 0.11% 0.11% RAYMOND JAMES FIN 10,950 USD 100.40 966,742.88 0.09% 0.09% REGIONS FINANCIAL 48,032 USD 21.80 920,768.20 0.08% 0.08% RESMED INC 8,200 USD 260.48 1,878,241.29 0.17% 0.17% ROBERT HALF 7,350 USD 111.52 720,780.87 0.07% 0.07% ROBINSON WORLDWIDE 8,634 USD 107.63 817,162.70 0.07% 0.07% ROCKWELL 6,800 USD 348.85 2,085,983.12 0.19% 0.19% ROPER TECHNOLOGIES 5,808 USD 491.86 2,512,067.25 0.23% 0.23% SALESFORCE.COM 57,400 USD 254.13 12,827,173.76 1.16% 1.16% SCHWAB 85,618 USD 84.10 6,331,756.77 0.57% 0.57% SEMPRA 18,200 USD 132.28 2,117,038.34 0.19% 0.19% SHERWIN-WILLIAMS CO 15,000 USD 352.16 4,645,093.21 0.42% 0.42% SIRIUS XM HLDGS 55,000 USD 6.35 307,113.96 0.03% 0.03% SNAP-ON 2,808 USD 215.38 531,821.17 0.05% 0.05% SP GLOBAL 14,300 USD 471.93 5,934,399.40 0.54% 0.54% STANLEY BLACK DECK 9,948 USD 188.62 1,650,010.34 0.15% 0.15% STARBUCKS CORP 68,004 USD 116.97 6,994,748.40 0.63% 0.63% STATE STREET 22,003 USD 93.00 1,799,401.16 0.16% 0.16% STEEL DYNAMICS 13,000 USD 62.07 709,558.56 0.06% 0.06% SVB FINANCIAL GROUP 3,357 USD 678.24 2,002,155.89 0.18% 0.18% TAKE-TWO INTERACT 7,000 USD 177.72 1,093,950.05 0.10% 0.10% TARGET CORP 29,100 USD 231.44 5,922,356.67 0.53% 0.53% TELADOC 7,600 USD 91.82 613,640.52 0.06% 0.06% TELEDYNE TECH 2,500 USD 436.89 960,451.11 0.09% 0.09% TELEFLEX INC 2,800 USD 328.48 808,779.46 0.07% 0.07% TESLA 49,100 USD 1,056.78 45,627,768.20 4.12% 4.12% TEXAS 54,000 USD 188.47 8,949,507.56 0.81% 0.81% THE CARLYLE GROUP 11,279 USD 54.90 544,510.29 0.05% 0.05% THERMO FISHER SCIEN 23,000 USD 667.24 13,495,005.28 1.22% 1.22%

DPAM CAPITAL B
DPAM CAPITAL B Equities US ESG Leaders Index
291
Description Quantity at
31 December 2021 Currency
Price in currency
Evaluation EUR % by the
UCI %
portfolio % net assets
TJX COS INC 71,000 USD 75.92 4,739,992.97 0.43% 0.43% TRACTOR SUPPLY 6,600 USD 238.60 1,384,769.61 0.13% 0.12% TRAVELERS COMP 14,100 USD 156.43 1,939,555.93 0.18% 0.18% TRIMBLE 14,147 USD 87.19 1,084,661.39 0.10% 0.10% T ROWE PRICE GROUP 13,000 USD 196.64 2,247,907.14 0.20% 0.20% TRUIST FINANCIAL 80,000 USD 58.55 4,118,888.50 0.37% 0.37% UGI CORP 10,000 USD 45.91 403,710.87 0.04% 0.04% UNION PACIFIC 38,600 USD 251.93 8,551,264.51 0.77% 0.77% UNITED PARCEL 42,284 USD 214.34 7,969,708.55 0.72% 0.72% UNITED RENTALS 4,247 USD 332.29 1,240,974.00 0.11% 0.11% US BANCORP-FIRSTAR- 83,000 USD 56.17 4,099,639.47 0.37% 0.37% VAIL RESORTS INC 2,417 USD 327.90 696,917.25 0.06% 0.06% VALERO ENERGY 23,000 USD 75.11 1,519,108.34 0.14% 0.14% VERIZON 242,000 USD 51.96 11,057,263.45 1.00% 1.00% VERTEX 14,800 USD 219.60 2,857,966.94 0.26% 0.26% VF CORP 19,000 USD 73.22 1,223,338.02 0.11% 0.11% VISA-A 98,400 USD 216.71 18,751,551.18 1.69% 1.69% VMWARE 11,500 USD 115.88 1,171,843.12 0.11% 0.11% WALT DISNEY 105,614 USD 154.89 14,384,938.85 1.30% 1.30% WASTE 24,500 USD 166.90 3,595,717.55 0.32% 0.32% WATERS 3,700 USD 372.60 1,212,293.35 0.11% 0.11% WELLTOWER INC 23,566 USD 85.77 1,777,396.96 0.16% 0.16% WESTERN UNION 25,883 USD 17.84 406,043.55 0.04% 0.04% WEST PHARMACEUTICAL 4,200 USD 469.01 1,732,186.07 0.16% 0.16% WEYERHAEUSER 45,000 USD 41.18 1,629,528.67 0.15% 0.15% WILLIAMS COMPANIES 69,888 USD 26.04 1,600,319.66 0.14% 0.14% WORKDAY INC -A- 11,000 USD 273.11 2,641,760.46 0.24% 0.24% XYLEM INC 11,380 USD 119.92 1,200,043.62 0.11% 0.11% ZEBRA TECHNO 3,300 USD 595.20 1,727,189.59 0.16% 0.16% ZOETIS-A 27,245 USD 244.03 5,846,462.67 0.53% 0.53%
1,049,658,921.07 94.78% 94.75%
Total - Shares 1,107,459,063.14 100.00% 99.97%
Total - Transferable securities admitted to an official stock exchange listing
1,107,459,063.14 100.00% 99.97%
Total - portfolio 1,107,459,063.14 100.00% 99.97%
Collatéral 0.00 0.00%
Deposits and liquid assets
deposit and liquid assets
Banque Degroof Petercam USD 368,333.07 0.03%
Banque Degroof Petercam EUR 954,936.77 0.09%
Total - deposit and liquid assets 1,323,269.84 0.12%
Total - Deposits and liquid assets 1,323,269.84 0.12%
Other receivables and other payables -958,555.64 -0.09%
Others 0.00 0.00%
Total net assets 1,107,823,777.34 100,00%
DPAM CAPITAL B Equities US ESG Leaders Index
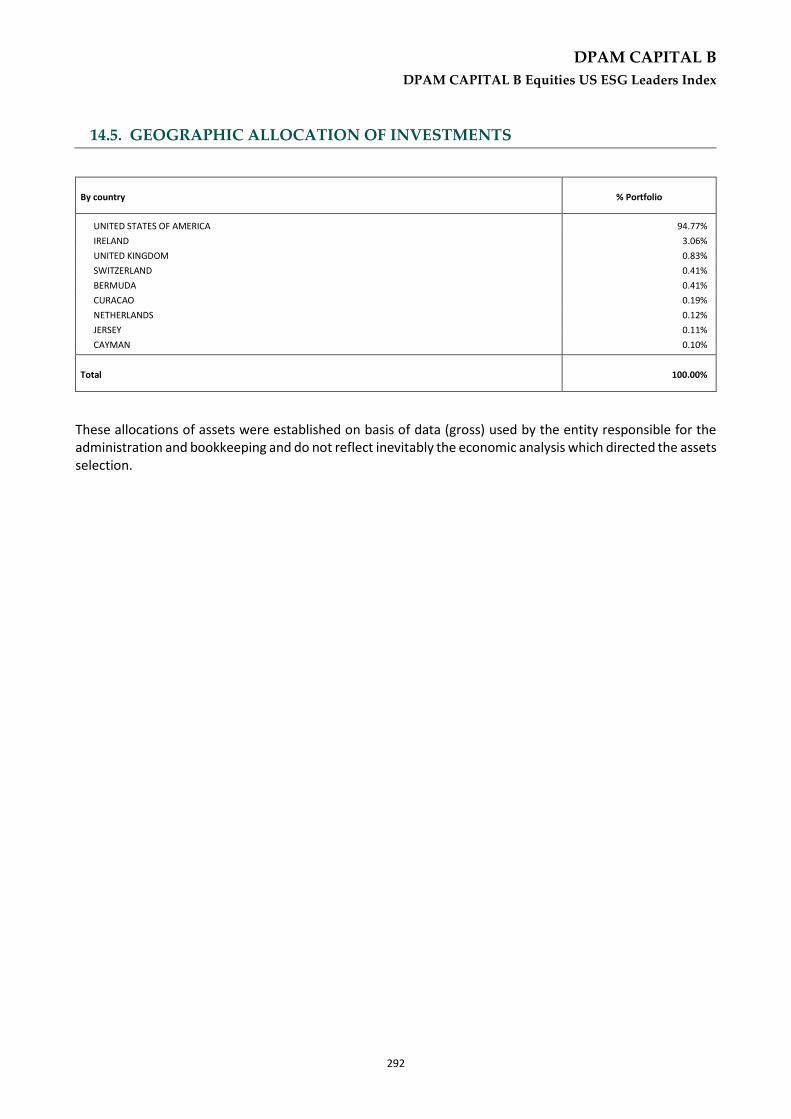
DPAM CAPITAL B
DPAM CAPITAL B Equities US ESG Leaders Index
292
14.5. GEOGRAPHIC ALLOCATION OF INVESTMENTS
By country % Portfolio
UNITED STATES OF AMERICA 94.77%
IRELAND 3.06%
UNITED KINGDOM 0.83%
SWITZERLAND 0.41%
BERMUDA 0.41%
CURACAO 0.19%
NETHERLANDS 0.12%
JERSEY 0.11%
CAYMAN 0.10%
Total 100.00%
These allocations of assets were established on basis of data (gross) used by the entity responsible for the administration and bookkeeping and do not reflect inevitably the economic analysis which directed the assets selection.

DPAM CAPITAL B
DPAM CAPITAL B Equities US ESG Leaders Index
293
14.6. ECONOMIC ALLOCATION OF INVESTMENTS
By sector % Portfolio
IT & INTERNET 21.17%
FINANCIAL SERVICES - HOLDINGS 13.35%
ELECTRIC & ELECTRONIC COMPONANTS 8.42%
PHARMACOLOGY & PERSONAL CARE 8.37%
BANKS 5.05%
ROAD VEHICLES 4.69%
RETAIL TRADING, DEPARTMENT STORES 4.67%
MISCELLANEOUS CONSUMER GOODS 4.00%
FOOD & CLEANING MATERIALS 3.14%
MECHANICAL CONSTRUCTION 2.66%
INFORMATION, TECHNOLOGY & COPIERS 2.25%
INSURANCE COMPANIES 2.13%
BIOTECHNOLOGY 1.98%
LEISURES & TOURISM 1.88%
REAL ESTATE 1.75%
OTHER SERVICES 1.73%
ROAD & RAILWAY TRANSPORTS 1.65%
TEXTILE & GARMENTS 1.33%
ENERGY SOURCES 1.29%
TELECOMMUNICATIONS 1.25%
CHEMICAL PRODUCTS 1.16%
AIRLIFT 0.95%
PUBLISHING & BROADCASTING 0.71%
HEALTH CARE & SERVICES 0.70%
ELECTRIC & ELECTRONIC MATERIALS 0.67%
OIL & DERIVED 0.65%
BUILDING MATERIALS 0.46%
FOREST PRODUCTS & PAPER INDUSTRY 0.45%
UTILITIES 0.32%
MISCELLANEOUS 0.30%
PRECIOUS METALS & STONES 0.23%
PACKAGING INDUSTRY 0.22%
CONGLOMERATES 0.16%
AEROSPACE INDUSTRY & DEFENCE 0.15%
INTERMEDIATE INDUSTRY PRODUCTS 0.06%
CAPITAL GOODS (MISCELLANEOUS) 0.05%
TOTAL 100.00%
These allocations of assets were established on basis of data (gross) used by the entity responsible for the administration and bookkeeping and do not reflect inevitably the economic analysis which directed the assets selection.

DPAM CAPITAL B
DPAM CAPITAL B Equities US ESG Leaders Index
294
14.7. CHANGES IN THE COMPOSITION OF THE ASSETS IN EUR DPAM CAPITAL B Equities US ESG Leaders Index
1st semester 2nd semester Total
Purchases 86,026,878.72 15,297,134.71 101,324,013.43 Sales 197,242,263.85 116,835,090.34 314,077,354.19 Total 1 283,269,142.57 132,132,225.05 415,401,367.62 Subscriptions 27,928,677.81 24,611,547.55 52,540,225.36 Redemptions 143,598,131.19 130,861,505.70 274,459,636.89 Total 2 171,526,809.00 155,473,053.25 326,999,862.25 Reference average of the total net asset 1,002,974,392.09 1,075,940,541.23 1,039,757,327.54
Rotation Percentage 11.14% -2.17% 8.50%
The rotation rate gives the annual average of the transactions. A figure close to 0% shows that the transactions relating to the securities or the assets with the exception of deposits and liquid assets during a given period, were done exclusively in function of the subscriptions and redemptions. A negative percentage indicates that the subscriptions and redemptions give rise to only few or, as the case may be, no transactions in the portfolio.
A detailed list of the transactions carried out during the financial year can be consulted, free of charge, at Banque Degroof Petercam S.A with its registered office at Rue de l’Industrie 44 - B-1040 Brussels which provides the financial services.
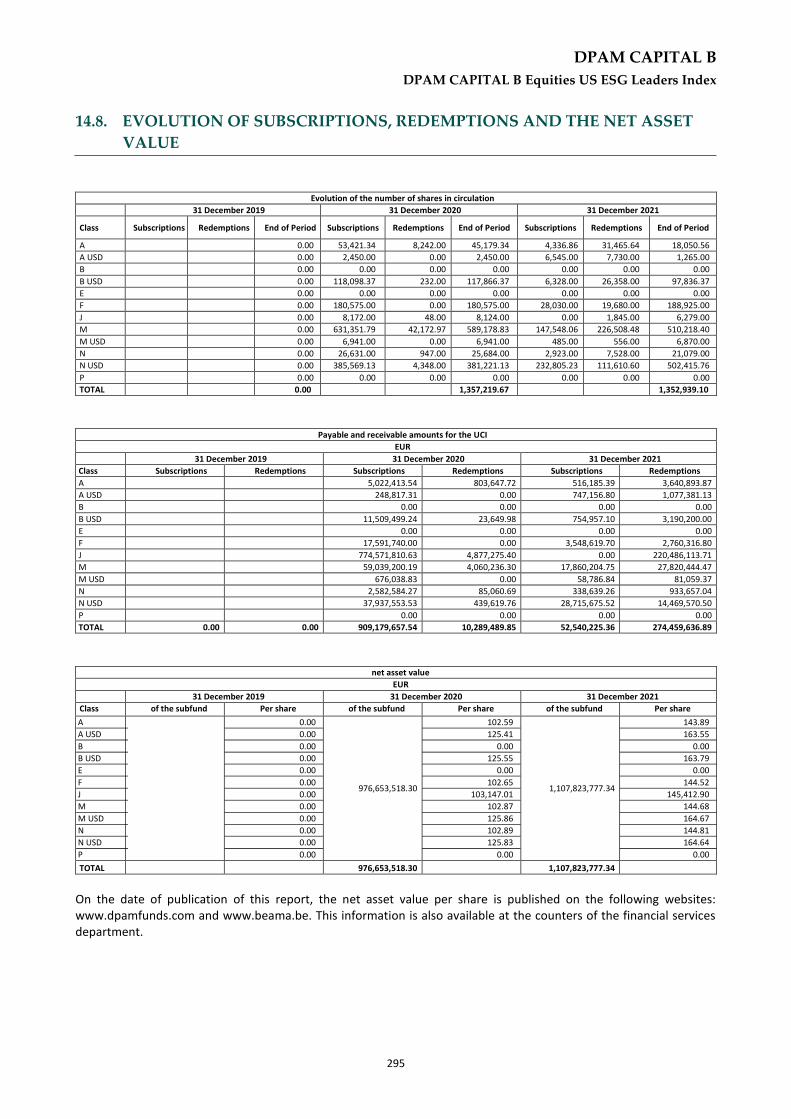
DPAM CAPITAL B
DPAM CAPITAL B Equities US ESG Leaders Index
295
14.8. EVOLUTION OF SUBSCRIPTIONS, REDEMPTIONS AND THE NET ASSET
VALUE DPAM CAPITAL B Equities US ESG Leaders Index
Evolution of the number of shares in circulation
31 December 2019 31 December 2020 31 December 2021
Class Subscriptions Redemptions End of Period Subscriptions Redemptions End of Period Subscriptions Redemptions End of Period
A 0.00 53,421.34 8,242.00 45,179.34 4,336.86 31,465.64 18,050.56
A USD 0.00 2,450.00 0.00 2,450.00 6,545.00 7,730.00 1,265.00
B 0.00 0.00 0.00 0.00 0.00 0.00 0.00
B USD 0.00 118,098.37 232.00 117,866.37 6,328.00 26,358.00 97,836.37
E 0.00 0.00 0.00 0.00 0.00 0.00 0.00
F 0.00 180,575.00 0.00 180,575.00 28,030.00 19,680.00 188,925.00
J 0.00 8,172.00 48.00 8,124.00 0.00 1,845.00 6,279.00
M 0.00 631,351.79 42,172.97 589,178.83 147,548.06 226,508.48 510,218.40
M USD 0.00 6,941.00 0.00 6,941.00 485.00 556.00 6,870.00
N 0.00 26,631.00 947.00 25,684.00 2,923.00 7,528.00 21,079.00
N USD 0.00 385,569.13 4,348.00 381,221.13 232,805.23 111,610.60 502,415.76
P 0.00 0.00 0.00 0.00 0.00 0.00 0.00
TOTAL 0.00 1,357,219.67 1,352,939.10
Payable and receivable amounts for the UCI
EUR 31 December 2019 31 December 2020 31 December 2021
Class Subscriptions Redemptions Subscriptions Redemptions Subscriptions Redemptions
A 5,022,413.54 803,647.72 516,185.39 3,640,893.87
A USD 248,817.31 0.00 747,156.80 1,077,381.13
B 0.00 0.00 0.00 0.00
B USD 11,509,499.24 23,649.98 754,957.10 3,190,200.00
E 0.00 0.00 0.00 0.00
F 17,591,740.00 0.00 3,548,619.70 2,760,316.80
J 774,571,810.63 4,877,275.40 0.00 220,486,113.71
M 59,039,200.19 4,060,236.30 17,860,204.75 27,820,444.47
M USD 676,038.83 0.00 58,786.84 81,059.37
N 2,582,584.27 85,060.69 338,639.26 933,657.04
N USD 37,937,553.53 439,619.76 28,715,675.52 14,469,570.50
P 0.00 0.00 0.00 0.00
TOTAL 0.00 0.00 909,179,657.54 10,289,489.85 52,540,225.36 274,459,636.89
net asset value
EUR 31 December 2019 31 December 2020 31 December 2021
Class of the subfund Per share of the subfund Per share of the subfund Per share
A
A USD
B
B USD
E
F
J
M
M USD
N
N USD
P
0.00
0.00
0.00
0.00
0.00
0.00
0.00
0.00
0.00
0.00
0.00
0.00
976,653,518.30
102.59
125.41
0.00
125.55
0.00
102.65
103,147.01
102.87
125.86
102.89
125.83
0.00
1,107,823,777.34
143.89
163.55
0.00
163.79
0.00
144.52
145,412.90
144.68
164.67
144.81
164.64
0.00
TOTAL 976,653,518.30 1,107,823,777.34
On the date of publication of this report, the net asset value per share is published on the following websites: www.dpamfunds.com and www.beama.be. This information is also available at the counters of the financial services department.

DPAM CAPITAL B
DPAM CAPITAL B Equities US ESG Leaders Index
296
14.9. PERFORMANCES
Figures reflect past performance and are not an indicator of future performance. These figures do not include any restructuring. Returns are determined at the end of the financial year. The annual return is defined as the absolute return earned over a year. For the semi-annual report, the accounting year is 12-month period preceding the end of the half-year. From 2011, the calculation of the performance of the capitalization units is calculated similarly to the distribution units. This change is also applied to past performance. This change of method does not bring any significant difference compared to the method used previously. Bar chart showing annual returns of the last 10 years (in % and calculated in EUR) as of 31 December 2021: Class A Table showing historical performance (actuarial returns):
Average cumulated returns Since
1 year 3 year 5 year 10 year
Year Value
Class A 40.26 % (in EUR)
23/01/2020 21.12 % (in EUR)
Class A USD Table showing historical performance (actuarial returns):
Average cumulated returns Since
1 year 3 year 5 year 10 year
Year Value
Class A USD 30.41 % (in EUR)
21/12/2020 31.63 % (in EUR)

DPAM CAPITAL B
DPAM CAPITAL B Equities US ESG Leaders Index
297
Class B USD Annual return:
This is a passively managed sub-fund, which means that the portfolio manager aims to replicate the performance of a benchmark. The benchmark is used for performance comparison. Table showing historical performance (actuarial returns):
Average cumulated returns Since
1 year 3 year 5 year 10 year
Year Value
Class B USD 30.46 % (in EUR)
20/07/2020 31.65 % (in EUR)
Class F Table showing historical performance (actuarial returns):
Average cumulated returns Since
1 year 3 year 5 year 10 year
Year Value
Class F 40.79 % (in EUR)
20/10/2020 40.08 % (in EUR)
30
.5%
31
.2%
30.00%
30.20%
30.40%
30.60%
30.80%
31.00%
31.20%
31.40%
2021
Class B USD MSCI USA ESG Leaders

DPAM CAPITAL B
DPAM CAPITAL B Equities US ESG Leaders Index
298
Class J Table showing historical performance (actuarial returns):
Average cumulated returns Since
1 year 3 year 5 year 10 year
Year Value
Class J 40.98 % (in EUR)
23/01/2020 21.77 % (in EUR)
Class M Table showing historical performance (actuarial returns):
Average cumulated returns Since
1 year 3 year 5 year 10 year
Year Value
Class M 40.64 % (in EUR)
23/01/2020 21.46 % (in EUR)
Class M USD Table showing historical performance (actuarial returns):
Average cumulated returns Since
1 year 3 year 5 year 10 year
Year Value
Class M USD 30.84 % (in EUR)
20/10/2020 35.15 % (in EUR)
Class N Table showing historical performance (actuarial returns):
Average cumulated returns Since
1 year 3 year 5 year 10 year
Year Value
Class N 40.74 % (in EUR)
28/01/2020 21.86 % (in EUR)
Class N USD Table showing historical performance (actuarial returns):
Average cumulated returns Since
1 year 3 year 5 year 10 year
Year Value
Class N USD 30.84 % (in EUR)
19/10/2020 35.25 % (in EUR)

DPAM CAPITAL B
DPAM CAPITAL B Equities US ESG Leaders Index
299
14.10. CHARGES DPAM CAPITAL B Equities US ESG Leaders Index
Ongoing charges
The ongoing charges, calculated in accordance with the provisions of European Commission Regulation 583/2010 of 1 July 2010. These charges include transaction fees incurred by the sub-fund when it subscribes to and/or sells units of another fund, but do not include either (i) the fees incurred by the sub-fund when it makes investments other than subscriptions/sales of units of funds or, where applicable, (ii) the performance fee These charges are based on the fees charged in fund accounting for one year prior to the end of the period under review. In the event of a change in the cost structure during the financial year or if the share class is issued during the financial year, the amount of the reported current expenses is calculated on the basis of an estimate based on the expected total amount of the annual expenses (which could be determined by comparison with a similar class).
Taking into account the change in the cost structure during the year, the estimated costs are :
- Class A - BE6317165403: 0.79 % - Class A USD - BE6317466504: 0.79 % - Class B - BE6317166419: 0.79 % - Class F - BE6317169447: 0.40 % - Class J - BE6317170452: 0.30 % - Class M - BE6317172474: 0.50 % - Class M USD - BE6317467510: 0.41 % - Class N - BE6317173480: 0.43 % - Class N USD - BE6317174496: 0.41 %
14.11. NOTES TO THE FINANCIAL STATEMENTS AND OTHER
INFORMATION
14.11.1. transparency of securities financing transactions and of reuse
In accordance with Article 13 and Section A of the Annex to Regulation EU 2015/2365 (hereinafter the Regulation), the SICAV must inform investors of its use of securities financing transactions and total return swaps in the annual report and the half-yearly report. The portfolio does not contain any loaned assets at the date of this report.
14.11.2. Investment restrictions and overruns
Between NAV Dates 7/06/2021 and 8/06/2021 a prospectus passive breach was open in the DPAM Capital B Equities ESG Leaders Index subfund. Indeed, due to corporate action, the fund received shares in Organon & Co. (ISIN: US68622V1061). This company is not included in the index the fund follows and represented 0.04% of the NAV as of 07/06/2021. The breach was resolved by selling the position. Between the NAV dates 7/10/2021 and 8/10/2021, a passive prospectus violation was opened in the DPAM Capital B Equities ESG Leaders Index sub-fund. The violation was caused by the fact that the sub-fund must be invested only in issues of the MSCI US ESG Leaders Index. On the NAV date of 07/10/2021, as a result of a split, the fund received shares of Sylvamo Corporation that are not part of the index. The violation was resolved as the position was sold. Between NAV dates 9/11/2021 and 10/11/2021, a passive prospectus violation was opened in the DPAM Capital B Equities ESG Leaders Index. The violation was caused by the fact that the sub-fund must be invested only in issues of

DPAM CAPITAL B
DPAM CAPITAL B Equities US ESG Leaders Index
300
the MSCI US ESG Leaders Index. On NAV date 09/11/2021, as a result of a split, the fund received shares of KYNDRYL HOLDINGS INCORPORATION that are not part of the index. The breakout was resolved as the position was sold.
14.11.3. Transparency in sustainability
This information is published in accordance with Article 11 of Regulation (EU) 2019/2088 of 27 November 2019 on sustainability-related disclosures in the financial services sector ("SFDR Regulation"), as amended by Article 25 of Regulation (EU) 2020/852 of 18 June 2020 on the establishment of a framework to promote sustainable investment and amending Regulation (EU) 2019/2088 ("Taxonomy Regulation"), as well as in respect of the Taxonomy Regulation. 1. Extent to which environmental or social characteristics are met A) Sustainability indicators The sub-fund does not aim for sustainable investment but promotes environmental and social characteristics within the meaning of the SFDR Regulation. The objective of the sub-fund is to replicate the performance of the MSCI USA ESG LEADERS index. This index has an ESG selection process and is therefore consistent with the environmental and social characteristics promoted by the sub-fund: This index is constructed by applying a process combining stock exclusion and "Best-in-Class" selection as described in the prospectus and in "General description of the index" and detailed in the MSCI ESG Leaders Index methodology which is availableat www.msci.com/index- In addition to the investment restrictions related to index replication, the sub-fund adopts constraints in terms of companies' exposure to certain controversial activities and behaviours in accordance with the prospectus. The sustainability indicators used to measure the achievement of the environmental or social characteristics promoted by this sub-fund correspond to the binding investment restrictions mentioned in the prospectus, including those related to index replication. In accordance with these investment restrictions, the sub-fund's portfolio during the period under review had:
a) A tracking error in relation to the benchmark index (MSCI USA ESG LEADERS) lower than the tracking error
provided for in the prospectus (1.50%);
b) Zero exposure to issuers deemed non-compliant with the 10 principles of the United Nations Global Compact
(which are part of the Global Standards) at the time the positions were purchased;
c) Zero exposure to issuers involved in controversial activities that meet the exclusion criteria set out in DPAM's
Controversial Activities Policy (available at www.dpamfunds.com), both at the time of purchase of the
positions and during the time the portfolio positions were held;
d) Zero exposure to issuers facing ESG controversies of maximum severity on environmental or social issues at
the time of purchase of the positions;
More information about the indicators and their methodology can be found in the prospectus and on the website www.dpamfunds.com. B) Use of derivatives The sub-fund does not use derivatives, if any are held, for the purpose of promoting environmental and/or social characteristics as described in the prospectus.

DPAM CAPITAL B
DPAM CAPITAL B Equities US ESG Leaders Index
301
2. Statement on the Taxonomy Regulation The investments underlying this product do not take into account the European Union's criteria for environmentally sustainable economic activities.
14.11.4. Transparency of the securities financing transactions and of reuse
In accordance with Article 13 and Section A of the Annex to Regulation EU 2015/2365 (hereinafter the Regulation), the Sicav must inform investors of its use of securities financing transactions and total return swaps in the annual report and the half-yearly report. The portfolio does not contain any loaned assets at the date of this report.
DPAM CAPITAL B Equities US ESG Leaders Index
Copyright © 2022 FDOKUMEN