Auditor's Report and Audited Financial Statements for the year ...
Upload
khangminh22Category
view
1download
0
Quality Control Review of the Independent Auditor’s Report on the
Federal Aviation Administration’s Audited Consolidated Financial Statements for
Fiscal Years 2019 and 2018
Report No. QC2020009
November 14, 2019

What We Looked At We contracted with the independent public accounting firm KPMG LLP to audit the Federal Aviation Administration’s (FAA) financial statements as of and for the fiscal years ended September 30, 2019, and September 30, 2018, and to report on internal control over financial reporting and compliance with laws and other matters. The contract requires the audit to be performed in accordance with U.S. generally accepted Government auditing standards, Office of Management and Budget audit guidance, and the Governmental Accountability Office’s and Council of the Inspectors General on Integrity and Efficiency’s Financial Audit Manual. In connection with the contract, we performed a quality control review of KPMG’s report dated November 9, 2019, and related documentation, and inquired of its representatives. What We Found Our quality control review disclosed no instances in which KPMG did not comply, in all material respects, with U.S. generally accepted Government auditing standards. Recommendations FAA concurred with KPMG’s seven recommendations. We agree with KPMG’s recommendations and are not making any additional recommendations.
Quality Control Review of the Independent Auditor’s Report on the Federal Aviation Administration’s Audited Consolidated Financial Statements for Fiscal Years 2019 and 2018 Required by the Chief Financial Officers Act of 1990
QC2020009 | November 14, 2019
All OIG audit reports are available on our website at www.oig.dot.gov.
For inquiries about this report, please contact our Office of Government and Public Affairs at (202) 366-8751.
QC2020009
Contents Memorandum 1
KPMG’s Report 2
Quality Control Review 4
Agency Comments and OIG Response 4
Actions Required 4
Exhibit. List of Acronyms 5
Attachment 1. Independent Auditor’s Report 6
Attachment 2. Agency Response 7
Attachment 3. Agency Performance and Accountability Report 8
QC2020009 1
Memorandum Date: November 14, 2019
Subject: ACTION: Quality Control Review of the Independent Auditor’s Report on the Federal Aviation Administration’s Audited Consolidated Financial Statements for Fiscal Years 2019 and 2018 | Report No. QC2020009
From: Louis C. King Assistant Inspector General for Financial and Information Technology Audits
To: Federal Aviation Administrator
I respectfully submit the results of our quality control review (QCR) of the independent auditor’s report on the Federal Aviation Administration’s (FAA) audited consolidated financial statements for fiscal years 2019 and 2018.
We contracted with the independent public accounting firm KPMG LLP to audit FAA’s financial statements as of and for the fiscal years ended September 30, 2019, and September 30, 2018, and to report on internal control over financial reporting and compliance with laws and other matters. The contract requires the audit to be performed in accordance with U.S. generally accepted Government auditing standards, Office of Management and Budget audit guidance, and the Governmental Accountability Office’s and Council of the Inspectors General on Integrity and Efficiency’s Financial Audit Manual.1
We appreciate the cooperation and assistance of FAA’s representatives and KPMG. If you have any questions about this report, please call me at (202) 366-1407, or George Banks, Program Director, at (202) 420-1116.
cc: The Secretary DOT Audit Liaison, M-1 FAA Audit Liaison, AAE-001
1 Financial Audit Manual, volumes 1, 2, and 3, GAO-18-601G, GAO-18-625G, and GAO-18-626G, June 2018.
U.S. DEPARTMENT OF TRANSPORTATION OFFICE OF INSPECTOR GENERAL
QC2020009 2
KPMG’s Report In its audit of the fiscal years 2019 and 2018 financial statements of FAA, KPMG reported that
• FAA’s financial statements2 were fairly presented, in all material respects, in accordance with U.S. generally accepted accounting principles;
• it found two significant deficiencies3 in internal control over financial reporting that it did not consider to be material weaknesses;4 and
• there were no instances of reportable noncompliance with provisions of laws tested or other matters.
KPMG made seven recommendations to address the significant deficiencies in internal control over financial reporting (see attachment 1).
The Significant Deficiencies Weaknesses in general information technology controls. KPMG identified the following general information technology control (GITC) deficiencies at the application, database, and operating system levels for the system used to prepare the Environmental Remediation Liability amount in the FAA financial statements:
• Review of audit logs was not documented to evidence appropriate and timely completion; and
• Monitoring controls were not operating effectively over the periodic review of access.
Weaknesses in the design and implementation of controls over the inventory part setup and receipting process. Controls to mitigate the risk of error in the inventory unit cost were not properly designed and implemented to ensure that donated exchange and repair (E&R) inventory parts are accurately set up in the Logistics Center Support System (LCSS) with supportable unit costs and other relevant attributes, such as condition code. Additionally, receipting controls
2 The financial statements are included in the Agency’s Performance and Accountability Report (see attachment 3). 3 A significant deficiency is a deficiency, or a combination of deficiencies, in internal control over financial reporting that is less severe than a material weakness, yet important enough to merit attention by those charged with governance. 4 A material weakness is a deficiency, or a combination of deficiencies, such that there is a reasonable possibility that a material misstatement of the entity's financial statements will not be prevented, or detected and corrected, on a timely basis.
QC2020009 3
to ensure the accuracy of inputs, including unit cost, receipt type, and condition code—key inputs to the price (valuation) of inventory—were not properly designed and implemented for miscellaneous and facilities and equipment (F&E) purchase orders.
Recommendations KPMG made the following recommendations to help strengthen FAA’s general information technology controls, and inventory part setup and receipting process controls.
For the GITC deficiencies, KPMG recommended that FAA management design and implement procedures to consistently perform and document the following, as required by existing internal policies:
1. Application log reviews;
2. Database layer audit log reviews;
3. Operation system layer log reviews;
4. Application level user account access reviews; and
5. Operating system administrative account access reviews.
For the inventory part setup and receipting process deficiencies, KPMG recommended that FAA management:
6. Design and implement review and approval control activities specific to the setup of a new donated inventory part in LCSS to ensure the established unit cost and related attributes are based on supportable and accurate information, and
7. Redesign policies and procedures unique to LCSS and the receipting scenarios that are acceptable for the miscellaneous and F&E purchase order receipt processes which support the accuracy of inputs. Further, management should design and implement review and approval control activities surrounding the creation of miscellaneous and F&E purchase orders in LCSS to ensure the unit cost and other attributes which are critical for the appropriate valuation, are valid and accurate.

QC2020009 4
Quality Control Review In connection with the contract, we performed a QCR of KPMG’s report, dated November 9, 2019, and related documentation, and inquired of its representatives. Our review, as differentiated from an audit of the financial statements in accordance with U.S. generally accepted Government auditing standards, was not intended to enable us to express, and we do not express, an opinion on FAA’s financial statements or conclusions about the effectiveness of internal control over financial reporting or compliance with laws and other matters. KPMG is responsible for its report and the conclusions expressed therein.
Our QCR disclosed no instances in which KPMG did not comply, in all material respects, with U.S. generally accepted Government auditing standards.
Agency Comments and OIG Response On November 6, 2019, KPMG provided FAA with its draft report and received FAA’s response, dated November 9, 2019 (see attachment 2). FAA agreed with the deficiencies KPMG found.
FAA concurred with KPMG’s seven recommendations and committed to developing a corrective action plan to address the deficiencies by December 31, 2019. We agree with KPMG’s recommendations and are not making any additional recommendations.
Actions Required We consider all seven of KPMG’s recommendations open and unresolved pending receipt of the corrective action plan.

Exhibit. List of Acronyms 5
Exhibit. List of Acronyms E&R exchange and repair
FAA Federal Aviation Administration
F&E facilities and equipment
GITC general information technology control
LCSS Logistics Center Support System
OIG Office of Inspector General
QCR quality control review

Attachment 1. Independent Auditor’s Report 6
Attachment 1. Independent Auditor’s Report
KPMG LLP is a Delaware limited liability partnership and the U.S. member firm of the KPMG network of independent member firms affiliated with KPMG International Cooperative (“KPMG International”), a Swiss entity.
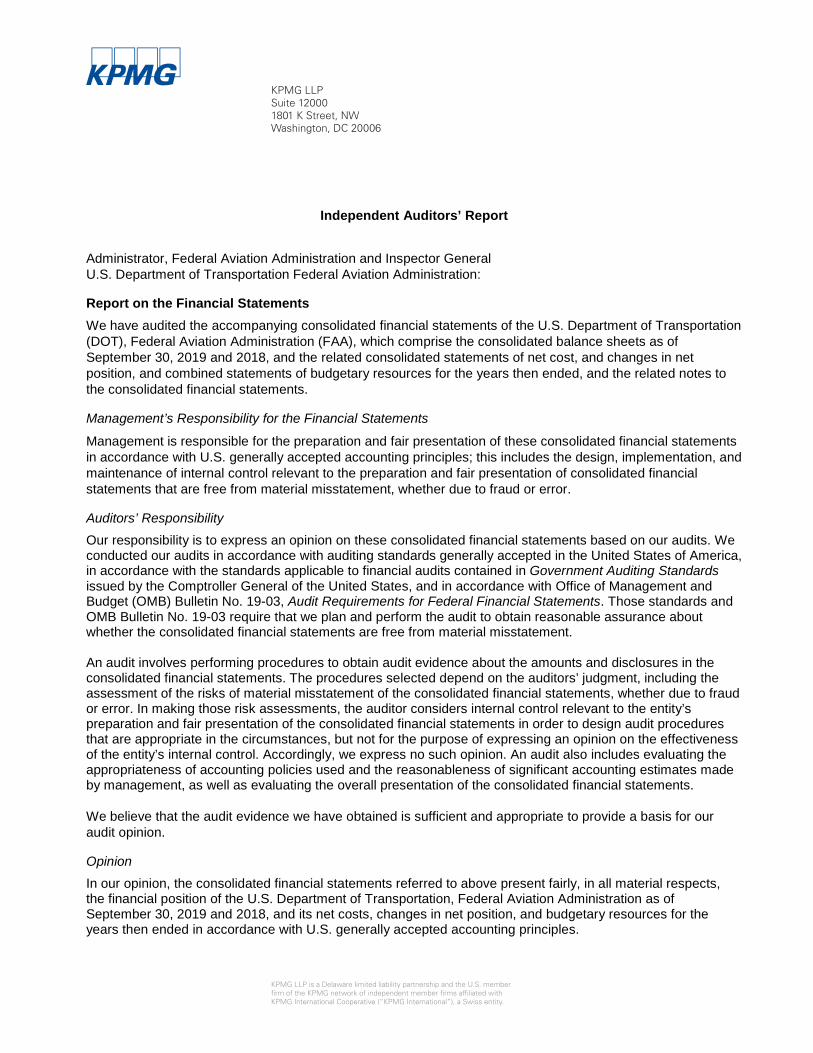
KPMG LLPSuite 120001801 K Street, NWWashington, DC 20006
Independent Auditors’ Report
Administrator, Federal Aviation Administration and Inspector General U.S. Department of Transportation Federal Aviation Administration:
Report on the Financial Statements We have audited the accompanying consolidated financial statements of the U.S. Department of Transportation (DOT), Federal Aviation Administration (FAA), which comprise the consolidated balance sheets as of September 30, 2019 and 2018, and the related consolidated statements of net cost, and changes in net position, and combined statements of budgetary resources for the years then ended, and the related notes to the consolidated financial statements.
Management’s Responsibility for the Financial Statements
Management is responsible for the preparation and fair presentation of these consolidated financial statements in accordance with U.S. generally accepted accounting principles; this includes the design, implementation, and maintenance of internal control relevant to the preparation and fair presentation of consolidated financial statements that are free from material misstatement, whether due to fraud or error.
Auditors’ Responsibility
Our responsibility is to express an opinion on these consolidated financial statements based on our audits. We conducted our audits in accordance with auditing standards generally accepted in the United States of America, in accordance with the standards applicable to financial audits contained in Government Auditing Standards issued by the Comptroller General of the United States, and in accordance with Office of Management and Budget (OMB) Bulletin No. 19-03, Audit Requirements for Federal Financial Statements. Those standards and OMB Bulletin No. 19-03 require that we plan and perform the audit to obtain reasonable assurance about whether the consolidated financial statements are free from material misstatement.
An audit involves performing procedures to obtain audit evidence about the amounts and disclosures in the consolidated financial statements. The procedures selected depend on the auditors’ judgment, including the assessment of the risks of material misstatement of the consolidated financial statements, whether due to fraud or error. In making those risk assessments, the auditor considers internal control relevant to the entity’s preparation and fair presentation of the consolidated financial statements in order to design audit procedures that are appropriate in the circumstances, but not for the purpose of expressing an opinion on the effectiveness of the entity’s internal control. Accordingly, we express no such opinion. An audit also includes evaluating the appropriateness of accounting policies used and the reasonableness of significant accounting estimates made by management, as well as evaluating the overall presentation of the consolidated financial statements.
We believe that the audit evidence we have obtained is sufficient and appropriate to provide a basis for our audit opinion.
Opinion
In our opinion, the consolidated financial statements referred to above present fairly, in all material respects, the financial position of the U.S. Department of Transportation, Federal Aviation Administration as of September 30, 2019 and 2018, and its net costs, changes in net position, and budgetary resources for the years then ended in accordance with U.S. generally accepted accounting principles.
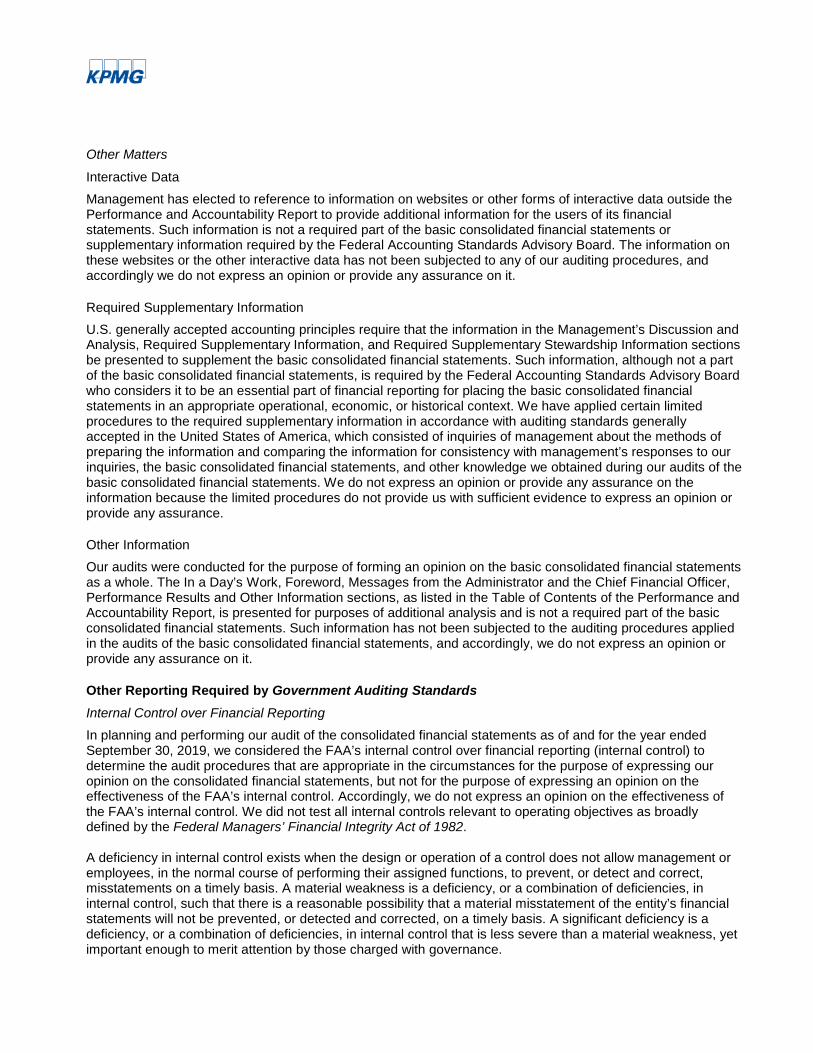
Other Matters
Interactive Data Management has elected to reference to information on websites or other forms of interactive data outside the Performance and Accountability Report to provide additional information for the users of its financial statements. Such information is not a required part of the basic consolidated financial statements or supplementary information required by the Federal Accounting Standards Advisory Board. The information on these websites or the other interactive data has not been subjected to any of our auditing procedures, and accordingly we do not express an opinion or provide any assurance on it.
Required Supplementary Information U.S. generally accepted accounting principles require that the information in the Management’s Discussion and Analysis, Required Supplementary Information, and Required Supplementary Stewardship Information sections be presented to supplement the basic consolidated financial statements. Such information, although not a part of the basic consolidated financial statements, is required by the Federal Accounting Standards Advisory Board who considers it to be an essential part of financial reporting for placing the basic consolidated financial statements in an appropriate operational, economic, or historical context. We have applied certain limited procedures to the required supplementary information in accordance with auditing standards generally accepted in the United States of America, which consisted of inquiries of management about the methods of preparing the information and comparing the information for consistency with management’s responses to our inquiries, the basic consolidated financial statements, and other knowledge we obtained during our audits of the basic consolidated financial statements. We do not express an opinion or provide any assurance on the information because the limited procedures do not provide us with sufficient evidence to express an opinion or provide any assurance.
Other Information Our audits were conducted for the purpose of forming an opinion on the basic consolidated financial statements as a whole. The In a Day’s Work, Foreword, Messages from the Administrator and the Chief Financial Officer, Performance Results and Other Information sections, as listed in the Table of Contents of the Performance and Accountability Report, is presented for purposes of additional analysis and is not a required part of the basic consolidated financial statements. Such information has not been subjected to the auditing procedures applied in the audits of the basic consolidated financial statements, and accordingly, we do not express an opinion or provide any assurance on it.
Other Reporting Required by Government Auditing Standards Internal Control over Financial Reporting
In planning and performing our audit of the consolidated financial statements as of and for the year ended September 30, 2019, we considered the FAA’s internal control over financial reporting (internal control) to determine the audit procedures that are appropriate in the circumstances for the purpose of expressing our opinion on the consolidated financial statements, but not for the purpose of expressing an opinion on the effectiveness of the FAA’s internal control. Accordingly, we do not express an opinion on the effectiveness of the FAA’s internal control. We did not test all internal controls relevant to operating objectives as broadly defined by the Federal Managers’ Financial Integrity Act of 1982.
A deficiency in internal control exists when the design or operation of a control does not allow management or employees, in the normal course of performing their assigned functions, to prevent, or detect and correct, misstatements on a timely basis. A material weakness is a deficiency, or a combination of deficiencies, in internal control, such that there is a reasonable possibility that a material misstatement of the entity’s financial statements will not be prevented, or detected and corrected, on a timely basis. A significant deficiency is a deficiency, or a combination of deficiencies, in internal control that is less severe than a material weakness, yet important enough to merit attention by those charged with governance.
Our consideration of internal control was for the limited purpose described in the first paragraph of this section and was not designed to identify all deficiencies in internal control that might be material weaknesses or significant deficiencies and therefore, material weaknesses or significant deficiencies may exist that have not been identified. Given these limitations, during our audit we did not identify any deficiencies in internal control that we consider to be material weaknesses. We did identify certain deficiencies in internal control, described in the accompanying Exhibit I as items 2019-1 and 2019-2 that we consider to be significant deficiencies.
Compliance and Other Matters
As part of obtaining reasonable assurance about whether the FAA’s consolidated financial statements are free from material misstatement, we performed tests of its compliance with certain provisions of laws, regulations, contracts, and grant agreements, noncompliance with which could have a direct and material effect on the determination of financial statement amounts. However, providing an opinion on compliance with those provisions was not an objective of our audit, and accordingly, we do not express such an opinion. The results of our tests disclosed no instances of noncompliance or other matters that are required to be reported under Government Auditing Standards or OMB Bulletin No. 19-03.
FAA’s Responses to Findings
The FAA’s response to the findings identified in our audit is described and presented in the section titled Management’s Response to the Independent Auditors’ Report. The FAA’s response was not subjected to the auditing procedures applied in the audit of the consolidated financial statements and, accordingly, we express no opinion on the response.
Purpose of the Other Reporting Required by Government Auditing Standards
The purpose of the communication described in the Other Reporting Required by Government Auditing Standards section is solely to describe the scope of our testing of internal control and compliance and the results of that testing, and not to provide an opinion on the effectiveness of the FAA’s internal control or compliance. Accordingly, this communication is not suitable for any other purpose.
Washington, DCNovember 9, 2019
Federal Aviation Administration Independent Auditors’ Report Exhibit I Internal Control Over Financial Reporting SIGNIFICANT DEFICIENCIES
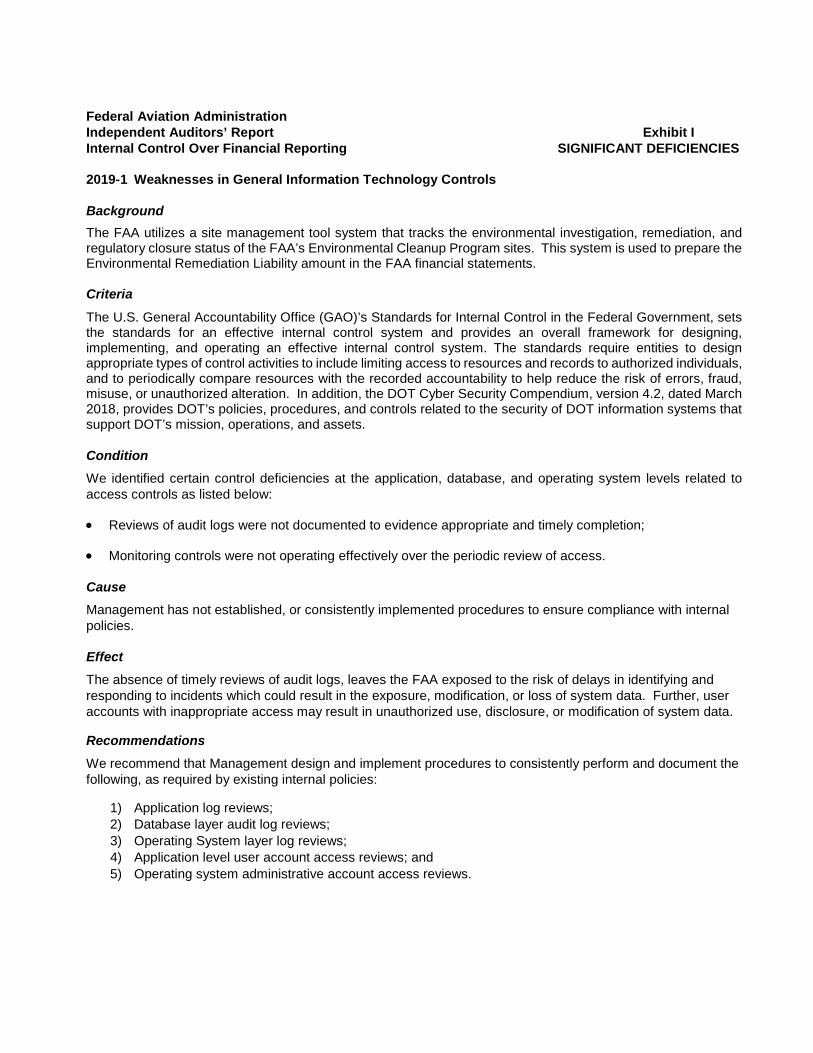
2019-1 Weaknesses in General Information Technology Controls
Background The FAA utilizes a site management tool system that tracks the environmental investigation, remediation, and regulatory closure status of the FAA’s Environmental Cleanup Program sites. This system is used to prepare the Environmental Remediation Liability amount in the FAA financial statements.
Criteria
The U.S. General Accountability Office (GAO)’s Standards for Internal Control in the Federal Government, sets the standards for an effective internal control system and provides an overall framework for designing, implementing, and operating an effective internal control system. The standards require entities to design appropriate types of control activities to include limiting access to resources and records to authorized individuals, and to periodically compare resources with the recorded accountability to help reduce the risk of errors, fraud, misuse, or unauthorized alteration. In addition, the DOT Cyber Security Compendium, version 4.2, dated March 2018, provides DOT’s policies, procedures, and controls related to the security of DOT information systems that support DOT’s mission, operations, and assets.
Condition We identified certain control deficiencies at the application, database, and operating system levels related to access controls as listed below:
• Reviews of audit logs were not documented to evidence appropriate and timely completion;
• Monitoring controls were not operating effectively over the periodic review of access.
Cause Management has not established, or consistently implemented procedures to ensure compliance with internal policies.
Effect The absence of timely reviews of audit logs, leaves the FAA exposed to the risk of delays in identifying and responding to incidents which could result in the exposure, modification, or loss of system data. Further, user accounts with inappropriate access may result in unauthorized use, disclosure, or modification of system data.
Recommendations We recommend that Management design and implement procedures to consistently perform and document the following, as required by existing internal policies:
1) Application log reviews;2) Database layer audit log reviews;3) Operating System layer log reviews;4) Application level user account access reviews; and5) Operating system administrative account access reviews.
Federal Aviation Administration Independent Auditors’ Report Exhibit I Internal Control Over Financial Reporting SIGNIFICANT DEFICIENCIES
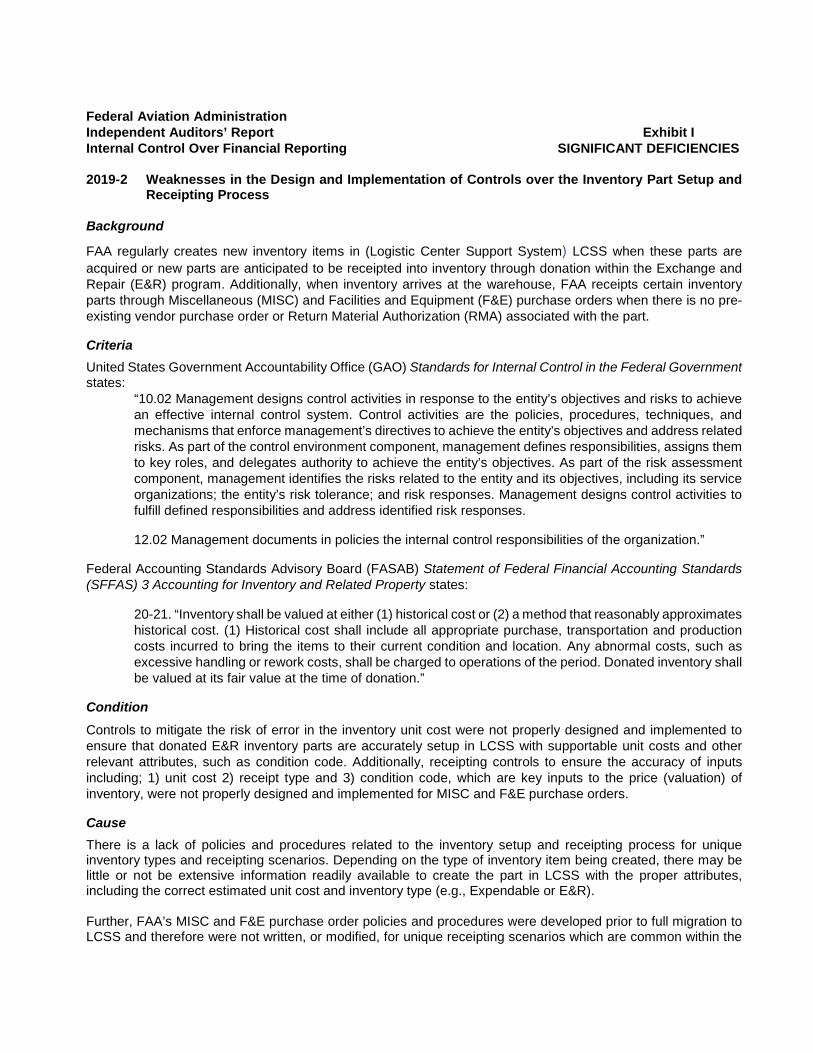
2019-2 Weaknesses in the Design and Implementation of Controls over the Inventory Part Setup and Receipting Process
Background
FAA regularly creates new inventory items in (Logistic Center Support System) LCSS when these parts areacquired or new parts are anticipated to be receipted into inventory through donation within the Exchange and Repair (E&R) program. Additionally, when inventory arrives at the warehouse, FAA receipts certain inventory parts through Miscellaneous (MISC) and Facilities and Equipment (F&E) purchase orders when there is no pre-existing vendor purchase order or Return Material Authorization (RMA) associated with the part.
Criteria United States Government Accountability Office (GAO) Standards for Internal Control in the Federal Government states:
“10.02 Management designs control activities in response to the entity’s objectives and risks to achieve an effective internal control system. Control activities are the policies, procedures, techniques, and mechanisms that enforce management’s directives to achieve the entity’s objectives and address related risks. As part of the control environment component, management defines responsibilities, assigns them to key roles, and delegates authority to achieve the entity’s objectives. As part of the risk assessment component, management identifies the risks related to the entity and its objectives, including its service organizations; the entity’s risk tolerance; and risk responses. Management designs control activities to fulfill defined responsibilities and address identified risk responses.
12.02 Management documents in policies the internal control responsibilities of the organization.”
Federal Accounting Standards Advisory Board (FASAB) Statement of Federal Financial Accounting Standards (SFFAS) 3 Accounting for Inventory and Related Property states:
20-21. “Inventory shall be valued at either (1) historical cost or (2) a method that reasonably approximateshistorical cost. (1) Historical cost shall include all appropriate purchase, transportation and productioncosts incurred to bring the items to their current condition and location. Any abnormal costs, such asexcessive handling or rework costs, shall be charged to operations of the period. Donated inventory shallbe valued at its fair value at the time of donation.”
Condition Controls to mitigate the risk of error in the inventory unit cost were not properly designed and implemented to ensure that donated E&R inventory parts are accurately setup in LCSS with supportable unit costs and other relevant attributes, such as condition code. Additionally, receipting controls to ensure the accuracy of inputs including; 1) unit cost 2) receipt type and 3) condition code, which are key inputs to the price (valuation) of inventory, were not properly designed and implemented for MISC and F&E purchase orders.
Cause There is a lack of policies and procedures related to the inventory setup and receipting process for unique inventory types and receipting scenarios. Depending on the type of inventory item being created, there may be little or not be extensive information readily available to create the part in LCSS with the proper attributes, including the correct estimated unit cost and inventory type (e.g., Expendable or E&R).
Further, FAA’s MISC and F&E purchase order policies and procedures were developed prior to full migration to LCSS and therefore were not written, or modified, for unique receipting scenarios which are common within the
Federal Aviation Administration Independent Auditors’ Report Exhibit I Internal Control Over Financial Reporting SIGNIFICANT DEFICIENCIES
new system. As MISC and F&E purchase orders have a considerable amount of additional flexibility when created, the inputs such as unit cost and other relevant valuation-driving attributes are susceptible to an increased risk of error.
Effect FAA may setup and record receipts of inventory parts into LCSS with inaccurate cost or attributes, which could result in a misstatement in the inventory balance.
Recommendations We recommend that management:
1) Design and implement review and approval control activities specific to the setup of a new donated inventorypart in LCSS to ensure the established unit cost and related attributes are based on supportable and accurateinformation.
2) Redesign policies and procedures unique to LCSS and the receipting scenarios that are acceptable for theMISC and F&E purchase order receipt process which support the accuracy of inputs. Further, managementshould design and implement review and approval control activities surrounding the creation of MISC andF&E purchase orders in LCSS to ensure the unit cost and other attributes which are critical for the appropriatevaluation, are valid and accurate.

Attachment 2. Agency Response 7
Attachment 2. Agency Response
Office of Financial Services 800 Independence Ave. S.W.
Washington, DC 20591
November 9, 2019 Ms. Hannah Padilla KPMG LLP 1801 K Street, NW, Suite 1200 Washington, DC 20006 Dear Ms. Padilla, We have received your Independent Auditors’ Report related to the Federal Aviation Administration's fiscal years 2019 and 2018 consolidated financial statements and offer the following response. We appreciate working with you in support of an efficient and effective audit and are pleased to receive an unmodified audit result with no material weaknesses. The audit is an essential part of our fiscal responsibility to our citizens, which we take very seriously. We concur with the findings in your report. To address these weaknesses, we will (1) ensure that general information technology controls pertaining to the site management tool system used to prepare the environmental remediation liability are appropriately strengthened and (2) improve procedures and controls surrounding the inventory part setup and receipting process. We will develop a corrective action plan to address these weaknesses and will provide it to the Office of Inspector General by December 31, 2019. I will monitor implementation of the plan throughout the corrective action process. Thank you for your candor and the professional manner in which you and your team conducted your audit. Sincerely,
Allison W. Ritman Chief Financial Officer (Acting)

Attachment 3. Agency Performance and Accountability Report 8
Attachment 3. Agency Performance and Accountability Report
P E R F O R M A N C E a n d A C C O U N TA B I L I T Y R E P O R T
F I S C A L Y E A R 2 0 1 9FAA PAR
T H E F A A . A D V A N C I N G A V I A T I O N .
Artist concept: Aerion

MISSION • VISION • VALUES
OUR MISSIONTo provide the safest, most efficient
aerospace system in the world.
OUR VISIONWe strive to reach the next level of safety
and efficiency and to demonstrate global
leadership in how we safely integrate new
users and technologies into our aviation
system. We are accountable to the American
public and our aviation stakeholders.
OUR VALUESSAFETY IS OUR PASSIONWe work so that all air and space travelers
arrive safely at their destinations.
EXCELLENCE IS OUR PROMISEWe seek results that embody professionalism,
transparency, and accountability.
INTEGRITY IS OUR TOUCHSTONEWe perform our duties honestly,
with moral soundness, and with
the highest level of ethics.
PEOPLE ARE OUR STRENGTHOur success depends on the
respect, diversity, collaboration, and
commitment of our workforce.
INNOVATION IS OUR SIGNATUREWe foster creativity and vision to provide
solutions beyond today’s boundaries.
FA A FISCAL YEAR 2019 | PERFORMANCE AND ACCOUNTABILIT Y REPORT 1
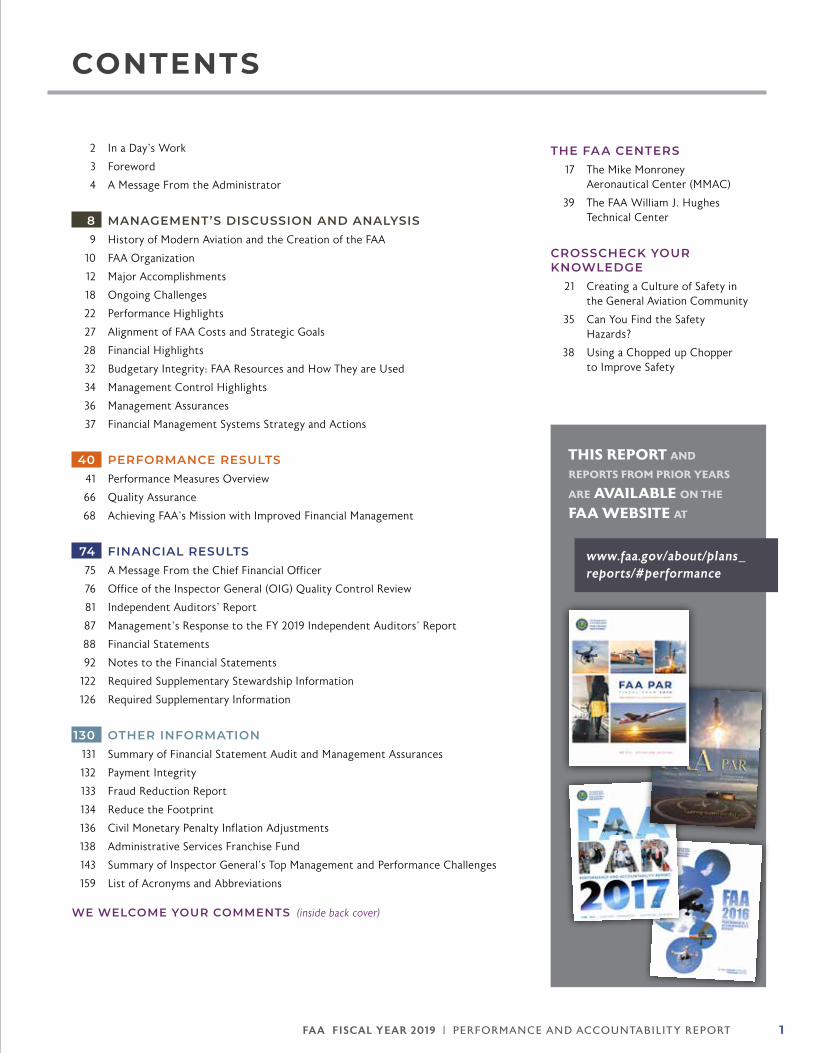
CONTENTS
2 In a Day’s Work
3 Foreword
4 A Message From the Administrator
8 MANAGEMENT’S DISCUSSION AND ANALYSIS 9 History of Modern Aviation and the Creation of the FAA
10 FAA Organization
12 Major Accomplishments
18 Ongoing Challenges
22 Performance Highlights
27 Alignment of FAA Costs and Strategic Goals
28 Financial Highlights
32 Budgetary Integrity: FAA Resources and How They are Used
34 Management Control Highlights
36 Management Assurances
37 Financial Management Systems Strategy and Actions
40 PERFORMANCE RESULTS 41 Performance Measures Overview
66 Quality Assurance
68 Achieving FAA’s Mission with Improved Financial Management
74 FINANCIAL RESULTS 75 A Message From the Chief Financial Officer
76 Office of the Inspector General (OIG) Quality Control Review
81 Independent Auditors’ Report
87 Management’s Response to the FY 2019 Independent Auditors’ Report
88 Financial Statements
92 Notes to the Financial Statements
122 Required Supplementary Stewardship Information
126 Required Supplementary Information
130 OTHER INFORMATION 131 Summary of Financial Statement Audit and Management Assurances
132 Payment Integrity
133 Fraud Reduction Report
134 Reduce the Footprint
136 Civil Monetary Penalty Inflation Adjustments
138 Administrative Services Franchise Fund
143 Summary of Inspector General’s Top Management and Performance Challenges
159 List of Acronyms and Abbreviations
WE WELCOME YOUR COMMENTS (inside back cover)
THE FAA CENTERS 17 The Mike Monroney
Aeronautical Center (MMAC)
39 The FAA William J. Hughes Technical Center
CROSSCHECK YOUR KNOWLEDGE 21 Creating a Culture of Safety in
the General Aviation Community
35 Can You Find the Safety Hazards?
38 Using a Chopped up Chopper to Improve Safety
THIS REPORT AND
REPORTS FROM PRIOR YEARS
ARE AVAILABLE ON THE FAA WEBSITE AT
www.faa.gov/about/plans_reports/#performance
FA A FISCAL YEAR 2019 | PERFORMANCE AND ACCOUNTABILIT Y REPORT2
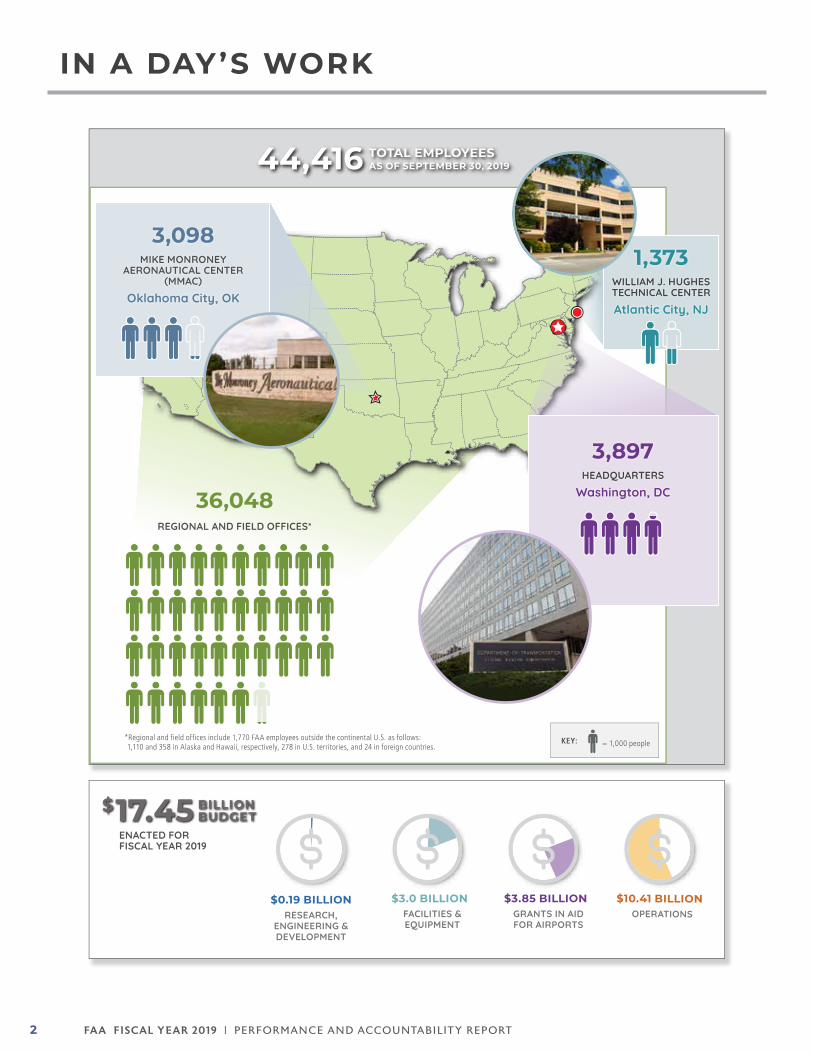
IN A DAY’S WORK
3,098MIKE MONRONEY
AERONAUTICAL CENTER (MMAC)
Oklahoma City, OK
1,373WILLIAM J. HUGHESTECHNICAL CENTERAtlantic City, NJ
3,889
3,897HEADQUARTERS
Washington, DC36,048REGIONAL AND FIELD OFFICES*
44,416 TOTAL EMPLOYEESAS OF SEPTEMBER 30, 2019
*Regional and field offices include 1,770 FAA employees outside the continental U.S. as follows: 1,110 and 358 in Alaska and Hawaii, respectively, 278 in U.S. territories, and 24 in foreign countries. = 1,000 peopleKEY:
$17.45 BILLION BUDGET
$0.19 BILLIONRESEARCH,
ENGINEERING & DEVELOPMENT
$10.41 BILLIONOPERATIONS
$3.85 BILLIONGRANTS IN AID FOR AIRPORTS
$3.0 BILLIONFACILITIES & EQUIPMENT
3,889
ENACTED FORFISCAL YEAR 2019

FA A FISCAL YEAR 2019 | PERFORMANCE AND ACCOUNTABILIT Y REPORT 3
The Federal Aviation Administration (FAA) is part
of the U.S. Department of Transportation (DOT). By directives,
the Office of Management and Budget, with statutory authority
from the Chief Financial Officers Act of 1990, requires the FAA
to prepare financial statements separate from those of the
DOT. The FAA consolidates its key data and information and
provides it to the DOT to incorporate into their corresponding
reports. Although the FAA is not required to prepare a separate
Agency Financial Report or Performance and Accountability
Report (PAR), it does so to better demonstrate the agency’s
accountability by presenting performance, management, and
financial information using the same statutory and guidance
framework as that used by the DOT. For this reason, the FAA
has produced its own PAR since fiscal year (FY) 2002.
The FAA is committed to safety for the flying public and fulfilling
its mission in a fiscally responsible and transparent manner. This
commitment is ongoing and the FAA is proud of the recognition
we have received over the years for transparent reporting of our
performance and accountability. The Certificate of Excellence in
Accountability Reporting (CEAR) award program was established
by the Association of Government Accountants in collaboration
with the Chief Financial Officers Council and the Office of
Management and Budget to improve government accountability
by streamlining reporting and improving the effectiveness of
reports. The FAA has received the prestigious CEAR award 15
of the last 16 years. Receiving the CEAR award is a
significant accomplishment
for a federal agency.
We are also extremely
honored to have been
recognized seven times
with special “best in class”
awards for elements of our
PAR considered to be
the best across all of
government.
The success of our financial stewardship is due to the diligent
efforts of our employees who practice sound fiscal policies in
supporting our mission, programs, and systems. We thank our
people for their dedication and commitment to our mission
and their transparent reporting of the important work of the
agency.
VISIT US FROM YOUR MOBILE DEVICEM.FAA.GOV
FOREWORD
FA A FISCAL YEAR 2019 | PERFORMANCE AND ACCOUNTABILIT Y REPORT4
A MESSAGE FROM THE ADMINISTRATOR
I am honored and humbled to lead the FAA during this period of exceptional innovation in aviation history. It’s a busy time as we integrate new users into the system, including unmanned aircraft
systems and commercial space launches. We are seeing new aircraft designs — electric and hybrid aircraft, flying taxis for urban passenger transport, and quiet supersonic aircraft. The future is very exciting for aviation and the agency; in fact, I think this could be the most exciting period in our aviation history since the introduction of the jet engine for commercial aircraft.
At the same time, our focus and mission has always been and continues to be safety. The lives lost and the grounding of the Boeing 737 MAX after two crashes placed a spotlight on aviation safety and the FAA’s oversight approach to those we regulate. The FAA acknowledges with deep sadness the pain and the loss of the families and friends of those killed. The accidents reconfirm the seriousness with which we must approach safety, and solidify our resolve to make the overall aviation system as safe as we possibly can. As I have said many times, safety is a journey, not a destination.
These accidents precipitated a variety of reviews of our processes and procedures, all of which we welcome. At the request of Secretary Chao, the Department of Transportation’s (DOT) Inspector General (IG) is auditing the certification of the 737 MAX, and a new 22-member Committee will advise the Department on aviation safety oversight and certification programs. The FAA also established a Joint Authorities Technical Review, or JATR, to review the certification of the 737 MAX automated flight control system.
These initiatives — the IG audit, the Advisory Committee, and the JATR — are geared toward developing systemic improvements for the future. Other efforts have focused more specifically on safely returning the 737 MAX to service, including a multi-agency independent Technical Advisory Board we launched to review Boeing’s software update and system safety assessment. In addition, I have already flown the 737 MAX simulator and as part of our comprehensive review of the MAX’s return to flight will pilot a 737 MAX aircraft in flight.
We continue to evaluate Boeing’s software modification, and we will assess necessary training requirements. This work is not following any prescribed timeline. The 737 MAX will not return to service for U.S. carriers and in U.S. airspace until the FAA’s analysis of the facts and technical data clearly demonstrate that it is safe to do so.
While our 737 MAX efforts are certainly a top priority, we continue to pursue a broad range of innovation and modernization activities. On January 1, 2020, our satellite-based successor to radar will be the required surveillance technology for most airspace, and the FAA has done a stellar job, particularly with airlines, in getting the message out to equip or be left in the hangar. In our latest data from September 1, the airlines have equipped 95 percent of the fleet (assuming a fleet size of 6,000 U.S.-regularly scheduled aircraft).
We are also putting the communications elements for modernization in place through the ongoing Data Communications program and ground system automation initiatives like Terminal Flight Data Manager. We are doing all this while keeping the largest, safest, and most complex airspace system operating 24/7/365.
The FAA's goal is to continually minimize safety risk while at the same time introducing innovations. The rate of change in aviation is something that will require the focus and attention of the FAA and
STEVE DICKSON
FA A FISCAL YEAR 2019 | PERFORMANCE AND ACCOUNTABILIT Y REPORT 5
all aviation stakeholders. We are integrating innovation, automation, and new entrants into our airspace system and we all must operate from a place of safety first. This is the only way we can continue to be successful in delivering the safest form of transportation available.
FAA ReauthorizationThe FAA Reauthorization Act of 2018, Public Law 115-254 (the Act), was signed into law October 5, 2018. This five-year authorization of the FAA represents the first significant multi-year reauthorization since the FAA Modernization and Reform Act of 2012, and the first five-year reauthorization since 1982. The Act is wide-ranging and provided the FAA with a host of critical new authorities and responsibilities on a broad range of aviation issues including enhancing safety, improving infrastructure, and enabling innovation. The vast majority of the specific mandates required FAA action within the first year. The Act’s focus on the first year of the reauthorization period, as well as other challenges that the FAA has encountered since enactment, has required the FAA to prioritize its implementation strategy. Despite these challenges, I am pleased to report that the FAA has made substantial progress on fulfilling the Congressional mandates in the Act.
Performance HighlightsLast year, the FAA updated its strategic plan, establishing new strategic goals for FY 2019 through FY 2022. These goals align with the DOT's strategic plan, and follow four priority areas: safety, infrastructure, innovation, and accountability. This year’s Performance and Accountability Report for the FAA reflects the structure of the new strategic plan, with each of the performance measures following one of the four priority areas.
In FY 2019, we achieved our target for 15 out of the agency’s 16 performance measures. A summary of results for all 16 performance measures is provided on pages 24–26 in the Management’s Discussion and Analysis section. Detailed information is in the Performance Results section, which begins on page 40.
Eight of the 16 performance measures support DOT priorities. These priorities are included in the performance plan the Department completed this year. As noted below, the FAA successfully achieved seven of the DOT priorities.
Safetyzz Commercial Air Carrier Fatality Rate: With a result of 0.6 fatalities per 100 million persons on board flights of U.S. passenger and cargo carriers, the FAA achieved its goal of not exceeding 5.9 fatalities per 100 million persons on board.
zz General Aviation Fatal Accident Rate: The year-end result of 0.93 fatal accidents per 100,000 flight hours was below our target of not exceeding 0.98.
Infrastructure zz NextGen Joint Implementation Plan Recommendations: With a year-end result of achieving 97.5 percent of NextGen Priorities Joint Implementation Plan commitments, the FAA achieved its goal of meeting 80 percent of its commitments.
zz Unmanned Aircraft Systems – Waivers: With an average time to process airspace waivers in FY 2019 of 18 days, the FAA achieved its goal of not exceeding an average time of 45 days.
FA A FISCAL YEAR 2019 | PERFORMANCE AND ACCOUNTABILIT Y REPORT6
Innovationzz Unmanned Aircraft Systems – Authorizations: With an average time to process airspace authorizations in FY 2019 of 19 days, the FAA achieved its goal of not exceeding an average time of 45 days.
zz Unmanned Aircraft Systems Integration Pilot Program – Part 135 Certificate: The FAA achieved its target to issue a certificate to an operator of unmanned aircraft systems under its regulations on charter and on-demand air service (commonly called “part 135” regulations).
zz Unmanned Aircraft Systems Integration Pilot Program – Enabling Operations: The FAA achieved its target by issuing 23 waivers for beyond visual line of sight operations, and 17 waivers for operations over people. The FAA’s target had been to approve five beyond visual line of sight waivers, and three waivers for operations over people.
Accountabilityzz Major System Investments: In FY 2019, for the first time the FAA did not meet its target to keep 90 percent of the major acquisition programs within 10 percent of their current budget, schedule, and performance milestones. Due to underestimated costs, unanticipated technical issues, and the month-long government shutdown, only 75 percent of major system investments remained within the 10 percent variance threshold.
Financial Accountability The FAA continues its commitment to ensuring transparency and accountability to the public while achieving our mission. The performance and financial data in this report are complete, accurate, and provide a comprehensive representation of agency results. Furthermore, for the thirteenth consecutive year, independent auditors gave our agency an unmodified audit opinion on our financial statements. The independent auditors' report is on page 81, and my statement of assurance is on page 36. The FY 2019 Performance and Accountability Report, as well as a summary document, can be accessed online at https://www.faa.gov/about/plans_reports/#performance.
Conclusion The FAA will work to remain the gold standard globally in aviation safety, aerospace system performance, and innovation. My focus will be on instilling core values such as honesty, integrity, respect, perseverance, and servant leadership for the agency and our dedicated employees. These types of values should form the foundation of everything we do.
I am excited about what the future will bring and humbled to play a part in this rapidly changing chapter of our nation’s aviation history.
STEVE DICKSONAdministratorNovember 9, 2019
FA A FISCAL YEAR 2019 | PERFORMANCE AND ACCOUNTABILIT Y REPORT 7
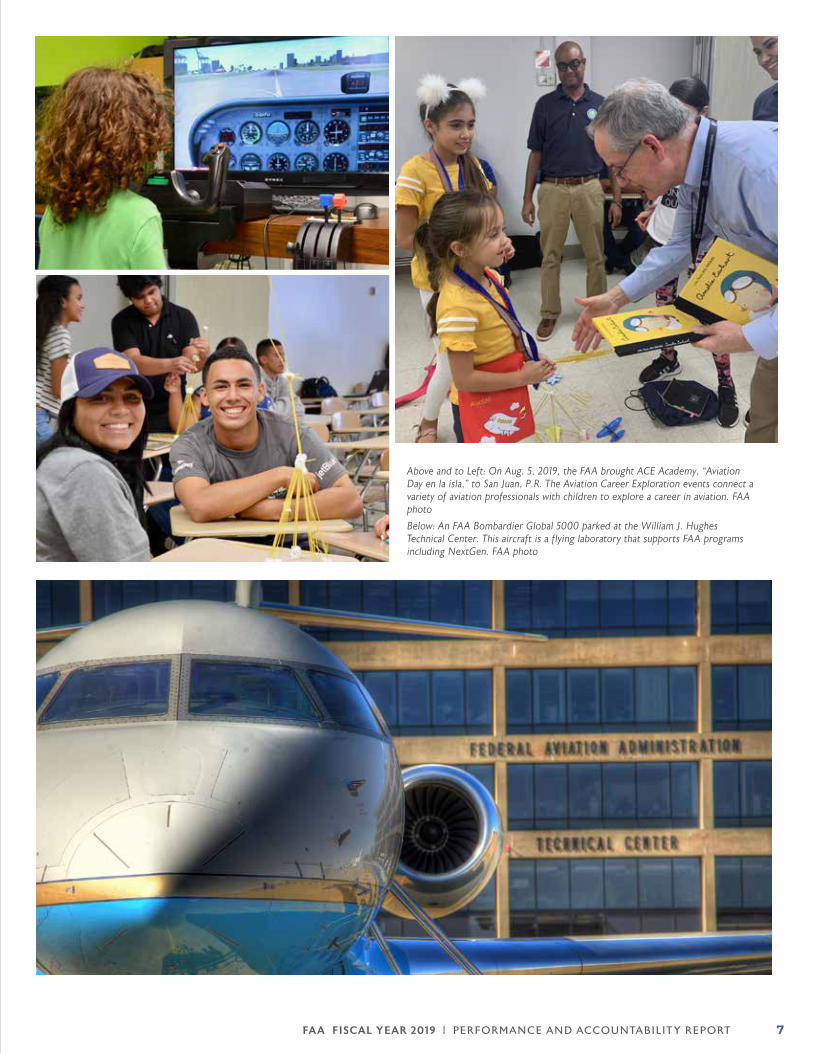
Above and to Left: On Aug. 5, 2019, the FAA brought ACE Academy, “Aviation Day en la isla,” to San Juan, P.R. The Aviation Career Exploration events connect a variety of aviation professionals with children to explore a career in aviation. FAA photo
Below: An FAA Bombardier Global 5000 parked at the William J. Hughes Technical Center. This aircraft is a flying laboratory that supports FAA programs including NextGen. FAA photo
FA A FISCAL YEAR 2019 | PERFORMANCE AND ACCOUNTABILIT Y REPORT8
MANAGEMENT’S DISCUSSION AND ANALYSIS
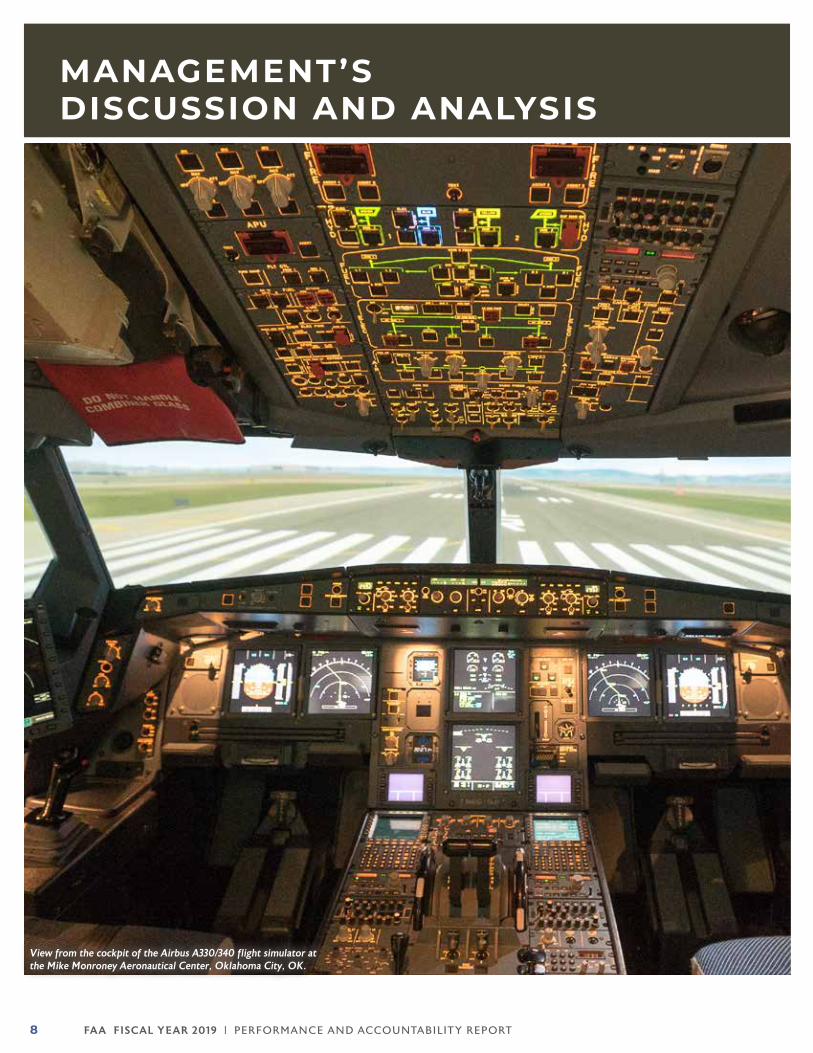
View from the cockpit of the Airbus A330/340 flight simulator at the Mike Monroney Aeronautical Center, Oklahoma City, OK.
FA A FISCAL YEAR 2019 | PERFORMANCE AND ACCOUNTABILIT Y REPORT 9
MA
NA
GE
ME
NT
’S D
ISC
US
SIO
N A
ND
AN
ALY
SIS
HISTORY OF MODERN AVIATION AND THE CREATION OF THE FAA
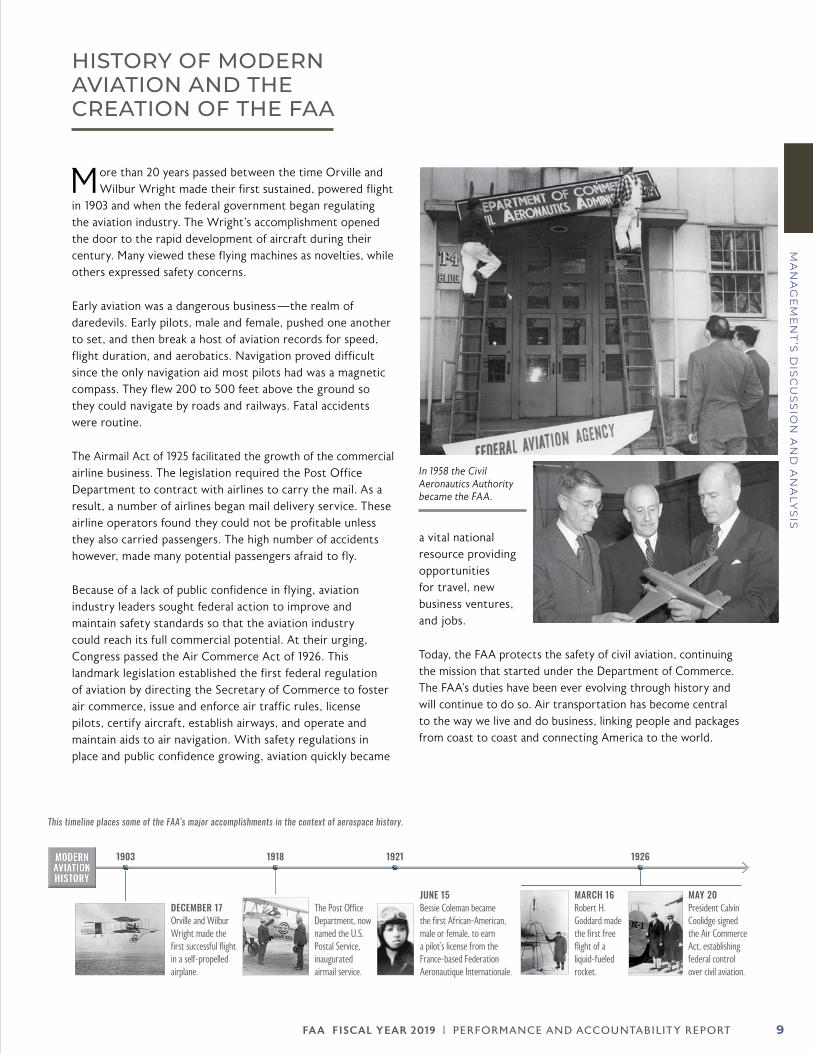
More than 20 years passed between the time Orville and Wilbur Wright made their first sustained, powered flight
in 1903 and when the federal government began regulating the aviation industry. The Wright’s accomplishment opened the door to the rapid development of aircraft during their century. Many viewed these flying machines as novelties, while others expressed safety concerns.
Early aviation was a dangerous business —the realm of daredevils. Early pilots, male and female, pushed one another to set, and then break a host of aviation records for speed, flight duration, and aerobatics. Navigation proved difficult since the only navigation aid most pilots had was a magnetic compass. They flew 200 to 500 feet above the ground so they could navigate by roads and railways. Fatal accidents were routine.
The Airmail Act of 1925 facilitated the growth of the commercial airline business. The legislation required the Post Office Department to contract with airlines to carry the mail. As a result, a number of airlines began mail delivery service. These airline operators found they could not be profitable unless they also carried passengers. The high number of accidents however, made many potential passengers afraid to fly.
Because of a lack of public confidence in flying, aviation industry leaders sought federal action to improve and maintain safety standards so that the aviation industry could reach its full commercial potential. At their urging, Congress passed the Air Commerce Act of 1926. This landmark legislation established the first federal regulation of aviation by directing the Secretary of Commerce to foster air commerce, issue and enforce air traffic rules, license pilots, certify aircraft, establish airways, and operate and maintain aids to air navigation. With safety regulations in place and public confidence growing, aviation quickly became
a vital national resource providing opportunities for travel, new business ventures, and jobs.
Today, the FAA protects the safety of civil aviation, continuing the mission that started under the Department of Commerce. The FAA’s duties have been ever evolving through history and will continue to do so. Air transportation has become central to the way we live and do business, linking people and packages from coast to coast and connecting America to the world.
The Post Office Department, now named the U.S. Postal Service, inaugurated airmail service.
DECEMBER 17Orville and Wilbur Wright made the first successful flight in a self-propelled airplane.
1918 1921 19261903
JUNE 15Bessie Coleman became the first African-American, male or female, to earn a pilot’s license from the France-based Federation Aeronautique Internationale.
MAY 20President Calvin Coolidge signed the Air Commerce Act, establishing federal control over civil aviation.
MARCH 16Robert H. Goddard made the first free flight of a liquid-fueled rocket.
MODERN AVIATION HISTORY
In 1958 the Civil Aeronautics Authority became the FAA.
This timeline places some of the FAA’s major accomplishments in the context of aerospace history.

FA A FISCAL YEAR 2019 | PERFORMANCE AND ACCOUNTABILIT Y REPORT10
MA
NA
GE
ME
NT
’S D
ISC
US
SIO
N A
ND
AN
ALY
SIS
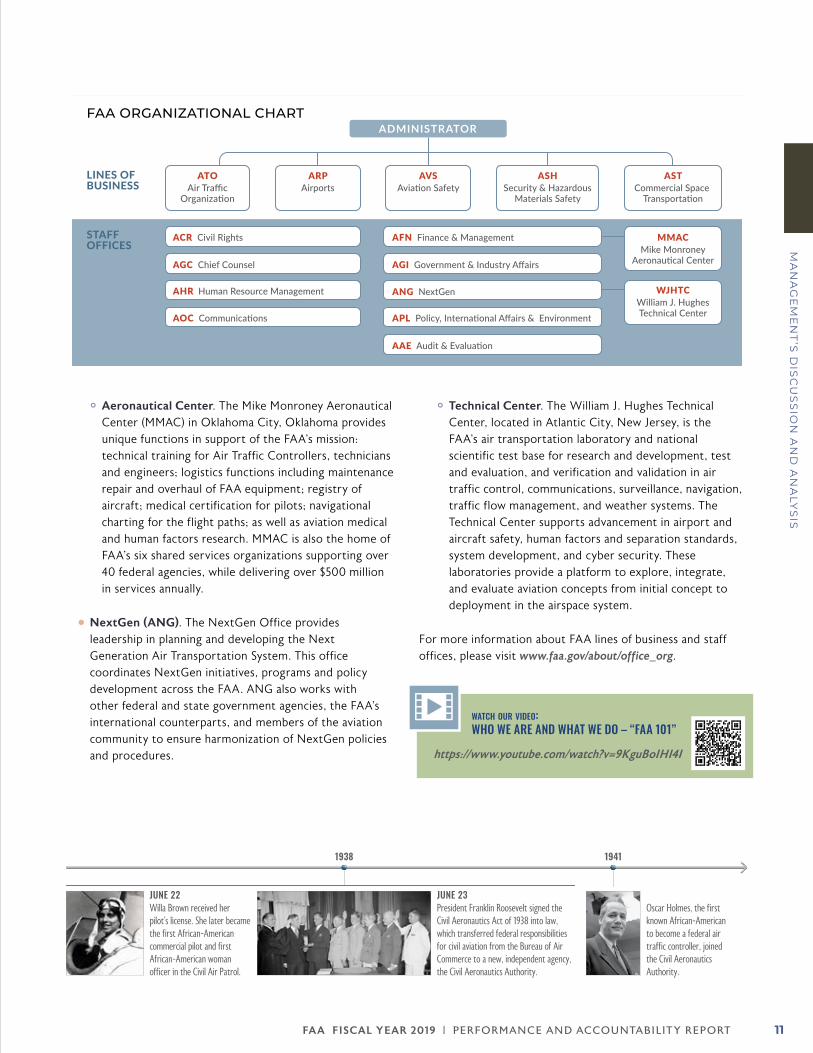
FAA ORGANIZATION
The FAA fulfills its mission through five lines of business that work collaboratively to create, operate, and maintain the national airspace system.
zz Air Traffic Organization (ATO). ATO is responsible for providing safe and efficient air navigation services for 29.4 million square miles of airspace. This represents more than 17 percent of the world’s airspace and includes all of the United States and large portions of the Atlantic and Pacific Oceans and the Gulf of Mexico. ATO stakeholders include commercial and private aviation users and the military. ATO employees are the service providers —the controllers, technicians, engineers and support personnel whose daily efforts keep aircraft moving safely and efficiently through the nation’s skies.
zz Airports (ARP). Provides leadership in planning and developing a safe and efficient national airport system; is responsible for all programs related to airport safety and inspections, and for standards of airport design, construction, and operation (including international harmonization of airport standards). ARP also awards Airport Improvement Program grants and approves passenger facility charge collections. ARP is also responsible for national airport planning and environmental and social requirements. In addition, ARP establishes policies related to airport rates and charges, compliance with grant assurances, and airport privatization.
zz Aviation Safety (AVS). Develops, establishes, administers, and enforces safety standards for all parts of the aviation industry, impacting every facet of domestic and international civil aviation safety. AVS is responsible for the certification of aircraft, airmen (pilots, mechanics, and other designees), and aviation entities (air carriers, charter operators, flying schools, training centers, etc.).
zz Security and Hazardous Materials Safety (ASH). Protects critical FAA assets, personnel, and the flying public from security risks, including criminal, terrorist, and insider threat actions. This is done through 24/7 emergency preparedness and response; global aviation situational awareness; intelligence threat identification, warning, and analysis; and robust personnel and facility security programs. ASH collaborates within FAA and with interagency, industry, and foreign partners to provide national security support and to ensure the safety of the transportation of hazardous materials (HAZMAT) in air commerce, preventing HAZMAT-related accidents or incidents aboard aircraft using targeted, risk-based oversight, as well as education, outreach, and engagement both domestically and internationally.
zz Commercial Space Transportation (AST). Ensures protection of the public, property, and the national security and foreign policy interests of the United States during commercial launch or reentry activities through licensing launches and reentries, and the operation of launch and reentry sites. AST also encourages, facilitates, and promotes U.S. commercial space transportation.
The FAA has 9 staff offices that support these lines of business and accomplishments of the agency’s mission.
Key among these staff offices are:
zz Finance and Management (AFN). Functions as the FAA's shared services organization, responsible for providing common business services through a consolidated, integrated approach. AFN delivers high-quality, efficient, and reliable finance, acquisitions, contracting, information technology, property, logistics, and technical training services across the agency. AFN helps streamline functions to ensure they are delivered as effectively and efficiently as possible, by reducing duplication and cutting costs.
MAY 21-22Amelia Earhart became the first woman to make a solo crossing of the Atlantic by airplane.
MAY 20-21Charles Lindbergh made the first solo transatlantic non-stop flight.
1932 1935 19361927HISTORY continued
British scientist Sir Robert Watson-Watt patented the first practical radar system.
JULY 6Federal air traffic control began as the Bureau of Air Commerce took over operation of the three airway traffic control stations at Newark, Chicago, and Cleveland.
FA A FISCAL YEAR 2019 | PERFORMANCE AND ACCOUNTABILIT Y REPORT 11
MA
NA
GE
ME
NT
’S D
ISC
US
SIO
N A
ND
AN
ALY
SIS
19411938
JUNE 22Willa Brown received her pilot’s license. She later became the first African-American commercial pilot and first African-American woman officer in the Civil Air Patrol.
JUNE 23President Franklin Roosevelt signed the Civil Aeronautics Act of 1938 into law, which transferred federal responsibilities for civil aviation from the Bureau of Air Commerce to a new, independent agency, the Civil Aeronautics Authority.
Oscar Holmes, the first known African-American to become a federal air traffic controller, joined the Civil Aeronautics Authority.
z| Aeronautical Center. The Mike Monroney Aeronautical Center (MMAC) in Oklahoma City, Oklahoma provides unique functions in support of the FAA’s mission: technical training for Air Traffic Controllers, technicians and engineers; logistics functions including maintenance repair and overhaul of FAA equipment; registry of aircraft; medical certification for pilots; navigational charting for the flight paths; as well as aviation medical and human factors research. MMAC is also the home of FAA’s six shared services organizations supporting over 40 federal agencies, while delivering over $500 million in services annually.
zz NextGen (ANG). The NextGen Office provides leadership in planning and developing the Next Generation Air Transportation System. This office coordinates NextGen initiatives, programs and policy development across the FAA. ANG also works with other federal and state government agencies, the FAA’s international counterparts, and members of the aviation community to ensure harmonization of NextGen policies and procedures.
z| Technical Center. The William J. Hughes Technical Center, located in Atlantic City, New Jersey, is the FAA’s air transportation laboratory and national scientific test base for research and development, test and evaluation, and verification and validation in air traffic control, communications, surveillance, navigation, traffic flow management, and weather systems. The Technical Center supports advancement in airport and aircraft safety, human factors and separation standards, system development, and cyber security. These laboratories provide a platform to explore, integrate, and evaluate aviation concepts from initial concept to deployment in the airspace system.
For more information about FAA lines of business and staff offices, please visit www.faa.gov/about/office_org.
AVSAviation Safety
ASHSecurity & Hazardous
Materials Safety
ARPAirports
MMACMike Monroney
Aeronautical Center
WJHTCWilliam J. HughesTechnical Center
ACR Civil Rights
AGC Chief Counsel
AHR Human Resource Management
AOC Communications
AFN Finance & Management
AGI Government & Industry Affairs
ANG NextGen
APL Policy, International Affairs & Environment
AAE Audit & Evaluation
ATOAir Traffic
Organization
ASTCommercial Space
Transportation
LINES OFBUSINESS
STAFF OFFICES
ADMINISTRATORFAA ORGANIZATIONAL CHART
watch our video: WHO WE ARE AND WHAT WE DO – “FAA 101”
https://www.youtube.com/watch?v=9KguBoIHI4I
FA A FISCAL YEAR 2019 | PERFORMANCE AND ACCOUNTABILIT Y REPORT12
MA
NA
GE
ME
NT
’S D
ISC
US
SIO
N A
ND
AN
ALY
SIS
OCTOBER 14Maj. Charles E. Yeager, USAF, piloting the Bell X-l rocket-propelled research aircraft at Muroc, CA, became the first pilot to exceed the speed of sound in level flight.
1947 19561941HISTORY continued
JUNE 30 Trans World Airlines Super Constellation and a United Air Lines DC-7 collided over the Grand Canyon, AZ, killing all 128 occupants of the two airplanes. The accident led directly to legislation creating the Federal Aviation Agency.
NOVEMBER 1The Civil Aeronautics Authority began operating airport traffic control towers and later that year began hiring and training women to be air traffic controllers.
MAJOR ACCOMPLISHMENTS
Runway Incursion Mitigation Program To date, the FAA has made improvements at 39 locations across the country to prevent runway incursions, with projects started at an additional 15 locations in FY 2019. Runway incursions occur when an aircraft, vehicle, or person is incorrectly present on the protected area of an airport’s surface designated for the landing and take-off of aircraft. Runway incursions are indicators of a serious safety problem that could result in an aircraft accident. Preventing runway incursions is a top safety concern for the FAA.
The FAA has analyzed national runway incursion data to develop an inventory of locations where risk factors may contribute to a runway incursion. For example, the geometric design of an airfield has been identified as a factor that contributes to runway incursions. In FY 2015, the FAA launched the Runway Incursion Mitigation program, a comprehensive, multi-year effort to help airports mitigate the risk of runway incursions at their locations.
The Runway Incursion Mitigation program has resulted in improvements at 39 locations to date, including locations at the Santa Barbara Municipal Airport, Corpus Christi International Airport, and Albuquerque International Airport. While airports have made improvements to each location at different times during the program, in total, the 39 mitigated locations experienced 435 runway incursions from 2007 until the time of their mitigation. The same locations experienced just 30 runway incursions since their mitigation over the FY 2016–2019 period. While the periods of time before and after these mitigations are not the same length, there is still a significant decrease in runway incursions at locations where mitigations have been implemented. The FAA will continue to monitor the locations over time to determine if mitigation efforts were successful and whether additional mitigations will be necessary.
Airport InfrastructureIn FY 2019, the FAA announced approximately $4 billion in grants to airports, making vital investments in the nation’s air transportation infrastructure. These grants include investments in runways, taxiways, aircraft parking areas, terminals, aircraft rescue and firefighting vehicles, snow removal equipment, and firefighting training facilities.
As required by law, the FAA maintains a list of airports that are significant to the national air transportation system based on several criteria: public use, the number of flights, and whether they receive U.S. mail service, among others. The list currently exceeds 3,300 airports across the country. If deemed significant, airports are eligible to receive federal grants for capital infrastructure projects under the Airport Improvement Program.
Of the $4 billion in airport grants announced in FY 2019, $779 million was part of supplemental grant funding in the Consolidated Appropriations Act, 2018. The Appropriations Act required the FAA to give “priority consideration” to smaller and more rural airports when awarding the supplemental funding. More than 1,000 airports met the criteria for priority consideration, and the FAA awarded about 88 percent of the supplemental funds to smaller and rural airports.
Our air transportation system connects communities, businesses, families, and friends. For people living in rural communities, it can do more than that. A general aviation airport in rural America can provide the primary access to vital services such as mail delivery and medical services. During winter in some northern communities, the only access to those communities may be through aviation. Aviation becomes the community lifeline, and access to safe airports becomes even more critical during bad weather. For many small remote communities that may not have a single resident doctor, air transport provides patients access to emergency medical services.
FA A FISCAL YEAR 2019 | PERFORMANCE AND ACCOUNTABILIT Y REPORT 13
MA
NA
GE
ME
NT
’S D
ISC
US
SIO
N A
ND
AN
ALY
SIS
AUGUST 23President Eisenhower signed the Federal Aviation Act of 1958, creating the independent Federal Aviation Agency.
OCTOBER 1The National Aeronautics and Space Administration was established under the National Aeronautics and Space Act of 1958.
1958 19621957
FEBRUARY 20 John H. Glenn, Jr., piloted the first U.S. manned orbital flight.
DECEMBER 20The jet age began with the first flight of the Boeing 707.
Unmanned Aircraft Systems (UAS)
Integration Pilot ProgramUnder the Integration Pilot Program (IPP), the FAA has partnered with nine state, local, and tribal governments as lead participants, which have then partnered with private industry to safely explore the further integration of drone operations into the national airspace.
The pilot program evaluates a variety of operational concepts, including night operations, flights over people, flights beyond the pilot’s line of sight, and package delivery. It also evaluates detect-and-avoid technologies and the reliability and security of data links between pilot and aircraft. The program supports immediate opportunities for commerce, photography, emergency management, agricultural support, and infrastructure inspections. It will also open a dialogue to help federal airspace authorities balance integration with state and local concerns regarding UAS technology and public safety.
In April 2019, Virginia’s IPP industry partner, Wing Aviation, achieved a package delivery milestone. Wing Aviation received the first ever drone air carrier certificate under the FAA’s regulations that cover charter and on-demand air service (commonly known as the FAA’s “Part 135 regulations”). The company is now allowed to deliver packages in Blacksburg, Virginia, and surrounding communities. The Virginia IPP team is planning to conduct their first flight under this certificate after conducting extensive community outreach to inform the community of its planned operations.
Another unique milestone occurred in July 2019, when the University of Alaska-Fairbanks IPP team obtained the first waiver under the FAA’s Part 107 regulations governing small UAS to fly beyond visual line of sight without visual observers. They conducted their first flight along a four-mile stretch of the Alyeska pipeline near Fairbanks, Alaska. In order to achieve this accomplishment, the team used a combination of on-board software as well as ground-based radars to spot and avoid any unexpected aircraft in the area.
Finally, the Chula Vista Police Department developed the Drone as a First Responder Program as part of the San Diego IPP team, dispatching drones in response to 911 calls to survey the area before first responders arrive. The program has helped the police department make a number of arrests and has provided critical situational awareness to arriving officers.
Unmanned Aircraft System Traffic Management Pilot Program UAS Traffic Management, or UTM, is a system for managing unmanned aircraft traffic at low altitudes. It is a part of the FAA’s larger air traffic control system. Under the UTM Pilot Program, the FAA is partnering with the National Aeronautics and Space Administration and the UAS industry to demonstrate UTM capabilities that are currently in the research and development phase, and to serve as the basis for expanded deployment of UTM capabilities. In FY 2019, the FAA selected three UAS test sites located in Virginia, North Dakota, and Nevada to partner with the agency to demonstrate UTM capabilities.
Low Altitude Authorization and Notification CapabilityUnder the FAA’s Small UAS Rule, also known as Part 107 regulations, drone operators must obtain an airspace authorization from the agency to operate a drone in controlled airspace. The FAA has been processing these requests manually, which is time consuming, requires many resources, and does not accommodate growth in demand. To process the approvals more efficiently, the agency partnered
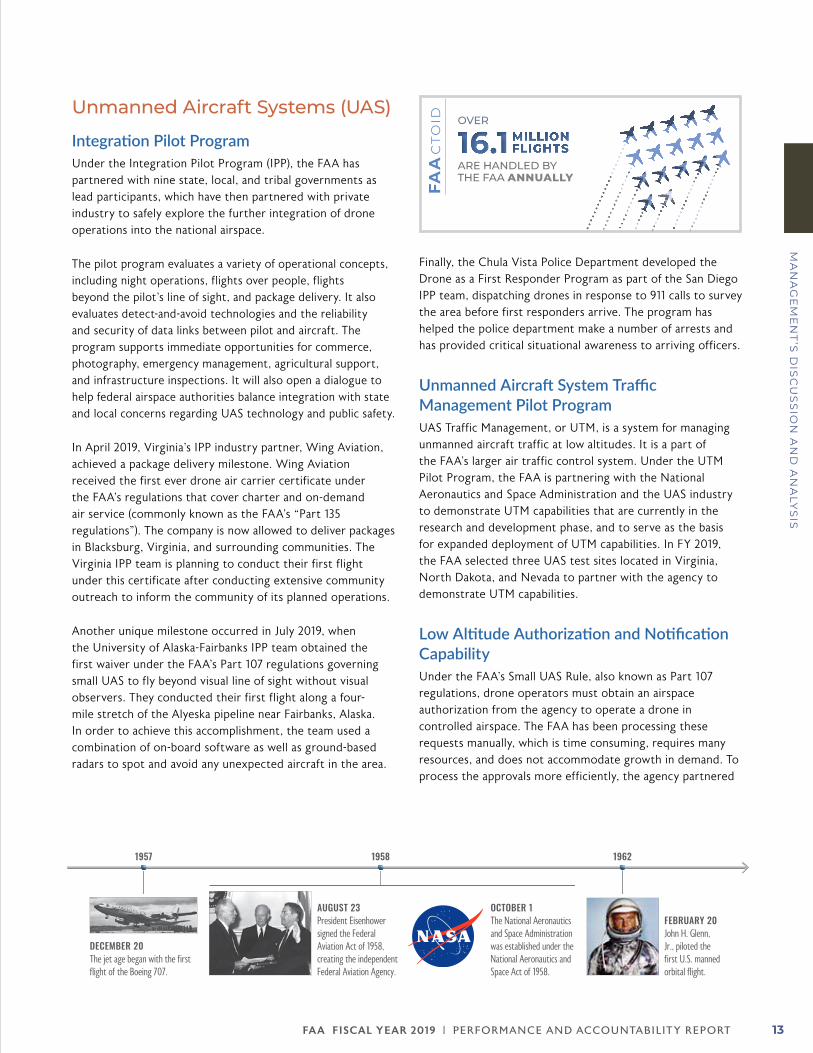
FAActo
id OVER
ARE HANDLED BY THE FAA ANNUALLY
16.1MILLIONFLIGHTS
FA A FISCAL YEAR 2019 | PERFORMANCE AND ACCOUNTABILIT Y REPORT14
MA
NA
GE
ME
NT
’S D
ISC
US
SIO
N A
ND
AN
ALY
SIS
with industry to develop the Low Altitude Authorization and Notification Capability (LAANC) system. Using LAANC, drone operators flying under FAA’s small UAS rule can receive near real-time airspace authorizations to fly in controlled airspace. LAANC also allows the FAA to know where planned drone operations will take place.
With the help of LAANC, the FAA has reduced the average time to process airspace authorizations from over 90 days to just 19 days, and in FY 2019 LAANC processed over 140,000 airspace authorizations. In FY 2019, the FAA expanded the availability of LAANC. At the beginning of the year, LAANC applied only to drone operators flying in a few designated zones in the national airspace. Today, LAANC is available at approximately 400 air traffic facilities covering about 600 airports. Additionally, in July 2019 the FAA expanded the availability of LAANC to recreational drone flyers in addition to pilots certified under the FAA’s Small UAS Rule.
Next StepsGoing forward, the ability to remotely identify UAS operators will be a crucial milestone for UAS traffic management, and will facilitate high volume low-altitude UAS operations. Remote identification is fundamental to safe and secure drone operations. Remote identification will be necessary for routine beyond visual line-of-sight operations and operations over people, package delivery, operations in congested areas, and the continued safe operation of all aircraft in shared airspace. It will also be foundational for the advancement of automated passenger or cargo-carrying air transportation — what is often referred to as urban air mobility. From a security perspective, remote identification would connect a suspect UAS to its control station location and be able to identify the registered owner of a suspect UAS. With universal remote identification, the FAA, our national security partners, and state and local law enforcement will be better able to locate and identify a UAS operator, determine if a UAS is being operated in an unsafe, unauthorized, or criminal manner, and take appropriate action if necessary. The FAA is committed to establishing remote identification requirements as quickly as possible.
NextGenFor more than 10 years, NextGen has been the FAA’s effort to modernize the nation’s air traffic control infrastructure, providing travelers a safer and more efficient way to fly. During this time, the FAA has been delivering on its promise to transition from a system based on radar to a system that uses satellite technology and Global Positioning System (GPS); leverage computer networks to share data and collaborate more effectively with airports, commercial airlines and other users of the national airspace; and take advantage of the capabilities of modern computers, allowing air traffic controllers and pilots to communicate with digital messages and strategically managing air traffic by predicting the location of each aircraft along its entire flight path.
In FY 2019, the FAA made significant achievements in the System Wide Information Management (SWIM) system and in the Terminal Flight Data Manager (TFDM) program. This year the FAA significantly expanded its SWIM program, which allows the agency to better share data with the aviation community. SWIM has already been used to share data over a secure network with commercial airlines and other users of the national airspace. This data includes safety notifications, weather forecasts, and traffic flow information. In FY 2019, the FAA expanded SWIM by using cloud technology to share data with the broader aviation community at a lower cost.
This year the FAA also completed developmental testing of the first major software build for the TFDM program. This program shares real-time data among controllers, aircraft operators, and airports so they can better stage arrivals and departures for greater efficiency on the airport surface. The operational testing of TFDM is scheduled for completion by June 2020. The FAA will then be ready to begin deploying the TFDM system.
The FAA is also translating these new technologies into real benefits for users of the national airspace and for the American public. The FAA estimates that improvements made as part of the NextGen effort have already accrued more than $6 billion worth of benefits, which consist of $3.4 billion
Elinor Williams became FAA’s first female African-American air traffic controller.
1968 1969 19761967HISTORY continued
JULY 20 Astronauts Neil A. Armstrong and Edwin E. Aldrin, Jr., became the first people to land on the Moon, while Michael Collins remained in lunar orbit. Later in the day, Armstrong and then Aldrin became the first to walk on the lunar surface.
First commercial supersonic passenger flight of Concorde.
APRIL 1National Transportation Safety Board (NTSB) was founded.
FA A FISCAL YEAR 2019 | PERFORMANCE AND ACCOUNTABILIT Y REPORT 15
MA
NA
GE
ME
NT
’S D
ISC
US
SIO
N A
ND
AN
ALY
SIS
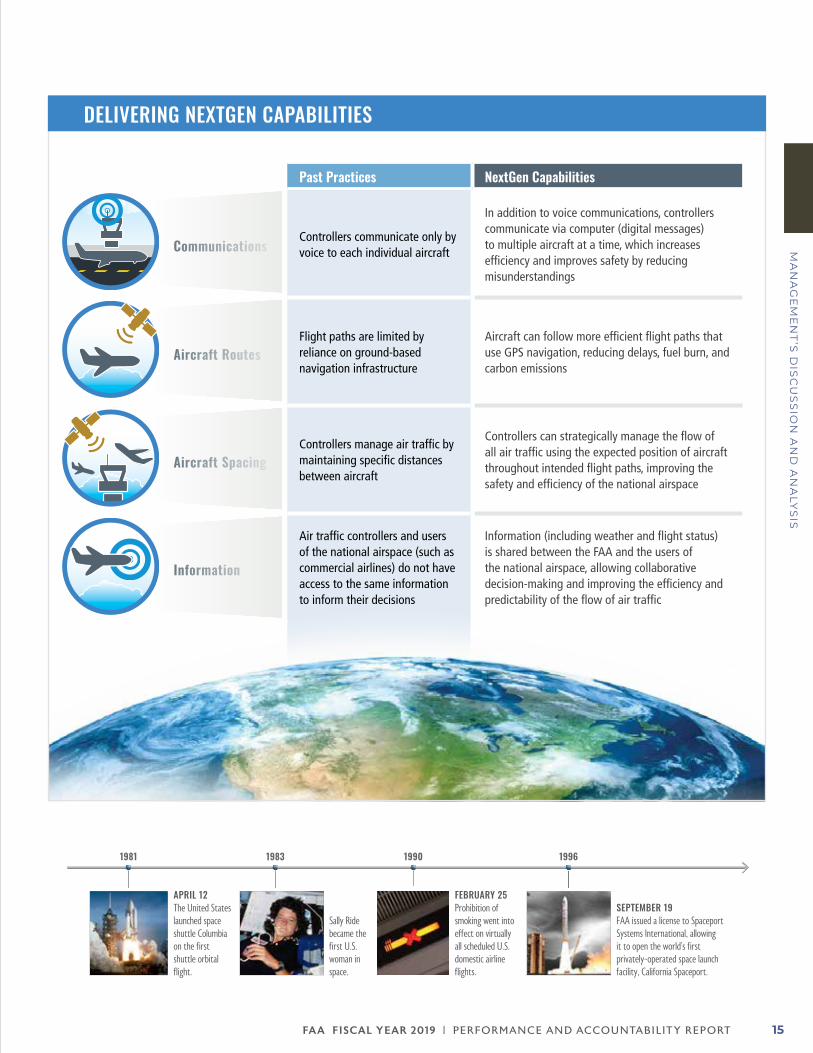
Past Practices NextGen Capabilities
Communications Controllers communicate only by voice to each individual aircraft
In addition to voice communications, controllers communicate via computer (digital messages) to multiple aircraft at a time, which increases efficiency and improves safety by reducing misunderstandings
Aircraft RoutesFlight paths are limited by reliance on ground-based navigation infrastructure
Aircraft can follow more efficient flight paths that use GPS navigation, reducing delays, fuel burn, and carbon emissions
Aircraft SpacingControllers manage air traffic by maintaining specific distances between aircraft
Controllers can strategically manage the flow of all air traffic using the expected position of aircraft throughout intended flight paths, improving the safety and efficiency of the national airspace
Information
Air traffic controllers and users of the national airspace (such as commercial airlines) do not have access to the same information to inform their decisions
Information (including weather and flight status) is shared between the FAA and the users of the national airspace, allowing collaborative decision-making and improving the efficiency and predictability of the flow of air traffic
APRIL 12The United States launched space shuttle Columbia on the first shuttle orbital flight.
Sally Ride became the first U.S. woman in space.
FEBRUARY 25Prohibition of smoking went into effect on virtually all scheduled U.S. domestic airline flights.
1990 19961981 1983
SEPTEMBER 19 FAA issued a license to Spaceport Systems International, allowing it to open the world’s first privately-operated space launch facility, California Spaceport.
DELIVERING NEXTGEN CAPABILITIES
FA A FISCAL YEAR 2019 | PERFORMANCE AND ACCOUNTABILIT Y REPORT16
MA
NA
GE
ME
NT
’S D
ISC
US
SIO
N A
ND
AN
ALY
SIS
SEPTEMBER 28FAA issued the first airworthiness certificate for a civil unmanned aerial vehicle, the General Atomics Altair.
AUGUST 29FAA implemented the first operational rules for routine non-hobbyist use of small UAS, or drones.
2005 2012 20162001HISTORY continued
MAY 2The SpaceX Falcon 9 rocket launched and, on MAY 25 became the first U.S. commercial space rocket to dock at the International Space Station.
NOVEMBER 19Transportation Security Administration was founded.
saved from decreased passenger travel time, $2.3 billion in lower aircraft operating expenses, and $400 million in safety benefits.
Commercial SpaceSpace is quickly becoming a regular place of business, with a growing number of commercial space launches and reentries. The FAA is working to protect public safety during this rapid rise in innovation and development, and to minimize the impact on traditional air travel. Chief among our accomplishments this year is developing streamlined launch and reentry licensing requirements and designing new methods to integrate commercial space operations into the national airspace.
To keep pace with a quickly expanding and innovative industry, and to allow the industry to continue its growth without regulatory burden, the FAA issued a proposed rule that would streamline its launch and reentry licensing requirements. The FAA published a proposed rule on April 15, 2019, that provides a safe, performance-based regulatory approach to commercial space transportation. It would promote safety practices by creating flexibility for operators to meet safety requirements through innovation, performance-based standards, and by enhancing collaboration among stakeholders. The rule would also improve efficiency by encouraging potential and current launch site and reentry operators to suggest and implement design and operation solutions instead of being prescribed specific solutions through regulation. The FAA has received hundreds of constructive comments from industry, helping the agency to refine and improve the rule before publishing a final rule.
This year the FAA designed time-based procedures for commercial space launches and reentries in order to reduce their impact on air traffic. Under the new procedures, the FAA creates a dynamic launch window that changes over time, allowing the agency to close a portion of the
airspace to air traffic only when it receives confirmation that a commercial space operation will be using the area. For example, if a launch operator begins a procedure that requires a launch within 30 minutes, the FAA will be updated that the actual launch will occur within that 30 minute window. Previously, the FAA used static launch windows that closed portions of the airspace even for times when they were not being used for commercial space operations.
Supersonic RevisitedThe Concorde first crossed the Atlantic on September 26, 1973, and started passenger service in 1976. The aircraft allowed passengers to fly at supersonic speed and travel from the U.S. to Europe in less than four hours. Many in the aviation community thought that the time had arrived for regular supersonic air travel for passengers. However, the Concorde was retired nearly two decades ago.
Companies in the United States and abroad are again taking a look at supersonic air travel. Lighter and more efficient composite materials, combined with new engine and airframe designs, may make it economically viable for air carriers to once again offer supersonic flights to commercial passengers.
Current law requires the FAA to issue new regulations to control and abate aircraft noise and sonic boom. To begin meeting these requirements, on June 28, 2019, the FAA published a draft regulation that will streamline the application process for requesting the authority to fly at supersonic speeds over land for the purpose of testing and developing supersonic aircraft. The FAA has also started to draft regulations that would address landing and takeoff noise standards for supersonic aircraft. The FAA’s challenge is to fulfill our responsibility to develop regulations that protect public health and welfare, but do not inhibit innovation. In addition, the FAA’s standards need to be technologically practicable, economically reasonable, and appropriate for the aircraft type.
FA A FISCAL YEAR 2019 | PERFORMANCE AND ACCOUNTABILIT Y REPORT 17
MA
NA
GE
ME
NT
’S D
ISC
US
SIO
N A
ND
AN
ALY
SIS
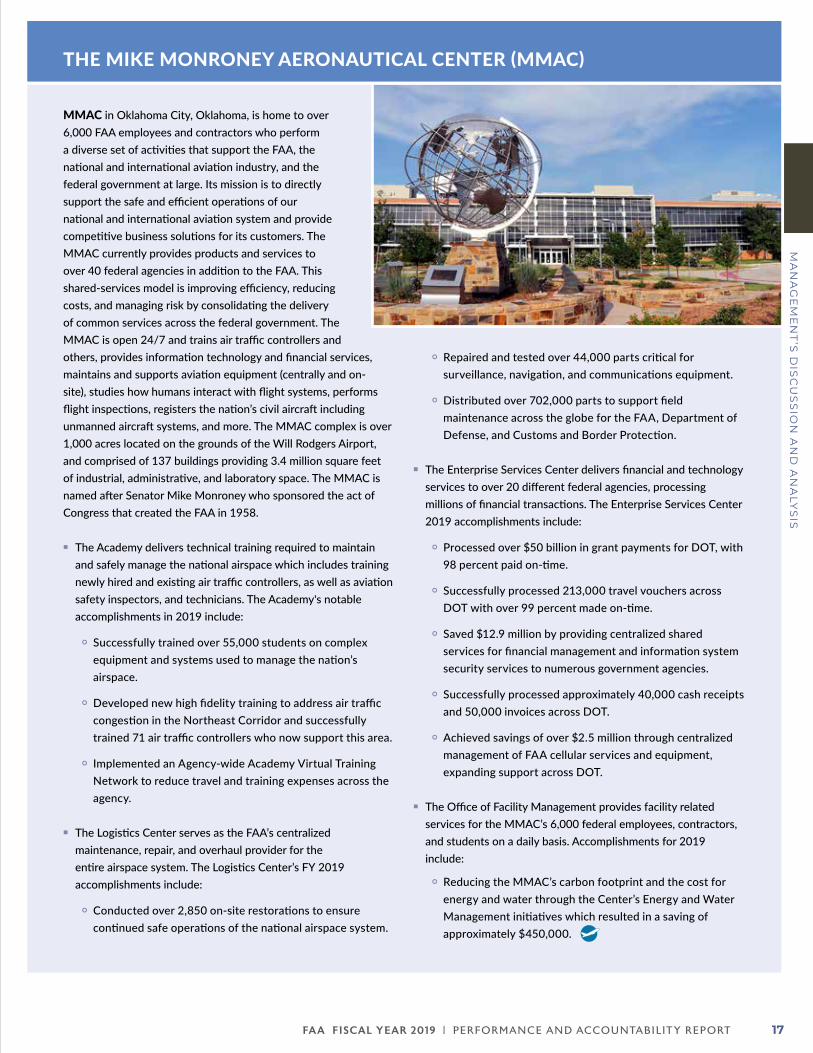
sTHE MIKE MONRONEY AERONAUTICAL CENTER (MMAC)
MMAC in Oklahoma City, Oklahoma, is home to over 6,000 FAA employees and contractors who perform a diverse set of activities that support the FAA, the national and international aviation industry, and the federal government at large. Its mission is to directly support the safe and efficient operations of our national and international aviation system and provide competitive business solutions for its customers. The MMAC currently provides products and services to over 40 federal agencies in addition to the FAA. This shared-services model is improving efficiency, reducing costs, and managing risk by consolidating the delivery of common services across the federal government. The MMAC is open 24/7 and trains air traffic controllers and others, provides information technology and financial services, maintains and supports aviation equipment (centrally and on-site), studies how humans interact with flight systems, performs flight inspections, registers the nation’s civil aircraft including unmanned aircraft systems, and more. The MMAC complex is over 1,000 acres located on the grounds of the Will Rodgers Airport, and comprised of 137 buildings providing 3.4 million square feet of industrial, administrative, and laboratory space. The MMAC is named after Senator Mike Monroney who sponsored the act of Congress that created the FAA in 1958.
z� The Academy delivers technical training required to maintain and safely manage the national airspace which includes training newly hired and existing air traffic controllers, as well as aviation safety inspectors, and technicians. The Academy's notable accomplishments in 2019 include:
z| Successfully trained over 55,000 students on complex equipment and systems used to manage the nation’s airspace.
z| Developed new high fidelity training to address air traffic congestion in the Northeast Corridor and successfully trained 71 air traffic controllers who now support this area.
z| Implemented an Agency-wide Academy Virtual Training Network to reduce travel and training expenses across the agency.
z� The Logistics Center serves as the FAA’s centralized maintenance, repair, and overhaul provider for the entire airspace system. The Logistics Center’s FY 2019 accomplishments include:
z| Conducted over 2,850 on-site restorations to ensure continued safe operations of the national airspace system.
z| Repaired and tested over 44,000 parts critical for surveillance, navigation, and communications equipment.
z| Distributed over 702,000 parts to support field maintenance across the globe for the FAA, Department of Defense, and Customs and Border Protection.
z� The Enterprise Services Center delivers financial and technology services to over 20 different federal agencies, processing millions of financial transactions. The Enterprise Services Center 2019 accomplishments include:
z| Processed over $50 billion in grant payments for DOT, with 98 percent paid on-time.
z| Successfully processed 213,000 travel vouchers across DOT with over 99 percent made on-time.
z| Saved $12.9 million by providing centralized shared services for financial management and information system security services to numerous government agencies.
z| Successfully processed approximately 40,000 cash receipts and 50,000 invoices across DOT.
z| Achieved savings of over $2.5 million through centralized management of FAA cellular services and equipment, expanding support across DOT.
z� The Office of Facility Management provides facility related services for the MMAC’s 6,000 federal employees, contractors, and students on a daily basis. Accomplishments for 2019 include:
z| Reducing the MMAC’s carbon footprint and the cost for energy and water through the Center’s Energy and Water Management initiatives which resulted in a saving of approximately $450,000.
FA A FISCAL YEAR 2019 | PERFORMANCE AND ACCOUNTABILIT Y REPORT18
MA
NA
GE
ME
NT
’S D
ISC
US
SIO
N A
ND
AN
ALY
SIS
ONGOING CHALLENGES
737 MAXThe crash of Lion Air flight JT 610 on October 29, 2018, and Ethiopia Airlines flight 302 on March 10, 2019, placed a spotlight on aviation safety and the FAA’s oversight approach to those we regulate. Safety has always been the core of the FAA’s mission and the agency’s top priority. These two accidents, and the pain and loss suffered by family and friends of those lost in the accidents, underscore the seriousness of our mission.
The FAA has worked tirelessly to take a proactive, data-driven approach to oversight that prioritizes safety above all else inside the FAA and within the aviation community that we regulate. This approach has provided the U.S. with the safest air transportation system in the world. Since 1997, the risk of a fatal commercial aviation accident in the U.S. has been cut by 94 percent. And in the past ten years, there has been one passenger fatality in the U.S. involving a domestic carrier in over 90 million flights. But no fatality is ever acceptable, and a healthy safety culture requires commitment to continuous improvement.
Our focus on continuous improvement has been a conscious effort and process in recent years and has contributed to increased safety. The FAA evolved from a prescriptive and more reactive approach to its safety oversight responsibilities to one that is performance-based, proactive, centered on managing risk, and creating a culture of safety in the aviation community. This approach to safety oversight relies on access to data and requires the open and transparent exchange of information. We know that it takes collaboration, communication, and common safety objectives to allow the FAA and the aviation community to identify system hazards and to implement safety solutions. This approach gives us knowledge that we would not otherwise have about safety events and risks. Sharing safety issues, trends, and lessons learned is critical to recognizing potential risks in the system. The more data we have, the more we can learn about the system, which in turn allows us to better manage, improve, and grow our air transportation system.
It took five years for the FAA to certify the 737 MAX, the aircraft involved in the Lion Air and Ethiopia Airlines crashes. Boeing applied for certification in January 2012, and the certification was completed in March 2017. During those five years, FAA safety engineers and test pilots put in 110,000 hours of work, and they flew or supported 297 test flights. After certification of an aircraft design is completed, the FAA continues oversight of the aircraft's safety when it is operational. As we obtain pertinent information, identify
potential risk, or learn of a system failure, we analyze it, mitigate the risk, update the certification requirements, and require operators to implement the mitigation.
This approach to safety and fact-based, data-driven decision making has been the FAA’s guiding principle in the agency’s response to the Lion Air and Ethiopian Airlines accidents. Once the FAA had data showing similarities between the two accidents that warranted further investigation of the possibility of a shared cause, the FAA made the decision to ground all 737 MAX airplanes operated by U.S. airlines or in U.S. territory, pending further investigation.
After the FAA grounded the 737 MAX, the Secretary of Transportation asked the Department of Transportation’s Inspector General to conduct an audit of the certification for the 737 MAX, with the goal of compiling an objective and detailed factual history of the activities that resulted in the certification of the aircraft. The Secretary also announced the establishment of a special committee to review the FAA’s procedures for the certification of new aircraft, including the 737 MAX. The Special Committee to Review FAA’s Aircraft Certification Process is an independent body whose findings and recommendations will be presented directly to the Secretary and the FAA Administrator.
The FAA also established a Joint Authorities Technical Review (JATR) to conduct a comprehensive review of the certification of the automated flight control system on the 737 MAX. The JATR was chaired by a former chairman of the National Transportation Safety Board, and had a team of experts from the FAA, National Aeronautics and Space Administration (NASA), and the aviation authorities of Australia, Brazil, Canada, China, the European Union, Indonesia, Japan, Singapore, and the United Arab Emirates. The JATR team concluded its review by formally submitting its recommendations, observations, and findings to the FAA on October 11, 2019. The FAA is committed to addressing all of the JATR's recommendations.
Additionally, the FAA met with safety representatives of the three U.S.-based commercial airlines that have the 737 MAX in their fleets, as well as the pilot unions for those airlines. This meeting was an opportunity for the FAA to hear individual views from operators and pilots of the 737 MAX as the agency evaluates what needs to be done before the FAA makes a decision to return the aircraft to service in the United States. In keeping with the FAA’s longstanding cooperation with its international partners, the FAA also hosted a meeting of
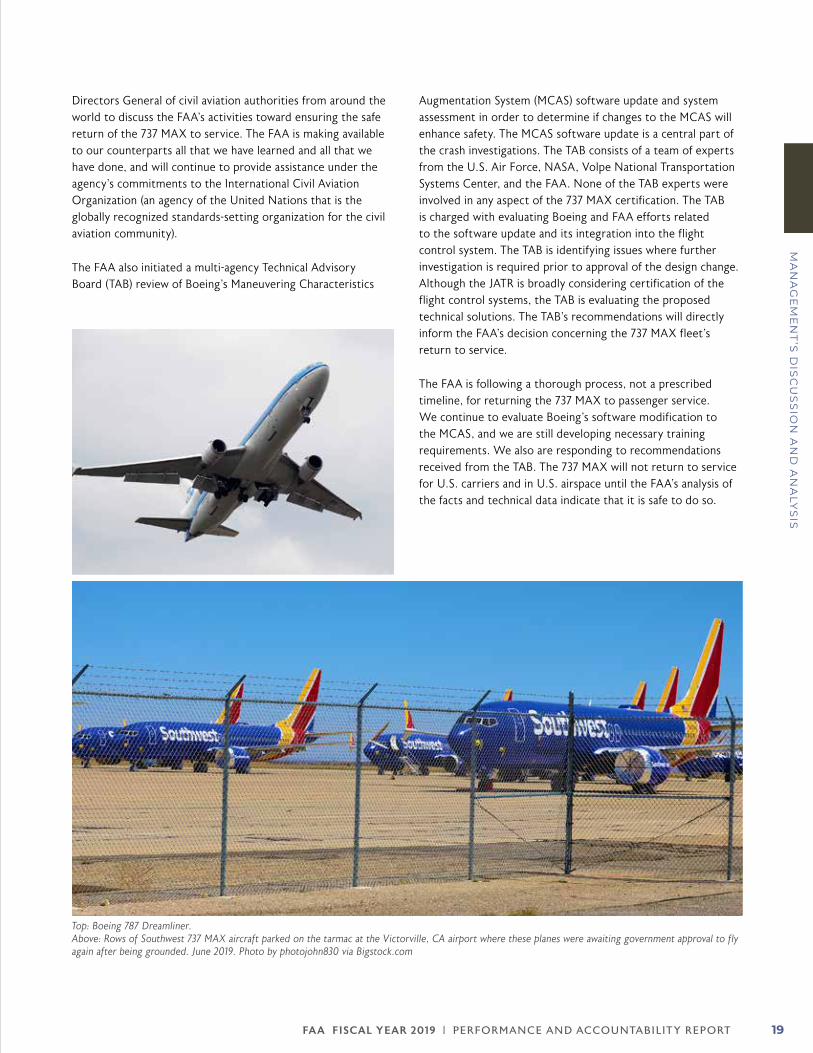
FA A FISCAL YEAR 2019 | PERFORMANCE AND ACCOUNTABILIT Y REPORT 19
MA
NA
GE
ME
NT
’S D
ISC
US
SIO
N A
ND
AN
ALY
SIS
Directors General of civil aviation authorities from around the world to discuss the FAA’s activities toward ensuring the safe return of the 737 MAX to service. The FAA is making available to our counterparts all that we have learned and all that we have done, and will continue to provide assistance under the agency’s commitments to the International Civil Aviation Organization (an agency of the United Nations that is the globally recognized standards-setting organization for the civil aviation community).
The FAA also initiated a multi-agency Technical Advisory Board (TAB) review of Boeing’s Maneuvering Characteristics
Augmentation System (MCAS) software update and system assessment in order to determine if changes to the MCAS will enhance safety. The MCAS software update is a central part of the crash investigations. The TAB consists of a team of experts from the U.S. Air Force, NASA, Volpe National Transportation Systems Center, and the FAA. None of the TAB experts were involved in any aspect of the 737 MAX certification. The TAB is charged with evaluating Boeing and FAA efforts related to the software update and its integration into the flight control system. The TAB is identifying issues where further investigation is required prior to approval of the design change. Although the JATR is broadly considering certification of the flight control systems, the TAB is evaluating the proposed technical solutions. The TAB’s recommendations will directly inform the FAA’s decision concerning the 737 MAX fleet’s return to service.
The FAA is following a thorough process, not a prescribed timeline, for returning the 737 MAX to passenger service. We continue to evaluate Boeing’s software modification to the MCAS, and we are still developing necessary training requirements. We also are responding to recommendations received from the TAB. The 737 MAX will not return to service for U.S. carriers and in U.S. airspace until the FAA’s analysis of the facts and technical data indicate that it is safe to do so.
Top: Boeing 787 Dreamliner. Above: Rows of Southwest 737 MAX aircraft parked on the tarmac at the Victorville, CA airport where these planes were awaiting government approval to fly again after being grounded. June 2019. Photo by photojohn830 via Bigstock.com
FA A FISCAL YEAR 2019 | PERFORMANCE AND ACCOUNTABILIT Y REPORT20
MA
NA
GE
ME
NT
’S D
ISC
US
SIO
N A
ND
AN
ALY
SIS
Workforce of the Future
With increasing retirements and decreasing numbers of new people looking for careers in the aviation industry, the world is facing an aviation workforce shortage. This shortage is particularly acute for pilots and mechanics. While the number of air passengers is expected to double by 2036, the number of commercial pilots has decreased by 19 percent in the last ten years and the number of private pilots holding active airmen certificates has decreased by 22 percent in the same period.
To address this challenge, the FAA sponsored an Aviation Workforce Symposium in September 2018 that brought together government, industry, and academia to begin to identify solutions together. The symposium provided an opportunity to share ideas about attracting young people to a career in aviation, training the newest aviation workers, and building partnerships among government, industry, academic institutions, and military services.
In February 2019, the FAA created an Aviation Workforce Steering Group, an executive-level committee dedicated to building a pipeline of safety professionals that have the right skills to meet the challenges of the aviation and aerospace industry of the 21st century. One of the committee’s goals is to inspire a passion for aviation in diverse populations, including youth, women, minorities, and people with disabilities, and to provide them with clear pathways to aviation careers.
Some early successes of the Aviation Workforce Steering Group include a renewed focus on the Science, Technology, Engineering and Math Aviation and Space Education (STEM AVSED) program. The FAA has already increased the number of STEM AVSED outreach activities by 223 percent since September 2018, and increased the number of registered FAA Volunteers, called STEM AVSED Outreach Representatives, by 155 percent.
Finally, in May 2019, the FAA Administrator signed a cooperative charter with the Secretary of the Air Force to enable the Air Force and the FAA to work with industry partners to share best practices and find ways to enable future aviators to reach their goal of becoming part of an aircrew.
Automatic Dependent Surveillance-Broadcast (ADS-B) Air traffic controllers started to use radar to manage commercial aircraft in 1952. Today the FAA is working on the successor to radar technology with the Automatic Dependent Surveillance — Broadcast (ADS-B) program, a part of the FAA’s NextGen effort to modernize its air traffic control system. ADS-B uses GPS technology to determine the precise location of aircraft, providing air traffic controllers and pilots more frequent and accurate information to help keep aircraft safely separated in the sky and on runways. In comparison to radar, ADS-B provides more accurate aircraft monitoring, and expanded coverage of areas such as the Gulf of Mexico.
ADS-B relies on both ground infrastructure as well as compatible equipment installed on the aircraft. The FAA has mandated that aircraft must be equipped with ADS-B to fly in most controlled airspace by January 1, 2020, at which point the FAA will use ADS-B as the preferred means of tracking aircraft in the national airspace. Implementation by the 2020 deadline has been a challenge because of the number of aircraft that must be equipped with this technology. As of September 2019, more than 90,000 aircraft are equipped with ADS-B. Mainline air carriers are 90 percent equipped and regional carriers are 85 percent equipped. The FAA estimates that aircraft that routinely fly in airspace that requires ADS-B equipage will be equipped in time for the mandate.
The FAA has been working with the aviation community to address barriers to equipage through the Equip 2020 Working Group. This industry partnership was formed in 2014 to rally aircraft operators behind ADS-B technology and help the FAA and industry work together to resolve issues that have been delaying equipage. Key barriers to equipage include the cost of upgrading GPS receivers, the availability of products, and the capacity of repair stations to complete installations. The Equip 2020 effort has addressed many of these issues, such as the need for low-cost avionics solutions. To that end, the FAA offered rebates of $500 to owners of fixed wing, single-engine piston aircraft to help offset the cost of equipping.
The FAA continued outreach efforts during 2019 to encourage owners to equip as soon as possible to capture the benefits of ADS-B and to ensure they will be able to access all available airspace once the mandate becomes effective. The FAA encourages ADS-B equipage through print, video, social media messages, and a comprehensive website that includes answers to frequently asked questions.
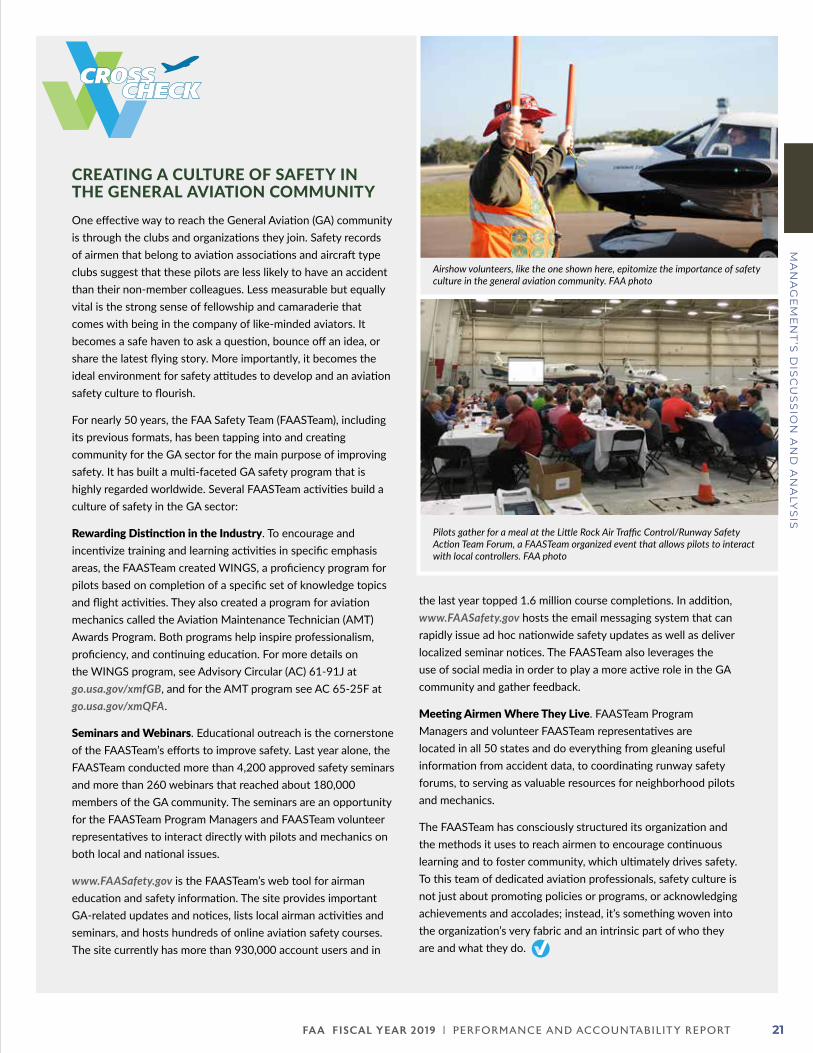
FA A FISCAL YEAR 2019 | PERFORMANCE AND ACCOUNTABILIT Y REPORT 21
MA
NA
GE
ME
NT
’S D
ISC
US
SIO
N A
ND
AN
ALY
SIS
CREATING A CULTURE OF SAFETY IN THE GENERAL AVIATION COMMUNITY One effective way to reach the General Aviation (GA) community is through the clubs and organizations they join. Safety records of airmen that belong to aviation associations and aircraft type clubs suggest that these pilots are less likely to have an accident than their non-member colleagues. Less measurable but equally vital is the strong sense of fellowship and camaraderie that comes with being in the company of like-minded aviators. It becomes a safe haven to ask a question, bounce off an idea, or share the latest flying story. More importantly, it becomes the ideal environment for safety attitudes to develop and an aviation safety culture to flourish.
For nearly 50 years, the FAA Safety Team (FAASTeam), including its previous formats, has been tapping into and creating community for the GA sector for the main purpose of improving safety. It has built a multi-faceted GA safety program that is highly regarded worldwide. Several FAASTeam activities build a culture of safety in the GA sector:
Rewarding Distinction in the Industry. To encourage and incentivize training and learning activities in specific emphasis areas, the FAASTeam created WINGS, a proficiency program for pilots based on completion of a specific set of knowledge topics and flight activities. They also created a program for aviation mechanics called the Aviation Maintenance Technician (AMT) Awards Program. Both programs help inspire professionalism, proficiency, and continuing education. For more details on the WINGS program, see Advisory Circular (AC) 61-91J at go.usa.gov/xmfGB, and for the AMT program see AC 65-25F at go.usa.gov/xmQFA.
Seminars and Webinars. Educational outreach is the cornerstone of the FAASTeam’s efforts to improve safety. Last year alone, the FAASTeam conducted more than 4,200 approved safety seminars and more than 260 webinars that reached about 180,000 members of the GA community. The seminars are an opportunity for the FAASTeam Program Managers and FAASTeam volunteer representatives to interact directly with pilots and mechanics on both local and national issues.
www.FAASafety.gov is the FAASTeam’s web tool for airman education and safety information. The site provides important GA-related updates and notices, lists local airman activities and seminars, and hosts hundreds of online aviation safety courses. The site currently has more than 930,000 account users and in
the last year topped 1.6 million course completions. In addition, www.FAASafety.gov hosts the email messaging system that can rapidly issue ad hoc nationwide safety updates as well as deliver localized seminar notices. The FAASTeam also leverages the use of social media in order to play a more active role in the GA community and gather feedback.
Meeting Airmen Where They Live. FAASTeam Program Managers and volunteer FAASTeam representatives are located in all 50 states and do everything from gleaning useful information from accident data, to coordinating runway safety forums, to serving as valuable resources for neighborhood pilots and mechanics.
The FAASTeam has consciously structured its organization and the methods it uses to reach airmen to encourage continuous learning and to foster community, which ultimately drives safety. To this team of dedicated aviation professionals, safety culture is not just about promoting policies or programs, or acknowledging achievements and accolades; instead, it’s something woven into the organization’s very fabric and an intrinsic part of who they are and what they do.
Airshow volunteers, like the one shown here, epitomize the importance of safety culture in the general aviation community. FAA photo
Pilots gather for a meal at the Little Rock Air Traffic Control/Runway Safety Action Team Forum, a FAASTeam organized event that allows pilots to interact with local controllers. FAA photo
CROSSCHECK
FA A FISCAL YEAR 2019 | PERFORMANCE AND ACCOUNTABILIT Y REPORT22
MA
NA
GE
ME
NT
’S D
ISC
US
SIO
N A
ND
AN
ALY
SIS
PERFORMANCE HIGHLIGHTS
The FAA is charged with promoting the safety and efficiency of the nation’s aerospace system. We maintain the system’s integrity and reliability through our broad authority to enforce safety regulations and conduct oversight of the civil aviation industry. Our strategic plans, annual business plans, human capital plans, annual PARs, and constant reevaluation of our efforts create a recurring cycle of planning, program execution, measurement, verification, and reporting. This cycle has created a strong link between the expenditure of our resources and our performance.
Managing PerformanceWe manage organizational performance through a four-step process that is based on best practices borrowed from several private and public-sector organizations:
zz Set Goals
zz Plan, Work, and Budget
zz Monitor Work
zz Assess Results
Each year we improve on this strategy through adaptation and enhancements of technologies that support the process.
Set GoalsThe first step in the performance management process includes consulting with management, employees, and stakeholders to identify areas to target for improvement. These areas include near-term priorities and long-standing management challenges. Goals, performance measures, targets, and initiatives are laid out in the business plans developed by each of the FAA’s lines of business and staff offices.
Plan, Work, and BudgetThe second step in evaluating our performance focuses on planning, which begins with reviewing the critical activities and resources required to achieve our goals. Budget formulation involves a series of steps that the FAA takes to determine where a program or activity stands at present, where it is going (i.e., reasonable expectations for progress), and what else could be done (i.e., alternative approaches) to achieve stated objectives. One of the basic objectives of the budget formulation process is to ensure that decision-makers have the information they need to determine how best to allocate resources to achieve goals.
Our complete FY 2019 Congressional Justification can be found at: https://www.transportation.gov/mission/budget/faa-fy-2019-budget-estimates.
The FAA also has a section in a DOT-prepared document that provides highlights of the FY 2019 budget request. This document can be found at: https://www.transportation.gov/mission/budget/fiscal-year-2019-budget-highlights.
In addition, our strategic initiatives and FY 2019 business plans for FAA organizations are available at https://www.faa.gov/about/plans_reports/#business_plans.
Monitor WorkMonitoring occurs in the course of the various performance management activities that our executives and employees participate in each month. The agency’s overall governance model was revised in FY 2018 to streamline decision-making at the executive level. The revised model includes two groups — a Management Board and a Deputy’s Meeting.
The Management Board provides agency-wide strategic direction and decision making for critical priorities. This includes setting short and long-term agency goals, as well as making annual budget and financial decisions. The Board is the highest deliberative body in the agency and the primary forum to assist the Administrator in setting the agency’s direction.
The Deputy’s Meeting is the primary forum to advise and assist the Deputy Administrator in monitoring all operational activities conducted by the FAA (e.g., workforce, IT, and air traffic facilities). The Deputy’s Meeting also refers decisions needed on significant internal issues to the Management Board.
PREPARING TO FLY? Visit https://www.faa.gov/travelers/prepare_fly/ before you get to the airport for travel tips, weather and delays, and resources for passengers with disabilities.
ALREADY AT THE AIRPORT? Visit m.faa.gov from your mobile device for up-to-date information on airport status and delays, and the latest news from the FAA.
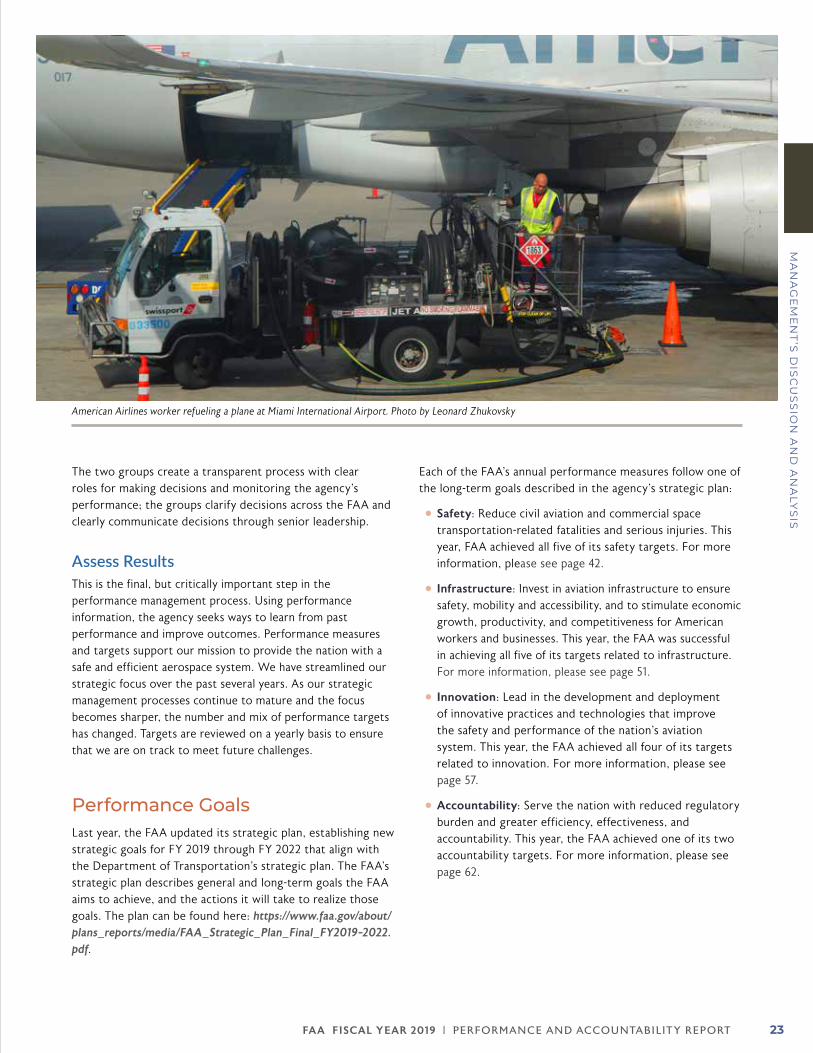
FA A FISCAL YEAR 2019 | PERFORMANCE AND ACCOUNTABILIT Y REPORT 23
MA
NA
GE
ME
NT
’S D
ISC
US
SIO
N A
ND
AN
ALY
SIS
The two groups create a transparent process with clear roles for making decisions and monitoring the agency’s performance; the groups clarify decisions across the FAA and clearly communicate decisions through senior leadership.
Assess ResultsThis is the final, but critically important step in the performance management process. Using performance information, the agency seeks ways to learn from past performance and improve outcomes. Performance measures and targets support our mission to provide the nation with a safe and efficient aerospace system. We have streamlined our strategic focus over the past several years. As our strategic management processes continue to mature and the focus becomes sharper, the number and mix of performance targets has changed. Targets are reviewed on a yearly basis to ensure that we are on track to meet future challenges.
Performance GoalsLast year, the FAA updated its strategic plan, establishing new strategic goals for FY 2019 through FY 2022 that align with the Department of Transportation’s strategic plan. The FAA’s strategic plan describes general and long-term goals the FAA aims to achieve, and the actions it will take to realize those goals. The plan can be found here: https://www.faa.gov/about/plans_reports/media/FAA_Strategic_Plan_Final_FY2019-2022.pdf.
Each of the FAA’s annual performance measures follow one of the long-term goals described in the agency’s strategic plan:
zz Safety: Reduce civil aviation and commercial space transportation-related fatalities and serious injuries. This year, FAA achieved all five of its safety targets. For more information, please see page 42.
zz Infrastructure: Invest in aviation infrastructure to ensure safety, mobility and accessibility, and to stimulate economic growth, productivity, and competitiveness for American workers and businesses. This year, the FAA was successful in achieving all five of its targets related to infrastructure. For more information, please see page 51.
zz Innovation: Lead in the development and deployment of innovative practices and technologies that improve the safety and performance of the nation’s aviation system. This year, the FAA achieved all four of its targets related to innovation. For more information, please see page 57.
zz Accountability: Serve the nation with reduced regulatory burden and greater efficiency, effectiveness, and accountability. This year, the FAA achieved one of its two accountability targets. For more information, please see page 62.
American Airlines worker refueling a plane at Miami International Airport. Photo by Leonard Zhukovsky
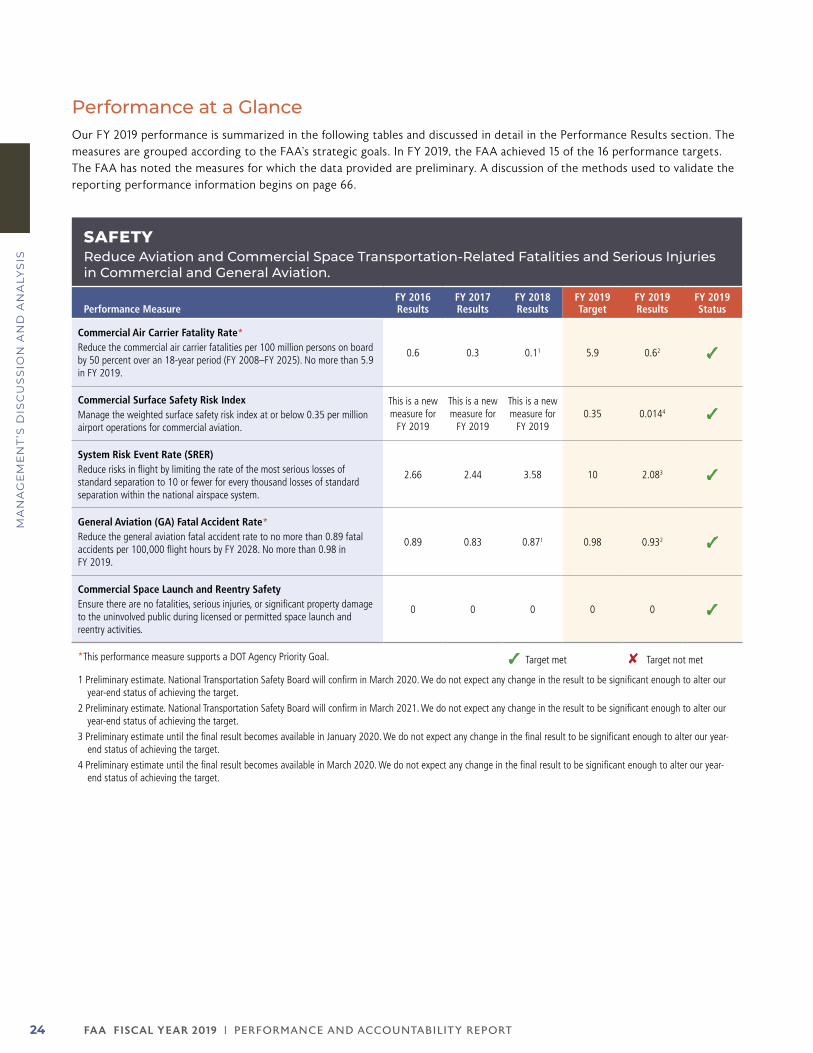
FA A FISCAL YEAR 2019 | PERFORMANCE AND ACCOUNTABILIT Y REPORT24
MA
NA
GE
ME
NT
’S D
ISC
US
SIO
N A
ND
AN
ALY
SIS
Performance at a GlanceOur FY 2019 performance is summarized in the following tables and discussed in detail in the Performance Results section. The measures are grouped according to the FAA’s strategic goals. In FY 2019, the FAA achieved 15 of the 16 performance targets. The FAA has noted the measures for which the data provided are preliminary. A discussion of the methods used to validate the reporting performance information begins on page 66.
SAFETYReduce Aviation and Commercial Space Transportation-Related Fatalities and Serious Injuries in Commercial and General Aviation.
Performance MeasureFY 2016Results
FY 2017Results
FY 2018Results
FY 2019Target
FY 2019Results
FY 2019Status
Commercial Air Carrier Fatality Rate*Reduce the commercial air carrier fatalities per 100 million persons on board by 50 percent over an 18-year period (FY 2008–FY 2025). No more than 5.9 in FY 2019.
0.6 0.3 0.11 5.9 0.62 ✓
Commercial Surface Safety Risk IndexManage the weighted surface safety risk index at or below 0.35 per million airport operations for commercial aviation.
This is a new measure for
FY 2019
This is a new measure for
FY 2019
This is a new measure for
FY 20190.35 0.0144 ✓
System Risk Event Rate (SRER)Reduce risks in flight by limiting the rate of the most serious losses of standard separation to 10 or fewer for every thousand losses of standard separation within the national airspace system.
2.66 2.44 3.58 10 2.083 ✓
General Aviation (GA) Fatal Accident Rate*Reduce the general aviation fatal accident rate to no more than 0.89 fatal accidents per 100,000 flight hours by FY 2028. No more than 0.98 in FY 2019.
0.89 0.83 0.871 0.98 0.932 ✓
Commercial Space Launch and Reentry SafetyEnsure there are no fatalities, serious injuries, or significant property damage to the uninvolved public during licensed or permitted space launch and reentry activities.
0 0 0 0 0 ✓
*This performance measure supports a DOT Agency Priority Goal. ✓ Target met ✘ Target not met
1 Preliminary estimate. National Transportation Safety Board will confirm in March 2020. We do not expect any change in the result to be significant enough to alter our year-end status of achieving the target.
2 Preliminary estimate. National Transportation Safety Board will confirm in March 2021. We do not expect any change in the result to be significant enough to alter our year-end status of achieving the target.
3 Preliminary estimate until the final result becomes available in January 2020. We do not expect any change in the final result to be significant enough to alter our year-end status of achieving the target.
4 Preliminary estimate until the final result becomes available in March 2020. We do not expect any change in the final result to be significant enough to alter our year-end status of achieving the target.
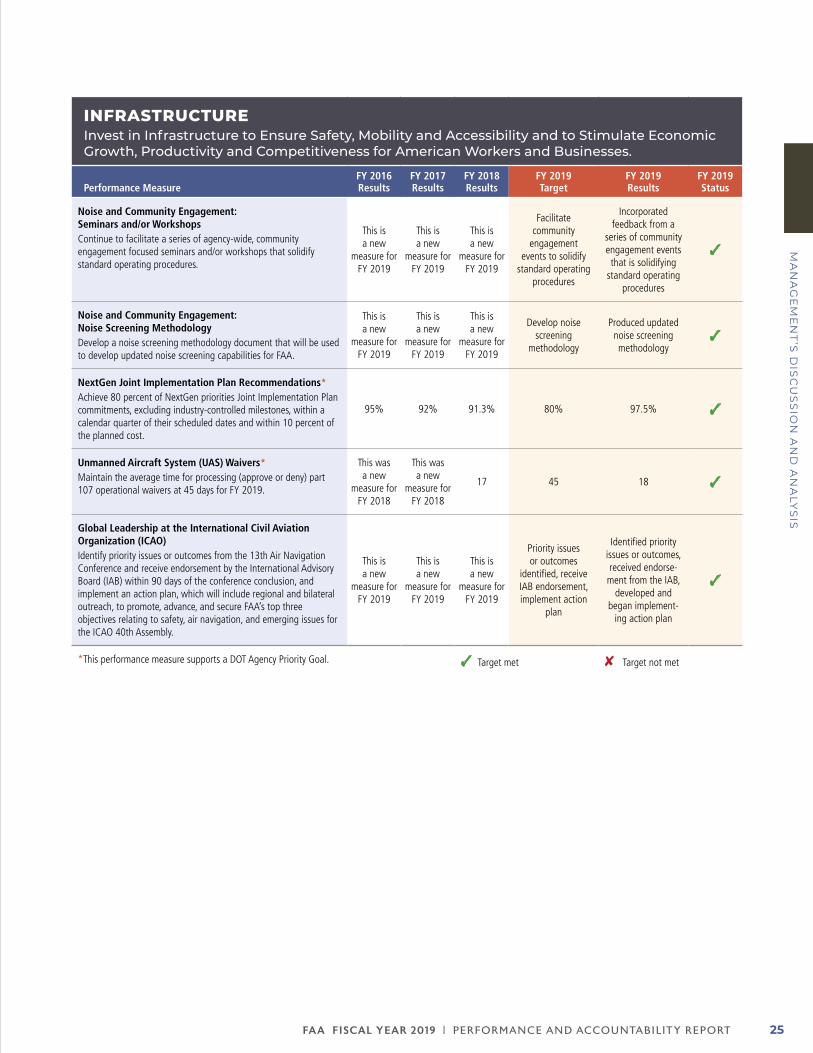
FA A FISCAL YEAR 2019 | PERFORMANCE AND ACCOUNTABILIT Y REPORT 25
MA
NA
GE
ME
NT
’S D
ISC
US
SIO
N A
ND
AN
ALY
SIS
INFRASTRUCTUREInvest in Infrastructure to Ensure Safety, Mobility and Accessibility and to Stimulate Economic Growth, Productivity and Competitiveness for American Workers and Businesses.
Performance MeasureFY 2016Results
FY 2017Results
FY 2018Results
FY 2019Target
FY 2019Results
FY 2019Status
Noise and Community Engagement: Seminars and/or WorkshopsContinue to facilitate a series of agency-wide, community engagement focused seminars and/or workshops that solidify standard operating procedures.
This is a new
measure for FY 2019
This is a new
measure for FY 2019
This is a new
measure for FY 2019
Facilitate community
engagement events to solidify
standard operating procedures
Incorporated feedback from a
series of community engagement events
that is solidifying standard operating
procedures
✓
Noise and Community Engagement: Noise Screening MethodologyDevelop a noise screening methodology document that will be used to develop updated noise screening capabilities for FAA.
This is a new
measure for FY 2019
This is a new
measure for FY 2019
This is a new
measure for FY 2019
Develop noise screening
methodology
Produced updated noise screening methodology
✓
NextGen Joint Implementation Plan Recommendations*Achieve 80 percent of NextGen priorities Joint Implementation Plan commitments, excluding industry-controlled milestones, within a calendar quarter of their scheduled dates and within 10 percent of the planned cost.
95% 92% 91.3% 80% 97.5% ✓
Unmanned Aircraft System (UAS) Waivers*Maintain the average time for processing (approve or deny) part 107 operational waivers at 45 days for FY 2019.
This was a new
measure for FY 2018
This was a new
measure for FY 2018
17 45 18 ✓
Global Leadership at the International Civil Aviation Organization (ICAO)Identify priority issues or outcomes from the 13th Air Navigation Conference and receive endorsement by the International Advisory Board (IAB) within 90 days of the conference conclusion, and implement an action plan, which will include regional and bilateral outreach, to promote, advance, and secure FAA’s top three objectives relating to safety, air navigation, and emerging issues for the ICAO 40th Assembly.
This is a new
measure for FY 2019
This is a new
measure for FY 2019
This is a new
measure for FY 2019
Priority issues or outcomes
identified, receive IAB endorsement, implement action
plan
Identified priority issues or outcomes, received endorse-
ment from the IAB, developed and
began implement-ing action plan
✓
*This performance measure supports a DOT Agency Priority Goal. ✓ Target met ✘ Target not met
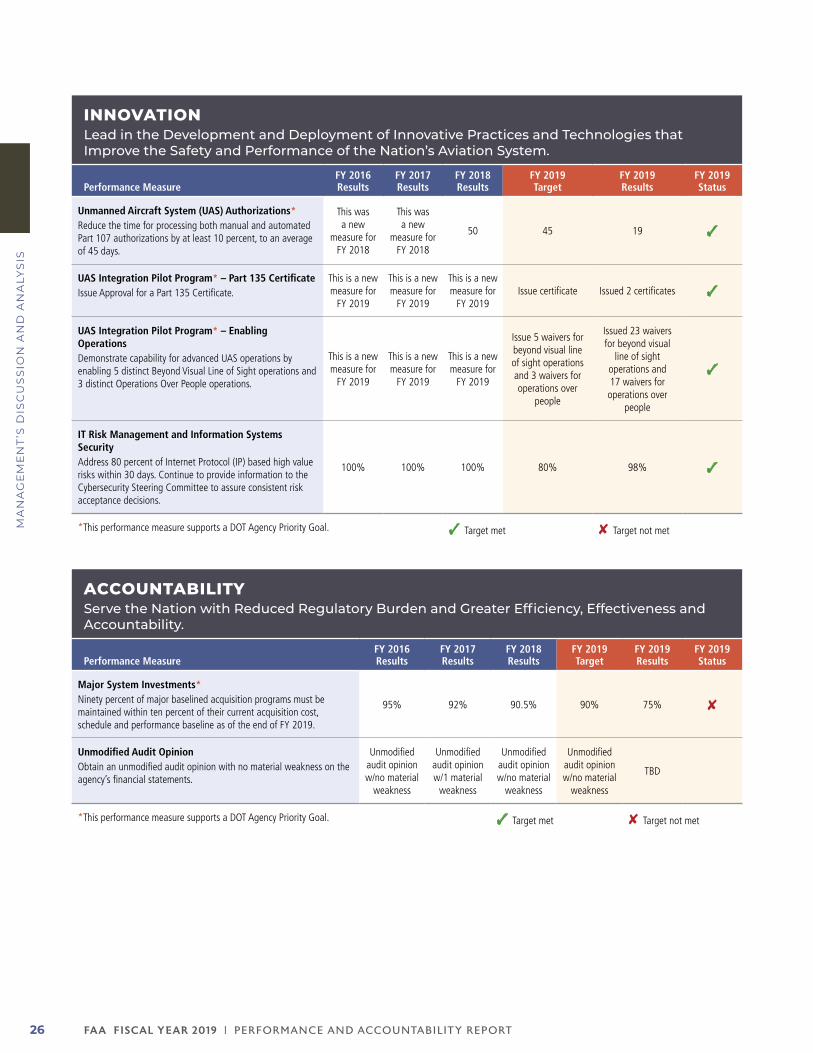
FA A FISCAL YEAR 2019 | PERFORMANCE AND ACCOUNTABILIT Y REPORT26
MA
NA
GE
ME
NT
’S D
ISC
US
SIO
N A
ND
AN
ALY
SIS
INNOVATION Lead in the Development and Deployment of Innovative Practices and Technologies that Improve the Safety and Performance of the Nation’s Aviation System.
Performance MeasureFY 2016Results
FY 2017Results
FY 2018Results
FY 2019Target
FY 2019Results
FY 2019Status
Unmanned Aircraft System (UAS) Authorizations*Reduce the time for processing both manual and automated Part 107 authorizations by at least 10 percent, to an average of 45 days.
This was a new
measure for FY 2018
This was a new
measure for FY 2018
50 45 19 ✓
UAS Integration Pilot Program* – Part 135 CertificateIssue Approval for a Part 135 Certificate.
This is a new measure for
FY 2019
This is a new measure for
FY 2019
This is a new measure for
FY 2019Issue certificate Issued 2 certificates ✓
UAS Integration Pilot Program* – Enabling OperationsDemonstrate capability for advanced UAS operations by enabling 5 distinct Beyond Visual Line of Sight operations and 3 distinct Operations Over People operations.
This is a new measure for
FY 2019
This is a new measure for
FY 2019
This is a new measure for
FY 2019
Issue 5 waivers for beyond visual line of sight operations and 3 waivers for operations over
people
Issued 23 waivers for beyond visual
line of sight operations and 17 waivers for operations over
people
✓
IT Risk Management and Information Systems SecurityAddress 80 percent of Internet Protocol (IP) based high value risks within 30 days. Continue to provide information to the Cybersecurity Steering Committee to assure consistent risk acceptance decisions.
100% 100% 100% 80% 98% ✓
*This performance measure supports a DOT Agency Priority Goal. ✓ Target met ✘ Target not met
ACCOUNTABILITYServe the Nation with Reduced Regulatory Burden and Greater Efficiency, Effectiveness and Accountability.
Performance MeasureFY 2016Results
FY 2017Results
FY 2018Results
FY 2019Target
FY 2019Results
FY 2019Status
Major System Investments*Ninety percent of major baselined acquisition programs must be maintained within ten percent of their current acquisition cost, schedule and performance baseline as of the end of FY 2019.
95% 92% 90.5% 90% 75% ✘
Unmodified Audit Opinion Obtain an unmodified audit opinion with no material weakness on the agency’s financial statements.
Unmodified audit opinion w/no material
weakness
Unmodified audit opinion w/1 material
weakness
Unmodified audit opinion w/no material
weakness
Unmodified audit opinion w/no material
weakness
TBD
*This performance measure supports a DOT Agency Priority Goal. ✓ Target met ✘ Target not met
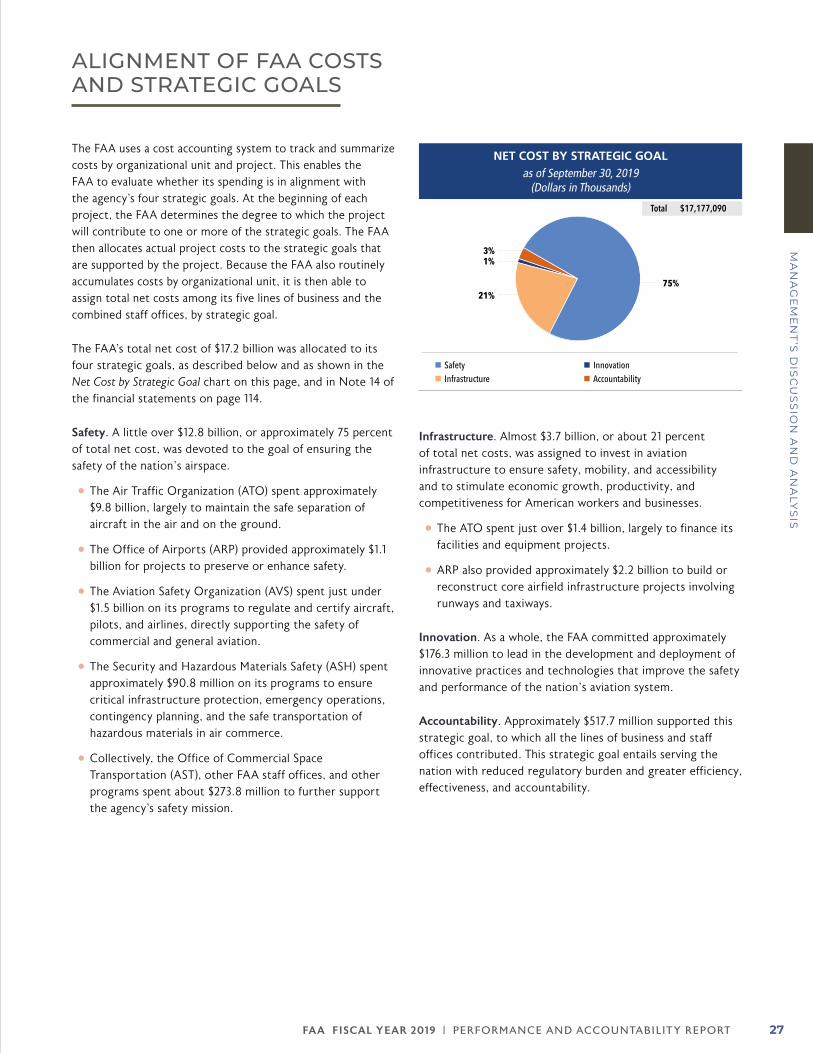
FA A FISCAL YEAR 2019 | PERFORMANCE AND ACCOUNTABILIT Y REPORT 27
MA
NA
GE
ME
NT
’S D
ISC
US
SIO
N A
ND
AN
ALY
SIS
ALIGNMENT OF FAA COSTS AND STRATEGIC GOALS
The FAA uses a cost accounting system to track and summarize costs by organizational unit and project. This enables the FAA to evaluate whether its spending is in alignment with the agency’s four strategic goals. At the beginning of each project, the FAA determines the degree to which the project will contribute to one or more of the strategic goals. The FAA then allocates actual project costs to the strategic goals that are supported by the project. Because the FAA also routinely accumulates costs by organizational unit, it is then able to assign total net costs among its five lines of business and the combined staff offices, by strategic goal.
The FAA’s total net cost of $17.2 billion was allocated to its four strategic goals, as described below and as shown in the Net Cost by Strategic Goal chart on this page, and in Note 14 of the financial statements on page 114.
Safety. A little over $12.8 billion, or approximately 75 percent of total net cost, was devoted to the goal of ensuring the safety of the nation’s airspace.
zz The Air Traffic Organization (ATO) spent approximately $9.8 billion, largely to maintain the safe separation of aircraft in the air and on the ground.
zz The Office of Airports (ARP) provided approximately $1.1 billion for projects to preserve or enhance safety.
zz The Aviation Safety Organization (AVS) spent just under $1.5 billion on its programs to regulate and certify aircraft, pilots, and airlines, directly supporting the safety of commercial and general aviation.
zz The Security and Hazardous Materials Safety (ASH) spent approximately $90.8 million on its programs to ensure critical infrastructure protection, emergency operations, contingency planning, and the safe transportation of hazardous materials in air commerce.
zz Collectively, the Office of Commercial Space Transportation (AST), other FAA staff offices, and other programs spent about $273.8 million to further support the agency’s safety mission.
Infrastructure. Almost $3.7 billion, or about 21 percent of total net costs, was assigned to invest in aviation infrastructure to ensure safety, mobility, and accessibility and to stimulate economic growth, productivity, and competitiveness for American workers and businesses.
zz The ATO spent just over $1.4 billion, largely to finance its facilities and equipment projects.
zz ARP also provided approximately $2.2 billion to build or reconstruct core airfield infrastructure projects involving runways and taxiways.
Innovation. As a whole, the FAA committed approximately $176.3 million to lead in the development and deployment of innovative practices and technologies that improve the safety and performance of the nation’s aviation system.
Accountability. Approximately $517.7 million supported this strategic goal, to which all the lines of business and staff offices contributed. This strategic goal entails serving the nation with reduced regulatory burden and greater efficiency, effectiveness, and accountability.
NET COST BY STRATEGIC GOAL as of September 30, 2019
(Dollars in Thousands)
Safety Infrastructure
Innovation Accountability
75%21%
3%1%
Total $17,177,090
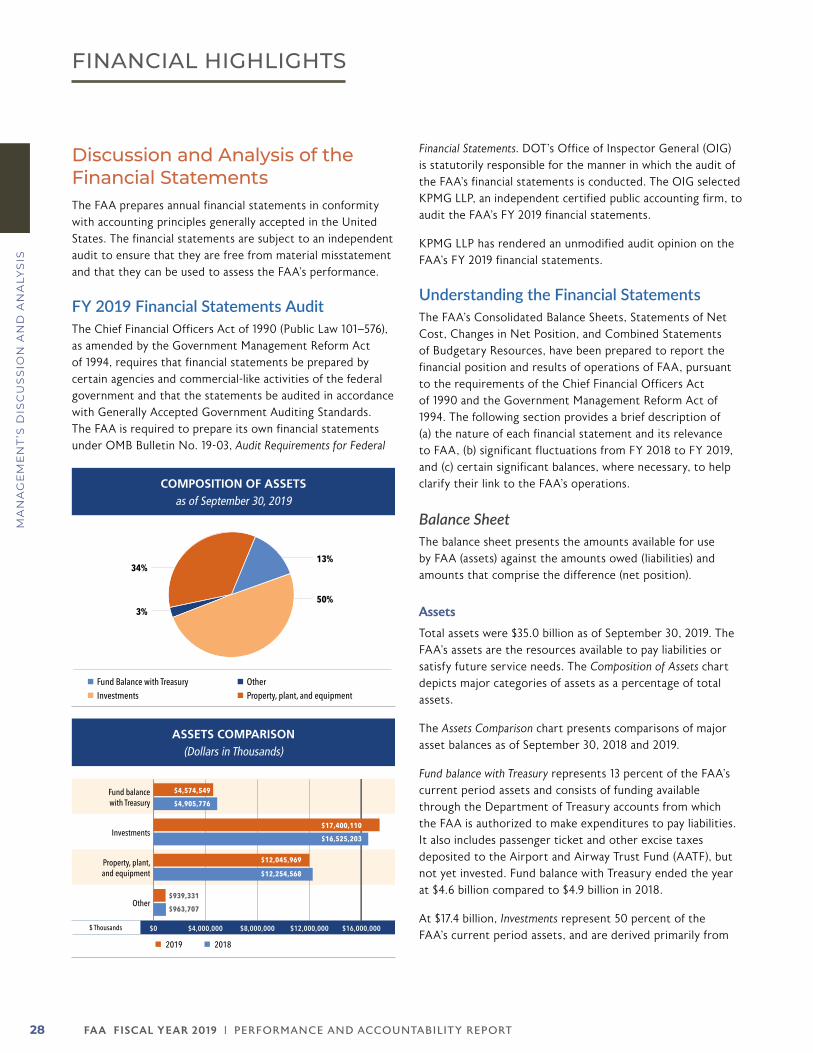
FA A FISCAL YEAR 2019 | PERFORMANCE AND ACCOUNTABILIT Y REPORT28
MA
NA
GE
ME
NT
’S D
ISC
US
SIO
N A
ND
AN
ALY
SIS
FINANCIAL HIGHLIGHTS
Discussion and Analysis of the Financial StatementsThe FAA prepares annual financial statements in conformity with accounting principles generally accepted in the United States. The financial statements are subject to an independent audit to ensure that they are free from material misstatement and that they can be used to assess the FAA’s performance.
FY 2019 Financial Statements AuditThe Chief Financial Officers Act of 1990 (Public Law 101–576), as amended by the Government Management Reform Act of 1994, requires that financial statements be prepared by certain agencies and commercial-like activities of the federal government and that the statements be audited in accordance with Generally Accepted Government Auditing Standards. The FAA is required to prepare its own financial statements under OMB Bulletin No. 19-03, Audit Requirements for Federal
Financial Statements. DOT’s Office of Inspector General (OIG) is statutorily responsible for the manner in which the audit of the FAA’s financial statements is conducted. The OIG selected KPMG LLP, an independent certified public accounting firm, to audit the FAA’s FY 2019 financial statements.
KPMG LLP has rendered an unmodified audit opinion on the FAA’s FY 2019 financial statements.
Understanding the Financial StatementsThe FAA’s Consolidated Balance Sheets, Statements of Net Cost, Changes in Net Position, and Combined Statements of Budgetary Resources, have been prepared to report the financial position and results of operations of FAA, pursuant to the requirements of the Chief Financial Officers Act of 1990 and the Government Management Reform Act of 1994. The following section provides a brief description of (a) the nature of each financial statement and its relevance to FAA, (b) significant fluctuations from FY 2018 to FY 2019, and (c) certain significant balances, where necessary, to help clarify their link to the FAA’s operations.
Balance SheetThe balance sheet presents the amounts available for use by FAA (assets) against the amounts owed (liabilities) and amounts that comprise the difference (net position).
Assets
Total assets were $35.0 billion as of September 30, 2019. The FAA’s assets are the resources available to pay liabilities or satisfy future service needs. The Composition of Assets chart depicts major categories of assets as a percentage of total assets.
The Assets Comparison chart presents comparisons of major asset balances as of September 30, 2018 and 2019.
Fund balance with Treasury represents 13 percent of the FAA’s current period assets and consists of funding available through the Department of Treasury accounts from which the FAA is authorized to make expenditures to pay liabilities. It also includes passenger ticket and other excise taxes deposited to the Airport and Airway Trust Fund (AATF), but not yet invested. Fund balance with Treasury ended the year at $4.6 billion compared to $4.9 billion in 2018.
At $17.4 billion, Investments represent 50 percent of the FAA’s current period assets, and are derived primarily from
COMPOSITION OF ASSETS as of September 30, 2019
Fund Balance with Treasury Investments
Other Property, plant, and equipment
13%
50%3%
34%
ASSETS COMPARISON (Dollars in Thousands)
2019 2018
$ Thousands $0 $4,000,000 $8,000,000 $12,000,000 $16,000,000
Other
Property, plant,and equipment
Investments
Fund balancewith Treasury
$939,331
$963,707
$12,045,969
$12,254,568
$4,574,549
$4,905,776
$17,400,110
$16,525,203
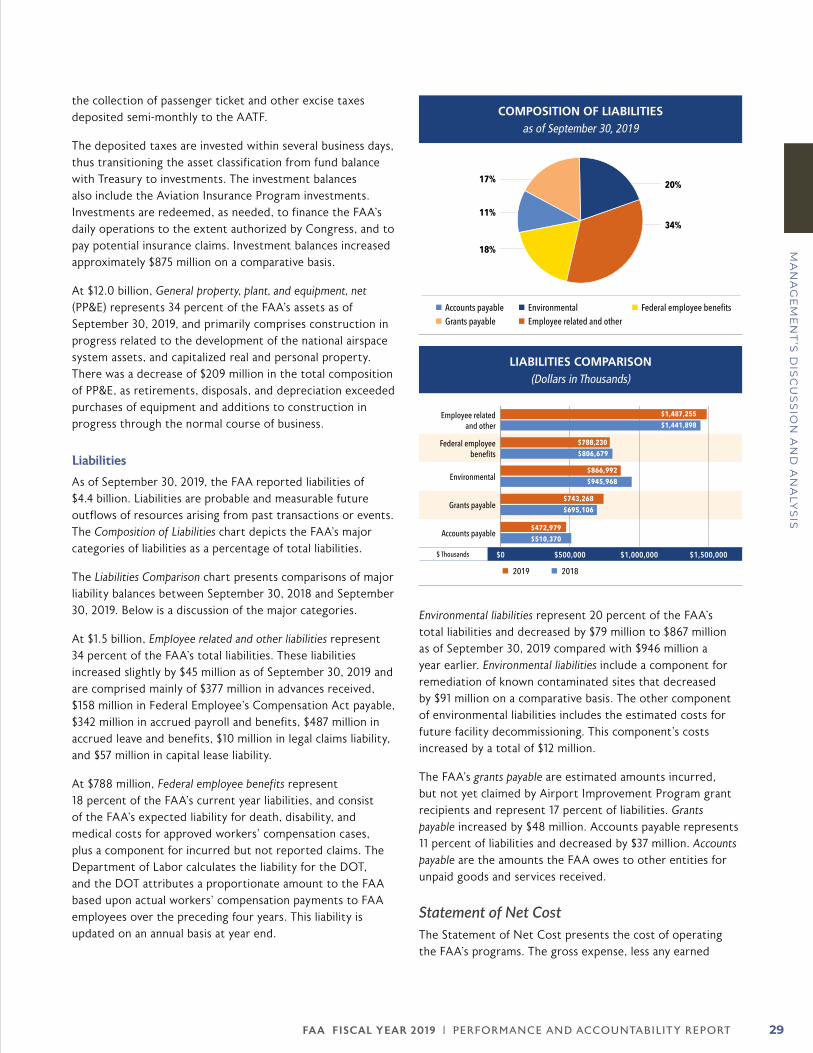
FA A FISCAL YEAR 2019 | PERFORMANCE AND ACCOUNTABILIT Y REPORT 29
MA
NA
GE
ME
NT
’S D
ISC
US
SIO
N A
ND
AN
ALY
SIS
the collection of passenger ticket and other excise taxes deposited semi-monthly to the AATF.
The deposited taxes are invested within several business days, thus transitioning the asset classification from fund balance with Treasury to investments. The investment balances also include the Aviation Insurance Program investments. Investments are redeemed, as needed, to finance the FAA’s daily operations to the extent authorized by Congress, and to pay potential insurance claims. Investment balances increased approximately $875 million on a comparative basis.
At $12.0 billion, General property, plant, and equipment, net (PP&E) represents 34 percent of the FAA’s assets as of September 30, 2019, and primarily comprises construction in progress related to the development of the national airspace system assets, and capitalized real and personal property. There was a decrease of $209 million in the total composition of PP&E, as retirements, disposals, and depreciation exceeded purchases of equipment and additions to construction in progress through the normal course of business.
Liabilities
As of September 30, 2019, the FAA reported liabilities of $4.4 billion. Liabilities are probable and measurable future outflows of resources arising from past transactions or events. The Composition of Liabilities chart depicts the FAA’s major categories of liabilities as a percentage of total liabilities.
The Liabilities Comparison chart presents comparisons of major liability balances between September 30, 2018 and September 30, 2019. Below is a discussion of the major categories.
At $1.5 billion, Employee related and other liabilities represent 34 percent of the FAA’s total liabilities. These liabilities increased slightly by $45 million as of September 30, 2019 and are comprised mainly of $377 million in advances received, $158 million in Federal Employee’s Compensation Act payable, $342 million in accrued payroll and benefits, $487 million in accrued leave and benefits, $10 million in legal claims liability, and $57 million in capital lease liability.
At $788 million, Federal employee benefits represent 18 percent of the FAA’s current year liabilities, and consist of the FAA’s expected liability for death, disability, and medical costs for approved workers’ compensation cases, plus a component for incurred but not reported claims. The Department of Labor calculates the liability for the DOT, and the DOT attributes a proportionate amount to the FAA based upon actual workers’ compensation payments to FAA employees over the preceding four years. This liability is updated on an annual basis at year end.
Environmental liabilities represent 20 percent of the FAA’s total liabilities and decreased by $79 million to $867 million as of September 30, 2019 compared with $946 million a year earlier. Environmental liabilities include a component for remediation of known contaminated sites that decreased by $91 million on a comparative basis. The other component of environmental liabilities includes the estimated costs for future facility decommissioning. This component’s costs increased by a total of $12 million.
The FAA’s grants payable are estimated amounts incurred, but not yet claimed by Airport Improvement Program grant recipients and represent 17 percent of liabilities. Grants payable increased by $48 million. Accounts payable represents 11 percent of liabilities and decreased by $37 million. Accounts payable are the amounts the FAA owes to other entities for unpaid goods and services received.
Statement of Net CostThe Statement of Net Cost presents the cost of operating the FAA’s programs. The gross expense, less any earned
COMPOSITION OF LIABILITIES as of September 30, 2019
Accounts payable Grants payable
Environmental Employee related and other
20%
34%
18%
17%
11%
Federal employee benefits
LIABILITIES COMPARISON (Dollars in Thousands)
2019 2018
$ Thousands $0 $500,000 $1,000,000 $1,500,000
Accounts payable
Grants payable
Environmental
Federal employee benefits
Employee related and other
$472,979
$510,370
$743,268
$695,106
$866,992
$945,968
$1,487,255
$1,441,898
$788,230
$806,679
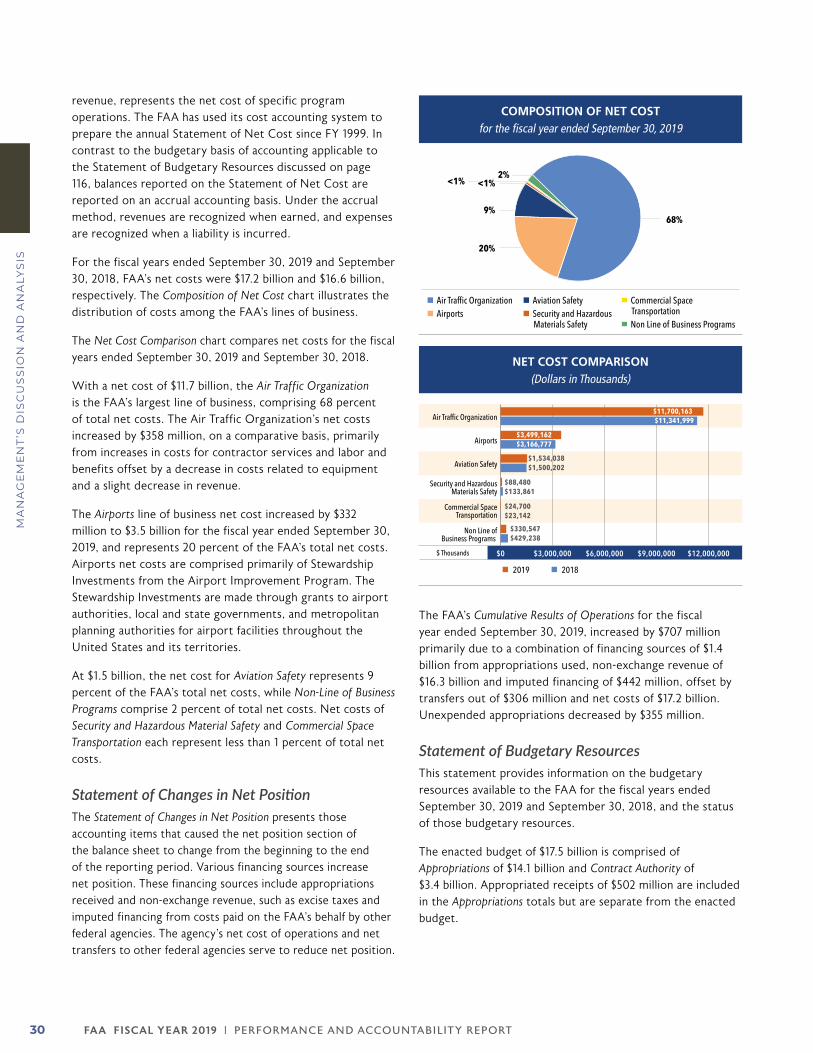
FA A FISCAL YEAR 2019 | PERFORMANCE AND ACCOUNTABILIT Y REPORT30
MA
NA
GE
ME
NT
’S D
ISC
US
SIO
N A
ND
AN
ALY
SIS
revenue, represents the net cost of specific program operations. The FAA has used its cost accounting system to prepare the annual Statement of Net Cost since FY 1999. In contrast to the budgetary basis of accounting applicable to the Statement of Budgetary Resources discussed on page 116, balances reported on the Statement of Net Cost are reported on an accrual accounting basis. Under the accrual method, revenues are recognized when earned, and expenses are recognized when a liability is incurred.
For the fiscal years ended September 30, 2019 and September 30, 2018, FAA’s net costs were $17.2 billion and $16.6 billion, respectively. The Composition of Net Cost chart illustrates the distribution of costs among the FAA’s lines of business.
The Net Cost Comparison chart compares net costs for the fiscal years ended September 30, 2019 and September 30, 2018.
With a net cost of $11.7 billion, the Air Traffic Organization is the FAA’s largest line of business, comprising 68 percent of total net costs. The Air Traffic Organization’s net costs increased by $358 million, on a comparative basis, primarily from increases in costs for contractor services and labor and benefits offset by a decrease in costs related to equipment and a slight decrease in revenue.
The Airports line of business net cost increased by $332 million to $3.5 billion for the fiscal year ended September 30, 2019, and represents 20 percent of the FAA’s total net costs. Airports net costs are comprised primarily of Stewardship Investments from the Airport Improvement Program. The Stewardship Investments are made through grants to airport authorities, local and state governments, and metropolitan planning authorities for airport facilities throughout the United States and its territories.
At $1.5 billion, the net cost for Aviation Safety represents 9 percent of the FAA’s total net costs, while Non-Line of Business Programs comprise 2 percent of total net costs. Net costs of Security and Hazardous Material Safety and Commercial Space Transportation each represent less than 1 percent of total net costs.
Statement of Changes in Net PositionThe Statement of Changes in Net Position presents those accounting items that caused the net position section of the balance sheet to change from the beginning to the end of the reporting period. Various financing sources increase net position. These financing sources include appropriations received and non-exchange revenue, such as excise taxes and imputed financing from costs paid on the FAA’s behalf by other federal agencies. The agency’s net cost of operations and net transfers to other federal agencies serve to reduce net position.
The FAA’s Cumulative Results of Operations for the fiscal year ended September 30, 2019, increased by $707 million primarily due to a combination of financing sources of $1.4 billion from appropriations used, non-exchange revenue of $16.3 billion and imputed financing of $442 million, offset by transfers out of $306 million and net costs of $17.2 billion. Unexpended appropriations decreased by $355 million.
Statement of Budgetary ResourcesThis statement provides information on the budgetary resources available to the FAA for the fiscal years ended September 30, 2019 and September 30, 2018, and the status of those budgetary resources.
The enacted budget of $17.5 billion is comprised of Appropriations of $14.1 billion and Contract Authority of $3.4 billion. Appropriated receipts of $502 million are included in the Appropriations totals but are separate from the enacted budget.
COMPOSITION OF NET COST for the fiscal year ended September 30, 2019
Air Traffic Organization Airports
Aviation Safety Security and Hazardous
Materials Safety
68%
20%
9%
<1% 2%
<1%
Commercial Space Transportation
Non Line of Business Programs
NET COST COMPARISON (Dollars in Thousands)
2019 2018
$ Thousands $0 $3,000,000 $6,000,000 $9,000,000 $12,000,000
Non Line of Business Programs
Commercial Space Transportation
Security and Hazardous Materials Safety
Aviation Safety
Airports
Air Traffic Organization
$1,534,038 $1,500,202
$88,480 $133,861
$24,700 $23,142
$330,547 $429,238
$11,700,163 $11,341,999
$3,499,162 $3,166,777
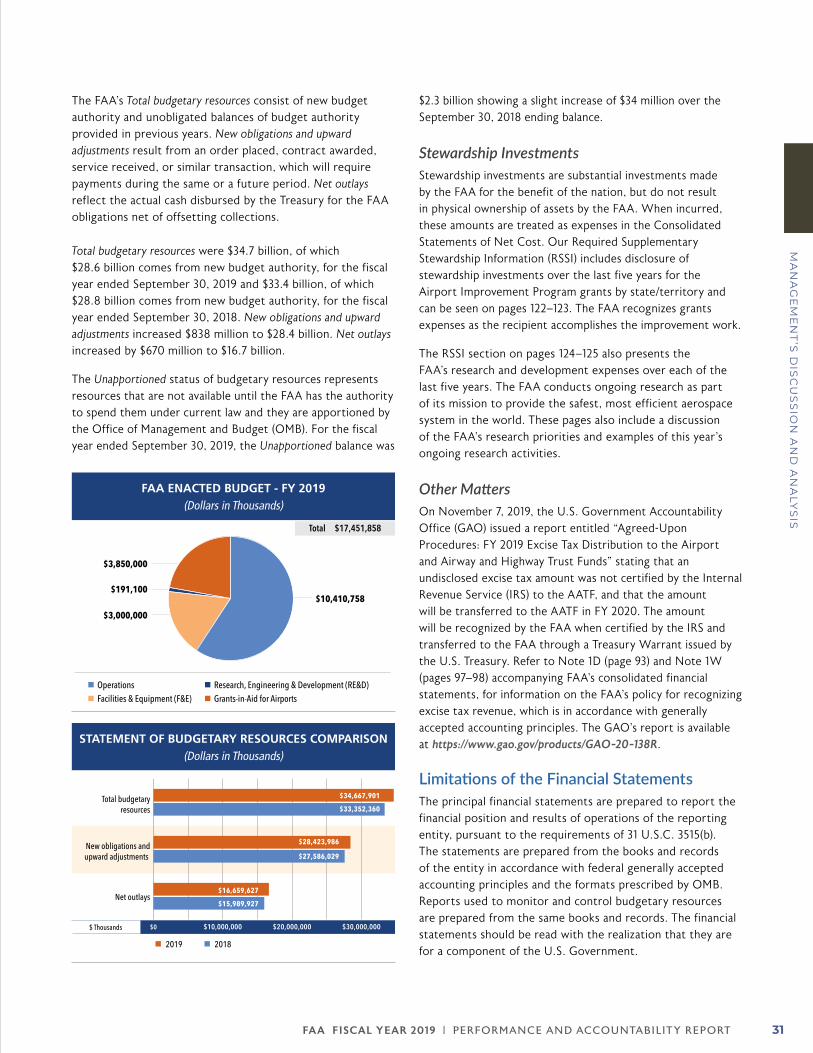
FA A FISCAL YEAR 2019 | PERFORMANCE AND ACCOUNTABILIT Y REPORT 31
MA
NA
GE
ME
NT
’S D
ISC
US
SIO
N A
ND
AN
ALY
SIS
The FAA’s Total budgetary resources consist of new budget authority and unobligated balances of budget authority provided in previous years. New obligations and upward adjustments result from an order placed, contract awarded, service received, or similar transaction, which will require payments during the same or a future period. Net outlays reflect the actual cash disbursed by the Treasury for the FAA obligations net of offsetting collections.
Total budgetary resources were $34.7 billion, of which $28.6 billion comes from new budget authority, for the fiscal year ended September 30, 2019 and $33.4 billion, of which $28.8 billion comes from new budget authority, for the fiscal year ended September 30, 2018. New obligations and upward adjustments increased $838 million to $28.4 billion. Net outlays increased by $670 million to $16.7 billion.
The Unapportioned status of budgetary resources represents resources that are not available until the FAA has the authority to spend them under current law and they are apportioned by the Office of Management and Budget (OMB). For the fiscal year ended September 30, 2019, the Unapportioned balance was
$2.3 billion showing a slight increase of $34 million over the September 30, 2018 ending balance.
Stewardship InvestmentsStewardship investments are substantial investments made by the FAA for the benefit of the nation, but do not result in physical ownership of assets by the FAA. When incurred, these amounts are treated as expenses in the Consolidated Statements of Net Cost. Our Required Supplementary Stewardship Information (RSSI) includes disclosure of stewardship investments over the last five years for the Airport Improvement Program grants by state/territory and can be seen on pages 122–123. The FAA recognizes grants expenses as the recipient accomplishes the improvement work.
The RSSI section on pages 124–125 also presents the FAA’s research and development expenses over each of the last five years. The FAA conducts ongoing research as part of its mission to provide the safest, most efficient aerospace system in the world. These pages also include a discussion of the FAA’s research priorities and examples of this year’s ongoing research activities.
Other MattersOn November 7, 2019, the U.S. Government Accountability Office (GAO) issued a report entitled “Agreed-Upon Procedures: FY 2019 Excise Tax Distribution to the Airport and Airway and Highway Trust Funds” stating that an undisclosed excise tax amount was not certified by the Internal Revenue Service (IRS) to the AATF, and that the amount will be transferred to the AATF in FY 2020. The amount will be recognized by the FAA when certified by the IRS and transferred to the FAA through a Treasury Warrant issued by the U.S. Treasury. Refer to Note 1D (page 93) and Note 1W (pages 97–98) accompanying FAA’s consolidated financial statements, for information on the FAA’s policy for recognizing excise tax revenue, which is in accordance with generally accepted accounting principles. The GAO’s report is available at https://www.gao.gov/products/GAO-20-138R.
Limitations of the Financial StatementsThe principal financial statements are prepared to report the financial position and results of operations of the reporting entity, pursuant to the requirements of 31 U.S.C. 3515(b). The statements are prepared from the books and records of the entity in accordance with federal generally accepted accounting principles and the formats prescribed by OMB. Reports used to monitor and control budgetary resources are prepared from the same books and records. The financial statements should be read with the realization that they are for a component of the U.S. Government.
FAA ENACTED BUDGET - FY 2019 (Dollars in Thousands)
Operations Facilities & Equipment (F&E)
Research, Engineering & Development (RE&D) Grants-in-Aid for Airports
$10,410,758
$3,000,000
$191,100
$3,850,000
Total $17,451,858
STATEMENT OF BUDGETARY RESOURCES COMPARISON (Dollars in Thousands)
2019 2018
$ Thousands $0 $10,000,000 $20,000,000 $30,000,000
Net outlays
New obligations and upward adjustments
Total budgetary resources
$16,659,627
$15,989,927
$34,667,901
$33,352,360
$28,423,986
$27,586,029
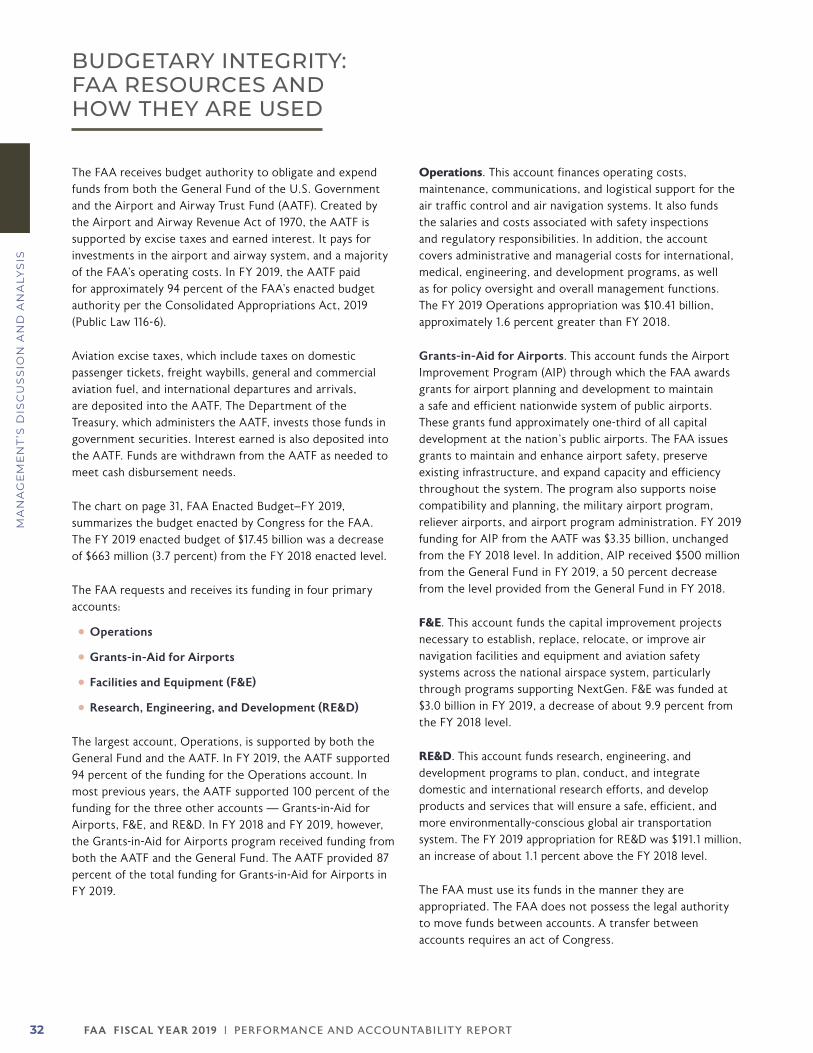
FA A FISCAL YEAR 2019 | PERFORMANCE AND ACCOUNTABILIT Y REPORT32
MA
NA
GE
ME
NT
’S D
ISC
US
SIO
N A
ND
AN
ALY
SIS
BUDGETARY INTEGRITY: FAA RESOURCES AND HOW THEY ARE USED
The FAA receives budget authority to obligate and expend funds from both the General Fund of the U.S. Government and the Airport and Airway Trust Fund (AATF). Created by the Airport and Airway Revenue Act of 1970, the AATF is supported by excise taxes and earned interest. It pays for investments in the airport and airway system, and a majority of the FAA’s operating costs. In FY 2019, the AATF paid for approximately 94 percent of the FAA’s enacted budget authority per the Consolidated Appropriations Act, 2019 (Public Law 116-6).
Aviation excise taxes, which include taxes on domestic passenger tickets, freight waybills, general and commercial aviation fuel, and international departures and arrivals, are deposited into the AATF. The Department of the Treasury, which administers the AATF, invests those funds in government securities. Interest earned is also deposited into the AATF. Funds are withdrawn from the AATF as needed to meet cash disbursement needs.
The chart on page 31, FAA Enacted Budget–FY 2019, summarizes the budget enacted by Congress for the FAA. The FY 2019 enacted budget of $17.45 billion was a decrease of $663 million (3.7 percent) from the FY 2018 enacted level.
The FAA requests and receives its funding in four primary accounts:
zz Operations
zz Grants-in-Aid for Airports
zz Facilities and Equipment (F&E)
zz Research, Engineering, and Development (RE&D)
The largest account, Operations, is supported by both the General Fund and the AATF. In FY 2019, the AATF supported 94 percent of the funding for the Operations account. In most previous years, the AATF supported 100 percent of the funding for the three other accounts — Grants-in-Aid for Airports, F&E, and RE&D. In FY 2018 and FY 2019, however, the Grants-in-Aid for Airports program received funding from both the AATF and the General Fund. The AATF provided 87 percent of the total funding for Grants-in-Aid for Airports in FY 2019.
Operations. This account finances operating costs, maintenance, communications, and logistical support for the air traffic control and air navigation systems. It also funds the salaries and costs associated with safety inspections and regulatory responsibilities. In addition, the account covers administrative and managerial costs for international, medical, engineering, and development programs, as well as for policy oversight and overall management functions. The FY 2019 Operations appropriation was $10.41 billion, approximately 1.6 percent greater than FY 2018.
Grants-in-Aid for Airports. This account funds the Airport Improvement Program (AIP) through which the FAA awards grants for airport planning and development to maintain a safe and efficient nationwide system of public airports. These grants fund approximately one-third of all capital development at the nation’s public airports. The FAA issues grants to maintain and enhance airport safety, preserve existing infrastructure, and expand capacity and efficiency throughout the system. The program also supports noise compatibility and planning, the military airport program, reliever airports, and airport program administration. FY 2019 funding for AIP from the AATF was $3.35 billion, unchanged from the FY 2018 level. In addition, AIP received $500 million from the General Fund in FY 2019, a 50 percent decrease from the level provided from the General Fund in FY 2018.
F&E. This account funds the capital improvement projects necessary to establish, replace, relocate, or improve air navigation facilities and equipment and aviation safety systems across the national airspace system, particularly through programs supporting NextGen. F&E was funded at $3.0 billion in FY 2019, a decrease of about 9.9 percent from the FY 2018 level.
RE&D. This account funds research, engineering, and development programs to plan, conduct, and integrate domestic and international research efforts, and develop products and services that will ensure a safe, efficient, and more environmentally-conscious global air transportation system. The FY 2019 appropriation for RE&D was $191.1 million, an increase of about 1.1 percent above the FY 2018 level.
The FAA must use its funds in the manner they are appropriated. The FAA does not possess the legal authority to move funds between accounts. A transfer between accounts requires an act of Congress.
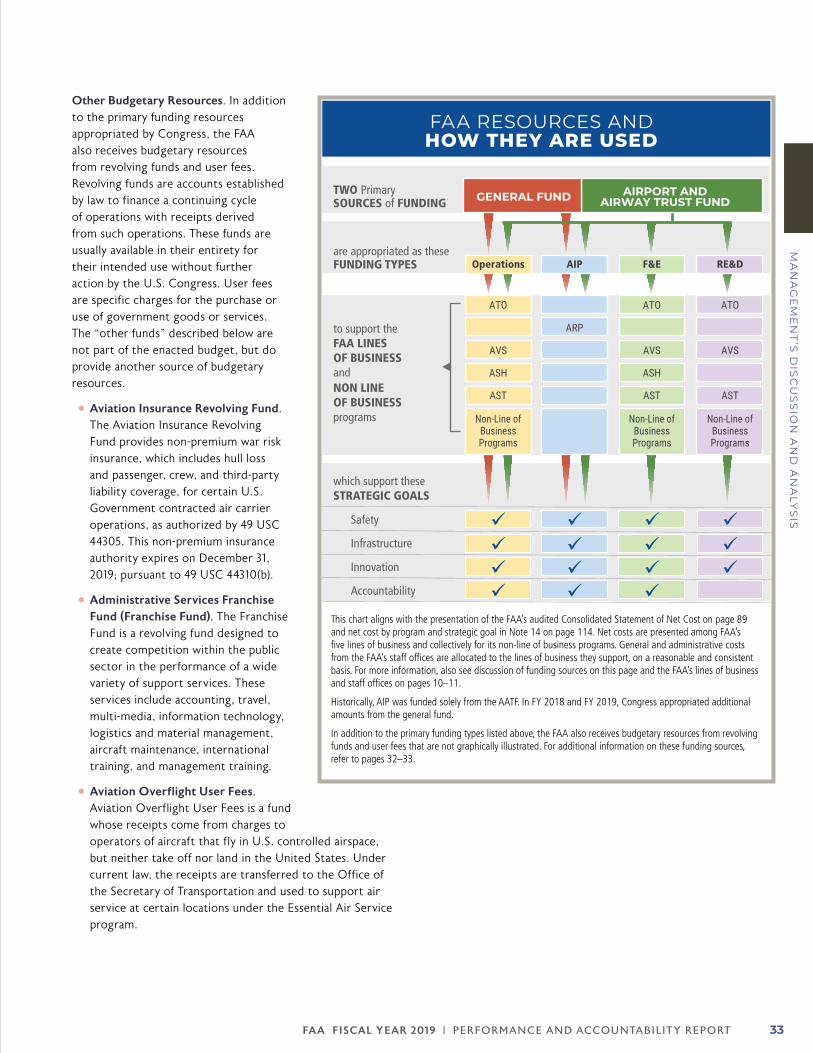
FA A FISCAL YEAR 2019 | PERFORMANCE AND ACCOUNTABILIT Y REPORT 33
MA
NA
GE
ME
NT
’S D
ISC
US
SIO
N A
ND
AN
ALY
SIS
Other Budgetary Resources. In addition to the primary funding resources appropriated by Congress, the FAA also receives budgetary resources from revolving funds and user fees. Revolving funds are accounts established by law to finance a continuing cycle of operations with receipts derived from such operations. These funds are usually available in their entirety for their intended use without further action by the U.S. Congress. User fees are specific charges for the purchase or use of government goods or services. The “other funds” described below are not part of the enacted budget, but do provide another source of budgetary resources.
zz Aviation Insurance Revolving Fund. The Aviation Insurance Revolving Fund provides non-premium war risk insurance, which includes hull loss and passenger, crew, and third-party liability coverage, for certain U.S. Government contracted air carrier operations, as authorized by 49 USC 44305. This non-premium insurance authority expires on December 31, 2019; pursuant to 49 USC 44310(b).
zz Administrative Services Franchise Fund (Franchise Fund). The Franchise Fund is a revolving fund designed to create competition within the public sector in the performance of a wide variety of support services. These services include accounting, travel, multi-media, information technology, logistics and material management, aircraft maintenance, international training, and management training.
zz Aviation Overflight User Fees. Aviation Overflight User Fees is a fund whose receipts come from charges to operators of aircraft that fly in U.S. controlled airspace, but neither take off nor land in the United States. Under current law, the receipts are transferred to the Office of the Secretary of Transportation and used to support air service at certain locations under the Essential Air Service program.
FAA RESOURCES AND HOW THEY ARE USED
Operations AIP F&E RE&D
ATO ATO ATO
ARP
AVSAVS
ASH
AST
AVS
AST
ASH
AST
are appropriated as these FUNDING TYPES
Non-Line of Business Programs
Non-Line of Business Programs
Non-Line of Business Programs
to support the FAA LINES OF BUSINESS and NON LINE OF BUSINESS programs
which support these STRATEGIC GOALS
Safety
Infrastructure
Innovation
Accountability
GENERAL FUND AIRPORT ANDAIRWAY TRUST FUND
TWO Primary SOURCES of FUNDING
This chart aligns with the presentation of the FAA’s audited Consolidated Statement of Net Cost on page 89 and net cost by program and strategic goal in Note 14 on page 114. Net costs are presented among FAA’s five lines of business and collectively for its non-line of business programs. General and administrative costs from the FAA’s staff offices are allocated to the lines of business they support, on a reasonable and consistent basis. For more information, also see discussion of funding sources on this page and the FAA’s lines of business and staff offices on pages 10–11.
Historically, AIP was funded solely from the AATF. In FY 2018 and FY 2019, Congress appropriated additional amounts from the general fund.
In addition to the primary funding types listed above, the FAA also receives budgetary resources from revolving funds and user fees that are not graphically illustrated. For additional information on these funding sources, refer to pages 32–33.
FAA RESOURCES AND HOW THEY ARE USED
FA A FISCAL YEAR 2019 | PERFORMANCE AND ACCOUNTABILIT Y REPORT34
MA
NA
GE
ME
NT
’S D
ISC
US
SIO
N A
ND
AN
ALY
SIS
MANAGEMENT CONTROL HIGHLIGHTS
Financial Management Integrity: Controls, Compliance and ChallengesOn November 9, 2019, the FAA Administrator reported to the Secretary of DOT an unmodified statement of assurance under the Federal Managers’ Financial Integrity Act (FMFIA). Every year, program managers in the FAA’s lines of business and staff offices assess the vulnerability of their programs. Based on these assessments, reviews are conducted to determine their compliance with sections 2 and 4 of FMFIA. Section 2 requires management controls to be in place, and Section 4 requires financial systems to conform to government-wide standards. The head of each line of business or staff office identifies, in writing, to the Administrator any potential material internal control weakness or system nonconformance. Identified weaknesses deemed material are consolidated in a Statement of Assurance signed by the Administrator and sent to the DOT Secretary. This FAA response becomes a part of the DOT Statement of Assurance sent to the President. We also report to DOT our compliance with the Federal Financial Management Improvement Act (FFMIA). FFMIA requires an assessment of adherence to financial management system requirements, accounting standards, and U.S. Standard General Ledger transaction level reporting. For FY 2019, we are reporting overall substantial compliance.
Enterprise Risk Management at the FAAOffice of Management and Budget (OMB) Circular A-123 is the detailed guidance for management’s responsibility for reporting and internal controls. While initially the guidance focused on internal controls over financial reporting, OMB has expanded its scope to consider both financial and operational controls over the past few years.
In FY 2017, OMB Circular A-123 was further modified to add enterprise risk management as an element to consider when providing the FMFIA annual letter of assurance. In fact, enterprise risk management was added to the title, which is now Management’s Responsibility for Enterprise Risk Management and Internal Control.
In response to this government-wide requirement, the FAA collaborated with the DOT (along with OMB) to discuss the best approach to incorporate risk management into FAA’s
long standing risk-based business architecture. As a mature risk-based entity whose mission is provide the safest and most efficient aerospace system in the world, the FAA had an existing monthly progress reporting process for its strategic goals. As a result, the FAA developed a specific enterprise risk management implementation plan for A-123 that identified a governance approach and a Chief Risk Officer. Each year now, with approval from our business plan council members and our Chief Risk Officer, we submit a risk register to the DOT for inclusion in the department-level risk register that is submitted to OMB.
Payment IntegrityThe Improper Payments Information Act of 2002 (IPIA), as amended by the Improper Payments Elimination and Recovery Act (IPERA) of 2010 and the Improper Payments Elimination and Recovery Improvement Act of 2012 (IPERIA), requires federal agencies to annually report information on improper payments to the President and the Congress. For purposes of this reporting, the acronym “IPIA” refers to “IPIA, as amended by IPERA and IPERIA”.
IPIA spells out a systematic approach by which the federal government must address a difficult and often complex problem. Paying billions of dollars every year, the federal government cannot afford to be at risk of improper payments. OMB Circular A-123, Appendix C (October 20, 2014), provides government-wide guidance for preventing and recovering losses.
The purpose of these regulations and guidance is to improve agency efforts to reduce and recover improper payments. Specifically, IPIA requires agencies to identify and estimate their improper payments, conduct payment recovery audits, reuse recovered improper payments, and report compliance actions.
In simple terms, an improper payment based on IPIA is any payment that should not have been made at all, was paid in the incorrect amount (overpayments or underpayments), was paid to an ineligible recipient, or was for an ineligible good or service. It is important to note that, payments made without complete supporting documentation and duplicate payments are also considered improper payments.
Based on IPIA, agencies are required to assess all programs and financial activities in order to identify those that are most susceptible to improper payments. This risk assessment
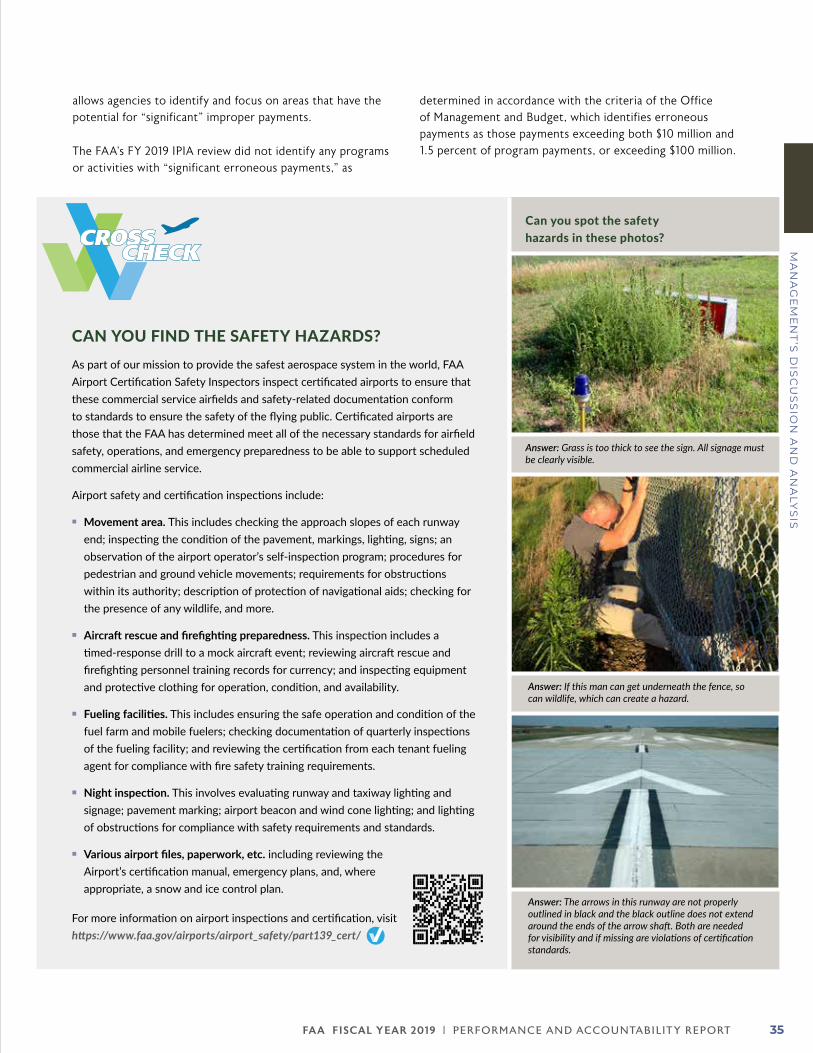
FA A FISCAL YEAR 2019 | PERFORMANCE AND ACCOUNTABILIT Y REPORT 35
MA
NA
GE
ME
NT
’S D
ISC
US
SIO
N A
ND
AN
ALY
SIS
allows agencies to identify and focus on areas that have the potential for “significant” improper payments.
The FAA’s FY 2019 IPIA review did not identify any programs or activities with “significant erroneous payments,” as
determined in accordance with the criteria of the Office of Management and Budget, which identifies erroneous payments as those payments exceeding both $10 million and 1.5 percent of program payments, or exceeding $100 million.
CAN YOU FIND THE SAFETY HAZARDS?As part of our mission to provide the safest aerospace system in the world, FAA Airport Certification Safety Inspectors inspect certificated airports to ensure that these commercial service airfields and safety-related documentation conform to standards to ensure the safety of the flying public. Certificated airports are those that the FAA has determined meet all of the necessary standards for airfield safety, operations, and emergency preparedness to be able to support scheduled commercial airline service.
Airport safety and certification inspections include:
z� Movement area. This includes checking the approach slopes of each runway end; inspecting the condition of the pavement, markings, lighting, signs; an observation of the airport operator’s self-inspection program; procedures for pedestrian and ground vehicle movements; requirements for obstructions within its authority; description of protection of navigational aids; checking for the presence of any wildlife, and more.
z� Aircraft rescue and firefighting preparedness. This inspection includes a timed-response drill to a mock aircraft event; reviewing aircraft rescue and firefighting personnel training records for currency; and inspecting equipment and protective clothing for operation, condition, and availability.
z� Fueling facilities. This includes ensuring the safe operation and condition of the fuel farm and mobile fuelers; checking documentation of quarterly inspections of the fueling facility; and reviewing the certification from each tenant fueling agent for compliance with fire safety training requirements.
z� Night inspection. This involves evaluating runway and taxiway lighting and signage; pavement marking; airport beacon and wind cone lighting; and lighting of obstructions for compliance with safety requirements and standards.
z� Various airport files, paperwork, etc. including reviewing the Airport’s certification manual, emergency plans, and, where appropriate, a snow and ice control plan.
For more information on airport inspections and certification, visit https://www.faa.gov/airports/airport_safety/part139_cert/
Answer: Grass is too thick to see the sign. All signage must be clearly visible.
Answer: If this man can get underneath the fence, so can wildlife, which can create a hazard.
Answer: The arrows in this runway are not properly outlined in black and the black outline does not extend around the ends of the arrow shaft. Both are needed for visibility and if missing are violations of certification standards.
Can you spot the safety hazards in these photos?CROSS
CHECK
FA A FISCAL YEAR 2019 | PERFORMANCE AND ACCOUNTABILIT Y REPORT36
MA
NA
GE
ME
NT
’S D
ISC
US
SIO
N A
ND
AN
ALY
SIS
Federal Managers’ Financial Integrity Act Assurance Statement
Fiscal Year 2019
The FAA is responsible for managing risks and maintaining effective internal control and financial management systems that meet the objectives of Section 2 and Section 4 of the Federal Managers’ Financial Integrity Act. This includes conducting assessments to determine the effectiveness of internal controls and conformance with financial system requirements. The FAA conducted its assessments in accordance with OMB Circular No. A-123, Management’s Responsibility for Enterprise Risk Management and Internal Control, Appendices A and D.
The FAA’s assessments considered the effectiveness of internal control over operations; financial reporting which also includes safeguarding of assets; and compliance with applicable laws and regulations. The objectives are to ensure:
zz Effectiveness and efficiency of operations
zz Reliability of reporting for internal and external use
zz Compliance with applicable laws and regulations
Based on the results of this assessment, the FAA can provide reasonable assurance that its internal control over operations, financial reporting, and compliance were operating effectively as of September 30, 2019. No material weaknesses were found in the design or operation of internal control over financial reporting.
The FAA also assessed its financial management systems’ conformance with financial system requirements, in accordance with the requirements of OMB Circular A-123 Appendix D. Based on this assessment, the FAA can provide reasonable assurance that its financial management systems conform to these requirements and no material non-conformances or instances of noncompliance were identified.
STEVE DICKSONAdministratorNovember 9, 2019
MANAGEMENT ASSURANCES
FA A FISCAL YEAR 2019 | PERFORMANCE AND ACCOUNTABILIT Y REPORT 37
MA
NA
GE
ME
NT
’S D
ISC
US
SIO
N A
ND
AN
ALY
SIS
FINANCIAL MANAGEMENT SYSTEMS STRATEGY AND ACTIONS
Financial Management Systems Strategy The FAA’s financial management systems strategy is based on a framework called the Federal Enterprise Architecture, which is recognized across the federal government as the best practice for aligning business and technology resources to achieve strategic outcomes. Achieving this in all areas of our financial systems, including making it part of our organizational design, entails ongoing focus and performance improvement. Our financial management systems strategy can be divided into five categories: Business, Applications, Data, Information, and Services. A summary of each is provided below:
Business. Continuing to transition to increasingly centralized management of financial information to optimize efficiency, transparency, and consistency.
Applications. Decreases the number of financial management applications being used by the agency via a financial systems modernization program.
Data. Implements a financial data management roadmap and stewardship council to govern the use and sharing of FAA financial data as a common asset.
Information. Builds an FAA-wide financial data “warehouse” to increase the consistency of reporting while maintaining each organization’s ability to meet individual core mission business reporting requirements.
Services. Defines and delivers shared operational and infrastructure services for the FAA’s multiple financial systems.
Systems Critical to Financial Management and Actions The FAA is working with DOT to consolidate and modernize its financial management systems and streamline processes and financial reports. Maintaining fewer systems will enable the FAA to operate more efficiently by having fewer points of data entry, fewer systems to reconcile with the official sources of the data, and fewer systems on which to train employees. Below is a summary of the systems
critical to FAA’s financial management and the actions and improvements that are recently completed, underway, or planned for each.
Accounting. DELPHI is an Oracle web-based financial management system and is integrated with the Procurement Information System for Management (PRISM), which is discussed below. DELPHI supports the agency’s business objectives, reduces program exposure to various sources of risk, automates, streamlines, and standardizes financial processes, and provides accurate financial results. The following are some highlights of DELPHI’s features and benefits:
zz One system and one set of books shared by all FAA regions, centers, and headquarters.
zz Ability to share and extract information and data from a common source.
zz Accurate financial statements produced directly from the system.
zz Streamlined business processes.
zz More accurate and timely information available to management for decision-making.
zz More flexibility for program and accounting managers to report financial information.
zz Clear lines of responsibility and accountability on projects that improve FAA’s ability to measure program effectiveness.
zz Accurate cost and lifecycle asset valuations.
Acquisition. PRISM is the official internet-based system for procurement processing for the agency. PRISM supports the entire procurement life cycle, including generating and maintaining procurement documentation and contractor award information. PRISM interfaces with the agency’s accounting system, DELPHI using Oracle/Compusearch Integration (OCI) software. In FY 2020, PRISM will be upgraded to version 7.4. This software upgrade will provide a more efficient interface with vendors, allow for easier upgrades in the future and the elimination of the OCI interface with DELPHI. The interface with DELPHI will be transitioned to a service-oriented architecture where services are provided to PRISM and other components in a more common and efficient manner.
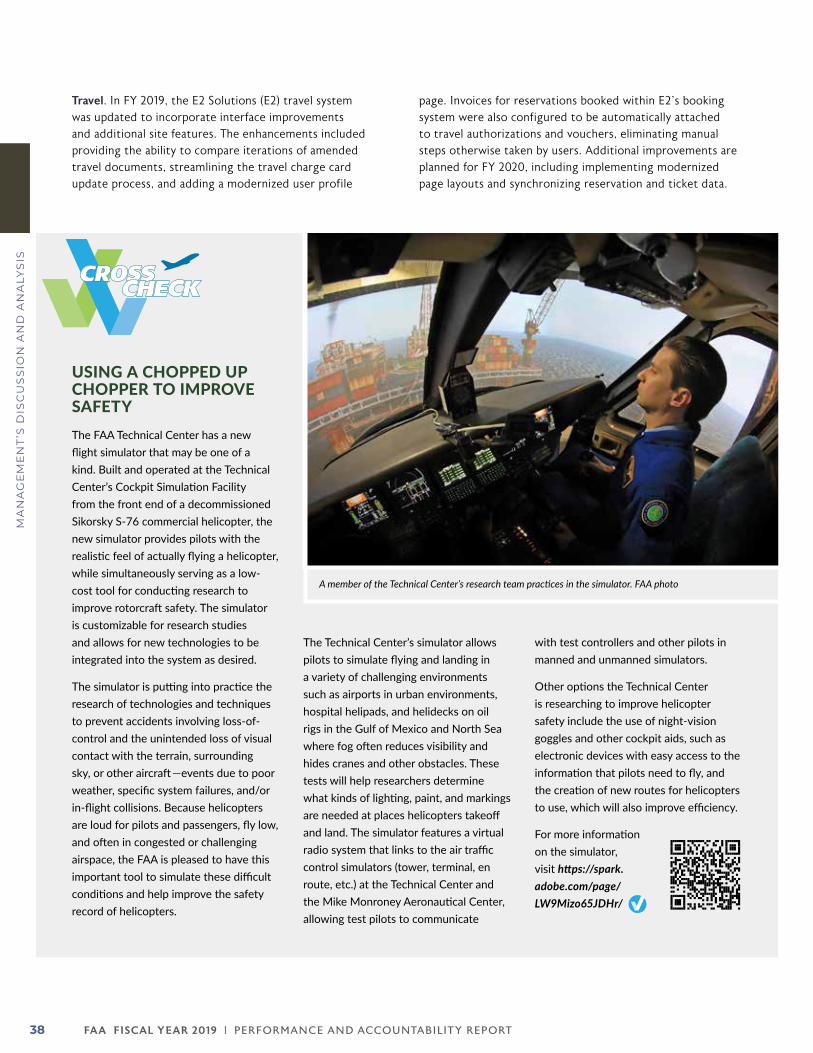
FA A FISCAL YEAR 2019 | PERFORMANCE AND ACCOUNTABILIT Y REPORT38
MA
NA
GE
ME
NT
’S D
ISC
US
SIO
N A
ND
AN
ALY
SIS
Travel. In FY 2019, the E2 Solutions (E2) travel system was updated to incorporate interface improvements and additional site features. The enhancements included providing the ability to compare iterations of amended travel documents, streamlining the travel charge card update process, and adding a modernized user profile
page. Invoices for reservations booked within E2’s booking system were also configured to be automatically attached to travel authorizations and vouchers, eliminating manual steps otherwise taken by users. Additional improvements are planned for FY 2020, including implementing modernized page layouts and synchronizing reservation and ticket data.
USING A CHOPPED UP CHOPPER TO IMPROVE SAFETY The FAA Technical Center has a new flight simulator that may be one of a kind. Built and operated at the Technical Center’s Cockpit Simulation Facility from the front end of a decommissioned Sikorsky S-76 commercial helicopter, the new simulator provides pilots with the realistic feel of actually flying a helicopter, while simultaneously serving as a low-cost tool for conducting research to improve rotorcraft safety. The simulator is customizable for research studies and allows for new technologies to be integrated into the system as desired.
The simulator is putting into practice the research of technologies and techniques to prevent accidents involving loss-of-control and the unintended loss of visual contact with the terrain, surrounding sky, or other aircraft —events due to poor weather, specific system failures, and/or in-flight collisions. Because helicopters are loud for pilots and passengers, fly low, and often in congested or challenging airspace, the FAA is pleased to have this important tool to simulate these difficult conditions and help improve the safety record of helicopters.
The Technical Center’s simulator allows pilots to simulate flying and landing in a variety of challenging environments such as airports in urban environments, hospital helipads, and helidecks on oil rigs in the Gulf of Mexico and North Sea where fog often reduces visibility and hides cranes and other obstacles. These tests will help researchers determine what kinds of lighting, paint, and markings are needed at places helicopters takeoff and land. The simulator features a virtual radio system that links to the air traffic control simulators (tower, terminal, en route, etc.) at the Technical Center and the Mike Monroney Aeronautical Center, allowing test pilots to communicate
with test controllers and other pilots in manned and unmanned simulators.
Other options the Technical Center is researching to improve helicopter safety include the use of night-vision goggles and other cockpit aids, such as electronic devices with easy access to the information that pilots need to fly, and the creation of new routes for helicopters to use, which will also improve efficiency.
For more information on the simulator, visit https://spark.adobe.com/page/LW9Mizo65JDHr/
A member of the Technical Center’s research team practices in the simulator. FAA photo
CROSSCHECK
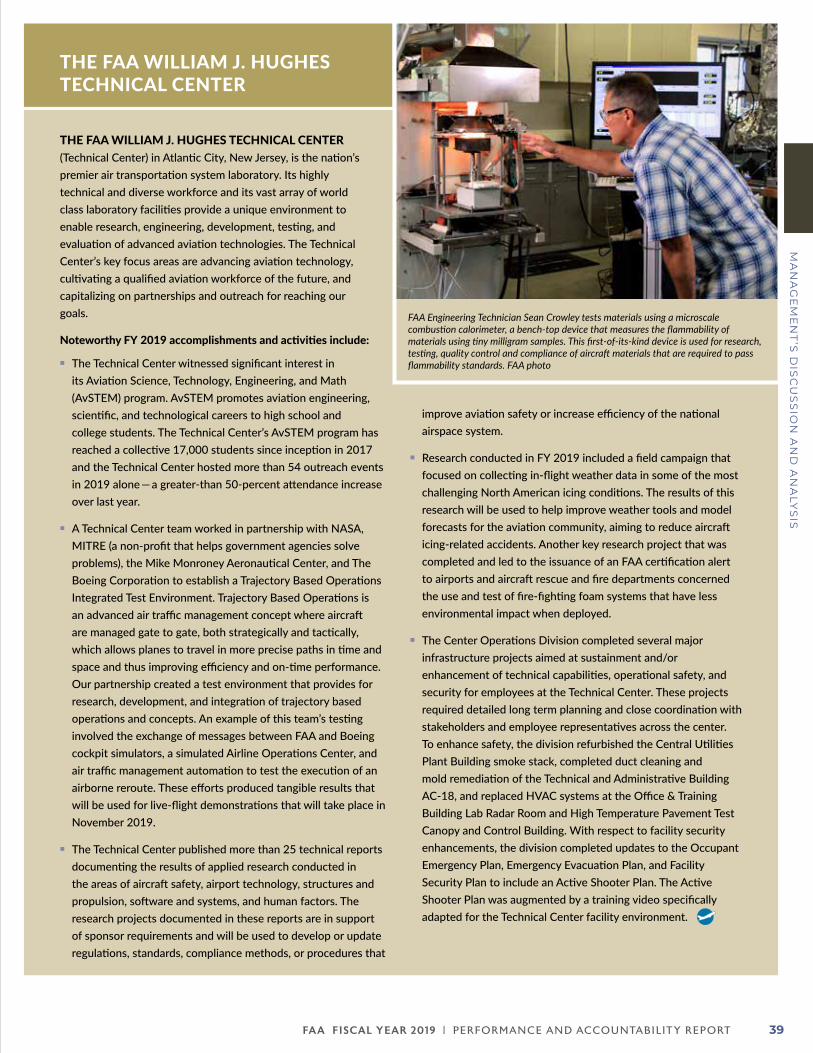
FA A FISCAL YEAR 2019 | PERFORMANCE AND ACCOUNTABILIT Y REPORT 39
MA
NA
GE
ME
NT
’S D
ISC
US
SIO
N A
ND
AN
ALY
SIS
sTHE FAA WILLIAM J. HUGHES TECHNICAL CENTER
THE FAA WILLIAM J. HUGHES TECHNICAL CENTER(Technical Center) in Atlantic City, New Jersey, is the nation’s premier air transportation system laboratory. Its highly technical and diverse workforce and its vast array of world class laboratory facilities provide a unique environment to enable research, engineering, development, testing, and evaluation of advanced aviation technologies. The Technical Center’s key focus areas are advancing aviation technology, cultivating a qualified aviation workforce of the future, and capitalizing on partnerships and outreach for reaching our goals.
Noteworthy FY 2019 accomplishments and activities include:
z� The Technical Center witnessed significant interest in its Aviation Science, Technology, Engineering, and Math (AvSTEM) program. AvSTEM promotes aviation engineering, scientific, and technological careers to high school and college students. The Technical Center’s AvSTEM program has reached a collective 17,000 students since inception in 2017 and the Technical Center hosted more than 54 outreach events in 2019 alone — a greater-than 50-percent attendance increase over last year.
z� A Technical Center team worked in partnership with NASA, MITRE (a non-profit that helps government agencies solve problems), the Mike Monroney Aeronautical Center, and The Boeing Corporation to establish a Trajectory Based Operations Integrated Test Environment. Trajectory Based Operations is an advanced air traffic management concept where aircraft are managed gate to gate, both strategically and tactically, which allows planes to travel in more precise paths in time and space and thus improving efficiency and on-time performance. Our partnership created a test environment that provides for research, development, and integration of trajectory based operations and concepts. An example of this team’s testing involved the exchange of messages between FAA and Boeing cockpit simulators, a simulated Airline Operations Center, and air traffic management automation to test the execution of an airborne reroute. These efforts produced tangible results that will be used for live-flight demonstrations that will take place in November 2019.
z� The Technical Center published more than 25 technical reports documenting the results of applied research conducted in the areas of aircraft safety, airport technology, structures and propulsion, software and systems, and human factors. The research projects documented in these reports are in support of sponsor requirements and will be used to develop or update regulations, standards, compliance methods, or procedures that
improve aviation safety or increase efficiency of the national airspace system.
z� Research conducted in FY 2019 included a field campaign that focused on collecting in-flight weather data in some of the most challenging North American icing conditions. The results of this research will be used to help improve weather tools and model forecasts for the aviation community, aiming to reduce aircraft icing-related accidents. Another key research project that was completed and led to the issuance of an FAA certification alert to airports and aircraft rescue and fire departments concerned the use and test of fire-fighting foam systems that have less environmental impact when deployed.
z� The Center Operations Division completed several major infrastructure projects aimed at sustainment and/or enhancement of technical capabilities, operational safety, and security for employees at the Technical Center. These projects required detailed long term planning and close coordination with stakeholders and employee representatives across the center. To enhance safety, the division refurbished the Central Utilities Plant Building smoke stack, completed duct cleaning and mold remediation of the Technical and Administrative Building AC-18, and replaced HVAC systems at the Office & Training Building Lab Radar Room and High Temperature Pavement Test Canopy and Control Building. With respect to facility security enhancements, the division completed updates to the Occupant Emergency Plan, Emergency Evacuation Plan, and Facility Security Plan to include an Active Shooter Plan. The Active Shooter Plan was augmented by a training video specifically adapted for the Technical Center facility environment.
FAA Engineering Technician Sean Crowley tests materials using a microscale combustion calorimeter, a bench-top device that measures the flammability of materials using tiny milligram samples. This first-of-its-kind device is used for research, testing, quality control and compliance of aircraft materials that are required to pass flammability standards. FAA photo
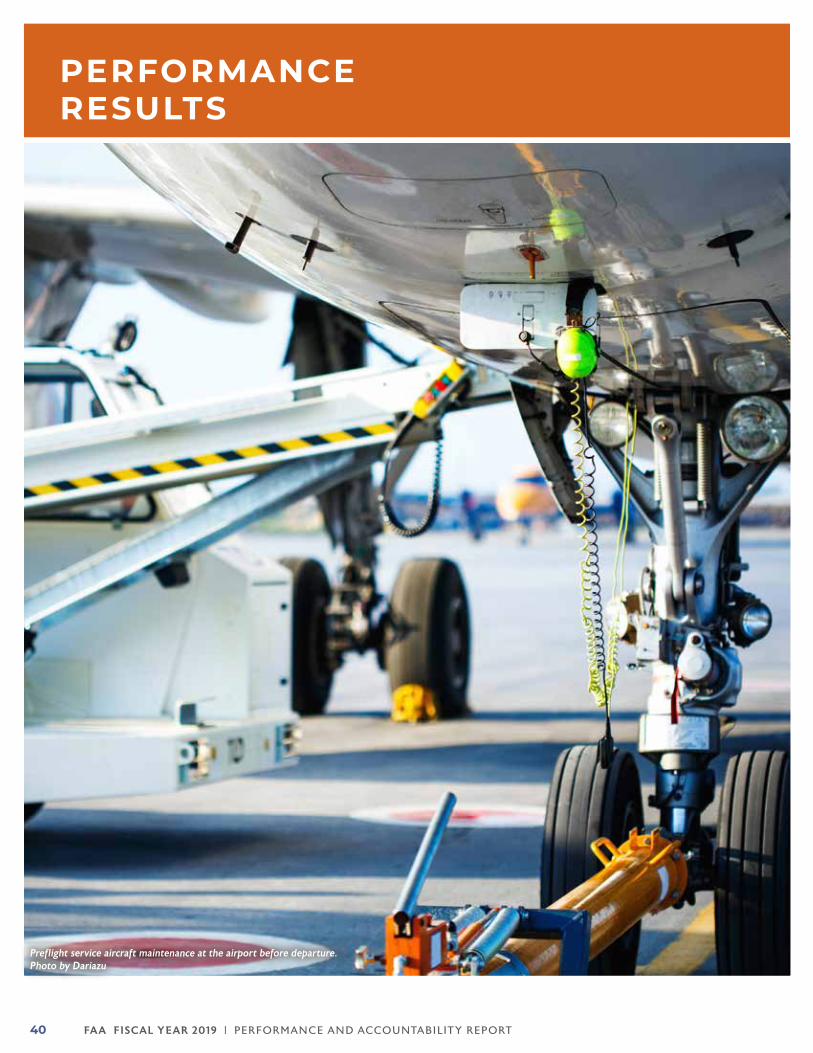
FA A FISCAL YEAR 2019 | PERFORMANCE AND ACCOUNTABILIT Y REPORT40
PERFORMANCE RESULTS
Preflight service aircraft maintenance at the airport before departure. Photo by Dariazu
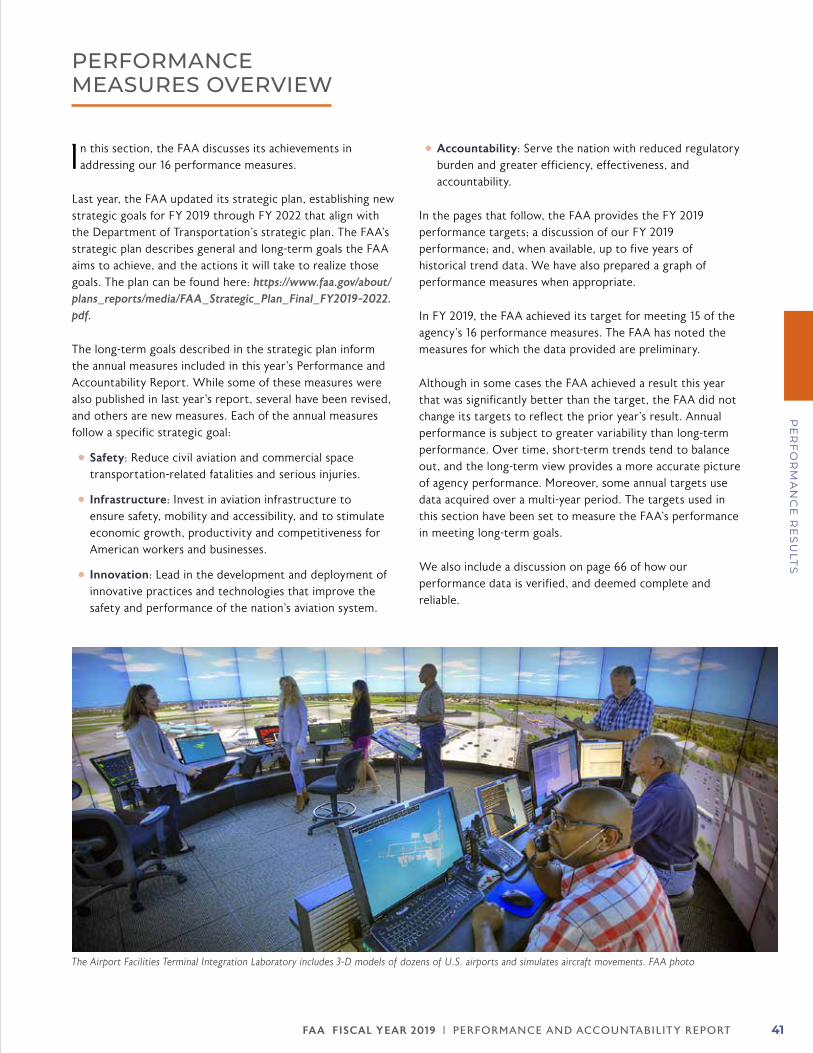
FA A FISCAL YEAR 2019 | PERFORMANCE AND ACCOUNTABILIT Y REPORT 41
PE
RF
OR
MA
NC
E R
ES
ULT
S
PERFORMANCE MEASURES OVERVIEW
In this section, the FAA discusses its achievements in addressing our 16 performance measures.
Last year, the FAA updated its strategic plan, establishing new strategic goals for FY 2019 through FY 2022 that align with the Department of Transportation’s strategic plan. The FAA’s strategic plan describes general and long-term goals the FAA aims to achieve, and the actions it will take to realize those goals. The plan can be found here: https://www.faa.gov/about/plans_reports/media/FAA_Strategic_Plan_Final_FY2019-2022.pdf.
The long-term goals described in the strategic plan inform the annual measures included in this year’s Performance and Accountability Report. While some of these measures were also published in last year’s report, several have been revised, and others are new measures. Each of the annual measures follow a specific strategic goal:
zz Safety: Reduce civil aviation and commercial space transportation-related fatalities and serious injuries.
zz Infrastructure: Invest in aviation infrastructure to ensure safety, mobility and accessibility, and to stimulate economic growth, productivity and competitiveness for American workers and businesses.
zz Innovation: Lead in the development and deployment of innovative practices and technologies that improve the safety and performance of the nation’s aviation system.
zz Accountability: Serve the nation with reduced regulatory burden and greater efficiency, effectiveness, and accountability.
In the pages that follow, the FAA provides the FY 2019 performance targets; a discussion of our FY 2019 performance; and, when available, up to five years of historical trend data. We have also prepared a graph of performance measures when appropriate.
In FY 2019, the FAA achieved its target for meeting 15 of the agency’s 16 performance measures. The FAA has noted the measures for which the data provided are preliminary.
Although in some cases the FAA achieved a result this year that was significantly better than the target, the FAA did not change its targets to reflect the prior year’s result. Annual performance is subject to greater variability than long-term performance. Over time, short-term trends tend to balance out, and the long-term view provides a more accurate picture of agency performance. Moreover, some annual targets use data acquired over a multi-year period. The targets used in this section have been set to measure the FAA’s performance in meeting long-term goals.
We also include a discussion on page 66 of how our performance data is verified, and deemed complete and reliable.
The Airport Facilities Terminal Integration Laboratory includes 3-D models of dozens of U.S. airports and simulates aircraft movements. FAA photo
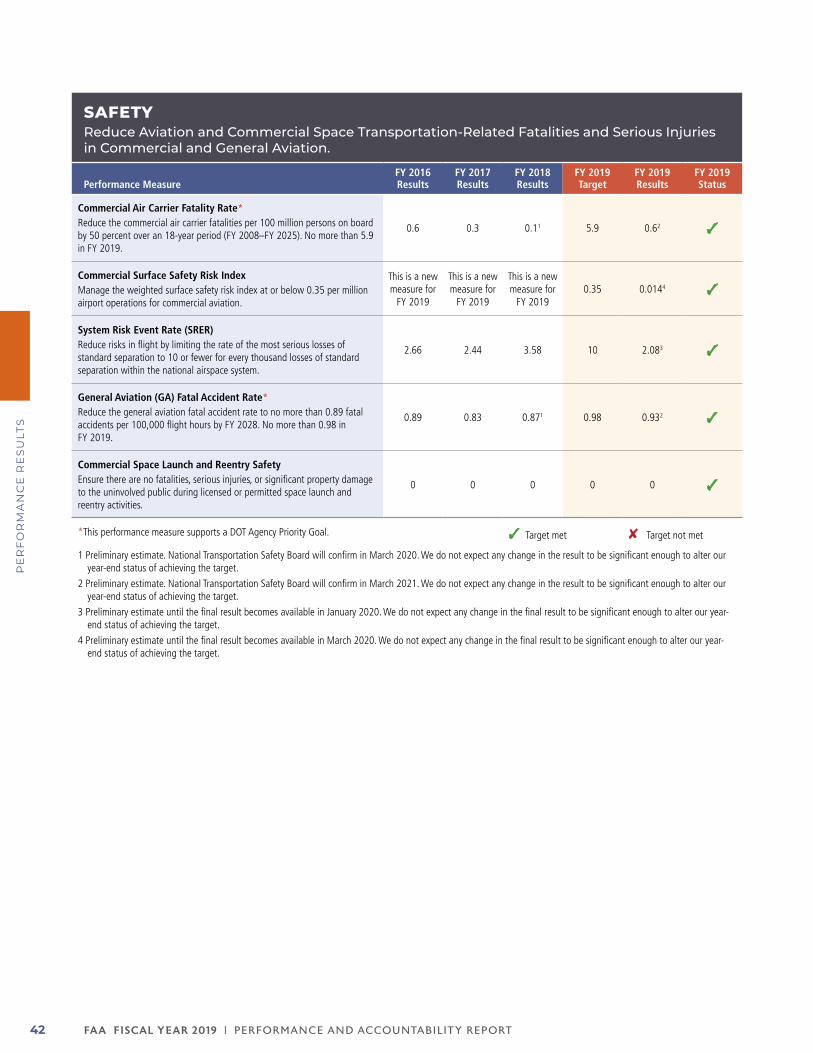
FA A FISCAL YEAR 2019 | PERFORMANCE AND ACCOUNTABILIT Y REPORT42
PE
RF
OR
MA
NC
E R
ES
ULT
S
SAFETYReduce Aviation and Commercial Space Transportation-Related Fatalities and Serious Injuries in Commercial and General Aviation.
Performance MeasureFY 2016Results
FY 2017Results
FY 2018Results
FY 2019Target
FY 2019Results
FY 2019Status
Commercial Air Carrier Fatality Rate*Reduce the commercial air carrier fatalities per 100 million persons on board by 50 percent over an 18-year period (FY 2008–FY 2025). No more than 5.9 in FY 2019.
0.6 0.3 0.11 5.9 0.62 ✓
Commercial Surface Safety Risk IndexManage the weighted surface safety risk index at or below 0.35 per million airport operations for commercial aviation.
This is a new measure for
FY 2019
This is a new measure for
FY 2019
This is a new measure for
FY 20190.35 0.0144 ✓
System Risk Event Rate (SRER)Reduce risks in flight by limiting the rate of the most serious losses of standard separation to 10 or fewer for every thousand losses of standard separation within the national airspace system.
2.66 2.44 3.58 10 2.083 ✓
General Aviation (GA) Fatal Accident Rate*Reduce the general aviation fatal accident rate to no more than 0.89 fatal accidents per 100,000 flight hours by FY 2028. No more than 0.98 in FY 2019.
0.89 0.83 0.871 0.98 0.932 ✓
Commercial Space Launch and Reentry SafetyEnsure there are no fatalities, serious injuries, or significant property damage to the uninvolved public during licensed or permitted space launch and reentry activities.
0 0 0 0 0 ✓
*This performance measure supports a DOT Agency Priority Goal. ✓ Target met ✘ Target not met
1 Preliminary estimate. National Transportation Safety Board will confirm in March 2020. We do not expect any change in the result to be significant enough to alter our year-end status of achieving the target.
2 Preliminary estimate. National Transportation Safety Board will confirm in March 2021. We do not expect any change in the result to be significant enough to alter our year-end status of achieving the target.
3 Preliminary estimate until the final result becomes available in January 2020. We do not expect any change in the final result to be significant enough to alter our year-end status of achieving the target.
4 Preliminary estimate until the final result becomes available in March 2020. We do not expect any change in the final result to be significant enough to alter our year-end status of achieving the target.
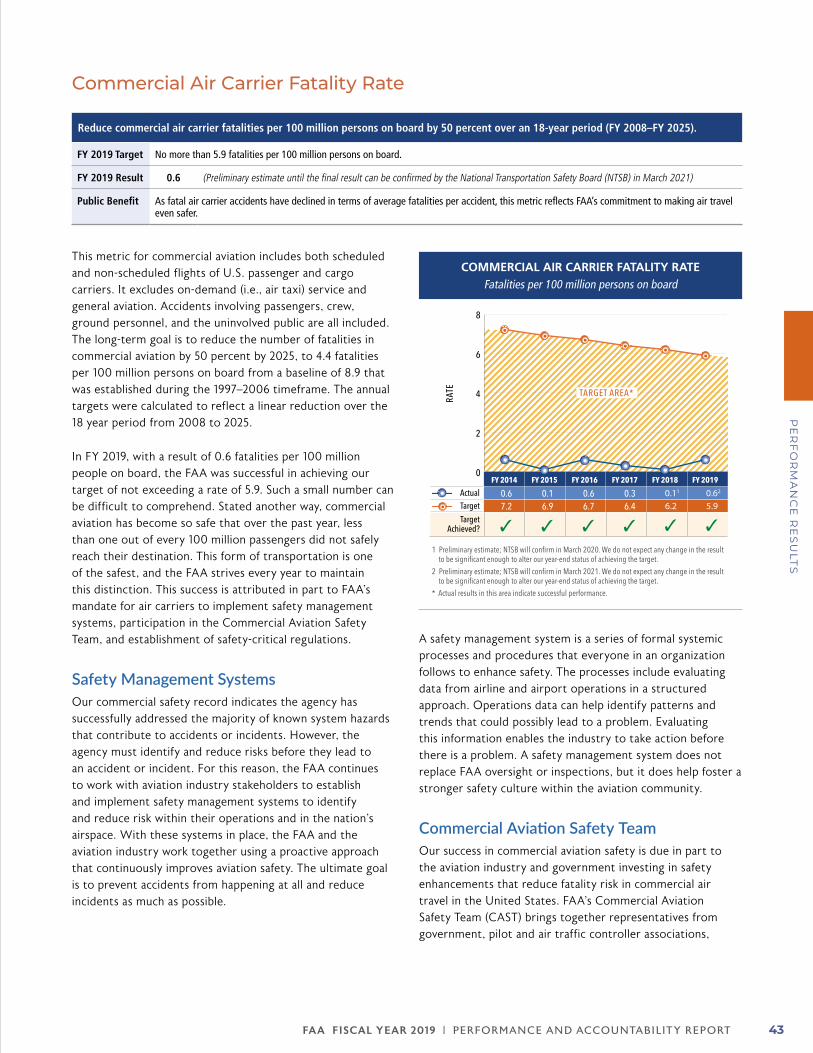
FA A FISCAL YEAR 2019 | PERFORMANCE AND ACCOUNTABILIT Y REPORT 43
PE
RF
OR
MA
NC
E R
ES
ULT
S
Commercial Air Carrier Fatality Rate
Reduce commercial air carrier fatalities per 100 million persons on board by 50 percent over an 18-year period (FY 2008–FY 2025).
FY 2019 Target No more than 5.9 fatalities per 100 million persons on board.
FY 2019 Result 0.6 (Preliminary estimate until the final result can be confirmed by the National Transportation Safety Board (NTSB) in March 2021)
Public Benefit As fatal air carrier accidents have declined in terms of average fatalities per accident, this metric reflects FAA’s commitment to making air travel even safer.
This metric for commercial aviation includes both scheduled and non-scheduled flights of U.S. passenger and cargo carriers. It excludes on-demand (i.e., air taxi) service and general aviation. Accidents involving passengers, crew, ground personnel, and the uninvolved public are all included. The long-term goal is to reduce the number of fatalities in commercial aviation by 50 percent by 2025, to 4.4 fatalities per 100 million persons on board from a baseline of 8.9 that was established during the 1997–2006 timeframe. The annual targets were calculated to reflect a linear reduction over the 18 year period from 2008 to 2025.
In FY 2019, with a result of 0.6 fatalities per 100 million people on board, the FAA was successful in achieving our target of not exceeding a rate of 5.9. Such a small number can be difficult to comprehend. Stated another way, commercial aviation has become so safe that over the past year, less than one out of every 100 million passengers did not safely reach their destination. This form of transportation is one of the safest, and the FAA strives every year to maintain this distinction. This success is attributed in part to FAA’s mandate for air carriers to implement safety management systems, participation in the Commercial Aviation Safety Team, and establishment of safety-critical regulations.
Safety Management SystemsOur commercial safety record indicates the agency has successfully addressed the majority of known system hazards that contribute to accidents or incidents. However, the agency must identify and reduce risks before they lead to an accident or incident. For this reason, the FAA continues to work with aviation industry stakeholders to establish and implement safety management systems to identify and reduce risk within their operations and in the nation’s airspace. With these systems in place, the FAA and the aviation industry work together using a proactive approach that continuously improves aviation safety. The ultimate goal is to prevent accidents from happening at all and reduce incidents as much as possible.
A safety management system is a series of formal systemic processes and procedures that everyone in an organization follows to enhance safety. The processes include evaluating data from airline and airport operations in a structured approach. Operations data can help identify patterns and trends that could possibly lead to a problem. Evaluating this information enables the industry to take action before there is a problem. A safety management system does not replace FAA oversight or inspections, but it does help foster a stronger safety culture within the aviation community.
Commercial Aviation Safety TeamOur success in commercial aviation safety is due in part to the aviation industry and government investing in safety enhancements that reduce fatality risk in commercial air travel in the United States. FAA’s Commercial Aviation Safety Team (CAST) brings together representatives from government, pilot and air traffic controller associations,
COMMERCIAL AIR CARRIER FATALITY RATE Fatalities per 100 million persons on board
RATE
0.67.2
✓
0.16.9
✓
0.66.7
✓
0.36.4
✓
0.11
6.2
✓
0.62
5.9
✓
ActualTarget
TargetAchieved?
1 Preliminary estimate; NTSB will confirm in March 2020. We do not expect any change in the result to be significant enough to alter our year-end status of achieving the target.
2 Preliminary estimate; NTSB will confirm in March 2021. We do not expect any change in the result to be significant enough to alter our year-end status of achieving the target.
* Actual results in this area indicate successful performance.
0
2
4
6
8
FY 2019FY 2018FY 2017FY 2016FY 2015FY 2014
TARGET AREA*
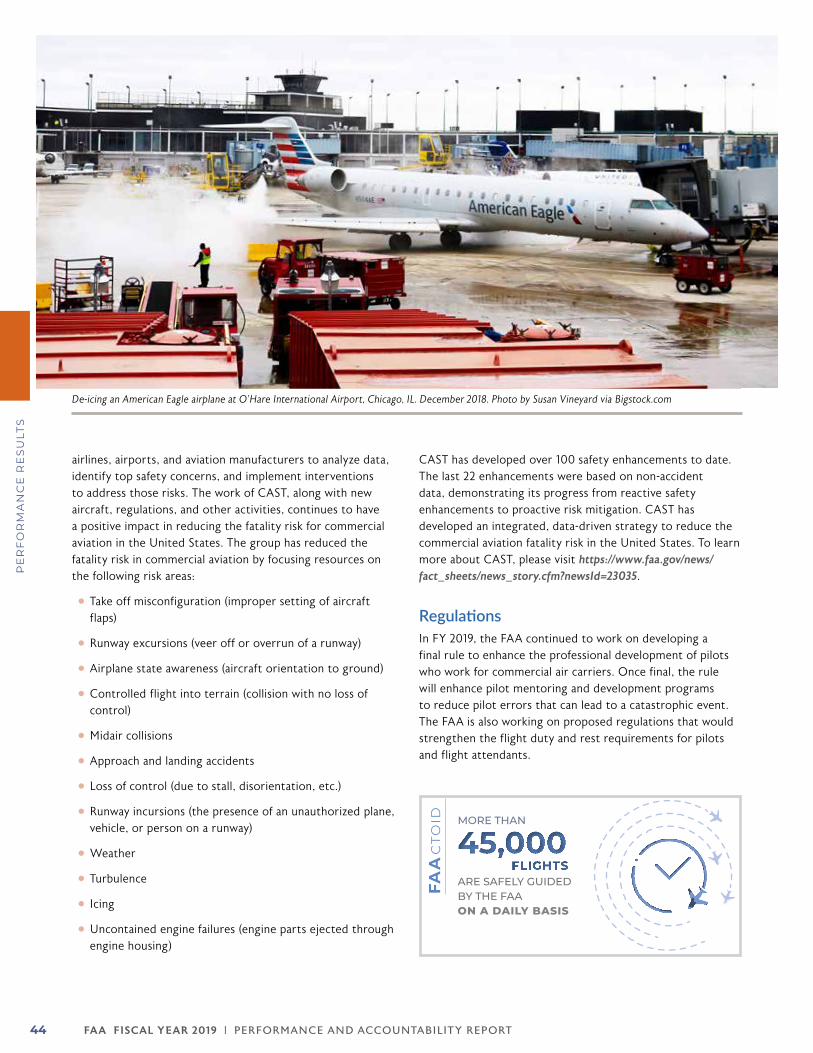
FA A FISCAL YEAR 2019 | PERFORMANCE AND ACCOUNTABILIT Y REPORT44
PE
RF
OR
MA
NC
E R
ES
ULT
S
airlines, airports, and aviation manufacturers to analyze data, identify top safety concerns, and implement interventions to address those risks. The work of CAST, along with new aircraft, regulations, and other activities, continues to have a positive impact in reducing the fatality risk for commercial aviation in the United States. The group has reduced the fatality risk in commercial aviation by focusing resources on the following risk areas:
zz Take off misconfiguration (improper setting of aircraft flaps)
zz Runway excursions (veer off or overrun of a runway)
zz Airplane state awareness (aircraft orientation to ground)
zz Controlled flight into terrain (collision with no loss of control)
zz Midair collisions
zz Approach and landing accidents
zz Loss of control (due to stall, disorientation, etc.)
zz Runway incursions (the presence of an unauthorized plane, vehicle, or person on a runway)
zz Weather
zz Turbulence
zz Icing
zz Uncontained engine failures (engine parts ejected through engine housing)
CAST has developed over 100 safety enhancements to date. The last 22 enhancements were based on non-accident data, demonstrating its progress from reactive safety enhancements to proactive risk mitigation. CAST has developed an integrated, data-driven strategy to reduce the commercial aviation fatality risk in the United States. To learn more about CAST, please visit https://www.faa.gov/news/fact_sheets/news_story.cfm?newsId=23035.
RegulationsIn FY 2019, the FAA continued to work on developing a final rule to enhance the professional development of pilots who work for commercial air carriers. Once final, the rule will enhance pilot mentoring and development programs to reduce pilot errors that can lead to a catastrophic event. The FAA is also working on proposed regulations that would strengthen the flight duty and rest requirements for pilots and flight attendants.
De-icing an American Eagle airplane at O’Hare International Airport, Chicago, IL. December 2018. Photo by Susan Vineyard via Bigstock.com
FAActo
id MORE THAN
ARE SAFELY GUIDED BY THE FAA ON A DAILY BASIS
45,000FLIGHTS
FA A FISCAL YEAR 2019 | PERFORMANCE AND ACCOUNTABILIT Y REPORT 45
PE
RF
OR
MA
NC
E R
ES
ULT
S
Commercial Surface Safety Risk Index
FY 2019 Target Manage the weighted surface safety risk index at or below 0.35 per million airport operations for commercial aviation
FY 2019 Result 0.014 (Preliminary estimate until the final becomes available in March 2020)
Public Benefit The Surface Safety Metric represents potential for fatal accidents on the runway or taxiway surface. A reduction in the Surface Safety Metric score is an indication of overall safety performance improvements for the flying public in the surface environment.
Reducing the risks posed by accidents and other events on airport runways and taxiways is a top priority for FAA. Historically, the FAA has monitored runway safety by focusing on the number and severity of runway incursions, which are the incorrect presence of an aircraft, vehicle or person on the protected area of a surface designated for the landing and take-off of aircraft. Prior to FY 2019, the FAA’s performance metric for surface safety measured the number of the most serious runway incursions per million operations. For FY 2019, the FAA has developed a new performance metric, the surface safety risk index. Rather than focusing solely on the number of runway incursions, the FAA’s new metric reflects the risk posed by all runway surface events. These events include runway excursions (incidents where an aircraft overruns, undershoots, or veers off the side of a runway), collision incidents, runway incursions, and surface incidents.
The new metric is based on a risk index score instead of a raw count of events. The risk index is calculated by applying a score to each surface event based on how close it came to resulting in a fatality, with a fatal injury causing a score of 1.0. The total of all scores is then divided by one million operations. By including all types of surface events and by weighting the events on their severity, the new metric better represents safety risk in the surface environment. The target for commercial operations is for the risk index to remain below 0.35 per million operations. For FY 2019, the FAA achieved a score of 0.014, well below its target for the weighted surface safety risk index for commercial aviation.
The FAA has made significant progress in improving runway safety at U.S. airports over the past 15 years by working with the aviation community on education, training, and airfield improvements such as better marking and lighting. In July 2015, the FAA initiated the Runway Incursion Mitigation (RIM) program to address runway/taxiway intersections with high incidence of runway incursions due to nonstandard airport layouts. Currently, there are 128 RIM locations at 77 airports. Airports often use a combination of strategies to improve these intersections, such as changes to the airport layout,
lights, signs, markings, and operational procedures, to reduce the likelihood of pilot confusion and ultimately, runway incursions. To date, 39 locations have been mitigated through the RIM program, with projects started at an additional 15 locations in FY 2019. The RIM locations will be monitored over time to determine if mitigation efforts were successful and if additional mitigation will be necessary.
The FAA has also worked to mitigate the impacts of runway excursions by improving runway safety areas (RSAs) at commercial service airports. An RSA is a paved or graded surface around the runway that reduces the risk of damage or injury in the event of a runway excursion. For example, in July 2013, Asiana Airlines Flight 214 landed short on Runway 28L at San Francisco International Airport. Although the aircraft sustained severe damage, a majority of those on board the aircraft survived, with many being able to walk away, due to an RSA improvement that provided 600 feet of available “undershoot” before the runway. In March 2017, an aircraft carrying the University of Michigan men’s basketball team overran a runway during take-off at Detroit Willow Run Airport, but because of an improved RSA there was minimal damage to the aircraft and no injuries were reported.
Many airports were built before the current 1,000-foot RSA standard was adopted approximately 20 years ago. In some cases, it is not practicable to achieve the full standard RSA because of a lack of available land. Engineered Material Arresting System (EMAS) uses crushable material placed at the end of a runway to stop an aircraft that overruns the runway. The tires of the aircraft sink into the lightweight material and the aircraft is decelerated as it rolls through the material. Currently, EMAS is installed at the end of 116 runways at 69 U.S. airports. To date, there have been 15 incidents where EMAS has safely stopped overrunning aircraft with a total of 406 crew and passengers aboard those flights.
To learn more about runway safety, please visit: http://www.faa.gov/airports/runway_safety/
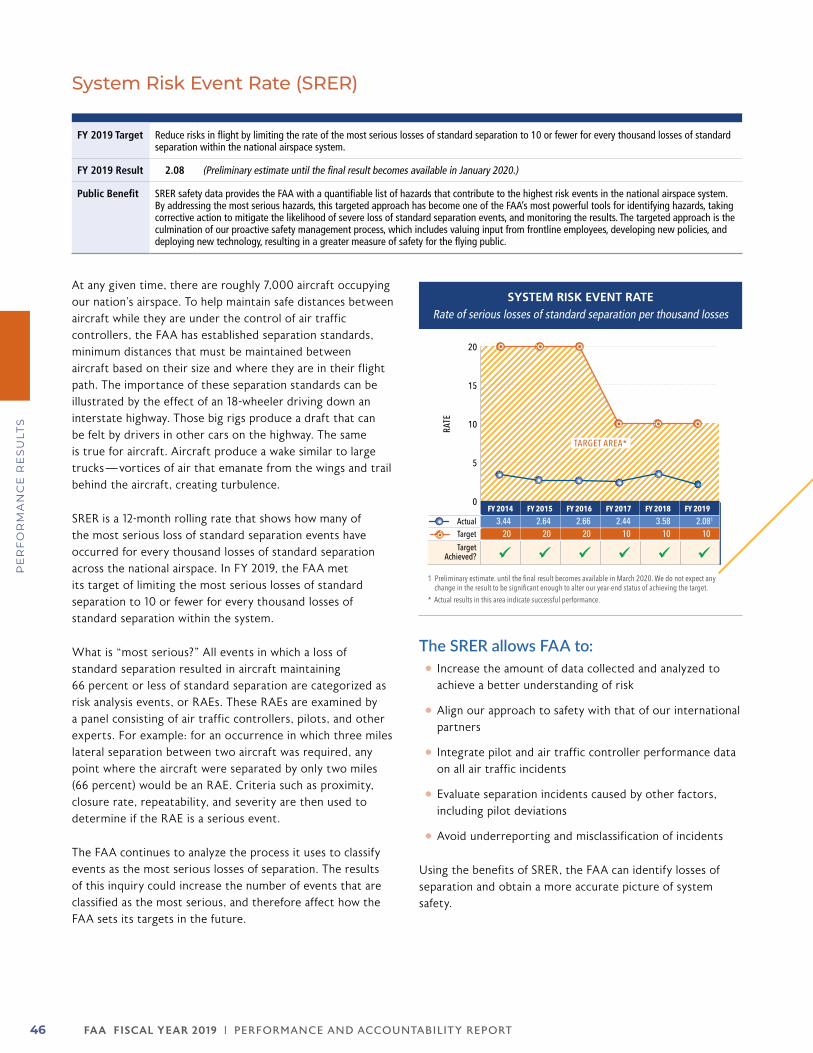
FA A FISCAL YEAR 2019 | PERFORMANCE AND ACCOUNTABILIT Y REPORT46
PE
RF
OR
MA
NC
E R
ES
ULT
S
System Risk Event Rate (SRER)
FY 2019 Target Reduce risks in flight by limiting the rate of the most serious losses of standard separation to 10 or fewer for every thousand losses of standard separation within the national airspace system.
FY 2019 Result 2.08 (Preliminary estimate until the final result becomes available in January 2020.)
Public Benefit SRER safety data provides the FAA with a quantifiable list of hazards that contribute to the highest risk events in the national airspace system. By addressing the most serious hazards, this targeted approach has become one of the FAA’s most powerful tools for identifying hazards, taking corrective action to mitigate the likelihood of severe loss of standard separation events, and monitoring the results. The targeted approach is the culmination of our proactive safety management process, which includes valuing input from frontline employees, developing new policies, and deploying new technology, resulting in a greater measure of safety for the flying public.
At any given time, there are roughly 7,000 aircraft occupying our nation’s airspace. To help maintain safe distances between aircraft while they are under the control of air traffic controllers, the FAA has established separation standards, minimum distances that must be maintained between aircraft based on their size and where they are in their flight path. The importance of these separation standards can be illustrated by the effect of an 18-wheeler driving down an interstate highway. Those big rigs produce a draft that can be felt by drivers in other cars on the highway. The same is true for aircraft. Aircraft produce a wake similar to large trucks — vortices of air that emanate from the wings and trail behind the aircraft, creating turbulence.
SRER is a 12-month rolling rate that shows how many of the most serious loss of standard separation events have occurred for every thousand losses of standard separation across the national airspace. In FY 2019, the FAA met its target of limiting the most serious losses of standard separation to 10 or fewer for every thousand losses of standard separation within the system.
What is “most serious?” All events in which a loss of standard separation resulted in aircraft maintaining 66 percent or less of standard separation are categorized as risk analysis events, or RAEs. These RAEs are examined by a panel consisting of air traffic controllers, pilots, and other experts. For example: for an occurrence in which three miles lateral separation between two aircraft was required, any point where the aircraft were separated by only two miles (66 percent) would be an RAE. Criteria such as proximity, closure rate, repeatability, and severity are then used to determine if the RAE is a serious event.
The FAA continues to analyze the process it uses to classify events as the most serious losses of separation. The results of this inquiry could increase the number of events that are classified as the most serious, and therefore affect how the FAA sets its targets in the future.
The SRER allows FAA to:zz Increase the amount of data collected and analyzed to achieve a better understanding of risk
zz Align our approach to safety with that of our international partners
zz Integrate pilot and air traffic controller performance data on all air traffic incidents
zz Evaluate separation incidents caused by other factors, including pilot deviations
zz Avoid underreporting and misclassification of incidents
Using the benefits of SRER, the FAA can identify losses of separation and obtain a more accurate picture of system safety.
SYSTEM RISK EVENT RATE Rate of serious losses of standard separation per thousand losses
RATE
ActualTarget
TargetAchieved?
1 Preliminary estimate. until the final result becomes available in March 2020. We do not expect any change in the result to be significant enough to alter our year-end status of achieving the target.
* Actual results in this area indicate successful performance.
3.4420
2.6420
2.6620
2.4410
3.5810
2.081
10
0
5
10
15
20
FY 2019FY 2018FY 2017FY 2016FY 2015FY 2014
TARGET AREA*
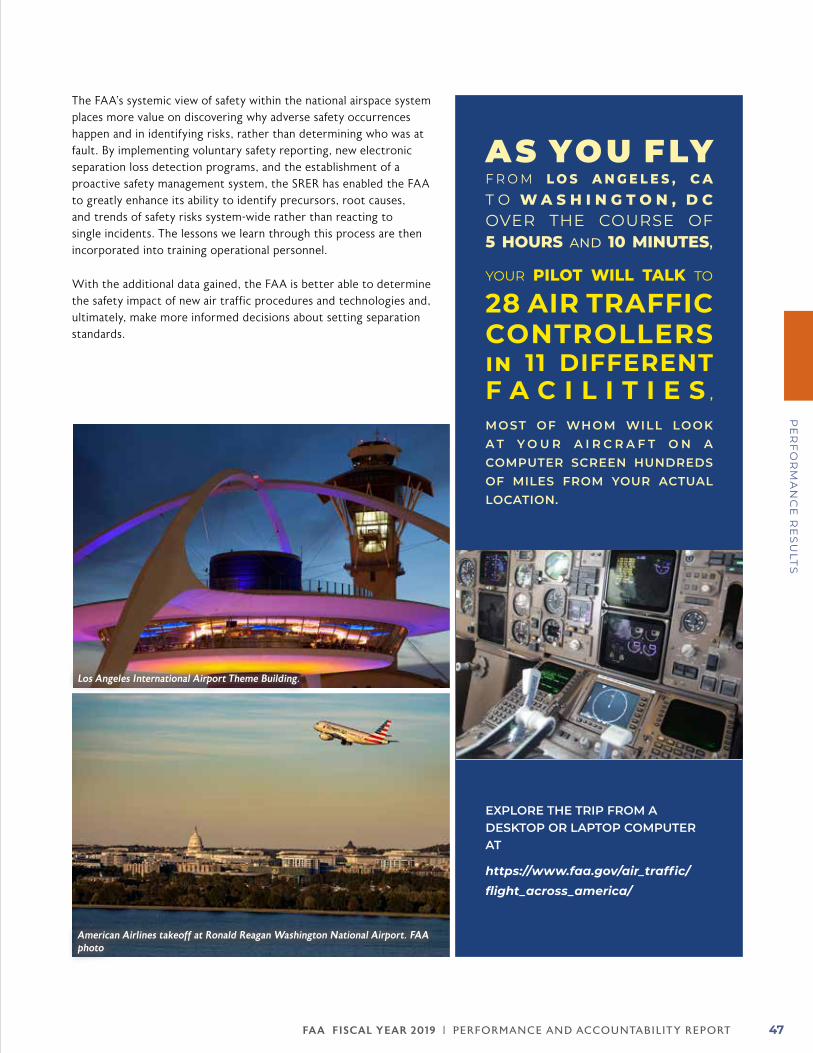
FA A FISCAL YEAR 2019 | PERFORMANCE AND ACCOUNTABILIT Y REPORT 47
PE
RF
OR
MA
NC
E R
ES
ULT
S
Los Angeles International Airport Theme Building.
American Airlines takeoff at Ronald Reagan Washington National Airport. FAA photo
The FAA’s systemic view of safety within the national airspace system places more value on discovering why adverse safety occurrences happen and in identifying risks, rather than determining who was at fault. By implementing voluntary safety reporting, new electronic separation loss detection programs, and the establishment of a proactive safety management system, the SRER has enabled the FAA to greatly enhance its ability to identify precursors, root causes, and trends of safety risks system-wide rather than reacting to single incidents. The lessons we learn through this process are then incorporated into training operational personnel.
With the additional data gained, the FAA is better able to determine the safety impact of new air traffic procedures and technologies and, ultimately, make more informed decisions about setting separation standards.
AS YOU FLY F R O M L O S A N G E L E S , C A T O W A S H I N G T O N , D C OVER THE COURSE OF5 HOURS and 10 MINUTES,
YOUR PILOT WILL TALK TO
28 AIR TRAFFIC CONTROLLERS in 11 DIFFERENT F A C I L I T I E S ,
MOST OF WHOM WILL LOOKA T Y O U R A I R C R A F T O N A COMPUTER SCREEN HUNDREDS OF MILES FROM YOUR ACTUAL LOCATION.
EXPLORE THE TRIP FROM A DESKTOP OR LAPTOP COMPUTER AT
https://www.faa.gov/air_traffic/flight_across_america/
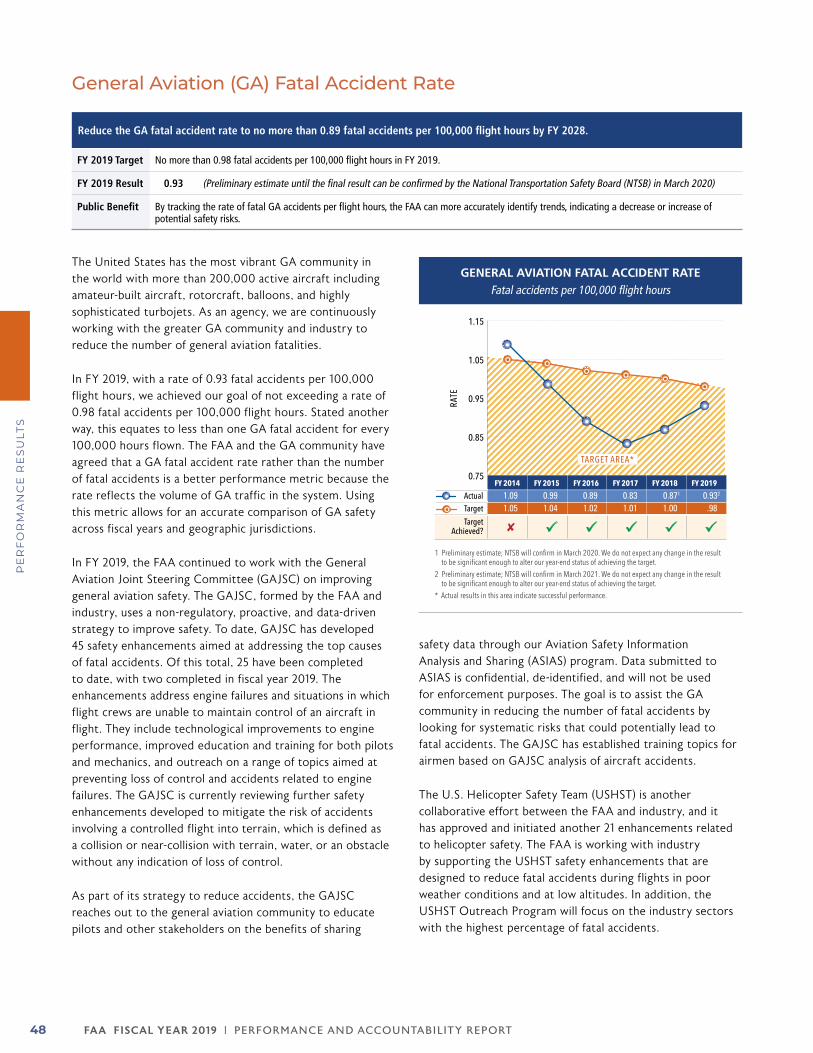
FA A FISCAL YEAR 2019 | PERFORMANCE AND ACCOUNTABILIT Y REPORT48
PE
RF
OR
MA
NC
E R
ES
ULT
S
General Aviation (GA) Fatal Accident Rate
Reduce the GA fatal accident rate to no more than 0.89 fatal accidents per 100,000 flight hours by FY 2028.
FY 2019 Target No more than 0.98 fatal accidents per 100,000 flight hours in FY 2019.
FY 2019 Result 0.93 (Preliminary estimate until the final result can be confirmed by the National Transportation Safety Board (NTSB) in March 2020)
Public Benefit By tracking the rate of fatal GA accidents per flight hours, the FAA can more accurately identify trends, indicating a decrease or increase of potential safety risks.
The United States has the most vibrant GA community in the world with more than 200,000 active aircraft including amateur-built aircraft, rotorcraft, balloons, and highly sophisticated turbojets. As an agency, we are continuously working with the greater GA community and industry to reduce the number of general aviation fatalities.
In FY 2019, with a rate of 0.93 fatal accidents per 100,000 flight hours, we achieved our goal of not exceeding a rate of 0.98 fatal accidents per 100,000 flight hours. Stated another way, this equates to less than one GA fatal accident for every 100,000 hours flown. The FAA and the GA community have agreed that a GA fatal accident rate rather than the number of fatal accidents is a better performance metric because the rate reflects the volume of GA traffic in the system. Using this metric allows for an accurate comparison of GA safety across fiscal years and geographic jurisdictions.
In FY 2019, the FAA continued to work with the General Aviation Joint Steering Committee (GAJSC) on improving general aviation safety. The GAJSC, formed by the FAA and industry, uses a non-regulatory, proactive, and data-driven strategy to improve safety. To date, GAJSC has developed 45 safety enhancements aimed at addressing the top causes of fatal accidents. Of this total, 25 have been completed to date, with two completed in fiscal year 2019. The enhancements address engine failures and situations in which flight crews are unable to maintain control of an aircraft in flight. They include technological improvements to engine performance, improved education and training for both pilots and mechanics, and outreach on a range of topics aimed at preventing loss of control and accidents related to engine failures. The GAJSC is currently reviewing further safety enhancements developed to mitigate the risk of accidents involving a controlled flight into terrain, which is defined as a collision or near-collision with terrain, water, or an obstacle without any indication of loss of control.
As part of its strategy to reduce accidents, the GAJSC reaches out to the general aviation community to educate pilots and other stakeholders on the benefits of sharing
safety data through our Aviation Safety Information Analysis and Sharing (ASIAS) program. Data submitted to ASIAS is confidential, de-identified, and will not be used for enforcement purposes. The goal is to assist the GA community in reducing the number of fatal accidents by looking for systematic risks that could potentially lead to fatal accidents. The GAJSC has established training topics for airmen based on GAJSC analysis of aircraft accidents.
The U.S. Helicopter Safety Team (USHST) is another collaborative effort between the FAA and industry, and it has approved and initiated another 21 enhancements related to helicopter safety. The FAA is working with industry by supporting the USHST safety enhancements that are designed to reduce fatal accidents during flights in poor weather conditions and at low altitudes. In addition, the USHST Outreach Program will focus on the industry sectors with the highest percentage of fatal accidents.
GENERAL AVIATION FATAL ACCIDENT RATE Fatal accidents per 100,000 flight hours
RATE
ActualTarget
TargetAchieved?
1 Preliminary estimate; NTSB will confirm in March 2020. We do not expect any change in the result to be significant enough to alter our year-end status of achieving the target.
2 Preliminary estimate; NTSB will confirm in March 2021. We do not expect any change in the result to be significant enough to alter our year-end status of achieving the target.
* Actual results in this area indicate successful performance.
1.091.05
✘
0.991.04
0.891.02
0.831.01
0.871
1.00
0.932
.98
0.75
0.85
0.95
1.05
1.15
FY 2019FY 2018FY 2017FY 2016FY 2015FY 2014
TARGET AREA*
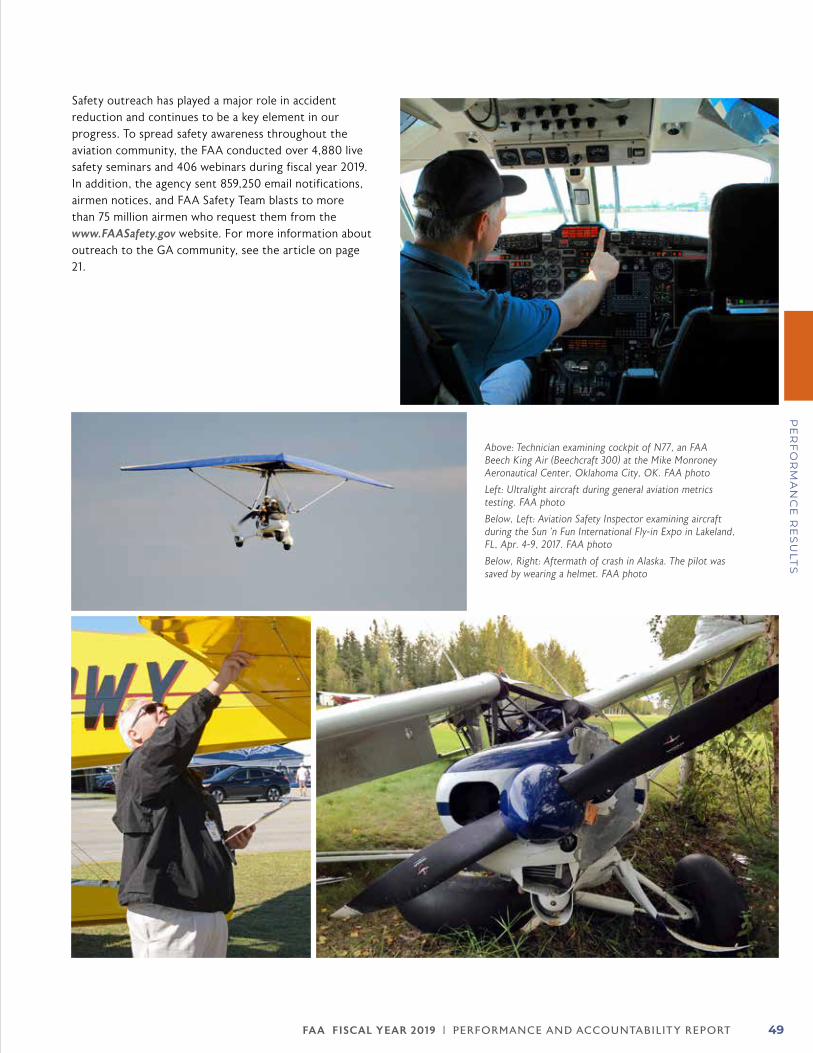
FA A FISCAL YEAR 2019 | PERFORMANCE AND ACCOUNTABILIT Y REPORT 49
PE
RF
OR
MA
NC
E R
ES
ULT
S
Safety outreach has played a major role in accident reduction and continues to be a key element in our progress. To spread safety awareness throughout the aviation community, the FAA conducted over 4,880 live safety seminars and 406 webinars during fiscal year 2019. In addition, the agency sent 859,250 email notifications, airmen notices, and FAA Safety Team blasts to more than 75 million airmen who request them from the www.FAASafety.gov website. For more information about outreach to the GA community, see the article on page 21.
Above: Technician examining cockpit of N77, an FAA Beech King Air (Beechcraft 300) at the Mike Monroney Aeronautical Center, Oklahoma City, OK. FAA photo
Left: Ultralight aircraft during general aviation metrics testing. FAA photo
Below, Left: Aviation Safety Inspector examining aircraft during the Sun 'n Fun International Fly-in Expo in Lakeland, FL, Apr. 4-9, 2017. FAA photo
Below, Right: Aftermath of crash in Alaska. The pilot was saved by wearing a helmet. FAA photo
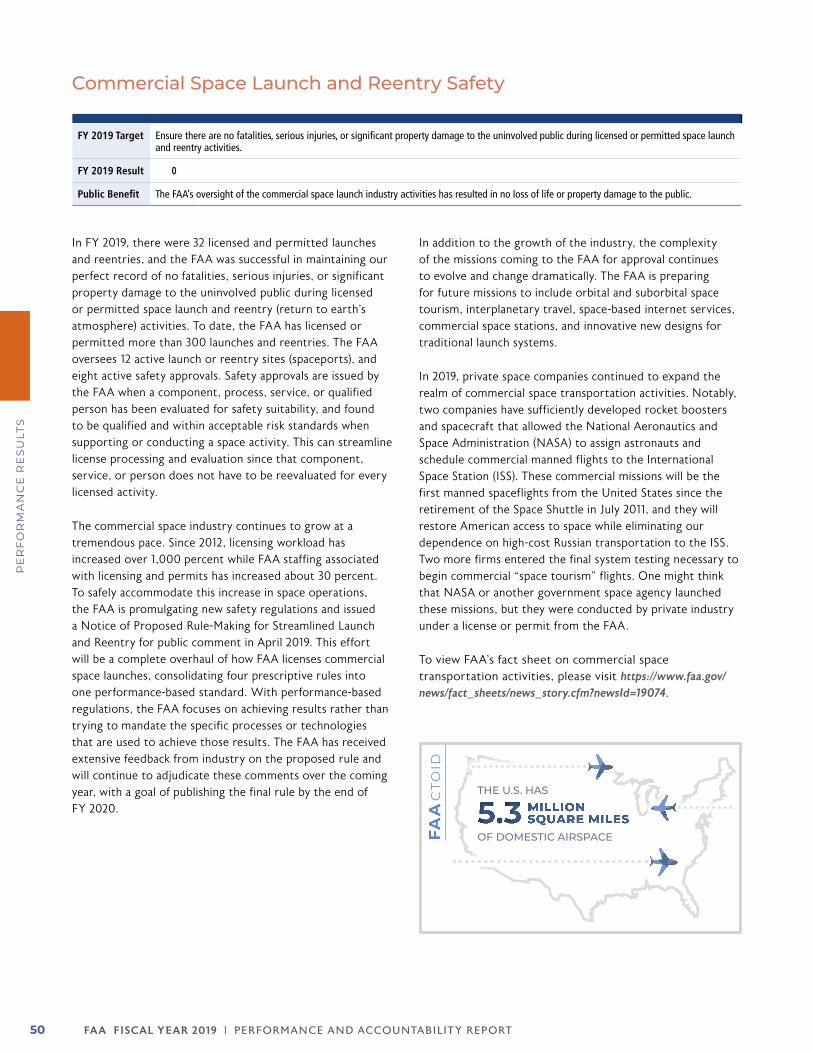
FA A FISCAL YEAR 2019 | PERFORMANCE AND ACCOUNTABILIT Y REPORT50
PE
RF
OR
MA
NC
E R
ES
ULT
S
Commercial Space Launch and Reentry Safety
FY 2019 Target Ensure there are no fatalities, serious injuries, or significant property damage to the uninvolved public during licensed or permitted space launch and reentry activities.
FY 2019 Result 0
Public Benefit The FAA’s oversight of the commercial space launch industry activities has resulted in no loss of life or property damage to the public.
In FY 2019, there were 32 licensed and permitted launches and reentries, and the FAA was successful in maintaining our perfect record of no fatalities, serious injuries, or significant property damage to the uninvolved public during licensed or permitted space launch and reentry (return to earth’s atmosphere) activities. To date, the FAA has licensed or permitted more than 300 launches and reentries. The FAA oversees 12 active launch or reentry sites (spaceports), and eight active safety approvals. Safety approvals are issued by the FAA when a component, process, service, or qualified person has been evaluated for safety suitability, and found to be qualified and within acceptable risk standards when supporting or conducting a space activity. This can streamline license processing and evaluation since that component, service, or person does not have to be reevaluated for every licensed activity.
The commercial space industry continues to grow at a tremendous pace. Since 2012, licensing workload has increased over 1,000 percent while FAA staffing associated with licensing and permits has increased about 30 percent. To safely accommodate this increase in space operations, the FAA is promulgating new safety regulations and issued a Notice of Proposed Rule-Making for Streamlined Launch and Reentry for public comment in April 2019. This effort will be a complete overhaul of how FAA licenses commercial space launches, consolidating four prescriptive rules into one performance-based standard. With performance-based regulations, the FAA focuses on achieving results rather than trying to mandate the specific processes or technologies that are used to achieve those results. The FAA has received extensive feedback from industry on the proposed rule and will continue to adjudicate these comments over the coming year, with a goal of publishing the final rule by the end of FY 2020.
In addition to the growth of the industry, the complexity of the missions coming to the FAA for approval continues to evolve and change dramatically. The FAA is preparing for future missions to include orbital and suborbital space tourism, interplanetary travel, space-based internet services, commercial space stations, and innovative new designs for traditional launch systems.
In 2019, private space companies continued to expand the realm of commercial space transportation activities. Notably, two companies have sufficiently developed rocket boosters and spacecraft that allowed the National Aeronautics and Space Administration (NASA) to assign astronauts and schedule commercial manned flights to the International Space Station (ISS). These commercial missions will be the first manned spaceflights from the United States since the retirement of the Space Shuttle in July 2011, and they will restore American access to space while eliminating our dependence on high-cost Russian transportation to the ISS. Two more firms entered the final system testing necessary to begin commercial “space tourism” flights. One might think that NASA or another government space agency launched these missions, but they were conducted by private industry under a license or permit from the FAA.
To view FAA’s fact sheet on commercial space transportation activities, please visit https://www.faa.gov/news/fact_sheets/news_story.cfm?newsId=19074.
FAActo
id
THE U.S. HAS
OF DOMESTIC AIRSPACE5.3 MILLION
SQUARE MILES

FA A FISCAL YEAR 2019 | PERFORMANCE AND ACCOUNTABILIT Y REPORT 51
PE
RF
OR
MA
NC
E R
ES
ULT
S
INFRASTRUCTUREInvest in Infrastructure to Ensure Safety, Mobility and Accessibility and to Stimulate Economic Growth, Productivity and Competitiveness for American Workers and Businesses.
Performance MeasureFY 2016Results
FY 2017Results
FY 2018Results
FY 2019Target
FY 2019Results
FY 2019Status
Noise and Community Engagement: Seminars and/or WorkshopsContinue to facilitate a series of agency-wide, community engagement focused seminars and/or workshops that solidify standard operating procedures.
This is a new
measure for FY 2019
This is a new
measure for FY 2019
This is a new
measure for FY 2019
Facilitate community
engagement events to solidify
standard operating procedures
Incorporated feedback from a
series of community engagement events
that is solidifying standard operating
procedures
✓
Noise and Community Engagement: Noise Screening MethodologyDevelop a noise screening methodology document that will be used to develop updated noise screening capabilities for FAA.
This is a new
measure for FY 2019
This is a new
measure for FY 2019
This is a new
measure for FY 2019
Develop noise screening
methodology
Produced updated noise screening methodology
✓
NextGen Joint Implementation Plan Recommendations*Achieve 80 percent of NextGen priorities Joint Implementation Plan commitments, excluding industry-controlled milestones, within a calendar quarter of their scheduled dates and within 10 percent of the planned cost.
95% 92% 91.3% 80% 97.5% ✓
Unmanned Aircraft System (UAS) Waivers*Maintain the average time for processing (approve or deny) part 107 operational waivers at 45 days for FY 2019.
This was a new
measure for FY 2018
This was a new
measure for FY 2018
17 45 18 ✓
Global Leadership at the International Civil Aviation Organization (ICAO)Identify priority issues or outcomes from the 13th Air Navigation Conference and receive endorsement by the International Advisory Board (IAB) within 90 days of the conference conclusion, and implement an action plan, which will include regional and bilateral outreach, to promote, advance, and secure FAA’s top three objectives relating to safety, air navigation, and emerging issues for the ICAO 40th Assembly.
This is a new
measure for FY 2019
This is a new
measure for FY 2019
This is a new
measure for FY 2019
Priority issues or outcomes
identified, receive IAB endorsement, implement action
plan
Identified priority issues or outcomes, received endorse-
ment from the IAB, developed and
began implement-ing action plan
✓
*This performance measure supports a DOT Agency Priority Goal. ✓ Target met ✘ Target not met
FA A FISCAL YEAR 2019 | PERFORMANCE AND ACCOUNTABILIT Y REPORT52
PE
RF
OR
MA
NC
E R
ES
ULT
S
Noise and Community Engagement:Seminars and/or Workshops and Noise Screening Methodology
Develop a communication procedure that results in better coordination and collaboration across FAA lines of business, staff offices, and stakeholders to address a wide range of concerns including aircraft noise.
FY 2019 Target Target 1: Continue to facilitate a series of agency-wide community engagement seminars and/or workshops that solidify standard operating procedures.
Target 2: Develop a noise screening methodology document that will be used to develop updated noise screening capabilities for FAA.
FY 2019 Result Target 1: Incorporated feedback from a series of agency-wide community engagement events that is solidifying standard operating procedures.
Target 2: The FAA produced an updated noise screening methodology framework to use as the basis for developing and implementing an updated noise screening tool.
Public Benefit Target 1: Greater consistency in FAA engagement practices nationwide. While the concerns naturally differ from case to case and scenario to scenario across the country, there are often identifiable similarities on which standardized practices are built. The public benefits from experiencing a more unified approach as the FAA conducts its outreach and maintains relationships with communities.
Target 2: Greater consistency in the initial evaluation of noise across different types of actions subject to the National Environmental Policy Act. A more consistent and documented noise screening methodology will aid the public’s understanding of the way FAA makes environmental determinations for noise.
The FAA continues to modernize and improve its air traffic control system and other aspects of the national airspace. In addition, air traffic continues to grow based on market forces and passenger demand. While the FAA has alleviated aircraft noise concerns for a majority of the population through quieter aircraft and more precise flight paths, people who still experience aircraft noise are often vocal in expressing concerns, engaging their local officials, and requesting that flight paths be moved.
As part of its effort to address this issue, in 2019 the FAA developed an updated noise screening methodology and applied new community engagement practices as it facilitated community engagement events. With these accomplishments, the FAA met its two targets related to noise and community engagement for FY 2019.
Since 2016, the FAA has been working to develop standardized, scalable, and repeatable community engagement strategies and practices. The FAA identified where its previous efforts were effective, and where they needed improvement. The FAA developed a new set of national best practices for engaging in a consistent way with communities that face similar airspace challenges. These practices can be scaled up or down based on the concerns and the size of the community.
In FY 2019, the FAA used these best practices in conducting roundtable discussions, and is actively engaging with more
than 35 airport and community roundtable locations around the United States. Roundtable discussions bring together stakeholders and technical advisors from the FAA to address the challenges unique to local airport conditions. Stakeholders include members of the public, regional politicians, and aviation industry representatives who meet and discuss airspace modernization projects, the expected benefits from them, and any potential impacts that could result.
The FAA also held more than 85 workshops across the country in FY 2019. During workshops, the FAA presents detailed information to community stakeholders on how their local airspace works. These workshops help the public understand local traffic flows and any constraints to making changes to traffic patterns.
In addition to these community engagement events, the FAA has been working to improve its noise screening methodology to comply with the National Environmental Policy Act, or NEPA, which requires federal agencies to assess the environmental effects of proposed actions before making decisions. To comply with NEPA, the FAA assesses potential impacts to the environment from proposed actions the agency sponsors, including airport changes and changes to the airspace. Once fully validated, the FAA’s new noise screening methodology will help the agency develop clear justifications for noise-related decisions.
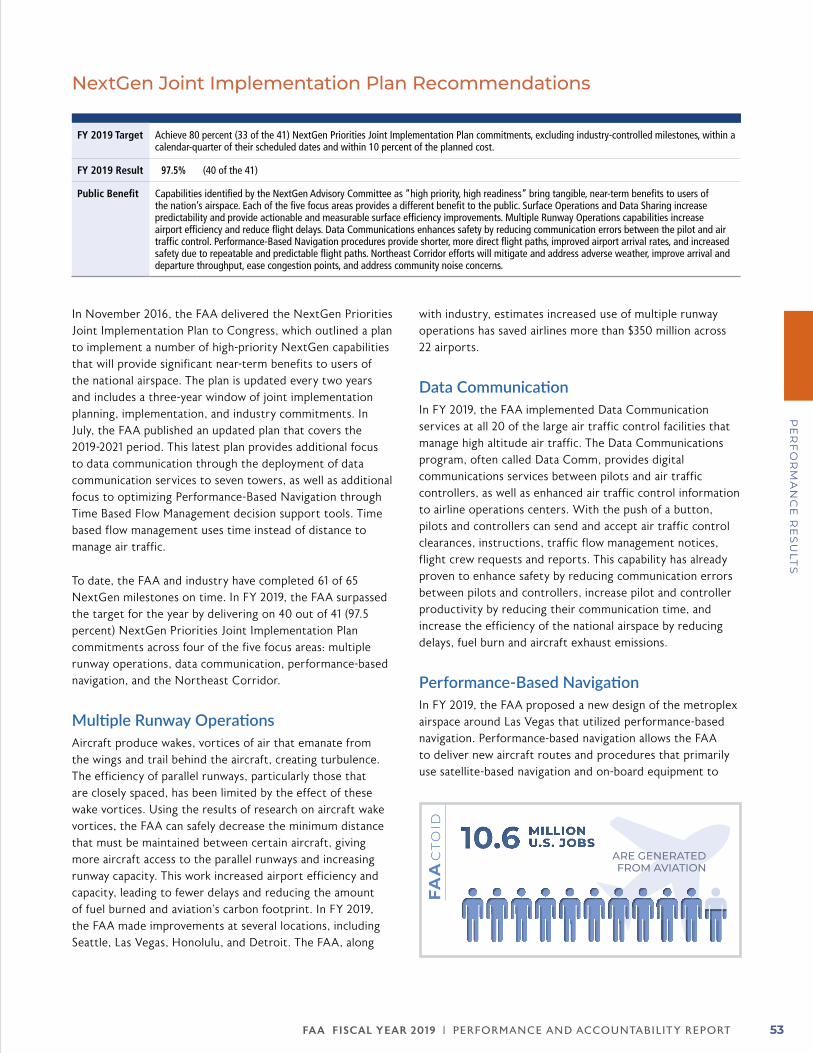
FA A FISCAL YEAR 2019 | PERFORMANCE AND ACCOUNTABILIT Y REPORT 53
PE
RF
OR
MA
NC
E R
ES
ULT
S
NextGen Joint Implementation Plan Recommendations
FY 2019 Target Achieve 80 percent (33 of the 41) NextGen Priorities Joint Implementation Plan commitments, excluding industry-controlled milestones, within a calendar-quarter of their scheduled dates and within 10 percent of the planned cost.
FY 2019 Result 97.5% (40 of the 41)
Public Benefit Capabilities identified by the NextGen Advisory Committee as “high priority, high readiness” bring tangible, near-term benefits to users of the nation’s airspace. Each of the five focus areas provides a different benefit to the public. Surface Operations and Data Sharing increase predictability and provide actionable and measurable surface efficiency improvements. Multiple Runway Operations capabilities increase airport efficiency and reduce flight delays. Data Communications enhances safety by reducing communication errors between the pilot and air traffic control. Performance-Based Navigation procedures provide shorter, more direct flight paths, improved airport arrival rates, and increased safety due to repeatable and predictable flight paths. Northeast Corridor efforts will mitigate and address adverse weather, improve arrival and departure throughput, ease congestion points, and address community noise concerns.
In November 2016, the FAA delivered the NextGen Priorities Joint Implementation Plan to Congress, which outlined a plan to implement a number of high-priority NextGen capabilities that will provide significant near-term benefits to users of the national airspace. The plan is updated every two years and includes a three-year window of joint implementation planning, implementation, and industry commitments. In July, the FAA published an updated plan that covers the 2019-2021 period. This latest plan provides additional focus to data communication through the deployment of data communication services to seven towers, as well as additional focus to optimizing Performance-Based Navigation through Time Based Flow Management decision support tools. Time based flow management uses time instead of distance to manage air traffic.
To date, the FAA and industry have completed 61 of 65 NextGen milestones on time. In FY 2019, the FAA surpassed the target for the year by delivering on 40 out of 41 (97.5 percent) NextGen Priorities Joint Implementation Plan commitments across four of the five focus areas: multiple runway operations, data communication, performance-based navigation, and the Northeast Corridor.
Multiple Runway OperationsAircraft produce wakes, vortices of air that emanate from the wings and trail behind the aircraft, creating turbulence. The efficiency of parallel runways, particularly those that are closely spaced, has been limited by the effect of these wake vortices. Using the results of research on aircraft wake vortices, the FAA can safely decrease the minimum distance that must be maintained between certain aircraft, giving more aircraft access to the parallel runways and increasing runway capacity. This work increased airport efficiency and capacity, leading to fewer delays and reducing the amount of fuel burned and aviation’s carbon footprint. In FY 2019, the FAA made improvements at several locations, including Seattle, Las Vegas, Honolulu, and Detroit. The FAA, along
with industry, estimates increased use of multiple runway operations has saved airlines more than $350 million across 22 airports.
Data CommunicationIn FY 2019, the FAA implemented Data Communication services at all 20 of the large air traffic control facilities that manage high altitude air traffic. The Data Communications program, often called Data Comm, provides digital communications services between pilots and air traffic controllers, as well as enhanced air traffic control information to airline operations centers. With the push of a button, pilots and controllers can send and accept air traffic control clearances, instructions, traffic flow management notices, flight crew requests and reports. This capability has already proven to enhance safety by reducing communication errors between pilots and controllers, increase pilot and controller productivity by reducing their communication time, and increase the efficiency of the national airspace by reducing delays, fuel burn and aircraft exhaust emissions.
Performance-Based NavigationIn FY 2019, the FAA proposed a new design of the metroplex airspace around Las Vegas that utilized performance-based navigation. Performance-based navigation allows the FAA to deliver new aircraft routes and procedures that primarily use satellite-based navigation and on-board equipment to
FAActo
id 10.6 MILLION U.S. JOBS
ARE GENERATED FROM AVIATION
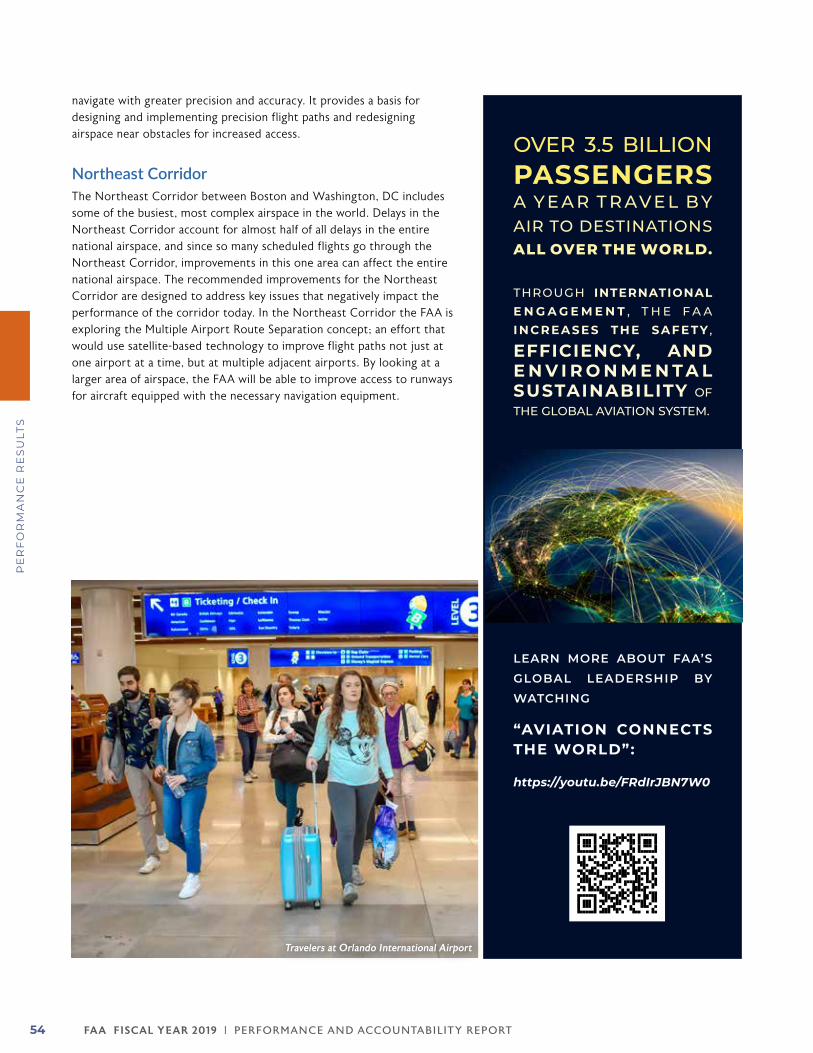
FA A FISCAL YEAR 2019 | PERFORMANCE AND ACCOUNTABILIT Y REPORT54
PE
RF
OR
MA
NC
E R
ES
ULT
S
navigate with greater precision and accuracy. It provides a basis for designing and implementing precision flight paths and redesigning airspace near obstacles for increased access.
Northeast CorridorThe Northeast Corridor between Boston and Washington, DC includes some of the busiest, most complex airspace in the world. Delays in the Northeast Corridor account for almost half of all delays in the entire national airspace, and since so many scheduled flights go through the Northeast Corridor, improvements in this one area can affect the entire national airspace. The recommended improvements for the Northeast Corridor are designed to address key issues that negatively impact the performance of the corridor today. In the Northeast Corridor the FAA is exploring the Multiple Airport Route Separation concept; an effort that would use satellite-based technology to improve flight paths not just at one airport at a time, but at multiple adjacent airports. By looking at a larger area of airspace, the FAA will be able to improve access to runways for aircraft equipped with the necessary navigation equipment.
OVER 3.5 BILLION PASSENGERSA Y E A R T R AV E L B Y AIR TO DESTINATIONS ALL OVER THE WORLD.
THROUGH INTERNATIONAL E N G A G E M E N T , T H E F A A INCREASES THE SAFETY ,
EFFICIENCY, AND E N V I R O N M E N T A L SUSTAINABILITY OF THE GLOBAL AVIATION SYSTEM.
LEARN MORE ABOUT FAA’S
GLOBAL LEADERSHIP BY
WATCHING
“AVIATION CONNECTS THE WORLD”:
https://youtu.be/FRdIrJBN7W0
Travelers at Orlando International Airport
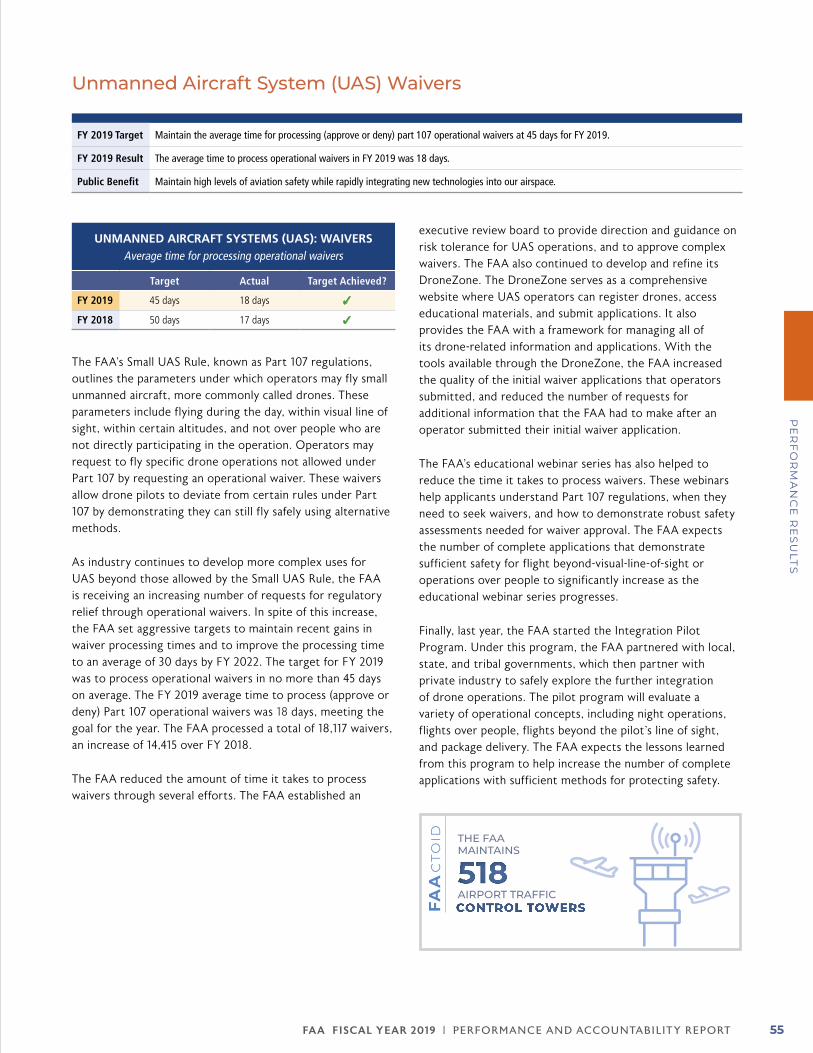
FA A FISCAL YEAR 2019 | PERFORMANCE AND ACCOUNTABILIT Y REPORT 55
PE
RF
OR
MA
NC
E R
ES
ULT
S
Unmanned Aircraft System (UAS) Waivers
FY 2019 Target Maintain the average time for processing (approve or deny) part 107 operational waivers at 45 days for FY 2019.
FY 2019 Result The average time to process operational waivers in FY 2019 was 18 days.
Public Benefit Maintain high levels of aviation safety while rapidly integrating new technologies into our airspace.
UNMANNED AIRCRAFT SYSTEMS (UAS): WAIVERS Average time for processing operational waivers
Target Actual Target Achieved?
FY 2019 45 days 18 days ✓
FY 2018 50 days 17 days ✓
The FAA’s Small UAS Rule, known as Part 107 regulations, outlines the parameters under which operators may fly small unmanned aircraft, more commonly called drones. These parameters include flying during the day, within visual line of sight, within certain altitudes, and not over people who are not directly participating in the operation. Operators may request to fly specific drone operations not allowed under Part 107 by requesting an operational waiver. These waivers allow drone pilots to deviate from certain rules under Part 107 by demonstrating they can still fly safely using alternative methods.
As industry continues to develop more complex uses for UAS beyond those allowed by the Small UAS Rule, the FAA is receiving an increasing number of requests for regulatory relief through operational waivers. In spite of this increase, the FAA set aggressive targets to maintain recent gains in waiver processing times and to improve the processing time to an average of 30 days by FY 2022. The target for FY 2019 was to process operational waivers in no more than 45 days on average. The FY 2019 average time to process (approve or deny) Part 107 operational waivers was 18 days, meeting the goal for the year. The FAA processed a total of 18,117 waivers, an increase of 14,415 over FY 2018.
The FAA reduced the amount of time it takes to process waivers through several efforts. The FAA established an
executive review board to provide direction and guidance on risk tolerance for UAS operations, and to approve complex waivers. The FAA also continued to develop and refine its DroneZone. The DroneZone serves as a comprehensive website where UAS operators can register drones, access educational materials, and submit applications. It also provides the FAA with a framework for managing all of its drone-related information and applications. With the tools available through the DroneZone, the FAA increased the quality of the initial waiver applications that operators submitted, and reduced the number of requests for additional information that the FAA had to make after an operator submitted their initial waiver application.
The FAA’s educational webinar series has also helped to reduce the time it takes to process waivers. These webinars help applicants understand Part 107 regulations, when they need to seek waivers, and how to demonstrate robust safety assessments needed for waiver approval. The FAA expects the number of complete applications that demonstrate sufficient safety for flight beyond-visual-line-of-sight or operations over people to significantly increase as the educational webinar series progresses.
Finally, last year, the FAA started the Integration Pilot Program. Under this program, the FAA partnered with local, state, and tribal governments, which then partner with private industry to safely explore the further integration of drone operations. The pilot program will evaluate a variety of operational concepts, including night operations, flights over people, flights beyond the pilot’s line of sight, and package delivery. The FAA expects the lessons learned from this program to help increase the number of complete applications with sufficient methods for protecting safety.
FAActo
id THE FAA MAINTAINS
AIRPORT TRAFFIC518CONTROL TOWERS
FA A FISCAL YEAR 2019 | PERFORMANCE AND ACCOUNTABILIT Y REPORT56
PE
RF
OR
MA
NC
E R
ES
ULT
S
FY 2019 Target Identify priority issues or outcomes from the 13th Air Navigation Conference and receive endorsement by the International Advisory Board within 90 days of the conference conclusion, and implement an action plan, which will include regional and bilateral outreach, to promote, advance, and secure FAA’s top three objectives relating to safety, air navigation, and emerging issues for the ICAO 40th Assembly.
FY 2019 Result The FAA provided to the International Advisory Board a detailed briefing on the outcomes of the 13th Air Navigation Conference within 90 days of its conclusion. This included the provision of a multi-tiered plan, capitalizing on our regional and bilateral relationships, to promote, advance, and secure FAA’s top three objectives relating to safety, air navigation, and emerging issues for the ICAO 40th Assembly.
Public Benefit Enhancing safety for the flying public by shaping global aviation standards and exchanging best practices to improve aviation safety, efficiency, and environmental sustainability.
The International Civil Aviation Organization (ICAO) is an agency of the United Nations, and the globally recognized standards-setting organization for the civil aviation community. ICAO not only shapes the regulatory landscapes of its 193 member states, it also provides the technical and diplomatic framework needed to debate and resolve the challenges involved in promoting safe and efficient air travel across the globe.
The FAA plays a critical leadership role at every level of ICAO’s standards-setting process. This includes providing subject matter experts for ICAO panels, committees, task forces, and advisory groups. The FAA also provides a participant to the Air Navigation Commission (ICAO’s standing technical body), which helps to ensure the technical excellence of the organization’s work, as well as the efficacy of the standards it promulgates.
This year the FAA accomplished its target by identifying priority issues and outcomes from the 13th Air Navigation Conference, receiving endorsement of these issues by the International Advisory Board within 90 days of the conference, and developing and implementing an action plan to secure the FAA’s objectives relating to safety, air navigation, and emerging issues at the ICAO 40th Assembly held in October 2019.
This past year, the FAA sought to highlight its highest objectives related to safety, air navigation, and emerging issues for discussion and consideration at the 40th triennial ICAO assembly. The FAA began by working with international partners at ICAO headquarters, participating in workshops across the globe, and engaging directly with international partners to highlight the importance of these objectives and how to address them. This work culminated in the presentation of several papers at the 13th ICAO Air
Navigation Conference, held in October 2018, which planned the technical discussions for the 40th Assembly. In addition, broad agreement was reached that the issues raised by the FAA were important globally and should be considered during the ICAO assembly. The FAA’s papers discussed the direction of the Global Aviation Safety Plan, the Global Air Navigation Plan, and emerging issues such as supersonic aircraft, drones, commercial space activities, and cybersecurity.
FAA staff provided a detailed briefing to the International Advisory Board on the outcomes of the conference within 90 days of its conclusion. The International Advisory Board is comprised of FAA executives who lead international activities and oversees implementation of the FAA’s international strategy. The FAA’s briefing included a multi-tiered plan for leveraging our regional and bilateral relationships to promote, advance, and secure the FAA’s top objectives relating to safety, air navigation, and emerging issues at the ICAO 40th Assembly.
With the FAA using its plan to promote, advance, and secure top priorities, the U.S. achieved several successes at ICAO's 40th Assembly, which was held from September 24 until October 4, 2019. The U.S. marshalled support for numerous aviation safety issues, particularly pilot training. In addition, the U.S. garnered support for several emerging issues, such as supporting a global aviation trust framework for cybersecurity, establishing global support for reaffirming several environmental initiatives, and establishing working groups that will address safety and legal issues related to the environmental initiatives. The U.S. also successfully sponsored assembly resolutions that support global efforts to increase the aviation sector's collective impact in combatting human trafficking, and reinforce the importance of ICAO's commitment to strengthened policies on ethics, transparency, and accountability, with a focus on protecting whistleblowers against retaliation.
Global Leadership at the International Civil Aviation Organization (ICAO)
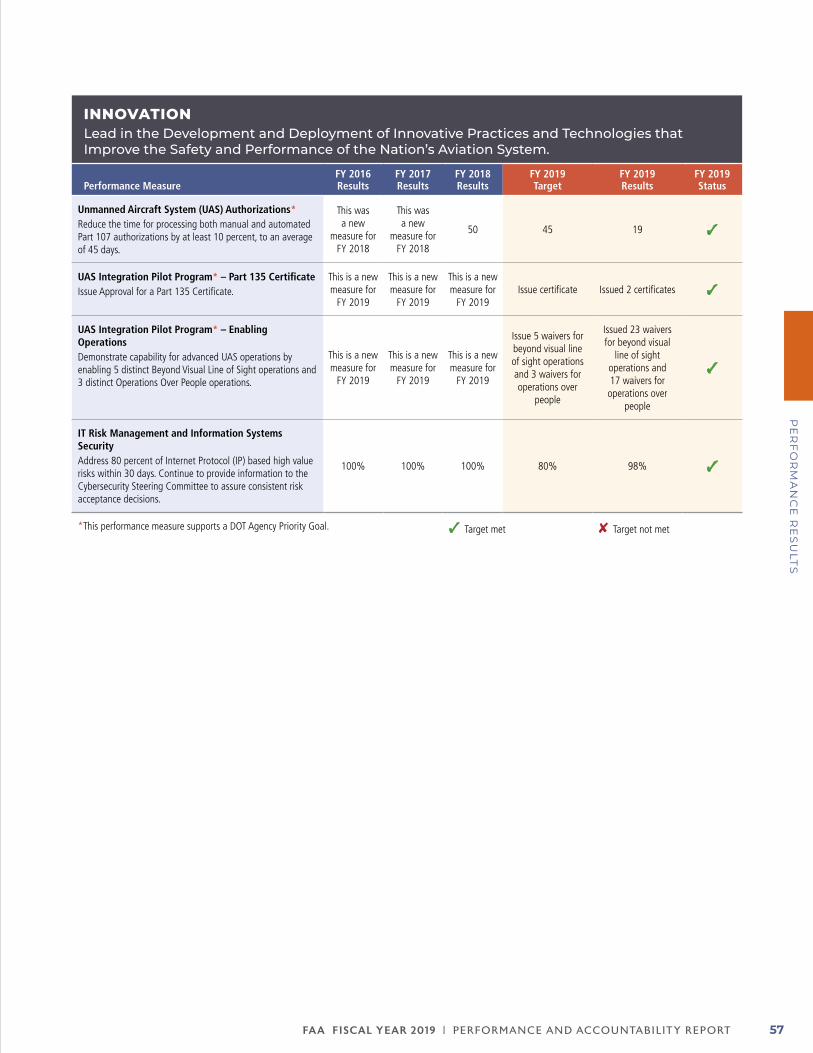
FA A FISCAL YEAR 2019 | PERFORMANCE AND ACCOUNTABILIT Y REPORT 57
PE
RF
OR
MA
NC
E R
ES
ULT
S
INNOVATION Lead in the Development and Deployment of Innovative Practices and Technologies that Improve the Safety and Performance of the Nation’s Aviation System.
Performance MeasureFY 2016Results
FY 2017Results
FY 2018Results
FY 2019Target
FY 2019Results
FY 2019Status
Unmanned Aircraft System (UAS) Authorizations*Reduce the time for processing both manual and automated Part 107 authorizations by at least 10 percent, to an average of 45 days.
This was a new
measure for FY 2018
This was a new
measure for FY 2018
50 45 19 ✓
UAS Integration Pilot Program* – Part 135 CertificateIssue Approval for a Part 135 Certificate.
This is a new measure for
FY 2019
This is a new measure for
FY 2019
This is a new measure for
FY 2019Issue certificate Issued 2 certificates ✓
UAS Integration Pilot Program* – Enabling OperationsDemonstrate capability for advanced UAS operations by enabling 5 distinct Beyond Visual Line of Sight operations and 3 distinct Operations Over People operations.
This is a new measure for
FY 2019
This is a new measure for
FY 2019
This is a new measure for
FY 2019
Issue 5 waivers for beyond visual line of sight operations and 3 waivers for operations over
people
Issued 23 waivers for beyond visual
line of sight operations and 17 waivers for operations over
people
✓
IT Risk Management and Information Systems SecurityAddress 80 percent of Internet Protocol (IP) based high value risks within 30 days. Continue to provide information to the Cybersecurity Steering Committee to assure consistent risk acceptance decisions.
100% 100% 100% 80% 98% ✓
*This performance measure supports a DOT Agency Priority Goal. ✓ Target met ✘ Target not met
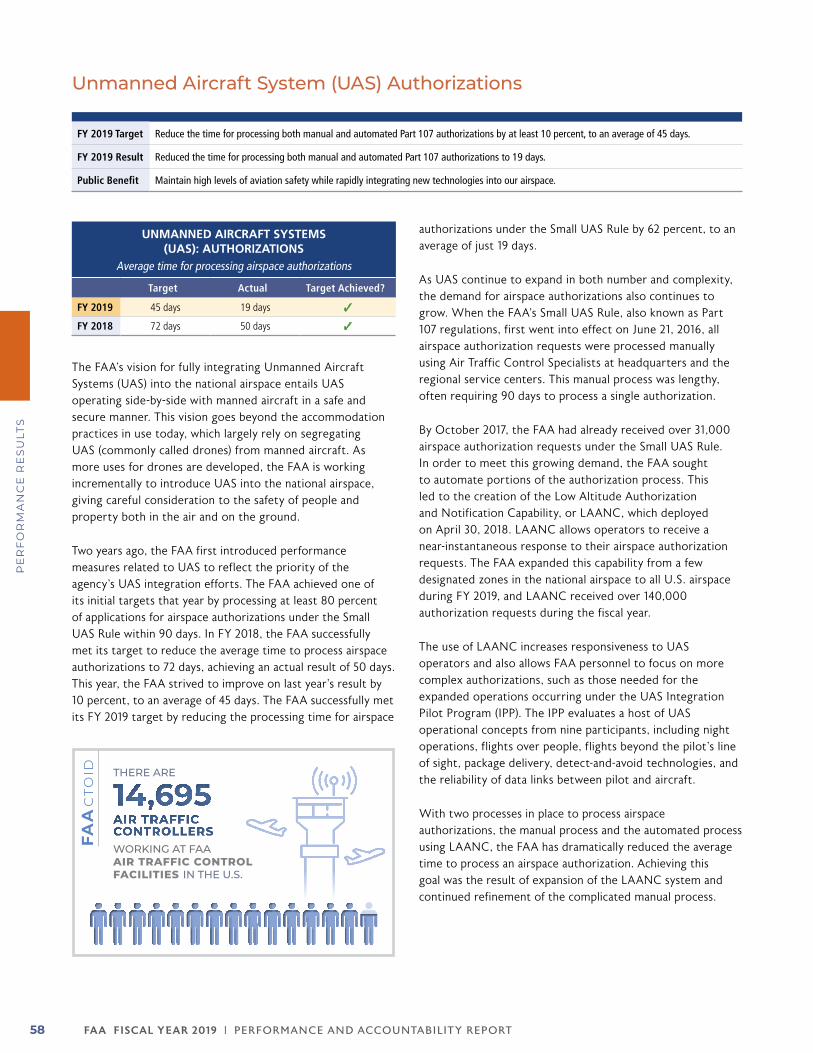
FA A FISCAL YEAR 2019 | PERFORMANCE AND ACCOUNTABILIT Y REPORT58
PE
RF
OR
MA
NC
E R
ES
ULT
S
Unmanned Aircraft System (UAS) Authorizations
FY 2019 Target Reduce the time for processing both manual and automated Part 107 authorizations by at least 10 percent, to an average of 45 days.
FY 2019 Result Reduced the time for processing both manual and automated Part 107 authorizations to 19 days.
Public Benefit Maintain high levels of aviation safety while rapidly integrating new technologies into our airspace.
UNMANNED AIRCRAFT SYSTEMS (UAS): AUTHORIZATIONS
Average time for processing airspace authorizations
Target Actual Target Achieved?
FY 2019 45 days 19 days ✓
FY 2018 72 days 50 days ✓
The FAA’s vision for fully integrating Unmanned Aircraft Systems (UAS) into the national airspace entails UAS operating side-by-side with manned aircraft in a safe and secure manner. This vision goes beyond the accommodation practices in use today, which largely rely on segregating UAS (commonly called drones) from manned aircraft. As more uses for drones are developed, the FAA is working incrementally to introduce UAS into the national airspace, giving careful consideration to the safety of people and property both in the air and on the ground.
Two years ago, the FAA first introduced performance measures related to UAS to reflect the priority of the agency’s UAS integration efforts. The FAA achieved one of its initial targets that year by processing at least 80 percent of applications for airspace authorizations under the Small UAS Rule within 90 days. In FY 2018, the FAA successfully met its target to reduce the average time to process airspace authorizations to 72 days, achieving an actual result of 50 days. This year, the FAA strived to improve on last year’s result by 10 percent, to an average of 45 days. The FAA successfully met its FY 2019 target by reducing the processing time for airspace
authorizations under the Small UAS Rule by 62 percent, to an average of just 19 days.
As UAS continue to expand in both number and complexity, the demand for airspace authorizations also continues to grow. When the FAA’s Small UAS Rule, also known as Part 107 regulations, first went into effect on June 21, 2016, all airspace authorization requests were processed manually using Air Traffic Control Specialists at headquarters and the regional service centers. This manual process was lengthy, often requiring 90 days to process a single authorization.
By October 2017, the FAA had already received over 31,000 airspace authorization requests under the Small UAS Rule. In order to meet this growing demand, the FAA sought to automate portions of the authorization process. This led to the creation of the Low Altitude Authorization and Notification Capability, or LAANC, which deployed on April 30, 2018. LAANC allows operators to receive a near-instantaneous response to their airspace authorization requests. The FAA expanded this capability from a few designated zones in the national airspace to all U.S. airspace during FY 2019, and LAANC received over 140,000 authorization requests during the fiscal year.
The use of LAANC increases responsiveness to UAS operators and also allows FAA personnel to focus on more complex authorizations, such as those needed for the expanded operations occurring under the UAS Integration Pilot Program (IPP). The IPP evaluates a host of UAS operational concepts from nine participants, including night operations, flights over people, flights beyond the pilot’s line of sight, package delivery, detect-and-avoid technologies, and the reliability of data links between pilot and aircraft.
With two processes in place to process airspace authorizations, the manual process and the automated process using LAANC, the FAA has dramatically reduced the average time to process an airspace authorization. Achieving this goal was the result of expansion of the LAANC system and continued refinement of the complicated manual process.
FAActo
id THERE ARE
WORKING AT FAA AIR TRAFFIC CONTROL FACILITIES IN THE U.S.
14,695 AIR TRAFFIC CONTROLLERS
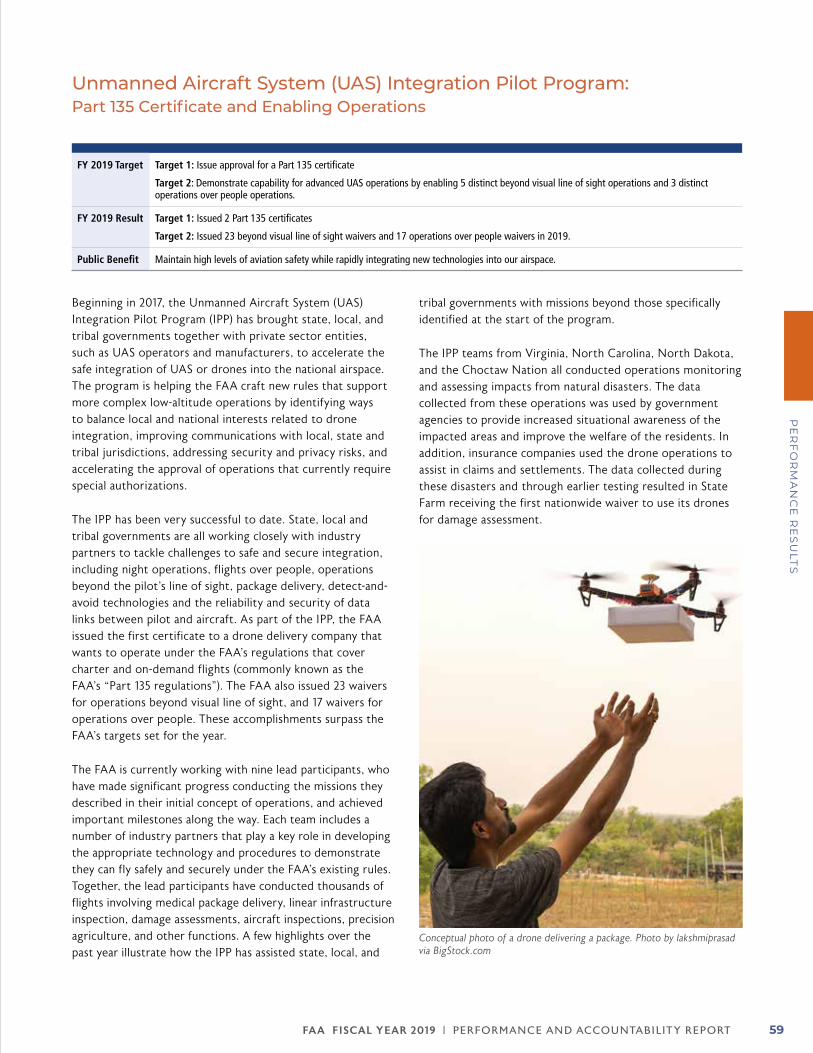
FA A FISCAL YEAR 2019 | PERFORMANCE AND ACCOUNTABILIT Y REPORT 59
PE
RF
OR
MA
NC
E R
ES
ULT
S
FY 2019 Target Target 1: Issue approval for a Part 135 certificate
Target 2: Demonstrate capability for advanced UAS operations by enabling 5 distinct beyond visual line of sight operations and 3 distinct operations over people operations.
FY 2019 Result Target 1: Issued 2 Part 135 certificates
Target 2: Issued 23 beyond visual line of sight waivers and 17 operations over people waivers in 2019.
Public Benefit Maintain high levels of aviation safety while rapidly integrating new technologies into our airspace.
Beginning in 2017, the Unmanned Aircraft System (UAS) Integration Pilot Program (IPP) has brought state, local, and tribal governments together with private sector entities, such as UAS operators and manufacturers, to accelerate the safe integration of UAS or drones into the national airspace. The program is helping the FAA craft new rules that support more complex low-altitude operations by identifying ways to balance local and national interests related to drone integration, improving communications with local, state and tribal jurisdictions, addressing security and privacy risks, and accelerating the approval of operations that currently require special authorizations.
The IPP has been very successful to date. State, local and tribal governments are all working closely with industry partners to tackle challenges to safe and secure integration, including night operations, flights over people, operations beyond the pilot’s line of sight, package delivery, detect-and-avoid technologies and the reliability and security of data links between pilot and aircraft. As part of the IPP, the FAA issued the first certificate to a drone delivery company that wants to operate under the FAA’s regulations that cover charter and on-demand flights (commonly known as the FAA’s “Part 135 regulations”). The FAA also issued 23 waivers for operations beyond visual line of sight, and 17 waivers for operations over people. These accomplishments surpass the FAA’s targets set for the year.
The FAA is currently working with nine lead participants, who have made significant progress conducting the missions they described in their initial concept of operations, and achieved important milestones along the way. Each team includes a number of industry partners that play a key role in developing the appropriate technology and procedures to demonstrate they can fly safely and securely under the FAA’s existing rules. Together, the lead participants have conducted thousands of flights involving medical package delivery, linear infrastructure inspection, damage assessments, aircraft inspections, precision agriculture, and other functions. A few highlights over the past year illustrate how the IPP has assisted state, local, and
tribal governments with missions beyond those specifically identified at the start of the program.
The IPP teams from Virginia, North Carolina, North Dakota, and the Choctaw Nation all conducted operations monitoring and assessing impacts from natural disasters. The data collected from these operations was used by government agencies to provide increased situational awareness of the impacted areas and improve the welfare of the residents. In addition, insurance companies used the drone operations to assist in claims and settlements. The data collected during these disasters and through earlier testing resulted in State Farm receiving the first nationwide waiver to use its drones for damage assessment.
Unmanned Aircraft System (UAS) Integration Pilot Program:Part 135 Certificate and Enabling Operations
Conceptual photo of a drone delivering a package. Photo by lakshmiprasad via BigStock.com
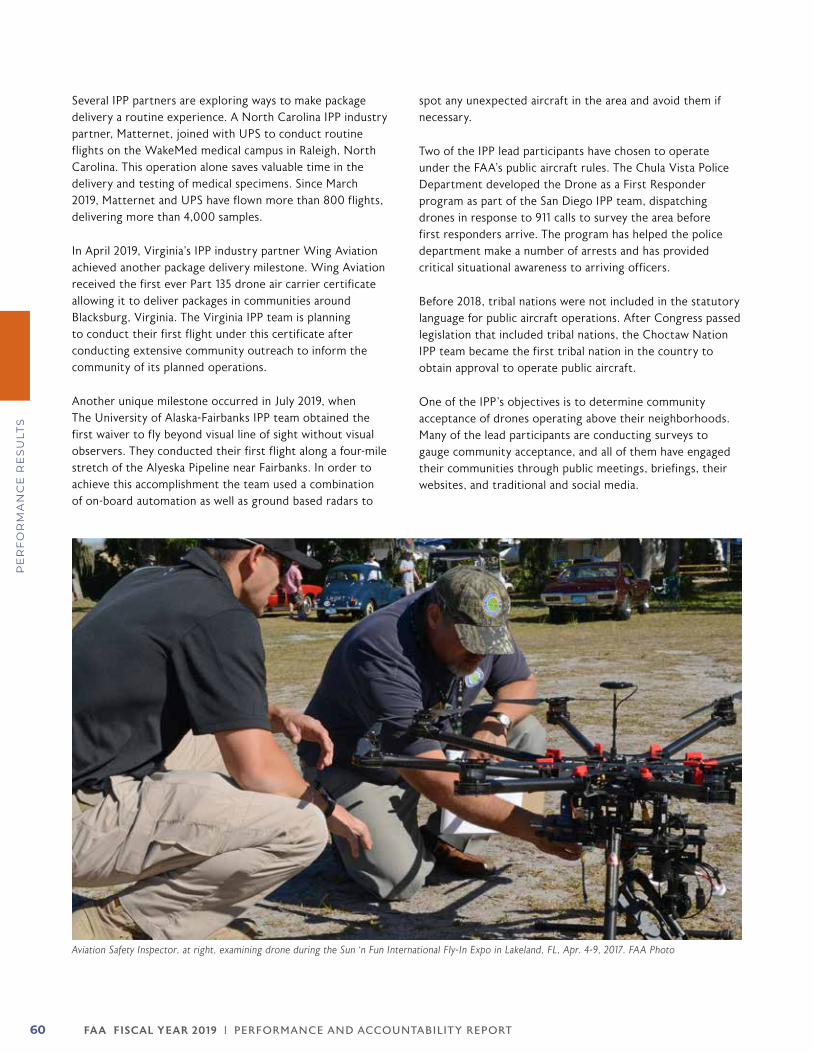
FA A FISCAL YEAR 2019 | PERFORMANCE AND ACCOUNTABILIT Y REPORT60
PE
RF
OR
MA
NC
E R
ES
ULT
S
Several IPP partners are exploring ways to make package delivery a routine experience. A North Carolina IPP industry partner, Matternet, joined with UPS to conduct routine flights on the WakeMed medical campus in Raleigh, North Carolina. This operation alone saves valuable time in the delivery and testing of medical specimens. Since March 2019, Matternet and UPS have flown more than 800 flights, delivering more than 4,000 samples.
In April 2019, Virginia’s IPP industry partner Wing Aviation achieved another package delivery milestone. Wing Aviation received the first ever Part 135 drone air carrier certificate allowing it to deliver packages in communities around Blacksburg, Virginia. The Virginia IPP team is planning to conduct their first flight under this certificate after conducting extensive community outreach to inform the community of its planned operations.
Another unique milestone occurred in July 2019, when The University of Alaska-Fairbanks IPP team obtained the first waiver to fly beyond visual line of sight without visual observers. They conducted their first flight along a four-mile stretch of the Alyeska Pipeline near Fairbanks. In order to achieve this accomplishment the team used a combination of on-board automation as well as ground based radars to
spot any unexpected aircraft in the area and avoid them if necessary.
Two of the IPP lead participants have chosen to operate under the FAA’s public aircraft rules. The Chula Vista Police Department developed the Drone as a First Responder program as part of the San Diego IPP team, dispatching drones in response to 911 calls to survey the area before first responders arrive. The program has helped the police department make a number of arrests and has provided critical situational awareness to arriving officers.
Before 2018, tribal nations were not included in the statutory language for public aircraft operations. After Congress passed legislation that included tribal nations, the Choctaw Nation IPP team became the first tribal nation in the country to obtain approval to operate public aircraft.
One of the IPP’s objectives is to determine community acceptance of drones operating above their neighborhoods. Many of the lead participants are conducting surveys to gauge community acceptance, and all of them have engaged their communities through public meetings, briefings, their websites, and traditional and social media.
Aviation Safety Inspector, at right, examining drone during the Sun ‘n Fun International Fly-In Expo in Lakeland, FL, Apr. 4-9, 2017. FAA Photo
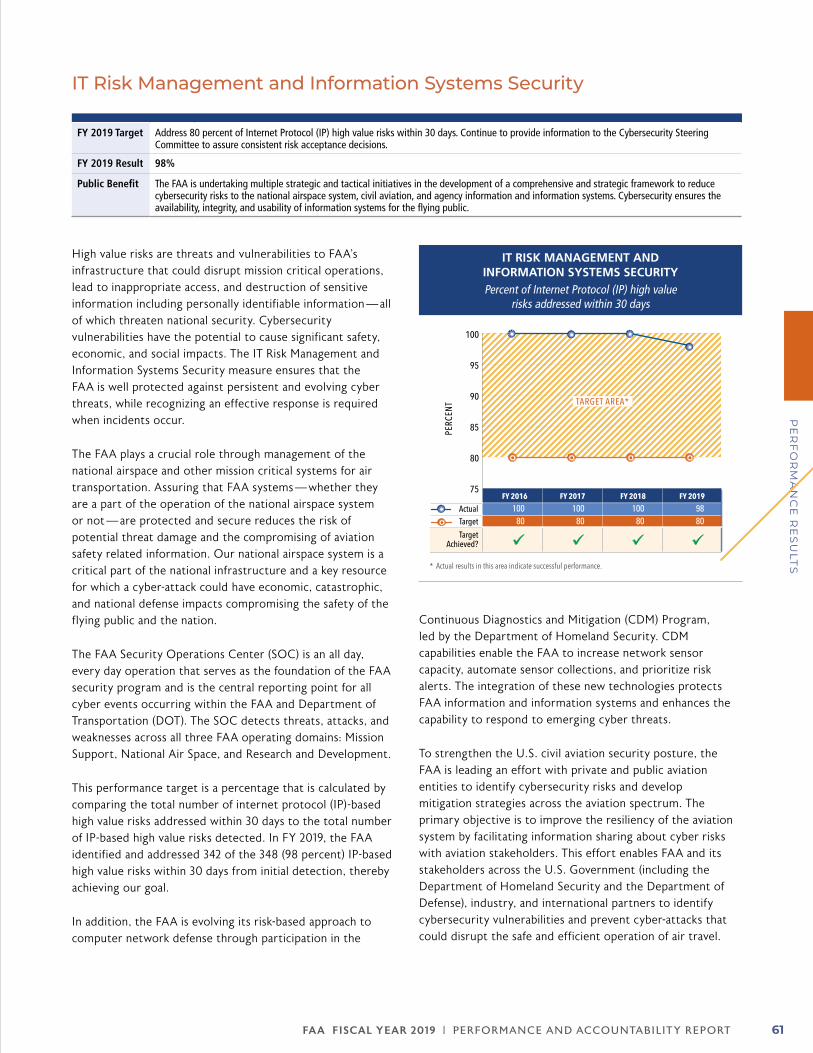
FA A FISCAL YEAR 2019 | PERFORMANCE AND ACCOUNTABILIT Y REPORT 61
PE
RF
OR
MA
NC
E R
ES
ULT
S
IT Risk Management and Information Systems Security
FY 2019 Target Address 80 percent of Internet Protocol (IP) high value risks within 30 days. Continue to provide information to the Cybersecurity Steering Committee to assure consistent risk acceptance decisions.
FY 2019 Result 98%
Public Benefit The FAA is undertaking multiple strategic and tactical initiatives in the development of a comprehensive and strategic framework to reduce cybersecurity risks to the national airspace system, civil aviation, and agency information and information systems. Cybersecurity ensures the availability, integrity, and usability of information systems for the flying public.
High value risks are threats and vulnerabilities to FAA’s infrastructure that could disrupt mission critical operations, lead to inappropriate access, and destruction of sensitive information including personally identifiable information — all of which threaten national security. Cybersecurity vulnerabilities have the potential to cause significant safety, economic, and social impacts. The IT Risk Management and Information Systems Security measure ensures that the FAA is well protected against persistent and evolving cyber threats, while recognizing an effective response is required when incidents occur.
The FAA plays a crucial role through management of the national airspace and other mission critical systems for air transportation. Assuring that FAA systems — whether they are a part of the operation of the national airspace system or not — are protected and secure reduces the risk of potential threat damage and the compromising of aviation safety related information. Our national airspace system is a critical part of the national infrastructure and a key resource for which a cyber-attack could have economic, catastrophic, and national defense impacts compromising the safety of the flying public and the nation.
The FAA Security Operations Center (SOC) is an all day, every day operation that serves as the foundation of the FAA security program and is the central reporting point for all cyber events occurring within the FAA and Department of Transportation (DOT). The SOC detects threats, attacks, and weaknesses across all three FAA operating domains: Mission Support, National Air Space, and Research and Development.
This performance target is a percentage that is calculated by comparing the total number of internet protocol (IP)-based high value risks addressed within 30 days to the total number of IP-based high value risks detected. In FY 2019, the FAA identified and addressed 342 of the 348 (98 percent) IP-based high value risks within 30 days from initial detection, thereby achieving our goal.
In addition, the FAA is evolving its risk-based approach to computer network defense through participation in the
Continuous Diagnostics and Mitigation (CDM) Program, led by the Department of Homeland Security. CDM capabilities enable the FAA to increase network sensor capacity, automate sensor collections, and prioritize risk alerts. The integration of these new technologies protects FAA information and information systems and enhances the capability to respond to emerging cyber threats.
To strengthen the U.S. civil aviation security posture, the FAA is leading an effort with private and public aviation entities to identify cybersecurity risks and develop mitigation strategies across the aviation spectrum. The primary objective is to improve the resiliency of the aviation system by facilitating information sharing about cyber risks with aviation stakeholders. This effort enables FAA and its stakeholders across the U.S. Government (including the Department of Homeland Security and the Department of Defense), industry, and international partners to identify cybersecurity vulnerabilities and prevent cyber-attacks that could disrupt the safe and efficient operation of air travel.
IT RISK MANAGEMENT AND INFORMATION SYSTEMS SECURITYPercent of Internet Protocol (IP) high value
risks addressed within 30 days
PERC
ENT
ActualTarget
TargetAchieved?
10080
10080
10080
9880
75
80
85
90
95
100
FY 2019FY 2018FY 2017FY 2016
TARGET AREA*
* Actual results in this area indicate successful performance.
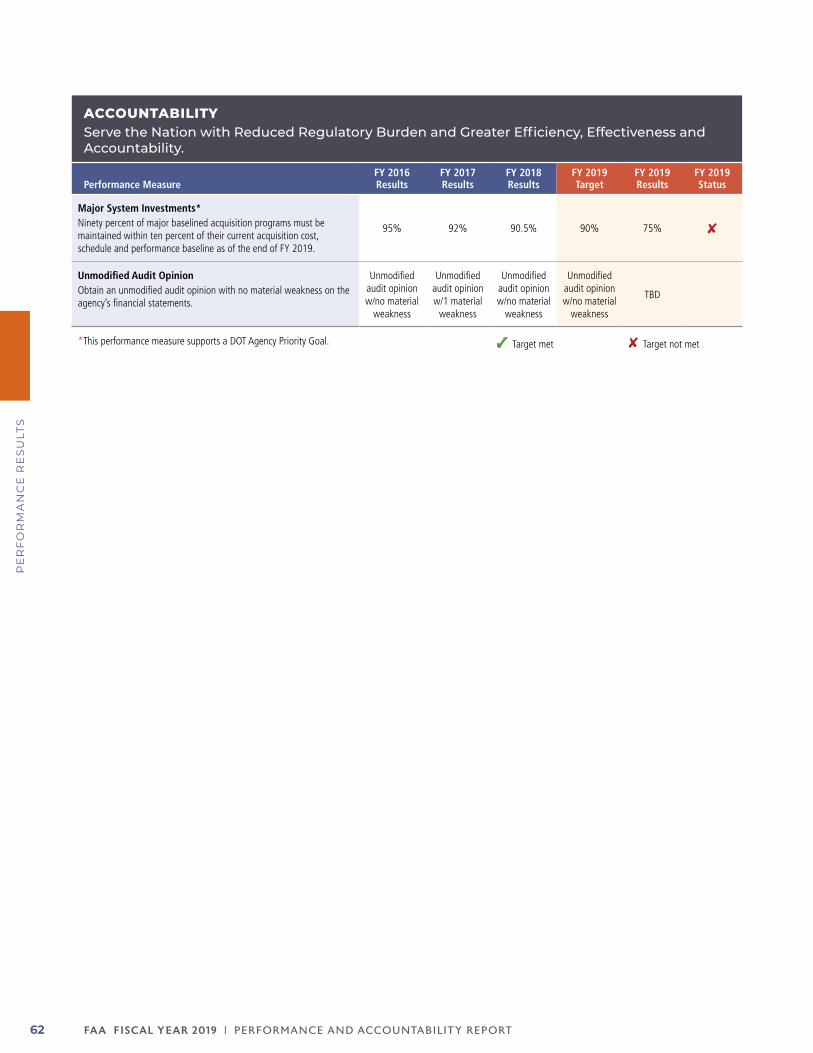
FA A FISCAL YEAR 2019 | PERFORMANCE AND ACCOUNTABILIT Y REPORT62
PE
RF
OR
MA
NC
E R
ES
ULT
S
ACCOUNTABILITYServe the Nation with Reduced Regulatory Burden and Greater Efficiency, Effectiveness and Accountability.
Performance MeasureFY 2016Results
FY 2017Results
FY 2018Results
FY 2019Target
FY 2019Results
FY 2019Status
Major System Investments*Ninety percent of major baselined acquisition programs must be maintained within ten percent of their current acquisition cost, schedule and performance baseline as of the end of FY 2019.
95% 92% 90.5% 90% 75% ✘
Unmodified Audit Opinion Obtain an unmodified audit opinion with no material weakness on the agency’s financial statements.
Unmodified audit opinion w/no material
weakness
Unmodified audit opinion w/1 material
weakness
Unmodified audit opinion w/no material
weakness
Unmodified audit opinion w/no material
weakness
TBD
*This performance measure supports a DOT Agency Priority Goal. ✓ Target met ✘ Target not met

FA A FISCAL YEAR 2019 | PERFORMANCE AND ACCOUNTABILIT Y REPORT 63
PE
RF
OR
MA
NC
E R
ES
ULT
S
Major System Investments
FY 2019 Target Ninety percent of major baselined acquisition programs must be maintained within 10 percent of their current acquisition cost, schedule, and performance baseline as of the end of FY 2019.
FY 2019 Result 75 percent of the major baselined acquisition programs were within 10 percent of their current cost, schedule and performance baseline. Five of 20 programs have breached the 10 percent threshold for the cost, schedule and/or performance baseline.
Public Benefit The FAA’s ability to keep acquisitions within budget and on schedule will allow for a timely transition of NextGen programs and other new programs. The transition to NextGen and other new programs involves acquiring numerous systems to support precision satellite navigation; digital, networked communications; integrated weather information; layered, adaptive security; and more.
The FAA’s ability to make investments in an efficient and cost-effective manner is critical to the implementation of NextGen. For this reason, the FAA established a performance measure that tracks the agency’s success in maintaining its cost, schedule, and performance baselines with regard to major system investments. Programs that have lifecycle costs greater than $100 million, or are key enablers of NextGen, or are classified as being the most complex, highest risk, and will most extensively change the airspace operations are considered major capital investments. The FAA tracks and reports the status of each program’s acquisition program baseline, using an automated database. The data is used to convey program status and performance information to senior executives for purposes of program performance reporting, periodic reviews, and decision making.
The target for each year has been to keep 90 percent of these major acquisition programs within a 10 percent variance of their budget, schedule, and performance milestones. The FAA had met this goal every year since its inception in FY 2012. In FY 2019, for the first time, the FAA did not
achieve the 90 percent target. Only 75 percent of major system investments remained within the 10 percent variance threshold.
Five of the 20 programs tracked for this metric exceeded the 10 percent threshold: En Route Automation Modernization (ERAM) Sustainment 2 (S2), Time Based Flow Management (TBFM) Enhancements 1 (E1), Traffic Flow Management System (TFMS) Enhancements 4 (E4), Common Support Services Weather (CSS Wx), and NextGen Weather Processor (NWP). The first three programs (ERAM S2, TBFM E1, and TFMS E4) varied from their budgets, schedules, or performance milestones by more than 10 percent because of the impact of the partial government shutdown that occurred from December 22, 2018, through January 25, 2019. The other two programs (CSS Wx and NWP) experienced a range of programmatic and technical challenges that have increased costs and schedules beyond original estimates.
Detailed information for each of the five programs is as follows:
zz For the ERAM S2 program, the FAA projects a 7-month (-15.6 percent) schedule variance. The program was on track to meet its budget and schedule prior to the government shutdown.
zz The TBFM E1 program was already experiencing minor variances from its performance milestones due to a shift in priority to other initiatives. The government shutdown, however, increased the schedule variance to 12 months (-13.5 percent).
zz The TFMS E4 program was already experiencing some budget and schedule variances due to the need to address system stability and address outages and other performance issues. The government shutdown pushed the schedule delay to 14 months (-22.2 percent).
zz For the CSS Wx program, the FAA is projecting a 13 month (-14.6 percent) schedule variance and a $44 million (-36.6 percent) cost increase. These variances are associated with underestimated cost and unanticipated technical issues.
MAJOR SYSTEMS INVESTMENTSPercent of major baselined acquisition programs within 10 percent
of their current acquisition cost, schedule and technical performance
PERC
ENT
ActualTarget
TargetAchieved?
95.090.0
100.090.0
95.590.0
95.290.0
90.590.0
75.090.0
✘
70
80
90
100
FY 2019FY 2018FY 2017FY 2016FY 2015FY 2014
TARGET AREA*
* Actual results in this area indicate successful performance.
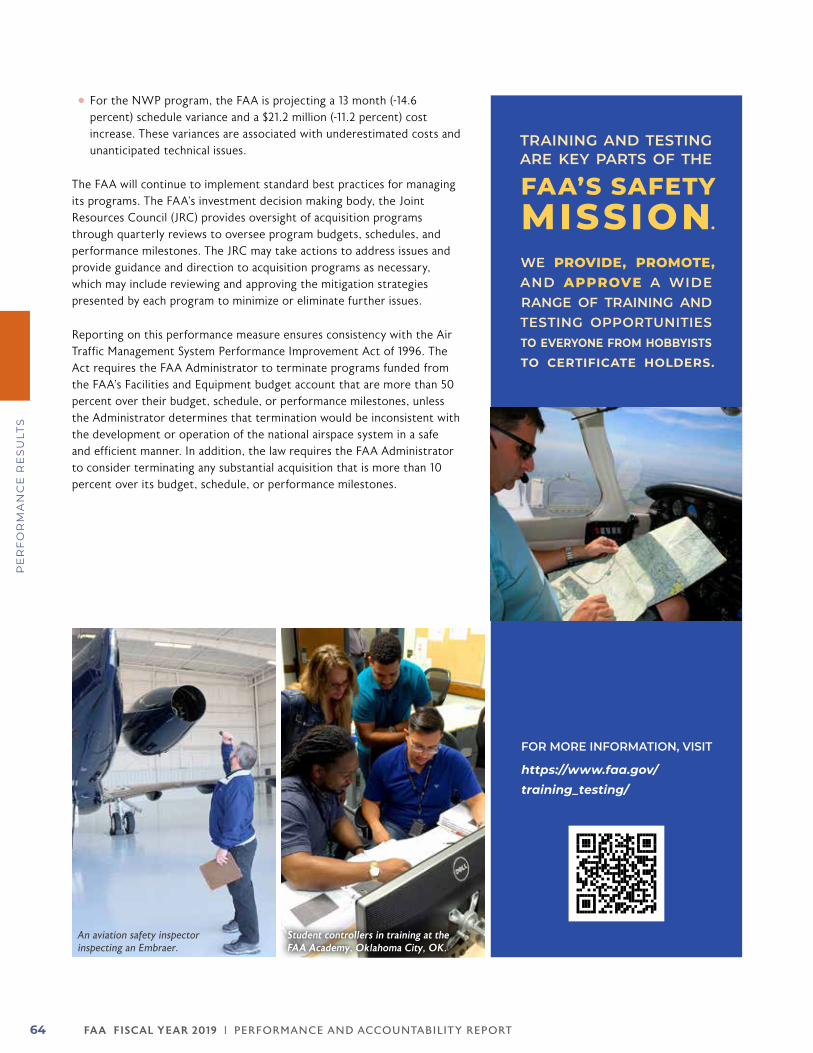
FA A FISCAL YEAR 2019 | PERFORMANCE AND ACCOUNTABILIT Y REPORT64
PE
RF
OR
MA
NC
E R
ES
ULT
S
TRAINING AND TESTING ARE KEY PARTS OF THE
FAA’S SAFETY MISSION.
WE PROVIDE, PROMOTE,AND APPROVE A WIDE RANGE OF TRAINING AND TESTING OPPORTUNITIES TO EVERYONE FROM HOBBYISTS TO CERTIFICATE HOLDERS.
FOR MORE INFORMATION, VISIT
https://www.faa.gov/training_testing/
zz For the NWP program, the FAA is projecting a 13 month (-14.6 percent) schedule variance and a $21.2 million (-11.2 percent) cost increase. These variances are associated with underestimated costs and unanticipated technical issues.
The FAA will continue to implement standard best practices for managing its programs. The FAA’s investment decision making body, the Joint Resources Council (JRC) provides oversight of acquisition programs through quarterly reviews to oversee program budgets, schedules, and performance milestones. The JRC may take actions to address issues and provide guidance and direction to acquisition programs as necessary, which may include reviewing and approving the mitigation strategies presented by each program to minimize or eliminate further issues.
Reporting on this performance measure ensures consistency with the Air Traffic Management System Performance Improvement Act of 1996. The Act requires the FAA Administrator to terminate programs funded from the FAA’s Facilities and Equipment budget account that are more than 50 percent over their budget, schedule, or performance milestones, unless the Administrator determines that termination would be inconsistent with the development or operation of the national airspace system in a safe and efficient manner. In addition, the law requires the FAA Administrator to consider terminating any substantial acquisition that is more than 10 percent over its budget, schedule, or performance milestones.
An aviation safety inspector inspecting an Embraer.
Student controllers in training at the FAA Academy, Oklahoma City, OK.
FA A FISCAL YEAR 2019 | PERFORMANCE AND ACCOUNTABILIT Y REPORT 65
PE
RF
OR
MA
NC
E R
ES
ULT
S
Unmodified Audit Opinion
FY 2019 Target Obtain an unmodified audit opinion with no material weakness on the agency’s financial statements.
FY 2019 Result Unmodified audit opinion with no material weakness.
Public Benefit The public benefits by being assured, confirmed by independent auditors, that the consolidated financial statements of the FAA are presented fairly in all material respects.
The unmodified audit opinion target is a critical indicator of financial condition because it independently assesses the fair presentation of FAA’s financial statements and, in connection with that process, considers the internal control over financial reporting.
In FY 2019, the FAA received an unmodified audit opinion on its consolidated financial statements with no material weaknesses. An unmodified audit opinion means that the financial statements are presented, in all material respects, in accordance with U.S. Generally Accepted Accounting Principles.
While many organizations consider an unmodified audit opinion alone to be a “clean” audit, the FAA sets a performance measure reflecting the higher standard to which
it holds itself. The FAA’s unmodified audit opinion target also requires no material weaknesses in internal control. Achieving this measure is also a signal to the public and Congress that the agency is transparent and accountable in its use of taxpayer resources. It requires every FAA organization to be responsible for following accounting policy by entering accurate and timely source data into the accounting system.
From the highest levels of the agency down, the audit is a priority. Executive-level leadership allocate resources so that sound internal controls operate routinely and effectively. Any audit issues are resolved promptly; the integrity of data and business system operations are ensured; and ongoing performance is monitored. The strong emphasis on fiscal responsibility is the most significant factor in contributing to the achievement of this measure.
FA A FISCAL YEAR 2019 | PERFORMANCE AND ACCOUNTABILIT Y REPORT66
PE
RF
OR
MA
NC
E R
ES
ULT
S
QUALITY ASSURANCE
Verification and Validation of Performance InformationThe FAA employs strong management controls to ensure the accuracy, completeness, and timely reporting of performance data. Because of rigorous internal and external reviews, the FAA’s verification and validation process produces performance results that agency managers and the Administrator are confident of.
In addition to internal verification and review by the FAA, performance data is independently verified by the Department of Transportation. Moreover, data from several FAA safety performance measures, such as the Commercial Air Carrier Fatality Rate, require independent verification by the National Transportation Safety Board (NTSB) and the Bureau of Transportation Statistics. Data for these measures are not considered final until the NTSB completes its report on each incident.
Completeness and Reliability of Performance DataThe agency’s internal review processes support the integrity of our performance data. At the beginning of each fiscal year, we update the performance measure profiles, which essentially function as a clearing house for accurate and detailed documentation of our performance measures. An exhaustive report includes technical definitions for each measure, as well as data source information, statistical issues, and completeness and reliability statements. Where the criteria for targets have changed, it is noted and the changes are explained.
To supplement the performance measure profiles, the agency annually conducts an internal review of the verification processes used by all internal FAA organizations responsible for collecting and reporting performance data. The agency’s full understanding of these processes allows it to provide complete and definitive documentation of results at the end of the year.
Use of Data and Evidence in FAA Decision-MakingSafety is the core of the FAA’s mission and our top priority. While the United States has the safest air transportation system in the world, aviation is a complex and dynamic
system that will always include risks. To mitigate these risks and improve the safety of air transportation, the FAA continually monitors data to identify safety trends and conducts discrete evaluations on threats to aircraft and aviation that include fire, extreme weather, aircraft icing, lithium batteries, bird strikes, and more. The data and evidence that the FAA collects from this continuous monitoring, feedback mechanisms from aviation partners, and testing of new technologies and protocols are critical to informing the agency’s decisions on regulations, guidelines, policies and air traffic control procedures.
Firefighting Test Equipment (A Discrete Evaluation): In FY 2019, the FAA completed an evaluation of foams that airports use to fight fires that resulted in the immediate issuance of new guidance to airports on conducting tests of firefighting vehicles. The results of this work allow airports to maintain the same level of safety while limiting the impact of the firefighting foam on public health and the environment.
Over the years, there has been growing concern about the potential health and environmental impacts of aqueous film-forming foams (AFFF) used by aircraft rescue and firefighting departments at airports and surrounding communities. Fluorinated AFFF was first introduced in the 1970s, and is used by both military and civilian airports. These AFFFs have performed extremely well by allowing for the formation of a thin, vapor-suppressing film on the surface of spilled fuels and other hydrocarbons. However, AFFF concentrates also include perfluorooctane sulfonate (commonly referred to as PFOS) and perfluorooctanoic acid (commonly referred to as PFOA), which are both considered persistent, bio-accumulative, and toxic by the Environmental Protection Agency (EPA). The EPA classifies a substance as persistent, bio-accumulative and toxic when it travels extensively through the environment without degrading, accumulates in an organism more quickly than it can be removed by the organism’s body, and is more harmful than most other contaminants.
Though foam manufactures have worked diligently to reduce the presence of these chemicals in their AFFF concentrates, health and environmental concerns still linger. There are also several other chemicals in the current AFFF formulas whose health and environmental hazards are not yet known. Recently, new AFFF formulas known as Fluorine-Free Foams have shown potential to replace current AFFFs, but they have not been proven to have equivalent fire extinguishing capabilities. In the meantime, the FAA requires airports to
FA A FISCAL YEAR 2019 | PERFORMANCE AND ACCOUNTABILIT Y REPORT 67
PE
RF
OR
MA
NC
E R
ES
ULT
S
periodically discharge AFFF in order to ensure that their firefighting equipment would work during an emergency.
For these reasons, the FAA evaluated three different types of AFFF testing equipment that do not require foam to be dispensed when airports test their firefighting vehicles. The FAA found a high degree of correlation between results from the new testing systems and systems already accepted by the FAA. In conducting the evaluation, the FAA used two different firefighting vehicles, dispensed the foam at a variety of speeds and concentrations, closely followed protocols throughout the evaluation, and set an acceptable range of results to account for the variability of firefighting vehicles. These methods give the FAA confidence in its findings.
As a result of this evaluation, the FAA was able to allow airports to use these three different types of testing equipment to conduct their firefighting tests without discharging AFFF into the environment. The FAA completed its evaluation and immediately issued new guidance in January 2019. The guidance was sent to the 524 airports across the country that meet FAA standards for airfield safety, operations, and emergency preparedness for supporting scheduled commercial airline service. The emergency preparedness standards require the airports to conduct regular testing of their firefighting capabilities.
The FAA guidance is available at this website: https://www.faa.gov/airports/airport_safety/certalerts/media/part-139-cert-alert-19-01-AFFF.pdf.
The results of the research effort were later published in a technical report titled “Evaluation of Input-Based Foam Proportioner Testing Systems,” which is available at this website: https://www.airporttech.tc.faa.gov/Products/Airport-Safety-Papers-Publications/Airport-Safety-Detail/ArtMID/3682/ArticleID/1484/Evaluation-of-Input-Based-Foam-Proportioner-Testing-Systems.
The FAA’s evaluation gave the agency the evidence it required to issue new guidance that will protect aviation safety while mitigating the risk of AFFF to public health and the environment. However, the new guidance is not a complete solution. The guidance only addresses what happens during a test of firefighting vehicles, and airports must still discharge AFFF into the environment during an actual emergency. Further work is needed to identify which firefighting ingredients are harmful to public health and the environment, and to reduce or eliminate their presence in firefighting foam.
Continuous Monitoring of Data: In addition to discrete projects, the FAA continually monitors aviation data in order to identify trends, make informed decisions, and address problems before they result in an accident. Unlike the discrete projects, these efforts are not based on a single question that can be identified and resolved. Instead, these efforts require continuous vigilance.
The FAA’s Aviation Safety Information Analysis and Sharing (ASIAS) program gathers data from across government and industry, including data from the FAA, members of the general aviation community, commercial airlines, corporate and business aviation operators, universities, aviation manufacturers, as well as maintenance, repair and overhaul organizations. In fact, ASIAS safety data comes from operators representing a large majority of U.S. air carrier operations in the national airspace. Participants in ASIAS provide data on a voluntary basis, knowing that information about potential safety problems is shared with the FAA in a non-punitive environment, and that proprietary information is protected.
The FAA participates in two groups that monitor ASIAS and other available data to identify trends, try to understand the underlying reasons for safety risks, and make important safety decisions. The Commercial Aviation Safety Team (CAST) brings together representatives from government, pilot and air traffic controller associations, airlines, airports and aviation manufacturers to identify the top safety concerns in commercial aviation and implement interventions. The FAA also participates in the General Aviation Joint Steering Committee (GAJSC) with industry stakeholders such as pilot organizations, flight instructors, mechanics, builders and manufacturers. Both groups issue voluntary safety enhancements that have substantially reduced aviation fatalities, along with the development of new aircraft technology, regulations, and other safety activities.
The FAA evaluates the effectiveness of its safety efforts, including the safety enhancements issued by the CAST and the GAJSC, by setting performance goals and monitoring results. For example, the fatality risk for commercial aviation in the U.S. fell by 83 percent from 1998 to 2008, and the FAA aims to reduce the U.S. commercial fatality risk by another 50 percent from 2010 to 2025. This performance goal and the work of CAST are discussed in more detail on pages 42–44. In addition, the FAA aims to reduce the general aviation fatality rate by 10 percent from 2019 to 2028, with a target of no more than 0.89 fatal accidents per 100,000 flight hours by 2028. The work of the GAJSC is discussed in more detail on pages 48–49.

FA A FISCAL YEAR 2019 | PERFORMANCE AND ACCOUNTABILIT Y REPORT68
PE
RF
OR
MA
NC
E R
ES
ULT
S
ACHIEVING FAA’S MISSION WITH IMPROVED FINANCIAL MANAGEMENT
Key Financial Management Activities and AccomplishmentsWhen people think of the FAA, they typically think of our air traffic controllers, aviation safety inspectors, engineers and many others in connection with achievement of our mission to provide the safest, most efficient aerospace system in the world. However, achieving our mission also requires a tremendous amount of “behind the scenes” efforts of a cadre of financial analysts. This section highlights some of the current fiscal year activities and accomplishments of our financial management team that support FAA’s mission.
Promoting Global Best Practices: In support of FAA’s global leadership initiative, the FAA’s Office of Finance and Management worked with our international counterparts to develop standardized performance metrics of our operational and cost data for the purpose of working toward global best practices. Standardizing the metrics was complex because of significant differences in the FAA's air navigation model versus that of other countries. Once the metrics were standardized and we published global operational and cost data, meaningful comparisons between countries became apparent.
zz EuroControl, the organization that works to achieve safe and seamless air traffic management across Europe, recognized the FAA as being much more efficient and productive than air navigation organizations across all 28 European Union countries plus Norway and Switzerland, during the 2015–2019 reporting period, as FAA’s air traffic controllers handled 77 percent more flights and provide the safest skies in the world (see page 17 of this year’s Cost Comparison Report, published March 18 2019 at: https://www.eurocontrol.int/sites/default/files/2019-05/us-europe-comparison-ans-cost-efficiency-trends-2006-2016.pdf). Global leadership is an agency priority (see page 56) because strong partnerships
and active collaboration are key elements to creating consistent aviation standards around the world, and for making international air travel safer, more efficient, and environmentally sustainable in the global aviation system.
zz The work of the our finance personnel to develop these standardized global metrics, and translate and publish our actual operational and cost data to prompt best practices conversations between the FAA and international counterparts, directly supports achievement of the FAA’s global leadership initiative.
zz We similarly collaborate with the Civil Air Navigation Service Organization on its Global Benchmarking Report, last published in 2018 which can be found at: https://www.canso.org/system/files/Global%20ANS%20Performance%20Report%20ANSP%20View.pdf.
Investment Analysis: The automated systems required to operate our nation’s airspace are complex, expensive to develop, and safety-critical. These systems integrate unmanned aircraft into our airspace; support the transition of surveillance from ground-based to satellite-based radar; and help modernize communication between air traffic controllers and pilots from voice to data. Every new system and program undergoes a rigorous evaluation by the FAA Office of Finance and Management before the FAA decides to pursue the investment. In its evaluation, the FAA considers many factors such as costs, user benefits, time to implementation, and risks. This year we made significant improvements in our data tools that we use in our independent evaluation of these complex investments.
zz In FY 2019, the FAA’s Office of Finance and Management conducted reviews for 32 separate capital investment decisions by the agency to ensure that cost, schedule, and benefits estimates were accurate, complete, and well-documented. These decisions encompassed over $3.5 billion in agency capital investments.
zz Last year, the FAA Office of Finance and Management developed a database that captures the life cycle cost and schedule estimates for national airspace systems and programs that have completed a final investment decision. This database serves as an analytical tool; it accumulates and summarizes the results of the risk analysis performed on each program into a visual display — a graphical “dashboard”. We overlay the risk analysis data with planned, risk-adjusted, and actual completion dates for
FAActo
id THERE ARE AS MANY AS
AT PEAK OPERATIONAL TIMES
5,000AIRCRAFT IN THE SKY
FA A FISCAL YEAR 2019 | PERFORMANCE AND ACCOUNTABILIT Y REPORT 69
PE
RF
OR
MA
NC
E R
ES
ULT
S
each program. We also pull in obligation (spending) data. The tool provides insight into program status and helps the FAA make more informed next step decisions when a program encounters a schedule delay or a cost increase, and it also supports decision making on future similar programs that may encounter similar risks. We upgraded our baseline reporting tool in FY 2019 to capture additional program status data. The upgrade helps us objectively assess if programs are meeting agency goals and project milestones. We also upgraded our implementation system to provide additional traceability of how money is used in our field operations. These upgrades will help the Office of Finance and Management to continue its goal of providing FAA leaders with data to support informed decisions related to program and acquisition approvals.
Air Traffic Operations and Pay Complexity Formula: A third of all FAA employees are air traffic controllers (about 15,000 out of 44,416 FAA employees) with air traffic payroll comprising about 49 percent of FAA’s Operations payroll (see pages 32–33). Air traffic controller and supervisor pay is partly determined by the volume and complexity of air traffic operations handled by each air traffic facility. (Complexity includes many factors, including operations over water vs. land; based on altitude, type of aircraft [e.g. jet versus turboprop], military vs. civilian operation; etc.) Therefore, accurate classification and counts of air traffic operations are critical to pay-setting and pay administration, and to avoiding varying interpretations that can lead to pay-related disputes.
zz The Office of Finance and Management developed expertise in this area and provided expert support in the analysis of operations and the pay complexity formula, which helped to resolve long-standing matters of differing interpretation. This is a highly complex and visible area for the agency, and the expertise, credibility, and leadership of the financial management team in this area added tremendous value to FAA management and achievement of its mission.
Contract Investment Reviews: The FAA relies on outside companies to provide certain contract services and systems, equipment, software, hardware and other products and services in order to run the nation’s airspace system and its mission support activities. All FAA contracts and other agreements valued at $10 million or more require the Chief Financial Officer’s (CFO) approval.
zz The CFO’s staff have significant acquisition and financial controls experience and independently examine these proposed investments/procurement strategies to advise the CFO in his or her reviews. In FY 2019, the
team reviewed 41 procurement packages for proposed investments each with estimated values of $10 million or more to support CFO decisions on over $7 billion of acquisitions. The team analyzes risks to include costs, performance, schedule and procurement related risks, and makes risk reduction recommendations. As a result of these controls, time consuming rework and contract reconciliations have decreased, which helps FAA customers meet their procurement milestones and satisfy their business needs more efficiently and effectively. These controls also help support the FAA’s business decisions when challenged by internal and external auditors.
Cost Per Air Traffic Operation: FAA’s strategic plan includes an objective to improve the financial management of the agency while delivering quality customer service. For example, our Office of Finance and Management works with our Air Traffic Organization to merge cost data with air traffic operational data to compute the cost per air traffic operation. We monitor these metrics to evaluate the cost efficiency of our air traffic operations, and make comparisons with our international counterparts. This type of data allows us to focus on achieving our safety mission in the most efficient manner. We discuss this and other examples on page 72.
Cost Control Program: The Office of Finance and Management manages the FAA’s Cost Control Program, producing documented savings of $58.7 million in FY 2019, and cumulative savings of over $1.3 billion since inception of the program in FY 2005. This program helps the agency achieve the part of its mission to provide the most efficient aerospace system in the world. To do this, we analyze cost data and historical trends to identify areas of potential cost savings. Our Office of Finance and Management works jointly with FAA lines of business to use this data to identify new target savings goals each year. You can read more about FAA’s Cost Control Program on pages 70–72.
Long-Term Capital Needs Study and Report: The FAA’s Office of Finance and Management evaluated the FAA’s long-term capital needs and proposed a range of options to meet those needs by addressing legislative constraints that prevent direct access to the Airport and Airway Trust Fund (AATF). The report, which is going through clearance for presentation to Congress, also addresses broader issues related to the organizational structure of the agency. More information regarding the AATF can be found on pages 32 and 111, and in Note 1.W on pages 97–98.
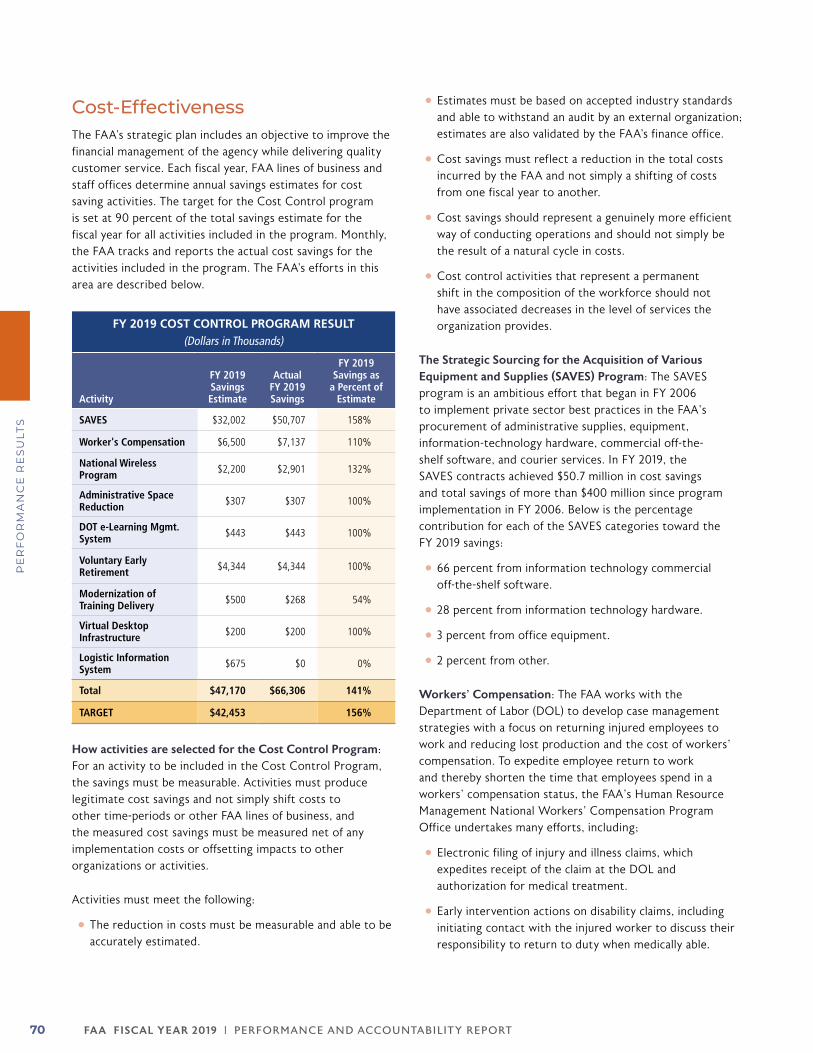
FA A FISCAL YEAR 2019 | PERFORMANCE AND ACCOUNTABILIT Y REPORT70
PE
RF
OR
MA
NC
E R
ES
ULT
S
Cost-Effectiveness The FAA’s strategic plan includes an objective to improve the financial management of the agency while delivering quality customer service. Each fiscal year, FAA lines of business and staff offices determine annual savings estimates for cost saving activities. The target for the Cost Control program is set at 90 percent of the total savings estimate for the fiscal year for all activities included in the program. Monthly, the FAA tracks and reports the actual cost savings for the activities included in the program. The FAA’s efforts in this area are described below.
FY 2019 COST CONTROL PROGRAM RESULT(Dollars in Thousands)
Activity
FY 2019 Savings Estimate
Actual FY 2019 Savings
FY 2019 Savings as
a Percent of Estimate
SAVES $32,002 $50,707 158%
Worker's Compensation $6,500 $7,137 110%
National Wireless Program $2,200 $2,901 132%
Administrative Space Reduction $307 $307 100%
DOT e-Learning Mgmt. System $443 $443 100%
Voluntary Early Retirement $4,344 $4,344 100%
Modernization of Training Delivery $500 $268 54%
Virtual Desktop Infrastructure $200 $200 100%
Logistic Information System $675 $0 0%
Total $47,170 $66,306 141%
TARGET $42,453 156%
How activities are selected for the Cost Control Program: For an activity to be included in the Cost Control Program, the savings must be measurable. Activities must produce legitimate cost savings and not simply shift costs to other time-periods or other FAA lines of business, and the measured cost savings must be measured net of any implementation costs or offsetting impacts to other organizations or activities.
Activities must meet the following:
zz The reduction in costs must be measurable and able to be accurately estimated.
zz Estimates must be based on accepted industry standards and able to withstand an audit by an external organization; estimates are also validated by the FAA’s finance office.
zz Cost savings must reflect a reduction in the total costs incurred by the FAA and not simply a shifting of costs from one fiscal year to another.
zz Cost savings should represent a genuinely more efficient way of conducting operations and should not simply be the result of a natural cycle in costs.
zz Cost control activities that represent a permanent shift in the composition of the workforce should not have associated decreases in the level of services the organization provides.
The Strategic Sourcing for the Acquisition of Various Equipment and Supplies (SAVES) Program: The SAVES program is an ambitious effort that began in FY 2006 to implement private sector best practices in the FAA’s procurement of administrative supplies, equipment, information-technology hardware, commercial off-the-shelf software, and courier services. In FY 2019, the SAVES contracts achieved $50.7 million in cost savings and total savings of more than $400 million since program implementation in FY 2006. Below is the percentage contribution for each of the SAVES categories toward the FY 2019 savings:
zz 66 percent from information technology commercial off-the-shelf software.
zz 28 percent from information technology hardware.
zz 3 percent from office equipment.
zz 2 percent from other.
Workers’ Compensation: The FAA works with the Department of Labor (DOL) to develop case management strategies with a focus on returning injured employees to work and reducing lost production and the cost of workers’ compensation. To expedite employee return to work and thereby shorten the time that employees spend in a workers’ compensation status, the FAA’s Human Resource Management National Workers’ Compensation Program Office undertakes many efforts, including;
zz Electronic filing of injury and illness claims, which expedites receipt of the claim at the DOL and authorization for medical treatment.
zz Early intervention actions on disability claims, including initiating contact with the injured worker to discuss their responsibility to return to duty when medically able.
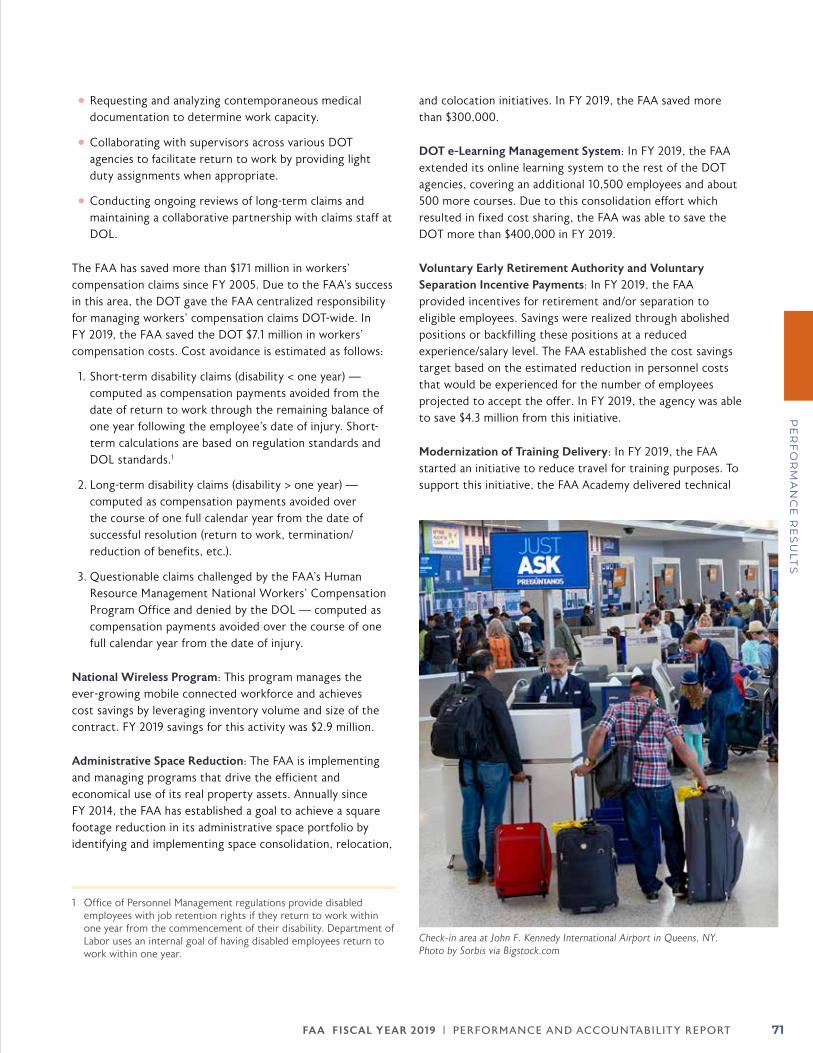
FA A FISCAL YEAR 2019 | PERFORMANCE AND ACCOUNTABILIT Y REPORT 71
PE
RF
OR
MA
NC
E R
ES
ULT
S
zz Requesting and analyzing contemporaneous medical documentation to determine work capacity.
zz Collaborating with supervisors across various DOT agencies to facilitate return to work by providing light duty assignments when appropriate.
zz Conducting ongoing reviews of long-term claims and maintaining a collaborative partnership with claims staff at DOL.
The FAA has saved more than $171 million in workers’ compensation claims since FY 2005. Due to the FAA’s success in this area, the DOT gave the FAA centralized responsibility for managing workers’ compensation claims DOT-wide. In FY 2019, the FAA saved the DOT $7.1 million in workers’ compensation costs. Cost avoidance is estimated as follows:
1. Short-term disability claims (disability < one year) — computed as compensation payments avoided from the date of return to work through the remaining balance of one year following the employee’s date of injury. Short-term calculations are based on regulation standards and DOL standards.1
2. Long-term disability claims (disability > one year) — computed as compensation payments avoided over the course of one full calendar year from the date of successful resolution (return to work, termination/reduction of benefits, etc.).
3. Questionable claims challenged by the FAA’s Human Resource Management National Workers’ Compensation Program Office and denied by the DOL — computed as compensation payments avoided over the course of one full calendar year from the date of injury.
National Wireless Program: This program manages the ever-growing mobile connected workforce and achieves cost savings by leveraging inventory volume and size of the contract. FY 2019 savings for this activity was $2.9 million.
Administrative Space Reduction: The FAA is implementing and managing programs that drive the efficient and economical use of its real property assets. Annually since FY 2014, the FAA has established a goal to achieve a square footage reduction in its administrative space portfolio by identifying and implementing space consolidation, relocation,
1 Office of Personnel Management regulations provide disabled employees with job retention rights if they return to work within one year from the commencement of their disability. Department of Labor uses an internal goal of having disabled employees return to work within one year.
and colocation initiatives. In FY 2019, the FAA saved more than $300,000.
DOT e-Learning Management System: In FY 2019, the FAA extended its online learning system to the rest of the DOT agencies, covering an additional 10,500 employees and about 500 more courses. Due to this consolidation effort which resulted in fixed cost sharing, the FAA was able to save the DOT more than $400,000 in FY 2019.
Voluntary Early Retirement Authority and Voluntary Separation Incentive Payments: In FY 2019, the FAA provided incentives for retirement and/or separation to eligible employees. Savings were realized through abolished positions or backfilling these positions at a reduced experience/salary level. The FAA established the cost savings target based on the estimated reduction in personnel costs that would be experienced for the number of employees projected to accept the offer. In FY 2019, the agency was able to save $4.3 million from this initiative.
Modernization of Training Delivery: In FY 2019, the FAA started an initiative to reduce travel for training purposes. To support this initiative, the FAA Academy delivered technical
Check-in area at John F. Kennedy International Airport in Queens, NY. Photo by Sorbis via Bigstock.com
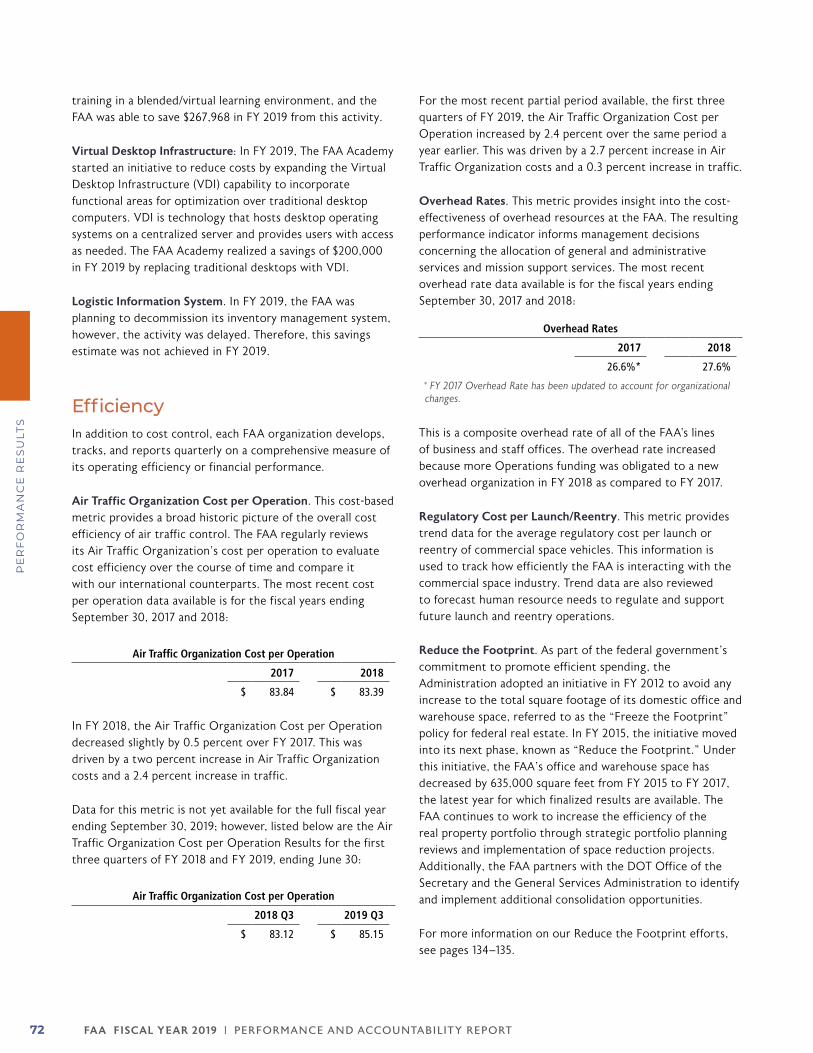
FA A FISCAL YEAR 2019 | PERFORMANCE AND ACCOUNTABILIT Y REPORT72
PE
RF
OR
MA
NC
E R
ES
ULT
S
training in a blended/virtual learning environment, and the FAA was able to save $267,968 in FY 2019 from this activity.
Virtual Desktop Infrastructure: In FY 2019, The FAA Academy started an initiative to reduce costs by expanding the Virtual Desktop Infrastructure (VDI) capability to incorporate functional areas for optimization over traditional desktop computers. VDI is technology that hosts desktop operating systems on a centralized server and provides users with access as needed. The FAA Academy realized a savings of $200,000 in FY 2019 by replacing traditional desktops with VDI.
Logistic Information System. In FY 2019, the FAA was planning to decommission its inventory management system, however, the activity was delayed. Therefore, this savings estimate was not achieved in FY 2019.
Efficiency In addition to cost control, each FAA organization develops, tracks, and reports quarterly on a comprehensive measure of its operating efficiency or financial performance.
Air Traffic Organization Cost per Operation. This cost-based metric provides a broad historic picture of the overall cost efficiency of air traffic control. The FAA regularly reviews its Air Traffic Organization’s cost per operation to evaluate cost efficiency over the course of time and compare it with our international counterparts. The most recent cost per operation data available is for the fiscal years ending September 30, 2017 and 2018:
Air Traffic Organization Cost per Operation
2017 2018
$ 83.84 $ 83.39
In FY 2018, the Air Traffic Organization Cost per Operation decreased slightly by 0.5 percent over FY 2017. This was driven by a two percent increase in Air Traffic Organization costs and a 2.4 percent increase in traffic.
Data for this metric is not yet available for the full fiscal year ending September 30, 2019; however, listed below are the Air Traffic Organization Cost per Operation Results for the first three quarters of FY 2018 and FY 2019, ending June 30:
Air Traffic Organization Cost per Operation
2018 Q3 2019 Q3
$ 83.12 $ 85.15
For the most recent partial period available, the first three quarters of FY 2019, the Air Traffic Organization Cost per Operation increased by 2.4 percent over the same period a year earlier. This was driven by a 2.7 percent increase in Air Traffic Organization costs and a 0.3 percent increase in traffic.
Overhead Rates. This metric provides insight into the cost-effectiveness of overhead resources at the FAA. The resulting performance indicator informs management decisions concerning the allocation of general and administrative services and mission support services. The most recent overhead rate data available is for the fiscal years ending September 30, 2017 and 2018:
Overhead Rates
2017 2018
26.6%* 27.6%
* FY 2017 Overhead Rate has been updated to account for organizational changes.
This is a composite overhead rate of all of the FAA’s lines of business and staff offices. The overhead rate increased because more Operations funding was obligated to a new overhead organization in FY 2018 as compared to FY 2017.
Regulatory Cost per Launch/Reentry. This metric provides trend data for the average regulatory cost per launch or reentry of commercial space vehicles. This information is used to track how efficiently the FAA is interacting with the commercial space industry. Trend data are also reviewed to forecast human resource needs to regulate and support future launch and reentry operations.
Reduce the Footprint. As part of the federal government’s commitment to promote efficient spending, the Administration adopted an initiative in FY 2012 to avoid any increase to the total square footage of its domestic office and warehouse space, referred to as the “Freeze the Footprint” policy for federal real estate. In FY 2015, the initiative moved into its next phase, known as “Reduce the Footprint.” Under this initiative, the FAA’s office and warehouse space has decreased by 635,000 square feet from FY 2015 to FY 2017, the latest year for which finalized results are available. The FAA continues to work to increase the efficiency of the real property portfolio through strategic portfolio planning reviews and implementation of space reduction projects. Additionally, the FAA partners with the DOT Office of the Secretary and the General Services Administration to identify and implement additional consolidation opportunities.
For more information on our Reduce the Footprint efforts, see pages 134–135.
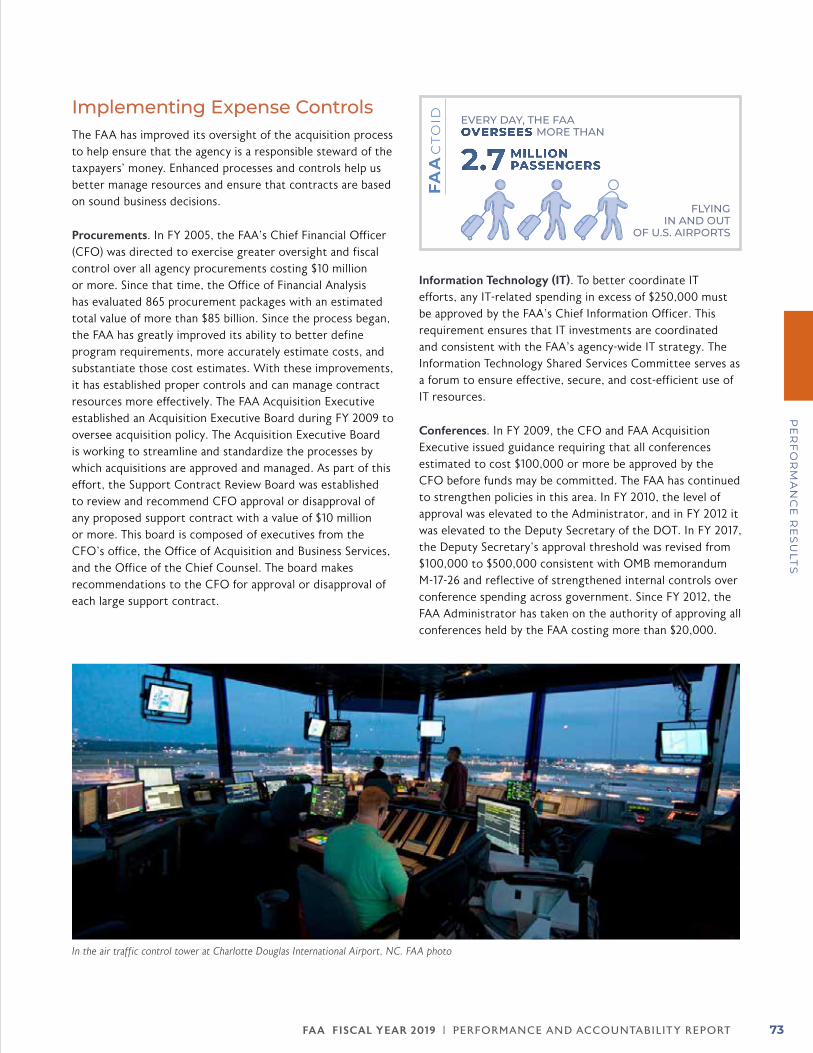
FA A FISCAL YEAR 2019 | PERFORMANCE AND ACCOUNTABILIT Y REPORT 73
PE
RF
OR
MA
NC
E R
ES
ULT
S
Implementing Expense Controls The FAA has improved its oversight of the acquisition process to help ensure that the agency is a responsible steward of the taxpayers’ money. Enhanced processes and controls help us better manage resources and ensure that contracts are based on sound business decisions.
Procurements. In FY 2005, the FAA’s Chief Financial Officer (CFO) was directed to exercise greater oversight and fiscal control over all agency procurements costing $10 million or more. Since that time, the Office of Financial Analysis has evaluated 865 procurement packages with an estimated total value of more than $85 billion. Since the process began, the FAA has greatly improved its ability to better define program requirements, more accurately estimate costs, and substantiate those cost estimates. With these improvements, it has established proper controls and can manage contract resources more effectively. The FAA Acquisition Executive established an Acquisition Executive Board during FY 2009 to oversee acquisition policy. The Acquisition Executive Board is working to streamline and standardize the processes by which acquisitions are approved and managed. As part of this effort, the Support Contract Review Board was established to review and recommend CFO approval or disapproval of any proposed support contract with a value of $10 million or more. This board is composed of executives from the CFO’s office, the Office of Acquisition and Business Services, and the Office of the Chief Counsel. The board makes recommendations to the CFO for approval or disapproval of each large support contract.
Information Technology (IT). To better coordinate IT efforts, any IT-related spending in excess of $250,000 must be approved by the FAA’s Chief Information Officer. This requirement ensures that IT investments are coordinated and consistent with the FAA’s agency-wide IT strategy. The Information Technology Shared Services Committee serves as a forum to ensure effective, secure, and cost-efficient use of IT resources.
Conferences. In FY 2009, the CFO and FAA Acquisition Executive issued guidance requiring that all conferences estimated to cost $100,000 or more be approved by the CFO before funds may be committed. The FAA has continued to strengthen policies in this area. In FY 2010, the level of approval was elevated to the Administrator, and in FY 2012 it was elevated to the Deputy Secretary of the DOT. In FY 2017, the Deputy Secretary’s approval threshold was revised from $100,000 to $500,000 consistent with OMB memorandum M-17-26 and reflective of strengthened internal controls over conference spending across government. Since FY 2012, the FAA Administrator has taken on the authority of approving all conferences held by the FAA costing more than $20,000.
FAActo
id
FLYING IN AND OUT
OF U.S. AIRPORTS
EVERY DAY, THE FAAMORE THAN
2.7 MILLION PASSENGERS
OVERSEES
In the air traffic control tower at Charlotte Douglas International Airport, NC. FAA photo

FA A FISCAL YEAR 2019 | PERFORMANCE AND ACCOUNTABILIT Y REPORT74
FINANCIAL RESULTS
Denver International Airport. Photo by Urbanlight
FA A FISCAL YEAR 2019 | PERFORMANCE AND ACCOUNTABILIT Y REPORT 75
FIN
AN
CIA
L R
ES
ULT
S
A MESSAGE FROM THE CHIEF FINANCIAL OFFICER
This year FAA staff continued to operate 24/7 managing over 44,000 daily flights in our airspace while working through the longest partial federal government shutdown in U.S. history. This year
also brought an increase in the safe integration of new entrants into our airspace like drones and commercial space launches. I am proud and humbled by my colleagues who continued to do their duty week after week, even under these challenging circumstances.
Financial ResultsWe publish our financial statements each year as part of our commitment to use our funding responsibly and to be accountable to the American taxpayer. To live up to this commitment, I am presenting our financial statements in this FY 2019 Performance and Accountability Report with a report from an independent auditor and a quality control review by the Department of Transportation’s Inspector General.
Our agency performance goals include a target of obtaining an unmodified audit opinion with no material weaknesses in internal controls (see page 65). This is also our key target for monitoring financial risk, the only financial/non-operational component of our enterprise risk management program.
I am proud to report that for FY 2019, we have once again met our goal of receiving an unmodified audit opinion with no material weaknesses, and have maintained our track record of responsible financial management. We present highlights of our financial statements on pages 28–31; a description of our financial resources and how they are used on pages 32–33; and, on pages 68–73, we provide highlights and examples of how we are helping to achieve FAA’s mission with improved financial management.
Evolving and Expanding Focus AreasSince the Chief Financial Officers Act of 1990 created CFOs in the federal government, one primary focus for them is demonstrating excellent financial stewardship by attaining unmodified audit opinions.
As financial reporting is now largely developed and solidified, federal CFOs are being asked to expand their focus to non-financial/operational reporting—well beyond dollars and cents. As a result, we are now subjecting our enterprise risk management activities, which are predominantly operational, to additional management review and testing. We are also now testing the quality and accuracy of our DATA Act reporting and issuing quarterly certifications of that data. And in the next year, we will begin testing the accuracy of our operational reports. We welcome these new challenges and the opportunity to expand our role in financial reporting to non-financial areas as well. This expanded role helps the agency evaluate its work and improves internal communication among FAA offices and added transparency for the public regarding our progress in achieving our safety mission.
I am eager to see the future of the aviation industry—everything from further integration of Unmanned Aircraft Systems delivering packages, all the way to leveraging innovative financing that will continue to affect the day-to-day operations in the CFO’s office—all coming together to meet the ever-changing needs of the industry.
ALLISON W. RITMANActing Chief Financial OfficerNovember 9, 2019
ALLISON W. RITMAN
FA A FISCAL YEAR 2019 | PERFORMANCE AND ACCOUNTABILIT Y REPORT76
FIN
AN
CIA
L R
ES
ULT
S
OFFICE OF THE INSPECTOR GENERAL (OIG) QUALITY CONTROL REVIEW

FA A FISCAL YEAR 2019 | PERFORMANCE AND ACCOUNTABILIT Y REPORT 77
FIN
AN
CIA
L R
ES
ULT
S

FA A FISCAL YEAR 2019 | PERFORMANCE AND ACCOUNTABILIT Y REPORT78
FIN
AN
CIA
L R
ES
ULT
S

FA A FISCAL YEAR 2019 | PERFORMANCE AND ACCOUNTABILIT Y REPORT 79
FIN
AN
CIA
L R
ES
ULT
S

FA A FISCAL YEAR 2019 | PERFORMANCE AND ACCOUNTABILIT Y REPORT80
FIN
AN
CIA
L R
ES
ULT
S
FA A FISCAL YEAR 2019 | PERFORMANCE AND ACCOUNTABILIT Y REPORT 81
FIN
AN
CIA
L R
ES
ULT
S
INDEPENDENT AUDITORS’ REPORT
KPMG LLP is a Delaware limited liability partnership and the U.S. member firm of the KPMG network of independent member firms affiliated with KPMG International Cooperative (“KPMG International”), a Swiss entity.
KPMG LLPSuite 120001801 K Street, NWWashington, DC 20006
Independent Auditors’ Report
Administrator, Federal Aviation Administration and Inspector GeneralU.S. Department of Transportation Federal Aviation Administration:
Report on the Financial StatementsWe have audited the accompanying consolidated financial statements of the U.S. Department of Transportation(DOT), Federal Aviation Administration (FAA), which comprise the consolidated balance sheets as ofSeptember 30, 2019 and 2018, and the related consolidated statements of net cost, and changes in netposition, and combined statements of budgetary resources for the years then ended, and the related notes tothe consolidated financial statements.
Management’s Responsibility for the Financial Statements
Management is responsible for the preparation and fair presentation of these consolidated financial statements in accordance with U.S. generally accepted accounting principles; this includes the design, implementation, and maintenance of internal control relevant to the preparation and fair presentation of consolidated financial statements that are free from material misstatement, whether due to fraud or error.
Auditors’ Responsibility
Our responsibility is to express an opinion on these consolidated financial statements based on our audits. We conducted our audits in accordance with auditing standards generally accepted in the United States of America, in accordance with the standards applicable to financial audits contained in Government Auditing Standardsissued by the Comptroller General of the United States, and in accordance with Office of Management and Budget (OMB) Bulletin No. 19-03, Audit Requirements for Federal Financial Statements. Those standards andOMB Bulletin No. 19-03 require that we plan and perform the audit to obtain reasonable assurance about whether the consolidated financial statements are free from material misstatement.
An audit involves performing procedures to obtain audit evidence about the amounts and disclosures in the consolidated financial statements. The procedures selected depend on the auditors’ judgment, including the assessment of the risks of material misstatement of the consolidated financial statements, whether due to fraud or error. In making those risk assessments, the auditor considers internal control relevant to the entity’s preparation and fair presentation of the consolidated financial statements in order to design audit procedures that are appropriate in the circumstances, but not for the purpose of expressing an opinion on the effectiveness of the entity’s internal control. Accordingly, we express no such opinion. An audit also includes evaluating the appropriateness of accounting policies used and the reasonableness of significant accounting estimates made by management, as well as evaluating the overall presentation of the consolidated financial statements.
We believe that the audit evidence we have obtained is sufficient and appropriate to provide a basis for our audit opinion.
Opinion
In our opinion, the consolidated financial statements referred to above present fairly, in all material respects, the financial position of the U.S. Department of Transportation, Federal Aviation Administration as of September 30, 2019 and 2018, and its net costs, changes in net position, and budgetary resources for the years then ended in accordance with U.S. generally accepted accounting principles.
FA A FISCAL YEAR 2019 | PERFORMANCE AND ACCOUNTABILIT Y REPORT82
FIN
AN
CIA
L R
ES
ULT
S
Other Matters
Interactive DataManagement has elected to reference to information on websites or other forms of interactive data outside thePerformance and Accountability Report to provide additional information for the users of its financial statements. Such information is not a required part of the basic consolidated financial statements or supplementary information required by the Federal Accounting Standards Advisory Board. The information on these websites or the other interactive data has not been subjected to any of our auditing procedures, and accordingly we do not express an opinion or provide any assurance on it.
Required Supplementary InformationU.S. generally accepted accounting principles require that the information in the Management’s Discussion and Analysis, Required Supplementary Information, and Required Supplementary Stewardship Information sections be presented to supplement the basic consolidated financial statements. Such information, although not a part of the basic consolidated financial statements, is required by the Federal Accounting Standards Advisory Board who considers it to be an essential part of financial reporting for placing the basic consolidated financial statements in an appropriate operational, economic, or historical context. We have applied certain limited procedures to the required supplementary information in accordance with auditing standards generally accepted in the United States of America, which consisted of inquiries of management about the methods of preparing the information and comparing the information for consistency with management’s responses to ourinquiries, the basic consolidated financial statements, and other knowledge we obtained during our audits of the basic consolidated financial statements. We do not express an opinion or provide any assurance on the information because the limited procedures do not provide us with sufficient evidence to express an opinion or provide any assurance.
Other InformationOur audits were conducted for the purpose of forming an opinion on the basic consolidated financial statements as a whole. The In a Day’s Work, Foreword, Messages from the Administrator and the Chief Financial Officer, Performance Results and Other Information sections, as listed in the Table of Contents of the Performance and Accountability Report, is presented for purposes of additional analysis and is not a required part of the basic consolidated financial statements. Such information has not been subjected to the auditing procedures appliedin the audits of the basic consolidated financial statements, and accordingly, we do not express an opinion orprovide any assurance on it.
Other Reporting Required by Government Auditing StandardsInternal Control over Financial Reporting
In planning and performing our audit of the consolidated financial statements as of and for the year endedSeptember 30, 2019, we considered the FAA’s internal control over financial reporting (internal control) todetermine the audit procedures that are appropriate in the circumstances for the purpose of expressing ouropinion on the consolidated financial statements, but not for the purpose of expressing an opinion on theeffectiveness of the FAA’s internal control. Accordingly, we do not express an opinion on the effectiveness ofthe FAA’s internal control. We did not test all internal controls relevant to operating objectives as broadlydefined by the Federal Managers’ Financial Integrity Act of 1982.
A deficiency in internal control exists when the design or operation of a control does not allow management oremployees, in the normal course of performing their assigned functions, to prevent, or detect and correct,misstatements on a timely basis. A material weakness is a deficiency, or a combination of deficiencies, ininternal control, such that there is a reasonable possibility that a material misstatement of the entity’s financialstatements will not be prevented, or detected and corrected, on a timely basis. A significant deficiency is adeficiency, or a combination of deficiencies, in internal control that is less severe than a material weakness, yetimportant enough to merit attention by those charged with governance.
FA A FISCAL YEAR 2019 | PERFORMANCE AND ACCOUNTABILIT Y REPORT 83
FIN
AN
CIA
L R
ES
ULT
S
Our consideration of internal control was for the limited purpose described in the first paragraph of this sectionand was not designed to identify all deficiencies in internal control that might be material weaknesses orsignificant deficiencies and therefore, material weaknesses or significant deficiencies may exist that have notbeen identified. Given these limitations, during our audit we did not identify any deficiencies in internal controlthat we consider to be material weaknesses. We did identify certain deficiencies in internal control, described in the accompanying Exhibit I as items 2019-1 and 2019-2 that we consider to be significant deficiencies.
Compliance and Other Matters
As part of obtaining reasonable assurance about whether the FAA’s consolidated financial statements are free from material misstatement, we performed tests of its compliance with certain provisions of laws, regulations, contracts, and grant agreements, noncompliance with which could have a direct and material effect on the determination of financial statement amounts. However, providing an opinion on compliance with those provisions was not an objective of our audit, and accordingly, we do not express such an opinion. The results of our tests disclosed no instances of noncompliance or other matters that are required to be reported underGovernment Auditing Standards or OMB Bulletin No. 19-03.
FAA’s Responses to Findings
The FAA’s response to the findings identified in our audit is described and presented in the section titled Management’s Response to the Independent Auditors’ Report. The FAA’s response was not subjected to the auditing procedures applied in the audit of the consolidated financial statements and, accordingly, we express no opinion on the response.
Purpose of the Other Reporting Required by Government Auditing Standards
The purpose of the communication described in the Other Reporting Required by Government Auditing Standards section is solely to describe the scope of our testing of internal control and compliance and the results of that testing, and not to provide an opinion on the effectiveness of the FAA’s internal control or compliance. Accordingly, this communication is not suitable for any other purpose.
Washington, DCNovember 9, 2019
FA A FISCAL YEAR 2019 | PERFORMANCE AND ACCOUNTABILIT Y REPORT84
FIN
AN
CIA
L R
ES
ULT
S
Federal Aviation AdministrationIndependent Auditors’ Report Exhibit IInternal Control Over Financial Reporting SIGNIFICANT DEFICIENCIES
2019-1 Weaknesses in General Information Technology Controls
BackgroundThe FAA utilizes a site management tool system that tracks the environmental investigation, remediation, and regulatory closure status of the FAA’s Environmental Cleanup Program sites. This system is used to prepare the Environmental Remediation Liability amount in the FAA financial statements.
Criteria
The U.S. General Accountability Office (GAO)’s Standards for Internal Control in the Federal Government, sets the standards for an effective internal control system and provides an overall framework for designing, implementing, and operating an effective internal control system. The standards require entities to design appropriate types of control activities to include limiting access to resources and records to authorized individuals, and to periodically compare resources with the recorded accountability to help reduce the risk of errors, fraud, misuse, or unauthorized alteration. In addition, the DOT Cyber Security Compendium, version 4.2, dated March 2018, provides DOT’s policies, procedures, and controls related to the security of DOT information systems that support DOT’s mission, operations, and assets.
ConditionWe identified certain control deficiencies at the application, database, and operating system levels related to access controls as listed below:
• Reviews of audit logs were not documented to evidence appropriate and timely completion;
• Monitoring controls were not operating effectively over the periodic review of access.
CauseManagement has not established, or consistently implemented procedures to ensure compliance with internal policies.
Effect
The absence of timely reviews of audit logs, leaves the FAA exposed to the risk of delays in identifying and responding to incidents which could result in the exposure, modification, or loss of system data. Further, user accounts with inappropriate access may result in unauthorized use, disclosure, or modification of system data.
Recommendations
We recommend that Management design and implement procedures to consistently perform and document the following, as required by existing internal policies:
1) Application log reviews;2) Database layer audit log reviews;3) Operating System layer log reviews;4) Application level user account access reviews; and5) Operating system administrative account access reviews.
FA A FISCAL YEAR 2019 | PERFORMANCE AND ACCOUNTABILIT Y REPORT 85
FIN
AN
CIA
L R
ES
ULT
S
Federal Aviation AdministrationIndependent Auditors’ Report Exhibit IInternal Control Over Financial Reporting SIGNIFICANT DEFICIENCIES
2019-2 Weaknesses in the Design and Implementation of Controls over the Inventory Part Setup and Receipting Process
Background
FAA regularly creates new inventory items in (Logistic Center Support System) LCSS when these parts areacquired or new parts are anticipated to be receipted into inventory through donation within the Exchange and Repair (E&R) program. Additionally, when inventory arrives at the warehouse, FAA receipts certain inventory parts through Miscellaneous (MISC) and Facilities and Equipment (F&E) purchase orders when there is no pre-existing vendor purchase order or Return Material Authorization (RMA) associated with the part.
CriteriaUnited States Government Accountability Office (GAO) Standards for Internal Control in the Federal Government states:
“10.02 Management designs control activities in response to the entity’s objectives and risks to achieve an effective internal control system. Control activities are the policies, procedures, techniques, and mechanisms that enforce management’s directives to achieve the entity’s objectives and address related risks. As part of the control environment component, management defines responsibilities, assigns them to key roles, and delegates authority to achieve the entity’s objectives. As part of the risk assessment component, management identifies the risks related to the entity and its objectives, including its service organizations; the entity’s risk tolerance; and risk responses. Management designs control activities to fulfill defined responsibilities and address identified risk responses.
12.02 Management documents in policies the internal control responsibilities of the organization.”
Federal Accounting Standards Advisory Board (FASAB) Statement of Federal Financial Accounting Standards (SFFAS) 3 Accounting for Inventory and Related Property states:
20-21. “Inventory shall be valued at either (1) historical cost or (2) a method that reasonably approximateshistorical cost. (1) Historical cost shall include all appropriate purchase, transportation and productioncosts incurred to bring the items to their current condition and location. Any abnormal costs, such asexcessive handling or rework costs, shall be charged to operations of the period. Donated inventory shallbe valued at its fair value at the time of donation.”
Condition
Controls to mitigate the risk of error in the inventory unit cost were not properly designed and implemented to ensure that donated E&R inventory parts are accurately setup in LCSS with supportable unit costs and other relevant attributes, such as condition code. Additionally, receipting controls to ensure the accuracy of inputs including; 1) unit cost 2) receipt type and 3) condition code, which are key inputs to the price (valuation) of inventory, were not properly designed and implemented for MISC and F&E purchase orders.
CauseThere is a lack of policies and procedures related to the inventory setup and receipting process for unique inventory types and receipting scenarios. Depending on the type of inventory item being created, there may be little or not be extensive information readily available to create the part in LCSS with the proper attributes, including the correct estimated unit cost and inventory type (e.g., Expendable or E&R).
Further, FAA’s MISC and F&E purchase order policies and procedures were developed prior to full migration to LCSS and therefore were not written, or modified, for unique receipting scenarios which are common within the
FA A FISCAL YEAR 2019 | PERFORMANCE AND ACCOUNTABILIT Y REPORT86
FIN
AN
CIA
L R
ES
ULT
S
Federal Aviation AdministrationIndependent Auditors’ Report Exhibit IInternal Control Over Financial Reporting SIGNIFICANT DEFICIENCIES
new system. As MISC and F&E purchase orders have a considerable amount of additional flexibility when created, the inputs such as unit cost and other relevant valuation-driving attributes are susceptible to an increased risk of error.
EffectFAA may setup and record receipts of inventory parts into LCSS with inaccurate cost or attributes, which could result in a misstatement in the inventory balance.
RecommendationsWe recommend that management:
1) Design and implement review and approval control activities specific to the setup of a new donated inventorypart in LCSS to ensure the established unit cost and related attributes are based on supportable and accurateinformation.
2) Redesign policies and procedures unique to LCSS and the receipting scenarios that are acceptable for theMISC and F&E purchase order receipt process which support the accuracy of inputs. Further, managementshould design and implement review and approval control activities surrounding the creation of MISC andF&E purchase orders in LCSS to ensure the unit cost and other attributes which are critical for the appropriatevaluation, are valid and accurate.
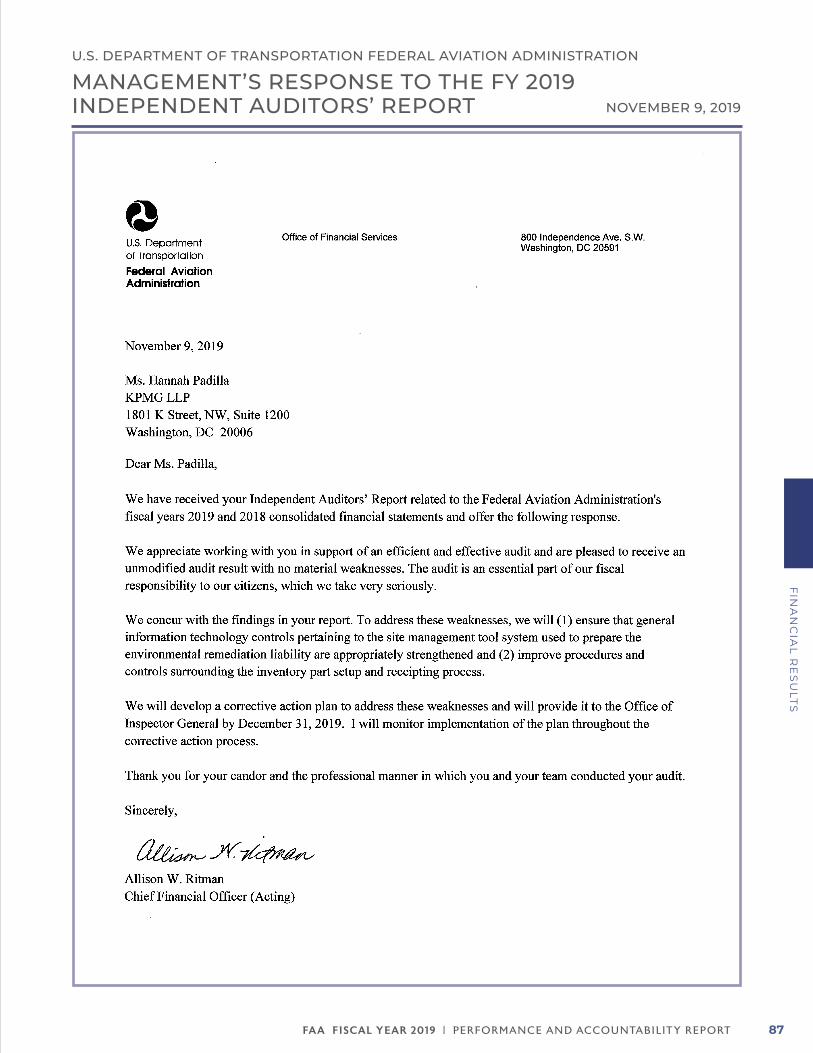
FA A FISCAL YEAR 2019 | PERFORMANCE AND ACCOUNTABILIT Y REPORT 87
FIN
AN
CIA
L R
ES
ULT
S
U.S. DEPARTMENT OF TRANSPORTATION FEDERAL AVIATION ADMINISTRATION
MANAGEMENT’S RESPONSE TO THE FY 2019 INDEPENDENT AUDITORS’ REPORT NOVEMBER 9, 2019
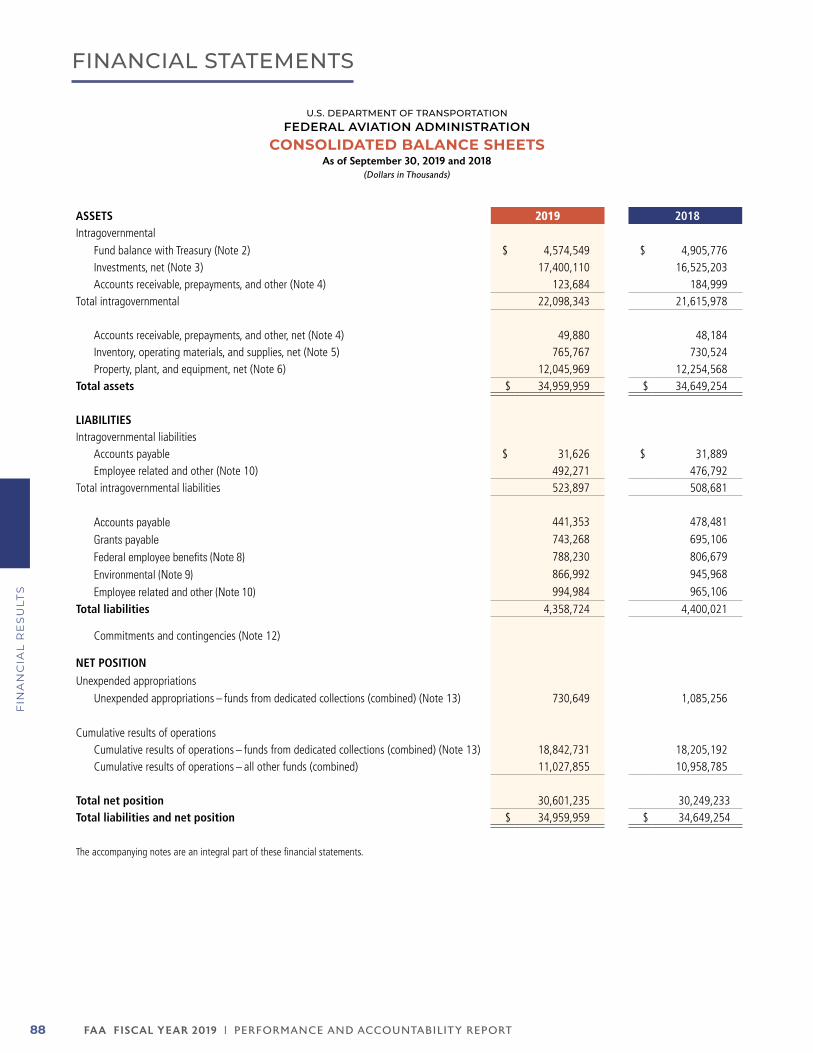
FA A FISCAL YEAR 2019 | PERFORMANCE AND ACCOUNTABILIT Y REPORT88
FIN
AN
CIA
L R
ES
ULT
S
FINANCIAL STATEMENTS
U.S. DEPARTMENT OF TRANSPORTATIONFEDERAL AVIATION ADMINISTRATION
CONSOLIDATED BALANCE SHEETSAs of September 30, 2019 and 2018
(Dollars in Thousands)
ASSETS 2019 2018Intragovernmental
Fund balance with Treasury (Note 2) $ 4,574,549 $ 4,905,776 Investments, net (Note 3) 17,400,110 16,525,203 Accounts receivable, prepayments, and other (Note 4) 123,684 184,999
Total intragovernmental 22,098,343 21,615,978
Accounts receivable, prepayments, and other, net (Note 4) 49,880 48,184 Inventory, operating materials, and supplies, net (Note 5) 765,767 730,524 Property, plant, and equipment, net (Note 6) 12,045,969 12,254,568
Total assets $ 34,959,959 $ 34,649,254
LIABILITIESIntragovernmental liabilities
Accounts payable $ 31,626 $ 31,889 Employee related and other (Note 10) 492,271 476,792
Total intragovernmental liabilities 523,897 508,681
Accounts payable 441,353 478,481
Grants payable 743,268 695,106
Federal employee benefits (Note 8) 788,230 806,679
Environmental (Note 9) 866,992 945,968
Employee related and other (Note 10) 994,984 965,106
Total liabilities 4,358,724 4,400,021
Commitments and contingencies (Note 12)
NET POSITION
Unexpended appropriations
Unexpended appropriations – funds from dedicated collections (combined) (Note 13) 730,649 1,085,256
Cumulative results of operationsCumulative results of operations – funds from dedicated collections (combined) (Note 13) 18,842,731 18,205,192 Cumulative results of operations – all other funds (combined) 11,027,855 10,958,785
Total net position 30,601,235 30,249,233 Total liabilities and net position $ 34,959,959 $ 34,649,254
The accompanying notes are an integral part of these financial statements.
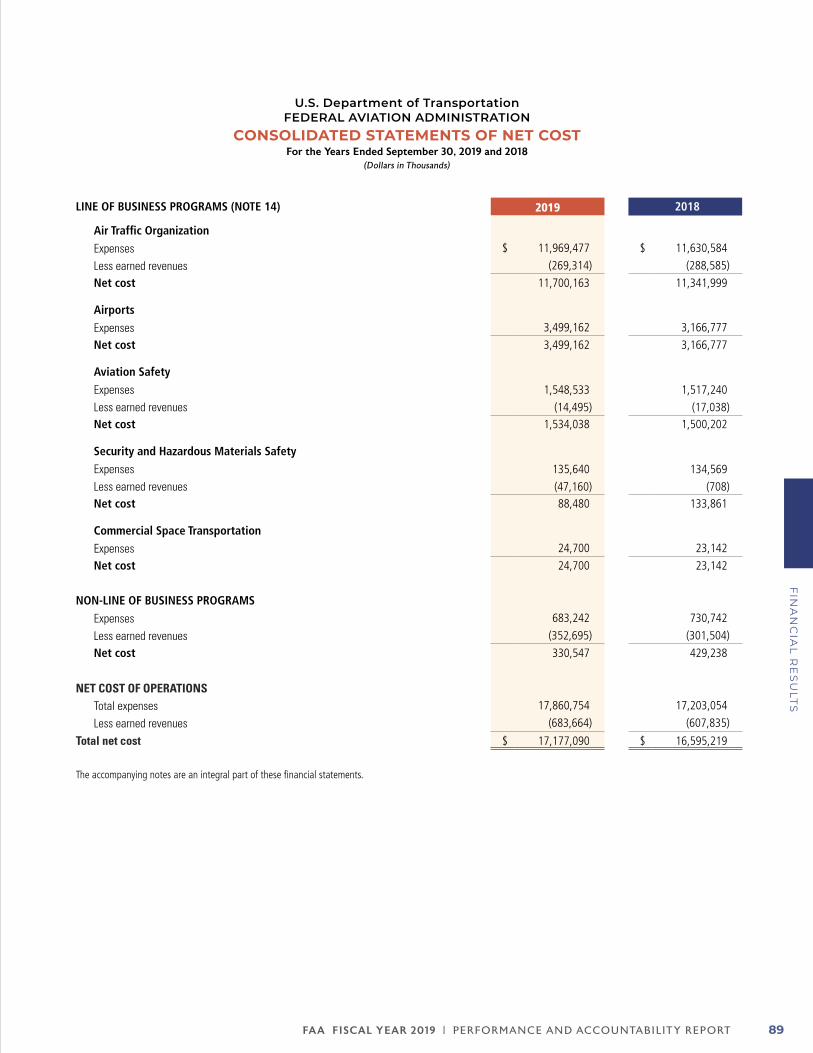
FA A FISCAL YEAR 2019 | PERFORMANCE AND ACCOUNTABILIT Y REPORT 89
FIN
AN
CIA
L R
ES
ULT
S
U.S. Department of TransportationFEDERAL AVIATION ADMINISTRATION
CONSOLIDATED STATEMENTS OF NET COSTFor the Years Ended September 30, 2019 and 2018
(Dollars in Thousands)
LINE OF BUSINESS PROGRAMS (NOTE 14) 2019 2018
Air Traffic Organization
Expenses $ 11,969,477 $ 11,630,584
Less earned revenues (269,314) (288,585)
Net cost 11,700,163 11,341,999
Airports
Expenses 3,499,162 3,166,777
Net cost 3,499,162 3,166,777
Aviation Safety
Expenses 1,548,533 1,517,240
Less earned revenues (14,495) (17,038)Net cost 1,534,038 1,500,202
Security and Hazardous Materials Safety
Expenses 135,640 134,569
Less earned revenues (47,160) (708)Net cost 88,480 133,861
Commercial Space Transportation
Expenses 24,700 23,142
Net cost 24,700 23,142
NON-LINE OF BUSINESS PROGRAMS
Expenses 683,242 730,742
Less earned revenues (352,695) (301,504)
Net cost 330,547 429,238
NET COST OF OPERATIONSTotal expenses 17,860,754 17,203,054
Less earned revenues (683,664) (607,835)
Total net cost $ 17,177,090 $ 16,595,219
The accompanying notes are an integral part of these financial statements.
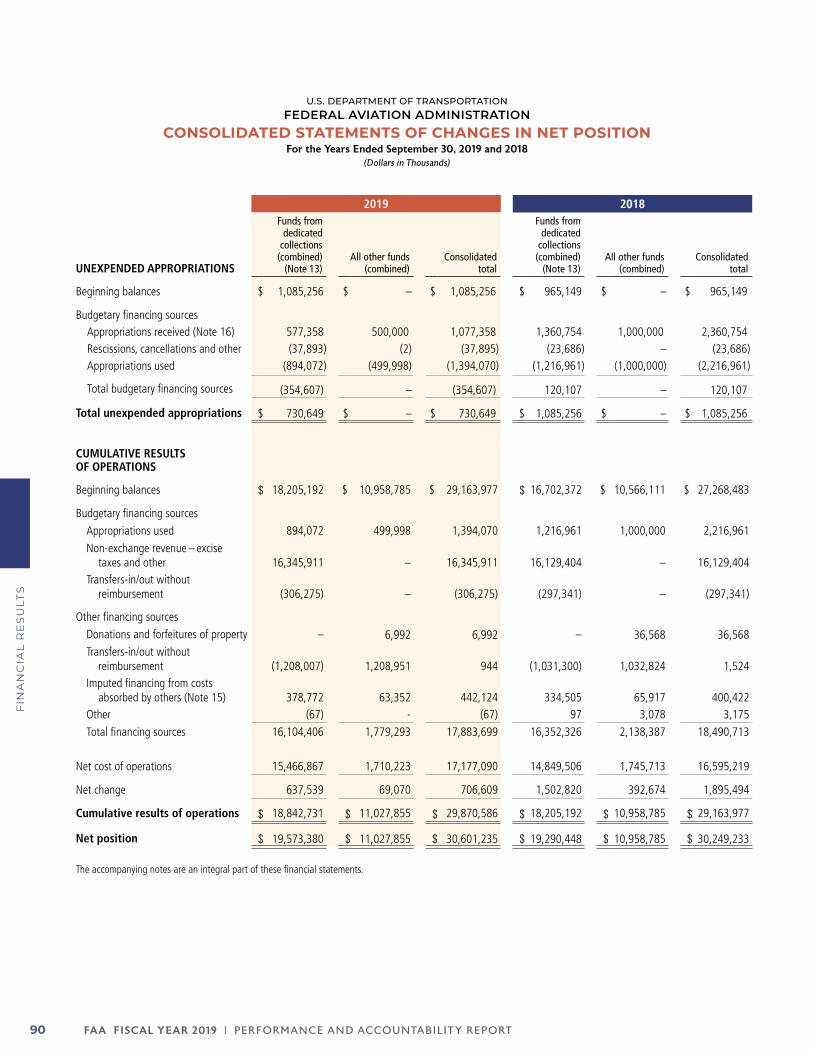
FA A FISCAL YEAR 2019 | PERFORMANCE AND ACCOUNTABILIT Y REPORT90
FIN
AN
CIA
L R
ES
ULT
S
U.S. DEPARTMENT OF TRANSPORTATIONFEDERAL AVIATION ADMINISTRATION
CONSOLIDATED STATEMENTS OF CHANGES IN NET POSITIONFor the Years Ended September 30, 2019 and 2018
(Dollars in Thousands)
2019 2018
UNEXPENDED APPROPRIATIONS
Funds from dedicated
collections (combined)
(Note 13)All other funds
(combined)Consolidated
total
Funds from dedicated
collections (combined)
(Note 13)All other funds
(combined)Consolidated
total
Beginning balances $ 1,085,256 $ – $ 1,085,256 $ 965,149 $ – $ 965,149
Budgetary financing sourcesAppropriations received (Note 16) 577,358 500,000 1,077,358 1,360,754 1,000,000 2,360,754 Rescissions, cancellations and other (37,893) (2) (37,895) (23,686) – (23,686)Appropriations used (894,072) (499,998) (1,394,070) (1,216,961) (1,000,000) (2,216,961)
Total budgetary financing sources (354,607) – (354,607) 120,107 – 120,107
Total unexpended appropriations $ 730,649 $ – $ 730,649 $ 1,085,256 $ – $ 1,085,256
CUMULATIVE RESULTS OF OPERATIONS
Beginning balances $ 18,205,192 $ 10,958,785 $ 29,163,977 $ 16,702,372 $ 10,566,111 $ 27,268,483
Budgetary financing sources
Appropriations used 894,072 499,998 1,394,070 1,216,961 1,000,000 2,216,961
Non-exchange revenue – excise taxes and other 16,345,911 – 16,345,911 16,129,404 – 16,129,404
Transfers-in/out without reimbursement (306,275) – (306,275) (297,341) – (297,341)
Other financing sources
Donations and forfeitures of property – 6,992 6,992 – 36,568 36,568 Transfers-in/out without
reimbursement (1,208,007) 1,208,951 944 (1,031,300) 1,032,824 1,524 Imputed financing from costs
absorbed by others (Note 15) 378,772 63,352 442,124 334,505 65,917 400,422 Other (67) - (67) 97 3,078 3,175
Total financing sources 16,104,406 1,779,293 17,883,699 16,352,326 2,138,387 18,490,713
Net cost of operations 15,466,867 1,710,223 17,177,090 14,849,506 1,745,713 16,595,219
Net change 637,539 69,070 706,609 1,502,820 392,674 1,895,494
Cumulative results of operations $ 18,842,731 $ 11,027,855 $ 29,870,586 $ 18,205,192 $ 10,958,785 $ 29,163,977
Net position $ 19,573,380 $ 11,027,855 $ 30,601,235 $ 19,290,448 $ 10,958,785 $ 30,249,233
The accompanying notes are an integral part of these financial statements.
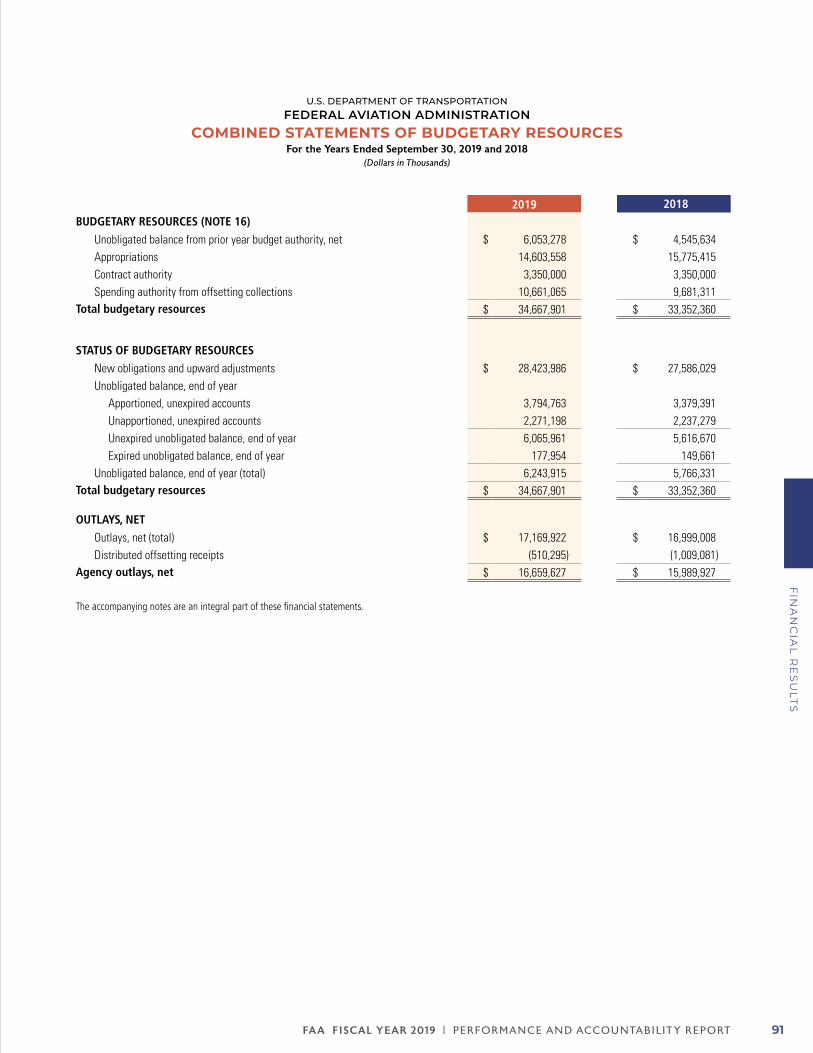
FA A FISCAL YEAR 2019 | PERFORMANCE AND ACCOUNTABILIT Y REPORT 91
FIN
AN
CIA
L R
ES
ULT
S
U.S. DEPARTMENT OF TRANSPORTATIONFEDERAL AVIATION ADMINISTRATION
COMBINED STATEMENTS OF BUDGETARY RESOURCESFor the Years Ended September 30, 2019 and 2018
(Dollars in Thousands)
2019 2018BUDGETARY RESOURCES (NOTE 16)
Unobligated balance from prior year budget authority, net $ 6,053,278 $ 4,545,634 Appropriations 14,603,558 15,775,415 Contract authority 3,350,000 3,350,000 Spending authority from offsetting collections 10,661,065 9,681,311
Total budgetary resources $ 34,667,901 $ 33,352,360
STATUS OF BUDGETARY RESOURCES
New obligations and upward adjustments $ 28,423,986 $ 27,586,029 Unobligated balance, end of year
Apportioned, unexpired accounts 3,794,763 3,379,391 Unapportioned, unexpired accounts 2,271,198 2,237,279 Unexpired unobligated balance, end of year 6,065,961 5,616,670 Expired unobligated balance, end of year 177,954 149,661
Unobligated balance, end of year (total) 6,243,915 5,766,331 Total budgetary resources $ 34,667,901 $ 33,352,360
OUTLAYS, NET
Outlays, net (total) $ 17,169,922 $ 16,999,008 Distributed offsetting receipts (510,295) (1,009,081)
Agency outlays, net $ 16,659,627 $ 15,989,927
The accompanying notes are an integral part of these financial statements.
FA A FISCAL YEAR 2019 | PERFORMANCE AND ACCOUNTABILIT Y REPORT92
FIN
AN
CIA
L R
ES
ULT
S
NOTES TO THE FINANCIAL STATEMENTS
NOTE 1. Summary of Significant Accounting Policies
A. Reporting EntityCreated in 1958, the FAA is a component of the Department of Transportation (DOT), a cabinet-level agency of the executive branch of the federal government. The FAA’s mission is to provide a safe, secure, and efficient global aerospace system that contributes to national security and safety. As the leading authority in the international aviation community, the FAA is responsive to the dynamic nature of customer needs, economic conditions, and environmental concerns.
Congress annually enacts appropriations to permit the FAA to incur obligations for specified purposes. The FAA is accountable for amounts made available per appropriations laws, from the Airport and Airway Trust Fund (AATF), revolving funds, a special fund, and the general fund. The FAA recognizes budgetary resources as assets when authorized by congressional action and apportioned by the Office of Management and Budget (OMB).
The FAA has contract authority, which allows the agency to enter into contracts prior to receiving an appropriation for the payment of obligations. A subsequently enacted appropriation provides funding to liquidate the obligations. Current contract authority is provided for the Airport Improvement Program (AIP) and funded by appropriations from the AATF.
The FAA also has spending authority from offsetting collections primarily from a non-expenditure transfer from the AATF for Operations funding. The balance of the spending authority from offsetting collections comes from other federal agencies which fund reimbursable activities performed by the FAA on their behalf.
The consolidated and combined financial statements present the accounts of all funds that have been established and maintained to account for the resources under the FAA’s control. The FAA has rights and ownership of all assets reported in these financial statements. The FAA does not possess any non-entity assets.
The reporting entity is comprised of the FAA’s lines of business and staff offices. For additional information, see FAA Organization on page 10.
The FAA is the sponsor of the Center for Advanced Aviation System Development (CAASD), a Federally Funded Research and Development Center (FFRDC). CAASD is a disclosure entity, which is not a consolidated entity. While the FAA’s financial statements include its spending for studies it contracts with CAASD, the financial statements of the FAA do not include the financial results or position of CAASD. Additional information on FAA’s relationship with CAASD is presented in Note 19.
B. Basis of PresentationThe financial statements have been prepared to report the financial position, net cost of operations, changes in net position, and status and availability of budgetary resources of the FAA. The statements are a requirement of the Chief Financial Officers Act of 1990 and the Government Management Reform Act of 1994. They have been prepared from, and are fully supported by, the books and records of the FAA in accordance with OMB Circular A-136, as revised, Financial Reporting Requirements, and the DOT and the FAA significant accounting policies, the latter of which are summarized in this note. The statements are subjected to audit, as required by OMB Bulletin 19-03, Audit Requirements for Federal Financial Statements.
All material intra-agency activity has been eliminated for presentation on a consolidated basis, with a few exceptions. The Statement of Budgetary Resources is presented on a combined basis in accordance with OMB Circular A-136, as revised, Financial Reporting Requirements. Intra-agency activity reported in funds from dedicated collections is often offset with activity in other funds. Accordingly, funds from dedicated collections and all other funds, presented separately in the Balance Sheets and Statements of Changes in Net Position, are presented on a combined basis.
FA A FISCAL YEAR 2019 | PERFORMANCE AND ACCOUNTABILIT Y REPORT 93
FIN
AN
CIA
L R
ES
ULT
S
Accounting standards require all reporting entities to disclose that accounting standards allow certain presentations and disclosures to be modified, if needed, to prevent the disclosure of classified information.
Unless specified otherwise, all dollar amounts are presented in thousands.
C. Basis of AccountingThe financial statements are prepared in accordance with all applicable accounting principles and standards developed and issued by the Federal Accounting Standards Advisory Board, which is recognized by the American Institute of Certified Public Accountants as the entity to establish generally accepted accounting principles for the Federal Government. The Federal Financial Management Improvement Act of 1996 requires the FAA to comply substantially with (1) Federal financial management systems requirements, (2) applicable Federal accounting standards, and (3) the United States Standard General Ledger requirements at the transaction level.
Transactions are recorded on both an accrual accounting basis and a budgetary accounting basis. Under the accrual method, revenues are recognized when earned and expenses are recognized when a liability is incurred, without regard to receipt or payment of cash. Budgetary accounting facilitates compliance with legal requirements on the use of federal funds.
D. Revenues and Other Financing SourcesCongress enacts annual, multi-year, and no-year appropriations to be used, within statutory limits, for operating, capital, and grant expenditures. Additional amounts are obtained from service fees (e.g., landing, registry, and aviation user fees), and through reimbursements for products and services provided to domestic and foreign governmental entities.
The AATF is sustained by excise taxes that the Internal Revenue Service (IRS) collects from airway system users. Excise taxes collected are initially deposited to the General Fund of the U.S. Government. The IRS does not receive sufficient information at the time the excise taxes are collected to determine how they should be distributed to specific funds from dedicated collections. Therefore, the U.S. Treasury makes initial semi-monthly distributions to the AATF based on allocations prepared by its Office of Tax Analysis. These allocations are based on historical excise tax data applied to current excise tax receipts and later adjusted to agree to actual collections when certified by the IRS.
The FAA’s September 30, 2019 financial statements reflect excise taxes certified by the IRS through June 30, 2019, and excise taxes allocated by the Office of Tax Analysis for the period July 1 through September 30, 2019, in compliance with Statement of Federal Financial Accounting Standards Number 7, Accounting for Revenue and Other Financing Sources. Actual excise tax collections data for the quarter ended September 30, 2019, will not be available from the IRS until February 2020. When actual amounts are certified by the IRS, generally four to five months after the end of each quarter, adjustments are made to the AATF to account for the difference. Additional information on this subject is disclosed in Note 13.
Interest on investments is recognized as revenue on an accrual basis, and classified as exchange or nonexchange depending on the predominant source of funds upon which the interest payment is based.
Appropriations are recognized as a financing source when expended. Revenues from services provided by the FAA associated with reimbursable agreements are recognized concurrently with the recognition of accrued expenditures for performing the services. Aviation overflight user fees are recognized as revenue in the period in which the flights take place.
Goods and services are received from other federal entities at no cost or at a cost less than the full cost to the providing federal entity. Consistent with accounting standards, certain costs of the providing entity that are not fully reimbursed by the FAA are recognized as imputed cost (in the Statement of Net Cost), and are offset by imputed financing sources (in the Statement of Changes in Net Position). Such imputed costs and revenues relate to business-type activities, employee benefits, and claims to be settled by the Treasury Judgment Fund. However, unreimbursed costs of goods and services other than those identified above are not included in our financial statements.
E. TaxesThe FAA, as a federal entity, is not subject to federal, state, or local income taxes and, accordingly, does not record a provision for income taxes in the accompanying financial statements.
F. Fund Balance with the U.S. TreasuryThe U.S. Treasury processes cash receipts and disbursements. Funds held at the Treasury are available to pay agency liabilities. The FAA does not maintain cash in commercial
FA A FISCAL YEAR 2019 | PERFORMANCE AND ACCOUNTABILIT Y REPORT94
FIN
AN
CIA
L R
ES
ULT
S
bank accounts or foreign currency balances. Foreign currency payments are made either by the U.S. Treasury or the U.S. Department of State and are reported by the FAA in the U.S. dollar equivalent.
G. Investment in U.S. Government SecuritiesUnexpended funds in the AATF and Aviation Insurance Revolving Fund are invested in U.S. Government securities and reported at cost. A portion of the AATF investments is liquidated monthly in amounts needed to provide cash for the FAA appropriation accounts, to the extent authorized. Aviation Insurance Revolving Fund investments are intended to be held to maturity, but may be liquidated to pay insurance claims when necessary. Investments, redemptions, and reinvestments are held and managed under the direction of the FAA by the U.S. Treasury.
H. Accounts ReceivableAccounts receivable consists of amounts owed to the FAA by other federal agencies and the public. Amounts due from federal agencies are considered fully collectible. Accounts receivable from the public include, for example, aviation user fees, fines and penalties, reimbursements from employees, and services performed for foreign governments. An allowance for loss on uncollectible amounts due from the public is established based on historical collection experience or an analysis of the individual receivables.
I. InventoryWithin the FAA’s Administrative Services Franchise Fund (Franchise Fund), inventory is held for sale to the FAA field locations and other domestic entities and foreign governments. Inventory consists of materials and supplies that the FAA uses to support our nation’s airspace system and is predominantly located at the Mike Monroney Aeronautical Center in Oklahoma City, Oklahoma. Inventory costs include material, labor, and applicable manufacturing overhead.
Inventory held for sale includes both purchased inventory and refurbished inventory. Inventory held for sale is valued using historical cost, applying the moving average cost flow method. The moving average cost flow method is an inventory costing method used in conjunction with a perpetual inventory system. A weighted average cost per unit is recomputed after every purchase. Goods sold are costed at the most recent moving average cost.
The FAA has an exchange and repair program where the FAA field locations exchange non-operational components with the Franchise Fund for operational components. The non-operational repairable components are classified as “held for repair” and valued using the direct method. Under the direct method, inventory held for repair is valued at the same value as a serviceable item less the estimated repair costs.
Raw materials and work in progress is comprised of repairable inventory components, the materials used to bring the components to a re-useable or serviceable condition along with the labor and overhead incurred during the refurbishing process. Raw materials are valued using historical cost, applying the moving average cost flow method. The repairable components, reported as work in progress, are valued at the same value as a serviceable item less the estimated repair costs at the time of transfer from the “held for repair” account to the work in progress account. When the refurbishing process is complete, the inventory components are reclassified to “held for sale.”
Inventory may be deemed to be “excess, obsolete, and unserviceable” if, for example, the quantity exceeds projected demand for the foreseeable future or if the item has been technologically surpassed. The “excess, obsolete, and unserviceable” inventory is determined to have no residual net realizable value, therefore, a loss is recognized to write off the inventory in the current period.
J. Operating Materials and SuppliesOperating materials and supplies primarily consist of unissued materials and supplies that will be used in the repair and maintenance of FAA owned aircraft. They are valued based on the latest acquisition cost. Operating materials and supplies are expensed using the consumption method of accounting. Under the consumption method, goods are recognized as assets upon acquisition and are expensed as they are consumed.
Operating materials and supplies “held for use” are those items that are consumed on a regular and ongoing basis. Operating materials and supplies “held for repair” are awaiting service to restore their condition to “held for use.” An allowance of 50 percent has been established for operating materials and supplies “held for repair” based on historical experience.
Operating materials and supplies may be classified as “excess, obsolete, and unserviceable” if, for example, the quantity exceeds projected demand for the foreseeable future or if the item has been technologically surpassed. An allowance
FA A FISCAL YEAR 2019 | PERFORMANCE AND ACCOUNTABILIT Y REPORT 95
FIN
AN
CIA
L R
ES
ULT
S
is established for “excess, obsolete, and unserviceable” operating materials and supplies based on the condition of various asset categories as well as the FAA’s historical experience with disposing of such assets.
K. Property, Plant, and EquipmentThe FAA capitalizes acquisitions of Property, Plant, and Equipment (PP&E) when the cost equals or exceeds $100 thousand (except for internal use software, for which the threshold is $200 thousand) and the useful life equals or exceeds two years. The FAA records PP&E at original acquisition cost. However, where applicable, the FAA allocates an average cost of like assets within a program, commonly referred to as “unit costing.” The FAA purchases some capital assets in large quantities, which are known as “bulk purchases.” If the cost per unit is below the capitalization threshold of the FAA, then these items are expensed.
Depreciation expense is calculated using the straight-line method. Depreciation commences the first month after the asset is placed in service. The FAA does not recognize residual value of its PP&E.
Real property assets, such as buildings, air traffic control towers, en route air traffic control centers, mobile buildings, roads, sidewalks, parking lots, and other structures, are depreciated over a useful life of up to 40 years.
Personal property assets, such as aircraft, decision support systems, navigation-, surveillance-, communications- and weather-related equipment, office furniture, vehicles, and office equipment, are depreciated over a useful life of up to 20 years.
Internal use software, such as software used to operate programmatic and administrative information systems, is generally amortized over a useful life of five years. However, it may be adjusted if a determination is made by specific program office and/or subject matter experts to have a longer or shorter useful life (not less than two years).
Construction in progress and internal use software in development are valued at actual direct costs plus applied overhead and other indirect costs.
The FAA researches and develops new technologies to support the nation’s airspace system. Until such time as a research and development project reaches “technological feasibility,” the costs associated with the project are expensed in the year incurred.
L. LeasesThe FAA occupies certain real property that is leased by the DOT from the General Services Administration (GSA). The FAA also has non-GSA leases. Payments made by the FAA are based on contractual agreements. Future payments are disclosed for both cancellable and non-cancellable operating leases, but not disclosed separately since most lease agreements are either cancellable or contain termination rights.
Capital leases for buildings and equipment are amortized over the lease term. If the lease agreement contains a bargain purchase option or otherwise provides for transferring title of the asset to the FAA, the buildings are depreciated over a 40-year service life and the equipment is depreciated over its estimated useful life.
M. Prepaid ChargesThe FAA generally does not pay for goods and services in advance, except for certain reimbursable agreements, subscriptions, and payments to contractors and employees. Payments made in advance of the receipt of goods and services are recorded as prepaid charges at the time of prepayment and recognized as expenses when the related goods and services are received.
N. LiabilitiesLiabilities covered by budgetary or other resources are those liabilities for which Congress has appropriated funds, and which are otherwise available to pay amounts due. Liabilities not covered by budgetary or other resources represent amounts owed in excess of available, congressionally appropriated funds or other amounts. The liquidation of liabilities not covered by budgetary or other resources is dependent on future congressional appropriations or other funding, including the AATF. Liabilities not requiring budgetary resources include custodial liabilities which are collections on behalf of other federal entities or funds, such as the General Fund of the U.S. Government. Custodial liabilities are liquidated when the collections are transferred to the owner. Intragovernmental liabilities are claims against the FAA by other federal agencies.
O. Accounts PayableAccounts payable are amounts that the FAA owes to other federal agencies and the public. Accounts payable to federal agencies generally consist of amounts due under interagency reimbursable agreements. Accounts payable to the public primarily consist of unpaid goods and services received by the FAA in support of our nation’s airspace system.
FA A FISCAL YEAR 2019 | PERFORMANCE AND ACCOUNTABILIT Y REPORT96
FIN
AN
CIA
L R
ES
ULT
S
P. Annual, Sick, and Other LeaveAnnual leave is accrued as it is earned and the accrual is reduced as leave is taken. For each biweekly pay period, the balance in the accrued annual leave account is adjusted to reflect the latest pay rates and unused hours of leave. Liabilities associated with other types of vested leave, including compensatory, credit hours, restored leave, and sick leave in certain circumstances, are accrued based on latest pay rates and unused hours of leave. Sick leave is generally non-vested, except for sick leave balances at retirement under the terms of certain union agreements. Funding will be obtained from future financing sources to the extent that current or prior year appropriations are not available to fund annual and other types of vested leave earned but not taken. Non-vested leave is expensed when used.
Q. Workers’ CompensationThe Federal Employees Compensation Act (FECA) (Public Law 103-3) provides income and medical cost protection to covered federal civilian employees injured on the job, to employees who have incurred work-related occupational diseases, and to beneficiaries of employees whose deaths are attributable to job-related injuries or occupational diseases. The FECA program is administered by the Department of Labor (DOL), which pays valid claims and subsequently seeks reimbursement from the FAA for these paid claims.
The FECA liability consists of two elements. The first element, accrued FECA liability, is based on workers’ compensation claims paid by DOL but not yet reimbursed by the FAA. The FAA reimburses DOL for claims as funds are appropriated for this purpose. In general, there is a two-year period between payment by DOL and reimbursement to DOL by the FAA. As a result, the FAA recognizes an intragovernmental liability for the claims paid by DOL and not yet reimbursed by the FAA.
The second element, actuarial FECA liability, is the estimated liability for future benefit payments. The actuarial FECA liability includes the expected liability for death, disability, medical, and miscellaneous costs for approved compensation cases. DOL determines the actuarial FECA liability annually, as of September 30, using an actuarial method that considers historical benefit payment patterns, wage inflation factors, medical inflation factors, and other variables. The projected annual benefit payments are discounted to present value using the OMB economic assumptions for 10-year Treasury notes and bonds. The actuarial FECA liability is not covered by budgetary resources and will require future funding.
For additional information regarding accrued FECA liability, see Note 8, Federal Employee Benefits and Note 10, Employee Related and Other Liabilities.
R. Retirement PlanFAA employees participate in either the Civil Service Retirement System (CSRS) or the Federal Employees Retirement System (FERS). The employees who participate in the CSRS contribute seven percent of their pay and are beneficiaries of the FAA’s matching contribution program, equal to seven percent of pay, distributed to their annuity account in the Civil Service Retirement and Disability Fund.
FERS went into effect on January 1, 1987. FERS and Social Security automatically cover most employees hired after December 31, 1983. Employees hired prior to January 1, 1984 could elect either to join FERS and Social Security or to remain in CSRS. FERS offers a savings plan to which the FAA automatically contributes one percent of pay and matches any employee contribution up to an additional four percent of pay. For FERS participants, the FAA also contributes the employer’s matching share for Social Security. The FAA’s matching contributions are recognized as operating expenses.
The FAA recognizes the full cost of pensions and other retirement benefits during an employee’s active years of service. The costs are covered through a combination of FAA appropriations and imputed costs. The imputed amount is calculated using the OPM’s cost factors and is the difference between the FAA’s and the employee’s contributions during the year and the total cost of the benefit. OPM actuaries determine pension cost factors by calculating the value of pension benefits expected to be paid in the future and communicate these factors to the FAA. The OPM also provides information regarding the full cost of health and life insurance benefits. The imputed costs are completely offset with other financing sources, which are reported as an imputed financing source on the Consolidated Statements of Changes in Net Position to the extent that these costs will be paid by the OPM. Reporting of the assets and liabilities associated with the retirement plans is the responsibility of the administering agency, OPM. Therefore, the FAA does not report CSRS or FERS assets, accumulated plan benefits, or unfunded liabilities, if any, applicable to employees.
S. GrantsThe FAA records an obligation at the time a grant is awarded. As grant recipients conduct eligible activities under the terms of their grant agreement, they request payment by the FAA, typically made via an electronic payment process. Expenses
FA A FISCAL YEAR 2019 | PERFORMANCE AND ACCOUNTABILIT Y REPORT 97
FIN
AN
CIA
L R
ES
ULT
S
are recorded at the time of payment approval during the year. The FAA also recognizes an accrued liability and expense for estimated eligible grant payments not yet requested by grant recipients. Grant expenses, including associated administrative costs, are classified on the Consolidated Statements of Net Cost under the Airports line of business.
T. Use of EstimatesManagement has made certain estimates and assumptions when reporting assets, liabilities, revenues, and expenses, and in the note disclosures. Actual results could differ from these estimates. Significant estimates underlying the accompanying financial statements include (a) legal, environmental, and contingent liabilities; (b) accruals of accounts and grants payable; (c) accrued workers’ compensation; (d) allowance for doubtful accounts receivable; (e) allowances for operating materials and supplies; (f) allocations of common costs to construction in progress, (g) the allocation of an average cost of like property, plant, and equipment within a program, commonly referred to as unit costing; and (h) accrued benefits and benefits payable.
U. Environmental LiabilitiesIn compliance with applicable laws and regulations including the Clean Air Act of 1963, the Resource Conservation and Recovery Act of 1976, the Comprehensive Environmental Response, Compensation and Liability Act of 1980 as amended by the Superfund Amendments and Reauthorization Act of 1986 and the Community Environmental Response Facilitation Act of 1992, the FAA recognizes two types of environmental liabilities: environmental remediation, and cleanup and decommissioning.
The liability for environmental remediation is an estimate of costs necessary to bring a known contaminated site into compliance with applicable environmental standards. The increase or decrease in the annual liability is charged to current year expense.
The liability for environmental cleanup and decommissioning is the estimated cost that will be incurred to remove, contain, and/or dispose of hazardous materials when an asset presently in service is shutdown. The FAA estimates the environmental cleanup and decommissioning costs at the time that an FAA-owned asset is placed in service. For assets placed in service through FY 1998, the increase or decrease in the estimated environmental cleanup liability is charged to expense. Assets placed in service in FY 1999 and after do not contain any known hazardous materials, and therefore do not have associated environmental liabilities.
There are no known possible changes to these estimates based on inflation, deflation, technology or applicable laws and regulations.
V. ContingenciesA contingent liability represents a potential cost to the FAA depending on the outcome of future events. Three categories of contingent liabilities — probable, reasonably possible, and remote — determine the appropriate accounting treatment. The FAA recognizes contingent liabilities, in the accompanying balance sheet and statement of net cost, when they are both probable and can be reasonably estimated. The FAA discloses contingent liabilities in the notes to the financial statements (see Note 12) when the conditions for liability recognition are not met but are reasonably possible. Contingent liabilities that are considered remote are not disclosed.
In some cases, once losses are certain, payments may be made from the Judgment Fund maintained by the U.S. Treasury rather than from the amounts appropriated to the FAA for agency operations. Payments from the Judgment Fund are recorded as “Other Financing Sources” when made.
W. Funds from Dedicated CollectionsThe FAA’s financial statements include the following funds, considered to be “funds from dedicated collections”:
zz AATF
zz Operations-AATF
zz Operations-General Fund
zz Grants-in-Aid for Airports-AATF
zz Facilities and Equipment
zz Research, Engineering, and Development
zz Aviation Insurance Fund
zz Aviation User Fees
Funds from dedicated collections are those that are financed by specifically identified revenues and financing sources which remain available over time. They are required by statute to be used for designated activities, benefits, or purposes and must be accounted for separately from the government’s general revenues.
The AATF is funded by excise taxes that the IRS collects from airway system users. These receipts are unavailable until appropriated by the U.S. Congress. Once appropriated for use, the FAA transfers the AATF receipts necessary to meet
FA A FISCAL YEAR 2019 | PERFORMANCE AND ACCOUNTABILIT Y REPORT98
FIN
AN
CIA
L R
ES
ULT
S
cash disbursement needs to several other funds, from which expenditures are made. Those funds that receive transfers from the AATF are the Operations-AATF, Grants-in-Aid for Airports-AATF, Facilities and Equipment, and Research, Engineering and Development. These funds represent the majority of the FAA annual expenditures.
In addition, while the Operations-General Fund is primarily funded through transfers from Operations-AATF, it is also supplemented by funding from the General Fund of the U.S. Government through annual appropriations. Because the Operations-General Fund is primarily funded from the AATF, and because it is not reasonably possible to differentiate cash balances between those originally flowing from the AATF versus those that come from general fund appropriations, the Operations-General Fund is presented as funds from dedicated collections. The funds from dedicated collections in the Facilities and Equipment fund are used to purchase or construct PP&E. When PP&E has been placed in service, the funds from dedicated collections are no longer available for future expenditure, have been used for their intended purpose, and are therefore classified as “other funds” on
the balance sheet and the statement of changes in net position. Construction in progress is classified as “funds from dedicated collections” because although the funds have been expended, they have not yet fully achieved their intended purpose. The intended result of this presentation is to differentiate between funds from dedicated collections that remain available for future expenditure, or have not yet fully achieved their designated purpose, and funds from dedicated collections previously expended that have achieved their intended purpose.
Additional disclosures concerning funds from dedicated collections can be found in Note 13.
X. ReclassificationsCertain prior year amounts have been reclassified for consistency with the current year presentation.
FY 2018 net costs have been reclassified in Note 14, Net Cost by Program and Strategic Goal, for consistency with the current year presentation of the strategic goals adopted by the FAA in FY 2019.
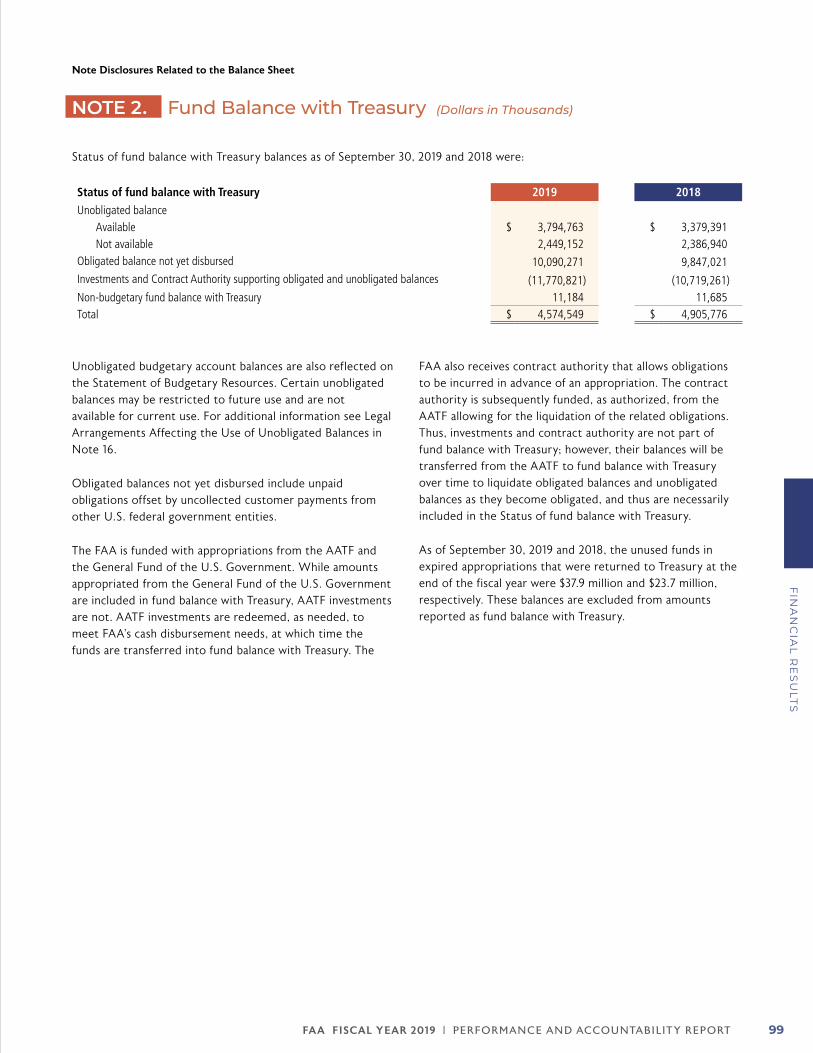
FA A FISCAL YEAR 2019 | PERFORMANCE AND ACCOUNTABILIT Y REPORT 99
FIN
AN
CIA
L R
ES
ULT
S
Note Disclosures Related to the Balance Sheet
NOTE 2. Fund Balance with Treasury (Dollars in Thousands)
Status of fund balance with Treasury balances as of September 30, 2019 and 2018 were:
Status of fund balance with Treasury 2019 2018
Unobligated balanceAvailable $ 3,794,763 $ 3,379,391 Not available 2,449,152 2,386,940
Obligated balance not yet disbursed 10,090,271 9,847,021 Investments and Contract Authority supporting obligated and unobligated balances (11,770,821) (10,719,261)Non-budgetary fund balance with Treasury 11,184 11,685 Total $ 4,574,549 $ 4,905,776
Unobligated budgetary account balances are also reflected on the Statement of Budgetary Resources. Certain unobligated balances may be restricted to future use and are not available for current use. For additional information see Legal Arrangements Affecting the Use of Unobligated Balances in Note 16.
Obligated balances not yet disbursed include unpaid obligations offset by uncollected customer payments from other U.S. federal government entities.
The FAA is funded with appropriations from the AATF and the General Fund of the U.S. Government. While amounts appropriated from the General Fund of the U.S. Government are included in fund balance with Treasury, AATF investments are not. AATF investments are redeemed, as needed, to meet FAA’s cash disbursement needs, at which time the funds are transferred into fund balance with Treasury. The
FAA also receives contract authority that allows obligations to be incurred in advance of an appropriation. The contract authority is subsequently funded, as authorized, from the AATF allowing for the liquidation of the related obligations. Thus, investments and contract authority are not part of fund balance with Treasury; however, their balances will be transferred from the AATF to fund balance with Treasury over time to liquidate obligated balances and unobligated balances as they become obligated, and thus are necessarily included in the Status of fund balance with Treasury.
As of September 30, 2019 and 2018, the unused funds in expired appropriations that were returned to Treasury at the end of the fiscal year were $37.9 million and $23.7 million, respectively. These balances are excluded from amounts reported as fund balance with Treasury.
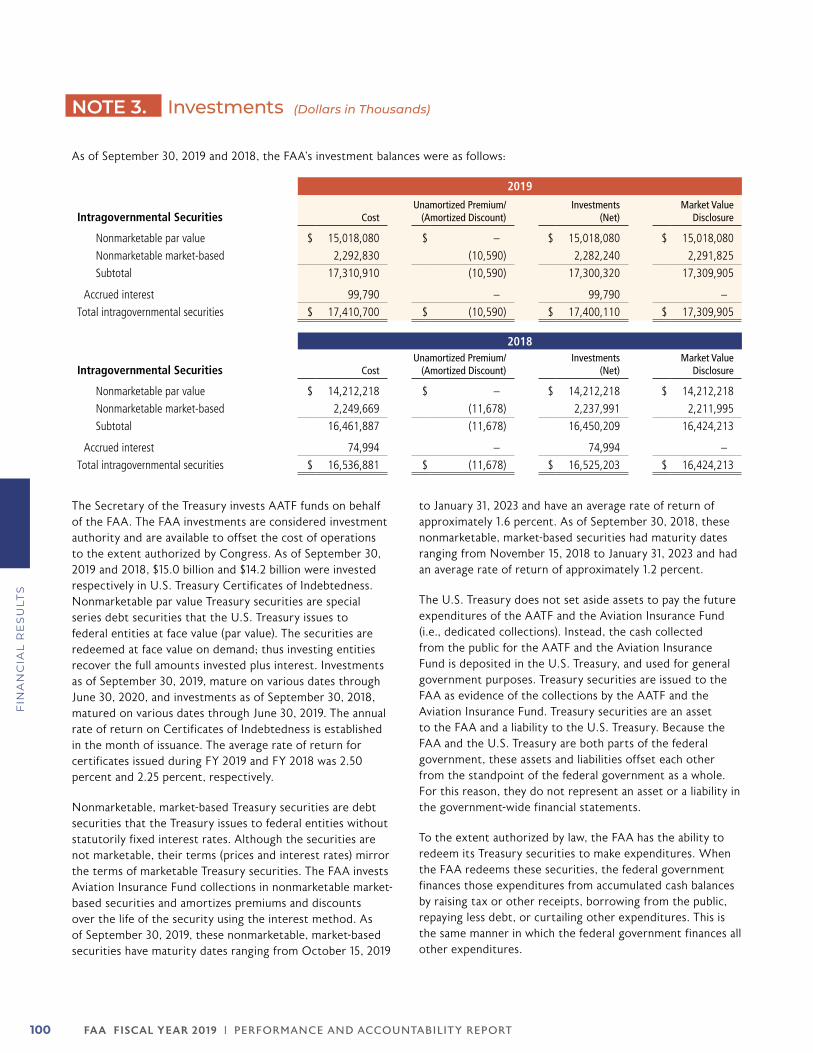
FA A FISCAL YEAR 2019 | PERFORMANCE AND ACCOUNTABILIT Y REPORT100
FIN
AN
CIA
L R
ES
ULT
S
NOTE 3. Investments (Dollars in Thousands)
As of September 30, 2019 and 2018, the FAA’s investment balances were as follows:
2019
Intragovernmental Securities Cost Unamortized Premium/
(Amortized Discount) Investments
(Net) Market Value
Disclosure
Nonmarketable par value $ 15,018,080 $ – $ 15,018,080 $ 15,018,080
Nonmarketable market-based 2,292,830 (10,590) 2,282,240 2,291,825
Subtotal 17,310,910 (10,590) 17,300,320 17,309,905
Accrued interest 99,790 – 99,790 –
Total intragovernmental securities $ 17,410,700 $ (10,590) $ 17,400,110 $ 17,309,905
2018
Intragovernmental Securities Cost Unamortized Premium/
(Amortized Discount) Investments
(Net) Market Value
Disclosure
Nonmarketable par value $ 14,212,218 $ – $ 14,212,218 $ 14,212,218
Nonmarketable market-based 2,249,669 (11,678) 2,237,991 2,211,995
Subtotal 16,461,887 (11,678) 16,450,209 16,424,213
Accrued interest 74,994 – 74,994 –
Total intragovernmental securities $ 16,536,881 $ (11,678) $ 16,525,203 $ 16,424,213
The Secretary of the Treasury invests AATF funds on behalf of the FAA. The FAA investments are considered investment authority and are available to offset the cost of operations to the extent authorized by Congress. As of September 30, 2019 and 2018, $15.0 billion and $14.2 billion were invested respectively in U.S. Treasury Certificates of Indebtedness. Nonmarketable par value Treasury securities are special series debt securities that the U.S. Treasury issues to federal entities at face value (par value). The securities are redeemed at face value on demand; thus investing entities recover the full amounts invested plus interest. Investments as of September 30, 2019, mature on various dates through June 30, 2020, and investments as of September 30, 2018, matured on various dates through June 30, 2019. The annual rate of return on Certificates of Indebtedness is established in the month of issuance. The average rate of return for certificates issued during FY 2019 and FY 2018 was 2.50 percent and 2.25 percent, respectively.
Nonmarketable, market-based Treasury securities are debt securities that the Treasury issues to federal entities without statutorily fixed interest rates. Although the securities are not marketable, their terms (prices and interest rates) mirror the terms of marketable Treasury securities. The FAA invests Aviation Insurance Fund collections in nonmarketable market-based securities and amortizes premiums and discounts over the life of the security using the interest method. As of September 30, 2019, these nonmarketable, market-based securities have maturity dates ranging from October 15, 2019
to January 31, 2023 and have an average rate of return of approximately 1.6 percent. As of September 30, 2018, these nonmarketable, market-based securities had maturity dates ranging from November 15, 2018 to January 31, 2023 and had an average rate of return of approximately 1.2 percent.
The U.S. Treasury does not set aside assets to pay the future expenditures of the AATF and the Aviation Insurance Fund (i.e., dedicated collections). Instead, the cash collected from the public for the AATF and the Aviation Insurance Fund is deposited in the U.S. Treasury, and used for general government purposes. Treasury securities are issued to the FAA as evidence of the collections by the AATF and the Aviation Insurance Fund. Treasury securities are an asset to the FAA and a liability to the U.S. Treasury. Because the FAA and the U.S. Treasury are both parts of the federal government, these assets and liabilities offset each other from the standpoint of the federal government as a whole. For this reason, they do not represent an asset or a liability in the government-wide financial statements.
To the extent authorized by law, the FAA has the ability to redeem its Treasury securities to make expenditures. When the FAA redeems these securities, the federal government finances those expenditures from accumulated cash balances by raising tax or other receipts, borrowing from the public, repaying less debt, or curtailing other expenditures. This is the same manner in which the federal government finances all other expenditures.
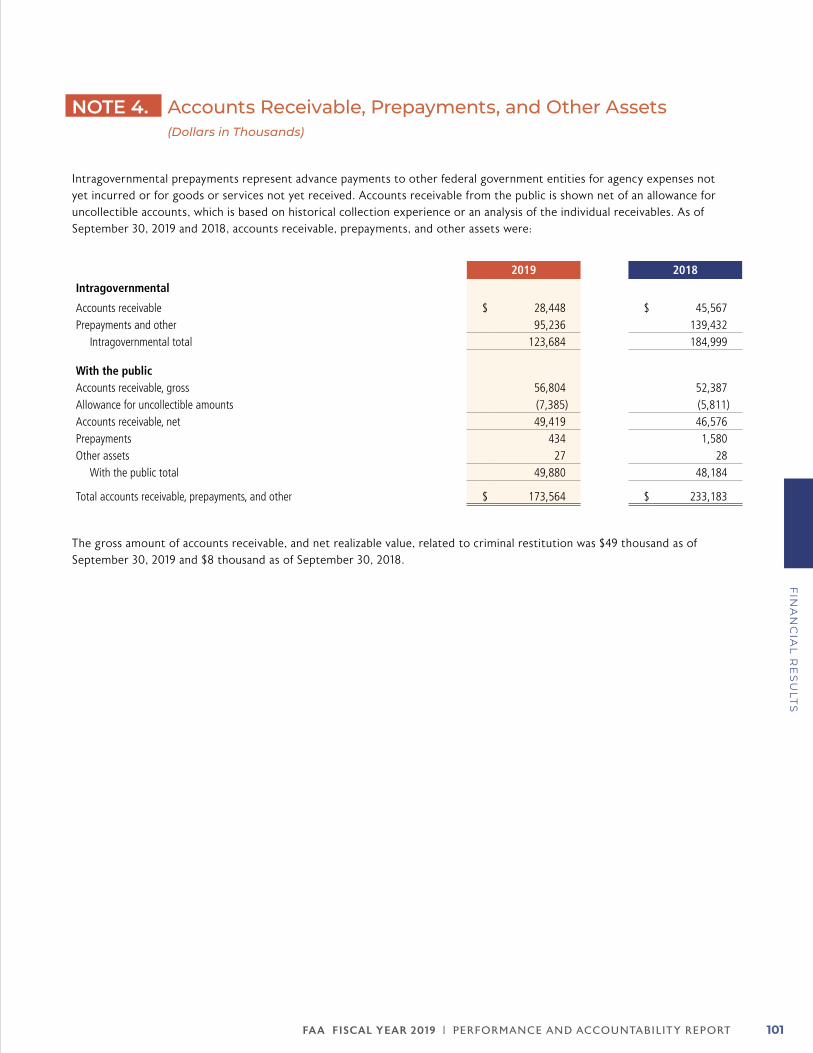
FA A FISCAL YEAR 2019 | PERFORMANCE AND ACCOUNTABILIT Y REPORT 101
FIN
AN
CIA
L R
ES
ULT
S
NOTE 4. Accounts Receivable, Prepayments, and Other Assets (Dollars in Thousands)
Intragovernmental prepayments represent advance payments to other federal government entities for agency expenses not yet incurred or for goods or services not yet received. Accounts receivable from the public is shown net of an allowance for uncollectible accounts, which is based on historical collection experience or an analysis of the individual receivables. As of September 30, 2019 and 2018, accounts receivable, prepayments, and other assets were:
2019 2018
Intragovernmental
Accounts receivable $ 28,448 $ 45,567 Prepayments and other 95,236 139,432
Intragovernmental total 123,684 184,999
With the publicAccounts receivable, gross 56,804 52,387 Allowance for uncollectible amounts (7,385) (5,811)Accounts receivable, net 49,419 46,576 Prepayments 434 1,580 Other assets 27 28
With the public total 49,880 48,184
Total accounts receivable, prepayments, and other $ 173,564 $ 233,183
The gross amount of accounts receivable, and net realizable value, related to criminal restitution was $49 thousand as of September 30, 2019 and $8 thousand as of September 30, 2018.
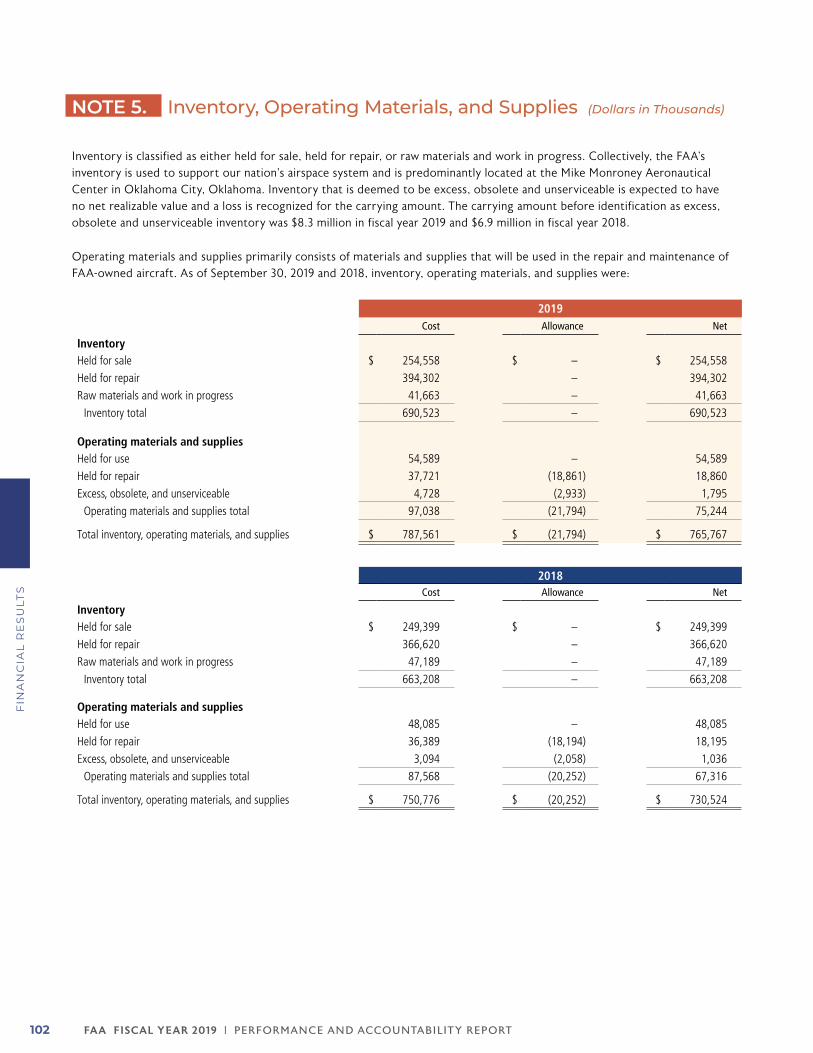
FA A FISCAL YEAR 2019 | PERFORMANCE AND ACCOUNTABILIT Y REPORT102
FIN
AN
CIA
L R
ES
ULT
S
NOTE 5. Inventory, Operating Materials, and Supplies (Dollars in Thousands)
Inventory is classified as either held for sale, held for repair, or raw materials and work in progress. Collectively, the FAA’s inventory is used to support our nation’s airspace system and is predominantly located at the Mike Monroney Aeronautical Center in Oklahoma City, Oklahoma. Inventory that is deemed to be excess, obsolete and unserviceable is expected to have no net realizable value and a loss is recognized for the carrying amount. The carrying amount before identification as excess, obsolete and unserviceable inventory was $8.3 million in fiscal year 2019 and $6.9 million in fiscal year 2018.
Operating materials and supplies primarily consists of materials and supplies that will be used in the repair and maintenance of FAA-owned aircraft. As of September 30, 2019 and 2018, inventory, operating materials, and supplies were:
2019Cost Allowance Net
InventoryHeld for sale $ 254,558 $ – $ 254,558
Held for repair 394,302 – 394,302
Raw materials and work in progress 41,663 – 41,663
Inventory total 690,523 – 690,523
Operating materials and suppliesHeld for use 54,589 – 54,589
Held for repair 37,721 (18,861) 18,860
Excess, obsolete, and unserviceable 4,728 (2,933) 1,795
Operating materials and supplies total 97,038 (21,794) 75,244
Total inventory, operating materials, and supplies $ 787,561 $ (21,794) $ 765,767
2018Cost Allowance Net
InventoryHeld for sale $ 249,399 $ – $ 249,399
Held for repair 366,620 – 366,620
Raw materials and work in progress 47,189 – 47,189
Inventory total 663,208 – 663,208
Operating materials and suppliesHeld for use 48,085 – 48,085
Held for repair 36,389 (18,194) 18,195
Excess, obsolete, and unserviceable 3,094 (2,058) 1,036
Operating materials and supplies total 87,568 (20,252) 67,316
Total inventory, operating materials, and supplies $ 750,776 $ (20,252) $ 730,524
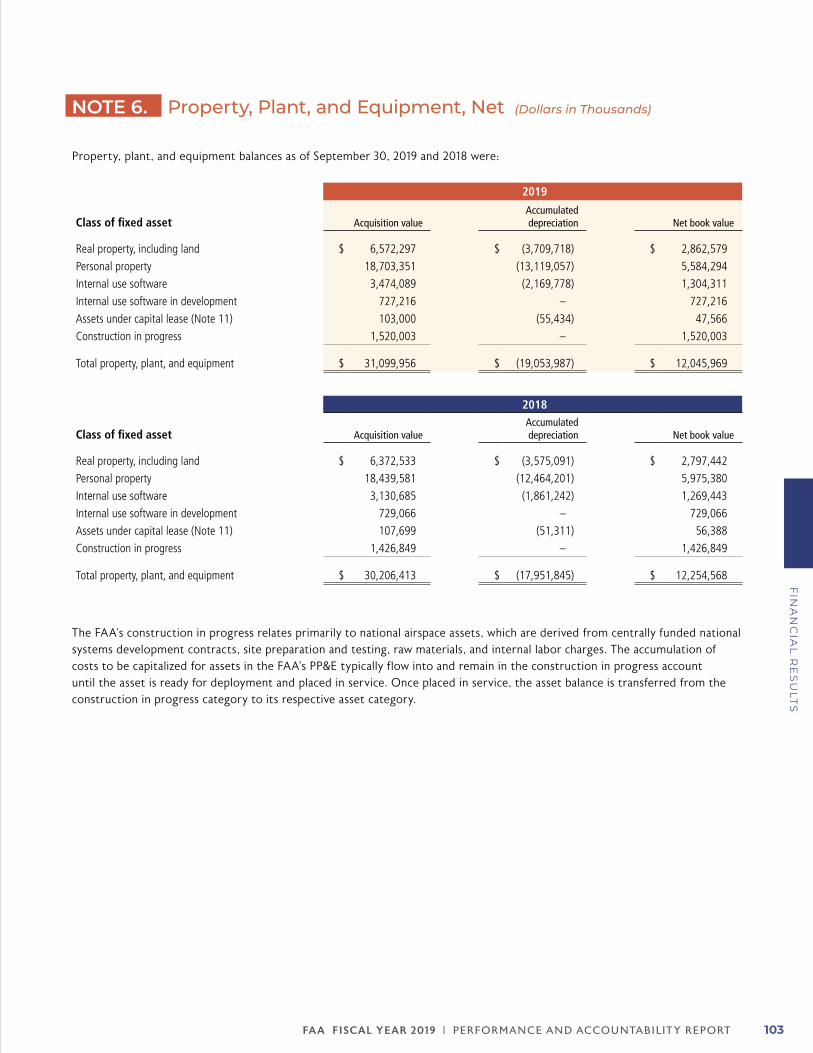
FA A FISCAL YEAR 2019 | PERFORMANCE AND ACCOUNTABILIT Y REPORT 103
FIN
AN
CIA
L R
ES
ULT
S
NOTE 6. Property, Plant, and Equipment, Net (Dollars in Thousands)
Property, plant, and equipment balances as of September 30, 2019 and 2018 were:
2019
Class of fixed asset Acquisition valueAccumulated depreciation Net book value
Real property, including land $ 6,572,297 $ (3,709,718) $ 2,862,579
Personal property 18,703,351 (13,119,057) 5,584,294
Internal use software 3,474,089 (2,169,778) 1,304,311
Internal use software in development 727,216 – 727,216
Assets under capital lease (Note 11) 103,000 (55,434) 47,566
Construction in progress 1,520,003 – 1,520,003
Total property, plant, and equipment $ 31,099,956 $ (19,053,987) $ 12,045,969
2018
Class of fixed asset Acquisition valueAccumulated depreciation Net book value
Real property, including land $ 6,372,533 $ (3,575,091) $ 2,797,442
Personal property 18,439,581 (12,464,201) 5,975,380
Internal use software 3,130,685 (1,861,242) 1,269,443
Internal use software in development 729,066 – 729,066
Assets under capital lease (Note 11) 107,699 (51,311) 56,388
Construction in progress 1,426,849 – 1,426,849
Total property, plant, and equipment $ 30,206,413 $ (17,951,845) $ 12,254,568
The FAA’s construction in progress relates primarily to national airspace assets, which are derived from centrally funded national systems development contracts, site preparation and testing, raw materials, and internal labor charges. The accumulation of costs to be capitalized for assets in the FAA’s PP&E typically flow into and remain in the construction in progress account until the asset is ready for deployment and placed in service. Once placed in service, the asset balance is transferred from the construction in progress category to its respective asset category.
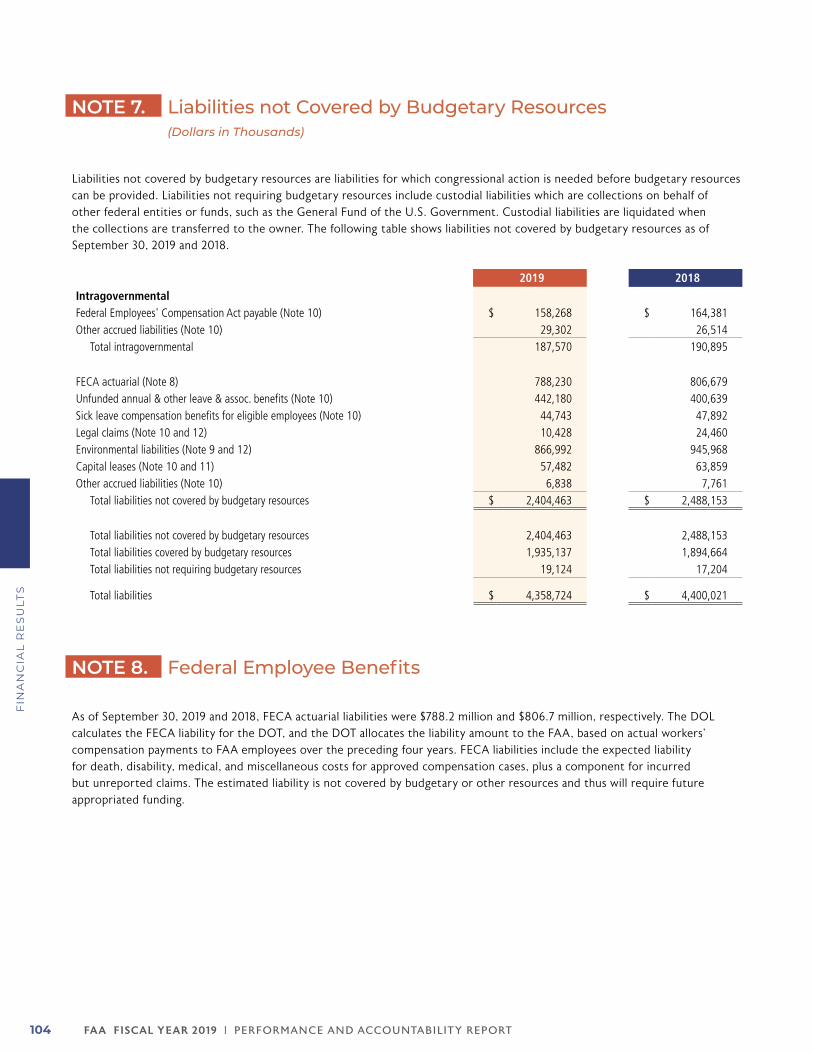
FA A FISCAL YEAR 2019 | PERFORMANCE AND ACCOUNTABILIT Y REPORT104
FIN
AN
CIA
L R
ES
ULT
S
NOTE 7. Liabilities not Covered by Budgetary Resources (Dollars in Thousands)
Liabilities not covered by budgetary resources are liabilities for which congressional action is needed before budgetary resources can be provided. Liabilities not requiring budgetary resources include custodial liabilities which are collections on behalf of other federal entities or funds, such as the General Fund of the U.S. Government. Custodial liabilities are liquidated when the collections are transferred to the owner. The following table shows liabilities not covered by budgetary resources as of September 30, 2019 and 2018.
2019 2018
IntragovernmentalFederal Employees' Compensation Act payable (Note 10) $ 158,268 $ 164,381 Other accrued liabilities (Note 10) 29,302 26,514
Total intragovernmental 187,570 190,895
FECA actuarial (Note 8) 788,230 806,679 Unfunded annual & other leave & assoc. benefits (Note 10) 442,180 400,639 Sick leave compensation benefits for eligible employees (Note 10) 44,743 47,892 Legal claims (Note 10 and 12) 10,428 24,460 Environmental liabilities (Note 9 and 12) 866,992 945,968 Capital leases (Note 10 and 11) 57,482 63,859 Other accrued liabilities (Note 10) 6,838 7,761
Total liabilities not covered by budgetary resources $ 2,404,463 $ 2,488,153
Total liabilities not covered by budgetary resources 2,404,463 2,488,153 Total liabilities covered by budgetary resources 1,935,137 1,894,664 Total liabilities not requiring budgetary resources 19,124 17,204
Total liabilities $ 4,358,724 $ 4,400,021
NOTE 8. Federal Employee Benefits
As of September 30, 2019 and 2018, FECA actuarial liabilities were $788.2 million and $806.7 million, respectively. The DOL calculates the FECA liability for the DOT, and the DOT allocates the liability amount to the FAA, based on actual workers’ compensation payments to FAA employees over the preceding four years. FECA liabilities include the expected liability for death, disability, medical, and miscellaneous costs for approved compensation cases, plus a component for incurred but unreported claims. The estimated liability is not covered by budgetary or other resources and thus will require future appropriated funding.
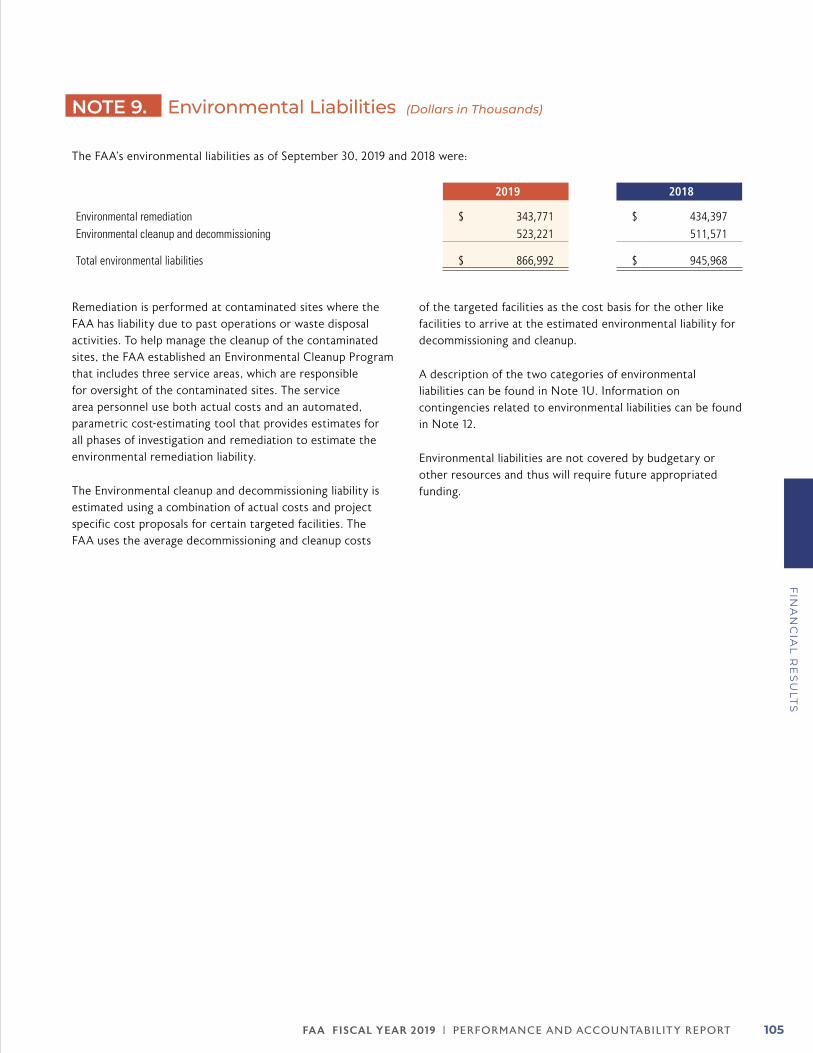
FA A FISCAL YEAR 2019 | PERFORMANCE AND ACCOUNTABILIT Y REPORT 105
FIN
AN
CIA
L R
ES
ULT
S
NOTE 9. Environmental Liabilities (Dollars in Thousands)
The FAA’s environmental liabilities as of September 30, 2019 and 2018 were:
2019 2018
Environmental remediation $ 343,771 $ 434,397
Environmental cleanup and decommissioning 523,221 511,571
Total environmental liabilities $ 866,992 $ 945,968
Remediation is performed at contaminated sites where the FAA has liability due to past operations or waste disposal activities. To help manage the cleanup of the contaminated sites, the FAA established an Environmental Cleanup Program that includes three service areas, which are responsible for oversight of the contaminated sites. The service area personnel use both actual costs and an automated, parametric cost-estimating tool that provides estimates for all phases of investigation and remediation to estimate the environmental remediation liability.
The Environmental cleanup and decommissioning liability is estimated using a combination of actual costs and project specific cost proposals for certain targeted facilities. The FAA uses the average decommissioning and cleanup costs
of the targeted facilities as the cost basis for the other like facilities to arrive at the estimated environmental liability for decommissioning and cleanup.
A description of the two categories of environmental liabilities can be found in Note 1U. Information on contingencies related to environmental liabilities can be found in Note 12.
Environmental liabilities are not covered by budgetary or other resources and thus will require future appropriated funding.
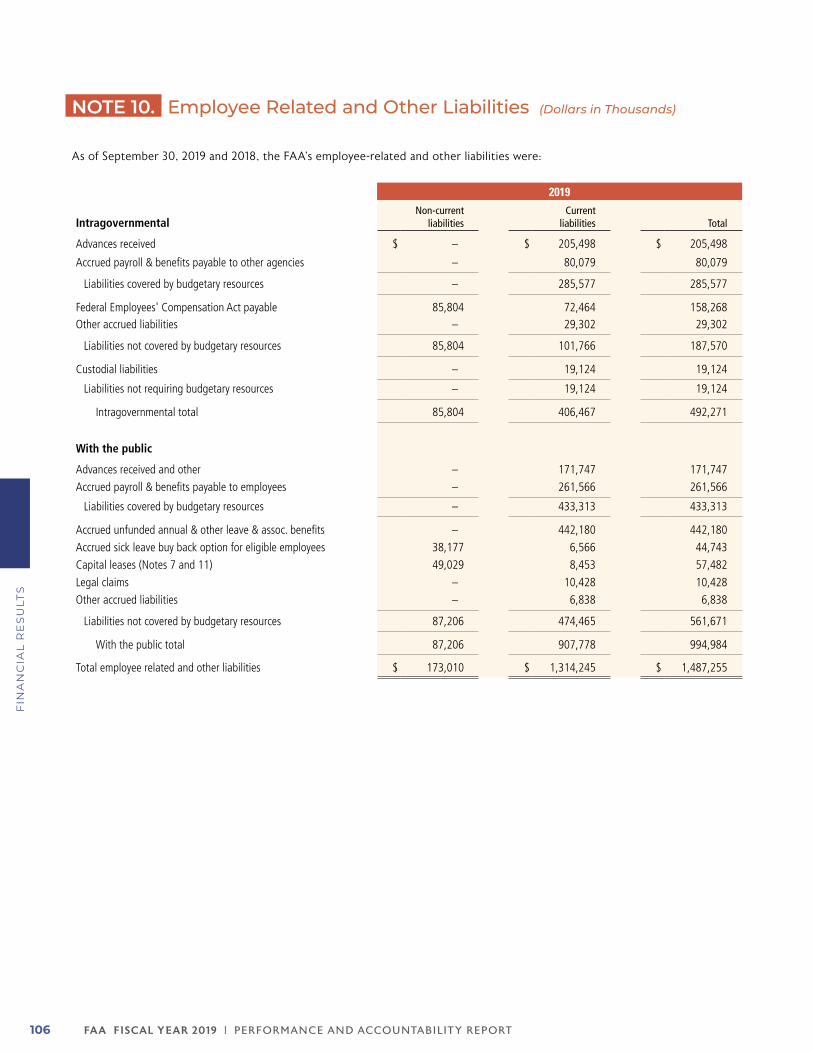
FA A FISCAL YEAR 2019 | PERFORMANCE AND ACCOUNTABILIT Y REPORT106
FIN
AN
CIA
L R
ES
ULT
S
NOTE 10. Employee Related and Other Liabilities (Dollars in Thousands)
As of September 30, 2019 and 2018, the FAA’s employee-related and other liabilities were:
2019
IntragovernmentalNon-current
liabilitiesCurrent
liabilities Total
Advances received $ – $ 205,498 $ 205,498
Accrued payroll & benefits payable to other agencies – 80,079 80,079
Liabilities covered by budgetary resources – 285,577 285,577
Federal Employees' Compensation Act payable 85,804 72,464 158,268 Other accrued liabilities – 29,302 29,302
Liabilities not covered by budgetary resources 85,804 101,766 187,570
Custodial liabilities – 19,124 19,124
Liabilities not requiring budgetary resources – 19,124 19,124
Intragovernmental total 85,804 406,467 492,271
With the public
Advances received and other – 171,747 171,747
Accrued payroll & benefits payable to employees – 261,566 261,566
Liabilities covered by budgetary resources – 433,313 433,313
Accrued unfunded annual & other leave & assoc. benefits – 442,180 442,180
Accrued sick leave buy back option for eligible employees 38,177 6,566 44,743
Capital leases (Notes 7 and 11) 49,029 8,453 57,482
Legal claims – 10,428 10,428
Other accrued liabilities – 6,838 6,838
Liabilities not covered by budgetary resources 87,206 474,465 561,671
With the public total 87,206 907,778 994,984
Total employee related and other liabilities $ 173,010 $ 1,314,245 $ 1,487,255
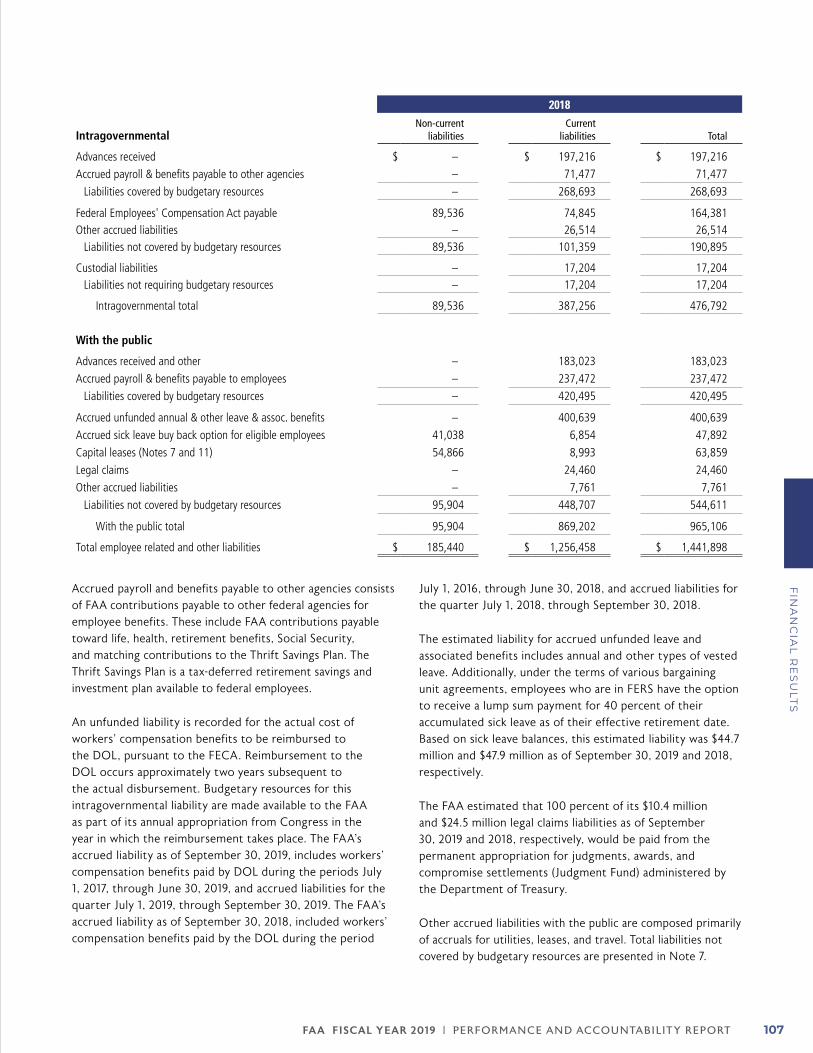
FA A FISCAL YEAR 2019 | PERFORMANCE AND ACCOUNTABILIT Y REPORT 107
FIN
AN
CIA
L R
ES
ULT
S
2018
IntragovernmentalNon-current
liabilitiesCurrent
liabilities Total
Advances received $ – $ 197,216 $ 197,216
Accrued payroll & benefits payable to other agencies – 71,477 71,477
Liabilities covered by budgetary resources – 268,693 268,693
Federal Employees' Compensation Act payable 89,536 74,845 164,381 Other accrued liabilities – 26,514 26,514
Liabilities not covered by budgetary resources 89,536 101,359 190,895
Custodial liabilities – 17,204 17,204 Liabilities not requiring budgetary resources – 17,204 17,204
Intragovernmental total 89,536 387,256 476,792
With the public
Advances received and other – 183,023 183,023
Accrued payroll & benefits payable to employees – 237,472 237,472
Liabilities covered by budgetary resources – 420,495 420,495
Accrued unfunded annual & other leave & assoc. benefits – 400,639 400,639
Accrued sick leave buy back option for eligible employees 41,038 6,854 47,892
Capital leases (Notes 7 and 11) 54,866 8,993 63,859
Legal claims – 24,460 24,460
Other accrued liabilities – 7,761 7,761
Liabilities not covered by budgetary resources 95,904 448,707 544,611
With the public total 95,904 869,202 965,106
Total employee related and other liabilities $ 185,440 $ 1,256,458 $ 1,441,898
Accrued payroll and benefits payable to other agencies consists of FAA contributions payable to other federal agencies for employee benefits. These include FAA contributions payable toward life, health, retirement benefits, Social Security, and matching contributions to the Thrift Savings Plan. The Thrift Savings Plan is a tax-deferred retirement savings and investment plan available to federal employees.
An unfunded liability is recorded for the actual cost of workers’ compensation benefits to be reimbursed to the DOL, pursuant to the FECA. Reimbursement to the DOL occurs approximately two years subsequent to the actual disbursement. Budgetary resources for this intragovernmental liability are made available to the FAA as part of its annual appropriation from Congress in the year in which the reimbursement takes place. The FAA’s accrued liability as of September 30, 2019, includes workers’ compensation benefits paid by DOL during the periods July 1, 2017, through June 30, 2019, and accrued liabilities for the quarter July 1, 2019, through September 30, 2019. The FAA’s accrued liability as of September 30, 2018, included workers’ compensation benefits paid by the DOL during the period
July 1, 2016, through June 30, 2018, and accrued liabilities for the quarter July 1, 2018, through September 30, 2018.
The estimated liability for accrued unfunded leave and associated benefits includes annual and other types of vested leave. Additionally, under the terms of various bargaining unit agreements, employees who are in FERS have the option to receive a lump sum payment for 40 percent of their accumulated sick leave as of their effective retirement date. Based on sick leave balances, this estimated liability was $44.7 million and $47.9 million as of September 30, 2019 and 2018, respectively.
The FAA estimated that 100 percent of its $10.4 million and $24.5 million legal claims liabilities as of September 30, 2019 and 2018, respectively, would be paid from the permanent appropriation for judgments, awards, and compromise settlements (Judgment Fund) administered by the Department of Treasury.
Other accrued liabilities with the public are composed primarily of accruals for utilities, leases, and travel. Total liabilities not covered by budgetary resources are presented in Note 7.
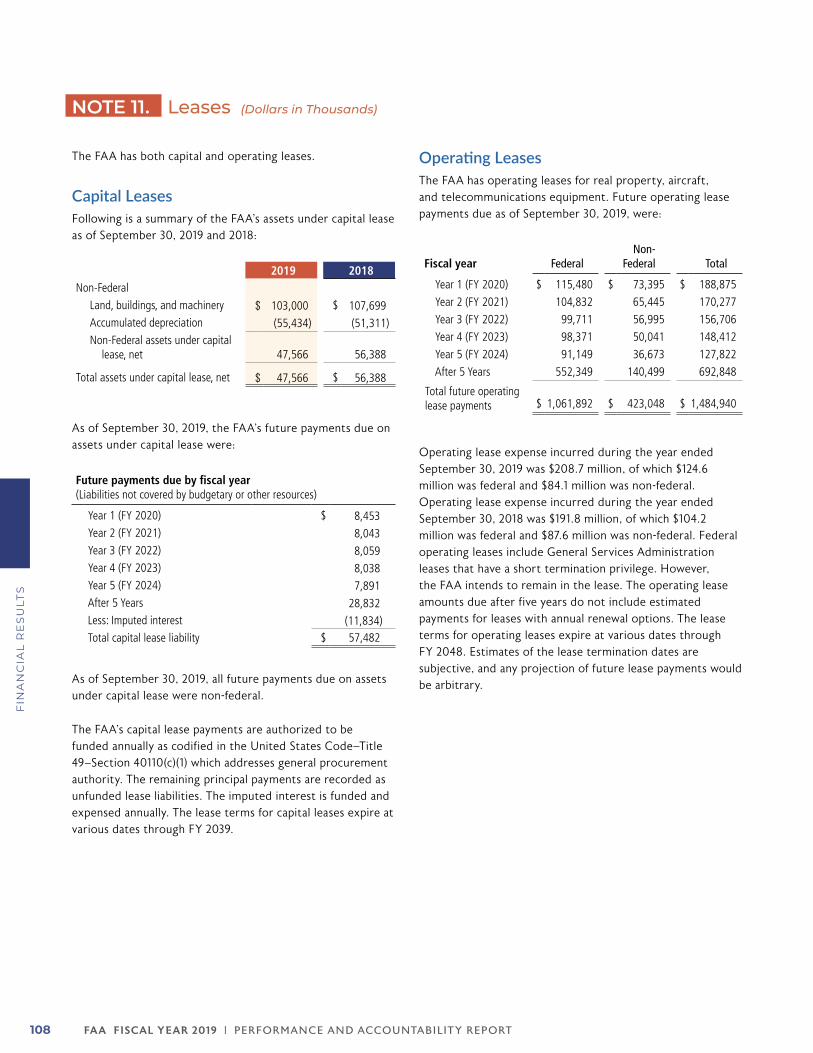
FA A FISCAL YEAR 2019 | PERFORMANCE AND ACCOUNTABILIT Y REPORT108
FIN
AN
CIA
L R
ES
ULT
S
NOTE 11. Leases (Dollars in Thousands)
The FAA has both capital and operating leases.
Capital LeasesFollowing is a summary of the FAA’s assets under capital lease as of September 30, 2019 and 2018:
2019 2018Non-Federal
Land, buildings, and machinery $ 103,000 $ 107,699 Accumulated depreciation (55,434) (51,311)Non-Federal assets under capital
lease, net 47,566 56,388
Total assets under capital lease, net $ 47,566 $ 56,388
As of September 30, 2019, the FAA’s future payments due on assets under capital lease were:
Future payments due by fiscal year(Liabilities not covered by budgetary or other resources)
Year 1 (FY 2020) $ 8,453 Year 2 (FY 2021) 8,043 Year 3 (FY 2022) 8,059 Year 4 (FY 2023) 8,038 Year 5 (FY 2024) 7,891 After 5 Years 28,832 Less: Imputed interest (11,834)Total capital lease liability $ 57,482
As of September 30, 2019, all future payments due on assets under capital lease were non-federal.
The FAA’s capital lease payments are authorized to be funded annually as codified in the United States Code–Title 49–Section 40110(c)(1) which addresses general procurement authority. The remaining principal payments are recorded as unfunded lease liabilities. The imputed interest is funded and expensed annually. The lease terms for capital leases expire at various dates through FY 2039.
Operating LeasesThe FAA has operating leases for real property, aircraft, and telecommunications equipment. Future operating lease payments due as of September 30, 2019, were:
Fiscal year FederalNon-
Federal Total
Year 1 (FY 2020) $ 115,480 $ 73,395 $ 188,875
Year 2 (FY 2021) 104,832 65,445 170,277
Year 3 (FY 2022) 99,711 56,995 156,706
Year 4 (FY 2023) 98,371 50,041 148,412
Year 5 (FY 2024) 91,149 36,673 127,822
After 5 Years 552,349 140,499 692,848
Total future operating lease payments $ 1,061,892 $ 423,048 $ 1,484,940
Operating lease expense incurred during the year ended September 30, 2019 was $208.7 million, of which $124.6 million was federal and $84.1 million was non-federal. Operating lease expense incurred during the year ended September 30, 2018 was $191.8 million, of which $104.2 million was federal and $87.6 million was non-federal. Federal operating leases include General Services Administration leases that have a short termination privilege. However, the FAA intends to remain in the lease. The operating lease amounts due after five years do not include estimated payments for leases with annual renewal options. The lease terms for operating leases expire at various dates through FY 2048. Estimates of the lease termination dates are subjective, and any projection of future lease payments would be arbitrary.
FA A FISCAL YEAR 2019 | PERFORMANCE AND ACCOUNTABILIT Y REPORT 109
FIN
AN
CIA
L R
ES
ULT
S
NOTE 12. Commitments, Contingencies, and Other Disclosures (Dollars in Thousands)
Continuing Resolution and Reauthorization. Effective October 1, 2019, the FAA is operating under a continuing resolution, Public Law 116-59, for its FY 2020 appropriation and many of its programmatic and financing authorities. The continuing resolution will be in effect through November 21, 2019, unless superseded by enactment of specified appropriations legislation and includes a provision that allows the FAA to continue spending at FY 2019 rates.
In addition, the passage of the FAA Reauthorization Act of 2018, Public Law 115-254 authorizes the FAA’s programmatic and financing authorities, the Airport Improvement Program contract authority, and the authority to collect and deposit excise taxes into and make expenditures from the AATF. The new authority expires on September 30, 2023.
Airport Improvement Program. The Airport Improvement Program provides grants for the planning and development of public-use airports that are included in the National Plan of Integrated Airport Systems. Eligible projects generally include improvements that address airport safety, capacity, security, and environmental concerns. The FAA’s share of eligible costs for large and medium primary hub airports is 75 percent, with the exception of noise program implementation, for which the FAA’s share is 80 percent. For remaining airports (small primary, reliever, and general aviation), the FAA’s share of eligible costs is 90 percent.
The FAA has authority under 49 U.S.C. 47110(e) to issue letters of intent to enter into a series of annual Airport Improvement Program grant agreements. The FAA records an obligation when a grant is awarded. As of September 30, 2019, the FAA had letters of intent extending through FY 2026 totaling $7.3 billion. As of September 30, 2019, the FAA had obligated $6.8 billion of this total amount, leaving $435 million unobligated.
As of September 30, 2018, the FAA had letters of intent extending through FY 2026 totaling $7.3 billion. As of September 30, 2018, the FAA had obligated $6.7 billion of this total amount, leaving $548 million unobligated.
Aviation Insurance Program. The FAA provides non-premium war risk insurance for certain U.S. Government contracted operations as permitted by 49 USC 44305. Coverage is provided without premium to air carriers at the written
request of other U.S. Government agencies. The scope of coverage under the Non-Premium War Risk Insurance program includes hull, bodily injury, personal injury, and property damage. The FAA is currently providing coverage for certain U.S. Department of Defense (DOD) contracted air carrier operations.
Because insurance policies are issued only at the request of other federal departments and agencies, total coverage-in-force fluctuates throughout the fiscal year. The coverage-in-force at any given point in time does not represent a potential liability against the Aviation Insurance Revolving Fund because the Secretary of Defense has entered into an indemnity agreement with the Secretary of Transportation and will fully reimburse the Fund for all losses paid by the FAA on behalf of DOD.
Contingencies. The FAA has the following contingencies as of September 30, 2019 and 2018:
Legal Contingencies. The FAA’s legal contingencies include asserted and pending legal claims. An accrued liability is recognized for legal claims where the loss is probable and the amount can be reasonably estimated. For pending legal claims where the loss is reasonably possible, a liability is not recognized, however, the estimated range of loss is disclosed in the following table. There are other claims that could result in significant pay-outs; however, it is not possible at this time to determine the probability of an unfavorable outcome, or to estimate the amount of potential loss in the event of such an outcome.
Environmental Contingencies. The FAA’s environmental contingencies include environmental remediation, and environmental clean-up and decommissioning. The nature of these contingencies is described in Note 1U. An accrued liability is recognized for environmental contingencies where the loss is probable and the amount can be reasonably estimated. For environmental contingencies where the loss is reasonably possible, a liability is not recognized, however, the estimated range of loss is disclosed in the following table. FAA is a party to environmental remediation sites in Alaska, the Pacific Islands, and New Jersey in which the extent of liability is not both probable and reasonably estimable. As a result, a liability is not recognized for these sites without further studies and negotiations with other federal agencies.
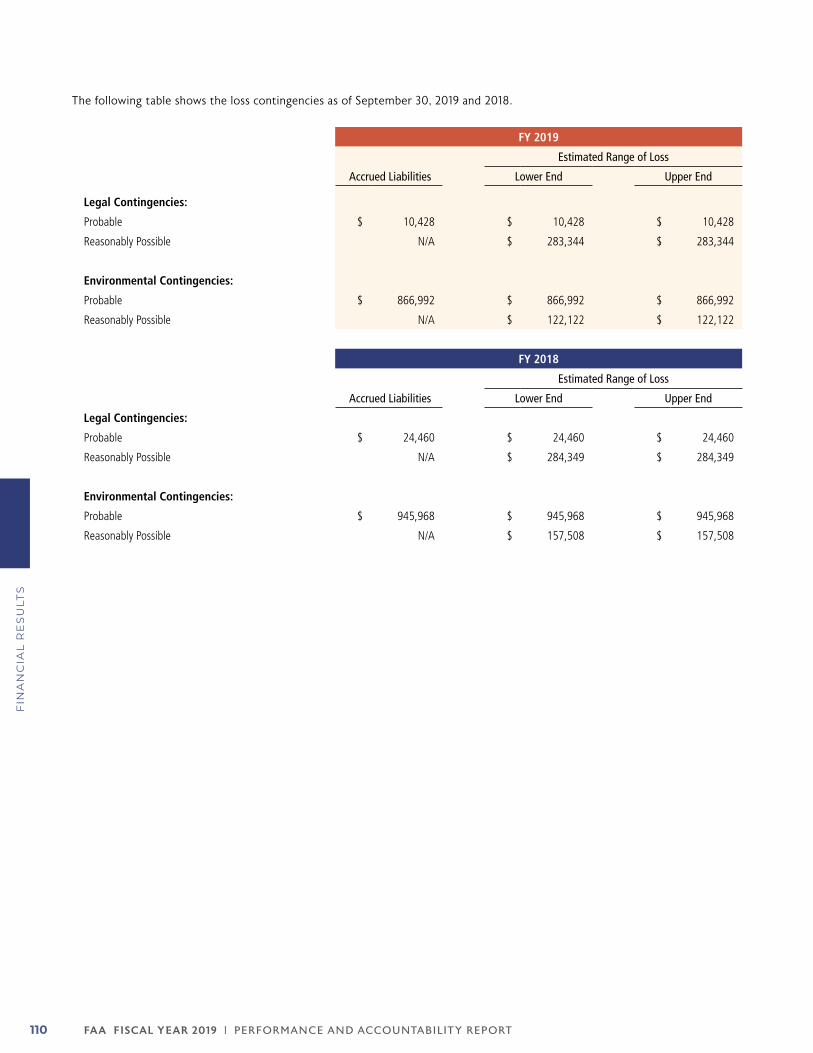
FA A FISCAL YEAR 2019 | PERFORMANCE AND ACCOUNTABILIT Y REPORT110
FIN
AN
CIA
L R
ES
ULT
S
The following table shows the loss contingencies as of September 30, 2019 and 2018.
FY 2019
Accrued Liabilities
Estimated Range of Loss
Lower End Upper End
Legal Contingencies:
Probable $ 10,428 $ 10,428 $ 10,428
Reasonably Possible N/A $ 283,344 $ 283,344
Environmental Contingencies:
Probable $ 866,992 $ 866,992 $ 866,992
Reasonably Possible N/A $ 122,122 $ 122,122
FY 2018
Accrued Liabilities
Estimated Range of Loss
Lower End Upper End
Legal Contingencies:
Probable $ 24,460 $ 24,460 $ 24,460
Reasonably Possible N/A $ 284,349 $ 284,349
Environmental Contingencies:
Probable $ 945,968 $ 945,968 $ 945,968
Reasonably Possible N/A $ 157,508 $ 157,508
FA A FISCAL YEAR 2019 | PERFORMANCE AND ACCOUNTABILIT Y REPORT 111
FIN
AN
CIA
L R
ES
ULT
S
NOTE 13. Funds from Dedicated Collections (Dollars in Thousands)
Funds from dedicated collections are those that are financed by specifically identified revenues and financing sources that remain available over time. They are required by statute to be used for designated activities, benefits, or purposes and must be accounted for separately from the government’s general revenues.
The FAA’s funds from dedicated collections are reported in the Consolidated Statements of Changes in Net Position and on pages 112–113 among two classifications. The first classification is comprised of the financial statement balances in AATF as of the end of each fiscal year. The second classification of “All other funds from dedicated collections” is comprised of the financial statement balances of all the related funds that receive funding from the AATF and includes Operations-AATF, Grants-in-Aid for Airports-AATF, Facilities and Equipment, and Research, Engineering and Development. The “All other funds from dedicated collections” classification also includes the Operations-General Fund, which is primarily funded through transfers from Operations-AATF, but is additionally supplemented by the General Fund of the U.S. Government through annual appropriations. However, since the Operations account is primarily funded from the AATF, it is properly presented as a “fund from dedicated collections.” The category of “All other funds from dedicated collections” also includes the Aviation Insurance Revolving Fund and aviation user fees.
In addition, this note presents only the funds from dedicated collections that are financing sources available for future expenses, and funds that have been expended but have not yet fully achieved their designated purpose, such as construction in progress. As such, PP&E that has been placed in service, though funded from Facilities and Equipment, are excluded from this note; these funds are no longer available for future expenditure and have been used for their intended purpose.
Airport and Airway Trust FundThe FAA’s consolidated financial statements include the results of operations and the financial position of the AATF. Congress created the AATF with the passage of the Airport and Airway Revenue Act of 1970.
The Act provides a dedicated source of funding for the nation’s aviation system through the collection of several aviation-related excise taxes. The IRS collects these taxes on behalf of the FAA’s AATF. These taxes can be withdrawn only as appropriated by the U.S. Congress. Twice a month, Treasury allocates the amount collected and subsequently adjusts the allocation to reflect actual collections quarterly.
As discussed in Note 1D, FY 2019 excise tax revenue includes amounts certified as actual by the IRS for the first three quarters of the year and amounts allocated by the Office of Tax Analysis for the fourth quarter of the year.
All Other Funds from Dedicated Collections
zz The Aviation Insurance Program had investments of $2.3 billion and revenues of $46.4 million for the period ended September 30, 2019 compared to $2.2 billion and $32.5 million, respectively, for the period ended September 30, 2018. The Aviation Insurance Program is also discussed in Notes 1G and 12.
zz Aviation user fees are charged to commercial airlines that fly in U.S. controlled air space, but neither take off nor land in the U.S. The FAA reported aviation user fees of $148.4 million and $140.7 million for the periods ended September 30, 2019 and 2018, respectively.
Fiscal data as of and for the years ended September 30, 2019 and 2018 are summarized in the following charts. Intra-agency transactions have not been eliminated in the amounts presented.
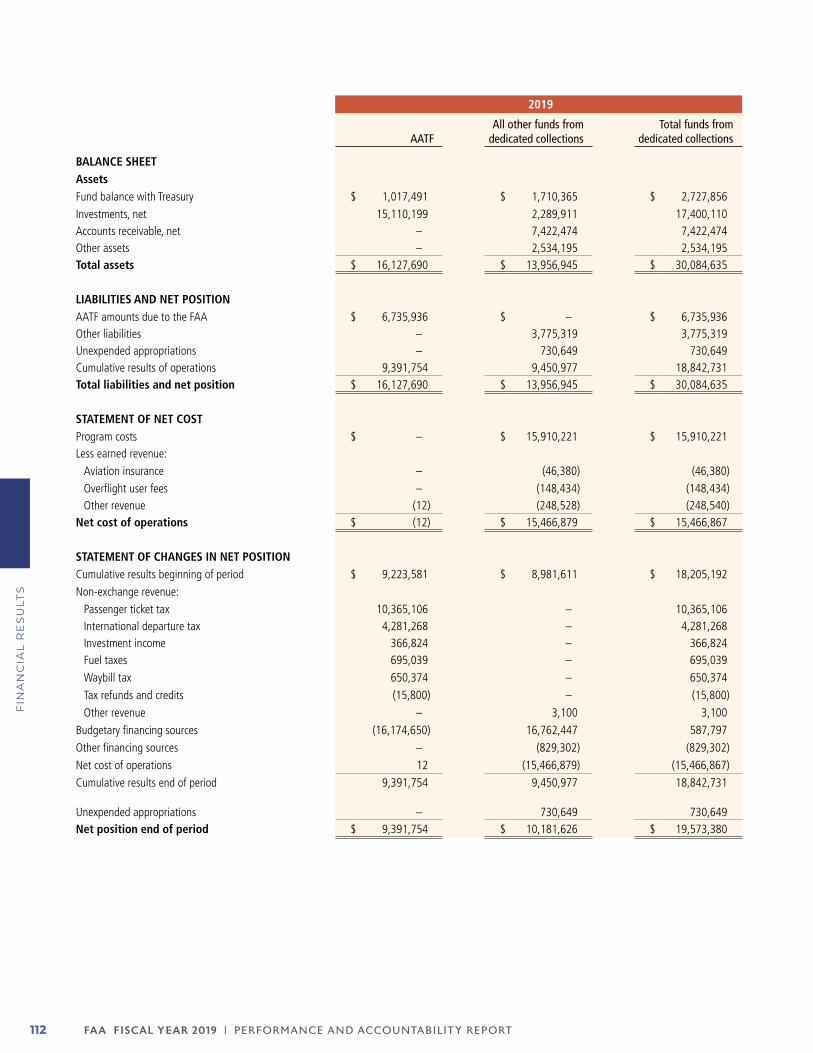
FA A FISCAL YEAR 2019 | PERFORMANCE AND ACCOUNTABILIT Y REPORT112
FIN
AN
CIA
L R
ES
ULT
S
2019
AATFAll other funds from
dedicated collectionsTotal funds from
dedicated collections
BALANCE SHEET AssetsFund balance with Treasury $ 1,017,491 $ 1,710,365 $ 2,727,856
Investments, net 15,110,199 2,289,911 17,400,110 Accounts receivable, net – 7,422,474 7,422,474 Other assets – 2,534,195 2,534,195 Total assets $ 16,127,690 $ 13,956,945 $ 30,084,635
LIABILITIES AND NET POSITIONAATF amounts due to the FAA $ 6,735,936 $ – $ 6,735,936 Other liabilities – 3,775,319 3,775,319 Unexpended appropriations – 730,649 730,649 Cumulative results of operations 9,391,754 9,450,977 18,842,731 Total liabilities and net position $ 16,127,690 $ 13,956,945 $ 30,084,635
STATEMENT OF NET COST Program costs $ – $ 15,910,221 $ 15,910,221 Less earned revenue:
Aviation insurance – (46,380) (46,380)
Overflight user fees – (148,434) (148,434)Other revenue (12) (248,528) (248,540)
Net cost of operations $ (12) $ 15,466,879 $ 15,466,867
STATEMENT OF CHANGES IN NET POSITIONCumulative results beginning of period $ 9,223,581 $ 8,981,611 $ 18,205,192
Non-exchange revenue:
Passenger ticket tax 10,365,106 – 10,365,106 International departure tax 4,281,268 – 4,281,268 Investment income 366,824 – 366,824 Fuel taxes 695,039 – 695,039
Waybill tax 650,374 – 650,374
Tax refunds and credits (15,800) – (15,800)
Other revenue – 3,100 3,100
Budgetary financing sources (16,174,650) 16,762,447 587,797
Other financing sources – (829,302) (829,302)
Net cost of operations 12 (15,466,879) (15,466,867)
Cumulative results end of period 9,391,754 9,450,977 18,842,731
Unexpended appropriations – 730,649 730,649 Net position end of period $ 9,391,754 $ 10,181,626 $ 19,573,380
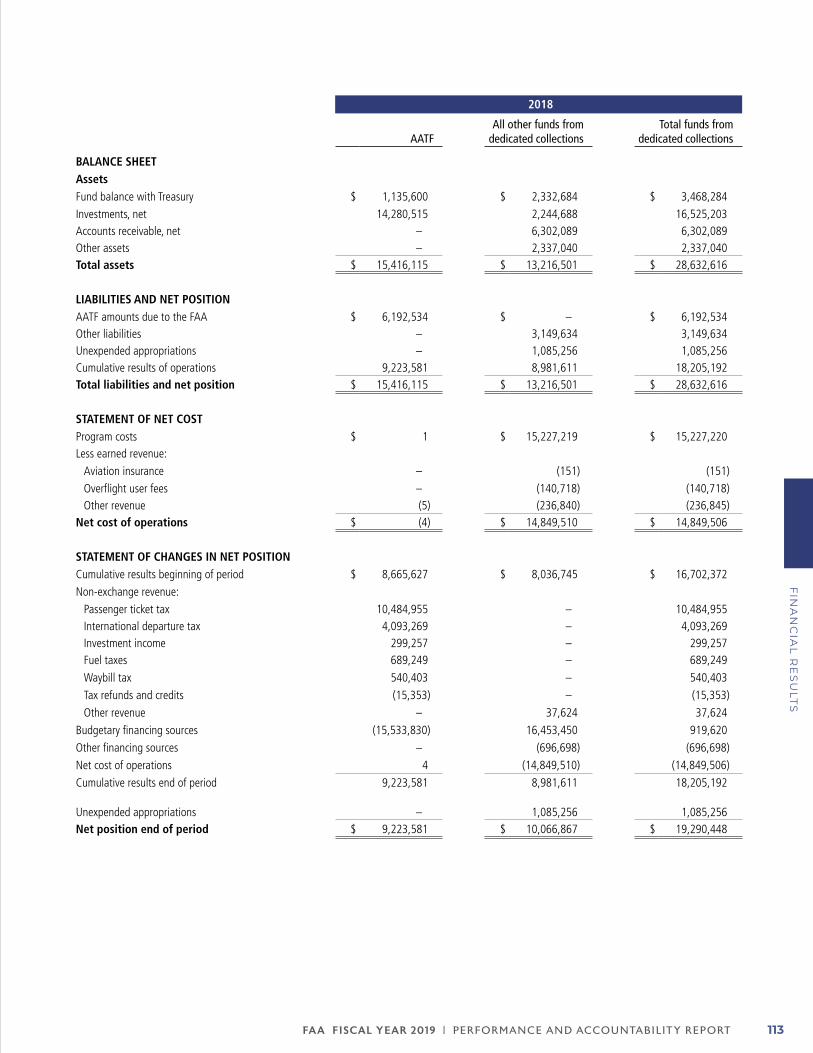
FA A FISCAL YEAR 2019 | PERFORMANCE AND ACCOUNTABILIT Y REPORT 113
FIN
AN
CIA
L R
ES
ULT
S
2018
AATFAll other funds from
dedicated collectionsTotal funds from
dedicated collections
BALANCE SHEET AssetsFund balance with Treasury $ 1,135,600 $ 2,332,684 $ 3,468,284
Investments, net 14,280,515 2,244,688 16,525,203 Accounts receivable, net – 6,302,089 6,302,089 Other assets – 2,337,040 2,337,040 Total assets $ 15,416,115 $ 13,216,501 $ 28,632,616
LIABILITIES AND NET POSITIONAATF amounts due to the FAA $ 6,192,534 $ – $ 6,192,534 Other liabilities – 3,149,634 3,149,634 Unexpended appropriations – 1,085,256 1,085,256 Cumulative results of operations 9,223,581 8,981,611 18,205,192 Total liabilities and net position $ 15,416,115 $ 13,216,501 $ 28,632,616
STATEMENT OF NET COST Program costs $ 1 $ 15,227,219 $ 15,227,220 Less earned revenue:
Aviation insurance – (151) (151)
Overflight user fees – (140,718) (140,718)Other revenue (5) (236,840) (236,845)
Net cost of operations $ (4) $ 14,849,510 $ 14,849,506
STATEMENT OF CHANGES IN NET POSITIONCumulative results beginning of period $ 8,665,627 $ 8,036,745 $ 16,702,372
Non-exchange revenue:
Passenger ticket tax 10,484,955 – 10,484,955 International departure tax 4,093,269 – 4,093,269 Investment income 299,257 – 299,257 Fuel taxes 689,249 – 689,249
Waybill tax 540,403 – 540,403
Tax refunds and credits (15,353) – (15,353)
Other revenue – 37,624 37,624
Budgetary financing sources (15,533,830) 16,453,450 919,620
Other financing sources – (696,698) (696,698)
Net cost of operations 4 (14,849,510) (14,849,506)
Cumulative results end of period 9,223,581 8,981,611 18,205,192
Unexpended appropriations – 1,085,256 1,085,256 Net position end of period $ 9,223,581 $ 10,066,867 $ 19,290,448
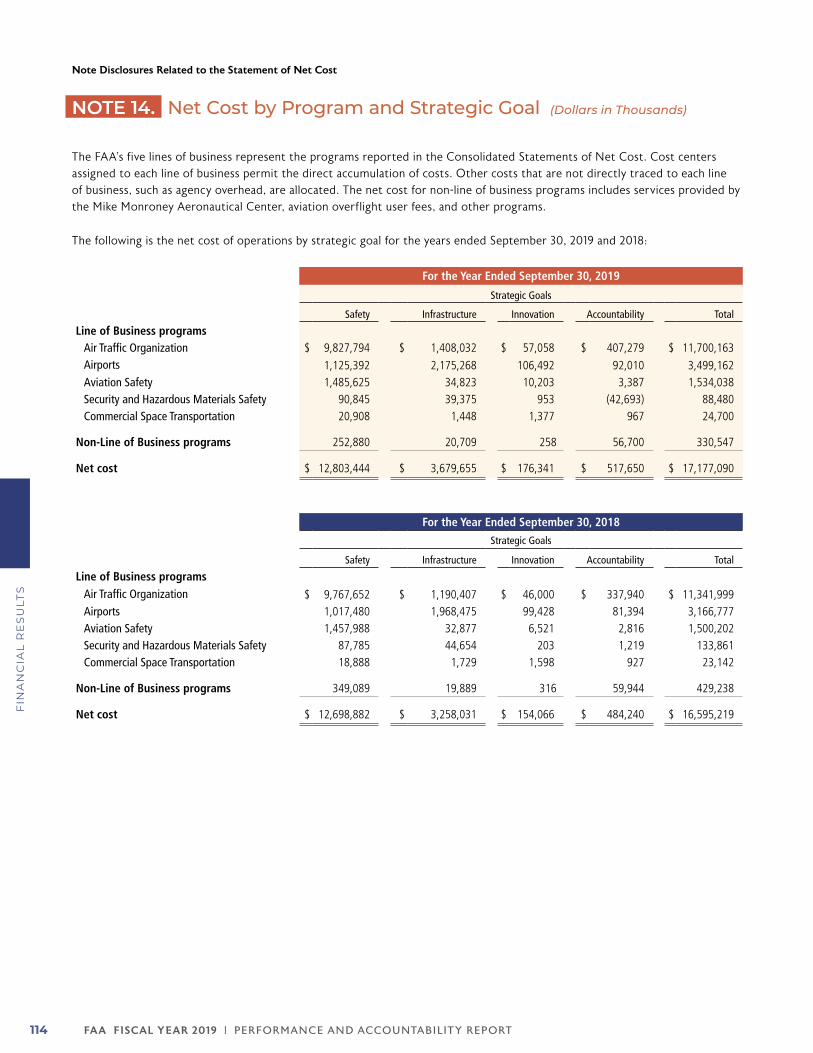
FA A FISCAL YEAR 2019 | PERFORMANCE AND ACCOUNTABILIT Y REPORT114
FIN
AN
CIA
L R
ES
ULT
S
Note Disclosures Related to the Statement of Net Cost
NOTE 14. Net Cost by Program and Strategic Goal (Dollars in Thousands)
The FAA’s five lines of business represent the programs reported in the Consolidated Statements of Net Cost. Cost centers assigned to each line of business permit the direct accumulation of costs. Other costs that are not directly traced to each line of business, such as agency overhead, are allocated. The net cost for non-line of business programs includes services provided by the Mike Monroney Aeronautical Center, aviation overflight user fees, and other programs.
The following is the net cost of operations by strategic goal for the years ended September 30, 2019 and 2018:
For the Year Ended September 30, 2019
Strategic Goals
Safety Infrastructure Innovation Accountability Total
Line of Business programsAir Traffic Organization $ 9,827,794 $ 1,408,032 $ 57,058 $ 407,279 $ 11,700,163 Airports 1,125,392 2,175,268 106,492 92,010 3,499,162 Aviation Safety 1,485,625 34,823 10,203 3,387 1,534,038 Security and Hazardous Materials Safety 90,845 39,375 953 (42,693) 88,480 Commercial Space Transportation 20,908 1,448 1,377 967 24,700
Non-Line of Business programs 252,880 20,709 258 56,700 330,547
Net cost $ 12,803,444 $ 3,679,655 $ 176,341 $ 517,650 $ 17,177,090
For the Year Ended September 30, 2018
Strategic Goals
Safety Infrastructure Innovation Accountability Total
Line of Business programsAir Traffic Organization $ 9,767,652 $ 1,190,407 $ 46,000 $ 337,940 $ 11,341,999 Airports 1,017,480 1,968,475 99,428 81,394 3,166,777 Aviation Safety 1,457,988 32,877 6,521 2,816 1,500,202 Security and Hazardous Materials Safety 87,785 44,654 203 1,219 133,861 Commercial Space Transportation 18,888 1,729 1,598 927 23,142
Non-Line of Business programs 349,089 19,889 316 59,944 429,238
Net cost $ 12,698,882 $ 3,258,031 $ 154,066 $ 484,240 $ 16,595,219
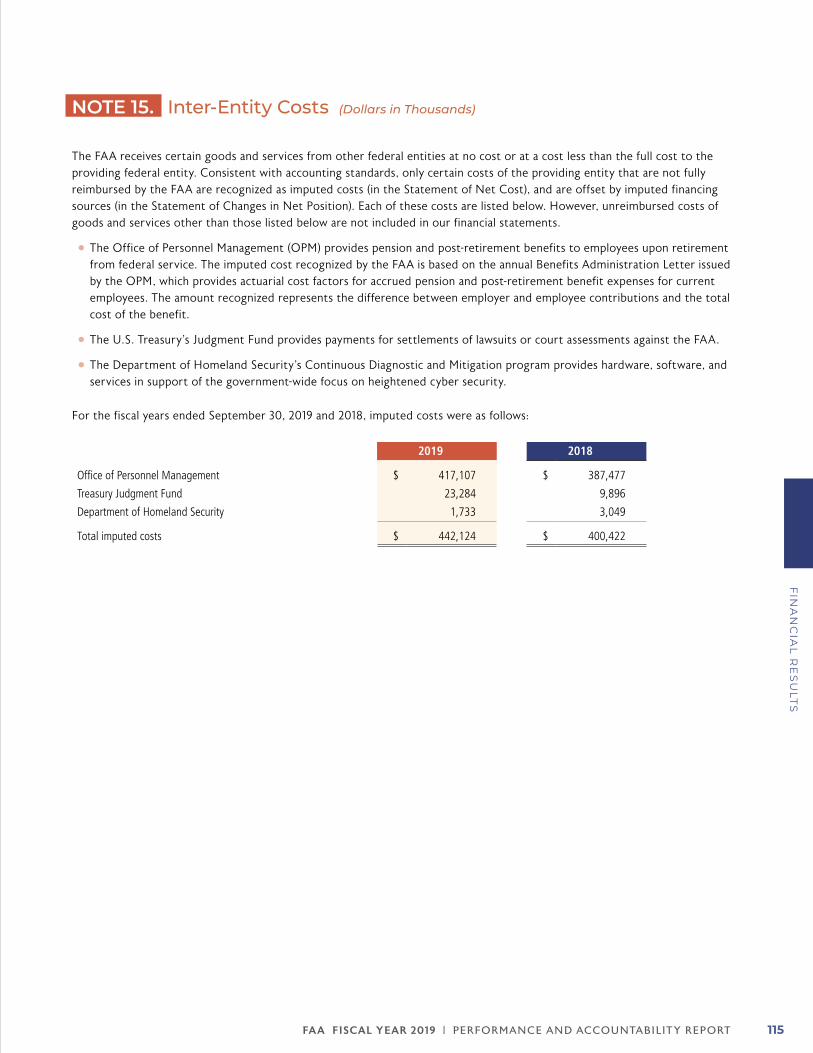
FA A FISCAL YEAR 2019 | PERFORMANCE AND ACCOUNTABILIT Y REPORT 115
FIN
AN
CIA
L R
ES
ULT
S
NOTE 15. Inter-Entity Costs (Dollars in Thousands)
The FAA receives certain goods and services from other federal entities at no cost or at a cost less than the full cost to the providing federal entity. Consistent with accounting standards, only certain costs of the providing entity that are not fully reimbursed by the FAA are recognized as imputed costs (in the Statement of Net Cost), and are offset by imputed financing sources (in the Statement of Changes in Net Position). Each of these costs are listed below. However, unreimbursed costs of goods and services other than those listed below are not included in our financial statements.
zz The Office of Personnel Management (OPM) provides pension and post-retirement benefits to employees upon retirement from federal service. The imputed cost recognized by the FAA is based on the annual Benefits Administration Letter issued by the OPM, which provides actuarial cost factors for accrued pension and post-retirement benefit expenses for current employees. The amount recognized represents the difference between employer and employee contributions and the total cost of the benefit.
zz The U.S. Treasury’s Judgment Fund provides payments for settlements of lawsuits or court assessments against the FAA.
zz The Department of Homeland Security’s Continuous Diagnostic and Mitigation program provides hardware, software, and services in support of the government-wide focus on heightened cyber security.
For the fiscal years ended September 30, 2019 and 2018, imputed costs were as follows:
2019 2018
Office of Personnel Management $ 417,107 $ 387,477
Treasury Judgment Fund 23,284 9,896
Department of Homeland Security 1,733 3,049
Total imputed costs $ 442,124 $ 400,422
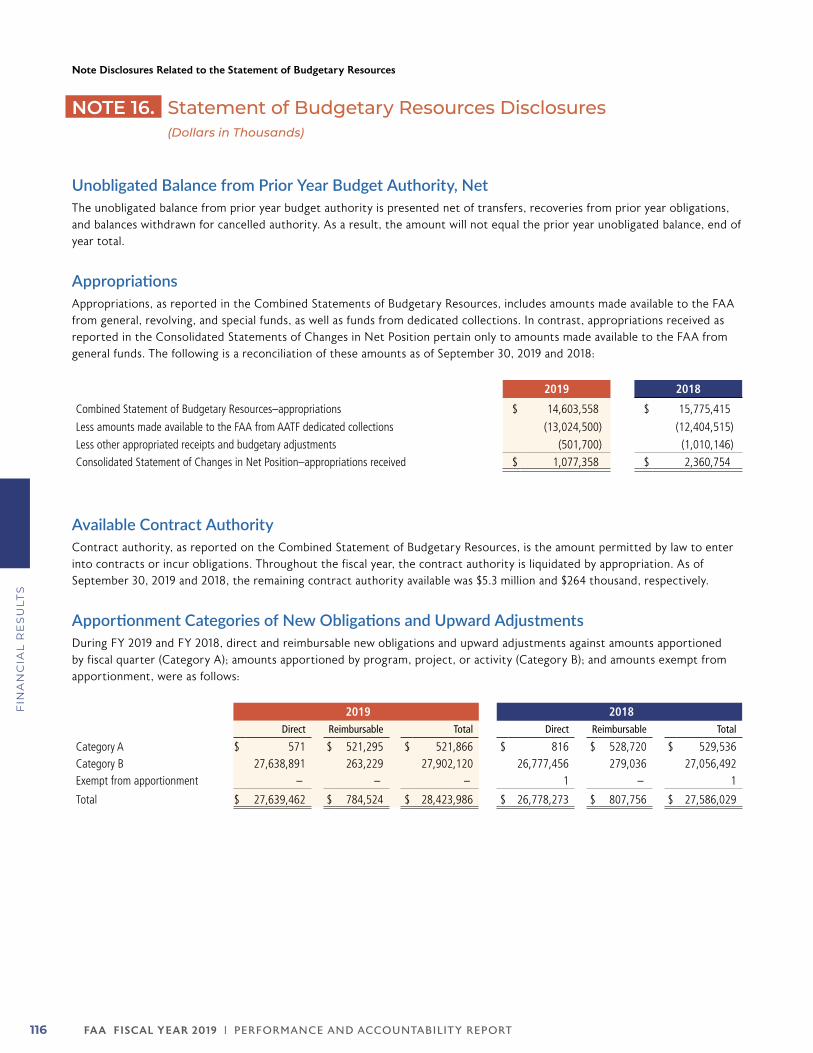
FA A FISCAL YEAR 2019 | PERFORMANCE AND ACCOUNTABILIT Y REPORT116
FIN
AN
CIA
L R
ES
ULT
S
Note Disclosures Related to the Statement of Budgetary Resources
NOTE 16. Statement of Budgetary Resources Disclosures (Dollars in Thousands)
Unobligated Balance from Prior Year Budget Authority, NetThe unobligated balance from prior year budget authority is presented net of transfers, recoveries from prior year obligations, and balances withdrawn for cancelled authority. As a result, the amount will not equal the prior year unobligated balance, end of year total.
AppropriationsAppropriations, as reported in the Combined Statements of Budgetary Resources, includes amounts made available to the FAA from general, revolving, and special funds, as well as funds from dedicated collections. In contrast, appropriations received as reported in the Consolidated Statements of Changes in Net Position pertain only to amounts made available to the FAA from general funds. The following is a reconciliation of these amounts as of September 30, 2019 and 2018:
2019 2018
Combined Statement of Budgetary Resources–appropriations $ 14,603,558 $ 15,775,415
Less amounts made available to the FAA from AATF dedicated collections (13,024,500) (12,404,515)
Less other appropriated receipts and budgetary adjustments (501,700) (1,010,146)
Consolidated Statement of Changes in Net Position–appropriations received $ 1,077,358 $ 2,360,754
Available Contract AuthorityContract authority, as reported on the Combined Statement of Budgetary Resources, is the amount permitted by law to enter into contracts or incur obligations. Throughout the fiscal year, the contract authority is liquidated by appropriation. As of September 30, 2019 and 2018, the remaining contract authority available was $5.3 million and $264 thousand, respectively.
Apportionment Categories of New Obligations and Upward AdjustmentsDuring FY 2019 and FY 2018, direct and reimbursable new obligations and upward adjustments against amounts apportioned by fiscal quarter (Category A); amounts apportioned by program, project, or activity (Category B); and amounts exempt from apportionment, were as follows:
2019 2018Direct Reimbursable Total Direct Reimbursable Total
Category A $ 571 $ 521,295 $ 521,866 $ 816 $ 528,720 $ 529,536 Category B 27,638,891 263,229 27,902,120 26,777,456 279,036 27,056,492 Exempt from apportionment – – – 1 – 1
Total $ 27,639,462 $ 784,524 $ 28,423,986 $ 26,778,273 $ 807,756 $ 27,586,029
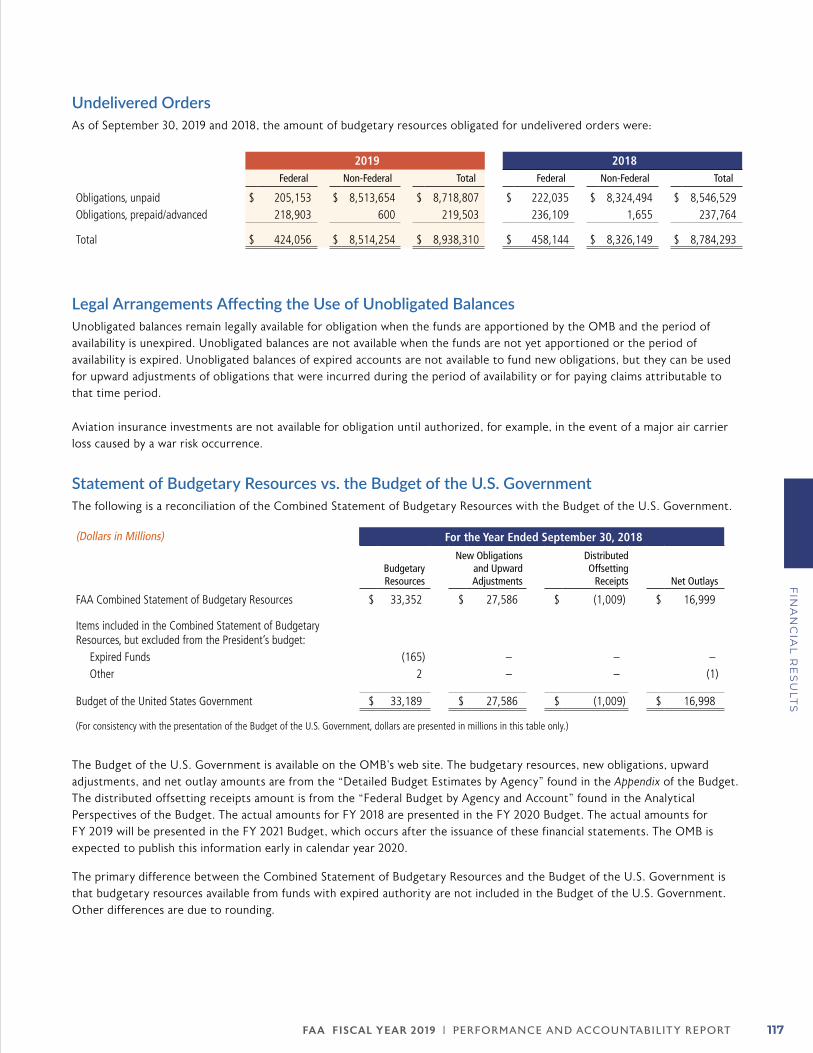
FA A FISCAL YEAR 2019 | PERFORMANCE AND ACCOUNTABILIT Y REPORT 117
FIN
AN
CIA
L R
ES
ULT
S
Undelivered OrdersAs of September 30, 2019 and 2018, the amount of budgetary resources obligated for undelivered orders were:
2019 2018Federal Non-Federal Total Federal Non-Federal Total
Obligations, unpaid $ 205,153 $ 8,513,654 $ 8,718,807 $ 222,035 $ 8,324,494 $ 8,546,529 Obligations, prepaid/advanced 218,903 600 219,503 236,109 1,655 237,764
Total $ 424,056 $ 8,514,254 $ 8,938,310 $ 458,144 $ 8,326,149 $ 8,784,293
Legal Arrangements Affecting the Use of Unobligated BalancesUnobligated balances remain legally available for obligation when the funds are apportioned by the OMB and the period of availability is unexpired. Unobligated balances are not available when the funds are not yet apportioned or the period of availability is expired. Unobligated balances of expired accounts are not available to fund new obligations, but they can be used for upward adjustments of obligations that were incurred during the period of availability or for paying claims attributable to that time period.
Aviation insurance investments are not available for obligation until authorized, for example, in the event of a major air carrier loss caused by a war risk occurrence.
Statement of Budgetary Resources vs. the Budget of the U.S. GovernmentThe following is a reconciliation of the Combined Statement of Budgetary Resources with the Budget of the U.S. Government.
(Dollars in Millions) For the Year Ended September 30, 2018
Budgetary Resources
New Obligations and Upward Adjustments
Distributed Offsetting
Receipts Net Outlays
FAA Combined Statement of Budgetary Resources $ 33,352 $ 27,586 $ (1,009) $ 16,999
Items included in the Combined Statement of Budgetary Resources, but excluded from the President’s budget:
Expired Funds (165) – – –Other 2 – – (1)
Budget of the United States Government $ 33,189 $ 27,586 $ (1,009) $ 16,998
(For consistency with the presentation of the Budget of the U.S. Government, dollars are presented in millions in this table only.)
The Budget of the U.S. Government is available on the OMB’s web site. The budgetary resources, new obligations, upward adjustments, and net outlay amounts are from the “Detailed Budget Estimates by Agency” found in the Appendix of the Budget. The distributed offsetting receipts amount is from the “Federal Budget by Agency and Account” found in the Analytical Perspectives of the Budget. The actual amounts for FY 2018 are presented in the FY 2020 Budget. The actual amounts for FY 2019 will be presented in the FY 2021 Budget, which occurs after the issuance of these financial statements. The OMB is expected to publish this information early in calendar year 2020.
The primary difference between the Combined Statement of Budgetary Resources and the Budget of the U.S. Government is that budgetary resources available from funds with expired authority are not included in the Budget of the U.S. Government. Other differences are due to rounding.
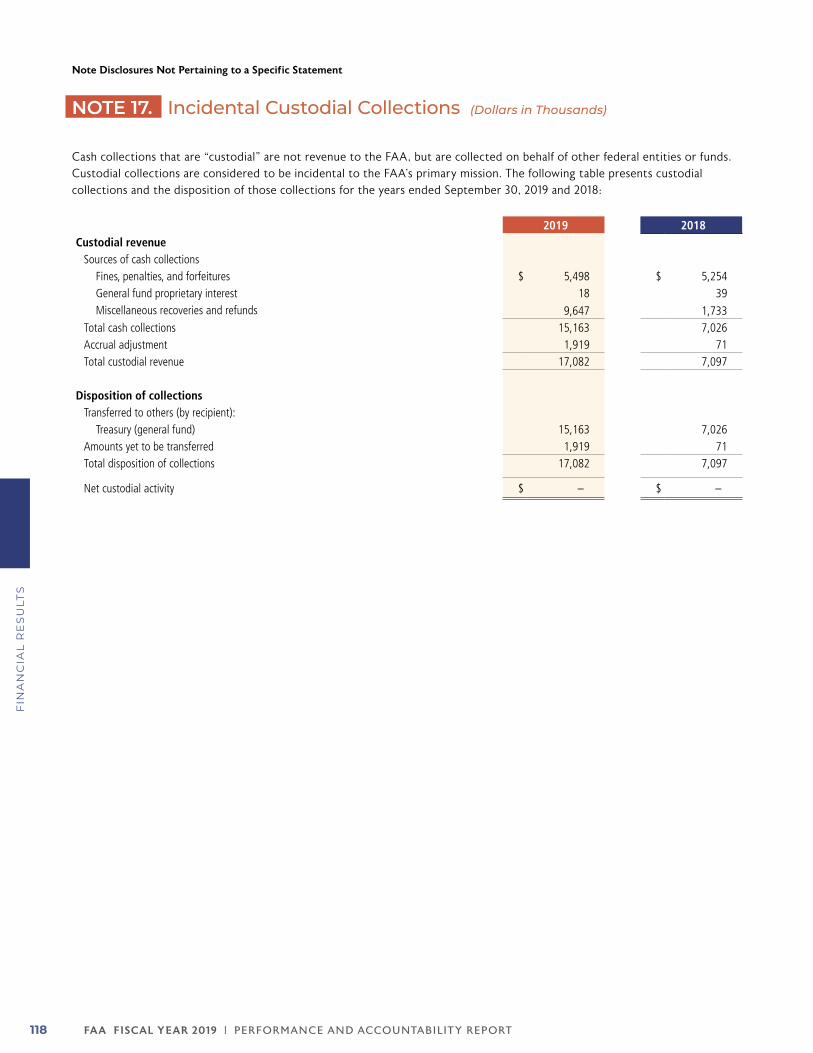
FA A FISCAL YEAR 2019 | PERFORMANCE AND ACCOUNTABILIT Y REPORT118
FIN
AN
CIA
L R
ES
ULT
S
Note Disclosures Not Pertaining to a Specific Statement
NOTE 17. Incidental Custodial Collections (Dollars in Thousands)
Cash collections that are “custodial” are not revenue to the FAA, but are collected on behalf of other federal entities or funds. Custodial collections are considered to be incidental to the FAA’s primary mission. The following table presents custodial collections and the disposition of those collections for the years ended September 30, 2019 and 2018:
2019 2018Custodial revenue
Sources of cash collectionsFines, penalties, and forfeitures $ 5,498 $ 5,254 General fund proprietary interest 18 39 Miscellaneous recoveries and refunds 9,647 1,733
Total cash collections 15,163 7,026 Accrual adjustment 1,919 71 Total custodial revenue 17,082 7,097
Disposition of collectionsTransferred to others (by recipient):
Treasury (general fund) 15,163 7,026 Amounts yet to be transferred 1,919 71 Total disposition of collections 17,082 7,097
Net custodial activity $ – $ –
FA A FISCAL YEAR 2019 | PERFORMANCE AND ACCOUNTABILIT Y REPORT 119
FIN
AN
CIA
L R
ES
ULT
S
NOTE 18. Reconciliation of Net Cost to Net Outlays (Dollars in Thousands)
Budgetary and financial accounting information differ. Budgetary accounting is used for planning and control purposes and relates to both the receipt and use of cash, as well as reporting the federal deficit. Financial accounting is intended to provide a picture of the government’s financial operations and financial position so it presents information on an accrual basis. The accrual basis includes information about costs arising from the consumption of assets and the incurrence of liabilities.
The reconciliation of net outlays, presented on a budgetary basis, and the net cost, presented on an accrual basis, provides an explanation of the relationship between budgetary and financial accounting information. The reconciliation serves not only to identify costs paid for in the past and those that will be paid in the future, but also to assure integrity between budgetary and financial accounting.
The analysis below illustrates this reconciliation by listing the key differences between net cost and net outlays.
zz The acquisition of capital assets results in outlays, but does not result in costs. Rather, the costs are recognized over the useful lives of the assets as depreciation expense. To reconcile this difference, depreciation is a component
of net operating cost, but not part of net outlays; and the acquisition of capital assets is a component of net outlays, but not part of net operating cost.
zz Special fund receipts, such as aviation overflight user fees, are collected from specific sources that are earmarked by law for a specific purpose, and require an appropriation to be expended. The exchange revenue from these receipts is included in the net cost of operations, but there is no corresponding net outlay.
Although some differences presented in the reconciliation relate to amounts reported in the balance sheet and statement of net position, the amounts may not tie. Certain financial activities do not result in net operating cost, nor net outlays, and are therefore excluded from the reconciliation. For example, the purchase of investments results in a change in assets on the balance sheet, but does not result in net operating cost nor net outlays.
The reconciliation of net cost to net outlays was not applicable in prior years. In the initial year of implementation, the disclosure requirements applicable to prior reporting periods are not required for comparative presentations.
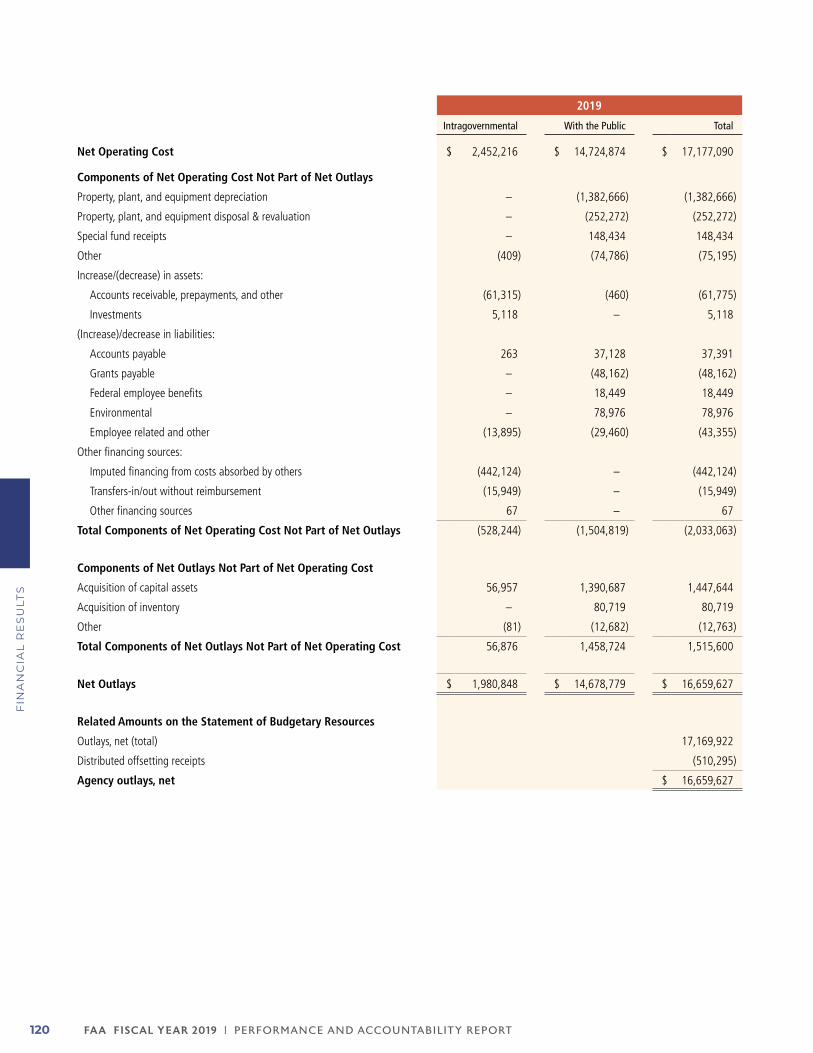
FA A FISCAL YEAR 2019 | PERFORMANCE AND ACCOUNTABILIT Y REPORT120
FIN
AN
CIA
L R
ES
ULT
S
2019
Intragovernmental With the Public Total
Net Operating Cost $ 2,452,216 $ 14,724,874 $ 17,177,090
Components of Net Operating Cost Not Part of Net Outlays
Property, plant, and equipment depreciation – (1,382,666) (1,382,666)
Property, plant, and equipment disposal & revaluation – (252,272) (252,272)
Special fund receipts – 148,434 148,434
Other (409) (74,786) (75,195)
Increase/(decrease) in assets:
Accounts receivable, prepayments, and other (61,315) (460) (61,775)
Investments 5,118 – 5,118
(Increase)/decrease in liabilities:
Accounts payable 263 37,128 37,391
Grants payable – (48,162) (48,162)
Federal employee benefits – 18,449 18,449
Environmental – 78,976 78,976
Employee related and other (13,895) (29,460) (43,355)
Other financing sources:
Imputed financing from costs absorbed by others (442,124) – (442,124)
Transfers-in/out without reimbursement (15,949) – (15,949)
Other financing sources 67 – 67
Total Components of Net Operating Cost Not Part of Net Outlays (528,244) (1,504,819) (2,033,063)
Components of Net Outlays Not Part of Net Operating Cost
Acquisition of capital assets 56,957 1,390,687 1,447,644
Acquisition of inventory – 80,719 80,719
Other (81) (12,682) (12,763)
Total Components of Net Outlays Not Part of Net Operating Cost 56,876 1,458,724 1,515,600
Net Outlays $ 1,980,848 $ 14,678,779 $ 16,659,627
Related Amounts on the Statement of Budgetary Resources
Outlays, net (total) 17,169,922
Distributed offsetting receipts (510,295)
Agency outlays, net $ 16,659,627
FA A FISCAL YEAR 2019 | PERFORMANCE AND ACCOUNTABILIT Y REPORT 121
FIN
AN
CIA
L R
ES
ULT
S
NOTE 19. Disclosure Entities
The Center for Advanced Aviation System Development (CAASD) is a Federally Funded Research and Development Center (FFRDC) sponsored by the FAA. FFRDCs are nonprofit entities that are sponsored and funded by the U.S. Government to meet special long-term research or development needs. CAASD serves the public interest by providing essential research to advance the safety, security, effectiveness, and efficiency of aviation and transportation in the United States and around the world.
The administrator of CAASD is The MITRE Corporation (MITRE). MITRE is a not-for-profit organization that operates multiple FFRDCs including CAASD. MITRE is a “public interest company” having no commercial interests. The absence of commercial conflicts of interest is essential to maintaining independence and objectivity.
As the sponsor of CAASD, the FAA has a long-term relationship with MITRE. The nature of this relationship is for the FAA to provide sufficient physical and financial resources in support of CAASD’s innovative research and development that in turn supports the accomplishment of FAA’s mission. The FAA’s relationship with MITRE and CAASD presents no financial or non-financial risk, and there is no expectation of benefits based on this relationship, other than the results of the independent research and development.
For the periods ended September 30, 2019 and 2018, the FAA had new obligations of $159 million and $147 million, respectively, in support of its sponsorship agreement with MITRE for CAASD.
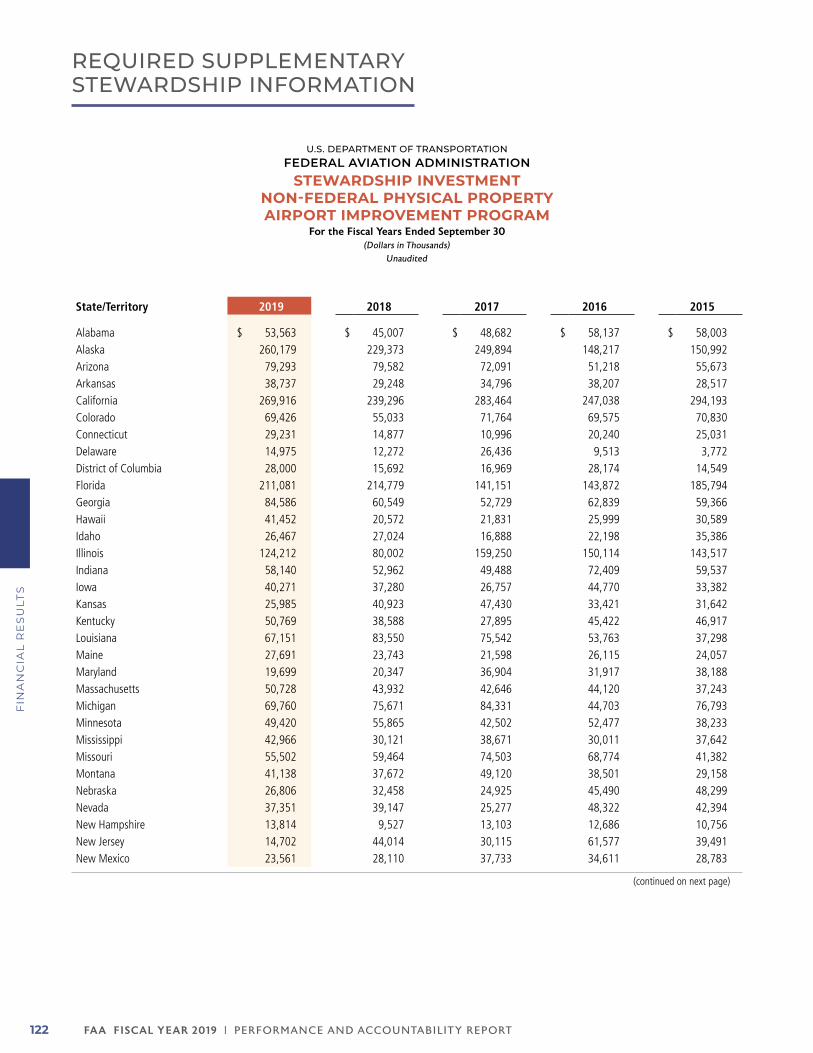
FA A FISCAL YEAR 2019 | PERFORMANCE AND ACCOUNTABILIT Y REPORT122
FIN
AN
CIA
L R
ES
ULT
S
REQUIRED SUPPLEMENTARY STEWARDSHIP INFORMATION
U.S. DEPARTMENT OF TRANSPORTATIONFEDERAL AVIATION ADMINISTRATION
STEWARDSHIP INVESTMENT NON-FEDERAL PHYSICAL PROPERTY AIRPORT IMPROVEMENT PROGRAM
For the Fiscal Years Ended September 30(Dollars in Thousands)
Unaudited
State/Territory 2019 2018 2017 2016 2015
Alabama $ 53,563 $ 45,007 $ 48,682 $ 58,137 $ 58,003 Alaska 260,179 229,373 249,894 148,217 150,992 Arizona 79,293 79,582 72,091 51,218 55,673 Arkansas 38,737 29,248 34,796 38,207 28,517 California 269,916 239,296 283,464 247,038 294,193 Colorado 69,426 55,033 71,764 69,575 70,830 Connecticut 29,231 14,877 10,996 20,240 25,031 Delaware 14,975 12,272 26,436 9,513 3,772 District of Columbia 28,000 15,692 16,969 28,174 14,549 Florida 211,081 214,779 141,151 143,872 185,794 Georgia 84,586 60,549 52,729 62,839 59,366 Hawaii 41,452 20,572 21,831 25,999 30,589 Idaho 26,467 27,024 16,888 22,198 35,386 Illinois 124,212 80,002 159,250 150,114 143,517 Indiana 58,140 52,962 49,488 72,409 59,537 Iowa 40,271 37,280 26,757 44,770 33,382 Kansas 25,985 40,923 47,430 33,421 31,642 Kentucky 50,769 38,588 27,895 45,422 46,917 Louisiana 67,151 83,550 75,542 53,763 37,298 Maine 27,691 23,743 21,598 26,115 24,057 Maryland 19,699 20,347 36,904 31,917 38,188 Massachusetts 50,728 43,932 42,646 44,120 37,243 Michigan 69,760 75,671 84,331 44,703 76,793 Minnesota 49,420 55,865 42,502 52,477 38,233 Mississippi 42,966 30,121 38,671 30,011 37,642 Missouri 55,502 59,464 74,503 68,774 41,382 Montana 41,138 37,672 49,120 38,501 29,158 Nebraska 26,806 32,458 24,925 45,490 48,299 Nevada 37,351 39,147 25,277 48,322 42,394 New Hampshire 13,814 9,527 13,103 12,686 10,756 New Jersey 14,702 44,014 30,115 61,577 39,491 New Mexico 23,561 28,110 37,733 34,611 28,783
(continued on next page)
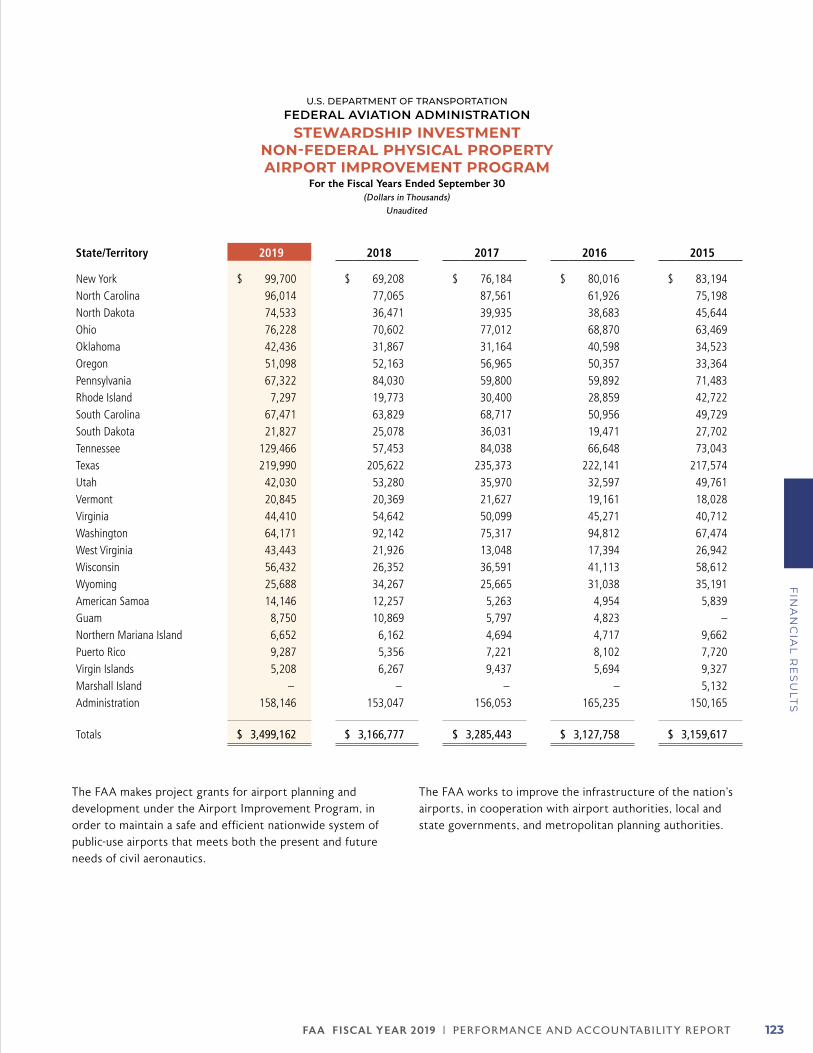
FA A FISCAL YEAR 2019 | PERFORMANCE AND ACCOUNTABILIT Y REPORT 123
FIN
AN
CIA
L R
ES
ULT
S
U.S. DEPARTMENT OF TRANSPORTATIONFEDERAL AVIATION ADMINISTRATION
STEWARDSHIP INVESTMENT NON-FEDERAL PHYSICAL PROPERTY AIRPORT IMPROVEMENT PROGRAM
For the Fiscal Years Ended September 30(Dollars in Thousands)
Unaudited
State/Territory 2019 2018 2017 2016 2015
New York $ 99,700 $ 69,208 $ 76,184 $ 80,016 $ 83,194 North Carolina 96,014 77,065 87,561 61,926 75,198 North Dakota 74,533 36,471 39,935 38,683 45,644 Ohio 76,228 70,602 77,012 68,870 63,469 Oklahoma 42,436 31,867 31,164 40,598 34,523 Oregon 51,098 52,163 56,965 50,357 33,364 Pennsylvania 67,322 84,030 59,800 59,892 71,483 Rhode Island 7,297 19,773 30,400 28,859 42,722 South Carolina 67,471 63,829 68,717 50,956 49,729 South Dakota 21,827 25,078 36,031 19,471 27,702 Tennessee 129,466 57,453 84,038 66,648 73,043 Texas 219,990 205,622 235,373 222,141 217,574 Utah 42,030 53,280 35,970 32,597 49,761 Vermont 20,845 20,369 21,627 19,161 18,028 Virginia 44,410 54,642 50,099 45,271 40,712 Washington 64,171 92,142 75,317 94,812 67,474 West Virginia 43,443 21,926 13,048 17,394 26,942 Wisconsin 56,432 26,352 36,591 41,113 58,612 Wyoming 25,688 34,267 25,665 31,038 35,191 American Samoa 14,146 12,257 5,263 4,954 5,839 Guam 8,750 10,869 5,797 4,823 – Northern Mariana Island 6,652 6,162 4,694 4,717 9,662 Puerto Rico 9,287 5,356 7,221 8,102 7,720 Virgin Islands 5,208 6,267 9,437 5,694 9,327 Marshall Island – – – – 5,132 Administration 158,146 153,047 156,053 165,235 150,165
Totals $ 3,499,162 $ 3,166,777 $ 3,285,443 $ 3,127,758 $ 3,159,617
The FAA makes project grants for airport planning and development under the Airport Improvement Program, in order to maintain a safe and efficient nationwide system of public-use airports that meets both the present and future needs of civil aeronautics.
The FAA works to improve the infrastructure of the nation’s airports, in cooperation with airport authorities, local and state governments, and metropolitan planning authorities.
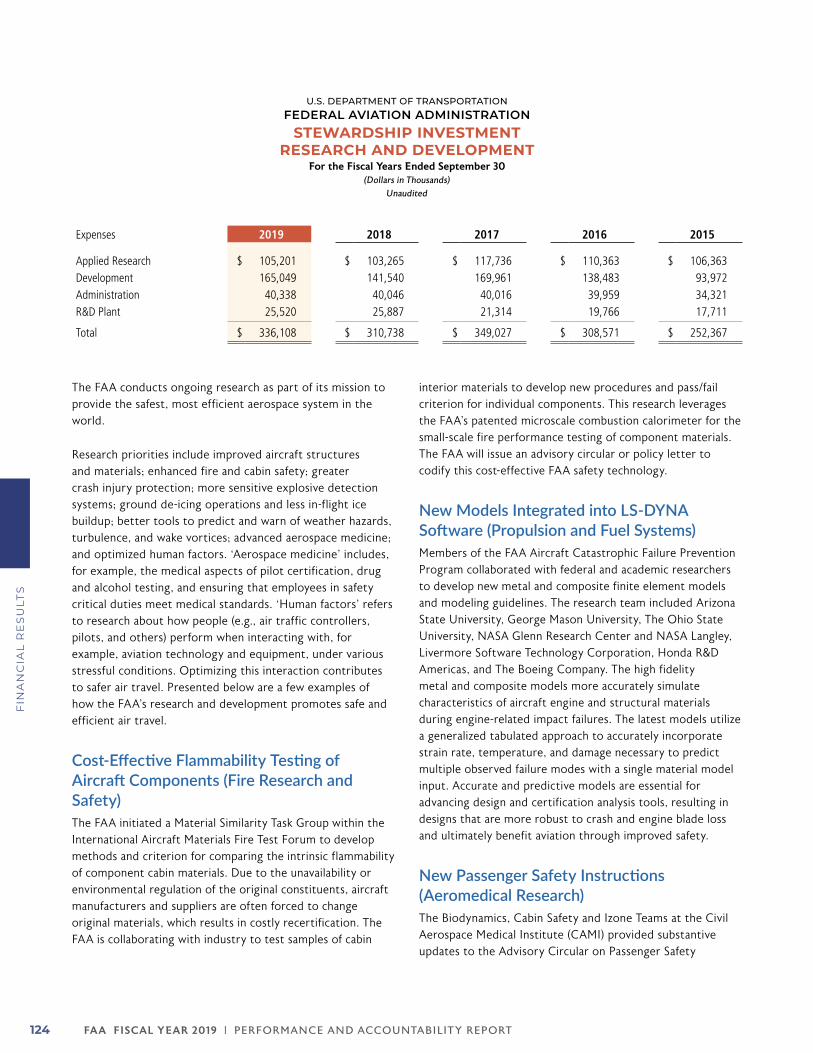
FA A FISCAL YEAR 2019 | PERFORMANCE AND ACCOUNTABILIT Y REPORT124
FIN
AN
CIA
L R
ES
ULT
S
U.S. DEPARTMENT OF TRANSPORTATIONFEDERAL AVIATION ADMINISTRATION
STEWARDSHIP INVESTMENT RESEARCH AND DEVELOPMENT
For the Fiscal Years Ended September 30(Dollars in Thousands)
Unaudited
Expenses 2019 2018 2017 2016 2015
Applied Research $ 105,201 $ 103,265 $ 117,736 $ 110,363 $ 106,363 Development 165,049 141,540 169,961 138,483 93,972 Administration 40,338 40,046 40,016 39,959 34,321 R&D Plant 25,520 25,887 21,314 19,766 17,711
Total $ 336,108 $ 310,738 $ 349,027 $ 308,571 $ 252,367
The FAA conducts ongoing research as part of its mission to provide the safest, most efficient aerospace system in the world.
Research priorities include improved aircraft structures and materials; enhanced fire and cabin safety; greater crash injury protection; more sensitive explosive detection systems; ground de-icing operations and less in-flight ice buildup; better tools to predict and warn of weather hazards, turbulence, and wake vortices; advanced aerospace medicine; and optimized human factors. ‘Aerospace medicine’ includes, for example, the medical aspects of pilot certification, drug and alcohol testing, and ensuring that employees in safety critical duties meet medical standards. ‘Human factors’ refers to research about how people (e.g., air traffic controllers, pilots, and others) perform when interacting with, for example, aviation technology and equipment, under various stressful conditions. Optimizing this interaction contributes to safer air travel. Presented below are a few examples of how the FAA’s research and development promotes safe and efficient air travel.
Cost-Effective Flammability Testing of Aircraft Components (Fire Research and Safety)The FAA initiated a Material Similarity Task Group within the International Aircraft Materials Fire Test Forum to develop methods and criterion for comparing the intrinsic flammability of component cabin materials. Due to the unavailability or environmental regulation of the original constituents, aircraft manufacturers and suppliers are often forced to change original materials, which results in costly recertification. The FAA is collaborating with industry to test samples of cabin
interior materials to develop new procedures and pass/fail criterion for individual components. This research leverages the FAA’s patented microscale combustion calorimeter for the small-scale fire performance testing of component materials. The FAA will issue an advisory circular or policy letter to codify this cost-effective FAA safety technology.
New Models Integrated into LS-DYNA Software (Propulsion and Fuel Systems)Members of the FAA Aircraft Catastrophic Failure Prevention Program collaborated with federal and academic researchers to develop new metal and composite finite element models and modeling guidelines. The research team included Arizona State University, George Mason University, The Ohio State University, NASA Glenn Research Center and NASA Langley, Livermore Software Technology Corporation, Honda R&D Americas, and The Boeing Company. The high fidelity metal and composite models more accurately simulate characteristics of aircraft engine and structural materials during engine-related impact failures. The latest models utilize a generalized tabulated approach to accurately incorporate strain rate, temperature, and damage necessary to predict multiple observed failure modes with a single material model input. Accurate and predictive models are essential for advancing design and certification analysis tools, resulting in designs that are more robust to crash and engine blade loss and ultimately benefit aviation through improved safety.
New Passenger Safety Instructions (Aeromedical Research)The Biodynamics, Cabin Safety and Izone Teams at the Civil Aerospace Medical Institute (CAMI) provided substantive updates to the Advisory Circular on Passenger Safety
FA A FISCAL YEAR 2019 | PERFORMANCE AND ACCOUNTABILIT Y REPORT 125
FIN
AN
CIA
L R
ES
ULT
S
Information Briefing and Briefing Cards (AC 121-24D). The new publication updates the instructions with new brace positions on passenger Safety Cards. It also encourages the application of innovative research, such as the use of “Serious Games” and computer applications to improve the retention of safety information through “edutainment.” CAMI's Cabin Safety Research Team, in collaboration with the Human-Computer Interaction Laboratory at the University of Udine Italy, investigated how new technologies such as smartphone applications could offer a novel experience to enhance passenger education in the best actions to take to improve their chance of survival and reduce their risk of injury in an aircraft accident or incident.
Evaluation of New Airport Firefighting Testing Equipment (Airports Technology Research Program)The FAA’s Airports Technology Research Program evaluated testing equipment, which would eliminate the need for the
discharge of aqueous film forming foams (AFFF) into the environment. AFFF is used by aircraft rescue and firefighting departments at airports and surrounding communities due to their firefighting capabilities when dealing with specific risks such as spilled fuels and hydrocarbons. However, the current formulation of AFFF has been classified by the EPA as persistent, bio-accumulative and toxic, leading to health and environmental concerns during a discharge. Proposed replacements for AFFF have shown potential, however have not yet been proven to have equivalent fire extinguishing capabilities. Until a suitable alternative is deemed acceptable for use, the implementation of this new testing equipment will allow airports to ensure full functioning capability of their firefighting equipment, without having to unnecessarily discharge these chemicals into the environment. Upon completion of the evaluation, new guidance was issued and supplied to airports through CertAlert No. 19-01, issued in January 2019.
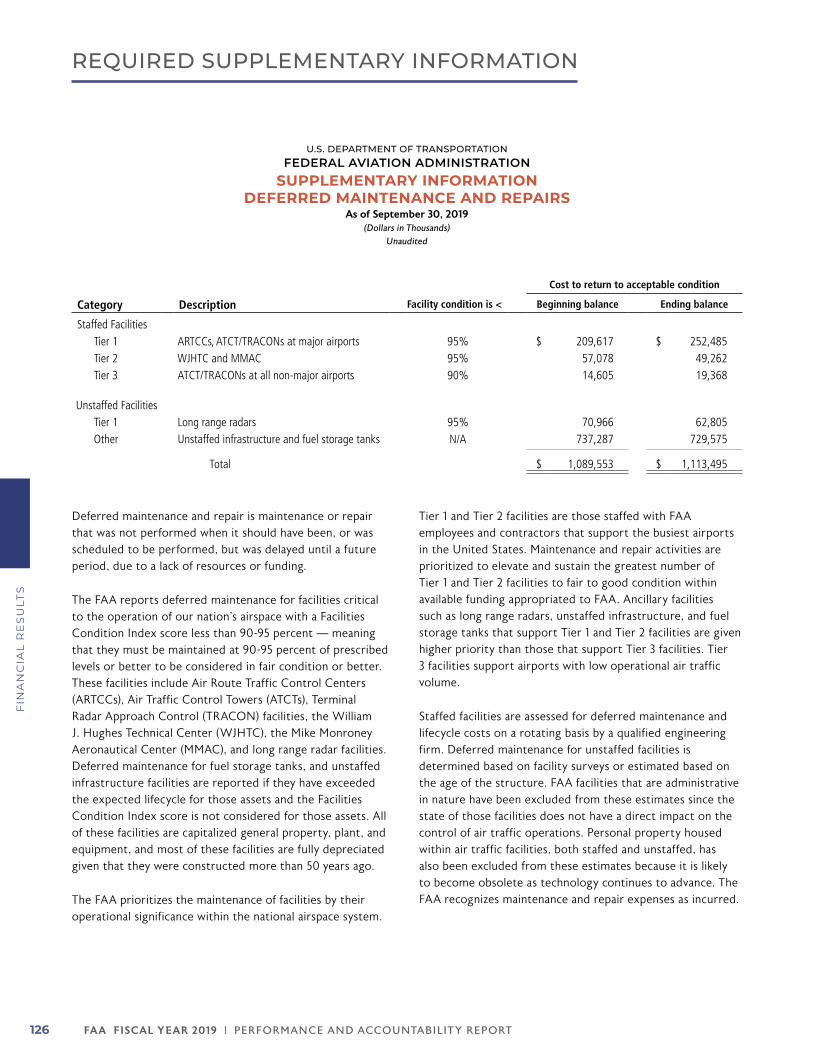
FA A FISCAL YEAR 2019 | PERFORMANCE AND ACCOUNTABILIT Y REPORT126
FIN
AN
CIA
L R
ES
ULT
S
REQUIRED SUPPLEMENTARY INFORMATION
U.S. DEPARTMENT OF TRANSPORTATIONFEDERAL AVIATION ADMINISTRATION
SUPPLEMENTARY INFORMATION DEFERRED MAINTENANCE AND REPAIRS
As of September 30, 2019(Dollars in Thousands)
Unaudited
Cost to return to acceptable condition
Category Description Facility condition is < Beginning balance Ending balance
Staffed FacilitiesTier 1 ARTCCs, ATCT/TRACONs at major airports 95% $ 209,617 $ 252,485 Tier 2 WJHTC and MMAC 95% 57,078 49,262 Tier 3 ATCT/TRACONs at all non-major airports 90% 14,605 19,368
Unstaffed FacilitiesTier 1 Long range radars 95% 70,966 62,805 Other Unstaffed infrastructure and fuel storage tanks N/A 737,287 729,575
Total $ 1,089,553 $ 1,113,495
Deferred maintenance and repair is maintenance or repair that was not performed when it should have been, or was scheduled to be performed, but was delayed until a future period, due to a lack of resources or funding.
The FAA reports deferred maintenance for facilities critical to the operation of our nation’s airspace with a Facilities Condition Index score less than 90-95 percent — meaning that they must be maintained at 90-95 percent of prescribed levels or better to be considered in fair condition or better. These facilities include Air Route Traffic Control Centers (ARTCCs), Air Traffic Control Towers (ATCTs), Terminal Radar Approach Control (TRACON) facilities, the William J. Hughes Technical Center (WJHTC), the Mike Monroney Aeronautical Center (MMAC), and long range radar facilities. Deferred maintenance for fuel storage tanks, and unstaffed infrastructure facilities are reported if they have exceeded the expected lifecycle for those assets and the Facilities Condition Index score is not considered for those assets. All of these facilities are capitalized general property, plant, and equipment, and most of these facilities are fully depreciated given that they were constructed more than 50 years ago.
The FAA prioritizes the maintenance of facilities by their operational significance within the national airspace system.
Tier 1 and Tier 2 facilities are those staffed with FAA employees and contractors that support the busiest airports in the United States. Maintenance and repair activities are prioritized to elevate and sustain the greatest number of Tier 1 and Tier 2 facilities to fair to good condition within available funding appropriated to FAA. Ancillary facilities such as long range radars, unstaffed infrastructure, and fuel storage tanks that support Tier 1 and Tier 2 facilities are given higher priority than those that support Tier 3 facilities. Tier 3 facilities support airports with low operational air traffic volume.
Staffed facilities are assessed for deferred maintenance and lifecycle costs on a rotating basis by a qualified engineering firm. Deferred maintenance for unstaffed facilities is determined based on facility surveys or estimated based on the age of the structure. FAA facilities that are administrative in nature have been excluded from these estimates since the state of those facilities does not have a direct impact on the control of air traffic operations. Personal property housed within air traffic facilities, both staffed and unstaffed, has also been excluded from these estimates because it is likely to become obsolete as technology continues to advance. The FAA recognizes maintenance and repair expenses as incurred.
FA A FISCAL YEAR 2019 | PERFORMANCE AND ACCOUNTABILIT Y REPORT 127
FIN
AN
CIA
L R
ES
ULT
S
The increase in Tier 1 staffed facilities is due to the net addition of two Air Route Traffic Control Centers and four combined Air Traffic Control Towers and Terminal Approach Control facilities whose facility condition scores fell below the acceptable range. The decrease in Long Range Radar deferred maintenance relates to the net decrease of three facilities that had facility condition scores above the
acceptable level. The decrease in unstaffed infrastructure and fuel storage tanks is attributed to improved data collection and differentiation so that unstaffed structures that house equipment are better segregated from structures that have a higher replacement value.
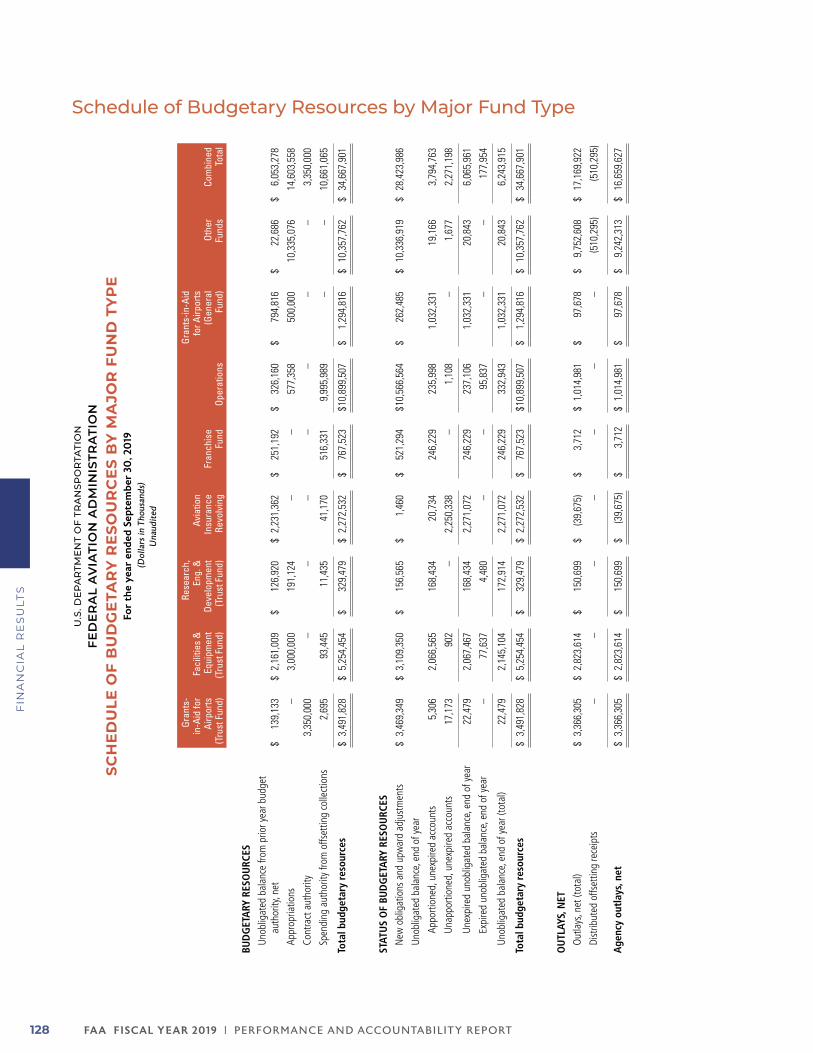
FA A FISCAL YEAR 2019 | PERFORMANCE AND ACCOUNTABILIT Y REPORT128
FIN
AN
CIA
L R
ES
ULT
S
Schedule of Budgetary Resources by Major Fund Type
U.S
. DE
PA
RTM
EN
T O
F TR
AN
SPO
RTA
TIO
N
FE
DE
RA
L A
VIA
TIO
N A
DM
INIS
TRA
TIO
N
SCH
ED
ULE
OF
BU
DG
ETA
RY
RE
SOU
RC
ES
BY
MA
JOR
FU
ND
TY
PE
For
the
year
en
ded
Sep
tem
ber
30
, 20
19
(Dol
lars
in T
hous
ands
) U
naud
ited
Gran
ts-
in-A
id fo
r Ai
rpor
ts(T
rust
Fun
d)
Faci
litie
s &
Eq
uipm
ent
(Tru
st F
und)
Rese
arch
, En
g. &
De
velo
pmen
t(T
rust
Fun
d)
Avia
tion
Insu
ranc
e Re
volv
ing
Fran
chis
e Fu
ndOp
erat
ions
Gran
ts-in
-Aid
fo
r Airp
orts
(Gen
eral
Fu
nd)
Othe
r Fu
nds
Com
bine
d To
tal
BUD
GET
ARY
RES
OU
RCES
Unob
ligat
ed b
alan
ce fr
om p
rior y
ear b
udge
t au
thor
ity, n
et$
139,
133
$ 2
,161
,009
$
126
,920
$
2,2
31,3
62
$ 2
51,1
92
$ 3
26,1
60
$ 7
94,8
16
$ 2
2,68
6 $
6,0
53,2
78
Appr
opria
tions
– 3
,000
,000
1
91,1
24
––
577
,358
5
00,0
00
10,
335,
076
14,
603,
558
Cont
ract
aut
horit
y 3
,350
,000
–
–
–
––
–
–
3,3
50,0
00
Spen
ding
aut
horit
y fro
m o
ffset
ting
colle
ctio
ns 2
,695
9
3,44
5 1
1,43
5 4
1,17
0 5
16,3
31
9,9
95,9
89
–
–
10,
661,
065
Tota
l bud
geta
ry r
esou
rces
$
3,4
91,8
28
$ 5
,254
,454
$
329
,479
$
2,2
72,5
32
$ 7
67,5
23
$10,
899,
507
$ 1
,294
,816
$
10,
357,
762
$34
,667
,901
STAT
US
OF
BUD
GET
ARY
RES
OU
RCES
New
obl
igat
ions
and
upw
ard
adju
stm
ents
$
3,4
69,3
49
$ 3
,109
,350
$
156
,565
$
1,4
60
$ 5
21,2
94
$10,
566,
564
$ 2
62,4
85
$ 1
0,33
6,91
9 $
28,4
23,9
86
Unob
ligat
ed b
alan
ce, e
nd o
f yea
r
Appo
rtion
ed, u
nexp
ired
acco
unts
5,3
06
2,0
66,5
65
168
,434
2
0,73
4 2
46,2
29
235
,998
1
,032
,331
1
9,16
6 3
,794
,763
Un
appo
rtion
ed, u
nexp
ired
acco
unts
17,
173
902
–
2,2
50,3
38
– 1
,108
–
1,6
77
2,2
71,1
98
Unex
pire
d un
oblig
ated
bal
ance
, end
of y
ear
22,
479
2,0
67,4
67
168
,434
2
,271
,072
2
46,2
29
237
,106
1
,032
,331
2
0,84
3 6
,065
,961
Ex
pire
d un
oblig
ated
bal
ance
, end
of y
ear
– 7
7,63
7 4
,480
–
– 9
5,83
7 –
– 1
77,9
54
Unob
ligat
ed b
alan
ce, e
nd o
f yea
r (to
tal)
22,
479
2,1
45,1
04
172
,914
2
,271
,072
2
46,2
29
332
,943
1
,032
,331
2
0,84
3 6
,243
,915
Tota
l bud
geta
ry r
esou
rces
$
3,4
91,8
28
$ 5
,254
,454
$
329
,479
$
2,2
72,5
32
$ 7
67,5
23
$10,
899,
507
$ 1
,294
,816
$
10,
357,
762
$34
,667
,901
OU
TLAY
S, N
ET
Out
lays
, net
(tot
al)
$ 3
,366
,305
$
2,8
23,6
14
$15
0,69
9 $
(39,
675)
$3,
712
$ 1
,014
,981
$
97,6
78
$ 9
,752
,608
$
17,1
69,9
22
Dist
ribut
ed o
ffset
ting
rece
ipts
––
–
––
––
(510
,295
) (5
10,2
95)
Age
ncy
outl
ays,
net
$ 3
,366
,305
$
2,8
23,6
14
$15
0,69
9 $
(39,
675)
$3,
712
$ 1
,014
,981
$
97,6
78
$ 9
,242
,313
$
16,6
59,6
27
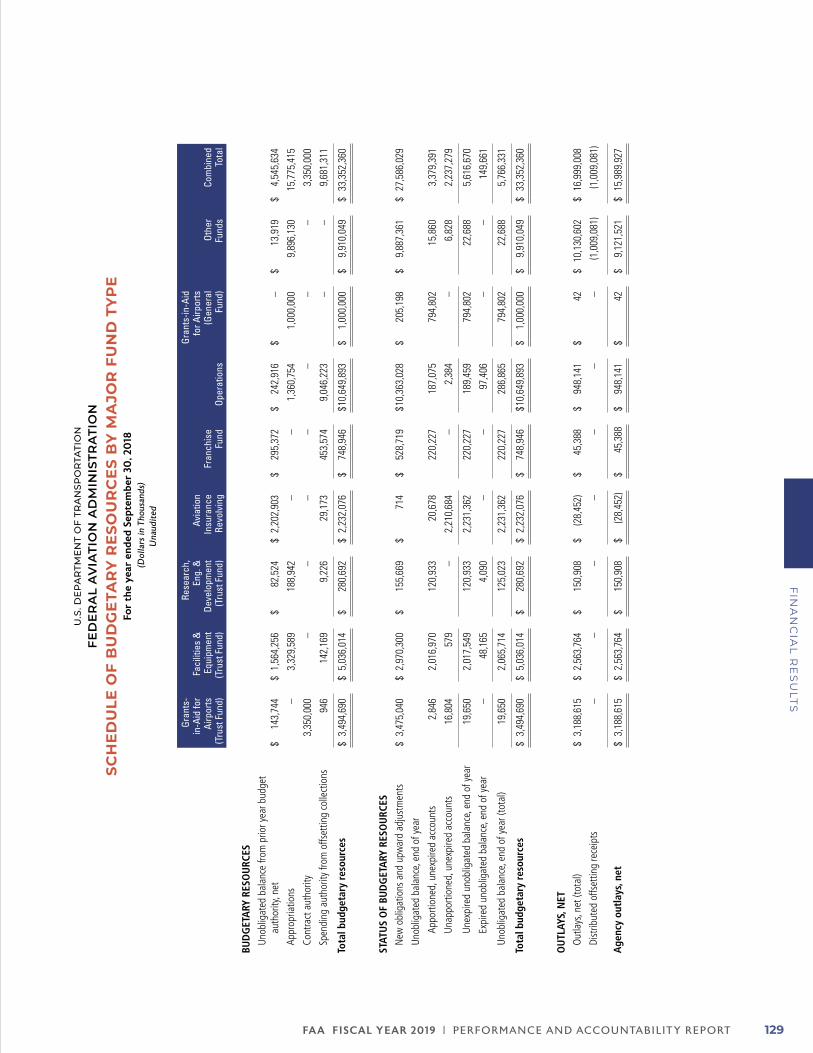
FA A FISCAL YEAR 2019 | PERFORMANCE AND ACCOUNTABILIT Y REPORT 129
FIN
AN
CIA
L R
ES
ULT
S
U.S
. DE
PA
RTM
EN
T O
F TR
AN
SPO
RTA
TIO
N
FE
DE
RA
L A
VIA
TIO
N A
DM
INIS
TRA
TIO
N
SCH
ED
ULE
OF
BU
DG
ETA
RY
RE
SOU
RC
ES
BY
MA
JOR
FU
ND
TY
PE
For
the
year
en
ded
Sep
tem
ber
30
, 20
18
(Dol
lars
in T
hous
ands
) U
naud
ited
Gran
ts-
in-A
id fo
r Ai
rpor
ts(T
rust
Fun
d)
Faci
litie
s &
Eq
uipm
ent
(Tru
st F
und)
Rese
arch
, En
g. &
De
velo
pmen
t(T
rust
Fun
d)
Avia
tion
Insu
ranc
e Re
volv
ing
Fran
chis
e Fu
ndOp
erat
ions
Gran
ts-in
-Aid
fo
r Airp
orts
(Gen
eral
Fu
nd)
Othe
r Fu
nds
Com
bine
d To
tal
BUD
GET
ARY
RES
OU
RCES
Unob
ligat
ed b
alan
ce fr
om p
rior y
ear b
udge
t au
thor
ity, n
et$
143
,744
$
1,5
64,2
56
$ 8
2,52
4 $
2,2
02,9
03
$ 2
95,3
72
$ 2
42,9
16
$ –
$
13,
919
$ 4
,545
,634
Ap
prop
riatio
ns–
3,3
29,5
89
188
,942
–
– 1
,360
,754
1
,000
,000
9
,896
,130
1
5,77
5,41
5 Co
ntra
ct a
utho
rity
3,3
50,0
00
–
–
––
– –
–
3
,350
,000
Sp
endi
ng a
utho
rity
from
offs
ettin
g co
llect
ions
946
1
42,1
69
9,2
26
29,
173
453
,574
9
,046
,223
–
–
9
,681
,311
Tota
l bud
geta
ry r
esou
rces
$
3,4
94,6
90
$ 5
,036
,014
$
280
,692
$
2,2
32,0
76
$ 7
48,9
46
$10,
649,
893
$ 1
,000
,000
$
9,9
10,0
49
$ 3
3,35
2,36
0
STAT
US
OF
BUD
GET
ARY
RES
OU
RCES
New
obl
igat
ions
and
upw
ard
adju
stm
ents
$
3,4
75,0
40
$ 2
,970
,300
$
155
,669
$
714
$
528
,719
$1
0,36
3,02
8 $
205
,198
$
9,8
87,3
61
$ 2
7,58
6,02
9 Un
oblig
ated
bal
ance
, end
of y
ear
Appo
rtion
ed, u
nexp
ired
acco
unts
2,8
46
2,0
16,9
70
120
,933
2
0,67
8 2
20,2
27
187
,075
7
94,8
02
15,
860
3,3
79,3
91
Unap
porti
oned
, une
xpire
d ac
coun
ts 1
6,80
4 5
79
– 2
,210
,684
–
2,3
84
– 6
,828
2
,237
,279
Unex
pire
d un
oblig
ated
bal
ance
, end
of y
ear
19,
650
2,0
17,5
49
120
,933
2
,231
,362
2
20,2
27
189
,459
7
94,8
02
22,
688
5,6
16,6
70
Expi
red
unob
ligat
ed b
alan
ce, e
nd o
f yea
r –
48,
165
4,0
90
––
97,
406
––
149
,661
Unob
ligat
ed b
alan
ce, e
nd o
f yea
r (to
tal)
19,
650
2,0
65,7
14
125
,023
2
,231
,362
2
20,2
27
286
,865
7
94,8
02
22,
688
5,7
66,3
31
Tota
l bud
geta
ry r
esou
rces
$
3,4
94,6
90
$ 5
,036
,014
$
280
,692
$
2,2
32,0
76
$ 7
48,9
46
$10,
649,
893
$ 1
,000
,000
$
9,9
10,0
49
$ 3
3,35
2,36
0
OU
TLAY
S, N
ET
Out
lays
, net
(tot
al)
$ 3
,188
,615
$
2,5
63,7
64
$ 1
50,9
08
$ (2
8,45
2)$
45,
388
$ 9
48,1
41
$ 4
2 $
10,
130,
602
$ 1
6,99
9,00
8 Di
strib
uted
offs
ettin
g re
ceip
ts–
– –
–
––
– (1
,009
,081
) (1
,009
,081
)
Age
ncy
outl
ays,
net
$ 3
,188
,615
$
2,5
63,7
64
$ 1
50,9
08
$ (2
8,45
2)$
45,
388
$ 9
48,1
41
$ 4
2 $
9,1
21,5
21
$ 1
5,98
9,92
7
FA A FISCAL YEAR 2019 | PERFORMANCE AND ACCOUNTABILIT Y REPORT130
OTHER INFORMATION
Photo by Jeswin Thomas
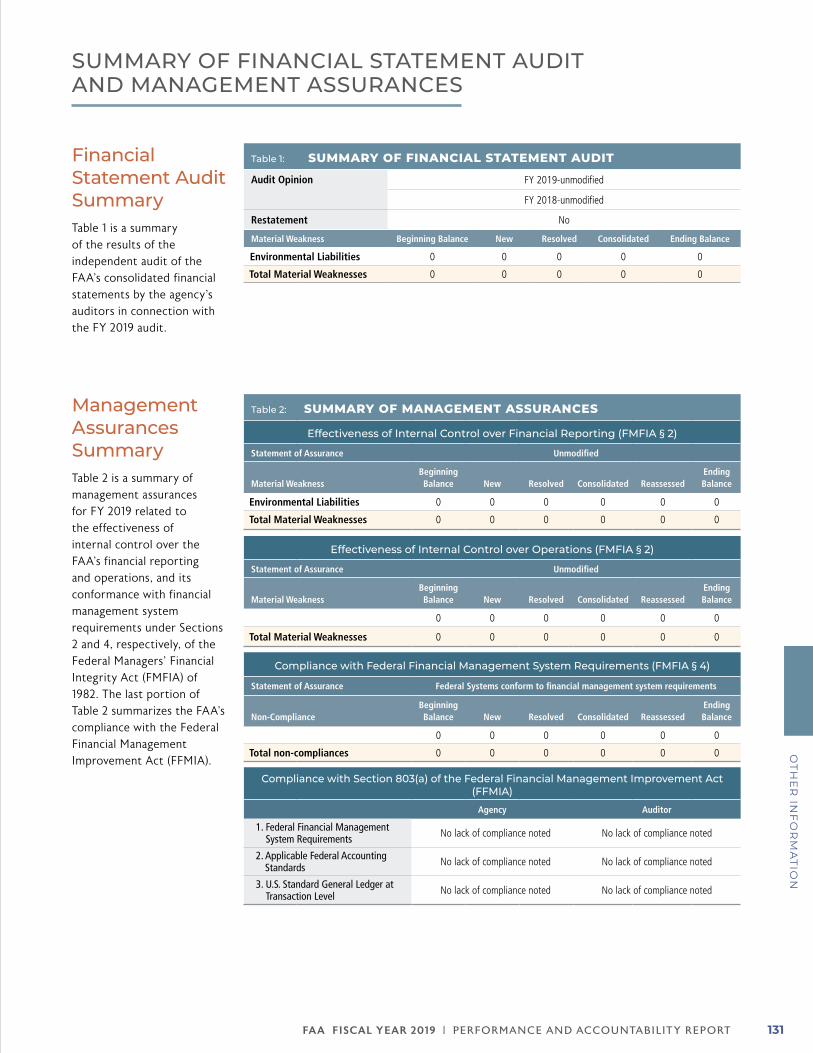
FA A FISCAL YEAR 2019 | PERFORMANCE AND ACCOUNTABILIT Y REPORT 131
OT
HE
R IN
FO
RM
AT
ION
SUMMARY OF FINANCIAL STATEMENT AUDIT AND MANAGEMENT ASSURANCES
Financial Statement Audit SummaryTable 1 is a summary of the results of the independent audit of the FAA’s consolidated financial statements by the agency’s auditors in connection with the FY 2019 audit.
Table 1: SUMMARY OF FINANCIAL STATEMENT AUDIT
Audit Opinion FY 2019-unmodified
FY 2018-unmodified
Restatement No
Material Weakness Beginning Balance New Resolved Consolidated Ending Balance
Environmental Liabilities 0 0 0 0 0
Total Material Weaknesses 0 0 0 0 0
Management Assurances Summary Table 2 is a summary of management assurances for FY 2019 related to the effectiveness of internal control over the FAA’s financial reporting and operations, and its conformance with financial management system requirements under Sections 2 and 4, respectively, of the Federal Managers’ Financial Integrity Act (FMFIA) of 1982. The last portion of Table 2 summarizes the FAA’s compliance with the Federal Financial Management Improvement Act (FFMIA).
Table 2: SUMMARY OF MANAGEMENT ASSURANCES
Effectiveness of Internal Control over Financial Reporting (FMFIA § 2)
Statement of Assurance Unmodified
Material WeaknessBeginning Balance New Resolved Consolidated Reassessed
Ending Balance
Environmental Liabilities 0 0 0 0 0 0
Total Material Weaknesses 0 0 0 0 0 0
Effectiveness of Internal Control over Operations (FMFIA § 2)
Statement of Assurance Unmodified
Material WeaknessBeginning Balance New Resolved Consolidated Reassessed
Ending Balance
0 0 0 0 0 0
Total Material Weaknesses 0 0 0 0 0 0
Compliance with Federal Financial Management System Requirements (FMFIA § 4)
Statement of Assurance Federal Systems conform to financial management system requirements
Non-ComplianceBeginning Balance New Resolved Consolidated Reassessed
Ending Balance
0 0 0 0 0 0
Total non-compliances 0 0 0 0 0 0
Compliance with Section 803(a) of the Federal Financial Management Improvement Act (FFMIA)
Agency Auditor
1. Federal Financial Management System Requirements No lack of compliance noted No lack of compliance noted
2. Applicable Federal Accounting Standards No lack of compliance noted No lack of compliance noted
3. U.S. Standard General Ledger at Transaction Level No lack of compliance noted No lack of compliance noted
FA A FISCAL YEAR 2019 | PERFORMANCE AND ACCOUNTABILIT Y REPORT132
OT
HE
R I
NF
OR
MA
TIO
N
PAYMENT INTEGRITY
The Improper Payments Information Act (IPIA) of 2002 (P.L. 107-300) requires agencies to review their programs and activities to identify those susceptible to significant improper payments. IPIA was amended on July 22, 2010 by the Improper Payments Elimination and Recovery Act (IPERA) of 2010 (P. L. 111-204). IPERA strengthens the requirements for government agencies to carry out cost-effective programs for identifying and recovering overpayments, also known as “recapture auditing.” The FAA continues to implement these laws and the most recent amendment to IPIA, the Improper Payments Elimination and Recovery Improvement Act (IPERIA) of 2012 (Public Law 112-248).
Office of Management and Budget (OMB) Circular A-123, Appendix C, Requirements for Effective Measurement and Remediation of Improper Payments, provides guidance on the implementation of IPERIA. OMB Circular A-123, Appendix C defines an improper payment as any payment that should not have been made or that was made in an incorrect amount under statutory, contractual, administrative, or other legally applicable requirements. Incorrect amounts are overpayments or underpayments that are made to eligible recipients including inappropriate denials of payment or service, any payment that does not account for credit for applicable discounts, payments for the incorrect amount, and duplicate payments. An improper payment also includes any payment that was made to an ineligible recipient or for an ineligible good or service, or payments for goods or services not received (except for such payments authorized by law). In addition, when an agency’s review is unable to discern whether a payment was proper because of insufficient or lack of documentation, this payment must also be considered an improper payment.
OMB issued memorandum M-13-07, Accountability for Funds Provided by the Disaster Relief Appropriations Act, dated March 12, 2013 (M-13-07) that requires agencies to manage disaster relief funds with the same discipline and rigor as programs that are traditionally designated as susceptible to significant improper payments under IPERIA.
For more detailed information on improper payments as well as information reported in past FAA Performance and Accountability Reports (PAR) but not included in the FY 2019 PAR, see https://paymentaccuracy.gov/.
Federal Aviation Administration ProcessThe FAA’s process for complying with IPERIA and OMB Circular A-123, Appendix C, consists of the following steps:
1) Review programs and activities to identify those susceptible to significant improper payments
2) Obtain a statistically valid estimate of the annual amount of improper payments in programs and activities for those programs identified as susceptible to significant improper payments
3) Implement a plan to reduce erroneous payments
4) Report estimates of the annual amounts of improper payments in programs and activities, and progress in reducing occurrence of future improper payments
For FY 2019 reporting, the FAA did not conduct detailed improper payment testing. OMB granted our previous risk areas waivers from further testing. In addition, our last risk assessment conducted in FY 2017 did not identify any high risk areas deemed susceptible to improper payments under IPERIA.
According to IPERA, and OMB A-123, Appendix C, if a program has been reporting improper payment estimates, but has documented a minimum of two consecutive years of improper payments that are below the thresholds set by IPERA, the agency may request relief from the annual reporting requirements for this program. This request must include an assertion from the agency’s Office of Inspector General (OIG) that it concurs with the agency’s request for relief. In FY 2016, DOT requested that OMB relieve the FAA’s Airport Improvement Program (AIP) from improper payment reporting. In its written request, AIP adequately demonstrated that the program had at least two consecutive years of improper payments reporting below the IPERA thresholds. In addition, the request included the requisite assertion from the agency’s OIG that it concurs with the agency’s request for relief. OMB approved this request on July 19, 2016. Therefore, the FAA’s FY 2019 PAR does not include any AIP improper payment reporting.
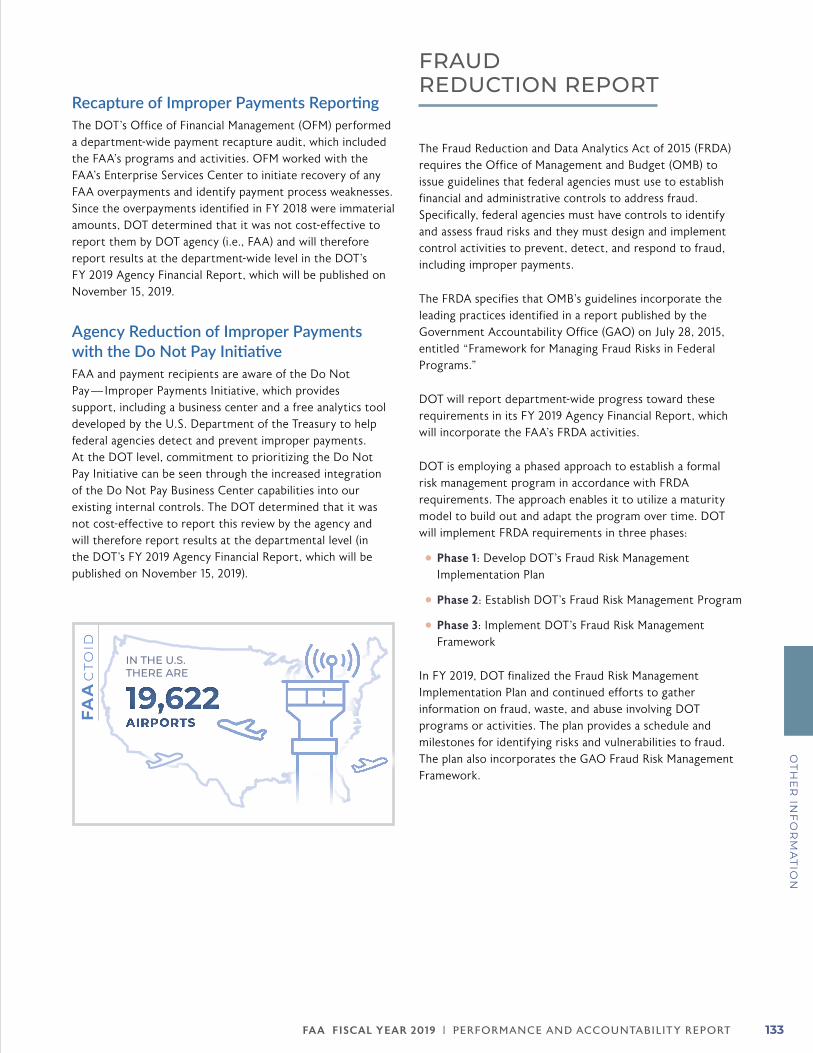
FA A FISCAL YEAR 2019 | PERFORMANCE AND ACCOUNTABILIT Y REPORT 133
OT
HE
R IN
FO
RM
AT
ION
Recapture of Improper Payments ReportingThe DOT’s Office of Financial Management (OFM) performed a department-wide payment recapture audit, which included the FAA’s programs and activities. OFM worked with the FAA’s Enterprise Services Center to initiate recovery of any FAA overpayments and identify payment process weaknesses. Since the overpayments identified in FY 2018 were immaterial amounts, DOT determined that it was not cost-effective to report them by DOT agency (i.e., FAA) and will therefore report results at the department-wide level in the DOT’s FY 2019 Agency Financial Report, which will be published on November 15, 2019.
Agency Reduction of Improper Payments with the Do Not Pay InitiativeFAA and payment recipients are aware of the Do Not Pay — Improper Payments Initiative, which provides support, including a business center and a free analytics tool developed by the U.S. Department of the Treasury to help federal agencies detect and prevent improper payments. At the DOT level, commitment to prioritizing the Do Not Pay Initiative can be seen through the increased integration of the Do Not Pay Business Center capabilities into our existing internal controls. The DOT determined that it was not cost-effective to report this review by the agency and will therefore report results at the departmental level (in the DOT’s FY 2019 Agency Financial Report, which will be published on November 15, 2019).
FRAUD REDUCTION REPORT
The Fraud Reduction and Data Analytics Act of 2015 (FRDA) requires the Office of Management and Budget (OMB) to issue guidelines that federal agencies must use to establish financial and administrative controls to address fraud. Specifically, federal agencies must have controls to identify and assess fraud risks and they must design and implement control activities to prevent, detect, and respond to fraud, including improper payments.
The FRDA specifies that OMB’s guidelines incorporate the leading practices identified in a report published by the Government Accountability Office (GAO) on July 28, 2015, entitled “Framework for Managing Fraud Risks in Federal Programs.”
DOT will report department-wide progress toward these requirements in its FY 2019 Agency Financial Report, which will incorporate the FAA’s FRDA activities.
DOT is employing a phased approach to establish a formal risk management program in accordance with FRDA requirements. The approach enables it to utilize a maturity model to build out and adapt the program over time. DOT will implement FRDA requirements in three phases:
zz Phase 1: Develop DOT’s Fraud Risk Management Implementation Plan
zz Phase 2: Establish DOT’s Fraud Risk Management Program
zz Phase 3: Implement DOT’s Fraud Risk Management Framework
In FY 2019, DOT finalized the Fraud Risk Management Implementation Plan and continued efforts to gather information on fraud, waste, and abuse involving DOT programs or activities. The plan provides a schedule and milestones for identifying risks and vulnerabilities to fraud. The plan also incorporates the GAO Fraud Risk Management Framework.
FAActo
id
IN THE U.S.THERE ARE
19,622 AIRPORTS
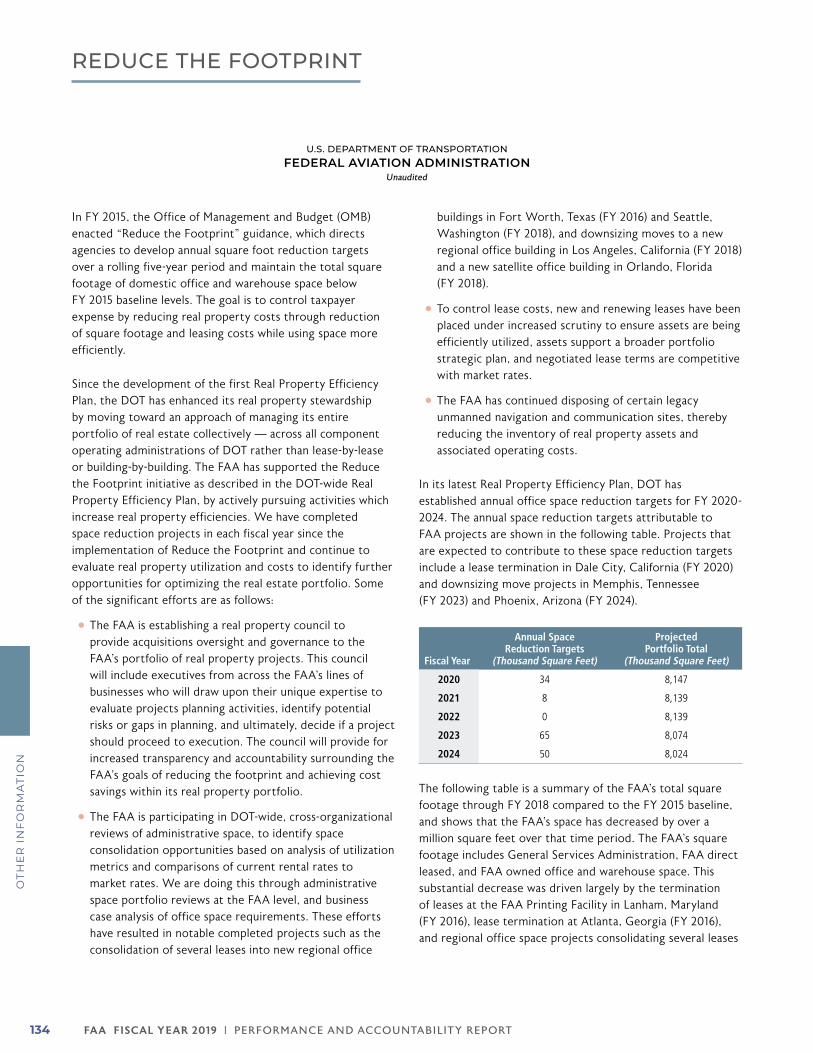
FA A FISCAL YEAR 2019 | PERFORMANCE AND ACCOUNTABILIT Y REPORT134
OT
HE
R I
NF
OR
MA
TIO
N
REDUCE THE FOOTPRINT
U.S. DEPARTMENT OF TRANSPORTATIONFEDERAL AVIATION ADMINISTRATION
Unaudited
In FY 2015, the Office of Management and Budget (OMB) enacted “Reduce the Footprint” guidance, which directs agencies to develop annual square foot reduction targets over a rolling five-year period and maintain the total square footage of domestic office and warehouse space below FY 2015 baseline levels. The goal is to control taxpayer expense by reducing real property costs through reduction of square footage and leasing costs while using space more efficiently.
Since the development of the first Real Property Efficiency Plan, the DOT has enhanced its real property stewardship by moving toward an approach of managing its entire portfolio of real estate collectively — across all component operating administrations of DOT rather than lease-by-lease or building-by-building. The FAA has supported the Reduce the Footprint initiative as described in the DOT-wide Real Property Efficiency Plan, by actively pursuing activities which increase real property efficiencies. We have completed space reduction projects in each fiscal year since the implementation of Reduce the Footprint and continue to evaluate real property utilization and costs to identify further opportunities for optimizing the real estate portfolio. Some of the significant efforts are as follows:
zz The FAA is establishing a real property council to provide acquisitions oversight and governance to the FAA’s portfolio of real property projects. This council will include executives from across the FAA’s lines of businesses who will draw upon their unique expertise to evaluate projects planning activities, identify potential risks or gaps in planning, and ultimately, decide if a project should proceed to execution. The council will provide for increased transparency and accountability surrounding the FAA’s goals of reducing the footprint and achieving cost savings within its real property portfolio.
zz The FAA is participating in DOT-wide, cross-organizational reviews of administrative space, to identify space consolidation opportunities based on analysis of utilization metrics and comparisons of current rental rates to market rates. We are doing this through administrative space portfolio reviews at the FAA level, and business case analysis of office space requirements. These efforts have resulted in notable completed projects such as the consolidation of several leases into new regional office
buildings in Fort Worth, Texas (FY 2016) and Seattle, Washington (FY 2018), and downsizing moves to a new regional office building in Los Angeles, California (FY 2018) and a new satellite office building in Orlando, Florida (FY 2018).
zz To control lease costs, new and renewing leases have been placed under increased scrutiny to ensure assets are being efficiently utilized, assets support a broader portfolio strategic plan, and negotiated lease terms are competitive with market rates.
zz The FAA has continued disposing of certain legacy unmanned navigation and communication sites, thereby reducing the inventory of real property assets and associated operating costs.
In its latest Real Property Efficiency Plan, DOT has established annual office space reduction targets for FY 2020-2024. The annual space reduction targets attributable to FAA projects are shown in the following table. Projects that are expected to contribute to these space reduction targets include a lease termination in Dale City, California (FY 2020) and downsizing move projects in Memphis, Tennessee (FY 2023) and Phoenix, Arizona (FY 2024).
Fiscal Year
Annual Space Reduction Targets
(Thousand Square Feet)
Projected Portfolio Total
(Thousand Square Feet)
2020 34 8,147
2021 8 8,139
2022 0 8,139
2023 65 8,074
2024 50 8,024
The following table is a summary of the FAA's total square footage through FY 2018 compared to the FY 2015 baseline, and shows that the FAA’s space has decreased by over a million square feet over that time period. The FAA's square footage includes General Services Administration, FAA direct leased, and FAA owned office and warehouse space. This substantial decrease was driven largely by the termination of leases at the FAA Printing Facility in Lanham, Maryland (FY 2016), lease termination at Atlanta, Georgia (FY 2016), and regional office space projects consolidating several leases
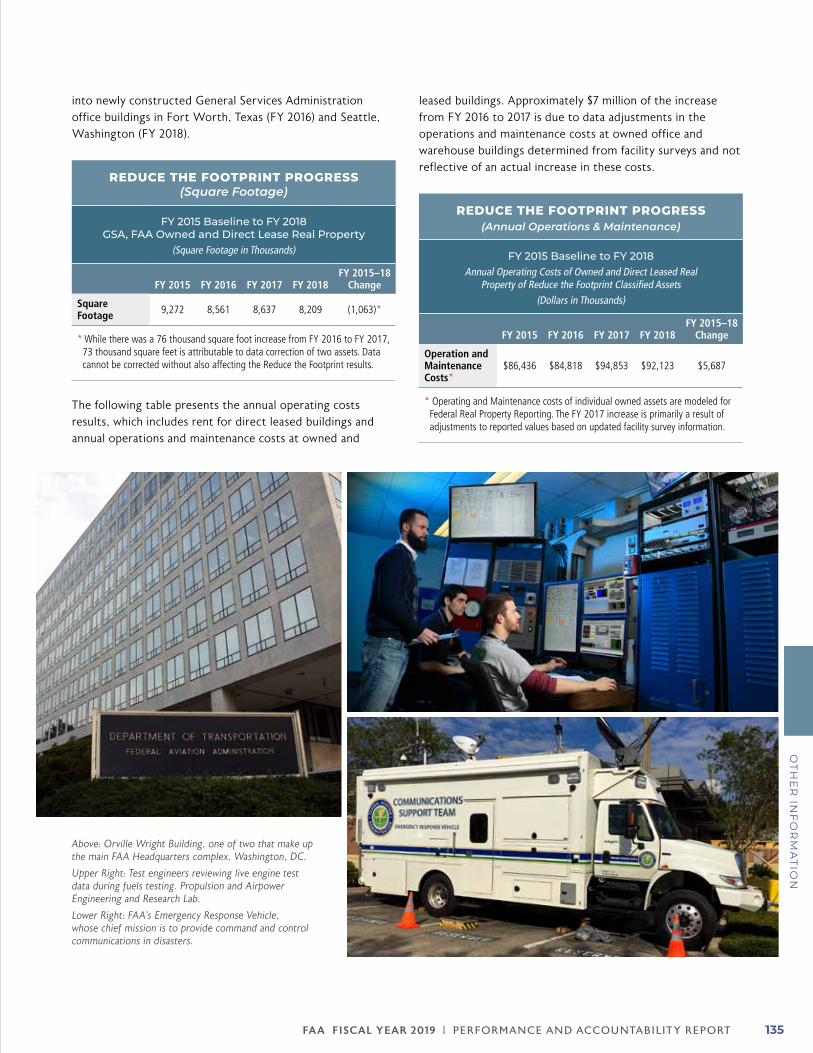
FA A FISCAL YEAR 2019 | PERFORMANCE AND ACCOUNTABILIT Y REPORT 135
OT
HE
R IN
FO
RM
AT
ION
into newly constructed General Services Administration office buildings in Fort Worth, Texas (FY 2016) and Seattle, Washington (FY 2018).
REDUCE THE FOOTPRINT PROGRESS (Square Footage)
FY 2015 Baseline to FY 2018GSA, FAA Owned and Direct Lease Real Property
(Square Footage in Thousands)
FY 2015 FY 2016 FY 2017 FY 2018FY 2015–18
Change
Square Footage 9,272 8,561 8,637 8,209 (1,063)*
* While there was a 76 thousand square foot increase from FY 2016 to FY 2017, 73 thousand square feet is attributable to data correction of two assets. Data cannot be corrected without also affecting the Reduce the Footprint results.
The following table presents the annual operating costs results, which includes rent for direct leased buildings and annual operations and maintenance costs at owned and
leased buildings. Approximately $7 million of the increase from FY 2016 to 2017 is due to data adjustments in the operations and maintenance costs at owned office and warehouse buildings determined from facility surveys and not reflective of an actual increase in these costs.
REDUCE THE FOOTPRINT PROGRESS (Annual Operations & Maintenance)
FY 2015 Baseline to FY 2018Annual Operating Costs of Owned and Direct Leased Real
Property of Reduce the Footprint Classified Assets(Dollars in Thousands)
FY 2015 FY 2016 FY 2017 FY 2018FY 2015–18
Change
Operation and Maintenance Costs*
$86,436 $84,818 $94,853 $92,123 $5,687
* Operating and Maintenance costs of individual owned assets are modeled for Federal Real Property Reporting. The FY 2017 increase is primarily a result of adjustments to reported values based on updated facility survey information.
Above: Orville Wright Building, one of two that make up the main FAA Headquarters complex, Washington, DC.
Upper Right: Test engineers reviewing live engine test data during fuels testing. Propulsion and Airpower Engineering and Research Lab.
Lower Right: FAA's Emergency Response Vehicle, whose chief mission is to provide command and control communications in disasters.
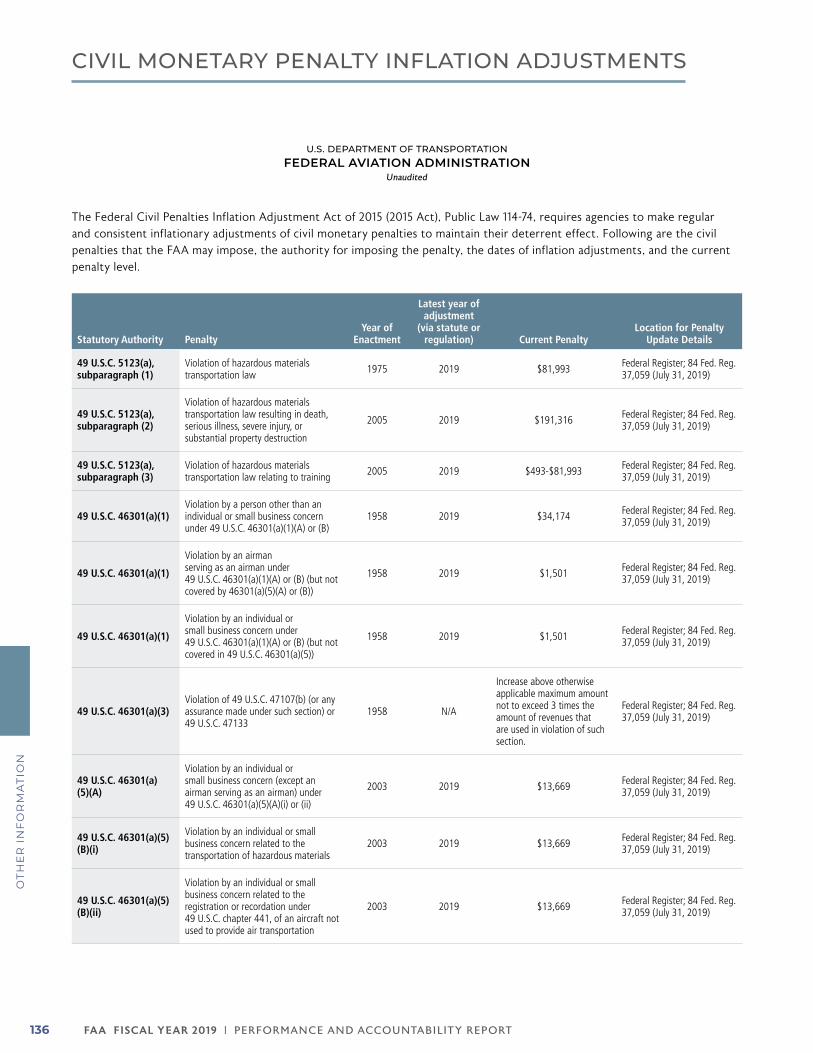
FA A FISCAL YEAR 2019 | PERFORMANCE AND ACCOUNTABILIT Y REPORT136
OT
HE
R I
NF
OR
MA
TIO
N
CIVIL MONETARY PENALTY INFLATION ADJUSTMENTS
U.S. DEPARTMENT OF TRANSPORTATIONFEDERAL AVIATION ADMINISTRATION
Unaudited
The Federal Civil Penalties Inflation Adjustment Act of 2015 (2015 Act), Public Law 114-74, requires agencies to make regular and consistent inflationary adjustments of civil monetary penalties to maintain their deterrent effect. Following are the civil penalties that the FAA may impose, the authority for imposing the penalty, the dates of inflation adjustments, and the current penalty level.
Statutory Authority PenaltyYear of
Enactment
Latest year of adjustment
(via statute or regulation) Current Penalty
Location for Penalty Update Details
49 U.S.C. 5123(a), subparagraph (1)
Violation of hazardous materials transportation law 1975 2019 $81,993 Federal Register; 84 Fed. Reg.
37,059 (July 31, 2019)
49 U.S.C. 5123(a), subparagraph (2)
Violation of hazardous materials transportation law resulting in death, serious illness, severe injury, or substantial property destruction
2005 2019 $191,316 Federal Register; 84 Fed. Reg. 37,059 (July 31, 2019)
49 U.S.C. 5123(a), subparagraph (3)
Violation of hazardous materials transportation law relating to training 2005 2019 $493-$81,993 Federal Register; 84 Fed. Reg.
37,059 (July 31, 2019)
49 U.S.C. 46301(a)(1)Violation by a person other than an individual or small business concern under 49 U.S.C. 46301(a)(1)(A) or (B)
1958 2019 $34,174 Federal Register; 84 Fed. Reg. 37,059 (July 31, 2019)
49 U.S.C. 46301(a)(1)
Violation by an airman serving as an airman under 49 U.S.C. 46301(a)(1)(A) or (B) (but not covered by 46301(a)(5)(A) or (B))
1958 2019 $1,501 Federal Register; 84 Fed. Reg. 37,059 (July 31, 2019)
49 U.S.C. 46301(a)(1)
Violation by an individual or small business concern under 49 U.S.C. 46301(a)(1)(A) or (B) (but not covered in 49 U.S.C. 46301(a)(5))
1958 2019 $1,501 Federal Register; 84 Fed. Reg. 37,059 (July 31, 2019)
49 U.S.C. 46301(a)(3)Violation of 49 U.S.C. 47107(b) (or any assurance made under such section) or 49 U.S.C. 47133
1958 N/A
Increase above otherwise applicable maximum amount not to exceed 3 times the amount of revenues that are used in violation of such section.
Federal Register; 84 Fed. Reg. 37,059 (July 31, 2019)
49 U.S.C. 46301(a)(5)(A)
Violation by an individual or small business concern (except an airman serving as an airman) under 49 U.S.C. 46301(a)(5)(A)(i) or (ii)
2003 2019 $13,669 Federal Register; 84 Fed. Reg. 37,059 (July 31, 2019)
49 U.S.C. 46301(a)(5)(B)(i)
Violation by an individual or small business concern related to the transportation of hazardous materials
2003 2019 $13,669 Federal Register; 84 Fed. Reg. 37,059 (July 31, 2019)
49 U.S.C. 46301(a)(5)(B)(ii)
Violation by an individual or small business concern related to the registration or recordation under 49 U.S.C. chapter 441, of an aircraft not used to provide air transportation
2003 2019 $13,669 Federal Register; 84 Fed. Reg. 37,059 (July 31, 2019)
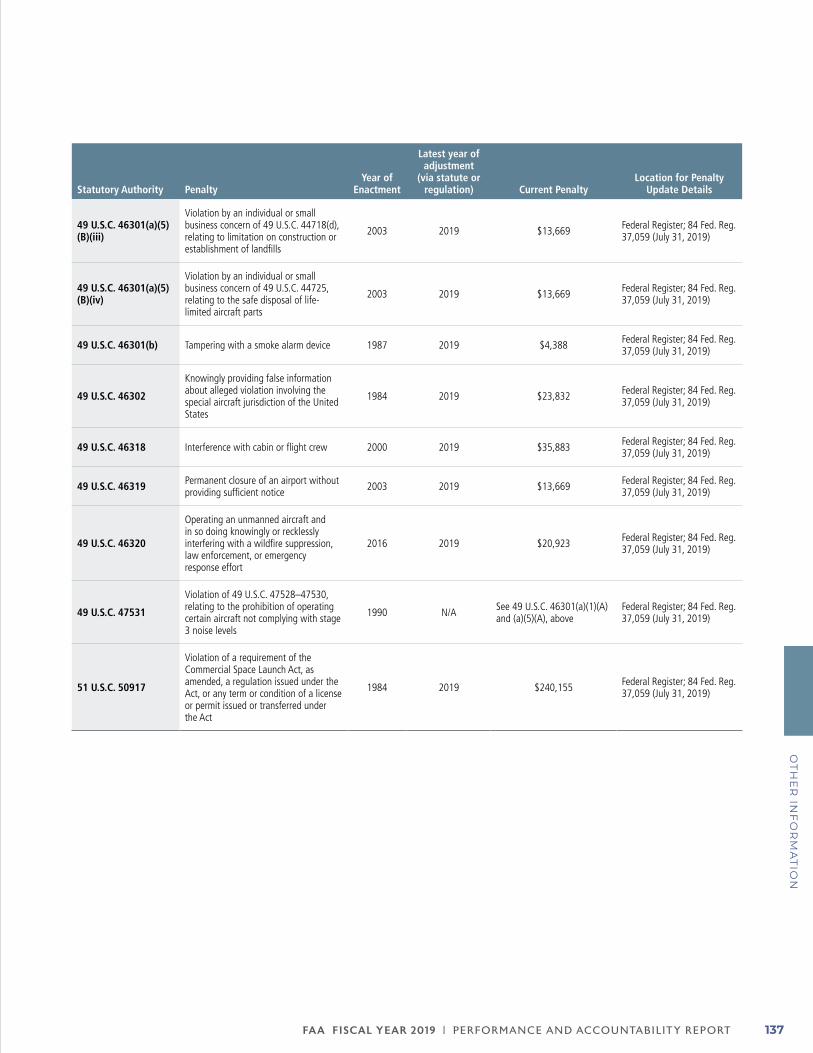
FA A FISCAL YEAR 2019 | PERFORMANCE AND ACCOUNTABILIT Y REPORT 137
OT
HE
R IN
FO
RM
AT
ION
Statutory Authority PenaltyYear of
Enactment
Latest year of adjustment
(via statute or regulation) Current Penalty
Location for Penalty Update Details
49 U.S.C. 46301(a)(5)(B)(iii)
Violation by an individual or small business concern of 49 U.S.C. 44718(d), relating to limitation on construction or establishment of landfills
2003 2019 $13,669 Federal Register; 84 Fed. Reg. 37,059 (July 31, 2019)
49 U.S.C. 46301(a)(5)(B)(iv)
Violation by an individual or small business concern of 49 U.S.C. 44725, relating to the safe disposal of life-limited aircraft parts
2003 2019 $13,669 Federal Register; 84 Fed. Reg. 37,059 (July 31, 2019)
49 U.S.C. 46301(b) Tampering with a smoke alarm device 1987 2019 $4,388 Federal Register; 84 Fed. Reg. 37,059 (July 31, 2019)
49 U.S.C. 46302
Knowingly providing false information about alleged violation involving the special aircraft jurisdiction of the United States
1984 2019 $23,832 Federal Register; 84 Fed. Reg. 37,059 (July 31, 2019)
49 U.S.C. 46318 Interference with cabin or flight crew 2000 2019 $35,883 Federal Register; 84 Fed. Reg. 37,059 (July 31, 2019)
49 U.S.C. 46319 Permanent closure of an airport without providing sufficient notice 2003 2019 $13,669 Federal Register; 84 Fed. Reg.
37,059 (July 31, 2019)
49 U.S.C. 46320
Operating an unmanned aircraft and in so doing knowingly or recklessly interfering with a wildfire suppression, law enforcement, or emergency response effort
2016 2019 $20,923 Federal Register; 84 Fed. Reg. 37,059 (July 31, 2019)
49 U.S.C. 47531
Violation of 49 U.S.C. 47528–47530, relating to the prohibition of operating certain aircraft not complying with stage 3 noise levels
1990 N/A See 49 U.S.C. 46301(a)(1)(A) and (a)(5)(A), above
Federal Register; 84 Fed. Reg. 37,059 (July 31, 2019)
51 U.S.C. 50917
Violation of a requirement of the Commercial Space Launch Act, as amended, a regulation issued under the Act, or any term or condition of a license or permit issued or transferred under the Act
1984 2019 $240,155 Federal Register; 84 Fed. Reg. 37,059 (July 31, 2019)
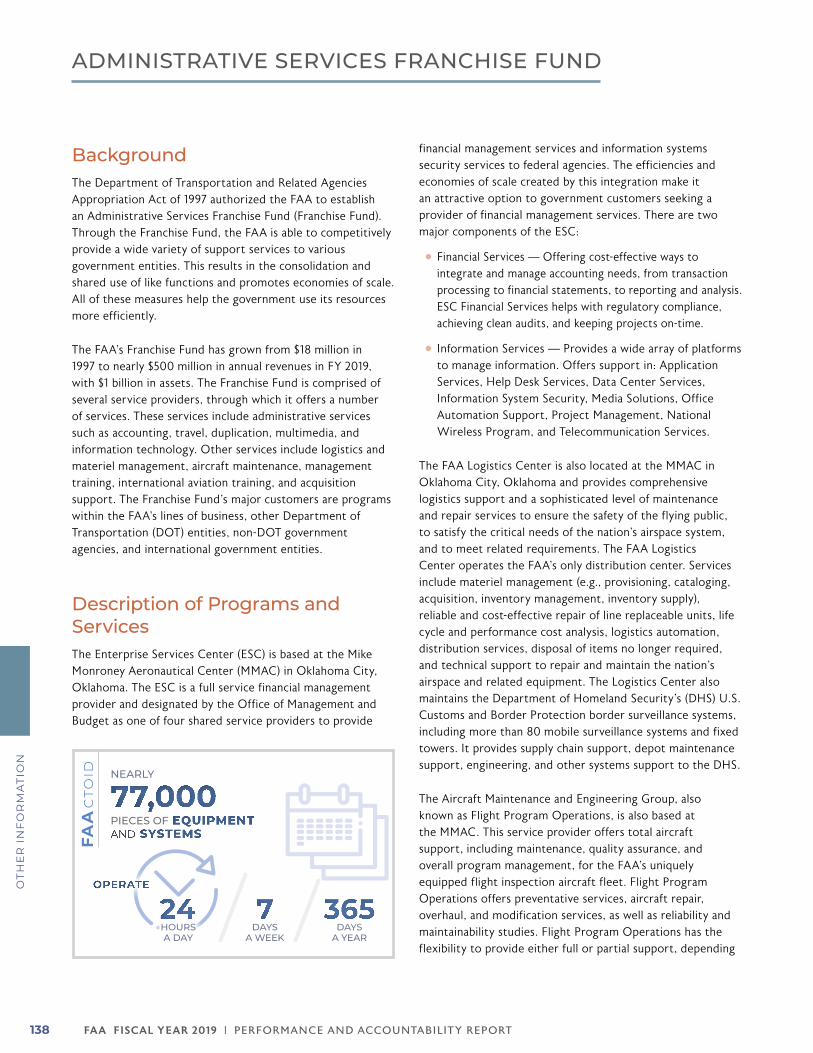
FA A FISCAL YEAR 2019 | PERFORMANCE AND ACCOUNTABILIT Y REPORT138
OT
HE
R I
NF
OR
MA
TIO
N
ADMINISTRATIVE SERVICES FRANCHISE FUND
BackgroundThe Department of Transportation and Related Agencies Appropriation Act of 1997 authorized the FAA to establish an Administrative Services Franchise Fund (Franchise Fund). Through the Franchise Fund, the FAA is able to competitively provide a wide variety of support services to various government entities. This results in the consolidation and shared use of like functions and promotes economies of scale. All of these measures help the government use its resources more efficiently.
The FAA’s Franchise Fund has grown from $18 million in 1997 to nearly $500 million in annual revenues in FY 2019, with $1 billion in assets. The Franchise Fund is comprised of several service providers, through which it offers a number of services. These services include administrative services such as accounting, travel, duplication, multimedia, and information technology. Other services include logistics and materiel management, aircraft maintenance, management training, international aviation training, and acquisition support. The Franchise Fund’s major customers are programs within the FAA’s lines of business, other Department of Transportation (DOT) entities, non-DOT government agencies, and international government entities.
Description of Programs and ServicesThe Enterprise Services Center (ESC) is based at the Mike Monroney Aeronautical Center (MMAC) in Oklahoma City, Oklahoma. The ESC is a full service financial management provider and designated by the Office of Management and Budget as one of four shared service providers to provide
financial management services and information systems security services to federal agencies. The efficiencies and economies of scale created by this integration make it an attractive option to government customers seeking a provider of financial management services. There are two major components of the ESC:
zz Financial Services — Offering cost-effective ways to integrate and manage accounting needs, from transaction processing to financial statements, to reporting and analysis. ESC Financial Services helps with regulatory compliance, achieving clean audits, and keeping projects on-time.
zz Information Services — Provides a wide array of platforms to manage information. Offers support in: Application Services, Help Desk Services, Data Center Services, Information System Security, Media Solutions, Office Automation Support, Project Management, National Wireless Program, and Telecommunication Services.
The FAA Logistics Center is also located at the MMAC in Oklahoma City, Oklahoma and provides comprehensive logistics support and a sophisticated level of maintenance and repair services to ensure the safety of the flying public, to satisfy the critical needs of the nation’s airspace system, and to meet related requirements. The FAA Logistics Center operates the FAA’s only distribution center. Services include materiel management (e.g., provisioning, cataloging, acquisition, inventory management, inventory supply), reliable and cost-effective repair of line replaceable units, life cycle and performance cost analysis, logistics automation, distribution services, disposal of items no longer required, and technical support to repair and maintain the nation’s airspace and related equipment. The Logistics Center also maintains the Department of Homeland Security’s (DHS) U.S. Customs and Border Protection border surveillance systems, including more than 80 mobile surveillance systems and fixed towers. It provides supply chain support, depot maintenance support, engineering, and other systems support to the DHS.
The Aircraft Maintenance and Engineering Group, also known as Flight Program Operations, is also based at the MMAC. This service provider offers total aircraft support, including maintenance, quality assurance, and overall program management, for the FAA’s uniquely equipped flight inspection aircraft fleet. Flight Program Operations offers preventative services, aircraft repair, overhaul, and modification services, as well as reliability and maintainability studies. Flight Program Operations has the flexibility to provide either full or partial support, depending
FAActo
id NEARLY
PIECES OF 77,000
EQUIPMENTAND SYSTEMS
DAYS A WEEK
7DAYS
A YEAR
365HOURSA DAY
24OPERATE
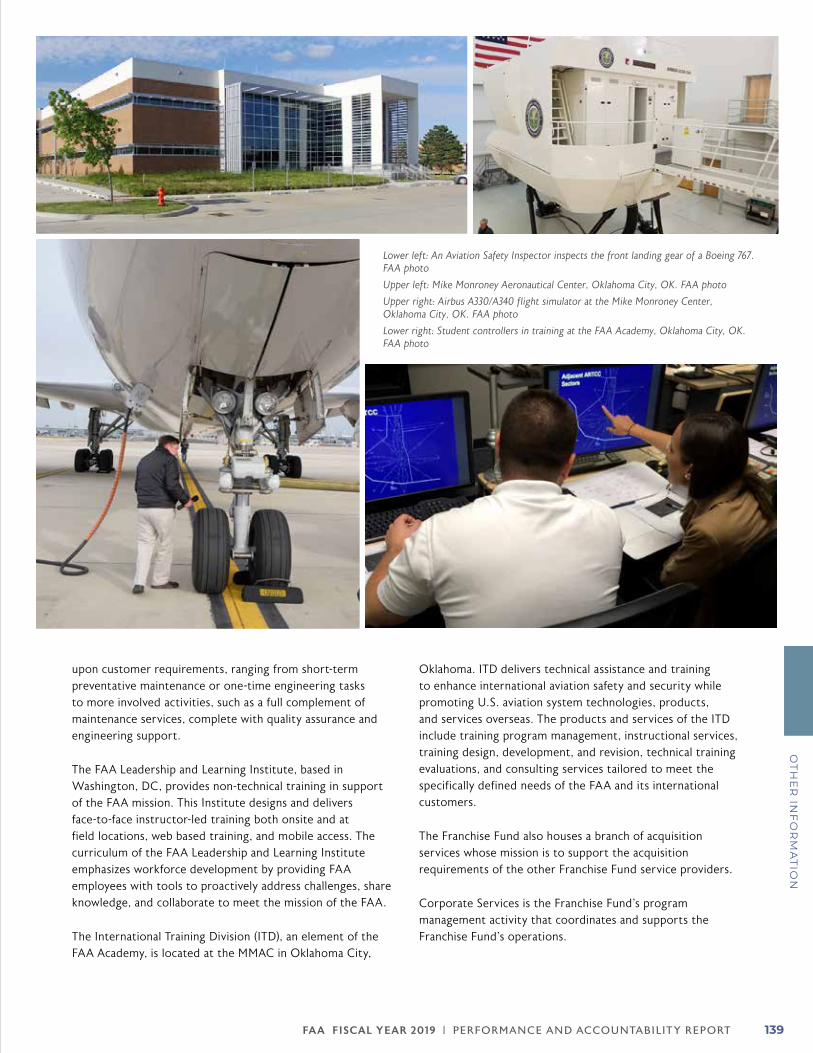
FA A FISCAL YEAR 2019 | PERFORMANCE AND ACCOUNTABILIT Y REPORT 139
OT
HE
R IN
FO
RM
AT
ION
upon customer requirements, ranging from short-term preventative maintenance or one-time engineering tasks to more involved activities, such as a full complement of maintenance services, complete with quality assurance and engineering support.
The FAA Leadership and Learning Institute, based in Washington, DC, provides non-technical training in support of the FAA mission. This Institute designs and delivers face-to-face instructor-led training both onsite and at field locations, web based training, and mobile access. The curriculum of the FAA Leadership and Learning Institute emphasizes workforce development by providing FAA employees with tools to proactively address challenges, share knowledge, and collaborate to meet the mission of the FAA.
The International Training Division (ITD), an element of the FAA Academy, is located at the MMAC in Oklahoma City,
Oklahoma. ITD delivers technical assistance and training to enhance international aviation safety and security while promoting U.S. aviation system technologies, products, and services overseas. The products and services of the ITD include training program management, instructional services, training design, development, and revision, technical training evaluations, and consulting services tailored to meet the specifically defined needs of the FAA and its international customers.
The Franchise Fund also houses a branch of acquisition services whose mission is to support the acquisition requirements of the other Franchise Fund service providers.
Corporate Services is the Franchise Fund’s program management activity that coordinates and supports the Franchise Fund’s operations.
Lower left: An Aviation Safety Inspector inspects the front landing gear of a Boeing 767. FAA photo
Upper left: Mike Monroney Aeronautical Center, Oklahoma City, OK. FAA photo
Upper right: Airbus A330/A340 flight simulator at the Mike Monroney Center, Oklahoma City, OK. FAA photo
Lower right: Student controllers in training at the FAA Academy, Oklahoma City, OK. FAA photo
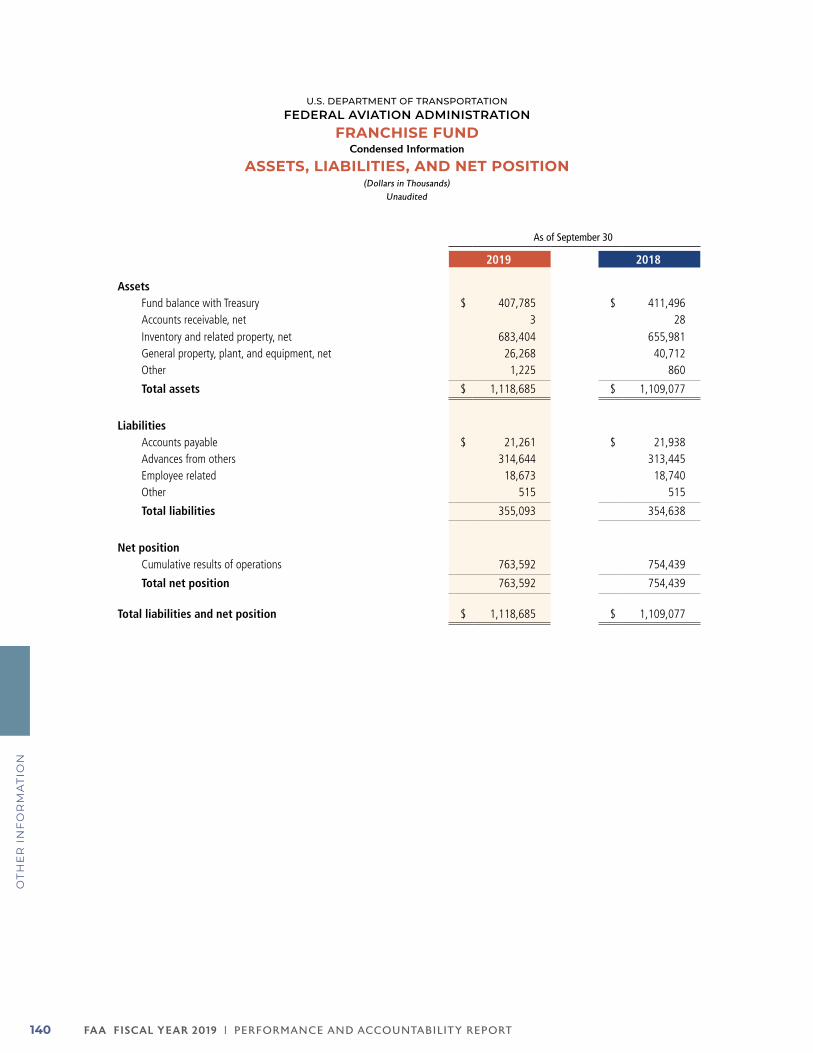
FA A FISCAL YEAR 2019 | PERFORMANCE AND ACCOUNTABILIT Y REPORT140
OT
HE
R I
NF
OR
MA
TIO
N
U.S. DEPARTMENT OF TRANSPORTATIONFEDERAL AVIATION ADMINISTRATION
FRANCHISE FUNDCondensed Information
ASSETS, LIABILITIES, AND NET POSITION(Dollars in Thousands)
Unaudited
As of September 30
2019 2018
AssetsFund balance with Treasury $ 407,785 $ 411,496 Accounts receivable, net 3 28 Inventory and related property, net 683,404 655,981 General property, plant, and equipment, net 26,268 40,712 Other 1,225 860
Total assets $ 1,118,685 $ 1,109,077
LiabilitiesAccounts payable $ 21,261 $ 21,938 Advances from others 314,644 313,445 Employee related 18,673 18,740 Other 515 515
Total liabilities 355,093 354,638
Net positionCumulative results of operations 763,592 754,439
Total net position 763,592 754,439
Total liabilities and net position $ 1,118,685 $ 1,109,077
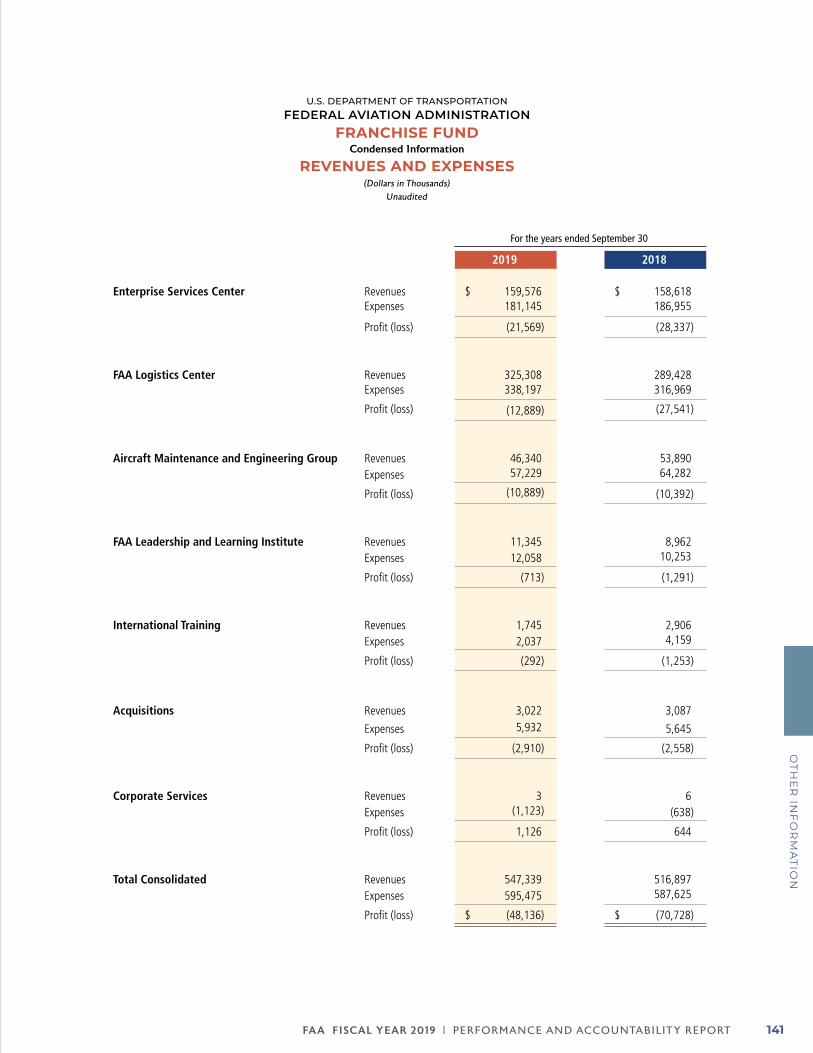
FA A FISCAL YEAR 2019 | PERFORMANCE AND ACCOUNTABILIT Y REPORT 141
OT
HE
R IN
FO
RM
AT
ION
U.S. DEPARTMENT OF TRANSPORTATIONFEDERAL AVIATION ADMINISTRATION
FRANCHISE FUNDCondensed Information
REVENUES AND EXPENSES(Dollars in Thousands)
Unaudited
For the years ended September 30
2019 2018
Enterprise Services Center Revenues $ 159,576 $ 158,618 Expenses 181,145 186,955
Profit (loss) (21,569) (28,337)
FAA Logistics Center Revenues 325,308 289,428 Expenses 338,197 316,969
Profit (loss) (12,889) (27,541)
Aircraft Maintenance and Engineering Group Revenues 46,340 53,890 Expenses 57,229 64,282
Profit (loss) (10,889) (10,392)
FAA Leadership and Learning Institute Revenues 11,345 8,962 Expenses 12,058 10,253
Profit (loss) (713) (1,291)
International Training Revenues 1,745 2,906 Expenses 2,037 4,159
Profit (loss) (292) (1,253)
Acquisitions Revenues 3,022 3,087
Expenses 5,932 5,645
Profit (loss) (2,910) (2,558)
Corporate Services Revenues 3 6 Expenses (1,123) (638)
Profit (loss) 1,126 644
Total Consolidated Revenues 547,339 516,897 Expenses 595,475 587,625
Profit (loss) $ (48,136) $ (70,728)
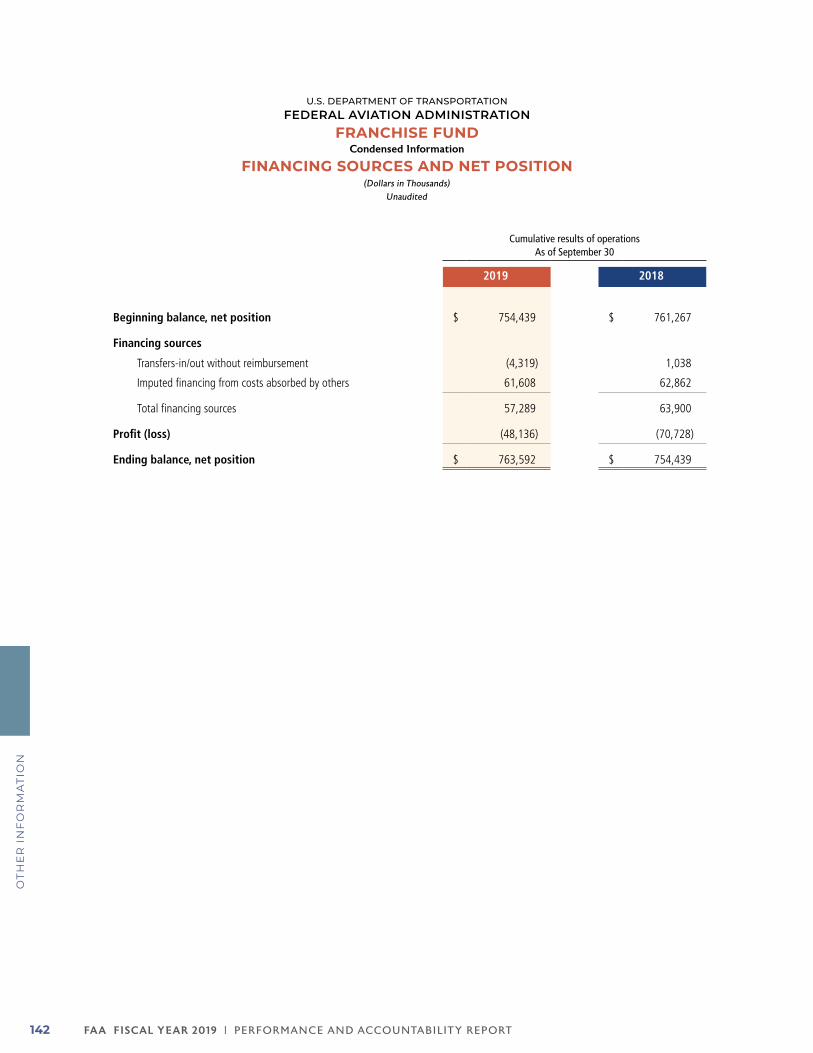
FA A FISCAL YEAR 2019 | PERFORMANCE AND ACCOUNTABILIT Y REPORT142
OT
HE
R I
NF
OR
MA
TIO
N
U.S. DEPARTMENT OF TRANSPORTATIONFEDERAL AVIATION ADMINISTRATION
FRANCHISE FUNDCondensed Information
FINANCING SOURCES AND NET POSITION(Dollars in Thousands)
Unaudited
Cumulative results of operations As of September 30
2019 2018
Beginning balance, net position $ 754,439 $ 761,267
Financing sources
Transfers-in/out without reimbursement (4,319) 1,038
Imputed financing from costs absorbed by others 61,608 62,862
Total financing sources 57,289 63,900
Profit (loss) (48,136) (70,728)
Ending balance, net position $ 763,592 $ 754,439
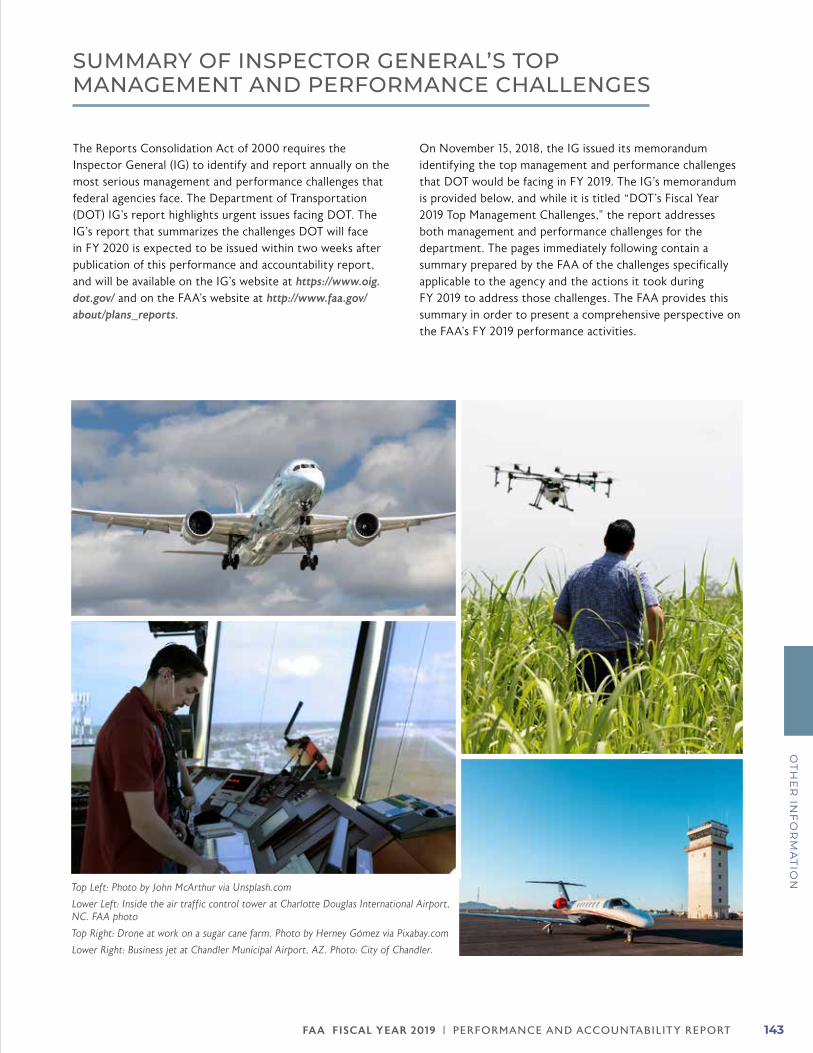
FA A FISCAL YEAR 2019 | PERFORMANCE AND ACCOUNTABILIT Y REPORT 143
OT
HE
R IN
FO
RM
AT
ION
SUMMARY OF INSPECTOR GENERAL’S TOP MANAGEMENT AND PERFORMANCE CHALLENGES
The Reports Consolidation Act of 2000 requires the Inspector General (IG) to identify and report annually on the most serious management and performance challenges that federal agencies face. The Department of Transportation (DOT) IG’s report highlights urgent issues facing DOT. The IG’s report that summarizes the challenges DOT will face in FY 2020 is expected to be issued within two weeks after publication of this performance and accountability report, and will be available on the IG’s website at https://www.oig.dot.gov/ and on the FAA’s website at http://www.faa.gov/about/plans_reports.
On November 15, 2018, the IG issued its memorandum identifying the top management and performance challenges that DOT would be facing in FY 2019. The IG’s memorandum is provided below, and while it is titled “DOT’s Fiscal Year 2019 Top Management Challenges,” the report addresses both management and performance challenges for the department. The pages immediately following contain a summary prepared by the FAA of the challenges specifically applicable to the agency and the actions it took during FY 2019 to address those challenges. The FAA provides this summary in order to present a comprehensive perspective on the FAA’s FY 2019 performance activities.
Top Left: Photo by John McArthur via Unsplash.com
Lower Left: Inside the air traffic control tower at Charlotte Douglas International Airport, NC. FAA photo
Top Right: Drone at work on a sugar cane farm. Photo by Herney Gómez via Pixabay.com
Lower Right: Business jet at Chandler Municipal Airport, AZ. Photo: City of Chandler.
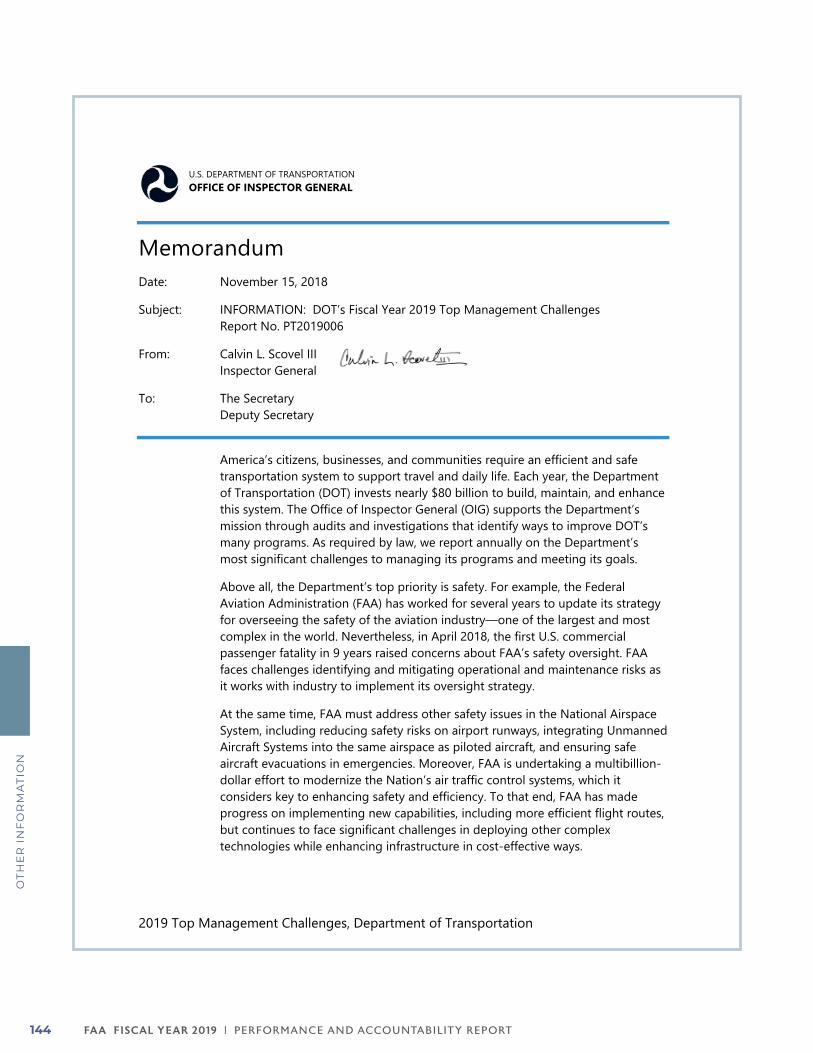
FA A FISCAL YEAR 2019 | PERFORMANCE AND ACCOUNTABILIT Y REPORT144
OT
HE
R I
NF
OR
MA
TIO
N
2019 Top Management Challenges, Department of Transportation
Memorandum Date: November 15, 2018
Subject: INFORMATION: DOT’s Fiscal Year 2019 Top Management Challenges Report No. PT2019006
From: Calvin L. Scovel III Inspector General
To: The Secretary Deputy Secretary
America’s citizens, businesses, and communities require an efficient and safe transportation system to support travel and daily life. Each year, the Department of Transportation (DOT) invests nearly $80 billion to build, maintain, and enhance this system. The Office of Inspector General (OIG) supports the Department’s mission through audits and investigations that identify ways to improve DOT’s many programs. As required by law, we report annually on the Department’s most significant challenges to managing its programs and meeting its goals.
Above all, the Department’s top priority is safety. For example, the Federal Aviation Administration (FAA) has worked for several years to update its strategy for overseeing the safety of the aviation industry—one of the largest and most complex in the world. Nevertheless, in April 2018, the first U.S. commercial passenger fatality in 9 years raised concerns about FAA’s safety oversight. FAA faces challenges identifying and mitigating operational and maintenance risks as it works with industry to implement its oversight strategy.
At the same time, FAA must address other safety issues in the National Airspace System, including reducing safety risks on airport runways, integrating Unmanned Aircraft Systems into the same airspace as piloted aircraft, and ensuring safe aircraft evacuations in emergencies. Moreover, FAA is undertaking a multibillion-dollar effort to modernize the Nation’s air traffic control systems, which it considers key to enhancing safety and efficiency. To that end, FAA has made progress on implementing new capabilities, including more efficient flight routes, but continues to face significant challenges in deploying other complex technologies while enhancing infrastructure in cost-effective ways.
U.S. DEPARTMENT OF TRANSPORTATION OFFICE OF INSPECTOR GENERAL
FA A FISCAL YEAR 2019 | PERFORMANCE AND ACCOUNTABILIT Y REPORT 145
OT
HE
R IN
FO
RM
AT
ION
2019 Top Management Challenges, Department of Transportation
Meeting the Department’s safety mission also requires dedicating significant focus to safety risks within our rail systems and highways. Due to several passenger rail incidents during the last 10 years, Congress required and the U.S. rail industry committed to implementing positive train control (PTC) systems. These systems use advanced train control technology to prevent collisions, overspeed derailments, and other incidents. With a statutory deadline for PTC implementation rapidly approaching in December 2018 and billions of dollars in Federal funding and loans dedicated for PTC systems, it is critical that the Department maintain focus on this complex safety challenge.
In addition, over 40,000 people lost their lives each year in motor vehicle crashes in 2016 and 2017. While most crashes involved impaired driving, speeding, or a lack of seatbelts, some were caused by vehicle defects. Over the past several years, we have made recommendations to help the National Highway Traffic Safety Administration’s (NHTSA) Office of Defects Investigation (ODI) strengthen how it investigates possible vehicle defects and oversees recalls. Follow-through by NHTSA remains critical to address these highway safety risks.
While working to enhance transportation safety, the Department must also safeguard its considerable financial investments, resources, and assets. For example, DOT provides over $50 billion a year to build, repair, maintain, and oversee millions of miles of roads, bridges, tunnels, tracks, and oil and gas pipelines across the Nation. However, infrastructure needs currently outpace departmental resources. As a result, the Department faces challenges in efficiently using these resources while targeting inspections and enforcement actions to the greatest safety risks.
DOT’s assets also include over 450 information technology systems, which it relies on to meet critical mission needs. The Department’s cybersecurity program must protect these systems from increasingly sophisticated cyber attacks. Our work has shown that the Department remains challenged to standardize its processes, increase network visibility, and resolve longstanding weaknesses to reduce its vulnerability to cyber threats.
Finally, the Department must work diligently to fulfill its stewardship responsibilities when awarding billions in contracts and grants each year. To efficiently meet its research and procurement goals, DOT uses innovative acquisition approaches, timesaving multiple-award vehicles, and partnerships with industry and State and local governments. While innovation can deliver benefits, DOT must exercise strong oversight to achieve desired program outcomes; safeguard taxpayer dollars from fraud, waste, and abuse; and mitigate risks.
We considered several criteria to identify the Department’s top management challenges for fiscal year 2019, including safety impact, documented
FA A FISCAL YEAR 2019 | PERFORMANCE AND ACCOUNTABILIT Y REPORT146
OT
HE
R I
NF
OR
MA
TIO
N
2019 Top Management Challenges, Department of Transportation
vulnerabilities, large dollar implications, and the Department’s ability to effect change. In the enclosed report, we identify and discuss the following challenges:
• Effectively implementing FAA’s new safety oversight strategy
• Protecting against a wide range of threats to aviation safety and security
• Maintaining focus on the railroad industry’s implementation of positive traincontrol
• Improving NHTSA’s data use, processes, and oversight of vehicle safetydefects
• Providing effective stewardship over surface infrastructure safety andinvestments
• Modernizing the National Airspace System while introducing new capabilitiesand making sound investment decisions
• Systematizing cybersecurity strategies to deter surging cyber threats
• Harnessing innovative procurement and financing practices while maintainingoversight of acquisitions, grants, and assets
As always, we will continue to work closely with DOT officials to support the Department’s efforts to improve safety, enhance efficiency, and protect resources. We appreciate the Department’s commitment to prompt action in response to the challenges we have identified. The final report and the Department’s response will be included in DOT’s Annual Financial Report, as required by law.
If you have any questions regarding this report, please contact me at (202) 366-1959. You may also contact Joseph W. Comé, Principal Assistant Inspector General for Auditing and Evaluation, at (202) 366-1427.
#
cc: DOT Audit Liaison, M-1
FA A FISCAL YEAR 2019 | PERFORMANCE AND ACCOUNTABILIT Y REPORT 147
OT
HE
R IN
FO
RM
AT
ION
Of the 25 key challenges identified by the Inspector General for FY 2019, DOT tasked the FAA with addressing the following 15 challenges:
zz Implementing effective air carrier oversight by proactively identifying and mitigating significant operational and maintenance safety risks
zz Balancing collaboration and enforcement in air carrier safety oversight
zz Addressing runway safety risks
zz Safely evacuating airline passengers in the event of an aircraft incident
zz Strengthening oversight of Unmanned Aircraft Systems in the national airspace system
zz Enhancing interagency coordination to improve cockpit security
zz Ensuring effective oversight of FAA’s drug and alcohol testing program
zz Addressing barriers to implementation of new flight routes
zz Providing new capabilities to airspace users while modernizing systems
zz Replacing existing radar with a new system financed by the auction of electromagnetic spectrum
zz Strengthening management oversight of developmental funding for air traffic management
zz Resolving longstanding security weaknesses to strengthen information technology infrastructure
zz Implementing congressionally mandated aviation cybersecurity initiatives
zz Implementing innovative and streamlined acquisition practices while managing risk
zz Strengthening agency oversight of DOT assets, contracts, and grants
After the Inspector General’s report was issued, the FAA developed an “Action Plan” that listed actions and timelines for addressing each of the challenges. The FAA then developed an “Actions Taken” report that describes the progress the FAA made throughout FY 2019 in addressing each of the challenges. These Actions Taken reports, initial Action Plans, and the Inspector General’s comprehensive report identifying top management challenges for FY 2019 are posted on FAA’s website at http://www.faa.gov/about/plans_reports/ under the DOT IG Top Management Challenges section.
Implementing effective air carrier oversight by proactively identifying and mitigating significant operational and maintenance safety risks
Why this is a challengeThe effectiveness of FAA’s risk-based oversight system depends on safety data to enable the agency to identify and target its oversight to areas of greatest risk. The FAA’s safety oversight strategy relies on a strong safety culture within the agency and industry. To supplement industry’s wide array of safety reporting systems, the FAA established a hotline in 2014 for stakeholders to submit safety concerns, in addition to allowing various FAA offices to receive complaints. The FAA recognizes the impact a single inspector can have on the safety culture and established standards that require inspectors to act impartially and avoid the appearance of preferential treatment when they perform their official duties. Ensuring that FAA’s inspector workforce meets standards of impartiality remains a key oversight challenge for the agency to protect its safety culture, and effectively identify and mitigate risks.
Progress in meeting the challengezz The FAA conducted an independent review of the oversight of American Airlines’ flight operations to determine whether controls are in place and effective in preventing single points of failure.
zz The FAA developed and implemented controls requiring oversight office staff to resolve complaints and follow key policy requirements.
zz The FAA conducted an independent review at the American Airlines Certificate Management Office (CMO) in Irving, Texas that focused on ten specific areas of assessment. Of these ten areas, eight were satisfactory and two had findings of minor revisions needed to the Office Procedures Manual, which were processed in the Flight Standards Quality Management System (QMS).
zz The FAA conducted numerous audits and assessments to evaluate air carrier oversight, including:
zz Four assessments of the FAA’s American Airlines CMO Operations unit;
z| American Airlines Flight Test Program viability through the Safety Assurance System Comprehensive Assessment Plan and normal surveillance assigned;

FA A FISCAL YEAR 2019 | PERFORMANCE AND ACCOUNTABILIT Y REPORT148
OT
HE
R I
NF
OR
MA
TIO
N
z| The QMS process review and records to ensure continuous improvement;
z| Follow-up actions on Risk Management Processes to mitigate risks identified with American Airlines Flight Operations Programs; and
z| Analysis Assessment and Action Oversight. All areas were found satisfactory, and with no single points of failure.
zz The FAA initiated a review and independent assessment of the policies and procedures for its Certificate Management Data Evaluation Program (CMDEP) to update and implement improved mechanisms to evaluate the objectivity of inspectors by incorporating risk factors such as non-routine operations and the length of time inspectors oversee the same air carrier.
zz In March 2019, the FAA initiated process improvements to ensure safety complaints are routed to FAA’s Office of Audit and Evaluation (AAE). These included:
z| Revision of Order 8900.1 guidance pertaining to complaints received directly by FAA personnel concerning other FAA personnel.
z| Identified deficiencies in the Flight Standards Administrative Manual (FSAM) process for intake; and determination of cases requiring Management Inquiries, Security Investigations or AAE coordination, and coordinated draft changes.
z| Conducted meetings to explore possible needed changes in guidance regarding in-person safety complaints received by FAA Flight Standards employees.
z| Reviewed current complaint investigation guidance for duplication, and conducted a gap analysis (the gap between the current state of a safety management system and the desired state).
z| Consolidated FAA’s complaint investigation policy and procedures to enable consistent and efficient execution of complaint investigations and to coordinate with AAE.
z| Identified the Safety Risk Management Division of the Flight Standards Service as the focal point to manage and control all changes and submissions to complaint investigations guidance.
z| Revised and drafted Order 8900.1 complaint investigation guidance to de-conflict with FSAM safety hotline guidance and meet the organizational intent of consistency and efficiency in complaint investigations and coordination with AAE.
z| Created a Job Aid to ensure data quality in complaint reporting and incorporated it by reference in the draft Order 8900.1 guidance to enable data analysis to identify complaints requiring AAE routing and coordination.
What needs to be donezz The FAA is following up on the results of the independent audit by processing two Non Conformity and Corrective Actions (NCA-19-0454 and NCA-19-0459). Both of these corrective actions are in “Disposition Correction” phase and are expected to be completed in early FY 2020.
zz On CMDEP, the FAA is working to determine a method to account for significant discontinuity in Aviation Safety Inspector (ASI) certificate assignments and Front Line Manager (FLM) positions, to identify total times assigned to certificates. The team will review Safety Assurance System automation guidelines to identify relevant details for data validation. Once that is accomplished, the team will also review direct office inquiries to determine FLM to ASI ratio validity and accuracy.
zz The FAA will validate the Flight Standards interpretation of the “Special Program” used to identify the American Airlines flight test program. This includes an authorization via local Memorandum of Understanding or other local arrangement that allows the certificate holder to perform any functions not normally supported by their certification; or tracked as part of the normal oversight process; or any arrangements that grant relief from FAA requirements that have not been published in the Flight Standards Information Management System.
zz The FAA will create a process for evaluating the suitability and adequacy of the Special Programs approval to ensure that American Airlines flight test program, and other such programs, are captured in Flight Standards oversight and CMDEP analysis.
zz The FAA will coordinate publishing the changes in guidance in accordance with the Document Control Board and QMS Document Control Procedures, and implement and manage the changes to the guidance upon release.

FA A FISCAL YEAR 2019 | PERFORMANCE AND ACCOUNTABILIT Y REPORT 149
OT
HE
R IN
FO
RM
AT
ION
Balancing collaboration and enforcement in air carrier safety oversight
Why this is a challengeFAA’s Compliance Program emphasizes the agency’s preference for collaborating with air carriers through education and training over penalizing carriers to address discrepancies. This program calls for FAA to work with air carriers to address the root causes of violations of safety regulations rather than imposing enforcement actions — a change in the way FAA and the airlines previously addressed compliance and safety issues. A key challenge the agency faces is striking a balance between collaboration and enforcement and accurately assessing whether an air carrier is willing and able to correct its deficiencies.
Progress in meeting the challengezz The FAA has provided guidance concerning this challenge in several published documents:
z| FAA Order 8000.373A, Paragraph 4, which provides an overview of the Compliance Program.
z| FAA Order 2150.3C, Chapter 5, which describes the “Responsibilities of Program Offices When Selecting Among Compliance, Administrative, and Legal Enforcement Actions”.
z| Order 8900.1, Volume 14, Chapter 1, Section 1, Paragraph 14-1-1-7 which provides guidance to FAA personnel on addressing safety deviations (including specific instances when enforcement is required).
z| Order 8900.1, Volume 14, Chapter 1, Section 1, Paragraph 14-1-1-11 which provides guidance to FAA personnel on expectations when investigating a safety deviation.
z| Order 8900.1, Volume 14, Chapter 1, Section 2, which provides FAA personnel a process to determine if a compliance action (i.e., non-enforcement response to a deviation) is appropriate.
zz The FAA provides training to newly hired Flight Standards personnel (who are responsible for investigative duties) through the following courses:
z| FAA 27100253, Compliance Philosophy Supplemental Briefing. This briefing provides foundational information on the Compliance Program and includes a video from the former Executive Director of the Flight Standards Service. The video focuses on the underlying precursors of deviations, and the willingness and ability of the subject of the investigation to correct the problem,
when determining action. The video also stresses interdependence and critical thinking when determining the FAA’s responses to a safety deviation.
z| FAA 27100259, Safety and Compliance Course, which provides newly hired Flight Standards personnel (who are responsible for investigative duties) information on FAA’s creation of a culture of self-disclosure of errors and notes that there is a difference between unsafe acts that can be effectively addressed through the use of compliance tools and unacceptable behavior that requires the use of enforcement action. This course also reinforces the need for an individual to be both willing and able to cooperate in order to have a regulatory deviation resolved with a compliance action.
z| FAA 21000136, Safety and Compliance Practical Application Workshop, which offers multiple compliance-related exercises. These exercises educate and provide practice for the participants on investigative procedures and determining which actions, in response to a deviation, are appropriate.
z| FAA 21000148, Enforcement Procedures Course, which provides further training on when enforcement action is necessary and required.
zz The Flight Standards Compliance Program Focus Team has conducted site visits to over 60 Safety Assurance offices (i.e., Flight Standards District Offices and Certificate Management Offices) to provide briefings on the Compliance Program; and continues to provide ongoing support to these offices.
What needs to be donezz The FAA continues to collect and develop measures, and seeks feedback from the workforce, to inform any needed changes or additions to the guidance, training, and messaging described above. This includes ongoing Safety Assurance office site visits by the Compliance Program Focus Team.
zz In FY 2020, the FAA will initiate a comprehensive revision to the Safety and Compliance courses, and the Enforcement Procedures course. The updated training material will incorporate collected feedback to aid in balancing the appropriate response from the FAA.
zz In FY 2020, the FAA will initiate development of a Recurrent Safety and Compliance course that is to be required for all personnel with investigative duties and responsibilities.
FA A FISCAL YEAR 2019 | PERFORMANCE AND ACCOUNTABILIT Y REPORT150
OT
HE
R I
NF
OR
MA
TIO
N
Addressing runway safety risks
Why this is a challengeReducing the risks of surface safety events remains one of the FAA’s highest priorities. The Office of the Inspector General for the Department of Transportation identified runway safety risks as a management challenge after observing that reports of runway incursions had increased between FY 2011 and FY 2017. The Inspector General further stated that, while the data indicates the rate of serious runway incursions is low, some incidents had occurred in which two aircraft came within “a few feet of colliding with each other, posing significant safety risks.” These observations, combined with the ever-changing and complex nature of air travel and recent increases in the congestion of airspace, call for increased vigilance with regard to runway safety.
Progress in meeting the challengezz During FY 2019, the FAA completed an analysis of surface safety events and identified causal factors that mitigate risks associated with surface operations. This analysis resulted in improved metrics for surface safety, which enabled more comprehensive assessments of runway safety events. The FAA anticipates these metrics will facilitate the tracking of trends and results.
zz The FAA also enabled the Airport Surface Detection Equipment, Model X (ASDE-X) Taxiway Arrival Prediction enhancement at 13 airports. The ASDE-X surveillance system uses a variety of technologies to allow air traffic controllers to track surface movement of aircraft and vehicles. Controllers at ASDE-X equipped airports have access to depictions of aircraft and vehicles in airport movement areas and can discern aircraft flying on final approach to those airports. The Taxiway Arrival Prediction capability provides air traffic controllers with alerts when aircraft mistakenly line up on a taxiway rather than a runway. As a result of these new capabilities, the FAA is confident its use of ASDE-X will improve overall runway safety.
zz The FAA took action to further its Runway Incursion Mitigation (RIM) program at five airports. The FAA identified these airports based on the existence of certain safety concerns and the airports’ non-conformance with FAA standards. As a result of the redesign of these airports under the RIM program, the FAA has reduced the likelihood that a runway safety event will occur. The FAA has completed the planning and design phase for 10 additional locations that plan to participate in the program.
zz The FAA also implemented the Airport Surface Surveillance Capability (ASSC) at Pittsburgh, New Orleans, Kansas City, and Cincinnati. The ASSC is a runway-safety tool that displays aircraft and ground vehicles on an airport surface, as well as aircraft on approach and departure paths within close proximity to the airport.
zz In addition, the FAA completed upgrades to the Standard Terminal Automation Replacement System (STARS) in certain facilities. STARS provides controllers with a complete, precise picture of the airspace. The STARS Approach Runway Verification (ARV) modification is a software enhancement that monitors for wrong surface landings (taxiways, wrong runways, and closed runways), wrong airport and wrong direction approaches, and provides audio and visual alerts to controllers.
What needs to be donezz The FAA prepared FAA Order 7050.1B Change 1 that adds a Chapter 5 to the Runway Safety Program, and anticipates publishing the revised order in FY 2020. This new chapter defines the roles and responsibilities of the Runway Selection Safety Team (RSST). The primary purpose of the RSST is to develop and document in the Runway Selection Plan criteria for local runway operations and the process of assessing and determining the airport’s active runway configurations. The Runway Selection Plan will be unique to every airport and provides direction and guidance for conducting RSST meetings.
zz The FAA is prepared to conduct a shadow operations evaluation of real time speech recognition technology in FY 2020, barring any unforeseen delays related to technological updates.
zz The FAA will continue the development and modifications of the STARS ARV and commence key site testing in FY 2020. Wrong surface landing alerts are currently available only at the 35 ASDE-X and 8 ASSC equipped airports. STARS ARV has the potential to bring this capability to hundreds of additional airports. The Runway Safety Group is collaborating with the STARS ARV team by providing wrong surface landing data, lessons learned from ASDE-X Taxiway Arrival Prediction capability deployment, and key site selection qualities.
zz The implementation of ASDE-X Taxiway Arrival Prediction at additional sites is scheduled to continue over the next 18 months.
FA A FISCAL YEAR 2019 | PERFORMANCE AND ACCOUNTABILIT Y REPORT 151
OT
HE
R IN
FO
RM
AT
ION
Safely evacuating airline passengers in the event of an aircraft incident
Why this is a challengeThe effective evacuation of a civil aircraft is a critical component of saving lives in the event of an incident. The FAA’s standards for evacuating passenger aircraft require that the aircraft can be fully evacuated in 90 seconds or less. To obtain FAA certification for a specific aircraft type, manufacturers must conduct an actual demonstration of an emergency evacuation or a combination of tests and analyses, including computer simulations that yield equivalent results.
The Office of the Inspector General is currently auditing the FAA on this subject (refer to Audit #18A3006A000, “FAA’s Oversight of Aircraft Evacuation Procedures”) and has not issued any report. The specific challenges associated with this task have therefore yet to be determined.
Progress in meeting the challengezz The Inspector General is currently auditing the FAA on this subject. The FAA has supported the ongoing audit (refer to Audit #18A3006A000, “FAA’s Oversight of Aircraft Evacuation Procedures”) and will respond to the recommendations in the report.
zz The FAA has formed an Aviation Rulemaking Committee to assess the existing regulatory requirements related to evacuation against the recent service history involving emergency evacuations.
zz The FAA has developed research plans to assess aircraft exit types, location, and access over the next three years. This work will likely lead to additional guidance to address innovative configurations being developed.
What needs to be donezz The FAA will produce action plans to respond to the recommendations in the Inspector General’s report.
zz The FAA will conduct an extensive research program to assess whether there is any negative impact on evacuation due to variations in seat pitch and width. The program is scheduled to be concluded in December 2019.
zz The Aviation Rulemaking Committee will write a report and identify whether there appear to be changes to the requirements needed. The report is expected in early 2020.
Strengthening oversight of Unmanned Aircraft Systems in the national airspace system
Why this is a challengeThe growing number of UAS operators presents significant oversight and risk mitigation challenges for FAA. The FAA needs to determine the risk posed by current UAS operations and develop appropriate oversight plans to address these risks.
Progress in meeting the challengezz The FAA developed and issued the Extended UAS Oversight Plan (Notice 8900.504) on February 28, 2019. This oversight plan takes a risk-based approach to enhancing the surveillance of UAS activities in the national airspace.
zz The FAA completed its Semi-Annual Assessment of UAS Data in August 2019. The assessment:
z| Verified desired effects of increased surveillance activities, identification of alleged non-compliant UAS operators, and corrective actions for non-compliant operations since implementation of the Oversight Plan.
z| Identified adjustments needed to the Oversight Plan and for the development of solutions which resulted in the following recommendations:
� Make strategic adjustments using risk-based decision-making to achieve desired metrics and quality surveillance opportunities for mitigating the risks from UAS.
� Define current and future UAS-specific educational needs for inspectors.
� Use existing and new UAS data or information to evaluate oversight activities, and develop a mechanism to capture that data.
zz The FAA issued Order 1800.56T, National Flight Standards Work Program Guidelines. This version of the Order updates previous guidance regarding work activities and identifies specific work functions that personnel in the FAA’s Flight Standards service must accomplish. It also incorporated the findings of the semi-annual UAS assessment, adding new surveillance requirements for UAS, guidance on collecting and identifying key UAS data for identifying the risks UAS pose to the airspace system, and direction for how to mitigate risks through a risk-based decision-making oversight plan. By doing so, the revised Work Program Guidelines replace the previously issued UAS Oversight Plan.
FA A FISCAL YEAR 2019 | PERFORMANCE AND ACCOUNTABILIT Y REPORT152
OT
HE
R I
NF
OR
MA
TIO
N
What needs to be donezz The FAA is reviewing the recommendations resulting from the Semi-Annual Assessment of UAS Data.
zz Applicable FAA guidance documents will be revised upon leadership approval.
Enhancing interagency coordination to improve cockpit security
Why this is a challengeIncidents in recent years in the United States and abroad drew attention to flight deck safety and security, including securing cockpit doors. Although the FAA has taken dramatic steps to secure the flight deck and prevent any breaches, we continue to look for collaboration opportunities that could enhance cockpit safety and security. Enhanced communication with key industry stakeholders and the Transportation Security Administration will be critical to FAA’s efforts to ensure the safety and security of flight crews and the traveling public.
Progress in meeting the challengezz The FAA’s Flight Standards Service policies and procedures have resulted in no breach of a flight deck door since 9/11.
zz The FAA continued to implement a 2018 Order that requires Principal Inspectors to meet with Transportation Security Agency Principle Security Inspectors at least once a year to ensure enhanced interagency communication and coordination.
zz The FAA continued to emphasize observing flight deck door transition procedures while conducting en route inspections.
zz Flight Standards added two questions to its Safety Assurance System En Route Inspection Data Collection Tool regarding this topic. These questions will prompt FAA inspectors to document observations regarding the flight deck door procedures while in flight.
What needs to be donezz The FAA will comply with section 336 of the FAA Reauthorization Act of 2018. This provision directs the FAA to issue an Order requiring installation of secondary cockpit barriers on all new passenger aircraft operating under the provisions of 14 CFR Part 121.
Ensuring effective oversight of FAA’s drug and alcohol testing program
Why this is a challengeEffective drug and alcohol testing programs in the transportation industry are crucial to ensuring the safety of the traveling public. The National Transportation Safety Board recently highlighted this challenge to safety in its 2017–2018 Most Wanted List of Transportation Safety Improvements. The report stated that marijuana decriminalization, increased popularity of dangerous synthetic drugs, and a significant rise in the use and abuse of over-the-counter and prescription medication, along with alcohol, have led to an epidemic of impairment in transportation safety. In addition, recent Office of Inspector General investigations have reinforced the importance of maintaining strong substance abuse inspection programs.
The FAA’s Drug Abatement Division oversees the aviation industry’s compliance with drug and alcohol testing laws and regulations that cover pilots, mechanics, and flight dispatchers at approximately 7,000 regulated aviation companies. Given the changing landscape of drug use in the United States, developing a risk-based inspection schedule to maximize the agency’s resources will remain key to mitigating the safety risks presented by impaired pilots, mechanics, and other safety-responsible staff.
Progress in meeting the challengezz The Office of the Inspector General completed its audit of FAA’s Drug Abatement Inspection Program and issued its findings on June 25, 2019 (Report #AV-2019-055, “FAA Needs To Adopt a Risk-Based, Data-Driven Scheduling Process To Improve the Effectiveness of Its Drug Abatement Inspection Program”). The FAA concurred with both of the report’s recommendations and began work on their implementation.
zz The FAA’s Office of Aerospace Medicine has been coordinating with FAA’s Flight Standards Service and other aviation safety offices to enhance FAA’s Drug Abatement Inspection Program. These efforts include:
z| Gathered information on additional risk factors available for inclusion by FAA’s Drug Abatement Inspection Program;
z| Continued to develop a common risk-profiling methodology, and adopted structured, national-level profiles to identify and analyze emerging trends that affect safety;
FA A FISCAL YEAR 2019 | PERFORMANCE AND ACCOUNTABILIT Y REPORT 153
OT
HE
R IN
FO
RM
AT
ION
z| Defined parameters for measuring risk in our Strategic Compliance Monitoring Plan (SCMP);
z| Continued to develop a tool to help define information for statistical analysis such as baseline numbers, confidence levels, a calculated inspection sample, and a target error rate, which will provide a method to validate the SCMP goals for inspection scheduling. This initiative will provide scheduling and inspector personnel with enhanced tools to identify, analyze and document risk when planning and conducting surveillance;
z| Developed an initial plan for determining high, medium and low risk of non-compliance which will be used with the Aerospace Medicine Safety Information System (AMSIS) program, to allow for an automated scheduling process based on the risk analysis. The Drug Abatement Division implemented and continues to utilize a temporary method for risk analysis until AMSIS is deployed; and
z| Revamped several reports to measure risk and performance to be displayed on the Division’s dashboard and in quarterly program management meetings.
zz In November 2018, the FAA’s Associate Administrator for Aviation Safety directed the Office of Aerospace Medicine’s Drug Abatement Division and Flight Standards organization to explore the benefits of integrating oversight surveillance of the industry drug and alcohol testing program into a larger workforce. To evaluate the benefits, the Drug Abatement Division and North Texas Flight Standards District Office initiated a beta test concept to conduct surveillance of small repair station operators in the North Texas area.
z| In July 2019, Drug Abatement Division personnel provided a briefing to the North Texas Aviation Safety Inspectors (ASIs) to explain the program and benefits of the beta test.
z| Throughout August 2019, the ASIs conducted their on-site surveillance using a checklist and document collection list. The documents collected by the ASIs were provided to the Drug Abatement Division.
z| The Drug Abatement Division is currently reviewing these documents to identify possible noncompliance and determine appropriate action.
What needs to be donezz Distribute the updated Strategic Compliance Monitoring Plan for FY 2020 in early October 2019.
zz Train Drug Abatement Division representative in Change Management in October 2019, to enhance effectiveness as we develop and implement process and organizational changes. This will enhance our ability to help employees through the transition from the current state to the future state.
zz By March 2020, complete the beta test document review and initiate appropriate action for non-compliance items discovered. Provide a final report to the Associate Administrator for Aviation Safety.
zz Continue to provide training to Drug Abatement staff on changing policies, methodologies, and systems, including:
z| Root Cause and Risk Model (September 2020)
z| New Inspector (December 2019)
z| Recurrent Training/High Impact (September 2020)
z| AMSIS Training (upon AMSIS deployment)
zz Implement the two recommendations from Inspector General Report #AV-2019-055 by December 31, 2020:
z| Develop and implement a data-driven, risk-based inspection scheduling program in accordance with FAA’s Safety Risk Management Policy.
z| Develop and implement a process to coordinate and verify the accuracy of aviation company data, including coordinating with FAA Flight Standards, prior to finalizing the inspection schedule.
zz Deploy AMSIS by September 2021.
Addressing barriers to implementation of new flight routes
Why this is a challengeAdvancing Performance-Based Navigation (PBN) is a top investment priority for both the FAA and industry. PBN flight procedures will provide flight paths that are more direct than paths previously used, enhance capacity for traffic in the airspace, improve on-time airport arrival rates, and reduce aircraft emissions and fuel burn. While PBN promises great benefits for aviation, implementation must be done without disrupting air traffic flow and with input from local communities that will be impacted by the changes.
Progress in meeting the challengeIn FY 2019, the FAA improved regional traffic movement through the PBN NextGen Integration Working Group
FA A FISCAL YEAR 2019 | PERFORMANCE AND ACCOUNTABILIT Y REPORT154
OT
HE
R I
NF
OR
MA
TIO
N
and the Northeast Corridor by completing the following activities:
zz Completed seven of the 11 Metroplex PBN projects. Metroplex sites are metropolitan areas with multiple airports and complex air traffic flows.
zz Accomplished the following key milestones at the remaining Metroplex projects:
z| For Las Vegas, completed final optimized airspace and procedure designs in May 2019.
z| For Denver, published the draft Environmental Assessment in April 2019 and accepted public comments on the draft Environmental Assessment in May 2019. Also completed 12 community engagement workshops.
z| For South-Central Florida, completed final optimized airspace and procedure designs in July 2019.
zz Completed over half of the 52 Northeast Corridor milestones. Notable PBN route and airspace redesign accomplishments include:
z| Completion of a new high altitude PBN route structure design along the eastern seaboard.
z| Redesign of a high altitude airspace structure in Washington Air Route Traffic Control Center.
z| Design of a new offshore airspace route structure east of the New York Metro area. Also redesigned the New York Air Route Traffic Control Center’s offshore airspace structure to support the new PBN “Y” routes.
zz Deployed a standardized, step-by-step process across the FAA for the use of the Environmental Screening Tool that interfaces with the Aviation Environmental Design Tool. These tools work together to ensure changes to airspace utilization, such as creating a new air route, will not present extraordinary circumstances that trigger the use of a categorical exclusion provision per the National Environmental Policy Act. In addition, the FAA designed a portal to automate the noise screening request process. The portal standardizes the handling of all environmental documentation for airspace changes, such as special use designation and implementing performance based navigation procedures.
zz Developed the Aircraft Noise Complaint/Inquiry Repository, a single, online mechanism available for all FAA employees who work on aircraft noise complaints and inquiries. The repository includes information about the noise complaint process and standardized text to facilitate efficient resolution of complaints and inquiries from the public.
zz Developed and implemented practices for early and ongoing community engagement by building partnerships with communities, airport operators, and other stakeholders.
z| The FAA adheres to a five-phase process for collaboration with aviation stakeholders, as described in the FAA Community Involvement Manual. The FAA uses this process as a guide during the project lifecycle for airspace projects that involve changes to flight paths, their utilization, or the concentration of flight tracks at lower altitudes. The FAA also uses this process in its consideration of changes that could result in unequal impacts or perceived controversy.
z| The FAA developed the Community Involvement PBN Desk Guide to describe community engagement activities and establish a standard, repeatable process to ensure productive and effective community involvement for PBN projects, as described in FAA Order 7110.41A.
z| The FAA expanded the Metroplex Handbook to include community engagement recommendations for each phase of a Metroplex project lifecycle.
zz The FAA expanded community engagement activities by holding additional public workshops, outreach briefings, and webinars. For example, the FAA held outreach briefings at airports in Houston, Washington, DC, North Texas, and Atlanta. In addition to outreach briefings, the FAA held other engagement activities in Northern and Southern California, Denver, Florida, Cleveland and Detroit.
What needs to be doneThe FAA completed the items it planned for FY 2019 and will continue to address this management challenge as necessary.
FA A FISCAL YEAR 2019 | PERFORMANCE AND ACCOUNTABILIT Y REPORT 155
OT
HE
R IN
FO
RM
AT
ION
Providing new capabilities to airspace users while modernizing systems
Why this is a challengeWorking with the airlines, FAA plans to implement Data Communications (Data Comm) for controllers and pilots at high-altitude Air Route Traffic Control Centers beginning in 2019 through 2021 at a cost of over $691 million. Deploying Data Comm at the 20 centers while replacing their existing En Route Automation Modernization (ERAM) system hardware (and implementing other enhancements) represents a significant system integration challenge.
Progress in meeting the challengezz During FY 2019 FAA replaced obsolete ERAM system equipment with modern, sustainable hardware platforms at certain locations. This replacement ensured the system fulfilled operational availability and performance requirements. For this effort the FAA:
z| Completed the Early D portion of ERAM Sustainment 2 at five ARTCCs. This equipment upgrade deployed new processors in the Controller D Position consoles, bringing all 20 ARTCCs to completion.
z| Began full deployment of ERAM Sustainment 2 at three key sites in August 2019.
z| Deployed adaptation enhancements software for ERAM Enhancements 2.
zz The FAA completed the following strategic integration activities for ERAM and Data Comm:
z| Implemented the New Program Integration process, which provides the foundation for integrating new capabilities and external programs into the ERAM platform. This process encompasses all activities from receipt of request for integration (e.g., a new program requesting a change in ERAM hardware, interface or software requirements) to establishing schedule and lifecycle cost estimates for the requesting program. Additionally, the process includes implementing new program requirements into the ERAM platform and will focus on the successful implementation of Data Comm software.
z| Applied the ERAM Strategic Release Planning process and multi-year integrated schedule to support pre-planned software releases to ensure that conflicts do not exist between ERAM sustainment and Data Comm deployment schedules.
zz The FAA also accepted Data Comm supporting software releases and conducted en route Controller Pilot Data Link Communications operations at two sites.
What needs to be donezz The FAA will continue to address this challenge by taking the following additional steps:
z| Conduct Initial Operating Capability in November 2019 for both sites at which the FAA completed Data Comm supporting software releases. Following this Initial Operating Capability, the FAA plans to conduct an Independent Operational Assessment and complete an In-Service Decision.
z| Complete ERAM Sustainment in 2025 by providing all the necessary replacement hardware for the entire ERAM system.
Replacing existing radar with a new system financed by the auction of electromagnetic spectrum
Why this is a challengeThe FAA manages air traffic and collects weather information with an aging radar infrastructure that has been in service longer than originally planned, making it increasingly difficult and expensive to maintain. The FAA has partnered with two other agencies in the Spectrum Efficient National Surveillance Radar (SENSR) program to auction Government-owned electromagnetic spectrum frequencies and use the revenue to develop and deploy new radar systems.
The SENSR initiative will provide the FAA and the other participating agencies with the opportunity to consolidate surveillance capability outside of the normal appropriations process. The agency is leveraging this opportunity to completely overhaul federal surveillance capability and gain spectral efficiencies.
As part of the process, the FAA will perform due diligence to assess the relocation of surveillance capabilities to a different portion of the spectrum, while ensuring that the existing surveillance capabilities are maintained. We will also incorporate inherent and incidental improvements over existing legacy surveillance capability that modern technical solutions may provide.
FA A FISCAL YEAR 2019 | PERFORMANCE AND ACCOUNTABILIT Y REPORT156
OT
HE
R I
NF
OR
MA
TIO
N
Progress in meeting the challengeDuring FY 2019, the FAA worked with the National Telecommunications and Information Administration, the Office of Management and Budget, and the Federal Communications Commission to confirm the availability of funding for spectrum reallocation from the Spectrum Relocation Fund. The FAA also determined the scope of the program and established a program management infrastructure necessary for a functional, cross-agency program team.
Throughout the fiscal year, FAA engaged with industry partners to resolve certain program challenges. The SENSR team released multiple requests for information which garnered industry input on the program’s overall approach, requirements, and acquisition strategy. In addition, the team held multiple meetings with vendors.
Publication of the requests for information and vendor engagement events with industry partners provided FAA with helpful information. After receiving this input, the FAA worked with other agencies to refine the program’s scope and requirements.
Milestones the FAA completed in FY 2019 include:
zz Submitted acquisition strategy for approval to the FAA’s Joint Resource Council in October 2018.
zz Drafted cross estimating plan and submitted Investment Planning and Analysis in December 2018.
zz Held one-on-one meetings with vendors about RFI 2.1 in March 2019.
zz Submitted Phase I Extension SENSR Pipeline Plan to Tech Panel in April 2019.
zz Identified Finalized Program Requirements in July 2019.
zz Released Program Requirements to industry, conducted Feasibility Assessment, and held Industry Week in August 2019 to provide information to vendors.
What needs to be doneThe FAA will continue to address this challenge by working towards achieving an Initial Investment Decision for the SENSR program, at which point the FAA selects for detailed implementation planning for one alternative solution that best satisfies customer service needs within cost, operational, performance, benefit, and risk constraints.
Strengthening management oversight of developmental funding for air traffic management
Why this is a challengeThe FAA annually spends millions of dollars on research and air traffic development projects through its capital account and faces challenges in managing these efforts while providing adequate oversight. These projects are part of a development, testing, and demonstration process that FAA uses to reduce risks in new air traffic management concepts. FAA manages each project with project-level agreements—an internal control mechanism for documenting agreed-upon work and managing project execution.
Progress in meeting the challengezz The FAA modified the Program Management Assessment Funding Request Standard Operating Procedure (SOP). The SOP now includes language that requires the Office of National Airspace System Lifecycle Planning to provide a close-out memorandum as verification for completion of work. This ensures that project requirements are met before transferring expiring funds into the Project Level Agreement account.
zz Instead of updating the FAA Financial Manual to define projects that are considered pre-implementation, it was determined that this addition would be more effective if it was added to the Facilities & Equipment (F&E) budget narrative justifications included in the FAA’s FY 2021 President’s Budget Submission.
zz As planned, we continued to follow the formal process for reviewing F&E budget requests at the individual Capital Investment Plan level. The F&E budget process aligns the FAA’s strategic vision on the Enterprise Architecture with the agency’s F&E budget request. The Joint Resources Council produces a formal record of its final determination on the F&E budget request. Continuing to follow the formal process enhances management control of allocated funds and this effort remains ongoing.
What needs to be donezz Include the definition of projects that are considered pre-implementation in the F&E executive summary section and/or NextGen sections of the FY 2021 President’s Budget submission expected to be submitted to Congress in February 2020.
zz Continue to improve management and oversight of NextGen developmental funding to achieve better outcomes for our air traffic management development efforts.
FA A FISCAL YEAR 2019 | PERFORMANCE AND ACCOUNTABILIT Y REPORT 157
OT
HE
R IN
FO
RM
AT
ION
Resolving longstanding security weaknesses to strengthen information technology infrastructure
Why this is a challengeOver the last 10 years, the Inspector General consistently found that the cyber security assessment and management database does not include all known security weaknesses. For example, FAA did not track weaknesses that the Government Accountability Office (GAO) identified in its 2015 report on the air traffic control information security program, which resulted in 185 recommendations.
Progress in meeting the challengezz The FAA continues to meet with GAO to discuss open recommendations and clarifications to documentation that has been submitted in support of their closing.
z| As of September 2019, GAO has closed all 17 publically available recommendations and 135 of 168 technical recommendations marked as Sensitive Security Information.
z| In August and September of 2019, FAA submitted to GAO documentation supporting closure of an additional 12 technical recommendations.
zz The Air Traffic Organization updated the FAA Cybersecurity Steering Committee on the progress of addressing GAO audit recommendations in February, May, and September 2019.
What needs to be doneGAO records indicate that, as of the end of FY 2019, 21 technical recommendations from the 2015 report remain open. The FAA will continue to work on addressing GAO’s concerns so that we can close out these remaining open recommendations.
Implementing congressionally mandated aviation cybersecurity initiatives
Why this is a challengeAbout 70 percent of DOT’s information technology investments belong to the FAA. Spread out across the country, this vast network of systems and facilities are indispensable components in managing air traffic in the national airspace. Ensuring these systems are reliable and secure from external threats is a dynamic process requiring continuous evaluation and preparation. This process
becomes increasingly complex as the FAA integrates new communication systems, tracking systems, and technologies into its existing systems.
Progress in meeting the challengezz The FAA’s Aviation Safety office initiated efforts to address the four deferred recommendations made by the Aviation Rulemaking Advisory Committee Aircraft Systems Information Security Protection Working Group. Target dates for completing these recommendations have been identified.
zz The FAA updated the Aircraft Systems Information Security Protection plan and submitted the document to the Office of the Inspector General.
zz The FAA’s NextGen organization provided a status update of cyber security risk model (CyRM) activities to the FAA Cybersecurity Steering Committee in March 2019 and submitted an updated CyRM strategy and plan to the OIG.
zz NextGen also provided the updated draft of FAA’s Cyber Research & Development (R&D) Plan to the Cybersecurity Steering Committee for review in August 2019. To prevent duplicate efforts, agency priorities were coordinated with other agency cybersecurity plans and activities.
What needs to be donezz The FAA will finalize the Cyber R&D plan and submit it to the Inspector General.
Implementing innovative and streamlined acquisition practices while managing risk
Why this is a challengeThe Department of Transportation (DOT) utilizes agreements and multiple-award vehicles to acquire a wide range of supplies and services to meet mission needs. For example, the FAA uses multiple-award vehicles to support major initiatives such as the Next Generation Air Transportation System (NextGen) and meet DOT procurement targets for small and disadvantaged businesses. While multiple-award vehicles can streamline the process for meeting acquisition goals, they are prone to oversight vulnerabilities.
Progress in meeting the challengezz The FAA developed and implemented a process in July 2019 requiring contracting officers to verify and document a firm’s small/disadvantaged status prior to
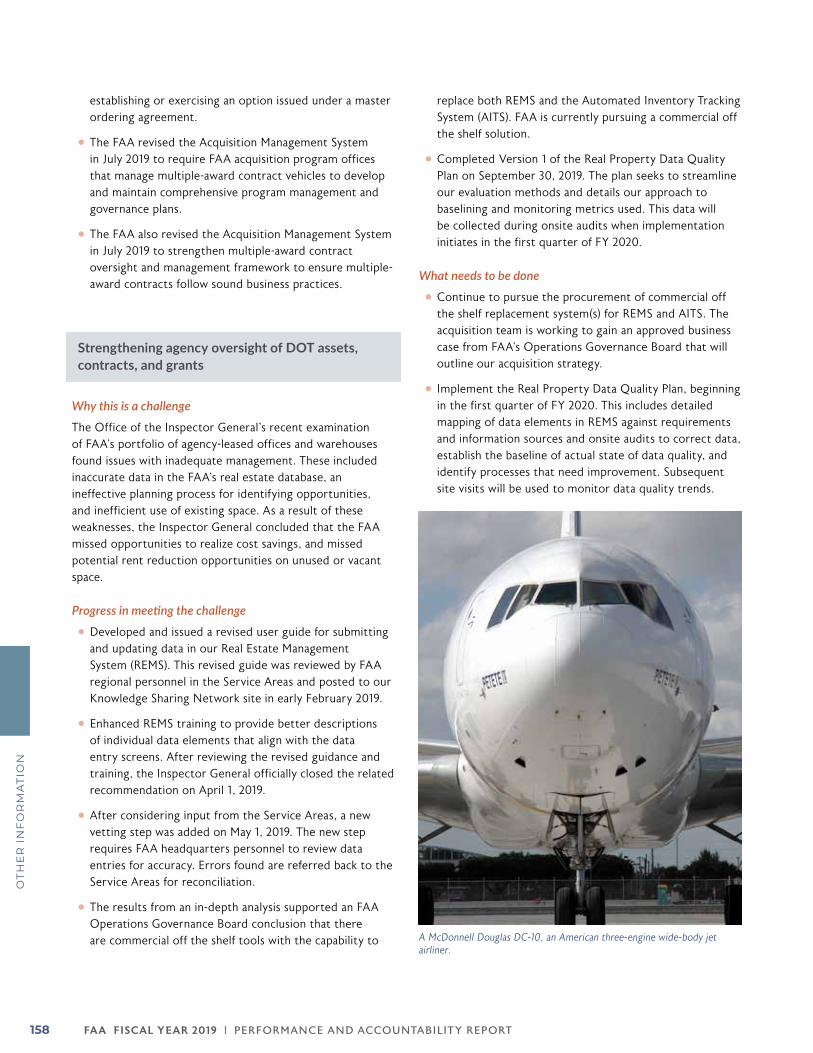
FA A FISCAL YEAR 2019 | PERFORMANCE AND ACCOUNTABILIT Y REPORT158
OT
HE
R I
NF
OR
MA
TIO
N
establishing or exercising an option issued under a master ordering agreement.
zz The FAA revised the Acquisition Management System in July 2019 to require FAA acquisition program offices that manage multiple-award contract vehicles to develop and maintain comprehensive program management and governance plans.
zz The FAA also revised the Acquisition Management System in July 2019 to strengthen multiple-award contract oversight and management framework to ensure multiple-award contracts follow sound business practices.
Strengthening agency oversight of DOT assets, contracts, and grants
Why this is a challengeThe Office of the Inspector General’s recent examination of FAA’s portfolio of agency-leased offices and warehouses found issues with inadequate management. These included inaccurate data in the FAA’s real estate database, an ineffective planning process for identifying opportunities, and inefficient use of existing space. As a result of these weaknesses, the Inspector General concluded that the FAA missed opportunities to realize cost savings, and missed potential rent reduction opportunities on unused or vacant space.
Progress in meeting the challengezz Developed and issued a revised user guide for submitting and updating data in our Real Estate Management System (REMS). This revised guide was reviewed by FAA regional personnel in the Service Areas and posted to our Knowledge Sharing Network site in early February 2019.
zz Enhanced REMS training to provide better descriptions of individual data elements that align with the data entry screens. After reviewing the revised guidance and training, the Inspector General officially closed the related recommendation on April 1, 2019.
zz After considering input from the Service Areas, a new vetting step was added on May 1, 2019. The new step requires FAA headquarters personnel to review data entries for accuracy. Errors found are referred back to the Service Areas for reconciliation.
zz The results from an in-depth analysis supported an FAA Operations Governance Board conclusion that there are commercial off the shelf tools with the capability to
replace both REMS and the Automated Inventory Tracking System (AITS). FAA is currently pursuing a commercial off the shelf solution.
zz Completed Version 1 of the Real Property Data Quality Plan on September 30, 2019. The plan seeks to streamline our evaluation methods and details our approach to baselining and monitoring metrics used. This data will be collected during onsite audits when implementation initiates in the first quarter of FY 2020.
What needs to be donezz Continue to pursue the procurement of commercial off the shelf replacement system(s) for REMS and AITS. The acquisition team is working to gain an approved business case from FAA’s Operations Governance Board that will outline our acquisition strategy.
zz Implement the Real Property Data Quality Plan, beginning in the first quarter of FY 2020. This includes detailed mapping of data elements in REMS against requirements and information sources and onsite audits to correct data, establish the baseline of actual state of data quality, and identify processes that need improvement. Subsequent site visits will be used to monitor data quality trends.
A McDonnell Douglas DC-10, an American three-engine wide-body jet airliner.
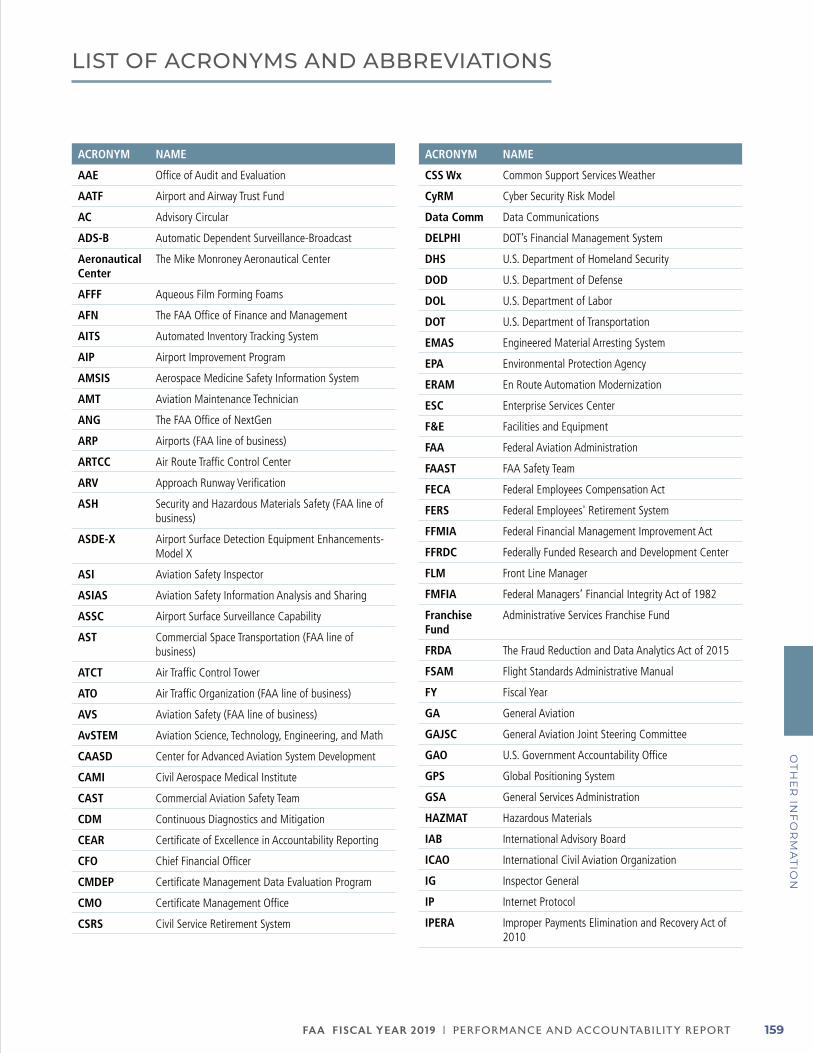
FA A FISCAL YEAR 2019 | PERFORMANCE AND ACCOUNTABILIT Y REPORT 159
OT
HE
R IN
FO
RM
AT
ION
LIST OF ACRONYMS AND ABBREVIATIONS
ACRONYM NAME
AAE Office of Audit and Evaluation
AATF Airport and Airway Trust Fund
AC Advisory Circular
ADS-B Automatic Dependent Surveillance-Broadcast
Aeronautical Center
The Mike Monroney Aeronautical Center
AFFF Aqueous Film Forming Foams
AFN The FAA Office of Finance and Management
AITS Automated Inventory Tracking System
AIP Airport Improvement Program
AMSIS Aerospace Medicine Safety Information System
AMT Aviation Maintenance Technician
ANG The FAA Office of NextGen
ARP Airports (FAA line of business)
ARTCC Air Route Traffic Control Center
ARV Approach Runway Verification
ASH Security and Hazardous Materials Safety (FAA line of business)
ASDE-X Airport Surface Detection Equipment Enhancements-Model X
ASI Aviation Safety Inspector
ASIAS Aviation Safety Information Analysis and Sharing
ASSC Airport Surface Surveillance Capability
AST Commercial Space Transportation (FAA line of business)
ATCT Air Traffic Control Tower
ATO Air Traffic Organization (FAA line of business)
AVS Aviation Safety (FAA line of business)
AvSTEM Aviation Science, Technology, Engineering, and Math
CAASD Center for Advanced Aviation System Development
CAMI Civil Aerospace Medical Institute
CAST Commercial Aviation Safety Team
CDM Continuous Diagnostics and Mitigation
CEAR Certificate of Excellence in Accountability Reporting
CFO Chief Financial Officer
CMDEP Certificate Management Data Evaluation Program
CMO Certificate Management Office
CSRS Civil Service Retirement System
ACRONYM NAME
CSS Wx Common Support Services Weather
CyRM Cyber Security Risk Model
Data Comm Data Communications
DELPHI DOT’s Financial Management System
DHS U.S. Department of Homeland Security
DOD U.S. Department of Defense
DOL U.S. Department of Labor
DOT U.S. Department of Transportation
EMAS Engineered Material Arresting System
EPA Environmental Protection Agency
ERAM En Route Automation Modernization
ESC Enterprise Services Center
F&E Facilities and Equipment
FAA Federal Aviation Administration
FAAST FAA Safety Team
FECA Federal Employees Compensation Act
FERS Federal Employees' Retirement System
FFMIA Federal Financial Management Improvement Act
FFRDC Federally Funded Research and Development Center
FLM Front Line Manager
FMFIA Federal Managers’ Financial Integrity Act of 1982
Franchise Fund
Administrative Services Franchise Fund
FRDA The Fraud Reduction and Data Analytics Act of 2015
FSAM Flight Standards Administrative Manual
FY Fiscal Year
GA General Aviation
GAJSC General Aviation Joint Steering Committee
GAO U.S. Government Accountability Office
GPS Global Positioning System
GSA General Services Administration
HAZMAT Hazardous Materials
IAB International Advisory Board
ICAO International Civil Aviation Organization
IG Inspector General
IP Internet Protocol
IPERA Improper Payments Elimination and Recovery Act of 2010
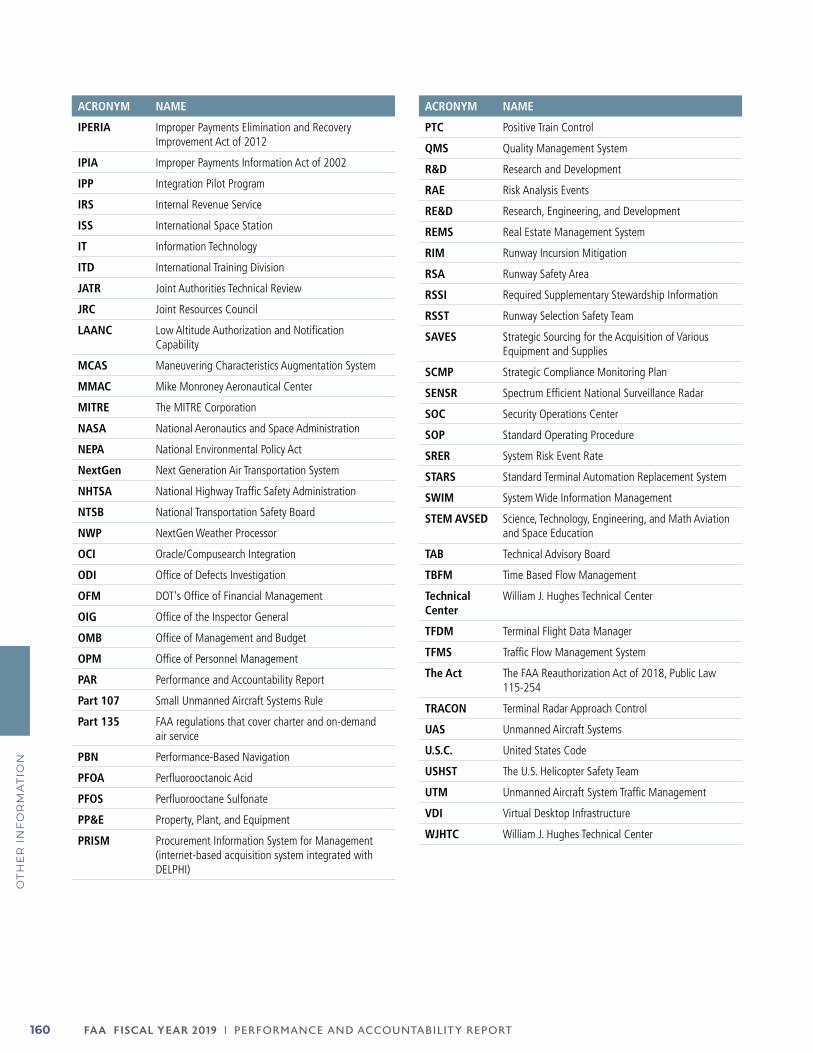
FA A FISCAL YEAR 2019 | PERFORMANCE AND ACCOUNTABILIT Y REPORT160
OT
HE
R I
NF
OR
MA
TIO
N
ACRONYM NAME
IPERIA Improper Payments Elimination and Recovery Improvement Act of 2012
IPIA Improper Payments Information Act of 2002
IPP Integration Pilot Program
IRS Internal Revenue Service
ISS International Space Station
IT Information Technology
ITD International Training Division
JATR Joint Authorities Technical Review
JRC Joint Resources Council
LAANC Low Altitude Authorization and Notification Capability
MCAS Maneuvering Characteristics Augmentation System
MMAC Mike Monroney Aeronautical Center
MITRE The MITRE Corporation
NASA National Aeronautics and Space Administration
NEPA National Environmental Policy Act
NextGen Next Generation Air Transportation System
NHTSA National Highway Traffic Safety Administration
NTSB National Transportation Safety Board
NWP NextGen Weather Processor
OCI Oracle/Compusearch Integration
ODI Office of Defects Investigation
OFM DOT's Office of Financial Management
OIG Office of the Inspector General
OMB Office of Management and Budget
OPM Office of Personnel Management
PAR Performance and Accountability Report
Part 107 Small Unmanned Aircraft Systems Rule
Part 135 FAA regulations that cover charter and on-demand air service
PBN Performance-Based Navigation
PFOA Perfluorooctanoic Acid
PFOS Perfluorooctane Sulfonate
PP&E Property, Plant, and Equipment
PRISM Procurement Information System for Management (internet-based acquisition system integrated with DELPHI)
ACRONYM NAME
PTC Positive Train Control
QMS Quality Management System
R&D Research and Development
RAE Risk Analysis Events
RE&D Research, Engineering, and Development
REMS Real Estate Management System
RIM Runway Incursion Mitigation
RSA Runway Safety Area
RSSI Required Supplementary Stewardship Information
RSST Runway Selection Safety Team
SAVES Strategic Sourcing for the Acquisition of Various Equipment and Supplies
SCMP Strategic Compliance Monitoring Plan
SENSR Spectrum Efficient National Surveillance Radar
SOC Security Operations Center
SOP Standard Operating Procedure
SRER System Risk Event Rate
STARS Standard Terminal Automation Replacement System
SWIM System Wide Information Management
STEM AVSED Science, Technology, Engineering, and Math Aviation and Space Education
TAB Technical Advisory Board
TBFM Time Based Flow Management
Technical Center
William J. Hughes Technical Center
TFDM Terminal Flight Data Manager
TFMS Traffic Flow Management System
The Act The FAA Reauthorization Act of 2018, Public Law 115-254
TRACON Terminal Radar Approach Control
UAS Unmanned Aircraft Systems
U.S.C. United States Code
USHST The U.S. Helicopter Safety Team
UTM Unmanned Aircraft System Traffic Management
VDI Virtual Desktop Infrastructure
WJHTC William J. Hughes Technical Center
WE WELCOME YOUR COMMENTS
THANK YOU FOR YOUR INTEREST in the FAA’s FY 2019 Performance and Accountability Report.
We welcome your comments on HOW WE CAN MAKE THIS REPORT MORE INFORMATIVE FOR OUR READERS.
PLEASE SEND YOUR COMMENTS TO:
OFFICE OF FINANCIAL MANAGEMENT
Federal Aviation Administration 800 Independence Avenue SW
Room 600W Washington, DC 20591
202-267-9105
This FY 2019 Performance and Accountability Report and its companion, the FY 2019 Summary of Performance and Financial Information, and prior year documents are available on the FAA website at:
https:/www.faa.gov/about/plans_reports/#performance
FPO
YOU CAN ALSO STAY CONNECTED WITH THE FAA VIA THE SOCIAL MEDIA LISTED BELOW
www.facebook.com/FAA www.instagram.com/faa www.twitter.com/FAANews
www.youtube.com/FAANews www.linkedin.com/company/faa
8 0 0 I N D E P E N D E N C E A V E N U E , S W
W A S H I N G T O N , D C 2 0 5 9 1
WWW.FA A .GOV

Our Mission OIG conducts audits and investigations on
behalf of the American public to improve the performance and integrity of DOT’s programs
to ensure a safe, efficient, and effective national transportation system.
Copyright © 2022 FDOKUMEN