Free radical co- and terpolymerization of styrene, hydrogenated cardanylacrylate, and cardanyl...
11
Free Radical Co- and Terpolymerization of Styrene, Hydrogenated Cardanyl Acrylate, and Cardanyl Acetate Le Huong Nguyen,* Hilmar Koerner, † Klaus Lederer Department of Chemistry of Polymeric Materials, The University of Leoben, Austria Received 4 June 2001; accepted 21 May 2002 ABSTRACT: Hydrogenated cardanyl acrylate (HCA) and cardanyl acetate (CACE) were synthesized from cardanol. The copolymerizations of HCA, CACE, and styrene (S) with methyl ethyl ketone peroxide (MEKP) and cobalt salt as the initiator were studied by FTIR. Based on FTIR results the reactivity ratios of the three copolymerization systems S–HCA, S–CACE, and HCA–CACE were determined by three different methods (Mayo-Lewis, Fineman-Ross, and Kelen-Tu ¨ dos). Results obtained from the three methods are in good agreement. Instantaneous compositions and compo- sition shift as a function of conversion is calculated for the S–HCA–CACE system with different feed compositions. © 2003 Wiley Periodicals, Inc. J Appl Polym Sci 88: 1399 –1409, 2003 Key words: copolymerization; FTIR; kinetics; cardanyl INTRODUCTION Previous work 1–3 describes the synthesis and charac- terization of cardanyl acrylate (CA) (Scheme 1) with two kinds of double bonds, namely the acrylic group and the double bonds in the long alkyl side chain (C 15 ) from cardanol. Several studies 2,3 have been done to clarify the reaction between CA and styrene. How- ever, up to now kinetic investigations of CA in free radical (co)polymerization reactions have not been carried out. The determination of reactivity ratios for copoly- merization between CA and styrene (S) is the aim of this study. To reduce the complexity of the CA– Styrene system, and to be able to understand the reactivity of each kind of double bond individually, the model compounds such as hydrogenated carda- nyl acrylate [HCA contains only the acrylic double bond ( acry)] and cardanyl acetate [CACE con- tains only alkyl side chain double bonds ( car)s] were synthesized. Calculations of the reactivity ratios of the copoly- merization of double bonds of the acrylic moiety and the side chain in HCA and CACE , respectively, with styrene double bonds are determined, and will be helpful to understand the characteristics of the com- plex radical terpolymerization of CA and styrene. The three methods by Mayo-Lewis, 5 Fineman- Ross, 6 and Kelen-Tu ¨ dos 7,8 were used to determine the reactivity ratios. The reactivity ratio data was obtained by FTIR measurements. Estimation of monomer reactivity ratios The relationship between the feed monomer compo- sition and the instantaneous composition of copoly- mer is given by the well-known copolymerization equation: 4 d M 1 dM 2 M 1 M 2 r 1 M 1 M 2 r 2 M 2 M 1 (1) where [M 1 ] and [M 2 ] are the concentrations of mono- mers M 1 and M 2 in the feed. d[M 1 ] and d[M 2 ] are the amount of monomer M 1 and that of monomer M 2 that have been converted into copolymer during a time interval dt, respec- tively. r 1 , r 2 are reactivity ratios; r 1 k 11 /k 12 and r 2 k 22 / k 21 . MAYO-LEWIS METHOD 5 According to Mayo-Lewis, eq. (2) can be obtained from eq. (1): *Present address: Polymer Research Center, The HoChiM- inh City University of Technology, Viet Nam. † Present address: University of Dayton Research Institute, Dayton, OH. Correspondence to: K. Lederer. Journal of Applied Polymer Science, Vol. 88, 1399 –1409 (2003) © 2003 Wiley Periodicals, Inc.
-
Upload
independent -
Category
Documents
-
view
2 -
download
0
Transcript of Free radical co- and terpolymerization of styrene, hydrogenated cardanylacrylate, and cardanyl...

Free Radical Co- and Terpolymerization of Styrene,Hydrogenated Cardanyl Acrylate, and Cardanyl Acetate
Le Huong Nguyen,* Hilmar Koerner,† Klaus Lederer
Department of Chemistry of Polymeric Materials, The University of Leoben, Austria
Received 4 June 2001; accepted 21 May 2002
ABSTRACT: Hydrogenated cardanyl acrylate (HCA) andcardanyl acetate (CACE) were synthesized from cardanol.The copolymerizations of HCA, CACE, and styrene (S) withmethyl ethyl ketone peroxide (MEKP) and cobalt salt as theinitiator were studied by FTIR. Based on FTIR results thereactivity ratios of the three copolymerization systemsS–HCA, S–CACE, and HCA–CACE were determined bythree different methods (Mayo-Lewis, Fineman-Ross, and
Kelen-Tudos). Results obtained from the three methods arein good agreement. Instantaneous compositions and compo-sition shift as a function of conversion is calculated for theS–HCA–CACE system with different feed compositions.© 2003 Wiley Periodicals, Inc. J Appl Polym Sci 88: 1399–1409, 2003
Key words: copolymerization; FTIR; kinetics; cardanyl
INTRODUCTION
Previous work1–3 describes the synthesis and charac-terization of cardanyl acrylate (CA) (Scheme 1) withtwo kinds of double bonds, namely the acrylic groupand the double bonds in the long alkyl side chain (C15)from cardanol. Several studies2,3 have been done toclarify the reaction between CA and styrene. How-ever, up to now kinetic investigations of CA in freeradical (co)polymerization reactions have not beencarried out.
The determination of reactivity ratios for copoly-merization between CA and styrene (S) is the aim ofthis study. To reduce the complexity of the CA–Styrene system, and to be able to understand thereactivity of each kind of double bond individually,the model compounds such as hydrogenated carda-nyl acrylate [HCA contains only the acrylic doublebond ( � acry)] and cardanyl acetate [CACE con-tains only alkyl side chain double bonds ( � car)s]were synthesized.
Calculations of the reactivity ratios of the copoly-merization of double bonds of the acrylic moiety andthe side chain in HCA and CACE , respectively, with
styrene double bonds are determined, and will behelpful to understand the characteristics of the com-plex radical terpolymerization of CA and styrene.
The three methods by Mayo-Lewis,5 Fineman-Ross,6 and Kelen-Tudos7,8 were used to determine thereactivity ratios. The reactivity ratio data was obtainedby FTIR measurements.
Estimation of monomer reactivity ratios
The relationship between the feed monomer compo-sition and the instantaneous composition of copoly-mer is given by the well-known copolymerizationequation:4
d�M1�
d�M2��
�M1�
�M2�
r1�M1� � �M2�
r2�M2� � �M1�(1)
where [M1] and [M2] are the concentrations of mono-mers M1 and M2 in the feed.
d[M1] and d[M2] are the amount of monomer M1
and that of monomer M2 that have been convertedinto copolymer during a time interval dt, respec-tively.
r1, r2 are reactivity ratios; r1 � k11/k12 and r2 � k22/k21.
MAYO-LEWIS METHOD5
According to Mayo-Lewis, eq. (2) can be obtainedfrom eq. (1):
*Present address: Polymer Research Center, The HoChiM-inh City University of Technology, Viet Nam.
†Present address: University of Dayton Research Institute,Dayton, OH.
Correspondence to: K. Lederer.
Journal of Applied Polymer Science, Vol. 88, 1399–1409 (2003)© 2003 Wiley Periodicals, Inc.

r2 �
log�M2�o
�M2��
1p log
1 � p�M1�
�M2�
1 � p�M1�o
�M2�o
log�M1�o
�M1�� log
1 � p�M1�
�M2�
1 � p�M1�o
�M2�o
(2)
where
p �1 � r1
1 � r2(3)
and [M1]o, [M2]o refer to the initial concentration ofmonomers M1 and M2 in the feed; [M1] and [M2]represent unreacted monomer concentrations.
FINEMAN-ROSS METHOD6
According to Fineman and Ross, eq. (4) is obtainedbased on eq. (1):
r2 �f1
1 � f1�1 � 2F1
F1�
f 12
�1 � f1�2
�1 � F1
F1� r1 � �G � H � r1 (4)
f1 and F1 are mol fractions of monomer M1 in the feedand of unit M1 in the copolymer formed instanta-neously F1, respectively.
KELEN-TUDOS METHOD7,8
The Kelen-Tudos method is based on the Fineman-Ross method, with the aim of preventing the nonsym-metrical character of the composition of eq. (4) fromaffecting the values of r1 and r2, which are determinedexperimentally.
By setting:
� �G
� � H and � �H
� � H
the instantaneous composition equation can be writ-ten as:
� � ��r1 �r2
�� �r2
�(5)
with
� � �Hmin � Hmax; Hmin, Hmax
are minimum and maximum H values.By plotting � vs. �, a straight line can be obtained,
and r1 and �(r2)/� are the values of � for � � 1 and for� � 0, respectively.
USE OF BINARY REACTIVITY RATIOS TODESCRIBE TERPOLYMERIZATION SYSTEM9–11
In terpolymerization, nine possible propagation reac-tions can take place as follows:
MM1• � M1O¡
k11
MM1•
MM1• � M2O¡
k12
MM2•
MM1• � M3O¡
k13
MM3•�MM2
• � M1O¡k21
MM1•
MM2• � M2O¡
k22
MM2•
MM2• � M3O¡
k23
MM3•�MM3
• � M1O¡k31
MM1•
MM3• � M2O¡
k32
MM2•
MM3• � M3O¡
k33
MM3•
Scheme 1 The chemical structure of cardanyl acrylate.
1400 NGUYEN, KOERNER, AND LEDERER

Several different methods and equations for terpoly-mer system calculations were described in refs. 10 and11. The equation of authors Alfrey and Goldfinger hasbeen shown to give good agreement between esti-mated radical terpolymer compositions and experi-mental results.10 Therefore, it was chosen to be ap-plied in this work. Alfrey and Goldfinger9 derived thefollowing equation to describe terpolymerization:
d�M1�: d�M2�: d�M3� � �M1� � ��M1�
r31r21�
�M2�
r21r32�
�M3�
r31r23�
� ��M1� ��M2�
r12�
�M3�
r13� : �M2� � ��M1�
r12r31�
�M2�
r12r32
��M3�
r32r13���M2� �
�M1�
r21�
�M3�
r23� : �M3� � ��M1�
r13r21
��M2�
r23r12�
�M3�
r13r23���M3� �
�M1�
r31�
�M2�
r32� (6)
with d[M1] � d[M2] � d[M3] � 1, and [M1] � [M2]� [M3] �1, where [Mi] is the molar fraction of mono-mer i in feed and d[Mi] is the instantaneous molarfraction of monomer i at a certain time.
The r values shown in this equation are the r1 and r2values of each of the three monomer pairs M1–M2,M2–M3, and M1–M3. To distinguish these better, eachr value has now two index numbers:
M1 � M2 M2 � M3 M1 � M3
r1 � k11/k12 � r12 r1 � k22/k23 � r23 r1 � k11/k13 � r13
r2 � k22/k21 � r21 r2 � k33/k32 � r32 r2 � k33/k31 � r31
Equation (6) can be used to calculate the instantaneouscopolymer compositions.
The chemical composition distribution of the ter-polymer is usually plotted in a triangular diagram.
EXPERIMENTAL
Materials
Cardanol was recovered from technical cashew nutshell liquid (obtained from Tai Loi company, VietNam) by direct vacuum distillation at a reduced pres-
sure of 5–6 mbar, under nitrogen, and the fractiondistilled at 190–210°C was collected.
The hydrogenated cardanol (P440-2), technicalchemical grade, used in this study was supplied byAldrich Company. Acryloyl chloride and acetyl chlo-ride were supplied by Fluka. Styrene (Fluka) wasfreed from inhibitor by vacuum distillation before us-ing in the copolymerization investigation. Hydroqui-none, sodium hydroxide, methyl ethyl ketone perox-ide (MEKP, 35 wt % solution in a mixture of diisobu-tylphthalate and diacetone alcohol), and the solventswere supplied by Merck. Cobalt naphthenate (Co2�, 1wt % solution in toluene) was supplied by VianovaResins Company (Graz, Austria).
Preparation of monomers
HCA was synthesized according to reaction Scheme 2,and was carried out as described in ref. [12]. The HCAproduct was obtained in solid form at room tempera-tures, with a melting point between 40–45°C and d20� 0.9054 g/cm3.
CACE was synthesized in the same way accordingto reaction Scheme 3. CACE obtained is a transparent,yellow liquid with a density d20 � 0.975 g/cm3.
Instrumentation and experimental procedure
A Perkin-Elmer FTIR spectrometer Model 1600 wasused in this work. The FTIR was equipped with aMettler Instruments FP 52 hotstage.
The liquid samples of S–HCA (or S–CACE andHCA–CACE) were catalyzed using MEKP and cobaltnaphthenate (Co2�) (4% of the weight of the reactivemonomer mixtures). After thorough mixing and min-imum delay (less than 2–3 min), one drop of the reac-tive mixture was placed as a thin film between twoNaCl windows, which were then sealed. The windowwas placed in the hotstage and mounted into the FTIRchamber. The curing reaction for S–HCA, S–CACE,and HCA–CACE was studied isothermally at 120, 130,
Scheme 2 Reaction of hydrogenated cardanol and acryloylchloride to form hydrogenated cardanyl acrylate.
Scheme 3 Reaction of cardanol and acetyl chloride to formcardanyl acetate.
FREE RADICAL TERPOLYMERIZATION OF STYRENE, HCA, AND CACE 1401

Figure 1 The conversion of S–HCA samples at 120°C by isothermal FTIR measurement. (a) Sample S–HCA-1; (b) sampleS–HCA-2; (c) sample S–HCA-3; (d) sample S–HCA-4.
TABLE ICharacteristics of a Copolymerization of Styrene and HCA
Sample[S]o
(mol/L)[HCA]o(mol/L)
[S]*(mol/L)
[HCA]*(mol/L) f1 F1 �S �HCA
Overallconversion
�T
S-HCA-1 0.4353 2.4031 0.0570 0.3396 0.1534 0.1437 0.1309 0.1413 0.1397S-HCA-2 0.8707 2.2763 0.0987 0.3139 0.2767 0.2393 0.1134 0.1379 0.1311S-HCA-3 2.1624 1.7710 0.1881 0.2033 0.5960 0.4806 0.0720 0.1148 0.0893S-HCA-4 5.2259 1.0118 0.4462 0.1986 0.8378 0.6920 0.0854 0.1963 0.1034
1402 NGUYEN, KOERNER, AND LEDERER
and 150°C by time-resolved FTIR, monitoring the dis-appearance of peaks for double bonds.
FTIR analysis13–14
Infrared analysis that can directly measure the concen-tration of functional groups was used to investigatethe copolymerization characteristics of systemsS–HCA, S–CACE, HCA–CACE. Furthermore, the re-activity ratios for the radical copolymerization of thesemonomers with styrene and the ratios for the mono-mers together were estimated based on a change of thereactive groups in the system by FTIR.
Based on the change of the peak of functional groupsat 1402 and 908 cm�1 assigned to the COH in plane
bending vibrations of{}
CACH2 of HCA (named acrylic
double bond) and styrene double bonds, respectively,the concentrations of unreacted double bonds forS–HCA copolymerization were determined. The peak at982 cm�1, which is also caused by acrylic double bonds( � acry), was not chosen for the calculation because itoverlaps with the styrene peak at 992 cm�1.
In the case of the S–CACE system, the concentra-tions of unreacted double bonds were determined at3008 and 908 cm�1 for the alkyl side chain doublebonds of CACE (cardanol double bond) and styrenedouble bonds.
Figure 2 Selected IR spectra of S–HCA-1 showing the peak changes of functional groups at 1402 and 908 cm�1 at 120°C.
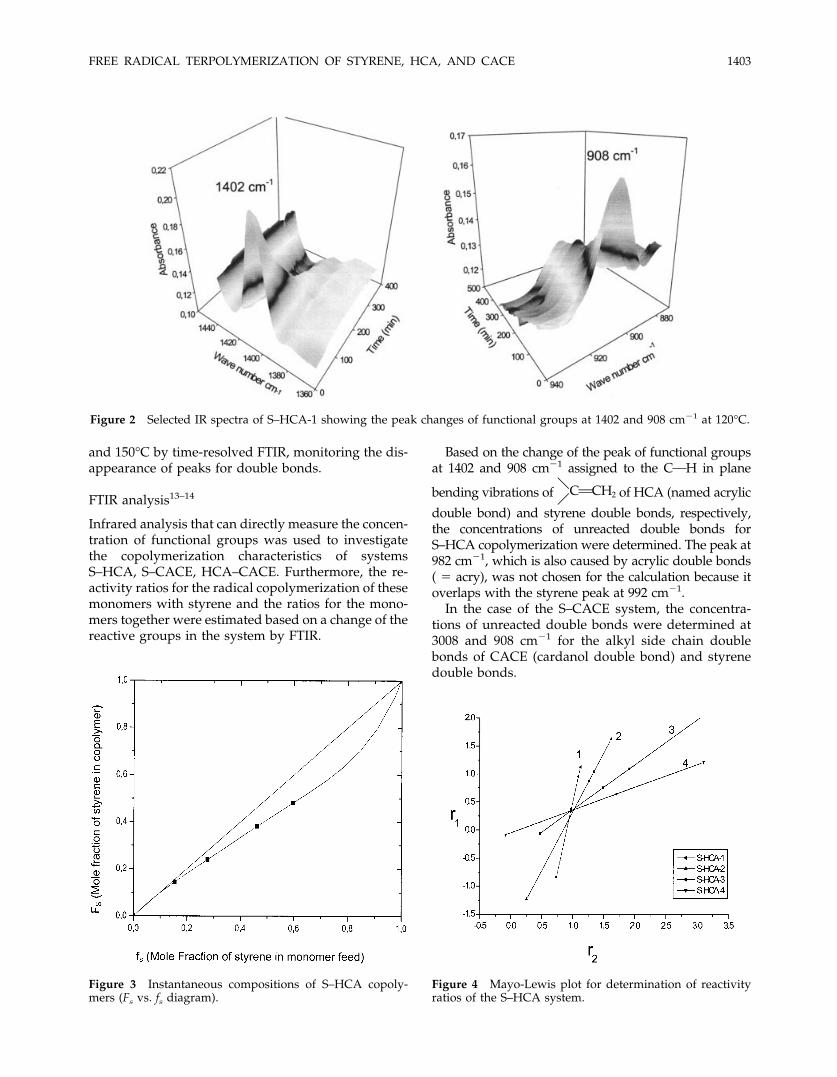
Figure 3 Instantaneous compositions of S–HCA copoly-mers (Fs vs. fs diagram).
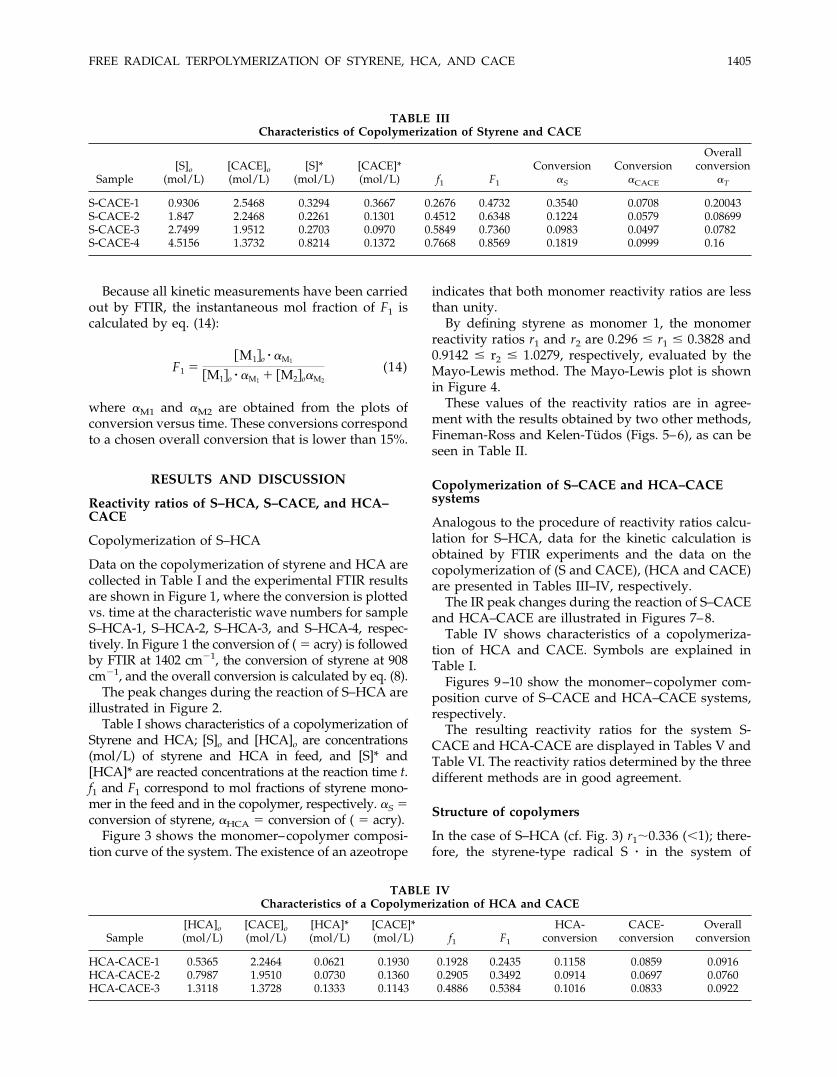
Figure 4 Mayo-Lewis plot for determination of reactivityratios of the S–HCA system.
FREE RADICAL TERPOLYMERIZATION OF STYRENE, HCA, AND CACE 1403

In the case of HCA–CACE copolymerization, theconcentrations of unreacted double bonds were deter-mined at 1402 and 3008 cm�1 for COH in plane bend-
ing of{}
CACH2 of HCA and the alkyl side chain
double bonds of CACE.To compensate for a change in sample thickness the
FTIR data was normalized to an internal standard peak.In this work, the COH peak at 2925 cm�1 was chosen asthe internal standard for normalizing, and peak heightwas used instead of area. The determination of the un-reacted concentration of monomers in the mixture wascalculated according to Beer-Lambert’s law.15–17
All IR spectra in this study are presented in absor-bance units.
The conversion of the reaction can be determinedfrom the change of the normalized absorbances Ao andAt of the monomer functional group before the reac-tion and after a reaction time t.
� � 1 � At/Ao (7)
In the case of the S–HCA system, the conversion ofmixtures S–HCA is based on the overall consumptionof CAC bonds.
The overall conversion of CAC bonds can be ex-pressed as:
�T ��S � I�H
1 � I (8)
where
I � �HCA�o/�S�o (9)
�S, the styrene conversion, can be determined fromthe peak height change at 908 cm�1
�S � 1 � �At/Ao�908 (10)
�H, the HCA conversion, can be determined from thepeak height change at 1402 cm�1
�H � 1 � �At/Ao�1402 (11)
[S]o, [HCA]o, [S]*, and [HCA]*, which are concentra-tions of styrene and HCA monomers in the feed andthe reacted concentration at the reaction time t, respec-tively, are obtained by:
�S�* � �S�o � �S (12)
�HCA�* � �HCA�o � �H (13)
For S–CACE and HCA–CACE systems, all calcula-tions of conversion and concentration of monomers inthe reaction system were determined analogously.
Figure 5 Fineman-Ross plot for determination of reactivityratios of the S–HCA system.
Figure 6 Kelen-Tudos plot for determination of reactivityratios of the S–HCA system.
TABLE IIReactivity Ratios of the Copolymerization of S-HCA
Calculated by Three Different Methods
Method ofcalculation r1 r2
Mayo-Lewis 0.296 � r1 � 0.3828 0.9142 � r2 � 1.0279Fineman-Ross 0.322 0.938Kelen-Tudos 0.3355 0.964
1404 NGUYEN, KOERNER, AND LEDERER
Because all kinetic measurements have been carriedout by FTIR, the instantaneous mol fraction of F1 iscalculated by eq. (14):
F1 ��M1�o � �M1
�M1�o � �M1 � �M2�o�M2
(14)
where �M1 and �M2 are obtained from the plots ofconversion versus time. These conversions correspondto a chosen overall conversion that is lower than 15%.
RESULTS AND DISCUSSION
Reactivity ratios of S–HCA, S–CACE, and HCA–CACE
Copolymerization of S–HCA
Data on the copolymerization of styrene and HCA arecollected in Table I and the experimental FTIR resultsare shown in Figure 1, where the conversion is plottedvs. time at the characteristic wave numbers for sampleS–HCA-1, S–HCA-2, S–HCA-3, and S–HCA-4, respec-tively. In Figure 1 the conversion of ( � acry) is followedby FTIR at 1402 cm�1, the conversion of styrene at 908cm�1, and the overall conversion is calculated by eq. (8).
The peak changes during the reaction of S–HCA areillustrated in Figure 2.
Table I shows characteristics of a copolymerization ofStyrene and HCA; [S]o and [HCA]o are concentrations(mol/L) of styrene and HCA in feed, and [S]* and[HCA]* are reacted concentrations at the reaction time t.f1 and F1 correspond to mol fractions of styrene mono-mer in the feed and in the copolymer, respectively. �S �conversion of styrene, �HCA � conversion of ( � acry).
Figure 3 shows the monomer–copolymer composi-tion curve of the system. The existence of an azeotrope
indicates that both monomer reactivity ratios are lessthan unity.
By defining styrene as monomer 1, the monomerreactivity ratios r1 and r2 are 0.296 � r1 � 0.3828 and0.9142 � r2 � 1.0279, respectively, evaluated by theMayo-Lewis method. The Mayo-Lewis plot is shownin Figure 4.
These values of the reactivity ratios are in agree-ment with the results obtained by two other methods,Fineman-Ross and Kelen-Tudos (Figs. 5–6), as can beseen in Table II.
Copolymerization of S–CACE and HCA–CACEsystems
Analogous to the procedure of reactivity ratios calcu-lation for S–HCA, data for the kinetic calculation isobtained by FTIR experiments and the data on thecopolymerization of (S and CACE), (HCA and CACE)are presented in Tables III–IV, respectively.
The IR peak changes during the reaction of S–CACEand HCA–CACE are illustrated in Figures 7–8.
Table IV shows characteristics of a copolymeriza-tion of HCA and CACE. Symbols are explained inTable I.
Figures 9–10 show the monomer–copolymer com-position curve of S–CACE and HCA–CACE systems,respectively.
The resulting reactivity ratios for the system S-CACE and HCA-CACE are displayed in Tables V andTable VI. The reactivity ratios determined by the threedifferent methods are in good agreement.
Structure of copolymers
In the case of S–HCA (cf. Fig. 3) r1�0.336 (1); there-fore, the styrene-type radical S � in the system of
TABLE IIICharacteristics of Copolymerization of Styrene and CACE
Sample[S]o
(mol/L)[CACE]o(mol/L)
[S]*(mol/L)
[CACE]*(mol/L) f1 F1
Conversion�S
Conversion�CACE
Overallconversion
�T
S-CACE-1 0.9306 2.5468 0.3294 0.3667 0.2676 0.4732 0.3540 0.0708 0.20043S-CACE-2 1.847 2.2468 0.2261 0.1301 0.4512 0.6348 0.1224 0.0579 0.08699S-CACE-3 2.7499 1.9512 0.2703 0.0970 0.5849 0.7360 0.0983 0.0497 0.0782S-CACE-4 4.5156 1.3732 0.8214 0.1372 0.7668 0.8569 0.1819 0.0999 0.16
TABLE IVCharacteristics of a Copolymerization of HCA and CACE
Sample[HCA]o(mol/L)
[CACE]o(mol/L)
[HCA]*(mol/L)
[CACE]*(mol/L) f1 F1
HCA-conversion
CACE-conversion
Overallconversion
HCA-CACE-1 0.5365 2.2464 0.0621 0.1930 0.1928 0.2435 0.1158 0.0859 0.0916HCA-CACE-2 0.7987 1.9510 0.0730 0.1360 0.2905 0.3492 0.0914 0.0697 0.0760HCA-CACE-3 1.3118 1.3728 0.1333 0.1143 0.4886 0.5384 0.1016 0.0833 0.0922
FREE RADICAL TERPOLYMERIZATION OF STYRENE, HCA, AND CACE 1405

S–HCA has a pronounced preference to react withHCA monomers rather than with styrene monomers,and because r2�0.964 (close to 1), there is only a verysmall preference for copolymerization than for ho-mopolymerization for the free radical HCA � . Thismeans both monomers tend to copolymerize. As seenfor the S–HCA system in Figure 3, HCA enters thecopolymer faster than styrene throughout the wholerange of comonomer compositions. The product r1r2� 0.324 is closer to zero, which indicates that thecopolymer formed has a slight tendency to an alter-nating structure.
In the case of S–CACE (cf. Fig. 9), where the curve isabove the diagonal, or with r1�1.68 1 and r2�0.295 1, both free radical types S � and CACE � easily react
with styrene monomers. The styrene-type radical inthe system of S–CACE has a pronounced preferencefor reacting with styrene monomers rather than withCACE, whereas the CACE-type radical prefers to reactwith styrene rather than with its own monomer. Thismeans the copolymer formed instantaneously is richerin styrene than the monomer mixture it originates from.
Similar to the case of HCA–CACE (cf. Fig. 10) whenr1 1 and r2 1, both free radical types HCA � andCACE � easily react with HCA monomer. Because r1 isclose to 1, the copolymer formed instantaneously isslightly richer in HCA than the monomer mixture itoriginates from. Values r1�1.057 and r2�0.688 dem-onstrate that HCA-type radicals will prefer to reactwith its own monomer, whereas the CACE-type rad-
Figure 7 Selected IR spectra of S–CACE-1 showing the peak changes of functional groups at 908 and 3008 cm�1 at 130°C.
Figure 8 Selected IR spectra of HCA–CACE-3 showing the peak changes of functional groups at 1402 and 3008 cm�1 at150°C.
1406 NGUYEN, KOERNER, AND LEDERER

icals prefer to bind the other monomer, i.e., HCAmonomer. In the case of the comonomer pair HCA–CACE, r1 and r2 values and its product r1 � r2 � 0.727are close to unity, indicating the reaction system isclose to an “ideal copolymerization” or “random co-polymer” and shows less tendency for an alternation.
From the three pairs of reactivity ratios of modelcompounds, a terpolymer model was built for thecopolymerization system that consists of S, HCA, andCACE monomers. Using the Copolymer builder mod-ule of Cerius2 Molecular Modeling Package (Molecu-lar Simulations Software GMBH, D-85598 Baldham,Germany) according to their reactivity ratios r12, r21,r23, r32, r13 and r31 with a initial monomer composi-tions of S/HCA were simulated.
Figure 11 shows molecular structures of the S–HCAcopolymer with the sequence distribution of monomerunits HCA and S along the chain at two different initialmonomer compositions of S/HCA � 50/50 and 85/15.
As a result from molecular modeling studies it canbe concluded that even at low ratios of cardanolmonomer enough flexible side groups are present toenhance mechanical properties of such networks.
Building the ternary copolymer model for thestyrene–HCA–CACE system
In a polymerization of a three-monomer mixture of sty-rene–HCA–CACE there are nine possible reactions, asshown above, where S � M1, HCA � M2 and CACE� M3 with the reactivity ratios as below:
M1 � M2 �S � HCA� M2 � M3�HCA � CACE� M1 � M3�S � CACE�r1 � k11/k12 � r12 � 0.336 r1 � k22/k23 � r23 � 1.057 r1 � k11/k13 � r13 � 1.68r2 � k22/k21 � r21 � 0.96 r2 � k33/k32 � r32 � 0.688 r2 � k33/k31 � r31 � 0.294
With the two index number reactivity ratios r12, r21,r23, r32, r13, and r31, the terpolymerization compositionof the S–HCA–CACE system is calculated using acomputer model and eq. (6) by Alfrey-Goldfinger.
To demonstrate the composition drift occurring inthe terpolymerization of S, HCA, and CACE threeoverall monomer compositions are chosen: fs, fHCA,fCACE � (60, 5, 35), (50, 45, 5), and (5, 50, 45) and are
Figure 9 Instantaneous compositions of S–CACE copoly-mers (Fs vs. fs diagram). Figure 10 Instantaneous compositions of HCA–CACE co-
polymers (FHCA vs. fHCA).
TABLE VReactivity Ratios of the Copolymerization of S-CACE
Calculated by Three Different Methods
Method ofcalculation r1 r2
Mayo-Lewis 1.4984 � r1 � 1.7315 0.2063 � r2 � 0.3Fineman-Ross 1.681 0.2964Kelen-Tudos 1.677 0.294
TABLE VIReactivity Ratios of the Copolymerization of HCA-CACE
Calculated by Three Different Methods
Method ofcalculation r1 r2
Mayo-Lewis 1.047 � r1 � 1.101 0.669 � r2 � 0.685Fineman-Ross 1.052 0.686Kelen-Tudos 1.057 0.688
FREE RADICAL TERPOLYMERIZATION OF STYRENE, HCA, AND CACE 1407

named A1, A2, A3. These have increasing fractions ofHCA. The results of the ternary copolymerization ofA1, A2, and A3 were calculated and represented in atriangular diagram in Figure 12, which shows thecourse of the composition drift in the radical terpoly-merization for S–HCA–CACE system. The lines rep-resent the instantaneous composition of the terpoly-mers during the polymerization reaction. It can be
seen that they all end at pure CACE. Figure 12 alsoshows HCA is the most reactive monomer.
Figure 13 shows the initial composition drift in theternary copolymerization for the system S–HCA–CACE. The arrows represent the overall monomercomposition (start of arrow) and the correspondinginitial terpolymer composition (end of arrow). It canbe seen that there is a strong composition drift.
Figure 11 Molecular model of the S–HCA copolymer with the sequence distribution of monomer units HCA and styrenealong the chain: (a) at monomer molar ratios of S/HCA � 50/50; (b) at monomer molar ratios of S/HCA � 85/15.
Figure 12 The course of the composition drift in radical terpolymerization with varying overall composition: A1, A2, and A3.A1, A2, and A3 are monomer compositions of S–HCA–CACE reaction system at the start of the polymerization. A�1, A�2, andA�3 are the compositions of the initial terpolymer corresponding to A1, A2, and A3.
1408 NGUYEN, KOERNER, AND LEDERER
Based on the ternary plots above, it can be con-cluded that CACE is the least reactive monomer, andHCA the most reactive. This monomer is depletedfirst, and a copolymer of S and CACE is formed untilall S is depleted as well, after which the remainingCACE polymerizes.
CONCLUSION
FTIR was used effectively to study the copolymeriza-tion characteristics between HCA, CACE, with sty-rene. Based on FTIR results the reactivity ratios ofthree copolymerization systems S–HCA, S–CACE,and HCA–CACE were determined by three differentmethods (Mayo-Lewis, Fineman-Ross, and Kelen-Tu-
dos) are r1�0.336 and r2�0.964, r1�1.68, and r2�0.294,r1�1.057, and r2�0.688, respectively. The results thatwere determined by three different methods are invery good agreement.
The ability to predict terpolymer compositions withthe knowledge of the respective monomer concentra-tions and reactivity ratios is of significant importance,and helpful to control a composition drift in the rad-ical terpolymerization of the HCA–CACE–S system.
The authors would like to thank the OEAD (Austrian Aca-demic Exchange Service) which supported one of the au-thors (Le Huong Nguyen).
References
1. Desai, T. B.; Potnis, S. P. Paintindia 1977, May, 13.2. John, G.; Pillai, C. K. S. Makromol Chem Rapid Commun 1992,
13, 255.3. John, G.; Thomas, S. K.; Pillai, C. K. S. J Appl Polym Sci 1994, 53,
1415.4. Rempp, P.; Merrill, E. W. Polymer Synthesis; Huethig & Wepf
Verlag: Basel, 1986; p 91.5. Mayo, F. R.; Lewis, F. M. J Am Chem Soc 1944, 66, 1594.6. Fineman, M.; Ross, S. D. J Polym Sci 1950, 5, 259.7. Kelen, T.; Tudos, F. J Macromol Sci Chem. 1975, A9, 1.8. Kelen, T.; Tudos, F. Polym Bull 1980, 2, 71.9. Alfrey, T.; Goldfinger, G. J Chem Phys 1944, 12, 322.
10. Hocking, M. B.; Klimchuk, K. A. J Polym Sci Part A 1996, 34,2481.
11. Schoonbrood, H. A. S.; van Eijnatten, R. C. P. M.; van den Reijen,B.; Van Herk, A. M.; German, A. L. J Polym Sci Part A 1996, 34,935.
12. Sitaramam, B. S.; Chatterjee, P. C. J Appl Polym Sci 1989, 37, 33.13. Yang, Y. S.; James Lee, L. Macromolecules 1987, 20, 1490.14. Lee, S. Y.; Loh, K. Y.; Leong, L. S.; Goh, S. H. Eur Polym J 1992,
28, 229.15. Hannah, R. W.; Swinehart, J. S. Experiments in Techniques of
Infrared Spectroscopy; Perkin- Elmer: Norwalk, CT, 1974.16. Vogel’s. Textbook of Practical Organic Chemistry; Longman:
London, 1978; pp 246 and 947.17. Henniker, J. C. Infrared Spectrometry of Industrial Polymers;
Academic Press: London, 1967; p 146.
Figure 13 Triangular composition diagrams representingthe initial composition drift occurring in S–HCA–CACE rad-ical terpolymerization.
FREE RADICAL TERPOLYMERIZATION OF STYRENE, HCA, AND CACE 1409