Freddie Mac
78
OÅering Circular Supplement $942,605,008 (To OÅering Circular Dated June 1, 2003) Freddie Mac Multiclass CertiÑcates, Series 2979 OÅered Classes: REMIC Classes shown below and MACR Classes shown on Appendix A OÅering Terms: The underwriter named below is oÅering the Classes in negotiated transactions at varying prices Closing Date: May 27, 2005 REMIC Original Principal Class Interest CUSIP Final Payment REMIC Original Principal Class Interest CUSIP Final Payment Classes Balance Type(1) Coupon Type(1) Number Date Classes Balance Type(1) Coupon Type(1) Number Date Group 1 Group 5 BC ÏÏÏ $300,000,000 SC/SEQ 5.0% FIX 31395U M 2 4 April 15, 2020 DA ÏÏÏ $ 73,500,000 SEQ 4.89% FIX 31395UMB4 October 15, 2031 BI ÏÏÏ 32,856,357 SC/NTL(SEQ) 5.0 FIX/IO 31395U M 3 2 April 15, 2020 ID ÏÏÏ 1,617,000 NTL(SEQ) 5.0 FIX/IO 31395UMP3 October 15, 2031 BO ÏÏÏ 32,856,357 SC/SEQ 0.0 PO 31395U M 4 0 April 15, 2020 VK ÏÏÏ 8,394,483 AD/SEQ 5.0 FIX 31395U N S 6 May 15, 2016 VL ÏÏÏ 6,601,749 SEQ 5.0 FIX 31395U N T 4 February 15, 2022 Group 2 ZL ÏÏÏ 11,503,768 SEQ 5.0 FIX/Z 31395UNZ0 May 15, 2035 FB ÏÏÏ 6,070,429 SUP (2) FLT 31395UMG3 May 15, 2035 FP ÏÏÏ 16,975,000 PAC (2) FLT 31395UML2 May 15, 2035 Group 6 QG ÏÏÏ 21,999,000 PAC 5.0 FIX 31395UMZ1 April 15, 2026 TB ÏÏÏ 12,867,428 SC/TAC (2) INV/S/T/DLY 31395UNN7 April 15, 2035 QH ÏÏÏ 11,362,000 PAC 5.0 FIX 31395U N 2 3 September 15, 2030 TG ÏÏÏ 2,850,000 SC/TAC (2) INV/S/T/DLY 31395U N P 2 April 15, 2035 QJ ÏÏÏ 11,617,000 PAC 5.0 FIX 31395U N 4 9 January 15, 2034 XB ÏÏÏ 3,509,299 SC/TAC (2) FLT/S/T/DLY 31395UNU1 April 15, 2035 QK ÏÏÏ 5,947,000 PAC 5.0 FIX 31395U N 5 6 May 15, 2035 XG ÏÏÏ 777,273 SC/TAC (2) FLT/S/T/DLY 31395UNV9 April 15, 2035 SB ÏÏÏ 1,655,571 SUP (2) INV/S 31395UND9 May 15, 2035 Z ÏÏÏ 3,942,395 SC/SUP 5.5 FIX/Z 31395UNW7 April 15, 2035 SP ÏÏÏ 16,975,000 NTL(PAC) (2) INV/IO 31395UNK3 May 15, 2035 Group 7 TQ ÏÏÏ 14,318,856 SCH (2) INV/S/T/DLY 31395UNQ0 May 15, 2035 CD ÏÏÏ 10,000,000 JMP/SUP 4.5 FIX 31395U M 7 3 May 15, 2020 TW ÏÏÏ 3,905,144 SCH (2) FLT/S/T/DLY 31395UNR8 May 15, 2035 CE ÏÏÏ 10,000,000 JMP/SUP 4.5 FIX 31395U M 8 1 May 15, 2020 ZK ÏÏÏ 1,150,000 SUP 5.5 FIX/Z 31395UNY3 June 15, 2034 CZ ÏÏÏ 229,498 NSJ/SUP 4.5 FIX/Z 31395UMA6 February 15, 2018 Group 3 DZ ÏÏÏ 3,060 SUP 4.5 FIX/Z 31395UME8 May 15, 2020 BS ÏÏÏ 1,959,000 PAC I (2) INV/S 31395U M 5 7 May 15, 2035 QA ÏÏÏ 28,437,577 PAC 4.5 FIX 31395UMV0 October 15, 2014 DS ÏÏÏ 4,129,726 SUP (2) INV/S 31395UMD0 May 15, 2035 QB ÏÏÏ 17,767,748 PAC 4.5 FIX 31395UMW8 March 15, 2018 ES ÏÏÏ 17,447,000 PAC I (2) INV/S 31395UMF5 March 15, 2034 QC ÏÏÏ 3,899,327 PAC 4.5 FIX 31395UMX6 October 15, 2018 FE ÏÏÏ 50,000,000 PT (2) FLT 31395UMH1 May 15, 2035 QI ÏÏÏ 10,380,354 NTL(PAC) 4.5 FIX/IO 31395U N 3 1 May 15, 2020 FG ÏÏÏ 50,000,000 PT (2) FLT 31395U M J 7 May 15, 2035 QO ÏÏÏ 10,380,354 PAC 0.0 PO 31395U N 8 0 May 15, 2020 GS ÏÏÏ 20,354,835 NTL(PAC I) (2) INV/IO 31395UMM0 March 15, 2034 ZG ÏÏÏ 11,081,702 JMP/SUP 4.5 FIX/Z 31395UNX5 May 15, 2020 HS ÏÏÏ 3,737,000 PAC II (2) INV/S 31395UMN8 May 15, 2035 Group 8 IS ÏÏÏ 4,359,833 NTL(PAC II) (2) INV/IO 31395UMR9 May 15, 2035 MA ÏÏÏ 35,000,000 SEQ 4.375 FIX 31395UMS7 November 15, 2018 SN ÏÏÏ 50,000,000 NTL(PT) (2) INV/IO 31395U N J 6 May 15, 2035 MB ÏÏÏ 43,750,000 SEQ 5.5 FIX 31395UMT5 November 15, 2018 Group 4 MC ÏÏÏ 15,000,000 SEQ 5.0 FIX 31395UMU2 May 15, 2020 FJ ÏÏÏ 57,185,527 PT (2) FLT 31395UMK4 May 15, 2035 SL ÏÏÏ 4,158,947 SEQ (2) INV/S 31395UNH0 May 15, 2035 Residual ST ÏÏÏ 7,319,747 SEQ (2) INV/S 31395UNL1 November 15, 2032 R ÏÏÏ 0 NPR 0.0 NPR 31395U N 9 8 May 15, 2035 SU ÏÏÏ 9,316,043 SEQ (2) INV/S 31395UNM9 November 15, 2032 RS ÏÏÏ 0 NPR 0.0 NPR 31395U N B 3 May 15, 2035 (1) See Appendix II to the OÅering Circular and Payments Ì Categories of Classes. (2) See Terms Sheet Ì Interest. The CertiÑcates may not be suitable investments for you. You should not purchase CertiÑcates unless you have carefully considered and are able to bear the associated prepayment, interest rate, yield and market risks of investing in them. Certain Risk Considerations on page S-2 highlights some of these risks. You should purchase CertiÑcates only if you have read and understood this Supplement, the attached OÅering Circular and the documents listed under Available Information. We guarantee principal and interest payments on the CertiÑcates. These payments are not guaranteed by and are not debts or obligations of the United States or any federal agency or instrumentality other than Freddie Mac. The CertiÑcates are not tax-exempt. Because of applicable securities law exemptions, we have not registered the CertiÑcates with any federal or state securities commission. No securities commission has reviewed this Supplement. UBS Investment Bank April 18, 2005
-
Upload
khangminh22 -
Category
Documents
-
view
0 -
download
0
Transcript of Freddie Mac
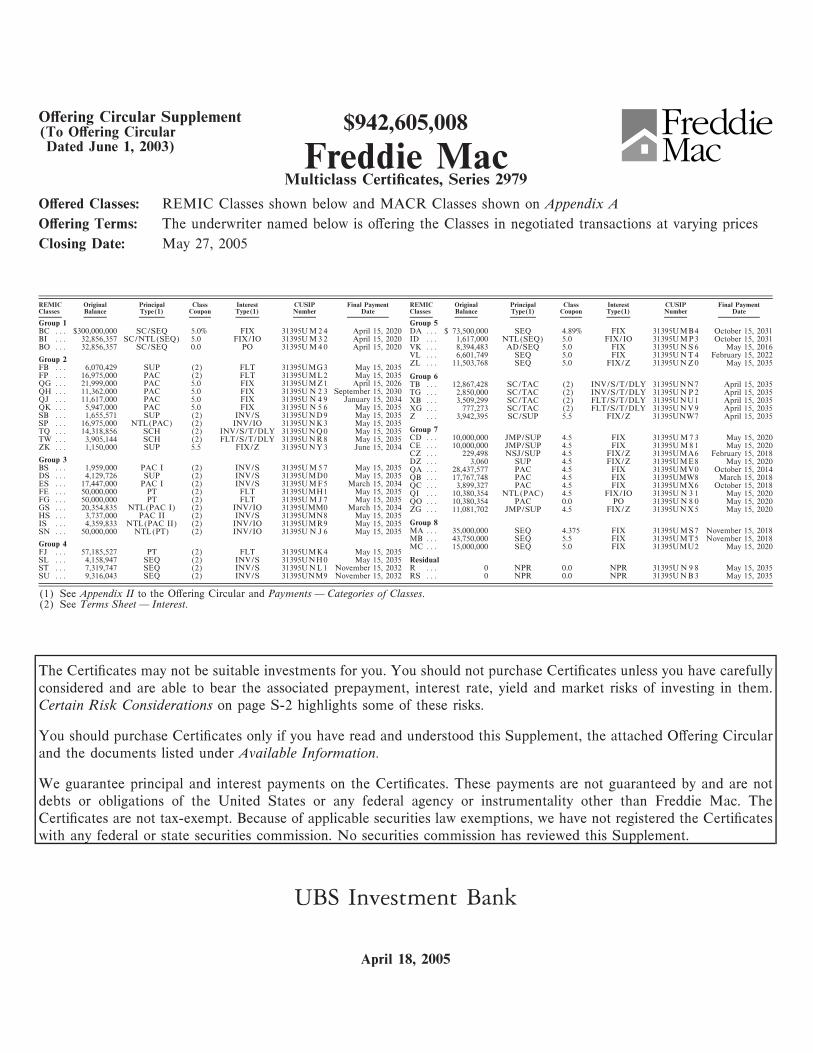
OÅering Circular Supplement $942,605,008(To OÅering CircularDated June 1, 2003) Freddie Mac
Multiclass CertiÑcates, Series 2979
OÅered Classes: REMIC Classes shown below and MACR Classes shown on Appendix A
OÅering Terms: The underwriter named below is oÅering the Classes in negotiated transactions at varying prices
Closing Date: May 27, 2005
REMIC Original Principal Class Interest CUSIP Final Payment REMIC Original Principal Class Interest CUSIP Final PaymentClasses Balance Type(1) Coupon Type(1) Number Date Classes Balance Type(1) Coupon Type(1) Number Date
Group 1 Group 5BC ÏÏÏ $300,000,000 SC/SEQ 5.0% FIX 31395UM24 April 15, 2020 DA ÏÏÏ $ 73,500,000 SEQ 4.89% FIX 31395UMB4 October 15, 2031BI ÏÏÏ 32,856,357 SC/NTL(SEQ) 5.0 FIX/IO 31395UM32 April 15, 2020 ID ÏÏÏ 1,617,000 NTL(SEQ) 5.0 FIX/IO 31395UMP3 October 15, 2031BO ÏÏÏ 32,856,357 SC/SEQ 0.0 PO 31395UM40 April 15, 2020 VK ÏÏÏ 8,394,483 AD/SEQ 5.0 FIX 31395UNS6 May 15, 2016
VL ÏÏÏ 6,601,749 SEQ 5.0 FIX 31395UNT4 February 15, 2022Group 2 ZL ÏÏÏ 11,503,768 SEQ 5.0 FIX/Z 31395UNZ0 May 15, 2035FB ÏÏÏ 6,070,429 SUP (2) FLT 31395UMG3 May 15, 2035FP ÏÏÏ 16,975,000 PAC (2) FLT 31395UML2 May 15, 2035 Group 6QG ÏÏÏ 21,999,000 PAC 5.0 FIX 31395UMZ1 April 15, 2026 TB ÏÏÏ 12,867,428 SC/TAC (2) INV/S/T/DLY 31395UNN7 April 15, 2035QH ÏÏÏ 11,362,000 PAC 5.0 FIX 31395U N 2 3 September 15, 2030 TG ÏÏÏ 2,850,000 SC/TAC (2) INV/S/T/DLY 31395UNP2 April 15, 2035QJ ÏÏÏ 11,617,000 PAC 5.0 FIX 31395U N 4 9 January 15, 2034 XB ÏÏÏ 3,509,299 SC/TAC (2) FLT/S/T/DLY 31395UNU1 April 15, 2035QK ÏÏÏ 5,947,000 PAC 5.0 FIX 31395U N 5 6 May 15, 2035 XG ÏÏÏ 777,273 SC/TAC (2) FLT/S/T/DLY 31395UNV9 April 15, 2035SB ÏÏÏ 1,655,571 SUP (2) INV/S 31395UND9 May 15, 2035 Z ÏÏÏ 3,942,395 SC/SUP 5.5 FIX/Z 31395UNW7 April 15, 2035SP ÏÏÏ 16,975,000 NTL(PAC) (2) INV/IO 31395UNK3 May 15, 2035
Group 7TQ ÏÏÏ 14,318,856 SCH (2) INV/S/T/DLY 31395UNQ0 May 15, 2035CD ÏÏÏ 10,000,000 JMP/SUP 4.5 FIX 31395UM73 May 15, 2020TW ÏÏÏ 3,905,144 SCH (2) FLT/S/T/DLY 31395UNR8 May 15, 2035CE ÏÏÏ 10,000,000 JMP/SUP 4.5 FIX 31395UM81 May 15, 2020ZK ÏÏÏ 1,150,000 SUP 5.5 FIX/Z 31395UNY3 June 15, 2034CZ ÏÏÏ 229,498 NSJ/SUP 4.5 FIX/Z 31395UMA6 February 15, 2018
Group 3 DZ ÏÏÏ 3,060 SUP 4.5 FIX/Z 31395UME8 May 15, 2020BS ÏÏÏ 1,959,000 PAC I (2) INV/S 31395UM57 May 15, 2035 QA ÏÏÏ 28,437,577 PAC 4.5 FIX 31395UMV0 October 15, 2014DS ÏÏÏ 4,129,726 SUP (2) INV/S 31395UMD0 May 15, 2035 QB ÏÏÏ 17,767,748 PAC 4.5 FIX 31395UMW8 March 15, 2018ES ÏÏÏ 17,447,000 PAC I (2) INV/S 31395UMF5 March 15, 2034 QC ÏÏÏ 3,899,327 PAC 4.5 FIX 31395UMX6 October 15, 2018FE ÏÏÏ 50,000,000 PT (2) FLT 31395UMH1 May 15, 2035 QI ÏÏÏ 10,380,354 NTL(PAC) 4.5 FIX/IO 31395U N 3 1 May 15, 2020FG ÏÏÏ 50,000,000 PT (2) FLT 31395U M J 7 May 15, 2035 QO ÏÏÏ 10,380,354 PAC 0.0 PO 31395U N 8 0 May 15, 2020GS ÏÏÏ 20,354,835 NTL(PAC I) (2) INV/IO 31395UMM0 March 15, 2034 ZG ÏÏÏ 11,081,702 JMP/SUP 4.5 FIX/Z 31395UNX5 May 15, 2020HS ÏÏÏ 3,737,000 PAC II (2) INV/S 31395UMN8 May 15, 2035
Group 8IS ÏÏÏ 4,359,833 NTL(PAC II) (2) INV/IO 31395UMR9 May 15, 2035MA ÏÏÏ 35,000,000 SEQ 4.375 FIX 31395UMS7 November 15, 2018SN ÏÏÏ 50,000,000 NTL(PT) (2) INV/IO 31395U N J 6 May 15, 2035MB ÏÏÏ 43,750,000 SEQ 5.5 FIX 31395UMT5 November 15, 2018
Group 4 MC ÏÏÏ 15,000,000 SEQ 5.0 FIX 31395UMU2 May 15, 2020FJ ÏÏÏ 57,185,527 PT (2) FLT 31395UMK4 May 15, 2035SL ÏÏÏ 4,158,947 SEQ (2) INV/S 31395UNH0 May 15, 2035 ResidualST ÏÏÏ 7,319,747 SEQ (2) INV/S 31395UNL1 November 15, 2032 R ÏÏÏ 0 NPR 0.0 NPR 31395U N 9 8 May 15, 2035SU ÏÏÏ 9,316,043 SEQ (2) INV/S 31395UNM9 November 15, 2032 RS ÏÏÏ 0 NPR 0.0 NPR 31395UNB3 May 15, 2035
(1) See Appendix II to the OÅering Circular and Payments Ì Categories of Classes.(2) See Terms Sheet Ì Interest.
The CertiÑcates may not be suitable investments for you. You should not purchase CertiÑcates unless you have carefullyconsidered and are able to bear the associated prepayment, interest rate, yield and market risks of investing in them.Certain Risk Considerations on page S-2 highlights some of these risks.
You should purchase CertiÑcates only if you have read and understood this Supplement, the attached OÅering Circularand the documents listed under Available Information.
We guarantee principal and interest payments on the CertiÑcates. These payments are not guaranteed by and are notdebts or obligations of the United States or any federal agency or instrumentality other than Freddie Mac. TheCertiÑcates are not tax-exempt. Because of applicable securities law exemptions, we have not registered the CertiÑcateswith any federal or state securities commission. No securities commission has reviewed this Supplement.
UBS Investment Bank
April 18, 2005
CERTAIN RISK CONSIDERATIONS
Although we guarantee the payments on the CertiÑcates, and so bear the associated credit risk,
as an investor you will bear the other risks of owning mortgage securities. This section highlights
some of these risks. You should also read Risk Factors and Prepayment, Yield and Suitability
Considerations in the OÅering Circular for further discussions of these risks.
The CertiÑcates May Not be Suitable Investments for You. The CertiÑcates are complex
securities. You should not purchase CertiÑcates unless you are able to understand and bear the
associated prepayment, interest rate, yield and market risks.
In particular, the Interest Only, Principal Only, Inverse Floating Rate, Toggle, Non-Sticky
Jump, Jump, Support, Accrual and Residual Classes have special risks and are not suitable for all
investors.
Prepayments Can Reduce Your Yield. The yield on your CertiÑcates could be lower than you
expect if:
‚ You buy your CertiÑcates at a premium over their principal amount and principal
payments are faster than you expect.
‚ You buy your CertiÑcates at a discount to their principal amount and principal
payments are slower than you expect. This is especially true for a Principal Only Class.
If you buy an Interest Only Class and prepayments are fast, you may not even recover your
investment.
LIBOR Levels Can Reduce Your Yield if You Own a Floating Rate or Inverse Floating Rate
Class. The yield on your CertiÑcates could be lower than you expect if:
‚ You buy a Floating Rate Class and LIBOR levels are lower than you expect.
‚ You buy an Inverse Floating Rate Class and LIBOR levels are higher than you expect.
If you buy an Interest Only Inverse Floating Rate Class, you may not even recover your investment
if LIBOR levels are high or prepayments are fast.
All of the Mortgages Backing the Group 4 Assets are Prepayment Protection Mortgages. The
Prepayment Protection Mortgages require a borrower to pay a prepayment premium under certain
circumstances if the borrower prepays the Mortgage during periods of up to three years from
origination. A prepayment premium may or may not discourage a borrower from prepaying the
Mortgage during the applicable period. We do not pass prepayment premiums through to investors.
The CertiÑcates are Subject to Market Risks. You will bear all of the market risks of your
investment. The market value of your CertiÑcates will vary over time, primarily in response to
changes in prevailing interest rates. If you sell your CertiÑcates when their market value is low, you
may experience signiÑcant losses. The underwriter named on the front cover (the ""Underwriter'')
intends to make a market for the purchase and sale of the CertiÑcates after they are issued, but has
no obligation to do so. A secondary market may not develop. Even if one does develop, it may not be
liquid enough to allow you to sell your CertiÑcates easily or at your desired price.
Our Multiclass CertiÑcates OÅering Circular dated June 1, 2003 (the ""OÅering Circular''),
attached to this Supplement, deÑnes many of the terms we use in this Supplement.
S-2
TERMS SHEET
This Terms Sheet contains selected information about this Series. You should refer to the
remainder of this Supplement for further information.
In this Supplement, we refer to Classes only by their letter designations. For example, ""R''
refers to the R Class of this Series.
Payment Dates
We make payments of principal and interest on the CertiÑcates on each monthly Payment Date
beginning in June 2005.
Form of Classes
Regular and MACR Classes: Book-entry on Fed System
Residual Classes: CertiÑcated
Interest
The Fixed Rate Classes bear interest at the Class Coupons shown on the front cover and
Appendix A.
BO and QO are Principal Only Classes and do not bear interest.
S-3

The Floating Rate and Inverse Floating Rate Classes bear interest as shown in the followingtable. The initial Class Coupons apply only to the Ñrst Accrual Period. We determine LIBOR usingthe BBA Method.
Class Coupon Subject toInitial ClassClass Coupon Class Coupon Formula Minimum Rate Maximum Rate
Group 2
FB ÏÏÏÏÏÏ 4.08% LIBOR ° 1.0% 1.0% 7.0%FPÏÏÏÏÏÏÏ 3.53 LIBOR ° 0.45% 0.45 7.0SB ÏÏÏÏÏÏ 10.706668 22.000005% ¿ (LIBOR £ 3.666668) 0 22.000005SPÏÏÏÏÏÏÏ 3.47 6.55% ¿ LIBOR 0 6.55
ETQ(1) ÏÏÏ 7.0 If LIBOR is greater than 7.0%: 0.0%F 0 7.0If LIBOR is less than or equal to 7.0%: 7.0%H
ETW(1)ÏÏÏ 0.0 If LIBOR is greater than 7.0%: 25.6666578%F 0 25.6666578If LIBOR is less than or equal to 7.0%: 0.0%H
Group 3
AS(2) ÏÏÏ 13.273333 24.273334% ¿ (LIBOR £ 3.666667) 0 24.273334BS ÏÏÏÏÏÏ 13.273333 24.273334% ¿ (LIBOR £ 3.666667) 0 24.273334CS(2) ÏÏÏ 13.273333 24.273334% ¿ (LIBOR £ 3.666667) 0 24.273334DS ÏÏÏÏÏÏ 13.273333 24.273334% ¿ (LIBOR £ 3.666667) 0 24.273334ES ÏÏÏÏÏÏ 9.05 16.55% ¿ (LIBOR £ 2.5) 0 16.55FE ÏÏÏÏÏÏ 3.37 LIBOR ° 0.37% 0.37 7.0FG ÏÏÏÏÏÏ 3.38 LIBOR ° 0.38% 0.38 7.0GS ÏÏÏÏÏÏ 3.62 6.62% ¿ LIBOR 0 6.62HS ÏÏÏÏÏÏ 9.05 16.55% ¿ (LIBOR £ 2.5) 0 16.55IS ÏÏÏÏÏÏÏ 3.62 6.62% ¿ LIBOR 0 6.62SH(2) ÏÏÏ 13.273333 24.273334% ¿ (LIBOR £ 3.666667) 0 24.273334SN ÏÏÏÏÏÏ 0.01 6.63% ¿ LIBOR 0 0.01
Group 4
FJÏÏÏÏÏÏÏ 3.39 LIBOR ° 0.30% 0.3 7.5SJ(2)ÏÏÏÏ 11.3025 19.8% ¿ (LIBOR £ 2.75) 0 19.8SK(2) ÏÏÏ 11.3025 19.8% ¿ (LIBOR £ 2.75) 0 19.8SL ÏÏÏÏÏÏ 11.3025 19.8% ¿ ( LIBOR £ 2.75) 0 19.8ST ÏÏÏÏÏÏ 7.5 45.0% ¿ (LIBOR £ 6.25) 0 7.5SU ÏÏÏÏÏÏ 14.29017774 29.464284% ¿ (LIBOR £ 4.910714) 0 29.464284
Group 6
ETB(1) ÏÏÏ 7.0 If LIBOR is greater than 6.5%: 0.0%F 0 7.0If LIBOR is less than or equal to 6.5%: 7.0%H
ETG(1) ÏÏÏ 7.0 If LIBOR is greater than 7.0%: 0.0%F 0 7.0If LIBOR is less than or equal to 7.0%: 7.0%H
EXB(1) ÏÏÏ 0.0 If LIBOR is greater than 6.5%: 25.66666334%F 0 25.66666334If LIBOR is less than or equal to 6.5%: 0.0%H
EXG(1) ÏÏÏ 0.0 If LIBOR is greater than 7.0%: 25.66665766%F 0 25.66665766If LIBOR is less than or equal to 7.0%: 0.0%H
(1) Delay Class.(2) MACR Class.
See Appendix V to the OÅering Circular and Payments Ì Interest.
S-4

Notional Classes
Original NotionalClass Principal Amount Reduces Proportionately With
Group 1BI $32,856,357 BO (SC/SEQ)
Group 2IQ* $ 1,999,909 QG (PAC)SP 16,975,000 FP (PAC)
Group 3SN $50,000,000 FE (PT)GS 20,354,835 ES (PAC I)IS 4,359,833 HS (PAC II)
Group 5ID $ 1,617,000 DA (SEQ)
Group 7QI $10,380,354 QO (PAC)
* MACR Class.
See Payments Ì Interest Ì Notional Classes.
MACR Classes
This Series includes MACR Classes. Appendix A shows the characteristics of the MACR
Classes and the Combinations of REMIC and MACR Classes.
See Appendix III to the OÅering Circular for a description of MACR CertiÑcates and
exchange procedures and fees.
Principal
REMIC Classes
On each Payment Date, we pay:
Group 1SC/ A
SequentialB ‚ The Group 1 Asset Principal Amount to BO and BC, in that order, until retired
PayD
Group 2
AScheduledB ‚ The ZK Accrual Amount to TQ and TW, pro rata, until retired, and then to ZKand AccrualD
‚ The Group 2 Asset Principal Amount in the following order of priority:
A 1. To the PAC Classes, until reduced to their Aggregate Targeted Balance, allocated
concurrently:PAC
B
a. 25%, to FP, while outstanding
D b. 75% to QG, QH, QJ and QK, in that order, while outstanding
A
ScheduledB 2. To TQ and TW, pro rata, until reduced to their Aggregate Targeted BalanceD
A 3. To ZK, until retiredSupport
B
D 4. To FB and SB, pro rata, until retired
S-5

A
ScheduledB 5. To TQ and TW, pro rata, until retiredD
A 6. To the PAC Classes as described in step 1 above, but without regard to theirPAC
B
D Aggregate Targeted Balance, until retired
Group 3
‚ The Group 3 Asset Principal Amount, allocated concurrently:
A 1. 39.2857146786% to FE, until retiredPass-BThrough
D 2. 39.2857146786% to FG, until retired
3. 21.4285706428% as follows:
A
Type I PACB a. To ES and BS, in that order, until reduced to their Aggregate Targeted BalanceD
A
Type II PACB b. To HS, until reduced to its Targeted BalanceD
A
SupportB c. To DS, until retiredD
A
Type II PACB d. To HS, until retiredD
A
Type I PACB e. To ES and BS, in that order, until retiredD
Group 4
‚ The Group 4 Asset Principal Amount, allocated concurrently:
APass-B 1. 73.3333334188% to FJ, until retiredThroughD
A 2. 26.6666665812% as follows:Sequential
B a. To ST and SU, pro rata, until retiredPay
D b. To SL, until retired
Group 5Sequential A
PayB ‚ The ZL Accrual Amount to VK and VL, in that order, until retired, and then to ZL
and AccrualD
A ‚ The Group 5 Asset Principal Amount to DA, VK, VL and ZL, in that order, untilSequentialBPayD retired
Group 6
A ‚ The Z Accrual Amount to TB, TG, XB and XG, pro rata, until reduced to theirSC/TACBand AccrualD Aggregate Targeted Balance, and then to Z
‚ The Group 6 Asset Principal Amount in the following order of priority:
A
SC/TACB 1. To TB, TG, XB and XG, pro rata, until reduced to their Aggregate Targeted BalanceD
A
SC/SupportB 2. To Z, until retiredD
A
SC/TACB 3. To TB, TG, XB and XG, pro rata, until retiredD
S-6
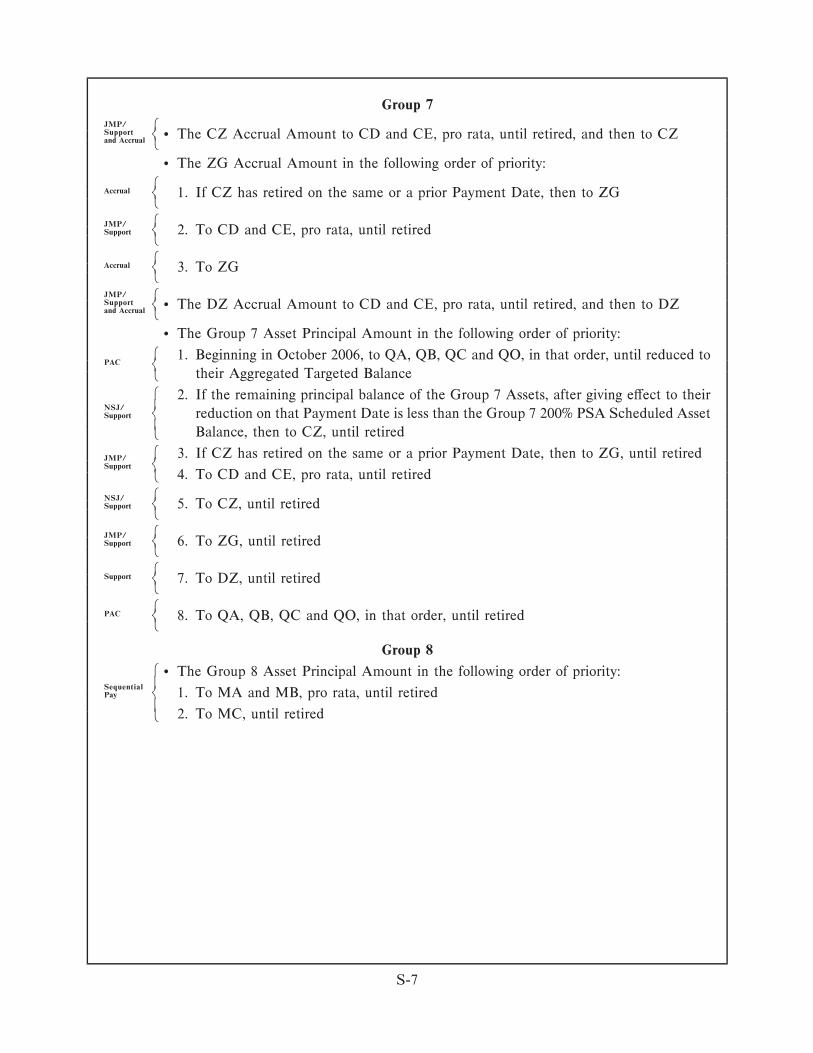
Group 7JMP/ A
SupportB ‚ The CZ Accrual Amount to CD and CE, pro rata, until retired, and then to CZ
and AccrualD
‚ The ZG Accrual Amount in the following order of priority:
A
AccrualB 1. If CZ has retired on the same or a prior Payment Date, then to ZGD
AJMP/B 2. To CD and CE, pro rata, until retiredSupportD
A
AccrualB 3. To ZGD
JMP/ A
SupportB ‚ The DZ Accrual Amount to CD and CE, pro rata, until retired, and then to DZ
and AccrualD
‚ The Group 7 Asset Principal Amount in the following order of priority:
A 1. Beginning in October 2006, to QA, QB, QC and QO, in that order, until reduced toPAC
B
D their Aggregated Targeted Balance
A 2. If the remaining principal balance of the Group 7 Assets, after giving eÅect to theirNSJ/
B reduction on that Payment Date is less than the Group 7 200% PSA Scheduled AssetSupport
D Balance, then to CZ, until retired
A 3. If CZ has retired on the same or a prior Payment Date, then to ZG, until retiredJMP/BSupport
D 4. To CD and CE, pro rata, until retired
ANSJ/B 5. To CZ, until retiredSupportD
AJMP/B 6. To ZG, until retiredSupportD
A
SupportB 7. To DZ, until retiredD
A
PACB 8. To QA, QB, QC and QO, in that order, until retiredD
Group 8
A ‚ The Group 8 Asset Principal Amount in the following order of priority:Sequential
B 1. To MA and MB, pro rata, until retiredPay
D 2. To MC, until retired
S-7
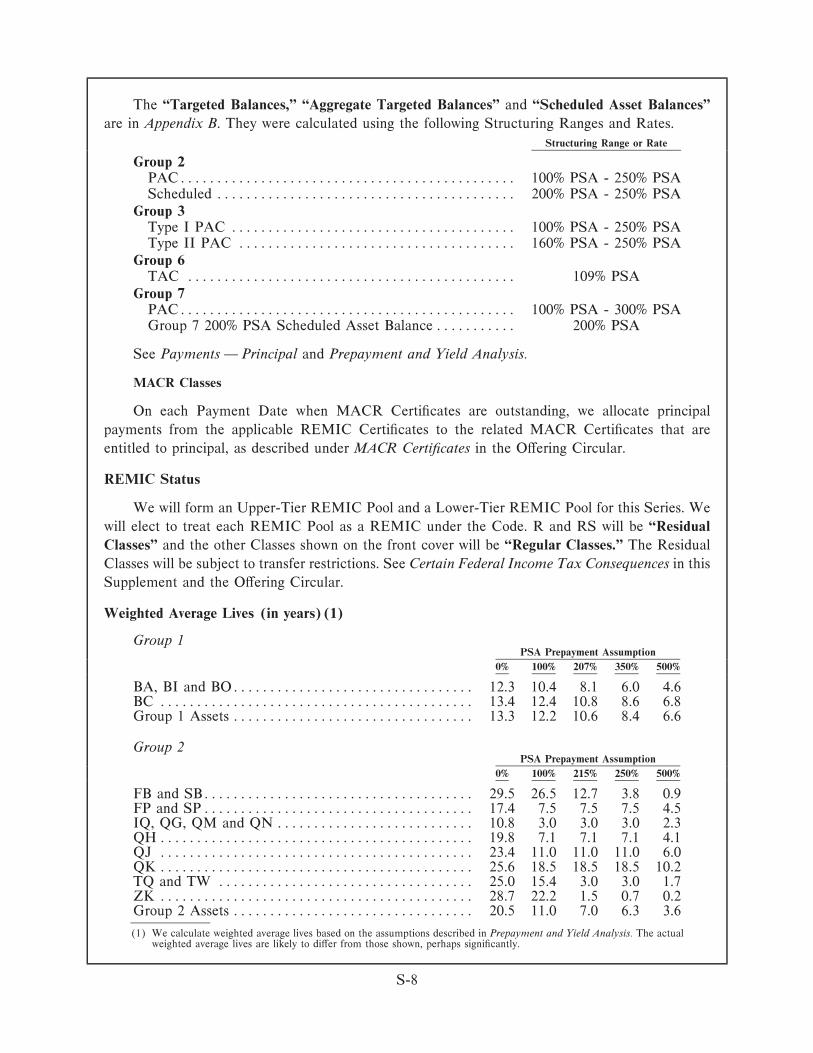
The ""Targeted Balances,'' ""Aggregate Targeted Balances'' and ""Scheduled Asset Balances''
are in Appendix B. They were calculated using the following Structuring Ranges and Rates.
Structuring Range or Rate
Group 2PACÏÏÏÏÏÏÏÏÏÏÏÏÏÏÏÏÏÏÏÏÏÏÏÏÏÏÏÏÏÏÏÏÏÏÏÏÏÏÏÏÏÏÏÏÏÏ 100% PSA - 250% PSAScheduled ÏÏÏÏÏÏÏÏÏÏÏÏÏÏÏÏÏÏÏÏÏÏÏÏÏÏÏÏÏÏÏÏÏÏÏÏÏÏÏÏÏ 200% PSA - 250% PSA
Group 3Type I PAC ÏÏÏÏÏÏÏÏÏÏÏÏÏÏÏÏÏÏÏÏÏÏÏÏÏÏÏÏÏÏÏÏÏÏÏÏÏÏÏ 100% PSA - 250% PSAType II PAC ÏÏÏÏÏÏÏÏÏÏÏÏÏÏÏÏÏÏÏÏÏÏÏÏÏÏÏÏÏÏÏÏÏÏÏÏÏÏ 160% PSA - 250% PSA
Group 6TAC ÏÏÏÏÏÏÏÏÏÏÏÏÏÏÏÏÏÏÏÏÏÏÏÏÏÏÏÏÏÏÏÏÏÏÏÏÏÏÏÏÏÏÏÏÏ 109% PSA
Group 7PACÏÏÏÏÏÏÏÏÏÏÏÏÏÏÏÏÏÏÏÏÏÏÏÏÏÏÏÏÏÏÏÏÏÏÏÏÏÏÏÏÏÏÏÏÏÏ 100% PSA - 300% PSAGroup 7 200% PSA Scheduled Asset Balance ÏÏÏÏÏÏÏÏÏÏÏ 200% PSA
See Payments Ì Principal and Prepayment and Yield Analysis.
MACR Classes
On each Payment Date when MACR CertiÑcates are outstanding, we allocate principal
payments from the applicable REMIC CertiÑcates to the related MACR CertiÑcates that are
entitled to principal, as described under MACR CertiÑcates in the OÅering Circular.
REMIC Status
We will form an Upper-Tier REMIC Pool and a Lower-Tier REMIC Pool for this Series. We
will elect to treat each REMIC Pool as a REMIC under the Code. R and RS will be ""Residual
Classes'' and the other Classes shown on the front cover will be ""Regular Classes.'' The Residual
Classes will be subject to transfer restrictions. See Certain Federal Income Tax Consequences in this
Supplement and the OÅering Circular.
Weighted Average Lives (in years)(1)
Group 1PSA Prepayment Assumption
0% 100% 207% 350% 500%
BA, BI and BOÏÏÏÏÏÏÏÏÏÏÏÏÏÏÏÏÏÏÏÏÏÏÏÏÏÏÏÏÏÏÏÏÏ 12.3 10.4 8.1 6.0 4.6BC ÏÏÏÏÏÏÏÏÏÏÏÏÏÏÏÏÏÏÏÏÏÏÏÏÏÏÏÏÏÏÏÏÏÏÏÏÏÏÏÏÏÏÏ 13.4 12.4 10.8 8.6 6.8Group 1 Assets ÏÏÏÏÏÏÏÏÏÏÏÏÏÏÏÏÏÏÏÏÏÏÏÏÏÏÏÏÏÏÏÏÏ 13.3 12.2 10.6 8.4 6.6
Group 2PSA Prepayment Assumption
0% 100% 215% 250% 500%
FB and SBÏÏÏÏÏÏÏÏÏÏÏÏÏÏÏÏÏÏÏÏÏÏÏÏÏÏÏÏÏÏÏÏÏÏÏÏÏ 29.5 26.5 12.7 3.8 0.9FP and SPÏÏÏÏÏÏÏÏÏÏÏÏÏÏÏÏÏÏÏÏÏÏÏÏÏÏÏÏÏÏÏÏÏÏÏÏÏ 17.4 7.5 7.5 7.5 4.5IQ, QG, QM and QN ÏÏÏÏÏÏÏÏÏÏÏÏÏÏÏÏÏÏÏÏÏÏÏÏÏÏÏ 10.8 3.0 3.0 3.0 2.3QHÏÏÏÏÏÏÏÏÏÏÏÏÏÏÏÏÏÏÏÏÏÏÏÏÏÏÏÏÏÏÏÏÏÏÏÏÏÏÏÏÏÏÏ 19.8 7.1 7.1 7.1 4.1QJ ÏÏÏÏÏÏÏÏÏÏÏÏÏÏÏÏÏÏÏÏÏÏÏÏÏÏÏÏÏÏÏÏÏÏÏÏÏÏÏÏÏÏÏ 23.4 11.0 11.0 11.0 6.0QK ÏÏÏÏÏÏÏÏÏÏÏÏÏÏÏÏÏÏÏÏÏÏÏÏÏÏÏÏÏÏÏÏÏÏÏÏÏÏÏÏÏÏÏ 25.6 18.5 18.5 18.5 10.2TQ and TW ÏÏÏÏÏÏÏÏÏÏÏÏÏÏÏÏÏÏÏÏÏÏÏÏÏÏÏÏÏÏÏÏÏÏÏ 25.0 15.4 3.0 3.0 1.7ZK ÏÏÏÏÏÏÏÏÏÏÏÏÏÏÏÏÏÏÏÏÏÏÏÏÏÏÏÏÏÏÏÏÏÏÏÏÏÏÏÏÏÏÏ 28.7 22.2 1.5 0.7 0.2Group 2 Assets ÏÏÏÏÏÏÏÏÏÏÏÏÏÏÏÏÏÏÏÏÏÏÏÏÏÏÏÏÏÏÏÏÏ 20.5 11.0 7.0 6.3 3.6
(1) We calculate weighted average lives based on the assumptions described in Prepayment and Yield Analysis. The actualweighted average lives are likely to diÅer from those shown, perhaps signiÑcantly.
S-8

Group 3PSA Prepayment Assumption
0% 100% 220% 250% 500%
AS, ES and GS ÏÏÏÏÏÏÏÏÏÏÏÏÏÏÏÏÏÏÏÏÏÏÏÏÏÏÏÏÏÏÏÏ 16.4 6.0 6.0 6.0 3.5BS ÏÏÏÏÏÏÏÏÏÏÏÏÏÏÏÏÏÏÏÏÏÏÏÏÏÏÏÏÏÏÏÏÏÏÏÏÏÏÏÏÏÏÏ 25.7 18.9 18.9 18.9 10.3CS, HS and IS ÏÏÏÏÏÏÏÏÏÏÏÏÏÏÏÏÏÏÏÏÏÏÏÏÏÏÏÏÏÏÏÏÏ 27.2 14.7 3.2 3.2 1.5DS ÏÏÏÏÏÏÏÏÏÏÏÏÏÏÏÏÏÏÏÏÏÏÏÏÏÏÏÏÏÏÏÏÏÏÏÏÏÏÏÏÏÏÏ 29.1 23.8 6.6 2.5 0.8FE, FG, SH, SN and Group 3 AssetsÏÏÏÏÏÏÏÏÏÏÏÏÏÏ 20.5 10.8 6.6 6.0 3.3
Group 4Vector Prepayment Assumption(2)
0% 50% 100% 150% 200%
FJ, SJ and Group 4 Assets ÏÏÏÏÏÏÏÏÏÏÏÏÏÏÏÏÏÏÏÏÏÏÏ 20.5 9.4 5.9 4.2 3.3SK, ST and SU ÏÏÏÏÏÏÏÏÏÏÏÏÏÏÏÏÏÏÏÏÏÏÏÏÏÏÏÏÏÏÏÏ 18.4 6.5 3.9 2.8 2.2SL ÏÏÏÏÏÏÏÏÏÏÏÏÏÏÏÏÏÏÏÏÏÏÏÏÏÏÏÏÏÏÏÏÏÏÏÏÏÏÏÏÏÏÏ 28.8 20.8 13.8 9.8 7.5
Group 5PSA Prepayment Assumption
0% 100% 181% 300% 400%
DA and ID ÏÏÏÏÏÏÏÏÏÏÏÏÏÏÏÏÏÏÏÏÏÏÏÏÏÏÏÏÏÏÏÏÏÏÏÏ 17.3 6.6 4.2 2.8 2.2DE ÏÏÏÏÏÏÏÏÏÏÏÏÏÏÏÏÏÏÏÏÏÏÏÏÏÏÏÏÏÏÏÏÏÏÏÏÏÏÏÏÏÏÏ 28.3 20.9 15.8 10.8 8.3VK ÏÏÏÏÏÏÏÏÏÏÏÏÏÏÏÏÏÏÏÏÏÏÏÏÏÏÏÏÏÏÏÏÏÏÏÏÏÏÏÏÏÏÏ 6.0 6.0 6.0 5.0 4.2VL ÏÏÏÏÏÏÏÏÏÏÏÏÏÏÏÏÏÏÏÏÏÏÏÏÏÏÏÏÏÏÏÏÏÏÏÏÏÏÏÏÏÏÏ 14.0 13.8 11.0 7.7 6.1ZL ÏÏÏÏÏÏÏÏÏÏÏÏÏÏÏÏÏÏÏÏÏÏÏÏÏÏÏÏÏÏÏÏÏÏÏÏÏÏÏÏÏÏÏ 28.3 21.3 17.2 12.5 9.9Group 5 Assets ÏÏÏÏÏÏÏÏÏÏÏÏÏÏÏÏÏÏÏÏÏÏÏÏÏÏÏÏÏÏÏÏÏ 20.2 10.4 7.3 4.9 3.8
Group 6PSA Prepayment Assumption
0% 100% 253% 450% 600%
CB, TB, TG, XB and XGÏÏÏÏÏÏÏÏÏÏÏÏÏÏÏÏÏÏÏÏÏÏÏÏ 19.2 12.3 4.7 1.5 1.1ZÏÏÏÏÏÏÏÏÏÏÏÏÏÏÏÏÏÏÏÏÏÏÏÏÏÏÏÏÏÏÏÏÏÏÏÏÏÏÏÏÏÏÏÏÏ 25.8 18.1 0.7 0.5 0.4Group 6 Assets ÏÏÏÏÏÏÏÏÏÏÏÏÏÏÏÏÏÏÏÏÏÏÏÏÏÏÏÏÏÏÏÏÏ 25.4 15.4 4.0 1.3 1.0
Group 7CPR
PrepaymentPSA Prepayment Assumption Assumption
0% 100% 169% 200% 201% 300% 400% 6.0%
CD and CE ÏÏÏÏÏÏÏÏÏÏÏÏÏÏÏ 7.1 3.9 1.6 1.3 6.5 2.5 1.8 10.6CZ ÏÏÏÏÏÏÏÏÏÏÏÏÏÏÏÏÏÏÏÏÏÏ 12.7 9.2 4.9 3.3 0.1 0.1 0.1 0.1ZG ÏÏÏÏÏÏÏÏÏÏÏÏÏÏÏÏÏÏÏÏÏÏ 13.9 12.0 10.4 8.9 0.7 0.6 0.6 0.6
PSA Prepayment Assumption
0% 100% 169% 300% 400%
DZ ÏÏÏÏÏÏÏÏÏÏÏÏÏÏÏÏÏÏÏÏÏÏÏÏÏÏÏÏÏÏÏÏÏÏÏÏÏÏÏÏÏÏÏ 15.0 14.6 14.6 5.6 2.8QA ÏÏÏÏÏÏÏÏÏÏÏÏÏÏÏÏÏÏÏÏÏÏÏÏÏÏÏÏÏÏÏÏÏÏÏÏÏÏÏÏÏÏÏ 4.6 3.0 3.0 3.0 2.8QB ÏÏÏÏÏÏÏÏÏÏÏÏÏÏÏÏÏÏÏÏÏÏÏÏÏÏÏÏÏÏÏÏÏÏÏÏÏÏÏÏÏÏÏ 8.8 6.0 6.0 6.0 5.0QC ÏÏÏÏÏÏÏÏÏÏÏÏÏÏÏÏÏÏÏÏÏÏÏÏÏÏÏÏÏÏÏÏÏÏÏÏÏÏÏÏÏÏÏ 10.4 8.0 8.0 8.0 6.6QD, QI and QOÏÏÏÏÏÏÏÏÏÏÏÏÏÏÏÏÏÏÏÏÏÏÏÏÏÏÏÏÏÏÏÏ 11.7 10.7 10.7 10.7 9.3Group 7 Assets ÏÏÏÏÏÏÏÏÏÏÏÏÏÏÏÏÏÏÏÏÏÏÏÏÏÏÏÏÏÏÏÏÏ 8.8 6.4 5.5 4.3 3.6
Group 8PSA Prepayment Assumption
0% 100% 213% 350% 500%
MA and MB ÏÏÏÏÏÏÏÏÏÏÏÏÏÏÏÏÏÏÏÏÏÏÏÏÏÏÏÏÏÏÏÏÏÏÏ 7.9 4.5 3.2 2.3 1.7MCÏÏÏÏÏÏÏÏÏÏÏÏÏÏÏÏÏÏÏÏÏÏÏÏÏÏÏÏÏÏÏÏÏÏÏÏÏÏÏÏÏÏÏ 14.3 11.6 10.2 8.3 6.5Group 8 Assets ÏÏÏÏÏÏÏÏÏÏÏÏÏÏÏÏÏÏÏÏÏÏÏÏÏÏÏÏÏÏÏÏÏ 8.9 5.7 4.3 3.2 2.4
(2) See Prepayment and Yield Analysis Ì General Ì Modeling Assumptions for a deÑnition of ""Vector PrepaymentAssumption.''
S-9
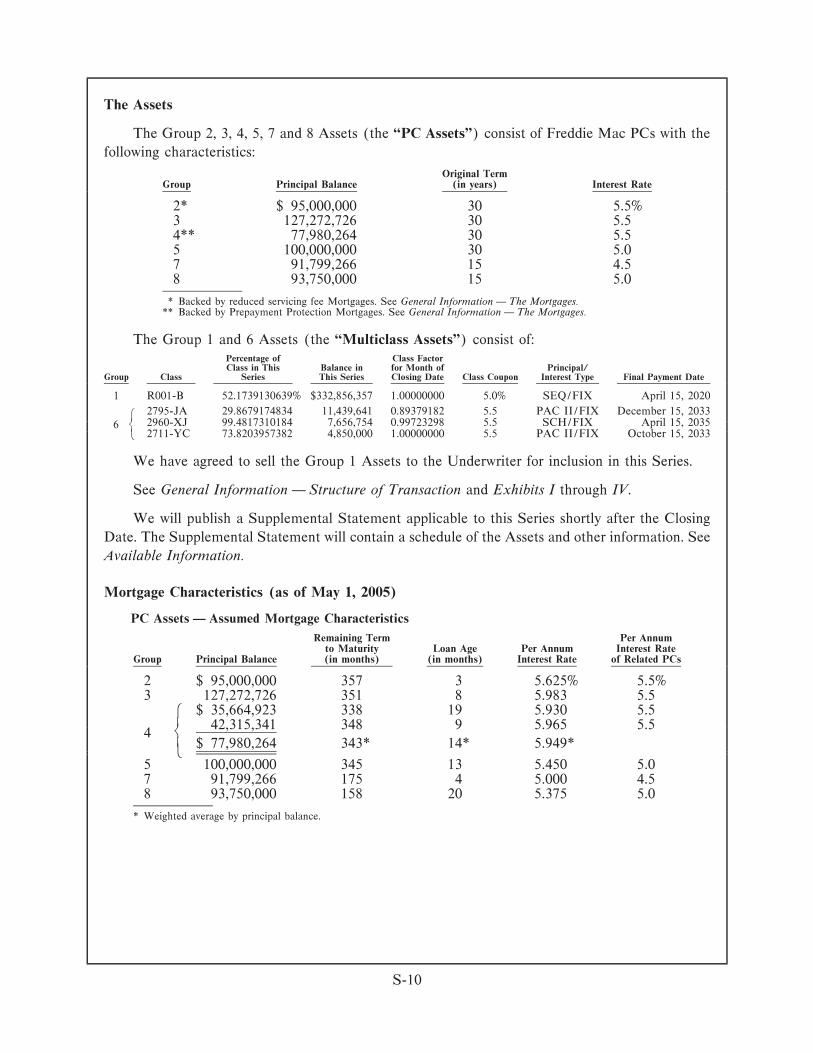
The Assets
The Group 2, 3, 4, 5, 7 and 8 Assets (the ""PC Assets'') consist of Freddie Mac PCs with the
following characteristics:
Original TermGroup Principal Balance (in years) Interest Rate
2* $ 95,000,000 30 5.5%3 127,272,726 30 5.54** 77,980,264 30 5.55 100,000,000 30 5.07 91,799,266 15 4.58 93,750,000 15 5.0
* Backed by reduced servicing fee Mortgages. See General Information Ì The Mortgages.** Backed by Prepayment Protection Mortgages. See General Information Ì The Mortgages.
The Group 1 and 6 Assets (the ""Multiclass Assets'') consist of:Percentage of Class FactorClass in This Balance in for Month of Principal/
Group Class Series This Series Closing Date Class Coupon Interest Type Final Payment Date
1 R001-B 52.1739130639% $332,856,357 1.00000000 5.0% SEQ/FIX April 15, 2020
2795-JA 29.8679174834 11,439,641 0.89379182 5.5 PAC II/FIX December 15, 2033A
2960-XJ 99.4817310184 7,656,754 0.99723298 5.5 SCH/FIX April 15, 2035B6D 2711-YC 73.8203957382 4,850,000 1.00000000 5.5 PAC II/FIX October 15, 2033
We have agreed to sell the Group 1 Assets to the Underwriter for inclusion in this Series.
See General Information Ì Structure of Transaction and Exhibits I through IV.
We will publish a Supplemental Statement applicable to this Series shortly after the Closing
Date. The Supplemental Statement will contain a schedule of the Assets and other information. See
Available Information.
Mortgage Characteristics (as of May 1, 2005)
PC Assets Ì Assumed Mortgage Characteristics
Remaining Term Per Annumto Maturity Loan Age Per Annum Interest Rate
Group Principal Balance (in months) (in months) Interest Rate of Related PCs
2 $ 95,000,000 357 3 5.625% 5.5%3 127,272,726 351 8 5.983 5.5
A $ 35,664,923 338 19 5.930 5.542,315,341 348 9 5.965 5.5
B4$ 77,980,264 343* 14* 5.949*
D
5 100,000,000 345 13 5.450 5.07 91,799,266 175 4 5.000 4.58 93,750,000 158 20 5.375 5.0
* Weighted average by principal balance.
S-10
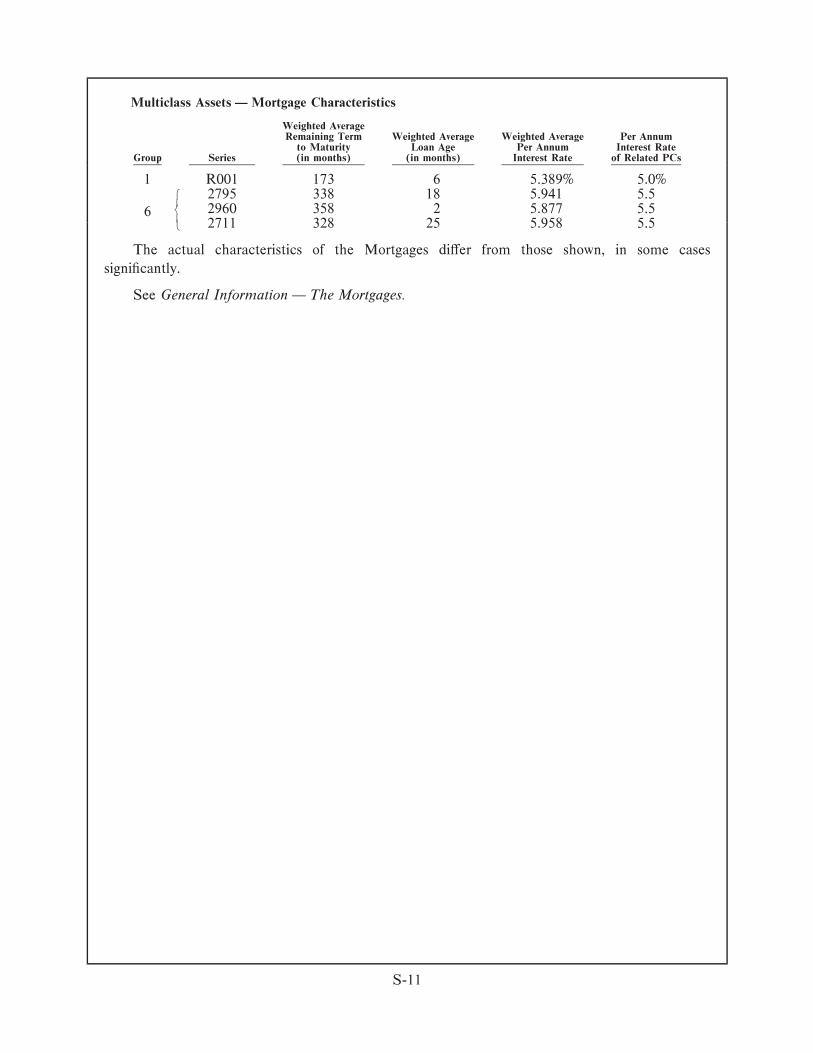
Multiclass Assets Ì Mortgage Characteristics
Weighted AverageRemaining Term Weighted Average Weighted Average Per Annum
to Maturity Loan Age Per Annum Interest RateGroup Series (in months) (in months) Interest Rate of Related PCs
1 R001 173 6 5.389% 5.0%A 2795 338 18 5.941 5.5B 2960 358 2 5.877 5.56D 2711 328 25 5.958 5.5
The actual characteristics of the Mortgages diÅer from those shown, in some cases
signiÑcantly.
See General Information Ì The Mortgages.
S-11
AVAILABLE INFORMATION
You should purchase CertiÑcates only if you have read and understood this Supplement, the
OÅering Circular and the following documents:
‚ Our Mortgage Participation CertiÑcates OÅering Circular dated July 1, 2004 and the
related OÅering Circular Supplement dated January 21, 2005, which together describe
Gold PCs generally.
‚ Our Giant and Other Pass-Through CertiÑcates OÅering Circular dated December 1,
1999 and the related OÅering Circular Supplements dated May 9, 2001, March 31,
2004 and January 21, 2005, which together describe Gold Giant PCs generally.
‚ If you are investing in a Group 1 or 6 Class, our OÅering Circular Supplements for the
related Multiclass Assets (each, a ""Multiclass Asset OÅering Circular''), the front
covers and Terms Sheets from which are in Exhibits I through IV.
‚ Our Information Statement dated September 24, 2004 and any subsequent Information
Statement and Information Statement Supplements published through the time of
purchase.
This Supplement incorporates by reference the documents listed above. We will also publish a
Supplemental Statement applicable to this Series shortly after the Closing Date. The Supplemental
Statement will contain a schedule of the Assets and other information. You should rely only on the
most current information provided or incorporated by reference in this Supplement and any
applicable Supplemental Statement.
You can obtain the documents listed above, the Agreement and current information concerning
the Assets and the CertiÑcates from our Investor Inquiry Department or our Internet Web-Site as
described on page 3 of the OÅering Circular. You can also obtain the documents listed above from
the Underwriter at:
UBS Securities LLC
Prospectus Department
1000 Harbor Boulevard
Weehawken, New Jersey 07087
(201) 352-6858
GENERAL INFORMATION
The Agreement
We will create the CertiÑcates under the Multiclass CertiÑcates Agreement dated June 1, 2003
and a Terms Supplement dated the Closing Date (together, the ""Agreement'').
You should refer to the Agreement for a complete description of your rights and obligations and
those of Freddie Mac. You will acquire your CertiÑcates subject to the terms and conditions of the
Agreement, including the Terms Supplement.
S-12

Form of CertiÑcates
The Regular and MACR Classes are issued, held and transferable on the Fed System. The
Residual Classes are issued and held in certiÑcated form and are transferable at the oÇce of the
Registrar.
Only a Fed Participant can be a Holder of a Regular or MACR Class. As an investor in
CertiÑcates, you are not necessarily the Holder.
See Description of CertiÑcates Ì Form, Holders and Payment Procedures in the OÅering
Circular.
Denominations of CertiÑcates
The Jump Classes (other than the Non-Sticky Jump Class) will be issued, and may be held
and transferred, in minimum original principal amounts of $1,000,000 and additional increments of
$1. The Inverse Floating Rate, Toggle and Non-Sticky Jump Classes will be issued, and may be
held and transferred, in minimum original principal or notional principal amounts of $100,000 and
additional increments of $1. See Description of CertiÑcates Ì Form, Holders and Payment
Procedures in the OÅering Circular for the minimum denominations of the other Classes.
Structure of Transaction
General
This Series is a Double-Tier Series, structured as follows:
REMIC Pool Classes Issued from REMIC Pool REMIC Pool Assets
Upper-Tier All Regular Classes and R All Lower-Tier regular interests
Lower-Tier RS The Assets
See Description of CertiÑcates Ì REMIC Pool Structures in the OÅering Circular.
The PC Assets
The PC Assets are Gold PCs and/or Gold Giant PCs.
The Multiclass Assets
The Multiclass Assets consist of previously issued Freddie Mac REMIC Classes, which
represent interests in their underlying PCs.
For additional information about the Multiclass Assets, see the Multiclass Asset OÅering
Circulars and other related information on our Internet Web-Site. We have attached the front
covers and Terms Sheets from the Multiclass Asset OÅering Circulars as Exhibits to this
Supplement.
There may have been material changes since we prepared the Multiclass Asset OÅering
Circulars, including changes in prepayment rates, prevailing interest rates and other economic
factors. These changes may limit the usefulness of, and be inconsistent with the assumptions used in
preparing, the Multiclass Asset OÅering Circulars.
S-13
The Mortgages
The Mortgages underlying the Assets (the ""Mortgages'') are Ñxed-rate, Ñrst lien residential
mortgages and mortgage participations.
For purposes of this Supplement, we have made certain assumptions regarding the Mortgages
underlying the PC Assets, as shown under Terms Sheet Ì Mortgage Characteristics. The weighted
average remaining terms to maturity, weighted average loan ages and weighted average interest rates
of the Mortgages underlying the Multiclass Assets, as of May 1, 2005, are shown under Terms
Sheet Ì Mortgage Characteristics. However, the actual characteristics of most of the Mortgages
diÅer from those assumed or shown, perhaps signiÑcantly. This is the case even if the weighted
average characteristics of the Mortgages are the same as those of mortgages having the characteris-
tics assumed or shown.
On account of arrangements between sellers of Mortgages underlying the Group 2 Assets and
us, such Mortgages have minimum servicing fee levels that are below the minimum servicing fee
level of 0.25% per annum of the principal balance of each Mortgage, which is the prevailing
minimum servicing fee level for Mortgages we acquire. The Mortgages underlying the Group 2
Assets generally have a minimum servicing fee of 0.125% per annum.
The Mortgages backing the Group 4 Assets are ""Prepayment Protection Mortgages.'' These
Mortgages require prepayment premiums equal to 2% of the prepayment amount to be paid under
certain circumstances when prepayments are made within three years of origination.
Servicers have the option not to enforce prepayment premiums if they result from a sale of the
mortgaged property, but otherwise are generally required to enforce them according to the terms of
the Mortgage and applicable law. The servicer retains the prepayment premium, and it is not passed
through to investors.
We will furnish some of the Assets from our own portfolio. Assets from our portfolio, or from
other sources, may emphasize speciÑc Mortgage characteristics, such as loan purpose, source of
origination, geographic distribution or loan size, or speciÑc borrower characteristics, such as credit
rating or equity in the property. You can obtain information about the underlying Mortgage
characteristics for the Assets from our Internet Web-Site.
PAYMENTS
Payment Dates; Record Dates
We make payments of principal and interest on the CertiÑcates on each Payment Date,
beginning in the month following the Closing Date. A ""Payment Date'' is the 15th of each month
or, if the 15th is not a Business Day, the next Business Day.
On each Payment Date, any payment on a CertiÑcate is made to the Holder of record as of the
end of the preceding calendar month (a ""Record Date'').
Method of Payment
You will receive payments on your CertiÑcates in the manner described under Description of
CertiÑcates Ì Form, Holders and Payment Procedures in the OÅering Circular.
S-14
Categories of Classes
For purposes of principal and interest payments, we have categorized the Classes as shown
under ""Principal Type'' and ""Interest Type'' on the front cover and Appendix A. Appendix II to the
OÅering Circular explains the abbreviations used for categories of Classes.
The following deÑnitions also apply to certain Classes of this Series:
Freddie MacStandard
Abbreviation Category of Class DeÑnition
JMP Jump Classes whose principal payment priorities change upon theoccurrence of multiple ""trigger'' or other priority-changingconditions. This category includes Classes whose priority-changing conditions fail to satisfy the requirements for the Non-Sticky Jump or Sticky Jump designation.
NSJ Non-Sticky Jump Classes whose principal payment priorities change temporarilyupon the occurrence of a single ""trigger'' or priority-changingcondition. A Non-Sticky Jump Class ""jumps'' or is ""jumped''(changes its principal payment priority to its new priority) oneach Payment Date when the condition is met and reverts to itsoriginal priority (does not ""stick'' to the new priority) on eachPayment Date when the condition is not met.
S Structured Floating Rate and Inverse Floating Rate Classes with ClassFormula Coupons that are periodically reset using a formula other than an
Index (without any multiplier) plus a constant, in the case ofFloating Rate Classes, or a constant minus an Index (without anymultiplier), in the case of Inverse Floating Rate Classes.
T Toggle Floating Rate or Inverse Floating Rate Classes with ClassCoupons that change signiÑcantly as a result of very small changesin the applicable Index. The change in Class Coupon is not acontinuous function of changes in the Index; rather, a change inthe Index will result in a ""shift'' from a predetermined rate to adiÅerent predetermined rate.
Interest
We pay 30 days' interest on each Payment Date to the Holders of each Class on which interest
has accrued, except that the Accrual Classes receive payments as described below. We calculate
each interest payment on the outstanding balance of the Class as of the related Record Date and on
the basis of a 360-day year of twelve 30-day months.
Accrual Period
The ""Accrual Period'' for each Payment Date is:
‚ For Fixed Rate and Delay Classes Ì the preceding calendar month.
‚ For Floating Rate and Inverse Floating Rate Classes other than Delay Classes Ì from
the 15th of the preceding month to the 15th of the month of that Payment Date.
Fixed Rate Classes
The Fixed Rate Classes bear interest at the Class Coupons shown on the front cover and
Appendix A.
S-15
Principal Only Classes
The Principal Only Classes are shown under Terms Sheet Ì Interest. They do not bear interest.
Notional Classes
The Notional Classes do not receive principal payments. For calculating interest payments, the
Notional Classes have notional principal amounts that will reduce as shown under Terms Sheet Ì
Notional Classes.
Floating Rate and Inverse Floating Rate Classes
The Floating Rate and Inverse Floating Rate Classes bear interest as shown under Terms
Sheet Ì Interest. Their Class Coupons are based on one-month LIBOR.
We determine LIBOR and calculate the Class Coupons for the Floating Rate and Inverse
Floating Rate Classes as described in Appendix V to the OÅering Circular.
Accrual Classes
CZ, DZ, Z, ZG, ZK and ZL are Accrual Classes. They do not receive interest payments;
rather, interest accrued on each Accrual Class during each Accrual Period is added to its principal
amount on the related Payment Date. We pay principal on each Accrual Class, including accrued
interest that has been added to its principal amount, as described under Terms Sheet Ì Principal.
Principal
We pay principal on each Payment Date to the Holders of the Classes on which principal is
then due. Holders receive principal payments on a pro rata basis among the CertiÑcates of their
Class.
Amount of Payments
The principal payments on the CertiÑcates on each Payment Date equal:
‚ The amount of interest accrued on each Accrual Class during the related Accrual
Period and not payable as interest on that Payment Date (the ""CZ Accrual Amount,''
the ""DZ Accrual Amount'' and so forth).
‚ The amount of principal required to be paid in the same month on the Assets of each
Group (the ""Group 1 Asset Principal Amount,'' the ""Group 2 Asset Principal
Amount'' and so forth).
Allocation of Payments
On each Payment Date, we pay the Accrual Amounts and the Asset Principal Amounts for
that Payment Date as described under Terms Sheet Ì Principal. Principal allocable to the Classes
receiving payments from a particular Asset Group will be allocated only to those Classes and will
not be available for Classes receiving payments from the other Asset Groups.
S-16

Class Factors
General
We make Class Factors available on or about the Ñfth business day of each month after the
Closing Date. See Description of CertiÑcates Ì Payments Ì Class Factors in the OÅering Circular.
Use of Factors
You can calculate principal and interest payments by using the Class Factors.
For example, the reduction (or for an Accrual Class, the increase) in the balance of a
CertiÑcate in February will equal its original balance times the diÅerence between its January and
February Class Factors. The amount of interest to be paid on (or for an Accrual Class, added to the
principal amount of) a CertiÑcate in February will equal 30 days' interest at its Class Coupon,
accrued during the related Accrual Period, on the balance of that CertiÑcate determined by its
January Class Factor.
Guarantees
We guarantee to each Holder of a CertiÑcate the timely payment of interest at its Class
Coupon and the payment of its principal amount as described in this Supplement. See Description of
CertiÑcates Ì Payments Ì Guarantees in the OÅering Circular.
1% Clean-up Call
We have a 1% Clean-up Call Right. If we exercise this right, all of the Classes then outstanding
will be paid in full and will retire. 2795-JA will not, and the other Multiclass Assets may, become
subject to the similar 1% Clean-up Call Rights in their Series. See Description of CertiÑcates Ì
Payments Ì 1% Clean-up Call in the OÅering Circular.
Residual Proceeds
Upon surrender of their CertiÑcates to the Registrar, the Holders of each Residual Class will
receive the proceeds of any remaining assets of the related REMIC Pool after all required principal
and interest payments on the Classes have been made. Any remaining assets are likely to be
insigniÑcant. See Description of CertiÑcates Ì Payments Ì Residual Classes in the OÅering
Circular.
PREPAYMENT AND YIELD ANALYSIS
General
Mortgage Prepayments
The rates of principal payments on the Assets and the CertiÑcates will depend on the rates of
principal payments, including prepayments, on the underlying Mortgages. The Mortgages may be
prepaid at any time, subject to any applicable prepayment premiums in the case of the Group 4
Mortgages. A prepayment premium may or may not discourage a borrower from prepaying a
Mortgage. Mortgage prepayment rates Öuctuate continuously and, in some market conditions,
S-17
substantially. See Prepayment, Yield and Suitability Considerations Ì Prepayments in the OÅering
Circular for a discussion of Mortgage prepayment considerations and risks.
The Mortgages backing the Group 2 Assets have servicing fees below our typical minimum
servicing fee and may experience diÅerent prepayment rates than Mortgages to which our higher
minimum servicing fee level applies and which have similar interest rates or are included in PCs
with similar pass-through rates.
Yield
As an investor in the CertiÑcates, your yield will depend on:
‚ Your purchase price.
‚ The rate of principal payments on the underlying Mortgages.
‚ The actual characteristics of the underlying Mortgages.
‚ If you own a Floating Rate or Inverse Floating Rate Class, the level of LIBOR.
‚ If you own a Fixed Rate or Delay Class, the delay between its Accrual Period and the
related Payment Date.
‚ If you own a Group 1 or 6 Class, the payment priorities of the related Multiclass Assets
in their own Series, as described in the Terms Sheets of the Multiclass Asset OÅering
Circulars.
See Prepayment, Yield and Suitability Considerations Ì Yields in the OÅering Circular for a
discussion of yield considerations and risks.
Suitability
The CertiÑcates may not be suitable investments for you. See Prepayment, Yield and
Suitability Considerations Ì Suitability in the OÅering Circular for a discussion of suitability
considerations and risks.
Modeling Assumptions
To prepare the tables in this Supplement, we have made several assumptions. Unless otherwise
noted, each table employs the following assumptions (the ""Modeling Assumptions''), among
others:
‚ The Mortgages underlying the PC Assets have the characteristics shown under Terms
Sheet Ì Mortgage Characteristics.
‚ As of May 1, 2005, each Mortgage underlying the Multiclass Assets has a remaining
term to maturity equal to the weighted average remaining term to maturity, a loan age
equal to the weighted average loan age, and an interest rate equal to the weighted
average interest rate, of all the Mortgages underlying the same PC.
‚ As of the Closing Date, the Assets have the balances shown under Terms Sheet Ì The
Assets.
‚ The Multiclass Assets receive payments as described in the Multiclass Asset OÅering
Circulars.
S-18
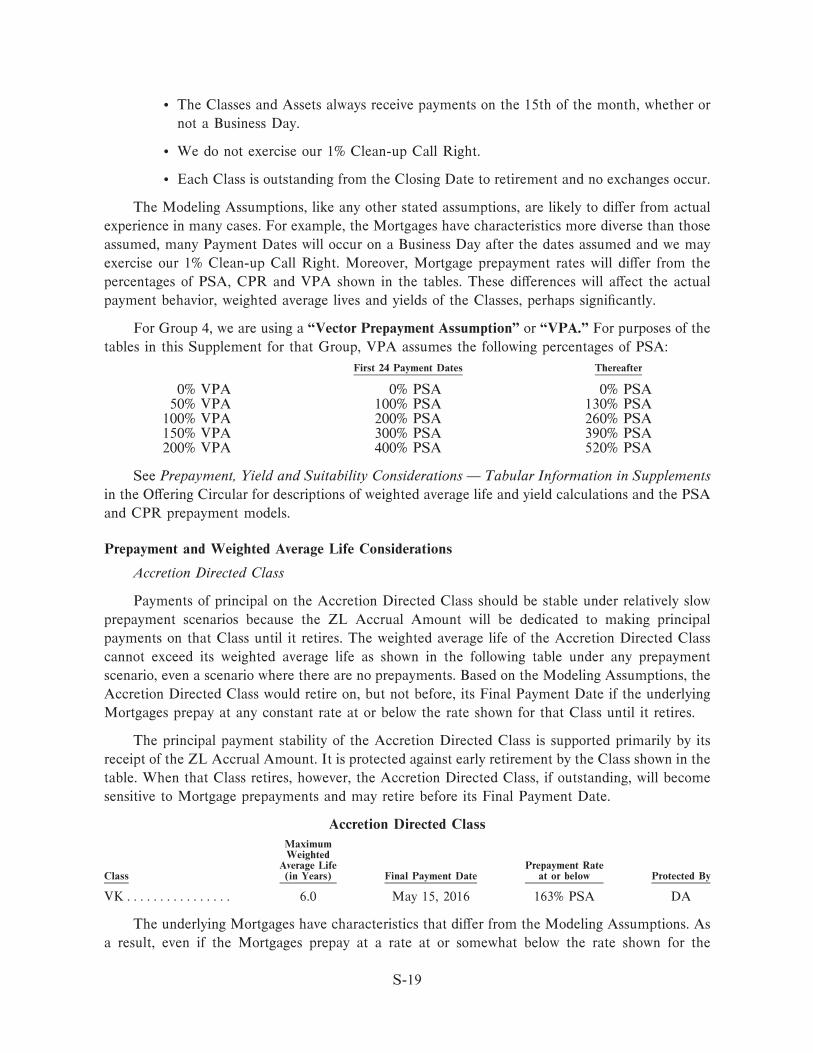
‚ The Classes and Assets always receive payments on the 15th of the month, whether or
not a Business Day.
‚ We do not exercise our 1% Clean-up Call Right.
‚ Each Class is outstanding from the Closing Date to retirement and no exchanges occur.
The Modeling Assumptions, like any other stated assumptions, are likely to diÅer from actual
experience in many cases. For example, the Mortgages have characteristics more diverse than those
assumed, many Payment Dates will occur on a Business Day after the dates assumed and we may
exercise our 1% Clean-up Call Right. Moreover, Mortgage prepayment rates will diÅer from the
percentages of PSA, CPR and VPA shown in the tables. These diÅerences will aÅect the actual
payment behavior, weighted average lives and yields of the Classes, perhaps signiÑcantly.
For Group 4, we are using a ""Vector Prepayment Assumption'' or ""VPA.'' For purposes of the
tables in this Supplement for that Group, VPA assumes the following percentages of PSA:
First 24 Payment Dates Thereafter
0% VPA 0% PSA 0% PSA50% VPA 100% PSA 130% PSA
100% VPA 200% PSA 260% PSA150% VPA 300% PSA 390% PSA200% VPA 400% PSA 520% PSA
See Prepayment, Yield and Suitability Considerations Ì Tabular Information in Supplements
in the OÅering Circular for descriptions of weighted average life and yield calculations and the PSA
and CPR prepayment models.
Prepayment and Weighted Average Life Considerations
Accretion Directed Class
Payments of principal on the Accretion Directed Class should be stable under relatively slow
prepayment scenarios because the ZL Accrual Amount will be dedicated to making principal
payments on that Class until it retires. The weighted average life of the Accretion Directed Class
cannot exceed its weighted average life as shown in the following table under any prepayment
scenario, even a scenario where there are no prepayments. Based on the Modeling Assumptions, the
Accretion Directed Class would retire on, but not before, its Final Payment Date if the underlying
Mortgages prepay at any constant rate at or below the rate shown for that Class until it retires.
The principal payment stability of the Accretion Directed Class is supported primarily by its
receipt of the ZL Accrual Amount. It is protected against early retirement by the Class shown in the
table. When that Class retires, however, the Accretion Directed Class, if outstanding, will become
sensitive to Mortgage prepayments and may retire before its Final Payment Date.
Accretion Directed Class
MaximumWeighted
Average Life Prepayment RateClass (in Years) Final Payment Date at or below Protected By
VKÏÏÏÏÏÏÏÏÏÏÏÏÏÏÏÏ 6.0 May 15, 2016 163% PSA DA
The underlying Mortgages have characteristics that diÅer from the Modeling Assumptions. As
a result, even if the Mortgages prepay at a rate at or somewhat below the rate shown for the
S-19
Accretion Directed Class, that Class could retire before its Final Payment Date and its weighted
average life could shorten.
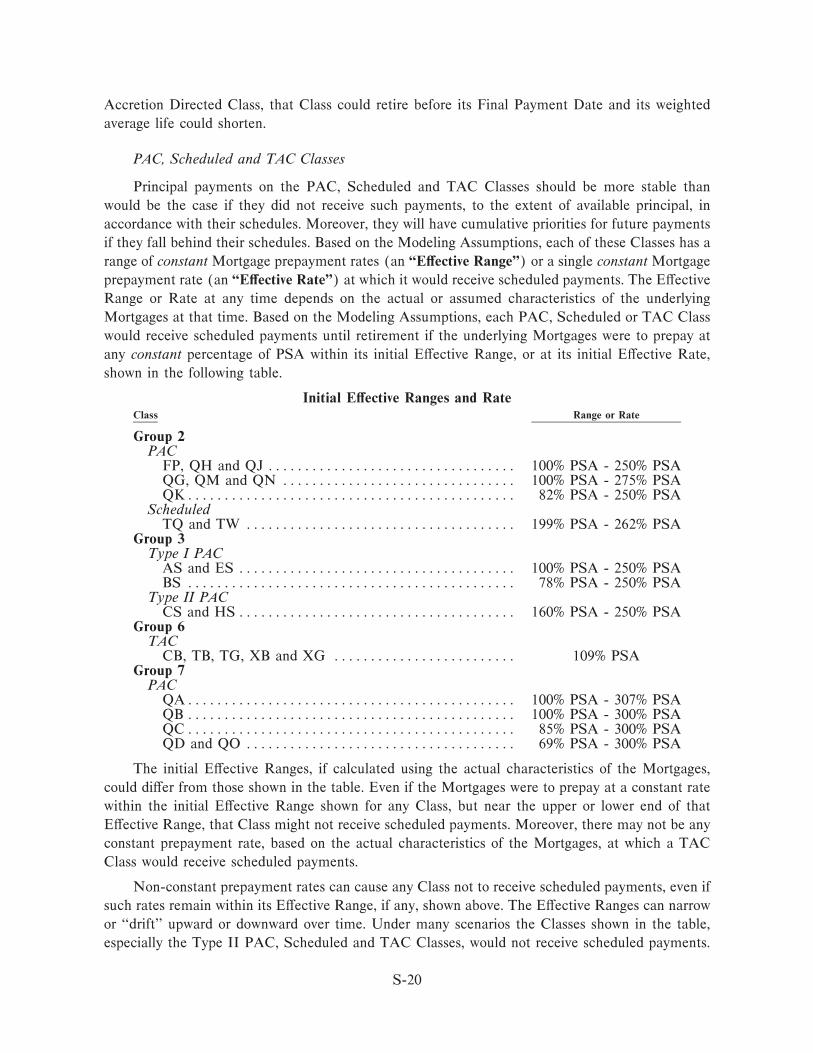
PAC, Scheduled and TAC Classes
Principal payments on the PAC, Scheduled and TAC Classes should be more stable than
would be the case if they did not receive such payments, to the extent of available principal, in
accordance with their schedules. Moreover, they will have cumulative priorities for future payments
if they fall behind their schedules. Based on the Modeling Assumptions, each of these Classes has a
range of constant Mortgage prepayment rates (an ""EÅective Range'') or a single constant Mortgage
prepayment rate (an ""EÅective Rate'') at which it would receive scheduled payments. The EÅective
Range or Rate at any time depends on the actual or assumed characteristics of the underlying
Mortgages at that time. Based on the Modeling Assumptions, each PAC, Scheduled or TAC Class
would receive scheduled payments until retirement if the underlying Mortgages were to prepay at
any constant percentage of PSA within its initial EÅective Range, or at its initial EÅective Rate,
shown in the following table.
Initial EÅective Ranges and RateClass Range or Rate
Group 2PAC
FP, QH and QJ ÏÏÏÏÏÏÏÏÏÏÏÏÏÏÏÏÏÏÏÏÏÏÏÏÏÏÏÏÏÏÏÏÏÏ 100% PSA - 250% PSAQG, QM and QN ÏÏÏÏÏÏÏÏÏÏÏÏÏÏÏÏÏÏÏÏÏÏÏÏÏÏÏÏÏÏÏÏ 100% PSA - 275% PSAQKÏÏÏÏÏÏÏÏÏÏÏÏÏÏÏÏÏÏÏÏÏÏÏÏÏÏÏÏÏÏÏÏÏÏÏÏÏÏÏÏÏÏÏÏÏ 82% PSA - 250% PSA
ScheduledTQ and TW ÏÏÏÏÏÏÏÏÏÏÏÏÏÏÏÏÏÏÏÏÏÏÏÏÏÏÏÏÏÏÏÏÏÏÏÏÏ 199% PSA - 262% PSA
Group 3Type I PAC
AS and ES ÏÏÏÏÏÏÏÏÏÏÏÏÏÏÏÏÏÏÏÏÏÏÏÏÏÏÏÏÏÏÏÏÏÏÏÏÏÏ 100% PSA - 250% PSABS ÏÏÏÏÏÏÏÏÏÏÏÏÏÏÏÏÏÏÏÏÏÏÏÏÏÏÏÏÏÏÏÏÏÏÏÏÏÏÏÏÏÏÏÏÏ 78% PSA - 250% PSA
Type II PACCS and HSÏÏÏÏÏÏÏÏÏÏÏÏÏÏÏÏÏÏÏÏÏÏÏÏÏÏÏÏÏÏÏÏÏÏÏÏÏÏ 160% PSA - 250% PSA
Group 6TAC
CB, TB, TG, XB and XG ÏÏÏÏÏÏÏÏÏÏÏÏÏÏÏÏÏÏÏÏÏÏÏÏÏ 109% PSAGroup 7
PACQAÏÏÏÏÏÏÏÏÏÏÏÏÏÏÏÏÏÏÏÏÏÏÏÏÏÏÏÏÏÏÏÏÏÏÏÏÏÏÏÏÏÏÏÏÏ 100% PSA - 307% PSAQB ÏÏÏÏÏÏÏÏÏÏÏÏÏÏÏÏÏÏÏÏÏÏÏÏÏÏÏÏÏÏÏÏÏÏÏÏÏÏÏÏÏÏÏÏÏ 100% PSA - 300% PSAQCÏÏÏÏÏÏÏÏÏÏÏÏÏÏÏÏÏÏÏÏÏÏÏÏÏÏÏÏÏÏÏÏÏÏÏÏÏÏÏÏÏÏÏÏÏ 85% PSA - 300% PSAQD and QO ÏÏÏÏÏÏÏÏÏÏÏÏÏÏÏÏÏÏÏÏÏÏÏÏÏÏÏÏÏÏÏÏÏÏÏÏÏ 69% PSA - 300% PSA
The initial EÅective Ranges, if calculated using the actual characteristics of the Mortgages,
could diÅer from those shown in the table. Even if the Mortgages were to prepay at a constant rate
within the initial EÅective Range shown for any Class, but near the upper or lower end of that
EÅective Range, that Class might not receive scheduled payments. Moreover, there may not be any
constant prepayment rate, based on the actual characteristics of the Mortgages, at which a TAC
Class would receive scheduled payments.
Non-constant prepayment rates can cause any Class not to receive scheduled payments, even if
such rates remain within its EÅective Range, if any, shown above. The EÅective Ranges can narrow
or ""drift'' upward or downward over time. Under many scenarios the Classes shown in the table,
especially the Type II PAC, Scheduled and TAC Classes, would not receive scheduled payments.
S-20
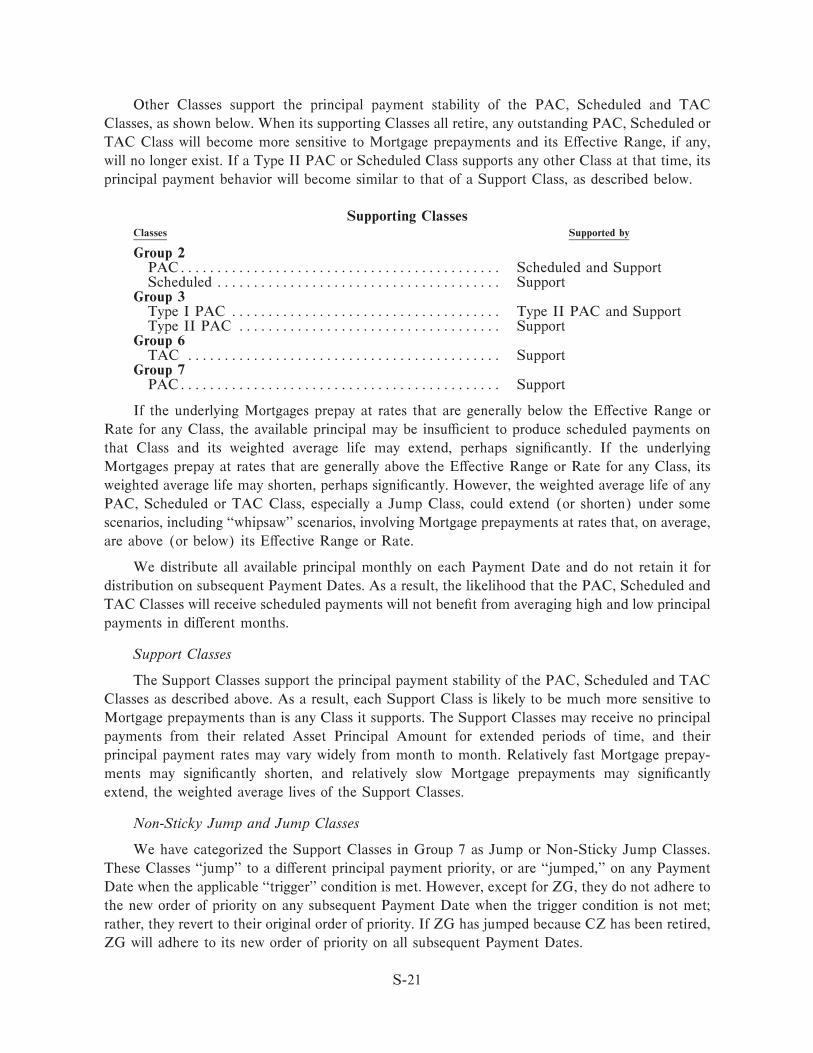
Other Classes support the principal payment stability of the PAC, Scheduled and TAC
Classes, as shown below. When its supporting Classes all retire, any outstanding PAC, Scheduled or
TAC Class will become more sensitive to Mortgage prepayments and its EÅective Range, if any,
will no longer exist. If a Type II PAC or Scheduled Class supports any other Class at that time, its
principal payment behavior will become similar to that of a Support Class, as described below.
Supporting ClassesClasses Supported by
Group 2PACÏÏÏÏÏÏÏÏÏÏÏÏÏÏÏÏÏÏÏÏÏÏÏÏÏÏÏÏÏÏÏÏÏÏÏÏÏÏÏÏÏÏÏÏ Scheduled and SupportScheduled ÏÏÏÏÏÏÏÏÏÏÏÏÏÏÏÏÏÏÏÏÏÏÏÏÏÏÏÏÏÏÏÏÏÏÏÏÏÏÏ Support
Group 3Type I PAC ÏÏÏÏÏÏÏÏÏÏÏÏÏÏÏÏÏÏÏÏÏÏÏÏÏÏÏÏÏÏÏÏÏÏÏÏÏ Type II PAC and SupportType II PAC ÏÏÏÏÏÏÏÏÏÏÏÏÏÏÏÏÏÏÏÏÏÏÏÏÏÏÏÏÏÏÏÏÏÏÏÏ Support
Group 6TAC ÏÏÏÏÏÏÏÏÏÏÏÏÏÏÏÏÏÏÏÏÏÏÏÏÏÏÏÏÏÏÏÏÏÏÏÏÏÏÏÏÏÏÏ Support
Group 7PACÏÏÏÏÏÏÏÏÏÏÏÏÏÏÏÏÏÏÏÏÏÏÏÏÏÏÏÏÏÏÏÏÏÏÏÏÏÏÏÏÏÏÏÏ Support
If the underlying Mortgages prepay at rates that are generally below the EÅective Range or
Rate for any Class, the available principal may be insuÇcient to produce scheduled payments on
that Class and its weighted average life may extend, perhaps signiÑcantly. If the underlying
Mortgages prepay at rates that are generally above the EÅective Range or Rate for any Class, its
weighted average life may shorten, perhaps signiÑcantly. However, the weighted average life of any
PAC, Scheduled or TAC Class, especially a Jump Class, could extend (or shorten) under some
scenarios, including ""whipsaw'' scenarios, involving Mortgage prepayments at rates that, on average,
are above (or below) its EÅective Range or Rate.
We distribute all available principal monthly on each Payment Date and do not retain it for
distribution on subsequent Payment Dates. As a result, the likelihood that the PAC, Scheduled and
TAC Classes will receive scheduled payments will not beneÑt from averaging high and low principal
payments in diÅerent months.
Support Classes
The Support Classes support the principal payment stability of the PAC, Scheduled and TAC
Classes as described above. As a result, each Support Class is likely to be much more sensitive to
Mortgage prepayments than is any Class it supports. The Support Classes may receive no principal
payments from their related Asset Principal Amount for extended periods of time, and their
principal payment rates may vary widely from month to month. Relatively fast Mortgage prepay-
ments may signiÑcantly shorten, and relatively slow Mortgage prepayments may signiÑcantly
extend, the weighted average lives of the Support Classes.
Non-Sticky Jump and Jump Classes
We have categorized the Support Classes in Group 7 as Jump or Non-Sticky Jump Classes.
These Classes ""jump'' to a diÅerent principal payment priority, or are ""jumped,'' on any Payment
Date when the applicable ""trigger'' condition is met. However, except for ZG, they do not adhere to
the new order of priority on any subsequent Payment Date when the trigger condition is not met;
rather, they revert to their original order of priority. If ZG has jumped because CZ has been retired,
ZG will adhere to its new order of priority on all subsequent Payment Dates.
S-21

The weighted average life of any Class that jumps may shorten, perhaps signiÑcantly.
Conversely, the weighted average life of any Class that is jumped may extend, perhaps signiÑcantly.
Jumps can aÅect the yield of such a Class, depending on its purchase price. If you buy such a Class
at a premium, your yield may be lower to the extent that your Class jumps; if you buy it at a
discount, your yield may be lower to the extent that it is jumped.
Sequential Pay Classes
The Sequential Pay Classes receive principal payments from their related Assets in a prescribed
sequence.
Pass-Through Classes
Each Pass-Through Class receives a speciÑed portion of the principal payments made on its
related Assets. The sensitivity of each Pass-Through Class to prepayments on the underlying
Mortgages is the same as that of its related Assets.
The Multiclass Assets
The Group 1 Assets consist of a Sequential Pay Class. This Class receives principal payments
from its related Assets in a prescribed sequence with other Classes in its Series.
The Group 6 Assets consist of PAC and Scheduled Classes. These Classes were structured to
receive principal payments in accordance with schedules. Based on the Modeling Assumptions for
this Series, these Classes currently have the following EÅective Ranges.Asset Current EÅective Range
2711-YC None2795-JA None2960-XJ 159% PSA - 293% PSA
We cannot predict whether or for how long these Classes might receive scheduled payments.
See Prepayment and Yield Analysis in the Multiclass Asset OÅering Circulars.
MACR Classes
The payment characteristics of the MACR Classes reÖect the payment characteristics of their
related REMIC Classes.
Declining Balances Table
The following table shows:
‚ Percentages of original balances (as of the Closing Date) that would be outstanding
after each of the Payment Dates shown at various percentages of PSA, CPR and VPA.
‚ Corresponding weighted average lives.
We have prepared this table using the Modeling Assumptions. However, for 0% PSA and
0% VPA we have assumed that each Mortgage underlying the PC Assets (a) has an interest rate
2.5% higher than that of the related PCs and (b) has a remaining term to maturity of 180 or
360 months, as applicable, and a loan age of 0 months. We have calculated weighted average lives
for each Notional Class assuming that a reduction in its notional principal amount is a reduction in
principal balance.
S-22

Percentages of Original Balances Outstanding* and Weighted Average Lives
Group 1
BA, BI and BO BC Group 1 Assets
PSA Prepayment Assumption PSA Prepayment Assumption PSA Prepayment Assumption
Date 0% 100% 207% 350% 500% 0% 100% 207% 350% 500% 0% 100% 207% 350% 500%
Closing Date ÏÏÏÏÏÏÏÏÏÏÏÏÏÏÏÏÏÏÏÏÏÏÏÏ 100 100 100 100 100 100 100 100 100 100 100 100 100 100 100May 15, 2006ÏÏÏÏÏÏÏÏÏÏÏÏÏÏÏÏÏÏÏÏÏÏÏÏ 100 100 100 100 100 100 100 100 100 100 100 100 100 100 100May 15, 2007ÏÏÏÏÏÏÏÏÏÏÏÏÏÏÏÏÏÏÏÏÏÏÏÏ 100 100 100 100 100 100 100 100 100 100 100 100 100 100 100May 15, 2008ÏÏÏÏÏÏÏÏÏÏÏÏÏÏÏÏÏÏÏÏÏÏÏÏ 100 100 100 100 100 100 100 100 100 100 100 100 100 100 100May 15, 2009ÏÏÏÏÏÏÏÏÏÏÏÏÏÏÏÏÏÏÏÏÏÏÏÏ 100 100 100 100 100 100 100 100 100 100 100 100 100 100 100May 15, 2010ÏÏÏÏÏÏÏÏÏÏÏÏÏÏÏÏÏÏÏÏÏÏÏÏ 100 100 100 100 0 100 100 100 100 88 100 100 100 100 79May 15, 2011ÏÏÏÏÏÏÏÏÏÏÏÏÏÏÏÏÏÏÏÏÏÏÏÏ 100 100 100 40 0 100 100 100 100 56 100 100 100 94 51May 15, 2012ÏÏÏÏÏÏÏÏÏÏÏÏÏÏÏÏÏÏÏÏÏÏÏÏ 100 100 100 0 0 100 100 100 74 36 100 100 100 67 32May 15, 2013ÏÏÏÏÏÏÏÏÏÏÏÏÏÏÏÏÏÏÏÏÏÏÏÏ 100 100 83 0 0 100 100 100 52 22 100 100 98 47 20May 15, 2014ÏÏÏÏÏÏÏÏÏÏÏÏÏÏÏÏÏÏÏÏÏÏÏÏ 100 100 0 0 0 100 100 83 36 13 100 100 75 32 12May 15, 2015ÏÏÏÏÏÏÏÏÏÏÏÏÏÏÏÏÏÏÏÏÏÏÏÏ 100 100 0 0 0 100 100 61 24 8 100 100 55 21 7May 15, 2016ÏÏÏÏÏÏÏÏÏÏÏÏÏÏÏÏÏÏÏÏÏÏÏÏ 100 0 0 0 0 100 87 42 15 4 100 78 38 13 4May 15, 2017ÏÏÏÏÏÏÏÏÏÏÏÏÏÏÏÏÏÏÏÏÏÏÏÏ 100 0 0 0 0 100 59 27 8 2 100 53 24 8 2May 15, 2018ÏÏÏÏÏÏÏÏÏÏÏÏÏÏÏÏÏÏÏÏÏÏÏÏ 0 0 0 0 0 71 33 14 4 1 64 30 13 4 1May 15, 2019ÏÏÏÏÏÏÏÏÏÏÏÏÏÏÏÏÏÏÏÏÏÏÏÏ 0 0 0 0 0 21 9 4 1 0 19 9 3 1 0May 15, 2020ÏÏÏÏÏÏÏÏÏÏÏÏÏÏÏÏÏÏÏÏÏÏÏÏ 0 0 0 0 0 0 0 0 0 0 0 0 0 0 0
Weighted AverageLife (Years)ÏÏÏÏÏÏÏÏÏÏÏÏÏÏÏÏÏÏÏÏÏÏÏ 12.3 10.4 8.1 6.0 4.6 13.4 12.4 10.8 8.6 6.8 13.3 12.2 10.6 8.4 6.6
Group 2
FB and SB FP and SP IQ, QG, QM and QN
PSA Prepayment Assumption PSA Prepayment Assumption PSA Prepayment Assumption
Date 0% 100% 215% 250% 500% 0% 100% 215% 250% 500% 0% 100% 215% 250% 500%
Closing Date ÏÏÏÏÏÏÏÏÏÏÏÏÏÏÏÏÏÏÏÏÏÏÏÏ 100 100 100 100 100 100 100 100 100 100 100 100 100 100 100May 15, 2006ÏÏÏÏÏÏÏÏÏÏÏÏÏÏÏÏÏÏÏÏÏÏÏÏ 100 100 100 100 45 99 96 96 96 96 97 90 90 90 90May 15, 2007ÏÏÏÏÏÏÏÏÏÏÏÏÏÏÏÏÏÏÏÏÏÏÏÏ 100 100 100 80 0 98 88 88 88 88 94 72 72 72 72May 15, 2008ÏÏÏÏÏÏÏÏÏÏÏÏÏÏÏÏÏÏÏÏÏÏÏÏ 100 100 97 55 0 96 78 78 78 67 91 50 50 50 23May 15, 2009ÏÏÏÏÏÏÏÏÏÏÏÏÏÏÏÏÏÏÏÏÏÏÏÏ 100 100 91 38 0 95 69 69 69 46 88 29 29 29 0May 15, 2010ÏÏÏÏÏÏÏÏÏÏÏÏÏÏÏÏÏÏÏÏÏÏÏÏ 100 100 88 27 0 93 61 61 61 32 84 10 10 10 0May 15, 2011ÏÏÏÏÏÏÏÏÏÏÏÏÏÏÏÏÏÏÏÏÏÏÏÏ 100 100 86 22 0 91 53 53 53 22 80 0 0 0 0May 15, 2012ÏÏÏÏÏÏÏÏÏÏÏÏÏÏÏÏÏÏÏÏÏÏÏÏ 100 100 75 10 0 89 46 46 46 15 76 0 0 0 0May 15, 2013ÏÏÏÏÏÏÏÏÏÏÏÏÏÏÏÏÏÏÏÏÏÏÏÏ 100 100 65 2 0 87 39 39 39 10 71 0 0 0 0May 15, 2014ÏÏÏÏÏÏÏÏÏÏÏÏÏÏÏÏÏÏÏÏÏÏÏÏ 100 100 61 0 0 85 32 32 32 7 66 0 0 0 0May 15, 2015ÏÏÏÏÏÏÏÏÏÏÏÏÏÏÏÏÏÏÏÏÏÏÏÏ 100 100 58 0 0 83 27 27 27 5 60 0 0 0 0May 15, 2016ÏÏÏÏÏÏÏÏÏÏÏÏÏÏÏÏÏÏÏÏÏÏÏÏ 100 100 54 0 0 80 22 22 22 3 54 0 0 0 0May 15, 2017ÏÏÏÏÏÏÏÏÏÏÏÏÏÏÏÏÏÏÏÏÏÏÏÏ 100 100 49 0 0 77 18 18 18 2 48 0 0 0 0May 15, 2018ÏÏÏÏÏÏÏÏÏÏÏÏÏÏÏÏÏÏÏÏÏÏÏÏ 100 100 45 0 0 74 15 15 15 1 41 0 0 0 0May 15, 2019ÏÏÏÏÏÏÏÏÏÏÏÏÏÏÏÏÏÏÏÏÏÏÏÏ 100 100 40 0 0 71 12 12 12 1 33 0 0 0 0May 15, 2020ÏÏÏÏÏÏÏÏÏÏÏÏÏÏÏÏÏÏÏÏÏÏÏÏ 100 100 36 0 0 68 10 10 10 1 25 0 0 0 0May 15, 2021ÏÏÏÏÏÏÏÏÏÏÏÏÏÏÏÏÏÏÏÏÏÏÏÏ 100 100 31 0 0 64 8 8 8 0 16 0 0 0 0May 15, 2022ÏÏÏÏÏÏÏÏÏÏÏÏÏÏÏÏÏÏÏÏÏÏÏÏ 100 100 27 0 0 59 7 7 7 0 6 0 0 0 0May 15, 2023ÏÏÏÏÏÏÏÏÏÏÏÏÏÏÏÏÏÏÏÏÏÏÏÏ 100 100 24 0 0 55 5 5 5 0 0 0 0 0 0May 15, 2024ÏÏÏÏÏÏÏÏÏÏÏÏÏÏÏÏÏÏÏÏÏÏÏÏ 100 100 20 0 0 50 4 4 4 0 0 0 0 0 0May 15, 2025ÏÏÏÏÏÏÏÏÏÏÏÏÏÏÏÏÏÏÏÏÏÏÏÏ 100 100 17 0 0 45 3 3 3 0 0 0 0 0 0May 15, 2026ÏÏÏÏÏÏÏÏÏÏÏÏÏÏÏÏÏÏÏÏÏÏÏÏ 100 100 14 0 0 39 3 3 3 0 0 0 0 0 0May 15, 2027ÏÏÏÏÏÏÏÏÏÏÏÏÏÏÏÏÏÏÏÏÏÏÏÏ 100 100 12 0 0 33 2 2 2 0 0 0 0 0 0May 15, 2028ÏÏÏÏÏÏÏÏÏÏÏÏÏÏÏÏÏÏÏÏÏÏÏÏ 100 100 9 0 0 26 2 2 2 0 0 0 0 0 0May 15, 2029ÏÏÏÏÏÏÏÏÏÏÏÏÏÏÏÏÏÏÏÏÏÏÏÏ 100 91 7 0 0 19 1 1 1 0 0 0 0 0 0May 15, 2030ÏÏÏÏÏÏÏÏÏÏÏÏÏÏÏÏÏÏÏÏÏÏÏÏ 100 73 6 0 0 11 1 1 1 0 0 0 0 0 0May 15, 2031ÏÏÏÏÏÏÏÏÏÏÏÏÏÏÏÏÏÏÏÏÏÏÏÏ 100 56 4 0 0 2 1 1 1 0 0 0 0 0 0May 15, 2032ÏÏÏÏÏÏÏÏÏÏÏÏÏÏÏÏÏÏÏÏÏÏÏÏ 100 40 3 0 0 0 0 0 0 0 0 0 0 0 0May 15, 2033ÏÏÏÏÏÏÏÏÏÏÏÏÏÏÏÏÏÏÏÏÏÏÏÏ 100 25 2 0 0 0 0 0 0 0 0 0 0 0 0May 15, 2034ÏÏÏÏÏÏÏÏÏÏÏÏÏÏÏÏÏÏÏÏÏÏÏÏ 100 10 1 0 0 0 0 0 0 0 0 0 0 0 0May 15, 2035ÏÏÏÏÏÏÏÏÏÏÏÏÏÏÏÏÏÏÏÏÏÏÏÏ 0 0 0 0 0 0 0 0 0 0 0 0 0 0 0
Weighted AverageLife (Years)ÏÏÏÏÏÏÏÏÏÏÏÏÏÏÏÏÏÏÏÏÏÏÏ 29.5 26.5 12.7 3.8 0.9 17.4 7.5 7.5 7.5 4.5 10.8 3.0 3.0 3.0 2.3
* Rounded to nearest whole percentage.
S-23

QH QJ QK
PSA Prepayment Assumption PSA Prepayment Assumption PSA Prepayment Assumption
Date 0% 100% 215% 250% 500% 0% 100% 215% 250% 500% 0% 100% 215% 250% 500%
Closing Date ÏÏÏÏÏÏÏÏÏÏÏÏÏÏÏÏÏÏÏÏÏÏÏÏ 100 100 100 100 100 100 100 100 100 100 100 100 100 100 100May 15, 2006ÏÏÏÏÏÏÏÏÏÏÏÏÏÏÏÏÏÏÏÏÏÏÏÏ 100 100 100 100 100 100 100 100 100 100 100 100 100 100 100May 15, 2007ÏÏÏÏÏÏÏÏÏÏÏÏÏÏÏÏÏÏÏÏÏÏÏÏ 100 100 100 100 100 100 100 100 100 100 100 100 100 100 100May 15, 2008ÏÏÏÏÏÏÏÏÏÏÏÏÏÏÏÏÏÏÏÏÏÏÏÏ 100 100 100 100 100 100 100 100 100 100 100 100 100 100 100May 15, 2009ÏÏÏÏÏÏÏÏÏÏÏÏÏÏÏÏÏÏÏÏÏÏÏÏ 100 100 100 100 51 100 100 100 100 100 100 100 100 100 100May 15, 2010ÏÏÏÏÏÏÏÏÏÏÏÏÏÏÏÏÏÏÏÏÏÏÏÏ 100 100 100 100 0 100 100 100 100 87 100 100 100 100 100May 15, 2011ÏÏÏÏÏÏÏÏÏÏÏÏÏÏÏÏÏÏÏÏÏÏÏÏ 100 84 84 84 0 100 100 100 100 44 100 100 100 100 100May 15, 2012ÏÏÏÏÏÏÏÏÏÏÏÏÏÏÏÏÏÏÏÏÏÏÏÏ 100 51 51 51 0 100 100 100 100 14 100 100 100 100 100May 15, 2013ÏÏÏÏÏÏÏÏÏÏÏÏÏÏÏÏÏÏÏÏÏÏÏÏ 100 19 19 19 0 100 100 100 100 0 100 100 100 100 87May 15, 2014ÏÏÏÏÏÏÏÏÏÏÏÏÏÏÏÏÏÏÏÏÏÏÏÏ 100 0 0 0 0 100 91 91 91 0 100 100 100 100 60May 15, 2015ÏÏÏÏÏÏÏÏÏÏÏÏÏÏÏÏÏÏÏÏÏÏÏÏ 100 0 0 0 0 100 66 66 66 0 100 100 100 100 41May 15, 2016ÏÏÏÏÏÏÏÏÏÏÏÏÏÏÏÏÏÏÏÏÏÏÏÏ 100 0 0 0 0 100 46 46 46 0 100 100 100 100 28May 15, 2017ÏÏÏÏÏÏÏÏÏÏÏÏÏÏÏÏÏÏÏÏÏÏÏÏ 100 0 0 0 0 100 29 29 29 0 100 100 100 100 19May 15, 2018ÏÏÏÏÏÏÏÏÏÏÏÏÏÏÏÏÏÏÏÏÏÏÏÏ 100 0 0 0 0 100 14 14 14 0 100 100 100 100 13May 15, 2019ÏÏÏÏÏÏÏÏÏÏÏÏÏÏÏÏÏÏÏÏÏÏÏÏ 100 0 0 0 0 100 2 2 2 0 100 100 100 100 9May 15, 2020ÏÏÏÏÏÏÏÏÏÏÏÏÏÏÏÏÏÏÏÏÏÏÏÏ 100 0 0 0 0 100 0 0 0 0 100 86 86 86 6May 15, 2021ÏÏÏÏÏÏÏÏÏÏÏÏÏÏÏÏÏÏÏÏÏÏÏÏ 100 0 0 0 0 100 0 0 0 0 100 69 69 69 4May 15, 2022ÏÏÏÏÏÏÏÏÏÏÏÏÏÏÏÏÏÏÏÏÏÏÏÏ 100 0 0 0 0 100 0 0 0 0 100 56 56 56 3May 15, 2023ÏÏÏÏÏÏÏÏÏÏÏÏÏÏÏÏÏÏÏÏÏÏÏÏ 92 0 0 0 0 100 0 0 0 0 100 45 45 45 2May 15, 2024ÏÏÏÏÏÏÏÏÏÏÏÏÏÏÏÏÏÏÏÏÏÏÏÏ 70 0 0 0 0 100 0 0 0 0 100 36 36 36 1May 15, 2025ÏÏÏÏÏÏÏÏÏÏÏÏÏÏÏÏÏÏÏÏÏÏÏÏ 46 0 0 0 0 100 0 0 0 0 100 28 28 28 1May 15, 2026ÏÏÏÏÏÏÏÏÏÏÏÏÏÏÏÏÏÏÏÏÏÏÏÏ 20 0 0 0 0 100 0 0 0 0 100 22 22 22 0May 15, 2027ÏÏÏÏÏÏÏÏÏÏÏÏÏÏÏÏÏÏÏÏÏÏÏÏ 0 0 0 0 0 92 0 0 0 0 100 17 17 17 0May 15, 2028ÏÏÏÏÏÏÏÏÏÏÏÏÏÏÏÏÏÏÏÏÏÏÏÏ 0 0 0 0 0 63 0 0 0 0 100 13 13 13 0May 15, 2029ÏÏÏÏÏÏÏÏÏÏÏÏÏÏÏÏÏÏÏÏÏÏÏÏ 0 0 0 0 0 31 0 0 0 0 100 10 10 10 0May 15, 2030ÏÏÏÏÏÏÏÏÏÏÏÏÏÏÏÏÏÏÏÏÏÏÏÏ 0 0 0 0 0 0 0 0 0 0 92 7 7 7 0May 15, 2031ÏÏÏÏÏÏÏÏÏÏÏÏÏÏÏÏÏÏÏÏÏÏÏÏ 0 0 0 0 0 0 0 0 0 0 18 5 5 5 0May 15, 2032ÏÏÏÏÏÏÏÏÏÏÏÏÏÏÏÏÏÏÏÏÏÏÏÏ 0 0 0 0 0 0 0 0 0 0 3 3 3 3 0May 15, 2033ÏÏÏÏÏÏÏÏÏÏÏÏÏÏÏÏÏÏÏÏÏÏÏÏ 0 0 0 0 0 0 0 0 0 0 2 2 2 2 0May 15, 2034ÏÏÏÏÏÏÏÏÏÏÏÏÏÏÏÏÏÏÏÏÏÏÏÏ 0 0 0 0 0 0 0 0 0 0 1 1 1 1 0May 15, 2035ÏÏÏÏÏÏÏÏÏÏÏÏÏÏÏÏÏÏÏÏÏÏÏÏ 0 0 0 0 0 0 0 0 0 0 0 0 0 0 0
Weighted AverageLife (Years)ÏÏÏÏÏÏÏÏÏÏÏÏÏÏÏÏÏÏÏÏÏÏÏ 19.8 7.1 7.1 7.1 4.1 23.4 11.0 11.0 11.0 6.0 25.6 18.5 18.5 18.5 10.2
TQ and TW ZK Group 2 Assets
PSA Prepayment Assumption PSA Prepayment Assumption PSA Prepayment Assumption
Date 0% 100% 215% 250% 500% 0% 100% 215% 250% 500% 0% 100% 215% 250% 500%
Closing Date ÏÏÏÏÏÏÏÏÏÏÏÏÏÏÏÏÏÏÏÏÏÏÏÏ 100 100 100 100 100 100 100 100 100 100 100 100 100 100 100May 15, 2006ÏÏÏÏÏÏÏÏÏÏÏÏÏÏÏÏÏÏÏÏÏÏÏÏ 100 100 90 90 90 106 106 77 22 0 99 97 95 94 89May 15, 2007ÏÏÏÏÏÏÏÏÏÏÏÏÏÏÏÏÏÏÏÏÏÏÏÏ 99 99 70 70 32 112 112 29 0 0 98 91 85 83 69May 15, 2008ÏÏÏÏÏÏÏÏÏÏÏÏÏÏÏÏÏÏÏÏÏÏÏÏ 99 99 46 46 0 118 118 0 0 0 97 85 73 69 48May 15, 2009ÏÏÏÏÏÏÏÏÏÏÏÏÏÏÏÏÏÏÏÏÏÏÏÏ 98 98 27 27 0 125 125 0 0 0 96 78 62 58 33May 15, 2010ÏÏÏÏÏÏÏÏÏÏÏÏÏÏÏÏÏÏÏÏÏÏÏÏ 98 98 13 13 0 132 132 0 0 0 95 72 53 48 23May 15, 2011ÏÏÏÏÏÏÏÏÏÏÏÏÏÏÏÏÏÏÏÏÏÏÏÏ 98 98 3 3 0 139 139 0 0 0 94 67 45 40 16May 15, 2012ÏÏÏÏÏÏÏÏÏÏÏÏÏÏÏÏÏÏÏÏÏÏÏÏ 97 97 0 0 0 147 147 0 0 0 92 61 39 34 11May 15, 2013ÏÏÏÏÏÏÏÏÏÏÏÏÏÏÏÏÏÏÏÏÏÏÏÏ 97 97 0 0 0 155 155 0 0 0 91 56 33 28 7May 15, 2014ÏÏÏÏÏÏÏÏÏÏÏÏÏÏÏÏÏÏÏÏÏÏÏÏ 96 96 0 0 0 164 164 0 0 0 89 52 28 23 5May 15, 2015ÏÏÏÏÏÏÏÏÏÏÏÏÏÏÏÏÏÏÏÏÏÏÏÏ 95 93 0 0 0 173 173 0 0 0 88 47 24 19 3May 15, 2016ÏÏÏÏÏÏÏÏÏÏÏÏÏÏÏÏÏÏÏÏÏÏÏÏ 95 89 0 0 0 183 183 0 0 0 86 43 20 16 2May 15, 2017ÏÏÏÏÏÏÏÏÏÏÏÏÏÏÏÏÏÏÏÏÏÏÏÏ 94 82 0 0 0 193 193 0 0 0 84 39 17 13 2May 15, 2018ÏÏÏÏÏÏÏÏÏÏÏÏÏÏÏÏÏÏÏÏÏÏÏÏ 93 75 0 0 0 204 204 0 0 0 82 36 14 11 1May 15, 2019ÏÏÏÏÏÏÏÏÏÏÏÏÏÏÏÏÏÏÏÏÏÏÏÏ 93 67 0 0 0 216 216 0 0 0 79 32 12 9 1May 15, 2020ÏÏÏÏÏÏÏÏÏÏÏÏÏÏÏÏÏÏÏÏÏÏÏÏ 92 58 0 0 0 228 228 0 0 0 77 29 10 7 0May 15, 2021ÏÏÏÏÏÏÏÏÏÏÏÏÏÏÏÏÏÏÏÏÏÏÏÏ 91 49 0 0 0 241 241 0 0 0 74 26 8 6 0May 15, 2022ÏÏÏÏÏÏÏÏÏÏÏÏÏÏÏÏÏÏÏÏÏÏÏÏ 90 39 0 0 0 254 254 0 0 0 71 23 7 5 0May 15, 2023ÏÏÏÏÏÏÏÏÏÏÏÏÏÏÏÏÏÏÏÏÏÏÏÏ 89 29 0 0 0 269 269 0 0 0 68 21 6 4 0May 15, 2024ÏÏÏÏÏÏÏÏÏÏÏÏÏÏÏÏÏÏÏÏÏÏÏÏ 88 20 0 0 0 284 284 0 0 0 64 18 5 3 0May 15, 2025ÏÏÏÏÏÏÏÏÏÏÏÏÏÏÏÏÏÏÏÏÏÏÏÏ 87 10 0 0 0 300 300 0 0 0 60 16 4 2 0May 15, 2026ÏÏÏÏÏÏÏÏÏÏÏÏÏÏÏÏÏÏÏÏÏÏÏÏ 86 0 0 0 0 317 317 0 0 0 56 14 3 2 0May 15, 2027ÏÏÏÏÏÏÏÏÏÏÏÏÏÏÏÏÏÏÏÏÏÏÏÏ 85 0 0 0 0 334 188 0 0 0 52 12 2 1 0May 15, 2028ÏÏÏÏÏÏÏÏÏÏÏÏÏÏÏÏÏÏÏÏÏÏÏÏ 84 0 0 0 0 353 60 0 0 0 47 10 2 1 0May 15, 2029ÏÏÏÏÏÏÏÏÏÏÏÏÏÏÏÏÏÏÏÏÏÏÏÏ 83 0 0 0 0 373 0 0 0 0 42 8 1 1 0May 15, 2030ÏÏÏÏÏÏÏÏÏÏÏÏÏÏÏÏÏÏÏÏÏÏÏÏ 81 0 0 0 0 394 0 0 0 0 36 7 1 1 0May 15, 2031ÏÏÏÏÏÏÏÏÏÏÏÏÏÏÏÏÏÏÏÏÏÏÏÏ 80 0 0 0 0 417 0 0 0 0 30 5 1 0 0May 15, 2032ÏÏÏÏÏÏÏÏÏÏÏÏÏÏÏÏÏÏÏÏÏÏÏÏ 51 0 0 0 0 440 0 0 0 0 23 4 0 0 0May 15, 2033ÏÏÏÏÏÏÏÏÏÏÏÏÏÏÏÏÏÏÏÏÏÏÏÏ 12 0 0 0 0 465 0 0 0 0 16 2 0 0 0May 15, 2034ÏÏÏÏÏÏÏÏÏÏÏÏÏÏÏÏÏÏÏÏÏÏÏÏ 0 0 0 0 0 21 0 0 0 0 8 1 0 0 0May 15, 2035ÏÏÏÏÏÏÏÏÏÏÏÏÏÏÏÏÏÏÏÏÏÏÏÏ 0 0 0 0 0 0 0 0 0 0 0 0 0 0 0
Weighted AverageLife (Years)ÏÏÏÏÏÏÏÏÏÏÏÏÏÏÏÏÏÏÏÏÏÏÏ 25.0 15.4 3.0 3.0 1.7 28.7 22.2 1.5 0.7 0.2 20.5 11.0 7.0 6.3 3.6
S-24

Group 3
AS, ES and GS BS CS, HS and IS
PSA Prepayment Assumption PSA Prepayment Assumption PSA Prepayment Assumption
Date 0% 100% 220% 250% 500% 0% 100% 220% 250% 500% 0% 100% 220% 250% 500%
Closing Date ÏÏÏÏÏÏÏÏÏÏÏÏÏÏÏÏÏÏÏÏÏÏÏÏ 100 100 100 100 100 100 100 100 100 100 100 100 100 100 100May 15, 2006ÏÏÏÏÏÏÏÏÏÏÏÏÏÏÏÏÏÏÏÏÏÏÏÏ 99 93 93 93 93 100 100 100 100 100 100 100 87 87 87May 15, 2007ÏÏÏÏÏÏÏÏÏÏÏÏÏÏÏÏÏÏÏÏÏÏÏÏ 97 84 84 84 84 100 100 100 100 100 100 100 67 67 4May 15, 2008ÏÏÏÏÏÏÏÏÏÏÏÏÏÏÏÏÏÏÏÏÏÏÏÏ 96 73 73 73 55 100 100 100 100 100 100 100 47 47 0May 15, 2009ÏÏÏÏÏÏÏÏÏÏÏÏÏÏÏÏÏÏÏÏÏÏÏÏ 94 64 64 64 34 100 100 100 100 100 100 100 32 32 0May 15, 2010ÏÏÏÏÏÏÏÏÏÏÏÏÏÏÏÏÏÏÏÏÏÏÏÏ 92 54 54 54 20 100 100 100 100 100 100 100 20 20 0May 15, 2011ÏÏÏÏÏÏÏÏÏÏÏÏÏÏÏÏÏÏÏÏÏÏÏÏ 90 46 46 46 10 100 100 100 100 100 100 100 10 10 0May 15, 2012ÏÏÏÏÏÏÏÏÏÏÏÏÏÏÏÏÏÏÏÏÏÏÏÏ 88 38 38 38 3 100 100 100 100 100 100 100 4 4 0May 15, 2013ÏÏÏÏÏÏÏÏÏÏÏÏÏÏÏÏÏÏÏÏÏÏÏÏ 86 30 30 30 0 100 100 100 100 90 100 100 0 0 0May 15, 2014ÏÏÏÏÏÏÏÏÏÏÏÏÏÏÏÏÏÏÏÏÏÏÏÏ 83 23 23 23 0 100 100 100 100 61 100 99 0 0 0May 15, 2015ÏÏÏÏÏÏÏÏÏÏÏÏÏÏÏÏÏÏÏÏÏÏÏÏ 81 17 17 17 0 100 100 100 100 42 100 96 0 0 0May 15, 2016ÏÏÏÏÏÏÏÏÏÏÏÏÏÏÏÏÏÏÏÏÏÏÏÏ 78 12 12 12 0 100 100 100 100 28 100 89 0 0 0May 15, 2017ÏÏÏÏÏÏÏÏÏÏÏÏÏÏÏÏÏÏÏÏÏÏÏÏ 75 8 8 8 0 100 100 100 100 19 100 81 0 0 0May 15, 2018ÏÏÏÏÏÏÏÏÏÏÏÏÏÏÏÏÏÏÏÏÏÏÏÏ 71 5 5 5 0 100 100 100 100 13 100 71 0 0 0May 15, 2019ÏÏÏÏÏÏÏÏÏÏÏÏÏÏÏÏÏÏÏÏÏÏÏÏ 68 2 2 2 0 100 100 100 100 9 100 60 0 0 0May 15, 2020ÏÏÏÏÏÏÏÏÏÏÏÏÏÏÏÏÏÏÏÏÏÏÏÏ 64 0 0 0 0 100 94 94 94 6 100 49 0 0 0May 15, 2021ÏÏÏÏÏÏÏÏÏÏÏÏÏÏÏÏÏÏÏÏÏÏÏÏ 59 0 0 0 0 100 76 76 76 4 100 36 0 0 0May 15, 2022ÏÏÏÏÏÏÏÏÏÏÏÏÏÏÏÏÏÏÏÏÏÏÏÏ 55 0 0 0 0 100 62 62 62 3 100 24 0 0 0May 15, 2023ÏÏÏÏÏÏÏÏÏÏÏÏÏÏÏÏÏÏÏÏÏÏÏÏ 50 0 0 0 0 100 49 49 49 2 100 11 0 0 0May 15, 2024ÏÏÏÏÏÏÏÏÏÏÏÏÏÏÏÏÏÏÏÏÏÏÏÏ 44 0 0 0 0 100 39 39 39 1 100 0 0 0 0May 15, 2025ÏÏÏÏÏÏÏÏÏÏÏÏÏÏÏÏÏÏÏÏÏÏÏÏ 38 0 0 0 0 100 31 31 31 1 100 0 0 0 0May 15, 2026ÏÏÏÏÏÏÏÏÏÏÏÏÏÏÏÏÏÏÏÏÏÏÏÏ 32 0 0 0 0 100 24 24 24 0 100 0 0 0 0May 15, 2027ÏÏÏÏÏÏÏÏÏÏÏÏÏÏÏÏÏÏÏÏÏÏÏÏ 25 0 0 0 0 100 18 18 18 0 100 0 0 0 0May 15, 2028ÏÏÏÏÏÏÏÏÏÏÏÏÏÏÏÏÏÏÏÏÏÏÏÏ 17 0 0 0 0 100 14 14 14 0 100 0 0 0 0May 15, 2029ÏÏÏÏÏÏÏÏÏÏÏÏÏÏÏÏÏÏÏÏÏÏÏÏ 9 0 0 0 0 100 10 10 10 0 100 0 0 0 0May 15, 2030ÏÏÏÏÏÏÏÏÏÏÏÏÏÏÏÏÏÏÏÏÏÏÏÏ 0 0 0 0 0 100 7 7 7 0 100 0 0 0 0May 15, 2031ÏÏÏÏÏÏÏÏÏÏÏÏÏÏÏÏÏÏÏÏÏÏÏÏ 0 0 0 0 0 17 5 5 5 0 100 0 0 0 0May 15, 2032ÏÏÏÏÏÏÏÏÏÏÏÏÏÏÏÏÏÏÏÏÏÏÏÏ 0 0 0 0 0 3 3 3 3 0 59 0 0 0 0May 15, 2033ÏÏÏÏÏÏÏÏÏÏÏÏÏÏÏÏÏÏÏÏÏÏÏÏ 0 0 0 0 0 1 1 1 1 0 7 0 0 0 0May 15, 2034ÏÏÏÏÏÏÏÏÏÏÏÏÏÏÏÏÏÏÏÏÏÏÏÏ 0 0 0 0 0 0 0 0 0 0 0 0 0 0 0May 15, 2035ÏÏÏÏÏÏÏÏÏÏÏÏÏÏÏÏÏÏÏÏÏÏÏÏ 0 0 0 0 0 0 0 0 0 0 0 0 0 0 0
Weighted AverageLife (Years)ÏÏÏÏÏÏÏÏÏÏÏÏÏÏÏÏÏÏÏÏÏÏÏ 16.4 6.0 6.0 6.0 3.5 25.7 18.9 18.9 18.9 10.3 27.2 14.7 3.2 3.2 1.5
DS FE, FG, SH, SN and Group 3 Assets
PSA Prepayment Assumption PSA Prepayment Assumption
Date 0% 100% 220% 250% 500% 0% 100% 220% 250% 500%
Closing Date ÏÏÏÏÏÏÏÏÏÏÏÏÏÏÏÏÏÏÏÏÏÏÏÏ 100 100 100 100 100 100 100 100 100 100May 15, 2006ÏÏÏÏÏÏÏÏÏÏÏÏÏÏÏÏÏÏÏÏÏÏÏÏ 100 100 89 83 35 99 96 92 92 84May 15, 2007ÏÏÏÏÏÏÏÏÏÏÏÏÏÏÏÏÏÏÏÏÏÏÏÏ 100 100 71 56 0 98 90 81 78 61May 15, 2008ÏÏÏÏÏÏÏÏÏÏÏÏÏÏÏÏÏÏÏÏÏÏÏÏ 100 100 55 34 0 97 83 69 66 42May 15, 2009ÏÏÏÏÏÏÏÏÏÏÏÏÏÏÏÏÏÏÏÏÏÏÏÏ 100 100 44 18 0 96 77 59 55 29May 15, 2010ÏÏÏÏÏÏÏÏÏÏÏÏÏÏÏÏÏÏÏÏÏÏÏÏ 100 100 36 8 0 95 71 50 46 20May 15, 2011ÏÏÏÏÏÏÏÏÏÏÏÏÏÏÏÏÏÏÏÏÏÏÏÏ 100 100 32 2 0 94 65 43 38 14May 15, 2012ÏÏÏÏÏÏÏÏÏÏÏÏÏÏÏÏÏÏÏÏÏÏÏÏ 100 100 30 0 0 92 60 36 32 9May 15, 2013ÏÏÏÏÏÏÏÏÏÏÏÏÏÏÏÏÏÏÏÏÏÏÏÏ 100 100 29 0 0 91 55 31 26 6May 15, 2014ÏÏÏÏÏÏÏÏÏÏÏÏÏÏÏÏÏÏÏÏÏÏÏÏ 100 100 28 0 0 89 51 26 22 4May 15, 2015ÏÏÏÏÏÏÏÏÏÏÏÏÏÏÏÏÏÏÏÏÏÏÏÏ 100 100 26 0 0 88 46 22 18 3May 15, 2016ÏÏÏÏÏÏÏÏÏÏÏÏÏÏÏÏÏÏÏÏÏÏÏÏ 100 100 24 0 0 86 42 19 15 2May 15, 2017ÏÏÏÏÏÏÏÏÏÏÏÏÏÏÏÏÏÏÏÏÏÏÏÏ 100 100 22 0 0 84 39 16 12 1May 15, 2018ÏÏÏÏÏÏÏÏÏÏÏÏÏÏÏÏÏÏÏÏÏÏÏÏ 100 100 20 0 0 82 35 13 10 1May 15, 2019ÏÏÏÏÏÏÏÏÏÏÏÏÏÏÏÏÏÏÏÏÏÏÏÏ 100 100 18 0 0 79 32 11 8 1May 15, 2020ÏÏÏÏÏÏÏÏÏÏÏÏÏÏÏÏÏÏÏÏÏÏÏÏ 100 100 16 0 0 77 29 9 7 0May 15, 2021ÏÏÏÏÏÏÏÏÏÏÏÏÏÏÏÏÏÏÏÏÏÏÏÏ 100 100 14 0 0 74 26 8 5 0May 15, 2022ÏÏÏÏÏÏÏÏÏÏÏÏÏÏÏÏÏÏÏÏÏÏÏÏ 100 100 12 0 0 71 23 6 4 0May 15, 2023ÏÏÏÏÏÏÏÏÏÏÏÏÏÏÏÏÏÏÏÏÏÏÏÏ 100 100 10 0 0 68 20 5 4 0May 15, 2024ÏÏÏÏÏÏÏÏÏÏÏÏÏÏÏÏÏÏÏÏÏÏÏÏ 100 99 9 0 0 64 18 4 3 0May 15, 2025ÏÏÏÏÏÏÏÏÏÏÏÏÏÏÏÏÏÏÏÏÏÏÏÏ 100 88 7 0 0 60 16 3 2 0May 15, 2026ÏÏÏÏÏÏÏÏÏÏÏÏÏÏÏÏÏÏÏÏÏÏÏÏ 100 77 6 0 0 56 13 3 2 0May 15, 2027ÏÏÏÏÏÏÏÏÏÏÏÏÏÏÏÏÏÏÏÏÏÏÏÏ 100 66 5 0 0 52 11 2 1 0May 15, 2028ÏÏÏÏÏÏÏÏÏÏÏÏÏÏÏÏÏÏÏÏÏÏÏÏ 100 56 4 0 0 47 9 2 1 0May 15, 2029ÏÏÏÏÏÏÏÏÏÏÏÏÏÏÏÏÏÏÏÏÏÏÏÏ 100 46 3 0 0 42 8 1 1 0May 15, 2030ÏÏÏÏÏÏÏÏÏÏÏÏÏÏÏÏÏÏÏÏÏÏÏÏ 100 36 2 0 0 36 6 1 1 0May 15, 2031ÏÏÏÏÏÏÏÏÏÏÏÏÏÏÏÏÏÏÏÏÏÏÏÏ 100 27 2 0 0 30 4 1 0 0May 15, 2032ÏÏÏÏÏÏÏÏÏÏÏÏÏÏÏÏÏÏÏÏÏÏÏÏ 100 18 1 0 0 23 3 0 0 0May 15, 2033ÏÏÏÏÏÏÏÏÏÏÏÏÏÏÏÏÏÏÏÏÏÏÏÏ 100 10 1 0 0 16 2 0 0 0May 15, 2034ÏÏÏÏÏÏÏÏÏÏÏÏÏÏÏÏÏÏÏÏÏÏÏÏ 56 2 0 0 0 8 0 0 0 0May 15, 2035ÏÏÏÏÏÏÏÏÏÏÏÏÏÏÏÏÏÏÏÏÏÏÏÏ 0 0 0 0 0 0 0 0 0 0
Weighted AverageLife (Years)ÏÏÏÏÏÏÏÏÏÏÏÏÏÏÏÏÏÏÏÏÏÏÏ 29.1 23.8 6.6 2.5 0.8 20.5 10.8 6.6 6.0 3.3
S-25

Group 4
FJ, SJ and Group 4 Assets SK, ST and SU SL
Vector Prepayment Assumption Vector Prepayment Assumption Vector Prepayment Assumption
Date 0% 50% 100% 150% 200% 0% 50% 100% 150% 200% 0% 50% 100% 150% 200%
Closing Date ÏÏÏÏÏÏÏÏÏÏÏÏÏÏÏÏÏÏÏÏÏÏÏÏ 100 100 100 100 100 100 100 100 100 100 100 100 100 100 100May 15, 2006ÏÏÏÏÏÏÏÏÏÏÏÏÏÏÏÏÏÏÏÏÏÏÏÏ 99 95 91 87 83 99 93 88 83 78 100 100 100 100 100May 15, 2007ÏÏÏÏÏÏÏÏÏÏÏÏÏÏÏÏÏÏÏÏÏÏÏÏ 98 88 79 71 63 98 85 74 64 54 100 100 100 100 100May 15, 2008ÏÏÏÏÏÏÏÏÏÏÏÏÏÏÏÏÏÏÏÏÏÏÏÏ 97 80 66 53 43 97 75 57 42 28 100 100 100 100 100May 15, 2009ÏÏÏÏÏÏÏÏÏÏÏÏÏÏÏÏÏÏÏÏÏÏÏÏ 96 72 55 40 29 95 65 43 25 11 100 100 100 100 100May 15, 2010ÏÏÏÏÏÏÏÏÏÏÏÏÏÏÏÏÏÏÏÏÏÏÏÏ 95 65 45 30 20 94 57 32 13 0 100 100 100 100 98May 15, 2011ÏÏÏÏÏÏÏÏÏÏÏÏÏÏÏÏÏÏÏÏÏÏÏÏ 94 59 37 23 13 92 49 22 3 0 100 100 100 100 66May 15, 2012ÏÏÏÏÏÏÏÏÏÏÏÏÏÏÏÏÏÏÏÏÏÏÏÏ 92 53 31 17 9 91 42 14 0 0 100 100 100 85 44May 15, 2013ÏÏÏÏÏÏÏÏÏÏÏÏÏÏÏÏÏÏÏÏÏÏÏÏ 91 48 25 13 6 89 35 7 0 0 100 100 100 64 30May 15, 2014ÏÏÏÏÏÏÏÏÏÏÏÏÏÏÏÏÏÏÏÏÏÏÏÏ 89 43 21 10 4 87 29 1 0 0 100 100 100 48 20May 15, 2015ÏÏÏÏÏÏÏÏÏÏÏÏÏÏÏÏÏÏÏÏÏÏÏÏ 88 39 17 7 3 85 23 0 0 0 100 100 86 35 13May 15, 2016ÏÏÏÏÏÏÏÏÏÏÏÏÏÏÏÏÏÏÏÏÏÏÏÏ 86 35 14 5 2 82 18 0 0 0 100 100 70 26 9May 15, 2017ÏÏÏÏÏÏÏÏÏÏÏÏÏÏÏÏÏÏÏÏÏÏÏÏ 84 31 11 4 1 80 14 0 0 0 100 100 57 19 6May 15, 2018ÏÏÏÏÏÏÏÏÏÏÏÏÏÏÏÏÏÏÏÏÏÏÏÏ 82 27 9 3 1 77 9 0 0 0 100 100 47 14 4May 15, 2019ÏÏÏÏÏÏÏÏÏÏÏÏÏÏÏÏÏÏÏÏÏÏÏÏ 79 24 8 2 1 74 5 0 0 0 100 100 38 11 3May 15, 2020ÏÏÏÏÏÏÏÏÏÏÏÏÏÏÏÏÏÏÏÏÏÏÏÏ 77 21 6 2 0 71 2 0 0 0 100 100 31 8 2May 15, 2021ÏÏÏÏÏÏÏÏÏÏÏÏÏÏÏÏÏÏÏÏÏÏÏÏ 74 19 5 1 0 68 0 0 0 0 100 94 24 6 1May 15, 2022ÏÏÏÏÏÏÏÏÏÏÏÏÏÏÏÏÏÏÏÏÏÏÏÏ 71 16 4 1 0 64 0 0 0 0 100 82 20 4 1May 15, 2023ÏÏÏÏÏÏÏÏÏÏÏÏÏÏÏÏÏÏÏÏÏÏÏÏ 68 14 3 1 0 60 0 0 0 0 100 71 15 3 0May 15, 2024ÏÏÏÏÏÏÏÏÏÏÏÏÏÏÏÏÏÏÏÏÏÏÏÏ 64 12 2 0 0 55 0 0 0 0 100 61 12 2 0May 15, 2025ÏÏÏÏÏÏÏÏÏÏÏÏÏÏÏÏÏÏÏÏÏÏÏÏ 60 10 2 0 0 51 0 0 0 0 100 51 9 1 0May 15, 2026ÏÏÏÏÏÏÏÏÏÏÏÏÏÏÏÏÏÏÏÏÏÏÏÏ 56 9 1 0 0 45 0 0 0 0 100 43 7 1 0May 15, 2027ÏÏÏÏÏÏÏÏÏÏÏÏÏÏÏÏÏÏÏÏÏÏÏÏ 52 7 1 0 0 40 0 0 0 0 100 35 5 1 0May 15, 2028ÏÏÏÏÏÏÏÏÏÏÏÏÏÏÏÏÏÏÏÏÏÏÏÏ 47 6 1 0 0 34 0 0 0 0 100 29 4 0 0May 15, 2029ÏÏÏÏÏÏÏÏÏÏÏÏÏÏÏÏÏÏÏÏÏÏÏÏ 42 4 1 0 0 27 0 0 0 0 100 22 3 0 0May 15, 2030ÏÏÏÏÏÏÏÏÏÏÏÏÏÏÏÏÏÏÏÏÏÏÏÏ 36 3 0 0 0 20 0 0 0 0 100 17 2 0 0May 15, 2031ÏÏÏÏÏÏÏÏÏÏÏÏÏÏÏÏÏÏÏÏÏÏÏÏ 30 2 0 0 0 13 0 0 0 0 100 11 1 0 0May 15, 2032ÏÏÏÏÏÏÏÏÏÏÏÏÏÏÏÏÏÏÏÏÏÏÏÏ 23 1 0 0 0 4 0 0 0 0 100 7 1 0 0May 15, 2033ÏÏÏÏÏÏÏÏÏÏÏÏÏÏÏÏÏÏÏÏÏÏÏÏ 16 0 0 0 0 0 0 0 0 0 81 2 0 0 0May 15, 2034ÏÏÏÏÏÏÏÏÏÏÏÏÏÏÏÏÏÏÏÏÏÏÏÏ 8 0 0 0 0 0 0 0 0 0 42 0 0 0 0May 15, 2035ÏÏÏÏÏÏÏÏÏÏÏÏÏÏÏÏÏÏÏÏÏÏÏÏ 0 0 0 0 0 0 0 0 0 0 0 0 0 0 0
Weighted AverageLife (Years)ÏÏÏÏÏÏÏÏÏÏÏÏÏÏÏÏÏÏÏÏÏÏÏ 20.5 9.4 5.9 4.2 3.3 18.4 6.5 3.9 2.8 2.2 28.8 20.8 13.8 9.8 7.5
Group 5
DA and ID DE VK
PSA Prepayment Assumption PSA Prepayment Assumption PSA Prepayment Assumption
Date 0% 100% 181% 300% 400% 0% 100% 181% 300% 400% 0% 100% 181% 300% 400%
Closing Date ÏÏÏÏÏÏÏÏÏÏÏÏÏÏÏÏÏÏÏÏÏÏÏÏ 100 100 100 100 100 100 100 100 100 100 100 100 100 100 100May 15, 2006ÏÏÏÏÏÏÏÏÏÏÏÏÏÏÏÏÏÏÏÏÏÏÏÏ 99 93 89 82 77 100 100 100 100 100 93 93 93 93 93May 15, 2007ÏÏÏÏÏÏÏÏÏÏÏÏÏÏÏÏÏÏÏÏÏÏÏÏ 97 83 74 60 49 100 100 100 100 100 86 86 86 86 86May 15, 2008ÏÏÏÏÏÏÏÏÏÏÏÏÏÏÏÏÏÏÏÏÏÏÏÏ 96 74 60 41 28 100 100 100 100 100 78 78 78 78 78May 15, 2009ÏÏÏÏÏÏÏÏÏÏÏÏÏÏÏÏÏÏÏÏÏÏÏÏ 94 66 48 26 11 100 100 100 100 100 70 70 70 70 70May 15, 2010ÏÏÏÏÏÏÏÏÏÏÏÏÏÏÏÏÏÏÏÏÏÏÏÏ 93 58 37 14 0 100 100 100 100 98 61 61 61 61 56May 15, 2011ÏÏÏÏÏÏÏÏÏÏÏÏÏÏÏÏÏÏÏÏÏÏÏÏ 91 50 28 4 0 100 100 100 100 73 52 52 52 52 0May 15, 2012ÏÏÏÏÏÏÏÏÏÏÏÏÏÏÏÏÏÏÏÏÏÏÏÏ 89 43 20 0 0 100 100 100 89 54 43 43 43 9 0May 15, 2013ÏÏÏÏÏÏÏÏÏÏÏÏÏÏÏÏÏÏÏÏÏÏÏÏ 87 37 12 0 0 100 100 100 71 40 33 33 33 0 0May 15, 2014ÏÏÏÏÏÏÏÏÏÏÏÏÏÏÏÏÏÏÏÏÏÏÏÏ 84 30 6 0 0 100 100 100 57 30 22 22 22 0 0May 15, 2015ÏÏÏÏÏÏÏÏÏÏÏÏÏÏÏÏÏÏÏÏÏÏÏÏ 82 25 0 0 0 100 100 100 45 22 11 11 11 0 0May 15, 2016ÏÏÏÏÏÏÏÏÏÏÏÏÏÏÏÏÏÏÏÏÏÏÏÏ 79 19 0 0 0 100 100 87 36 16 0 0 0 0 0May 15, 2017ÏÏÏÏÏÏÏÏÏÏÏÏÏÏÏÏÏÏÏÏÏÏÏÏ 77 14 0 0 0 100 100 75 29 12 0 0 0 0 0May 15, 2018ÏÏÏÏÏÏÏÏÏÏÏÏÏÏÏÏÏÏÏÏÏÏÏÏ 73 9 0 0 0 100 100 64 23 9 0 0 0 0 0May 15, 2019ÏÏÏÏÏÏÏÏÏÏÏÏÏÏÏÏÏÏÏÏÏÏÏÏ 70 5 0 0 0 100 100 55 18 6 0 0 0 0 0May 15, 2020ÏÏÏÏÏÏÏÏÏÏÏÏÏÏÏÏÏÏÏÏÏÏÏÏ 67 1 0 0 0 100 100 47 14 5 0 0 0 0 0May 15, 2021ÏÏÏÏÏÏÏÏÏÏÏÏÏÏÏÏÏÏÏÏÏÏÏÏ 63 0 0 0 0 100 91 40 11 3 0 0 0 0 0May 15, 2022ÏÏÏÏÏÏÏÏÏÏÏÏÏÏÏÏÏÏÏÏÏÏÏÏ 59 0 0 0 0 100 81 33 8 2 0 0 0 0 0May 15, 2023ÏÏÏÏÏÏÏÏÏÏÏÏÏÏÏÏÏÏÏÏÏÏÏÏ 54 0 0 0 0 100 71 28 6 2 0 0 0 0 0May 15, 2024ÏÏÏÏÏÏÏÏÏÏÏÏÏÏÏÏÏÏÏÏÏÏÏÏ 49 0 0 0 0 100 62 23 5 1 0 0 0 0 0May 15, 2025ÏÏÏÏÏÏÏÏÏÏÏÏÏÏÏÏÏÏÏÏÏÏÏÏ 44 0 0 0 0 100 54 19 4 1 0 0 0 0 0May 15, 2026ÏÏÏÏÏÏÏÏÏÏÏÏÏÏÏÏÏÏÏÏÏÏÏÏ 38 0 0 0 0 100 46 15 3 1 0 0 0 0 0May 15, 2027ÏÏÏÏÏÏÏÏÏÏÏÏÏÏÏÏÏÏÏÏÏÏÏÏ 32 0 0 0 0 100 38 12 2 0 0 0 0 0 0May 15, 2028ÏÏÏÏÏÏÏÏÏÏÏÏÏÏÏÏÏÏÏÏÏÏÏÏ 26 0 0 0 0 100 32 10 1 0 0 0 0 0 0May 15, 2029ÏÏÏÏÏÏÏÏÏÏÏÏÏÏÏÏÏÏÏÏÏÏÏÏ 19 0 0 0 0 100 25 7 1 0 0 0 0 0 0May 15, 2030ÏÏÏÏÏÏÏÏÏÏÏÏÏÏÏÏÏÏÏÏÏÏÏÏ 11 0 0 0 0 100 19 5 1 0 0 0 0 0 0May 15, 2031ÏÏÏÏÏÏÏÏÏÏÏÏÏÏÏÏÏÏÏÏÏÏÏÏ 3 0 0 0 0 100 14 3 0 0 0 0 0 0 0May 15, 2032ÏÏÏÏÏÏÏÏÏÏÏÏÏÏÏÏÏÏÏÏÏÏÏÏ 0 0 0 0 0 85 8 2 0 0 0 0 0 0 0May 15, 2033ÏÏÏÏÏÏÏÏÏÏÏÏÏÏÏÏÏÏÏÏÏÏÏÏ 0 0 0 0 0 59 3 1 0 0 0 0 0 0 0May 15, 2034ÏÏÏÏÏÏÏÏÏÏÏÏÏÏÏÏÏÏÏÏÏÏÏÏ 0 0 0 0 0 30 0 0 0 0 0 0 0 0 0May 15, 2035ÏÏÏÏÏÏÏÏÏÏÏÏÏÏÏÏÏÏÏÏÏÏÏÏ 0 0 0 0 0 0 0 0 0 0 0 0 0 0 0
Weighted AverageLife (Years)ÏÏÏÏÏÏÏÏÏÏÏÏÏÏÏÏÏÏÏÏÏÏÏ 17.3 6.6 4.2 2.8 2.2 28.3 20.9 15.8 10.8 8.3 6.0 6.0 6.0 5.0 4.2
S-26
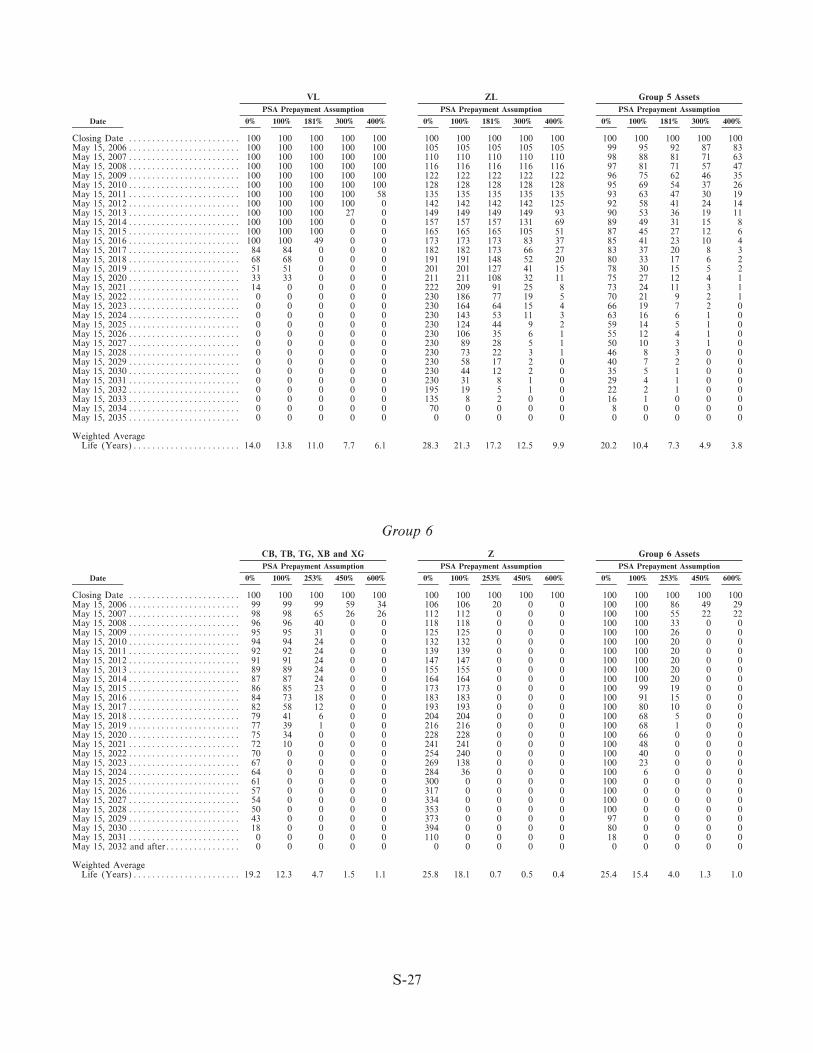
VL ZL Group 5 Assets
PSA Prepayment Assumption PSA Prepayment Assumption PSA Prepayment Assumption
Date 0% 100% 181% 300% 400% 0% 100% 181% 300% 400% 0% 100% 181% 300% 400%
Closing Date ÏÏÏÏÏÏÏÏÏÏÏÏÏÏÏÏÏÏÏÏÏÏÏÏ 100 100 100 100 100 100 100 100 100 100 100 100 100 100 100May 15, 2006ÏÏÏÏÏÏÏÏÏÏÏÏÏÏÏÏÏÏÏÏÏÏÏÏ 100 100 100 100 100 105 105 105 105 105 99 95 92 87 83May 15, 2007ÏÏÏÏÏÏÏÏÏÏÏÏÏÏÏÏÏÏÏÏÏÏÏÏ 100 100 100 100 100 110 110 110 110 110 98 88 81 71 63May 15, 2008ÏÏÏÏÏÏÏÏÏÏÏÏÏÏÏÏÏÏÏÏÏÏÏÏ 100 100 100 100 100 116 116 116 116 116 97 81 71 57 47May 15, 2009ÏÏÏÏÏÏÏÏÏÏÏÏÏÏÏÏÏÏÏÏÏÏÏÏ 100 100 100 100 100 122 122 122 122 122 96 75 62 46 35May 15, 2010ÏÏÏÏÏÏÏÏÏÏÏÏÏÏÏÏÏÏÏÏÏÏÏÏ 100 100 100 100 100 128 128 128 128 128 95 69 54 37 26May 15, 2011ÏÏÏÏÏÏÏÏÏÏÏÏÏÏÏÏÏÏÏÏÏÏÏÏ 100 100 100 100 58 135 135 135 135 135 93 63 47 30 19May 15, 2012ÏÏÏÏÏÏÏÏÏÏÏÏÏÏÏÏÏÏÏÏÏÏÏÏ 100 100 100 100 0 142 142 142 142 125 92 58 41 24 14May 15, 2013ÏÏÏÏÏÏÏÏÏÏÏÏÏÏÏÏÏÏÏÏÏÏÏÏ 100 100 100 27 0 149 149 149 149 93 90 53 36 19 11May 15, 2014ÏÏÏÏÏÏÏÏÏÏÏÏÏÏÏÏÏÏÏÏÏÏÏÏ 100 100 100 0 0 157 157 157 131 69 89 49 31 15 8May 15, 2015ÏÏÏÏÏÏÏÏÏÏÏÏÏÏÏÏÏÏÏÏÏÏÏÏ 100 100 100 0 0 165 165 165 105 51 87 45 27 12 6May 15, 2016ÏÏÏÏÏÏÏÏÏÏÏÏÏÏÏÏÏÏÏÏÏÏÏÏ 100 100 49 0 0 173 173 173 83 37 85 41 23 10 4May 15, 2017ÏÏÏÏÏÏÏÏÏÏÏÏÏÏÏÏÏÏÏÏÏÏÏÏ 84 84 0 0 0 182 182 173 66 27 83 37 20 8 3May 15, 2018ÏÏÏÏÏÏÏÏÏÏÏÏÏÏÏÏÏÏÏÏÏÏÏÏ 68 68 0 0 0 191 191 148 52 20 80 33 17 6 2May 15, 2019ÏÏÏÏÏÏÏÏÏÏÏÏÏÏÏÏÏÏÏÏÏÏÏÏ 51 51 0 0 0 201 201 127 41 15 78 30 15 5 2May 15, 2020ÏÏÏÏÏÏÏÏÏÏÏÏÏÏÏÏÏÏÏÏÏÏÏÏ 33 33 0 0 0 211 211 108 32 11 75 27 12 4 1May 15, 2021ÏÏÏÏÏÏÏÏÏÏÏÏÏÏÏÏÏÏÏÏÏÏÏÏ 14 0 0 0 0 222 209 91 25 8 73 24 11 3 1May 15, 2022ÏÏÏÏÏÏÏÏÏÏÏÏÏÏÏÏÏÏÏÏÏÏÏÏ 0 0 0 0 0 230 186 77 19 5 70 21 9 2 1May 15, 2023ÏÏÏÏÏÏÏÏÏÏÏÏÏÏÏÏÏÏÏÏÏÏÏÏ 0 0 0 0 0 230 164 64 15 4 66 19 7 2 0May 15, 2024ÏÏÏÏÏÏÏÏÏÏÏÏÏÏÏÏÏÏÏÏÏÏÏÏ 0 0 0 0 0 230 143 53 11 3 63 16 6 1 0May 15, 2025ÏÏÏÏÏÏÏÏÏÏÏÏÏÏÏÏÏÏÏÏÏÏÏÏ 0 0 0 0 0 230 124 44 9 2 59 14 5 1 0May 15, 2026ÏÏÏÏÏÏÏÏÏÏÏÏÏÏÏÏÏÏÏÏÏÏÏÏ 0 0 0 0 0 230 106 35 6 1 55 12 4 1 0May 15, 2027ÏÏÏÏÏÏÏÏÏÏÏÏÏÏÏÏÏÏÏÏÏÏÏÏ 0 0 0 0 0 230 89 28 5 1 50 10 3 1 0May 15, 2028ÏÏÏÏÏÏÏÏÏÏÏÏÏÏÏÏÏÏÏÏÏÏÏÏ 0 0 0 0 0 230 73 22 3 1 46 8 3 0 0May 15, 2029ÏÏÏÏÏÏÏÏÏÏÏÏÏÏÏÏÏÏÏÏÏÏÏÏ 0 0 0 0 0 230 58 17 2 0 40 7 2 0 0May 15, 2030ÏÏÏÏÏÏÏÏÏÏÏÏÏÏÏÏÏÏÏÏÏÏÏÏ 0 0 0 0 0 230 44 12 2 0 35 5 1 0 0May 15, 2031ÏÏÏÏÏÏÏÏÏÏÏÏÏÏÏÏÏÏÏÏÏÏÏÏ 0 0 0 0 0 230 31 8 1 0 29 4 1 0 0May 15, 2032ÏÏÏÏÏÏÏÏÏÏÏÏÏÏÏÏÏÏÏÏÏÏÏÏ 0 0 0 0 0 195 19 5 1 0 22 2 1 0 0May 15, 2033ÏÏÏÏÏÏÏÏÏÏÏÏÏÏÏÏÏÏÏÏÏÏÏÏ 0 0 0 0 0 135 8 2 0 0 16 1 0 0 0May 15, 2034ÏÏÏÏÏÏÏÏÏÏÏÏÏÏÏÏÏÏÏÏÏÏÏÏ 0 0 0 0 0 70 0 0 0 0 8 0 0 0 0May 15, 2035ÏÏÏÏÏÏÏÏÏÏÏÏÏÏÏÏÏÏÏÏÏÏÏÏ 0 0 0 0 0 0 0 0 0 0 0 0 0 0 0
Weighted AverageLife (Years)ÏÏÏÏÏÏÏÏÏÏÏÏÏÏÏÏÏÏÏÏÏÏÏ 14.0 13.8 11.0 7.7 6.1 28.3 21.3 17.2 12.5 9.9 20.2 10.4 7.3 4.9 3.8
Group 6
CB, TB, TG, XB and XG Z Group 6 Assets
PSA Prepayment Assumption PSA Prepayment Assumption PSA Prepayment Assumption
Date 0% 100% 253% 450% 600% 0% 100% 253% 450% 600% 0% 100% 253% 450% 600%
Closing Date ÏÏÏÏÏÏÏÏÏÏÏÏÏÏÏÏÏÏÏÏÏÏÏÏ 100 100 100 100 100 100 100 100 100 100 100 100 100 100 100May 15, 2006ÏÏÏÏÏÏÏÏÏÏÏÏÏÏÏÏÏÏÏÏÏÏÏÏ 99 99 99 59 34 106 106 20 0 0 100 100 86 49 29May 15, 2007ÏÏÏÏÏÏÏÏÏÏÏÏÏÏÏÏÏÏÏÏÏÏÏÏ 98 98 65 26 26 112 112 0 0 0 100 100 55 22 22May 15, 2008ÏÏÏÏÏÏÏÏÏÏÏÏÏÏÏÏÏÏÏÏÏÏÏÏ 96 96 40 0 0 118 118 0 0 0 100 100 33 0 0May 15, 2009ÏÏÏÏÏÏÏÏÏÏÏÏÏÏÏÏÏÏÏÏÏÏÏÏ 95 95 31 0 0 125 125 0 0 0 100 100 26 0 0May 15, 2010ÏÏÏÏÏÏÏÏÏÏÏÏÏÏÏÏÏÏÏÏÏÏÏÏ 94 94 24 0 0 132 132 0 0 0 100 100 20 0 0May 15, 2011ÏÏÏÏÏÏÏÏÏÏÏÏÏÏÏÏÏÏÏÏÏÏÏÏ 92 92 24 0 0 139 139 0 0 0 100 100 20 0 0May 15, 2012ÏÏÏÏÏÏÏÏÏÏÏÏÏÏÏÏÏÏÏÏÏÏÏÏ 91 91 24 0 0 147 147 0 0 0 100 100 20 0 0May 15, 2013ÏÏÏÏÏÏÏÏÏÏÏÏÏÏÏÏÏÏÏÏÏÏÏÏ 89 89 24 0 0 155 155 0 0 0 100 100 20 0 0May 15, 2014ÏÏÏÏÏÏÏÏÏÏÏÏÏÏÏÏÏÏÏÏÏÏÏÏ 87 87 24 0 0 164 164 0 0 0 100 100 20 0 0May 15, 2015ÏÏÏÏÏÏÏÏÏÏÏÏÏÏÏÏÏÏÏÏÏÏÏÏ 86 85 23 0 0 173 173 0 0 0 100 99 19 0 0May 15, 2016ÏÏÏÏÏÏÏÏÏÏÏÏÏÏÏÏÏÏÏÏÏÏÏÏ 84 73 18 0 0 183 183 0 0 0 100 91 15 0 0May 15, 2017ÏÏÏÏÏÏÏÏÏÏÏÏÏÏÏÏÏÏÏÏÏÏÏÏ 82 58 12 0 0 193 193 0 0 0 100 80 10 0 0May 15, 2018ÏÏÏÏÏÏÏÏÏÏÏÏÏÏÏÏÏÏÏÏÏÏÏÏ 79 41 6 0 0 204 204 0 0 0 100 68 5 0 0May 15, 2019ÏÏÏÏÏÏÏÏÏÏÏÏÏÏÏÏÏÏÏÏÏÏÏÏ 77 39 1 0 0 216 216 0 0 0 100 68 1 0 0May 15, 2020ÏÏÏÏÏÏÏÏÏÏÏÏÏÏÏÏÏÏÏÏÏÏÏÏ 75 34 0 0 0 228 228 0 0 0 100 66 0 0 0May 15, 2021ÏÏÏÏÏÏÏÏÏÏÏÏÏÏÏÏÏÏÏÏÏÏÏÏ 72 10 0 0 0 241 241 0 0 0 100 48 0 0 0May 15, 2022ÏÏÏÏÏÏÏÏÏÏÏÏÏÏÏÏÏÏÏÏÏÏÏÏ 70 0 0 0 0 254 240 0 0 0 100 40 0 0 0May 15, 2023ÏÏÏÏÏÏÏÏÏÏÏÏÏÏÏÏÏÏÏÏÏÏÏÏ 67 0 0 0 0 269 138 0 0 0 100 23 0 0 0May 15, 2024ÏÏÏÏÏÏÏÏÏÏÏÏÏÏÏÏÏÏÏÏÏÏÏÏ 64 0 0 0 0 284 36 0 0 0 100 6 0 0 0May 15, 2025ÏÏÏÏÏÏÏÏÏÏÏÏÏÏÏÏÏÏÏÏÏÏÏÏ 61 0 0 0 0 300 0 0 0 0 100 0 0 0 0May 15, 2026ÏÏÏÏÏÏÏÏÏÏÏÏÏÏÏÏÏÏÏÏÏÏÏÏ 57 0 0 0 0 317 0 0 0 0 100 0 0 0 0May 15, 2027ÏÏÏÏÏÏÏÏÏÏÏÏÏÏÏÏÏÏÏÏÏÏÏÏ 54 0 0 0 0 334 0 0 0 0 100 0 0 0 0May 15, 2028ÏÏÏÏÏÏÏÏÏÏÏÏÏÏÏÏÏÏÏÏÏÏÏÏ 50 0 0 0 0 353 0 0 0 0 100 0 0 0 0May 15, 2029ÏÏÏÏÏÏÏÏÏÏÏÏÏÏÏÏÏÏÏÏÏÏÏÏ 43 0 0 0 0 373 0 0 0 0 97 0 0 0 0May 15, 2030ÏÏÏÏÏÏÏÏÏÏÏÏÏÏÏÏÏÏÏÏÏÏÏÏ 18 0 0 0 0 394 0 0 0 0 80 0 0 0 0May 15, 2031ÏÏÏÏÏÏÏÏÏÏÏÏÏÏÏÏÏÏÏÏÏÏÏÏ 0 0 0 0 0 110 0 0 0 0 18 0 0 0 0May 15, 2032 and afterÏÏÏÏÏÏÏÏÏÏÏÏÏÏÏÏ 0 0 0 0 0 0 0 0 0 0 0 0 0 0 0
Weighted AverageLife (Years)ÏÏÏÏÏÏÏÏÏÏÏÏÏÏÏÏÏÏÏÏÏÏÏ 19.2 12.3 4.7 1.5 1.1 25.8 18.1 0.7 0.5 0.4 25.4 15.4 4.0 1.3 1.0
S-27
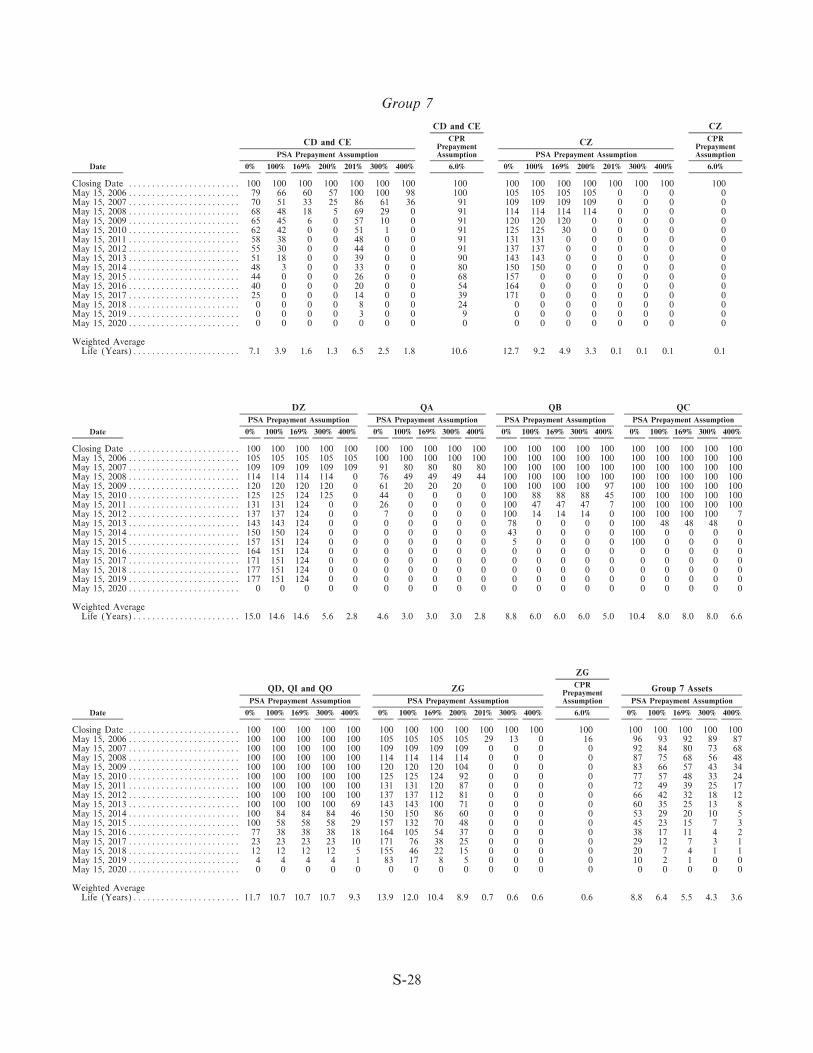
Group 7
CD and CE CZ
CPR CPRCD and CE CZPrepayment Prepayment
PSA Prepayment Assumption Assumption PSA Prepayment Assumption Assumption
Date 0% 100% 169% 200% 201% 300% 400% 6.0% 0% 100% 169% 200% 201% 300% 400% 6.0%
Closing Date ÏÏÏÏÏÏÏÏÏÏÏÏÏÏÏÏÏÏÏÏÏÏÏÏ 100 100 100 100 100 100 100 100 100 100 100 100 100 100 100 100May 15, 2006ÏÏÏÏÏÏÏÏÏÏÏÏÏÏÏÏÏÏÏÏÏÏÏÏ 79 66 60 57 100 100 98 100 105 105 105 105 0 0 0 0May 15, 2007ÏÏÏÏÏÏÏÏÏÏÏÏÏÏÏÏÏÏÏÏÏÏÏÏ 70 51 33 25 86 61 36 91 109 109 109 109 0 0 0 0May 15, 2008ÏÏÏÏÏÏÏÏÏÏÏÏÏÏÏÏÏÏÏÏÏÏÏÏ 68 48 18 5 69 29 0 91 114 114 114 114 0 0 0 0May 15, 2009ÏÏÏÏÏÏÏÏÏÏÏÏÏÏÏÏÏÏÏÏÏÏÏÏ 65 45 6 0 57 10 0 91 120 120 120 0 0 0 0 0May 15, 2010ÏÏÏÏÏÏÏÏÏÏÏÏÏÏÏÏÏÏÏÏÏÏÏÏ 62 42 0 0 51 1 0 91 125 125 30 0 0 0 0 0May 15, 2011ÏÏÏÏÏÏÏÏÏÏÏÏÏÏÏÏÏÏÏÏÏÏÏÏ 58 38 0 0 48 0 0 91 131 131 0 0 0 0 0 0May 15, 2012ÏÏÏÏÏÏÏÏÏÏÏÏÏÏÏÏÏÏÏÏÏÏÏÏ 55 30 0 0 44 0 0 91 137 137 0 0 0 0 0 0May 15, 2013ÏÏÏÏÏÏÏÏÏÏÏÏÏÏÏÏÏÏÏÏÏÏÏÏ 51 18 0 0 39 0 0 90 143 143 0 0 0 0 0 0May 15, 2014ÏÏÏÏÏÏÏÏÏÏÏÏÏÏÏÏÏÏÏÏÏÏÏÏ 48 3 0 0 33 0 0 80 150 150 0 0 0 0 0 0May 15, 2015ÏÏÏÏÏÏÏÏÏÏÏÏÏÏÏÏÏÏÏÏÏÏÏÏ 44 0 0 0 26 0 0 68 157 0 0 0 0 0 0 0May 15, 2016ÏÏÏÏÏÏÏÏÏÏÏÏÏÏÏÏÏÏÏÏÏÏÏÏ 40 0 0 0 20 0 0 54 164 0 0 0 0 0 0 0May 15, 2017ÏÏÏÏÏÏÏÏÏÏÏÏÏÏÏÏÏÏÏÏÏÏÏÏ 25 0 0 0 14 0 0 39 171 0 0 0 0 0 0 0May 15, 2018ÏÏÏÏÏÏÏÏÏÏÏÏÏÏÏÏÏÏÏÏÏÏÏÏ 0 0 0 0 8 0 0 24 0 0 0 0 0 0 0 0May 15, 2019ÏÏÏÏÏÏÏÏÏÏÏÏÏÏÏÏÏÏÏÏÏÏÏÏ 0 0 0 0 3 0 0 9 0 0 0 0 0 0 0 0May 15, 2020ÏÏÏÏÏÏÏÏÏÏÏÏÏÏÏÏÏÏÏÏÏÏÏÏ 0 0 0 0 0 0 0 0 0 0 0 0 0 0 0 0
Weighted AverageLife (Years)ÏÏÏÏÏÏÏÏÏÏÏÏÏÏÏÏÏÏÏÏÏÏÏ 7.1 3.9 1.6 1.3 6.5 2.5 1.8 10.6 12.7 9.2 4.9 3.3 0.1 0.1 0.1 0.1
DZ QA QB QC
PSA Prepayment Assumption PSA Prepayment Assumption PSA Prepayment Assumption PSA Prepayment Assumption
Date 0% 100% 169% 300% 400% 0% 100% 169% 300% 400% 0% 100% 169% 300% 400% 0% 100% 169% 300% 400%
Closing Date ÏÏÏÏÏÏÏÏÏÏÏÏÏÏÏÏÏÏÏÏÏÏÏÏ 100 100 100 100 100 100 100 100 100 100 100 100 100 100 100 100 100 100 100 100May 15, 2006ÏÏÏÏÏÏÏÏÏÏÏÏÏÏÏÏÏÏÏÏÏÏÏÏ 105 105 105 105 105 100 100 100 100 100 100 100 100 100 100 100 100 100 100 100May 15, 2007ÏÏÏÏÏÏÏÏÏÏÏÏÏÏÏÏÏÏÏÏÏÏÏÏ 109 109 109 109 109 91 80 80 80 80 100 100 100 100 100 100 100 100 100 100May 15, 2008ÏÏÏÏÏÏÏÏÏÏÏÏÏÏÏÏÏÏÏÏÏÏÏÏ 114 114 114 114 0 76 49 49 49 44 100 100 100 100 100 100 100 100 100 100May 15, 2009ÏÏÏÏÏÏÏÏÏÏÏÏÏÏÏÏÏÏÏÏÏÏÏÏ 120 120 120 120 0 61 20 20 20 0 100 100 100 100 97 100 100 100 100 100May 15, 2010ÏÏÏÏÏÏÏÏÏÏÏÏÏÏÏÏÏÏÏÏÏÏÏÏ 125 125 124 125 0 44 0 0 0 0 100 88 88 88 45 100 100 100 100 100May 15, 2011ÏÏÏÏÏÏÏÏÏÏÏÏÏÏÏÏÏÏÏÏÏÏÏÏ 131 131 124 0 0 26 0 0 0 0 100 47 47 47 7 100 100 100 100 100May 15, 2012ÏÏÏÏÏÏÏÏÏÏÏÏÏÏÏÏÏÏÏÏÏÏÏÏ 137 137 124 0 0 7 0 0 0 0 100 14 14 14 0 100 100 100 100 7May 15, 2013ÏÏÏÏÏÏÏÏÏÏÏÏÏÏÏÏÏÏÏÏÏÏÏÏ 143 143 124 0 0 0 0 0 0 0 78 0 0 0 0 100 48 48 48 0May 15, 2014ÏÏÏÏÏÏÏÏÏÏÏÏÏÏÏÏÏÏÏÏÏÏÏÏ 150 150 124 0 0 0 0 0 0 0 43 0 0 0 0 100 0 0 0 0May 15, 2015ÏÏÏÏÏÏÏÏÏÏÏÏÏÏÏÏÏÏÏÏÏÏÏÏ 157 151 124 0 0 0 0 0 0 0 5 0 0 0 0 100 0 0 0 0May 15, 2016ÏÏÏÏÏÏÏÏÏÏÏÏÏÏÏÏÏÏÏÏÏÏÏÏ 164 151 124 0 0 0 0 0 0 0 0 0 0 0 0 0 0 0 0 0May 15, 2017ÏÏÏÏÏÏÏÏÏÏÏÏÏÏÏÏÏÏÏÏÏÏÏÏ 171 151 124 0 0 0 0 0 0 0 0 0 0 0 0 0 0 0 0 0May 15, 2018ÏÏÏÏÏÏÏÏÏÏÏÏÏÏÏÏÏÏÏÏÏÏÏÏ 177 151 124 0 0 0 0 0 0 0 0 0 0 0 0 0 0 0 0 0May 15, 2019ÏÏÏÏÏÏÏÏÏÏÏÏÏÏÏÏÏÏÏÏÏÏÏÏ 177 151 124 0 0 0 0 0 0 0 0 0 0 0 0 0 0 0 0 0May 15, 2020ÏÏÏÏÏÏÏÏÏÏÏÏÏÏÏÏÏÏÏÏÏÏÏÏ 0 0 0 0 0 0 0 0 0 0 0 0 0 0 0 0 0 0 0 0
Weighted AverageLife (Years)ÏÏÏÏÏÏÏÏÏÏÏÏÏÏÏÏÏÏÏÏÏÏÏ 15.0 14.6 14.6 5.6 2.8 4.6 3.0 3.0 3.0 2.8 8.8 6.0 6.0 6.0 5.0 10.4 8.0 8.0 8.0 6.6
ZG
CPRQD, QI and QO ZG Group 7 AssetsPrepayment
PSA Prepayment Assumption PSA Prepayment Assumption Assumption PSA Prepayment Assumption
Date 0% 100% 169% 300% 400% 0% 100% 169% 200% 201% 300% 400% 6.0% 0% 100% 169% 300% 400%
Closing Date ÏÏÏÏÏÏÏÏÏÏÏÏÏÏÏÏÏÏÏÏÏÏÏÏ 100 100 100 100 100 100 100 100 100 100 100 100 100 100 100 100 100 100May 15, 2006ÏÏÏÏÏÏÏÏÏÏÏÏÏÏÏÏÏÏÏÏÏÏÏÏ 100 100 100 100 100 105 105 105 105 29 13 0 16 96 93 92 89 87May 15, 2007ÏÏÏÏÏÏÏÏÏÏÏÏÏÏÏÏÏÏÏÏÏÏÏÏ 100 100 100 100 100 109 109 109 109 0 0 0 0 92 84 80 73 68May 15, 2008ÏÏÏÏÏÏÏÏÏÏÏÏÏÏÏÏÏÏÏÏÏÏÏÏ 100 100 100 100 100 114 114 114 114 0 0 0 0 87 75 68 56 48May 15, 2009ÏÏÏÏÏÏÏÏÏÏÏÏÏÏÏÏÏÏÏÏÏÏÏÏ 100 100 100 100 100 120 120 120 104 0 0 0 0 83 66 57 43 34May 15, 2010ÏÏÏÏÏÏÏÏÏÏÏÏÏÏÏÏÏÏÏÏÏÏÏÏ 100 100 100 100 100 125 125 124 92 0 0 0 0 77 57 48 33 24May 15, 2011ÏÏÏÏÏÏÏÏÏÏÏÏÏÏÏÏÏÏÏÏÏÏÏÏ 100 100 100 100 100 131 131 120 87 0 0 0 0 72 49 39 25 17May 15, 2012ÏÏÏÏÏÏÏÏÏÏÏÏÏÏÏÏÏÏÏÏÏÏÏÏ 100 100 100 100 100 137 137 112 81 0 0 0 0 66 42 32 18 12May 15, 2013ÏÏÏÏÏÏÏÏÏÏÏÏÏÏÏÏÏÏÏÏÏÏÏÏ 100 100 100 100 69 143 143 100 71 0 0 0 0 60 35 25 13 8May 15, 2014ÏÏÏÏÏÏÏÏÏÏÏÏÏÏÏÏÏÏÏÏÏÏÏÏ 100 84 84 84 46 150 150 86 60 0 0 0 0 53 29 20 10 5May 15, 2015ÏÏÏÏÏÏÏÏÏÏÏÏÏÏÏÏÏÏÏÏÏÏÏÏ 100 58 58 58 29 157 132 70 48 0 0 0 0 45 23 15 7 3May 15, 2016ÏÏÏÏÏÏÏÏÏÏÏÏÏÏÏÏÏÏÏÏÏÏÏÏ 77 38 38 38 18 164 105 54 37 0 0 0 0 38 17 11 4 2May 15, 2017ÏÏÏÏÏÏÏÏÏÏÏÏÏÏÏÏÏÏÏÏÏÏÏÏ 23 23 23 23 10 171 76 38 25 0 0 0 0 29 12 7 3 1May 15, 2018ÏÏÏÏÏÏÏÏÏÏÏÏÏÏÏÏÏÏÏÏÏÏÏÏ 12 12 12 12 5 155 46 22 15 0 0 0 0 20 7 4 1 1May 15, 2019ÏÏÏÏÏÏÏÏÏÏÏÏÏÏÏÏÏÏÏÏÏÏÏÏ 4 4 4 4 1 83 17 8 5 0 0 0 0 10 2 1 0 0May 15, 2020ÏÏÏÏÏÏÏÏÏÏÏÏÏÏÏÏÏÏÏÏÏÏÏÏ 0 0 0 0 0 0 0 0 0 0 0 0 0 0 0 0 0 0
Weighted AverageLife (Years)ÏÏÏÏÏÏÏÏÏÏÏÏÏÏÏÏÏÏÏÏÏÏÏ 11.7 10.7 10.7 10.7 9.3 13.9 12.0 10.4 8.9 0.7 0.6 0.6 0.6 8.8 6.4 5.5 4.3 3.6
S-28
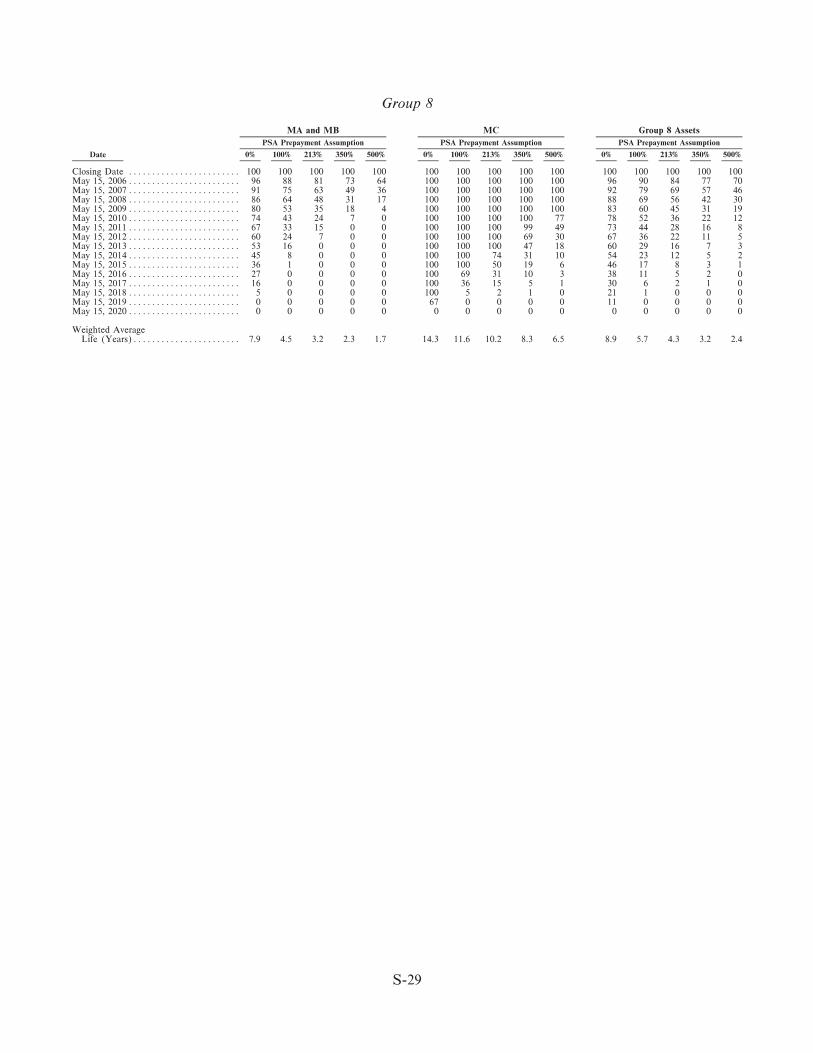
Group 8
MA and MB MC Group 8 Assets
PSA Prepayment Assumption PSA Prepayment Assumption PSA Prepayment Assumption
Date 0% 100% 213% 350% 500% 0% 100% 213% 350% 500% 0% 100% 213% 350% 500%
Closing Date ÏÏÏÏÏÏÏÏÏÏÏÏÏÏÏÏÏÏÏÏÏÏÏÏ 100 100 100 100 100 100 100 100 100 100 100 100 100 100 100May 15, 2006ÏÏÏÏÏÏÏÏÏÏÏÏÏÏÏÏÏÏÏÏÏÏÏÏ 96 88 81 73 64 100 100 100 100 100 96 90 84 77 70May 15, 2007ÏÏÏÏÏÏÏÏÏÏÏÏÏÏÏÏÏÏÏÏÏÏÏÏ 91 75 63 49 36 100 100 100 100 100 92 79 69 57 46May 15, 2008ÏÏÏÏÏÏÏÏÏÏÏÏÏÏÏÏÏÏÏÏÏÏÏÏ 86 64 48 31 17 100 100 100 100 100 88 69 56 42 30May 15, 2009ÏÏÏÏÏÏÏÏÏÏÏÏÏÏÏÏÏÏÏÏÏÏÏÏ 80 53 35 18 4 100 100 100 100 100 83 60 45 31 19May 15, 2010ÏÏÏÏÏÏÏÏÏÏÏÏÏÏÏÏÏÏÏÏÏÏÏÏ 74 43 24 7 0 100 100 100 100 77 78 52 36 22 12May 15, 2011ÏÏÏÏÏÏÏÏÏÏÏÏÏÏÏÏÏÏÏÏÏÏÏÏ 67 33 15 0 0 100 100 100 99 49 73 44 28 16 8May 15, 2012ÏÏÏÏÏÏÏÏÏÏÏÏÏÏÏÏÏÏÏÏÏÏÏÏ 60 24 7 0 0 100 100 100 69 30 67 36 22 11 5May 15, 2013ÏÏÏÏÏÏÏÏÏÏÏÏÏÏÏÏÏÏÏÏÏÏÏÏ 53 16 0 0 0 100 100 100 47 18 60 29 16 7 3May 15, 2014ÏÏÏÏÏÏÏÏÏÏÏÏÏÏÏÏÏÏÏÏÏÏÏÏ 45 8 0 0 0 100 100 74 31 10 54 23 12 5 2May 15, 2015ÏÏÏÏÏÏÏÏÏÏÏÏÏÏÏÏÏÏÏÏÏÏÏÏ 36 1 0 0 0 100 100 50 19 6 46 17 8 3 1May 15, 2016ÏÏÏÏÏÏÏÏÏÏÏÏÏÏÏÏÏÏÏÏÏÏÏÏ 27 0 0 0 0 100 69 31 10 3 38 11 5 2 0May 15, 2017ÏÏÏÏÏÏÏÏÏÏÏÏÏÏÏÏÏÏÏÏÏÏÏÏ 16 0 0 0 0 100 36 15 5 1 30 6 2 1 0May 15, 2018ÏÏÏÏÏÏÏÏÏÏÏÏÏÏÏÏÏÏÏÏÏÏÏÏ 5 0 0 0 0 100 5 2 1 0 21 1 0 0 0May 15, 2019ÏÏÏÏÏÏÏÏÏÏÏÏÏÏÏÏÏÏÏÏÏÏÏÏ 0 0 0 0 0 67 0 0 0 0 11 0 0 0 0May 15, 2020ÏÏÏÏÏÏÏÏÏÏÏÏÏÏÏÏÏÏÏÏÏÏÏÏ 0 0 0 0 0 0 0 0 0 0 0 0 0 0 0
Weighted AverageLife (Years)ÏÏÏÏÏÏÏÏÏÏÏÏÏÏÏÏÏÏÏÏÏÏÏ 7.9 4.5 3.2 2.3 1.7 14.3 11.6 10.2 8.3 6.5 8.9 5.7 4.3 3.2 2.4
S-29
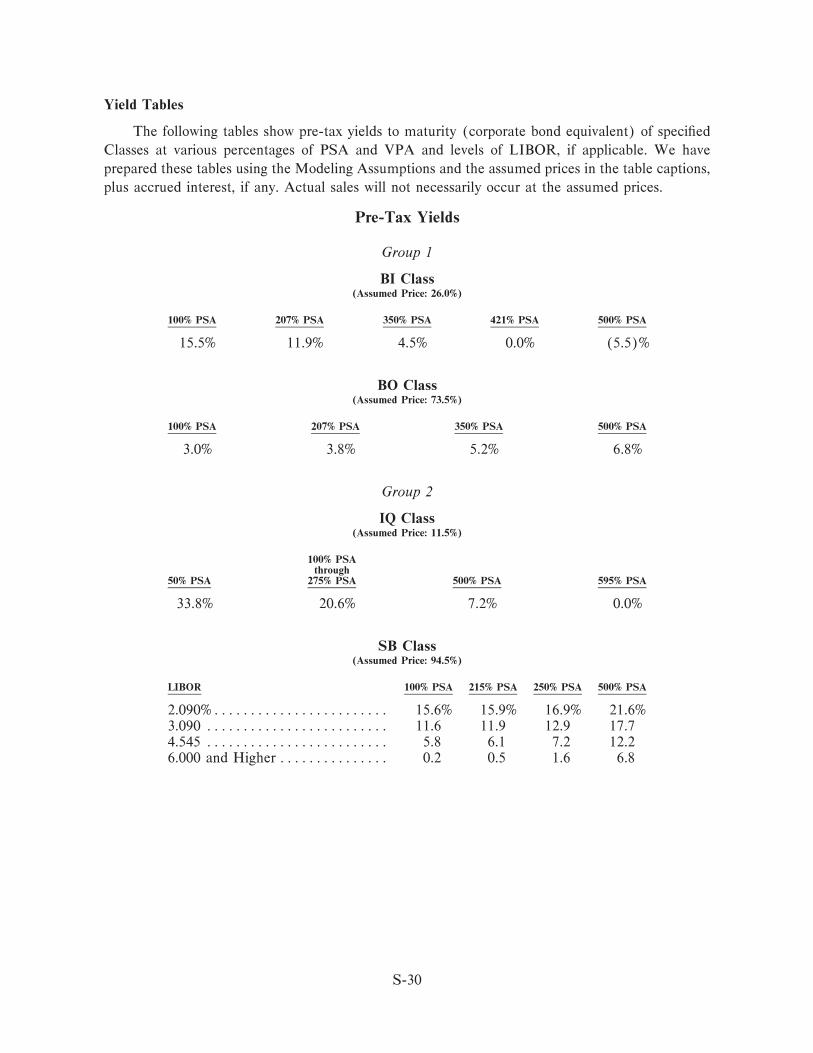
Yield Tables
The following tables show pre-tax yields to maturity (corporate bond equivalent) of speciÑed
Classes at various percentages of PSA and VPA and levels of LIBOR, if applicable. We have
prepared these tables using the Modeling Assumptions and the assumed prices in the table captions,
plus accrued interest, if any. Actual sales will not necessarily occur at the assumed prices.
Pre-Tax Yields
Group 1
BI Class(Assumed Price: 26.0%)
100% PSA 207% PSA 350% PSA 421% PSA 500% PSA
15.5% 11.9% 4.5% 0.0% (5.5)%
BO Class(Assumed Price: 73.5%)
100% PSA 207% PSA 350% PSA 500% PSA
3.0% 3.8% 5.2% 6.8%
Group 2
IQ Class(Assumed Price: 11.5%)
100% PSAthrough
50% PSA 275% PSA 500% PSA 595% PSA
33.8% 20.6% 7.2% 0.0%
SB Class(Assumed Price: 94.5%)
LIBOR 100% PSA 215% PSA 250% PSA 500% PSA
2.090%ÏÏÏÏÏÏÏÏÏÏÏÏÏÏÏÏÏÏÏÏÏÏÏÏ 15.6% 15.9% 16.9% 21.6%3.090 ÏÏÏÏÏÏÏÏÏÏÏÏÏÏÏÏÏÏÏÏÏÏÏÏÏ 11.6 11.9 12.9 17.74.545 ÏÏÏÏÏÏÏÏÏÏÏÏÏÏÏÏÏÏÏÏÏÏÏÏÏ 5.8 6.1 7.2 12.26.000 and Higher ÏÏÏÏÏÏÏÏÏÏÏÏÏÏÏ 0.2 0.5 1.6 6.8
S-30
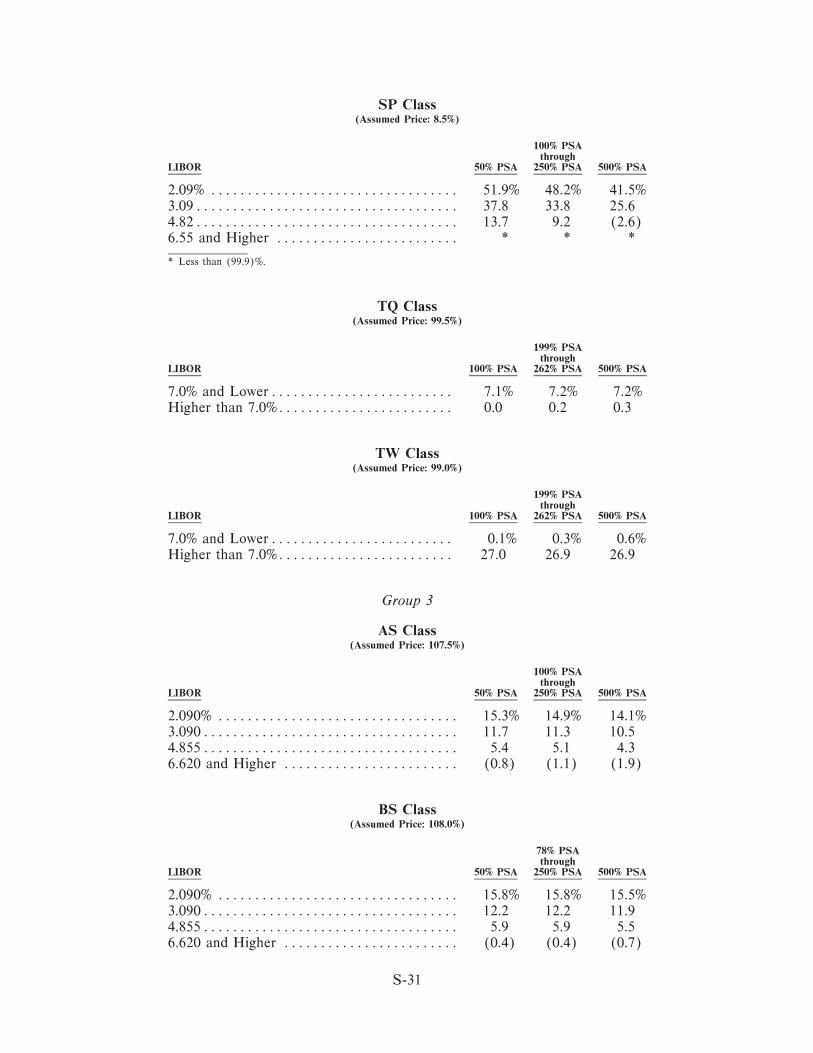
SP Class(Assumed Price: 8.5%)
100% PSAthrough
LIBOR 50% PSA 250% PSA 500% PSA
2.09% ÏÏÏÏÏÏÏÏÏÏÏÏÏÏÏÏÏÏÏÏÏÏÏÏÏÏÏÏÏÏÏÏÏÏ 51.9% 48.2% 41.5%3.09ÏÏÏÏÏÏÏÏÏÏÏÏÏÏÏÏÏÏÏÏÏÏÏÏÏÏÏÏÏÏÏÏÏÏÏÏ 37.8 33.8 25.64.82ÏÏÏÏÏÏÏÏÏÏÏÏÏÏÏÏÏÏÏÏÏÏÏÏÏÏÏÏÏÏÏÏÏÏÏÏ 13.7 9.2 (2.6)6.55 and Higher ÏÏÏÏÏÏÏÏÏÏÏÏÏÏÏÏÏÏÏÏÏÏÏÏÏ * * *
* Less than (99.9)%.
TQ Class(Assumed Price: 99.5%)
199% PSAthrough
LIBOR 100% PSA 262% PSA 500% PSA
7.0% and LowerÏÏÏÏÏÏÏÏÏÏÏÏÏÏÏÏÏÏÏÏÏÏÏÏÏ 7.1% 7.2% 7.2%Higher than 7.0%ÏÏÏÏÏÏÏÏÏÏÏÏÏÏÏÏÏÏÏÏÏÏÏÏ 0.0 0.2 0.3
TW Class(Assumed Price: 99.0%)
199% PSAthrough
LIBOR 100% PSA 262% PSA 500% PSA
7.0% and LowerÏÏÏÏÏÏÏÏÏÏÏÏÏÏÏÏÏÏÏÏÏÏÏÏÏ 0.1% 0.3% 0.6%Higher than 7.0%ÏÏÏÏÏÏÏÏÏÏÏÏÏÏÏÏÏÏÏÏÏÏÏÏ 27.0 26.9 26.9
Group 3
AS Class(Assumed Price: 107.5%)
100% PSAthrough
LIBOR 50% PSA 250% PSA 500% PSA
2.090% ÏÏÏÏÏÏÏÏÏÏÏÏÏÏÏÏÏÏÏÏÏÏÏÏÏÏÏÏÏÏÏÏÏ 15.3% 14.9% 14.1%3.090ÏÏÏÏÏÏÏÏÏÏÏÏÏÏÏÏÏÏÏÏÏÏÏÏÏÏÏÏÏÏÏÏÏÏÏ 11.7 11.3 10.54.855ÏÏÏÏÏÏÏÏÏÏÏÏÏÏÏÏÏÏÏÏÏÏÏÏÏÏÏÏÏÏÏÏÏÏÏ 5.4 5.1 4.36.620 and Higher ÏÏÏÏÏÏÏÏÏÏÏÏÏÏÏÏÏÏÏÏÏÏÏÏ (0.8) (1.1) (1.9)
BS Class(Assumed Price: 108.0%)
78% PSAthrough
LIBOR 50% PSA 250% PSA 500% PSA
2.090% ÏÏÏÏÏÏÏÏÏÏÏÏÏÏÏÏÏÏÏÏÏÏÏÏÏÏÏÏÏÏÏÏÏ 15.8% 15.8% 15.5%3.090ÏÏÏÏÏÏÏÏÏÏÏÏÏÏÏÏÏÏÏÏÏÏÏÏÏÏÏÏÏÏÏÏÏÏÏ 12.2 12.2 11.94.855ÏÏÏÏÏÏÏÏÏÏÏÏÏÏÏÏÏÏÏÏÏÏÏÏÏÏÏÏÏÏÏÏÏÏÏ 5.9 5.9 5.56.620 and Higher ÏÏÏÏÏÏÏÏÏÏÏÏÏÏÏÏÏÏÏÏÏÏÏÏ (0.4) (0.4) (0.7)
S-31
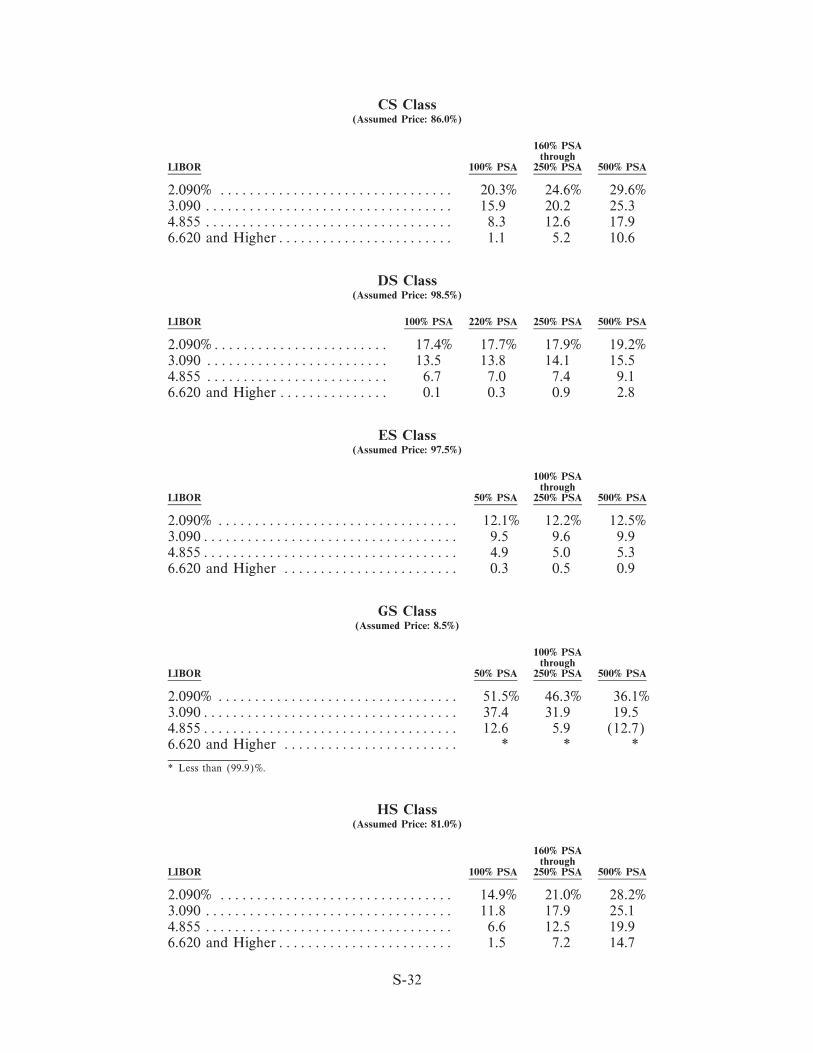
CS Class(Assumed Price: 86.0%)
160% PSAthrough
LIBOR 100% PSA 250% PSA 500% PSA
2.090% ÏÏÏÏÏÏÏÏÏÏÏÏÏÏÏÏÏÏÏÏÏÏÏÏÏÏÏÏÏÏÏÏ 20.3% 24.6% 29.6%3.090 ÏÏÏÏÏÏÏÏÏÏÏÏÏÏÏÏÏÏÏÏÏÏÏÏÏÏÏÏÏÏÏÏÏÏ 15.9 20.2 25.34.855 ÏÏÏÏÏÏÏÏÏÏÏÏÏÏÏÏÏÏÏÏÏÏÏÏÏÏÏÏÏÏÏÏÏÏ 8.3 12.6 17.96.620 and HigherÏÏÏÏÏÏÏÏÏÏÏÏÏÏÏÏÏÏÏÏÏÏÏÏ 1.1 5.2 10.6
DS Class(Assumed Price: 98.5%)
LIBOR 100% PSA 220% PSA 250% PSA 500% PSA
2.090%ÏÏÏÏÏÏÏÏÏÏÏÏÏÏÏÏÏÏÏÏÏÏÏÏ 17.4% 17.7% 17.9% 19.2%3.090 ÏÏÏÏÏÏÏÏÏÏÏÏÏÏÏÏÏÏÏÏÏÏÏÏÏ 13.5 13.8 14.1 15.54.855 ÏÏÏÏÏÏÏÏÏÏÏÏÏÏÏÏÏÏÏÏÏÏÏÏÏ 6.7 7.0 7.4 9.16.620 and Higher ÏÏÏÏÏÏÏÏÏÏÏÏÏÏÏ 0.1 0.3 0.9 2.8
ES Class(Assumed Price: 97.5%)
100% PSAthrough
LIBOR 50% PSA 250% PSA 500% PSA
2.090% ÏÏÏÏÏÏÏÏÏÏÏÏÏÏÏÏÏÏÏÏÏÏÏÏÏÏÏÏÏÏÏÏÏ 12.1% 12.2% 12.5%3.090ÏÏÏÏÏÏÏÏÏÏÏÏÏÏÏÏÏÏÏÏÏÏÏÏÏÏÏÏÏÏÏÏÏÏÏ 9.5 9.6 9.94.855ÏÏÏÏÏÏÏÏÏÏÏÏÏÏÏÏÏÏÏÏÏÏÏÏÏÏÏÏÏÏÏÏÏÏÏ 4.9 5.0 5.36.620 and Higher ÏÏÏÏÏÏÏÏÏÏÏÏÏÏÏÏÏÏÏÏÏÏÏÏ 0.3 0.5 0.9
GS Class(Assumed Price: 8.5%)
100% PSAthrough
LIBOR 50% PSA 250% PSA 500% PSA
2.090% ÏÏÏÏÏÏÏÏÏÏÏÏÏÏÏÏÏÏÏÏÏÏÏÏÏÏÏÏÏÏÏÏÏ 51.5% 46.3% 36.1%3.090ÏÏÏÏÏÏÏÏÏÏÏÏÏÏÏÏÏÏÏÏÏÏÏÏÏÏÏÏÏÏÏÏÏÏÏ 37.4 31.9 19.54.855ÏÏÏÏÏÏÏÏÏÏÏÏÏÏÏÏÏÏÏÏÏÏÏÏÏÏÏÏÏÏÏÏÏÏÏ 12.6 5.9 (12.7)6.620 and Higher ÏÏÏÏÏÏÏÏÏÏÏÏÏÏÏÏÏÏÏÏÏÏÏÏ * * *
* Less than (99.9)%.
HS Class(Assumed Price: 81.0%)
160% PSAthrough
LIBOR 100% PSA 250% PSA 500% PSA
2.090% ÏÏÏÏÏÏÏÏÏÏÏÏÏÏÏÏÏÏÏÏÏÏÏÏÏÏÏÏÏÏÏÏ 14.9% 21.0% 28.2%3.090 ÏÏÏÏÏÏÏÏÏÏÏÏÏÏÏÏÏÏÏÏÏÏÏÏÏÏÏÏÏÏÏÏÏÏ 11.8 17.9 25.14.855 ÏÏÏÏÏÏÏÏÏÏÏÏÏÏÏÏÏÏÏÏÏÏÏÏÏÏÏÏÏÏÏÏÏÏ 6.6 12.5 19.96.620 and HigherÏÏÏÏÏÏÏÏÏÏÏÏÏÏÏÏÏÏÏÏÏÏÏÏ 1.5 7.2 14.7
S-32

IS Class(Assumed Price: 4.5%)
160% PSAthrough
LIBOR 100% PSA 250% PSA 500% PSA
2.090% ÏÏÏÏÏÏÏÏÏÏÏÏÏÏÏÏÏÏÏÏÏÏÏÏÏÏÏÏÏÏÏÏ 122.8% 95.5% 60.8%3.090 ÏÏÏÏÏÏÏÏÏÏÏÏÏÏÏÏÏÏÏÏÏÏÏÏÏÏÏÏÏÏÏÏÏÏ 92.5 64.8 23.74.855 ÏÏÏÏÏÏÏÏÏÏÏÏÏÏÏÏÏÏÏÏÏÏÏÏÏÏÏÏÏÏÏÏÏÏ 43.2 12.1 (45.3)6.620 and HigherÏÏÏÏÏÏÏÏÏÏÏÏÏÏÏÏÏÏÏÏÏÏÏÏ * * *
SH Class(Assumed Price: 103.5%)
LIBOR 100% PSA 220% PSA 250% PSA 500% PSA
2.090%ÏÏÏÏÏÏÏÏÏÏÏÏÏÏÏÏÏÏÏÏÏÏÏÏ 16.3% 16.1% 16.0% 15.5%3.090 ÏÏÏÏÏÏÏÏÏÏÏÏÏÏÏÏÏÏÏÏÏÏÏÏÏ 12.6 12.3 12.3 11.84.855 ÏÏÏÏÏÏÏÏÏÏÏÏÏÏÏÏÏÏÏÏÏÏÏÏÏ 6.1 5.9 5.9 5.46.620 and Higher ÏÏÏÏÏÏÏÏÏÏÏÏÏÏÏ (0.3) (0.4) (0.5) (0.8)
SN Class(Assumed Price: 0.5%)
LIBOR 100% PSA 220% PSA 250% PSA 500% PSA
6.620% and Lower ÏÏÏÏÏÏÏÏÏÏÏÏÏÏ (13.0)% (19.9)% (21.7)% (37.4)%6.625 ÏÏÏÏÏÏÏÏÏÏÏÏÏÏÏÏÏÏÏÏÏÏÏÏÏ (17.0) (23.8) (25.6) (41.0)6.630 and Higher ÏÏÏÏÏÏÏÏÏÏÏÏÏÏÏ * * * *
* Less than (99.9)%.
Group 4
SJ Class(Assumed Price: 102.5%)
LIBOR 50% VPA 100% VPA 150% VPA 200% VPA
2.090%ÏÏÏÏÏÏÏÏÏÏÏÏÏÏÏÏÏÏÏÏÏÏÏÏ 13.8% 13.7% 13.5% 13.3%3.090 ÏÏÏÏÏÏÏÏÏÏÏÏÏÏÏÏÏÏÏÏÏÏÏÏÏ 11.0 10.9 10.7 10.55.145 ÏÏÏÏÏÏÏÏÏÏÏÏÏÏÏÏÏÏÏÏÏÏÏÏÏ 5.4 5.2 5.1 4.97.200 and Higher ÏÏÏÏÏÏÏÏÏÏÏÏÏÏÏ (0.2) (0.3) (0.5) (0.6)
SK Class(Assumed Price: 105.5%)
LIBOR 50% VPA 100% VPA 150% VPA 200% VPA
2.090%ÏÏÏÏÏÏÏÏÏÏÏÏÏÏÏÏÏÏÏÏÏÏÏÏ 13.0% 12.4% 11.8% 11.3%3.090 ÏÏÏÏÏÏÏÏÏÏÏÏÏÏÏÏÏÏÏÏÏÏÏÏÏ 10.2 9.7 9.2 8.65.145 ÏÏÏÏÏÏÏÏÏÏÏÏÏÏÏÏÏÏÏÏÏÏÏÏÏ 4.7 4.2 3.7 3.27.200 and Higher ÏÏÏÏÏÏÏÏÏÏÏÏÏÏÏ (0.7) (1.2) (1.7) (2.1)
S-33
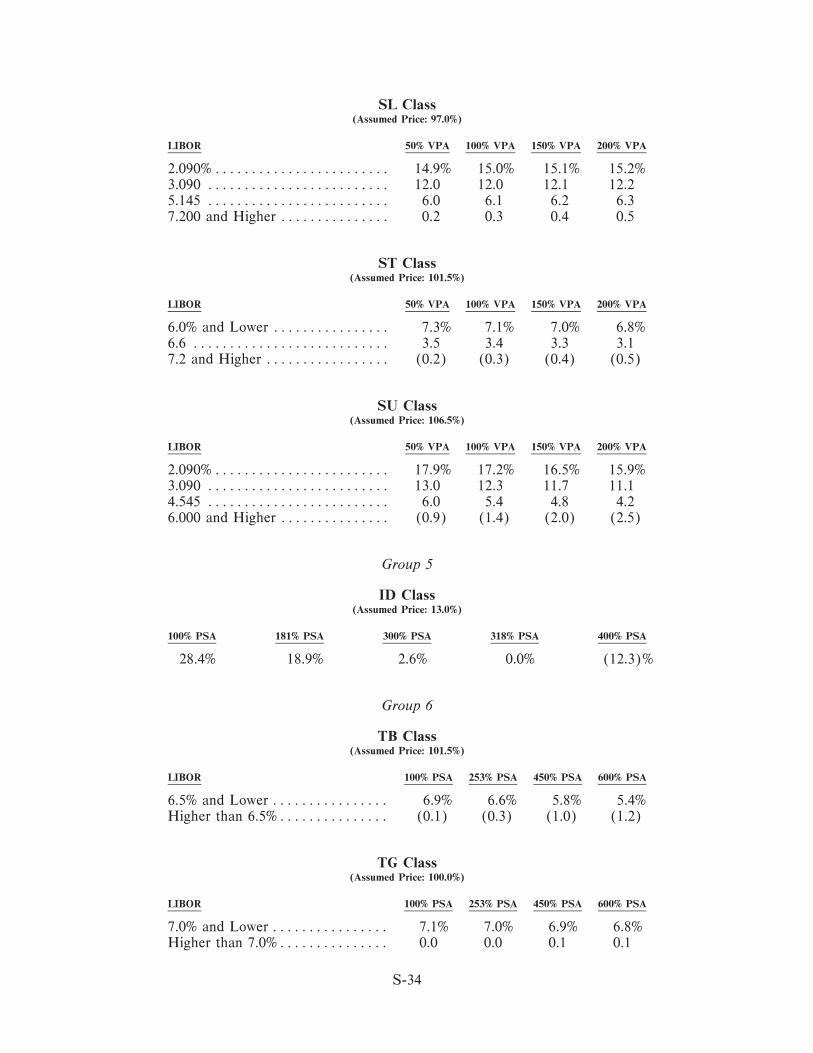
SL Class(Assumed Price: 97.0%)
LIBOR 50% VPA 100% VPA 150% VPA 200% VPA
2.090%ÏÏÏÏÏÏÏÏÏÏÏÏÏÏÏÏÏÏÏÏÏÏÏÏ 14.9% 15.0% 15.1% 15.2%3.090 ÏÏÏÏÏÏÏÏÏÏÏÏÏÏÏÏÏÏÏÏÏÏÏÏÏ 12.0 12.0 12.1 12.25.145 ÏÏÏÏÏÏÏÏÏÏÏÏÏÏÏÏÏÏÏÏÏÏÏÏÏ 6.0 6.1 6.2 6.37.200 and Higher ÏÏÏÏÏÏÏÏÏÏÏÏÏÏÏ 0.2 0.3 0.4 0.5
ST Class(Assumed Price: 101.5%)
LIBOR 50% VPA 100% VPA 150% VPA 200% VPA
6.0% and Lower ÏÏÏÏÏÏÏÏÏÏÏÏÏÏÏÏ 7.3% 7.1% 7.0% 6.8%6.6 ÏÏÏÏÏÏÏÏÏÏÏÏÏÏÏÏÏÏÏÏÏÏÏÏÏÏÏ 3.5 3.4 3.3 3.17.2 and Higher ÏÏÏÏÏÏÏÏÏÏÏÏÏÏÏÏÏ (0.2) (0.3) (0.4) (0.5)
SU Class(Assumed Price: 106.5%)
LIBOR 50% VPA 100% VPA 150% VPA 200% VPA
2.090%ÏÏÏÏÏÏÏÏÏÏÏÏÏÏÏÏÏÏÏÏÏÏÏÏ 17.9% 17.2% 16.5% 15.9%3.090 ÏÏÏÏÏÏÏÏÏÏÏÏÏÏÏÏÏÏÏÏÏÏÏÏÏ 13.0 12.3 11.7 11.14.545 ÏÏÏÏÏÏÏÏÏÏÏÏÏÏÏÏÏÏÏÏÏÏÏÏÏ 6.0 5.4 4.8 4.26.000 and Higher ÏÏÏÏÏÏÏÏÏÏÏÏÏÏÏ (0.9) (1.4) (2.0) (2.5)
Group 5
ID Class(Assumed Price: 13.0%)
100% PSA 181% PSA 300% PSA 318% PSA 400% PSA
28.4% 18.9% 2.6% 0.0% (12.3)%
Group 6
TB Class(Assumed Price: 101.5%)
LIBOR 100% PSA 253% PSA 450% PSA 600% PSA
6.5% and Lower ÏÏÏÏÏÏÏÏÏÏÏÏÏÏÏÏ 6.9% 6.6% 5.8% 5.4%Higher than 6.5%ÏÏÏÏÏÏÏÏÏÏÏÏÏÏÏ (0.1) (0.3) (1.0) (1.2)
TG Class(Assumed Price: 100.0%)
LIBOR 100% PSA 253% PSA 450% PSA 600% PSA
7.0% and Lower ÏÏÏÏÏÏÏÏÏÏÏÏÏÏÏÏ 7.1% 7.0% 6.9% 6.8%Higher than 7.0%ÏÏÏÏÏÏÏÏÏÏÏÏÏÏÏ 0.0 0.0 0.1 0.1
S-34

XB Class(Assumed Price: 99.0%)
LIBOR 100% PSA 253% PSA 450% PSA 600% PSA
6.5% and Lower ÏÏÏÏÏÏÏÏÏÏÏÏÏÏÏÏ 0.1% 0.2% 0.7% 0.9%Higher than 6.5%ÏÏÏÏÏÏÏÏÏÏÏÏÏÏÏ 27.0 26.9 26.8 26.8
XG Class(Assumed Price: 98.0%)
LIBOR 100% PSA 253% PSA 450% PSA 600% PSA
7.0% and Lower ÏÏÏÏÏÏÏÏÏÏÏÏÏÏÏÏ 0.2% 0.4% 1.4% 1.8%Higher than 7.0%ÏÏÏÏÏÏÏÏÏÏÏÏÏÏÏ 27.3 27.5 27.8 28.0
Group 7
QI Class(Assumed Price: 27.5%)
69% PSAthrough
50% PSA 300% PSA 400% PSA 691% PSA
11.7% 11.6% 9.4% 0.0%
QO Class(Assumed Price: 69.0%)
69% PSAthrough
50% PSA 300% PSA 400% PSA
3.5% 3.5% 4.1%
S-35
FINAL PAYMENT DATES
The Final Payment Date for each Class is the latest date by which it will be paid in full and will
retire. We calculate Final Payment Dates using highly conservative assumptions. The actual
retirement of each Class may occur earlier than its Final Payment Date.
CERTAIN FEDERAL INCOME TAX CONSEQUENCES
General
Subject to the assumptions described under Certain Federal Income Tax Consequences Ì
REMIC Election in the OÅering Circular, the Upper-Tier REMIC Pool and the Lower-Tier
REMIC Pool will each qualify as a REMIC for federal income tax purposes.
Regular Classes
The Regular Classes are ""regular interests'' in the Upper-Tier REMIC Pool. They are treated
as debt instruments for federal income tax purposes and may be issued with original issue discount
(""OID'') or at a premium. Based in part on (a) the level of LIBOR as of the date of this
Supplement and (b) information provided by the Underwriter regarding the initial prices at which it
would have expected to sell or will sell substantial portions of the Regular Classes, we expect to
report income to the Internal Revenue Service and to Holders of the Regular Classes assuming they
are issued as follows:
‚ OID: BI, BO, CZ, DZ, ES, GS, HS, ID, IS, QI, QO, SB, SN, SP, SU, TW, XG, Z,
ZG, ZK and ZL.
‚ De Minimis OID: CD, CE, DS, FB, MA, QB, QC, QJ, QK, SL, VL and XB.
‚ Premium: BC, BS, DA, MB, MC, QA, QG, QH, ST, TB, TG, TQ and VK.
We will report income with respect to SU assuming that all of the stated interest payments on
that Class are included in the stated redemption price since that Class does not qualify as a ""variable
rate debt instrument'' under the OID regulations. Consequently, that Class will be issued with OID.
OID generally results in recognition of taxable income in advance of the receipt of cash
attributable to that income. The Pricing Speeds used for OID and premium calculations are:
‚ Group 1 Ì 207% PSA
‚ Group 2 Ì 215% PSA
‚ Group 3 Ì 220% PSA
‚ Group 4 Ì 100% VPA
‚ Group 5 Ì 181% PSA
‚ Group 6 Ì 253% PSA
‚ Group 7 Ì 169% PSA
‚ Group 8 Ì 213% PSA
S-36
See Certain Federal Income Tax Consequences Ì Taxation of Regular Classes Ì Original Issue
Discount and Ì Premium in the OÅering Circular. In addition, the Pricing Speeds are used to
determine the principal type for certain Classes. See the descriptions of PAC and Scheduled Classes
in Appendix II to the OÅering Circular. Mortgage prepayment rates will diÅer, perhaps signiÑcantly,
from the Pricing Speeds shown above.
We intend to report any original issue or market discount or premium on the Floating Rate
Classes that are not Toggle Classes assuming that each variable rate is a Ñxed rate equal to the value
of the variable rate as of the date of this Supplement. See Certain Federal Income Tax
Consequences Ì Taxation of Regular Classes Ì Floating Rate, Inverse Floating Rate and
Weighted Average Coupon Classes in the OÅering Circular.
Residual Classes
Each Residual Class is the ""residual interest'' in its related REMIC Pool. Special tax
considerations apply to the Residual Classes. The taxation of the Residual Classes can produce a
signiÑcantly less favorable after-tax return than if (a) the Residual Classes were taxable as debt
instruments or (b) no portion of the taxable income on the Residual Classes were treated as ""excess
inclusions.'' In certain periods, taxable income and the resulting tax liability on a Residual Class
may exceed any payments on that Class. See Certain Federal Income Tax Consequences Ì
Taxation of Residual Classes in the OÅering Circular.
A substantial tax may be imposed on certain transferors of a Residual Class and certain
beneÑcial owners of a Residual Class that are ""pass-through entities.'' See Certain Federal Income
Tax Consequences Ì Transfers of Interests in a Residual Class Ì DisqualiÑed Organizations in the
OÅering Circular. You should not purchase a Residual Class before consulting your tax advisor.
We intend to report accruals of OID and market discount and to amortize premium with
respect to the Multiclass Assets using the applicable Pricing Speeds shown above, regardless of the
Pricing Speeds used in their Series.
You should consult your tax advisor regarding the tax consequences, if any, associated with the
Prepayment Protection Mortgages, including whether prepayment premiums retained by the
servicer may constitute servicing compensation the deductibility of which may be limited. See
Certain Federal Income Tax Consequences Ì Treatment of Servicing Compensation in the OÅering
Circular.
Certain Transfers of Residual Classes
The REMIC Regulations disregard:
1. A transfer of a ""noneconomic residual interest'' unless no signiÑcant purpose of the transfer
is to impede the assessment or collection of tax.
2. Except in certain cases, a transfer of a residual interest to a foreign investor or a transfer of a
residual interest from a foreign investor to a U.S. investor. Accordingly, the Agreement
prohibits the transfer of an interest in a Residual Class to or from a foreign investor without
our written consent.
See Certain Federal Income Tax Consequences Ì Transfers of Interests in a Residual Class Ì
Additional Transfer Restrictions in the OÅering Circular. In the case of a transfer that is
S-37
disregarded, the transferor would continue to be treated as the owner of the residual interest and
thus would continue to be subject to tax on its allocable portion of the net income of the REMIC.
Residual Classes with Negative Fair Market Values
Recently, the Treasury issued Ñnal regulations addressing the treatment of a payment made to a
transferee on the transfer of a ""noneconomic residual interest.'' Under these regulations, the
transferee does not immediately recognize the payment as income. Rather, the payment is
recognized as income over a period that is reasonably related to the period during which the
REMIC is expected to generate taxable income or net loss allocable to the holder of the
noneconomic Residual Class. The regulations also provide the following two safe harbor methods for
tax accounting for the payment:
‚ A transferee may recognize the payment for federal income tax purposes in the same
amounts and over the same period in which the payment is included in the transferee's
income for Ñnancial reporting purposes, provided that such period is not shorter than the
period over which the REMIC is expected to generate taxable income.
‚ A transferee may recognize the payment for federal income tax purposes ratably over
the ""anticipated weighted average life of the REMIC,'' as deÑned in the REMIC
Regulations, as determined at the time the transferee acquires the residual interest.
The regulations state that the unamortized amount of the payment must be currently included
by a transferee on disposition of the Residual Class. Additionally, the regulations provide that a
transferee's treatment of the payment is a method of accounting that must be consistently applied to
all such payments received by the transferee in connection with noneconomic Residual Classes.
Finally, the regulations state that such payment shall be treated as income from U.S. sources. The
regulations are eÅective for taxable years ending on or after May 11, 2004.
Certain federal income tax consequences of a payment made to a transferee on the transfer of a
Residual Class remain unclear. For example, the regulations do not address whether a residual
interest could have a negative basis and a negative issue price.
If you receive a payment in connection with the acquisition of a Residual Class, you should
consult your tax advisor as to the proper treatment of such payment.
Reporting and Administrative Matters
We will provide Holders of the Residual Classes information to enable them to prepare reports
required under the Code or applicable Treasury regulations. Because we do not intend to hold the
Residual Classes, applicable law may not allow us to perform tax administrative functions for the
REMIC Pools. Therefore, if you own a Residual Class, you may have certain tax administrative
obligations, for which we will act as your attorney-in-fact and agent. See Certain Federal Income
Tax Consequences Ì Reporting and Administrative Matters in the OÅering Circular.
MACR Classes
The arrangement under which the MACR Classes are created (the ""MACR Pool'') will be
classiÑed as a grantor trust under subpart E, part I of subchapter J of the Internal Revenue Code.
The interests in the Regular Classes that have been exchanged for the MACR Classes, including
S-38

any exchanges eÅective on the Closing Date, will be the assets of the MACR Pool and the MACR
Classes will represent beneÑcial ownership of these assets.
For a discussion of certain federal income tax consequences applicable to the MACR Classes,
see Certain Federal Income Tax Consequences Ì Taxation of MACR Classes, Ì Exchanges of
MACR Classes and Regular Classes and Ì Taxation of Certain Foreign Investors in the OÅering
Circular.
LEGAL INVESTMENT CONSIDERATIONS
You should consult your legal advisor to determine whether the CertiÑcates are a legal
investment for you and whether you can use the CertiÑcates as collateral for borrowings. See Legal
Investment Considerations in the OÅering Circular.
ERISA CONSIDERATIONS
Fiduciaries of ERISA plans should review ERISA Considerations in the OÅering Circular.
PLAN OF DISTRIBUTION
Under an agreement with the Underwriter, we have agreed to sell all of the REMIC
CertiÑcates to the Underwriter in exchange for the Assets. We have agreed to buy all of BA from
the Underwriter.
The Underwriter is oÅering the CertiÑcates to the public in negotiated transactions at varying
prices to be determined at the time of sale, plus accrued interest on each interest-bearing Class from
the Ñrst day of its initial Accrual Period. The Underwriter is oÅering the CertiÑcates subject to their
issuance by us and subject to the Underwriter's right to reject any order. The Underwriter may make
sales to or through securities dealers. The dealers may receive compensation in the form of
discounts, concessions or commissions from the Underwriter and commissions from any purchasers
for which they act as agents.
Our agreement with the Underwriter provides that we will indemnify it against certain
liabilities.
LEGAL MATTERS
Our General Counsel (or one of our Deputy General Counsels) will render an opinion on the
legality of the CertiÑcates. Cleary Gottlieb Steen & Hamilton LLP is representing the Underwriter
on legal matters concerning the CertiÑcates.
S-39

A-1
Appen
dix
A
Ava
ilab
le C
om
bin
atio
ns
REM
IC C
ertiÑca
tes
MAC
R C
ertiÑca
tes
Origi
nal
Exch
ange
MAC
RM
axim
um
Exch
ange
Princi
pal
Cla
ssIn
tere
stC
USIP
Gro
up
REM
IC C
lass
Bal
ance
Pro
port
ions(
1)
Cla
ssO
rigi
nal
Bal
ance
Pro
port
ions(
1)
Typ
e(2)
Coupon
Typ
e(2)
Num
ber
Fin
al P
aym
ent D
ate
Com
bin
atio
n 1
1BI
$32,8
56,3
57
(3)
BA
$32,8
56,3
57
100%
SC
/SEQ
5.0
%FIX
31395U
LZ
2A
pril 15, 2020
BO
32,8
56,3
57
100%
Com
bin
atio
n 2
2Q
G$21,9
99,0
00
100%
IQ$
1,9
99,9
09
N/A
NTL(PA
C)
5.5
%FIX
/IO
31395U
MQ
1A
pril 15, 2026
QM
21,9
99,0
00
N/A
PA
C4.7
5FIX
31395U
N64
April 15, 2026
QN
21,9
99,0
00
N/A
PA
C4.5
FIX
31395U
N72
April 15, 2026
Com
bin
atio
n 3
3ES
$17,4
47,0
00
100%
AS
$17,4
47,0
00
100%
PA
C I
(4)
INV
/S
31395U
LY
5M
arch
15, 2034
GS
20,3
54,8
35
(3)
Com
bin
atio
n 4
3H
S$
3,7
37,0
00
100%
CS
$3,7
37,0
00
100%
PA
C I
I(4)
INV
/S
31395U
M99
May
15, 2035
IS4,3
59,8
33
(3)
Com
bin
atio
n 5
3A
S(5)
$17,4
47,0
00
63.9
723363187%
SH
$27,2
72,7
26
100%
PT
(4)
INV
/S
31395U
NE
7M
ay 1
5, 2035
BS
1,9
59,0
00
7.1
830003352
CS(5)
3,7
37,0
00
13.7
023339728
DS
4,1
29,7
26
15.1
423293733
Com
bin
atio
n 6
4ST
$7,3
19,7
47
43.9
999963933%
SK
$16,6
35,7
90
100%
SEQ
(4)
INV
/S
31395U
NG
2N
ovem
ber
15, 2032
SU
9,3
16,0
43
56.0
000036067
Com
bin
atio
n 7
4SK
(5)
$16,6
35,7
90
80.0
000019236%
SJ
$20,7
94,7
37
100%
PT
(4)
INV
/S
31395U
NF4
May
15, 2035
SL
4,1
58,9
47
19.9
999980764
Com
bin
atio
n 8
5V
K$
8,3
94,4
83
31.6
772943396%
DE
$26,5
00,0
00
100%
SEQ
5.0
%FIX
31395U
MC
2M
ay 1
5, 2035
VL
6,6
01,7
49
24.9
122603774
ZL
11,5
03,7
68
43.4
104452830
Com
bin
atio
n 9
6TB
$12,8
67,4
28
78.5
714263906%
CB
$16,3
76,7
27
100%
SC
/TA
C5.5
%FIX
31395U
M65
April 15, 2035
XB
3,5
09,2
99
21.4
285736094
Com
bin
atio
n 1
07
QI
$10,3
80,3
54
(3)
QD
$10,3
80,3
54
100%
PA
C4.5
%FIX
31395U
MY
4M
ay 1
5, 2020
QO
10,3
80,3
54
100%
(1)
Exc
han
ge p
ropor
tion
s ar
e co
nstan
t pro
por
tion
s of
the
orig
inal bal
ance
s of
the
REM
IC C
lass
es o
r M
AC
R C
lass
es, as
applica
ble
. In
acc
ordan
ce w
ith the
exch
ange
pro
por
tion
s, y
ou m
ay e
xchan
geR
EM
IC C
ertiÑca
tes fo
r M
AC
R C
ertiÑca
tes, a
nd v
ice
vers
a. T
he
exch
ange
pro
por
tion
s ar
e not
applica
ble
to
the
MA
CR
Cla
sses
des
ignat
ed b
y ""N
/A
.'' See
Appen
dix
III
to
the
OÅer
ing
Circu
lar
for
a des
crip
tion
of ""ra
tio-
strippin
g'' M
AC
R C
lass
es o
f th
is typ
e.(2)
See
Appen
dix
II
to the
OÅer
ing
Circu
lar
and P
aym
ents
ÌCate
gories
of Cla
sses
.(3)
The
orig
inal
bal
ance
of ea
ch N
otio
nal
Cla
ss b
eing
exch
ange
d e
qual
s th
e ap
plica
ble
multip
lier
tim
es the
orig
inal
bal
ance
of th
e re
late
d C
lass
bei
ng
exch
ange
d.
Com
bin
atio
nN
otional
Cla
ssM
ultip
lier
Rel
ated
Cla
ss
1BI
1.0
000000000
BO
3G
S1.1
666667622
ES
4IS
1.1
666665775
HS
10
QI
1.0
000000000
QO
(4)
See
Ter
ms
Shee
tÌ
Inte
rest.
(5)
MA
CR
Cla
ss.

Appendix B
Balances Schedules
Group 2 Group 2 Group 3 Group 3PAC Scheduled Type I PAC HS
Payment Date (Aggregate) (Aggregate) (Aggregate) Type II PAC
Initial ÏÏÏÏÏÏÏÏÏÏÏÏÏÏÏÏÏÏÏÏÏ $67,900,000.00 $18,224,000.00 $19,406,000.00 $3,737,000.00June 15, 2005ÏÏÏÏÏÏÏÏÏÏÏÏÏÏÏ 67,733,487.60 18,159,890.85 19,336,069.70 3,712,352.94July 15, 2005 ÏÏÏÏÏÏÏÏÏÏÏÏÏÏÏ 67,550,438.43 18,080,025.25 19,261,510.55 3,684,608.84August 15, 2005ÏÏÏÏÏÏÏÏÏÏÏÏÏ 67,351,225.55 17,984,339.64 19,182,376.64 3,654,209.31September 15, 2005ÏÏÏÏÏÏÏÏÏÏ 67,135,916.26 17,872,935.41 19,098,698.60 3,621,188.86October 15, 2005 ÏÏÏÏÏÏÏÏÏÏÏÏ 66,904,586.25 17,745,938.45 19,010,509.42 3,585,585.58November 15, 2005ÏÏÏÏÏÏÏÏÏÏ 66,657,319.55 17,603,499.06 18,917,844.44 3,547,441.11December 15, 2005 ÏÏÏÏÏÏÏÏÏÏ 66,394,208.48 17,445,791.85 18,820,741.32 3,506,800.57January 15, 2006 ÏÏÏÏÏÏÏÏÏÏÏÏ 66,115,353.63 17,273,015.53 18,719,240.02 3,463,712.55February 15, 2006 ÏÏÏÏÏÏÏÏÏÏÏ 65,820,863.77 17,085,392.70 18,613,382.77 3,418,229.00March 15, 2006 ÏÏÏÏÏÏÏÏÏÏÏÏÏ 65,510,855.80 16,883,169.58 18,503,214.05 3,370,405.17April 15, 2006 ÏÏÏÏÏÏÏÏÏÏÏÏÏÏ 65,185,454.70 16,666,615.63 18,388,780.56 3,320,299.56May 15, 2006ÏÏÏÏÏÏÏÏÏÏÏÏÏÏÏ 64,844,793.42 16,436,023.24 18,270,131.18 3,267,973.82June 15, 2006ÏÏÏÏÏÏÏÏÏÏÏÏÏÏÏ 64,489,012.82 16,191,707.26 18,147,316.94 3,213,492.67July 15, 2006 ÏÏÏÏÏÏÏÏÏÏÏÏÏÏÏ 64,118,261.55 15,934,004.58 18,020,390.98 3,156,923.80August 15, 2006ÏÏÏÏÏÏÏÏÏÏÏÏÏ 63,732,695.98 15,663,273.55 17,889,408.53 3,098,337.78September 15, 2006ÏÏÏÏÏÏÏÏÏÏ 63,332,480.09 15,379,893.45 17,754,426.85 3,037,807.96October 15, 2006 ÏÏÏÏÏÏÏÏÏÏÏÏ 62,917,785.33 15,084,263.90 17,615,505.19 2,975,410.38November 15, 2006ÏÏÏÏÏÏÏÏÏÏ 62,488,790.54 14,776,804.18 17,472,704.76 2,911,223.61December 15, 2006 ÏÏÏÏÏÏÏÏÏÏ 62,045,681.80 14,457,952.55 17,326,088.69 2,845,328.67January 15, 2007 ÏÏÏÏÏÏÏÏÏÏÏÏ 61,588,652.31 14,128,165.50 17,175,721.95 2,777,808.91February 15, 2007 ÏÏÏÏÏÏÏÏÏÏÏ 61,117,902.23 13,787,917.01 17,021,671.35 2,708,749.86March 15, 2007 ÏÏÏÏÏÏÏÏÏÏÏÏÏ 60,633,638.58 13,437,697.69 16,864,005.45 2,638,239.12April 15, 2007 ÏÏÏÏÏÏÏÏÏÏÏÏÏÏ 60,136,075.04 13,078,013.99 16,707,155.85 2,568,920.37May 15, 2007ÏÏÏÏÏÏÏÏÏÏÏÏÏÏÏ 59,625,431.82 12,709,387.27 16,551,118.35 2,500,780.66June 15, 2007ÏÏÏÏÏÏÏÏÏÏÏÏÏÏÏ 59,101,935.50 12,332,352.91 16,395,888.78 2,433,807.14July 15, 2007 ÏÏÏÏÏÏÏÏÏÏÏÏÏÏÏ 58,565,818.86 11,947,459.35 16,241,462.97 2,367,987.13August 15, 2007ÏÏÏÏÏÏÏÏÏÏÏÏÏ 58,017,320.70 11,555,267.12 16,087,836.80 2,303,308.02September 15, 2007ÏÏÏÏÏÏÏÏÏÏ 57,471,695.23 11,170,762.63 15,935,006.15 2,239,757.35October 15, 2007 ÏÏÏÏÏÏÏÏÏÏÏÏ 56,928,927.66 10,793,845.24 15,782,966.92 2,177,322.77November 15, 2007ÏÏÏÏÏÏÏÏÏÏ 56,389,003.26 10,424,415.49 15,631,715.05 2,115,992.05December 15, 2007 ÏÏÏÏÏÏÏÏÏÏ 55,851,907.38 10,062,375.08 15,481,246.49 2,055,753.07January 15, 2008 ÏÏÏÏÏÏÏÏÏÏÏÏ 55,317,625.45 9,707,626.83 15,331,557.20 1,996,593.84February 15, 2008 ÏÏÏÏÏÏÏÏÏÏÏ 54,786,142.98 9,360,074.70 15,182,643.18 1,938,502.46March 15, 2008 ÏÏÏÏÏÏÏÏÏÏÏÏÏ 54,257,445.54 9,019,623.78 15,034,500.44 1,881,467.17April 15, 2008 ÏÏÏÏÏÏÏÏÏÏÏÏÏÏ 53,731,518.79 8,686,180.24 14,887,125.01 1,825,476.31May 15, 2008ÏÏÏÏÏÏÏÏÏÏÏÏÏÏÏ 53,208,348.45 8,359,651.37 14,740,512.94 1,770,518.34June 15, 2008ÏÏÏÏÏÏÏÏÏÏÏÏÏÏÏ 52,687,920.31 8,039,945.53 14,594,660.31 1,716,581.82July 15, 2008 ÏÏÏÏÏÏÏÏÏÏÏÏÏÏÏ 52,170,220.26 7,726,972.13 14,449,563.21 1,663,655.42August 15, 2008ÏÏÏÏÏÏÏÏÏÏÏÏÏ 51,655,234.23 7,420,641.67 14,305,217.76 1,611,727.92September 15, 2008ÏÏÏÏÏÏÏÏÏÏ 51,142,948.24 7,120,865.67 14,161,620.08 1,560,788.22October 15, 2008 ÏÏÏÏÏÏÏÏÏÏÏÏ 50,633,348.39 6,827,556.69 14,018,766.33 1,510,825.31November 15, 2008ÏÏÏÏÏÏÏÏÏÏ 50,126,420.83 6,540,628.32 13,876,652.69 1,461,828.28December 15, 2008 ÏÏÏÏÏÏÏÏÏÏ 49,622,151.79 6,259,995.15 13,735,275.34 1,413,786.35January 15, 2009 ÏÏÏÏÏÏÏÏÏÏÏÏ 49,120,527.58 5,985,572.77 13,594,630.50 1,366,688.83February 15, 2009 ÏÏÏÏÏÏÏÏÏÏÏ 48,621,534.57 5,717,277.76 13,454,714.40 1,320,525.13March 15, 2009 ÏÏÏÏÏÏÏÏÏÏÏÏÏ 48,125,159.20 5,455,027.68 13,315,523.29 1,275,284.77April 15, 2009 ÏÏÏÏÏÏÏÏÏÏÏÏÏÏ 47,631,387.99 5,198,741.06 13,177,053.44 1,230,957.36May 15, 2009ÏÏÏÏÏÏÏÏÏÏÏÏÏÏÏ 47,140,207.52 4,948,337.37 13,039,301.14 1,187,532.62June 15, 2009ÏÏÏÏÏÏÏÏÏÏÏÏÏÏÏ 46,651,604.44 4,703,737.05 12,902,262.70 1,145,000.37July 15, 2009 ÏÏÏÏÏÏÏÏÏÏÏÏÏÏÏ 46,165,565.46 4,464,861.46 12,765,934.45 1,103,350.51August 15, 2009ÏÏÏÏÏÏÏÏÏÏÏÏÏ 45,682,077.38 4,231,632.88 12,630,312.73 1,062,573.06September 15, 2009ÏÏÏÏÏÏÏÏÏÏ 45,201,127.05 4,003,974.51 12,495,393.91 1,022,658.13October 15, 2009 ÏÏÏÏÏÏÏÏÏÏÏÏ 44,722,701.40 3,781,810.45 12,361,174.38 983,595.91November 15, 2009ÏÏÏÏÏÏÏÏÏÏ 44,246,787.42 3,565,065.70 12,227,650.53 945,376.72December 15, 2009 ÏÏÏÏÏÏÏÏÏÏ 43,773,372.17 3,353,666.13 12,094,818.79 907,990.93January 15, 2010 ÏÏÏÏÏÏÏÏÏÏÏÏ 43,302,442.77 3,147,538.51 11,962,675.59 871,429.04February 15, 2010 ÏÏÏÏÏÏÏÏÏÏÏ 42,833,986.41 2,946,610.45 11,831,217.40 835,681.62March 15, 2010 ÏÏÏÏÏÏÏÏÏÏÏÏÏ 42,367,990.34 2,750,810.44 11,700,440.69 800,739.34April 15, 2010 ÏÏÏÏÏÏÏÏÏÏÏÏÏÏ 41,904,441.89 2,560,067.78 11,570,341.95 766,592.97May 15, 2010ÏÏÏÏÏÏÏÏÏÏÏÏÏÏÏ 41,443,328.45 2,374,312.63 11,440,917.70 733,233.34
B-1
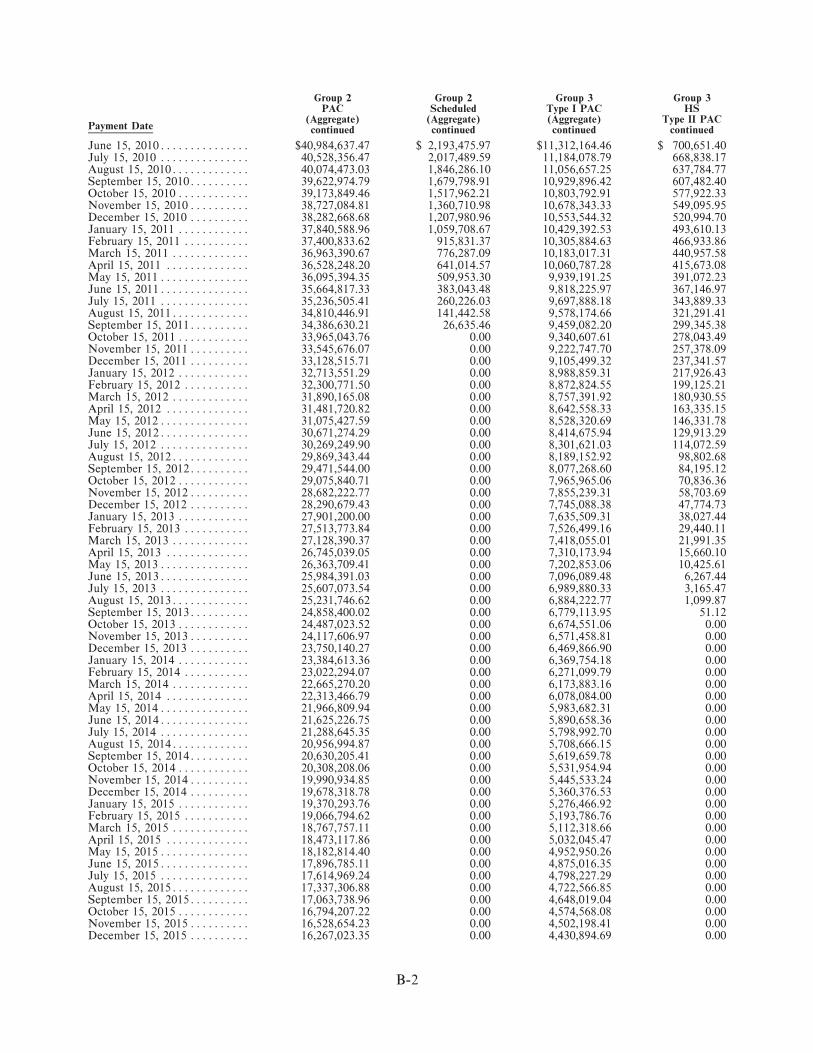
Group 2 Group 2 Group 3 Group 3PAC Scheduled Type I PAC HS
(Aggregate) (Aggregate) (Aggregate) Type II PACPayment Date continued continued continued continued
June 15, 2010ÏÏÏÏÏÏÏÏÏÏÏÏÏÏÏ $40,984,637.47 $ 2,193,475.97 $11,312,164.46 $ 700,651.40July 15, 2010 ÏÏÏÏÏÏÏÏÏÏÏÏÏÏÏ 40,528,356.47 2,017,489.59 11,184,078.79 668,838.17August 15, 2010ÏÏÏÏÏÏÏÏÏÏÏÏÏ 40,074,473.03 1,846,286.10 11,056,657.25 637,784.77September 15, 2010ÏÏÏÏÏÏÏÏÏÏ 39,622,974.79 1,679,798.91 10,929,896.42 607,482.40October 15, 2010 ÏÏÏÏÏÏÏÏÏÏÏÏ 39,173,849.46 1,517,962.21 10,803,792.91 577,922.33November 15, 2010ÏÏÏÏÏÏÏÏÏÏ 38,727,084.81 1,360,710.98 10,678,343.33 549,095.95December 15, 2010 ÏÏÏÏÏÏÏÏÏÏ 38,282,668.68 1,207,980.96 10,553,544.32 520,994.70January 15, 2011 ÏÏÏÏÏÏÏÏÏÏÏÏ 37,840,588.96 1,059,708.67 10,429,392.53 493,610.13February 15, 2011 ÏÏÏÏÏÏÏÏÏÏÏ 37,400,833.62 915,831.37 10,305,884.63 466,933.86March 15, 2011 ÏÏÏÏÏÏÏÏÏÏÏÏÏ 36,963,390.67 776,287.09 10,183,017.31 440,957.58April 15, 2011 ÏÏÏÏÏÏÏÏÏÏÏÏÏÏ 36,528,248.20 641,014.57 10,060,787.28 415,673.08May 15, 2011ÏÏÏÏÏÏÏÏÏÏÏÏÏÏÏ 36,095,394.35 509,953.30 9,939,191.25 391,072.23June 15, 2011ÏÏÏÏÏÏÏÏÏÏÏÏÏÏÏ 35,664,817.33 383,043.48 9,818,225.97 367,146.97July 15, 2011 ÏÏÏÏÏÏÏÏÏÏÏÏÏÏÏ 35,236,505.41 260,226.03 9,697,888.18 343,889.33August 15, 2011ÏÏÏÏÏÏÏÏÏÏÏÏÏ 34,810,446.91 141,442.58 9,578,174.66 321,291.41September 15, 2011ÏÏÏÏÏÏÏÏÏÏ 34,386,630.21 26,635.46 9,459,082.20 299,345.38October 15, 2011 ÏÏÏÏÏÏÏÏÏÏÏÏ 33,965,043.76 0.00 9,340,607.61 278,043.49November 15, 2011ÏÏÏÏÏÏÏÏÏÏ 33,545,676.07 0.00 9,222,747.70 257,378.09December 15, 2011 ÏÏÏÏÏÏÏÏÏÏ 33,128,515.71 0.00 9,105,499.32 237,341.57January 15, 2012 ÏÏÏÏÏÏÏÏÏÏÏÏ 32,713,551.29 0.00 8,988,859.31 217,926.43February 15, 2012 ÏÏÏÏÏÏÏÏÏÏÏ 32,300,771.50 0.00 8,872,824.55 199,125.21March 15, 2012 ÏÏÏÏÏÏÏÏÏÏÏÏÏ 31,890,165.08 0.00 8,757,391.92 180,930.55April 15, 2012 ÏÏÏÏÏÏÏÏÏÏÏÏÏÏ 31,481,720.82 0.00 8,642,558.33 163,335.15May 15, 2012ÏÏÏÏÏÏÏÏÏÏÏÏÏÏÏ 31,075,427.59 0.00 8,528,320.69 146,331.78June 15, 2012ÏÏÏÏÏÏÏÏÏÏÏÏÏÏÏ 30,671,274.29 0.00 8,414,675.94 129,913.29July 15, 2012 ÏÏÏÏÏÏÏÏÏÏÏÏÏÏÏ 30,269,249.90 0.00 8,301,621.03 114,072.59August 15, 2012ÏÏÏÏÏÏÏÏÏÏÏÏÏ 29,869,343.44 0.00 8,189,152.92 98,802.68September 15, 2012ÏÏÏÏÏÏÏÏÏÏ 29,471,544.00 0.00 8,077,268.60 84,195.12October 15, 2012 ÏÏÏÏÏÏÏÏÏÏÏÏ 29,075,840.71 0.00 7,965,965.06 70,836.36November 15, 2012ÏÏÏÏÏÏÏÏÏÏ 28,682,222.77 0.00 7,855,239.31 58,703.69December 15, 2012 ÏÏÏÏÏÏÏÏÏÏ 28,290,679.43 0.00 7,745,088.38 47,774.73January 15, 2013 ÏÏÏÏÏÏÏÏÏÏÏÏ 27,901,200.00 0.00 7,635,509.31 38,027.44February 15, 2013 ÏÏÏÏÏÏÏÏÏÏÏ 27,513,773.84 0.00 7,526,499.16 29,440.11March 15, 2013 ÏÏÏÏÏÏÏÏÏÏÏÏÏ 27,128,390.37 0.00 7,418,055.01 21,991.35April 15, 2013 ÏÏÏÏÏÏÏÏÏÏÏÏÏÏ 26,745,039.05 0.00 7,310,173.94 15,660.10May 15, 2013ÏÏÏÏÏÏÏÏÏÏÏÏÏÏÏ 26,363,709.41 0.00 7,202,853.06 10,425.61June 15, 2013ÏÏÏÏÏÏÏÏÏÏÏÏÏÏÏ 25,984,391.03 0.00 7,096,089.48 6,267.44July 15, 2013 ÏÏÏÏÏÏÏÏÏÏÏÏÏÏÏ 25,607,073.54 0.00 6,989,880.33 3,165.47August 15, 2013ÏÏÏÏÏÏÏÏÏÏÏÏÏ 25,231,746.62 0.00 6,884,222.77 1,099.87September 15, 2013ÏÏÏÏÏÏÏÏÏÏ 24,858,400.02 0.00 6,779,113.95 51.12October 15, 2013 ÏÏÏÏÏÏÏÏÏÏÏÏ 24,487,023.52 0.00 6,674,551.06 0.00November 15, 2013ÏÏÏÏÏÏÏÏÏÏ 24,117,606.97 0.00 6,571,458.81 0.00December 15, 2013 ÏÏÏÏÏÏÏÏÏÏ 23,750,140.27 0.00 6,469,866.90 0.00January 15, 2014 ÏÏÏÏÏÏÏÏÏÏÏÏ 23,384,613.36 0.00 6,369,754.18 0.00February 15, 2014 ÏÏÏÏÏÏÏÏÏÏÏ 23,022,294.07 0.00 6,271,099.79 0.00March 15, 2014 ÏÏÏÏÏÏÏÏÏÏÏÏÏ 22,665,270.20 0.00 6,173,883.16 0.00April 15, 2014 ÏÏÏÏÏÏÏÏÏÏÏÏÏÏ 22,313,466.79 0.00 6,078,084.00 0.00May 15, 2014ÏÏÏÏÏÏÏÏÏÏÏÏÏÏÏ 21,966,809.94 0.00 5,983,682.31 0.00June 15, 2014ÏÏÏÏÏÏÏÏÏÏÏÏÏÏÏ 21,625,226.75 0.00 5,890,658.36 0.00July 15, 2014 ÏÏÏÏÏÏÏÏÏÏÏÏÏÏÏ 21,288,645.35 0.00 5,798,992.70 0.00August 15, 2014ÏÏÏÏÏÏÏÏÏÏÏÏÏ 20,956,994.87 0.00 5,708,666.15 0.00September 15, 2014ÏÏÏÏÏÏÏÏÏÏ 20,630,205.41 0.00 5,619,659.78 0.00October 15, 2014 ÏÏÏÏÏÏÏÏÏÏÏÏ 20,308,208.06 0.00 5,531,954.94 0.00November 15, 2014ÏÏÏÏÏÏÏÏÏÏ 19,990,934.85 0.00 5,445,533.24 0.00December 15, 2014 ÏÏÏÏÏÏÏÏÏÏ 19,678,318.78 0.00 5,360,376.53 0.00January 15, 2015 ÏÏÏÏÏÏÏÏÏÏÏÏ 19,370,293.76 0.00 5,276,466.92 0.00February 15, 2015 ÏÏÏÏÏÏÏÏÏÏÏ 19,066,794.62 0.00 5,193,786.76 0.00March 15, 2015 ÏÏÏÏÏÏÏÏÏÏÏÏÏ 18,767,757.11 0.00 5,112,318.66 0.00April 15, 2015 ÏÏÏÏÏÏÏÏÏÏÏÏÏÏ 18,473,117.86 0.00 5,032,045.47 0.00May 15, 2015ÏÏÏÏÏÏÏÏÏÏÏÏÏÏÏ 18,182,814.40 0.00 4,952,950.26 0.00June 15, 2015ÏÏÏÏÏÏÏÏÏÏÏÏÏÏÏ 17,896,785.11 0.00 4,875,016.35 0.00July 15, 2015 ÏÏÏÏÏÏÏÏÏÏÏÏÏÏÏ 17,614,969.24 0.00 4,798,227.29 0.00August 15, 2015ÏÏÏÏÏÏÏÏÏÏÏÏÏ 17,337,306.88 0.00 4,722,566.85 0.00September 15, 2015ÏÏÏÏÏÏÏÏÏÏ 17,063,738.96 0.00 4,648,019.04 0.00October 15, 2015 ÏÏÏÏÏÏÏÏÏÏÏÏ 16,794,207.22 0.00 4,574,568.08 0.00November 15, 2015ÏÏÏÏÏÏÏÏÏÏ 16,528,654.23 0.00 4,502,198.41 0.00December 15, 2015 ÏÏÏÏÏÏÏÏÏÏ 16,267,023.35 0.00 4,430,894.69 0.00
B-2

Group 2 Group 2 Group 3 Group 3PAC Scheduled Type I PAC HS
(Aggregate) (Aggregate) (Aggregate) Type II PACPayment Date continued continued continued continued
January 15, 2016 ÏÏÏÏÏÏÏÏÏÏÏÏ $16,009,258.74 $ 0.00 $ 4,360,641.80 $ 0.00February 15, 2016 ÏÏÏÏÏÏÏÏÏÏÏ 15,755,305.32 0.00 4,291,424.81 0.00March 15, 2016 ÏÏÏÏÏÏÏÏÏÏÏÏÏ 15,505,108.79 0.00 4,223,229.02 0.00April 15, 2016 ÏÏÏÏÏÏÏÏÏÏÏÏÏÏ 15,258,615.60 0.00 4,156,039.92 0.00May 15, 2016ÏÏÏÏÏÏÏÏÏÏÏÏÏÏÏ 15,015,772.96 0.00 4,089,843.20 0.00June 15, 2016ÏÏÏÏÏÏÏÏÏÏÏÏÏÏÏ 14,776,528.80 0.00 4,024,624.76 0.00July 15, 2016 ÏÏÏÏÏÏÏÏÏÏÏÏÏÏÏ 14,540,831.79 0.00 3,960,370.69 0.00August 15, 2016ÏÏÏÏÏÏÏÏÏÏÏÏÏ 14,308,631.31 0.00 3,897,067.28 0.00September 15, 2016ÏÏÏÏÏÏÏÏÏÏ 14,079,877.45 0.00 3,834,701.00 0.00October 15, 2016 ÏÏÏÏÏÏÏÏÏÏÏÏ 13,854,520.99 0.00 3,773,258.52 0.00November 15, 2016ÏÏÏÏÏÏÏÏÏÏ 13,632,513.40 0.00 3,712,726.68 0.00December 15, 2016 ÏÏÏÏÏÏÏÏÏÏ 13,413,806.84 0.00 3,653,092.51 0.00January 15, 2017 ÏÏÏÏÏÏÏÏÏÏÏÏ 13,198,354.12 0.00 3,594,343.23 0.00February 15, 2017 ÏÏÏÏÏÏÏÏÏÏÏ 12,986,108.71 0.00 3,536,466.23 0.00March 15, 2017 ÏÏÏÏÏÏÏÏÏÏÏÏÏ 12,777,024.75 0.00 3,479,449.08 0.00April 15, 2017 ÏÏÏÏÏÏÏÏÏÏÏÏÏÏ 12,571,057.00 0.00 3,423,279.52 0.00May 15, 2017ÏÏÏÏÏÏÏÏÏÏÏÏÏÏÏ 12,368,160.86 0.00 3,367,945.45 0.00June 15, 2017ÏÏÏÏÏÏÏÏÏÏÏÏÏÏÏ 12,168,292.36 0.00 3,313,434.96 0.00July 15, 2017 ÏÏÏÏÏÏÏÏÏÏÏÏÏÏÏ 11,971,408.14 0.00 3,259,736.29 0.00August 15, 2017ÏÏÏÏÏÏÏÏÏÏÏÏÏ 11,777,465.44 0.00 3,206,837.85 0.00September 15, 2017ÏÏÏÏÏÏÏÏÏÏ 11,586,422.11 0.00 3,154,728.21 0.00October 15, 2017 ÏÏÏÏÏÏÏÏÏÏÏÏ 11,398,236.58 0.00 3,103,396.10 0.00November 15, 2017ÏÏÏÏÏÏÏÏÏÏ 11,212,867.87 0.00 3,052,830.41 0.00December 15, 2017 ÏÏÏÏÏÏÏÏÏÏ 11,030,275.56 0.00 3,003,020.18 0.00January 15, 2018 ÏÏÏÏÏÏÏÏÏÏÏÏ 10,850,419.81 0.00 2,953,954.61 0.00February 15, 2018 ÏÏÏÏÏÏÏÏÏÏÏ 10,673,261.34 0.00 2,905,623.04 0.00March 15, 2018 ÏÏÏÏÏÏÏÏÏÏÏÏÏ 10,498,761.40 0.00 2,858,014.97 0.00April 15, 2018 ÏÏÏÏÏÏÏÏÏÏÏÏÏÏ 10,326,881.81 0.00 2,811,120.03 0.00May 15, 2018ÏÏÏÏÏÏÏÏÏÏÏÏÏÏÏ 10,157,584.90 0.00 2,764,928.02 0.00June 15, 2018ÏÏÏÏÏÏÏÏÏÏÏÏÏÏÏ 9,990,833.55 0.00 2,719,428.86 0.00July 15, 2018 ÏÏÏÏÏÏÏÏÏÏÏÏÏÏÏ 9,826,591.14 0.00 2,674,612.63 0.00August 15, 2018ÏÏÏÏÏÏÏÏÏÏÏÏÏ 9,664,821.58 0.00 2,630,469.53 0.00September 15, 2018ÏÏÏÏÏÏÏÏÏÏ 9,505,489.28 0.00 2,586,989.91 0.00October 15, 2018 ÏÏÏÏÏÏÏÏÏÏÏÏ 9,348,559.14 0.00 2,544,164.25 0.00November 15, 2018ÏÏÏÏÏÏÏÏÏÏ 9,193,996.57 0.00 2,501,983.16 0.00December 15, 2018 ÏÏÏÏÏÏÏÏÏÏ 9,041,767.46 0.00 2,460,437.39 0.00January 15, 2019 ÏÏÏÏÏÏÏÏÏÏÏÏ 8,891,838.17 0.00 2,419,517.81 0.00February 15, 2019 ÏÏÏÏÏÏÏÏÏÏÏ 8,744,175.53 0.00 2,379,215.43 0.00March 15, 2019 ÏÏÏÏÏÏÏÏÏÏÏÏÏ 8,598,746.86 0.00 2,339,521.37 0.00April 15, 2019 ÏÏÏÏÏÏÏÏÏÏÏÏÏÏ 8,455,519.91 0.00 2,300,426.88 0.00May 15, 2019ÏÏÏÏÏÏÏÏÏÏÏÏÏÏÏ 8,314,462.90 0.00 2,261,923.34 0.00June 15, 2019ÏÏÏÏÏÏÏÏÏÏÏÏÏÏÏ 8,175,544.50 0.00 2,224,002.24 0.00July 15, 2019 ÏÏÏÏÏÏÏÏÏÏÏÏÏÏÏ 8,038,733.80 0.00 2,186,655.20 0.00August 15, 2019ÏÏÏÏÏÏÏÏÏÏÏÏÏ 7,904,000.35 0.00 2,149,873.95 0.00September 15, 2019ÏÏÏÏÏÏÏÏÏÏ 7,771,314.11 0.00 2,113,650.34 0.00October 15, 2019 ÏÏÏÏÏÏÏÏÏÏÏÏ 7,640,645.47 0.00 2,077,976.33 0.00November 15, 2019ÏÏÏÏÏÏÏÏÏÏ 7,511,965.23 0.00 2,042,844.00 0.00December 15, 2019 ÏÏÏÏÏÏÏÏÏÏ 7,385,244.61 0.00 2,008,245.53 0.00January 15, 2020 ÏÏÏÏÏÏÏÏÏÏÏÏ 7,260,455.24 0.00 1,974,173.22 0.00February 15, 2020 ÏÏÏÏÏÏÏÏÏÏÏ 7,137,569.13 0.00 1,940,619.47 0.00March 15, 2020 ÏÏÏÏÏÏÏÏÏÏÏÏÏ 7,016,558.70 0.00 1,907,576.79 0.00April 15, 2020 ÏÏÏÏÏÏÏÏÏÏÏÏÏÏ 6,897,396.75 0.00 1,875,037.80 0.00May 15, 2020ÏÏÏÏÏÏÏÏÏÏÏÏÏÏÏ 6,780,056.46 0.00 1,842,995.22 0.00June 15, 2020ÏÏÏÏÏÏÏÏÏÏÏÏÏÏÏ 6,664,511.40 0.00 1,811,441.87 0.00July 15, 2020 ÏÏÏÏÏÏÏÏÏÏÏÏÏÏÏ 6,550,735.51 0.00 1,780,370.67 0.00August 15, 2020ÏÏÏÏÏÏÏÏÏÏÏÏÏ 6,438,703.09 0.00 1,749,774.64 0.00September 15, 2020ÏÏÏÏÏÏÏÏÏÏ 6,328,388.81 0.00 1,719,646.90 0.00October 15, 2020 ÏÏÏÏÏÏÏÏÏÏÏÏ 6,219,767.70 0.00 1,689,980.67 0.00November 15, 2020ÏÏÏÏÏÏÏÏÏÏ 6,112,815.13 0.00 1,660,769.26 0.00December 15, 2020 ÏÏÏÏÏÏÏÏÏÏ 6,007,506.82 0.00 1,632,006.08 0.00January 15, 2021 ÏÏÏÏÏÏÏÏÏÏÏÏ 5,903,818.85 0.00 1,603,684.63 0.00February 15, 2021 ÏÏÏÏÏÏÏÏÏÏÏ 5,801,727.61 0.00 1,575,798.49 0.00March 15, 2021 ÏÏÏÏÏÏÏÏÏÏÏÏÏ 5,701,209.85 0.00 1,548,341.35 0.00April 15, 2021 ÏÏÏÏÏÏÏÏÏÏÏÏÏÏ 5,602,242.63 0.00 1,521,306.98 0.00May 15, 2021ÏÏÏÏÏÏÏÏÏÏÏÏÏÏÏ 5,504,803.34 0.00 1,494,689.23 0.00June 15, 2021ÏÏÏÏÏÏÏÏÏÏÏÏÏÏÏ 5,408,869.70 0.00 1,468,482.05 0.00July 15, 2021 ÏÏÏÏÏÏÏÏÏÏÏÏÏÏÏ 5,314,419.73 0.00 1,442,679.46 0.00
B-3
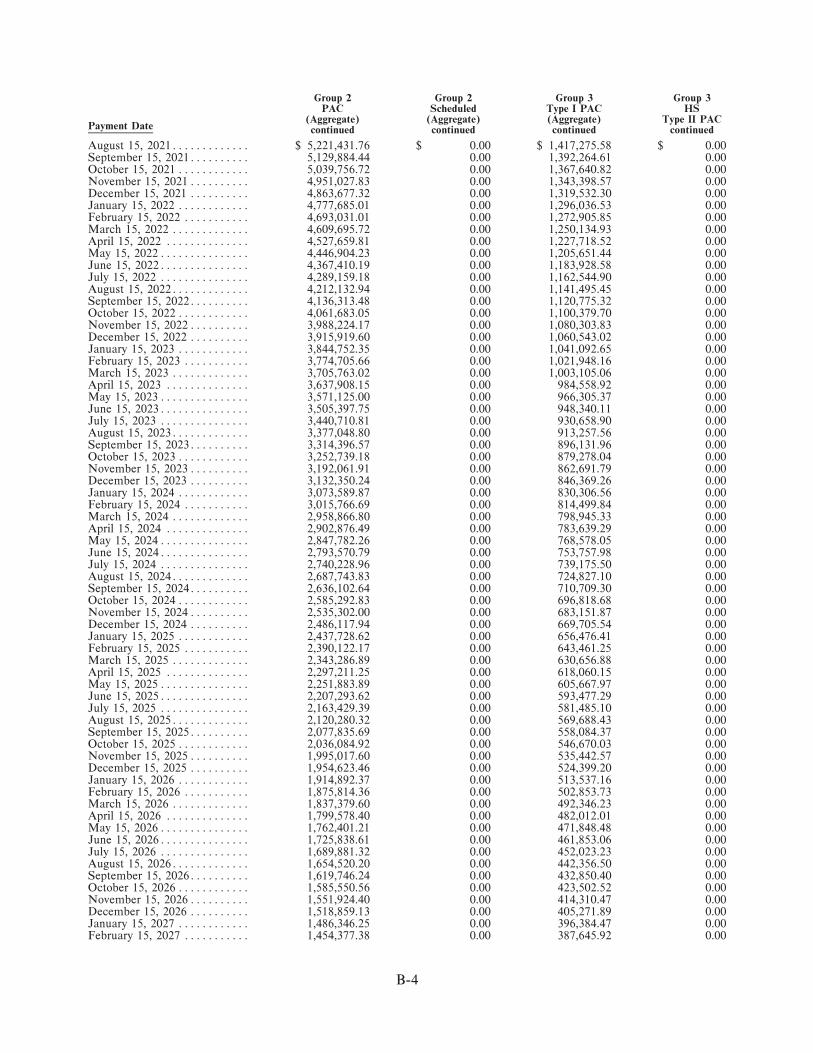
Group 2 Group 2 Group 3 Group 3PAC Scheduled Type I PAC HS
(Aggregate) (Aggregate) (Aggregate) Type II PACPayment Date continued continued continued continued
August 15, 2021ÏÏÏÏÏÏÏÏÏÏÏÏÏ $ 5,221,431.76 $ 0.00 $ 1,417,275.58 $ 0.00September 15, 2021ÏÏÏÏÏÏÏÏÏÏ 5,129,884.44 0.00 1,392,264.61 0.00October 15, 2021 ÏÏÏÏÏÏÏÏÏÏÏÏ 5,039,756.72 0.00 1,367,640.82 0.00November 15, 2021ÏÏÏÏÏÏÏÏÏÏ 4,951,027.83 0.00 1,343,398.57 0.00December 15, 2021 ÏÏÏÏÏÏÏÏÏÏ 4,863,677.32 0.00 1,319,532.30 0.00January 15, 2022 ÏÏÏÏÏÏÏÏÏÏÏÏ 4,777,685.01 0.00 1,296,036.53 0.00February 15, 2022 ÏÏÏÏÏÏÏÏÏÏÏ 4,693,031.01 0.00 1,272,905.85 0.00March 15, 2022 ÏÏÏÏÏÏÏÏÏÏÏÏÏ 4,609,695.72 0.00 1,250,134.93 0.00April 15, 2022 ÏÏÏÏÏÏÏÏÏÏÏÏÏÏ 4,527,659.81 0.00 1,227,718.52 0.00May 15, 2022ÏÏÏÏÏÏÏÏÏÏÏÏÏÏÏ 4,446,904.23 0.00 1,205,651.44 0.00June 15, 2022ÏÏÏÏÏÏÏÏÏÏÏÏÏÏÏ 4,367,410.19 0.00 1,183,928.58 0.00July 15, 2022 ÏÏÏÏÏÏÏÏÏÏÏÏÏÏÏ 4,289,159.18 0.00 1,162,544.90 0.00August 15, 2022ÏÏÏÏÏÏÏÏÏÏÏÏÏ 4,212,132.94 0.00 1,141,495.45 0.00September 15, 2022ÏÏÏÏÏÏÏÏÏÏ 4,136,313.48 0.00 1,120,775.32 0.00October 15, 2022 ÏÏÏÏÏÏÏÏÏÏÏÏ 4,061,683.05 0.00 1,100,379.70 0.00November 15, 2022ÏÏÏÏÏÏÏÏÏÏ 3,988,224.17 0.00 1,080,303.83 0.00December 15, 2022 ÏÏÏÏÏÏÏÏÏÏ 3,915,919.60 0.00 1,060,543.02 0.00January 15, 2023 ÏÏÏÏÏÏÏÏÏÏÏÏ 3,844,752.35 0.00 1,041,092.65 0.00February 15, 2023 ÏÏÏÏÏÏÏÏÏÏÏ 3,774,705.66 0.00 1,021,948.16 0.00March 15, 2023 ÏÏÏÏÏÏÏÏÏÏÏÏÏ 3,705,763.02 0.00 1,003,105.06 0.00April 15, 2023 ÏÏÏÏÏÏÏÏÏÏÏÏÏÏ 3,637,908.15 0.00 984,558.92 0.00May 15, 2023ÏÏÏÏÏÏÏÏÏÏÏÏÏÏÏ 3,571,125.00 0.00 966,305.37 0.00June 15, 2023ÏÏÏÏÏÏÏÏÏÏÏÏÏÏÏ 3,505,397.75 0.00 948,340.11 0.00July 15, 2023 ÏÏÏÏÏÏÏÏÏÏÏÏÏÏÏ 3,440,710.81 0.00 930,658.90 0.00August 15, 2023ÏÏÏÏÏÏÏÏÏÏÏÏÏ 3,377,048.80 0.00 913,257.56 0.00September 15, 2023ÏÏÏÏÏÏÏÏÏÏ 3,314,396.57 0.00 896,131.96 0.00October 15, 2023 ÏÏÏÏÏÏÏÏÏÏÏÏ 3,252,739.18 0.00 879,278.04 0.00November 15, 2023ÏÏÏÏÏÏÏÏÏÏ 3,192,061.91 0.00 862,691.79 0.00December 15, 2023 ÏÏÏÏÏÏÏÏÏÏ 3,132,350.24 0.00 846,369.26 0.00January 15, 2024 ÏÏÏÏÏÏÏÏÏÏÏÏ 3,073,589.87 0.00 830,306.56 0.00February 15, 2024 ÏÏÏÏÏÏÏÏÏÏÏ 3,015,766.69 0.00 814,499.84 0.00March 15, 2024 ÏÏÏÏÏÏÏÏÏÏÏÏÏ 2,958,866.80 0.00 798,945.33 0.00April 15, 2024 ÏÏÏÏÏÏÏÏÏÏÏÏÏÏ 2,902,876.49 0.00 783,639.29 0.00May 15, 2024ÏÏÏÏÏÏÏÏÏÏÏÏÏÏÏ 2,847,782.26 0.00 768,578.05 0.00June 15, 2024ÏÏÏÏÏÏÏÏÏÏÏÏÏÏÏ 2,793,570.79 0.00 753,757.98 0.00July 15, 2024 ÏÏÏÏÏÏÏÏÏÏÏÏÏÏÏ 2,740,228.96 0.00 739,175.50 0.00August 15, 2024ÏÏÏÏÏÏÏÏÏÏÏÏÏ 2,687,743.83 0.00 724,827.10 0.00September 15, 2024ÏÏÏÏÏÏÏÏÏÏ 2,636,102.64 0.00 710,709.30 0.00October 15, 2024 ÏÏÏÏÏÏÏÏÏÏÏÏ 2,585,292.83 0.00 696,818.68 0.00November 15, 2024ÏÏÏÏÏÏÏÏÏÏ 2,535,302.00 0.00 683,151.87 0.00December 15, 2024 ÏÏÏÏÏÏÏÏÏÏ 2,486,117.94 0.00 669,705.54 0.00January 15, 2025 ÏÏÏÏÏÏÏÏÏÏÏÏ 2,437,728.62 0.00 656,476.41 0.00February 15, 2025 ÏÏÏÏÏÏÏÏÏÏÏ 2,390,122.17 0.00 643,461.25 0.00March 15, 2025 ÏÏÏÏÏÏÏÏÏÏÏÏÏ 2,343,286.89 0.00 630,656.88 0.00April 15, 2025 ÏÏÏÏÏÏÏÏÏÏÏÏÏÏ 2,297,211.25 0.00 618,060.15 0.00May 15, 2025ÏÏÏÏÏÏÏÏÏÏÏÏÏÏÏ 2,251,883.89 0.00 605,667.97 0.00June 15, 2025ÏÏÏÏÏÏÏÏÏÏÏÏÏÏÏ 2,207,293.62 0.00 593,477.29 0.00July 15, 2025 ÏÏÏÏÏÏÏÏÏÏÏÏÏÏÏ 2,163,429.39 0.00 581,485.10 0.00August 15, 2025ÏÏÏÏÏÏÏÏÏÏÏÏÏ 2,120,280.32 0.00 569,688.43 0.00September 15, 2025ÏÏÏÏÏÏÏÏÏÏ 2,077,835.69 0.00 558,084.37 0.00October 15, 2025 ÏÏÏÏÏÏÏÏÏÏÏÏ 2,036,084.92 0.00 546,670.03 0.00November 15, 2025ÏÏÏÏÏÏÏÏÏÏ 1,995,017.60 0.00 535,442.57 0.00December 15, 2025 ÏÏÏÏÏÏÏÏÏÏ 1,954,623.46 0.00 524,399.20 0.00January 15, 2026 ÏÏÏÏÏÏÏÏÏÏÏÏ 1,914,892.37 0.00 513,537.16 0.00February 15, 2026 ÏÏÏÏÏÏÏÏÏÏÏ 1,875,814.36 0.00 502,853.73 0.00March 15, 2026 ÏÏÏÏÏÏÏÏÏÏÏÏÏ 1,837,379.60 0.00 492,346.23 0.00April 15, 2026 ÏÏÏÏÏÏÏÏÏÏÏÏÏÏ 1,799,578.40 0.00 482,012.01 0.00May 15, 2026ÏÏÏÏÏÏÏÏÏÏÏÏÏÏÏ 1,762,401.21 0.00 471,848.48 0.00June 15, 2026ÏÏÏÏÏÏÏÏÏÏÏÏÏÏÏ 1,725,838.61 0.00 461,853.06 0.00July 15, 2026 ÏÏÏÏÏÏÏÏÏÏÏÏÏÏÏ 1,689,881.32 0.00 452,023.23 0.00August 15, 2026ÏÏÏÏÏÏÏÏÏÏÏÏÏ 1,654,520.20 0.00 442,356.50 0.00September 15, 2026ÏÏÏÏÏÏÏÏÏÏ 1,619,746.24 0.00 432,850.40 0.00October 15, 2026 ÏÏÏÏÏÏÏÏÏÏÏÏ 1,585,550.56 0.00 423,502.52 0.00November 15, 2026ÏÏÏÏÏÏÏÏÏÏ 1,551,924.40 0.00 414,310.47 0.00December 15, 2026 ÏÏÏÏÏÏÏÏÏÏ 1,518,859.13 0.00 405,271.89 0.00January 15, 2027 ÏÏÏÏÏÏÏÏÏÏÏÏ 1,486,346.25 0.00 396,384.47 0.00February 15, 2027 ÏÏÏÏÏÏÏÏÏÏÏ 1,454,377.38 0.00 387,645.92 0.00
B-4
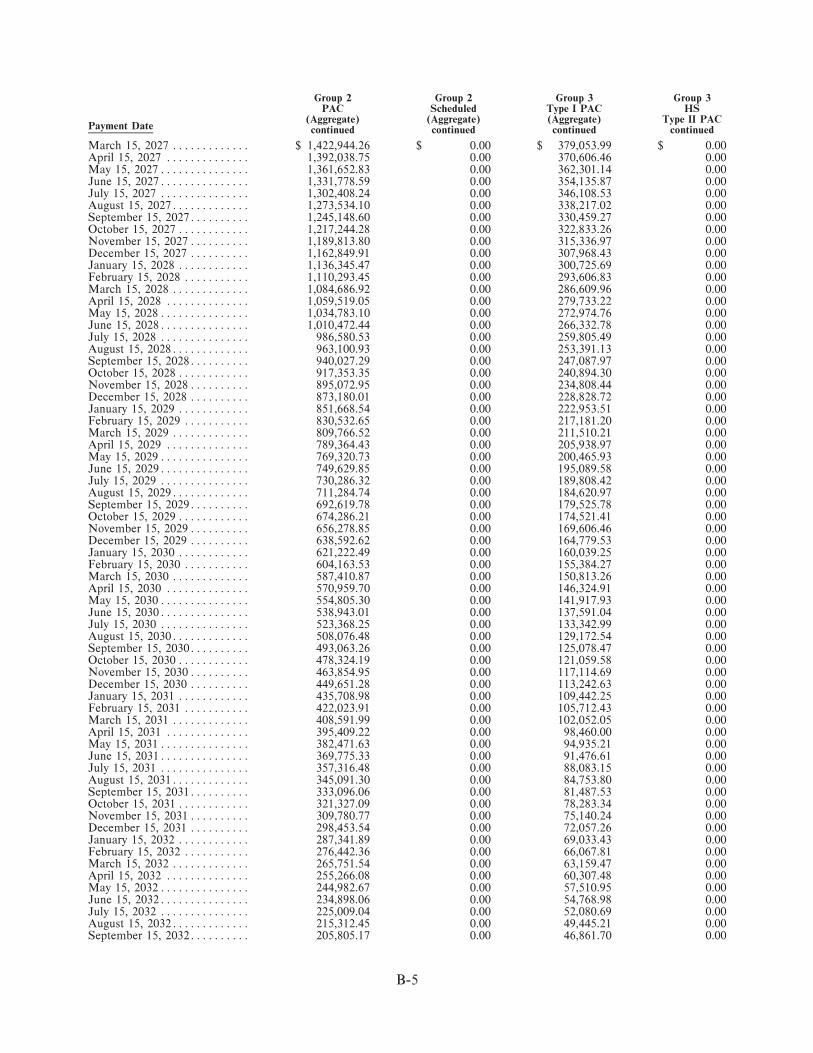
Group 2 Group 2 Group 3 Group 3PAC Scheduled Type I PAC HS
(Aggregate) (Aggregate) (Aggregate) Type II PACPayment Date continued continued continued continued
March 15, 2027 ÏÏÏÏÏÏÏÏÏÏÏÏÏ $ 1,422,944.26 $ 0.00 $ 379,053.99 $ 0.00April 15, 2027 ÏÏÏÏÏÏÏÏÏÏÏÏÏÏ 1,392,038.75 0.00 370,606.46 0.00May 15, 2027ÏÏÏÏÏÏÏÏÏÏÏÏÏÏÏ 1,361,652.83 0.00 362,301.14 0.00June 15, 2027ÏÏÏÏÏÏÏÏÏÏÏÏÏÏÏ 1,331,778.59 0.00 354,135.87 0.00July 15, 2027 ÏÏÏÏÏÏÏÏÏÏÏÏÏÏÏ 1,302,408.24 0.00 346,108.53 0.00August 15, 2027ÏÏÏÏÏÏÏÏÏÏÏÏÏ 1,273,534.10 0.00 338,217.02 0.00September 15, 2027ÏÏÏÏÏÏÏÏÏÏ 1,245,148.60 0.00 330,459.27 0.00October 15, 2027 ÏÏÏÏÏÏÏÏÏÏÏÏ 1,217,244.28 0.00 322,833.26 0.00November 15, 2027ÏÏÏÏÏÏÏÏÏÏ 1,189,813.80 0.00 315,336.97 0.00December 15, 2027 ÏÏÏÏÏÏÏÏÏÏ 1,162,849.91 0.00 307,968.43 0.00January 15, 2028 ÏÏÏÏÏÏÏÏÏÏÏÏ 1,136,345.47 0.00 300,725.69 0.00February 15, 2028 ÏÏÏÏÏÏÏÏÏÏÏ 1,110,293.45 0.00 293,606.83 0.00March 15, 2028 ÏÏÏÏÏÏÏÏÏÏÏÏÏ 1,084,686.92 0.00 286,609.96 0.00April 15, 2028 ÏÏÏÏÏÏÏÏÏÏÏÏÏÏ 1,059,519.05 0.00 279,733.22 0.00May 15, 2028ÏÏÏÏÏÏÏÏÏÏÏÏÏÏÏ 1,034,783.10 0.00 272,974.76 0.00June 15, 2028ÏÏÏÏÏÏÏÏÏÏÏÏÏÏÏ 1,010,472.44 0.00 266,332.78 0.00July 15, 2028 ÏÏÏÏÏÏÏÏÏÏÏÏÏÏÏ 986,580.53 0.00 259,805.49 0.00August 15, 2028ÏÏÏÏÏÏÏÏÏÏÏÏÏ 963,100.93 0.00 253,391.13 0.00September 15, 2028ÏÏÏÏÏÏÏÏÏÏ 940,027.29 0.00 247,087.97 0.00October 15, 2028 ÏÏÏÏÏÏÏÏÏÏÏÏ 917,353.35 0.00 240,894.30 0.00November 15, 2028ÏÏÏÏÏÏÏÏÏÏ 895,072.95 0.00 234,808.44 0.00December 15, 2028 ÏÏÏÏÏÏÏÏÏÏ 873,180.01 0.00 228,828.72 0.00January 15, 2029 ÏÏÏÏÏÏÏÏÏÏÏÏ 851,668.54 0.00 222,953.51 0.00February 15, 2029 ÏÏÏÏÏÏÏÏÏÏÏ 830,532.65 0.00 217,181.20 0.00March 15, 2029 ÏÏÏÏÏÏÏÏÏÏÏÏÏ 809,766.52 0.00 211,510.21 0.00April 15, 2029 ÏÏÏÏÏÏÏÏÏÏÏÏÏÏ 789,364.43 0.00 205,938.97 0.00May 15, 2029ÏÏÏÏÏÏÏÏÏÏÏÏÏÏÏ 769,320.73 0.00 200,465.93 0.00June 15, 2029ÏÏÏÏÏÏÏÏÏÏÏÏÏÏÏ 749,629.85 0.00 195,089.58 0.00July 15, 2029 ÏÏÏÏÏÏÏÏÏÏÏÏÏÏÏ 730,286.32 0.00 189,808.42 0.00August 15, 2029ÏÏÏÏÏÏÏÏÏÏÏÏÏ 711,284.74 0.00 184,620.97 0.00September 15, 2029ÏÏÏÏÏÏÏÏÏÏ 692,619.78 0.00 179,525.78 0.00October 15, 2029 ÏÏÏÏÏÏÏÏÏÏÏÏ 674,286.21 0.00 174,521.41 0.00November 15, 2029ÏÏÏÏÏÏÏÏÏÏ 656,278.85 0.00 169,606.46 0.00December 15, 2029 ÏÏÏÏÏÏÏÏÏÏ 638,592.62 0.00 164,779.53 0.00January 15, 2030 ÏÏÏÏÏÏÏÏÏÏÏÏ 621,222.49 0.00 160,039.25 0.00February 15, 2030 ÏÏÏÏÏÏÏÏÏÏÏ 604,163.53 0.00 155,384.27 0.00March 15, 2030 ÏÏÏÏÏÏÏÏÏÏÏÏÏ 587,410.87 0.00 150,813.26 0.00April 15, 2030 ÏÏÏÏÏÏÏÏÏÏÏÏÏÏ 570,959.70 0.00 146,324.91 0.00May 15, 2030ÏÏÏÏÏÏÏÏÏÏÏÏÏÏÏ 554,805.30 0.00 141,917.93 0.00June 15, 2030ÏÏÏÏÏÏÏÏÏÏÏÏÏÏÏ 538,943.01 0.00 137,591.04 0.00July 15, 2030 ÏÏÏÏÏÏÏÏÏÏÏÏÏÏÏ 523,368.25 0.00 133,342.99 0.00August 15, 2030ÏÏÏÏÏÏÏÏÏÏÏÏÏ 508,076.48 0.00 129,172.54 0.00September 15, 2030ÏÏÏÏÏÏÏÏÏÏ 493,063.26 0.00 125,078.47 0.00October 15, 2030 ÏÏÏÏÏÏÏÏÏÏÏÏ 478,324.19 0.00 121,059.58 0.00November 15, 2030ÏÏÏÏÏÏÏÏÏÏ 463,854.95 0.00 117,114.69 0.00December 15, 2030 ÏÏÏÏÏÏÏÏÏÏ 449,651.28 0.00 113,242.63 0.00January 15, 2031 ÏÏÏÏÏÏÏÏÏÏÏÏ 435,708.98 0.00 109,442.25 0.00February 15, 2031 ÏÏÏÏÏÏÏÏÏÏÏ 422,023.91 0.00 105,712.43 0.00March 15, 2031 ÏÏÏÏÏÏÏÏÏÏÏÏÏ 408,591.99 0.00 102,052.05 0.00April 15, 2031 ÏÏÏÏÏÏÏÏÏÏÏÏÏÏ 395,409.22 0.00 98,460.00 0.00May 15, 2031ÏÏÏÏÏÏÏÏÏÏÏÏÏÏÏ 382,471.63 0.00 94,935.21 0.00June 15, 2031ÏÏÏÏÏÏÏÏÏÏÏÏÏÏÏ 369,775.33 0.00 91,476.61 0.00July 15, 2031 ÏÏÏÏÏÏÏÏÏÏÏÏÏÏÏ 357,316.48 0.00 88,083.15 0.00August 15, 2031ÏÏÏÏÏÏÏÏÏÏÏÏÏ 345,091.30 0.00 84,753.80 0.00September 15, 2031ÏÏÏÏÏÏÏÏÏÏ 333,096.06 0.00 81,487.53 0.00October 15, 2031 ÏÏÏÏÏÏÏÏÏÏÏÏ 321,327.09 0.00 78,283.34 0.00November 15, 2031ÏÏÏÏÏÏÏÏÏÏ 309,780.77 0.00 75,140.24 0.00December 15, 2031 ÏÏÏÏÏÏÏÏÏÏ 298,453.54 0.00 72,057.26 0.00January 15, 2032 ÏÏÏÏÏÏÏÏÏÏÏÏ 287,341.89 0.00 69,033.43 0.00February 15, 2032 ÏÏÏÏÏÏÏÏÏÏÏ 276,442.36 0.00 66,067.81 0.00March 15, 2032 ÏÏÏÏÏÏÏÏÏÏÏÏÏ 265,751.54 0.00 63,159.47 0.00April 15, 2032 ÏÏÏÏÏÏÏÏÏÏÏÏÏÏ 255,266.08 0.00 60,307.48 0.00May 15, 2032ÏÏÏÏÏÏÏÏÏÏÏÏÏÏÏ 244,982.67 0.00 57,510.95 0.00June 15, 2032ÏÏÏÏÏÏÏÏÏÏÏÏÏÏÏ 234,898.06 0.00 54,768.98 0.00July 15, 2032 ÏÏÏÏÏÏÏÏÏÏÏÏÏÏÏ 225,009.04 0.00 52,080.69 0.00August 15, 2032ÏÏÏÏÏÏÏÏÏÏÏÏÏ 215,312.45 0.00 49,445.21 0.00September 15, 2032ÏÏÏÏÏÏÏÏÏÏ 205,805.17 0.00 46,861.70 0.00
B-5
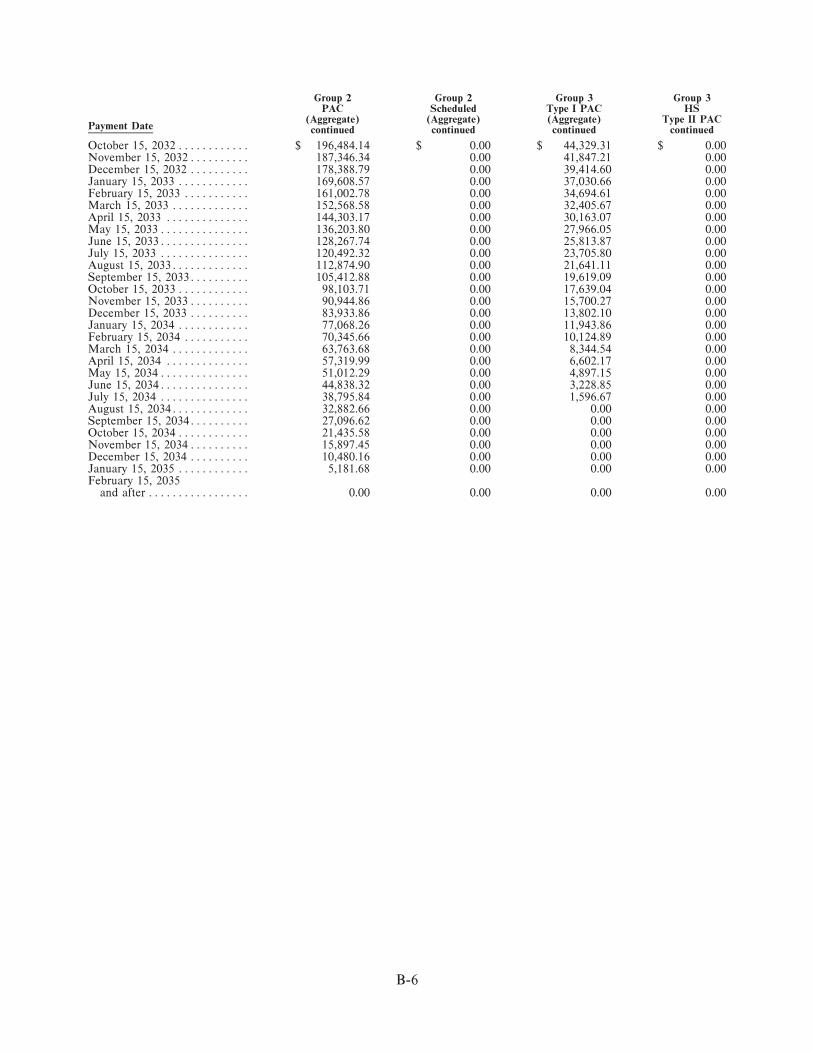
Group 2 Group 2 Group 3 Group 3PAC Scheduled Type I PAC HS
(Aggregate) (Aggregate) (Aggregate) Type II PACPayment Date continued continued continued continued
October 15, 2032 ÏÏÏÏÏÏÏÏÏÏÏÏ $ 196,484.14 $ 0.00 $ 44,329.31 $ 0.00November 15, 2032ÏÏÏÏÏÏÏÏÏÏ 187,346.34 0.00 41,847.21 0.00December 15, 2032 ÏÏÏÏÏÏÏÏÏÏ 178,388.79 0.00 39,414.60 0.00January 15, 2033 ÏÏÏÏÏÏÏÏÏÏÏÏ 169,608.57 0.00 37,030.66 0.00February 15, 2033 ÏÏÏÏÏÏÏÏÏÏÏ 161,002.78 0.00 34,694.61 0.00March 15, 2033 ÏÏÏÏÏÏÏÏÏÏÏÏÏ 152,568.58 0.00 32,405.67 0.00April 15, 2033 ÏÏÏÏÏÏÏÏÏÏÏÏÏÏ 144,303.17 0.00 30,163.07 0.00May 15, 2033ÏÏÏÏÏÏÏÏÏÏÏÏÏÏÏ 136,203.80 0.00 27,966.05 0.00June 15, 2033ÏÏÏÏÏÏÏÏÏÏÏÏÏÏÏ 128,267.74 0.00 25,813.87 0.00July 15, 2033 ÏÏÏÏÏÏÏÏÏÏÏÏÏÏÏ 120,492.32 0.00 23,705.80 0.00August 15, 2033ÏÏÏÏÏÏÏÏÏÏÏÏÏ 112,874.90 0.00 21,641.11 0.00September 15, 2033ÏÏÏÏÏÏÏÏÏÏ 105,412.88 0.00 19,619.09 0.00October 15, 2033 ÏÏÏÏÏÏÏÏÏÏÏÏ 98,103.71 0.00 17,639.04 0.00November 15, 2033ÏÏÏÏÏÏÏÏÏÏ 90,944.86 0.00 15,700.27 0.00December 15, 2033 ÏÏÏÏÏÏÏÏÏÏ 83,933.86 0.00 13,802.10 0.00January 15, 2034 ÏÏÏÏÏÏÏÏÏÏÏÏ 77,068.26 0.00 11,943.86 0.00February 15, 2034 ÏÏÏÏÏÏÏÏÏÏÏ 70,345.66 0.00 10,124.89 0.00March 15, 2034 ÏÏÏÏÏÏÏÏÏÏÏÏÏ 63,763.68 0.00 8,344.54 0.00April 15, 2034 ÏÏÏÏÏÏÏÏÏÏÏÏÏÏ 57,319.99 0.00 6,602.17 0.00May 15, 2034ÏÏÏÏÏÏÏÏÏÏÏÏÏÏÏ 51,012.29 0.00 4,897.15 0.00June 15, 2034ÏÏÏÏÏÏÏÏÏÏÏÏÏÏÏ 44,838.32 0.00 3,228.85 0.00July 15, 2034 ÏÏÏÏÏÏÏÏÏÏÏÏÏÏÏ 38,795.84 0.00 1,596.67 0.00August 15, 2034ÏÏÏÏÏÏÏÏÏÏÏÏÏ 32,882.66 0.00 0.00 0.00September 15, 2034ÏÏÏÏÏÏÏÏÏÏ 27,096.62 0.00 0.00 0.00October 15, 2034 ÏÏÏÏÏÏÏÏÏÏÏÏ 21,435.58 0.00 0.00 0.00November 15, 2034ÏÏÏÏÏÏÏÏÏÏ 15,897.45 0.00 0.00 0.00December 15, 2034 ÏÏÏÏÏÏÏÏÏÏ 10,480.16 0.00 0.00 0.00January 15, 2035 ÏÏÏÏÏÏÏÏÏÏÏÏ 5,181.68 0.00 0.00 0.00February 15, 2035
and after ÏÏÏÏÏÏÏÏÏÏÏÏÏÏÏÏÏ 0.00 0.00 0.00 0.00
B-6

Group 7Group 6 200% PSA Group 7
TAC Scheduled Asset PACPayment Date (Aggregate) Balance (Aggregate)
Initial ÏÏÏÏÏÏÏÏÏÏÏÏÏÏÏÏÏÏÏÏÏ $20,004,000.00 $91,799,266.00 $60,485,006.00June 15, 2005ÏÏÏÏÏÏÏÏÏÏÏÏÏÏÏ 19,985,930.69 91,288,045.31 60,485,006.00July 15, 2005 ÏÏÏÏÏÏÏÏÏÏÏÏÏÏÏ 19,967,778.56 90,745,866.21 60,485,006.00August 15, 2005ÏÏÏÏÏÏÏÏÏÏÏÏÏ 19,949,543.24 90,173,154.46 60,485,006.00September 15, 2005ÏÏÏÏÏÏÏÏÏÏ 19,931,224.33 89,570,368.71 60,485,006.00October 15, 2005 ÏÏÏÏÏÏÏÏÏÏÏÏ 19,912,821.47 88,937,999.96 60,485,006.00November 15, 2005ÏÏÏÏÏÏÏÏÏÏ 19,894,334.25 88,276,570.95 60,485,006.00December 15, 2005 ÏÏÏÏÏÏÏÏÏÏ 19,875,762.31 87,586,635.45 60,485,006.00January 15, 2006 ÏÏÏÏÏÏÏÏÏÏÏÏ 19,857,105.24 86,868,777.59 60,485,006.00February 15, 2006 ÏÏÏÏÏÏÏÏÏÏÏ 19,838,362.67 86,123,611.03 60,485,006.00March 15, 2006 ÏÏÏÏÏÏÏÏÏÏÏÏÏ 19,819,534.18 85,351,778.15 60,485,006.00April 15, 2006 ÏÏÏÏÏÏÏÏÏÏÏÏÏÏ 19,800,619.40 84,553,949.11 60,485,006.00May 15, 2006ÏÏÏÏÏÏÏÏÏÏÏÏÏÏÏ 19,781,617.93 83,730,820.96 60,485,006.00June 15, 2006ÏÏÏÏÏÏÏÏÏÏÏÏÏÏÏ 19,762,529.37 82,883,116.60 60,485,006.00July 15, 2006 ÏÏÏÏÏÏÏÏÏÏÏÏÏÏÏ 19,743,353.32 82,011,583.76 60,485,006.00August 15, 2006ÏÏÏÏÏÏÏÏÏÏÏÏÏ 19,724,089.38 81,116,993.88 60,485,006.00September 15, 2006ÏÏÏÏÏÏÏÏÏÏ 19,704,737.15 80,200,141.00 60,485,006.00October 15, 2006 ÏÏÏÏÏÏÏÏÏÏÏÏ 19,685,296.21 79,261,840.57 59,820,762.24November 15, 2006ÏÏÏÏÏÏÏÏÏÏ 19,665,766.18 78,302,928.21 59,144,322.17December 15, 2006 ÏÏÏÏÏÏÏÏÏÏ 19,625,628.94 77,324,258.48 58,456,123.85January 15, 2007 ÏÏÏÏÏÏÏÏÏÏÏÏ 19,569,857.84 76,326,703.61 57,756,487.87February 15, 2007 ÏÏÏÏÏÏÏÏÏÏÏ 19,510,796.35 75,311,152.10 57,045,740.32March 15, 2007 ÏÏÏÏÏÏÏÏÏÏÏÏÏ 19,448,506.68 74,278,507.45 56,324,212.55April 15, 2007 ÏÏÏÏÏÏÏÏÏÏÏÏÏÏ 19,383,054.38 73,229,686.73 55,592,240.89May 15, 2007ÏÏÏÏÏÏÏÏÏÏÏÏÏÏÏ 19,314,508.26 72,165,619.20 54,850,166.40June 15, 2007ÏÏÏÏÏÏÏÏÏÏÏÏÏÏÏ 19,242,940.31 71,087,244.88 54,098,334.60July 15, 2007 ÏÏÏÏÏÏÏÏÏÏÏÏÏÏÏ 19,168,425.59 69,995,513.11 53,337,095.20August 15, 2007ÏÏÏÏÏÏÏÏÏÏÏÏÏ 19,096,747.17 68,917,540.78 52,580,137.04September 15, 2007ÏÏÏÏÏÏÏÏÏÏ 18,988,570.75 67,853,167.92 51,827,437.75October 15, 2007 ÏÏÏÏÏÏÏÏÏÏÏÏ 18,867,054.43 66,802,236.31 51,078,975.05November 15, 2007ÏÏÏÏÏÏÏÏÏÏ 18,746,828.26 65,764,589.54 50,334,726.79December 15, 2007 ÏÏÏÏÏÏÏÏÏÏ 18,627,880.40 64,740,072.92 49,594,670.93January 15, 2008 ÏÏÏÏÏÏÏÏÏÏÏÏ 18,510,199.11 63,728,533.50 48,858,785.55February 15, 2008 ÏÏÏÏÏÏÏÏÏÏÏ 18,393,772.71 62,729,820.04 48,127,048.83March 15, 2008 ÏÏÏÏÏÏÏÏÏÏÏÏÏ 18,278,589.61 61,743,782.99 47,399,439.08April 15, 2008 ÏÏÏÏÏÏÏÏÏÏÏÏÏÏ 18,164,638.29 60,770,274.47 46,675,934.70May 15, 2008ÏÏÏÏÏÏÏÏÏÏÏÏÏÏÏ 18,051,907.32 59,809,148.26 45,956,514.22June 15, 2008ÏÏÏÏÏÏÏÏÏÏÏÏÏÏÏ 17,940,385.34 58,860,259.77 45,241,156.28July 15, 2008 ÏÏÏÏÏÏÏÏÏÏÏÏÏÏÏ 17,830,061.06 57,923,466.05 44,529,839.61August 15, 2008ÏÏÏÏÏÏÏÏÏÏÏÏÏ 17,720,923.27 56,998,625.71 43,822,543.08September 15, 2008ÏÏÏÏÏÏÏÏÏÏ 17,612,960.84 56,085,598.98 43,119,245.64October 15, 2008 ÏÏÏÏÏÏÏÏÏÏÏÏ 17,506,162.72 55,184,247.65 42,419,926.37November 15, 2008ÏÏÏÏÏÏÏÏÏÏ 17,400,517.94 54,294,435.03 41,724,564.45December 15, 2008 ÏÏÏÏÏÏÏÏÏÏ 17,296,015.57 53,416,026.01 41,033,139.16January 15, 2009 ÏÏÏÏÏÏÏÏÏÏÏÏ 17,192,644.79 52,548,886.96 40,345,629.90February 15, 2009 ÏÏÏÏÏÏÏÏÏÏÏ 17,090,394.83 51,692,885.75 39,662,016.17March 15, 2009 ÏÏÏÏÏÏÏÏÏÏÏÏÏ 16,989,255.02 50,847,891.75 38,982,277.58April 15, 2009 ÏÏÏÏÏÏÏÏÏÏÏÏÏÏ 16,889,214.72 50,013,775.79 38,306,393.84May 15, 2009ÏÏÏÏÏÏÏÏÏÏÏÏÏÏÏ 16,790,263.40 49,190,410.13 37,634,344.76June 15, 2009ÏÏÏÏÏÏÏÏÏÏÏÏÏÏÏ 16,692,390.58 48,377,668.50 36,966,110.27July 15, 2009 ÏÏÏÏÏÏÏÏÏÏÏÏÏÏÏ 16,595,585.86 47,575,426.02 36,301,670.39August 15, 2009ÏÏÏÏÏÏÏÏÏÏÏÏÏ 16,499,838.92 46,783,559.22 35,641,005.24September 15, 2009ÏÏÏÏÏÏÏÏÏÏ 16,405,139.48 46,001,946.02 34,984,095.06October 15, 2009 ÏÏÏÏÏÏÏÏÏÏÏÏ 16,311,477.34 45,230,465.71 34,330,920.18November 15, 2009ÏÏÏÏÏÏÏÏÏÏ 16,218,842.40 44,468,998.95 33,681,461.03December 15, 2009 ÏÏÏÏÏÏÏÏÏÏ 16,127,224.58 43,717,427.71 33,035,698.14January 15, 2010 ÏÏÏÏÏÏÏÏÏÏÏÏ 16,036,613.89 42,975,635.32 32,393,612.15February 15, 2010 ÏÏÏÏÏÏÏÏÏÏÏ 15,947,000.42 42,243,506.41 31,755,183.80March 15, 2010 ÏÏÏÏÏÏÏÏÏÏÏÏÏ 15,858,374.31 41,520,926.92 31,120,393.92April 15, 2010 ÏÏÏÏÏÏÏÏÏÏÏÏÏÏ 15,770,725.77 40,807,784.04 30,489,223.44May 15, 2010ÏÏÏÏÏÏÏÏÏÏÏÏÏÏÏ 15,684,045.06 40,103,966.28 29,861,653.39June 15, 2010ÏÏÏÏÏÏÏÏÏÏÏÏÏÏÏ 15,598,322.53 39,409,363.36 29,237,664.91July 15, 2010 ÏÏÏÏÏÏÏÏÏÏÏÏÏÏÏ 15,513,548.59 38,723,866.27 28,617,239.22August 15, 2010ÏÏÏÏÏÏÏÏÏÏÏÏÏ 15,429,713.71 38,047,367.22 28,000,357.64September 15, 2010ÏÏÏÏÏÏÏÏÏÏ 15,346,808.42 37,379,759.64 27,387,001.59October 15, 2010 ÏÏÏÏÏÏÏÏÏÏÏÏ 15,264,823.31 36,720,938.16 26,777,152.59November 15, 2010ÏÏÏÏÏÏÏÏÏÏ 15,183,749.04 36,070,798.60 26,170,792.25
B-7
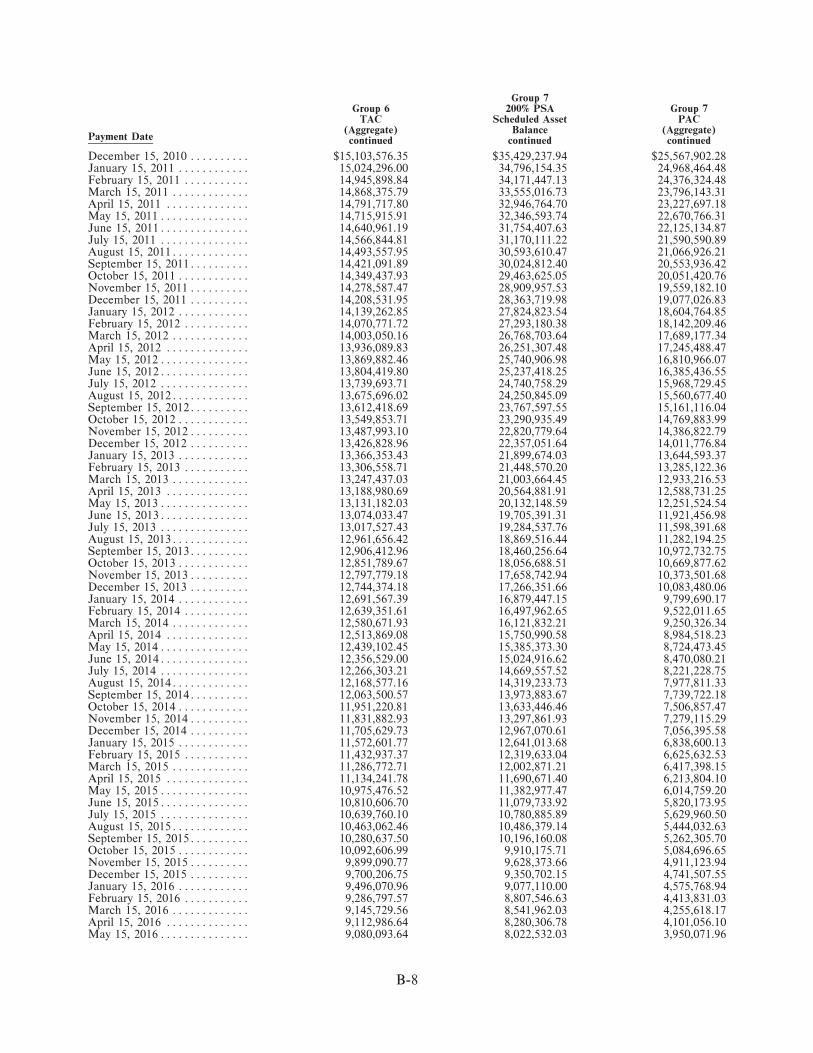
Group 7Group 6 200% PSA Group 7
TAC Scheduled Asset PAC(Aggregate) Balance (Aggregate)
Payment Date continued continued continued
December 15, 2010 ÏÏÏÏÏÏÏÏÏÏ $15,103,576.35 $35,429,237.94 $25,567,902.28January 15, 2011 ÏÏÏÏÏÏÏÏÏÏÏÏ 15,024,296.00 34,796,154.35 24,968,464.48February 15, 2011 ÏÏÏÏÏÏÏÏÏÏÏ 14,945,898.84 34,171,447.13 24,376,324.48March 15, 2011 ÏÏÏÏÏÏÏÏÏÏÏÏÏ 14,868,375.79 33,555,016.73 23,796,143.31April 15, 2011 ÏÏÏÏÏÏÏÏÏÏÏÏÏÏ 14,791,717.80 32,946,764.70 23,227,697.18May 15, 2011ÏÏÏÏÏÏÏÏÏÏÏÏÏÏÏ 14,715,915.91 32,346,593.74 22,670,766.31June 15, 2011ÏÏÏÏÏÏÏÏÏÏÏÏÏÏÏ 14,640,961.19 31,754,407.63 22,125,134.87July 15, 2011 ÏÏÏÏÏÏÏÏÏÏÏÏÏÏÏ 14,566,844.81 31,170,111.22 21,590,590.89August 15, 2011ÏÏÏÏÏÏÏÏÏÏÏÏÏ 14,493,557.95 30,593,610.47 21,066,926.21September 15, 2011ÏÏÏÏÏÏÏÏÏÏ 14,421,091.89 30,024,812.40 20,553,936.42October 15, 2011 ÏÏÏÏÏÏÏÏÏÏÏÏ 14,349,437.93 29,463,625.05 20,051,420.76November 15, 2011ÏÏÏÏÏÏÏÏÏÏ 14,278,587.47 28,909,957.53 19,559,182.10December 15, 2011 ÏÏÏÏÏÏÏÏÏÏ 14,208,531.95 28,363,719.98 19,077,026.83January 15, 2012 ÏÏÏÏÏÏÏÏÏÏÏÏ 14,139,262.85 27,824,823.54 18,604,764.85February 15, 2012 ÏÏÏÏÏÏÏÏÏÏÏ 14,070,771.72 27,293,180.38 18,142,209.46March 15, 2012 ÏÏÏÏÏÏÏÏÏÏÏÏÏ 14,003,050.16 26,768,703.64 17,689,177.34April 15, 2012 ÏÏÏÏÏÏÏÏÏÏÏÏÏÏ 13,936,089.83 26,251,307.48 17,245,488.47May 15, 2012ÏÏÏÏÏÏÏÏÏÏÏÏÏÏÏ 13,869,882.46 25,740,906.98 16,810,966.07June 15, 2012ÏÏÏÏÏÏÏÏÏÏÏÏÏÏÏ 13,804,419.80 25,237,418.25 16,385,436.55July 15, 2012 ÏÏÏÏÏÏÏÏÏÏÏÏÏÏÏ 13,739,693.71 24,740,758.29 15,968,729.45August 15, 2012ÏÏÏÏÏÏÏÏÏÏÏÏÏ 13,675,696.02 24,250,845.09 15,560,677.40September 15, 2012ÏÏÏÏÏÏÏÏÏÏ 13,612,418.69 23,767,597.55 15,161,116.04October 15, 2012 ÏÏÏÏÏÏÏÏÏÏÏÏ 13,549,853.71 23,290,935.49 14,769,883.99November 15, 2012ÏÏÏÏÏÏÏÏÏÏ 13,487,993.10 22,820,779.64 14,386,822.79December 15, 2012 ÏÏÏÏÏÏÏÏÏÏ 13,426,828.96 22,357,051.64 14,011,776.84January 15, 2013 ÏÏÏÏÏÏÏÏÏÏÏÏ 13,366,353.43 21,899,674.03 13,644,593.37February 15, 2013 ÏÏÏÏÏÏÏÏÏÏÏ 13,306,558.71 21,448,570.20 13,285,122.36March 15, 2013 ÏÏÏÏÏÏÏÏÏÏÏÏÏ 13,247,437.03 21,003,664.45 12,933,216.53April 15, 2013 ÏÏÏÏÏÏÏÏÏÏÏÏÏÏ 13,188,980.69 20,564,881.91 12,588,731.25May 15, 2013ÏÏÏÏÏÏÏÏÏÏÏÏÏÏÏ 13,131,182.03 20,132,148.59 12,251,524.54June 15, 2013ÏÏÏÏÏÏÏÏÏÏÏÏÏÏÏ 13,074,033.47 19,705,391.31 11,921,456.98July 15, 2013 ÏÏÏÏÏÏÏÏÏÏÏÏÏÏÏ 13,017,527.43 19,284,537.76 11,598,391.68August 15, 2013ÏÏÏÏÏÏÏÏÏÏÏÏÏ 12,961,656.42 18,869,516.44 11,282,194.25September 15, 2013ÏÏÏÏÏÏÏÏÏÏ 12,906,412.96 18,460,256.64 10,972,732.75October 15, 2013 ÏÏÏÏÏÏÏÏÏÏÏÏ 12,851,789.67 18,056,688.51 10,669,877.62November 15, 2013ÏÏÏÏÏÏÏÏÏÏ 12,797,779.18 17,658,742.94 10,373,501.68December 15, 2013 ÏÏÏÏÏÏÏÏÏÏ 12,744,374.18 17,266,351.66 10,083,480.06January 15, 2014 ÏÏÏÏÏÏÏÏÏÏÏÏ 12,691,567.39 16,879,447.15 9,799,690.17February 15, 2014 ÏÏÏÏÏÏÏÏÏÏÏ 12,639,351.61 16,497,962.65 9,522,011.65March 15, 2014 ÏÏÏÏÏÏÏÏÏÏÏÏÏ 12,580,671.93 16,121,832.21 9,250,326.34April 15, 2014 ÏÏÏÏÏÏÏÏÏÏÏÏÏÏ 12,513,869.08 15,750,990.58 8,984,518.23May 15, 2014ÏÏÏÏÏÏÏÏÏÏÏÏÏÏÏ 12,439,102.45 15,385,373.30 8,724,473.45June 15, 2014ÏÏÏÏÏÏÏÏÏÏÏÏÏÏÏ 12,356,529.00 15,024,916.62 8,470,080.21July 15, 2014 ÏÏÏÏÏÏÏÏÏÏÏÏÏÏÏ 12,266,303.21 14,669,557.52 8,221,228.75August 15, 2014ÏÏÏÏÏÏÏÏÏÏÏÏÏ 12,168,577.16 14,319,233.73 7,977,811.33September 15, 2014ÏÏÏÏÏÏÏÏÏÏ 12,063,500.57 13,973,883.67 7,739,722.18October 15, 2014 ÏÏÏÏÏÏÏÏÏÏÏÏ 11,951,220.81 13,633,446.46 7,506,857.47November 15, 2014ÏÏÏÏÏÏÏÏÏÏ 11,831,882.93 13,297,861.93 7,279,115.29December 15, 2014 ÏÏÏÏÏÏÏÏÏÏ 11,705,629.73 12,967,070.61 7,056,395.58January 15, 2015 ÏÏÏÏÏÏÏÏÏÏÏÏ 11,572,601.77 12,641,013.68 6,838,600.13February 15, 2015 ÏÏÏÏÏÏÏÏÏÏÏ 11,432,937.37 12,319,633.04 6,625,632.53March 15, 2015 ÏÏÏÏÏÏÏÏÏÏÏÏÏ 11,286,772.71 12,002,871.21 6,417,398.15April 15, 2015 ÏÏÏÏÏÏÏÏÏÏÏÏÏÏ 11,134,241.78 11,690,671.40 6,213,804.10May 15, 2015ÏÏÏÏÏÏÏÏÏÏÏÏÏÏÏ 10,975,476.52 11,382,977.47 6,014,759.20June 15, 2015ÏÏÏÏÏÏÏÏÏÏÏÏÏÏÏ 10,810,606.70 11,079,733.92 5,820,173.95July 15, 2015 ÏÏÏÏÏÏÏÏÏÏÏÏÏÏÏ 10,639,760.10 10,780,885.89 5,629,960.50August 15, 2015ÏÏÏÏÏÏÏÏÏÏÏÏÏ 10,463,062.46 10,486,379.14 5,444,032.63September 15, 2015ÏÏÏÏÏÏÏÏÏÏ 10,280,637.50 10,196,160.08 5,262,305.70October 15, 2015 ÏÏÏÏÏÏÏÏÏÏÏÏ 10,092,606.99 9,910,175.71 5,084,696.65November 15, 2015ÏÏÏÏÏÏÏÏÏÏ 9,899,090.77 9,628,373.66 4,911,123.94December 15, 2015 ÏÏÏÏÏÏÏÏÏÏ 9,700,206.75 9,350,702.15 4,741,507.55January 15, 2016 ÏÏÏÏÏÏÏÏÏÏÏÏ 9,496,070.96 9,077,110.00 4,575,768.94February 15, 2016 ÏÏÏÏÏÏÏÏÏÏÏ 9,286,797.57 8,807,546.63 4,413,831.03March 15, 2016 ÏÏÏÏÏÏÏÏÏÏÏÏÏ 9,145,729.56 8,541,962.03 4,255,618.17April 15, 2016 ÏÏÏÏÏÏÏÏÏÏÏÏÏÏ 9,112,986.64 8,280,306.78 4,101,056.10May 15, 2016ÏÏÏÏÏÏÏÏÏÏÏÏÏÏÏ 9,080,093.64 8,022,532.03 3,950,071.96
B-8

Group 7Group 6 200% PSA Group 7
TAC Scheduled Asset PAC(Aggregate) Balance (Aggregate)
Payment Date continued continued continued
June 15, 2016ÏÏÏÏÏÏÏÏÏÏÏÏÏÏÏ $ 9,047,049.88 $ 7,768,589.47 $ 3,802,594.23July 15, 2016 ÏÏÏÏÏÏÏÏÏÏÏÏÏÏÏ 9,013,854.67 7,518,431.38 3,658,552.73August 15, 2016ÏÏÏÏÏÏÏÏÏÏÏÏÏ 8,980,507.32 7,272,010.58 3,517,878.58September 15, 2016ÏÏÏÏÏÏÏÏÏÏ 8,947,007.12 7,029,280.43 3,380,504.19October 15, 2016 ÏÏÏÏÏÏÏÏÏÏÏÏ 8,913,353.38 6,790,194.84 3,246,363.23November 15, 2016ÏÏÏÏÏÏÏÏÏÏ 8,879,545.40 6,554,708.24 3,115,390.60December 15, 2016 ÏÏÏÏÏÏÏÏÏÏ 8,845,582.46 6,322,775.60 2,987,522.42January 15, 2017 ÏÏÏÏÏÏÏÏÏÏÏÏ 8,811,463.86 6,094,352.41 2,862,696.02February 15, 2017 ÏÏÏÏÏÏÏÏÏÏÏ 8,777,188.88 5,869,394.68 2,740,849.88March 15, 2017 ÏÏÏÏÏÏÏÏÏÏÏÏÏ 8,742,756.81 5,647,858.90 2,621,923.64April 15, 2017 ÏÏÏÏÏÏÏÏÏÏÏÏÏÏ 8,708,166.92 5,429,702.12 2,505,858.07May 15, 2017ÏÏÏÏÏÏÏÏÏÏÏÏÏÏÏ 8,673,418.50 5,214,881.83 2,392,595.06June 15, 2017ÏÏÏÏÏÏÏÏÏÏÏÏÏÏÏ 8,638,510.81 5,003,356.06 2,282,077.58July 15, 2017 ÏÏÏÏÏÏÏÏÏÏÏÏÏÏÏ 8,603,443.13 4,795,083.29 2,174,249.68August 15, 2017ÏÏÏÏÏÏÏÏÏÏÏÏÏ 8,568,214.72 4,590,022.53 2,069,056.46September 15, 2017ÏÏÏÏÏÏÏÏÏÏ 8,532,824.85 4,388,133.21 1,966,444.04October 15, 2017 ÏÏÏÏÏÏÏÏÏÏÏÏ 8,497,272.78 4,189,375.27 1,866,359.58November 15, 2017ÏÏÏÏÏÏÏÏÏÏ 8,461,557.76 3,993,709.12 1,768,751.21December 15, 2017 ÏÏÏÏÏÏÏÏÏÏ 8,425,679.04 3,801,095.59 1,673,568.05January 15, 2018 ÏÏÏÏÏÏÏÏÏÏÏÏ 8,389,635.88 3,611,496.02 1,580,760.19February 15, 2018 ÏÏÏÏÏÏÏÏÏÏÏ 8,353,427.53 3,424,872.16 1,490,278.65March 15, 2018 ÏÏÏÏÏÏÏÏÏÏÏÏÏ 8,317,053.22 3,241,186.23 1,402,075.38April 15, 2018 ÏÏÏÏÏÏÏÏÏÏÏÏÏÏ 8,280,512.19 3,060,400.87 1,316,103.25May 15, 2018ÏÏÏÏÏÏÏÏÏÏÏÏÏÏÏ 8,243,803.68 2,882,479.18 1,232,316.00June 15, 2018ÏÏÏÏÏÏÏÏÏÏÏÏÏÏÏ 8,206,926.93 2,707,384.66 1,150,668.27July 15, 2018 ÏÏÏÏÏÏÏÏÏÏÏÏÏÏÏ 8,169,881.15 2,535,081.28 1,071,115.55August 15, 2018ÏÏÏÏÏÏÏÏÏÏÏÏÏ 8,132,665.59 2,365,533.39 993,614.19September 15, 2018ÏÏÏÏÏÏÏÏÏÏ 8,095,279.45 2,198,705.78 918,121.35October 15, 2018 ÏÏÏÏÏÏÏÏÏÏÏÏ 8,057,721.96 2,034,563.64 844,595.01November 15, 2018ÏÏÏÏÏÏÏÏÏÏ 8,019,992.33 1,873,072.57 772,993.96December 15, 2018 ÏÏÏÏÏÏÏÏÏÏ 7,982,089.77 1,714,198.59 703,277.78January 15, 2019 ÏÏÏÏÏÏÏÏÏÏÏÏ 7,944,013.50 1,557,908.09 635,406.80February 15, 2019 ÏÏÏÏÏÏÏÏÏÏÏ 7,905,762.71 1,404,167.88 569,342.13March 15, 2019 ÏÏÏÏÏÏÏÏÏÏÏÏÏ 7,867,336.60 1,252,945.14 505,045.62April 15, 2019 ÏÏÏÏÏÏÏÏÏÏÏÏÏÏ 7,365,748.65 1,104,207.45 442,479.84May 15, 2019ÏÏÏÏÏÏÏÏÏÏÏÏÏÏÏ 6,841,306.10 957,922.75 381,608.09June 15, 2019ÏÏÏÏÏÏÏÏÏÏÏÏÏÏÏ 6,316,059.15 814,059.39 322,394.36July 15, 2019 ÏÏÏÏÏÏÏÏÏÏÏÏÏÏÏ 5,790,072.58 672,586.05 264,803.35August 15, 2019ÏÏÏÏÏÏÏÏÏÏÏÏÏ 5,263,409.72 533,471.82 208,800.42September 15, 2019ÏÏÏÏÏÏÏÏÏÏ 4,736,132.47 396,686.13 154,351.61October 15, 2019 ÏÏÏÏÏÏÏÏÏÏÏÏ 4,208,301.39 262,198.77 101,423.61November 15, 2019ÏÏÏÏÏÏÏÏÏÏ 3,679,975.65 129,979.89 49,983.75December 15, 2019 ÏÏÏÏÏÏÏÏÏÏ 3,151,213.10 0.00 0.00January 15, 2020 ÏÏÏÏÏÏÏÏÏÏÏÏ 2,623,254.51 0.00 0.00February 15, 2020 ÏÏÏÏÏÏÏÏÏÏÏ 2,582,846.07 0.00 0.00March 15, 2020 ÏÏÏÏÏÏÏÏÏÏÏÏÏ 2,542,252.43 0.00 0.00April 15, 2020 ÏÏÏÏÏÏÏÏÏÏÏÏÏÏ 2,501,472.73 0.00 0.00May 15, 2020ÏÏÏÏÏÏÏÏÏÏÏÏÏÏÏ 2,460,506.12 0.00 0.00June 15, 2020ÏÏÏÏÏÏÏÏÏÏÏÏÏÏÏ 2,419,351.76 0.00 0.00July 15, 2020 ÏÏÏÏÏÏÏÏÏÏÏÏÏÏÏ 2,271,735.11 0.00 0.00August 15, 2020ÏÏÏÏÏÏÏÏÏÏÏÏÏ 1,936,981.97 0.00 0.00September 15, 2020ÏÏÏÏÏÏÏÏÏÏ 1,601,035.86 0.00 0.00October 15, 2020 ÏÏÏÏÏÏÏÏÏÏÏÏ 1,263,941.09 0.00 0.00November 15, 2020ÏÏÏÏÏÏÏÏÏÏ 925,741.20 0.00 0.00December 15, 2020 ÏÏÏÏÏÏÏÏÏÏ 586,478.91 0.00 0.00January 15, 2021 ÏÏÏÏÏÏÏÏÏÏÏÏ 246,196.19 0.00 0.00February 15, 2021
and after ÏÏÏÏÏÏÏÏÏÏÏÏÏÏÏÏÏ 0.00 0.00 0.00
B-9
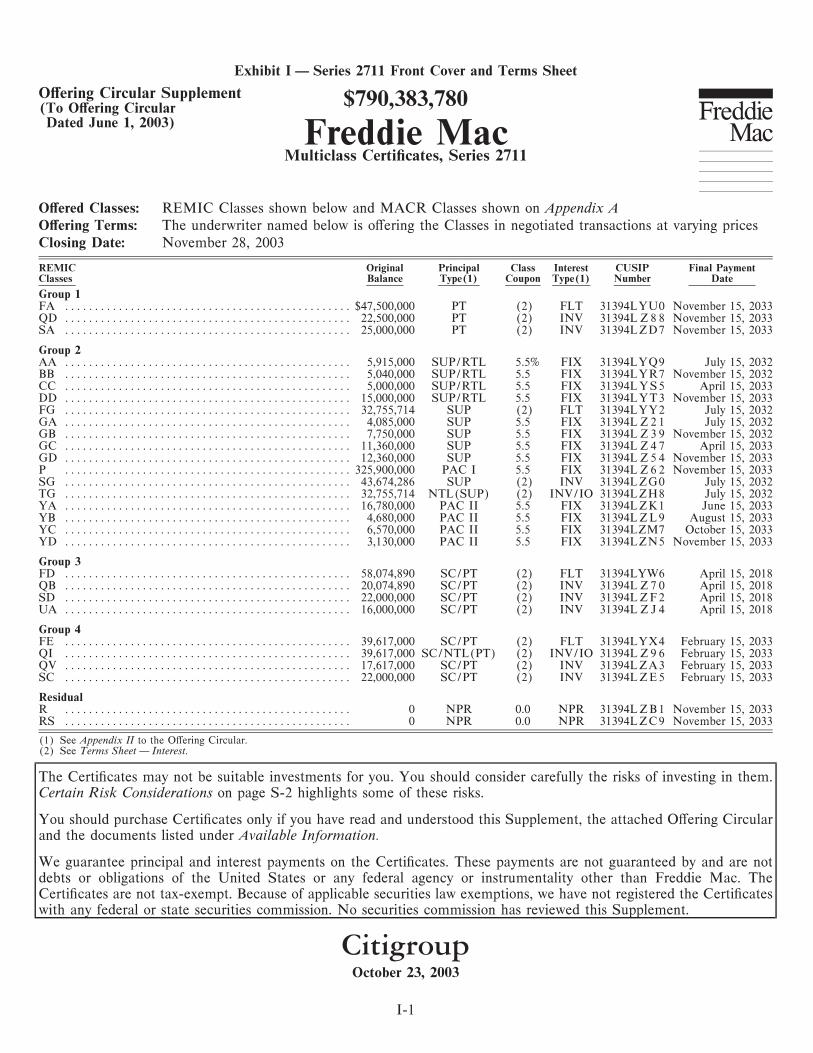
Exhibit I Ì Series 2711 Front Cover and Terms Sheet
OÅering Circular Supplement $790,383,780(To OÅering CircularDated June 1, 2003) Freddie Mac
Multiclass CertiÑcates, Series 2711 VOÅered Classes: REMIC Classes shown below and MACR Classes shown on Appendix AOÅering Terms: The underwriter named below is oÅering the Classes in negotiated transactions at varying pricesClosing Date: November 28, 2003
REMIC Original Principal Class Interest CUSIP Final PaymentClasses Balance Type(1) Coupon Type(1) Number Date
Group 1FA ÏÏÏÏÏÏÏÏÏÏÏÏÏÏÏÏÏÏÏÏÏÏÏÏÏÏÏÏÏÏÏÏÏÏÏÏÏÏÏÏÏÏÏÏÏÏÏÏ $47,500,000 PT (2) FLT 31394LYU0 November 15, 2033QD ÏÏÏÏÏÏÏÏÏÏÏÏÏÏÏÏÏÏÏÏÏÏÏÏÏÏÏÏÏÏÏÏÏÏÏÏÏÏÏÏÏÏÏÏÏÏÏÏ 22,500,000 PT (2) INV 31394L Z 8 8 November 15, 2033SA ÏÏÏÏÏÏÏÏÏÏÏÏÏÏÏÏÏÏÏÏÏÏÏÏÏÏÏÏÏÏÏÏÏÏÏÏÏÏÏÏÏÏÏÏÏÏÏÏ 25,000,000 PT (2) INV 31394LZD7 November 15, 2033
Group 2AA ÏÏÏÏÏÏÏÏÏÏÏÏÏÏÏÏÏÏÏÏÏÏÏÏÏÏÏÏÏÏÏÏÏÏÏÏÏÏÏÏÏÏÏÏÏÏÏÏ 5,915,000 SUP/RTL 5.5% FIX 31394LYQ9 July 15, 2032BB ÏÏÏÏÏÏÏÏÏÏÏÏÏÏÏÏÏÏÏÏÏÏÏÏÏÏÏÏÏÏÏÏÏÏÏÏÏÏÏÏÏÏÏÏÏÏÏÏ 5,040,000 SUP/RTL 5.5 FIX 31394LYR7 November 15, 2032CC ÏÏÏÏÏÏÏÏÏÏÏÏÏÏÏÏÏÏÏÏÏÏÏÏÏÏÏÏÏÏÏÏÏÏÏÏÏÏÏÏÏÏÏÏÏÏÏÏ 5,000,000 SUP/RTL 5.5 FIX 31394LYS5 April 15, 2033DD ÏÏÏÏÏÏÏÏÏÏÏÏÏÏÏÏÏÏÏÏÏÏÏÏÏÏÏÏÏÏÏÏÏÏÏÏÏÏÏÏÏÏÏÏÏÏÏÏ 15,000,000 SUP/RTL 5.5 FIX 31394LYT3 November 15, 2033FG ÏÏÏÏÏÏÏÏÏÏÏÏÏÏÏÏÏÏÏÏÏÏÏÏÏÏÏÏÏÏÏÏÏÏÏÏÏÏÏÏÏÏÏÏÏÏÏÏ 32,755,714 SUP (2) FLT 31394LYY2 July 15, 2032GA ÏÏÏÏÏÏÏÏÏÏÏÏÏÏÏÏÏÏÏÏÏÏÏÏÏÏÏÏÏÏÏÏÏÏÏÏÏÏÏÏÏÏÏÏÏÏÏÏ 4,085,000 SUP 5.5 FIX 31394L Z 2 1 July 15, 2032GB ÏÏÏÏÏÏÏÏÏÏÏÏÏÏÏÏÏÏÏÏÏÏÏÏÏÏÏÏÏÏÏÏÏÏÏÏÏÏÏÏÏÏÏÏÏÏÏÏ 7,750,000 SUP 5.5 FIX 31394L Z 3 9 November 15, 2032GC ÏÏÏÏÏÏÏÏÏÏÏÏÏÏÏÏÏÏÏÏÏÏÏÏÏÏÏÏÏÏÏÏÏÏÏÏÏÏÏÏÏÏÏÏÏÏÏÏ 11,360,000 SUP 5.5 FIX 31394L Z 4 7 April 15, 2033GD ÏÏÏÏÏÏÏÏÏÏÏÏÏÏÏÏÏÏÏÏÏÏÏÏÏÏÏÏÏÏÏÏÏÏÏÏÏÏÏÏÏÏÏÏÏÏÏÏ 12,360,000 SUP 5.5 FIX 31394L Z 5 4 November 15, 2033P ÏÏÏÏÏÏÏÏÏÏÏÏÏÏÏÏÏÏÏÏÏÏÏÏÏÏÏÏÏÏÏÏÏÏÏÏÏÏÏÏÏÏÏÏÏÏÏÏ 325,900,000 PAC I 5.5 FIX 31394L Z 6 2 November 15, 2033SG ÏÏÏÏÏÏÏÏÏÏÏÏÏÏÏÏÏÏÏÏÏÏÏÏÏÏÏÏÏÏÏÏÏÏÏÏÏÏÏÏÏÏÏÏÏÏÏÏ 43,674,286 SUP (2) INV 31394LZG0 July 15, 2032TG ÏÏÏÏÏÏÏÏÏÏÏÏÏÏÏÏÏÏÏÏÏÏÏÏÏÏÏÏÏÏÏÏÏÏÏÏÏÏÏÏÏÏÏÏÏÏÏÏ 32,755,714 NTL(SUP) (2) INV/IO 31394LZH8 July 15, 2032YA ÏÏÏÏÏÏÏÏÏÏÏÏÏÏÏÏÏÏÏÏÏÏÏÏÏÏÏÏÏÏÏÏÏÏÏÏÏÏÏÏÏÏÏÏÏÏÏÏ 16,780,000 PAC II 5.5 FIX 31394LZK1 June 15, 2033YB ÏÏÏÏÏÏÏÏÏÏÏÏÏÏÏÏÏÏÏÏÏÏÏÏÏÏÏÏÏÏÏÏÏÏÏÏÏÏÏÏÏÏÏÏÏÏÏÏ 4,680,000 PAC II 5.5 FIX 31394LZL9 August 15, 2033YC ÏÏÏÏÏÏÏÏÏÏÏÏÏÏÏÏÏÏÏÏÏÏÏÏÏÏÏÏÏÏÏÏÏÏÏÏÏÏÏÏÏÏÏÏÏÏÏÏ 6,570,000 PAC II 5.5 FIX 31394LZM7 October 15, 2033YD ÏÏÏÏÏÏÏÏÏÏÏÏÏÏÏÏÏÏÏÏÏÏÏÏÏÏÏÏÏÏÏÏÏÏÏÏÏÏÏÏÏÏÏÏÏÏÏÏ 3,130,000 PAC II 5.5 FIX 31394LZN5 November 15, 2033
Group 3FD ÏÏÏÏÏÏÏÏÏÏÏÏÏÏÏÏÏÏÏÏÏÏÏÏÏÏÏÏÏÏÏÏÏÏÏÏÏÏÏÏÏÏÏÏÏÏÏÏ 58,074,890 SC/PT (2) FLT 31394LYW6 April 15, 2018QB ÏÏÏÏÏÏÏÏÏÏÏÏÏÏÏÏÏÏÏÏÏÏÏÏÏÏÏÏÏÏÏÏÏÏÏÏÏÏÏÏÏÏÏÏÏÏÏÏ 20,074,890 SC/PT (2) INV 31394L Z 7 0 April 15, 2018SD ÏÏÏÏÏÏÏÏÏÏÏÏÏÏÏÏÏÏÏÏÏÏÏÏÏÏÏÏÏÏÏÏÏÏÏÏÏÏÏÏÏÏÏÏÏÏÏÏ 22,000,000 SC/PT (2) INV 31394LZF2 April 15, 2018UA ÏÏÏÏÏÏÏÏÏÏÏÏÏÏÏÏÏÏÏÏÏÏÏÏÏÏÏÏÏÏÏÏÏÏÏÏÏÏÏÏÏÏÏÏÏÏÏÏ 16,000,000 SC/PT (2) INV 31394L Z J 4 April 15, 2018
Group 4FE ÏÏÏÏÏÏÏÏÏÏÏÏÏÏÏÏÏÏÏÏÏÏÏÏÏÏÏÏÏÏÏÏÏÏÏÏÏÏÏÏÏÏÏÏÏÏÏÏ 39,617,000 SC/PT (2) FLT 31394LYX4 February 15, 2033QI ÏÏÏÏÏÏÏÏÏÏÏÏÏÏÏÏÏÏÏÏÏÏÏÏÏÏÏÏÏÏÏÏÏÏÏÏÏÏÏÏÏÏÏÏÏÏÏÏ 39,617,000 SC/NTL(PT) (2) INV/IO 31394L Z 9 6 February 15, 2033QV ÏÏÏÏÏÏÏÏÏÏÏÏÏÏÏÏÏÏÏÏÏÏÏÏÏÏÏÏÏÏÏÏÏÏÏÏÏÏÏÏÏÏÏÏÏÏÏÏ 17,617,000 SC/PT (2) INV 31394LZA3 February 15, 2033SC ÏÏÏÏÏÏÏÏÏÏÏÏÏÏÏÏÏÏÏÏÏÏÏÏÏÏÏÏÏÏÏÏÏÏÏÏÏÏÏÏÏÏÏÏÏÏÏÏ 22,000,000 SC/PT (2) INV 31394LZE5 February 15, 2033
ResidualR ÏÏÏÏÏÏÏÏÏÏÏÏÏÏÏÏÏÏÏÏÏÏÏÏÏÏÏÏÏÏÏÏÏÏÏÏÏÏÏÏÏÏÏÏÏÏÏÏ 0 NPR 0.0 NPR 31394LZB1 November 15, 2033RS ÏÏÏÏÏÏÏÏÏÏÏÏÏÏÏÏÏÏÏÏÏÏÏÏÏÏÏÏÏÏÏÏÏÏÏÏÏÏÏÏÏÏÏÏÏÏÏÏ 0 NPR 0.0 NPR 31394LZC9 November 15, 2033
(1) See Appendix II to the OÅering Circular.(2) See Terms Sheet Ì Interest.
The CertiÑcates may not be suitable investments for you. You should consider carefully the risks of investing in them.Certain Risk Considerations on page S-2 highlights some of these risks.
You should purchase CertiÑcates only if you have read and understood this Supplement, the attached OÅering Circularand the documents listed under Available Information.
We guarantee principal and interest payments on the CertiÑcates. These payments are not guaranteed by and are notdebts or obligations of the United States or any federal agency or instrumentality other than Freddie Mac. TheCertiÑcates are not tax-exempt. Because of applicable securities law exemptions, we have not registered the CertiÑcateswith any federal or state securities commission. No securities commission has reviewed this Supplement.
CitigroupOctober 23, 2003
I-1

TERMS SHEET
This Terms Sheet contains selected information about this Series. You should refer to the
remainder of this Supplement for further information.
In this Supplement, we refer to Classes only by their letter designations. For example, ""R''
refers to the R Class of this Series.
Payment Dates
We make payments of principal and interest on the CertiÑcates on each monthly Payment Date
beginning in December 2003.
Form of Classes
Regular (non-Retail) and MACR Classes: Book-entry on Fed System
Retail Classes: Book-entry on DTC System; issued and paid in $1,000 Retail Class Units
Residual Classes: CertiÑcated
Interest
The Fixed Rate Classes bear interest at the Class Coupons shown on the front cover.
The Floating Rate and Inverse Floating Rate Classes bear interest as shown in the following
table. The initial Class Coupons apply only to the Ñrst Accrual Period. We determine LIBOR using
the BBA Method.
InitialClass Coupon Subject toClass
Class Coupon Class Coupon Formula Minimum Rate Maximum Rate
Group 1
FAÏÏÏÏÏÏÏÏÏÏÏÏÏÏÏÏÏÏÏÏÏÏÏÏÏ 2.1% LIBOR ° 1.0% 1.0% 9.0%QD ÏÏÏÏÏÏÏÏÏÏÏÏÏÏÏÏÏÏÏÏÏÏÏÏ 6.9 8.0% ¿ LIBOR 0 8.0SAÏÏÏÏÏÏÏÏÏÏÏÏÏÏÏÏÏÏÏÏÏÏÏÏÏ 6.9 8.0% ¿ LIBOR 0 8.0Group 2
FGÏÏÏÏÏÏÏÏÏÏÏÏÏÏÏÏÏÏÏÏÏÏÏÏÏ 2.52 LIBOR ° 1.4% 1.4 7.5FH*ÏÏÏÏÏÏÏÏÏÏÏÏÏÏÏÏÏÏÏÏÏÏÏÏ 2.62 LIBOR ° 1.5% 1.5 7.5SGÏÏÏÏÏÏÏÏÏÏÏÏÏÏÏÏÏÏÏÏÏÏÏÏÏ 7.66 8.5% ¿ (LIBOR £ 0.75) 4.0 8.5TGÏÏÏÏÏÏÏÏÏÏÏÏÏÏÏÏÏÏÏÏÏÏÏÏÏ 0.1 6.1% ¿ LIBOR 0 0.1Group 3
FDÏÏÏÏÏÏÏÏÏÏÏÏÏÏÏÏÏÏÏÏÏÏÏÏÏ 1.62 LIBOR ° 0.5% 0.5 8.5QBÏÏÏÏÏÏÏÏÏÏÏÏÏÏÏÏÏÏÏÏÏÏÏÏÏ 8.38 9.5% ¿ LIBOR 1.5 9.5SDÏÏÏÏÏÏÏÏÏÏÏÏÏÏÏÏÏÏÏÏÏÏÏÏÏ 8.38 9.5% ¿ LIBOR 1.5 9.5UA ÏÏÏÏÏÏÏÏÏÏÏÏÏÏÏÏÏÏÏÏÏÏÏÏ 8.38 9.5% ¿ LIBOR 1.5 9.5Group 4
FC* ÏÏÏÏÏÏÏÏÏÏÏÏÏÏÏÏÏÏÏÏÏÏÏÏ 2.02 LIBOR ° 0.9% 0.9 9.0FE ÏÏÏÏÏÏÏÏÏÏÏÏÏÏÏÏÏÏÏÏÏÏÏÏÏ 1.62 LIBOR ° 0.5% 0.5 9.0QI ÏÏÏÏÏÏÏÏÏÏÏÏÏÏÏÏÏÏÏÏÏÏÏÏÏ 0.4 8.5% ¿ LIBOR 0 0.4QVÏÏÏÏÏÏÏÏÏÏÏÏÏÏÏÏÏÏÏÏÏÏÏÏÏ 8.98 10.1% ¿ LIBOR 2.0 10.1SC ÏÏÏÏÏÏÏÏÏÏÏÏÏÏÏÏÏÏÏÏÏÏÏÏÏ 8.98 10.1% ¿ LIBOR 2.0 10.1
* MACR Class.
See Appendix V to the OÅering Circular and Payments Ì Interest.
I-2
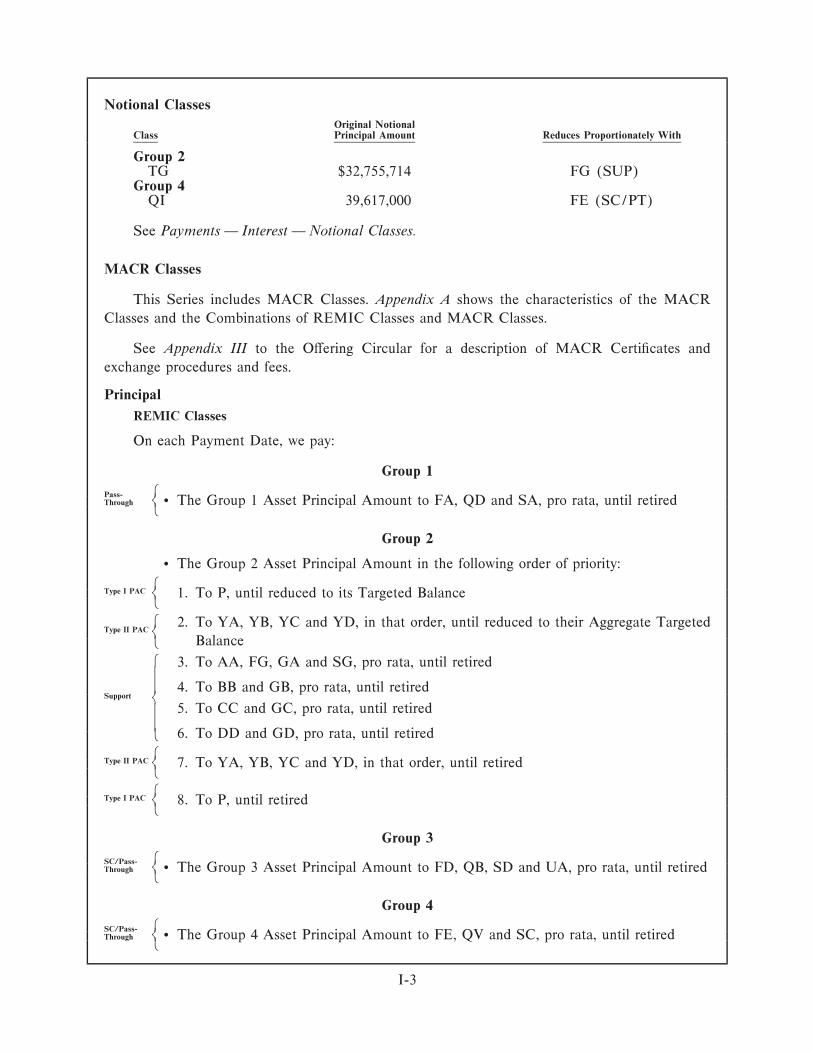
Notional Classes
Original NotionalClass Principal Amount Reduces Proportionately With
Group 2TG $32,755,714 FG (SUP)
Group 4QI 39,617,000 FE (SC/PT)
See Payments Ì Interest Ì Notional Classes.
MACR Classes
This Series includes MACR Classes. Appendix A shows the characteristics of the MACR
Classes and the Combinations of REMIC Classes and MACR Classes.
See Appendix III to the OÅering Circular for a description of MACR CertiÑcates and
exchange procedures and fees.
Principal
REMIC Classes
On each Payment Date, we pay:
Group 1
APass-B ‚ The Group 1 Asset Principal Amount to FA, QD and SA, pro rata, until retiredThroughD
Group 2
‚ The Group 2 Asset Principal Amount in the following order of priority:
A
Type I PACB 1. To P, until reduced to its Targeted BalanceD
A 2. To YA, YB, YC and YD, in that order, until reduced to their Aggregate TargetedType II PAC
B
BalanceD
A 3. To AA, FG, GA and SG, pro rata, until retired
4. To BB and GB, pro rata, until retiredSupport
B
5. To CC and GC, pro rata, until retired
6. To DD and GD, pro rata, until retiredD
A
Type II PACB 7. To YA, YB, YC and YD, in that order, until retiredD
A
Type I PACB 8. To P, until retiredD
Group 3
ASC/Pass-B ‚ The Group 3 Asset Principal Amount to FD, QB, SD and UA, pro rata, until retiredThroughD
Group 4
ASC/Pass-B ‚ The Group 4 Asset Principal Amount to FE, QV and SC, pro rata, until retiredThroughD
I-3
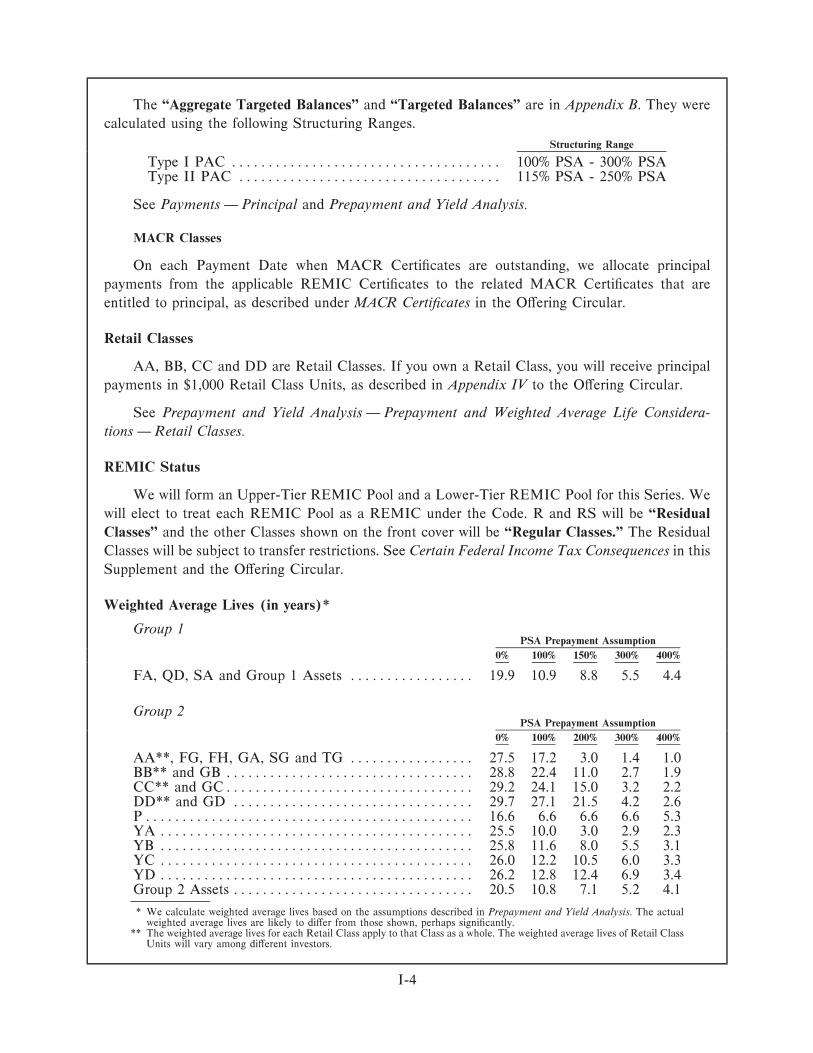
The ""Aggregate Targeted Balances'' and ""Targeted Balances'' are in Appendix B. They were
calculated using the following Structuring Ranges.
Structuring Range
Type I PAC ÏÏÏÏÏÏÏÏÏÏÏÏÏÏÏÏÏÏÏÏÏÏÏÏÏÏÏÏÏÏÏÏÏÏÏÏÏ 100% PSA - 300% PSAType II PAC ÏÏÏÏÏÏÏÏÏÏÏÏÏÏÏÏÏÏÏÏÏÏÏÏÏÏÏÏÏÏÏÏÏÏÏÏ 115% PSA - 250% PSA
See Payments Ì Principal and Prepayment and Yield Analysis.
MACR Classes
On each Payment Date when MACR CertiÑcates are outstanding, we allocate principal
payments from the applicable REMIC CertiÑcates to the related MACR CertiÑcates that are
entitled to principal, as described under MACR CertiÑcates in the OÅering Circular.
Retail Classes
AA, BB, CC and DD are Retail Classes. If you own a Retail Class, you will receive principal
payments in $1,000 Retail Class Units, as described in Appendix IV to the OÅering Circular.
See Prepayment and Yield Analysis Ì Prepayment and Weighted Average Life Considera-
tions Ì Retail Classes.
REMIC Status
We will form an Upper-Tier REMIC Pool and a Lower-Tier REMIC Pool for this Series. We
will elect to treat each REMIC Pool as a REMIC under the Code. R and RS will be ""Residual
Classes'' and the other Classes shown on the front cover will be ""Regular Classes.'' The Residual
Classes will be subject to transfer restrictions. See Certain Federal Income Tax Consequences in this
Supplement and the OÅering Circular.
Weighted Average Lives (in years)*
Group 1PSA Prepayment Assumption
0% 100% 150% 300% 400%
FA, QD, SA and Group 1 Assets ÏÏÏÏÏÏÏÏÏÏÏÏÏÏÏÏÏ 19.9 10.9 8.8 5.5 4.4
Group 2PSA Prepayment Assumption
0% 100% 200% 300% 400%
AA**, FG, FH, GA, SG and TG ÏÏÏÏÏÏÏÏÏÏÏÏÏÏÏÏÏ 27.5 17.2 3.0 1.4 1.0BB** and GB ÏÏÏÏÏÏÏÏÏÏÏÏÏÏÏÏÏÏÏÏÏÏÏÏÏÏÏÏÏÏÏÏÏÏ 28.8 22.4 11.0 2.7 1.9CC** and GCÏÏÏÏÏÏÏÏÏÏÏÏÏÏÏÏÏÏÏÏÏÏÏÏÏÏÏÏÏÏÏÏÏÏ 29.2 24.1 15.0 3.2 2.2DD** and GD ÏÏÏÏÏÏÏÏÏÏÏÏÏÏÏÏÏÏÏÏÏÏÏÏÏÏÏÏÏÏÏÏÏ 29.7 27.1 21.5 4.2 2.6PÏÏÏÏÏÏÏÏÏÏÏÏÏÏÏÏÏÏÏÏÏÏÏÏÏÏÏÏÏÏÏÏÏÏÏÏÏÏÏÏÏÏÏÏÏ 16.6 6.6 6.6 6.6 5.3YA ÏÏÏÏÏÏÏÏÏÏÏÏÏÏÏÏÏÏÏÏÏÏÏÏÏÏÏÏÏÏÏÏÏÏÏÏÏÏÏÏÏÏÏ 25.5 10.0 3.0 2.9 2.3YB ÏÏÏÏÏÏÏÏÏÏÏÏÏÏÏÏÏÏÏÏÏÏÏÏÏÏÏÏÏÏÏÏÏÏÏÏÏÏÏÏÏÏÏ 25.8 11.6 8.0 5.5 3.1YC ÏÏÏÏÏÏÏÏÏÏÏÏÏÏÏÏÏÏÏÏÏÏÏÏÏÏÏÏÏÏÏÏÏÏÏÏÏÏÏÏÏÏÏ 26.0 12.2 10.5 6.0 3.3YD ÏÏÏÏÏÏÏÏÏÏÏÏÏÏÏÏÏÏÏÏÏÏÏÏÏÏÏÏÏÏÏÏÏÏÏÏÏÏÏÏÏÏÏ 26.2 12.8 12.4 6.9 3.4Group 2 Assets ÏÏÏÏÏÏÏÏÏÏÏÏÏÏÏÏÏÏÏÏÏÏÏÏÏÏÏÏÏÏÏÏÏ 20.5 10.8 7.1 5.2 4.1
* We calculate weighted average lives based on the assumptions described in Prepayment and Yield Analysis. The actualweighted average lives are likely to diÅer from those shown, perhaps signiÑcantly.
** The weighted average lives for each Retail Class apply to that Class as a whole. The weighted average lives of Retail ClassUnits will vary among diÅerent investors.
I-4
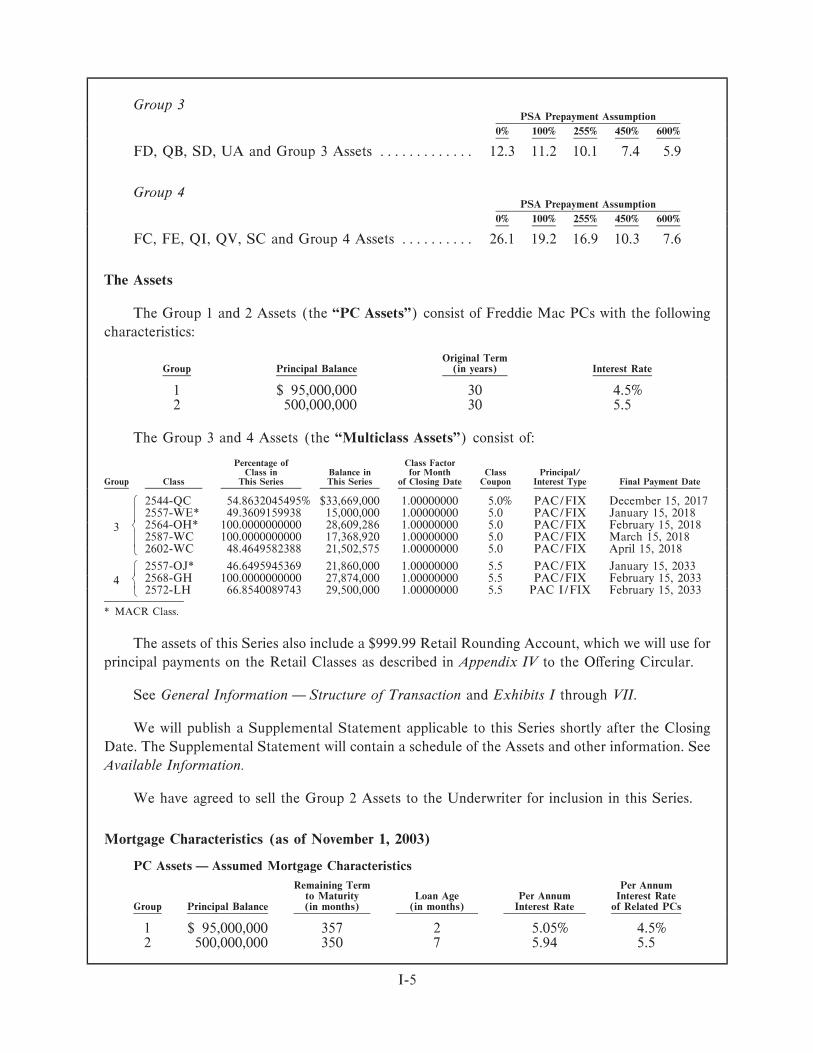
Group 3PSA Prepayment Assumption
0% 100% 255% 450% 600%
FD, QB, SD, UA and Group 3 Assets ÏÏÏÏÏÏÏÏÏÏÏÏÏ 12.3 11.2 10.1 7.4 5.9
Group 4PSA Prepayment Assumption
0% 100% 255% 450% 600%
FC, FE, QI, QV, SC and Group 4 Assets ÏÏÏÏÏÏÏÏÏÏ 26.1 19.2 16.9 10.3 7.6
The Assets
The Group 1 and 2 Assets (the ""PC Assets'') consist of Freddie Mac PCs with the following
characteristics:
Original TermGroup Principal Balance (in years) Interest Rate
1 $ 95,000,000 30 4.5%2 500,000,000 30 5.5
The Group 3 and 4 Assets (the ""Multiclass Assets'') consist of:
Percentage of Class FactorClass in Balance in for Month Class Principal/
Group Class This Series This Series of Closing Date Coupon Interest Type Final Payment Date
A 2544-QC 54.8632045495% $33,669,000 1.00000000 5.0% PAC/FIX December 15, 20172557-WE* 49.3609159938 15,000,000 1.00000000 5.0 PAC/FIX January 15, 2018
B 2564-OH* 100.0000000000 28,609,286 1.00000000 5.0 PAC/FIX February 15, 201832587-WC 100.0000000000 17,368,920 1.00000000 5.0 PAC/FIX March 15, 20182602-WC 48.4649582388 21,502,575 1.00000000 5.0 PAC/FIX April 15, 2018D
A 2557-OJ* 46.6495945369 21,860,000 1.00000000 5.5 PAC/FIX January 15, 2033B 2568-GH 100.0000000000 27,874,000 1.00000000 5.5 PAC/FIX February 15, 20334
2572-LH 66.8540089743 29,500,000 1.00000000 5.5 PAC I/FIX February 15, 2033D
* MACR Class.
The assets of this Series also include a $999.99 Retail Rounding Account, which we will use for
principal payments on the Retail Classes as described in Appendix IV to the OÅering Circular.
See General Information Ì Structure of Transaction and Exhibits I through VII.
We will publish a Supplemental Statement applicable to this Series shortly after the Closing
Date. The Supplemental Statement will contain a schedule of the Assets and other information. See
Available Information.
We have agreed to sell the Group 2 Assets to the Underwriter for inclusion in this Series.
Mortgage Characteristics (as of November 1, 2003)
PC Assets Ì Assumed Mortgage Characteristics
Remaining Term Per Annumto Maturity Loan Age Per Annum Interest Rate
Group Principal Balance (in months) (in months) Interest Rate of Related PCs
1 $ 95,000,000 357 2 5.05% 4.5%2 500,000,000 350 7 5.94 5.5
I-5

Multiclass Assets Ì Mortgage CharacteristicsWeighted AverageRemaining Term Weighted Average Weighted Average Per Annum
to Maturity Loan Age Per Annum Interest RateGroup Series (in months) (in months) Interest Rate of Related PCs
2544 165 11 5.441% 5.0%A
2557 166 10 5.502 5.02564 169 9 5.250 5.0B32587 167 11 5.567 5.02602 169 9 5.498 5.0D
2557 345 11 5.875 5.5A
2568 347 10 5.897 5.5B42572 347 10 5.989 5.5D
The actual characteristics of the Mortgages diÅer from those shown, in some cases
signiÑcantly.
See General InformationÌ The Mortgages.
I-6

Exhibit II Ì Series 2795 Front Cover and Terms Sheet
OÅering Circular Supplement $1,719,816,441(To OÅering CircularDated June 1, 2003) Freddie Mac
Multiclass CertiÑcates, Series 2795 VOÅered Classes: REMIC Classes shown below and MACR Classes shown on Appendix AOÅering Terms: The underwriter named below is oÅering the Classes in negotiated transactions at varying pricesClosing Date: May 28, 2004
REMIC Original Principal Class Interest CUSIP Final Payment REMIC Original Principal Class Interest CUSIP Final PaymentClasses Balance Type(1) Coupon Type(1) Number Date Classes Balance Type(1) Coupon Type(1) Number Date
Group 1 JA ÏÏÏÏÏÏ $ 42,852,000 PAC II 5.5% FIX 31394YUR3 December 15, 2033AA ÏÏÏÏÏÏ $ 9,775,000 SUP/RTL 5.5% FIX 31394YRY2 August 15, 2033 JB ÏÏÏÏÏÏ 5,986,000 PAC II 5.5 FIX 31394YUS1 February 15, 2034BA ÏÏÏÏÏÏ 4,692,000 SUP 5.5 FIX 31394YRZ9 August 15, 2033 JC ÏÏÏÏÏÏ 250,000 PAC II 5.5 FIX 31394YUT9 April 15, 2034BB ÏÏÏÏÏÏ 2,392,000 PAC II/RTL 5.5 FIX 31394Y S 2 1 March 15, 2034 JD ÏÏÏÏÏÏ 9,268,000 PAC II 6.0 FIX 31394YUU6 April 15, 2034BD ÏÏÏÏÏÏ 2,246,000 SUP 5.5 FIX 31394Y S 3 9 February 15, 2034 JE ÏÏÏÏÏÏ 7,145,000 PAC II 6.0 FIX 31394YUV4 May 15, 2034BE ÏÏÏÏÏÏ 1,243,000 SUP 5.5 FIX 31394Y S 4 7 May 15, 2034 JG ÏÏÏÏÏÏ 5,488,000 PAC II 6.0 FIX 31394YUW2 February 15, 2034BG ÏÏÏÏÏÏ 1,500,000 TAC 5.0 FIX 31394Y S 5 4 August 15, 2033 JJ ÏÏÏÏÏÏ 3,000,000 SUP/RTL 5.5 FIX 31394YUX0 September 15, 2033BH ÏÏÏÏÏÏ 1,500,000 TAC 6.0 FIX 31394Y S 6 2 August 15, 2033 KK ÏÏÏÏÏÏ 32,750,000 SUP/RTL 5.5 FIX 31394YUY8 March 15, 2033BJ ÏÏÏÏÏÏ 4,000,000 TAC 5.5 FIX 31394Y S 8 8 August 15, 2033 MMÏÏÏÏÏÏ 30,000,000 SUP/RTL 6.0 FIX 31394YUZ5 March 15, 2033BK ÏÏÏÏÏÏ 3,000,000 SUP 5.5 FIX 31394Y S 9 6 August 15, 2033 NN ÏÏÏÏÏÏ 10,000,000 SUP/RTL 6.0 FIX 31394Y V 2 7 July 15, 2033CC ÏÏÏÏÏÏ 1,917,000 SUP/RTL 5.5 FIX 31394YSG0 October 15, 2033 P ÏÏÏÏÏÏ 712,684,000 PAC I 5.5 FIX 31394Y V 3 5 May 15, 2034DD ÏÏÏÏÏÏ 1,434,000 PAC II/RTL 5.5 FIX 31394Y T 2 0 May 15, 2034
Group 5EE ÏÏÏÏÏÏ 1,651,000 SUP/RTL 5.5 FIX 31394YTQ7 February 15, 2034VA ÏÏÏÏÏÏ 10,700,000 SC/AD/SEQ 5.5 FIX 31394YVG6 April 15, 2015EF ÏÏÏÏÏÏ 2,066,250 SUP (2) FLT/DLY 31394YTR5 May 15, 2034VB ÏÏÏÏÏÏ 15,984,000 SC/SEQ 5.5 FIX 31394YVH4 August 15, 2024ES ÏÏÏÏÏÏ 1,239,750 SUP (2) INV/DLY 31394YU2 8 May 15, 2034ZA ÏÏÏÏÏÏ 13,100,000 SC/SEQ 5.5 FIX/Z 31394YVL5 April 15, 2034PA ÏÏÏÏÏÏ 100,000,000 PAC I 4.5 FIX 31394Y V 4 3 October 15, 2032
PB ÏÏÏÏÏÏ 15,113,000 PAC I 5.5 FIX 31394Y V 5 0 May 15, 2034 Group 6PI ÏÏÏÏÏÏ 18,181,818 NTL(PAC I) 5.5 FIX/IO 31394Y V 6 8 October 15, 2032 CU ÏÏÏÏÏÏ 23,915,737 SEQ 5.0 FIX 31394Y S T 2 May 15, 2019YA ÏÏÏÏÏÏ 6,606,000 PAC II 5.5 FIX 31394Y V J 0 December 15, 2033 CY ÏÏÏÏÏÏ 100,000,000 SEQ 5.0 FIX 31394YSW5 July 15, 2017YC ÏÏÏÏÏÏ 1,125,000 PAC II 5.5 FIX 31394YVK7 April 15, 2034
Group 7Group 2 SH ÏÏÏÏÏÏ 149,185,212 SC/NTL(PT) (2) INV/IO 31394YVA9 March 15, 2024CA ÏÏÏÏÏÏ 90,458,488 SEQ 5.0 FIX 31394YSE5 September 15, 2016 TS ÏÏÏÏÏÏ 149,185,212 SC/NTL(PT) (2) INV/IO 31394YVD3 March 15, 2024CK ÏÏÏÏÏÏ 23,915,737 SEQ 5.0 FIX 31394YSN5 May 15, 2019CX ÏÏÏÏÏÏ 9,541,512 SEQ 5.0 FIX 31394YSV7 July 15, 2017 Group 8
FA ÏÏÏÏÏÏ 30,000,000 SC/SCH (2) FLT 31394YU8 5 February 15, 2034Group 3UA ÏÏÏÏÏÏ 30,000,000 SC/NTL(SCH) (2) INV/IO 31394YVE1 February 15, 2034ST ÏÏÏÏÏÏ 25,682,321 SC/NTL(PT) (2) INV/IO 31394YVB7 December 15, 2032UT ÏÏÏÏÏÏ 30,000,000 SC/NTL(SCH) (2) INV/IO 31394YVF8 February 15, 2034SY ÏÏÏÏÏÏ 10,700,967 SC/PT (2) INV 31394YVC5 December 15, 2032Group 9Group 4IA ÏÏÏÏÏÏ 34,278,435 SC/NTL(PT) 4.5 FIX/IO 31394YUK8 March 15, 2018EG ÏÏÏÏÏÏ 21,084,783 CPT/SUP/PAC II 0.0 PO 31394YWK6 May 15, 2034
GA ÏÏÏÏÏÏ 5,931,909 SUP 5.5 FIX 31394YU9 3 March 15, 2033 Group 10GD ÏÏÏÏÏÏ 146,000 SUP 5.75 FIX 31394YUA0 March 15, 2033 BL ÏÏÏÏÏÏ 18,800,000 SEQ 5.0 FIX 31394YSA3 January 15, 2019GE ÏÏÏÏÏÏ 750,000 SUP 6.0 FIX 31394YUB8 September 15, 2033 BM ÏÏÏÏÏÏ 10,000,000 SEQ 5.0 FIX 31394YSB 1 May 15, 2019GG ÏÏÏÏÏÏ 5,100,000 SUP/RTL 5.75 FIX 31394YUC6 September 15, 2033 BN ÏÏÏÏÏÏ 60,360,000 SPP/SEQ/NAS 5.0 FIX 31394YSC9 March 15, 2018GH ÏÏÏÏÏÏ 20,000,000 SUP 6.0 FIX 31394YUD4 March 15, 2033 DA ÏÏÏÏÏÏ 140,840,000 SPP/SEQ/AS 5.0 FIX 31394YSX3 March 15, 2018GK ÏÏÏÏÏÏ 14,420,000 SUP 6.0 FIX 31394YUE2 July 15, 2033GV ÏÏÏÏÏÏ 37,500,000 AD/SUP 6.5 FIX 31394YUG7 December 15, 2019 ResidualGZ ÏÏÏÏÏÏ 21,594,308 SUP 6.5 FIX/Z 31394YUH5 May 15, 2034 R ÏÏÏÏÏÏ 0 NPR 0.0 NPR 31394Y V 7 6 May 15, 2034HH ÏÏÏÏÏÏ 14,050,000 SUP/RTL 6.0 FIX 31394Y U J 1 September 15, 2033 RS ÏÏÏÏÏÏ 0 NPR 0.0 NPR 31394Y V 8 4 May 15, 2034
(1) See Appendix II to the OÅering Circular.(2) See Terms Sheet Ì Interest.
The CertiÑcates may not be suitable investments for you. You should consider carefully the risks of investing in them.
Certain Risk Considerations on page S-2 highlights some of these risks.
You should purchase CertiÑcates only if you have read and understood this Supplement, the attached OÅering Circular
and the documents listed under Available Information.
We guarantee principal and interest payments on the CertiÑcates. These payments are not guaranteed by and are not
debts or obligations of the United States or any federal agency or instrumentality other than Freddie Mac. The
CertiÑcates are not tax-exempt. Because of applicable securities law exemptions, we have not registered the CertiÑcates
with any federal or state securities commission. No securities commission has reviewed this Supplement.
CitigroupApril 15, 2004
II-1

TERMS SHEET
This Terms Sheet contains selected information about this Series. You should refer to the
remainder of this Supplement for further information.
In this Supplement, we refer to Classes only by their letter designations. For example, ""R''
refers to the R Class of this Series.
Payment Dates
We make payments of principal and interest on the CertiÑcates on each monthly Payment Date
beginning in June 2004.
Form of Classes
Regular (non-Retail) and MACR Classes: Book-entry on Fed System
Retail Classes: Book-entry on DTC System; issued and paid in $1,000 Retail Class Units
Residual Classes: CertiÑcated
Interest
The Fixed Rate Classes bear interest at the Class Coupons shown on the front cover and
Appendix A.
EG is a Principal Only Class and does not bear interest.
The Floating Rate and Inverse Floating Rate Classes bear interest as shown in the following
table. The initial Class Coupons apply only to the Ñrst Accrual Period. Except in the case of SH and
TS, we determine LIBOR using the BBA Method. We determine LIBOR for SH and TS using the
LIBO method.
Class Coupon Subject toInitial ClassClass Coupon Class Coupon Formula Minimum Rate Maximum Rate
Group 1
EF(1)ÏÏ 2.6% LIBOR ° 1.5% 1.5% 7.0%ES(1)ÏÏ 10.33333333 12.16666667% ¿ (LIBOR £ 1.66666667) 3.0 12.16666667Group 3
STÏÏÏÏÏ 1.75 7.75% ¿ LIBOR 0 1.75SYÏÏÏÏÏ 11.76 14.4% ¿ (LIBOR £ 2.4) 0 14.4Group 7
SH ÏÏÏÏ 4.875 6.0% ¿ LIBOR 0 6.0TSÏÏÏÏÏ 1.95 7.95% ¿ LIBOR 0 1.95Group 8
FAÏÏÏÏÏ 1.85 LIBOR ° 0.75% 0.75 7.5SA(2)ÏÏ 5.65 6.75% ¿ LIBOR 0 6.75UA ÏÏÏÏ 4.9 6.0% ¿ LIBOR 0 6.0UT ÏÏÏÏ 0.75 6.75% ¿ LIBOR 0 0.75
(1) Delay Class.(2) MACR Class.
See Appendix V to the OÅering Circular and Payments Ì Interest.
II-2

Notional Classes
Original NotionalClass Principal Amount Reduces Proportionately With
Group 1PI $ 18,181,818 PA (PAC I)
Group 2CI* $ 22,614,622 CA (SEQ)IC* 25,000,000 CA and CX, as a whole (SEQ)XI* 2,385,378 CX (SEQ)
Group 3ST $ 25,682,321 SY (SC/PT)
Group 6IY* $ 20,000,000 CY (SEQ)
Group 7SH $149,185,212 Group 7 AssetsTS 149,185,212 Group 7 Assets
Group 8SA* $ 30,000,000 FA (SC/SCH)UA 30,000,000 FA (SC/SCH)UT 30,000,000 FA (SC/SCH)
Group 9IA $ 34,278,435 Group 9 Assets
Group 10BI* $ 5,640,000 BL (SEQ)DI* 42,252,000 DA (SPP/SEQ/AS)
$ 5,640,000 BL (SEQ)A
1,810,800 BN (SPP/SEQ/NAS)B 42,252,000 DA (SPP/SEQ/AS)EI*
$ 49,702,800D
IB* $ 60,360,000 BN and DA, as a whole (SEQ)ID* 18,108,000 BN (SPP/SEQ/NAS)IE* 66,000,000 BL, BN and DA, as a whole (SEQ)
* MACR Class.
See Payments Ì Interest Ì Notional Classes.
MACR Classes
This Series includes MACR Classes. Appendix A shows the characteristics of the MACR
Classes and the Combinations of REMIC and MACR Classes.
See Appendix III to the OÅering Circular for a description of MACR CertiÑcates and
exchange procedures and fees.
Components
Designation Original Balance Principal Type
EG-1 $ 1,991,000 PAC IIEG-2 19,093,783 SUP
See Payments Ì Principal Ì Components.
II-3
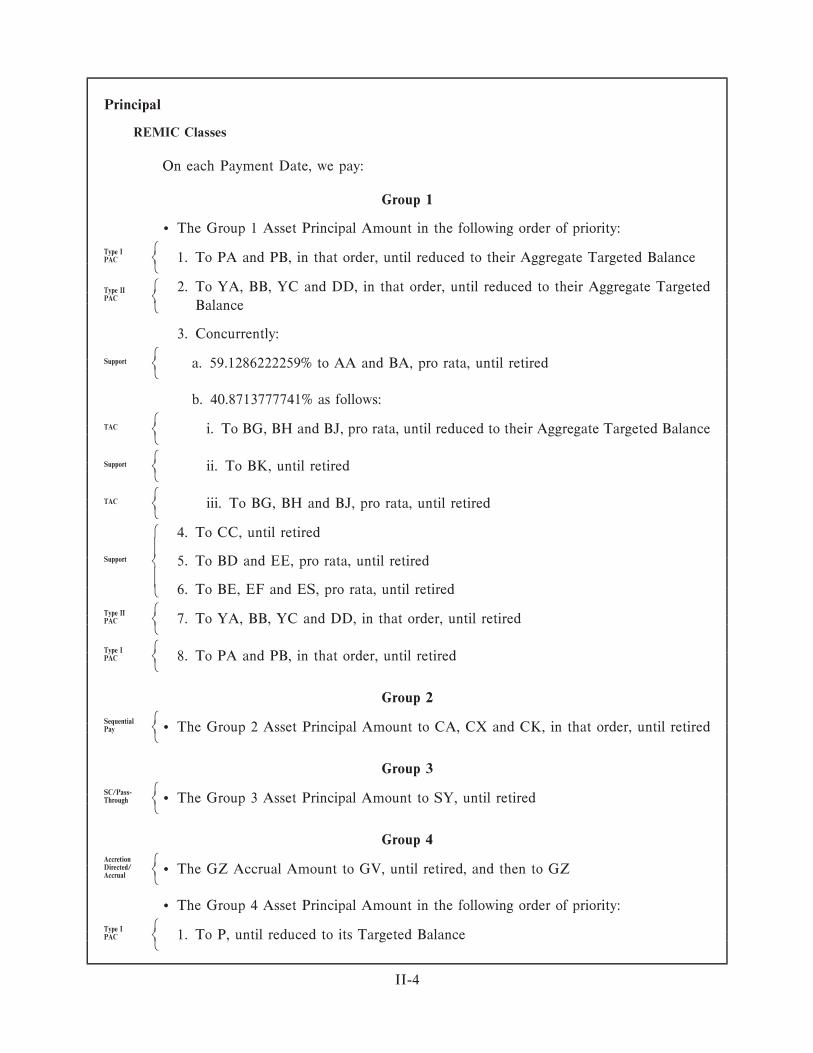
Principal
REMIC Classes
On each Payment Date, we pay:
Group 1
‚ The Group 1 Asset Principal Amount in the following order of priority:
AType IB 1. To PA and PB, in that order, until reduced to their Aggregate Targeted BalancePACD
A 2. To YA, BB, YC and DD, in that order, until reduced to their Aggregate TargetedType IIBPAC
BalanceD
3. Concurrently:
A
SupportB a. 59.1286222259% to AA and BA, pro rata, until retiredD
b. 40.8713777741% as follows:
A
TACB i. To BG, BH and BJ, pro rata, until reduced to their Aggregate Targeted BalanceD
A
SupportB ii. To BK, until retiredD
A
TACB iii. To BG, BH and BJ, pro rata, until retiredD
A 4. To CC, until retired
SupportB 5. To BD and EE, pro rata, until retired
6. To BE, EF and ES, pro rata, until retiredD
AType IIB 7. To YA, BB, YC and DD, in that order, until retiredPACD
AType IB 8. To PA and PB, in that order, until retiredPACD
Group 2
ASequentialB ‚ The Group 2 Asset Principal Amount to CA, CX and CK, in that order, until retiredPayD
Group 3
ASC/Pass-B ‚ The Group 3 Asset Principal Amount to SY, until retiredThroughD
Group 4Accretion A
Directed/B ‚ The GZ Accrual Amount to GV, until retired, and then to GZ
AccrualD
‚ The Group 4 Asset Principal Amount in the following order of priority:
AType IB 1. To P, until reduced to its Targeted BalancePACD
II-4
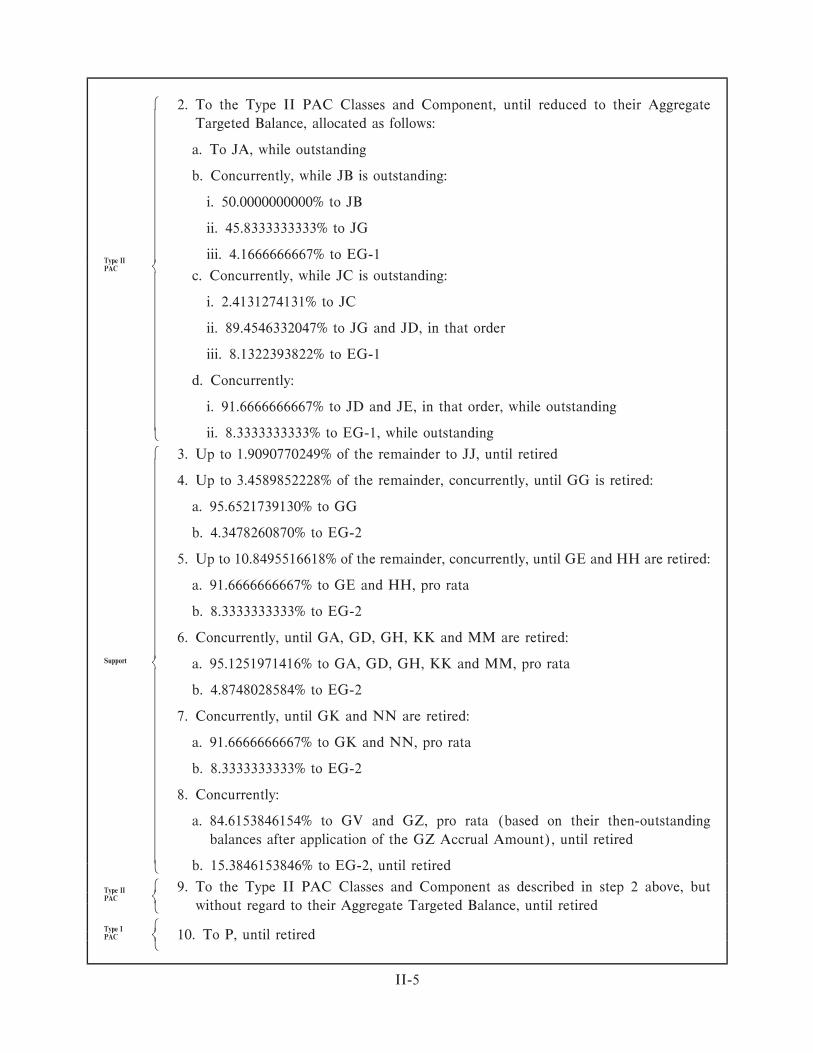
A 2. To the Type II PAC Classes and Component, until reduced to their Aggregate
Targeted Balance, allocated as follows:
a. To JA, while outstanding
b. Concurrently, while JB is outstanding:
i. 50.0000000000% to JB
ii. 45.8333333333% to JG
iii. 4.1666666667% to EG-1Type II
BPACc. Concurrently, while JC is outstanding:
i. 2.4131274131% to JC
ii. 89.4546332047% to JG and JD, in that order
iii. 8.1322393822% to EG-1
d. Concurrently:
i. 91.6666666667% to JD and JE, in that order, while outstanding
ii. 8.3333333333% to EG-1, while outstandingD
A 3. Up to 1.9090770249% of the remainder to JJ, until retired
4. Up to 3.4589852228% of the remainder, concurrently, until GG is retired:
a. 95.6521739130% to GG
b. 4.3478260870% to EG-2
5. Up to 10.8495516618% of the remainder, concurrently, until GE and HH are retired:
a. 91.6666666667% to GE and HH, pro rata
b. 8.3333333333% to EG-2
6. Concurrently, until GA, GD, GH, KK and MM are retired:
SupportB a. 95.1251971416% to GA, GD, GH, KK and MM, pro rata
b. 4.8748028584% to EG-2
7. Concurrently, until GK and NN are retired:
a. 91.6666666667% to GK and NN, pro rata
b. 8.3333333333% to EG-2
8. Concurrently:
a. 84.6153846154% to GV and GZ, pro rata (based on their then-outstanding
balances after application of the GZ Accrual Amount), until retired
b. 15.3846153846% to EG-2, until retiredD
A 9. To the Type II PAC Classes and Component as described in step 2 above, butType IIBPAC
without regard to their Aggregate Targeted Balance, until retiredD
AType IB 10. To P, until retiredPACD
II-5

Group 5Sequential A
Pay andB ‚ The ZA Accrual Amount to VA and VB, in that order, until retired, and then to ZA
AccrualD
A ‚ The Group 5 Asset Principal Amount in the following order of priority:
1. To VA and VB, pro rata (based on their then-outstanding balances after applicationSequentialBPay
of the ZA Accrual Amount), until retired
2. To ZA, until retiredD
Group 6
ASequentialB ‚ The Group 6 Asset Principal Amount to CY and CU, in that order, until retiredPayD
Group 8
A
SC/ScheduledB ‚ The Group 8 Asset Principal Amount to FA, until retiredD
Group 10
‚ The Group 10 Asset Principal Amount in the following order of priority:
ASPP/ 1. Beginning in June 2006, up to the Priority Amount to BN, until retiredSequential
B
Pay 2. To DA and BN, in that order, until retiredD
ASequentialB 3. To BL and BM, in that order, until retiredPayD
‚‚ Group 10 DeÑnitions
The Priority Amount for any Payment Date is the sum of (i) 98% of the Basic Principal
Amount for that Payment Date and (ii) the Priority Percentage of the Principal Prepayment
Amount for that Payment Date.
The Basic Principal Amount for any Payment Date is the aggregate amount of scheduled
principal payments required to be made on the Group 10 Assets on that Payment Date, exclusive of
amounts attributable to prepayments. For this purpose, we calculate scheduled principal payments
on the Group 10 Assets on the basis of the current weighted average interest rate and weighted
average remaining term to maturity of the underlying Mortgages.
The Principal Prepayment Amount for any Payment Date is the excess of (a) the Group 10
Asset Principal Amount for that Payment Date over (b) the Basic Principal Amount for that
Payment Date.
The Priority Percentage for each Payment Date is the following percentage applicable to that
Payment Date:
‚ 15% from June 2006 through May 2007
‚ 35% from June 2007 through May 2008
‚ 85% from June 2008 through May 2009
‚ 100% thereafter.
II-6

The ""Targeted Balances'' and ""Aggregate Targeted Balances'' are in Appendix B. They were
calculated using the following Structuring Ranges and Rate.Structuring Range or Rate
Group 1Type I PAC ÏÏÏÏÏÏÏÏÏÏÏÏÏÏÏÏÏÏÏÏÏÏÏÏÏÏÏÏÏÏÏÏÏÏÏÏÏ 100% PSA - 250% PSAType II PAC ÏÏÏÏÏÏÏÏÏÏÏÏÏÏÏÏÏÏÏÏÏÏÏÏÏÏÏÏÏÏÏÏÏÏÏÏ 120% PSA - 200% PSATAC ÏÏÏÏÏÏÏÏÏÏÏÏÏÏÏÏÏÏÏÏÏÏÏÏÏÏÏÏÏÏÏÏÏÏÏÏÏÏÏÏÏÏÏ 175% PSA
Group 4Type I PAC ÏÏÏÏÏÏÏÏÏÏÏÏÏÏÏÏÏÏÏÏÏÏÏÏÏÏÏÏÏÏÏÏÏÏÏÏÏ 100% PSA - 250% PSAType II PAC ÏÏÏÏÏÏÏÏÏÏÏÏÏÏÏÏÏÏÏÏÏÏÏÏÏÏÏÏÏÏÏÏÏÏÏÏ 120% PSA - 200% PSA
See Payments Ì Principal and Prepayment and Yield Analysis.
MACR Classes
On each Payment Date when MACR CertiÑcates are outstanding, we allocate principal
payments from the applicable REMIC CertiÑcates to the related MACR CertiÑcates that are
entitled to principal, as described under MACR CertiÑcates in the OÅering Circular.
Retail Classes
AA, BB, CC, DD, EE, GG, HH, JJ, KK, MM and NN are Retail Classes. If you own a Retail
Class, you will receive principal payments in $1,000 Retail Class Units, as described in Appendix IV
to the OÅering Circular.
See Prepayment and Yield Analysis Ì Prepayment and Weighted Average Life Considera-
tions Ì Retail Classes.
REMIC Status
We will form an Upper-Tier REMIC Pool and a Lower-Tier REMIC Pool for this Series. We
will elect to treat each REMIC Pool as a REMIC under the Code. R and RS will be ""Residual
Classes'' and the other Classes shown on the front cover will be ""Regular Classes.'' The Residual
Classes will be subject to transfer restrictions. See Certain Federal Income Tax Consequences in this
Supplement and the OÅering Circular.
Weighted Average Lives (in years)*
Group 1PSA Prepayment Assumption
0% 100% 150% 250% 400%
AA** and BAÏÏÏÏÏÏÏÏÏÏÏÏÏÏÏÏÏÏÏÏÏÏÏÏÏÏÏÏÏÏÏÏÏÏ 28.3 20.0 10.2 2.0 1.2BB** ÏÏÏÏÏÏÏÏÏÏÏÏÏÏÏÏÏÏÏÏÏÏÏÏÏÏÏÏÏÏÏÏÏÏÏÏÏÏÏÏÏ 26.9 14.0 8.0 6.0 2.8BD and EE** ÏÏÏÏÏÏÏÏÏÏÏÏÏÏÏÏÏÏÏÏÏÏÏÏÏÏÏÏÏÏÏÏÏÏ 29.5 26.4 22.8 4.1 2.1BE, EF and ESÏÏÏÏÏÏÏÏÏÏÏÏÏÏÏÏÏÏÏÏÏÏÏÏÏÏÏÏÏÏÏÏÏ 29.8 28.4 26.8 5.0 2.4BG, BH and BJ ÏÏÏÏÏÏÏÏÏÏÏÏÏÏÏÏÏÏÏÏÏÏÏÏÏÏÏÏÏÏÏÏ 28.0 18.6 7.1 2.3 1.4BK ÏÏÏÏÏÏÏÏÏÏÏÏÏÏÏÏÏÏÏÏÏÏÏÏÏÏÏÏÏÏÏÏÏÏÏÏÏÏÏÏÏÏÏ 29.0 23.2 17.7 1.3 0.6CC** ÏÏÏÏÏÏÏÏÏÏÏÏÏÏÏÏÏÏÏÏÏÏÏÏÏÏÏÏÏÏÏÏÏÏÏÏÏÏÏÏÏ 29.3 25.1 20.6 3.6 2.0DD** ÏÏÏÏÏÏÏÏÏÏÏÏÏÏÏÏÏÏÏÏÏÏÏÏÏÏÏÏÏÏÏÏÏÏÏÏÏÏÏÏÏ 27.2 15.2 12.6 7.6 2.9PA and PI ÏÏÏÏÏÏÏÏÏÏÏÏÏÏÏÏÏÏÏÏÏÏÏÏÏÏÏÏÏÏÏÏÏÏÏÏÏ 16.1 6.0 6.0 6.0 4.3PB ÏÏÏÏÏÏÏÏÏÏÏÏÏÏÏÏÏÏÏÏÏÏÏÏÏÏÏÏÏÏÏÏÏÏÏÏÏÏÏÏÏÏÏ 25.5 18.1 18.1 18.1 12.3YA ÏÏÏÏÏÏÏÏÏÏÏÏÏÏÏÏÏÏÏÏÏÏÏÏÏÏÏÏÏÏÏÏÏÏÏÏÏÏÏÏÏÏÏ 26.5 11.7 3.0 3.0 2.2YC ÏÏÏÏÏÏÏÏÏÏÏÏÏÏÏÏÏÏÏÏÏÏÏÏÏÏÏÏÏÏÏÏÏÏÏÏÏÏÏÏÏÏÏ 27.1 14.7 11.0 6.7 2.9Group 1 Assets ÏÏÏÏÏÏÏÏÏÏÏÏÏÏÏÏÏÏÏÏÏÏÏÏÏÏÏÏÏÏÏÏÏ 20.5 11.1 8.9 6.3 4.3
* We calculate weighted average lives based on the assumptions described in Prepayment and Yield Analysis. The actualweighted average lives are likely to diÅer from those shown, perhaps signiÑcantly.
** The weighted average lives for each Retail Class apply to that Class as a whole. The weighted average lives of Retail ClassUnits will vary among diÅerent investors.
II-7
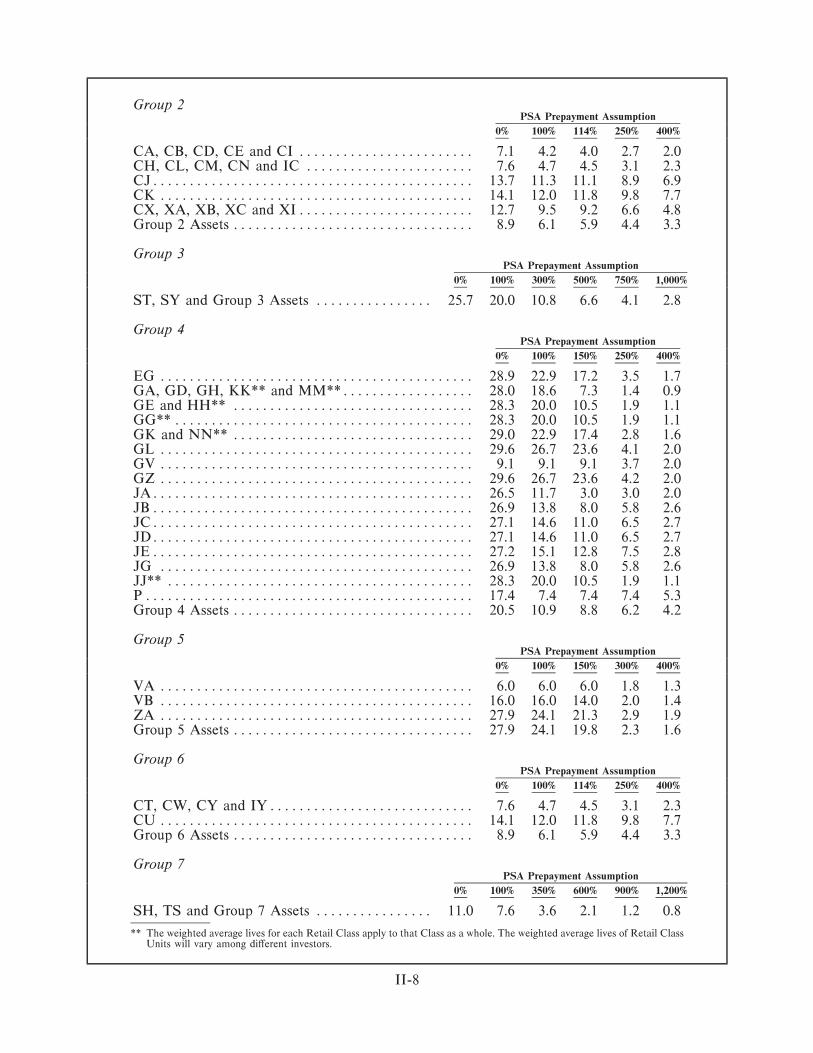
Group 2PSA Prepayment Assumption
0% 100% 114% 250% 400%
CA, CB, CD, CE and CI ÏÏÏÏÏÏÏÏÏÏÏÏÏÏÏÏÏÏÏÏÏÏÏÏ 7.1 4.2 4.0 2.7 2.0CH, CL, CM, CN and IC ÏÏÏÏÏÏÏÏÏÏÏÏÏÏÏÏÏÏÏÏÏÏÏ 7.6 4.7 4.5 3.1 2.3CJÏÏÏÏÏÏÏÏÏÏÏÏÏÏÏÏÏÏÏÏÏÏÏÏÏÏÏÏÏÏÏÏÏÏÏÏÏÏÏÏÏÏÏÏ 13.7 11.3 11.1 8.9 6.9CK ÏÏÏÏÏÏÏÏÏÏÏÏÏÏÏÏÏÏÏÏÏÏÏÏÏÏÏÏÏÏÏÏÏÏÏÏÏÏÏÏÏÏÏ 14.1 12.0 11.8 9.8 7.7CX, XA, XB, XC and XIÏÏÏÏÏÏÏÏÏÏÏÏÏÏÏÏÏÏÏÏÏÏÏÏ 12.7 9.5 9.2 6.6 4.8Group 2 Assets ÏÏÏÏÏÏÏÏÏÏÏÏÏÏÏÏÏÏÏÏÏÏÏÏÏÏÏÏÏÏÏÏÏ 8.9 6.1 5.9 4.4 3.3
Group 3PSA Prepayment Assumption
0% 100% 300% 500% 750% 1,000%
ST, SY and Group 3 Assets ÏÏÏÏÏÏÏÏÏÏÏÏÏÏÏÏ 25.7 20.0 10.8 6.6 4.1 2.8
Group 4PSA Prepayment Assumption
0% 100% 150% 250% 400%
EG ÏÏÏÏÏÏÏÏÏÏÏÏÏÏÏÏÏÏÏÏÏÏÏÏÏÏÏÏÏÏÏÏÏÏÏÏÏÏÏÏÏÏÏ 28.9 22.9 17.2 3.5 1.7GA, GD, GH, KK** and MM**ÏÏÏÏÏÏÏÏÏÏÏÏÏÏÏÏÏÏ 28.0 18.6 7.3 1.4 0.9GE and HH** ÏÏÏÏÏÏÏÏÏÏÏÏÏÏÏÏÏÏÏÏÏÏÏÏÏÏÏÏÏÏÏÏÏ 28.3 20.0 10.5 1.9 1.1GG** ÏÏÏÏÏÏÏÏÏÏÏÏÏÏÏÏÏÏÏÏÏÏÏÏÏÏÏÏÏÏÏÏÏÏÏÏÏÏÏÏÏ 28.3 20.0 10.5 1.9 1.1GK and NN** ÏÏÏÏÏÏÏÏÏÏÏÏÏÏÏÏÏÏÏÏÏÏÏÏÏÏÏÏÏÏÏÏÏ 29.0 22.9 17.4 2.8 1.6GL ÏÏÏÏÏÏÏÏÏÏÏÏÏÏÏÏÏÏÏÏÏÏÏÏÏÏÏÏÏÏÏÏÏÏÏÏÏÏÏÏÏÏÏ 29.6 26.7 23.6 4.1 2.0GV ÏÏÏÏÏÏÏÏÏÏÏÏÏÏÏÏÏÏÏÏÏÏÏÏÏÏÏÏÏÏÏÏÏÏÏÏÏÏÏÏÏÏÏ 9.1 9.1 9.1 3.7 2.0GZ ÏÏÏÏÏÏÏÏÏÏÏÏÏÏÏÏÏÏÏÏÏÏÏÏÏÏÏÏÏÏÏÏÏÏÏÏÏÏÏÏÏÏÏ 29.6 26.7 23.6 4.2 2.0JAÏÏÏÏÏÏÏÏÏÏÏÏÏÏÏÏÏÏÏÏÏÏÏÏÏÏÏÏÏÏÏÏÏÏÏÏÏÏÏÏÏÏÏÏ 26.5 11.7 3.0 3.0 2.0JBÏÏÏÏÏÏÏÏÏÏÏÏÏÏÏÏÏÏÏÏÏÏÏÏÏÏÏÏÏÏÏÏÏÏÏÏÏÏÏÏÏÏÏÏ 26.9 13.8 8.0 5.8 2.6JCÏÏÏÏÏÏÏÏÏÏÏÏÏÏÏÏÏÏÏÏÏÏÏÏÏÏÏÏÏÏÏÏÏÏÏÏÏÏÏÏÏÏÏÏ 27.1 14.6 11.0 6.5 2.7JDÏÏÏÏÏÏÏÏÏÏÏÏÏÏÏÏÏÏÏÏÏÏÏÏÏÏÏÏÏÏÏÏÏÏÏÏÏÏÏÏÏÏÏÏ 27.1 14.6 11.0 6.5 2.7JEÏÏÏÏÏÏÏÏÏÏÏÏÏÏÏÏÏÏÏÏÏÏÏÏÏÏÏÏÏÏÏÏÏÏÏÏÏÏÏÏÏÏÏÏ 27.2 15.1 12.8 7.5 2.8JG ÏÏÏÏÏÏÏÏÏÏÏÏÏÏÏÏÏÏÏÏÏÏÏÏÏÏÏÏÏÏÏÏÏÏÏÏÏÏÏÏÏÏÏ 26.9 13.8 8.0 5.8 2.6JJ** ÏÏÏÏÏÏÏÏÏÏÏÏÏÏÏÏÏÏÏÏÏÏÏÏÏÏÏÏÏÏÏÏÏÏÏÏÏÏÏÏÏÏ 28.3 20.0 10.5 1.9 1.1PÏÏÏÏÏÏÏÏÏÏÏÏÏÏÏÏÏÏÏÏÏÏÏÏÏÏÏÏÏÏÏÏÏÏÏÏÏÏÏÏÏÏÏÏÏ 17.4 7.4 7.4 7.4 5.3Group 4 Assets ÏÏÏÏÏÏÏÏÏÏÏÏÏÏÏÏÏÏÏÏÏÏÏÏÏÏÏÏÏÏÏÏÏ 20.5 10.9 8.8 6.2 4.2
Group 5PSA Prepayment Assumption
0% 100% 150% 300% 400%
VA ÏÏÏÏÏÏÏÏÏÏÏÏÏÏÏÏÏÏÏÏÏÏÏÏÏÏÏÏÏÏÏÏÏÏÏÏÏÏÏÏÏÏÏ 6.0 6.0 6.0 1.8 1.3VB ÏÏÏÏÏÏÏÏÏÏÏÏÏÏÏÏÏÏÏÏÏÏÏÏÏÏÏÏÏÏÏÏÏÏÏÏÏÏÏÏÏÏÏ 16.0 16.0 14.0 2.0 1.4ZA ÏÏÏÏÏÏÏÏÏÏÏÏÏÏÏÏÏÏÏÏÏÏÏÏÏÏÏÏÏÏÏÏÏÏÏÏÏÏÏÏÏÏÏ 27.9 24.1 21.3 2.9 1.9Group 5 Assets ÏÏÏÏÏÏÏÏÏÏÏÏÏÏÏÏÏÏÏÏÏÏÏÏÏÏÏÏÏÏÏÏÏ 27.9 24.1 19.8 2.3 1.6
Group 6PSA Prepayment Assumption
0% 100% 114% 250% 400%
CT, CW, CY and IYÏÏÏÏÏÏÏÏÏÏÏÏÏÏÏÏÏÏÏÏÏÏÏÏÏÏÏÏ 7.6 4.7 4.5 3.1 2.3CU ÏÏÏÏÏÏÏÏÏÏÏÏÏÏÏÏÏÏÏÏÏÏÏÏÏÏÏÏÏÏÏÏÏÏÏÏÏÏÏÏÏÏÏ 14.1 12.0 11.8 9.8 7.7Group 6 Assets ÏÏÏÏÏÏÏÏÏÏÏÏÏÏÏÏÏÏÏÏÏÏÏÏÏÏÏÏÏÏÏÏÏ 8.9 6.1 5.9 4.4 3.3
Group 7PSA Prepayment Assumption
0% 100% 350% 600% 900% 1,200%
SH, TS and Group 7 Assets ÏÏÏÏÏÏÏÏÏÏÏÏÏÏÏÏ 11.0 7.6 3.6 2.1 1.2 0.8
** The weighted average lives for each Retail Class apply to that Class as a whole. The weighted average lives of Retail ClassUnits will vary among diÅerent investors.
II-8
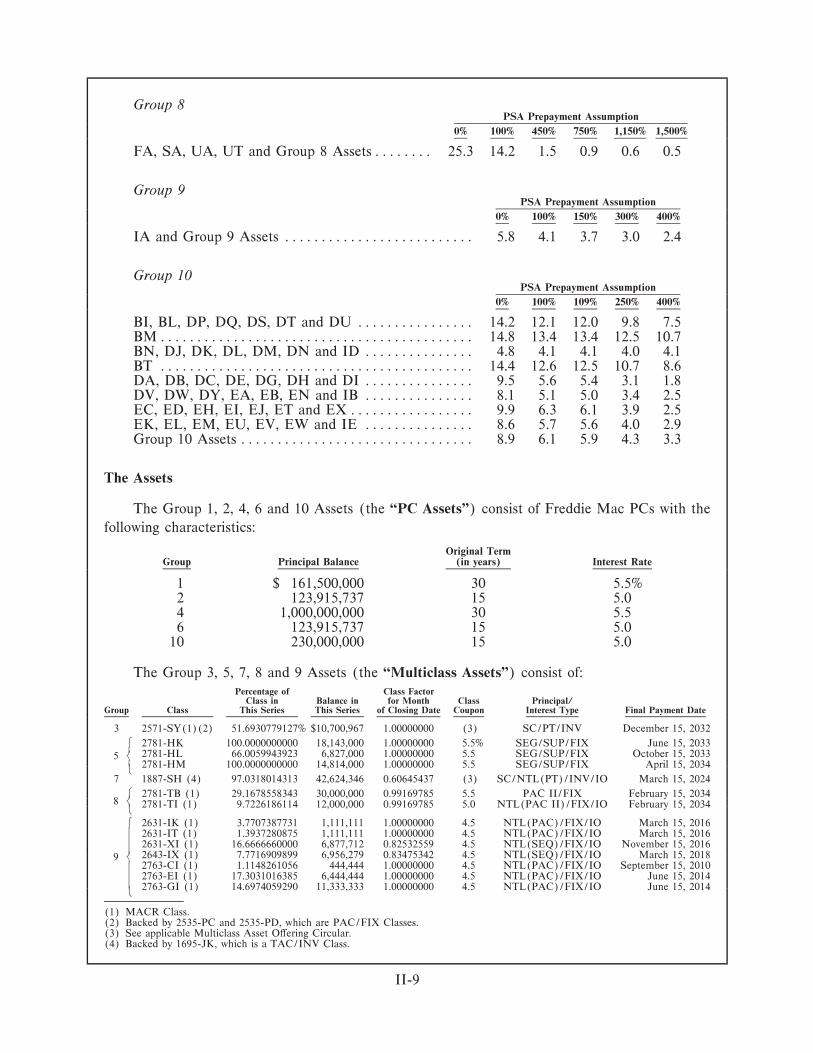
Group 8PSA Prepayment Assumption
0% 100% 450% 750% 1,150% 1,500%
FA, SA, UA, UT and Group 8 AssetsÏÏÏÏÏÏÏÏ 25.3 14.2 1.5 0.9 0.6 0.5
Group 9PSA Prepayment Assumption
0% 100% 150% 300% 400%
IA and Group 9 Assets ÏÏÏÏÏÏÏÏÏÏÏÏÏÏÏÏÏÏÏÏÏÏÏÏÏÏ 5.8 4.1 3.7 3.0 2.4
Group 10PSA Prepayment Assumption
0% 100% 109% 250% 400%
BI, BL, DP, DQ, DS, DT and DU ÏÏÏÏÏÏÏÏÏÏÏÏÏÏÏÏ 14.2 12.1 12.0 9.8 7.5BMÏÏÏÏÏÏÏÏÏÏÏÏÏÏÏÏÏÏÏÏÏÏÏÏÏÏÏÏÏÏÏÏÏÏÏÏÏÏÏÏÏÏÏ 14.8 13.4 13.4 12.5 10.7BN, DJ, DK, DL, DM, DN and ID ÏÏÏÏÏÏÏÏÏÏÏÏÏÏÏ 4.8 4.1 4.1 4.0 4.1BT ÏÏÏÏÏÏÏÏÏÏÏÏÏÏÏÏÏÏÏÏÏÏÏÏÏÏÏÏÏÏÏÏÏÏÏÏÏÏÏÏÏÏÏ 14.4 12.6 12.5 10.7 8.6DA, DB, DC, DE, DG, DH and DI ÏÏÏÏÏÏÏÏÏÏÏÏÏÏÏ 9.5 5.6 5.4 3.1 1.8DV, DW, DY, EA, EB, EN and IB ÏÏÏÏÏÏÏÏÏÏÏÏÏÏÏ 8.1 5.1 5.0 3.4 2.5EC, ED, EH, EI, EJ, ET and EXÏÏÏÏÏÏÏÏÏÏÏÏÏÏÏÏÏ 9.9 6.3 6.1 3.9 2.5EK, EL, EM, EU, EV, EW and IE ÏÏÏÏÏÏÏÏÏÏÏÏÏÏÏ 8.6 5.7 5.6 4.0 2.9Group 10 Assets ÏÏÏÏÏÏÏÏÏÏÏÏÏÏÏÏÏÏÏÏÏÏÏÏÏÏÏÏÏÏÏÏ 8.9 6.1 5.9 4.3 3.3
The Assets
The Group 1, 2, 4, 6 and 10 Assets (the ""PC Assets'') consist of Freddie Mac PCs with the
following characteristics:
Original TermGroup Principal Balance (in years) Interest Rate
1 $ 161,500,000 30 5.5%2 123,915,737 15 5.04 1,000,000,000 30 5.56 123,915,737 15 5.0
10 230,000,000 15 5.0
The Group 3, 5, 7, 8 and 9 Assets (the ""Multiclass Assets'') consist of:Percentage of Class Factor
Class in Balance in for Month Class Principal/Group Class This Series This Series of Closing Date Coupon Interest Type Final Payment Date
3 2571-SY(1)(2) 51.6930779127% $10,700,967 1.00000000 (3) SC/PT/INV December 15, 2032
A 2781-HK 100.0000000000 18,143,000 1.00000000 5.5% SEG/SUP/FIX June 15, 20332781-HL 66.0059943923 6,827,000 1.00000000 5.5 SEG/SUP/FIX October 15, 2033
B52781-HM 100.0000000000 14,814,000 1.00000000 5.5 SEG/SUP/FIX April 15, 2034
D
7 1887-SH (4) 97.0318014313 42,624,346 0.60645437 (3) SC/NTL(PT)/INV/IO March 15, 2024
A 2781-TB (1) 29.1678558343 30,000,000 0.99169785 5.5 PAC II/FIX February 15, 2034B8 2781-TI (1) 9.7226186114 12,000,000 0.99169785 5.0 NTL(PAC II)/FIX/IO February 15, 2034D
A 2631-IK (1) 3.7707387731 1,111,111 1.00000000 4.5 NTL(PAC)/FIX/IO March 15, 20162631-IT (1) 1.3937280875 1,111,111 1.00000000 4.5 NTL(PAC)/FIX/IO March 15, 20162631-XI (1) 16.6666660000 6,877,712 0.82532559 4.5 NTL(SEQ)/FIX/IO November 15, 20162643-IX (1) 7.7716909899 6,956,279 0.83475342 4.5 NTL(SEQ)/FIX/IO March 15, 2018
B92763-CI (1) 1.1148261056 444,444 1.00000000 4.5 NTL(PAC)/FIX/IO September 15, 20102763-EI (1) 17.3031016385 6,444,444 1.00000000 4.5 NTL(PAC)/FIX/IO June 15, 20142763-GI (1) 14.6974059290 11,333,333 1.00000000 4.5 NTL(PAC)/FIX/IO June 15, 2014
D
(1) MACR Class.(2) Backed by 2535-PC and 2535-PD, which are PAC/FIX Classes.(3) See applicable Multiclass Asset OÅering Circular.(4) Backed by 1695-JK, which is a TAC/INV Class.
II-9

The assets of this Series also include a $6,999.93 Retail Rounding Account, which we will use
for principal payments on the Retail Classes as described in Appendix IV to the OÅering Circular.
See General Information Ì Structure of Transaction and Exhibits I through VI.
We will publish a Supplemental Statement applicable to this Series shortly after the Closing
Date. The Supplemental Statement will contain a schedule of the Assets and other information. See
Available Information.
We have agreed to sell the Group 4 Assets to the Underwriter for inclusion in this Series.
Mortgage Characteristics (as of May 1, 2004)
PC Assets Ì Assumed Mortgage Characteristics
Remaining Term Per Annumto Maturity Loan Age Per Annum Interest Rate
Group Principal Balance (in months) (in months) Interest Rate of Related PCs
1 $ 161,500,000 355 3 6.0% 5.5%2 123,915,737 168 10 5.4 5.04 1,000,000,000 353 5 5.943 5.56 123,915,737 168 10 5.4 5.010 230,000,000 167 11 5.4 5.0
Multiclass Assets Ì Mortgage Characteristics
Weighted AverageRemaining Term Weighted Average Weighted Average Per Annum
to Maturity Loan Age Per Annum Interest RateGroup Series (in months) (in months) Interest Rate of Related PCs
3 2571/2535 337 19 6.532% 6.0%5 2781 (HK, HL and HM) 347 10 5.450 5.07 1887/1695 217 124 7.436 7.08 2781 (TB and TI) 346 11 5.583 5.0
2631 (IK) 166 11 5.226 4.5A
2631 (IT) 166 11 5.165 4.52631 (XI) 166 12 5.182 4.5B9
2643 164 13 5.194 4.52763 162 15 5.059 4.5D
The actual characteristics of the Mortgages diÅer from those shown, in some cases
signiÑcantly.
See General InformationÌ The Mortgages.
II-10
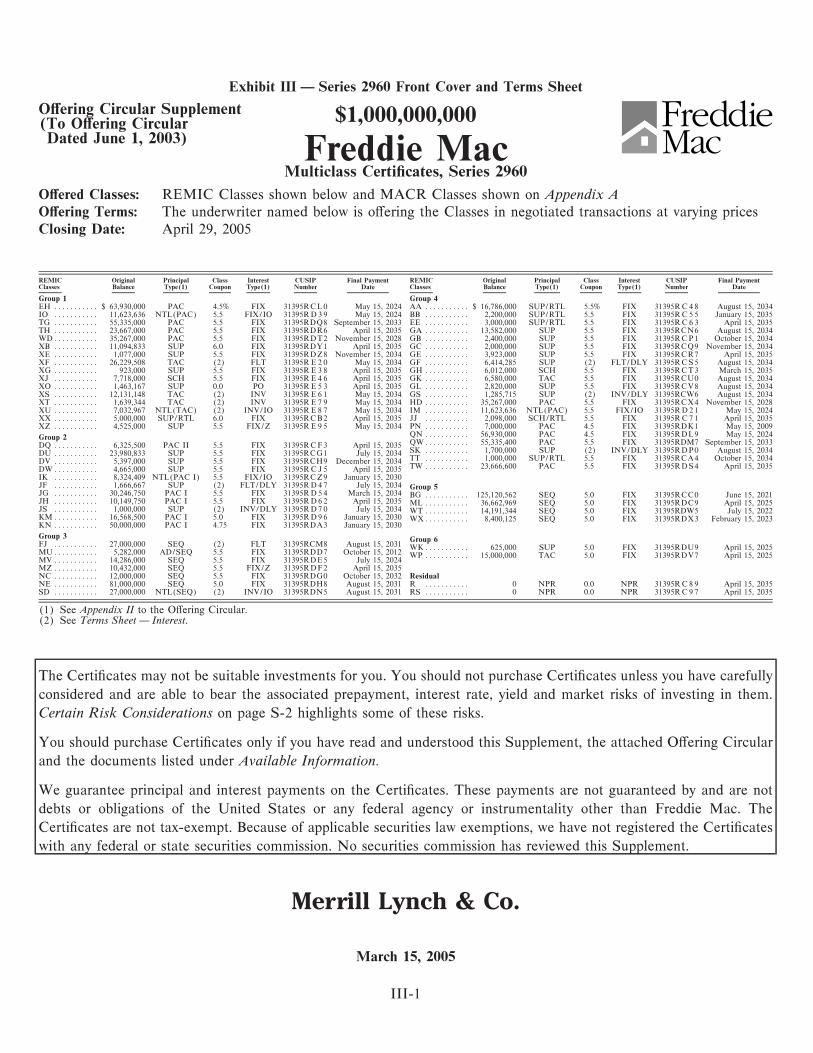
Exhibit III Ì Series 2960 Front Cover and Terms Sheet
OÅering Circular Supplement $1,000,000,000(To OÅering CircularDated June 1, 2003) Freddie Mac
Multiclass CertiÑcates, Series 2960
OÅered Classes: REMIC Classes shown below and MACR Classes shown on Appendix AOÅering Terms: The underwriter named below is oÅering the Classes in negotiated transactions at varying pricesClosing Date: April 29, 2005
REMIC Original Principal Class Interest CUSIP Final Payment REMIC Original Principal Class Interest CUSIP Final PaymentClasses Balance Type(1) Coupon Type(1) Number Date Classes Balance Type(1) Coupon Type(1) Number Date
Group 1 Group 4EH ÏÏÏÏÏÏÏÏÏÏÏ $ 63,930,000 PAC 4.5% FIX 31395RCL0 May 15, 2024 AA ÏÏÏÏÏÏÏÏÏÏÏ $ 16,786,000 SUP/RTL 5.5% FIX 31395R C 4 8 August 15, 2034IO ÏÏÏÏÏÏÏÏÏÏÏ 11,623,636 NTL(PAC) 5.5 FIX/IO 31395RD3 9 May 15, 2024 BB ÏÏÏÏÏÏÏÏÏÏÏ 2,200,000 SUP/RTL 5.5 FIX 31395R C 5 5 January 15, 2035TG ÏÏÏÏÏÏÏÏÏÏÏ 55,335,000 PAC 5.5 FIX 31395RDQ8 September 15, 2033 EE ÏÏÏÏÏÏÏÏÏÏÏ 3,000,000 SUP/RTL 5.5 FIX 31395R C 6 3 April 15, 2035TH ÏÏÏÏÏÏÏÏÏÏÏ 23,667,000 PAC 5.5 FIX 31395RDR6 April 15, 2035 GA ÏÏÏÏÏÏÏÏÏÏÏ 13,582,000 SUP 5.5 FIX 31395RCN6 August 15, 2034WDÏÏÏÏÏÏÏÏÏÏÏ 35,267,000 PAC 5.5 FIX 31395RDT2 November 15, 2028 GB ÏÏÏÏÏÏÏÏÏÏÏ 2,400,000 SUP 5.5 FIX 31395RCP1 October 15, 2034XB ÏÏÏÏÏÏÏÏÏÏÏ 11,094,833 SUP 6.0 FIX 31395RDY1 April 15, 2035 GC ÏÏÏÏÏÏÏÏÏÏÏ 2,000,000 SUP 5.5 FIX 31395RCQ9 November 15, 2034XE ÏÏÏÏÏÏÏÏÏÏÏ 1,077,000 SUP 5.5 FIX 31395RDZ8 November 15, 2034 GE ÏÏÏÏÏÏÏÏÏÏÏ 3,923,000 SUP 5.5 FIX 31395RCR7 April 15, 2035XF ÏÏÏÏÏÏÏÏÏÏÏ 26,229,508 TAC (2) FLT 31395R E 2 0 May 15, 2034 GF ÏÏÏÏÏÏÏÏÏÏÏ 6,414,285 SUP (2) FLT/DLY 31395RCS5 August 15, 2034XG ÏÏÏÏÏÏÏÏÏÏÏ 923,000 SUP 5.5 FIX 31395R E 3 8 April 15, 2035 GH ÏÏÏÏÏÏÏÏÏÏÏ 6,012,000 SCH 5.5 FIX 31395RCT3 March 15, 2035XJ ÏÏÏÏÏÏÏÏÏÏÏ 7,718,000 SCH 5.5 FIX 31395R E 4 6 April 15, 2035 GK ÏÏÏÏÏÏÏÏÏÏÏ 6,580,000 TAC 5.5 FIX 31395RCU0 August 15, 2034XO ÏÏÏÏÏÏÏÏÏÏÏ 1,463,167 SUP 0.0 PO 31395R E 5 3 April 15, 2035 GL ÏÏÏÏÏÏÏÏÏÏÏ 2,820,000 SUP 5.5 FIX 31395RCV8 August 15, 2034XS ÏÏÏÏÏÏÏÏÏÏÏ 12,131,148 TAC (2) INV 31395R E 6 1 May 15, 2034 GS ÏÏÏÏÏÏÏÏÏÏÏ 1,285,715 SUP (2) INV/DLY 31395RCW6 August 15, 2034XT ÏÏÏÏÏÏÏÏÏÏÏ 1,639,344 TAC (2) INV 31395R E 7 9 May 15, 2034 HD ÏÏÏÏÏÏÏÏÏÏÏ 35,267,000 PAC 5.5 FIX 31395RCX4 November 15, 2028XU ÏÏÏÏÏÏÏÏÏÏÏ 7,032,967 NTL(TAC) (2) INV/IO 31395R E 8 7 May 15, 2034 IM ÏÏÏÏÏÏÏÏÏÏÏ 11,623,636 NTL(PAC) 5.5 FIX/IO 31395RD2 1 May 15, 2024XX ÏÏÏÏÏÏÏÏÏÏÏ 5,000,000 SUP/RTL 6.0 FIX 31395RCB2 April 15, 2035 JJ ÏÏÏÏÏÏÏÏÏÏÏ 2,098,000 SCH/RTL 5.5 FIX 31395R C 7 1 April 15, 2035XZ ÏÏÏÏÏÏÏÏÏÏÏ 4,525,000 SUP 5.5 FIX/Z 31395R E 9 5 May 15, 2034 PN ÏÏÏÏÏÏÏÏÏÏÏ 7,000,000 PAC 4.5 FIX 31395RDK1 May 15, 2009
QN ÏÏÏÏÏÏÏÏÏÏÏ 56,930,000 PAC 4.5 FIX 31395RDL9 May 15, 2024Group 2QWÏÏÏÏÏÏÏÏÏÏÏ 55,335,400 PAC 5.5 FIX 31395RDM7 September 15, 2033DQ ÏÏÏÏÏÏÏÏÏÏÏ 6,325,500 PAC II 5.5 FIX 31395RCF3 April 15, 2035SK ÏÏÏÏÏÏÏÏÏÏÏ 1,700,000 SUP (2) INV/DLY 31395RDP0 August 15, 2034DU ÏÏÏÏÏÏÏÏÏÏÏ 23,980,833 SUP 5.5 FIX 31395RCG1 July 15, 2034TT ÏÏÏÏÏÏÏÏÏÏÏ 1,000,000 SUP/RTL 5.5 FIX 31395RCA4 October 15, 2034DV ÏÏÏÏÏÏÏÏÏÏÏ 5,397,000 SUP 5.5 FIX 31395RCH9 December 15, 2034TW ÏÏÏÏÏÏÏÏÏÏÏ 23,666,600 PAC 5.5 FIX 31395RDS4 April 15, 2035DWÏÏÏÏÏÏÏÏÏÏÏ 4,665,000 SUP 5.5 FIX 31395R C J 5 April 15, 2035
IK ÏÏÏÏÏÏÏÏÏÏÏ 8,324,409 NTL(PAC I) 5.5 FIX/IO 31395RCZ9 January 15, 2030JF ÏÏÏÏÏÏÏÏÏÏÏ 1,666,667 SUP (2) FLT/DLY 31395RD4 7 July 15, 2034 Group 5JG ÏÏÏÏÏÏÏÏÏÏÏ 30,246,750 PAC I 5.5 FIX 31395RD5 4 March 15, 2034 BG ÏÏÏÏÏÏÏÏÏÏÏ 125,120,562 SEQ 5.0 FIX 31395RCC0 June 15, 2021JH ÏÏÏÏÏÏÏÏÏÏÏ 10,149,750 PAC I 5.5 FIX 31395RD6 2 April 15, 2035 ML ÏÏÏÏÏÏÏÏÏÏÏ 36,662,969 SEQ 5.0 FIX 31395RDC9 April 15, 2025JS ÏÏÏÏÏÏÏÏÏÏÏ 1,000,000 SUP (2) INV/DLY 31395RD7 0 July 15, 2034 WT ÏÏÏÏÏÏÏÏÏÏÏ 14,191,344 SEQ 5.0 FIX 31395RDW5 July 15, 2022KMÏÏÏÏÏÏÏÏÏÏÏ 16,568,500 PAC I 5.0 FIX 31395RD9 6 January 15, 2030 WXÏÏÏÏÏÏÏÏÏÏÏ 8,400,125 SEQ 5.0 FIX 31395RDX3 February 15, 2023KN ÏÏÏÏÏÏÏÏÏÏÏ 50,000,000 PAC I 4.75 FIX 31395RDA3 January 15, 2030
Group 3 Group 6FJ ÏÏÏÏÏÏÏÏÏÏÏ 27,000,000 SEQ (2) FLT 31395RCM8 August 15, 2031 WKÏÏÏÏÏÏÏÏÏÏÏ 625,000 SUP 5.0 FIX 31395RDU9 April 15, 2025MUÏÏÏÏÏÏÏÏÏÏÏ 5,282,000 AD/SEQ 5.5 FIX 31395RDD7 October 15, 2012 WP ÏÏÏÏÏÏÏÏÏÏÏ 15,000,000 TAC 5.0 FIX 31395RDV7 April 15, 2025MV ÏÏÏÏÏÏÏÏÏÏÏ 14,286,000 SEQ 5.5 FIX 31395RDE5 July 15, 2024MZ ÏÏÏÏÏÏÏÏÏÏÏ 10,432,000 SEQ 5.5 FIX/Z 31395RDF2 April 15, 2035NC ÏÏÏÏÏÏÏÏÏÏÏ 12,000,000 SEQ 5.5 FIX 31395RDG0 October 15, 2032 ResidualNE ÏÏÏÏÏÏÏÏÏÏÏ 81,000,000 SEQ 5.0 FIX 31395RDH8 August 15, 2031 R ÏÏÏÏÏÏÏÏÏÏÏ 0 NPR 0.0 NPR 31395R C 8 9 April 15, 2035SD ÏÏÏÏÏÏÏÏÏÏÏ 27,000,000 NTL(SEQ) (2) INV/IO 31395RDN5 August 15, 2031 RS ÏÏÏÏÏÏÏÏÏÏÏ 0 NPR 0.0 NPR 31395R C 9 7 April 15, 2035
(1) See Appendix II to the OÅering Circular.(2) See Terms Sheet Ì Interest.
The CertiÑcates may not be suitable investments for you. You should not purchase CertiÑcates unless you have carefully
considered and are able to bear the associated prepayment, interest rate, yield and market risks of investing in them.
Certain Risk Considerations on page S-2 highlights some of these risks.
You should purchase CertiÑcates only if you have read and understood this Supplement, the attached OÅering Circular
and the documents listed under Available Information.
We guarantee principal and interest payments on the CertiÑcates. These payments are not guaranteed by and are not
debts or obligations of the United States or any federal agency or instrumentality other than Freddie Mac. The
CertiÑcates are not tax-exempt. Because of applicable securities law exemptions, we have not registered the CertiÑcates
with any federal or state securities commission. No securities commission has reviewed this Supplement.
Merrill Lynch & Co.
March 15, 2005
III-1

TERMS SHEET
This Terms Sheet contains selected information about this Series. You should refer to the
remainder of this Supplement for further information.
In this Supplement, we refer to Classes only by their letter designations. For example, ""R''
refers to the R Class of this Series.
Payment Dates
We make payments of principal and interest on the CertiÑcates on each monthly Payment Date
beginning in May 2005.
Form of Classes
Regular (non-Retail) and MACR Classes: Book-entry on Fed System
Retail Classes: Book-entry on DTC System; issued and paid in $1,000 Retail Class Units
Residual Classes: CertiÑcated
Interest
The Fixed Rate Classes bear interest at the Class Coupons shown on the front cover and
Appendix A.
XO is a Principal Only Class and does not bear interest.
The Floating Rate and Inverse Floating Rate Classes bear interest as shown in the following
table. The initial Class Coupons apply only to the Ñrst Accrual Period. We determine LIBOR using
the BBA Method.
Class Coupon Subject toInitial ClassClass Coupon Class Coupon Formula Minimum Rate Maximum Rate
Group 1
XF ÏÏÏÏÏÏÏÏÏÏ 3.35% LIBOR ° 0.5% 0.5% 7.0%XS ÏÏÏÏÏÏÏÏÏÏ 7.984613 12.494505% ¿ (LIBOR £ 1.582418) 3.0 12.494505XT ÏÏÏÏÏÏÏÏÏÏ 8.0 104.0% ¿ (LIBOR £ 16.0) 0 8.0XUÏÏÏÏÏÏÏÏÏÏ 3.15 6.0% ¿ LIBOR 0 6.0
Group 2
JF*ÏÏÏÏÏÏÏÏÏÏ 3.65 LIBOR ° 0.8% 0.8 6.999999JS*ÏÏÏÏÏÏÏÏÏÏ 8.58333 13.3333349% ¿ (LIBOR £ 1.666667) 3.0 13.3333349
Group 3
FJÏÏÏÏÏÏÏÏÏÏÏ 3.1 LIBOR ° 0.25% 0.25 7.0SD ÏÏÏÏÏÏÏÏÏÏ 3.9 6.75% ¿ LIBOR 0 6.75
Group 4
GF* ÏÏÏÏÏÏÏÏÏ 3.85 LIBOR ° 1.0% 1.0 7.0GS* ÏÏÏÏÏÏÏÏÏ 11.55 21.999984% ¿ (LIBOR £ 3.666664) 0 21.999984SK* ÏÏÏÏÏÏÏÏÏ 7.15 10.0% ¿ LIBOR 4.0 10.0
* Delay Class.
See Appendix V to the OÅering Circular and Payments Ì Interest.
III-2
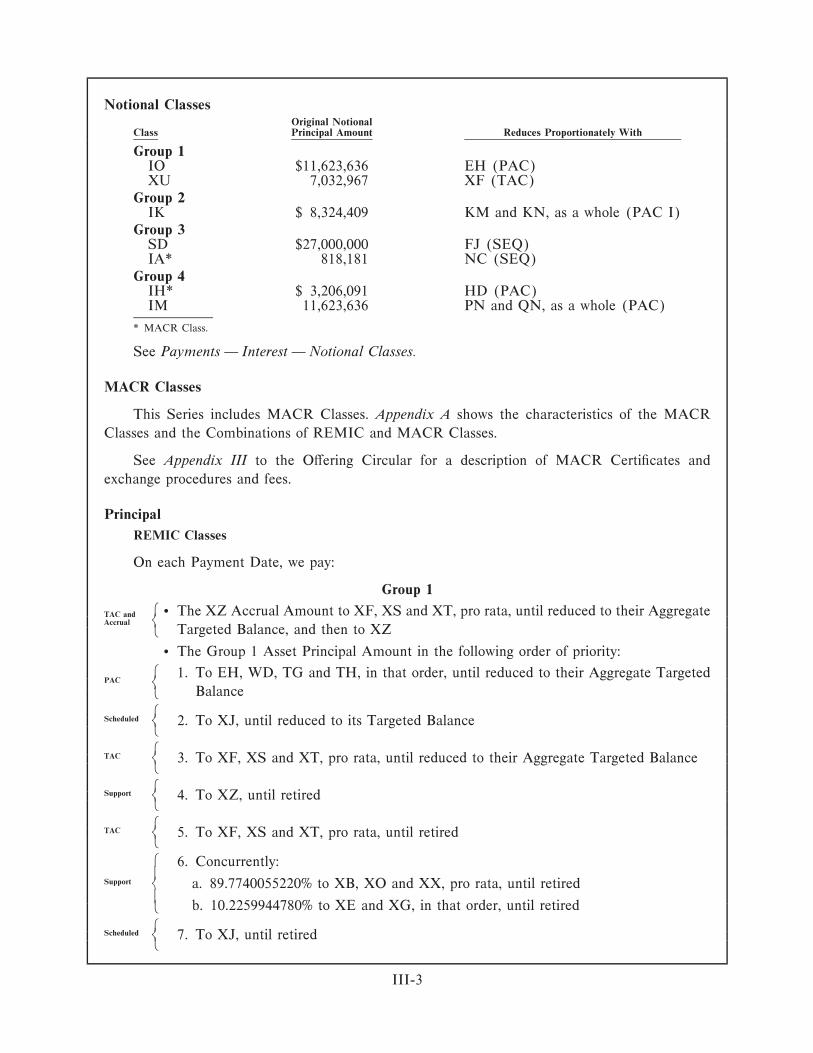
Notional ClassesOriginal Notional
Class Principal Amount Reduces Proportionately With
Group 1IO $11,623,636 EH (PAC)XU 7,032,967 XF (TAC)
Group 2IK $ 8,324,409 KM and KN, as a whole (PAC I)
Group 3SD $27,000,000 FJ (SEQ)IA* 818,181 NC (SEQ)
Group 4IH* $ 3,206,091 HD (PAC)IM 11,623,636 PN and QN, as a whole (PAC)
* MACR Class.
See Payments Ì Interest Ì Notional Classes.
MACR Classes
This Series includes MACR Classes. Appendix A shows the characteristics of the MACR
Classes and the Combinations of REMIC and MACR Classes.
See Appendix III to the OÅering Circular for a description of MACR CertiÑcates and
exchange procedures and fees.
Principal
REMIC Classes
On each Payment Date, we pay:
Group 1
A ‚ The XZ Accrual Amount to XF, XS and XT, pro rata, until reduced to their AggregateTAC andBAccrual
Targeted Balance, and then to XZD
‚ The Group 1 Asset Principal Amount in the following order of priority:
A 1. To EH, WD, TG and TH, in that order, until reduced to their Aggregate TargetedPAC
B
BalanceD
A
ScheduledB 2. To XJ, until reduced to its Targeted BalanceD
A
TACB 3. To XF, XS and XT, pro rata, until reduced to their Aggregate Targeted BalanceD
A
SupportB 4. To XZ, until retiredD
A
TACB 5. To XF, XS and XT, pro rata, until retiredD
A 6. Concurrently:
SupportB a. 89.7740055220% to XB, XO and XX, pro rata, until retired
b. 10.2259944780% to XE and XG, in that order, until retiredD
A
ScheduledB 7. To XJ, until retiredD
III-3
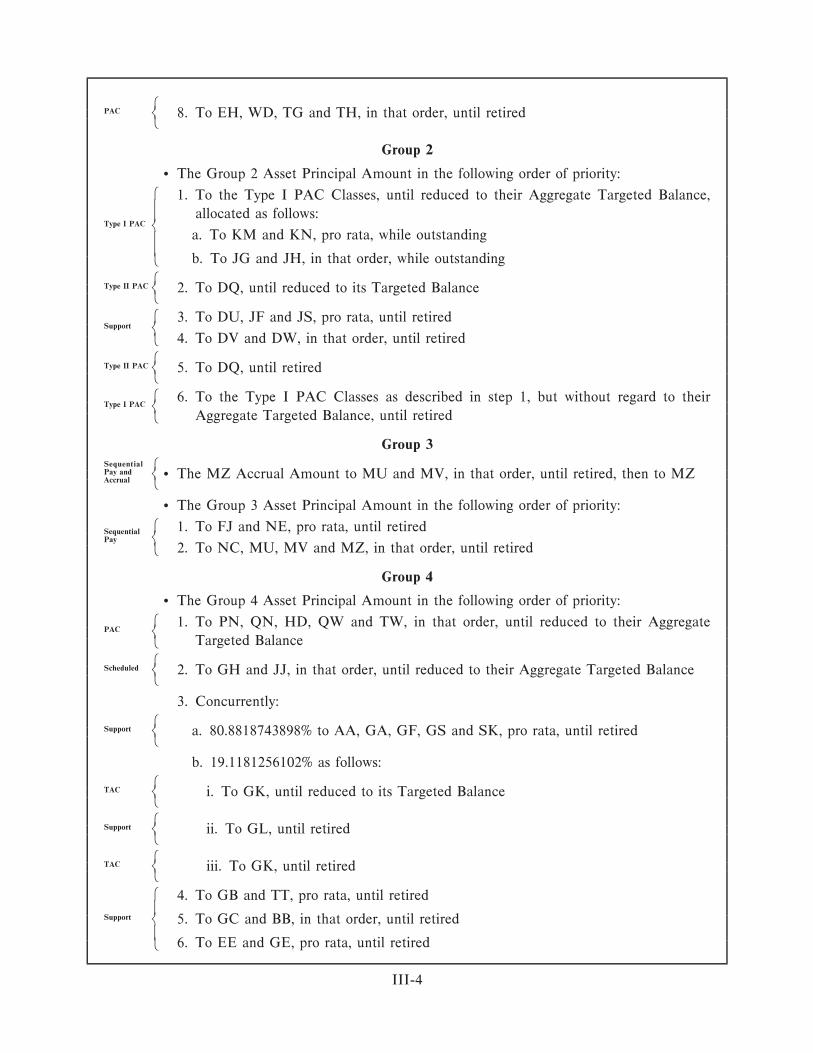
A
PACB 8. To EH, WD, TG and TH, in that order, until retiredD
Group 2
‚ The Group 2 Asset Principal Amount in the following order of priority:
A 1. To the Type I PAC Classes, until reduced to their Aggregate Targeted Balance,
allocated as follows:Type I PAC
B
a. To KM and KN, pro rata, while outstanding
b. To JG and JH, in that order, while outstandingD
A
Type II PACB 2. To DQ, until reduced to its Targeted BalanceD
A 3. To DU, JF and JS, pro rata, until retiredSupport
B
4. To DV and DW, in that order, until retiredD
A
Type II PACB 5. To DQ, until retiredD
A 6. To the Type I PAC Classes as described in step 1, but without regard to theirType I PAC
B
Aggregate Targeted Balance, until retiredD
Group 3Sequential A
Pay andB ‚ The MZ Accrual Amount to MU and MV, in that order, until retired, then to MZ
AccrualD
‚ The Group 3 Asset Principal Amount in the following order of priority:
A 1. To FJ and NE, pro rata, until retiredSequentialBPay
2. To NC, MU, MV and MZ, in that order, until retiredD
Group 4
‚ The Group 4 Asset Principal Amount in the following order of priority:
A 1. To PN, QN, HD, QW and TW, in that order, until reduced to their AggregatePAC
B
Targeted BalanceD
A
ScheduledB 2. To GH and JJ, in that order, until reduced to their Aggregate Targeted BalanceD
3. Concurrently:
A
SupportB a. 80.8818743898% to AA, GA, GF, GS and SK, pro rata, until retiredD
b. 19.1181256102% as follows:
A
TACB i. To GK, until reduced to its Targeted BalanceD
A
SupportB ii. To GL, until retiredD
A
TACB iii. To GK, until retiredD
A 4. To GB and TT, pro rata, until retired
SupportB 5. To GC and BB, in that order, until retired
6. To EE and GE, pro rata, until retiredD
III-4
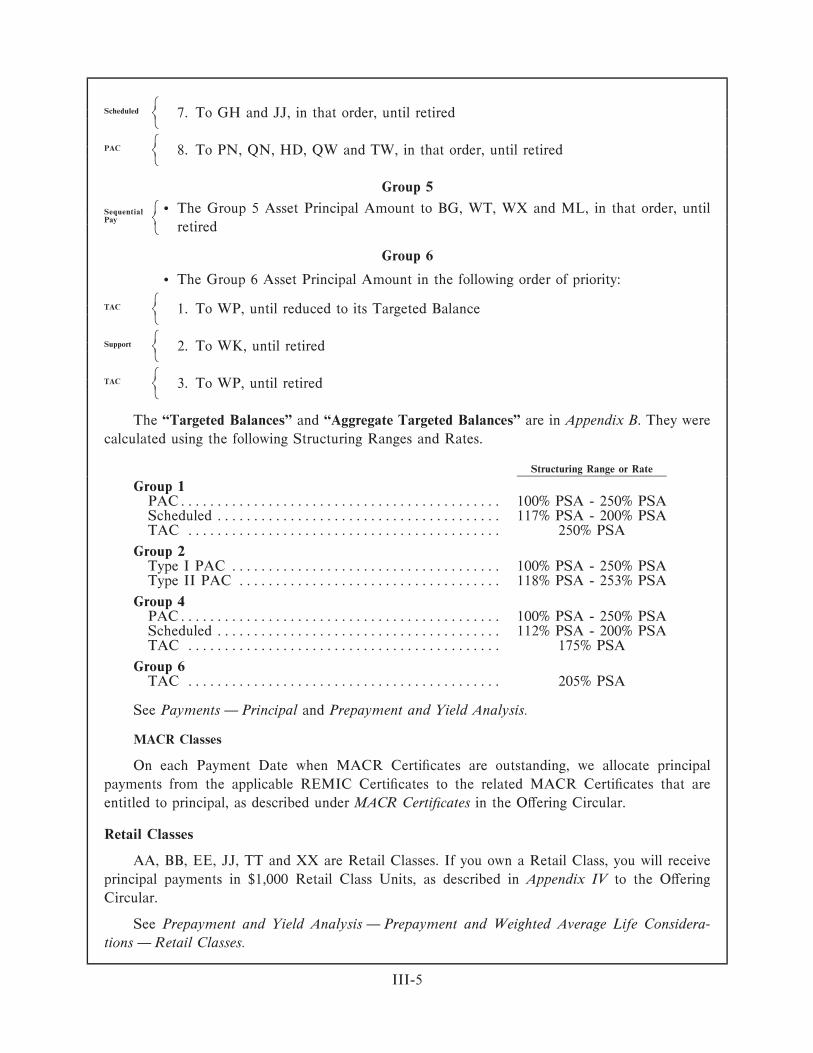
A
ScheduledB 7. To GH and JJ, in that order, until retiredD
A
PACB 8. To PN, QN, HD, QW and TW, in that order, until retiredD
Group 5
A ‚ The Group 5 Asset Principal Amount to BG, WT, WX and ML, in that order, untilSequentialBPay
retiredD
Group 6
‚ The Group 6 Asset Principal Amount in the following order of priority:
A
TACB 1. To WP, until reduced to its Targeted BalanceD
A
SupportB 2. To WK, until retiredD
A
TACB 3. To WP, until retiredD
The ""Targeted Balances'' and ""Aggregate Targeted Balances'' are in Appendix B. They were
calculated using the following Structuring Ranges and Rates.
Structuring Range or Rate
Group 1PACÏÏÏÏÏÏÏÏÏÏÏÏÏÏÏÏÏÏÏÏÏÏÏÏÏÏÏÏÏÏÏÏÏÏÏÏÏÏÏÏÏÏÏÏ 100% PSA - 250% PSAScheduled ÏÏÏÏÏÏÏÏÏÏÏÏÏÏÏÏÏÏÏÏÏÏÏÏÏÏÏÏÏÏÏÏÏÏÏÏÏÏÏ 117% PSA - 200% PSATAC ÏÏÏÏÏÏÏÏÏÏÏÏÏÏÏÏÏÏÏÏÏÏÏÏÏÏÏÏÏÏÏÏÏÏÏÏÏÏÏÏÏÏÏ 250% PSA
Group 2Type I PAC ÏÏÏÏÏÏÏÏÏÏÏÏÏÏÏÏÏÏÏÏÏÏÏÏÏÏÏÏÏÏÏÏÏÏÏÏÏ 100% PSA - 250% PSAType II PAC ÏÏÏÏÏÏÏÏÏÏÏÏÏÏÏÏÏÏÏÏÏÏÏÏÏÏÏÏÏÏÏÏÏÏÏÏ 118% PSA - 253% PSA
Group 4PACÏÏÏÏÏÏÏÏÏÏÏÏÏÏÏÏÏÏÏÏÏÏÏÏÏÏÏÏÏÏÏÏÏÏÏÏÏÏÏÏÏÏÏÏ 100% PSA - 250% PSAScheduled ÏÏÏÏÏÏÏÏÏÏÏÏÏÏÏÏÏÏÏÏÏÏÏÏÏÏÏÏÏÏÏÏÏÏÏÏÏÏÏ 112% PSA - 200% PSATAC ÏÏÏÏÏÏÏÏÏÏÏÏÏÏÏÏÏÏÏÏÏÏÏÏÏÏÏÏÏÏÏÏÏÏÏÏÏÏÏÏÏÏÏ 175% PSA
Group 6TAC ÏÏÏÏÏÏÏÏÏÏÏÏÏÏÏÏÏÏÏÏÏÏÏÏÏÏÏÏÏÏÏÏÏÏÏÏÏÏÏÏÏÏÏ 205% PSA
See Payments Ì Principal and Prepayment and Yield Analysis.
MACR Classes
On each Payment Date when MACR CertiÑcates are outstanding, we allocate principal
payments from the applicable REMIC CertiÑcates to the related MACR CertiÑcates that are
entitled to principal, as described under MACR CertiÑcates in the OÅering Circular.
Retail Classes
AA, BB, EE, JJ, TT and XX are Retail Classes. If you own a Retail Class, you will receive
principal payments in $1,000 Retail Class Units, as described in Appendix IV to the OÅering
Circular.
See Prepayment and Yield Analysis Ì Prepayment and Weighted Average Life Considera-
tions Ì Retail Classes.
III-5
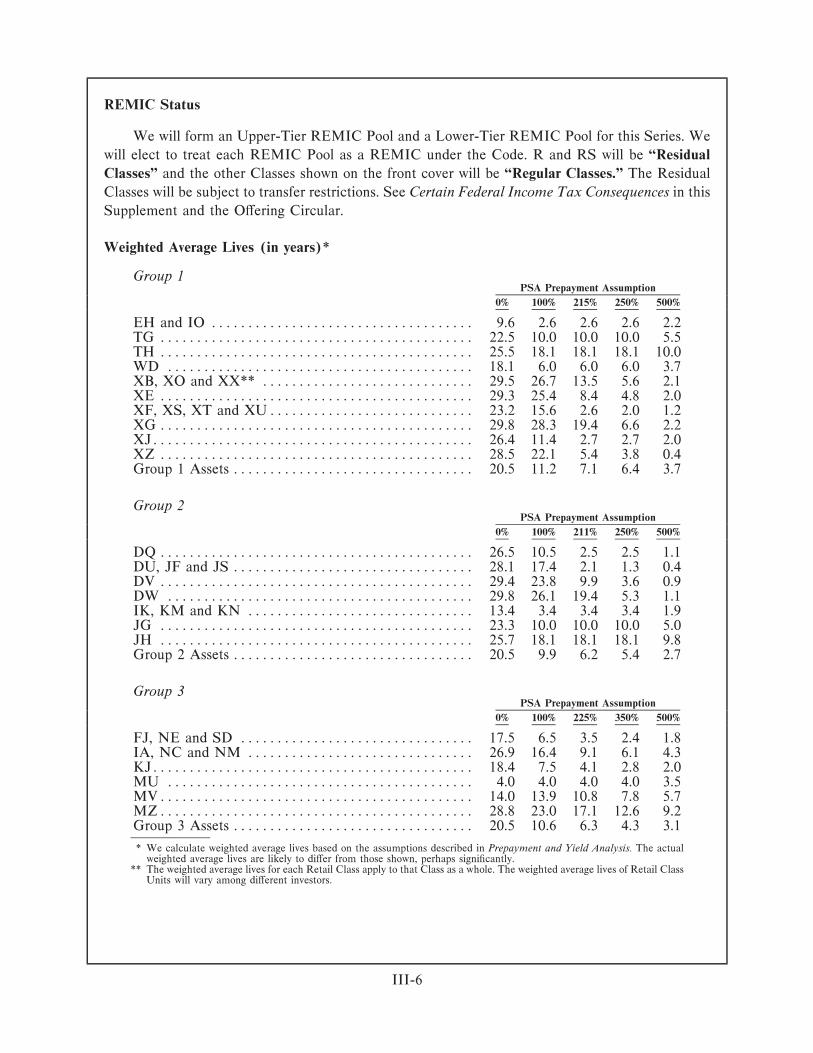
REMIC Status
We will form an Upper-Tier REMIC Pool and a Lower-Tier REMIC Pool for this Series. We
will elect to treat each REMIC Pool as a REMIC under the Code. R and RS will be ""Residual
Classes'' and the other Classes shown on the front cover will be ""Regular Classes.'' The Residual
Classes will be subject to transfer restrictions. See Certain Federal Income Tax Consequences in this
Supplement and the OÅering Circular.
Weighted Average Lives (in years)*
Group 1PSA Prepayment Assumption
0% 100% 215% 250% 500%
EH and IO ÏÏÏÏÏÏÏÏÏÏÏÏÏÏÏÏÏÏÏÏÏÏÏÏÏÏÏÏÏÏÏÏÏÏÏÏ 9.6 2.6 2.6 2.6 2.2TG ÏÏÏÏÏÏÏÏÏÏÏÏÏÏÏÏÏÏÏÏÏÏÏÏÏÏÏÏÏÏÏÏÏÏÏÏÏÏÏÏÏÏÏ 22.5 10.0 10.0 10.0 5.5TH ÏÏÏÏÏÏÏÏÏÏÏÏÏÏÏÏÏÏÏÏÏÏÏÏÏÏÏÏÏÏÏÏÏÏÏÏÏÏÏÏÏÏÏ 25.5 18.1 18.1 18.1 10.0WD ÏÏÏÏÏÏÏÏÏÏÏÏÏÏÏÏÏÏÏÏÏÏÏÏÏÏÏÏÏÏÏÏÏÏÏÏÏÏÏÏÏÏ 18.1 6.0 6.0 6.0 3.7XB, XO and XX** ÏÏÏÏÏÏÏÏÏÏÏÏÏÏÏÏÏÏÏÏÏÏÏÏÏÏÏÏÏ 29.5 26.7 13.5 5.6 2.1XE ÏÏÏÏÏÏÏÏÏÏÏÏÏÏÏÏÏÏÏÏÏÏÏÏÏÏÏÏÏÏÏÏÏÏÏÏÏÏÏÏÏÏÏ 29.3 25.4 8.4 4.8 2.0XF, XS, XT and XUÏÏÏÏÏÏÏÏÏÏÏÏÏÏÏÏÏÏÏÏÏÏÏÏÏÏÏÏ 23.2 15.6 2.6 2.0 1.2XG ÏÏÏÏÏÏÏÏÏÏÏÏÏÏÏÏÏÏÏÏÏÏÏÏÏÏÏÏÏÏÏÏÏÏÏÏÏÏÏÏÏÏÏ 29.8 28.3 19.4 6.6 2.2XJÏÏÏÏÏÏÏÏÏÏÏÏÏÏÏÏÏÏÏÏÏÏÏÏÏÏÏÏÏÏÏÏÏÏÏÏÏÏÏÏÏÏÏÏ 26.4 11.4 2.7 2.7 2.0XZ ÏÏÏÏÏÏÏÏÏÏÏÏÏÏÏÏÏÏÏÏÏÏÏÏÏÏÏÏÏÏÏÏÏÏÏÏÏÏÏÏÏÏÏ 28.5 22.1 5.4 3.8 0.4Group 1 Assets ÏÏÏÏÏÏÏÏÏÏÏÏÏÏÏÏÏÏÏÏÏÏÏÏÏÏÏÏÏÏÏÏÏ 20.5 11.2 7.1 6.4 3.7
Group 2PSA Prepayment Assumption
0% 100% 211% 250% 500%
DQ ÏÏÏÏÏÏÏÏÏÏÏÏÏÏÏÏÏÏÏÏÏÏÏÏÏÏÏÏÏÏÏÏÏÏÏÏÏÏÏÏÏÏÏ 26.5 10.5 2.5 2.5 1.1DU, JF and JS ÏÏÏÏÏÏÏÏÏÏÏÏÏÏÏÏÏÏÏÏÏÏÏÏÏÏÏÏÏÏÏÏÏ 28.1 17.4 2.1 1.3 0.4DV ÏÏÏÏÏÏÏÏÏÏÏÏÏÏÏÏÏÏÏÏÏÏÏÏÏÏÏÏÏÏÏÏÏÏÏÏÏÏÏÏÏÏÏ 29.4 23.8 9.9 3.6 0.9DW ÏÏÏÏÏÏÏÏÏÏÏÏÏÏÏÏÏÏÏÏÏÏÏÏÏÏÏÏÏÏÏÏÏÏÏÏÏÏÏÏÏÏ 29.8 26.1 19.4 5.3 1.1IK, KM and KN ÏÏÏÏÏÏÏÏÏÏÏÏÏÏÏÏÏÏÏÏÏÏÏÏÏÏÏÏÏÏÏ 13.4 3.4 3.4 3.4 1.9JG ÏÏÏÏÏÏÏÏÏÏÏÏÏÏÏÏÏÏÏÏÏÏÏÏÏÏÏÏÏÏÏÏÏÏÏÏÏÏÏÏÏÏÏ 23.3 10.0 10.0 10.0 5.0JH ÏÏÏÏÏÏÏÏÏÏÏÏÏÏÏÏÏÏÏÏÏÏÏÏÏÏÏÏÏÏÏÏÏÏÏÏÏÏÏÏÏÏÏ 25.7 18.1 18.1 18.1 9.8Group 2 Assets ÏÏÏÏÏÏÏÏÏÏÏÏÏÏÏÏÏÏÏÏÏÏÏÏÏÏÏÏÏÏÏÏÏ 20.5 9.9 6.2 5.4 2.7
Group 3PSA Prepayment Assumption
0% 100% 225% 350% 500%
FJ, NE and SD ÏÏÏÏÏÏÏÏÏÏÏÏÏÏÏÏÏÏÏÏÏÏÏÏÏÏÏÏÏÏÏÏ 17.5 6.5 3.5 2.4 1.8IA, NC and NM ÏÏÏÏÏÏÏÏÏÏÏÏÏÏÏÏÏÏÏÏÏÏÏÏÏÏÏÏÏÏÏ 26.9 16.4 9.1 6.1 4.3KJÏÏÏÏÏÏÏÏÏÏÏÏÏÏÏÏÏÏÏÏÏÏÏÏÏÏÏÏÏÏÏÏÏÏÏÏÏÏÏÏÏÏÏÏ 18.4 7.5 4.1 2.8 2.0MU ÏÏÏÏÏÏÏÏÏÏÏÏÏÏÏÏÏÏÏÏÏÏÏÏÏÏÏÏÏÏÏÏÏÏÏÏÏÏÏÏÏÏ 4.0 4.0 4.0 4.0 3.5MVÏÏÏÏÏÏÏÏÏÏÏÏÏÏÏÏÏÏÏÏÏÏÏÏÏÏÏÏÏÏÏÏÏÏÏÏÏÏÏÏÏÏÏ 14.0 13.9 10.8 7.8 5.7MZÏÏÏÏÏÏÏÏÏÏÏÏÏÏÏÏÏÏÏÏÏÏÏÏÏÏÏÏÏÏÏÏÏÏÏÏÏÏÏÏÏÏÏ 28.8 23.0 17.1 12.6 9.2Group 3 Assets ÏÏÏÏÏÏÏÏÏÏÏÏÏÏÏÏÏÏÏÏÏÏÏÏÏÏÏÏÏÏÏÏÏ 20.5 10.6 6.3 4.3 3.1
* We calculate weighted average lives based on the assumptions described in Prepayment and Yield Analysis. The actualweighted average lives are likely to diÅer from those shown, perhaps signiÑcantly.
** The weighted average lives for each Retail Class apply to that Class as a whole. The weighted average lives of Retail ClassUnits will vary among diÅerent investors.
III-6
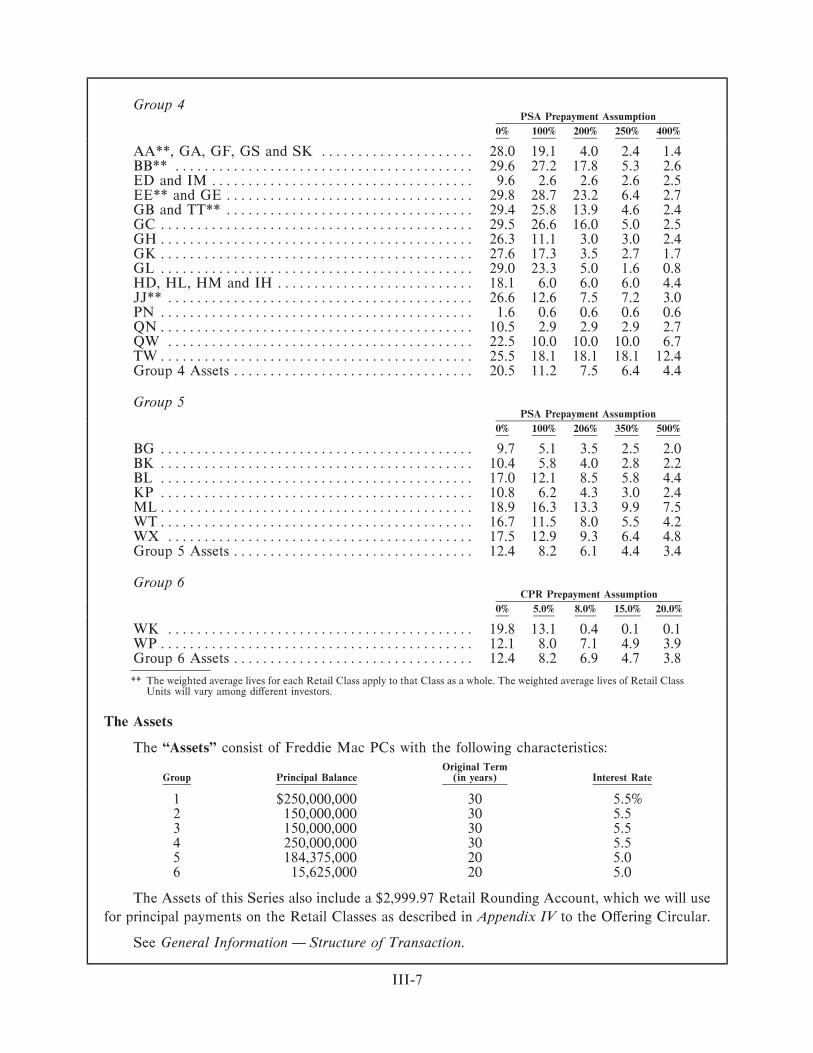
Group 4PSA Prepayment Assumption
0% 100% 200% 250% 400%
AA**, GA, GF, GS and SK ÏÏÏÏÏÏÏÏÏÏÏÏÏÏÏÏÏÏÏÏÏ 28.0 19.1 4.0 2.4 1.4BB** ÏÏÏÏÏÏÏÏÏÏÏÏÏÏÏÏÏÏÏÏÏÏÏÏÏÏÏÏÏÏÏÏÏÏÏÏÏÏÏÏÏ 29.6 27.2 17.8 5.3 2.6ED and IM ÏÏÏÏÏÏÏÏÏÏÏÏÏÏÏÏÏÏÏÏÏÏÏÏÏÏÏÏÏÏÏÏÏÏÏÏ 9.6 2.6 2.6 2.6 2.5EE** and GE ÏÏÏÏÏÏÏÏÏÏÏÏÏÏÏÏÏÏÏÏÏÏÏÏÏÏÏÏÏÏÏÏÏÏ 29.8 28.7 23.2 6.4 2.7GB and TT** ÏÏÏÏÏÏÏÏÏÏÏÏÏÏÏÏÏÏÏÏÏÏÏÏÏÏÏÏÏÏÏÏÏÏ 29.4 25.8 13.9 4.6 2.4GC ÏÏÏÏÏÏÏÏÏÏÏÏÏÏÏÏÏÏÏÏÏÏÏÏÏÏÏÏÏÏÏÏÏÏÏÏÏÏÏÏÏÏÏ 29.5 26.6 16.0 5.0 2.5GHÏÏÏÏÏÏÏÏÏÏÏÏÏÏÏÏÏÏÏÏÏÏÏÏÏÏÏÏÏÏÏÏÏÏÏÏÏÏÏÏÏÏÏ 26.3 11.1 3.0 3.0 2.4GK ÏÏÏÏÏÏÏÏÏÏÏÏÏÏÏÏÏÏÏÏÏÏÏÏÏÏÏÏÏÏÏÏÏÏÏÏÏÏÏÏÏÏÏ 27.6 17.3 3.5 2.7 1.7GL ÏÏÏÏÏÏÏÏÏÏÏÏÏÏÏÏÏÏÏÏÏÏÏÏÏÏÏÏÏÏÏÏÏÏÏÏÏÏÏÏÏÏÏ 29.0 23.3 5.0 1.6 0.8HD, HL, HM and IH ÏÏÏÏÏÏÏÏÏÏÏÏÏÏÏÏÏÏÏÏÏÏÏÏÏÏÏ 18.1 6.0 6.0 6.0 4.4JJ** ÏÏÏÏÏÏÏÏÏÏÏÏÏÏÏÏÏÏÏÏÏÏÏÏÏÏÏÏÏÏÏÏÏÏÏÏÏÏÏÏÏÏ 26.6 12.6 7.5 7.2 3.0PN ÏÏÏÏÏÏÏÏÏÏÏÏÏÏÏÏÏÏÏÏÏÏÏÏÏÏÏÏÏÏÏÏÏÏÏÏÏÏÏÏÏÏÏ 1.6 0.6 0.6 0.6 0.6QNÏÏÏÏÏÏÏÏÏÏÏÏÏÏÏÏÏÏÏÏÏÏÏÏÏÏÏÏÏÏÏÏÏÏÏÏÏÏÏÏÏÏÏ 10.5 2.9 2.9 2.9 2.7QW ÏÏÏÏÏÏÏÏÏÏÏÏÏÏÏÏÏÏÏÏÏÏÏÏÏÏÏÏÏÏÏÏÏÏÏÏÏÏÏÏÏÏ 22.5 10.0 10.0 10.0 6.7TWÏÏÏÏÏÏÏÏÏÏÏÏÏÏÏÏÏÏÏÏÏÏÏÏÏÏÏÏÏÏÏÏÏÏÏÏÏÏÏÏÏÏÏ 25.5 18.1 18.1 18.1 12.4Group 4 Assets ÏÏÏÏÏÏÏÏÏÏÏÏÏÏÏÏÏÏÏÏÏÏÏÏÏÏÏÏÏÏÏÏÏ 20.5 11.2 7.5 6.4 4.4
Group 5PSA Prepayment Assumption
0% 100% 206% 350% 500%
BG ÏÏÏÏÏÏÏÏÏÏÏÏÏÏÏÏÏÏÏÏÏÏÏÏÏÏÏÏÏÏÏÏÏÏÏÏÏÏÏÏÏÏÏ 9.7 5.1 3.5 2.5 2.0BK ÏÏÏÏÏÏÏÏÏÏÏÏÏÏÏÏÏÏÏÏÏÏÏÏÏÏÏÏÏÏÏÏÏÏÏÏÏÏÏÏÏÏÏ 10.4 5.8 4.0 2.8 2.2BL ÏÏÏÏÏÏÏÏÏÏÏÏÏÏÏÏÏÏÏÏÏÏÏÏÏÏÏÏÏÏÏÏÏÏÏÏÏÏÏÏÏÏÏ 17.0 12.1 8.5 5.8 4.4KP ÏÏÏÏÏÏÏÏÏÏÏÏÏÏÏÏÏÏÏÏÏÏÏÏÏÏÏÏÏÏÏÏÏÏÏÏÏÏÏÏÏÏÏ 10.8 6.2 4.3 3.0 2.4MLÏÏÏÏÏÏÏÏÏÏÏÏÏÏÏÏÏÏÏÏÏÏÏÏÏÏÏÏÏÏÏÏÏÏÏÏÏÏÏÏÏÏÏ 18.9 16.3 13.3 9.9 7.5WTÏÏÏÏÏÏÏÏÏÏÏÏÏÏÏÏÏÏÏÏÏÏÏÏÏÏÏÏÏÏÏÏÏÏÏÏÏÏÏÏÏÏÏ 16.7 11.5 8.0 5.5 4.2WX ÏÏÏÏÏÏÏÏÏÏÏÏÏÏÏÏÏÏÏÏÏÏÏÏÏÏÏÏÏÏÏÏÏÏÏÏÏÏÏÏÏÏ 17.5 12.9 9.3 6.4 4.8Group 5 Assets ÏÏÏÏÏÏÏÏÏÏÏÏÏÏÏÏÏÏÏÏÏÏÏÏÏÏÏÏÏÏÏÏÏ 12.4 8.2 6.1 4.4 3.4
Group 6CPR Prepayment Assumption
0% 5.0% 8.0% 15.0% 20.0%
WK ÏÏÏÏÏÏÏÏÏÏÏÏÏÏÏÏÏÏÏÏÏÏÏÏÏÏÏÏÏÏÏÏÏÏÏÏÏÏÏÏÏÏ 19.8 13.1 0.4 0.1 0.1WPÏÏÏÏÏÏÏÏÏÏÏÏÏÏÏÏÏÏÏÏÏÏÏÏÏÏÏÏÏÏÏÏÏÏÏÏÏÏÏÏÏÏÏ 12.1 8.0 7.1 4.9 3.9Group 6 Assets ÏÏÏÏÏÏÏÏÏÏÏÏÏÏÏÏÏÏÏÏÏÏÏÏÏÏÏÏÏÏÏÏÏ 12.4 8.2 6.9 4.7 3.8
** The weighted average lives for each Retail Class apply to that Class as a whole. The weighted average lives of Retail ClassUnits will vary among diÅerent investors.
The Assets
The ""Assets'' consist of Freddie Mac PCs with the following characteristics:Original Term
Group Principal Balance (in years) Interest Rate
1 $250,000,000 30 5.5%2 150,000,000 30 5.53 150,000,000 30 5.54 250,000,000 30 5.55 184,375,000 20 5.06 15,625,000 20 5.0
The Assets of this Series also include a $2,999.97 Retail Rounding Account, which we will use
for principal payments on the Retail Classes as described in Appendix IV to the OÅering Circular.
See General Information Ì Structure of Transaction.
III-7
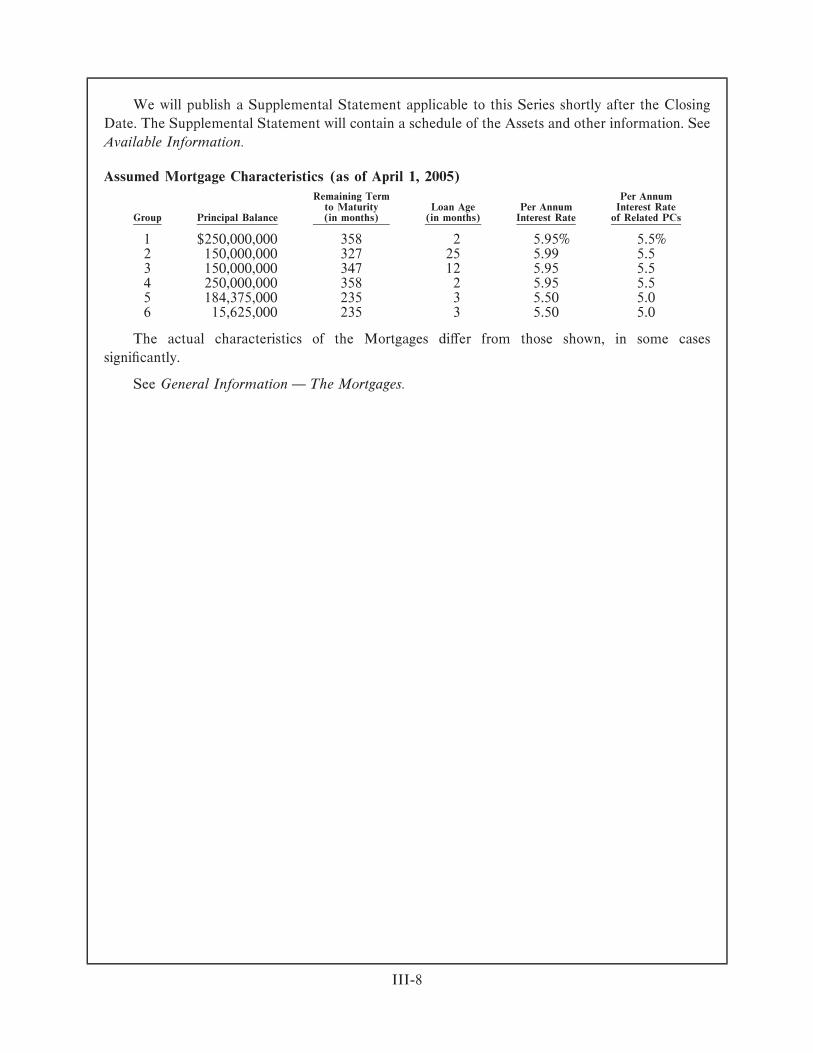
We will publish a Supplemental Statement applicable to this Series shortly after the Closing
Date. The Supplemental Statement will contain a schedule of the Assets and other information. See
Available Information.
Assumed Mortgage Characteristics (as of April 1, 2005)
Remaining Term Per Annumto Maturity Loan Age Per Annum Interest Rate
Group Principal Balance (in months) (in months) Interest Rate of Related PCs
1 $250,000,000 358 2 5.95% 5.5%2 150,000,000 327 25 5.99 5.53 150,000,000 347 12 5.95 5.54 250,000,000 358 2 5.95 5.55 184,375,000 235 3 5.50 5.06 15,625,000 235 3 5.50 5.0
The actual characteristics of the Mortgages diÅer from those shown, in some cases
signiÑcantly.
See General Information Ì The Mortgages.
III-8

Exhibit IV Ì Series R001 Front Cover and Terms Sheet
OÅering Circular Supplement $3,037,974,684(To OÅering CircularDated June 1, 2003)
Freddie MacReference REMICSM
Series R001
OÅered Classes: REMIC Classes shown below, Call Class shown on page S-3 and MACR Classes shownon Appendix A
OÅering Terms: The underwriters named below are oÅering the Classes in negotiated transactions atvarying prices
Closing Date: April 13, 2005
REMIC Original Principal Class Interest CUSIP Final PaymentClasses Balance Type(1) Coupon Type(1) Number Date
A ÏÏÏÏÏÏÏÏÏÏÏÏÏÏÏÏÏÏÏÏÏÏÏÏÏ $2,400,000,000 GMC/SEQ 5.0% FIX 31395RAL2 April 15, 2015AX(2) ÏÏÏÏÏÏÏÏÏÏÏÏÏÏÏÏÏÏÏÏÏ 2,400,000,000 SEQ 5.0 FIX 31395RB80 April 15, 2018BÏÏÏÏÏÏÏÏÏÏÏÏÏÏÏÏÏÏÏÏÏÏÏÏÏÏ 637,974,684 SEQ 5.0 FIX 31395RBA5 April 15, 2020RÏÏÏÏÏÏÏÏÏÏÏÏÏÏÏÏÏÏÏÏÏÏÏÏÏÏ 0 NPR 0.0 NPR 31395RBB3 April 15, 2020RA ÏÏÏÏÏÏÏÏÏÏÏÏÏÏÏÏÏÏÏÏÏÏÏÏ 0 NPR 0.0 NPR 31395RBC1 April 15, 2015
(1) See Appendix II to the OÅering Circular.(2) This Class backs the Guaranteed Maturity Class and will not be oÅered initially. See Terms Sheet Ì Guaranteed Maturity Class.
The CertiÑcates may not be suitable investments for you. You should not purchase CertiÑcates unless you have
carefully considered and are able to bear the associated prepayment, interest rate, yield and market risks of
investing in them. Certain Risk Considerations on page S-2 highlights some of these risks.
You should purchase CertiÑcates only if you have read and understood this Supplement, the attached OÅering
Circular and the documents listed under Available Information.
We guarantee principal and interest payments on the CertiÑcates and the proceeds due on the Call Class upon
exercise of the Call Right. These payments and proceeds are not guaranteed by and are not debts or obligations
of the United States or any federal agency or instrumentality other than Freddie Mac. The CertiÑcates are not
tax-exempt. Because of applicable securities law exemptions, we have not registered the CertiÑcates with any
federal or state securities commission. No securities commission has reviewed this Supplement.
Lead Underwriters
Lehman Brothers Morgan Stanley UBS Investment Bank
Co-Underwriters
Banc of America Securities LLC Bear, Stearns & Co. Inc. CitigroupCredit Suisse First Boston Deutsche Bank Securities Goldman, Sachs & Co.
RBS Greenwich Capital
April 7, 2005
IV-1

TERMS SHEET
This Terms Sheet contains selected information about this Series. You should refer to the
remainder of this Supplement for further information.
In this Supplement, we refer to Classes only by their letter designations. For example, ""R''
refers to the R Class of this Series.
Payment Dates
We make payments of principal and interest on the CertiÑcates on each monthly Payment Date
beginning in May 2005.
Form of Classes
Regular and MACR Classes: Book-entry on Fed System
Residual and Call Classes: CertiÑcated
Guaranteed Maturity Class
The Call Class, Callable Class and Underlying REMIC Class related to the Guaranteed
Maturity Class shown on the front cover are shown below.
Call Underlying GuaranteedClass CUSIP Number REMIC Class Callable Class Maturity Class Final Payment Date
A1 31395RAM0 AX AY A April 15, 2015
The Holder of the Call Class may direct Freddie Mac to redeem the Guaranteed Maturity
Class on its Final Payment Date and acquire the Underlying REMIC Class.
See Appendix VI to the OÅering Circular and General Information Ì Structure of
Transaction.
Interest
The Fixed Rate Classes bear interest at the Class Coupons shown on the front cover and
Appendix A.
AP is a Principal Only Class and does not bear interest.
See Payments Ì Interest.
IV-2
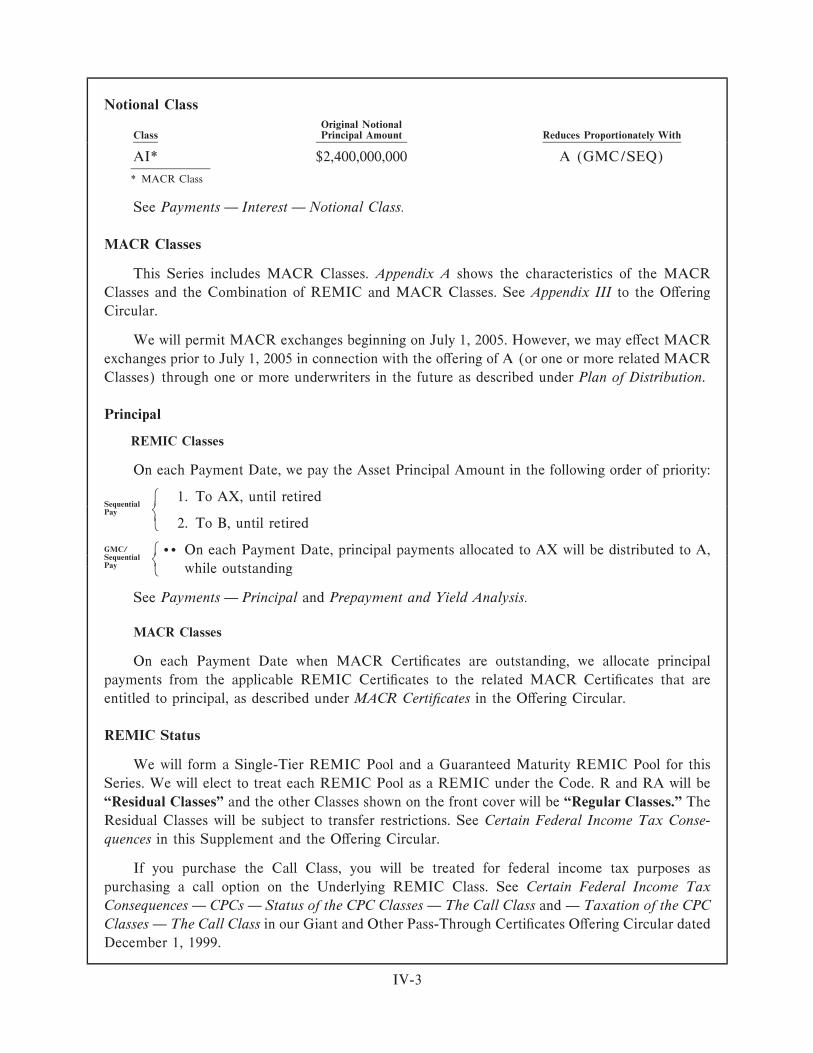
Notional Class
Original NotionalClass Principal Amount Reduces Proportionately With
AI* $2,400,000,000 A (GMC/SEQ)
* MACR Class
See Payments Ì Interest Ì Notional Class.
MACR Classes
This Series includes MACR Classes. Appendix A shows the characteristics of the MACR
Classes and the Combination of REMIC and MACR Classes. See Appendix III to the OÅering
Circular.
We will permit MACR exchanges beginning on July 1, 2005. However, we may eÅect MACR
exchanges prior to July 1, 2005 in connection with the oÅering of A (or one or more related MACR
Classes) through one or more underwriters in the future as described under Plan of Distribution.
Principal
REMIC Classes
On each Payment Date, we pay the Asset Principal Amount in the following order of priority:
A 1. To AX, until retiredSequential
BPay
2. To B, until retiredD
AGMC/ ‚‚ On each Payment Date, principal payments allocated to AX will be distributed to A,Sequential
B
Pay while outstandingD
See Payments Ì Principal and Prepayment and Yield Analysis.
MACR Classes
On each Payment Date when MACR CertiÑcates are outstanding, we allocate principal
payments from the applicable REMIC CertiÑcates to the related MACR CertiÑcates that are
entitled to principal, as described under MACR CertiÑcates in the OÅering Circular.
REMIC Status
We will form a Single-Tier REMIC Pool and a Guaranteed Maturity REMIC Pool for this
Series. We will elect to treat each REMIC Pool as a REMIC under the Code. R and RA will be
""Residual Classes'' and the other Classes shown on the front cover will be ""Regular Classes.'' The
Residual Classes will be subject to transfer restrictions. See Certain Federal Income Tax Conse-
quences in this Supplement and the OÅering Circular.
If you purchase the Call Class, you will be treated for federal income tax purposes as
purchasing a call option on the Underlying REMIC Class. See Certain Federal Income Tax
Consequences Ì CPCs Ì Status of the CPC Classes Ì The Call Class and Ì Taxation of the CPC
Classes Ì The Call Class in our Giant and Other Pass-Through CertiÑcates OÅering Circular dated
December 1, 1999.
IV-3
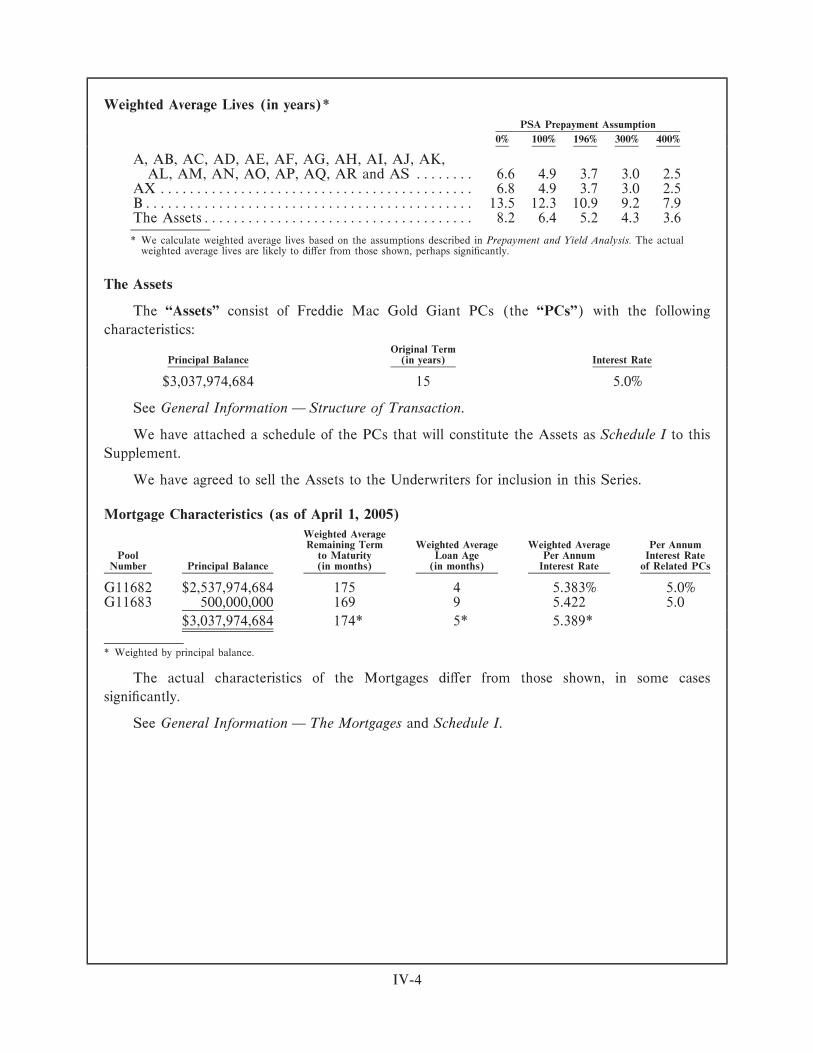
Weighted Average Lives (in years)*
PSA Prepayment Assumption
0% 100% 196% 300% 400%
A, AB, AC, AD, AE, AF, AG, AH, AI, AJ, AK,AL, AM, AN, AO, AP, AQ, AR and AS ÏÏÏÏÏÏÏÏ 6.6 4.9 3.7 3.0 2.5
AX ÏÏÏÏÏÏÏÏÏÏÏÏÏÏÏÏÏÏÏÏÏÏÏÏÏÏÏÏÏÏÏÏÏÏÏÏÏÏÏÏÏÏÏ 6.8 4.9 3.7 3.0 2.5BÏÏÏÏÏÏÏÏÏÏÏÏÏÏÏÏÏÏÏÏÏÏÏÏÏÏÏÏÏÏÏÏÏÏÏÏÏÏÏÏÏÏÏÏÏ 13.5 12.3 10.9 9.2 7.9The AssetsÏÏÏÏÏÏÏÏÏÏÏÏÏÏÏÏÏÏÏÏÏÏÏÏÏÏÏÏÏÏÏÏÏÏÏÏÏ 8.2 6.4 5.2 4.3 3.6
* We calculate weighted average lives based on the assumptions described in Prepayment and Yield Analysis. The actualweighted average lives are likely to diÅer from those shown, perhaps signiÑcantly.
The Assets
The ""Assets'' consist of Freddie Mac Gold Giant PCs (the ""PCs'') with the following
characteristics:
Original TermPrincipal Balance (in years) Interest Rate
$3,037,974,684 15 5.0%
See General Information Ì Structure of Transaction.
We have attached a schedule of the PCs that will constitute the Assets as Schedule I to this
Supplement.
We have agreed to sell the Assets to the Underwriters for inclusion in this Series.
Mortgage Characteristics (as of April 1, 2005)
Weighted AverageRemaining Term Weighted Average Weighted Average Per Annum
Pool to Maturity Loan Age Per Annum Interest RateNumber Principal Balance (in months) (in months) Interest Rate of Related PCs
G11682 $2,537,974,684 175 4 5.383% 5.0%G11683 500,000,000 169 9 5.422 5.0
$3,037,974,684 174* 5* 5.389*
* Weighted by principal balance.
The actual characteristics of the Mortgages diÅer from those shown, in some cases
signiÑcantly.
See General Information Ì The Mortgages and Schedule I.
IV-4
If you intend to purchase CertiÑcates, you shouldrely only on the information in this Supplementand the OÅering Circular, including the informa-tion in the disclosure documents that we have $942,605,008incorporated by reference. We have not authorizedanyone to provide you with diÅerent information.
This Supplement, the OÅering Circular and theincorporated documents may not be correct after Freddie Mactheir dates.
We are not oÅering the CertiÑcates in any juris-diction that prohibits their oÅer. Multiclass CertiÑcates,
Series 2979
TABLE OF CONTENTSDescription Page
OÅering Circular Supplement
Certain Risk Considerations ÏÏÏÏÏÏÏÏÏÏÏÏÏÏÏÏÏÏÏÏÏÏÏÏÏÏÏÏÏÏÏÏÏ S-2Terms Sheet ÏÏÏÏÏÏÏÏÏÏÏÏÏÏÏÏÏÏÏÏÏÏÏÏÏÏÏÏÏÏÏÏÏÏÏÏÏÏÏÏÏÏÏÏÏÏ S-3Available InformationÏÏÏÏÏÏÏÏÏÏÏÏÏÏÏÏÏÏÏÏÏÏÏÏÏÏÏÏÏÏÏÏÏÏÏÏÏÏÏ S-12General Information ÏÏÏÏÏÏÏÏÏÏÏÏÏÏÏÏÏÏÏÏÏÏÏÏÏÏÏÏÏÏÏÏÏÏÏÏÏÏÏÏ S-12
The Agreement ÏÏÏÏÏÏÏÏÏÏÏÏÏÏÏÏÏÏÏÏÏÏÏÏÏÏÏÏÏÏÏÏÏÏÏÏÏÏÏÏ S-12Form of CertiÑcates ÏÏÏÏÏÏÏÏÏÏÏÏÏÏÏÏÏÏÏÏÏÏÏÏÏÏÏÏÏÏÏÏÏÏÏÏ S-13Denominations of CertiÑcates ÏÏÏÏÏÏÏÏÏÏÏÏÏÏÏÏÏÏÏÏÏÏÏÏÏÏÏÏ S-13Structure of TransactionÏÏÏÏÏÏÏÏÏÏÏÏÏÏÏÏÏÏÏÏÏÏÏÏÏÏÏÏÏÏÏÏÏ S-13The Mortgages ÏÏÏÏÏÏÏÏÏÏÏÏÏÏÏÏÏÏÏÏÏÏÏÏÏÏÏÏÏÏÏÏÏÏÏÏÏÏÏÏ S-14
Payments ÏÏÏÏÏÏÏÏÏÏÏÏÏÏÏÏÏÏÏÏÏÏÏÏÏÏÏÏÏÏÏÏÏÏÏÏÏÏÏÏÏÏÏÏÏÏÏÏÏ S-14Payment Dates; Record DatesÏÏÏÏÏÏÏÏÏÏÏÏÏÏÏÏÏÏÏÏÏÏÏÏÏÏÏÏ S-14Method of Payment ÏÏÏÏÏÏÏÏÏÏÏÏÏÏÏÏÏÏÏÏÏÏÏÏÏÏÏÏÏÏÏÏÏÏÏÏ S-14Categories of Classes ÏÏÏÏÏÏÏÏÏÏÏÏÏÏÏÏÏÏÏÏÏÏÏÏÏÏÏÏÏÏÏÏÏÏÏ S-15InterestÏÏÏÏÏÏÏÏÏÏÏÏÏÏÏÏÏÏÏÏÏÏÏÏÏÏÏÏÏÏÏÏÏÏÏÏÏÏÏÏÏÏÏÏÏÏÏ S-15PrincipalÏÏÏÏÏÏÏÏÏÏÏÏÏÏÏÏÏÏÏÏÏÏÏÏÏÏÏÏÏÏÏÏÏÏÏÏÏÏÏÏÏÏÏÏÏÏ S-16Class Factors ÏÏÏÏÏÏÏÏÏÏÏÏÏÏÏÏÏÏÏÏÏÏÏÏÏÏÏÏÏÏÏÏÏÏÏÏÏÏÏÏÏÏ S-17GuaranteesÏÏÏÏÏÏÏÏÏÏÏÏÏÏÏÏÏÏÏÏÏÏÏÏÏÏÏÏÏÏÏÏÏÏÏÏÏÏÏÏÏÏÏÏ S-171% Clean-up Call ÏÏÏÏÏÏÏÏÏÏÏÏÏÏÏÏÏÏÏÏÏÏÏÏÏÏÏÏÏÏÏÏÏÏÏÏÏÏ S-17Residual ProceedsÏÏÏÏÏÏÏÏÏÏÏÏÏÏÏÏÏÏÏÏÏÏÏÏÏÏÏÏÏÏÏÏÏÏÏÏÏÏ S-17
Prepayment and Yield Analysis ÏÏÏÏÏÏÏÏÏÏÏÏÏÏÏÏÏÏÏÏÏÏÏÏÏÏÏÏÏÏ S-17GeneralÏÏÏÏÏÏÏÏÏÏÏÏÏÏÏÏÏÏÏÏÏÏÏÏÏÏÏÏÏÏÏÏÏÏÏÏÏÏÏÏÏÏÏÏÏÏÏ S-17Prepayment and Weighted Average Life Considerations ÏÏÏÏÏÏ S-19Declining Balances TableÏÏÏÏÏÏÏÏÏÏÏÏÏÏÏÏÏÏÏÏÏÏÏÏÏÏÏÏÏÏÏÏ S-22Yield Tables ÏÏÏÏÏÏÏÏÏÏÏÏÏÏÏÏÏÏÏÏÏÏÏÏÏÏÏÏÏÏÏÏÏÏÏÏÏÏÏÏÏÏ S-30
Final Payment Dates ÏÏÏÏÏÏÏÏÏÏÏÏÏÏÏÏÏÏÏÏÏÏÏÏÏÏÏÏÏÏÏÏÏÏÏÏÏÏÏ S-36Certain Federal Income Tax ConsequencesÏÏÏÏÏÏÏÏÏÏÏÏÏÏÏÏÏÏÏÏÏ S-36
GeneralÏÏÏÏÏÏÏÏÏÏÏÏÏÏÏÏÏÏÏÏÏÏÏÏÏÏÏÏÏÏÏÏÏÏÏÏÏÏÏÏÏÏÏÏÏÏÏ S-36Regular ClassesÏÏÏÏÏÏÏÏÏÏÏÏÏÏÏÏÏÏÏÏÏÏÏÏÏÏÏÏÏÏÏÏÏÏÏÏÏÏÏÏ S-36Residual Classes ÏÏÏÏÏÏÏÏÏÏÏÏÏÏÏÏÏÏÏÏÏÏÏÏÏÏÏÏÏÏÏÏÏÏÏÏÏÏÏ S-37MACR Classes ÏÏÏÏÏÏÏÏÏÏÏÏÏÏÏÏÏÏÏÏÏÏÏÏÏÏÏÏÏÏÏÏÏÏÏÏÏÏÏÏ S-38
Legal Investment Considerations ÏÏÏÏÏÏÏÏÏÏÏÏÏÏÏÏÏÏÏÏÏÏÏÏÏÏÏÏÏ S-39ERISA ConsiderationsÏÏÏÏÏÏÏÏÏÏÏÏÏÏÏÏÏÏÏÏÏÏÏÏÏÏÏÏÏÏÏÏÏÏÏÏÏÏ S-39Plan of Distribution ÏÏÏÏÏÏÏÏÏÏÏÏÏÏÏÏÏÏÏÏÏÏÏÏÏÏÏÏÏÏÏÏÏÏÏÏÏÏÏÏ S-39Legal Matters ÏÏÏÏÏÏÏÏÏÏÏÏÏÏÏÏÏÏÏÏÏÏÏÏÏÏÏÏÏÏÏÏÏÏÏÏÏÏÏÏÏÏÏÏÏ S-39Appendix A Ì Available Combinations Ì Series 2957 ÏÏÏÏÏÏÏÏÏÏÏ A-1Appendix B Ì Balances SchedulesÏÏÏÏÏÏÏÏÏÏÏÏÏÏÏÏÏÏÏÏÏÏÏÏÏÏÏÏ B-1Exhibit I Ì Series 2711 Front Cover and Terms SheetÏÏÏÏÏÏÏÏÏÏÏ I-1 UBS Investment BankExhibit II Ì Series 2795 Front Cover and Terms SheetÏÏÏÏÏÏÏÏÏÏ II-1Exhibit III Ì Series 2960 Front Cover and Terms Sheet ÏÏÏÏÏÏÏÏÏ III-1Exhibit IV Ì Series R001 Front Cover and Terms SheetÏÏÏÏÏÏÏÏÏ IV-1
OÅering CircularFreddie Mac ÏÏÏÏÏÏÏÏÏÏÏÏÏÏÏÏÏÏÏÏÏÏÏÏÏÏÏÏÏÏÏÏÏÏÏÏÏÏÏÏÏÏÏÏÏÏ 3Additional InformationÏÏÏÏÏÏÏÏÏÏÏÏÏÏÏÏÏÏÏÏÏÏÏÏÏÏÏÏÏÏÏÏÏÏÏÏÏÏ 3Summary ÏÏÏÏÏÏÏÏÏÏÏÏÏÏÏÏÏÏÏÏÏÏÏÏÏÏÏÏÏÏÏÏÏÏÏÏÏÏÏÏÏÏÏÏÏÏÏÏÏ 4Risk FactorsÏÏÏÏÏÏÏÏÏÏÏÏÏÏÏÏÏÏÏÏÏÏÏÏÏÏÏÏÏÏÏÏÏÏÏÏÏÏÏÏÏÏÏÏÏÏÏ 7Description of CertiÑcates ÏÏÏÏÏÏÏÏÏÏÏÏÏÏÏÏÏÏÏÏÏÏÏÏÏÏÏÏÏÏÏÏÏÏÏ 9MACR CertiÑcatesÏÏÏÏÏÏÏÏÏÏÏÏÏÏÏÏÏÏÏÏÏÏÏÏÏÏÏÏÏÏÏÏÏÏÏÏÏÏÏÏÏ 20Prepayment, Yield and Suitability Considerations ÏÏÏÏÏÏÏÏÏÏÏÏÏÏÏ 21The Agreement ÏÏÏÏÏÏÏÏÏÏÏÏÏÏÏÏÏÏÏÏÏÏÏÏÏÏÏÏÏÏÏÏÏÏÏÏÏÏÏÏÏÏÏÏ 27Certain Federal Income Tax ConsequencesÏÏÏÏÏÏÏÏÏÏÏÏÏÏÏÏÏÏÏÏÏ 30ERISA ConsiderationsÏÏÏÏÏÏÏÏÏÏÏÏÏÏÏÏÏÏÏÏÏÏÏÏÏÏÏÏÏÏÏÏÏÏÏÏÏÏ 45Legal Investment Considerations ÏÏÏÏÏÏÏÏÏÏÏÏÏÏÏÏÏÏÏÏÏÏÏÏÏÏÏÏÏ 45Plan of Distribution ÏÏÏÏÏÏÏÏÏÏÏÏÏÏÏÏÏÏÏÏÏÏÏÏÏÏÏÏÏÏÏÏÏÏÏÏÏÏÏÏ 46 April 18, 2005Increase in SizeÏÏÏÏÏÏÏÏÏÏÏÏÏÏÏÏÏÏÏÏÏÏÏÏÏÏÏÏÏÏÏÏÏÏÏÏÏÏÏÏÏÏÏÏ 46Appendix I Ì Index of Terms ÏÏÏÏÏÏÏÏÏÏÏÏÏÏÏÏÏÏÏÏÏÏÏÏÏÏÏÏÏÏÏ I-1Appendix II Ì Standard DeÑnitions and Abbreviations for Classes II-1Appendix III Ì MACR CertiÑcate Exchanges ÏÏÏÏÏÏÏÏÏÏÏÏÏÏÏÏÏ III-1Appendix IV Ì Retail Class Principal Payments ÏÏÏÏÏÏÏÏÏÏÏÏÏÏÏÏ IV-1Appendix V Ì Interest Rate Indices ÏÏÏÏÏÏÏÏÏÏÏÏÏÏÏÏÏÏÏÏÏÏÏÏÏÏ V-1Appendix VI Ì Guaranteed Maturity and Call Classes;
Redemption and Exchange Procedures ÏÏÏÏÏÏÏÏÏÏÏÏÏÏÏÏÏÏÏÏÏÏ VI-1