FRC City Meeting 6-28-2021 Meeting Packet - State of Michigan
244
72 (Rev. 01-19) STATE OF MICHIGAN DEPARTMENT OF TREASURY GRETCHEN WHITMER RACHAEL EUBANKS GOVERNOR LANSING STATE TREASURER DATE: June 28, 2021 TO: Financial Review Commission Members FROM: Patrick Dostine, Departmental Specialist, Treasury SUBJECT: Year-Four Waiver of Direct FRC Oversight of City of Detroit Executive Summary The Financial Review Commission is required to certify that the statutory conditions of Sec 8(2) of the Michigan Financial Review Commission Act, Act 181 of 2014 (the Act) are met to grant a waiver under the Act. Throughout the third waiver-year, the city has been diligent in providing the Financial Review Commission with timely submissions of information and monthly, quarterly and annual reports as required in Section 3 of Resolution 2018-13. Exhibit A in Resolution 2021-02 details the city’s compliance with the statutory conditions and identifies the supporting documentation outlining the city’s compliance with the Act. Based upon a review of the city’s financial information, submitted reports and discussions during the finance and contracts subcommittee meetings, staff recommends the Financial Review Commission certify that the city of Detroit has met the statutory conditions of Sec. 8(2) and grant the city of Detroit the year-four waiver. Background The Michigan Financial Review Commission Act provides for the active oversight of the city of Detroit for not less than 13 years. The Financial Review Commission’s (FRC) duties and powers in active oversight are detailed in Sections 6 and 7 of the Act. Section 8 sets forth the conditions which, if all are met, require the FRC to annually adopt a resolution granting the waiver and the conditions which, should one occur, require the FRC to rescind the waiver. The Act established the FRC on December 10, 2014 to monitor the city’s compliance with the plan of adjustment (POA) and provide oversight of the city’s financial and operational activities. The FRC granted the city of Detroit the third waiver from active oversight on June 29, 2020. The year- three waiver will expire on June 30, 2021 and, therefore, the year-four waiver is now before the FRC for its consideration. In order for the FRC to certify all the statutory conditions are met to grant the waiver, the city’s (i) Revenues, (ii) Adopted/Adhered to Deficit-Free Budgets, (iii) Adopted Four-Year Financial Plan FY 2022-2025, (iv) Municipal Securities/Debt Obligations, (v) the Retirement Protection Fund (RPF) and Legacy Costs, and (vi) Rainy Day Fund are discussed below to supplement the compliance documents listed in Exhibit A. 430 WEST ALLEGAN STREET • LANSING, MICHIGAN 48922 www.michigan.gov/osrfa • 517-373-3200
-
Upload
khangminh22 -
Category
Documents
-
view
4 -
download
0
Transcript of FRC City Meeting 6-28-2021 Meeting Packet - State of Michigan

72 (Rev. 01-19)
STATE OF MICHIGAN
DEPARTMENT OF TREASURY GRETCHEN WHITMER RACHAEL EUBANKS GOVERNOR LANSING STATE TREASURER
DATE: June 28, 2021
TO: Financial Review Commission Members
FROM: Patrick Dostine, Departmental Specialist, Treasury
SUBJECT: Year-Four Waiver of Direct FRC Oversight of City of Detroit
Executive Summary
The Financial Review Commission is required to certify that the statutory conditions of Sec 8(2) of the Michigan Financial Review Commission Act, Act 181 of 2014 (the Act) are met to grant a waiver under the Act. Throughout the third waiver-year, the city has been diligent in providing the Financial Review Commission with timely submissions of information and monthly, quarterly and annual reports as required in Section 3 of Resolution 2018-13. Exhibit A in Resolution 2021-02 details the city’s compliance with the statutory conditions and identifies the supporting documentation outlining the city’s compliance with the Act. Based upon a review of the city’s financial information, submitted reports and discussions during the finance and contracts subcommittee meetings, staff recommends the Financial Review Commission certify that the city of Detroit has met the statutory conditions of Sec. 8(2) and grant the city of Detroit the year-four waiver.
Background
The Michigan Financial Review Commission Act provides for the active oversight of the city of Detroit for not less than 13 years. The Financial Review Commission’s (FRC) duties and powers in active oversight are detailed in Sections 6 and 7 of the Act. Section 8 sets forth the conditions which, if all are met, require the FRC to annually adopt a resolution granting the waiver and the conditions which, should one occur, require the FRC to rescind the waiver.
The Act established the FRC on December 10, 2014 to monitor the city’s compliance with the plan of adjustment (POA) and provide oversight of the city’s financial and operational activities.
The FRC granted the city of Detroit the third waiver from active oversight on June 29, 2020. The year-three waiver will expire on June 30, 2021 and, therefore, the year-four waiver is now before the FRC for its consideration. In order for the FRC to certify all the statutory conditions are met to grant the waiver, the city’s (i) Revenues, (ii) Adopted/Adhered to Deficit-Free Budgets, (iii) Adopted Four-Year Financial Plan FY 2022-2025, (iv) Municipal Securities/Debt Obligations, (v) the Retirement Protection Fund (RPF) and Legacy Costs, and (vi) Rainy Day Fund are discussed below to supplement the compliance documents listed in Exhibit A.
430 WEST ALLEGAN STREET • LANSING, MICHIGAN 48922 www.michigan.gov/osrfa • 517-373-3200

February 2021 Revenue Estimates, General Fund
Sinmitfions
Februa!}: 2021 Estimates
FY21 FYl2 Change FY23 Change FY2A Change FY2S Change M ajor Taxes
Income Tax s 223.0 s m .6 32.69' s 318.6 1.8" s ll7.8 2.9" s !35.9 H9'
State Revenue Sharing 20U 202.S -0.8" 203.7 0.6,C 204.9 0.6,C 206.1 0.6"
Wagering Tax 103.0 169.8 64.9" 186.7 10.0lC 1B8.6 1.0lC 190.S 1.0lC
Property Tax 129.4 128.7 ,0.59' 131.1 1.9" 1.33.1 1.5" 135.7 2.(f¼
Tax Increment Financing Capture j15.7) j15.3) .2.59' !15,6) 2,0,C !15,9) L9" !162) 1.9.¥ Net Property Tax 113.7 113.4 -0.3" 115.S 1.9" 117~2 1.5" 119.S 2.0,C
Utility Users Tax 40.8 41.0 0.59' 41.2 0.59' 4L 4 0.59' 41.6 0.5" To Public Lighting Authority 112.5) 112.5) 0.09' 112.5) ao,c (12-5) 0.0,C 1125) o.cm
Net Utility Users Tax 28.3 28.S 0.7" 28.7 0.7" 28..9 0.7" 29.1 0.7"
Subtotal, Major Taxes s 6n.1 s 809.8 20.5,C s 853.2 S.4" s 867~4 1.7" s 88L1 1.6"
Other Revenues s 175.S s 185.8 S.9" s 193.1 3.9" s 194..2 0.6,C s 197.5 1.7"
Recurring 171.0 185.8 8.7" 193.1 3.9" 194..2 0.6,C 197..S 1.7"
Non-recurring 4.5 -1000!¥
Grand Total, General Fund s 847.6 s 995.6 11.5" s ~ 046.3 S.1,C s ¼r061..6 1.5" s 1.078.6 J.6"
General Fund, Recurriog Only s 843.1 s 995.6 18.1,C s 1,046.3 S.1,C s ¼r061..6 1.5" s 1,078.6 J.6"
Page 2 June 28, 2021 Financial Review Commission
i. Revenues
The city’s revenue projections in its adopted four-year financial plan (FY2022-2025) utilized the revenue estimates from the February 2021 Revenue Estimating Conference, as required by Public Act 182 of 2014. The estimates include updates for FY 2021–25. Recurring general fund revenues from FY 2021 to FY 2022 increase by 18.1%. This is due to gains in revenues from the wagering tax based on a projected return to pre-COVID-19 baseline revenue for casinos, as well as stabilized income tax collections. The general fund revenue forecast for FY 2023 increases 5.1% over FY 2022 as peak pandemic effects on nonresident remote work and casinos wear off. Revenues such as income tax, wagering tax, and parking enforcement are anticipated to stabilize from the pandemic by FY 2023. The conservative forecasts for FY 2024 and FY 2025 show modest annual revenue growth around 1.5%.
The city returns to its pre-pandemic, revenue peak -- which was FY ’19 -- in FY ’24 ($1,061.6 billion). The city did not include in its forecast revenues from on-line gaming nor the anticipated $826 million from the American Rescue Plan Act of 2021.
Table 1: February 2021 Revenue Estimates, General Fund
Revenue Risks and Potential Upside
Downside Risks ● Slower casino recovery than expected ● Slower than anticipated recovery from recession ● Larger than anticipated nonresident remote work impact ● Longer lasting changes in economic activity due to workplace and behavior changes ● Future state and federal budget pressures causing reductions in local funding
Potential Upside (not counted in current revenue estimates)

Page 3 June 28, 2021 Financial Review Commission
● Residential, commercial, and industrial development activity throughout the City ● Workforce development and labor force participation gains ● Internet gaming and sports betting taxes (launched Jan 2021) ● State-shared excise tax from adult-use marijuana (City authorized in Nov 2020, implementation underway) ● Additional federal fiscal relief and economic stimulus
ii. Adopted/Adhered to Deficit-Free Budgets
Sec. 8 (2)(a) of Act 181 requires the FRC to certify that the city has adopted and adhered to deficit-free budgets for three consecutive years that comply with generally accepted accounting principles and are in accordance with the uniform budgeting and accounting act. FY 20 marks the sixth straight year (FY2015-FY2020) of audited balanced budgets and operating surpluses.
For fiscal year 2020, staff from Treasury’s Community Engagement and Finance Division reviewed the city’s FY 2020 Comprehensive Annual Financial Report (CAFR) for funds with unrestricted deficits. For funds using modified accrual, “unrestricted” fund balance equals the sum of committed, assigned and unassigned balances. The city’s FY 2020 CAFR was reviewed independently by two Treasury staff who arrived at the same conclusion: there were seven funds with unrestricted deficits; however, in accordance with Treasury’s Numbered Letter (NL) 2016-1, no deficit elimination plans are required. See Table 2.
Table 2: Treasury Review of 2020 CAFR for Deficits
Audit Fund Name Fund Type Page Comments Transportation Enterprise 29
DEP not required because Current Assets > Current Liabilities. NL 2016-1, pages 2-4.
Detroit Public Library Component Unit 37 Detroit Transportation Corporation Component Unit 37 Local Development Finance Authority Component Unit 38 Museum of African American History Component Unit 38 Airport Enterprise 190
COVID-19 Revenue Special Revenue 159
DEP not required because Deferred Inflows of Resources >= Unrestricted Deficit. NL 2016-1, page 1.
The audited general fund balance in FY 2020 was $746.3 million, a $54.2 million increase from the fund balance total ($692.1 million) at June 30, 2019.
The general fund had unassigned cumulative fund surplus of $109.1 million at June 30, 2020, a $14.1 million decrease from the $123.2 million surplus at June 30, 2019.
iii. Adopted Four-Year Financial Plan FY 2022-2025

FY2020 FY2021 FY2022 FY2023 FY2024 FY202S Expenditures Actual Adopted Adopted Forecast Forecast Forecast
Salaries & Wages --- 386,333,466 446,180,656 464,140,199 444,559,475 449,780,578 455,106,105 Employee Benefits --- 113,027,890 201,267,084 216,464,891 221,484,286 363,501,281 363,518,614 Professional & Contractual Services --- 66,463,571 79,359,755 73,983,717 73,624,062 73,624,062 73,624,062 Operating Supplies 35,882,117 42,025,235 43,312,662 43,311,462 43,311,462 43,311,462 Operating Services 85,940,286 84,606,237 87,409,243 86,036,108 86,036,108 86,036,108 Equipment Acquisition 2,076,449 37,950 Capital Outlays 117,541 250,000 190,800 190,800 190,800 190,800 Fixed Charges 79,657,672 85,046,628 85,056,650 85,898,752 73,283,661 75,501,217 Other Expenses 237,720,838 85,203,334 84,581,069 90,871,570 94,489,053 93,864,679
Total Expenditures - Recurring 1,007,219,830 1,023,976,879 1,055, 139,231 1,045,976,515 1,184,217,005 1,191,153,047
Expenditures - Non-Recurrln1 Reserves 80,000,000
Other One-Time Expenditures 3,274,123
Total Expenditures - Non-Recurring 83,274,123
Grand Total Expenditures 1,007,219,830 1,023,976,879 1,138,413,354 1,045,976,515 1,184,217,005 1, 191,153,047
FY2020 FY2021 FY2022 FY2023 FY2024 FY202S
Revenues Actual Adopted Adopted Forecast Foree-a.st Forecast
Grants, Shared Taxes, & Revenues 187,233,648 192,182,000 205,265,000 206,466,000 207,654,000 208,866,000 Revenues from Use of Assets 46,385,022 32,781,199 27,154,912 27,059,0 16 26,337,224 25,574,633 Sales of Assets & Compensation to, Losses 11,769,515 62,000 62,000 62,000 62,000 62,000 Sales & Charges for Services 103,840,815 107,378,022 106,544,319 111,152,499 112, 142,781 115,413,370 Fines, Forfeits, & Penalties - 21, 127,279 25,491,000 20,776,000 22,855,000 22,863,000 22,871,150 Licenses, Permits, & Inspection Olarges - 10,692,111 13,075,000 13,692,000 13,851,000 13,977,000 14,106,894 Taxes, Assessments, & Interest 573,495,129 522,959,000 613,656,000 656,003,000 669,077,000 681,541,000 Contributions & Transfers 61,132,716 5,100,000 Miscellaneous 8,099,723 7,567,000 7,989,000 8,528,000 9,104,000 9,718,000
Total Revenues . Recurring 1,023,nS,9S8 906,595,221 995, 139,231 1,045,976,515 1,061,217,005 1,078,153,047
Revenues • Non•Recurrina Contributions and Transfers 117,381,658 143,274,123 123,000,000 113,000,000
Total Revenues . Non•Recurrlng 117 ,381,6S8 143,274,123 123,000,000 113,000,000
Grand Total Revenues 1,023,775,958 1,023,976,879 1,138,413,354 1,045,976,515 1,184,217,005 1, 191,153,047
Page 4 June 28, 2021 Financial Review Commission
Sec. 8 (2)(c) of Act 181 requires the city’s financial plan projects a balanced budget for the current fiscal year (FY2021) and the succeeding three years using general accepted accounting principles and in accordance with the uniform budgeting and accounting act.
To date the city has submitted six, four-year financial plans with balanced budgets.
• FY 2016-FY 2019, FRC approved April 20, 2015; • FY 2017-FY 2020, FRC approved April 18, 2016; • FY 2018-FY 2021, FRC approved April 17, 2017; • FY 2019- FY 2022, FRC approved April 16, 2018; • FY 2020-FY 2023, submitted April 30, 2019, (in waiver, FRC approval not required); • FY 2021-FY 2024, submitted June 1, 20201, (in waiver, FRC approval not required)
Table 3 is the city’s adopted Four-Year Financial Plan FY 2022-2025. It includes the adopted budget for FY 2022 plus three forecasted years (FY 2023, FY 2024, FY 2025) in accordance with the requirements of the Home Rule City Act and in compliance with Sec. 8(2)(c) of Act 181, utilizing revenue estimates from the February 2020 Revenue Estimating Conference as a base.
Table 3: FY 2022-FY 2025 Expenditures & Revenues by Major Classification City of Detroit Budget Development, Fund 1000 – General Fund
iv. Municipal Securities/Debt Obligations
1 The Financial Review Commission granted the city an extension last year on its Four-Year Financial Plan due to the effects of COVID-19.

Page 5 June 28, 2021 Financial Review Commission
Sec. 8 (2)(b) of Act 181 requires the state treasurer and the city’s CFO to certify that (1) all municipal securities or debt obligations sold by or for the benefit of the city in the general public market during the immediately preceding fiscal year and current fiscal year satisfied the capital and other financial requirements of the city and (2) there is a substantial likelihood that municipal securities or debt obligations can be sold by the qualified city or qualified school district in the general public market during the remainder of the current fiscal year and the immediately succeeding fiscal year in amounts sufficient to substantially satisfy all of the capital and other financial requirements of the qualified city or qualified school district during those periods in accordance with the qualified city's or qualified school district's financial plan, as applicable.
Unlimited Tax General Obligation bonds
$80 million in UTGO capital bonds The city issued $80 million in UTGO capital bonds in October 2020 for public safety, recreation and transportation projects. This borrowing was the second series; the first series was issued December 2018, in the amount of $135 million. The city selected JP Morgan Chase and Siebert Williams Shank as co-senior managers to lead the offering. Ahead of the sale, Moody’s Investors Service affirmed the city’s Ba3 rating and positive outlook while S & P Global Ratings affirmed the city’s BB- rating and negative outlook. This borrowing, which was the city’s second, post-Chapter 9, stand-alone, unlimited tax general obligation (UTGO) issue, permits the city to maintain its capital investments pursuant to the Plan of Adjustment. The city executed this borrowing without raising the city's debt millage rate, which remains at 9 mills. Finally, the Financial Review Commission passed Resolution 2020-4, August 30, 2020 authorizing the sale of the bonds, pursuant to Sec. 8 (3)(c) of the Act 181 of 2014.
$175 million in UTGO bonds (Proposal N)
On December 14, 2020, the Financial Review Commission authorized (Resolution 2020-6) $250 million in UTGO bonds to continue to pay the cost of neighborhood improvements through property rehabilitation, demolition, and blight remediation. Voters had approved the issuance in the November 3, 2020 general election. For this borrowing, the city entered the bond market in February 2021 with Bank of America Securities and Siebert Williams Shank acting as co-senior managers on the transaction. Moody’s Investors Service affirmed the city’s Ba3 ratings and positive outlook while S & P Global Ratings affirmed the city’s BB- rating and revised the outlook from negative to stable. The city issued $135 million in tax-exempt UTGO bonds and $40 million in taxable UTGO bonds.
v. The Retirement Protection Fund (RPF) and the Pension Fund
The RPF has earned approximately $14.3 million as of March 31, 2021, which is an effective rate of return of 2.63% since inception. In total, the RPF has $220 million in contributions and $14.3 million from interest earnings. The target is $365 million at 2024.
The pension pressures will be a long-term budget challenge for the city. It is the city’s policy to reexamine the pension system and the RPF every year for future funding requirements and to adjust its funding plan as needed during the annual budget development process. The Four-Year Financial plan includes $60M for the RPF in FY23. The FY22 Budget includes $85 million for the RPF (the originally planned $55M, plus $30M from one-time surplus). The city plans to identify additional RPF funding on top of these amounts to extend the life of the RPF and provide a longer ramp-up to fully phasing in legacy pension costs.
The FY 2024 pension “cliff” is $202 million, using a level dollar amortization over 30 years. It was calculated by Cheiron, an actuarial firm hired by the city, post-bankruptcy, to assist it with its legacy

$250
$200
$150
$100
$50
$0
S365M in RPF Deposits 1
K
General Fund Legacy Pension Contributions ($ in millions)
Grand Bargain Contributions End
~~~~~~~~~~~~~~~~~~~~~~~~ ■ PeASion Contribution (General Fund) ■ Pension Contribution (RPF) ■ RPF Deposit (recurring) ■ RPF Deposit (one-time)
Pro;aclions d annual legacy pension c:onlribuli:)ns assume a 30-year leYel dollar am<rization. E:xdudes-otand Bargain• conbibutions from State of Michigan, Foundation for Detroit's Futtn (FOF}, and Oe.tro~ Institute of Ms (OIA). OWSO and Library liabilities and contrilutions are separate.
Page 6 June 28, 2021 Financial Review Commission
obligations. Gabriel Roeder Smith (GRS), the actuarial firm for the investment committees and pension boards, completed its FY20 actuarial valuations in April, after the city completed its FY ’22 budget. GRS projected the city’s annual general fund contributions starting in FY ’24 will be $186.1 million v. $202 million, a difference of $15.9 million. The difference is largely due to actuarial gains from data improvements, terminations, and mortality that mitigated the actuarial losses from the below target FY 20 investment returns.
Sec 4t (c)(ii) of Act 279 of 1909 (as amended) requires the city to make contributions necessary to assure that the pension systems for employees and retirees of the city are adequately funded. In addition to the city’s contributions into the RPF mentioned above, the FY ’22-’25 Four-Year Financial Plan budgets contributions from the RPF, $123 million in FY ’24 and $113 million in FY ’25, to assist the city’s general fund’s $202 million pension-payment obligation in FY ’24, which is conservative by $15.9 million.
Table 4: FY 2022 Retirement Protection Fund Plan
vi. Rainy Day Fund
Act 182 requires the city of Detroit to maintain a 5% minimum budget reserve. The city utilized $50 million from the budget reserve in the FY 2021 while remaining in compliance with Act 182. The FY2022 adopted budget restores the $50 million, increasing the Rainy Day Fund back to $107.3 million. (See Table 5).

Beginning Balance
City of Detroit
Budget Reserve Schedule
MIIJ•fi $ 107,280,192 $ 57,280,192
(50,000,000) 50,000,000
MAJ•ft■ Mlil•ft $ 107,280,192 $ 107,280,192 $ 107,280,192
Transfer In/ Out
End ing Balance IWMIPI 4fj,@h€fi 4♦j,N€N IJl,N€fi iij,@h?fi % of Recurring Expenditures 5.6% 10.2%
Minimum Balance (5% of Recurring Expenditures) $ 51,198,844 $ 52,756,962
PA 182 Sec 4t (1) (c) (vi) • Four-Year Financial Plan Requirement :
10.3%
$ 52,298,826
9.1%
$ 59,210,850
9.0%
$ 59,557,652
Include a general reserve fund for each f iscal year to cover potential reduct ions in projected revenues o r increases in projected expend itures
equal to not less than 5% of projected expenditures for the fiscal year.
Page 7 June 28, 2021 Financial Review Commission
Table 5: FY 2022 – 2025 Budget Reserve
Conclusion
For the above-written reasons and Exhibit A, staff recommends the FRC certify the city of Detroit has met all of the statutory conditions required in Sec. 8(2) and grant the city of Detroit the year-four waiver.
The FRC, during waiver, plays a very limited role in the city’s day-to-day finances and operations. The commission’s waiver responsibilities are listed Sec. 8 (2) and (3) of Act 181. The commission’s primary role is to ensure the city remains in compliance with statute related to maintaining a waiver once granted, and to ensure that the city meets the statutory conditions necessary to be granted a waiver. As a result, the FRC has more of an evaluative role, rather than a prospective one. The FRC receives sufficient financial-, debt- and other key reports from the city to monitor the city’s statutory requirements.
When COVID-19 hit in the spring of 2020, the city experienced an immediate and profound impact to its general fund. The city was looking at a nearly $400 million deficit across FY ’21 and FY ’22. The FRC, within its statutory role, monitored the city’s key financial reports and verified, among other metrics, that the city, in its comprehensive response the pandemic, maintained an operating surplus, made all scheduled debt obligations and pension payments, and provided essential services to its residents.
Going forward, the FRC, utilizing the submissions of financial reports by the city pursuant to Resolution 2018-13, will follow the city’s progress over the next fiscal year to verify, monthly, that the city remains in compliance with and does not trigger any conditions in Sec. 8(3)(a) through (h), the waiver rescission section of Act 181 of 2014.

72 (Rev. 01-19)
STATE OF MICHIGAN
DEPARTMENT OF TREASURY GRETCHEN WHITMER RACHAEL EUBANKS GOVERNOR LANSING STATE TREASURER
DATE: May 4, 2021
TO: State Budget Director David Massaron, CFO Jay Rising, Council President Brenda Jones, John Walsh, John Barnwell, State Treasurer Rachael Eubanks
FROM: Patrick Dostine, Departmental Specialist Financial Review Commission
SUBJECT: FRC City Finance Subcommittee May 4, 2021 Meeting Recap
The following is a recap of the FRC city finance subcommittee Teams-meeting on May 4, 2021. The finance subcommittee was convened for the purpose of receiving an overview of the city’s finances and operations as the city nears the end of its year-three waiver, which was granted June 29, 2020. On June 28, the FRC will take up for consideration the extension of the waiver for another year.
Introduction
The Office of Chief Financial Officer (OCFO) presentation covered, among other things, the FY 2022 adopted budget and the Four-Year Financial Plan, FY2022-FY2025 (the Plan), a revenue forecast, the Rainy Day Fund, the Retirement Protection Fund, the FY 2021-2030 Long-Term Forecast, and the American Rescue Plan Act (ARPA). This memorandum provides a summary that focuses on the adopted FY ’22 budget and financial Plan, the Retire Protection Fund, the pension system, and material risks to the new budget and financial plan.
The Mayor presented his original budget, utilizing revenues from the February 2021 revenue estimating conference, to city council on March 5. City council held budget hearings in March and subsequently adopted a balance budget and the Four-Year Financial Plan, as required by law. The OCFO submitted the adopted FY ’22 balanced budget and Four-Year Financial Plan to the FRC April 30.
FY 2022 Adopted Budget
The FY 2022 budget is balanced. On the revenue side, the city utilized the revenue estimate ($995.2 million) from the February revenue estimating conference. There is a gradual recovery in income and wagering taxes. Further, as Budget Director Steve Watson noted, what helped the city in formulating its FY ’22 balance budget was the large increase in FY ’21’s fund balance, from the adopted amount ($77.3 million last May) to the revised amount of $186.4 million. (See p.16 FRC Finance Subcommittee PowerPoint in the appendix.) The increase in FY ’21 fund
430 WEST ALLEGAN STREET • LANSING, MICHIGAN 48922 www.michigan.gov/osrfa • 517-373-3200

Page 2
balance, Watson said, was due to the city’s comprehensive response to last year’s COVID outbreak, which included repurposing fund balance, rapid cost-cutting measures, and maximizing use of the CARES funds and other state and federal grant dollars.
On the expenditure side, the FY ’22 adopted budget spends down most of the unassigned fund balance. Total recurring expenditures is $1,055.2 billion, a 15 percent increase from FY ’21 revised budget ($917.4 million). Expenditure growth in the FY ’22 budget is largely driven by personnel expenses, and, to a lesser extent, a diminishing reliance on federal transit monies, and lastly, one-time investments. Salaries and employee benefits increase in this budget 4.9%, from $578.8 million (FY ’21 revised budget) to $606.9 million.1 One-time expenditures include: $50 million for the Rainy Day Fund; an additional $30 million for the Retiree Protection Fund; $20 million for blight and capital outside of bond proceeds; and $3.3 million for other, totaling $103.3 million. (See p.17 FRC Finance Subcommittee PowerPoint in the appendix.) It should be noted, the $50 million investment in the Rainy Day Fund would increase that fund to approximately 10 percent of expenditures, nearly double what’s required by the Michigan Financial Review Commission Act (FRC Act).
The city highlighted some FY ’22 budget priorities that focus on the neighborhoods. They include the home repair grants program ($5.5 million), affordable housing and homeownership ($5.5 million), public transit ($3 million), workforce training and business support ($10 million), safer neighborhoods ($1.5 million), and vibrant and beautiful city/recreation opportunities ($12 million). Some of the budget priorities are new investments/programs, some are continuation of investments/programs (See pp. 21-26 FRC Finance Subcommittee PowerPoint.)
FY 2022-2025 Adopted Four-Year Financial Plan (the Plan)
The Plan is balanced. Revenues conservatively increase from FY ’22 ($995.2 million) through FY ’25 ($1,078.2 billion). Again, these revenue estimates come from the February revenue estimating conference, as required by law. The city returns to its pre-pandemic, revenue peak, which was FY ’19, in FY ’24 ($1,061.2 billion). The city did not include in its forecast revenues from on-line gaming nor the anticipated $880 million from the American Rescue Plan Act of 2021. Watson said that one of the risks to this revenue projection is the remote work income tax, which the city estimates at a permanent 10 percent loss starting in FY ’23 through ’25. In FY ’23, the city no longer budgets federal transit grants that helped relieve pressure on the general fund. However, the budget director said a provision in Act 51 allows the city to utilize 20 percent of the monies for public transit. The Plan also shows (See p. 31 FRC Finance Subcommittee PowerPoint), under Recurring Expenditures, the city utilizing funds from the Retiree Protection Fund in FY ’24 ($123 million) and FY ’25 ($113 million) to help offset the city’s general fund obligation to the pension system of $202 million. This is up from $166 million from last year’s financial outlook/estimate. Poor returns as of June 2020, -0.96 percent for the General Retirement System (GRS) and 1.6 percent for the Police Fire Retirement System (PFRS), largely drove the increase in the FY ’24 pension obligation.
1 Mayor Duggan announced in early March that city employees would receive a 2 percent raise July 1, the start of fiscal year 2022. Police are receiving a 2.5 percent raise. Also, employees who had been at 80 percent status were brought back to full time status.

Page 3
Retiree Protection Fund (RPF) and the Pension Fund
The FY 2024 pension “cliff” is $202 million, using a level dollar amortization over 30 years. It was calculated by Cheiron, an actuarial firm hired by the city, post-bankruptcy, to assist it with its legacy obligations. Gabriel Roeder Smith (GRS), the actuarial firm for the investment committees and pension boards, completed its FY20 actuarial valuations in April, after the city completed its FY ’22 budget. GRS projected the city’s annual general fund contributions starting in FY ’24 will be $186.1 million v. $202 million, a difference of $15.9 million. “The difference is largely due to substantial actuarial gains from data improvements, terminations, and mortality that mitigated the actuarial losses from the below target FY 20 investment returns,” the city wrote in an answer. (See Question 6 in the Memorandum Response to Discussion Questions for OCFO, Finance Subcommittee in the appendix.)
The budget director addressed the fact that the RPF in this year’s model makes contributions through FY ’27, but last year’s model had the RPF making contributions through FY ’32, five additional years. Put another way, pressure on the general fund to “go it alone” with pension contributions occurs sooner. Watson said the city must continue to identify additional dollars to contribute to the RPF, continue to control and reduce city expenses, and grow revenues. The $15.9 million reduction in the projected annual contribution from the GRS valuations and the strong investment performance for FY ’21 to date help to mitigate that risk to the RPF.
Another pressure to the general fund’s ability to make pension contributions is the pension systems’ funding policy. The city is facing a possible 20-year amortization funding policy rather than the current 30-year amortization. In its FY 2021-2030 Long-Term Forecast, the city ran projections, 20-year amortization v 30-year (See pp. 34-35 FRC Finance Subcommittee PowerPoint). If the investment committees and pension boards (note: the PFRS board has adopted and recommends a 20-year amortization to the PFRS Investment Committee) adopt a more aggressive amortization schedule, expenditures exceed revenues sooner and by a greater amount and the RPF expires faster. The budget director said the city will continue to engage with the investment committees and pension boards as they contemplate a funding policy, and to explain the city’s financial conditions and the need for a 30-year amortization.
Pension Fund Performance
As noted earlier, investment performance measured on June 2020 was poor, -0.96 percent for the GRS and 1.6 percent for the PFRS. These returns were used to calculate the city’s pension contribution in FY ’24, which increased from $166 million to $202 million. The one caveat: that the city’s budgeted $202 million payment is conservative by $15.9 million as computed by Gabriel Roeder Smith.
Some positive news is Finance Director John Naglick reported that investment performance has been in the double digits (approximately 15 percent for both GRS and PFRS) since June 2020. With two months remaining in the fiscal year, the investment committees remain cautiously optimistic. Naglick said the investment committees have been very intentional with the portfolios, designed to protect against downsides and market corrections.

Page 4
Potential Risks to the FY ’22 Budget and Four-Year Financial Plan
• Slower on-site casino recovery and larger, longer-lasting income tax losses from remote work.
• Assumptions do not materialize for workforce savings in FY ’22 ($33 million) and additional savings beginning in FY ’23.
• Firefighter/EMS labor contract expired June 30, 2020. Not yet settled. Police contract expires June 30, 2022.
• Pension board funding policy and future investment performance, both affect FY ’24 pension payment.
• A voter-adopted Draft Revised Charter. • Future state and federal budget pressures causing reductions in local funding.
Conclusion The city submitted to the FRC on April 30 a balanced FY ’22 budget and Four-Year Financial Plan, meeting the requirement in Sec. 8(2)(c) of the Financial Review Commission Act (the FRC Act). Further, the CFO and state treasurer noted during the meeting that they would certify that municipal securities or debt obligations can be sold by the city in the general public market, meeting the requirement in Sec. 8(2)(b) of the FRC Act.
The CFO guided finance subcommittee commissioners through the requirements necessary for a waiver, listed in Sec. 8(2), demonstrating that the city has met all the necessary conditions to be granted a fourth consecutive waiver. The FRC meeting that determines whether a fourth waiver will be granted is June 28.
Finally, the OCFO will present the finance subcommittee presentation to the full Financial Review Commission on May 24.
See the Appendix to review the city’s entire presentation FRC Finance Subcommittee and the Memorandum: Response to Discussion Questions for OCFO, Finance Subcommittee.

OFFICE OF THE
Iii CHIEF FINANCIAL OFFICER Coleman A. Young Municipal Center 2 Woodward Avenue. Suite 1100 Detroit. Michigan 48226
Phone 313•628•2535 Fax 313·224·2135 [email protected] www.detroitmi.gov
Response to Finance Subcommittee Discussion Qs Page 1 of 3
Memorandum
TO: Detroit Financial Review Commission Finance Subcommittee (City of Detroit)
FROM: Jay B. Rising, Acting CFO, City of Detroit
DATE: April 29, 2021
RE: Response to “Discussion Questions for OCFO, Finance Subcommittee May 4, 2021”
1. What are the material risks to the FY 22 budget and Four-Year Financial Plan?
Response: Slower on-site casino recovery than expected and larger and longer-lasting income tax losses from nonresidents working remotely (partly mitigated by launch of internet gaming and sports betting, which is not counted yet in revenue estimates).
The budget assumes $33M in recurring workforce savings from turnover, attrition, and overtime in FY22 and additional savings beginning in FY23. For FY22, this accelerates much of the savings that naturally occurs every year. For FY23 and beyond, we will implement a workforce planning process to set and achieve four-year reduction targets for agency staffing levels and overtime management.
The Firefighter/EMS labor contract expired on 6/30/20 and is not yet settled. The police labor contracts expire on 6/30/22. While the City is planning for anticipated wage increases and will identify offsets for anything above baseline, the pending contracts remain a risk until settled.
The legacy pension contributions that resume in FY24 remain a risk, both from future investment performance but also the pending funding policies and the risk of a shorter amortization period.
As discussed at the April 26, 2021 FRC meeting, the proposed City Charter is a material risk to the budget.
2. We understand the US Treasury will be issuing additional guidance for the ARPA funds and that the city of Detroit will receive two installments across two fiscal years. That said, where/how do these funds fit into the city’s future budgetary plans?
Response: The FY22 Budget and four-year plan does not include any of the ARPA funds. The Mayor announced in March that the City would use a portion of the ARPA funds to return all workshare employees to full-time status. Beyond that, the City is working now on its plan for the use of ARPA funds. We expect the plan to include funding for unmet needs due to revenue losses from the pandemic (e.g., commercial blight) and transformational projects that invest in City infrastructure and human capital. We expect to announce these plans later in May. While the ARPA funds provide an important safety net as we bridge our budget beyond the pandemic, we will only use these funds for one-time expenses rather than building up recurring costs we cannot sustain once the ARPA funds run out in December 2024.

Response to Finance Subcommittee Discussion Qs Page 2 of 3
3. Authorizations remain for unissued $40M in capital improvement UTGO bonds and $75M in Neighborhood Improvement Plan UTGO bonds. Does the city plan to issue them? If the City does plan to issue any of those bonds, how will it impact the general fund?
Response: The City’s current capital financing plan assumes we will issue the remaining UTGO authorizations and seek voter approval for additional UTGO authorizations. These bonds are supported by the dedicated 9-mill debt millage and have no impact on the General Fund. The timing and size of such future issuances may change should the City receive and use additional state and federal funding for capital, such as the ARPA funds and any subsequent infrastructure funds.
4. What would be the effects to the general fund and the city’s commitment to the Plan of Adjustment should voters approve the Detroit Charter Revision Commission’s proposed changes to the Charter?
Response: Please see OCFO presentation to the FRC on April 26, 2021.
5. What rate of return did Cheiron assume in determining the revised FY ’24 Actuarial Determined Contribution (ADC)?
Response: We used the actual investment returns for FY20 (-0.96% for GRS and 1.6% for PFRS) and 6.75% for all years thereafter.
6. What is the difference between the Cheiron’s FY ’24 ADC and the FY ’20 actuarial valuation reports prepared by Gabriel Roeder?
Response: Gabriel Roeder completed the FY20 actuarial valuations in April 2021 after the City completed the FY22 Budget. Based on the FY20 valuations and a 30-year level dollar amortization, the projected annual General Fund contribution beginning FY24 will be $15.9 million lower than what we assumed in the FY22 Budget/Cheiron model ($186.1M vs. $202M). The differences are largely due to substantial actuarial gains from data improvements, terminations, and mortality that mitigated the actuarial losses from the below target FY20 investment returns.
The valuation reports are attached (attachments 1 and 2).
7. Regarding the Retiree Protection Fund (RPF), it is noted that this year’s RPF model (p. 8 of the Long-Term Forecast, FY 21-FY 30) shows the RPF expiring five (5) years sooner than last year’s RPF model (p. 10 of the Long-Term Forecast, FY 20-29). How will/has the city respond(ed) to this sooner-than-expected pressure on the general fund?
Response: We will need to identify additional RPF funding to extend its life, reduce recurring spending through new efficiencies and innovations, and continue to grow and diversify our revenues. The $15.9 million reduction in the projected annual contribution from FY20 valuations and the strong investment performance for FY21 to date will further mitigate this risk.
8. Please provide an updated chart similar to the chart found on page 12 of the CFO’s March 30, 2020 PowerPoint in the Long-Term Forecast Report for Legacy Pension Plans and Debt Obligations (2020 – 2029). That chart is titled “Recurring Debt Service and Legacy Pension Costs” and shows the combined costs of those two obligations from FY 20 to FY 38. The chart we are requesting will show the same information for FY 21 to FY 39
Response: Please see attached (attachment 3).

Response to Finance Subcommittee Discussion Qs Page 3 of 3
9. Please explain why the future RFP returns are projected to be so low in FY 2021 and declining (1.56% for FY 2021 and declining to 1% post-FY 2023)?
Response: This forecast comes from our RPF investment consultant. We have always invested the RPF very conservatively to preserve principal over yield. Current market yields are very low, and the reduced investment return assumption keeps our RPF plan conservative.
10. What are the potential sources of funding for the large annual increases in recurring debt service and legacy pension costs?
Response: LTGO debt service paid from the General Fund actually decreases over time. Recall that in 2018, the City restructured its LTGO debt to eliminate the debt service spike previously scheduled to occur in FY25.
The City’s four-year plan already assumes the $13M in LTGO debt service savings in FY24 will be redirected toward legacy pensions. We will use the RPF to gradually phase in legacy pension costs. However, as stated in #7 above, we recognize we will need to identify additional RPF funding, continue to reduce recurring costs, and grow our revenues to fully phase in legacy pension costs.
11. Why are no additional funds being budgeted to be placed in the RPF in FY 2023?
Response: The four-year plan includes $60M for the RPF in FY23. The FY22 Budget includes $85 million for the RPF (the originally planned $55M, plus $30M from one-time surplus). As stated above, the City plans to identify additional RPF funding on top of these amounts to extend the life of the RPF and provide a longer ramp-up to fully phasing in legacy pension costs.
12. Are there estimates of what the general fund legacy pension contributions will be pending the issuance of the FY 2020 valuation reports? If there are no estimates available, does the city anticipate that those obligations will materially increase because of the exceptionally low FY 2020 earnings by both GRS (-0.96%) and PFRS (1.6%)? If the FY 2020 actuarial valuations are completed, please provide.
Response: Our pension projections already factored in the FY20 investment earnings. The FY20 valuations were released subsequent to the FY22 Budget and reported substantial actuarial gains that mitigated the impact of the poor investment returns. See #6 above.
Att: General Retirement System of the City of Detroit – Annual Actuarial Valuation of Component II, June 30, 2020 (Attachment 1) Police and Fire Retirement System of the City of Detroit – Annual Actuarial Valuation of Component II, June 30, 2020 (Attachment 2) Recurring Debt Service and Legacy Pension Costs (Attachment 3)

General Retirement System of the City of Detroit – Annual Actuarial Valuation of Component II, June 30, 2020
(Attachment 1)

GRS
The General Retirement System of the City of Detroit Annual Actuarial Valuation of Component II June 30, 2020

800.521.0498 j P: 248.799.9000 j www.grsconsulting.com
One Towne Square Suite 800 Southfield. Michigan 48076-3723
April 8, 2021
Board of Trustees The General Retirement System of the City of Detroit
Dear Board Members:
This report provides key results from the Annual Actuarial Valuation of the annuity and pension liabilities of the General Retirement System of the City of Detroit – Component II benefits. The date of the valuation was June 30, 2020.
The City of Detroit filed for bankruptcy on July 18, 2013. A final Plan of Adjustment (“POA”) was confirmed on November 7, 2014 and the official exit from bankruptcy was on December 10, 2014. In connection with the POA, very significant changes were made to the benefits that the General Retirement System provides and to the contributions that it will receive. In particular, the benefits provided by the Retirement System were divided into two separate plans, referred to as “Component I” and “Component II.” The benefits provided in each component are effective July 1, 2014 and are described in detail in Emergency Manager Order No. 44, dated December 8, 2014. In very general terms, Component I provides benefits for service rendered on and after July 1, 2014 and Component II provides benefits for service rendered prior to July 1, 2014.
The results provided herein relate solely to the Component II benefits. Component I benefits will be the subject of a separate report. The purposes of the valuation are:
1) To measure the funding progress of Component II in accordance with the terms of the POA; 2) To provide illustrative actuarially determined contribution amounts for FY 2021; 3) To compare the illustrative actuarially determined contributions to the POA mandated contributions;
and 4) To estimate the FY 2024 actuarially determined contributions (the first year the employer will be
required to make actuarially determined contributions adopted by the Board and Investment Committee) under possible funding policies amounts.
The results of the valuation are not applicable for other purposes. In particular, the information provided in this report is not suitable for financial reporting in connection with GASB Statement No. 67. Such information is provided in a separate report. Information regarding potential benefit restoration as allowed for in the POA will also be provided in a separate report, at the Board’s request.
The contribution amounts on page 5 include POA mandated contributions plus two illustrative contribution amounts from potential alternate funding policies. Users of this report should be aware that contributions made at these amounts do not guarantee benefit security.

Board of Trustees April 8, 2021 Page 2
This report was prepared at the request of the Board and is intended for use by the Retirement System and those designated or approved by the Board. This report may be provided to parties other than the System only in its entirety and only with the permission of the Board. GRS is not responsible for unauthorized use of this report.
Future actuarial measurements may differ significantly from the current measurements presented in this report due to such factors as: plan experience differing from that anticipated by the economic and demographic assumptions; changes in economic or demographic assumptions; increases or decreases expected as part of the natural operation of the methodology used for these measurements (such as the end of an amortization period or additional cost or contribution requirements based on the plan’s funded status); and changes in plan provisions or applicable law. Due to the limited scope of the actuary’s assignment, the actuary did not perform an analysis of the potential range of such future measurements.
The valuation was based upon records maintained and furnished by the Retirement System staff concerning active members, retirees and beneficiaries, and financial accounts as of the valuation date. Data was checked for year-to-year consistency, but was not audited by the actuary. We are not responsible for the completeness or accuracy of the data. Certain necessary data was not available in time to be considered in this report and, therefore, it was necessary for us to use approximations. Please see related discussion in the Comments section as well as the Data section of this report.
The assumptions used in the valuations concerning future experience are summarized in Section D of this report. Except for the assumed rate of investment return, the actuarial assumptions used for the valuation are set by the Board based upon advice of the actuary and other parties. The assumed rate of investment return was set to 6.75% in the POA and is, therefore, a “prescribed assumption set by another party” as discussed in Actuarial Standard of Practice No. 4. In our judgement, all of the actuarial assumptions used for the valuation are reasonable for purposes of the measurement being made.
This report was prepared using our proprietary valuation model and related software which in our professional judgment has the capability to provide results that are consistent with the purposes of the valuation and has no material limitations or known weaknesses. We performed tests to ensure that the model reasonably represents that which is intended to be modeled. We are relying on the GRS actuaries and Internal Software, Training, and Processes Team who developed and maintain the model.
This report has been prepared by individuals who have substantial experience valuing public sector retirement systems. To the best of our knowledge, this report is complete and accurate and was made in accordance with Actuarial Standards of Practice promulgated by the Actuarial Standards Board.
The signing individuals are independent of the plan sponsor.
David T. Kausch, Judith A. Kermans and Jamal Adora are Members of the American Academy of Actuaries (MAAA) and meet the Qualification Standards of the American Academy of Actuaries to render the actuarial opinions contained herein.

Board of Trustees April 8, 2021 Page 3
This report does not evaluate the plan sponsor’s ability or willingness to make contributions to the Retirement System. Given the funded level of Component II, plan sponsor contributions are critical if further benefit reductions are to be avoided. Indeed, the employer contributions set forth in the POA have and are expected to continue to lead to a decrease in the funded status through June 30, 2023 (as contemplated by the POA), even if all assumptions are met.
Respectfully submitted,
David T. Kausch, FSA, EA, FCA, MAAA, PhD
Judith A. Kermans, EA, FCA, MAAA
Kenneth G. Alberts
Jamal Adora, ASA, EA, MAAA
DTK/JAK/KGA:rmn

Table of Contents Page
Section A Valuation Results
Executive Summary...............................................................................................................1 Valuation Results ...............................................................................................................2-6 POA Liability and Funded Ratio.............................................................................................7 Solvency Liability...................................................................................................................7 Comments ........................................................................................................................8-18 POA Liability by Division......................................................................................................19
Section B Fund Assets
Statement of Plan Assets ....................................................................................................20 Market Value of Assets .......................................................................................................21 Allocation of Assets Used for Valuation..............................................................................22
Section C Participant Data
Reconciliation of Raw Data .................................................................................................23 Active Member Data and Assumptions Included in Valuation ......................................24-30 Retiree and Beneficiary Data Included in Valuation ......................................................31-32
Section D Methods and Assumptions ...........................................................................................33-39
Section E Plan Provisions ..............................................................................................................40-42
Section F Glossary .........................................................................................................................43-44
The General Retirement System of the City of Detroit

SECTION A VALUATION RESULTS

Executive Summary ($ in Millions)
Valuation Date June 30, 2020 June 30, 2019 Contributions For Fiscal Year Ending June 30, 2022 June 30, 2021
POA Mandated Employer Contributions $ 48.3 $ 48.3
Membership Number of: Active Members 2,403 2,793 Retirees and Beneficiaries 11,220 11,557 Inactive, Nonretired Members 2,728 3,209 Total 16,351 17,559 Valuation Payroll $ 111.1 $ 142.2
Assets Market Value (1) $ 1,596.1 $ 1,798.9 Return on Market Value (net of all expenses) (0.60)% 2.64 %
Actuarial Information Actuarial Accrued Liability (2) $ 2,716.5 $ 2,866.1 Unfunded Actuarial Accrued Liability: (2) - (1) 1,120.4 1,067.2 Funded Ratio: (1) / (2) 58.76 % 62.77 %
Risk Metrics Actuarial Accrued Liability Divided by Payroll 24.4 20.2 Market Value of Assets Divided by Payroll 14.4 12.6
The General Retirement System of the City of Detroit 1

I I I I I I I I
Valuation Results Required contributions to the Plan through FY 2023 are provided in the POA. The schedule below details our understanding of the remaining contributions required by the POA.
Contribution Source ($ Millions)
Fiscal Year
For DWSD Liabilities For Other Liabilities
Total DWSD Transfers UTGO Transfers from
State DIA Other DWSD 2021 2022 2023
$ 45.4 $ (2.5) 45.4 (2.5) 45.4 (2.5)
$ - $ --
- $ 0.4 $ 2.5 $ 2.5 - 0.4 2.5 2.5 - 0.4 2.5 2.5
$ 48.3 48.3 48.3
We have assumed the contributions outlined above as called for in the POA (with adjustments) will not change. An estimate of the probability of those payments being made was outside the scope of this project, not required by Actuarial Standards, and was not made.
In order to develop divisional valuation results in accordance with POA provisions, we allocated the above contributions to the various divisions as instructed by the Retirement System staff. This was done by allocating DWSD transfer amounts to the General City division and remaining DWSD contributions to the DWSD division; allocating $2.5 million per year to the Library; and allocating remaining contributions to DOT and General in proportion to their unfunded liabilities as of June 30, 2020.
The chart below shows this allocation.
General D.O.T. Subtotal Library DWSD Totals
Unfunded Liabilities (6/30/2020)
$ Thousands
$ 608,600 $ 282,422 $ 891,022 $ 16,744 $ 212,633 $1,120,399 % of Subtotal 68.3% 31.7% 100.0% N/A N/A FY 2021 Contributions $ 256 $ 119 $ 375 $ 2,500 $ 45,400 $ 48,275 Transfers $ 2,500 $ - $ 2,500 $ - $ (2,500) $ -FY 2021 UAAL Contributions $ 2,756 $ 119 $ 2,875 $ 2,500 $ 42,900 $ 48,275
A different allocation procedure would produce different results. If a different allocation procedure should be used, please let us know and we will revise this report.
The General Retirement System of the City of Detroit 2

Valuation Results (Continued)
Unfunded Actuarial Accrued Liability (UAAL) ($ Millions)
General City D.O.T. DWSD Library
System Total
UAAL as of June 30, 2020 $ 608.6 $ 282.4 $ 212.6 $ 16.7 $ 1,120.4 Anticipated POA Contribution (EOY) 2.8 0.1 42.9 2.5 48.3 Anticipated Expenses@ - - - - -Interest at 6.75% 41.1 19.1 14.4 1.1 75.6 Projected UAAL as of June 30, 2021 $ 646.9 $ 301.4 $ 184.1 $ 15.4 $ 1,147.8
Anticipated POA Contributions for FY 2022 2.8 0.1 42.9 2.5 48.3
Estimated Employer Contributions for FY 2024 #!
Alternate 1:Level Principal $ 73.8 $ 34.6 $ 12.2 $ 1.2 $ 121.8
Alternate 2:Level Dollar## $ 57.5 $ 27.0 $ 9.5 $ 1.0 $ 94.9
Totals may not add due to rounding.
@ In accordance with the Plan Document, the mandated 6.75% rate of return is net of investment and administrative expenses.
# Assuming the POA contributions through 2023 and a 30-year closed amortization thereafter. When determining the Fiscal Year 2024 illustrative amounts, only the total contributions and the DWSD contributions are stipulated in the POA. The remaining amounts were allocated to the other groups as described on page 2. A different allocation would result in different results by group.
! Total employer contributions, including amounts paid by employer but funded from other sources as required by POA. ## Contributions at this level may not be sufficient to prevent fund depletion prior to satisfaction of all benefit
payments. This scenario is included at System’s request (see page 5).
The POA contributions are well below actuarially determined amounts and, as such, result in a defunding of the plan between now and June 30, 2023, which was contemplated by the POA. In fact, the anticipated POA contributions are not expected to result in benefit restoration even if all assumptions are met (including the POA mandated assumed rate of return of 6.75%).
Also, the FY 2021 to 2023 contributions are less than the amount of nominal interest that accrues on the UAAL.
The Estimated Employer Contribution for FY 2024 is based on a projection of results assuming only the POA contributions are made and all future experience between the valuation date and FY 2024 is as assumed. Actual experience will result in changes to this estimate and the final result (from the June 30, 2022 actuarial valuation) could be materially different than shown above.
We understand that the City has set aside additional money in a side fund to be contributed to the pension plans in the future. This potential additional contribution has not been considered in this valuation.
The General Retirement System of the City of Detroit 3

- -
$140
$120
$Mill
ions
$100
$80
$60
$40
$20
$0 2021
DGRS - Employer Contributions
2026 2031 2036 2041 2046 2051 Fiscal Year Ending June 30
Employer Contribution (30-Year Level Principal) Employer Contribution (30-Year Level Dollar)
2056
$Mill
ions
$1,200
$900
$600
$300
$0 2020
DGRS Funding Projection
2025 2030 2035 2040 2045 2050 2055 Valuation Date June 30
UAL (30-Year Level Dollar) UAL (30-Year Level Principal)
Funded Level (30-Year Level Dollar) Funded Level (30-Year Level Principal)
100%
75%
50%
Fund
ed Le
vel
25%
0%
Notes: 30-year amortization periods are assumed to begin in FY 2024. 30-year level dollar may result in fund depletion and pay-as-you-go funding before the end of the 30-year period. Under this scenario, the Plan is only 12% funded in 2045.
The General Retirement System of the City of Detroit 4

Valuation Results (Continued) We have recommended that the Board establish a funding policy for the contribution determinations on and after fiscal year 2024. The Board has begun the process. Once that process has been completed we will incorporate the adopted policy into future valuation reports. Until that process is completed, we will continue to show the following two possible policies.
In the chart below, the first policy funds the UAAL over the expected remaining active service life of this group. The second policy is similar to the Board’s pre-bankruptcy policy, but with accelerated principle payments of the UAAL to prevent insolvency prior to the end of the funding period. The illustrations are intended to show that there are a broad range of possible funding policies, but are not intended to provide a specific recommendation or a minimum or maximum level of contributions.
Funding Policy 1 is based on amortizing the UAAL over the average remaining service life of active members (6 years for General; 5 years for DOT; 6 years for DWSD; and 6 years for Library) using level dollar amortization.
Funding Policy 2 is based on amortizing the UAAL with level principal payments over a closed 30-year period plus interest. This method is also known as level principal declining interest amortization.
Illustrative Contribution Shortfall ($ Millions)
General City D.O.T. DWSD Library
System Total
(1) Illustrative Contribution for FY 2022 (Funding Policy 1) $ 134.7 $ 73.0 $ 38.3 $ 3.2 $ 249.2
(2) Illustrative Contribution for FY 2022 (Funding Policy 2) 65.2 30.4 18.6 1.6 115.7
(3) Actual Contributions for FY 2022 (POA) 2.8 0.1 42.9 2.5 48.3
Fiscal Year 2022 Shortfall - Funding Policy 1: (1) - (3) $ 131.9 $ 72.9 $ (4.6) $ 0.7 $ 200.9
Fiscal Year 2022 Shortfall - Funding Policy 2: (2) - (3) $ 62.4 $ 30.3 $ (24.3) $ (0.9) $ 67.4
We understand the Employer continues to set aside money in a separate side fund account to contribute to the Pension Plans in the future. Since the account is outside of the trust fund and the portion of the fund this Plan will receive (vs. the Police and Fire Plan) has not been determined, we have not taken those assets into account in our calculations. We commend the Employer for taking proactive steps to manage the estimated increase in funding requirements beginning in FY 2024 from a budgeting perspective. In the meantime, we recommend continued consideration of increasing contributions actually deposited into the trust.
In addition, as the Board works through the funding policy, we would suggest considering a funding period less than 30 years. Given the fact that not all of the retiree liabilities are funded, a period of 15 years or less should be considered.
The General Retirement System of the City of Detroit 5

Valuation Results (Concluded)
Present Value June 30, 2020 June 30, 2019
Accrued Pension Liabilities (Employer Financed)
Retirees and beneficiaries
Inactive members future deferred pensions
Active members
$2,022,510,702
223,061,249
256,033,419
$2,091,442,091
256,076,056
292,534,990
Total accrued pensions
Pension fund balances
2,501,605,370
1,500,667,694
2,640,053,137
1,689,006,631
Unfunded accrued pension liabilities $ 1,000,937,676 $ 951,046,506
Accrued Annuity Liabilities (Member Financed)
Retirees and beneficiaries Future annuities
Member annuities & future refunds
$ 100,671,026
114,225,043
$ 105,757,686
120,248,768
Total accrued annuity liabilities
Annuity fund balances
214,896,069
95,434,295
226,006,454
109,900,196
Unfunded accrued annuity liabilities* $ 119,461,774 $ 116,106,258
Totals
Actuarial Accrued Liabilities (AAL)
Market Value of Assets (MVA)
$2,716,501,439
1,596,101,989
$2,866,059,591
1,798,906,827
Unfunded Actuarial Accrued Liabilities (UAAL) $1,120,399,450 $ 1,067,152,764
POA Funded Status 58.8% 62.8%
* Liabilities are gross before accounting for ASF claw-back. Assets currently include a receivable of approximately $99.4 million related to the ASF claw-back. We believe the receivable is included in the Pension fund balances.
Historical Results ($ Millions) 2018 2017 2016 2015 2014
Total AAL MVA UAAL POA Funded Status
$2,929.1 1,940.6
988.4 66.3%
$2,995.8 1,966.7 1,029.1
65.6%
$3,032.3 1,933.5 1,098.8
63.8%
$3,139.1 2,131.3 1,007.8
67.9%
$3,222.4 2,015.2 1,207.1
62.5%
The General Retirement System of the City of Detroit 6

Funded Ratio - POA
A
B
Actuarial Accrued Liability (AAL)
Market Value of Assets
Defined Benefit ASF Total
$2,602,276,396
$1,481,876,946
$114,225,043
$114,225,043
$2,716,501,439
$1,596,101,989
C
D
Unfunded Actuarial Accrued Liability (A-B)
Funded Ratio (B/A)
$1,120,399,450
56.9%
$ 0
100.0%
$1,120,399,450
58.8%
The POA Funded Ratio measurement above is an expected return-based measurement of the pension obligation. It is based upon the mandated 6.75% interest rate assumption (assumption prescribed by the POA). It determines an amount (AAL) that will be sufficient to provide benefits if the portfolio earns the expected 6.75% return on assets and all other assumptions are met. This measure is appropriate for assessing the need for or amount of future contributions (if all assumptions are met). This measure is not appropriate for assessing the sufficiency of plan assets to cover the estimated cost of settling the plan’s benefit obligation, in other words, of transferring the obligation to a third party in a market value type transaction.
Funded Ratio - Solvency
A B
Market-Based Liability (MBL) Market Value of Assets
Defined Benefit ASF Total $4,032,971,790 $1,481,876,946
$114,225,043 $114,225,043
$4,147,196,833 $1,596,101,989
C D
Unfunded Market-Based Liability (A-B) Funded Ratio (B/A)
$2,551,094,844 36.7%
$ 0 100.0%
$2,551,094,844 38.5%
The Solvency Funded Ratio is a market-based measurement of the pension obligation. It estimates the amount (MBL) the plan would need to invest in low risk securities to provide the benefits with greater certainty. For this purpose, the MBL is computed at 2.45% interest as of June 30, 2020, based on the long-term municipal bond rate (“20-Year Municipal GO AA Index” rate from the Fidelity Index as of June 30, 2020). We are not able to assess the credit quality of the plan sponsor and, as such, no adjustment has been made for the credit quality of the plan sponsor. This measure may not be appropriate for assessing the need for or amount of future contributions. This measure may not be appropriate for assessing the sufficiency of plan assets to cover the estimated cost of settling the plan’s benefit obligation.
The difference between the two measures (POA and Solvency) is one illustration of the savings the sponsor anticipates by taking on the risk in a diversified portfolio.
The General Retirement System of the City of Detroit 7

Comments Experience Experience was less favorable than assumed during the year ending June 30, 2020. The chart below shows the estimated gain by division.
Development of Actuarial Gain/(Loss) ($ Millions)
General City D.O.T. DWSD Library
System Total
(1) UAAL as of June 30, 2019 (BOY) $ 558.2 $ 268.4 $ 226.2 $ 14.3 $ 1,067.2 (2) Actual POA Contribution (EOY) 2.8 0.1 42.9 2.5 48.3 (3) Interest at 6.75% 37.7 18.1 15.3 1.0 72.0 (4) Projected UAAL* as of June 30, 2020 $ 593.1 $ 286.4 $ 198.6 $ 12.8 $ 1,090.9 (5) Actual UAAL* as of June 30, 2020 608.6 282.4 212.6 16.7 1,120.4
Gain (Loss): (4) - (5) $ (15.5) $ 4.0 $ (14.0) $ (4.0) $ (29.5) Gain (Loss) from Investments $ (70.0) $ (10.2) $ (37.5) $ (5.6) $ (123.3) Gain (Loss) from ASF Audit Transfers $ - $ - $ - $ - $ -Gain (Loss) from Excess Interest Transfers (Inc. FY 2020) $ 1.6 $ 1.0 $ 0.4 $ 0.3 $ 3.2 Gain (Loss) from Liabilities $ 52.9 $ 13.2 $ 23.2 $ 1.3 $ 90.6
* Unfunded actuarial accrued liability.
Source of Actuarial Gain/(Loss)
Type of Risk Area
Gain (Loss) in Period
Totals ($ in Millions)
Percent ofLiabilities
Data Improvements^ 41.3 1.4 %
ASF Transfers 0.0 0.0 %
Excess Interest Transfers (Inc. FY 2019) 3.2 0.1 %
Risks Related to Experience
Economic Risk Areas:
Investment Return (123.3) (4.3)%
Demographic Risk Areas:
Full and Reduced Service Retirements 13.4 0.5 %
Death Benefits 0.1 0.0 %
Disability Benefits (0.2) 0.0 %
Other Terminations 10.6 0.4 %
Post-Retirement Mortality 25.4 0.9 %
Total Gain (or Loss) Related to Experience (74.0) (2.6)%
Total Gain (or Loss) During Period (29.5) (1.0)%
Beginning of Year Accrued Liabilities 2,866.1 100.0 %
^ See comment regarding Terminated Vested Data Audit on page 11.
The General Retirement System of the City of Detroit 8

Comments (Continued)
Experience (Continued)
The estimated FY 2024 contributions are very sensitive to changes in year-to-year experience. The chart below reconciles our estimate from the June 30, 2019 valuation to our estimate from this valuation (June 30, 2020).
The June 30, 2020 loss, primarily due to investments, decreased the funded percent more than expected and puts additional strain on the plan. For example, the projected funded level decreases to a minimum of about 12% funded in 2045 under the 30-year, level dollar contribution scenario, down from 16% based on the 2019 valuation. This means that the 30-year, level dollar scenario has an increased risk of the assets being depleted.
Reconciliation of Projected June 30, 2024 Contributions – Level Principal
($ Millions) General
City D.O.T. DWSD Library System Total*
Estimated FY 2024 Employer Contribution (Level Principal) from 6/30/19 Valuation Gain (Loss) from Investments Gain (Loss) from ASF Audit Transfers Gain (Loss) from Excess Interest Transfers (Inc. FY 2020) Gain (Loss) from Liabilities Modified Contributions (see below) Actual FY 2020 Contribution above/(below) Expected
$ 71.8 8.6 -
(0.2) (6.5)
--
$ 35.1 1.3 -
(0.1) (1.6)
--
$ 10.5 4.6 --
(2.8) --
$ 0.8 0.7 --
(0.2) --
$ 118.2 15.1
-(0.4)
(11.1) --
Estimated FY 2024 Employer Contribution (Level Principal) from 6/30/20 Valuation $ 73.7 $ 34.6 $ 12.2 $ 1.2 $ 121.8
* Totals may not add due to rounding.
Reconciliation of Projected June 30, 2024 Contributions – Level Dollar
($ Millions) General
City D.O.T. DWSD Library System Total*
Estimated FY 2024 Employer Contribution (Level Dollar) from 6/30/19 Valuation Gain (Loss) from Investments Gain (Loss) from ASF Audit Transfers Gain (Loss) from Excess Interest Transfers (Inc. FY 2020) Gain (Loss) from Liabilities Modified Contributions (see below) Actual FY 2020 Contribution above/(below) Expected
$ 56.0 6.7 -
(0.2) (5.1)
--
$ 27.4 1.0 -
(0.1) (1.3)
--
$ 8.2 3.6 --
(2.2) --
$ 0.6 0.5 --
(0.1) --
$ 92.1 11.8
-(0.3) (8.7)
--
Estimated FY 2024 Employer Contribution (Level Dollar) from 6/30/20 Valuation $ 57.4 $ 27.0 $ 9.5 $ 1.0 $ 94.9
* Totals may not add due to rounding.
The General Retirement System of the City of Detroit 9

Comments (Continued)
Experience (Continued)
Demographic Experience
Number Count Actual Expected
A E A/E% Retirement (including early) 80 275 29% Disability 0 18 0% Vested Terminations 181 50 362% Other Terminations (including pre-retirement death) 176 34 512% Post-Retirement Death 663 439 151%
Member Experience Additional Comments Retirements were less than one-third the number expected.
Vested Terminations were nearly three times the number expected.
Post Retirement mortality was one and one-half times the number expected.
The year ending June 30, 2020 was unique due to the Covid-19 pandemic as well as the City’s response. The pandemic, by itself, appears to have increased retiree mortality. However, the liability gain related to the increase in mortality was less than the number counts would imply. This suggests that the pandemic had a bigger impact on the older, lower liability population of the plan. This valuation is only six months into the pandemic and we expect higher mortality for at least the next six months following the valuation date. Given all the uncertainty regarding this experience, we have not attempted to account for this potential liability risk in this valuation. While we do not have the cause of death in the census data, it is likely that a significant portion of those who died during the year in excess of expectations were as a result of COVID-19. We honor those who have died during the pandemic.
Active member experience this year was also very different from expectations. We believe this is partly due to the pandemic and resulting economic uncertainties as well as the City’s response, which was to implement furloughs and a workshare program. Based on some number counts that the System Staff provided, we suspect that a lot of the terminations are actually temporary and related to the furloughs. The System provided information on members participating in the work share program and we have confirmed that the vast majority of those members are included as active members on June 30, 2020. If the furloughed members return to full time active status in the future, this could result in a liability loss in that future year. We have considered setting up a liability reserve for this potential future loss and decided not to include such a reserve for the following reasons:
1) It is unknown how many of the furloughed members will return to active service; and 2) The liability loss in this plan related to those members returning to active status would likely be
small, since it would only affect future eligibility service and not the frozen accrued benefit.
The General Retirement System of the City of Detroit 10

Comments (Continued)
Terminated Vested Data Audit As a result of an improvement of the Terminated Vested member data, we were informed that 493 members reported in the 2019 data were actually deceased as of June 30, 2019. The change this year is included in the “Data Improvements” source of gains/losses on page 8. This improved data has been recognized in this valuation, resulting in a gain of approximately $36.9 million.
New Members
We continue to see active members added to the Legacy data. We have assumed these were either data corrections or re-hires. We have observed this every year since 2014. The change this year is included in the “Data Improvements” source of gains/losses on page 8. This year 47 members were added as active to this plan. This resulted in an increase in accrued liabilities of approximately $1.8 million, after accounting for those members that were known to come from the deferred and retiree rolls.
Annuity Savings Fund (ASF) Claw-Back Data
For the June 30, 2015 valuation, the System’s auditors determined a receivable in accordance with GAAP accounting that was included in the reported June 30, 2015 assets. The reported assets for the June 30, 2020 status valuation also included a receivable for the remaining claw-back payments. We have assumed this information, received by the System’s auditors, was reasonable. This assumption is in compliance with the Actuarial Standards of Practice.
Annuity Reserve Fund (ARF)
Typically, we would compare the Annuity Reserve Fund (ARF) to the ARF liabilities and recommend a transfer if liabilities exceed assets. However, the annuity claw-back receivable created by the Bankruptcy (which relates to the ARF and the ASF) makes this analysis much more complicated. If the System would like us to perform this calculation, we will need additional information not routinely provided for the valuation. Please let us know if this is needed.
In general, assets were reviewed for reasonableness. During that review, we discovered that the ARF does not appear to have been credited any interest. As a result, we recommend that all the reserve amounts be reviewed.
Plan Provisions
Section B-1 (b) of the plan provides that members who terminate employment and are subsequently rehired before incurring a six-year break in service are eligible to earn additional vesting and eligibility service under the plan. For purposes of this valuation, we have assumed no terminated members will be rehired in the future. Rehires will, therefore, cause a loss when they occur.
The General Retirement System of the City of Detroit 11

Comments (Continued)
Great Lakes Water Authority (GLWA) Members
For the June 30, 2017 valuation we received a separate file indicating the June 30, 2014 DWSD status of members. Any members that were indicated as being DWSD division members on that file were valued under the DWSD for this valuation, regardless of the division reported on the main valuation data (which we understand to be the division as of June 30, 2020 in the Component I plan).
Allocation of Contributions Between General and DOT
Our understanding of the allocation of contributions between General and DOT is discussed on page 2 of this report. Based on the reported assets, a different allocation method appears to have been used in FY 2020. If the System supplies us with this asset allocation method actually used, we can incorporate that method in future valuations.
Annuity Savings Fund (ASF) Interest Credits
The ASF fund is credited with the lesser of 5.25% interest and the total fund earnings. We understand that any earnings in excess of 5.25% (that otherwise would have been credited to the ASF fund if not for the 5.25% cap) will be transferred to Component I assets, to the extent needed, for funding of transition liability. Since ASF liabilities are equal to ASF balances, we did not model any such future excess earnings as part of this valuation. Furthermore, since the fund earned less than 5.25% for both FY 2019 and FY 2020, we do not expect that there will be transfers of excess ASF interest in either FY 2021 or FY 2022. No additional liabilities were included in this report to account for anticipated excess earnings expected to occur as a result of return on assets. We have discussed the potential for additional liability with the Plan’s accountants and have been instructed that the excess earnings should not be included as a liability in the GASB 67 and 68 reports.
In FY 2020, approximately $1.2 million was transferred from Component II (Legacy) to Component I (Hybrid) due to excess interest earned in FY 2018. This was the second year of such a transfer. The amount was approximately $3.2 million less than we had estimated in the June 30, 2019 valuation.
We understand that the System has adopted a procedure for computing the ASF interest credits lagging the actual experience of the assets. We have not reviewed or audited this procedure. If the Retirement System can provide the methodology for determining the transfer, we may be able to more accurately reflect it in advance.
The General Retirement System of the City of Detroit 12

Comments (Continued)
Estimated Excess Interest Transfers
FY 2 Years Prior to Transfer Fiscal Year Investment Estimated Resulting Assets to be Transfer is ASF Balance Assumed ASF ASF Balance Estimated Return Excess ASF Return Component I Funded Percent Transferred Expected BOY Payment EOY Year Return Percent Excess Transition Cost Status Transfer Out (BOY)
(A) (B) (C) (D) (E) (F) (G) = (F) - 5.25% (H) = (G) x (B) (I) (J) (K) = (H) x (J)
2021 $ 114,225,043 $14,594,585 $ 105,249,066 2019 2.64% 0.00% $ - <100% 100% $ -2022 105,249,066 14,594,585 95,801,849 2020 -0.60% 0.00% $ - <100% 100% $ -
We understand this calculation will be performed by staff and may be different than shown above. The estimates above are used to approximate the effect on UAAL.
Section E-16(c) of the Combined General Plan is shown below:
In any Plan Year during the period beginning on or after July 1, 2014 and ending June 30, 2023 in which the annual rate of return credited to the accounts of members investing in the Annuity Savings Fund as provided in paragraph (b) is less than the actual rate of return net of expenses of the Retirement System's invested assets for the second Plan Year immediately preceding the Plan Year in which the annual rate of return is credited ("ASF Return Excess"), an amount equal to the value of the ASF Return Excess shall be transferred to the Pension Accumulation Fund maintained under Component I of the Combined Plan and shall be used to fund the Transition Cost relating to Component I. The Transition Cost is a measure of the liability that Component I of the Retirement System has at its inception; due to the fact that at its inception, members in Component I of the Retirement System receive vesting and eligibility credit under Component I for service that was earned prior to July 1, 2014 and is otherwise credited to members under Component II of the Retirement System. Transition Cost is calculated by the Plan Actuary. In the event there is an ASF return excess for a Plan Year following the Plan Year in which such transfers have fully funded the Transition Costs relating to Component I, fifty percent (50%) of such ASF Return Excess shall be transferred to the Pension Accumulation Fund maintained under Component II and the remaining fifty percent (50%) of such ASF Return Excess shall be transferred to Component I and credited to the Rate Stabilization Fund maintained under Component I. "Transition Cost" shall be determined by the Plan Actuary.
The General Retirement System of the City of Detroit 13

Comments (Continued)
Risks Associated with Measuring the Accrued Liability and Actuarially Determined Contribution
The determination of the accrued liability and the actuarially determined contribution requires the use of assumptions regarding future economic and demographic experience. Risk measures, as illustrated in this report, are intended to aid in the understanding of the effects of future experience differing from the assumptions used in the course of the actuarial valuation. Risk measures may also help with illustrating the potential volatility in the accrued liability and the actuarially determined contribution that result from the differences between actual experience and the actuarial assumptions.
Future actuarial measurements may differ significantly from the current measurements presented in this report due to such factors as the following: plan experience differing from that anticipated by the economic or demographic assumptions; changes in economic or demographic assumptions due to changing conditions; increases or decreases expected as part of the natural operation of the methodology used for these measurements (such as the end of an amortization period, or additional cost or contribution requirements based on the Plan’s funded status); and changes in plan provisions or applicable law. The scope of an actuarial valuation does not include an analysis of the potential range of such future measurements.
Examples of risk that may reasonably be anticipated to significantly affect the plan’s future financial condition include:
1. Investment Risk – actual investment returns may differ from the expected returns; 2. Asset/Liability Mismatch – changes in asset values may not match changes in liabilities, thereby
altering the gap between the accrued liability and assets and consequently altering the funded status and contribution requirements;
3. Contribution Risk – actual contributions may differ from expected future contributions. For example, actual contributions may not be made in accordance with the plan’s funding policy or material changes may occur in the anticipated number of covered employees, covered payroll, or other relevant contribution base;
4. Salary and Payroll Risk – actual salaries and total payroll may differ from expected, resulting in actual future accrued liability and contributions differing from expected;
5. Longevity Risk – members may live longer or shorter than expected and receive pensions for a period of time other than assumed; and
6. Other Demographic Risks – members may terminate, retire or become disabled at times or with benefits other than assumed resulting in actual future accrued liability and contributions differing from expected.
The effects of certain trends in experience can generally be anticipated. For example, if the investment return since the most recent actuarial valuation is less (or more) than the assumed rate, the cost of the plan can be expected to increase (or decrease). Likewise, if longevity is improving (or worsening), increases (or decreases) in cost can be anticipated.
The timely receipt of the actuarially determined contributions is critical to support the financial health of the plan. Users of this report should be aware that contributions made at the actuarially determined rate do not necessarily guarantee benefit security.
The General Retirement System of the City of Detroit 14

Comments (Continued) Plan Maturity Measures
Risks facing a pension plan evolve over time. A young plan with virtually no investments and paying few benefits may experience little investment risk. An older plan with a large number of members in pay status and a significant trust may be much more exposed to investment risk. Generally accepted plan maturity measures include the following:
2020 2019 Ratio of the market value of assets to total payroll* 5.9 6.4 Ratio of actuarial accrued liability to payroll* 10.0 10.2 Ratio of actives to retirees and beneficiaries 0.2 0.2 Ratio of net cash flow to market value of assets -12.1% -10.5% Duration of the actuarial accrued liability 8.6 8.7
* Payroll for this purpose is Component I payroll of $271.4 million for 2020 and $280.1 million for 2019.
Ratio of Market Value of Assets to Payroll
The relationship between assets and payroll is a useful indicator of the potential volatility of contributions. For example, if the market value of assets is 2.0 times the payroll, a return on assets 5% different than assumed would equal 10% of payroll. A higher (lower) or increasing (decreasing) level of this maturity measure generally indicates a higher (lower) or increasing (decreasing) volatility in plan sponsor contributions as a percentage of payroll.
Ratio of Actuarial Accrued Liability to Payroll
The relationship between actuarial accrued liability and payroll is a useful indicator of the potential volatility of contributions for a fully funded plan. A funding policy that targets a funded ratio of 100% is expected to result in the ratio of assets to payroll and the ratio of liability to payroll converging over time.
The ratio of liability to payroll may also be used as a measure of sensitivity of the liability itself. For example, if the actuarial accrued liability is 2.5 times the payroll, a change in liability 2% other than assumed would equal 5% of payroll. A higher (lower) or increasing (decreasing) level of this maturity measure generally indicates a higher (lower) or increasing (decreasing) volatility in liability (and also plan sponsor contributions) as a percentage of payroll.
The General Retirement System of the City of Detroit 15

Comments (Continued) Ratio of Actives to Retirees and Beneficiaries
A young plan with many active members and few retirees will have a high ratio of actives to retirees. A mature open plan may have close to the same number of actives to retirees resulting in a ratio near 1.0. A super-mature or closed plan may have significantly more retirees than actives resulting in a ratio below 1.0.
Ratio of Net Cash Flow to Market Value of Assets
A positive net cash flow means contributions exceed benefits and expenses. A negative cash flow means existing funds are being used to make benefits payments. A certain amount of negative net cash flow is generally expected to occur when benefits are prefunded through a qualified trust. Large negative net cash flows as a percent of assets may indicate a super-mature plan or a need for additional contributions.
Duration of Actuarial Accrued Liability
The duration of the actuarial accrued liability may be used to approximate the sensitivity to a 1% change in the assumed rate of return. For example, a duration of 10 indicates that the liability would increase approximately 10% if the assumed rate of return were lowered 1%.
Additional Risk Assessment
The Solvency Liability shown on page 7 may be considered as a risk assessment. Additional risk assessment is outside the scope of the annual actuarial valuation. Additional assessment may include scenario tests, sensitivity tests, stochastic modeling, and stress tests. We included additional risk assessments in the funding policy discussions based on the 2017 actuarial valuation. We can update those at the Board’s request.
Census Data and Approximations
Data was reported separately for Component I and Component II. Additional time was needed to reconcile these two data sets as they came from different source data. Processing time for the valuation could be shortened if data for future valuations is reconciled before being provided to GRS. We would be happy to work with the Retirement System staff to help them provide the information that is needed for the valuation. Additional information about the data approximations and assumptions may be found on page 25.
Actuarial Assumptions
The Retirement System routinely has five-year experience studies in accordance with the City ordinance. The Board has chosen to schedule the next experience study to begin subsequent to the June 30, 2020 valuation.
The General Retirement System of the City of Detroit 16

Comments (Continued)
Restoration
This valuation assumes no future restoration of Component II benefits (consistent with the expectation of the POA). Any future restoration will be reflected beginning in the next valuation after being granted.
DWSD (Water/Sewer) Projections
Based on this valuation, the DWSD (Water/Sewer) division is not expected to be fully funded by 2024. As a result, their contributions will continue to be needed in FY 2024 (see page 3 for estimated FY 2024 contributions) to fund DWSD liabilities.
Future Results
While FY 2021 investment performance is not yet available (since the fiscal year is not over), the S&P 500 and the Dow Jones Industrial Average have so far both returned substantially more than 6.75%, so far, this fiscal year. If the Retirement System’s experience is similar and that experience is not overshadowed by a reverse in the last quarter of the fiscal year, then there might be upward pressure on the funded status and downward pressure on the FY 2024 contribution requirements from investment experience during FY 2021. However, the defunding of the Retirement System through the POA mandated contribution levels will continue to put downward pressure on the funded status (the POA mandated contribution levels have already been considered in the FY 2024 contribution estimates).
Recommendation
We recommend that every potential action be taken to increase contributions to the Retirement System. Benefit payments to retirees in the Plan were almost $240 million compared to the FY 2020 contribution of $48.3 million. See benefit projections on page 30.
Prior Recommendation
The Board is currently working on the development of a funding policy for FY 2024 and beyond.
Divisional Results
Divisional results are shown on page 19. One result that stands out is the funded status of the DOT division at 33%. This is much lower than the other divisions. We expect that all of the assets back all of the liabilities. Therefore, if this division runs out of money before all of its benefits are paid, the plan will pay DOT benefits from other divisional assets. In that case, the total plan funded status is a better measure than individual division funded ratios. However, the manner in which divisional contributions have historically been determined treats each division as a standalone plan for the purpose of determining the actuarially determined contribution. Assuming the Board continues this method for Fiscal Year 2024 (the first year actuarially determined contributions are assessed to the employer), this low funded status for the DOT (relative to the other divisions) could result in a higher DOT employer contribution (relative to the other divisions). The Board may also want to consider a more aggressive funding policy for the DOT division if they want to avoid using other divisional assets to pay DOT benefits. Please let us know if the Board would like us to do any special projects related to this situation, such as divisional cash flow projections or divisional funding policy suggestions.
The General Retirement System of the City of Detroit 17

Comments (Concluded)
Conclusion
The funded status of the plan decreased this year from 62.8% to 58.8% as a result of:
Defunding of the plan due to contributions substantially less than the actuarially determined amounts would have been. This defunding was mandated by the POA; and
Poor investment experience and negative cash flow resulting in a decrease in plan assets.
The General Retirement System of the City of Detroit 18

Liability by Division - POA ($ Thousands)
General D.O.T. DWSD Library Totals
Accrued Pension Liabilities
Retirees and beneficiaries $1,098,444 $292,193 $577,270 $ 54,604 $2,022,511 Inactive members future deferred pensions 116,083 32,450 69,258 5,270 223,061 Active members 140,758 60,740 33,678 20,857 256,033 Total accrued pension liabilities 1,355,285 385,383 680,206 80,731 2,501,605 Pension fund balance# 813,797 113,433 504,778 68,660 1,500,668 Unfunded accrued pension liabilities 541,488 271,950 175,428 12,071 1,000,937
Accrued Annuity Liabilities
Retirees and beneficiaries# 55,440 10,072 31,700 3,459 100,671 Members annuities & future refunds 60,037 27,233 18,397 8,558 114,225 Total accrued annuity liabilities 115,477 37,305 50,097 12,017 214,896 Annuity fund balances 48,365 26,833 12,893 7,343 95,434 Unfunded accrued annuity liabilities# 67,112 10,472 37,204 4,674 119,462
Totals Actuarial Accrued Liabilities 1,470,762 422,688 730,303 92,748 2,716,501 Accrued Assets 862,162 140,266 517,671 76,003 1,596,102 Funded Ratio 58.6% 33.2% 70.9% 81.9% 58.8% Unfunded Actuarial Accrued Liabilities $ 608,600 $282,422 $212,632 $ 16,745 $1,120,399
Totals may be off slightly due to rounding.
# The pension fund balance includes a receivable of approximately $99.4 million for future claw-back payments. Liabilities are shown gross, before the annuity savings claw-back.
The General Retirement System of the City of Detroit 19

SECTION B FUND ASSETS

Statement of Plan Assets (Reported Assets at Market Value)
Market Value - June 30, 2020 Cash and Cash EquivalentsInvestments at Fair ValueReceivablesCash and Investments held as collateral for securities lendingCapital Assets - NetAccounts Payable
$ 26,869,406 1,464,526,814 106,835,905 65,263,754 1,849,036 (69,242,926)
Total Current Assets $ 1,596,101,989
The General Retirement System of the City of Detroit 20

Market Value of Assets Reserve Accounts
(Market Value)
Funds Fund Balances
June 30, 2020 June 30, 2019
Annuity Savings Annuity Reserve Pension Accumulation Pension Reserve
$ 114,225,043 (18,790,748)
(370,423,727) 1,871,091,421
$ 120,248,768 (10,348,572)
(223,815,149) 1,912,821,780
Total Fund Balances $ 1,596,101,989 $1,798,906,827
Revenues and Expenditures (Market Value)
Pension Funds Annuity Funds Total Funds
Balance, July 1, 2019 Prior valuation audit adjustment Market Value July 1, 2019
Revenues
$1,689,006,631 0
$109,900,196 0
$1,798,906,827 0
$1,689,006,631 $109,900,196 $1,798,906,827
Employer Contributions 47,900,000 0 47,900,000 Employee Contributions 0 0 0 Foundation Contributions 375,000 0 375,000 ASF Recoupment Interest 6,214,544 0 6,214,544 Investment Income (Net of Investment Expenses) (19,214,790) 5,212,677 (14,002,113) Other Income Total
Expenditures Benefit Payments Refund of Member Contributions ASF Recoupment Write Off Transfer to Component I (Transition Cost) Administrative Expenses Total
Market Value June 30, 2020
1,978,048 (148,505) 1,829,543 $ 37,252,802
220,351,579 0
1,710,757 1,178,130 2,351,273
$ 5,064,172
10,186,019 9,344,054
0 0 0
$ 42,316,974
230,537,598 9,344,054 1,710,757 1,178,130 2,351,273
$ 225,591,739
$1,500,667,694
$ 19,530,073
$95,434,295
$ 245,121,812
$1,596,101,989
Market Value Rate of Return (Net of all expenses) (1.0)% 5.1% (0.6)%
Net Cash Flow as Percent of Assets (10.3)% (17.8)% (10.7)%
Rates of return are dollar weighted estimates assuming contributions occur at the end of the year and remaining items are mid-year cash flows. “ASF Recoupment Interest” and “Other” items are treated as investment cash flows.
Note that interest credits to the ASF (and other reserves) are determined by plan provisions and Board policy (including any timing issues) as calculated by Retirement System staff.
The General Retirement System of the City of Detroit 21

Allocation of Assets Used for Valuation by Reserve Account and Division
June 30, 2019 Adjustment Contributions Benefit Payments Other Investment Return
(Net of All Expenses) June 30, 2020
Annuity Savings Fund General D.O.T. DWSD Library Totals
$ 61,869,974 30,004,564 19,704,141
8,670,089
$ 0 0 0 0
$ 0 0 0 0
$ (3,742,538) (4,100,326) (1,321,713)
(179,477)
$ (658,917) (77,789)
(826,993) (328,649)
$ 2,568,414 1,406,469
841,872 395,922
$ 60,036,933 27,232,918 18,397,307
8,557,885 120,248,768 0 0 (9,344,054) (1,892,348) 5,212,677 114,225,043
Annuity Reserve Fund General D.O.T. DWSD Library Totals
(6,554,374) 450,768
(3,144,710) (1,100,256)
0 0 0 0
0 0 0 0
(5,702,529) (891,411)
(3,162,076) (430,003)
585,363 40,906
801,986 315,588
0 0 0 0
(11,671,540) (399,737)
(5,504,800) (1,214,671)
(10,348,572) 0 0 (10,186,019) 1,743,843 0 (18,790,748)
Pension Accumulation Fund General D.O.T. DWSD Library Totals
(96,551,027) (123,804,114)
(25,633,520) 22,173,512
(95,742,919) (30,825,169) (47,884,037)
(4,169,095)
2,765,012 109,988
42,900,000 2,500,000
0 0 0 0
2,588,768 849,315
1,706,575 159,046
(12,750,711) (1,900,200) (5,982,828)
(932,323)
(199,690,877) (155,570,180)
(34,893,810) 19,731,140
(223,815,149) (178,621,220) 48,275,000 0 5,303,704 (21,566,062) (370,423,727)
Pension Reserve Fund General D.O.T. DWSD Library Totals
1,040,954,081 269,271,831 551,454,963
51,140,905
95,742,919 30,825,169 47,884,037
4,169,095
0 0 0 0
(123,209,115) (31,093,737) (59,667,517)
(6,381,210)
0 0 0 0
0 0 0 0
1,013,487,885 269,003,263 539,671,483
48,928,790 1,912,821,780 178,621,220 0 (220,351,579) 0 0 1,871,091,421
Retirement System Totals $1,798,906,827 $ 0 $48,275,000 $ (239,881,652) $ 5,155,199 $ (16,353,385) $1,596,101,989
The General Retirement System of the City of Detroit 22

SECTION C PARTICIPANT DATA
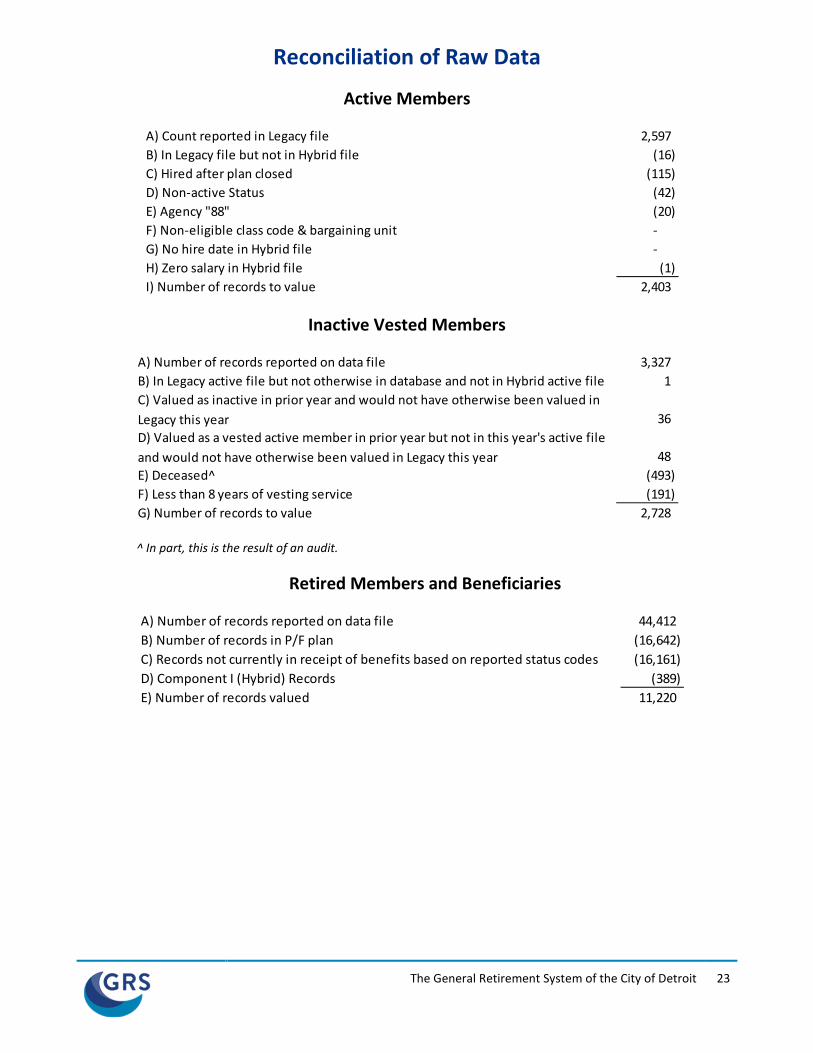
Reconciliation of Raw Data
Active Members
A) Count reported in Legacy file 2,597 B) In Legacy file but not in Hybrid file (16) C) Hired after plan closed (115) D) Non-active Status (42) E) Agency "88" (20) F) Non-eligible class code & bargaining unit -G) No hire date in Hybrid file -H) Zero salary in Hybrid file (1) I) Number of records to value 2,403
Inactive Vested Members
A) Number of records reported on data file 3,327 B) In Legacy active file but not otherwise in database and not in Hybrid active file 1 C) Valued as inactive in prior year and would not have otherwise been valued in Legacy this year 36 D) Valued as a vested active member in prior year but not in this year's active file and would not have otherwise been valued in Legacy this year 48 E) Deceased^ (493) F) Less than 8 years of vesting service (191) G) Number of records to value 2,728
^ In part, this is the result of an audit.
Retired Members and Beneficiaries
A) Number of records reported on data file 44,412 B) Number of records in P/F plan (16,642) C) Records not currently in receipt of benefits based on reported status codes (16,161) D) Component I (Hybrid) Records (389) E) Number of records valued 11,220
The General Retirement System of the City of Detroit 23

Reconciliation of Year-to-Year Data as of June 30, 2020
2019
Change in Pay/PensionsRehired (Not Vested)Rehired (Vested)New Beneficiary
Retired
Non-Duty DisabledDuty Disabled
Assumed Death/Removals
Vested TermNon-Vested Terminated
Data Adjustment
2020
Active Term. Retirees Totals
Count Pay# Count Monthly
Count Benefits Count 2,793 $142,215,060
N/A (14,180,217) 38 1,579,212
9 413,154
(80) (3,832,741)
(181) (7,814,068) (176) (7,256,096)
- -
2,403 $111,124,304
3,209
N/A -
(9)
(98)
(528)
153
1
2,728
11,557 $18,403,344
N/A (82,867)
- -91 97,566
226 309,279
- -- -
(663) (874,828)
9 11,365
11,220 $17,863,859
17,559
38 -91
48
--
(1,191)
(28) (176)
10
16,351
# This represents current pay and is not used for the Component II (Legacy) valuation.
The General Retirement System of the City of Detroit 24

Data Approximations and Assumptions
As part of our review of the data received from the System, we discussed questionable or missing data with System staff and developed approximations and assumptions in order to perform the valuation. We provided System staff with a letter dated March 22, 2021 with additional information regarding data reconciliation, processing instructions, and assumptions regarding unresolved issues. Note, that letter disclosed our remaining data processing procedures and assumptions and details our reconciliation and final valuation data. System staff has approved the detail and final data disclosed in that letter.
The purpose of this section in this report is to summarize any unresolved concerns about questionable data that are relevant and could have a significant effect on the valuation as disclosed in that letter. This summary also discusses any significant steps we have taken to improve the data due to identifying questionable data values or relationships, significant judgments, or assumptions we have applied to the data.
Active
For active members, frozen AFC amounts and frozen service as of June 30, 2014 was reported. For purposes of this valuation, we matched the June 30, 2020 actives to the active data reported for the June 30, 2014 valuation to check against AFC as of June 30, 2014. In cases where the frozen AFC as reported in the 2020 data file was less than 75% of the AFC as reported on the 2014 data file, the AFC as reported on the 2014 data file was used. This boundary was determined after an analysis of the raw AFC data showed that the AFC for several members was unreasonably low. In cases where AFC was reported in to be $0 in both the current data file and the 2014 data file, the current salary was used in place of the AFC.
Deferred Vested
Data provided for deferred vested members was incomplete. As part of the processing of deferred member data, in cases where AFC was incomplete, we used $30,000 to estimate the AFC. Component II benefit service is not directly provided on the file. The Component II (Legacy) file includes total vesting service and the Component I (Hybrid) file includes Component I benefit service. Since Component II benefit service was frozen as of June 30, 2014 for members that terminated after June 30, 2014, Component II (Legacy) benefit service was determined by subtracting service in the Component I (Hybrid) inactive file from total vesting service in the corresponding Component II (Legacy) inactive file. Members with vesting service of less than 8 years were assumed to be non-vested and were not valued. We estimated the commencement date with the following rules:
Age 55 if 30 or more years of service and hired before July 1986; Age 60 if less than 30 years of service, but more than 10 years of service and hired before 1986;
and Age 62 for all others.
The entire amount of the deferred benefit was assumed to commence at the same time regardless of the date of hire.
The General Retirement System of the City of Detroit 25

Retired and Beneficiary
It is our understanding that the current pension amount provided in the retiree data includes the 4.5% reduction as mandated in the POA. However, for members that retired prior to July 2015, the other pension amounts provided in the data (original pension amount, equated pension amount, and prior year’s pension amount) did not reflect the 4.5% reduction and, as such, were reduced by 4.5% when valuing any related liability. Other adjustments/assumptions include:
In cases where the benefit is identified to be a joint and survivor benefit and a beneficiary is not listed in the data, it was assumed that male spouses were 3 years older than females;
Benefits for dependent children are assumed to cease at age 21; and For non-converted disabled members, converted benefits are:
o assumed to commence at age 60; and o estimated, based on reported service and projected service from the date of disability to
age 60.
The General Retirement System of the City of Detroit 26

I I I I I I I
I I I I I I I
I I I I I I I
Summary of Member Data June 30, 2020 Active Members
General D.O.T. DWSD Library Totals^
Number % Change in active members Annual payroll ($ millions) Average pay % Change in average pay
1,427 (14.4)% $ 72.1 $50,498
(7.9)%
430 (20.7)% $ 15.8 $36,705
(7.2)%
336 (6.1)%
$ 14.5 $43,112 (16.7)%
210 (7.1)% $ 8.8
$41,882 (12.7)%
2,403 (14.0)% $ 111.2 $46,244
(9.2)%
^ May not add due to rounding.
Retired Members and Survivor Beneficiaries
General D.O.T. DWSD Library Totals
Number Annual benefits ($ millions) # Average benefits # % Change in reported average benefit
6,604 $ 125.2 $18,965
0.1 %
1,588 $ 30.7 $19,327
(0.1)%
2,710 $ 61.7 $22,754
(0.5)%
318 $ 6.7 $20,981
0.0 %
11,220 $ 224.3 $19,989
(0.1)%
# Includes annuities. Does not include reductions resulting from the annuity claw-backs.
Inactive Vested Members
General D.O.T. DWSD Library Totals
Number Average AFC Average service Annual benefits ($ millions) Average benefits % Change in average service % Change in average AFC
1,479 $40,051
15.4 $ 14.8
$9,997 (1.8)% 2.8 %
373 $45,429
15.2 $ 4.2 $11,212
(0.6)% 8.5 %
791 $49,515
15.3 $ 9.8
$12,370 (2.2)% 2.7 %
85 $33,994
13.8 $ 0.7 $ 8,047
(4.3)% 3.1 %
2,728 $43,342
15.3 $ 29.4 $10,790
(1.9)% 3.7 %
The General Retirement System of the City of Detroit 27

Active Members as of June 30, 2020 by Attained Age and Years of Service
Retirement System Totals
Attained Age
Years of Service to Valuation Date Totals
0-4 5-9 10-14 15-19 20-24 25-29 30 Plus No. Valuation
Payroll
Under 20 0 0 $ 0
20-24 0 0 0 0 25-29 3 1 0 4 126,953 30-34 5 41 10 0 56 2,033,790 35-39 4 35 27 17 4 87 3,523,586
40-44 10 38 42 62 31 3 186 8,018,816 45-49 9 58 49 88 97 27 1 329 15,033,294 50-54 6 31 75 108 193 66 40 519 24,588,723 55-59 8 48 47 91 182 88 154 618 28,508,378
60-64 2 26 30 67 91 71 143 430 20,408,404 65-69 1 24 19 12 23 14 38 131 6,954,147 70-74 0 2 5 9 7 2 3 28 1,266,906 75-79 0 2 2 3 2 1 5 15 661,307
Totals 48 306 306 457 630 272 384 2,403 $111,124,304
Group Averages: Age: 53.7 years
Benefit Service: 15.1 years Eligibility Service: 20.4 years
Annual Pay: $46,244
Service shown in this schedule is Legacy Benefit service plus Hybrid Benefit service.
The General Retirement System of the City of Detroit 28

■ ■ ■ ■
Expected Terminations from Active Employment for Current Active Members
81%
2%
6%
11%
Retirements Non-Vested Separations Deaths and Disabilities Vested Separations
The chart shows the expected future development of the present population in simplified terms. The Retirement System presently covers 2,403 active members. Eventually, 46 people are expected to terminate covered employment prior to retirement and forfeit eligibility for an employer provided benefit. 2,206 people are expected to receive monthly retirement benefits either by retiring directly from active service, or by retiring from vested deferred status. 151 people are expected to become eligible for benefits as a result of death-in-service or disability.
Actual versus expected retirements for the 2020 fiscal year is shown below:
Year Ended June 30, Expected Actual
2020 275 80
The General Retirement System of the City of Detroit 29

---
Expected Benefit Payments Shown below is a graph of projected benefit payments remaining in the Retirement System.
$300
DGRS - Benefit Payments
$0
$50
$100
$150
$200
$250
2021 2056
$Mill
ions
2026 2031 2036 2041 2046 2051
Fiscal Year Ending June 30
Benefits Benefits from last report
The graph above shows the projection of future expected benefit payments (solid green line) derived from the June 30, 2020 actuarial valuation data and contrasts that with the corresponding projection from the June 30, 2019 valuation data (red dashed line). The since the assumptions are the same in the two projections, the graph shows the impact that the pandemic has had on the future expected benefit projection, which is lower in the earlier years and nearly unchanged in the later years. In addition, the remaining ASF balances are assumed to be paid out over a rolling 10-year period resulting in a shift of those 10-year payments visible in the graph between last year and this.
The General Retirement System of the City of Detroit 30

Retirees and Beneficiaries June 30, 2020 Tabulated by Attained Ages Retirement System Totals
Attained Ages
Age & Service# Disability Death-in-Service Totals
No. Monthly
Allowances No. Monthly
Allowances No. Monthly
Allowances No. Monthly
Allowances
Under 20* 8 $ 6,412 0 $ 0 2 $ 1,216 10 $ 7,628
20-24 4 5,382 4 5,382 25-29 2 2,566 2 2,566 30-34 14 9,789 0 0 14 9,789 35-39 17 7,985 0 0 2 2,811 19 10,796
40-44 14 10,464 6 2,896 1 773 21 14,133 45-49 47 40,417 21 14,314 4 1,853 72 56,584 50-54 156 251,433 45 34,632 9 8,739 210 294,804 55-59 529 938,824 106 95,540 17 20,817 652 1,055,181
60-64 1,501 2,799,557 212 279,309 42 50,114 1,755 3,128,980 65-69 2,042 3,557,985 199 233,365 40 51,762 2,281 3,843,112 70-74 2,053 3,708,994 156 178,287 35 63,115 2,244 3,950,396 75-79 1,384 2,334,617 74 75,251 35 44,389 1,493 2,454,257
80-84 903 1,295,258 50 44,217 24 26,663 977 1,366,138 85-89 643 811,018 18 15,214 32 35,345 693 861,577 90-94 477 523,156 19 14,601 32 26,948 528 564,705
95 and Over 220 219,126 7 4,738 18 13,967 245 237,831
Totals 10,014 $16,522,983 913 $992,364 293 $348,512 11,220 $17,863,859
* May include records with defective birth dates. # Includes survivor beneficiaries of deceased retirees.
The General Retirement System of the City of Detroit 31

Retirees and Beneficiaries June 30, 2020 Tabulated by Year of Retirement
Year of Retirement No.
Monthly Allowances Total Average
1950 & before 3 $ 5,931 $1,977
1951-1955 3 5,323 1,774
1956-1960 1 329 329
1961-1965 6 2,314 386
1966-1970 19 8,254 434
1971-1975 64 38,558 602
1976-1980 194 143,388 739
1981-1985 413 404,277 979
1986-1990 580 615,331 1,061
1991-1995 1,102 1,356,271 1,231
1996-2000 1,348 2,012,278 1,493
2001-2005 1,841 3,454,115 1,876
2006-2010 2,030 3,800,301 1,872
2011-2015 2,429 4,215,329 1,735
2016 398 700,669 1,760
2017 250 343,777 1,375
2018 236 325,459 1,379
2019 227 309,278 1,362
2020 76 122,677 1,614
Totals 11,220 $17,863,859 $1,592
The General Retirement System of the City of Detroit 32

SECTION D METHODS AND ASSUMPTIONS

Summary of Assumptions and Methods Used for Actuarial Valuations
Adopted by the Board of Trustees All assumptions are estimates of future experience except as noted. The rationale for the assumptions is based on experience studies where noted.
Economic Assumptions
The investment return rate used in making the valuation was 6.75% per year, compounded annually (net after investment and administrative expenses). This assumption is prescribed by the Eighth Amended Plan for the Adjustment of Debts of the City of Detroit (POA).
Price inflation is not directly used in the valuation. For purposes of assessing the reasonability of the investment return assumptions, we assumed price inflation of 2.50% per year.
Non-Economic Assumptions
The mortality table used to measure retired life mortality was 100% of the RP-2014 Blue Collar Annuitant Table for set-forward 1 year for males and 100% of the RP-2014 Blue Collar Annuitant Table set-forward 1 year for females. Tables were extended below age 50 with a cubic spline to the published Juvenile rates. Pre-retirement mortality is based on the corresponding Employee tables with corresponding set-forward. The tables are projected to be fully generational, based on the 2-dimensional, sex distinct mortality improvement scale MP-2014 (which was published and intended to be used with RP-2014). 75% of all deaths-in-service are assumed to be non-duty related. This table was first used as of June 30, 2014. For disabled members, the same tables are used. The rationale for the mortality assumption is based on the 2008-2013 Mortality Experience Study issued February 4, 2015.
The probabilities of retirement for members eligible to retire are shown on pages 36 and 37. These probabilities were revised for the June 30, 2008 valuation. The rationale is based on the 2002-2007 Experience Study.
The probabilities of separation from service (including death-in-service and disability) are shown for sample ages on page 38. These probabilities were revised for the June 30, 2008 valuation. The rationale is based on the 2002-2007 Experience Study.
The General Retirement System of the City of Detroit 33
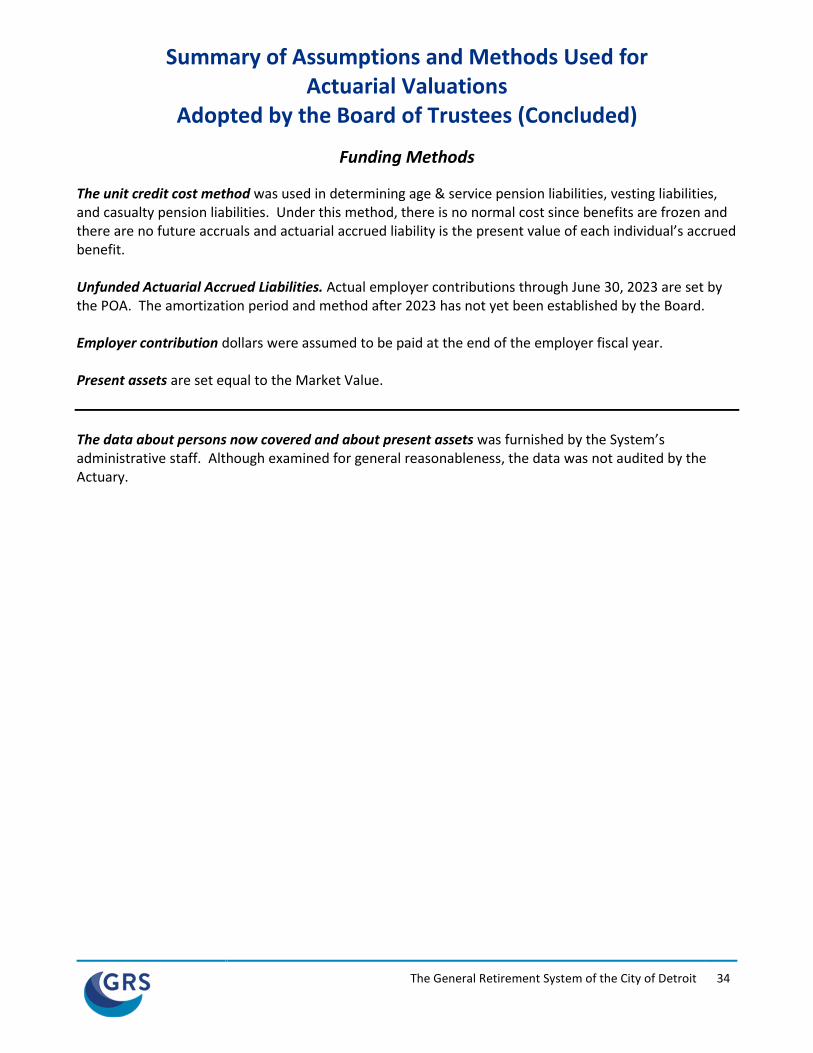
Summary of Assumptions and Methods Used for Actuarial Valuations
Adopted by the Board of Trustees (Concluded)
Funding Methods
The unit credit cost method was used in determining age & service pension liabilities, vesting liabilities, and casualty pension liabilities. Under this method, there is no normal cost since benefits are frozen and there are no future accruals and actuarial accrued liability is the present value of each individual’s accrued benefit.
Unfunded Actuarial Accrued Liabilities. Actual employer contributions through June 30, 2023 are set by the POA. The amortization period and method after 2023 has not yet been established by the Board.
Employer contribution dollars were assumed to be paid at the end of the employer fiscal year.
Present assets are set equal to the Market Value.
The data about persons now covered and about present assets was furnished by the System’s administrative staff. Although examined for general reasonableness, the data was not audited by the Actuary.
The General Retirement System of the City of Detroit 34

I I I I
Single Life Retirement Values
Based on RP-2014 Blue Collar 100% of Male Rates Set-Forward 1 Year
100% of Female Rates Set-Forward 1 Year
Sample Future Life Attained Expectancy (Years)
Ages in 2020 Men Women
45 38.83 42.17 50 33.87 37.11 55 29.10 32.20 60 24.54 27.44 65 20.23 22.86 70 16.23 18.54 75 12.59 14.57 80 9.39 11.05
The General Retirement System of the City of Detroit 35

45
50
55
60
65
70
75
80
Probabilities of Age/Service Retirement for Members Eligible to Retire
Retirement Ages
Percent of Eligible Active Members Retiring within Next Year with Unreduced Benefits EMS D.O.T. Others
25%
46 25% 47 25% 48 22% 49 20%
18% 55% 50%
51 15% 50% 50% 52 15% 50% 45% 53 15% 50% 45% 54 15% 55% 40%
15% 50% 30%
56 15% 50% 30% 57 15% 50% 30% 58 15% 50% 30% 59 15% 55% 40%
40% 40% 25%
61 30% 30% 25% 62 30% 30% 25% 63 30% 30% 25% 64 30% 30% 25%
30% 30% 35%
66 30% 30% 30% 67 30% 30% 25% 68 30% 50% 25% 69 30% 50% 25%
100% 100% 20%
71 20% 72 20% 73 20% 74 20%
20%
76 20% 77 20% 78 20% 79 20%
100% Ref 537 1648 1647
Rationale for assumption is 2002 to 2007 Experience Study. Additional retirement rates for Component I (Hybrid Plan) eligibility are not reflected in this valuation due to materiality.
The General Retirement System of the City of Detroit 36

Probabilities of Early Retirement for Members Eligible for Early Retirement
Retirement Ages
Percent of Eligible
Active Members Retiring within Next Year with
Reduced Benefits
55 7% 56 8% 57 9% 58 10% 59 12%
60 12% 61 12% 62 12% 63 12% 64 12% Ref 1649
Rationale for assumption is 2002 to 2007 Experience Study.
The General Retirement System of the City of Detroit 37

Sample Rates of Separation from Active Employment Before Retirement
Sample Ages
Years of Service
% of Active Members Separating within Next Year Withdrawal
EMS D.O.T. Others
Men Women ALL 0 11.00% 18.00% 18.00% 20.00%
1 10.00% 16.00% 15.00% 16.00% 2 8.00% 14.00% 13.00% 14.00% 3 8.00% 11.00% 11.00% 12.00% 4 7.00% 9.00% 10.00% 10.00%
25 5 & Over 6.70% 8.00% 7.60% 7.60% 30 5.90% 7.60% 7.22% 7.22% 35 5.20% 5.56% 5.28% 5.28% 40 4.40% 4.26% 4.05% 4.05%
45 3.40% 3.69% 3.51% 3.51% 50 2.40% 3.50% 3.33% 3.33% 55 2.00% 3.50% 3.33% 3.33% 60 0.00% 3.50% 3.33% 3.33% Ref 338
1068 143 212
584 212 x 0.95
188 212 x 0.95
Sample % of Active Members Becoming Disabled within Next Year
D.O.T. Others Ages Ordinary Duty Ordinary Duty
25 30 35 40 45 50 55 60
0.02% 0.05% 0.14% 0.27% 0.51% 0.66% 0.76% 0.86%
0.03% 0.08% 0.21% 0.42% 0.79% 1.03% 1.18% 1.34%
0.01% 0.04% 0.11% 0.21% 0.40% 0.51% 0.59% 0.67%
0.25% 0.29% 0.34% 0.39% 0.45% 0.52% 0.60% 0.70%
Ref 23 x 0.45 23 x 0.70 23 x 0.35 423 x 0.90
Rationale for assumption is 2002 to 2007 Experience Study.
The General Retirement System of the City of Detroit 38

Miscellaneous and Technical Assumptions Benefit Service
Decrement Operation
Decrement Timing
Eligibility Testing
Forfeitures
Incidence of Contributions
Marriage Assumption
Normal Form of Benefit
Service Credit Accruals
Administrative Expenses
Sick Leave
Member Contributions
Pop-Up Benefits
Exact Fractional service is used to determine the amount of benefit payable.
Disability and mortality decrements do not operate during the first five years of service. Disability and withdrawal do not operate during retirement eligibility.
Decrements of all types are assumed to occur mid-year.
Eligibility for benefits is determined based upon the age nearest birthday and rounded service on the date the decrement is assumed to occur.
None.
Contributions are assumed to be received at the end of the year.
100% of males and 100% of females are assumed to be married for purposes of death-in-service benefits. Male spouses are assumed to be three years older than female spouses for active member valuation purposes.
Straight life is the normal form of benefit. The Board adopted assumptions for Actuarial Equivalence to be an 80%/20% unisex blend of RP-2014 mortality (Male/Female) with Blue Collar Adjustment, set ahead one year for males and females, projected 11 years with MP-2014, an interest rate of 6.75%, and no COLA for optional forms of payment and early retirement reduction. Assumptions for annuitizing member contributions are the same except for using a 60%/40% unisex blend and a 5.25% assumed rate of interest. Prior to the use of these factors, actuarial equivalent factors were based on 7.5% interest and the 1984 Group Annuity Mortality table.
Service accruals stop as of June 30, 2014 for measurement of Component II liabilities. However, future service in Component I may be used to satisfy benefit eligibility requirement in Component II. Members who became duty disabled prior to June 30, 2014 are assumed to get projected service from date of disability to conversion date. Member who become disabled after June 30, 2014 are assumed to get their frozen accrued benefit as of June 30, 2014 at date of conversion.
The investment return assumption is mandated to be net of investment and administrative expense in the plan document. No other provision for administrative expenses is included in this valuation.
Sick leave banks as of June 30, 2014 were included in the 2014 data file provided by the System.
Member contributions to this Component II plan are assumed to have ceased with the bankruptcy.
For current retirees with a pop-up benefit, the value of the pop-up was estimated by valuing a non-pop-up option and increasing the associated liabilities by 2%.
Rationale for assumption is 2002 to 2007 Experience Study, modified as necessary for changes in data or administration.
The General Retirement System of the City of Detroit 39

SECTION E PLAN PROVISIONS

Summary of Benefit Provisions Evaluated
Component II Frozen Benefits
All Component II benefits are frozen as of June 30, 2014 based on service and average final compensation accrued as of that date and the provisions of the Detroit General Retirement System as it existed on June 30, 2014. Frozen benefits are further reduced by 4.5% and all future cost-of-living adjustments (“COLAs”) were eliminated. Benefits resulting from the Annuity Savings Fund and benefits paid from the Annuity Reserve Fund were subject to a separate reduction described as a “Claw-back.” Details of the claw-back provision are complicated and can be found in the Eighth Amended Plan of Adjustment. The benefits evaluated in this report are the frozen reduced benefits after adjusting the assets for the claw-back. Component II benefits are payable after separation from service, upon meeting the eligibility conditions of the plan as it existed on June 30, 2014, regardless of whether the individual is eligible to receive a Component I benefit at that time.
Our understanding of the June 30, 2014 plan provisions is provided below for completeness. The material below does not have legal standing and is not intended to cover all potential situations that could occur. If there are discrepancies between the description below and appropriate legal documents, the latter necessarily govern.
Age and Service Pension
Eligibility - Any age (minimum age 55 for non-EMS members hired after 1995) with 30 years of service (25 for EMS members), or age 60 with 10 years of service, or age 65 with 8 years of service.
Annual Amount - EMS Members: Sum of a) a basic pension of $12 for each of the first 10 years of service, plus b) a pension equal to 2.0% of AFC multiplied by years of service. Maximum benefit is 90% of AFC.
Other Members: Sum of a) a basic pension of $12 for each of the first 10 years of service, plus b) a pension equal to the first 10 years of service multiplied by 1.6% of AFC, plus 1.8% of AFC for each year of service greater than 10 years up to 20 years, plus 2.0% of AFC for each year of service greater than 20 years up to 25 years, plus 2.2% of AFC for each year of service greater than 25 years. Future benefit accruals for certain active members (depending on bargaining unit) were reduced to 1.5% of final average compensation per year of service.
Type of Average Final Compensation (AFC) - Highest 3 consecutive years out of the last 10. Pension benefits will not be diminished if compensation is reduced because of a fiscal emergency. Effective July 1, 1999, in computing the AFC, a member shall have the option of adding the value of 25% of unused accrued sick leave to the earnings used in computing the AFC. Longevity is added to AFC in accordance with the following schedule: $150 after 5 years, $300 after 10 years, $450 after 15 years, $600 after 20 years, and $750 after 25 years.
Early Retirement
Eligibility - Any age with 25 or more years of service (min. age 55 for members hired after 1995).
Annual Amount - Same as regular retirement but actuarially reduced.
The General Retirement System of the City of Detroit 40

Summary of Benefit Provisions Evaluated (Continued)
Deferred Retirement (Vested Benefit) Eligibility - Hired prior to 7-1-80: Age 40 with 8 years of service. Hired on or after 7-1-80: Any age with 10 years of service.
Benefit Commencement - APTE hired prior to July 1, 1988: Benefit begins at the age the member would have become eligible for regular retirement if service had continued. SAAA, Non-Union and lawyers hired prior to June 30, 1986: Benefit begins at the age the member would have become eligible for regular retirement. Others: Benefits based on service rendered by June 30, 1986 begin at the age the member would have become eligible for regular retirement. Benefits based on service rendered after July 1, 1986 begin at age 62.
Annual Amount - Same as regular retirement but based on average final compensation and service at the time of termination.
Duty Disability Retirement Eligibility - Service related disability before eligibility for service retirement prior to and July 1, 2014. No service requirement.
Annual Amount - An annuity which is the actuarial equivalent of the accumulated contributions at date of disability plus a pension of two-thirds of average final compensation at time of disability. The maximum annual pension is $5,700 ($9,000 for EMS). At the earliest of when the member would have accrued 30 years of service credit (25 for EMS) or age 60, the annuity is recomputed assuming contributions would have continued at a salary level equal to final compensation. The pension is recomputed with additional service credit granted from the date of disability to age 60 (or 30 years of service credit) or June 30, 2014, whichever is earlier. Benefits payable prior to conversion/re-computation, if any, were assumed to be paid outside the trust.
Non-Duty Disability Retirement Eligibility - Disability from any cause before age 60 with 10 or more years of service prior to July 1, 2014.
Annual Amount - Computed in the same manner as a regular retirement benefit. Maximum annual pension to age 60 is $6,000. Benefit is recomputed at age 60 with no maximum. Benefits payable prior to age 60, if any, were assumed to be paid from outside the trust.
Duty Death Before Retirement Eligibility - Death from service related causes. No age or service requirements.
Annual Amount - One-third of final compensation as of June 30, 2014 to the surviving spouse for life or until remarriage, plus an equal share of 1/4 of final compensation to each unmarried child under age 18. If there is no eligible spouse, eligible children each receive 1/4 of final compensation; if there are more than 2 such children, each child shares an equal part of 1/2 of final compensation. Maximum total amount for spouse and children is $9,000 annually. If there is no eligible spouse or children, dependent parents each receive 1/6 of deceased’s final compensation, to a total maximum of $600 annually.
The General Retirement System of the City of Detroit 41

Summary of Benefit Provisions Evaluated (Concluded)
Non-Duty Death Before Retirement Eligibility - Death-in-service at any age with 15 years of service; or after age 60 with 10 years of service; or after age 65 with 8 years of service.
Annual Amount - To Surviving Spouse: Computed as a regular retirement benefit but reduced in accordance with a 100% joint and survivor election for members with 20 or more years of service. For members with 15 years of service but less than 20, benefit is reduced in accordance with a 50% joint and survivor election. To Dependent Children if no Surviving Spouse: $9,000 payable to age 19 of the youngest child or for life if child is physically or mentally impaired for members with 20 or more years of service ($6,000 if less than 20 years of service).
Post-Retirement Cost-of-Living Adjustments Benefit is increased annually by 2.25% of the original pension amount at retirement. Post-retirement cost-of-living increases were eliminated on future accruals for certain active members (depending on bargaining unit).
Member Contributions Members have the option of choosing one of four contribution amounts: (1) 0%; (2) 3.0% of compensation up to the Social Security wage base, plus 5.0% of compensation in excess of the Social Security wage base; (3) 5.0% of total compensation; or (4) 7.0% of total compensation. Member contributions can be paid as a lump sum or annuitized at retirement to provide an annuity in addition to the pension (which is not affected by the level of member contributions).
The General Retirement System of the City of Detroit 42

SECTION F GLOSSARY

Glossary Actuarial Accrued Liability. The difference between (i) the actuarial present value of future plan benefits, and (ii) the actuarial present value of future normal cost. Sometimes referred to as “accrued liability” or “past service liability.”
Accrued Service. The service credited under the plan which was rendered before the date of the actuarial valuation.
Actuarial Assumptions. Estimates of future plan experience with respect to rates of mortality, disability, turnover, retirement, rate or rates of investment income and salary increases. Decrement assumptions (rates of mortality, disability, turnover and retirement) are generally based on past experience, often modified for projected changes in conditions. Economic assumptions (salary increases and investment income) consist of an underlying rate in an inflation-free environment plus a provision for a long-term average rate of inflation.
Actuarial Cost Method. A mathematical budgeting procedure for allocating the dollar amount of the “actuarial present value of future plan benefits” between the actuarial present value of future normal cost and the actuarial accrued liability. Sometimes referred to as the “actuarial funding method.”
Actuarial Equivalent. A single amount or series of amounts of equal value to another single amount or series of amounts, computed on the basis of the rate(s) of interest and mortality tables used by the plan.
Actuarial Present Value. The amount of funds presently required to provide a payment or series of payments in the future. It is determined by discounting the future payments at a predetermined rate of interest, taking into account the probability of payment.
AFC. Average Final Compensation.
Amortization. Paying off an interest-bearing liability by means of periodic payments of interest and principal, as opposed to paying it off with a lump sum payment.
APTE. Association of Professional and Technical Employees.
ASF. Annuity Savings Fund
Contribution Budgeting Liability. An expected return-based measure of pension obligation.
DIA. Detroit Institute of Art.
D.O.T. Department of Transportation.
DWSD. Detroit Water and Sewerage Department.
EMS. Emergency Medical Service.
The General Retirement System of the City of Detroit 43

Glossary Experience Gain (Loss). A measure of the difference between actual experience and that expected based upon a set of actuarial assumptions during the period between two actuarial valuation dates, in accordance with the actuarial cost method being used.
GASB. The Governmental Accounting Standards Board.
GLWA. Great Lakes Water Authority.
Normal Cost. The annual cost assigned, under the actuarial funding method, to current and subsequent plan years. Sometimes referred to as “current service cost.” Any payment toward the unfunded actuarial accrued liability is not part of the normal cost.
PAF. Pension Accumulation Fund.
Plan of Adjustment or POA. The 8th Amended Plan for the Adjustment of the Debt of the City of Detroit.
Reserve Account. An account used to indicate that funds have been set aside for a specific purpose and are not generally available for other uses.
SAAA. Senior Accountants, Analysts, and Appraisers Association.
Solvency Liability. A market-based measure of the present value of accrued benefits at a municipal bond discount rate unadjusted for the credit quality of the plan sponsor.
Unfunded Actuarial Accrued Liability. The difference between the actuarial accrued liability and valuation assets. Sometimes referred to as “unfunded accrued liability.”
UTGO. Unlimited Tax General Obligation.
Valuation Assets. The value of current plan assets recognized for valuation purposes.
The General Retirement System of the City of Detroit 44

Police and Fire Retirement System of the City of Detroit – Annual Actuarial Valuation of Component II, June 30, 2020
(Attachment 2)

GRS
The Police and Fire Retirement System of the City of Detroit Annual Actuarial Valuation of Component II June 30, 2020

800.521.0498 I P: 248.799.9000 I w.vw.grsconsulting.com
One Towne Square Suite 800 Southfield. Michigan 48076-3723
April 27, 2021
Board of Trustees The Police and Fire Retirement System of the City of Detroit
Dear Board Members:
This report provides key results of the Annual Actuarial Valuation of the annuity and pension liabilities of the Police and Fire Retirement System of the City of Detroit – Component II benefits. The date of the valuation was June 30, 2020.
The City of Detroit filed for bankruptcy on July 18, 2013. A final Plan of Adjustment (“POA”) was confirmed on November 7, 2014 and the official exit from bankruptcy was on December 10, 2014. In connection with the POA, very significant changes were made to the benefits that the Police and Fire Retirement System provide and to the contributions that it will receive. In particular, the benefits provided by the Retirement System were divided into two separate plans, referred to as “Component I” and “Component II.” The benefits provided in each component were effective July 1, 2014 and are described in detail in the Emergency Manager Order No. 44, dated December 8, 2014. In very general terms, Component I provide benefits for service rendered on and after July 1, 2014 and Component II provides benefits for service rendered prior to July 1, 2014.
The results provided herein relate solely to the Component II benefits. Component I benefits are the subject of a separate report. The purposes of the valuation are:
1. To measure the funding progress of Component II in accordance with the terms of the POA; 2. To provide illustrative actuarially determined contribution amounts for FY 2021; 3. To compare the illustrative actuarially determined contributions to the POA mandated contributions;
and 4. To estimate the FY 2024 actuarially determined contributions (the first year the employer will be
required to make actuarially determined contributions adopted by the Board and Investment Committee) under possible funding policies amounts. This report includes calculations based upon the Board approved funding policy shown in the appendix.
The results of the valuation are not applicable for other purposes. In particular, the information provided in this report is not suitable for financial reporting in connection with GASB Statement No. 67. Such information was provided in a separate report. Information regarding potential benefit restoration as allowed for in the POA will also be provided in a separate report at the Board’s request.
The contribution amounts on page 4 include POA stipulated contributions plus two illustrative contribution amounts from alternate funding policies. Users of this report should be aware that contributions made at any of these amounts do not guarantee benefit security.

Board of Trustees The Police and Fire Retirement System
of the City of Detroit April 27, 2021 Page 2
This report was prepared at the request of the Board and is intended for use by the Retirement System and those designated or approved by the Board. This report may be provided to parties other than the System only in its entirety and only with the permission of the Board. GRS is not responsible for unauthorized use of this report.
Future actuarial measurements may differ significantly from the current measurements presented in this report due to such factors as: plan experience differing from that anticipated by the economic and demographic assumptions; changes in economic or demographic assumptions; increases or decreases expected as part of the natural operation of the methodology used for these measurements (such as the end of an amortization period or additional cost or contribution requirements based on the plan’s funded status); and changes in plan provisions or applicable law. Due to the limited scope of the actuary’s assignment, the actuary did not perform an analysis of the potential range of such future measurements.
The valuation was based upon records maintained and furnished by the Retirement System staff concerning active members, retirees and beneficiaries, and financial accounts as of the valuation date. Data was checked for year-to-year consistency, but was not audited by the actuary. We are not responsible for the completeness or accuracy of the data. Certain data was not available in time to produce the results in this report and it was necessary for us to use approximations. Please see related discussion in the Comments section as well as the Data section of this report.
The assumptions used in the valuations concerning future experience are summarized in the Appendix of this report. Except for the assumed rate of investment return, the actuarial assumptions used for the valuation are set by the Board based upon discussion with the actuary and other parties. The assumed rate of investment return was set to 6.75% in the POA and is, therefore, a “prescribed assumption set by another party” as discussed in Actuarial Standard of Practice No. 4. We have reviewed the assumed rate of asset return based on the System’s asset allocation and, in our professional judgment, believe it is reasonable for purposes of the measurement. In our judgement, all of the other actuarial assumptions used for the valuation are also reasonable for purposes of the measurement being taken.
This report does not reflect events occurring after the valuation date. In particular, it does not reflect the full impact of COVID-19 that is likely to affect economic and demographic experience during calendar year 2021 and possibly beyond.
This report was prepared using our proprietary valuation model and related software which in our professional judgment has the capability to provide results that are consistent with the purposes of the valuation and has no material limitations or known weaknesses. We performed tests to ensure that the model reasonably represents that which is intended to be modeled. We are relying on the GRS actuaries and Internal Software, Training, and Processes Team who developed and maintain the model.
This report has been prepared by individuals who have substantial experience valuing public sector retirement systems. To the best of our knowledge, this report is complete and accurate and was made in accordance with standards of practice promulgated by the Actuarial Standards Board.

k~
~,tf,~ •• .s
~.,,t:J.~
Board of Trustees The Police and Fire Retirement System
of the City of Detroit April 27, 2021 Page 3
The individuals signing the report are independent of the plan sponsor.
David T. Kausch, Judith A. Kermans, and Jamal Adora are Members of the American Academy of Actuaries (MAAA), and meet the Qualification Standards of the American Academy of Actuaries to render the actuarial opinions contained herein.
This report does not evaluate the plan sponsor’s ability or willingness to make contributions to the Retirement System. Given the funded level of this plan, plan sponsor contributions are critical if further benefit reductions are to be avoided. Please note that the employer contributions set forth in the POA are expected to lead to a decrease in the funded status through June 30, 2023 (as contemplated by the POA), even if all assumptions are met.
Respectfully submitted,
David T. Kausch, FSA, EA, FCA, MAAA, PhD
Judith A. Kermans, EA, FCA, MAAA
Kenneth G. Alberts
Jamal Adora, ASA, EA, MAAA
DTK/JAK/KGA/JA:ah

Table of Contents Page
Valuation Results
Principle Valuation Results ................................................................................................1-7 Expected Terminations from Active Employment................................................................8 Expected Benefit Payments ..................................................................................................9 Comments, Recommendations and Conclusion ...........................................................10-16 Risk Measures ................................................................................................................17-23
Data Furnished for Valuation
Summary of Benefit Provisions......................................................................................24-26 Reported Assets .............................................................................................................27-28 Member Data Included in Valuation..............................................................................29-40
Appendix I Assumptions and Glossary
Methods and Assumptions ............................................................................................41-48 Glossary..........................................................................................................................49-50
Appendix II Funding Policy
Funding Policy ................................................................................................................51-55 Glossary...............................................................................................................................56 Assets ..................................................................................................................................57
The Police and Fire Retirement System of the City of Detroit – Component II

VALUATION RESULTS

Valuation Results (Continued) Executive Summary
($ in Millions)
Valuation Date June 30, 2020 June 30, 2019 Contributions For Fiscal Year Ending June 30, 2022 June 30, 2021
POA Mandated Employer Contributions $ 18.3 $ 18.3
Membership Number of: Active Members 1,369 1,551 DROP Members 757 764 Retirees and Beneficiaries 7,960 8,102 Inactive, Nonretired Members 389 394 Total 10,475 10,811 Valuation Payroll $ 71.8 $ 105.2
Assets Market Value (1) $ 2,417.2 $ 2,670.8 Return on Market Value (net of administrative expenses) 1.20 % 3.54 %
Actuarial Information Actuarial Accrued Liability (2) $ 3,725.3 $ 3,843.3 Unfunded Actuarial Accrued Liability: (2) - (1) 1,308.1 1,172.4 Funded Ratio: (1) / (2) 64.89 % 69.49 %
Risk Metrics Actuarial Accrued Liability Divided by Payroll 51.9 36.5 Market Value of Assets Divided by Payroll 33.6 25.4
The Police and Fire Retirement System of the City of Detroit - Component II 1

Valuation Results (Continued) Valuation Results
Actual POA Contributions Required contributions to the Plan through FY 2023 are provided in the POA. The schedule below details our understanding of the remaining contributions required by the POA.
Contribution Fiscal Year (Millions)
2021 $ 18.3 2022 18.3 2023 18.3
We have assumed that the contributions outlined above (as called for in the POA with adjustments) will not change. An estimate of the probability of those payments being made was outside the scope of this project, not required by Actuarial Standards, and not made.
Estimated 2024 Contributions In order to help the Board assess the longer term implications of the funding requirements dictated in the POA, we have estimated the contribution that will be needed in 2024 when actuarially determined contributions will again be required according to the Plan.
We have recommended that the Board establish a funding policy for the contribution determinations on and after Fiscal Year 2024. The Board has accepted this recommendation and has approved the funding policy shown in the appendix in this report.
The Estimated Employer Contribution for FY 2024 shown on the following page is based on a projection of results assuming only the POA contributions are made and all future experience between the valuation date and FY 2024 is as assumed. Actual experience will impact the final result (which will be based on the June 30, 2022 actuarial valuation) and could be materially different than shown.
The Police and Fire Retirement System of the City of Detroit - Component II 2

Valuation Results (Continued)
($ millions)
POA Estimates Board Adopted Funding
Policy
UAAL1 as of June 30, 2020 Anticipated POA Contribution for FY 2021 Anticipated Expenses2
Interest at 6.75%
$ 1,308.1 18.3
-88.3
$ 1,183.2 18.3
-79.9
Projected UAAL1 as of June 30, 2021 $ 1,378.1 $ 1,244.8
Anticipated POA Contributions for FY 2022 18.3 18.3
Estimated Employer Contributions for FY 20243
Amortization Period Beginning in FY 2024
Level Principal
Level Dollar
$
$
30
154.5
120.4
20
$ 127.8
1Unfunded Actuarial Accrued Liability. POA Estimates use the market value of assets while the Board Approved Funding Policy uses the Funding Policy Assets (FPA) shown on page 4.
2In accordance with the Plan Document, the mandated 6.75% rate of return is net of investment and administrative expenses. Contributions are assumed to be made at the end of the year.
3Total estimated employer contributions needed, including amounts paid by employer but funded from other sources as required by the POA.
The POA contributions will continue to result in a defunding of the plan between now and June 30, 2023, which was contemplated by the POA. In fact, the anticipated POA contribution for FY 2020 is about one fifth of the interest that will accrue on the UAAL and about 6% of the annual benefit payments.
The Police and Fire Retirement System of the City of Detroit - Component II 3

-- ......
Valuation Results (Continued)
$-
$20
$40
$60
$80
$100
$120
$140
$160
2021 2026 2031 2036 2041 2046 2051
$Mill
ions
Fiscal Year Ending June 30
PFRS - Employer Contributions
Board Adopted Policy (20-Year Level Dollar with FPA) 30-Year Level Dollar with MVA
Notes: • All actuarial assumptions are assumed to be met exactly each year in the projection (i.e., no future
gains or losses). For the two scenarios shown, the rate of return on funding policy assets and rate of return on market value of assets are assumed to be 6.75%. Since the funding policy assets are higher than the market value of assets as of June 30, 2020, there are deferred losses in the smoothing method. This means that earning 6.75% on the market value of assets would result in rates of return below 6.75% on the funding policy assets. The 6.75% scenario on the funding policy assets implicitly assumes rates of return above 6.75% on the market value to make up for deferred losses.
• POA contributions are assumed through June 30, 2023. • The Board approved policy contributions are based on the funding policy assets. Since the market
value of assets is lower than the funding policy assets, a 20-year amortization based on the market value of assets would be higher.
The Police and Fire Retirement System of the City of Detroit - Component II 4

- --
- -
Valuation Results (Continued)
$1,500
$Mill
ions
$1,200
$900
$600
$300
$-2020
PFRS Funding Projection 30-Year Leval Dollar with MVA
2025 2030 2035 2040 2045 2050 Valuation Date June 30
UAL $ Funded Level %
100%
80%
60%
40%
20%
0%
Fund
ed L
evel
$Mill
ions
$1,500
$1,200
$900
$600
$300
$-2020
PFRS Funding Projection Board Adopted Policy (20-Year Leval Dollar with FPA)
2025 2030 2035 2040 2045 2050 Valuation Date June 30
UAL $ Funded Level %
100%
80%
60% Fu
nded
Lev
el
40%
20%
0%
The Police and Fire Retirement System of the City of Detroit - Component II 5
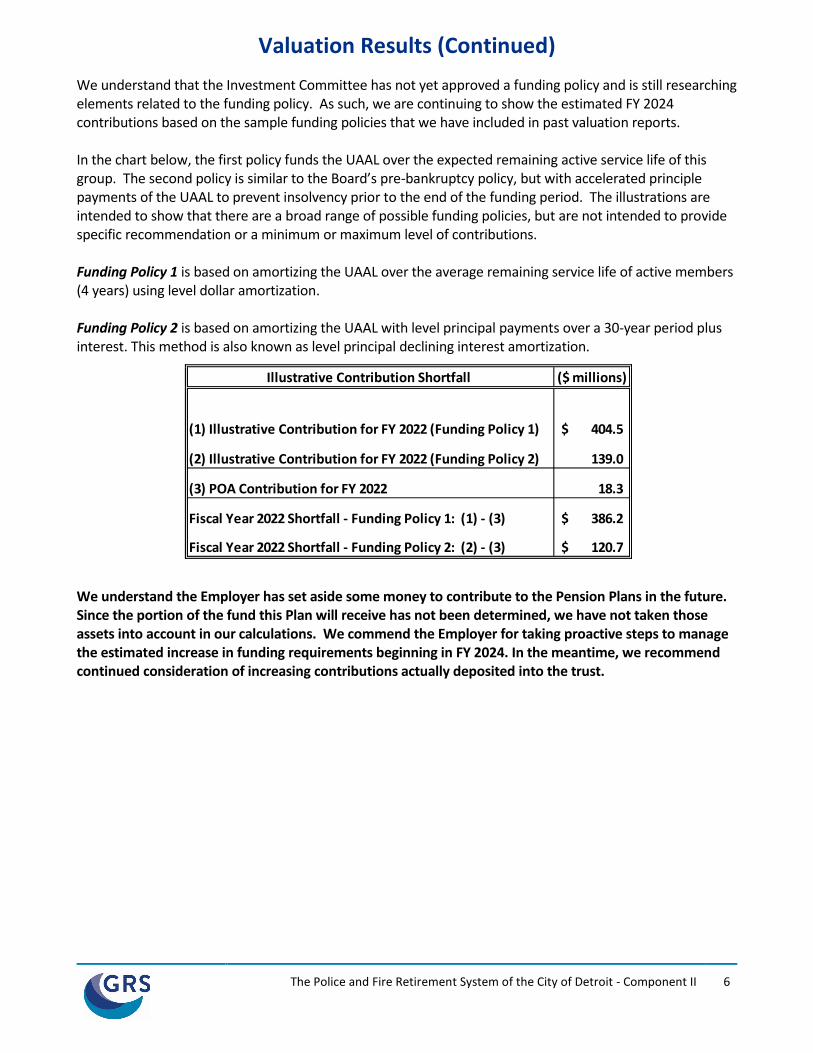
Valuation Results (Continued) We understand that the Investment Committee has not yet approved a funding policy and is still researching elements related to the funding policy. As such, we are continuing to show the estimated FY 2024 contributions based on the sample funding policies that we have included in past valuation reports.
In the chart below, the first policy funds the UAAL over the expected remaining active service life of this group. The second policy is similar to the Board’s pre-bankruptcy policy, but with accelerated principle payments of the UAAL to prevent insolvency prior to the end of the funding period. The illustrations are intended to show that there are a broad range of possible funding policies, but are not intended to provide specific recommendation or a minimum or maximum level of contributions.
Funding Policy 1 is based on amortizing the UAAL over the average remaining service life of active members (4 years) using level dollar amortization.
Funding Policy 2 is based on amortizing the UAAL with level principal payments over a 30-year period plus interest. This method is also known as level principal declining interest amortization.
Illustrative Contribution Shortfall ($ millions)
(1) Illustrative Contribution for FY 2022 (Funding Policy 1) $ 404.5
(2) Illustrative Contribution for FY 2022 (Funding Policy 2) 139.0
(3) POA Contribution for FY 2022 18.3
Fiscal Year 2022 Shortfall - Funding Policy 1: (1) - (3) $ 386.2
Fiscal Year 2022 Shortfall - Funding Policy 2: (2) - (3) $ 120.7
We understand the Employer has set aside some money to contribute to the Pension Plans in the future. Since the portion of the fund this Plan will receive has not been determined, we have not taken those assets into account in our calculations. We commend the Employer for taking proactive steps to manage the estimated increase in funding requirements beginning in FY 2024. In the meantime, we recommend continued consideration of increasing contributions actually deposited into the trust.
The Police and Fire Retirement System of the City of Detroit - Component II 6

Valuation Results (Concluded)
Present Value June 30, 2020 June 30, 2019
Accrued Pension Liabilities
Retirees and beneficiaries
Inactive members future deferred pensions
Active members
$3,023,739,174
53,105,662
504,197,443
$3,055,699,278
61,658,034
577,882,824
Total accrued pension liabilities
Pension fund balances
3,581,042,279
2,272,972,647
3,695,240,136
2,522,817,278
Unfunded accrued pension liabilities $1,308,069,632 $1,172,422,858
Accrued Annuity Liabilities
Retirees and beneficiaries Future annuities Reserve for outstanding refunds & contingencies
$ 3,524,584
26,894,729
$ 3,730,401
26,819,139
Total
Members annuities & future refunds
$ 30,419,313
113,856,180
$ 30,549,540
117,476,538
Total accrued annuity liabilities
Annuity fund balances
144,275,493
144,275,493
148,026,078
148,026,078
Unfunded accrued annuity liabilities $ 0 $ 0
System Totals
Actuarial accrued liabilities
Accrued assets
$3,725,317,772
2,417,248,140
$3,843,266,214
2,670,843,356
Unfunded actuarial accrued liabilities $1,308,069,632 $1,172,422,858
The Police and Fire Retirement System of the City of Detroit - Component II 7

■ ■ ■ ■
Expected Terminations from Active Employment for Current Active Members
92%
1% 4%
3%
Retirements Non-Vested Separations Death and Disabilities Vested Separations
The chart above shows the expected future development of the present population in simplified terms. The Retirement System presently covers 1,369 active members (excluding 757 members currently in the DROP). Eventually, 15 members are expected to terminate covered employment prior to retirement and forfeit eligibility for an employer provided benefit. 1,301 members are expected to receive monthly retirement benefits either by retiring directly from active service (including DROP), or by retiring from vested deferred status. 53 members are expected to become eligible for death-in-service or disability benefits.
The Police and Fire Retirement System of the City of Detroit - Component II 8

---
Expected Benefit Payments Shown below is a graph of projected benefit payments remaining in the Retirement System.
PFRS - Benefit Payments
$80
$160
$240
$320
$Mill
ions
2021 2026 2031 2036 2041 2046
Fiscal Year Ending June 30
Benefits Benefits from last report
$-2051
The graph above shows the projection of future expected benefit payments (solid green line) derived from the June 30, 2020 actuarial valuation data and contrasts that with the corresponding projection from the June 30, 2019 valuation data (red dashed line). Since the assumptions are the same in the two projections, the graph shows the impact that the pandemic has had on the future expected benefit projection, which is lower in the earlier years and nearly unchanged in the later years. In addition, the remaining ARF balances are assumed to be paid out over a rolling 10-year period resulting in a shift of those 10-year payments visible in the graph between last year and this.
The Police and Fire Retirement System of the City of Detroit - Component II 9

Comments, Recommendations and Conclusion Experience Experience was less favorable than assumed during the year ending June 30, 2020. The main sources of the losses were investment experience. These losses were partially offset by demographic experience gains such as mortality (more retiree deaths then assumed), retirement (fewer retirements than assumed) and terminations (more terminations than assumed). The chart below shows the estimated total experience loss and the portion of the gain/loss due to investments.
Development of Actuarial Gain/(Loss) ($ millions)
(1) UAAL1 as of June 30, 2019 (2) POA Contribution FY 2020 (3) Interest at 6.75% (4) Benefit Changes
$ Millions $ 1,172.4
18.3 79.1 -
(5) Projected UAAL1 as of June 30, 2020 (1) - (2) + (3) + (4) (6) Actual UAAL1 as of June 30, 2020
$ 1,233.3 1,308.1
Gain or Loss: (5) - (6) Gain or Loss from Investments Gain or Loss from Excess Interest Transfers (Inc. FY 2019) Gain or Loss from Liabilities
$ (74.8) (139.8)
0.4 64.6
1Unfunded Actuarial Accrued Liability.
Type of Risk Area
Gain or Loss in Period1
Totals ($ in millions)
Percent of Beginning of Year Liabilities2
Terminated Vested Data Audit $ 6.7 0.2 %
Other Data Improvements3 13.7 0.4 %
Excess Interest Transfers (Inc. FY 2019)
Risks Related to Assumptions
Economic Risk Areas:
0.4 0.0 %
Investment Return
Demographic Risk Areas:
(139.8) (3.6)%
Full and Reduced Service Retirements 1.9 0.0 %
Death Benefits (0.3) 0.0 %
Disability Benefits (2.7) (0.1)%
Other Terminations 16.0 0.4 %
Post-Retirement Mortality (Inc. DROP) 29.3 0.8 %
Total Gain or Loss During Period (74.8) (1.9)%
1Results are approximate due to limitations in data. 2Beginning of year accrued liabilities is equal to $3,843.3 million.
3Net of adjustments to modeling as a result of data changes.
The Police and Fire Retirement System of the City of Detroit – Component II 10

Comments, Recommendations and Conclusion
Experience (Continued) A summary of Actual (A) to Expected (E) activity is shown in the table below).
Actives Number Added Terminations During Year
Year During Normal Disability Died-in- Withdrawal Retiree Ended Year Retirement Retirement Service Vested Other Total Deaths1
June 30 A E A E A E A E A A A E A E 2019 5 0 157 363 18 12 0 1 23 8 31 18 281 247 2020 8 0 121 391 8 10 0 1 45 16 61 13 405 247
1Includes DROP
Member Experience Additional Comments • Retirements were less than one-third the number expected. • Vested Terminations were nearly three times the number expected. • Post Retirement mortality was more than one and one-half times the number expected.
The year ending June 30, 2020 was unique due to the Covid-19 pandemic as well as the City’s response. The pandemic, by itself, appears to have increased retiree mortality. However, the liability gain related to the increase in mortality was less than the number counts would imply. This suggests that the pandemic had a bigger impact on the older, lower liability population of the plan. This valuation is only six months into the pandemic and we expect higher mortality for at least the next six months following the valuation date. Given all the uncertainty regarding this experience, we have not attempted to account for this potential liability risk in this valuation. While we do not have the cause of death in the census data, it is likely that a significant portion of those who died during the year in excess of expectations were as a result of COVID-19. We honor those who have died during the pandemic.
The Police and Fire Retirement System of the City of Detroit – Component II 11

Comments, Recommendations and Conclusion
Terminated Vested Data Audit
As a result of an improvement of the Terminated Vested member data, we were informed that 31 members reported in the 2019 data were actually deceased as of June 30, 2019. The change this year is included in the source of gains/losses on page 10. This improved data has been recognized in this valuation, resulting in a gain of approximately $6.7 million.
Year-to-Year Reconciliation of Projected June 30, 2024 Contributions
The estimated FY 2024 contributions are very sensitive to changes in year-to-year experience. The chart below reconciles our estimate from the June 30, 2019 valuation to our estimate from this valuation (June 30, 2020). For purposes of this reconciliation, amortized periods are 30 years.
Est. FY 2024 Employer Contribution from 6/30/2019 Valuation Gain or Loss from Investments Gain or Loss from Excess Interest Transfers (Inc. FY 2019) Other Experience
$ Millions 30-Year Level
Principal - MVA 30-Year Level Dollar - MVA
Board Policy (20-Year Level Dollar - FPA)
$ 145.4 17.1
-(7.9)
$ 113.3 13.4
-(6.2)
Est. FY 2024 Employer Contribution from 6/30/2020 Valuation $ 154.5 $ 120.4 $ 127.8
Annuity Reserve Fund (ARF)
The ARF, as reported, was $27 million higher than the related accrued liabilities for Retirees and Beneficiaries. If the Board chooses to transfer some or all of the $27 million from the ARF to the Pension Accumulation Fund (PAF) within Component II, the transfer would reduce the UAAL. As discussed in the 2019 valuation report, the Annuity Reserve Fund does not appear to have been credited with any interest during the year (asset details provided were not sufficient to definitively determine).
Annuity Savings Fund (ASF) Interest Credits
The ASF fund is credited with the lesser of 5.25% interest and the total fund earnings. We understand that any earning in excess of 5.25% (that otherwise would have been credited to the ASF fund if not for the 5.25% cap) will be transferred to Component I assets, to the extent needed, for funding of transition liability. For purposes of calculating future refunds of member contributions, the ASF was assumed to earn 5.25% interest in all future years. Furthermore, since the fund earned less than 5.25% for both FY 2019 and FY 2020, we do not expect that there will be transfers of excess ASF interest in either FY 2021 or FY 2022. No additional liabilities were included in this report to account for anticipated excess earnings expected to occur as a result of return on assets. We have previously discussed the potential for additional liability with the Plan’s auditors, who have indicated that the excess earnings transfer should not be included as a liability in the GASB Statements Nos. 67 and 68 reports until it actually occurs.
In FY 2020, approximately $1.6 million was transferred from Component II (Legacy) to Component I (Hybrid) due to excess interest earned in FY 2018. This is the second year of such a transfer. The amount was approximately $0.4 million less than we had estimated in the June 30, 2019 valuation.
The Police and Fire Retirement System of the City of Detroit – Component II 12

Comments, Recommendations and Conclusion
We understand that the System has adopted a procedure for computing the ASF interest credits lagging the actual experience of the assets. We have not reviewed or audited this procedure. If the Retirement System can provide the methodology for determining the transfer, we may be able to more accurately reflect it in advance.
The Police and Fire Retirement System of the City of Detroit – Component II 13

Comments, Recommendations and Conclusion
Estimated Excess Interest Transfers
FY 2 Years Prior to Transfer Fiscal Year Investment Estimated Resulting Assets to be Transfer is ASF Balance Assumed ASF ASF Balance Estimated Return Excess ASF Return Component I Funded Percent Transferred Expected BOY Payment EOY Year Return Percent Excess Transition Cost Status Transfer Out (BOY)
(A) (B) (C) (D) (E) (F) (G) = (F) - 5.25% (H) = (G) x (B) (I) (J) (K) = (H) x (J) 2021 $ 113,856,180 $ 14,547,455 $ 104,909,188 2019 3.54% 0.00% $ - >100% 50% $ -2022 104,909,188 14,547,455 95,492,480 2020 1.20% 0.00% - >100% 50% -
We understand this calculation will be performed by staff and may be different than shown above. The estimates above are used to approximate the effect on UAAL.
Section G-2(f) of the Combined PFRS Plan is shown below:
In any Plan Year during the period beginning on or after July 1, 2014 and ending June 30, 2023 in which the annual rate of return credited to the accounts of Members investing in the Annuity Savings Fund as provided in paragraph (a) is less than the actual rate of return net of expenses of the Retirement System's invested assets for the second Plan Year immediately preceding the Plan Year in which the annual rate of return is credited ("ASF Return Excess"), an amount equal to the value of the ASF Return Excess shall be transferred to the Pension Accumulation Fund maintained under Component I of the Combined Plan and shall be used to fund the Transition Cost relating to Component I. The Transition Cost is a measure of the liability that Component I of the Retirement System has at its inception; due to the fact that at its inception, Members in Component I of the Retirement System receive vesting and eligibility credit under Component I for service that was earned prior to July 1, 2014 and is otherwise credited to Members under Component II of the Retirement System, as such Transition Cost is calculated by the Plan Actuary. In the event there is an ASF Return Excess for a Plan Year following the Plan Year in which such transfers have fully funded the Transition Costs relating to Component I, fifty percent (50%) of such ASF Return Excess shall be transferred to the Pension Accumulation Fund maintained under Component II and the remaining fifty percent (50%) of such ASF Return Excess shall be transferred to Component I and credited to the Rate Stabilization Fund maintained under Component I. “Transition Cost” shall be determined by the Plan Actuary.
The Police and Fire Retirement System of the City of Detroit – Component II 14

Comments, Recommendations and Conclusion
Option Factors
The Board adopted new option factors for the Plan. We have not been provided with a specific effective date for the new factors. However, we understand the intent is to implement the new factors with the new data system. For the sake of simplicity, we have assumed the new factors apply to all retirements after the valuation date.
Actuarial Assumptions
The Retirement System routinely has five-year experience studies in accordance with the City ordinance. The Board has chosen to schedule the next experience study to begin subsequent to the June 30, 2020 valuation.
Restoration
This valuation assumes no future restoration of Component II benefits. Calculations related to restoration will be provided in a separate report at the Board’s request. Any future restoration will be reflected beginning in the next valuation after being granted.
Future Results
While FY 2021 investment performance is not yet available (since the fiscal year is not over), the S&P 500 and the Dow Jones Industrial Average have so far both returned substantially more than 6.75%, so far, this fiscal year. If the Retirement System’s experience is similar and that experience is not overshadowed by a reverse in the last quarter of the fiscal year, then there might be upward pressure on the funded status and downward pressure on the estimated FY 2024 contribution from investment experience during FY 2021. However, the defunding of the Retirement System through the POA mandated contribution levels will continue to put downward pressure on the funded status (the POA mandated contribution levels have already been considered in the FY 2024 contribution estimates).
Census Data and Approximations
Data was reported separately for Component I and Component II. Additional time was needed to reconcile these two data sets. Processing time for the valuation could be shortened if data for future valuations is reconciled before being provided to GRS. We would be happy to work with the Retirement System staff to help them provide the information that is needed for the valuation. After we issued our annual data letter (in which we questioned the reported frozen AFC amounts for the Legacy plan), we were informed that the amounts reported on the file were incorrect. We worked with the Executive Director to develop a process that would enable us to complete the 2020 valuation. We acknowledge his help with appreciation. That process was to file match the Legacy actives reported on the 2020 data file to the Legacy actives reported on the 2018 data file for purposes of using the Frozen AFC reported on the 2018 file for this valuation. All other active member data used in this valuation was taken from the 2020 data files. Additional information about the data approximations and assumptions may be found on page 36.
The Police and Fire Retirement System of the City of Detroit – Component II 15

Comments, Recommendations and Conclusion (Concluded)
Disability Retirees
The Police and Fire Retirement System Combined Plan provides disability benefits for both Component I and Component II. Our understanding of the Component II freeze as it relates to duty disability benefits was that the only benefit payable from Component II would be the frozen accrued benefit, payable at the time of conversion to normal retirement (for members becoming disabled after 6/30/2014) and that any benefits payable during the period of disability would be paid from Component I. Data reported for this valuation is not consistent with that understanding. However, assets reported for this valuation appear to be consistent with this interpretation. We have valued the pre-conversion duty disability benefit in a manner consistent with the data (paid out of Component II). We understand that the System is in the process of moving to a new data system and expect this issue to be corrected once the new data system is in place.
For future retirees, duty disability retirement benefits prior to age 65 are assumed to be paid from Component I.
For current duty disability retirees that became disabled after June 30, 2014, we have estimated the amount that will be paid by Component II upon conversion.
New Data System
We understand that the Retirement System is in the process of moving to a new data system and that future valuation data will be provided from that system beginning with the 2021 or 2022 valuation. We also understand that data may have gone through additional cleaning/auditing as it has been entered into the new system. We anticipate that data will be more precise for valuation purposes once the new system is providing that data. Please note that changes in data may impact future valuation results and generate gains or losses.
Recommendation
We recommend that every potential action be taken to generate contributions to the Retirement System above those provided in the POA. Benefit payments to retirees in the Plan were approximately $300 million compared to FY 2020 contributions of $18 million.
Prior Recommendation
The Board has approved a funding policy for FY 2024 and beyond.
Conclusion
It is likely that the funded status will decline and the unfunded actuarial accrued liability will increase between now and FY 2024. The funded status is projected to decline to approximately 56% as of June 30, 2024, if all assumptions are met. Events occurring after the valuation date have not been included in this valuation.
The Police and Fire Retirement System of the City of Detroit – Component II 16

Risks Associated with Measuring the Accrued Liability and Actuarially Determined Contribution
The determination of the accrued liability and the actuarially determined contribution requires the use of assumptions regarding future economic and demographic experience. Risk measures, as illustrated in this report, are intended to aid in the understanding of the effects of future experience differing from the assumptions used in the course of the actuarial valuation. Risk measures may also help with illustrating the potential volatility in the accrued liability and the actuarially determined contribution that result from the differences between actual experience and the actuarial assumptions.
Future actuarial measurements may differ significantly from the current measurements presented in this report due to such factors as the following: plan experience differing from that anticipated by the economic or demographic assumptions; changes in economic or demographic assumptions due to changing conditions; increases or decreases expected as part of the natural operation of the methodology used for these measurements (such as the end of an amortization period, or additional cost or contribution requirements based on the Plan’s funded status); and changes in plan provisions or applicable law. The scope of an actuarial valuation does not include an analysis of the potential range of such future measurements.
Examples of risk that may reasonably be anticipated to significantly affect the plan’s future financial condition include:
1. Investment Risk – actual investment returns may differ from the expected returns; 2. Asset/Liability Mismatch – changes in asset values may not match changes in liabilities, thereby
altering the gap between the accrued liability and assets and consequently altering the funded status and contribution requirements;
3. Contribution Risk – actual contributions may differ from expected future contributions. For example, actual contributions may not be made in accordance with the plan’s funding policy or material changes may occur in the anticipated number of covered employees, covered payroll, or other relevant contribution base;
4. Salary and Payroll Risk – actual salaries and total payroll may differ from expected, resulting in actual future accrued liability and contributions differing from expected;
5. Longevity Risk – members may live longer or shorter than expected and receive pensions for a period of time other than assumed; and
6. Other Demographic Risks – members may terminate, retire or become disabled at times or with benefits other than assumed resulting in actual future accrued liability and contributions differing from expected.
The effects of certain trends in experience can generally be anticipated. For example, if the investment return since the most recent actuarial valuation is less (or more) than the assumed rate, the cost of the plan can be expected to increase (or decrease). Likewise, if longevity is improving (or worsening), increases (or decreases) in cost can be anticipated.
The timely receipt of the actuarially determined contributions is critical to support the financial health of the plan. Users of this report should be aware that contributions made at the actuarially determined rate do not necessarily guarantee benefit security.
The Police and Fire Retirement System of the City of Detroit – Component II 17

Risks Associated with Measuring the Accrued Liability and Actuarially Determined Contribution
Plan Risk Measures
Risks facing a pension plan evolve over time. A young plan with virtually no investments and paying few benefits may experience little investment risk. An older plan with a large number of members in pay status and a significant trust may be much more exposed to investment risk.
In our discussions with the Board and Investment Committee, we illustrated various investment return scenarios as part of the funding policy analysis. This type of analysis may also be considered a quantitative risk assessment. We recommend that the Board consider similar periodic analysis as appropriate under the Risk Controls of the newly approved funding policy.
The Board approved funding policy call for illustrating the table of risk measures shown below. Please see the funding policy in the appendix for additional information. In the table below, the acronyms are as follows: FPA = Funding Policy Assets; MVA = Market Value of Assets; AAL = Actuarial Accrued liability; UAAL = Unfunded Actuarial Accrued Liability).
2020 2019 (i) Classic measures
− Funded ratio MVA 64.9% 69.5% FPA 68.2% 71.0%
− UAAL amortization period 20 − Portfolio rate of return
MVA 1.20% 3.54% FPA 3.76% 5.68%
− Geometric average portfolio rate of return 5-year
MVA 2.36% 3.54% FPA 4.72% 5.68%
10-year MVA 2.36% 3.54% FPA 4.72% 5.68%
− Standard deviation of return 5-year
MVA 1.17% 0.00% FPA 0.96% 0.00%
10-year MVA 1.17% 0.00% FPA 0.96% 0.00%
(ii) Duration of the Actuarial Accrued Liability 9.4 9.5 (iii) Total UAAL / Covered Payroll1
MVA 8.5 7.8 FPA 7.7 7.4
(iv) Total Assets / Covered Payroll1
MVA 15.8 17.8 FPA 16.6 18.2
(v) Total AAL / Covered Payroll1 24.3 25.6 (vi) Non-Investment Cash flow / Beginning of year MVA -10.6% -10.2% (vii) MVA / Benefit Payments 8.0 8.6 (viii) Solvency Liability ($ millions)2 $ 6,061.3 $ 5,748.1
1Payroll for this purpose is Component I payroll of $153.0 million for 2020 and $150.0 million for 2019. 2See discussion on next page.
The Police and Fire Retirement System of the City of Detroit – Component II 18

Risks Associated with Measuring the Accrued Liability and Actuarially Determined Contribution
Solvency Liability
Funded Ratio - POA
A Actuarial Accrued Liability Defined Benefit Annuity Funds Total
$ 3,581,042,279 $ 144,275,493 $ 3,725,317,772 B Market Value of Assets $ 2,272,972,647 $ 144,275,493 $ 2,417,248,140 C Unfunded Actuarial Accrued Liability (A - B) $ 1,308,069,632 $ - $ 1,308,069,632 D Funded Ratio (B/A) 63.5% 100.0% 64.9% E Prior Years Funded Ratio 68.3% 100.0% 69.5%
The POA Funded Ratio is an expected return-based measurement of the pension obligations. It is based upon the POA mandated 6.75% interest rate assumption (assumption prescribed by another party). It determines an amount that will be sufficient to provide benefits if the portfolio earns the expected 6.75% return on assets and all other assumptions are met. This measure is appropriate for assessing the need for or amount of future contributions if all assumptions are met. This measure is not appropriate for assessing the sufficiency of plan assets to cover the estimated cost of settling the plan’s benefit obligation, in other words, of transferring the obligation to a third party in a market value type transaction.
Funded Ratio - Solvency
A B
Actuarial Accrued Liability Market Value of Assets
Defined Benefit Annuity Funds Total $ 5,917,072,862 $ 2,272,972,647
$ 144,275,493 $ 144,275,493
$ 6,061,348,355 $ 2,417,248,140
C D
Unfunded Actuarial Accrued Liability (A - B) Funded Ratio (B/A)
$ 3,644,100,215 38.4%
$ -100.0%
$ 3,644,100,215 39.9%
The Solvency Liability is a market-based measurement of the pension obligations. It represents the amount the plan would need to invest in low risk securities to provide the benefits with greater certainty. For this purpose, the solvency liability is computed at 2.45% as of June 30, 2020, based on the long-term municipal bond rate (“20-Year Municipal GO AA Index” rate from the Fidelity Index as of June 30, 2020). No adjustment has been made for the credit quality of the plan sponsor. This measure may not be appropriate for assessing the need for or amount of future contributions. This measure may not be appropriate for assessing the sufficiency of plan assets to cover the estimated cost of settling the plan’s benefit obligation.
The difference between the two measures (POA and Solvency) is one illustration of the savings the sponsor anticipates by taking on the risk in a diversified portfolio.
The Police and Fire Retirement System of the City of Detroit – Component II 19

Risks Associated with Measuring the Accrued Liability and Actuarially Determined Contribution
Funded Ratio
The funded ratio is the most widely known measure of a plan's financial strength, but the trend in the funded ratio is much more important than the absolute ratio. The funded ratio should trend to 100%. As it approaches 100%, it is important to re-evaluate the level of investment risk in the portfolio and potentially to re-evaluate the assumed rate of return.
Rate of Return, Geometric Average, and Standard Deviation
Investment return is probably the largest single risk that most systems face. The year-by-year return and the geometric average give an indicator of the realism of the System’s assumed return.
Duration of the Actuarial Accrued Liability
The duration of the actuarial accrued liability may be used to approximate the sensitivity to a 1% change in the assumed rate of return. For example, a duration of 10 indicates that the liability would increase approximately 10% if the assumed rate of return were lowered 1%.
Ratio of Unfunded Actuarial Accrued Liability to Payroll
The ratio of unfunded liability to payroll gives an indication of the plan’s sensitivity to differences between assumed and actual experience related to the employer contributions. A value above approximately 300% or 400% may indicate high volatility relative to small gains and losses.
Ratio Assets to Payroll
The relationship between assets and payroll is a useful indicator of the potential volatility of contributions. For example, if the market value of assets is 2.0 times the payroll, a return on assets 5% different than assumed would equal 10% of payroll. A higher (lower) or increasing (decreasing) level of this maturity measure generally indicates a higher (lower) or increasing (decreasing) volatility in plan sponsor contributions as a percentage of payroll.
Ratio of Actuarial Accrued Liability to Payroll
The relationship between actuarial accrued liability and payroll is a useful indicator of the potential volatility of contributions for a fully funded plan. A funding policy that targets a funded ratio of 100% is expected to result in the ratio of assets to payroll and the ratio of liability to payroll converging over time.
The ratio of liability to payroll may also be used as a measure of sensitivity of the liability itself. For example, if the actuarial accrued liability is 2.5 times the payroll, a change in liability 2% other than assumed would equal 5% of payroll. A higher (lower) or increasing (decreasing) level of this maturity measure generally indicates a higher (lower) or increasing (decreasing) volatility in liability (and also plan sponsor contributions) as a percentage of payroll.
The Police and Fire Retirement System of the City of Detroit – Component II 20

Risks Associated with Measuring the Accrued Liability and Actuarially Determined Contribution
Ratio of Non-Investment Cash Flow to Market Value of Assets
A positive net cash flow means contributions exceed benefits and expenses. A negative cash flow means existing funds are being used to make payments. A certain amount of negative net cash flow is generally expected to occur when benefits are prefunded through a qualified trust. Large negative net cash flows as a percent of assets may indicate a super-mature plan or a need for additional contributions.
Additional Risk Assessment
Additional risk assessment is outside the scope of the annual actuarial valuation. Additional assessment may include scenario tests, sensitivity tests, stochastic modeling, and stress tests. We can provide additional risk assessments at the Board’s request.
The Police and Fire Retirement System of the City of Detroit – Component II 21

I I I I I I I I I
Valuation Results – Comparative Statement ($ millions)
June 30
Active Payroll Actuarial Accrued Liabilities Unfunded / Active Pays
Employer Contributions
% of Pays Total Average Computed
Total Valuation
Assets Unfunded
2001 253.3 45,353 3,463.2 3,900.0 (436.8) - 27.22% 20021 248.7 46,203 3,632.0 3,635.1 (3.1) - 23.39% 2003 248.7 47,305 3,721.6 3,205.5 516.1 2.1 43.89% 2004 258.7 51,126 3,857.5 3,074.5 783.0 3.0 54.36% 20053 250.5 52,197 3,780.4 3,757.9 22.5 0.1 25.98%
20063 228.1 52,908 3,809.0 3,980.3 (171.3) - 25.09% 20072, 3 230.2 54,647 3,896.8 4,307.2 (410.4) - 26.71% 20081 232.8 57,090 4,071.1 4,316.3 (245.2) - 26.27% 2009 231.8 57,418 4,221.3 3,945.2 276.1 1.2 35.22% 20101, 2 228.8 57,322 3,767.4 3,853.3 (85.9) - 23.02%
2011 220.5 57,773 3,808.6 3,804.8 3.8 0.0 23.14% 20121 205.8 57,374 3,822.7 3,675.5 147.2 0.7 30.59% 20132 186.7 57,163 3,890.1 3,545.5 344.6 1.8 44.93%
20142 132.6 50,831 4,007.3 3,276.2 731.1 5.5 2015 132.7 55,626 4,053.4 3,194.8 858.6 6.5
2016 126.9 57,535 4,001.7 2,950.5 1,051.3 8.3 2017 116.3 60,757 3,967.9 2,922.1 1,045.8 9.0 20182 111.4 63,589 3,907.4 2,866.3 1,041.1 9.3 20192 105.2 67,849 3,843.3 2,670.8 1,172.4 11.1 2020 71.8 52,478 3,725.3 2,417.2 1,308.1 18.2
1After changes in actuarial assumptions and/or methods. 2After Plan Amendments. 32005 and 2006 assets were revised following the June 30, 2006 valuation. 2007 assets were revised after the June 30, 2007 valuation.
The Police and Fire Retirement System of the City of Detroit – Component II 22

Schedule of Funding Progress
Actuarial Schedule of Funding Progress UAAL as a
% of Actuarial Accrued Unfunded Actuarial Value of Liability (AAL) AAL Funded Covered Covered Valuation Assets -- Entry Age (UAAL) Ratio Payroll Payroll
Date (a) (b) (b - a) (a / b) (c) ((b - a) / c)
2001 $3,900,020,703 $3,463,248,393 $(436,772,310) 112.6% $253,297,027 -20021 3,635,106,581 3,631,971,448 (3,135,133) 100.1% 248,663,133 -2003 3,205,516,657 3,721,593,210 516,076,553 86.1% 248,681,461 207.5 % 2004 3,074,516,589 3,857,493,282 782,976,693 79.7% 258,699,581 302.7 % 20053, 5 3,757,884,417 3,780,447,414 22,562,997 99.4% 250,491,872 9.0 %
20063 3,980,254,576 3,808,952,741 (171,301,835) 104.5% 228,140,160 -20072, 3 4,307,194,763 3,896,814,229 (410,380,534) 110.5% 230,173,964 -20081 4,316,263,291 4,071,053,752 (245,209,539) 106.0% 232,812,606 -2009 3,945,205,453 4,221,291,045 276,085,592 93.5% 231,795,528 119.1 % 20101, 2 3,853,279,381 3,767,364,201 (85,915,180) 102.3% 228,829,999 -
2011 3,804,759,868 3,808,642,533 3,882,665 99.9% 220,461,691 1.8 % 20121 3,675,459,604 3,822,676,002 147,216,398 96.1% 205,800,278 71.5 % 20132, 4 3,474,538,021 3,890,143,341 415,605,320 89.3% 186,694,166 222.6 %
20142 3,276,203,299 4,007,323,791 731,120,492 81.8% 132,566,687 551.5 % 2015 3,194,754,441 4,053,351,943 858,597,502 78.8% 132,722,741 646.9 %
2016 2,950,470,450 4,001,721,957 1,051,251,507 73.7% 126,865,176 828.6 % 2017 2,922,141,978 3,967,895,457 1,045,753,479 73.6% 116,288,356 899.3 % 20182 2,866,303,805 3,907,378,106 1,041,074,301 73.4% 111,407,220 934.5 % 20192 2,670,843,356 3,843,266,214 1,172,422,858 69.5% 105,233,078 1,114.1 % 2020 2,417,248,140 3,725,317,772 1,308,069,632 64.9% 71,842,120 1,820.8 %
1After changes in actuarial assumptions and/or methods. 2AfterPlan Amendments. 32005 and 2006 assets were revised following the June 30, 2006 valuation. 2007 assets were revised after the June 30, 2007 valuation.
4Assumes past due contributions of $71 million are made. 5After POC transfer.
The Police and Fire Retirement System of the City of Detroit – Component II 23

DATA FURNISHED FOR VALUATION

Summary of Benefit Provisions (June 30, 2020)
Component II Frozen Benefits All Component II benefits are frozen as of June 30, 2014 based on service and average final compensation accrued as of that date and the provisions of the Detroit Police and Fire Retirement System as it existed on June 30, 2014 and all future Cost-of-Living Adjustments (“COLA’s”) were reduced from 2.25% to 1.0125% per year. The benefits evaluated in this report are the frozen reduced benefits. Component II benefits are payable after separation from service, upon meeting the eligibility conditions of the plan as it existed on June 30, 2014, regardless of whether the individual is eligible to receive a Component I benefit at that time.
Our understanding of the June 30, 2014 plan provisions is provided below for completeness. The material below is a non-legal summary and is not intended to cover all potential situations that could occur. If there are discrepancies between the description below, and appropriate legal documents, the latter necessarily govern.
Age and Service Retirement Eligibility - 25 years of service regardless of age. 20 years of service regardless of age for eligible DPOA and DFFA members. DFFA members must retire by age 60.
Annual Amount - An annuity equal to the actuarial equivalent of the member’s accumulated contribution account plus a defined benefit, which, when added to the annuity will provide the following:
Pre-1969 Members - For all service earned up to April 5, 2011 for LSA and Fire equivalent members, and up to September 1, 2011 for DPOA and Fire equivalent members, 2.5% of AFC times the first 25 years of service, with a maximum allowance of 15/22 of a police officer’s or firefighter’s annual rate of compensation (actuarially reduced to reflect early payment).
For all service earned after April 5, 2011 for LSA and Fire equivalent members, and after September 1, 2011 for DPOA and Fire equivalent members, 2.1% of AFC times the first 25 years of service, with a maximum allowance of 15/22 of a police officer’s or firefighter’s annual rate of compensation.
1969 Plan Members - For all service earned up to April 5, 2011 for LSA and Fire equivalent members, and up to September 1, 2011 for DPOA and Fire equivalent members, 2.5% of AFC times the first 25 years of service plus 2.1% of AFC times each of the next 10 years of service.
For all service earned after April 5, 2011 for LSA and Fire equivalent members, and after September 1, 2011 for DPOA and Fire equivalent members, 2.1% of AFC times each year of service, up to 35 years of service.
Members may elect to receive their accumulated contribution account in a lump sum after 25 years of service (20 years of service for eligible DPOA and DFFA members). The defined benefit at retirement is then reduced by the actuarial equivalent of the amount of principal withdrawn. No reduction is made with regard to the interest portion of the withdrawal. Pre-1969 plan members may elect 1969 plan benefits at the time of retirement.
The Police and Fire Retirement System of the City of Detroit – Component II 24

Summary of Benefit Provisions (June 30, 2020) (Continued)
Type of Average Final Compensation (AFC) - Average of the current compensation for the ranks held in each of last 5 years (last 3 years for DPCOA, Executive Members and their Fire equivalents). Pension benefits for non-union employees may not be diminished due to a reduction in compensation because of fiscal emergency. AFC includes prior longevity distributions during the averaging period in accordance with the following schedule: 1% of compensation after 5 years of service, 2% after 11 years, 3% after 16 years and 4% after 21 years. A member may elect that upon retirement or upon death before retirement either (i) a lump sum payment equal to 85% (100% for DPOA and DPCOA members) of the amount of his or her unused accumulated sick leave bank, or (ii) to have the 3-year average of 25% of the value of the accumulated unused sick leave bank added to his or her AFC. Any member electing the AFC adjustment option will also be paid a lump sum equal to the remaining value of the sick leave bank as provided in (i) above. Lump sum payments are not paid by the Retirement System.
Deferred Retirement (Vested Benefit) Eligibility - 10 years of service for DPOA and Fire equivalents, age 40 with 8 years of service for all others.
Annual Amount - Same as regular retirement but based on average final compensation and credited service at the time of termination.
Benefit Commencement - DPOA and Fire equivalent members hired after 6/30/1985: Unreduced benefit begins at age 62. All other members: Unreduced benefit begins at the age when the member would have first been eligible for regular retirement had the member continued in City service. All members may elect a reduced benefit payable immediately.
Note, for valuation purposes, the frozen accrued benefit was valued in the event of a death or disability. The following death and disability provisions are provided for historical purposes only.
Duty Disability Retirement Eligibility - No age or service requirement.
Annual Amount - A basic benefit of 50% of final compensation as of June 30, 2014 and a supplemental benefit of 16-2/3% of final compensation as of June 30, 2014 is payable for 24 months. After 24 months, members disabled from any occupation continue to receive both benefits; otherwise, only the 50% benefit is then payable. Upon attaining 25 years of service, the disability benefit is 50% of final compensation as of June 30, 2014. Members convert to regular retirement benefit at age 65. Worker’s compensation payments are offset. Members who have already filed under the old duty disability plan will receive 66-2/3% of final compensation as of June 30, 2014 payable to eligibility date for regular retirement. Benefits prior to age 65 are assumed to be paid from Component I. Benefits after age 65 are assumed to be paid from Component II (this plan).
Non-Duty Disability Retirement Eligibility - 5 years of service.
Annual Amount - Computed as a regular retirement benefit, but based on average final compensation and credited service at the time of disability. Minimum benefit is 20% of average final compensation. Benefits are assumed to be paid from Component II (this plan).
Duty Death Before Retirement Eligibility - No age or service requirement.
The Police and Fire Retirement System of the City of Detroit – Component II 25

Summary of Benefit Provisions (June 30, 2020) (Concluded)
Annual Amount - Surviving spouse receives 5/11 of police officer’s or firefighter’s compensation and each child under age 18 receives 1/10 of such compensation with a maximum total of 7/33 of such compensation as of June 30, 2014. If there is no surviving spouse, each child receives 1/4 of such compensation with a maximum total of 1/2 of such compensation. If there is no surviving spouse or children, each dependent parent receives 1/6 of such compensation. Worker’s compensation payments are offset. Benefits are assumed to be paid from Component I.
Non-Duty Death Before Retirement Eligibility - No age or service requirement.
Annual Amount - Same as a regular retirement benefit to a surviving spouse, but reduced in accordance with a 100% joint and survivor option election. Minimum benefit is 20% of average final compensation as of June 30, 2014. Each child under 18 receives 1/7 of Police Officer’s or Firefighter’s compensation with a maximum total of 2/7 of such compensation. If there is no spouse or children, each dependent parent receives 1/7 of such compensation. Benefits are assumed to be paid from Component II (this plan).
Post-Retirement Cost-of-Living Adjustments Pre-1969 Members - Allowances increase in proportion to active member
compensation for the corresponding rank. These increases are not considered COLAs and are therefore not reduced under the POA.
1969 Plan Members - Police retired after July 1, 2001, certain Police classes retired after July 1, 1998 and all Fire members: For all service earned up to April 5, 2011 for LSA members (September 1, 2011 for DPOA members) pensions increase by 2.25% of the current pension amount each July 1. No cost-of-living adjustments for service earned after April 5, 2011 for LSA members (September 1, 2011 for DPOA members). COLA is reduced by 45% according to the POA.
Member Contributions 5% of covered compensation payable until first eligible for regular retirement. Interest on member contributions provides benefits in addition to the formula benefit.
DROP Plan Members with 25 years (20 years for DPOA members) of service may elect to participate in the DROP. When a DROP election is made, the member ceases to accrue any further age and service retirement benefits. Seventy-five percent (75%) of the member’s benefit (accrued to their DROP date) is contributed to a DROP account (a defined contribution account). At retirement the member is entitled to the balance in the DROP account and a monthly benefit equal to 100% of their benefit accrued to their DROP date, increased by any post-retirement increases that the member would have received, had the member been retired. Fire members must retire from the DROP plan at age 60. Participation in the DROP is limited to 10 years for LSA members electing to DROP after April 5, 2011 and prior to July 1, 2014. Members electing DROP after July 1, 2014 are limited to 5 years of DROP participation. Effective October 31, 2018, LSA members are limited to 10 years of DROP participation. Effective May 9, 2019, DPOA members are limited to 10 years of DROP participation.
The Police and Fire Retirement System of the City of Detroit – Component II 26

I I I I
Asset Information Furnished for Valuation
Reported Assets (Market Value)
Asset Class Market Value
June 30, 2020 June 30, 2019 Cash and Cash Equivalents Investments at fair value Receivables Cash and Investments held as collateral for securities lending Capital Asset - Net Accounts Payable
$ 60,589,060 2,354,977,122 67,919,982 166,656,580 1,849,895 (234,744,499)
$ 57,654,902 2,610,224,281 99,739,032 200,383,824 1,198,468 (298,357,151)
Total Current Assets $2,417,248,140 $2,670,843,356
Reserve Accounts
Funds Fund Balances
June 30, 2020 June 30, 2019
Annuity Savings Annuity Reserve
$ 113,856,180 30,419,313
$ 117,476,538 30,549,540
Total Annuity Funds
Pension Accumulation Pension Reserve Survivor Benefit
144,275,493
(495,301,166) 2,773,194,141
(4,920,328)
148,026,078
(2,079,310) 2,526,084,121
(1,187,533) Total Pension Funds
Total Fund Balances
2,272,972,647
$ 2,417,248,140
2,522,817,278
$ 2,670,843,356
The Police and Fire Retirement System of the City of Detroit – Component II 27
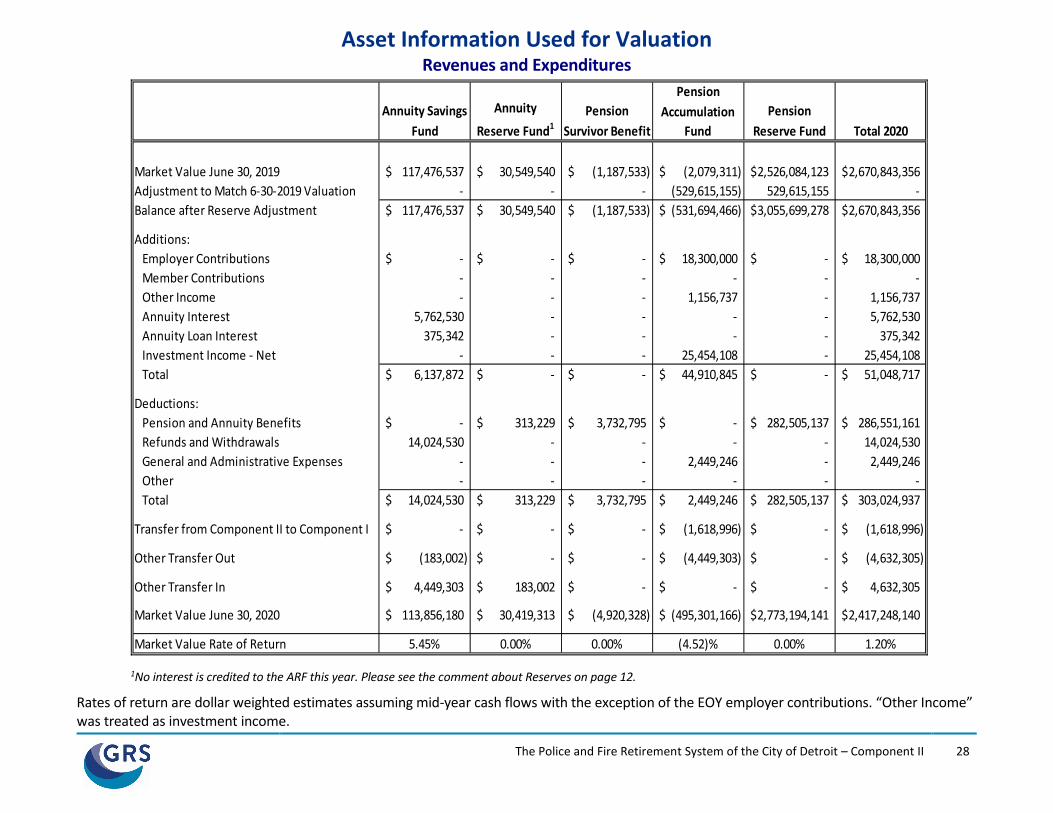
Asset Information Used for Valuation Revenues and Expenditures
Annuity Savings Fund
Annuity
Reserve Fund1 Pension
Survivor Benefit
Pension Accumulation
Fund Pension
Reserve Fund Total 2020
Market Value June 30, 2019 Adjustment to Match 6-30-2019 Valuation Balance after Reserve Adjustment
Additions: Employer Contributions Member Contributions Other Income Annuity Interest Annuity Loan Interest Investment Income - Net Total
Deductions: Pension and Annuity Benefits Refunds and Withdrawals General and Administrative Expenses Other Total
$ 117,476,537 -
$ 30,549,540 -
$ (1,187,533) -
$ (2,079,311) (529,615,155)
$2,526,084,123 529,615,155
$2,670,843,356 -
$ 117,476,537
$ ---
5,762,530 375,342
-
$ 30,549,540
$ ------
$ (1,187,533)
$ ------
$ (531,694,466)
$ 18,300,000 -
1,156,737 --
25,454,108
$3,055,699,278
$ ------
$2,670,843,356
$ 18,300,000 -
1,156,737 5,762,530
375,342 25,454,108
$ 6,137,872
$ -14,024,530
--
$ -
$ 313,229 ---
$ -
$ 3,732,795 ---
$ 44,910,845
$ --
2,449,246 -
$ -
$ 282,505,137 ---
$ 51,048,717
$ 286,551,161 14,024,530
2,449,246 -
$ 14,024,530 $ 313,229 $ 3,732,795 $ 2,449,246 $ 282,505,137 $ 303,024,937
Transfer from Component II to Component I $ - $ - $ - $ (1,618,996) $ - $ (1,618,996)
Other Transfer Out $ (183,002) $ - $ - $ (4,449,303) $ - $ (4,632,305)
Other Transfer In $ 4,449,303 $ 183,002 $ - $ - $ - $ 4,632,305
Market Value June 30, 2020 $ 113,856,180 $ 30,419,313 $ (4,920,328) $ (495,301,166) $2,773,194,141 $2,417,248,140
Market Value Rate of Return 5.45% 0.00% 0.00% (4.52)% 0.00% 1.20%
1No interest is credited to the ARF this year. Please see the comment about Reserves on page 12.
Rates of return are dollar weighted estimates assuming mid-year cash flows with the exception of the EOY employer contributions. “Other Income” was treated as investment income.
The Police and Fire Retirement System of the City of Detroit – Component II 28

I I I I I I I I I I
I I I I I I I I I I
I I I I
Retirees and Beneficiaries as of June 30, 2020 Tabulated by Attained Age1
Attained Age
Age & Service Disability Death-in-Service Totals
No. Monthly
Allowances No. Monthly
Allowances No. Monthly
Allowances No. Monthly
Allowances
Under 202 7 $ 18,941 1 $ 3,006 36 $ 20,497 44 $ 42,444
20-24 2 8,237 2 8,237 25-29 5 10,726 2 5,916 1 2,131 8 18,773 30-34 3 5,911 2 6,019 5 11,930 35-39 10 16,199 21 63,986 2 3,814 33 83,999
40-44 49 73,528 69 213,748 9 14,929 127 302,205 45-49 174 293,412 107 337,220 19 37,806 300 668,438 50-54 320 734,193 102 317,500 13 23,177 435 1,074,870 55-59 437 1,227,270 134 410,864 16 31,553 587 1,669,687
60-64 626 1,868,301 127 358,848 22 45,850 775 2,272,999 65-69 1,056 3,401,488 274 764,693 35 68,625 1,365 4,234,806 70-74 1,399 4,613,866 392 995,925 49 87,587 1,840 5,697,378 75-79 890 2,647,241 219 562,662 26 48,670 1,135 3,258,573
80-84 489 1,353,659 64 165,262 13 25,507 566 1,544,428 85-89 320 765,403 27 80,393 8 19,041 355 864,837 90-94 235 531,564 24 66,845 15 33,747 274 632,156
95 & Over 97 192,407 10 28,444 2 4,545 109 225,396 Totals 6,119 $17,762,346 1,575 $4,381,331 266 $467,479 7,960 $22,611,156
1Includes both pre-1969 and 1969 retirees. Allowances being paid to DROP members are not reflected. Allowances shown are amounts as reported in the data.
2May include records with incorrect birth dates reported.
Inactive Vested Members June 30, 2020 Estimated
Attained Annual Age No. Allowances
Under 40 32 $ 460,613 40-44 111 2,045,095 45-49 111 2,210,977 50-54 76 1,544,880 55-59 29 685,454 60-64 20 491,902
65 & over 10 185,333
Totals 389 $7,624,254
The Police and Fire Retirement System of the City of Detroit – Component II 29

I I I I
I I I I
Pre-1969 Retirees and Beneficiaries as of June 30, 2020 Tabulated by Attained Age
Attained Age & Service1 Disability1 Death-in-Service Totals
Monthly Monthly Monthly Monthly Age No. Allowances No. Allowances No. Allowances No. Allowances
60-64 7 $ 7,341 1 $ 2,126 8 $ 9,467 65-69 13 27,579 2 4,754 15 32,333 70-74 118 254,633 26 $ 68,895 12 27,056 156 350,584 75-79 307 712,183 106 273,249 13 28,530 426 1,013,962
80-84 291 701,388 50 127,268 11 21,711 352 850,367 85-89 215 463,223 19 49,723 6 13,264 240 526,210 90-94 167 350,152 21 57,631 13 27,855 201 435,638
95 & Over 88 171,741 9 24,699 2 4,545 99 200,985 Totals 1,207 $2,689,480 231 $601,465 60 $129,841 1,498 $3,420,786
1Includes survivor beneficiaries of service and disability retirees.
DROP Participants June 30, 2020
Estimated Attained Monthly
Age No. Allowances1
Under 25 2 $ 3,408 35-39 2 2,172 40-44 50 58,550 45-49 160 216,626 50-54 210 426,827 55-59 213 531,267 60-64 78 230,749 65-69 31 117,856 70-74 9 38,384 75-79 2 9,220 Totals 757 $1,635,059
1Reflects the 75% of reported monthly benefits being paid into DROP accounts.
The Police and Fire Retirement System of the City of Detroit – Component II 30

I I I I I I I I I I I
I I I I I I I I I I I
Active Members as of June 30, 2020 by Attained Age and Years of Service (Excludes DROP)
Note the following active member schedules show eligibility service (total service) and reported payroll as of the valuation date. However, benefits are based on service and AFC as of June 30, 2014.
Police Members
Attained Age
Years of Service to Valuation Date Totals
0-4 5-9 10-14 15-19 20-24 25-29 30 Plus No. Valuation
Payroll
20-24 $ 0 25-29 26 26 965,131 30-34 1 42 23 66 2,824,270 35-39 1 28 58 33 5 125 6,133,429 40-44 11 38 79 89 2 219 11,686,023 45-49 5 21 53 158 14 251 14,269,837 50-54 3 14 34 95 13 1 160 9,097,355 55-59 2 4 13 28 5 4 56 3,100,161
60 2 4 6 334,467 61 1 1 2 116,004 62 1 1 1 3 155,244 63 1 1 52,783 64 0 68 0 69 0
Totals 2 117 159 216 382 36 7 919 $48,961,976
Fire Members
Attained Age
Years of Service to Valuation Date Totals
0-4 5-9 10-14 15-19 20-24 25-29 30 Plus No. Valuation
Payroll
20-24 25-29 30-34 35-39 40-44 45-49 50-54 55-59
3 1
14 22 18
4 1
1 3 9
11 5 4
2 9
32 44 17
5
3 41 63 58 16
14 26
9 5 5
1 18 27 39 88
127 110
35
$ 32,629 600,603
1,001,622 1,666,810 4,508,104 6,729,019 6,021,419 2,052,988
Totals 3 61 33 109 185 49 10 450 $22,880,144
The Police and Fire Retirement System of the City of Detroit – Component II 31

Total Active Members as of June 30, 2020 by Attained Age and Years of Service (Excludes DROP)
Note the following active member schedules show eligibility service (total service) and reported payroll as of the valuation date. However, benefits are based on service and AFC as of June 30, 2014.
Total Members
Attained Age
Years of Service to Valuation Date Totals
0-4 5-9 10-14 15-19 20-24 25-29 30 Plus No. Valuation
Payroll 20-24 1 1 $ 32,629 25-29 3 40 1 44 1,565,734 30-34 1 64 26 2 93 3,825,892 35-39 1 46 67 42 8 164 7,800,239 40-44 15 49 111 130 2 307 16,194,127 45-49 6 26 97 221 28 378 20,998,856 50-54 3 18 51 153 39 6 270 15,118,774 55-59 2 4 18 44 14 9 91 5,153,149
60 2 6 8 453,307 61 1 2 3 179,668 62 1 1 1 1 4 187,501 63 1 1 52,783 64 68 1 1 52,189 69
Totals 5 178 192 325 567 85 17 1,369 $71,842,120
Group Averages
Age: Police Fire Total
44.6 years 45.6 years 44.9 years Benefit Service: 11.8 years 12.8 years 12.1 years Eligibility Service: 17.7 years 18.8 years 18.1 years Annual Pay: $53,277 $50,845 $52,478
The Police and Fire Retirement System of the City of Detroit – Component II 32

Summary of Membership Data by Category
June 30, 2020 June 30, 2019 Active Members (Excluding DROP)
Number 1,369 1,551 Average age (years) 44.9 44.1 Average service (years) 18.1 17.4 Average salary $ 52,478 $ 67,849 Total payroll supplied, annualized $ 71,842,120 $ 105,233,078
Members in DROP Number 757 764 Average age (years) 54.0 54.0
Total annual benefits1 $ 19,620,706 $ 21,221,995
Average annual benefit1 $ 25,919 $ 27,777
Vested Inactive Members Number 389 394 Average age (years) 48.3 49.6 Total annual deferred benefits $ 7,624,254 $ 8,714,989 Average annual deferred benefit $ 19,600 $ 22,119
Service Retirees Number 4,924 4,975 Average age (years) 69.1 69.0 Total annual benefits $ 181,804,035 $ 182,363,445 Average annual benefit $ 36,923 $ 36,657
Disability Retirees Number 1,575 1,641 Average age (years) 66.5 65.9 Total annual benefits $ 52,575,972 $ 54,129,360 Average annual benefit $ 33,377 $ 32,981
Beneficiaries (Including Death in Service) Number 1,461 1,486 Average age (years) 74.8 75.0 Total annual benefits $ 36,953,865 $ 36,389,907 Average annual benefit $ 25,294 $ 24,488
1Reflects the 75% of reported monthly benefits being paid into DROP accounts.
The Police and Fire Retirement System of the City of Detroit – Component II 33

Reconciliation of Reported Data as of June 30, 2020
Active Data
A) Count reported in PF_Benefits table: 1,384 B) In PF_Benefits file but not in Hybrid file: -C) Hired after plan closed: (4) D) Non-active Status: (3) E) Agency "88": -F) Non-eligible class code & bargaining unit: -G) No hire date in Hybrid file: -H) Zero salary in Hybrid file: -I) Also in retiree file (including DROP): (8) J) Actives excluding DROP: 1,369
Retired Data
A) Number of records reported on data file: 44,412 B) Number of records not in P/F plan: (27,770) C) Records not currently in receipt of benefits based on reported status codes: (7,662) D) Component I (Hybrid) Records: (263) E) Records in DROP: (757) F) Number of records valued: 7,960
Deferred Data
A) Number of records reported on data file 455 B) Deceased1 (35) C) Less than 8 years of vesting service (31) D) Number of records to value 389
1In part, this is the result of an audit.
Active Row D: The Active data file contains a field titled “Stat”. Active members were only valued if the record for this field had a value of “1”. Active Row E: Agency “88” is the 36th District Court. We understand that members in that agency are not eligible to receive benefits. Active Row F: For both this valuation and the prior valuation, we have received a separate list of Class Codes and Bargaining Units that are not eligible to receive benefits. Retired Row C: The Retired_Life file has a field named “STATUS”. We understand that if this field is populated with a number that is one or greater, the member is no longer receiving a benefit and should not be valued. Deferred Row B: Service provided in the data file is vesting service. Since benefit service was frozen as of June 30, 2014 for members that terminated after June 30, 2014, benefit service was determined by subtracting service in the Hybrid inactive file from service in the Legacy inactive file with service.
The Police and Fire Retirement System of the City of Detroit – Component II 34

Reconciliation of Year-to-Year Data as of June 30, 2020
2019
Change in Pay/PensionsRehired (Not Vested)Rehired (Vested)New Beneficiary
DROP
Retired
Non-Duty DisabledDuty Disabled
Death/Off
Vested TermNon-Vested Terminated
Data Adjustment
2020
Active Term. Vested DROP Retirees Totals
Count Pay1 Count Monthly
Count Benefits Monthly
Count Benefits Count 1,551 $105,233,078
N/A (21,187,647) 5 210,643 3 178,254
(100) (6,831,786)
(21) (1,409,351)
- - (8) (512,041)
(45) (2,921,065)(16) (917,965)
- -
1,369 $71,842,120
394
N/A -
(1)
-
(10)
(1)
(31)
38
-
389
764 $1,991,524
N/A 14,540
- -
100 161,386
(100) (292,463)
(7) (17,746)
- (1,768)
757 $1,855,473
8,102 $22,740,226
N/A 255,925
(2) (6,851) 91 200,635
156 380,130
- -9 30,785
(398) (992,099)
2 2,405
7,960 $22,611,156
10,811
5 -91
-
25
--
(436)
(7) (16)
2
10,475
1This represents current pay and is not used for the Component II (Legacy) valuation.
Notable Data Changes:
7 active vested terminations were not reported on the Terminated Vested file. We have assumed these members refunded and forfeited their defined benefit.
25 new retirees came from nowhere. We believe most of these are a result of EDRO’s.
31 Terminated Vested members were valued last year but will not be valued this year. We have assumed these members refunded and forfeited their defined benefit.
The data adjustments relate to records where we could not specifically identify the activity during the year. This could be the result of duplicate member IDs or corrected Member IDs.
The Police and Fire Retirement System of the City of Detroit – Component II 35

Data Approximations and Assumptions As part of our review of the data received from the System, we discussed questionable or missing data with System staff and developed approximations and assumptions in order to perform the valuation. We provided System staff with a letter dated March 22, 2021 with additional information regarding data reconciliation, processing instructions, and assumptions regarding unresolved issues. Note, that letter disclosed our remaining data processing procedures and assumptions and details our reconciliation and final valuation data. System staff has approved the detail and final data disclosed in that letter.
The purpose of this section in this report is to summarize any unresolved concerns about questionable data that are relevant and could have a significant effect on the valuation as disclosed in that letter. This summary also discusses any significant steps we have taken to improve the data due to identifying questionable data values or relationships, significant judgments, or assumptions we have applied to the data. The rationale for the demographic assumptions made for the data processing are 1) instructions/discussions with System staff and 2) professional judgement. All data assumptions have been reviewed with and approved by staff before implementation.
Active
These records are reported in the Microsoft Access data file in the table titled PF_Benefits. Legacy specific fields (salary, Annuity Savings Fund (ASF) balance, service, and Average Final Compensation (AFC)) are taken from this file and combined with the Hybrid active file. That information is used in conjunction with information obtained from the Master tables (sick leave bank) and information carried over from prior valuations (AFC, sick leave, class code, and annual pay as of 2014).
For active members, frozen AFC amounts and frozen service as of June 30, 2014 was reported. The frozen AFC reported on the June 30, 2020 data file was not useable. As such, we used the frozen AFC as reported on the June 30, 2018 data file. For purposes of this valuation, we matched the June 30, 2018 AFC to the AFC data reported for the June 30, 2014 valuation to check against AFC as of June 30, 2014. In cases where the frozen AFC as reported in the 2018 data file was less than 75% of the AFC as reported on the 2014 data file, the AFC as reported on the 2014 data file was used. This boundary was determined after an analysis of the raw AFC data showed that the AFC for several members was unreasonably low. The class code used to distinguish between LSA and DPOA was taken from the 2014 data file.
These procedures are unchanged from the 2019 valuation.
Deferred
These records are reported in the Microsoft Access data file in the table titled PF_Benefits_Vested. Information from the Hybrid inactive file (Hybrid service) is appended to the Legacy file.
Data provided for deferred vested members was incomplete. As part of the processing of deferred member data, in cases where AFC was incomplete, we used $30,000 to estimate the AFC. This procedure is unchanged from the 2019 valuation.
Component II benefit service is not directly provided on the file. The Component II (Legacy) file includes total vesting service and the Component I (Hybrid) file includes Component I benefit service. Since Component II benefit service was frozen as of June 30, 2014 for members that terminated after June 30, 2014, Component II (Legacy) benefit service was determined by subtracting service in the Component I (Hybrid) inactive file from total vesting service in the corresponding Component II (Legacy)
The Police and Fire Retirement System of the City of Detroit – Component II 36

Data Approximations and Assumptions inactive file. Members with estimated vesting service of less than 8 years were assumed to be non-vested and were not valued.
Retired and Beneficiary
These records are reported in the Microsoft Access data file in the table titled Retired_Life. This file is used in conjunction with information from the Master file (class code and agency). Note, General and P/F members are both reported in this table.
Adjustment assumptions include:
• In cases where the benefit is identified to be a joint and survivor benefit and a beneficiary is not listed in the data, it was assumed that male spouses were 3 years older than females;
• For non-equated members that elected a pop-up benefit, the pop-up amount is estimated based on the chosen option and benefit amounts provided in the data;
• Benefits for dependent children are assumed to cease at age 21; and • For non-converted disabled members:
o Converted benefits are assumed to commence at age 65. o For disabilities prior to 2014, converted benefits were estimated using 25 years of service
and the multiplier in effect for the member. For disabilities after 2014, converted benefits were estimated using service as of June 30, 2014 and the multiplier in effect for the member; and
o At 25 years of service, disability benefits are assumed to equal 50% of final compensation.
These procedures are unchanged from the 2019 valuation.
The Police and Fire Retirement System of the City of Detroit – Component II 37

I I I I I I I I I I
Comparative Statement of Active Members and Valuation Payroll
June 30
No. of Members Total Members
No. %
Change
Ratio of Active to Retired
Annual Payroll*
Average Pay 1969 Plan
Pre-1969 $ Change
2001 5,453 132 5,585 2 % 0.7 253,297,027 45,353 4.6 % 2002 5,290 92 5,382 (4)% 0.7 248,663,133 46,203 1.9 % 2003 5,181 76 5,257 (2)% 0.6 248,681,461 47,305 2.4 % 2004 5,007 53 5,060 (4)% 0.6 258,699,581 51,126 8.1 % 2005 4,768 31 4,799 (5)% 0.6 250,491,872 52,197 2.1 %
2006 4,298 14 4,312 (10)% 0.5 228,140,160 52,908 1.4 % 2007 4,204 8 4,212 (2)% 0.5 230,173,964 54,647 3.3 % 2008 4,071 7 4,078 (3)% 0.5 232,812,606 57,090 4.5 % 2009 4,030 7 4,037 (1)% 0.5 231,795,528 57,418 0.6 % 2010 3,985 7 3,992 (1)% 0.5 228,829,999 57,322 (0.2)%
2011 3,809 7 3,816 (4)% 0.5 220,461,691 57,773 0.8 % 2012 3,580 7 3,587 (6)% 0.4 205,800,278 57,374 (0.7)% 20131 3,260 6 3,266 (9)% 0.4 186,694,166 57,163 (0.4)%
20142 2,608 0 2,608 (20)% 0.3 132,566,687 50,831 (11.1)% 2015 2,386 0 2,386 (9)% 0.3 132,722,741 55,626 9.4 %
2016 2,205 0 2,205 (8)% 0.3 126,865,176 57,535 3.4 % 2017 1,914 0 1,914 (13)% 0.2 116,288,356 60,757 5.6 % 2018 1,752 0 1,752 (8)% 0.2 111,407,220 63,589 4.7 % 2019 1,551 0 1,551 (11)% 0.2 105,233,078 67,849 6.7 % 2020 1,369 0 1,369 (12)% 0.2 71,842,120 52,478 (22.7)%
1Payroll used was the greater of the payroll reported for the current and prior fiscal years. 2Post Bankruptcy.
Prior to 2014, DROP members are included.
The Police and Fire Retirement System of the City of Detroit – Component II 38

I I I I I I I I I I
Comparative Statement of Annual Retirement Allowances Being Paid to Retirees and Beneficiaries (Excluding DROP Members)
June 30 No. Retired % of Current Allowances Current Allowances
Allowances as a % of Payroll Pre-69 Total Annuities Pensions Escalators Total Average
2001 4,394 8,166 0.6% 67.4% 32.0% 180,239,652 22,072 71% 2002 4,229 8,179 0.5% 68.4% 31.1% 185,658,396 22,699 75% 2003 4,104 8,277 0.5% 69.8% 29.7% 191,634,636 23,153 77% 2004 3,961 8,328 0.4% 68.5% 31.1% 203,083,524 24,386 79% 2005 3,791 8,376 0.4% 69.5% 30.1% 211,114,020 25,205 84%
2006 3,666 8,550 0.4% 70.9% 28.7% 222,357,372 26,007 97% 2007 3,501 8,498 0.3% 70.6% 29.1% 227,671,788 26,791 99% 2008 3,318 8,442 0.3% 70.0% 29.7% 234,223,368 27,745 101% 2009 3,168 8,424 0.3% 70.1% 29.6% 240,094,968 28,501 104% 2010 3,035 8,356 0.3% 70.3% 29.4% 243,688,596 29,163 106%
2011 2,861 8,379 0.2% 71.6% 28.2% 250,376,700 29,881 114% 2012 2,723 8,451 0.2% 72.2% 27.6% 258,660,084 30,607 126% 2013 2,544 8,476 0.2% 72.9% 26.9% 266,438,460 31,434 143%
20141 2,362 8,395 0.2% 73.5% 26.3% 269,579,544 32,112 203% 2015 2,185 8,279 0.2% 74.2% 25.6% 266,597,448 32,202 201%
2016 2,040 8,204 0.2% 74.3% 25.5% 267,432,588 32,598 211% 2017 1,915 8,187 0.1% 74.3% 25.6% 270,114,360 32,993 232% 2018 1,795 8,151 0.1% 74.2% 25.7% 271,526,640 33,312 244% 2019 1,675 8,102 0.1% 73.9% 26.0% 272,882,712 33,681 259% 2020 1,498 7,960 0.1% 74.2% 25.7% 271,333,872 34,087 378%
1Post Bankruptcy.
The Police and Fire Retirement System of the City of Detroit – Component II 39

Schedule of Employer Contributions
Fiscal Year Ended
June 30
Reported Employer Contributions From Pension
Obligation Certificates (POCs)
Employer Contributions Other
than from POCs
2001 $ 14,443,382 2002 8,449,645 2003 66,843,029 2004 69,475,202 2005 $ 630,829,189 51,602,596
20061 57,766,542 2007 57,423,366 2008 33,934,636 20092 36,151,057 2010 32,808,485
2011 81,642,112 20122 49,760,229 2013 0 2014 0 2015 114,300,000
2016 37,787,744 2017 18,300,000 2018 18,300,000 2019 18,300,000 2020 18,300,000
12006 assets were revised following the 6/30/2006 valuation. 2Contribution receivable.
The Police and Fire Retirement System of the City of Detroit – Component II 40

APPENDIX I – ASSUMPTIONS AND GLOSSARY

Summary of Assumptions Used for PFRS Actuarial Valuation Assumptions Adopted by Board of Trustees
After Consulting with Actuary
Assumption Review
All assumptions are estimates of future experience except as noted. If the rationale for the assumptions is based on experience studies, it is noted.
Economic Assumptions
The investment return rate used in the valuation was 6.75% per year, compounded annually (net of investment and administrative expenses). This assumption is prescribed by the Eighth Amended Plan for the Adjustment of Debts of the City of Detroit (POA).
Price inflation is not directly used in the valuation. For purposes of assessing the reasonability of the investment return assumption we assumed price inflation of 2.50% per year.
Non-Economic Assumptions
The mortality table used to measure retired life mortality is the RP-2014 Blue Collar Annuitant Table for males and females. Tables were extended below age 50 with a cubic spline to the published Juvenile rates. Pre-retirement mortality is the RP-2014 Blue Collar Employee Tables for males and females. The tables are projected to be fully generational, based on the 2-dimensional, sex distinct mortality improvement scale MP-2014. This table was first used as of June 30, 2014. The rationale for the mortality assumption is based on the 2008-2013 Mortality Experience Study issued February 13, 2015.
The probabilities of age/service retirement for members eligible to retire are shown on page 47. The rationale is based on the 2002-2007 Experience Study. However, probabilities were modified effective with the June 30, 2014 valuation to reflect a change in the modeling of future DROP members, consistent with the plan closure. The revised probabilities were selected so that, when combined with the model change, the effect on the present value of benefits would be immaterial.
The probabilities of separation from service (including death-in-service) are shown for sample ages on page 48. These probabilities were first used for the June 30, 2008 valuation. The rationale is based on the 2002-2007 Experience Study.
The Police and Fire Retirement System of the City of Detroit – Component II 41

Miscellaneous and Technical Assumptions June 30, 2020
Marriage Assumption: 100% of males and 100% of females are assumed to be married for purposes of death-in-service benefits. This assumption accounts for potential dependent children/dependent parent death benefits. No other assumption is made for surviving children/dependent parents. Male spouses are assumed to be three years older than female spouses.
Pay Increase Timing: N/A
Decrement Timing: Decrements are assumed to occur mid-year.
Eligibility Testing: Eligibility for benefits is determined based upon the age nearest birthday and service nearest whole year on the date of decrement.
Decrement Relativity: Decrement rates are used directly from the experience study, without adjustment for multiple decrement table effects.
Decrement Operation: Disability and mortality decrements do not operate during the first 5 years of service. Disability and withdrawal do not operate during retirement eligibility.
Incidence of Contributions: Employer contributions are assumed to be received on the last day of the fiscal year.
Longevity in AFC: Longevity payments were included directly in the AFC data provided by the System. No further adjustment was included.
Unused Sick Leave Payout: Sick leave banks as of June 30, 2014 were included in the 2014 data file provided by the System. No further adjustment to the sick banks was included.
Post-Retirement COLA: Active members are assumed to receive a 0.9% COLA rather than 1.0125% because the annuity portion is not subject to the COLA. Post-retirement increases for retired members were based on the plan in effect at retirement. For the pre-69 plan members, future COLA’s are assumed to be the same as wage inflation for active members (not reduced in POA). For other members retiring before 2014, the COLA rate is prorated by the ratio of COLA eligible service to total service at retirement before applying the POA mandated reduction to 1.0125%. The service ratio is provided on the data file.
AFC Period: AFC data was provided by the System.
The Police and Fire Retirement System of the City of Detroit – Component II 42

Miscellaneous and Technical Assumptions June 30, 2020 (Continued)
Disability Change Age: For active members that become duty disabled, the Component II (Legacy) plan is assumed to only be responsible for the frozen benefit which becomes payable starting at age 65.
Duty Death Benefit: For current active members, the duty death pension benefit is assumed to be payable entirely by the Component I (Hybrid) plan. It was assumed that the Component II (Legacy) plan would only be responsible for the refund of member contributions.
Mandatory Retirement Age Currently most members of the PFRS are subject to a mandatory retirement age of 60. However, we understand that the mandatory retirement age is currently not enforced for Police members. Recent membership data indicates that very few Police members stay in employment past age 65. We have, therefore, assumed employment would end at age 65 for Police members and age 60 for Fire members regardless of the length of their DROP participation at that age.
DROP Assumption: All active members not in the DROP are assumed to have a 40% chance of retiring or entering the DROP in their first five years of retirement eligibility (see page 31).
For Police members, 65% of eligible members are assumed to enter the DROP and remain in the DROP for seven years.
For Fire members, 60% of eligible members are assumed to enter the DROP and remain in the DROP for five years.
Workers Comp Offset: No Workers Compensation offsets are assumed for duty disability benefits.
DROP Account: DROP account balances are not reported. No liability is included for DROP account balances.
Class Codes: For valuation purposes, members are categorized as DPOA, DFFA or LSA based on class codes provided by the Retirement System and are primarily used in the valuation to determine normal retirement eligibility (20 & Out versus 25 & Out). The class codes used for this valuation were taken from the 2014 data file. Therefore, counts in the valuation may not represent actual membership in the respective associations.
Frozen Benefit Estimate: Reported frozen AFC was adjusted to include 25% of unused sick leave (to a maximum of 25 days per year of service).
The Police and Fire Retirement System of the City of Detroit – Component II 43
Miscellaneous and Technical Assumptions June 30, 2020 (Concluded)
Form of Payment: The actuarial equivalent basis for optional forms of payment and early retirement are based on the RP-2014 Mortality Table with Blue Collar adjustments projected 11 years, a 6.75% interest rate, 90%/10% unisex mix and a 1.0125% COLA assumption per System Policy. Annuity withdrawal factors use the same mortality and interest rate assumptions with a 0% COLA assumption. No adjustment has been made for alternate forms of payment elections. Principal balances of accumulated member contributions were converted to life annuity offsets based on plan factors for the valuation.
Retiree Pop-Up Factor: If a retiree has a pop-up option but no pop-up factor is provided in the data, the pop-up factor is determined by using an average age at retirement of 50.2, beneficiary age of 47.2, and the optional form of payment assumptions (determined above).
Member Contributions: Member contributions to this Component II plan are assumed to have ceased with the bankruptcy. However, for purposes of determining refunds on member contributions, contribution balances are assumed to earn 5.25% interest.
Limit Testing: We understand the System has specific outside counsel regarding I.R.C. section 415 testing. We have not adjusted liabilities for potential 415 limits.
Data Assumptions: Assumptions regarding incomplete or missing data are reviewed annually with the System and adjusted as directed by the System.
The rationale for the miscellaneous and technical assumptions is the 2002-2007 Experience Study, modified as necessary for changes in data or administration.
The Police and Fire Retirement System of the City of Detroit – Component II 44

Funding Methods The unit credit cost method was used in determining liabilities and normal cost. Under this method, there is no normal cost since benefits are frozen and there are no future accruals and Actuarial Accrued Liability is the present value of each individual’s accrued benefit.
Unfunded Actuarial Accrued Liabilities (UAAL). UAAL contribution is not actuarially determined. Actual employer contributions through June 30, 2023 are set by the POA. The funding policy after 2023 has not yet been established by the Board.
Employer contribution dollars were assumed to be paid in a single sum on the last day of the employer fiscal year. (Adopted for the June 30, 1979 actuarial valuation.)
Present assets are set equal to the Market Value in accordance with the POA.
The data about persons now covered and about present assets was furnished by the System’s administrative staff. Although examined for general reasonableness, the data was not audited by the actuary.
The Police and Fire Retirement System of the City of Detroit – Component II 45

Single Life Retirement Values Based on RP-2014 Blue Collar
for Males and Females
Sample Future Life Attained Expectancy
Ages (Years) in 2020 Men Women
45 39.81 43.14 50 34.82 38.06 55 30.01 33.13 60 25.42 28.35 65 21.06 23.73 70 16.99 19.36 75 13.27 15.31 80 9.97 11.69
The Police and Fire Retirement System of the City of Detroit – Component II 46

I I I I I I
I I I I
Probabilities of Service Retirement
Service
Percent of Eligible Active Members Retiring within Next Year
Police Fire 20 & Out 25 & Out 20 & Out 25 & Out
19 40% 40% 20 40% 40% 21 40% 40% 22 40% 40% 23 40% 40% 24 100% 40% 100% 40% 25 100% 40% 100% 40% 26 100% 40% 100% 40% 27 100% 40% 100% 40% 28 100% 40% 100% 40% 29 100% 100% 100% 100% 30 100% 100% 100% 100% 31 100% 100% 100% 100% 32 100% 100% 100% 100% 33 100% 100% 100% 100% 34 100% 100% 100% 100% 35 100% 100% 100% 100% 36 100% 100% 100% 100% 37 100% 100% 100% 100% 38 100% 100% 100% 100% 39 100% 100% 100% 100% 40 100% 100% 100% 100%
Ref 922 922 922 922
Age
Percent of Eligible Active Members Retiring within Next Year
Police Fire
60 40% 100% 61 40% 100% 62 40% 100% 63 40% 100% 64 40% 100% 65 100% 100% 66 100% 100% 67 100% 100% 68 100% 100% 69 100% 100% 70 100% 100% Ref 922 1
Members eligible for 20 & Out are assumed to be first eligible for normal retirement after 19 years of service due to their ability (and experience) to purchase service. Members eligible for 25 & Out are assumed to be eligible for normal retirement after 24 years of service due to their ability (and experience) to purchase service. Members are also eligible to retire at age 60 with no service requirement. The rationale for these assumptions is the 2002-2007 Experience Study.
The Police and Fire Retirement System of the City of Detroit – Component II 47

I I I I I
Probabilities of Separation
Sample Ages
Years of Service
% of Active Members Withdrawing within Next Year
Police Fire
ALL 0 8.50% 5.00% 1 7.50% 4.00% 2 6.00% 3.00% 3 5.00% 2.00% 4 4.50% 2.00%
25 5 & Over 4.50% 1.96% 30 3.30% 1.62% 35 2.30% 1.11% 40 1.70% 0.77%
45 1.50% 0.60% 50 1.10% 0.51% 55 0.80% 0.51% 60 0.80% 0.51% Ref 566
207 230
113 x 0.85
Sample % of Active Members Becoming Disabled within Next Year
Police Fire Ages Ordinary Duty Ordinary Duty
25 30 35 40
45 50 55 60
0.06% 0.07% 0.08% 0.11%
0.16% 0.47% 0.73% 0.83%
0.13% 0.19% 0.34% 0.49%
0.73% 1.16% 1.96% 2.82%
0.07% 0.08% 0.09% 0.12%
0.18% 0.53% 0.82% 0.94%
0.34% 0.52% 0.90% 1.30%
1.92% 3.06% 5.18% 7.47%
Ref 105 x 0.75 90 x 0.85 105 x 0.85 90 x 2.25
The rationale for these assumptions is the 2002-2007 Experience Study.
The Police and Fire Retirement System of the City of Detroit – Component II 48

Glossary Actuarial Accrued Liability. The difference between (i) the actuarial present value of future plan benefits, and (ii) the actuarial present value of future normal cost. Sometimes referred to as “accrued liability” or “past service liability.”
Accrued Service. The service credited under the plan which was rendered before the date of the actuarial valuation.
Actuarial Assumptions. Estimates of future plan experience with respect to rates of mortality, disability, turnover, retirement, rate or rates of investment income and salary increases. Decrement assumptions (rates of mortality, disability, turnover and retirement) are generally based on past experience, often modified for projected changes in conditions. Economic assumptions (salary increases and investment income) consist of an underlying rate in an inflation-free environment plus a provision for a long-term average rate of inflation.
Actuarial Cost Method. A mathematical budgeting procedure for allocating the dollar amount of the “actuarial present value of future plan benefits” between the actuarial present value of future normal cost and the Actuarial Accrued Liability. Sometimes referred to as the “actuarial funding method.”
Actuarial Equivalent. A single amount or series of amounts of equal value to another single amount or series of amounts, computed on the basis of the rate(s) of interest and mortality tables used by the plan.
Actuarial Present Value. The amount of funds presently required to provide a payment or series of payments in the future. It is determined by discounting the future payments at a predetermined rate of interest, taking into account the probability of payment.
AFC. Average Final Compensation.
Amortization. Paying off an interest-bearing liability by means of periodic payments of interest and principal, as opposed to paying it off with a lump sum payment.
ARF. Annuity Reserve Fund.
ASF. Annuity Savings Fund.
Contribution Budgeting Liability. An expected return based measure of pension obligation.
DPOA. Detroit Police Officers Association.
DFFA. Detroit Fire Fighters Association.
DPCOA. Detroit Police Command Officers Association.
DROP. Deferred Retirement Option Program.
The Police and Fire Retirement System of the City of Detroit – Component II 49

Glossary (Concluded) Experience Gain (Loss). A measure of the difference between actual experience and that expected based upon a set of actuarial assumptions during the period between two actuarial valuation dates, in accordance with the Actuarial Cost Method being used.
GASB: Governmental Accounting Standards Board.
PFA: Funding Plan Assets
FY: Fiscal Year
LSA. Lieutenants and Sergeants Association.
MVA: Market Value Assets
Normal Cost. The annual cost assigned, under the actuarial funding method, to current and subsequent plan years. Sometimes referred to as “current service cost.” Any payment toward the Unfunded Actuarial Accrued Liability is not part of the Normal Cost.
PAF. Pension Accumulation Fund.
POA. The 8th Amended Plan for the Adjustment of the Debt of the City of Detroit.
Reserve Account. An account used to indicate that funds have been set aside for a specific purpose and are not generally available for other uses.
Solvency Liability. A market-based measure of the present value of accrued benefits at a municipal bond discount rate unadjusted for the credit quality of the plan sponsor.
Unfunded Actuarial Accrued Liability. The difference between the Actuarial Accrued Liability and Valuation Assets. Sometimes referred to as “unfunded accrued liability.”
Valuation Assets. The value of current plan assets recognized for valuation purposes.
The Police and Fire Retirement System of the City of Detroit – Component II 50

APPENDIX II – FUNDING POLICY

Police and Fire Retirement System of the City of Detroit Actuarial Funding Policy
Introduction
The purpose of this Actuarial Funding Policy is to record the funding objectives and policy set by the Board of Trustees (Board) for the Police and Fire Retirement System of the City of Detroit (the System). The Board establishes this Actuarial Funding Policy to help ensure the systematic funding of future benefit payments for members of the Plan.
In 2014, the Plan for the System was written and approved by the bankruptcy court as part of the City’s Plan of Adjustment (POA). At that time, the original retirement plan was split into two Retirement Plans: Component I (Hybrid) and Component II (Legacy). In accordance with the POA, employer contributions and certain assumptions cannot be changed until fiscal year 2024. This Policy is intended to recognize those items as fixed until 2024 and establish a funding policy for the period beginning in fiscal year 2024, when employer contributions must be determined on an actuarial basis. Nothing in this Policy is intended to prevent the Board from altering the Policy prior to fiscal year 2024 as conditions change or additional information becomes available to the Board.
This Policy shall be regularly reviewed by the Board.
Funding Objectives
1. Provide benefit security to members of the System:
a. For purposes of this policy, benefit security means having adequate liquidity to pay benefits when due.
2. Establish an appropriate employer contribution based on the following objectives:
a. Fully funding the Legacy Plan liability no later than 2054;
b. Keeping the Hybrid Plan fully funded; and
c. Managing employer contribution volatility.
3. Provide a reasonable margin for adverse experience to help offset risks.
4. Measure and monitor funding status, post-2024 contribution estimates and risk.
a. Perform annual valuations; and
b. Include post-2024 contribution estimates (based on this Policy) in annual actuarial valuations.
The Police and Fire Retirement System of the City of Detroit – Component II 51

Elements of Actuarial Funding Policy
The Plans will have annual actuarial valuations each June 30. Employer contributions will be determined for the fiscal year ending two years after the valuation date. For example, the actuarially determined employer contribution for the fiscal year ending June 30, 2024 will be determined by the June 30, 2022 annual actuarial valuation.
Annual actuarial valuations may or may not also serve other purposes such as Legacy Plan restoration, Hybrid plan Section 9.5 fiscal responsibility calculations, and/or Annuity Savings Fund excess interest transfers between components. Unless otherwise stated, those purposes are not subject to this Policy.
For all other funding purposes, annual actuarial valuations will include the following elements of the Actuarial Funding Policy:
1. Actuarial Cost Method
a. Hybrid Plan: The Entry Age actuarial cost method shall be used in determining the Actuarial Accrued Liability (AAL) and Normal Cost with the entry age based on date of hire. Since this component was created in July 2014 and granted eligibility and vesting service prior to July 2014 (for members hired before that date), this Plan had an unfunded actuarial accrued liability on the effective date, known as the transition cost. As of June 30, 2017, the AAL (including the transition cost) in the Hybrid Plan was fully funded. This Plan could become less than fully funded in the future if experience is less favorable than assumed or there are changes in assumptions or Plan provisions.
b. Legacy Plan: The Unit Credit Normal actuarial cost method shall be used in determining Actuarial Accrued Liability (AAL) and Normal Cost. Since this component is closed and accrued benefits are frozen as of June 30, 2014, this method results in no normal costs and an AAL that equals the Present Value of Accrued Benefits (PVAB) of each member.
2. Asset Smoothing Method
a. For estimating contributions prior to June 30, 2023, the Funding Value of Assets (or actuarial value of assets) will be equal to the Market Value of Assets, as mandated by the Plan of Adjustment. For determining (or estimating) employer contributions on or after fiscal year 2024, the Funding Value of Assets will be based on a method that employs smoothing of market gains and losses over a closed period. The smoothing period for recognized market gains and losses (above or below the assumed rate of return) will be a 3-year period.
b. The Funding Value of Assets shall not diverge from the Market Value of Assets by more than 15%.
c. The annual actuarial valuation will calculate results on both the smoothed value of assets and the (non-smoothed) Market Value of Assets beginning with the June 30, 2019 valuation (the Funding Value of Assets will initially be set to the Market Value of Assets as of June 30, 2018 with smoothing beginning prospectively). The post-2024 contribution estimate will always be based on the smoothed value of assets. Other results (UAAL, Funded Status, etc.) will be based on the Market Value of Assets prior to 2024 and the smoothed value of assets after 2023.
The Police and Fire Retirement System of the City of Detroit – Component II 52

3. Amortization Method
a. Hybrid Plan
a) A Level Percent of Payroll amortization method shall be used to systematically eliminate (pay off) the Unfunded Actuarial Accrued Liability (UAAL) over a closed 15-year period from the later of July 1, 2023 or the applicable fiscal year after the funded status falls below 100%.
b) If funded status is above 100%, the contribution requirements for the UAAL will be $0 (thereby creating a minimum employer contribution of employer normal cost).
c) Layered amortizations will be considered by the Board post-2024.
b. Legacy Plan
a) The Level Dollar amortization method shall be used to systematically eliminate (pay off) the Unfunded Actuarial Accrued Liability (UAAL) over a closed period of 20 years from July 1, 2023 for the UAAL as of July 30, 2022 (projected to July 1, 2023), and
b) Layered amortizations that use 20-year closed periods for gains and losses occurring after June 30, 2022 (each 20-year period starts with the first payment after the applicable gain or loss occurs).
4. Funding Target and Cash Flow Projections
a. The targeted funded ratio shall be 100%.
b. The Legacy Plan annual actuarial valuation shall include projections of estimated employer contributions, expected benefit payments and estimated funded status to the later of fiscal year 2054 or 30 years after the applicable employer contribution fiscal year.
c. Section 9.5 of the Plan details the actions to be taken if the 5-year projected funded status falls below 90% (Hybrid Plan, only).
5. Risk Management
a. Assumption Changes
a) The actuarial assumptions used shall be those last adopted by the Board based on the most recent experience study and upon the advice and recommendation of the actuary. In accordance with the City Ordinance, the actuary shall conduct an experience study at least every five years. The results of the study shall be the basis for the actuarial assumption changes recommended to the Board. However, the assumed rate of return and the actuarial value of assets are mandated by the City’s POA and cannot be changed prior to June 30, 2023.
b) The actuarial assumptions may be updated at any time, as advised by the actuary, if significant Plan design changes or other significant events occur.
c) The next experience study will be performed after the 2020 actuarial valuation and will include both economic (investment return, inflation, etc.) and demographic (mortality, retirement, disability, etc.) assumptions. Even though the investment rate of return may not be changed for determining employer contributions until after June 30, 2023, the Board may elect to show valuation results under an alternative reasonable assumed rate of investment return prior to 2023.
The Police and Fire Retirement System of the City of Detroit – Component II 53

b. Risk Measures
a) Risk measures will be included in the annual actuarial valuations. Below is a list of potential measures to be included. The measures may be changed over time as deemed appropriate.
(i) Classic measures currently determined
− Funded ratio (assets / liability) on both a market value and funding value (if funding value is not equal to market).
− UAAL amortization period (years required to pay down the UAAL based on current funding rates).
− Portfolio rate of return for the year on both the market value and funding value of assets.
− 5- and 10-year geometric average portfolio rate of return on both the market value and funding value of assets (developed prospectively beginning with the 2019 valuation).
− 5- and 10-year standard deviation of return on both the market value and funding value of assets (developed prospectively beginning with the 2019 valuation).
(ii) Duration of the Actuarial Accrued Liability
− Measures the sensitivity of the liability to a 1% change in assumed rate of return. A decrease in this measure indicates a decrease in assumed rate sensitivity and vice versa.
(iii) Total UAAL / Covered Payroll
− Measures the risk associated with contribution rates relative to the impact on the ability to fund the UAAL. A decrease in this measure indicates a decrease in UAAL contribution risk and vice versa.
− Consideration will be given to using total payroll or revenue source, if available.
(iv) Total Assets / Covered Payroll
− Measures the risk associated with the potential impact of asset experience on contributions. A decrease in this measure indicates a decrease in asset risk and vice versa.
− Consideration will be given to using total payroll or revenue source, if available.
(v) Total AAL / Covered Payroll
− Measures the risk associated with the potential impact of liability experience on contributions. A decrease in this measure indicates a decrease in experience risk and vice versa. This also provides a long-term measure of the asset risk where the System has a target funded ratio of 100%.
− Consideration will be given to using total payroll or revenue source, if available.
(vi) Non-Investment Cash flow / Beginning of year assets
− Measures depletion risk, sensitivity to annual investment gains and losses risk and the maturity of the plan. For a mature open plan, this may converge to the negative of the real rate of return assumption (investment return less wage inflation). A less negative number (or a positive number) indicates a less mature plan and/or a plan that is at lower risk of fund depletion and less sensitive to annual gains and losses. A more negative number indicates a more mature plan and/or a plan that is more at risk of fund depletion and more sensitive to annual gains and losses. For a super-mature closed plan such as the Legacy plan, this may become more negative over time as liquidity needs increase.
The Police and Fire Retirement System of the City of Detroit – Component II 54

(vii) Market Value of Assets / Benefit Payments
− Measure depletion risk. A low value estimates the number of years to depletion disregarding future contributions and investment return.
(viii) Solvency Liability
− Measures the estimated cost of accrued benefits as a result of minimizing investment risk in the portfolio.
b) Risk Control: The Board shall carefully monitor the risk measures above and shall consider steps to mitigate risk, particularly as the Legacy Plan funded ratio increases. Examples of risk mitigating techniques include, but are not limited to:
(i) Reviewing investment risk in accordance with the Board’s Investment Policy
(ii) Adding provisions for adverse deviation in the actuarial assumptions
(iii) Increasing employer contributions (through a change in methods, assumptions, or amortization period)
(iv) Other
The Police and Fire Retirement System of the City of Detroit – Component II 55

Glossary
1. Actuarial Accrued Liability (AAL): The difference between (i) the actuarial present value of future plan benefits; and (ii) the actuarial present value of future normal cost. Sometimes referred to as “accrued liability” or “past service liability.”
2. Actuarial Assumptions: Estimates of future plan experience with respect to rates of mortality, disability, turnover, retirement, rate or rates of investment income and salary increases. Decrement assumptions (rates of mortality, disability, turnover and retirement) are generally based on past experience, often modified for projected changes in conditions. Economic assumptions (salary increases and investment income) consist of an underlying rate in an inflation-free environment plus a provision for a long-term average rate of inflation.
3. Actuarial Cost Method: A mathematical budgeting procedure for allocating the dollar amount of the “actuarial present value of future plan benefits” between the actuarial present value of future normal cost and the actuarial accrued liability. Sometimes referred to as the “actuarial funding method.”
4. Actuarial Gain (Loss): A measure of the difference between actual experience and that expected based upon a set of actuarial assumptions during the period between two actuarial valuation dates, in accordance with the actuarial cost method being used. For example, if during a given year the assets earn more than the investment return assumption, the amount of earnings above the assumption will cause an unexpected reduction in UAAL, or “actuarial gain” as of the next valuation. These include contribution gains and losses that result from actual contributions made being greater or less than the level determined under the policy.
5. Actuary: A person who is trained in the applications of probability and compound interest to problems in business and finance that involve payment of money in the future, contingent upon the occurrence of future events. Most actuaries in the United States are Members of the American Academy of Actuaries (MAAA). The Society of Actuaries is an international research, education and membership organization for actuaries in the life and health insurance, employee benefits, and pension fields. It administers a series of examinations leading initially to Associateship and the designation ASA and ultimately to Fellowship with the designation FSA.
6. Amortization: Paying off an interest-bearing liability by means of periodic payments of interest and principal, as opposed to paying it off with a lump sum payment.
7. Unit Credit Normal Actuarial Cost Method: A funding method that calculates the Normal Cost as the present value of the change in accrued benefits for active members.
8. Experience Study: An actuarial investigation of demographic and economic experiences of the system during the period studied. The investigation was made for the purpose of updating the actuarial assumptions used in valuing the actuarial liabilities.
9. Funding Value of Assets: The value of current plan assets recognized for valuation purposes. Generally based on a phased-in recognition of all or a portion of market related investment return. Sometimes referred to as Actuarial Value of Assets or Smoothed value of Assets.
10. Market Value of Assets: The fair value of plan assets as reported in the plan’s audited financial statements.
11. Normal Cost (NC): The annual cost assigned, under the actuarial funding method, to current and subsequent plan years. Sometimes referred to as “current service cost.” Any payment toward the unfunded actuarial accrued liability is not part of the normal cost.
12. Unfunded Actuarial Accrued Liability (UAAL): The positive difference, if any, between the actuarial accrued liability and valuation assets. Sometimes referred to as “unfunded accrued liability.”
The Police and Fire Retirement System of the City of Detroit – Component II 56

Actuarial Value of Assets 2018 2019 2020 2021 2022
A. Funding Value Beginning of Year $ 2,922,141,978 $ 2,866,303,805 $ 2,728,941,361
B. Market Value End of Year 2,866,303,805 2,670,843,356 2,417,248,140
C. Market Value Beginning of Year 2,922,141,978 2,866,303,805 2,670,843,356
D. Contributions During Year: D1. City Contributions (End of Year) 18,300,000 18,300,000 18,300,000 D2. Member Contributions 42,114 3,600 0 D3. Total 18,342,114 18,303,600 18,300,000
E. Disbursements: E1. Benefits Paid During Year 288,443,573 286,557,514 286,551,161 E2. Refunds 19,947,151 19,054,169 14,024,530 E3. Transfers 0 4,030,561 1,618,996 E4. Total 308,390,724 309,642,244 302,194,687
F. Investment Income: F1. Average Funding Value 2,767,967,673 2,711,484,483 2,577,844,018 F2. Assumed Rate 6.75% 6.75% 6.75% F3. Amount for Immediate Recognition: F1 X F2 183,025,203 174,004,471 F4. Market Total: B - C - D3 + E4 234,210,437 95,878,195 30,299,471 F5. Amount for Phased-In Recognition: F4-F3 (87,147,008) (143,705,000)
G. Phased-In Recognition of Investment Income: G1. Current Year: F5/3 (29,049,003) (47,901,667) G2. 1st Prior Year 0 (29,049,003) (47,901,667) G3. 2nd Prior Year 0 0 (29,049,002) (47,901,666) G3. Total Recognized Investment Gain (29,049,003) (76,950,670) (76,950,669) (47,901,666)
H. Total Interest Distributed - Current Year: F3 + G3 234,210,437 153,976,200 97,053,801
I. Funding Value End of Year: I1. Preliminary Funding Value End of Year: A + D - E + H 2,728,941,361 2,542,100,475 I2. Upper Corridor Limit 115% x B 3,071,469,859 2,779,835,361 I3. Lower Corridor Limit 85% x B 2,270,216,853 2,054,660,919 I4. Funding Value End of Year 2,866,303,805 2,728,941,361 2,542,100,475
J. Difference Between Market & Funding Value: B - I4 0 (58,098,005) (124,852,335)
K. Recognized Rate of Return: H / F1 8.46% 5.68% 3.76%
L. Market Rate of Return: F4 / (F1 + C - A) 8.46% 3.54% 1.20%
M. Ratio of Funding Value to Market Value: I4 / B 100.00% 102.18% 105.17%
The Funding Value of Assets recognizes assumed investment income (line F3) fully each year. Differences between actual and assumed investment income (line F5) are phased-in over a closed 3-year period. During periods when investment performance exceeds the assumed rate, Funding Value of Assets will tend to be less than market value. During periods when investment performance is less than the assumed rate, Funding Value of Assets will tend to be greater than market value. The Funding Value of Assets is unbiased with respect to Market Value. At any time, it may be either greater or less than Market Value. If assumed rates are exactly realized for two consecutive years, the Funding Value will become equal to Market Value.
The Police and Fire Retirement System of the City of Detroit – Component II 57

Recurring Debt Service and Legacy Pension Costs
(Attachment 3)

- - -
Recurring Debt Service and Legacy Pension Costs General Fund Grand Bargain ($ in millions) Contributions End
$350
$300
$250
$200
$150
$100
$50
$0
$85 $85 $86 $73 $75 $75 $76 $76 $76 $76 $71 $71 $71 $70 $69 $70 $66 $63 $61 $59 $56 $54 $52 $50
$50 $55 $60 $79 $89 $99 $141
$202 $202 $202 $202 $202 $202 $202 $221 $221 $221 $221 $221 $221 $221 $221 $221 $221
Debt Service Savings Goes Toward Legacy Pension
30%
25%
20%
15%
10%
5%
0%
LTGO Debt Service Legacy Pension % of Revenue
Excludes RPF Deposits from one-time fund balance in FY16 ($20M), FY17 ($50M), and FY22 ($30m). Excludes “Grand Bargain” contributions, which provide $18.7M per year through FY34. Excludes DWSD and Library. LTGO Debt Service excludes B-Note debt service allocated to enterprise funds.
1FY 2021-2030 Long-Term Forecast OCFO – Office of Budget

Office of the Chief Financial Officer
FRC Finance Subcommittee City of Detroit
May 4, 2021

Agenda ● Adopted FY 2021-2022 Budget and Four-Year Financial Plan Overview
● Long-Term Forecast
● American Rescue Plan Act
● Waiver Requirements
Office of the Chief Financial Officer 2

Adopted FY 2021-2022 Budget and Four-Year Financial Plan Overview
Office of the Chief Financial Officer 3

FY 2022 Budget Overview
Key Budget Drivers
1. COVID-19 Impact and Response
2. Economic Recovery and Opportunity
3. Fiscal Stability
FY 2022 Budget Totals
● All Funds Budget totals $2.3 billion
● General Fund Budget totals $1.1 billion
● All Funds support 10,324 full-time equivalent positions
Office of the Chief Financial Officer 4

Economic Outlook
Office of the Chief Financial Officer 5

340 New Cases, 7-Day MA New Deaths, 7-Day MA_ 68
320 - New COVID-19 Cases, 7-day MA _64
300 - New COVID-19 Deaths, 7-day MA 1---- ---¾--------------------------------------------l-60
280 - 56
260 - 52
240 - 48
220 - 44
200 - 40
180 - 36
160 - 32
140 - 28
120 - 24
100 - 20
80 - 16
60 - 12
40 - 8
20 ---4 o l!....L --"-----'----~~~~~~~~-1!!!!!!!1!11111!!~~-a-~~-'---~---=..:~ .-O
20M03 20M04 20M05 20M06 20M07 20M08 20M09 20M10 20Mll 20M12 21M01 21M02 I lsA RESEARCH SEMINAR IN QUANTITATIVE ECONOM ICS UNl \'ERSITY OFMIC HICA N
COVID-19 Cases and Deaths in Detroit
RSQE, February 2021
Office of the Chief Financial Officer 6

235 000 Employment Count, SA _ 235,000 ' - Detroit Resident Employment
230 000 --~~- = 1- - ~ --~ --------------~ ~~·#'"'c-~ - , .c1...--c,, -... --- ----1- 230 000 ' - Detroit Payro1 Employment ~ ·" '
225,000 ~ ------------------------.a----.r,---;;r----f-- ~ -----~ - 225,000 220,000 , ~ - 220,000
215,000 - - 215,000
210,000 - 210,000
205,000 - 205,000
200,000 - 200,000
195,000 - 195,000
190,000 - 190,000
185,000 --- 185,000
180,000 --- 180,000
175,000 - 175,000
170,000 - 170,000
165,000 - 165,000 2010 2011 2012 2013 2014 2015 2016 2017 2018 2019 2020 I lsA RESEARCH SEMINAR IN
QUANTITATIVE ECONOM ICS UNl \'ERSITY OFMIC HICA N
Seasonally Adjusted Monthly Employment
RSQE, February 2021
Office of the Chief Financial Officer 7

4 700 Thousands of Payroll Jobs , - Michigan Payroll Employment (LH)
Thousands of Payroll Jobs _ 250 Forecast
>------------+-------------------.- 245
4,300 - 230
4,200 1----~ ------ ~ ----------,,,=--------~-----------i l---------,/', -----------l- 225
4,100
4,000
- 220
- 215
3,900 i------~-.----~ ----------------------t\l r,~---------------<- 210
3,800 1-------------------------------H ,__ __________ __,_ 205
3,700 1-------------------------------H 1-----------------<- 200
3,600 1------------------------------+-u--------------1- 195
3,500 .__--'----'----'---'--__,__-----'------'--..__---'----'----'---'------'-'._____.._----''----'-----'------'----'- 190 07 08 09 10 11 12 13 14 15 16 17 18 19 20 21 22 23 24 25 I lsA RESEARCH SEMINAR IN
QUANTITATIVE ECONOM ICS UNl\'ERSITYOFMIC HICAN
Jobs in Detroit Recover Faster than State Overall
RSQE, February 2021
Office of the Chief Financial Officer 8

80 000 ~D_o_ll_a_rs _________________________ ~-------------~ ' - Average Wage Rate, Jobs in the City of Detroit
75,000 - -Ave~age-Wage-Rate-,--JGb&-in-MiGt:ligaA--------------+---------,~-=-------1
- Average Wage Rate, Residents of the City of Detroit
45,000 '- --.-!l!!'~~"'.:::::::::=--------------1------------J 40,000 t-----------------------------t----------------1
35,000 l---------------------~,,..~"""1-"""""' ...... ;;;iiii---"""""""'""""" ....... -::=-~
10 11 12 13 14 15 16 17 18 19 20 21 22 23 24 25
~
- 80,000
- 75,000
- 70,000
- 65,000
- 60,000
- 55,000
- 50,000
-45,000
-40,000
- 35,000
- 30,000
- 25,000
I lsA RESEARCH SEMINAR IN QUANTITATIVE ECONOM ICS UNl \'ERSITY OFMIC HICA N
Average Wages for Jobs in Michigan and Detroit, and for Detroit Residents
RSQE, February 2021
Office of the Chief Financial Officer 9

Revenue Forecast
Office of the Chief Financial Officer 10

■ ■
Office of the Chief Financial Officer
Recurring General Fund Revenue ($ in millions)
$1,200 $1,078.2 $1,051.7 $1,045.9 $1,061.2
$995.2 $1,000
FY19 Actual FY20 Actual FY21 Estimate FY22 Estimate FY23 Estimate FY24 Estimate FY25 Estimate
Major Revenues Other Revenues
$872.3
$179.4 $927.5 $843.1
$800
$600
$400
$200
$0
$881.1
$197.1
$853.2
$192.7
$751.1
$176.4
$867.4
$193.8
$809.8
$185.4
$672.1
$171.0
Note: Excludes non-recurring revenues, such as bond proceeds, asset sales, and one-time tax payments. Adjusted from Revenue Conference to reflect shift of $0.4M from General Fund to special revenue.
11

■ ■ ■
-jf_._
S'
Recurring Income Tax Revenue Estimated Components
($ in millions) $400
$338.0 $335.9 $350 $327.6 $318.6
$300
$250
$200
$150
$100
$50
$0 FY19 Actual FY20 Actual FY21 Estimate FY22 Estimate FY23 Estimate FY24 Estimate FY25 Estimate
$53.7 $38.9 $31.4 $31.5 $33.6 $33.4 $33.6
$155.9 $152.5 $151.5 $157.1 $161.7 $166.4 $170.8
$128.4 $102.1
$40.1
$107.0 $123.3 $127.8 $131.5
$293.5
$223.0
$295.6
Corporate / Partnerships / Assessments / CIPP Resident Individual Nonresident Individual
Note: FY19 Actual excludes $23m one-time corporate collections. FY20 Actual excludes ($3.5m) in one-time corporate refunds.
Office of the Chief Financial Officer 12

Recurring Income Tax Revenue Estimated Components and Remote Work Loss
($ in millions) $400
$350
---------.
■ ■ ■
$53.7
$155.9
$128.4
$16.6 $16.2 $15.6
$31.4
$151.5
$40.1
$84.9
$26.1 $23.5 $300
$250
$200
$150
$100
$50
$0 $38.9
$152.5
$102.1
$33.6
$170.8
$131.5
$33.4
$166.4
$127.8
$33.6
$161.7
$123.3
$31.5
$157.1
$107.0
FY19 Actual FY20 Actual FY21 Estimate FY22 Estimate FY23 Estimate FY24 Estimate FY25 Estimate
Corporate / Partnerships / Assessments / CIPP Resident Individual Nonresident Individual Remote Work Loss (Est.)
Note: FY19 Actual excludes $23m one-time corporate collections. FY20 Actual excludes ($3.5m) in one-time corporate refunds.
Office of the Chief Financial Officer 13

■
Wagering Taxes Impacted by COVID-19 ($ in millions)
$250
$200
$150
$100
$50
$0
$190.5 $186.7
$132.4 $169.8
$188.6
$103.0
$183.8
Wagering Tax
FY19 Actual FY20 Actual FY21 Estimate FY22 Estimate FY23 Estimate FY24 Estimate FY25 Estimate
Note: FY20-FY22 impacted by casino closures and capacity restrictions due to COVID-19 pandemic. Does not include new revenues from internet gaming and sports betting.
Office of the Chief Financial Officer 14

FY 2022 Adopted Budget
Office of the Chief Financial Officer 15

FY 2022 Budget Overview FY22 Budget
General Fund FY21 FY21 FY22 vs. FY21 ($ in millions) Adopted Revised Adopted Revised
Beginning Fund Balance $ 77.3 $ 186.4 $ 170.6 $ (15.8) Rainy Day Fund Use 50.0 50.0 - (50.0)
Revenues Income Tax 275.2 307.9 321.7 13.8
Income Tax Remote Work Loss (35.8) (84.9) (26.1) 58.8 State Revenue Sharing 190.5 204.1 202.5 (1.6) Wagering Tax 135.3 103.0 169.8 66.8 All Other Revenues 341.5 317.5 327.3 9.8 Deferred COVID Reimbursement - 14.0 - (14.0)
Total Revenues 906.7 861.6 995.2 133.6
Recurring Expenditures (1,048.0) (1,050.0) (1,081.7) (31.7) Federal Transit Grants 24.0 60.0 26.5 (33.5) Lapses - 72.6 - (72.6)
Total Recurring Expenditures (net) (1,024.0) (917.4) (1,055.2) (137.8)
Expenditures in excess of revenues (117.3) (55.8) (60.0) (4.2)
Remaining Fund Balance 10.0 180.6 110.6 (70.0)
One-Time Expenditures (10.0) (10.0) (103.3) (93.3)
● FY21 fund balance higher due to effective
management of one-time federal relief funds
● FY22 revenue estimates assume gradual
recovery of income and wagering taxes
● FY22 expenditures growth driven by personnel
expenses, less reliance on federal transit
grants, and one-time investments (next slide)
● FY22 budget spends down most of unassigned
fund balance, while restoring $50M back to
Rainy Day Fund
Ending Fund Balance $ - $ 170.6 $ 7.3 $ (163.3) * FY21 beginning fund balance includes FY20 amounts unassigned and assigned for subsequent year budget
Office of the Chief Financial Officer 16

FY 2022 Budget Overview - Expenditures ● FY22 salaries and benefits grow to support
essential services and enhance support for
our public servants
● FY22 Retiree Protection Fund includes
scheduled $5M increase, plus $30M
supplemental deposit, for a total of $85M
● FY22 blight and capital funding includes
$8M for emergency demolitions, $6.5M for
beautification programs, and $5.5 for fleet
replacements and library capital
○ Other blight and capital activities
supported by bonds
FY22 Budget General Fund FY21 FY21 FY22 vs. FY21 ($ in millions) Adopted Revised Adopted Revised
Recurring Expenditures Salaries and Employee Benefits $ (578.8) $ (578.8) $ (606.9) $ (28.1) Other Operating Expenses (246.3) (248.3) (247.7) 0.6 Retiree Protection Fund (recurring) (50.0) (50.0) (55.0) (5.0) Grand Bargain Pension Contributions (18.7) (18.7) (18.7) -Debt Service (85.0) (85.0) (85.0) -Enterprise Fund Contributions (69.2) (69.2) (68.4) 0.8 Subtotal (1,048.0) (1,050.0) (1,081.7) (31.7)
Federal Transit Grants 24.0 60.0 26.5 (33.5) Lapses - 72.6 - (72.6)
Total Recurring Expenditures (net) (1,024.0) (917.4) (1,055.2) (137.8)
One-Time Expenditures Rainy Day Fund Deposit - - (50.0) (50.0) Retiree Protection Fund Supplemental - - (30.0) (30.0) Blight and Capital (Fund 1003/4533) (10.0) (10.0) (20.0) (10.0) Other One-Time - - (3.3) (3.3)
Total One-Time Expenditures $ (10.0) $ (10.0) $ (103.3) $ (93.3)
* Transit grants support DDOT and People Mover operations. Lapses include one-time federal relief and other projected savings.
Office of the Chief Financial Officer 17

Community Engagement on the Budget
● Rebooted annual public meeting with virtual teleconference
● Partnered with Council on Budget Priorities Forums held in each district
● Nearly 400 attended the 8 meetings, plus 10,800 social media views
● Produced a new public budget survey and exhibits
Outreach Participants
Annual Public Budget Meeting (Oct 2020) 98
Budget Priorities Survey (Nov 2020) 718
Council District Forums (Jan 2021) 268
[email protected] inbox 9
Comments Received 917
Office of the Chief Financial Officer 18

Community Engagement Findings
Over 1,000 people weighed in on budget outreach
Highest Rated Strategies: Crime Control and Household Support
Their Top 5 concerns:
● Are you distributing City resources equitably?
● Can we redirect resources to rebuilding forgotten neighborhoods?
● How do we assure our buildings and assets are fully maintained?
● Can the City improve and expand community outreach efforts?
● How will Detroit remain financially sustainable, especially post-pandemic?
Office of the Chief Financial Officer 19

Budget Highlights
Office of the Chief Financial Officer 20
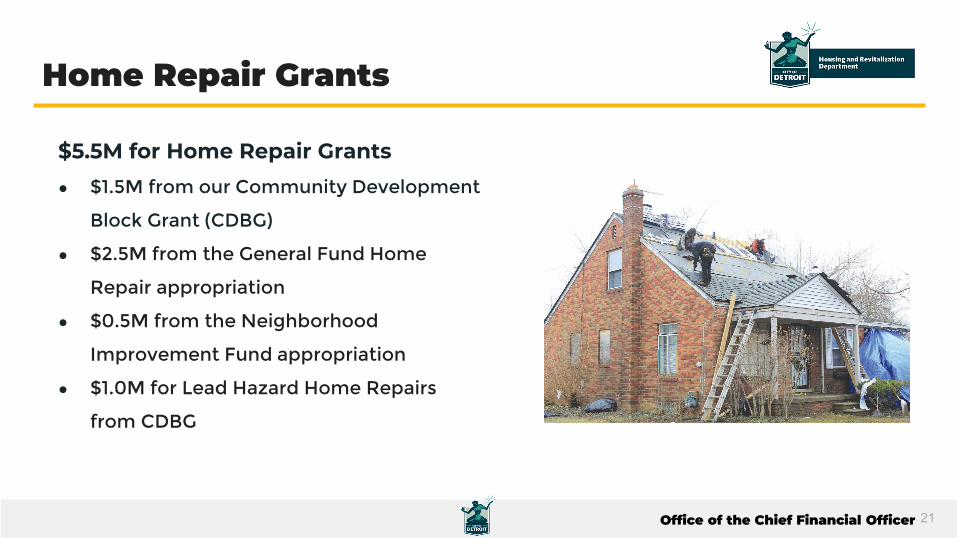
Home Repair Grants
$5.5M for Home Repair Grants ● $1.5M from our Community Development
Block Grant (CDBG)
● $2.5M from the General Fund Home
Repair appropriation
● $0.5M from the Neighborhood
Improvement Fund appropriation
● $1.0M for Lead Hazard Home Repairs
from CDBG
Office of the Chief Financial Officer 21

Affordable Housing and Homeownership
$3.3M for Affordable Housing
Development and Preservation Fund
$2.4M for new Single Family
Homeownership Program ● Down payment assistance to new and
returning low and moderate income buyers
● Funding for community development
organizations to assist
Office of the Chief Financial Officer 22

Public Transit
Over $3M increase for Public Transit ● $1.7M increase for para-transit services
● $1.5M increase for additional Transit Police Officers
● Leveraging federal transit grants to preserve and improve service
Office of the Chief Financial Officer 23

Economic Equity and Opportunity
Over $10M for Workforce Training and Business Support ● $3.5M for Grow Detroit’s Young Talent
● $1.3M for Homegrown Detroit business support and dedicated staff
● $3.1M for Detroit at Work job training and support
● $2.5M for Motor City Match
Other Budget Highlights: ● $400K toward doubling Project Clean Slate expungements
● $250K for Goal Line and $210K for EITC Support
Office of the Chief Financial Officer 24

~ defroif
~ice
Safer Neighborhoods
Over $1M for DPD Mental Health Co-Response Initiative ● DWIHN/DPD Crisis Intervention Team (CIT) in 6 precincts
● DWIHN behavioral health specialists partnered with trained DPD officers
● Mental health and substance use issues connected to supportive services
● 9-1-1 Integrated Response to connect frequent callers to behavioral health specialists
● HRD Homeless Outreach Team providers and mental health case managers
Other Budget Highlights: ● 2.5% pay raise for DPD Police Officers
● $500K for Shot Spotter and Forensic Technicians
Office of the Chief Financial Officer 25

~
GS□ CITY OF OETROIT GENERAL SERVICES DEPARTMENT ·~DN;Oiftolf.1Nt:ttl..r
City of Detroit Alley Cleanup Program .... Gratiot and Woodlawn - Before and After ~ .. .,J
Vibrant and Beautiful City and Recreational Opportunities
Nearly $12M for GSD Beautification Programs ● $6.5M for Commercial Corridors, Murals, Land Bank Properties, and Graffiti Removal
● $5.4M for Year 2 of the Alley Cleanup Program
$1M for Summer Host Sites ● Partnering with 14 faith-based
organizations to provide youth
programming
Budget supports the Safe Restart to
Recreation in Summer 2021
Office of the Chief Financial Officer 26

Fiscal Stability
Office of the Chief Financial Officer 27

Budget Reserve (“Rainy Day Fund”) State law requires the City to maintain a General Fund
budget reserve (“Rainy Day Fund”) of no less than 5% of
the projected expenditures for the fiscal year
In FY2020, the City increased and maintained its Rainy
Day Fund at $107.3M (10% of projected expenditures)
The FY2021 Adopted Budget assumes the City will draw
down $50M to help address COVID-19 revenue
shortfalls, keeping the balance above 5%
The FY2022 Adopted Budget restores the $50M,
increasing the Rainy Day Fund back to $107.3M
Rainy Day Fund ($ in millions)
$120
$100
$80
$60
$40
$20
$0
$62.3
$77.3
$107.3
$57.3
$50.0
-
$107.3
FY18 FY19 FY20 FY21 FY22
Ending Balance Budgeted Draw 5% Requirement
Office of the Chief Financial Officer 28

■ ■ ■
Retiree Protection Fund (“RPF”) Retiree Protection Fund
($ in millions)
$350 $319.7
$300
$250
$200
$150
$100
$50
$0
$103.3 $129.5
$184.7
$234.7 $234.7
$55.0
$30.0
FY18 FY19 FY20 FY21 FY22
Balance FY22 Original Deposit FY22 Supplemental Deposit
Despite the pandemic’s impact on revenues, our
commitment to our retirees has never wavered
FY22 Budget includes our scheduled $55M deposit into
the Retiree Protection Fund, plus another $30M
supplemental deposit, for a total of $85M
Four-Year Financial Plan includes the scheduled $60M
deposit in FY23 and $202M in projected annual pension
contributions resuming in FY24 and FY25
The RPF is critical to our pension funding strategy, and
more funding will be needed to sustain annual pension
contributions after FY26
Office of the Chief Financial Officer 29

r ------------~~~~~~~~~~~~~~~~~~~~~~~~ ■ ■ ■ ■
Retiree Protection Fund (“RPF”) General Fund Legacy Pension Contributions Grand Bargain
Contributions End ($ in millions) $250
$200
$150
$100
$50
$0 $12 $20 $20 $20 $20
$79 $89 $99 $141
$202 $202 $202 $202 $202 $202 $202 $221 $221 $221 $221
$123 $113 $103 $61
$10 $10 $15 $20 $45 $50 $55 $60 $20
$50 $30
$365M in RPF Deposits
Pension Contribution (General Fund) Pension Contribution (RPF) RPF Deposit (recurring) RPF Deposit (one-time)
• Projections of annual legacy pension contributions assume a 30-year level dollar amortization. • Excludes “Grand Bargain” contributions from State of Michigan, Foundation for Detroit’s Future (FDF), and Detroit Institute of Arts (DIA). DWSD and Library liabilities and contributions are separate.
Office of the Chief Financial Officer 30

FY 2022-2025 Four-Year Financial Plan General Fund FY22 ($ in millions) Adopted
Beginning Fund Balance $ 170.6
Revenues Income Tax 321.7
Income Tax Remote Work Loss (26.1) State Revenue Sharing 202.5 Wagering Tax 169.8 All Other Revenues 327.3
Total Revenues 995.2
Recurring Expenditures (1,081.7) Federal Transit Grants 26.5 Street Fund Use for Transit -Retiree Protection Fund Use -
Total Recurring Expenditures (net) (1,055.2)
Expenditures in excess of revenues (60.0)
Remaining Fund Balance 110.6
One-Time Expenditures (103.3)
Ending Fund Balance $ 7.3
FY23 Forecast
$ 7.3
334.2 (15.6) 203.7 186.7 336.9
1,045.9
(1,065.9) -
20.0 -
(1,045.9)
-
7.3
-
$ 7.3
FY24 Forecast
$ 7.3
344.0 (16.2) 204.9 188.6 339.9
1,061.2 1,078.2
(1,204.2) (1,211.2) - -
20.0 20.0 123.0 113.0
(1,061.2)
-
7.3
-
$ 7.3
FY25 Forecast
$ 7.3
352.5 (16.6) 206.1 190.5 345.7
(1,078.2)
-
7.3
-
$ 7.3
● Conservative revenue forecast shows peak
pandemic effects wearing off but assumes a
permanent 10% remote work income tax loss
● Under Act 51, the City may use 20% of its Street
Fund budget for public transit
● Legacy pension payments resume in FY24
projected at $202M annually
● Retiree Protection Fund withdrawals begin
offsetting a portion of the annual $202M pension
payment
Office of the Chief Financial Officer 31

Long-Term Forecast
Office of the Chief Financial Officer 32

Baseline Forecast Assumptions Revenues
● Based on the approved February 2021 Revenue Estimating Conference results for FY 2022 – FY 2025
● Revenue growth generally continues along revenue conference trends after FY 2025
● Forecast does not include one-time federal American Rescue Plan Act funding
● Forecast does not include potential significant negative effects of the proposed charter revisions presented to the Governor
Expenditures
● Generally forecasted from FY 2020 actuals and known adjustments
● Annual wage growth based on current labor agreements and inflationary increases thereafter
● Healthcare, dental, and vision benefits include inflationary growth
● Legacy Pension cost based on FY 2022 Adopted Budget and 30-year level dollar amortization
○ An additional graph is provided to show the impact of a 20-year level dollar amortization
● Debt service based on existing debt service schedules
● Other operating expenditures include 2% inflationary growth
● Includes turnover, overtime, and other savings based on approved FY 2022-2025 four-year financial plan
● Forecast does not include one-time spending from fund balance (e.g., blight, capital); it only includes recurring revenues and expenses
● Projections do not assume any corrective action beyond the four-year financial plan that would be taken to balance the budget
Office of the Chief Financial Officer 33

FY 2021-2030 Long-Term Forecast Baseline
($ in millions) $1,400
$800
$900
$1,000
$1,100
$1,200
$1,300
Large shortfall returns in FY27 and grows as RPF is exhausted
Shortfall will be supported by fund balance in FY21 and FY22.
Revenues Expenditures
Office of the Chief Financial Officer 34

FY 2021-2030 Long-Term Forecast Baseline with 20-Year Pension Amortization
($ in millions) $1,400
$800
$900
$1,000
$1,100
$1,200
$1,300 Shortfall will be supported by fund balance in FY21 and FY22.
Large shortfall returns in FY26 and grows faster as RPF is exhausted sooner
Revenues Expenditures
* The Retirement Systems are considering a 20-year level dollar amortization as the funding policies for the legacy pension plans.
Office of the Chief Financial Officer 35

Potential Upside and Downside Risks Potential Upside (added to forecast)
● Income and property taxes from economic development projects underway
● Internet gaming and sports betting taxes (launched Jan 2021)
● State-shared excise tax from adult-use marijuana (City authorized in Nov 2020, implementation underway)
● Departmental revenue gains from Emergency Medical Services and Municipal Parking improvements
● Potential income tax gains by reducing the resident poverty rate by 10% during the forecast period
Downside Risk (not included in forecast)
● Slower on-site casino recovery than expected
● Slower than anticipated recovery from recession
● Larger income tax losses from nonresidents who continue to work remotely (reduces taxable income)
○ Baseline assumes an ongoing 10% remote work loss, and a 30% loss is shown to illustrate risk
● Longer lasting changes in local economic activity due to workplace and behavior changes
● Future state and federal budget pressures causing reductions in local funding
Office of the Chief Financial Officer 36

FY 2021-2030 Long-Term Forecast with Potential Upside
($ in millions) $1,400
$900
$1,000
$1,100
$1,200
$1,300
Shortfall delayed until FY28
Shortfall is reduced in FY21 and FY22
Potential upside can help mitigate downside risks
-----------------
-➔
$800
Revenues Revenues (if 30% Remote Work) Expenditures
* Baseline forecast assumes an ongoing 10% nonresident income tax loss from commuters who continue to work remotely. The dotted line shows the impact if the ongoing loss is 30% instead.
Office of the Chief Financial Officer 37

FY 2021-2030 Long-Term Forecast with Potential Upside and 20-Year Amortization
($ in millions) $1,400
$800
$900
$1,000
$1,100
$1,200
$1,300
Much larger shortfall by FY27 under 20-year amortization
Shortfall is reduced in FY21 and FY22
Potential upside can help mitigate downside risks
-----------------
-➔
Revenues Revenues (if 30% Remote Work) Expenditures * The Retirement Systems are considering a 20-year level dollar amortization as the funding policies for the legacy pension plans. * Baseline forecast assumes an ongoing 10% nonresident income tax loss from commuters who continue to work remotely. The dotted line shows the impact if the ongoing loss is 30% instead.
Office of the Chief Financial Officer 38

American Rescue Plan Act
Office of the Chief Financial Officer 39

American Rescue Plan Act ● Under the American Rescue Plan Act of 2021, the city of Detroit is expected to receive approximately
$880M from funding allocated to local units of government and states. This allocation will be received
in two tranches, $440M will be received in May 2021 and the other half in 2022. Guidance governing
the use of these funds and other matters is anticipated from the U.S. Treasury Department.
● ARPA spending plan will include funding for unmet needs due to revenue losses from the pandemic
(e.g., commercial blight) and transformational projects that invest in City infrastructure and Detroiters.
More specifics will be coming in May
● While the ARPA funds provide an important safety net as we bridge our budget beyond the pandemic,
the City will only use these funds for one-time expenses rather than building up recurring costs we
cannot sustain once the ARPA funds run out in December 2024.
Office of the Chief Financial Officer 40

Waiver Requirements
Office of the Chief Financial Officer 41

Conditions for Rescission of Waiver FRC Act Section
Condition/ Response Compliance
8(3)(a) Condition: The qualified city or qualified school district fails to pay principal of or interest on any municipal securities when due or payable.
Response: The City did not fail to pay principal of or interest on any municipal securities when due or payable.
8(3)(b) Condition: The qualified city or qualified school district incurs a budget deficit in a fiscal year equal to or more than 5% of the total expenditures in that year based on generally accepted accounting principles.
Response: The City did not incur a budget deficit in a fiscal year equal to or more than 5% of the total expenditures in that year based on generally accepted accounting principles.
8(3)(c) Condition: The qualified city or qualified school district issues municipal securities without the authorization of the commission or in violation of the revised municipal finance act, 2001 PA 34, MCL 141.2101 to 141.2821.
Response: The City did not issue municipal securities without the authorization of the commission or in violation of the revised municipal finance act, 2001 PA 34, MCL 141.2101 to 141.2821.
Office of the Chief Financial Officer 42

Office of the Chief Financial Officer
43
Conditions for Rescission of Waiver FRC Act Section
Condition/ Response Compliance
8(3)(d) Condition: The qualified city or qualified school district violates this act or any mandatory financial controls in a manner that substantially impairs that qualified city's or qualified school district's ability to pay principal of and interest on municipal securities or other debt when due and payable or its ability to adhere to a balanced budget. Response: The City has timely paid all principal and interest on all securities and debt when due. The City has adhered to a balance budget.
8(3)(e) Condition: The qualified city or qualified school district violates any provision of the plan for adjustment, if applicable.
Response: The City did not violate any provision of the plan for adjustment.
8(3)(f) Condition: The state treasurer and the qualified city's or qualified school district's chief financial officer, if applicable, fail to certify that the criteria in subsection (2)(b) are met.
Response: The state treasurer and City CFO provided certification in June of 2020. We intend to provide a new certification in June 2021 and anticipate the state treasurer will also provide the certification.

Conditions for Rescission of Waiver
FRC Act Section
Condition/ Response Compliance
8(3)(g) Condition: The qualified city's or qualified school district's chief financial officer has resigned, been terminated, or been removed, or the office has otherwise become vacant and a successor has not been appointed within 180 days of that vacancy. Response: The City’s CFO position has not been vacant for more than 180 days.
8(3)(h) Condition: The qualified city or qualified school district has not satisfied the requirements in subsection (2)(h).
Response: The City offers the same retirement plan as provided for in the plan of adjustment.
Office of the Chief Financial Officer 44

Considerations for Waiver for the City FRC Act Section
Requirement/ Response Compliance
8(2)(a) Requirement: The commission certifies that the City has adopted and adhered to deficit-free budgets for 3 consecutive years that comply with generally accepted accounting principles and are in accordance with the uniform budgeting and accounting act, 1968 PA 2, MCL 141.421 to 141.440a. Response: The City’s FY 2018, 2019, and 2020 comprehensive annual financial reports show positive unrestricted fund balances at year-end.
8(2)(b)
45
Requirement: The State treasurer and the City’s chief financial officer, if applicable, certify that both of the following are met: (i) all municipal securities or debt obligations sold by or for the benefit of the City in the general public market during the immediately preceding fiscal year and current fiscal year satisfied the capital and other financial requirements of the City during that period, and (ii) there is a substantial likelihood that municipal securities or debt obligations can be sold by the City in the general public market during the remainder of the current fiscal year and the immediately succeeding fiscal year in amount sufficient to substantially satisfy all of the capital and other financial requirements of the City during those periods in accordance with the City’s financial plan, as applicable.
Response: In February 2021 the city issued $175 million in bonds for Proposal N’s Neighborhood Improvement Program, which will be used to meet the City's needs for the rehabilitation and demolition of residential blighted properties in the City in FY 2021 and FY 2022. In October 2020 the city issued $80 million in bonds to fund parks, recreation, and public safety capital improvements, which provided adequate funding for the City's capital and other financial requirements during FY 2021.
Office of the Chief Financial Officer

Office of the Chief Financial Officer
Considerations for Waiver for the City (cont.)
FRC Act Section
8(2)(c)
46
Requirement/ Response Compliance
Requirement: The City’s financial plan projects a balanced budget for the current and succeeding 3 fiscal years using generally accepted accounting principles and in accordance with the uniform budgeting and accounting act, 1968 PA 2, MCL 141.421 to 141.440a and section 4t of the home rule city act, 1909 PA 279, MCL 117.4t.
Response: The City submitted its approved FY 2022-FY 2025 four-year financial plan to the FRC on April 30, 2021. The financial plan projects a balanced budget for the current and succeeding 3 fiscal years. Additionally, the approved FY 2022-FY 2025 financial plan contains the following: a) certification from the CFO that the approved budget complies with the applicable provisions of the uniform budgeting and accounting act, and b) a checklist of the financial plan requirements under MCL 117.4t and a response to each requirement.
8(2)(d) Requirement: The City has demonstrated to the commission’s satisfaction that the City has sufficient ability to borrow in the municipal securities market.
Response: In FY 2021, the City issued a total of $255,000,000 of Unlimited Tax General Obligation Bonds, secured only by a pledge of the full faith and credit of the City. Those bonds were rated BB- by S&P and Ba3 by Moody's. In January 2021, S&P revised Detroit’s credit outlook to “Stable” from “Negative”. In addition, based upon the Qualifying Statement submitted to the Michigan Department of Treasury in December 2020, the Department of Treasury determined that the City was in material compliance with the criteria identified in Section 303(3) of Public Act 34 of 2001. As a result, the City is now authorized to issue municipal securities under this Act without further approval from the Department

Considerations for Waiver for the City (cont.)
FRC Act Section
Requirement/ Response Compliance
8(2)(e) Requirement: The City did not violate the plan for adjustment in the immediately preceding fiscal year, as applicable, and is not in violation in the current fiscal year.
Response: The City did not violate the plan of adjustment in the immediately preceding fiscal year or the current fiscal year.
8(2)(f) Requirement: The State treasurer certifies that the City is in compliance with the uniform budgeting and accounting act, 1968 PA 2, MCL 141.421 to 141.440a.
Response: The CFO has certified that the approved FY 2022-2025 four-year financial plan complies with the applicable provisions of the uniform budgeting and accounting act. The City is managing the current year budget in compliance with the act by monitoring revenues and expenditures and amending the budget if appropriation or fund deficits are projected.
8(2)(g) Requirement: The commission certifies that the City is in substantial compliance with the act.
Response: The City has timely submitted the information and reports required under FRC Resolution 2020-03, which granted the City its current waiver pursuant to section 8 of the act.
Office of the Chief Financial Officer 47

Considerations for Waiver for the City (cont.)
FRC Act Section
Requirement/ Response Compliance
8(2)(h) Requirement: The City has established as part of a system of compensation for employees retirement plans in which the City contributes no more than 7% of an individual’s base pay, excluding payment for overtime services, 1-time lump-sum payments, and the cost of fringe benefits, to an employees’ retirement account. Response: The City offers the same retirement plan as provided for in the plan of adjustment.
8(2)(i) Requirement: The City has implemented a program in which all contracts awarded by the City are posted on the City’s public website within 30 days of the contract award, including the identity of the parties to the contract, the dollar amount of the contract, and a brief description of the goods or services provided in the contract.
Response: The program is available on the City’s Open Data Portal and can be viewed here.
Office of the Chief Financial Officer 48

Detroit FRC Resolution 2018-13 Requirements
Waiver Section
Requirement/ Response Compliance
3(a) Requirement: Within 45 days after the end of each month, in the form provided to the Commission by the City during the twelve months prior to the commencement of the waiver period, as may be modified after consultation and approval by the Commission’s Executive Director and the City’s Chief Financial Officer, the following: (i) current fiscal year-to-date actuals to budget and annualized projections, (ii) monthly headcount analysis, and (iii) current fiscal year-to-date net cash flows, including a current ratio analysis
Response: The City has timely submitted all required monthly financial reports to the Commission and has archived them on the City’s Financial Reports webpage.
3(b) Requirement: Within 45 days of the end of each quarter, a report on the current status of bond debt, payments made to the City’s pension plans, and payments made to the City’s Section 115 Trust for its legacy pension obligations. Response: The City has timely submitted all required quarterly financial reports to the Commission and has archived them on the City’s Financial Reports webpage.
Office of the Chief Financial Officer 49

Detroit FRC Resolution 2018-13 Requirements (cont.)
Waiver Section
Requirement/ Response Compliance
3(c)(i) Requirement: On an annual basis, by March 31st of each year, (A) analysis and forecasts for the legacy pension plans in the form substantially similar to those previously provided to the Commission by the City prior to the waiver period, as may be modified after consultation and approval by the Commission’s Executive Director ad the City’s Chief Financial Officer; and (B) analysis that confirms the City’s ability to pay its debt obligations through the period of time the City is subject to the Commission’s oversight.
Response: The City timely submitted this report titled “FY 2021 – 2030 Long-Term Forecast Report for Legacy Pension Plans and Debt Obligations” on March 31, 2021.
3(c)(ii) Requirement: On an annual basis, by April 30th of each year, the City’s adopted budget and 4-Year Financial Plan. Response: The City timely submitted its adopted budget and 4-year financial plan on April 30, 2021. It is also available online.
Office of the Chief Financial Officer 50

72 (Rev. 01-19)
STATE OF MICHIGAN
DEPARTMENT OF TREASURY GRETCHEN WHITMER RACHAEL EUBANKS GOVERNOR LANSING STATE TREASURER
DATE: May 11, 2021
TO: State Treasurer Rachael Eubanks, CFO Jay Rising, Council President Brenda Jones, State Budget Director David Massaron, David Nicholson, John Barnwell, John Walsh, Ronald Rose
FROM: Patrick Dostine, Departmental Specialist Financial Review Commission
SUBJECT: FRC-City Contracts/Grants Subcommittee May 11, 2021 Meeting Recap
The following is a recap of the FRC-city contracts/grants subcommittee meeting on May 11, 2021. The contracts subcommittee was reconstituted for the purpose of receiving an overview and update of the city’s procurement, contracts, and grants administration. This memorandum provides a summary that focuses on the city’s launch of its $175 million Proposal N demolition and securing program, the fiscal impact to procurement from the proposed charter, and the services of Guidehouse.
The city is nearing the end of its year-three waiver, which was granted June 2020. On June 28, the FRC will take up for consideration the extension of the waiver for another year.
Proposal N
Last December the Detroit Financial Review Commission approved/authorized the sale of $250 million in Neighborhood Improvement Bonds (per Sec.8 (3)(c) of the Michigan Financial Review Commission Act (the FRC Act)). Voters had approved the bonds, Proposal N, in the November election. The city sold the first $175 million in bonds in January.
The Office of Contracting and Procurement (OCP) staff updated subcommittee commissioners on the implementation of Proposal N, which seeks to secure for rehabilitation 8,000 homes and demolish 8,000 homes over a five-year period. The Detroit Land Bank determines what houses are slated for demolition, what houses for securing, and provides the city with the lists.
Boysie Jackson, director of OCP, reported that the city has begun implementation of Proposal N. In March, Detroit City Council approved $30 million in demolition contracts for seven companies. The contracts are for the planned demolition of 1,380 properties. And in early May the city announced the first round of awarded contracts to six companies to secure 276 homes for rehabilitation. Total cost for the 276 homes is $700,000. City Council must still approve the securing contracts. Securing involves the clean-up of an abandoned house, getting it ready for
430 WEST ALLEGAN STREET • LANSING, MICHIGAN 48922 www.michigan.gov/osrfa • 517-373-3200

Page 2
future rehabilitation, like clearing trash, tires, carpeting, fixing holes in roof, and sealing the structure from the elements. Jackson said the OCP sends out every two weeks RFPs for Proposal-N demolition and securing-properties work for companies to respond to.
The city emphasized that its implementation of Proposal N is meeting the requirements of Executive Order 2020-5 which include employing Detroit residents -- 51 percent of the workforce to be Detroit residents -- on any demolition or securing contract greater that $50,000. This requirement is monitored by the city’s Civil Rights, Inclusion and Opportunity (CRIO) department for the duration of the contract. Companies that fall out of compliance are required to contribute to the city’s workforce training fund.
For more information on the Proposal N, click Detroit Demolition Department.
Draft Revised Charter Impact on Procurement
The Office of Chief Financial Officer (OCFO) evaluated the financial and operational impacts of the Draft Revised Charter across city administration and other operations. The OCFO estimates the cost at $2 billion over four years. Tonya Stoudemire, chief deputy CFO, reported to the subcommittee that the impact on procurement would be substantial, approximately $250 million over four years.
There are two main components in the proposed charter that affect procurement. One would expand the workforce-reporting requirements in Executive Order 2016-1 (EO 2016-1 mandates the utilization of Detroit residents on publicly funded construction projects) to “ …all contracts for services between the city of Detroit and contractors, including general contractors and subcontractors” (Italics my emphasis). The OCFO said this additional reporting/compliance requirement would get passed onto the city as a cost from companies expected to follow the new requirements. The OCFO conservatively estimated a cost of $247.3 million over four years. They said it could be higher. The OCFO arrived at the $247.3 million figure by adding 10 percent to all contractual costs.1 Boysie Jackson expressed concern that the added administrative lift, because the proposed charter would apply EO 2016-1 to “all contracts for services”, would be an Achilles heel for small and mid-sized businesses.
This expansion of Executive Order 2016-1 across prime contractors and subcontractors, the chief deputy told commissioners, would also necessitate the OCP to add administrative staff, a new unit, to carry out the expanded reporting requirements. The OCFO estimated a cost of $3.2 million over four years. Boysie Jackson said, for example, the OCP would be required to track all the employees at AECOM, a prime contractor with subcontractors, to verify, among other things, employees’ addresses and whether they pay their city taxes.
As a reminder, the Charter Revision Commission is scheduled to make a presentation, which will include the fiscal impact the proposed charter would have on the city’s general fund, May 24 to the Financial Review Commission.2
1 See Appendix, the OCFO’s spreadsheet: Fiscal Impact Draft-V.2. Row 9 & 16 on Sheet1 show how the OCFO arrived at the roughly $250 million impacting the GF and OCP. This spreadsheet also contains the OCFO’s drivers, inflation rate, assumptions, etc. used in its fiscal analysis of the proposed Charter changes. 2 The OCFO had minimal communications with the CRC during the formulation stage of the proposed charter. When the CRC web-published the Discussion Draft in early 2021, the OCFO produced its first analysis which is in the Appendix.

Page 3
Guidehouse, CFR and ARPA
The city hired Guidehouse in April 2020, at the start of COVID-19, to assist it in maximizing federal funding under the CARES Act, FEMA disaster recovery program, state and regional programs, and future stimulus legislation.3 In April 2021, the city amended the Guidehouse contract, extending it through August 2021, to include work with the vaccine funding/administration. (See p.17 FRC Contracts/Grants Subcommittee PowerPoint in the Appendix.) The city received $23 million in vaccine funding ($19 million from FEMA, $3.4 million from the State, and $663,000 from the Health Department). The $19 million was advanced and so the city did not have to identify funds and be reimbursed later by the federal government.
The city has been anticipating $826 million in ARPA funds. (The amount, $826 million, is a slight reduction, 6 percent, from initial estimated figure, $880 million.) The city is in the process of issuing RFPs to bring in supportive services for procurement, accounting, and compliance in preparation for the large influx of monies arriving in two tranches: FY ‘21 and FY ‘22. The idea is to hit the ground running and commit the dollars most efficiently and within all guidelines and timelines. The city also noted that the ARPA funds will be guided by single-audit rules and, therefore, are exempt from the city mandates related to Detroit-based businesses.
Conclusion All contracts awarded by the city are posted on the city’s website within 30 days of the contract award. Included in the posted information are the identity of the parties to the contract, the contract amount, and a brief description of the goods and services. As a result, the city remains in compliance with Sec. 8(2)(i) of the FRC Act. To view the OCP webpage and posted contracts, click Detroit.mi.gov/purchasing and Open Data Portal, respectively.
See the Appendix to review the CFO’s entire presentation: FRC Contracts/Grants Subcommittee, May 11, 2021, and the OCFO’s Fiscal Impact Draft – V2.
3 The OCFO reported that it has left to draw-down from the $154 million Coronavirus Relief Fund (CRF) allocation about $200,000.

Fiscal Impact of Proposed City Charter $ in thousands Section FY22 FY23 FY24 FY25 Driver Avg Cost Units Total Cost Growth Rate Dept Source?
Special Counsels for independent elected officials' departments 2-2105, 4-121 (4,500) (4,590) (4,682) (4,775) 25% of Law Dept's budget 4500 2% Independent Elected Officials - duplication of central admin 2-2105 (91,000) (92,820) (94,676) (96,570) Duplicates their proportion of central admin (Police, Fire, Law, Election) based on FY21 Cost Allocation Plan 91000 2% Language Access Plans 2-114 (3,200) (816) (832) (849) Cost to make plan and implement (current CRIO language budget x 32 depts, with 25% ongoing) 3200 2% Election Commission 3-102 et seq. (5,616) (5,728) (5,843) (5,960) Match BOPC 5616 2% Voter Participation Among City Employees 3-112 (7,351) (7,498) (7,647) (7,800) Reg Payroll + 50% OT 0.71 10354 7,351 2% Elections Department 3-113 et seq. (10,000) (10,200) (10,404) (10,612) Based on their FY22 budget request 10000 2% Changes in City Contracting and Process Requirements 4-122, 9-1001 (60,000) (61,200) (62,424) (63,672) 10% Premium on contract costs in annual operating budget 10% 600,000.00 60000 2% Public Authority Annual Review 4-123 (1,700) (1,734) (1,769) (1,804) $100k per authority per year 100 17 1700 2% Cultural Neighborhoods 4-124 (1,400) (1,428) (1,457) (1,486) Cost of maintenance, 10% of current GSD grounds maintenance budget 1400 2% BZA notification requirements, per diem, staffing 4-202 (1,000) (1,020) (1,040) (1,061) Expansion on par with other commissions above 98.25 5 1000 2% Public Broadband & Technology Commission 4-402 (1,000) (1,020) (1,040) (1,061) FTE + Contractual/Operating Costs 98.25 5 1000 2% Public funded broadband services (free Wi-Fi) 4-403 (12,833) (14,280) (14,566) (14,857) Per DoIT estimate 14,000 2% X Mayor Community Meetings quadrupled, additional requirements 5-110 (2,100) (2,142) (2,185) (2,229) Assumes $100k of staff prep, open meetings, and security time for each of the 21 new meetings 100 21 2100 2% Contractor Employee Reporting 6-306 (771) (786) (802) (818) OCP Staffing + soft costs 5 771 2% BSEED Citizen Complaints, 90 day turnaround 6-509 (7,000) (7,140) (7,283) (7,428) 25% increase in BSEED budget 7000 2% Auditor General 7.5-107 (1,021) (1,041) (1,062) (1,083) Add 50% to current budget 1021 2% Enforcement of Charter 7.5-209 (734) (748) (763) (779) Law Dept - 5 more attorneys, 2 paralegals 104.8 7 733.6 2% Inspector General 7.5-305 (601) (613) (625) (638) Add 50% to current budget 601 2% Ombudsman 10 FTE requirement 7.5-405 (183) (187) (191) (195) 10 FTE vs current 8 FTE 91.7 2 183.4 2% Health In All Policies Taskforce 7-105 (1,000) (1,020) (1,040) (1,061) Same as other commissions / task forces 98.25 5 1000 2% Advisory Transportation Commission 7-1102 (1,000) (1,020) (1,040) (1,061) FTE + Contractual/Operating Costs 98.25 5 1000 2% Bus Fares 7-1105 (20,000) (20,400) (20,808) (21,224) Elimination of fare revenue 20000 2% Transportation Standards 7-1106 (13,800) (14,076) (14,358) (14,645) Cost increase to DDOT budget to meet new standards 10% 138000 13800 2% DWSD affordability rate system (NTE 3% of income) 7-1203 (23,460) (23,929) (24,408) (24,896) DWSD estimate 300 78200 23460 2% X Implementation of water affordability system 7-1205 (18,000) (3,600) (3,672) (3,745) Based on Philadelphia $18m. Assumes 20% ongoing cost 18000 2% X Disability Affairs Department 7-1501 (1,000) (1,020) (1,040) (1,061) FTE + Contractual/Operating Costs 98.25 5 1000 2% Disability Justice Commission 7-1506 (1,000) (1,020) (1,040) (1,061) FTE + Contractual/Operating Costs 98.25 5 1000 2% Office of Environmental Justice and Sustainability 7-1601 (1,000) (1,020) (1,040) (1,061) FTE + Contractual/Operating Costs 98.25 5 1000 2% Environmental Justice Health Fund (0.02% of budget) 7-1605 (200) (204) (208) (212) Did they mean 2%? 0.02% 1000000 200 2% Environmental Protection Commission 7-1606 (1,000) (1,020) (1,040) (1,061) FTE + Contractual/Operating Costs 98.25 5 1000 2% City will be ineligible for workforce development funding with OECE 7-1701 (18,000) (18,360) (18,727) (19,102) WF Dev funds lost 18000 2% X Office of Economic and Consumer Empowerment 7-1701 (1,000) (1,020) (1,040) (1,061) FTE + Contractual/Operating Costs 98.25 5 1000 2% Health Dept new Duties / Health Impact Statements / Studies 7-204 et seq. (2,000) (2,040) (2,081) (2,122) Matched CRIO new duties 2000 2% Health - Therapist, Psychologist, and Psychiatrist required 7-209 (1,572) (1,603) (1,636) (1,668) Assume 10 FTE 157.2 10 1,572 2% Sidewalk Maintenance 7-402 (48,000) (48,960) (49,939) (50,938) Cost per flag x # of flags 0.3 4,000,000 48,000 2% X Board of Fire Commissioners 7-502 et seq. (5,000) (5,100) (5,202) (5,306) Match BOPC 5000 2% Independent Fire Dept will need its own 9-1-1/Dispatch 7-502 et seq. (15,000) (15,300) (15,606) (15,918) Match Police Comms Bureau Cost 15000 2% Taskforce on Reparations and African American Justice 7-702 (1,000) (1,020) (1,040) (1,061) FTE + Contractual/Operating Costs 98.25 5 1000 2% Office of Veteran Affairs 7-703 (1,000) (1,020) (1,040) (1,061) FTE + Contractual/Operating Costs 98.25 5 1000 2% Office of Immigrant Affairs 7-704 (1,000) (1,020) (1,040) (1,061) FTE + Contractual/Operating Costs 98.25 5 1000 2% Immigrant and Refugee Affairs Commission 7-705 (1,000) (1,020) (1,040) (1,061) FTE + Contractual/Operating Costs 98.25 5 1000 2% CRIO New Duties 7-708 (2,000) (2,040) (2,081) (2,122) Additional staff and contractual services 2000 2% Indigenous Peoples Task Force 7-708.4 (1,000) (1,020) (1,040) (1,061) FTE + Contractual/Operating Costs 98.25 5 1000 2% Board of Police Commissioners 7-802 et seq. (1,872) (1,909) (1,948) (1,987) Add 50% to current budget 1872 2% Permanent Storage of Body, Dash, and other Camera Footage 7-806 (1,575) (1,607) (1,639) (1,671) Storage: $700/yr for 1500 BCs and 750 dash 0.7 2250 1575 2% Police Officer Annual Psychological and Physical Examinations 7-821 (20,000) (20,400) (20,808) (21,224) Avg Cost x # of officers (could be higher with mandate) 7.5 2671 20000 2% X Police training 7-823 (3,500) (3,570) (3,641) (3,714) 50% increase in training services budget 3500 2% Duplicate Planning Function within City Planning Commission 8-101 (4,300) (4,386) (4,474) (4,563) CPC Current Budget vs. PDD Budget 4300 2% Equitable funding of social services vs. police 8-204 (291,000) (296,820) (302,756) (308,812) Difference between GF Police vs. GF HRD+DHD 291000 2% Proportional Funding for Oversight Agencies 8-214 (413) (426) (438) (451) Growth at least equal to total budget 13772 3% Election Funding (0.5%-5% of income tax, 95% of PY floor) 8-215 (5,000) (5,150) (5,305) (5,464) Current budget less 5% of Income Tax % 5% 300,000 5000 3% Divert Budget Reserve Interest to Capital 8-217 (535) (546) (557) (568) Investment return on $107m 535 2% Community Advisory Councils 9-102 (7,000) (7,140) (7,283) (7,428) 7 members in 7 districts - same assumptions as wage boards 98.25 5 7000 2% Community Benefits Changes - Operating Impact 9-1301 (1,000) (1,020) (1,040) (1,061) PDD budget impact 1000 2% Funding for the Arts 9-202 (1,500) (1,530) (1,561) (1,592) Benchmark: % of city-funded CIP 1.0% 150000 1500 2% Charles H. Wright Museum of African American History 9-203 (1,600) (1,632) (1,665) (1,698) Cost above baseline 1600 2% Youth Employment 9-404 (63,000) (64,260) (65,545) (66,856) assumes all 14-18 year olds have City-funded part-time summer employment (based on GDYT/unit cost) 1.5 42000 63,000 2% Calculation of Area Median Income incompatible with CDBG requirements 9-902 (33,000) (33,660) (34,333) (35,020) CDBG lost 33000 2% X Wage and Standard Boards 13-102 (11,000) (11,220) (11,444) (11,673) FTE + Contractual/Operating Costs x 11 industries 98.25 5 11000 2% Foregone Revenue - Impact of Economic Development Provisions Various (2,920) (5,840) (8,760) (11,680) Based on DEGC analysis in their memo, converted from 10 year amount to annual amount X Total Fiscal Impact $ (840,257) $ (843,960) $ (863,698) $ (883,774)
OCFO - Confidential Draft 2/18/2021
GreavesB
Highlight
GreavesB
Highlight

Central Staff Costs ($M) per City's FY21 CAP
Net Direct Cost Direct Billed Disallowed Total Cost Base Finance 26.4 3 20.4 49.8 HR 9.7 1.1 0 10.8 CRIO 0.5 0 6.4 6.9 DOIT 22.1 0 0.1 22.2 Law 14.9 1.6 0.4 16.9 Mayor 1.9 0 9.8 11.7 GSD 83 13.6 13.1 109.7 OAG 2.8 0 0 2.8 Ombud 0.9 0 0 0.9 OIG 0.9 0 0 0.9 Clerk? 0 0 0 0 Total 163.1 19.3 50.2 232.6
Share of net cost Fire 31.00 per CAP Police 54.00 per CAP Law 1.85 1.3% Employees % of total as of Dec 2020, removed Law Elections 2.60 per CAP Total 89.45 based on FY19 actual
91.24 Roll forward to FY20
OCFO - Confidential Draft 2/18/2021

Office of the Chief Financial Officer
FRC Contracts/Grants Subcommittee
City of Detroit
May 11, 2021

Agenda ● Review of Procurement, Contracts, and Grants policies and procedures
● Update on Proposal N demolition program implementation
● Draft Revised Charter fiscal impact on procurement process
● Updates on emergency purchases and Guidehouse
Office of the Chief Financial Officer 2

Review of Procurement, Contracts, and Grants policies and procedures
Office of the Chief Financial Officer 3

Contract Posting Requirements Section 117.4t(1)(g) of Public Act 279 of 1909 (The Home Rule City Act) states, in part, that:
• The city shall post on its website copies of both of the following:
(i) Within 30 days of the contract award, each contract entered into by the city during each fiscal year.
(ii) All contracts in which the city is a party that are in effect during each fiscal year.
Section 141.1638(2)(h)(i) of Public Act 181 (FRC Act) states, in part, that: • All contracts awarded by the qualified city are posted on the qualified city's public website within 30 days
of the contract award, including the identity of the parties to the contract, the dollar amount of the contract, and a brief description of the goods or services provided by the contract.
In addition to the requirements above, the City agreed to the following maintain the required contract information (i.e. Supplier Name, Contract Dollar Amount, and Brief Description) on the City’s website for an additional period of one (1) year, at the end of the contract term.
More information can be found here: Detroitmi.gov/purchasing and Open Data Portal
Office of the Chief Financial Officer 4

17 Article V
Governing Rules and Regulations
GUIDANCE SOURCE AND CITATION
•Federal Procurement Guidelines •Federal Acquisition Regulation (FAR)
•State and Procurement Guidelines •Freedom of Information Act (FOIA)
•City Ordinances •Michigan Compiled Law (MCL)
•Funding Source Specific Guidelines (i.e. grant •2019 City Ordinance – Chapter funding sources)
•OCFO Directive
•OCP Standard Operating Procedures
Office of the Chief Financial Officer 5

Procurement Controls The City added controls on procurement in collaboration with Financial Review Commission Contracts Subcommittee. ● Competitive bidding:
○ Requisition required with approved funding
○ Transparency of bids (through Oracle Cloud, Outreach, Websites)
● Cross-functional consensus evaluation and selection process
● Contract sign-off by: requesting Department, Supplier, Law Department, and OCP
● Contracts approved by:
○ City Council and Chief Procurement Officer, for contracts greater than $25,000
○ Chief Procurement Officer, for contracts less than $25,000
● All contracts posted on the City’s OCP website, per statutory requirement
● OCP Audit & Compliance division performs audits of agreements for policy, procedure and
compliance requirements
Office of the Chief Financial Officer 6
-
Procurement Controls • Sole sources • Emergencies • Renewal & extensions
Chief Procurement Officer approval of exceptions
include:
• Separation of duties • Approval amount • Workflow hierarchy
E Procurement system controls include:
• Contract expiration • Agreements without a purchase order • Requisitions
Report monitoring controls include:
• Cost savings/avoidance • Procurement cycle time • Certified business contract award (DHB, DBB,
DSB, DRB)
Metrics in place:
Office of the Chief Financial Officer 7

Update on Proposal N demolition program implementation
Office of the Chief Financial Officer 8

Proposal N – Executive Order 2020-5 The economic revitalization of Detroit depends upon the employment of Detroit residents and the availability of a skilled workforce.
Summary of Executive Order 2020-5:
● Utilization of Detroit Residents on Publicly Funded Projects. For demolition, applies to any
contract for the demolition or rehabilitation of residential buildings under the Proposition N
Neighborhood Improvement Plan for a contract in excess of $50,000.
● Requires 51% of the workforce to be Detroit residents
● a) Must meet the Workforce Target or b) make a contribution to the City’s workforce training fund
Office of the Chief Financial Officer 9

Proposal N - Implementation Update ● In January 2021, the first $30 million in demolition contracts in the Proposal N program were awarded
to 7 companies. The contracts were approved by City Council in March.
○ All 7 companies are small companies located in Detroit and each has hired a Detroit workforce of more than 50% to do work on these contracts.
○ The contracts are for the planned demolition of 1,380 properties, which were selected based on proximity to an occupied home.
5th● On May , the City announced the first round of contracts awarded to secure houses for rehabilitation under Proposal N.
○ 5 of the 6 winning bidders selected are Detroit-based and black-owned, and the 6th winning bidder is a joint venture between another black-owned Detroit company and a suburban-based business.
○ The contracts are for the planned securing of 276 properties for future rehab, and the total award is for nearly $700,000.
○ The contracts will be submitted to City Council for approval
Office of the Chief Financial Officer 10

Proposal N – Contracts Awarded First round of contracts awarded to secure houses for rehab under
Proposal N: 6 of 7 winning bidders are Detroit companies.
• 6 of 7 companies selected through purchasing process are Detroit-based
• Work will begin process of securing first 276 properties for future rehab
• Work can begin immediately following City Council approval of contracts
Company # of Properties
Gayanga Co. 96
J. Keith Construction 72
GTJ Consulting/ MWV Environmental 60
P&P Group 24
Detroit Grounds Crew 12
Motor City Preservation 12
District # of Properties
District 1 16
District 2 8
District 3 84
District 4 32
District 5 44
District 6 52
District 7 40
Office of the Chief Financial Officer 11

Draft Revised Charter fiscal impact on procurement process
Office of the Chief Financial Officer 12

Draft Revised Charter Impact on Procurement ● There are two main components of proposed charter that impact procurement
Changes in City Contracting and Process Requirements
Drivers: Compliance with Executive Order 2016-1, documentation of training and residency of workforce, licensing requirements, pre-qualification, and insurance
Estimate: Estimated to add at least 10% to all contractual costs, for total of $247.3 million over 4 years
Sections: 4-122, 9-1001
Contractor Employee Reporting
Drivers: Contractors must provide name, address, wage, union name for each employee (gathering personal information for people who do not work for the City)
Estimate: Increase Office of Contracting and Procurement (OCP) administration costs by $3.2 million over 4 years
Section: 6-306
Office of the Chief Financial Officer 13

Update on COVID-19 Related Procurements and Guidehouse
Office of the Chief Financial Officer 14

COVID-19 Response – Guidehouse
● Guidehouse began on 4/27/2020 to assist the City in
maximizing federal funding under the CARES Act, FEMA
disaster recovery program, state and regional programs, and
future stimulus legislation.
● In April 2021, the City amended the Guidehouse contract to
include the vaccine funding in the scope of work.
Office of the Chief Financial Officer 15

COVID-19 Response – Guidehouse Guidehouse’s Scope Includes:
• Develop plan for identifying, documenting and assigning COVID-19
costs for reimbursement.
• Project manage timelines, grant opportunities, requirements all
programs identified
• Provide templates for documenting cost, reporting and data
collection
• Assist in preparing for grant audits
Office of the Chief Financial Officer 16

COVID-19 Response – Guidehouse Guidehouse’s Role Regarding Vaccines:
• Develop the scope, budget and objectives
• Capture expenses and track all vaccine-related costs
• Assist in accounting for COVID-19 and vaccine planning expenditures and distribution
cost
• Prioritize vaccine funding streams (E.g., FEMA, State)
• Support application reporting and reimbursement requirements
• Since audit support
Office of the Chief Financial Officer 17

FEMA
■ Byrne OT
■CRF Sub
■Vacc i nes
■ Test ing
Coronavirus Relief Fund (t-RF) $15ll"M Fund ing for State, Local & Tribal government City of Detroit received : • CRF Prime $11 6,915,243 • CRF Sub $37,378,779
Byrne OT $3.6M
FEMA $10.5M (in progress) FEMA provides fund ing support for COVID-19 through its pub lic assistance - reimbursement program: • FEMA NCS $1,680,830 • FEMA FY20 -$2,268,041
- Contracts and Labor- $546,290 - PPE- $1,721 ,750.97
• FEMA FY21 Q1-Q3 & NCS ~$2,500,000
COVID-19 Testing $30.7M Testing grants provides fund ing support for the City's COVID-19 testing. To date the C ity of Detroi has received : • State Testing CRF $15,763,983 • ELC State Grant $14,254,423
COVID-19 Vaccines $23M Vaccine grant provides fund ing support for the City's vaccine d istribution. To date the C ity of Detroit has received: • FEMA Expedited PW $19 M advance • State Vaccine Grant $3.4 M • Health Department Grant $663,708
COVID-19 Funding Overview
Office of the Chief Financial Officer 18

Total Amount Approved
View By Activities
Top Activities
Testing Su pport and Services.
Housing /Homelessness / Non-Congregate Shelters Services
Additional Cleanlng / Olsinrection Support and Services
Se<ure and Distribute PPE / Supplies tor City Employees/ work
Elections Support
Management/ Adminisllalive Support
Transportation Support and Services
Food Distribution Services and Support
Remote W ork Planning and Support
Return to Work Planning and Support
$48,808,245.65 Total Billed by Vendor
View By Vendors
Top Vendors
$27,354,286.65 Arrow Sllat<>gies. LLC
$23,617.763.90 UNITEDCOM MUNllY HOUSING COALI TION
S9.378.116.92 Premier su,rr Services
S9.135.102.98 Abbott Rapid D• North America. LLC
S3.543.600.52 ROCK CONNECTIONS LLC
$3.395.024.81 DETROIT EM PLOYMENT SOLUTIONS CORP
S2.674 ,1 57.43 Bio-R@ference Laboratories, Inc.
$2,559 ,179.45 SEHi COMPUTER PRODUCTS INC
$2.360.916.07 PARK PHARMACY INC.
Sl.889 ,949.00 DETROIT RESCUE M ISSION M IN ISTRIES
a1
S9 ,710.456.75
$5.651,794.11
S5.319.642 .42
S4.975 .617.40
54.71 4,000.00
54.055.766.57
53.658 ,200.00
$3,311 ,333.64
S3.0n,3s2.00
$2.745.593.75
COVID-19 Related Procurements To date, approximately $107M has been approved to procure goods to address the COVID-19 pandemic. Includes all COVID-19, Vaccine and Testing related costs.
Office of the Chief Financial Officer 19

Discussion
Office of the Chief Financial Officer 20

STATE OF MICHIGAN
GRETCHEN WHITMER DEPARTMENT OF TREASURY RACHAEL EUBANKS GOVERNOR LANSING STATE TREASURER
DETROIT FINANCIAL REVIEW COMMISSION
RESOLUTION 2021-01
CERTIFYING THE CITY OF DETROIT’S (I) ADOPTION AND ADHERENCE TO DEFICIT FREE BUDGETS FOR THREE CONSECUTIVE YEARS AND (II)
COMPLIANCE WITH THE MICHIGAN FINANCIAL REVIEW COMMISSION ACT
WHEREAS, Public Act 181 of 2014, the Michigan Financial Review Commission Act (the
“Act”), allows for the creation of the Detroit Financial Review Commission (the “Commission”)
within the Michigan Department of Treasury; and
WHEREAS, the Commission granted a waiver to the City pursuant to Section 8 of the Act
on June 24, 2019 in Resolution 2018-13 and is currently in a period of decreased oversight; and
WHEREAS, both the Act and the conditions of waiver approved by the Commission in
Resolution 2018-13 contemplate continued monitoring of the City’s financial status, even though
the Commission is no longer providing day to day oversight of the City’s finances; and
WHEREAS, one such condition is found in Section 8(2)(a) of the Act which requires the
Commission to certify annually that the City has adopted and adhered to deficit-free budgets for
three consecutive years that comply with generally accepted accounting principles and are in
accordance with the uniform budgeting and accounting act, MCL 141.421.
WHEREAS, Section 8(2)(g) of the Act further requires the Commission certify annually
that the City is in substantial compliance with the provisions of the Act; and
1

WHEREAS, at the Commission meeting June 28, 2021, documentation of the City’s (i)
adoption and adherence to deficit free budgets for three consecutive years that comply with
generally accepted accounting principles and are in accordance with the uniform budgeting and
accounting act, MCL 141.421, and (ii) compliance with the Act since the adoption of Resolution
2018-13, was presented for consideration.
NOW THEREFORE, be it resolved by the Detroit Financial Review Commission as
follows:
1. That the Commission hereby certifies that the City has adopted and adhered to
deficit free budgets for three consecutive years that comply with generally accepted accounting
principles and are in accordance with the uniform budgeting and accounting act, MCL 141.421.
2. That the Commission hereby certifies that the City is in substantial compliance with
the provisions of the Act since the adoption of Resolution 2018-3.
3. That the minutes of the Detroit Financial Review Commission meeting at which
this Resolution is adopted take notice of the adoption of this Resolution.
4. This Resolution shall have immediate effect.
2

Coleman A. Young Municipal Center Phone: 313 -628-2535 2 Woodward Avenue, Suite 1100 Fax: 313 -224-2135 Detroit, Michigan 48226 www.detroitmi.gov
CFO MEMORANDUM NO. 2021-101-005
TO: Financial Review Commission FROM: Jay B. Rising, Acting Chief Financial Officer, City of Detroit SUBJECT: Certification the City has met the Waiver Conditions in PA 181, Section 8(2) DATE: May 20, 2021
1. AUTHORITY 1.1. State of Michigan Public Act 181, Section 8(1) states the FRC shall, by resolution, waive
the oversight requirements designated in Sections 6 and 7 of PA 181 if certain conditions are met as provided in Section 8(2) of PA 181.
2. OBJECTIVE
2.1. To verify that the City has met all the waiver conditions in Section 8(2) of PA 181.
3. PURPOSE
3.1. To certify that, to the best of my knowledge, the statements in Section 5 of this Memorandum are true and accurate, and to transmit the certification to the FRC.
4. SCOPE
4.1. This Memorandum is intended solely to verify that the City has met the waiver conditions of Section 8(2) of PA 181.
5. STATEMENT
5.1. In accordance with Section 8(2) of PA 181, the City has met the following conditions:
5.1.1. Adopted and adhered to deficit-free budgets for 3 consecutive years that comply with generally accepted accounting principles and are in accordance with the uniform budgeting and accounting act, 1968 PA 2, MCL 141.421 to 141.440a.
5.1.2. Both of the following conditions related to municipal securities:
5.1.2.1. All municipal securities or debt obligations sold by or for the benefit of the City in the general public market during the immediately preceding fiscal year and current fiscal year satisfied the capital and other financial requirements of the City during that period.
5.1.2.2. There is a substantial likelihood that municipal securities or debt obligations can be sold by the City in the general public market during the remainder of the current fiscal year and the immediately succeeding fiscal year in amounts sufficient to substantially satisfy all of the capital and other financial requirements of the City during those periods in accordance with the City’s financial plan, as applicable.
https://detroitmi.gov/departments/office-chief-financial-officer
_________________________________
CFO Memorandum 2021-101-005: Waiver Certification Page 2 of 2
5.1.3. Financial plan projects a balanced budget for the current and succeeding 3 fiscal years using generally accepted accounting principles and in accordance with the uniform budgeting and accounting act, 1968 PA 2, MCL 141.421 to 141.440a, and section 4t of the home rule city act, 1909 PA 279, MCL 117.4t.
5.1.4. Sufficient ability to borrow in the municipal securities market.
5.1.5. Did not violate the Plan of Adjustment (the “POA”) in the immediately preceding fiscal year, as applicable, and is not in violation in the current fiscal year.
5.1.6. Compliance with the uniform budgeting and accounting act, 1968 PA 2, MCL 141.421 to 141.440a.
5.1.7. Substantial compliance with PA 181.
5.1.8. Currently only offers the retirement plans as provided in the POA, which do not include contributions to individual employee retirement accounts.
5.1.9. Implemented a program in which all contracts awarded by the City are posted on the City’s public website within 30 days of the contract award, including the identity of the parties to the contract, the dollar amount of the contract, and a brief description of the goods or services provided by the contract.
CERTIFIED
Jay B. Rising Acting Chief Financial Officer, City of Detroit
https://detroitmi.gov/departments/office-chief-financial-officer

STATE OF MICHIGAN
DEPARTMENT OF TREASURY GRETCHEN WHITMER RACHAEL EUBANKS GOVERNOR LANSING STATE TREASURER
DETROIT FINANCIAL REVIEW COMMISSION
RESOLUTION 2021-02
EXTENDING WAIVER GRANTED PURSUANT TO SECTION 8 OF THE MICHIGAN FINANCIAL REVIEW COMMISSION ACT
WHEREAS, Public Act 181 of 2014, as amended, the Michigan Financial Review
Commission Act (the “Act”), created the Detroit Financial Review Commission (the
“Commission”) to provide specified supervision of certain activities and actions of the City of
Detroit (the “City”) beginning on December 10, 2014; and
WHEREAS, the Act charges the Commission with, among other things, (a) ensuring that
the City is meeting certain statutory requirements, (b) reviewing and approving the City’s budgets
and certain contracts, and (c) establishing processes to ensure effective prudent fiscal management;
and
WHEREAS, the Commission granted a waiver to the City pursuant to Section 8 of the Act
on June 29, 2020 in Resolution 2020-3 and is currently in a period of decreased oversight; and
WHEREAS, both the Act and the conditions of waiver approved by the Commission in
Resolution 2018-13 contemplate continued monitoring of the City’s financial status, even though
the Commission is no longer providing day to day oversight of the City’s finances; and
WHEREAS, Resolution 2018-13 also requires the City to provide the Commission certain
information and reports during the period of decreased oversight; and
1

WHEREAS, the City has timely provided the Commission with the information and reports
required by Resolution 2018-3; and
WHEREAS, at the Commission meeting on June 28, 2021, documentation that the City
has satisfied the conditions enumerated in Section 8, attached as Exhibit A to this Resolution, was
presented for consideration; and
WHEREAS, the Mayor and CFO have consulted with the Commission and support this
resolution;
NOW THEREFORE, be it RESOLVED by the Detroit Financial Review Commission
as follows:
1. That the conditions set forth in Section 8(2) have been satisfied and therefore, the
City’s duties and obligations to the Commission under Sections 6 and 7 of the Act are waived
through and including June 30, 2022, subject to the terms and conditions of the Act, including
Section 8.
2. All other provisions and obligations of the City under Resolution 2018-13 remain
in full force and effect.
3. That the minutes of the Detroit Financial Review Commission meeting at which
this Resolution is adopted take notice of the adoption of this Resolution.
4. That this Resolution shall have immediate effect.
2

FRC City Resolution 2021 -02 Exhibit A
DETROIT FINANCIAL REVIEW COMMISSION
Considerations for Extension of Waiver for City of Detroit (“City”) Michigan Financial Review Commission Act (Act 181 of 2014)
For the Period July 1, 2020 through June 30, 2021
Presented on June 28, 2021
Requirement FRC Act Sec. No.
Compliance
Commission certifies the City has adopted and adhered to deficit-free budgets for 3 consecutive years that comply with generally accepted accounting principles and are in accordance with the uniform budgeting and accounting act, MCL 141.421
8(2)(a) See FRC resolution 2021- 1 for the FRC’s certification.
The State Treasurer and the City’s CFO certify that (a) all municipal securities or debt obligations sold by or for the benefit of the City in the general public market during the immediately preceding fiscal year and current fiscal year satisfied the capital and other financial requirements of the City, and (b) there is a substantial likelihood that municipal securities or debt obligations can be sold by the City in the general public market during the remainder of the current fiscal year.
8(2)(b) See Treasurer’s attached verification and City’s attached certification.
The City’s financial plan projects a balanced budget for the current and succeeding 3 fiscal years using general accepted accounting principles and in accordance with the Uniform Budgeting and Accounting Act
8(2)(c) The City has submitted the requisite four-year financial plans with balanced budgets.
The City has demonstrated to the FRC’s satisfaction the City has sufficient ability to borrower in the municipal securities market.
8(2)(d) See City’s attached certification.
The City did not violate the Plan of Adjustment (“POA”) in the immediately preceding fiscal year and is not in violation in the current fiscal year.
8(2)(e) See City’s attached certification.
The State Treasurer certifies that the City is in compliance with the Uniform Budgeting and Accounting Act.
8(2)(f) See Treasurer’s attached verification.
The FRC certifies that the City is in substantial compliance with the Act.
8(2)(g) See FRC Resolution 2021-1
The City has established a system of compensation for employees retirement plans in which the City contributes no
8(2)(h) See City’s attached certification.
4

more than 7% of an individuals’ base pay, excluding payment for overtime services, 1-time lump sum payments and the costs of fringe benefits, to an employee’s retirement account. The City has implemented a program in which all contracts awarded by the City are posted on the City’s public website within 30 days of the contract award including the identity of the parties to the contract, the dollar amount of the contract an d a brief description of the foods or services provided by the contract.
8(2)(i) See City’s attached certification.
4824-2984-8512 v1 [56620-1]
5

State of Michigan
DEPARTMENT OF TREASURY GRETCHEN WHITMER RACHAEL EUBANKS
GOVERNOR LANSING STATE TREASURER
DATE: June 28, 2021
TO: Financial Review Commission
FROM: Joyce Parker, Deputy State Treasurer
SUBJECT: FRC Certifications on the City of Detroit
Public Act 181 of 2014, the Financial Review Commission Act (the “Act”) requires certain
certifications of the State Treasurer as conditions for the Financial Review Commission (FRC) to
waive the requirements described in sections 6 and 7 of the Act.
I certify that to the best of my knowledge the following statements are true and accurate of the
City of Detroit and transmit this certification to the FRC:
1) All municipal securities or debt obligations sold by or for the benefit of the City in
the general public market during the immediately preceding fiscal year and current fiscal year
satisfied the capital and other financial requirements of the City during that period.
2) There is substantial likelihood that municipal securities or debt obligations can be
sold by the City in the general public market during the remainder of the current fiscal year and
the immediately succeeding fiscal year in amounts sufficient to substantially satisfy all of the
capital and other financial requirements of the City during those periods in accordance with the
City’s financial plan, as applicable.
3) The City is in compliance with the uniform budgeting and accounting act, 1968 PA
2, MCL 141.421 to 141.440a.
430 WEST ALLEGAN STREET • LANSING, MICHIGAN 48922 www.michigan.gov/osrfa • 517-373-3200

OFFICE OF THE
Ill CHIEF FINANCIAL OFFICER Coleman A. Young Municipal Center 2 Woodward Avenue. Suite 1100 Detroit. Michigan 48226
Phone 313•628•2535 Fax 313•224•2135 [email protected] www.detroitmi.gov
June 14, 2021
Detroit Financial Review Commission Cadillac Place 3062 West Grand Boulevard Detroit, MI 48202
Re: Financial Report for the Ten Months ended April 30, 2021
Dear Commissioners:
The Office of the Chief Financial Officer (OCFO) respectfully submits its City of Detroit Financial Report for the Ten Months ended April 30, 2021.
This report is provided in accordance with the requirements included in Detroit Financial Review Commission (FRC) Resolution 2020-03, which granted the City its waiver of active FRC oversight through June 30, 2021. The OCFO has separately submitted this report to the Mayor, Detroit City Council and posted it on the City’s website.
Best regards,
Jay B. Rising CFO
Att: City of Detroit Financial Report for the Ten Months ended April 30, 2021
Cc: Patrick Dostine, Executive Director, Detroit Financial Review Commission

Office of the Chief Financial Officer
FY 2021 Financial Report For the 10 Months ended April 30, 2021
Office of the Chief Financial Officer
Submitted on June 14, 2021

Table of Contents Page(s)
Executive Summary 3
Monthly Budget vs. Actual 4
YTD Budget vs. Actual and Projection 5-6
YTD Budget Amendments – General Fund 7
Employee Count Monitoring 8
Workforce Changes 9
Income Tax 10-11
Development and Grants 12-14
Coronavirus Federal Relief 15-17
Cash 18-19
Accounts Payable 20
Office of the Chief Financial Officer 2

Executive Summary Notes on the April 2021 Monthly Financial Report:
● On April 12, City employees who were previously on Workshare, due to workforce changes implemented in May 2020 to generate financial savings due to the pandemic, returned to full-time work status.
● On April 22, a new law (PA 7) was enacted to extend the filing deadline for individual city income tax filers to May 17, 2021, matching the Federal and State income tax extensions.
Subsequent events to the month-end:
● On May 25, the Mayor gave a virtual citywide presentation to discuss the planning process for spending American Recovery Act Funds. The presentation kicked-off a series of community engagement meetings to solicit ideas and resident feedback. The presentation, a survey, and schedule of community meetings is available online.
● The City received its first installment of Coronavirus State and Local Fiscal Recovery Funds which resulted from the Federal American Rescue Plan Act. The City received $413,337,645 on June 7, 2021, which represented 50% of $826,675,290 awarded to Detroit.
Office of the Chief Financial Officer 3

Monthly Budget v. Monthly Actual – General Fund (Unaudited)
MONTHLY ANALYSIS
BUDGET ACTUAL + ADJUSTMENTS + ENCUMBRANCES VARIANCE
(BUDGET VS. ACTUAL)
MAJOR CLASSIFICATIONS
April
2021 ACTUAL ADJUSTMENTS + ENCUMBRANCES TOTAL
A B C D E = C + D ($) F = E-B % G = (F/B) REVENUE:
Municipal Income Tax Property Taxes Wagering Taxes Utility Users' Tax State Revenue Sharing Other Revenues
Sub-Total Use of Prior Year Fund Balance Balance Forward Appropriations Transfers from Other Funds TOTAL
Salary and Wages (Incl. Overtime) Employee Benefits Legacy Pension Payments Retiree Protection Fund Debt Service Other Expenses
TOTAL
$
$
21.9 1.4
17.1 3.6
32.3 17.4
93.7 10.0
2.3 –
$ 14.2 1.2
17.9 3.9
34.7 5.3
$ 77.2 – – –
– – – – – –
– 10.0
2.3 –
$ 14.2 1.2
17.9 3.9
34.7 5.3
$ 77.2 10.0
2.3 –
$ (7.7) (0.2) 0.8 0.3
– (12.1)
$ (16.5) – – –
(35.2%) (14.3%)
4.7% 8.3%
-(69.5%)
(17.6%) 0.0% 0.0%
-$
$
$
106.0
(33.9) (9.5)
– –
(11.0) (22.1)
(76.5)
$ 77.2
$ (33.4) (11.5)
– –
(11.0) (13.5)
$ (69.4)
$ 12.3
– – – – –
(4.9)
$ (4.9)
$ 89.5
$ (33.4) (11.5)
– –
(11.0) (18.4)
$ (74.3)
$ (16.5)
0.5 (2.0)
– – –
3.7
$ 2.2
(15.6%)
1.5% (21.1%)
---
16.7%
2.9%
Office of the Chief Financial Officer 4

Office of the Chief Financial Officer
YTD Budget vs. YTD Actual – General Fund (Unaudited)
YTD ANALYSIS
BUDGET ACTUAL + ADJUSTMENTS + ENCUMBRANCES VARIANCE
(BUDGET VS. ACTUAL)
MAJOR CLASSIFICATIONS YEAR
TO DATE ACTUAL ADJUSTMENTS + ENCUMBRANCES TOTAL
A B C D E = C + D ($) F = E-B % G = (F/B) REVENUE:
Municipal Income Tax Property Taxes Wagering Taxes Utility Users' Tax State Revenue Sharing Other Revenues
Sub-Total
$ 202.2 99.1
101.1 23.1
127.1 170.2
$ 208.7 94.7 96.5 24.6
141.7 120.8
$ 687.0
– – – – – –
-
$ 208.7 94.7 96.5 24.6
141.7 120.8
$ 687.0
$ 6.5 (4.4) (4.6) 1.5
14.6 (49.4)
$ (35.8)
3.2% (4.4%) (4.5%) 6.5%
11.5% (29.0%)
(5.0%) $ 722.8 Use of Prior Year Fund Balance 99.5 – 99.5 99.5 – 0.0% Balance Forward Appropriations 22.4 – 22.4 22.4 – 0.0% Transfers from Other Funds TOTAL
Salary and Wages (Incl. Overtime) Employee Benefits Legacy Pension Payments Retiree Protection Fund Debt Service Other Expenses
TOTAL
– – – – – -$
$
$
844.7
(360.1) (105.8)
– (50.0) (75.3)
(324.9)
(916.1)
$ 687.0
$ (330.2) (96.9)
– (50.0) (75.3)
(188.6)
$ (741.0)
$ 121.9
– – – – –
(42.6)
$ (42.6)
$ 808.9
$ (330.2) (96.9)
– (50.0) (75.3)
(231.2)
$ (783.6)
$ (35.8)
$ 29.9 8.9
– – –
93.7
$ 132.5
(4.2%)
8.3% 8.4%
-0.0% 0.0%
28.8%
14.5% * The State ordered the Detroit casinos to close from November 18 to December 20 to protect public health. They re-opened on December 23 on a limited capacity basis. Note: YTD Actuals for Other Revenues is lagging behind YTD Budget due to a more gradual resumption of activities (e.g., parking enforcement).
5

Annualized Projection vs. Budget – General Fund
BUDGET PROJECTION VARIANCE
(BUDGET VS. PROJECTION)
ANNUAL ANNUAL ANNUAL
AMENDED ESTIMATED ESTIMATED
B C ($) D = C-B % E = (D/B)
REVENUE:
Municipal Income Tax 239.4 $ 223.0 $ (16.4) $ (6.9%) Property Taxes 111.9 113.7 1.8 1.6% Wagering Taxes 135.3 103.0 (32.3) (23.9%) Utility Users' Tax 28.5 28.3 (0.2) (0.7%) State Revenue Sharing 190.6 204.1 13.5 7.1% Other Revenues 202.5 189.5 (13.0) (6.4%)
Sub-Total 908.2 861.6 (46.6) (5.1%) Use of Prior Year Fund Balance 119.4 226.5 107.1 89.7% Balance Forward Appropriations 26.8 26.8 - 0.0%
Transfers from Other Funds – – - -
TOTAL (F) 1,054.4 $ 1,114.9 $ 60.5 $ 5.7%
EXPENDITURES:
Salary and Wages (Incl. Overtime) (446.0) $ (391.0) $ 55.0 $ 12.3% Employee Benefits (131.7) (124.3) 7.4 5.6% Legacy Pension Payments (18.7) (18.7) – 0.0% Retiree Protection Fund (50.0) (50.0) – 0.0% Debt Service (85.0) (85.0) – 0.0% Other Expenses (323.0) (275.4) 47.6 14.7%
TOTAL (G) (1,054.4) $ (944.4) $ 110.0 $ 10.4% VARIANCE (H=F+G) 170.5 $ 170.5 $
A
ANNUAL ANALYSIS
SUMMARY CLASSIFICATIONS
Note: Projected annual revenues are based on the February 2021 Revenue Estimating Conference. Projections also include additional beginning fund balance from FY20 audited financial report, deferred COVID grant reimbursements in Other Revenue, grant reimbursements that lower General Fund supported expenses, and additional projected savings.
Office of the Chief Financial Officer 6

YTD Budget Amendments – General Fund FY 2020 2021 GENERAL FUND BUDGET AMENDMENTS (Through April 2021)
Department Reason for Amendment Resources Expenditures 1,023,976,879 $ 1,023,976,879 $FY 2020 2021 Adopted Budget
Use of Prior Year Fund Balance CRIO Homegrown Detroit 2,000,000 2,000,000
Total 2,000,000 2,000,000
Balance Forward Appropriations Non-Departmental Blight Remediation 733,907 733,907 General Services Wayne County Park Millage - FY18 41,850 41,850
City Council Legislative Policy Division 324,572 324,572 Housing & Revitalization Affordable Housing 2,000,000 2,000,000
Police Public Act 302 - Training Fund 748,179 748,179 Public Lighting PLD Decommissioning 23,000,000 23,000,000
Total 26,848,508 26,848,508
Budget Amendments - Additional Resources CRIO Donation 1,250 1,250
General Services Pistons Basketball Court Improvement - Yr. 3 563,529 563,529 General Services Wayne County Park Millage - FY19 294,496 294,496 General Services Wayne County Park Millage - FY20 262,756 262,756 General Services Pistons Basketball Court Improvement - Yr. 4 416,667 416,667
Total 1,538,698 1,538,698
Transfers N/A N/A N/A N/A
Total 0 0
1,054,364,085 $ 1,054,364,085 $FY 2020 2021 Amended Budget
-
-
-
Office of the Chief Financial Officer 7

-
Employee Count Monitoring MONTH-OVER-MONTH ACTUAL(1) BUDGET VS. ACTUAL
Variance Change Adjusted (Under)/Over
Actual Actual March 2021 Budget Budget vs. March 2021 April 2021 vs. April 2021 FY 2021(2) April 2021
Public Safety Police 3,209 3,174 (35) 3,418 (244) (7%) Fire 1,166 1,160 (6) 1,271 (111) (9%)
Total Public Safety 4,375 4,334 (41) 4,689 (355) (8%)
Non-Public Safety Office of the Chief Financial Officer 385 372 (13) 466 (94) Public Works - Full Time 349 371 22 460 (89) Health 125 131 6 234 (103) Human Resources 97 93 (4) 115 (22) Housing and Revitalization 133 135 2 167 (32) Innovation and Technology 119 121 2 144 (23) Law 109 109 0 129 (20) Mayor's Office 83 83 0 83 0 Municipal Parking 86 81 (5) 101 (20) Planning and Development 36 35 (1) 42 (7) General Services - Full Time 485 486 1 600 (114) Legislative(3) 213 210 (3) 258 (48) 36th District Court 312 312 0 325 (13) Other(4) 213 192 (21) 187 5
Total Non-Public Safety 2,745 2,731 (14) 3,311 (580) (18%)
Total General City-Full Time 7,120 7,065 (55) 8,000 (935) (12%)
Seasonal / Part Time(5) 21 93 72 818 (725) (89%)
Enterprise Airport 4 4 0 4 0 BSEED 254 255 1 305 (50) Transportation Water and Sewerage Library
668 662 490 497 236 235
(6) 7
(1)
976 (314) 650 (153) 327 (92)
Notes: (1) (2) Actuals are the headcount of all active employees at month-end. The Budgeted positions have
been adjusted to convert full-time equivalents to headcount and to reflect position amendments approved mid-year.
Total Enterprise 1,652 1,653 1 2,262 (609) (27%) (3) Includes Auditor General, Inspector General, Zoning, City Council, Ombudsperson, City Clerk, and
Elections. (4) Includes Civil Rights Inclusion & Opportunity, Appeals and Hearings, Public Lighting, Demolition, and
Total City 8,793 8,811 18 11,080 (2,269) (20%) Non-Departmental (5) Includes Public Works, General Services, Recreation, and Elections.
Office of the Chief Financial Officer 8

–
Workforce Changes Report Payroll Savings by Department July 2020 through April 2021
All Funds
Category Department
Projected Regular Cost
(w/o reductions as of April 2020)
Projected Savings (as of
April 2020) Actual Cost
Actual Savings
Change in Savings
(Projected vs. Actual)
Executive Departments
19 – DPW 19,311,958 7,719,083 19,360,533 (48,575) (7,767,659) 23 – OCFO 32,953,663 5,050,114 27,271,783 5,681,880 631,766 24 – Fire 34,646,317 238,746 34,407,571 238,746 -25 – Health 8,920,356 308,986 7,906,682 1,013,674 704,688 28 – HR 7,564,742 1,056,578 7,151,795 412,946 (643,631) 29 – CRIO 1,128,931 334,062 1,072,112 56,820 (277,242) 31 – DoIT 11,403,299 2,233,105 9,582,426 1,820,874 (412,232) 32 – Law 10,517,452 2,055,298 8,656,664 1,860,787 (194,511) 33 – Mayor 7,912,063 942,157 6,736,179 1,175,883 233,726 34 – Parking 4,087,373 3,070,078 2,064,404 2,022,968 (1,047,110) 36 – HRD 9,718,884 518,108 9,425,111 293,773 (224,335) 37 – Police 186,026,193 4,573,022 181,453,171 4,573,022 -38 – Lighting 134,803 121,322 35,064 99,739 (21,584) 43 – PDD 3,698,383 636,140 3,000,984 697,399 61,258 45 – DAH 816,326 141,350 637,731 178,595 37,245 47 – GSD 29,484,172 8,376,689 24,164,869 5,319,303 (3,057,386)
Non-Departmental 35 – Non-Dept 9,358,843 1,060,714 7,446,881 1,911,962 851,248
Enterprise Agencies
10 – Airport 364,885 - 379,777 (14,892) (14,892) 13 – BSEED 16,716,474 2,858,271 15,116,040 1,600,433 (1,257,838) 20 – DDoT 39,837,217 2,043,777 39,118,947 718,270 (1,325,507) 48 – Water 34,714,226 11,912,395 31,013,345 3,700,881 (8,211,515) 49 – Sewerage 948,094 178,388 1,296,219 (348,125) (526,514)
Total Executive Departments 368,324,913 37,374,839 342,927,079 25,397,833 (11,977,005) Total Non-Departmental 9,358,843 1,060,714 7,446,881 1,911,962 851,248 Total Enterprise Agencies 92,580,895 16,992,832 86,924,329 5,656,567 (11,336,265) Grand Total 470,264,651 55,428,385 437,298,289 32,966,362 (22,462,023)
General Fund 350,227,964 30,360,657 317,959,028 32,268,936 1,908,278 Non-General Fund 120,036,687 25,067,728 119,339,261 697,427 (24,370,301)
Note: On April 12, City employees who were previously on Workshare, due to workforce changes implemented in May 2020 to generate financial savings due to the pandemic, returned to full-time work status.
Office of the Chief Financial Officer 9

Income Tax - Collections Fiscal Years 2020 - 2021 Income Tax Collections
FY21 YTD April 2021
FY20 YTD April 2020
Withholdings/Estimates Individuals Corporations Partnerships Assessments
$231,019,598 57,745,704 21,908,493
4,068,154 372,706
$246,930,104 20,217,739 15,212,647
4,028,255 1,663,816
Total Collections $315,114,655 $288,052,562
Refunds claimed and disbursed FY21 accrual for estimated remote work refunds
(65,800,306) (40,508,632)
(26,464,227) -
Collections Net of Refunds/Disbursements $ 208,733,717 $ 261,588,335
Note: The total remote work refund liability recorded at April 30th is $70.6M; $44.2 million is accrued for tax year 2020 and $26.4 million for tax year 2021.
Office of the Chief Financial Officer 10

t I- I- t
,-
I t t t t I- I- I- I- I-
Income Tax – Volume of Returns and Withholdings
169,000
175,574
0
50,000
100,000
150,000
200,000
Jul Aug Sep Oct Nov Dec Jan Feb Mar Apr May Jun
Number of Withholding Returns
Cumulative FY 2020 Cumulative FY 2021
5,702
6,656
0
2,000
4,000
6,000
Jul Aug Sep Oct Nov Dec Jan Feb Mar Apr May Jun
Number of Corporate Returns
Cumulative FY 2020 Cumulative FY 2021
286,290
321,171
0
100,000
200,000
300,000
Jul Aug Sep Oct Nov Dec Jan Feb Mar Apr May Jun
Number of Individual Returns*
Cumulative FY 2020 Cumulative FY 2021
130,873
149,063
0
50,000
100,000
150,000
Jul Aug Sep Oct Nov Dec Jan Feb Mar Apr May Jun
Number of Refunds to Individuals*
Cumulative FY 2020 Cumulative FY 2021
*The large variance in the number of returns and refunds at the beginning of the fiscal year is due to the extension of tax year 2019 filing deadline from April 15, 2020 to July 15, 2020. The tax year 2020 filing deadline has been extended to May 17, 2021, which has created a delay in the receipt of tax year 2020 returns and refunds.
Office of the Chief Financial Officer 11

Development and Grants Active Grants and Donations as of April 30, 2021 ($ in millions)
Amount Awarded – City(1) Amount Awarded – Partners(2)
Total Active $2,020.9 $327.6
$804.2 Net Change from last month(3) ($2.8)
New Funds – January 1 to May 28, 2021 ($ in millions)
Amount Awarded
Documented $898.1
Committed(4) $272.6
Total New Funding $1,170.7
COVID-19 Overall Funds Raised(5) $1,045.5 (1) Reflects public and private funds directly to City departments. (2) Reflects public and private funds for City projects via fiduciaries, and to third-party partners and agencies for projects prioritized by the City for which the OCFO-Office of Development and Grants has provided active support. (3) The most significant new award in April was the American Rescue Plan Act (ARPA) Grant to the City of Detroit, in the amount of $826,675,290. (4) Reflects verbal and informal commitments which are secure, but for which formal agreements have not yet been finalized. The most significant new commitment for this month’s report is the Choice Neighborhoods Program, from the Department of
Housing and Urban Development (HUD), in the amount of $30 M. (5) Reflects documented and committed funds raised for COVID-19 response efforts by the City and its partners.
Office of the Chief Financial Officer 12

Development and Grants New Funds (Total) – January 1 to May 28, 2021 – By Priority Category
Priority Category Documented Committed Total
Administration/General Services $ 845,613,191 (1) $ 22,326,942 $ 867,940,133
Community/Culture $ 182,594 $ 120,000 $ 302,594
Economic Development $ 1,500,000 $ 1,500,000
Health $ 17,129,814 $ 1,000,000 $ 18,129,814
Housing $ 28,172,915 $ 215,994,944 (2) $ 244,167,859
Infrastructure
Parks and Recreation $ 1,591,346 $ 300,000 $ 1,891,346
Planning Public Safety $ 340,590 $ 798,786 $ 1,139,376
Technology/Education $ 1,047,500 $ 1,047,500
Transportation $ 20,000 $ 28,553,354 $ 28,573,354
Workforce $ 3,548,800 $ 2,486,400 $ 6,035,200
Grand Total $ 898,099,250 $ 272,627,926 $ 1,170,727,176
(1) American Rescue Plan final allocation was awarded less than what was previously estimated. Original allocation was estimated at $879.59M, actual award is $826.67M, a difference of $52.92M. Once specific project allocations have been finalized, funds will be moved to the appropriate category.
(2) COVID Rental Assistance (CERA) funds were originally reported at $44M. The CERA funds are now documented at $96M through combining the City’s allocation with Highland Park and Hamtramck. Detroit residents have access to the entire allocation. In May 2021, U.S. Treasury released an additional round of Emergency Rental Assistance funding through the American Rescue Plan (ARP). The City of Detroit will receive a direct allocation in the amount of $28M.
Office of the Chief Financial Officer 13

Development and Grants New Funds and City Leverage(1) – January 1 to May 28, 2021– By Priority Category
Priority Category Total Funds City Leverage(1)
Administration/General Services $ 867,940,133 (2)
Community/Culture $ 302,594 $ 26,798
Economic Development(3) $ 1,500,000 $ 59,000,000
Health $ 18,129,814 $ 13,000
Housing(4) $ 244,167,859
Infrastructure
Parks and Recreation $ 1,891,346 $ 200,000
Planning Public Safety $ 1,139,376 $ 25,148
Technology/Education $ 1,047,500
Transportation $ 28,573,354 $ 455,938
Workforce(5) $ 6,035,200 $ 17,040,200(4)
Grand Total $ 1,170,727,176 $ 76,761,084
(1) Leverage includes both match and parallel investment by the City that help make the case to external funders to co-invest. (2) American Rescue Plan final allocation was awarded less than what was previously estimated. Original allocation was estimated at $879.59M, actual award is $826.67M, a difference of $52.92M. Once specific project allocations have
been finalized, funds will be moved to the appropriate category. (3) Included here is $59M for the Strategic Neighborhood Fund, which has leveraged all SNF funding to date which includes funds raised between 2018-2020. (4) There is an additional $50M in HUD funding allocated to the Affordable Housing Leverage Fund that has been critical to securing these commitments. COVID Rental Assistance (CERA) funds were originally reported at $44M. The CERA
funds are now documented at $96M through combining the City’s allocation with Highland Park and Hamtramck. Detroit residents have access to the entire allocation. In May 2021, U.S. Treasury released an additional round of Emergency Rental Assistance funding through the American Rescue Plan (ARP). The City of Detroit will receive a direct allocation in the amount of $28M.
(5) Includes $15,040,200 in leverage for the People Plan and $2M in leverage for GDYT.
Office of the Chief Financial Officer 14

Coronavirus Federal Relief - Transparency Coronavirus Federal Relief(1) - Current Detail ($ in millions)
Federal Source Awarded Amount
Current Estimated Exp. (2)
Projected Exp. Uses
American Rescue Plan Act (ARPA) $826.7 $0 $826.7 To combat the adverse economic, health, budget, quality of life, and community impacts of the COVID-19 pandemic
Previously unbudgeted costs necessary to respond to COVID, incurred between 3/1/2020 and CARES Act Coronavirus Relief Fund (CRF) $116.9 $116.9 $0 12/30/2020
• Emergency response services and supplies, MI-2020-022-00 Section 5307 Urbanized Area $64.3 $33.8 $30.5 • paid administrative leave due to service reductions Formula • Provision of transit services that help residents and employees
Coronavirus Relief Local Government Grants FY 2020 $37.3 $37.3 $0 To offset reductions in State revenues allocated to the City of Detroit as part of the FY 2020 revenue
sharing allocation
Emergency Rental Assistance Program II (ARPA) $28.1 $0 $28.1 To provide rental and utility assistance to renters in Detroit
CDBG-CV $24.9 $7.3 $17.6 Investments in supportive housing, housing counseling, tax-filing assistance, housing search and placement, eviction defense, and rental assistance for landlords and tenants.
ESG-CV $19.6 $16.3 $3.3 Emergency services such as shelter and outreach as well as prevention and rapid re-housing to decrease homelessness, while mitigating impact of COVID
FEMA Supplemental Vaccine- Federal Disaster Declaration $18.7 $7.9 $10.8 To administer the COVID-19 vaccine at various facilities – includes cost of procuring PPE/supplies
to administer vaccine distribution
(1) This report includes details for all documented awards received directly by the City, originating from Federal COVID relief legislation. (2) Expenditures are estimated expenditures through 5/31/21, and subject to adjustment as supporting documentation is reviewed.
Office of the Chief Financial Officer 15

Coronavirus Federal Relief - Transparency Coronavirus Federal Relief - Current Detail ($ in millions)
Federal Source Amount Current Estimated Exp.
Projected Exp. Uses
MDHHS Coronavirus Relief Fund (CRF) for Testing Operations $15.8 $15.8 $0 To administer and expand COVID testing operations and cover costs associated with testing
Epi Lab Capacity (CDC) Enhanced Testing $14.3 $5.8 $8.5 To administer and expand COVID testing operations and cover costs associated with testing
To reimburse qualifying first responder hazard pay premiums provided to first responders First Responder Hazard Pay Premiums Program $3.7 $3.7 $0 who have performed hazardous duty or work related to COVID-19
• Fire and Police- OT costs due to COVID DOJ Byrne Coronavirus Emergency Supplemental $3.3 $1.8 $1.5 • HSEM Early/Emergency Notification system Funding (CESF) • Software/Tech for DPD remote work
COVID-19 Epi Lab Capacity Contact Tracing TCVM $2.8 $2.8 $0 To support contact tracing costs
Unanticipated School Closure Food Program (USCFP) $2.1 $2.1 $0 In light of school closure, provide parents and guardians contact-free pick-up of meals for children
FEMA Non-Congregate Shelter FY20 $1.7 $1.7 $0 To reimburse costs incurred by the City in combatting the COVID Pandemic – 1st submission to FEMA
CRF Contact Tracing $1.5 $0.9 $0.4 To cover the cost of contact tracing and case investigation, to mitigate the spread of COVID-19.
MDE Summer Food Service Program Increase $1.1 $1.1 $0 To support the increase and expansion of SFSP 2020 due to COVID-19
Office of the Chief Financial Officer 16

-
Coronavirus Federal Relief - Transparency Coronavirus Federal Relief - Current Detail ($ in millions)
Federal Source Amount Current Estimated Exp.
Projected Exp. Uses
Coronavirus Task Force on Racial Disparities Rapid Response $0.9 $0.8 $0.1 To cover the costs of staff and supplies in order to mitigate the effects of COVID-19 on
communities of color
Influenza Immunization Outreach Program $0.8 $0.4 $0.4 To provide more flu shots and ensure more people are vaccinated during the COVID pandemic
COVID-19 Contact Tracing TCVM Detroit Local Comp. $0.7 $0 $0.7 To support Contact Tracing under the Local Comprehensive Agreement
COVID-19 Immunizations $0.7 $0 $0.7 To support COVID-19 Immunization Efforts
Ryan White HIV/AIDS Program Part A COVID-19 Response $0.5 $0.5 $0
Expanded training, additional contractual services, equipment - provides critical meal, transportation, and housing needs for individuals living with HIV/AIDS, while mitigating COVID
HOPWA-CV $0.4 $0.4 $0 Assistance with short-term rental, mortgage and utilities payments, and Supportive services for individuals and/or families affected by HIV/AIDS, while mitigating COVID.
COVID-19 Epi Lab Infection Prevention $0.3 $0 $0.3 CDC ELC Support for Infection Prevention Efforts
CRF LHD Testing $0.1 $0.1 $0 Provides additional supplies/resources for COVID-19 testing
COVID-19 Epi Lab Infection Prevention Local Comp. $0.1 $0.1 $0 CDC ELC Support for Infection Prevention Efforts provided under the Local Comprehensive Agreement
Airport Supplemental CARES Act Funds FY 2020 $0.1 $0 $0.1 To cover the cost of airport utility expenses during the COVID-19 Emergency period
Coronavirus Federal Relief Total: $1,187.4
Office of the Chief Financial Officer 17

Office of the Chief Financial Officer
Cash Position ($ in millions)
Prior Year April Unrestricted Restricted April 2021 Total 2020
Bank Balance $ 870.9 $ 687.6 $ 1,558.5 $ 1,272.7
Plus/minus: Reconciling items (2.7) 1.4 (1.3) (0.3)
Reconciled Bank Balance $ 868.2 $ 689.0 $ 1,557.2 $ 1,272.4
General Ledger Cash Balances
General Fund
General Accounts $ 291.5 $ 60.4 $ 351.8 $ 295.1
Risk Management/Self Insurance 11.9 9.6 21.6 75.8
Undistributed Delinquent Taxes - - - 3.2
Quality of Life Fund - 6.8 6.8 17.7
Retiree Protection Trust Fund - 234.7 234.7 180.8
A/P and Payroll Clearing 13.6 - 13.6 29.6
Other Governmental Funds
Capital Projects $ 22.3 $ 348.3 $ 370.6 $ 113.2
Street Fund 101.0 3.1 104.1 127.3
Grants 55.3 0.1 55.5 164.5
Covid 19 124.0 - 124.0 -
Solid Waste Management Fund 39.1 - 39.1 39.0
Debt Service - 25.9 25.9 33.9
Gordie Howe Bridge Fund 2.8 - 2.8 16.7
Other 24.9 - 24.9 19.0
Enterprise Funds
Enterprise Funds $ 17.7 - $ 17.7 $ 5.9
Fiduciary Funds
Undistributed Property Taxes $ 92.4 - $ 92.4 $ 88.3
Fire Insurance Escrow 10.8 - 10.8 10.8
Other 44.0 - 44.0 41.0
Component Units
Component Units $ 16.9 - $ 16.9 $ 10.6
Total General Ledger Cash Balance $ 868.2 $ 689.0 $ 1,557.2 $ 1,272.4
Note: This schedule reports total City of Detroit (excludes DSWD) cash in the bank at April 30, 2021 and differences between the General Ledger and bank balance are shown as reconciling items. This report does not represent cash available for spending, and liabilities and fund balance must be considered when determining excess cash.
18

Operating Cash Activity: YTD Actual vs. Forecast and 12 Month Forecast
($ in millions)
Beginning Common Cash Pool
FY20 YTD July - April
Actual
$ 553.6
Sources of Cash Income Taxes Property Taxes Revenue Sharing Wagering Taxes Utility Users Taxes Other Receipts (2)
Net Interpool transfers Bond Proceeds Transfers from Budget Reserve Fund (1)
$ 237.6 507.0 143.2 156.0
21.1 419.8 357.1
68.2 -
Total Sources of Cash $ 1,910.0
Uses of Cash Wages and Benefits Pension Contribution Debt Service Property Tax Distribution TIF Distribution Other Disbursements Transfers to Retiree Protection Fund Total Uses of Cash
Net Cash Flow
Ending Common Cash Pool
$
$
$
$
(583.8) (54.0) (23.6)
(299.6) (29.7)
(814.7) (45.0)
(1,850.4)
59.6
613.2
Budget Reserve Fund (1) $107.0
FY21 YTD July - April
Actual July - April
Forecast Variance
$ 564.2
$ 249.6 556.0 118.9 108.3
24.6 457.6 327.0
34.5 -
$ 158.8 525.2 116.3
47.7 21.1
316.5 357.8
13.6 -
$ 90.8 30.8
2.6 60.6
3.5 141.1 (30.8) 20.9
-$ 1,877.0 $ 1,557.0 $ 320.0
$
$
$
$
(562.5) (55.8) (18.5)
(330.2) (30.7)
(787.7) (50.0)
(1,835.4)
41.6
605.8
$
$
$
(563.5) (52.5) (18.5)
(331.3) (29.7)
(754.5) (50.0)
(1,800.0)
(243.0)
$
$
$
1.0 (3.3) -1.1
(1.0) (33.2)
-(35.4)
284.6
$107.0 $107.0
April 2021
Actual
May 2021
Forecast
June 2021
Forecast
July 2021
Forecast
Aug 2021
Forecast
Sept 2021
Forecast
Oct 2021
Forecast
Nov 2021 -Apr 2022 Forecast
$ 588.0 $ 605.8 $ 561.3 $ 1,047.8 $ 1,059.6 $ 1,087.5 $ 1,023.2 $ 1,022.1
$ 28.4 4.9
28.4 17.7
3.9 30.0 25.9
2.2 -
$ 8.8 7.1 -
12.2 3.1
21.5 15.2
1.5 -
$ 17.3 45.9 25.1 10.2
2.2 471.0
72.3 8.7
50.0
$ 25.3 58.2
-13.1
1.8 22.2 72.0 20.1
-
$ 20.3 188.4
29.0 27.6
1.4 42.4 21.8
1.3 -
$ 27.0 20.8
-13.0
1.9 44.4 44.3
0.3 -
$ 26.6 13.9 29.2 16.6
2.1 18.0 32.3
0.8 -
$ 143.5 225.6
86.5 88.3 14.6
167.7 242.3
47.1 -
$ 141.4 $ 69.4 $ 702.7 $ 212.7 $ 332.2 $ 151.7 $ 139.5 $ 1,015.6
$
$
$
$
(44.2) (10.4)
-(1.9) -
(67.1) -
(123.6)
17.8
605.8
$
$
$
$
(46.0) (2.2) -
(1.4) (5.6)
(58.7) -
(113.9)
(44.5)
561.3
$
$
$
$
(64.2) (4.9) -
(52.9) (24.3) (69.9)
-(216.2)
486.5
1,047.8
$
$
$
$
(53.9) (10.1)
(5.1) (6.8) -
(95.0) (30.0)
(200.9)
11.8
1,059.6
$
$
$
$
(59.2) (2.2) -
(86.0) -
(101.9) (55.0)
(304.3)
27.9
1,087.5
$
$
$
$
(57.7) (2.2) (8.7)
(62.7) -
(84.7) -
(216.0)
(64.3)
1,023.2
$
$
$
$
(51.8) (9.9) (0.4) (4.6) (1.6)
(72.3) -
(140.6)
(1.1)
1,022.1
$
$
$
(341.8) (31.3)
(9.4) (145.6)
(28.1) (452.9)
-(1,009.1)
6.5
1,028.6
$107.0 $107.0 $57.0 $107.0 $107.0 $107.0 $107.0 $107.0
(1) The June 2021 projected transfer from Budget Reserve Fund was part of the original FY21 budget solution. It may not be necessary as other cost savings /surplus are identified. (2) American Rescue Plan Act (ARPA) funds of $413M are recognized in the June 2021 "Other Receipts" forecast.
Office of the Chief Financial Officer 19

■ ■
■ ■
Accounts Payable and Supplier Payments City of Detroit Accounts Payable Accounts Payable Analysis (Inc. installments/retainage) $ in millions
$70 Accounts Payable (AP) as of Apr-21
Total AP (Mar-21) $ 22.5 Plus: Apr-21 invoices processed $ 72.3
Less: Apr-21 Payments made $ (64.5) Total AP month end (Apr-21) $ 30.3
d (1) Less: Invoices on hol $ (10.2) Less: Installments/Retainage Invoices (2)
$ (0.1) Net AP not on hold $ 20.0
Mill
ions
$60 $50 $40 $30 $20 $10
$0 $8.9 $6.5 $2.3 $15.2 $23.0 $19.1 $28.0 $20.4 $19.8 $16.2 $19.2 $13.0 $10.2
$15.8 $14.2 $36.0 $17.9
$34.5 $37.3 $20.0 $22.7 $33.2
$16.4 $18.0 $9.5 $20.1
AP Aging (excluding invoices on hold)
Days Past Due Net AP Current 1-30 31-60 61+
Apr-20 May-20 Jun-20 Jul-20 Aug-20 Sep-20 Oct-20 Nov-20 Dec-20 Jan-21 Feb-21 Mar-21 Apr-21
On Hold Not on Hold
Supplier Payment Metric (Phase 1)
Apr-21. Total $ % of total
Change vs. Mar-21 $
Total Count of Invoices % of total Change vs. Mar-21
Mar-21. Total $ % of total
Total Count of Invoices % of total
Notes:
20.0 $ 100% 10.5 $
1,406 100% 591
9.5 $ 100%
815 100%
12.4 $ 4.1 $ 0.7 $ 2.8 62% 21% 4% 13% 6.8 $ 3.9 $ 0.6 $ (0.8)
1,058 244 17 87 75% 17% 1% 7% 396 209 (11) (3)
5.6 $ 0.2 $ 0.1 $ 3.6 59% 2% 1% 38%
662 35 28 90 81% 4% 3% 12%
7/31
/201
9 93
.5%
8/31
/201
9 88
.4%
9/30
/201
9 91
.0%
10/3
1/20
19
92.9
%
11/3
0/20
19
92.1
%
4/30
/202
0 96
.8%
7/31
/202
0 94
.7%
8/31
/202
0 96
.8%
9/30
/202
0 95
.6%
10/3
0/20
20
95.6
%
11/3
0/20
20
96.5
%
12/3
1/20
20
94.3
%
1/31
/202
1 96
.1%
2/28
/202
1 94
.5%
3/31
/202
1 97
.4%
4/30
/202
1 95
.4%
100.0% 80.0% 60.0% 40.0% 20.0%
0.0%
(1) Invoices with system holds are pending validation. Some reasons include: pending receipt, does not match purchase order quantity/price and legal holds (2) Invoices on retainage are on hold until the supplier satifies all contract obligations
All invoices are processed and aged based on the invoice date ACH Checks
Office of the Chief Financial Officer 20