Fraud against the Commonwealth 2009–10 annual report to government
99
AIC Reports Monitoring Reports 18 Fraud against the Commonwealth 2009–10 annual report to government Jade Lindley Penny Jorna Russell G Smith
Transcript of Fraud against the Commonwealth 2009–10 annual report to government

AIC Reports
Monitoring Reports 18
Fraud against the Commonwealth 2009–10 annual report to government
Jade Lindley Penny Jorna Russell G Smith


www.aic.gov.au
AIC Reports
MonitoringReports
18
Fraud against the Commonwealth 2009–10 annual report to government
Jade Lindley Penny Jorna Russell G Smith

© Australian Institute of Criminology 2012
ISSN 1836-2087 (Print) 1836-2095 (Online)
ISBN 978 1 922009 02 9 (Print) 978 1 922009 03 6 (Online)
Apart from any fair dealing for the purpose of private study, research, criticism or review, as permitted under the Copyright Act 1968 (Cth), no part of this publication may in any form or by any means (electronic, mechanical, microcopying, photocopying, recording or otherwise) be reproduced, stored in a retrieval system or transmitted without prior written permission. Inquiries should be addressed to the publisher.
Project no. 0134 Dataset no. 0123
Published by the Australian Institute of Criminology GPO Box 2944 Canberra ACT 2601 Tel: (02) 6260 9200 Fax: (02) 6260 9299 Email: [email protected] Website: http://www.aic.gov.au
Please note: minor revisions are occasionally made to publications after release. The online versions available on the AIC website will always include any revisions.
Disclaimer: This research report does not necessarily reflect the policy position of the Australian Government.
Edited and typeset by the Australian Institute of Criminology
A full list of publications in the AIC Reports series can be found on the Australian Institute of Criminology website at http://www.aic.gov.au

iiiForeword
Foreword
Fraud has been estimated to cost Australia many billions of dollars each year. It affects all sectors of the community but in particular government agencies that handle large sums of public money such as taxation revenue and welfare payments. Government agencies are also at risk of public servants and contractors exploiting security weaknesses in systems to obtain financial advantage dishonestly. Fraud risks also arise in connection with implementing new, large-scale government programs.
This report presents the findings of the eighth annual survey of the fraud experiences of Australian Government agencies reported pursuant to the Commonwealth Fraud Control Guidelines 2002 (the Guidelines). The Guidelines require the Australian Institute of Criminology (AIC) to produce a report each year on fraud experienced by Australian Government agencies and the fraud control arrangements they use to minimise the risk of fraud.
The report is based on information from the 2009–10 financial year supplied by Australian Government agencies to the AIC before 30 September 2010. The 152 agencies that responded to the present survey reported experiencing 706,000 incidents of fraud, worth almost $498m, during 2009–10—almost 12 percent fewer incidents than in 2008–09 with a net worth almost 17 percent less than the amount lost in 2008–09. Reported losses arising from internal fraud, however, increased by almost 10 percent between 2008–09 and 2009–10, with more than $2m lost in 2009–10.
Responses vary when fraud is identified within agencies. Some responses are obligatory under official policies and laws, and others are optional,
depending on the scale and circumstances of the offence. Fraud is often not reported officially and sometimes repeat victimisation occurs—occasionally by the same offender against the same agency. The Australian Government has developed an extensive range of responses to this problem, including extensive fraud control policies, regular risk assessments, enhanced information security measures—and last, but by no means least, the use of prosecution and punishment when all else fails.
In 2009–10, over 5,000 defendants were referred to the Commonwealth Director of Public Prosecutions (CDPP) for prosecution involving allegations of fraud worth almost $100m. Of these only 29 were acquitted. The CDPP secured more than $59m by way of reparation under the Crimes Act 1914 (Cth) and pecuniary orders under the Proceeds of Crime Act 1987 (Cth).
This is the final AIC survey to be conducted pursuant to the 2002 Guidelines. Early in 2011 revised guidelines were issued by the Attorney-General’s Department, and the AIC has taken the opportunity to revise the data collection instrument for 2011. This will enable agencies to distinguish clearly between incidents of non-compliance and of fraud and also to provide more detailed information on the most serious incident of fraud experienced during the year—including demographic information on the principal suspect, as well as judicial outcome results.
I believe this report will provide important evidence that agencies can use to improve their fraud control measures and keep the risks of financial crime involving Commonwealth funds to a minimum.
Adam Tomison Director


vContents
Contents
iii Foreword
vii Acknowledgements
viii Acronyms
ix Executive summary
1 Introduction
1 Commonwealth Fraud Control Guidelines
2 Background
8 The nature and extent of public sector fraud
12 Methodology
13 Previous fraud surveys and results
16 The AIC online survey 2009–10
18 Results for 2009–10
18 Agency information
19 Fraud control
20 Fraud incidents
20 Agency reporting of fraud incidents
22 Agency size and fraud
23 Internal fraud
33 External fraud
43 Training and fraud
45 Policing and prosecutions
45 Australian Federal Police reporting
47 Commonwealth Director of Public Prosecutions reporting
49 Conclusions
49 Comparing internal and external frauds
54 Fraud trends in 2009–10
55 Future data collection
56 Implications for future monitoring of Commonwealth fraud trends
58 References
60 Appendixes
61 Appendix 1: Survey
77 Appendix 2: Respondent agencies
Box stories3 Box 1: Social security fraud
10 Box 2: Excise fraud
13 Box 3: Centrelink fraud reporting
52 Box 4: Australian Taxation Office
53 Box 5: Australian Customs and Border Protection Service
54 Box 6: Medicare Australia
Figures19 Figure 1: Respondents by type of agency
governance
21 Figure 2: Fraud experience by type of agency governance
22 Figure 3: Incidence of fraud, by agency size
24 Figure 4: Agency experience of internal fraud, by focus
26 Figure 5: Internal fraud by focus of incident
26 Figure 6: Internal fraud, by method of commission
29 Figure 7: Agency experience of internal fraud, by focus of incident and reported losses
34 Figure 8: External fraud, by focus of incident
36 Figure 9: External fraud, by method of commission
39 Figure 10: Agency experience of external fraud, by focus of incident and reported losses

vi Fraud against the Commonwealth 2009–10 annual report to government
Tables17 Table 1: Participating agencies in 2008–09 and
2009–10 surveys
19 Table 2: Date of most recent fraud risk assessment
20 Table 3: Date of most recent fraud control plan
21 Table 4: Agency experience of fraud incidents, by type of perpetrator
23 Table 5: Experience of fraud by agencies with a fraud control section
25 Table 6: Internal fraud, by focus of incident
27 Table 7: Internal fraud, by method of commission
29 Table 8: Internal fraud losses by focus of incident
30 Table 9: Internal fraud losses that could not be quantified, by method of commission
30 Table 10: Internal fraud recoveries, by focus of incident and recovery type
31 Table 11: Internal fraud suspects, by focus of incident
31 Table 12: Suspects’ duration of employment and current job role
32 Table 13: Internal fraud detection methods
32 Table 14: Method used to investigate internal fraud incidents
33 Table 15: Internal fraud referrals, by focus of incident and agency referred to
35 Table 16: External fraud, by focus of incident
37 Table 17: External fraud, by method of commission
38 Table 18: External fraud losses, by focus of incident
40 Table 19: External fraud losses that could not be quantified, by focus of incident
40 Table 20: External fraud recoveries, by focus of incident and method of recovery
42 Table 21: External fraud, by focus of incident
42 Table 22: External fraud detection methods
42 Table 23: Methods used to investigate external fraud incidents
43 Table 24: Number of external fraud referrals, by focus of incident
43 Table 25: Qualifications of agency fraud control staff
46 Table 26: Type and frequency of offences recorded by the AFP 2009–10
47 Table 27: Prosecution of fraud by jurisdiction, 2009–10
49 Table 28: Agency experience of fraud by focus of incident—summary
50 Table 29: Agency experience of fraud by method of commission—summary

viiAcknowledgements
Acknowledgements
This report would not have been possible without the input and support of the staff in each of the agencies that responded to this year’s survey. Comments on earlier drafts were provided by Dr Samantha Bricknell and Dr Rick Brown at the AIC.

viii Fraud against the Commonwealth 2009–10 annual report to government
Acronyms
ABS Australian Bureau of Statistics
ACBPS Australian Customs and Border Protection Service
ACC Australian Crime Commission
AFP Australian Federal Police
AGD Attorney-General’s Department
AGIS Australian Government Investigation Standards
AIC Australian Institute of Criminology
ANAO Australian National Audit Office
APCA Australian Payments Clearing Association Ltd
APS Australian Public Service
ATO Australian Taxation Office
CAC Act Commonwealth Authorities and Companies Act 1997
CDPP Commonwealth Director of Public Prosecutions
FMA Act Financial Management and Accountability Act 1997
IP Intellectual property
IT Information technology
NFA National Fraud Authority
QARs quality assurance reviews

ixExecutive summary
Executive summary
This report presents the findings of the eighth annual survey of the fraud experiences of Australian Government agencies reported pursuant to the Commonwealth Fraud Control Guidelines 2002 (the Guidelines). It is the fourth survey undertaken by the Australian Institute of Criminology (AIC) and the fifteenth survey undertaken on behalf of the government since 1995–96. The Guidelines require the AIC to produce a report each year on fraud experienced by Australian Government agencies and the fraud control arrangements agencies use to minimise the risk of fraud. The current report is based on information from the 2009–10 financial year, supplied by Australian Government agencies to the AIC before 30 September 2010. Relevant agencies completed a secure online survey. As required under the Guidelines, this report includes additional data provided by the Australian Federal Police (AFP) and the Commonwealth Director of Public Prosecutions (CDPP) on fraud investigations and prosecutions, respectively. A review was also undertaken of other research into public sector fraud derived from various fraud surveys completed in recent years by market research organisations and consultancies. The results of this were compared with the findings of the current survey.
ContextCrimes involving dishonesty, collectively known as fraud, have been estimated to cost Australia many billions of dollars each year. Fraud affects all sectors of the community, extending from individuals who have responded to online offers to make ‘quick money’, to large companies and government departments that have suffered fraud at the hands of their employees or members of the public. Fraud risks arise in connection with all government activities
but may have particular importance in connection with implementing large-scale, new government programs.
In the private sector, estimates of personal fraud losses for 2006–07, reported by respondents to the national survey of households conducted by the Australian Bureau of Statistics, totalled $977m (ABS 2008), while respondents to KPMG’s survey of Australian and New Zealand businesses in 2010 reported losses of $345.4m over the two-year period 2008–10 (KPMG 2010).
Fraud against the Commonwealth may be committed by individuals outside agencies (external fraud) who seek to claim benefits or obtain some other financial advantage dishonestly, or by those employed by agencies (internal fraud), including staff and contractors. The incidence and financial impact of internal fraud is generally lower than of external fraud, although both deplete government resources and have a negative impact on the administration of agencies.
Fraud in the public sector deprives governments of income for providing services to their communities while fraud in the private sector can seriously harm, businesses and individuals alike. The 152 Australian Government agencies that responded to the present survey reported experiencing almost 706,000 incidents of fraud (internal and external), worth almost $498m during 2009–10. This was almost 17 percent less than the amount lost in 2008–09, and almost 12 percent fewer reported incidents than in 2008–09. Reported losses arising from internal fraud, however, increased by almost 10 percent between 2008–09 and 2009–10, with more than $2m lost in 2009–10.
These totals under-represent the true value of fraud losses, as only 43 percent of agencies that experienced fraud specified a loss in 2009–10

x Fraud against the Commonwealth 2009–10 annual report to government
(26 out of the 61 agencies that experienced fraud). This was an improvement on the situation in 2008–09, when only 40 percent of agencies that experienced fraud specified a loss (23 out of 58 agencies that experienced fraud). The ability to quantify a loss depends on various factors, including the availability of evidence of what transpired, whether the investigation had been finalised and the nature of the dishonesty practised. Some instances where intangible losses are involved are difficult to quantify.
Responses vary when fraud is identified within agencies. Some responses are obligatory under official policies and laws, and others are optional depending on the scale and circumstances of the offence. Often, however, fraud is not reported officially and sometimes repeat victimisation occurs—occasionally by the same offender against the same agency. Both government and business have developed an extensive range of responses to this problem over the past decade, notably in response to changes in information and communications technology and the resulting increased vulnerability to computer-enabled crime.
2009–10 surveyThis report examines the fraud experiences of Australian Government agencies during the 2009–10 financial year. It includes evidence of the type and cost of detected incidents, the number of incidents investigated and the prevention and control measures adopted by agencies during this period.
The questionnaire used to collect information from agencies in 2009–10 varied slightly from that used in 2008–09, with changes designed to improve the clarity of questions and to deal with feedback from responding agencies provided during the year. The differences were, however, not marked enough to prevent comparisons between the results collected for the two years.
In March 2011, the Attorney-General’s Department (AGD) released an updated version of the Commonwealth Fraud Control Guidelines. The results of the 2009–10 data collection in this report relate to the 2002 Guidelines, which were current when agencies completed the survey. The 2010–11
report will traverse the period of change in the Guidelines, as the revised Guidelines of March 2011 were operational at the time agencies completed the survey in September 2011. Information on changes to the Guidelines will be reported in the 2010–11 report, along with details of the new questionnaire agencies completed in September 2011. These changes were made in light of the revised guidelines introduced to clarify the types of fraud and dishonesty agencies are required to report on. For this report, however, reference to ‘the Guidelines’ will be to the May 2002 version.
Participating agenciesUnder paragraph 8.13 of the Guidelines, reporting on fraud and fraud control is required by all Australian Government agencies governed by the Financial Management and Accountability Act 1997 (FMA Act) and by agencies governed by the Commonwealth Authorities and Companies Act 1997 (CAC Act) that receive at least 50 percent of funding from the Australian Government or an Australian Government agency.
Australian Government agencies that do not fall within these criteria are not required to report. They are, however, encouraged to do so and to comply with all aspects of the Guidelines. Each year, the number of agencies invited to participate differs slightly from the number that respond because new agencies are created and others are removed or amalgamated. There is also a small number each year that choose not to participate for various reasons, including interests of national security. Of the agencies that respond, some are excluded from the analysis because they do not meet the FMA Act or CAC Act eligibility criteria.
In 2010 an invitation to complete the questionnaire was sent to 191 Australian Government agencies. Completed responses were received from 175 agencies, although this was reduced to 152 after removing those agencies not covered by the FMA Act or CAC Act eligibility criteria. The revised total number of respondents included in the analysis (n=152) represented 80 percent of those invited to participate. Of these, 103 (68%) were FMA Act agencies and 49 (32%) were CAC Act bodies.

xiExecutive summary
year. Similar to risk assessments, three percent of agencies completed their last fraud control plan more than two years earlier. However, the number of agencies that had never had a fraud control plan increased from one percent in 2008–09 to two percent in 2009–10. As with the risk assessment question, these agencies had a more general risk management plan in place rather than a ‘fraud-specific’ one, which led them to answer this question in the negative.
Fraud victimisationAlmost the same percentage of agencies reported fraud victimisation in 2009–10 as in 2008–09 (40% in 2009–10, 39% in 2008–09). Slightly more agencies reported external fraud (34%) than internal fraud (31%), while nearly one-quarter had experienced both types of fraud (24%). Seven percent of agencies reported incidents of collusion between individuals within agencies and those outside agencies in 2009–10, the same as in the preceding year. In total, 705,547 incidents of fraud (internal and external) were reported in 2009–10 by 61 agencies —a reduction of almost 12 percent of the number of incidents from the 800,698 reported in 2008–09.
There were considerably more reported incidents of fraud alleged against persons external to agencies (external fraud) than against employees and contractors (internal fraud). In 2009–10, 47 agencies reported 3,001 incidents of internal fraud. For the five specified categories of internal fraud, incidents relating to ‘financial benefits’ affected the largest proportion of agencies (20%, n=30). For the specific subcategories of internal fraud, ‘leave and related entitlements’ affected the highest number of agencies experiencing internal fraud (n=19, 40%), which differed from 2008–09, when misuse of government credit cards affected the largest number of agencies (38%).
Agencies reported 702,941 incidents of external fraud, some of which may have involved allegations of non-compliance with regulatory instruments rather than actual incidents of financial crime. Most incidents related to ‘entitlements’; however, this only affected a small number of the largest agencies. One agency reported 75,644 incidents related to
In 2008–09 invitations were sent to 177 agencies, of which 166 responded and 149 were analysed (84% of those invited). In 2008–09 the responses analysed were from 101 FMA Act agencies and 48 CAC Act agencies, while in 2009–10 the responses analysed were from 103 FMA Act agencies and 49 CAC Act agencies. The proportion of agencies governed by these two Acts was the same in 2008–09 and 2009–10 (FMA Act=68% in both years and CAC Act=32% in both years).
In 2009–10, of the 152 agencies whose responses were analysed in this report, 139 (89%) were the same agencies analysed in 2008–09. Only four of the 16 agencies whose responses were analysed in 2009–10, but which were not included in the 2008–09 survey, reported instances of fraud in 2009–10 (a total of 70 fraud incidents—37 incidents from one agency, 30 from another, two from another and one from another agency). In making comparisons between the two years, therefore, it was apparent that the vast majority of responses came from the same agencies.
Fraud prevention and controlUnder the Guidelines, agencies are required to undertake a risk assessment every two years. The majority of agencies (62%) completed their most recent risk assessment in the current financial year (2009–10). The number of agencies that completed a risk assessment more than two years before that remained the same as it was in 2008–09, at four percent. The number of agencies that reported never having had a risk assessment also remained the same as in 2008–09, at two percent. Investigations revealed that the fraud control arrangements in these agencies generally fell within broader risk management activities, rather than as separate procedures dedicated to fraud risk. This resulted in these agencies responding that they had not undertaken a ‘fraud-specific’ risk assessment. Future surveys will seek information from agencies on this question differently to avoid confusion over how risk assessments are undertaken.
The majority of agencies (56%) completed their most recent fraud control plan in the current financial

xii Fraud against the Commonwealth 2009–10 annual report to government
$196,735,497 recovered. This was a considerable increase in the proportion of losses recovered in 2008–09, when $139,312,337 was recovered. The vast majority of funds recovered related to external fraud.
Fraud detection and investigationDetection of fraud incidents was most likely to occur through internal controls such as audits or internal investigations. This was true for both internal and external fraud incidents.
As required by the Guidelines, agencies generally investigated incidents of fraud themselves rather than referring them to an external agency or investigator. In the case of internal fraud, 85 percent (n=2,553) of incidents were investigated within agencies, while 94 percent (n=659,899) of external fraud incidents were investigated within agencies.
The majority of agencies reporting fraud identified at least one suspect. Almost 94 percent of those agencies that reported internal fraud identified a suspect, while 88 percent of agencies that reported external fraud identified a suspect.
ReferralsIn 2009–10 agencies referred a total of 5,428 incidents involving external fraud and 94 incidents involving internal fraud for police investigation or prosecution by the Commonwealth Director of Public Prosecution (CDPP). Of these incidents, 34 internal fraud incidents and 134 external fraud incidents were sent to the Australian Federal Police (AFP), 25 internal fraud incidents and 101 external fraud incidents were sent to state and territory police, and 35 internal fraud incidents and 5,193 external fraud incidents were sent to the CDPP in 2009–10. The fact that more external fraud incidents were referred for prosecution is, arguably, a reflection of the much larger number of incidents of external fraud detected each year.
entitlements, while another reported 613,996 incidents which were comparable in scale to those reported by these agencies in 2008–09. For external fraud, the type of incident affecting the greatest number of agencies involved ‘financial benefits’ (21%).The specific category of fraud that affected the greatest number of agencies was ‘theft of telecommunications or computer equipment (including mobile devices)’ (n=18, 35%). It was found that smaller agencies, with 500 or fewer employees, were less likely to report fraud incidents than those with more than 500 employees. However, while the smaller agencies reported fraud at lower rates, they were not completely immune. Eighteen percent of smaller agencies reported experiencing at least one fraud incident, while 83 small agencies reportedly did not experience any fraud.
Cost of fraud victimisationThe total loss reported by agencies was $497,573,820, although only 42 percent of agencies that experienced fraud specified a loss.
Fifty-three percent of agencies that reported experiencing an internal fraud incident reported a financial loss in 2009–10 totalling $2,039,162, compared with 60 percent in 2008–09 totalling $1,856,707—an increase of almost 10 percent.
Fraud related to ‘misuse of entitlements’ was the most costly internal fraud category, with agencies reporting more than $1.2m lost to this fraud type alone.
Fifty-one agencies experienced an incident of external fraud, worth $495,534,658 in 2009–10, although only 65 percent of agencies that experienced an incident of external fraud specified a loss. This was a 17 percent decrease in reported losses from external fraud from 2008–09. The largest external fraud losses arose from fraud relating to ‘entitlements’, with a total estimated loss of $487m in 2009–10 compared with $489m in 2008–09. For both internal and external fraud, there were several agencies that suffered losses they were unable to quantify.
In 2009–10, some 40 percent of total reported losses were recovered by agencies, with

xiiiExecutive summary
ConclusionsThis year’s report provides policy-relevant information about the types of fraud Australian Government agencies experienced and the methods used to commit them. In future years, the results from the annual questionnaire will provide trend data which will assist agencies in preparing fraud control policies and allocating resources for preventing and investigating fraud. Future reports will also seek to further explore the problem of external fraud, which accounts for by far the largest proportion of fraud detected by agencies—particularly for large agencies. It would be useful to explore why these large agencies have apparently good levels of protection against internal fraud yet remain vulnerable to external fraud risks. Future reports will also place greater emphasis on the profile of those committing fraud against the Commonwealth by including specific questions on the ‘most serious fraud’ case of internal fraud experienced during the preceding financial year.
This report, like previous AIC reports, shows the need for more consistent data-recording practices and measurement of fraud within agencies, particularly concerning the extent to which regulatory non-compliance ought to be included in the scope of the Guidelines and survey. Feedback from agencies highlights the fact that the definition of fraud in the 2002 Guidelines has been interpreted inconsistently by some Australian Government agencies. With the introduction of revised Guidelines in 2011 and improved data collection procedures which will clearly distinguish between non-compliance and fraud, future Fraud against the Commonwealth reports will be able to quantify more precisely the true nature and extent of the fraud experiences of all Australian Government agencies, both internally and externally.
Australian Federal PoliceApart from the information provided by agencies in response to this year’s survey, the Guidelines also require the AFP and CDPP to provide information on matters dealt with during the previous year. These agencies adopt different definitions and categories for collecting data from those used by reporting agencies themselves, thus making their statistics on referrals not directly comparable with agency data.
During 2009–10 the AFP accepted 94 fraud referrals and declined 29. Of these, 24 matters resulted in legal action (this included some matters initially referred in previous years). The AFP advised that the number of referrals had decreased since 2008–09 due to changes in business rules for recording undeclared currency matters. For example, in 2009–10 cases were recorded only if they proceeded either by arrest or summons. Losses involved in the 94 matters accepted for investigation during 2009–10 were estimated to amount to almost $39m.
Commonwealth Director of Public Prosecutions In 2009–10, 5,010 defendants were referred to the CDPP for prosecution involving allegations of fraud. Of these, 4,913 were prosecuted, resulting in 4,180 convictions and 29 acquittals. It should be noted that prosecutions undertaken by the CDPP in 2009–10 may relate to cases that had been referred to the CDPP in previous years. Accordingly, some cases that agencies referred to the CDPP in 2009–10 may have been prosecuted in later years. Charges against those prosecuted for fraud in 2009–10 involved alleged financial losses of almost $100m. The CDPP secured more than $59m by way of reparation under the Crimes Act 1914 (Cth) and pecuniary orders under the Proceeds of Crime Act 1987 (Cth). These recoveries related only to monies recovered during 2009–10.


1Introduction
Introduction
This report presents the findings of the eighth annual survey of the fraud experiences of Australian Government agencies reported under the Commonwealth Fraud Control Guidelines, May 2002 (the Guidelines). The current report is based on information from the 2009–10 financial year, supplied by Australian Government agencies before 30 September 2010 in response to a secure, online questionnaire conducted by the Australian Institute of Criminology (AIC). At the outset, the nature of the Commonwealth’s fraud control arrangements is presented with a review of the nature and extent of public sector fraud risks Australian Government agencies currently face.
Commonwealth Fraud Control GuidelinesThe Australian Government first released its fraud control policy in 1987. Changes in technology and Australian Public Service (APS) operations, particularly the use of third-party providers of services, led to reviews of the policy in 1994, 1999 and 2011. As a result of the 1999 review, the then Minister for Justice and Customs issued new Commonwealth Fraud Control Guidelines in May 2002 under rule 19 of the Financial Management
and Accountability Act 1997 (FMA). The Guidelines apply to all agencies governed by the FMA Act and to bodies governed by the Commonwealth Authorities and Companies Act 1997 (CAC) that receive at least 50 percent of funding for their operating costs from the Australian Government or an Australian Government agency. The Guidelines do not apply to a CAC Act agency that does not receive this level of funding. Such agencies are, however, strongly encouraged to comply with the best practice standards set out in the Guidelines. Agencies are responsible for determining their funding status to ascertain whether the Guidelines apply to them.
Under the current Guidelines, agency chief executives are required to take a holistic and ongoing approach to fraud risk management as part of their governance obligations. They need to ensure that their staff are appropriately trained in fraud prevention, detection and investigative techniques. Chief executives are accountable to their portfolio minister for implementing a fraud control plan and for reporting on fraud within and against their agencies annually to enable the preparation of this fraud report.
Before 2006–07, the Attorney-General’s Department (AGD) was responsible for receiving and analysing information from agencies and producing the annual

2 Fraud against the Commonwealth 2009–10 annual report to government
other technology-enabled frauds are increasingly areas of concern for both the public and private sectors. According to KPMG (2010), fraud and misconduct in all sectors remain serious issues in Australian and New Zealand.
Types of fraud
Credit card fraud
In the late 1990s a study by the AIC revealed that the credit/debit card industry was being targeted by organised crime, with vulnerabilities arising from the way in which credit/debit cards were issued and payments processed (Smith & Grabosky 1998). A continuing concern is the likelihood of hackers and other fraudsters gaining access to card numbers and other personal information electronically (Choo, Smith & McCusker 2007). In 2010, the KPMG Fraud and Misconduct Survey found that corporate credit card fraud represented 10 percent of all public sector frauds in Australia and New Zealand (KPMG 2010). Compared with the same KPMG survey conducted in 2008, credit card fraud decreased by three percent, while cheque fraud reduced by two percent to zero in 2010, which may be indicative of increased protections to prevent credit card fraud and the decreasing use of cheques. Data from the Australian Payments Clearing Association Ltd (APCA 2010) reveal that from 1 July 2009 to 30 June 2010 fraud perpetrated on Australian-issued payment instruments amounted to $200,232,941 involving 749,628 transactions, which represented 0.0099 percent of the value of all transactions during that year. APCA data also show that from 2008–09 to 2009–10 the total number of credit/charge card transactions increased by 10 percent, while from 2008–09 to 2009–10 the total number of fraudulent credit/charge card transactions increased by 37 percent. Although separate data are not available for public and private sectors, or organisations and individuals, it is clear that credit card risks arise for all who make use of them.
Financial reporting fraud
Auditing standard ASA 240 (AUASB 2006) identifies two types of financial reporting fraud:
• misstatements resulting from misappropriation of assets; and
fraud report. In October 2006 the then Minister for Justice and Customs amended the Guidelines and transferred these responsibilities to the Australian Institute of Criminology (AIC). More general responsibilities for fraud control policy remain with AGD. The AIC was also asked to consider how best to enhance the quality of the annual fraud report to ensure that its findings could be used effectively to develop the Australian Government’s fraud control policy. Under paragraph 8.13 of the Guidelines, agencies are required to collect information on fraud victimisation and fraud control and to provide it to the AIC by 30 September each year.
In March 2011, AGD released an updated version of the Commonwealth Fraud Control Guidelines. The results of the 2009–10 data collection reported in this volume relate to the 2002 Guidelines, which were current at the time agencies completed the survey. Next year’s report for 2010–11 will traverse the period of change in the Guidelines—the revised Guidelines of March 2011 were operational at the time agencies completed the survey in September 2011. Information on the changes to the Guidelines will be reported in the 2010–11 report. For this report, however, reference to ‘the Guidelines’ is to the May 2002 version.
BackgroundThe nature of fraud
Fraud involves the use of dishonest or deceitful means to obtain some unjust advantage. Dishonesty is the key attribute that distinguishes fraudulent from innocent conduct. Rather than defining dishonesty in legislation, it is usually a matter of fact for juries to determine in criminal cases. Anyone can be a target of fraud, be it an individual or an organisation, and victims can be targeted by individuals or organised groups of individuals. Defining fraud is difficult because of the range of conduct that can involve dishonesty. The lack of an agreed operational definition of fraud is one of the enduring limitations to effective quantification of the scale of the problem. Fraud is not a new phenomenon but, as technology continues to advance and its use increases, there are additional challenges for those attempting to prevent and control fraud. Identity-related fraud and

3Introduction
Smith & McCusker 2007). The PwC (2010) survey found that 15 percent of respondents reported that IP affected their organisation; however, less than one-quarter of respondents believed that their organisation was well prepared to deal with significant IP theft (Ernst & Young 2010). As such, the PwC (2010) survey found a strong trend towards increased spending to protect information security. Governments, too, are at risk of IP theft, and the present survey includes loss of IP as one of the fraud categories for agencies to report on.
Social security fraud
Social security fraud involves giving false or misleading information, or omitting relevant information, to a government agency to receive a social security benefit to which one is not entitled. Benefits include unemployment benefits, disability pensions and family allowances.
In Australia, Centrelink administered $84.2b in payments to 7.02 million customers in 2009–10 alone. Centrelink’s large customer base leaves it particularly vulnerable to fraud. In 2009–10, Centrelink undertook 3.5 million eligibility and entitlement reviews, which resulted in 613,498 payments being cancelled or reduced and generated customer debts totalling $486m. These reviews identified the total number of incidents of customer non-compliance Centrelink identified for the year, a proportion of which entail criminal acts of dishonesty. Centrelink also makes use of the ‘Australian Government services fraud tip-off line’, which receives reports of suspected fraud against Centrelink, Medicare, the Pharmaceutical Benefits Scheme and the Child Support Program. In 2009–10, based on tip-offs alone, Centrelink conducted 43,726 customer entitlement reviews, which resulted in $101.8 million in debts and
• misstatements from fraudulent financial reporting.
Fraudulent financial reporting involves intentional misstatements, including omissions of amounts or disclosures in the financial report, to deceive financial report users. Fraudulent financial reporting may be accomplished by the following:
Manipulation, falsification (including forgery), or alteration of accounting records or supporting documentation from which the financial report is prepared; misrepresentation in, or intentional omission from, the financial report of events, transactions or other significant information; or intentional misapplication of accounting principles relating to amounts, classification, manner of presentation, or disclosure (AUASB 2006: 12).
This type of activity has contributed to a number of high-profile corporate collapses in Australia and the United States in recent years (eg Enron and WorldCom in the United States). As a result of these collapses, the US Government passed the Sarbanes-Oxley Act 2002, which tightened reporting requirements for companies and increased penalties for financial crime (Kroll 2007).
Intellectual property theft
With increasing electronic storage and transmission of information, managing and protecting intellectual property (IP) has become a high priority for organisations. Digitisation provides opportunities for IP theft without the theft becoming obvious or the thief being identifiable. Electronic surveillance and data-capture technologies can be used to steal commercial-in-confidence information or may be directed at electronic IP. Enhanced reverse engineering techniques (stripping down and analysing competitors’ products) also facilitate unauthorised access and exploitation of IP (Choo,
Box 1 Social security fraud
The defendant’s mother was in receipt of a Widows and Age pension from Centrelink. The defendant was his mother’s carer until her death on 4 May 1997. On 17 March 1998 the defendant represented to Centrelink that his mother was still alive and in receipt of her pension by applying for an advance payment, ostensibly on her behalf. Between 19 March 1998 and 19 June 2006 the defendant accessed his mother’s bank account and obtained more than $92,000. The defendant was in poor health and used the money for gambling. The defendant was charged with two counts of making a false representation to obtain a benefit from the Commonwealth pursuant to section 29B of the Crimes Act 1914 and one count of dishonestly causing a loss pursuant to section 135.1(5) of the Criminal Code Act 1995. On 31 March 2010 in the District Court at Parramatta the defendant was sentenced to a total of 16 months imprisonment to be served by way of home detention, to be released on recognisance after 10 months.
Source: CDPP (2010: 18)

4 Fraud against the Commonwealth 2009–10 annual report to government
that increase crime reporting and detection, can affect the number of incidents which appear in official statistics (Victorian Parliament Drugs and Crime Prevention Committee 2004). Similarly, changes in police agency resources and crime classification and recording practices can dramatically affect crime rates.
The other principal source of information on the extent of fraud comes from victim surveys and surveys of offenders. These may be carried out by interview or through self-report surveys. Surveys typically involve samples in which a small representative group is questioned and its responses used to predict the likely situation in an entire population. This, of course, introduces the possibility of error in predictions and the need for statistical controls to combat this. There are also problems of reliability (whether repeated surveys elicit the same answers from the same subjects) and validity (whether the survey is measuring what it is intended to measure) (Victorian Parliament Drugs and Crime Prevention Committee 2004).
In the case of public sector fraud, little information is available from victimisation surveys, as data gathered from organisations are rarely reported in a way that enables the experiences of public sector agencies to be disaggregated from the experiences of private sector organisations surveyed.
The circumstances and complexity of the offence may also make constructing a meaningful survey difficult. Problems of telescoping information (that is, including events outside the survey period), exaggerating facts or reporting selectively—all common problems with surveys and personal interviewing—can affect the accuracy of information gathered using conventional techniques. There may also be problems of veracity, where a manager may be reluctant to report circumstances that may be personally incriminating or which may attract negative publicity for the organisation. Finally, there may also be problems arising from organisational incentives which can skew the relative attractiveness of classifying losses as bad debt rather than fraud (eg when a credit card payment or other debt remains unpaid after only one or two initial payments).
Due to the difficulties in measuring the extent of fraud, generating an accurate picture of the cost of fraud has also been problematic. The difficulties
savings. In relation to incidents of serious non-compliance or fraud in 2009–10, Centrelink reviewed and investigated 24,517 suspected incidents of fraud worth approximately $76m. Of these, 4,608 cases of serious non-compliance or fraud were referred to the Commonwealth Director of Public Prosecutions for consideration of prosecution in 2009–10. Of these, 3,461 Centrelink cases were prosecuted, with a successful conviction rate of 99.3 percent and only 25 acquittals (Centrelink 2010: 72). Despite sophisticated fraud control measures, individuals still seek to obtain benefits illegally from Centrelink (see Box 1).
Extent of fraud
It is difficult to obtain consistent data on fraud in Australian jurisdictions because of different information systems, legislative definitions, data collection practices and prosecution activity. Despite this, it is known that a substantial amount of fraud occurs in the Australian community, affecting individual consumers, businesses and government agencies.
Problems of measurement
There are many impediments to measuring fraud accurately. Part of the problem lies in the absence of agreed definitions, which has prevented data from being collected uniformly and consistently. Official statistics collected by police and other criminal justice agencies also only reflect matters that have come to the attention of the authorities. In the case of fraud, it is well known that such crimes are often undetected, unreported or not proceeded with by law enforcement agencies (Smith & Grabosky 1998). This creates difficulties for those seeking an accurate picture of the extent of the problem. Some victims, such as those who have given money to fraudulent and non-existent charities, may never realise that they have been victimised. Others, such as businesses and government agencies, may be unaware that employees have stolen inventory or stock.
Official statistics, particularly those relating to fraud and dishonesty offences, have limitations. The first of these, despite the best efforts of those involved, relates to accuracy. In addition, any changes in police detection rates, for example, or other factors

5Introduction
In 2010, a survey was undertaken of fraud perpetrated against not-for-profit organisations in Australia and New Zealand (BDO Chartered Accountants and Advisers 2010). Of the 272 responses received about perceptions and levels of fraud, only 43 percent indicated that they had reported cases of fraud to police—an increase of two percent in respondents who reported to the police from the 2008 not-for-profit survey. The not-for-profit sector reported having dismissed a greater number of employees who had committed fraud than KPMG reported, at 64 percent.
The reasons for non-reporting of fraud are well known. Some organisations may be unaware that employees have stolen stock or misappropriated equipment or misused services. In the case of online fraud, difficulties may arise in locating the offender, who may be a resident overseas or have used an anonymous re-mailing system to carry out the fraud. Often, the victims of economic crime may be unwilling to incur further time and expense in pursuing legal remedies (Smith 2008). There may also be a belief that there is inadequate proof, or that the matter is not serious enough to warrant police attention. There may also be a fear of reprisals if matters are reported or that the resultant publicity of security weaknesses could result in victims being targeted again, or a fear of losing business or of damaging commercial reputations. Many public sector agencies often do not like to admit that they have a problem (Smith 2008).
A victimised government agency may believe that adverse publicity could result in a loss of confidence among the general public or clients (PwC 2007). In KPMG’s 2010 survey, organisations surveyed indicated ‘minor nature of the incident’, ‘money/property was returned’ and ‘a lack of evidence’ as their main reasons for not reporting matters to the police (KPMG 2010:15). PwC (2007) found that when the fraud was committed by a person external to the company, the matter was more likely to be made public. In addition, the reluctance to spend money to recover debts and ‘sending good money after bad’, can lead to writing off losses rather than reporting and investigating them (Smith 2008: 387).
in assessing the cost of fraud have been outlined previously by the AIC (Mayhew 2003; Rollings 2008). Alongside the challenges of obtaining good-quality data, there are also problems that stem from the volume of ‘hidden’ fraud. Hidden fraud, as defined by Mayhew (2003), consists of the frauds that, because of the level of deception involved in the incident, will go undetected and remain unknown to police and even the victims involved. As well as these problems of measurement, the costs of detected fraud are not always known, as victims might not be able to accurately estimate their losses. The result is that calculations of financial loss and other impacts can, at best, only be estimates and will invariably be lower than the actual loss suffered.
Problems of underreporting
Perhaps the greatest difficulty in assessing the extent of fraud lies in the fact that organisations are reluctant to officially report their experiences of fraud. This is evident from the results of KPMG’s biennial surveys of its clients on their experiences of fraud and how they deal with it (KPMG 2010, 2009, 2006).
The results of the KPMG Fraud and Misconduct Survey 2010 were derived from responses to a survey distributed among 18 sectors of Australia’s and New Zealand’s largest public and private sector organisations (KPMG 2010). The survey sought information about fraud incidents in the respondents’ business operations from February 2008 to January 2010. Usable responses were received from 214 organisations, representing just over 10 percent of the surveys distributed. It was found that 60 percent of major fraud incidents reported in the survey were referred to the police, which is a drop of three percent from the 2008 KPMG survey. This left 40 percent of fraud matters handled without police involvement. A range of other responses were reported, including internal and external investigations and the immediate dismissal of the individual in question. Some 59 percent of matters were dealt with by internal investigation, and in 37 percent of matters immediate dismissal occurred (KPMG 2010). In the case of fraud against Australian Government agencies, the Commonwealth Fraud Control Guidelines require agencies to deal with most matters internally, which means that less than one percent of incidents are referred for police investigation.

6 Fraud against the Commonwealth 2009–10 annual report to government
Australians $977m in 2006–07 (ABS 2008). Individual fraud losses were typically between $10,000 and $100,000; however, a small number of respondents reported having lost more than $1m in a single fraud (KPMG 2010). The public sector alone experienced more than $15.6m in fraud losses during the two-year period to January 2010 (KPMG 2010). Despite these estimates being derived using differing methodologies, the increase over this time can be attributed to increasing fraud, consistent with other international findings.
Money was often not recovered following major fraud incidents. According to KPMG’s survey results, no losses were recovered in 61 percent of major fraud incidents reported. This represented a substantial deterioration from the 2008 results, where no losses were recovered in 42 percent of major fraud incidents reported in the survey (KPMG 2010, 2008).
Not surprisingly, the size of an organisation correlated with the level of risk for fraud. In all three KPMG surveys (2010, 2008, 2006), it was found that the level of fraud was higher in larger organisations. In 2010, the most common type of major fraud was theft of cash (18%), followed by false invoicing (11%), consistent with the 2008 findings. Fraud was more likely to be committed by outsiders rather than an employee of an agency; however, the largest frauds were ‘inside jobs’ and, consistent with previous years, internal controls were the most effective means of detecting fraud (KPMG 2010). PwC found in its 2009 survey that, while internal audit remained vital to the detection of fraud, there was a clear decrease in detecting fraud through this method, whereas anti-fraud controls, especially risk management, were reported as having detected an increasing number of frauds in the 2009 survey.
International environment
Between November 2009 and February 2010, Ernst & Young (2010) conducted its eleventh global fraud survey and interviewed 1,409 respondents from 36 countries. Almost four percent (n=52) of respondents were from Australia. Of these, eight percent had experienced a significant fraud incident within the preceding two years, somewhat less than the global average of 16 percent. However, measures required to manage and mitigate the risk of fraud
Estimates of extent and cost of fraud
Despite the difficulties associated with measuring the cost of fraud, there have been attempts through surveys and other means to demonstrate the extent of the problem in Australia and overseas. Research on the extent of fraud is sparse and often conducted by individual agencies using a small sample. While this means there is little generalisable data, there is information about specific fraud incidents experienced by companies, particularly those in the private sector. However, due to the inherent difficulties in measuring fraud, it is likely that some estimates will greatly understate the actual incidence and losses involved.
Australia
Fraud has been identified as the most expensive crime category in Australia. According to ABS (2011) reported statistics, fraud and deception-related offences was the largest category of all federal offences from all levels of Australian courts. According to KPMG’s 2010 Fraud Barometer for Australia, the cases going before Australian courts exceeded $100m (KPMG 2011). Rollings (2008) estimated that in 2005 slightly fewer than 100,000 cases of fraud were officially recorded by police, but that this, using Mayhew’s (2003) methodology, was probably only 25 percent of all the fraud cases that had actually occurred. Accordingly, there could have been approximately 400,000 cases of fraud that actually occurred in 2005 (Rollings 2008).
This finding is echoed in KPMG’s ninth biennial fraud survey in 2010, which reported that at least 50 percent of surveyed private entities experienced a fraud and 61 percent of the public sector experienced fraud (KPMG 2010). Recorded fraud in Australia was estimated to cost $5.88b in 2001–02, or 30 percent of the cost of all crime (Mayhew 2003). The total cost of fraud, including intangible costs and recovery costs, was estimated at $8.5b in 2005 using a slightly different method of calculation to that used by Mayhew in 2003 (Rollings 2008).
Findings from the 2010 KPMG survey showed the collective total value of public and private sector fraud costing $345.4m, an increase from the 2008 value of $301.1m (KPMG 2010). This figure, however, excludes personal fraud, which reportedly cost

7Introduction
which makes them particularly vulnerable to fraud’ (ACFE 2010: 4). This finding is not supported by KPMG (2010), which found that organisations with fewer than 500 employees experienced less fraud than organisations with more than 500 employees.
BDO Chartered Accountants and Advisers (2010) conduct biennial surveys on fraud in the not-for-profit sector in Australia and New Zealand. The most recent survey was conducted in 2010 and involved a sample of 272 organisations—a reduction from the 384 organisations surveyed in 2008. Of these, 15 percent had experienced fraud in the previous two years, compared with 16 percent in 2008 and 19 percent in 2006. A total of $1,071,851 was lost to fraud, representing $14,291 per incident. Cash theft (24%) accounted for the largest type of fraud, often committed by paid employees in their thirties or forties over an average period of 10 months. As also found in similar surveys, fraud increased as turnover increased and in 67 percent of frauds no money was recovered. This represented an increase of 23 percent from the 2008 survey. Internal controls were the most common way to detect fraud: 40 percent of frauds were discovered through this method and a further 31 percent detected through tip-offs.
The PwC (2009) Economic Crime survey questioned 3,037 respondents from 54 countries using a web-based questionnaire. Of these respondents, 30 percent reported experiencing at least one fraud incident in the previous two years. As with KPMG’s findings, fraud incidents increased with employee numbers. The most common method for detecting fraud incidents was identified as ‘chance’.
Perpetrators of fraud
In its survey of business fraud in Australia and New Zealand KPMG (2010) found that 65 percent of major frauds, which resulted in 98 percent of losses, were committed by employees within the victim organisations, who generally acted alone. KPMG (2010) found that in public sector agencies, 90 percent of frauds were committed internally, with management responsible for more of the total value of fraud than non-management employees (85% compared with 7%). Only eight percent of the total value of fraud was committed by external parties.
were not increasing at a comparable rate with the increased occurrence of fraud (Ernst & Young 2010).
In July and August 2010, Kroll (2010) commissioned the Economist Intelligence Unit to conduct a worldwide survey on fraud. More than 800 senior executives took part in this survey, with 29 percent of the respondents based in North America, 25 percent in Europe, 24 percent in the Asia–Pacific region (47 percent of which were from China and India) and 11 percent each from Latin America, the Middle East and Africa. The survey covered 10 industries, with no fewer than 50 respondents drawn from each industry group. The survey found that 88 percent of companies were affected by at least one fraud in the preceding year, which remains broadly consistent across regions and preceding surveys. The average company surveyed lost US$1.7m to fraud compared to US$1.4m in 2009.
The 2010 Kroll survey examined fraud experiences more deeply than previous surveys and uncovered a range of emerging trends in risk, including increased risk of theft of information and electronic data; corporate information technology systems increasingly being under threat; companies being unprepared for increasing regulatory efforts against corruption; and fraud being most often an inside job (Kroll 2010). In the Asia–Pacific region, Kroll (2010) reported that 92 percent of companies were affected by fraud, up from 82 percent in 2009. Specifically, IP theft (16%) and money laundering (9%) were reportedly the highest of any region in the previous 12 months (Kroll 2010). Much of the fraud exposure (34%) was attributable to high staff turnover in the region (Kroll 2010).
The 2010 Report to nations on occupational fraud and abuse, compiled by the Association of Certified Fraud Examiners, is based on 1,843 cases of occupational fraud reported by Certified Fraud Examiners who investigated them in more than 100 countries. These investigations found that typical organisations lost around five percent of their annual revenue to fraud, translating to a median loss of US$160,000, but nearly one-quarter of the frauds totalled at least US$1m. The Certified Fraud Examiners determined that frauds were more likely to be detected through tip-offs than by any other means. Interestingly, it was found that small organisations were disproportionately victimised by occupational fraud, often due to a lack of ‘anti-fraud controls compared to larger counterparts,

8 Fraud against the Commonwealth 2009–10 annual report to government
In relation to ‘the absence of capable guardians’ as a reason for why fraud occurs, relevant factors can be grouped into five categories:
• regulatory failures (breach of regulatory provisions);
• accounting/auditing failures (failure to detect accounting irregularities);
• security failures (computer security weaknesses, poor cash controls etc);
• prudential failures (failure to conduct creditworthiness checks etc); and
• personnel failures (eg staff screening, supervision and monitoring).
The study by the AIC and PwC (2003) found the following evidence of these factors. Overall, prudential failures to do with providing finance and credit and verifying the backgrounds of applicants for finance were the highest areas of risk, followed by personnel failures involving inadequate supervision and control of staff in organisations. Accounting and auditing failures were also frequently present and arose in almost one-quarter of cases. In the private sector, prudential failures represented the highest risk category, while in the public sector there were similar numbers of cases involving prudential failures and accounting and auditing failures (Smith 2003).
The nature and extent of public sector fraudTypes of public sector fraud
As with all types of crime, there are three generally recognised requirements for fraud to occur. There must be the presence of an opportunity, a suitably motivated offender and the absence of capable guardianship to prevent the crime from taking place (Clarke & Mayhew 1980). If all three elements are present, then the risk of fraud is enhanced. In the public sector, opportunities arise for both internal and external fraud. The principal opportunities for internal fraud arise from poor risk management, lax internal controls and deficient recruitment practices. Risks for external fraud arise from the provision of new benefits, new taxes, procurement and the use of consultants.
Similarly, in 2006 and 2008, fraud was most likely to be perpetrated by an employee within the non-financial sector (54% and 57% respectively); however, as the counting rules changed between 2008 and 2010, direct comparisons cannot be made. These findings contrast the situation experienced by Australian Government agencies, where the vast majority (99.6%) of fraud incidents were perpetrated by individuals outside agencies.
Using the results of the survey, KPMG (2010 17) created a profile of the ‘typical’ fraudster across all sectors, who was likely to be:
• a male, non-managerial employee of the victim organisation, acting alone with no known history of dishonesty;
• a male, aged 38 years and earning $113,000 per annum;
• employed by the organisation for a period of five years and having held the current position for three years at the time of detection;
• motivated by greed, misappropriating cash to an average value of $229,000; and
• detected by the organisation’s internal controls 12 months after the commencement of the fraud.
The profile contained characteristics which were largely the same as the ‘typical’ fraudster identified in 2006 and 2008 (KPMG 2010) and closely followed the profile of convicted serious fraud offenders found by the AIC and PwC in 2003 (Smith 2003).
In relation to the motivations of offenders, previous research by the AIC and PwC (Smith 2003) and KPMG (2010) has shown that fraud offences are most often committed as a result of gambling problems, either as a means of obtaining funds for gambling or as a way of settling gambling debts. Increasingly, however, the primary driver of fraud is personal greed and a desire to maintain a certain lifestyle, which reportedly accounted for almost 93 percent of respondents to the 2010 KPMG survey. Given the full impact of the global financial crisis, personal financial difficulties also provide an important motivator (3%) (KPMG 2010; see Levi & Smith 2011 for a discussion of the role of the global financial crisis on the incidence of fraud). Identifying individuals who may be affected by these factors represents a valuable way of preventing fraud.

9Introduction
Fraud can also arise in connection with the corruption of public servants who may conspire with others to provide access to secure systems in return for a benefit (see Smith & Jorna 2011). In KPMG’s (2010) latest survey, collusion between criminals and insiders was found to be present in 23 percent of cases, a slight increase from the 2008 survey. This figure is greater than the results in the 2008–09 and 2009–10 Fraud against the Commonwealth reports, which found just over seven percent (n=10 in both years) of agencies experienced frauds involving collusion between internal and external parties.
Grabosky (1991: 7) described three areas in which government agencies may be vulnerable to fraud:
There are three basic modes of government activity in which fraud can occur—paying, collecting and contracting. Governments bestow a variety of benefits, subsidies, and payments to individuals and organisations. Not all recipients are entitled to what they receive. Governments collect revenues from individuals and organisations, in the form of taxes and duties, or as payment for services. There are those who do not pay what is due.
Governments themselves are consumers of goods and services. There are those providers of goods and services who charge the government for goods not delivered or for services not rendered, or who knowingly provide defective or substandard products. Beyond this, governments control billions of dollars of capital resources, some of which are vulnerable to conversion for private use by unauthorised persons.
Governments may also be vulnerable to other frauds, such as identity fraud, corruption and theft. Direct theft may occur where employees steal petty cash or remove government property. More covert forms of theft involve the abuse of government facilities, such as the unauthorised use of motor vehicles and computers. Corruption can be involved when government employees abuse their position by accepting bribes to grant licences for which there is no entitlement or to charge governments for goods or services which are not in fact provided (Grabosky, Smith & Dempsey 2001). Government departments may also be grossly overcharged or purchase specific goods and services that they would not need if not for the corruption of insiders.
The introduction of the Clean Energy Future legislative package in 2011 in Australia, which is a core element of the Kyoto Protocol, poses new public sector fraud risks for Australian Government agencies. Some of the potential risks associated with carbon reduction schemes include the possibility of fraudulent reporting of emissions and manipulation of the financial instruments and transactions used in the schemes. Potential fraud vulnerabilities may be averted through targeted risk prevention planning activities.
Since the introduction of the European emissions trading scheme, there have been two major fraud attacks resulting from poor levels of security. The first, in February 2010, was a phishing attack in which traders were asked to revalidate their information via a fabricated web link, which led to the theft of 250,000 carbon allowances worth over €3m at the time (Macalister & Webb 2011). The second occurred in late January 2011, when cyber thieves stole around €30m worth of carbon allowances from several national registries in the European emissions trading scheme (Lockhart 2011). These attacks have met with criticism concerning the level of security required along with ‘calls for an EU-backed insurance fund to be established to cover any such losses’ (Macalister & Webb 2011). It is evident that ‘no system could ever be 100 percent fraud proof, despite promises by the commission to tighten software security in the light of the growing problem with fraud’ (Macalister & Webb 2011). More recently, the Australian Crime Commission has also raised concerns over the potential for carbon reduction schemes to be manipulated by organised crime groups for financial gain (Barrett 2011).
New technologies have also provided new fraud risks for government. Risks have arisen with e-government in connection with online benefit payments and e-tax systems. New payment systems such as chip/PIN cards and online banking have created further opportunities while reducing other risks. The use of mobile devices and wireless networks in the public sector creates other vulnerabilities. These include conventional risks associated with the misuse of identities and documents used for identification, as well as the risk of offenders gaining unauthorised access to computers and wireless networks which have inadequate security measures in place.

10 Fraud against the Commonwealth 2009–10 annual report to government
services and up to 54 percent infrequently or never conduct risk assessments after the acquisition (Ernst & Young 2010). As such, ongoing development of prevention and management techniques is required in both the public and private sectors to protect revenue, expenditure and property from fraudulent and dishonest activities.
The threat to governments often differs based on whether the fraud is committed by an employee or an external party. Internal and external fraud incidents can be counted as separate phenomena as, except in cases of collusion between internal and external parties, the methods used to carry out attacks and the desired benefits are often different. The benefits obtained through fraud can be either tangible or intangible and the methods used are highly variable. Examples of possible methods used in fraud attempts against government agencies include:
• hacking into, or interfering with, a Commonwealth computer system;
• creating and using a false identity to obtain income support payments;
• using Commonwealth systems to gain access to other systems without authority;
• charging the Commonwealth for goods or services that are incomplete or not delivered;
• hiding or disposing of assets by bankrupts to avoid paying creditors; and
• making false statements under the Commonwealth Electoral Act 1918.
Extent of public sector fraud
There has been little systematic quantitative research undertaken into the nature and extent of the losses that governments have sustained through fraud, other than the AIC’s annual surveys. Although some,
Identity fraud can affect governments through people claiming benefits they are not entitled to or by gaining employment through using a false or fraudulent identity. However, identity frauds inadvertently facilitated by the government can then extend to frauds being committed against the private sector. For example, by fraudulently gaining citizenship or a work visa, perpetrators are then presented with the opportunity to commit fraud against new employers or companies by using the documents and status the government has inadvertently provided. Likewise, identity frauds committed against, or using intellectual property from, the private sector can then provide offenders with the basis from which to defraud the government. Therefore, the risks of fraud against the government operate in two parallel directions, both increasing and being increased by frauds committed against the private sector.
It is difficult to properly characterise such acts and know whether they should be described as crimes of theft, or merely ‘leakage’ of government resources due to poor internal controls. The scale of such conduct also varies considerably from the trivial—an extended lunch break—to the serious—a large-scale revenue fraud. In the private sector it is now accepted that the ‘risk of fraud is part of doing business’ (Kroll 2009: 2) and that ‘fraud is one of the most problematic issues for business worldwide’ (PwC 2007: 4).
While 59 percent of organisations surveyed had policies in place to encourage activities to ensure due diligence of suppliers and business partners, these may not be effective (KPMG 2010). According to survey results, around 25 percent of Australian companies infrequently or never conduct risk assessments on companies before acquiring
Box 2 Excise fraud
A shipment arrived in Australia containing a concealed shipment of 3,000,000 cigarettes, which was not declared. The contents of the shipment were concealed among car batteries to avoid an excise duty payment of $715,200. Australian Customs and Border Protection Service seized the cigarettes on detection and the defendant was charged with one count of dishonestly causing a loss to the Commonwealth. Further, the defendant had used a false name in the organisation of the offence to avoid detection. The defendant pleaded guilty and was sentenced to two years imprisonment to be released forthwith on condition that he be of good behaviour for two years.
Source: CDPP 2010

11Introduction
The ninth KPMG biennial fraud survey in 2010 isolated the public sector responses, which provided a snapshot of the prevalence of fraud in the public sector. Based on the responses provided, total public sector loss was estimated to be more than $15.6m, which only represented five percent of the total fraud estimated across all sectors in the reporting period (KPMG 2010).
At an international level, the NFA (2010) attempted to estimate the cost of fraud in the United Kingdom, concluding that in 2009–10 national public sector losses in the United Kingdom were conservatively estimated at £38.4b per annum, which equated to £621 per adult of the United Kingdom population. This figure took into account, the public (£21.2b) and private sectors (£12b), and individual (£4b) and charity sector (£1.3b) frauds (NFA 2011:7).
At a local level in the United Kingdom in 2008–09, public sector losses were estimated at £21.2b per annum, which was a significant increase from the 2008–09 estimates of £17.6b (NFA 2010). Public sector frauds were broken down as follows:
• £15 b in tax fraud;
• £1.5b in fraud relating to benefits and tax credits;
• £2.1b in frauds against local government; and
• £2.6b in frauds against central government (NFA 2011:7).
Although not costing as much as in the United Kingdom, public sector fraud in Australia is considerable, costing the Australian Government almost half a billion dollars in 2009–10, as reported below. It appears, however, that the extensive fraud control measures adopted in recent years might be starting to pay dividends, with reported fraud declining in Australia in recent years.
but by no means all, agencies record information on the extent of fraud for their own internal fraud control purposes, they rarely share this information publicly. Often all that is known is what is mentioned in brief summaries provided in annual reports or media reports of cases involving prominent figures. Many governments would prefer that their fraud experiences are never made public to avoid criticism for not having appropriate preventive measures in place. The problem was described in the United Kingdom as follows:
Fraud is massively underreported. Fraud is not a national police priority, so even when reports are taken, little is done with them. Many victims therefore don’t report at all. So, the official crime statistics display just the tip of the iceberg, and developing a strategic law enforcement response is impossible because the information to target investigations does not exist (Attorney-General’s Office 2006: 7).
The United Kingdom National Fraud Authority (NFA) highlighted in its National fraud indicator report the importance of disseminating information on fraud in the public domain to enhance the understanding of it, as highlighted below:
Although the figure is significant in its own right, providing an unmistakable indicator of how serious an issue fraud is for the United Kingdom, it serves a wider purpose. It enables the counter-fraud community ... to better target its approach to tackling fraud. It provides signposting to fraud trends and hotspots and establishes a benchmark to measure success. It also provides the impetus to encourage industry and government to invest the necessary levels of resource required to combat a crime that deeply affects the public and private sectors and individuals (NFA 2010:3).
12 Fraud against the Commonwealth 2009–10 annual report to government
Methodology
The reference to some of these offences, such as theft and corruption, are open to differing interpretations by agencies in determining the extent to which matters reported involve dishonesty as opposed to other acquisitive property crime.
To mitigate the risk of fraud, some larger agencies run periodic computerised or manual checks to ensure that fraud and other compliance-related activities are identified. As such some of these matters may be defined and treated as regulatory non-compliance rather than criminal fraud and may be excluded from their responses to the annual fraud questionnaire. Centrelink, in particular, faces a high rate of what may be referred to as ‘error or regulatory non-compliance’. Some of the challenges faced by Centrelink and its fraud reporting are described in Box 3.
The definition of fraud was changed in the 2011 edition of the Guidelines to make future data collection more accurate and consistent across agencies. It defines fraud against the Commonwealth as ‘dishonestly obtaining a benefit, or causing a loss, by deception or other means’. The 2010–11 fraud against the Commonwealth questionnaire will make a clear distinction between fraud and non-compliance allowing agencies to disaggregate alleged and actual fraud from other operational regulatory compliance activities.
Quantifying the extent of public sector fraud is complicated owing to perceived differences in what is defined as fraud and what is defined as a breach of regulatory procedures and rules. It is likely that any estimates of fraud incidents will underestimate the true number and cost as there is often a discrepancy between what agencies define as actual fraud compared with other breaches of procedures and laws. The definition of fraud in the Guidelines is broad and includes both minor and suspected incidents of dishonesty.
The 2002 Guidelines define fraud as ‘dishonestly obtaining a benefit by deception or other means’. The definition used in the Guidelines encompasses, but is not limited to:
• theft;
• obtaining property, a financial advantage or any other means by deception;
• causing a loss, or avoiding or creating a liability by deception;
• providing false or misleading information to the Commonwealth, or failing to provide information where there is an obligation to do so;
• bribery corruption or abuse of office;
• unlawful use of Commonwealth computers, vehicles, telephones and other property or services;
• relevant bankruptcy offences; and
• any offences of a like nature to those above.

13Methodology
also made use of data collected by the AIC for the 2007–08 Fraud against the Commonwealth report, to avoid the time and cost required in duplicating responses.
Australian Government agencies are responsible for investigating routine or minor instances of fraud against them or their programs, and all agency investigations must be conducted according to the Commonwealth Fraud Investigation Standards Package. For serious or complex fraud and larger scale matters, the Guidelines assign responsibility for investigation to the AFP and provide criteria for matters to be referred to the AFP, although there is an increasing trend in underreporting fraud incidents to authorities detected internally by Australian Government agencies.
Previous fraud surveys and resultsAustralian National Audit Office
The Australian National Audit Office has conducted three surveys (ANAO 2010, 2004, 2000) of Australian public sector agencies to determine the nature of their fraud control arrangements. Surveys were sent to 150 agencies in 1999, 160 agencies in 2002 and 173 agencies in 2009. Responses were received from 114 agencies in the 1999 survey (76%), 158 agencies (99%) in the 2002 survey and 160 agencies (92%) in the 2009 survey—although only 155 were included in the analysis in 2009. For the purpose of the 2009 ANAO report, the ANAO
Box 3 Centrelink fraud reporting
Centrelink is one of Australia’s largest public sector agencies, serving a sizable customer base of 7.02 million people. In 2009–10 it provided $84.2b in payments to Australians. As such, Centrelink may be seen as an attractive target for those seeking to defraud the Australian Government. In response, Centrelink has a number of measures in place to manage the risk of fraud, including:
• identity checks;
• data-matching information held by Centrelink with information from other agencies or organisations;
• public tip-offs;
• inter-agency compliance activities;
• data analysis and data mining; and
• customer reviews based on their circumstances, duration of payments or a specific event.
Centrelink maintains a relationship with key investigation agencies, the Australian Crime Commission and the Australian Federal Police and applies an intelligence-led model by assessing cases against criteria to determine the relative seriousness and priority of potential investigations. This results in improved targeting of cases for investigation and review. Centrelink also links in with other agencies and builds on existing relationships to improve intelligence-led investigations and outcomes. These relationships also facilitate data matching between key customer service-based agencies. Centrelink can detect incorrect payments by matching data with a number of other agencies, such as the Australian Taxation Office, Department of Veterans’ Affairs, Department of Immigration and Citizenship, Department of Corrective Services and the Registrar-General’s Office.
In 2009–10, Centrelink undertook 3.5 million eligibility and entitlement reviews, which that resulted in 613,498 payments being cancelled or reduced and generated customer debts totalling $486m. These reviews represent the total number of incidents of customer non-compliance identified by Centrelink for the year, a proportion of which entail criminal acts of dishonesty.
Centrelink also makes use of the Australian Government Services Fraud Tip-off Line, which receives reports of suspected fraud against Centrelink, Medicare, the Pharmaceutical Benefits Scheme or the Child Support Program. In 2009–10, based on tip-offs alone, Centrelink conducted 43,726 customer entitlement reviews, which resulted in $101.8 million in debts and savings.
In relation to incidents of serious non-compliance or fraud in 2009–10, Centrelink reviewed and investigated 24,517 suspected incidents of fraud worth approximately $76m. Of these, 4,608 cases of serious non-compliance or fraud were referred to the Commonwealth Director of Public Prosecutions for consideration for prosecution in 2009–10. Of these, 3,461 Centrelink cases were prosecuted, with a successful conviction rate of 99.3 percent and only 25 acquittals.
The current Fraud against the Commonwealth 2009–10 annual report to government incorporates data on the 613,498 customer payments examined by Centrelink during the year, rather than only the 24,517 incidents for the organisation of suspected fraud actually investigated. A large proportion of the Centrelink matters included in this annual report have, following investigation, been found not to entail acts of criminal fraud. They are, however, included in this report to provide an indication of how potential acts of dishonesty are dealt with by the Australian Government.
Source: Centrelink (2010: 72).

14 Fraud against the Commonwealth 2009–10 annual report to government
agencies were defining fraud as specified in the Guidelines (ANAO 2010). However, the ANAO did not investigate how agencies categorised various dishonest practices as falling or not falling within the guidelines’ definition of fraud. This, of course, is the critical question in determining whether agencies are acting uniformly in reporting the same kinds of incidents of dishonesty when responding to the survey.
Based on the trends reported in the three ANAO reports, it is apparent that Commonwealth agencies reported experiencing a greater incidence of both internal and external fraud, generating an increased financial loss over time. The current Fraud against the Commonwealth report and AIC reports for the preceding two years, however, show an overall decline in the incidence and cost of fraud against the Commonwealth. Based on the findings of the 2009 ANAO Fraud control in Australian Government agencies report, the ANAO recommended that:
1. The Attorney-General’s Department, in its review of the Commonwealth Fraud Control Guidelines, should take the opportunity to:
• consult with the AIC and consider approaches, including a more precise definition of fraud that will allow the AIC to collect, analyse and disseminate fraud trend data on a consistent basis;
• continue to work with the Department of Finance and Deregulation to clarify which CAC Act bodies are subject to the Guidelines; and
• consider the merits of establishing an approach for the provision of fraud control advice and information to Australian Government agencies, particularly to smaller sized agencies, that facilitates the provision and exchange of practical fraud control advice (ANAO 2010: 26–27).
2. Agencies should reassess their fraud risks and, where appropriate, the effectiveness of existing fraud control strategies, when undergoing significant change in role, structure or function, or when implementing a substantially new program or service delivery arrangements.
Both these recommendations have been examined by AGD in its review of the Fraud Control Policy in 2011 and have led to a revision of the AIC’s survey instruments for 2011.
Statistics have been included in ANAO reports to determine the extent to which allegations of fraud were investigated and referred for prosecution by the AFP, the CDPP and other investigation agencies. In 2001–02, 762 cases were referred to police or other agencies, 4,270 cases were referred to the CDPP, 3,282 cases were prosecuted by the CDPP and 3,195 cases that were prosecuted were proved (ANAO 2004). To gauge the methods of detecting fraud in its 2009 survey, the ANAO asked agencies whether they had implemented mechanisms to deal with fraud allegations made by members of the public, to which 69 agencies (45%) responded positively (ANAO 2010). To determine the extent to which allegations of fraud were investigated, in the 2009 survey the ANAO asked whether agencies had established procedures and guidelines to conduct fraud investigations in line with the Australian Government Investigation Standards (AGIS), to which 94 percent of FMA Act agencies and 75 percent of CAC Act agencies responded positively (ANAO 2010).
In relation to fraud prosecution, the ANAO asked agencies whether they had documented the reasons for not referring a brief of evidence to the CDPP, to which 88 percent of FMA Act agencies and 77 percent of CAC Act agencies responded positively (ANAO 2010). Between 2002 and 2009, the ANAO found a general level of improvement in agencies’ compliance with fraud prevention activities, including the use of policy statements, risk assessments and control plans (ANAO 2010). Despite this improvement, the ANAO found that of the 54 percent (n=155) of respondent agencies that indicated that they had conducted an evaluation into the effectiveness of their fraud prevention or detection strategies, evidence of these evaluations was only received from 12 percent of agencies (ANAO 2010).
The ANAO echoed the AIC’s findings that an ongoing issue in collecting comparable fraud data is the inconsistent use of fraud definitions:‘The integrity of such trend information is contingent upon common definitions for fraud’ (ANAO 2010: 14).
The ANAO found that 97 percent of respondent agencies reported that they used the definition of fraud as specified in the Guidelines (ANAO 2010). This represents a marked improvement since 2002, when the ANAO reported that only 50 percent of

15Methodology
AIC 2006–07 survey
The AIC prepared the annual fraud report for the first time in 2007, which included incidents dealt with in the 2006–07 financial year. The online survey had a 92 percent response rate, which equated to 158 agencies. This was the highest response rate since the annual fraud report began.
Of the contributing agencies, 36 percent indicated they had experienced at least one type of fraud in 2006–07, meaning that almost two-thirds of agencies did not report any fraud incidents. In total, there were 124,908 alleged incidents of fraud reported in the survey, with the most common fraud type identified as ‘obtaining property, financial advantage or any other benefit by deception’ (44%, n=55,576). Similar to the findings of AGD in 2005–06, it was found that the majority of fraud incidents were experienced by only a small number of agencies. Just two agencies accounted for 87 percent (n=108,974) of the suspected incidents. The agency with the most incidents identified 86,204 (69%) incidents, followed by an agency with 22,770 (18%) incidents.
Another key finding was that the majority of incidents were committed by offenders external to the agency. For incidents in which the offender was known, an external person accounted for 65 percent of offenders.
Agencies calculated the loss from fraud at $34,338,866 for all incidents where a figure could be quantified (n=2,594 incidents). Of this, external offenders were estimated to be responsible for 95 percent ($32,502,755) of reported losses. The amount recovered by agencies was significantly lower than the amount lost. Agencies reported that $8,188,749 had been recovered from those alleged to have committed fraud against the Commonwealth.
AIC 2007–08 survey
In 2008, after consultation with the Fraud Liaison Forum Steering Committee and participating Australian Government agencies, the AIC made major changes to its online survey to assist agencies with reporting requirements. Respondents were able to complete the survey online during August and September 2008, with each agency receiving an individual logon and password to ensure confidentiality
Attorney-General’s Department Commonwealth Fraud Control Guidelines annual report
Pursuant to paragraph 8.13 of the 2002 Guidelines, all Australian Government agencies governed by the Financial Management and Accountability Act 1997 (FMA Act) and those governed by the Commonwealth Authorities and Companies Act 1997 (CAC Act) that receive at least 50 percent of funding from the Australian Government or an Australian Government agency are required to report on fraud and fraud control.
Australian Government agencies that do not fall within these criteria are not required to report but are encouraged to do so and to comply with all aspects of the Guidelines. Each year, the number of agencies invited to participate differs slightly from the number that respond due to new agencies being created and others being removed or amalgamated. Each year a small number of agencies also choose not to participate for various reasons, including interests of national security. Of the agencies that respond, some are excluded from the analysis because they do not fall under the FMA Act or CAC Act eligibility criteria.
The AIC took over responsibility from the Attorney-General’s Department (AGD) for collecting fraud information from Australian Government agencies in 2006–07. In 2005–06, the last year in which AGD had responsibility for reporting, responses were received from 128 Australian Government agencies reporting 113,704 alleged incidents of fraud. Overwhelmingly, just three agencies reported the majority of incidents, accounting for 104,055 allegations (92%). There was a discrepancy in the estimates of the value and number of frauds from the agencies and the AFP. Agencies reported an initial estimated value of fraud at $121,500,322, while the AFP estimated the value of the 422 cases they investigated at $454,183,271. Recoveries amounting to $28,732,736 were reported by 30 agencies.
These figures differed somewhat from the statistics provided in AFP and CDPP annual reports for 2005–06. The reason for these differences lies in the categories of fraud and economic crime used and the counting rules adopted by each agency.

16 Fraud against the Commonwealth 2009–10 annual report to government
Of the 149 agencies in the final sample, 39 percent (n=58) reported that they had experienced at least one incident of fraud between 1 July 2008 and 30 June 2009. Of these, 32 percent (n=48) reported having experienced at least one incident of internal fraud, while 30 percent (n=45) experienced at least one incident of external fraud and 23 percent (n=35) experienced both internal and external fraud. There was a total of 800,698 reported incidents of fraud for 2008–09. Of these, however, 90% (n=720,000) were reported by one large agency. These frauds consisted of 3,371 internal frauds and 797,327 external frauds. Only 10 agencies (7%) reported incidents involving collusion between internal and external individuals.
In 2008–09, 23 agencies that experienced internal or external fraud reported suffering a financial loss from these incidents (39%). The total loss for the reporting period was close to $600m, mostly attributable to losses from external fraud, which was reportedly almost $489m. These Commonwealth funds were primarily lost through the category of ‘financial benefits’ in both external and internal fraud. Of the total amount lost, in 2008–09 only 10 percent of internal frauds lost and 12 percent of external frauds could be recovered. Although the total number of fraud incidents declined by eight percent compared to 2007–08, the reported losses increased by 1.4 percent. Almost all of the increased losses were due to external fraud.
The AIC online survey 2009–10The AIC sent an invitation to complete the 2009–10 questionnaire to 191 Australian Government agencies and received completed responses from 175 agencies. This was reduced to 152 after removing those agencies not covered by the FMA Act or CAC Act criteria of eligibility. The revised total number of respondents included in the analysis (n=152) represented 80 percent of those invited to participate. Of these, 103 (68%) were FMA Act agencies and 49 (32%) were CAC Act bodies. The proportion of agencies governed by these two Acts was the same in 2008–09 and 2009–10 (FMA Act=68% in both years and CAC Act= 32% in both years).
of responses. Agencies were also given the option of responding via a paper version of the survey from which the data were then transferred to the electronic version by the researchers.
In 2007–08, 139 agencies responded out of the 170 invited to participate in the survey. Of these, 97 were FMA Act agencies and 42 were CAC Act bodies receiving at least 50 percent funding from the Government.
Forty-five percent of agencies reported experiencing at least one incident during 2007–08, which represented an increase of around nine percent from 2006–07. The total number of fraud incidents reported by agencies in 2007–08 was 873,401. Of these, 3,239 were internal fraud incidents and 870,162 were external fraud incidents. Further, 25 percent of responding agencies experienced both internal and external incidents in 2007–08. The reason for the large increase in the number of incidents between 2006–07 and 2007–08 was the changed definition of fraud that agencies were asked to use. In particular, large agencies reported more incidents of external fraud than in the past.
Of the 139 agencies, 47 quantified a loss from either internal or external fraud. Of these, 30 identified internal fraud and 34 identified external fraud. These frauds reportedly resulted in a total financial loss of $446,715,351, which represents $444,733,676 lost to external fraud and $1,981,675 lost to internal fraud. These large increases from the preceding year were again due to the different definition of fraud used by respondents.
The AIC online survey 2008–09
Few revisions were made to the 2008–09 survey from that used in 2007–08, so the data reported could be used for comparative trend analysis. The survey had the highest number of participating agencies recorded—84% of the 177 agencies surveyed with 166 completed responses. Seventeen responses were discarded because they were either incomplete or the agency did not meet the 50 percent funding requirement for CAC Act agencies. This left 149 agencies’ responses subject to analysis—101 (68%) FMA Act agencies and 48 (32%) CAC Act bodies.

17Methodology
another agency). In making comparisons between the two years, therefore, it is apparent that the vast majority of responses came from the same agencies each year.
Minor changes were present between the 2008–09 and 2009–10 versions of the survey, although it was possible to make comparisons for most of the questions asked. The 2008–09 questionnaire is included in Appendix 1, although formatting changes differ somewhat from the online version agencies completed.
The summary statistics concerning the participating agencies for 2008–09 and 2009–10 are shown in Table 1.
In 2009–10, of the 152 agencies whose responses were analysed, the responses of 139 (89%) agencies were also analysed in 2008–09. The 16 agencies whose responses were analysed in 2009–10 but which were not included in the 2008–09 census included only four who reported a total of 70 instances of fraud in 2009–10 (37 incidents from one agency, 30 from another, two from another and one from
Table 1 Participating agencies in 2008–09 and 2009–10 surveys
2009–10 survey 2008–09 survey
n % n %
Invited to participate 191 100 177 100
Responded 175 91.6 166 93.8
Included in analysis 152 79.6 149 84.2
FMA Act agencies 103 53.9 101 57.1
CAC Act agencies 49 25.7 48 27.1
Note: Percentages are of those invited to participate
Source: Commonwealth fraud surveys 2008–09 and 2009–10 data [AIC computer file]

18 Fraud against the Commonwealth 2009–10 annual report to government
Results for 2009–10
In the 2009–10 survey of Commonwealth agencies, agencies were asked to include alleged incidents of fraud—either discovered by the agency or allegations of fraudulent behaviour reported to the agency. Agencies were asked to use the definition of fraud contained in the Commonwealth Fraud Control Guidelines 2002: dishonestly obtaining a benefit by deception or other means, including:
• theft;
• obtaining property, financial advantage or any other benefit by deception;
• causing a loss, or avoiding or creating a liability by deception;
• providing false or misleading information to the Commonwealth, or failing to provide information where there is an obligation to do so;
• making, using, or possessing forged or falsified documents;
• bribery, corruption, or abuse of office;
• unlawful use of Commonwealth computers, vehicles, telephones and other property or services;
• relevant bankruptcy offences; and
• any offences of a like nature to those listed above.
In responding to the survey, agencies contributed information on incidents of fraud allegedly
perpetrated internally (by public servants and contractors engaged by the government) and externally (by members of the public). Questions relating to incidents of internal fraud and external fraud were separated to allow for analysis of different risk factors and methodologies associated with the two classes of perpetrator.
The survey was designed to maximise information available on actual fraud types and methods. As such, agencies were asked to report a single incident in multiple categories, where applicable, which meant that for some of the data reported, the total number of responses exceeded the total number of incidents owing to some individual incidents entailing multiple types of fraud or methods. For each table, the total number of responses is indicated.
Agency informationOf the 152 agencies whose responses were analysed, most were governed by the FMA Act (see Figure 1). The proportion of agencies governed by these two Acts was the same in 2009–10 as in 2008–09 (FMA Act=68%, n=103 and CAC Act at least 50%=32%, n=49). There was only an increase of two FMA Act agencies and one CAC Act agency in 2009–10.

19Results for 2009–10
not specifically related to fraud (Table 2). According to the Guidelines, risk assessments are required to be completed every two years. On the basis of the specific responses given, there was a slight decline in the number of agencies undertaking risk assessments in 2009–10 compared with 2008–09. According to the Ernst & Young’s global fraud survey (2010), which covers both the private and public sectors, only six percent of Australian respondents
Fraud controlNearly all agencies (88%, n=133) indicated that they had completed a fraud risk assessment within the previous two financial years, with 62 percent (n=94) undertaking a risk assessment in 2009–10. Only two percent of respondents (n=3) indicated that they had never conducted a fraud risk assessment, although they might have undertaken general risk assessments
Figure 1 Respondents by type of agency governance (number and percentage of agencies)
0
20
40
60
80
100
120 CAC 50%FMA
%n%n2009–10 2008–09
103
49
68
32
101
48
68
32
Source: Commonwealth fraud survey 2009–10 data [AIC computer file]
Table 2 Date of most recent fraud risk assessment (2008–09 and 2009–10)
Period
2009–10 survey 2008–09 survey
n % n %
Current financial year 94 62 95 64
Previous financial year 39 26 41 28
Two years ago 10 7 4 3
More than two years ago 6 4 6 4
Never had a fraud risk assessment 3 2 3 2
Total 152 100 149 100
Source: Commonwealth fraud survey 2009–10 data [AIC computer file]

20 Fraud against the Commonwealth 2009–10 annual report to government
Agency reporting of fraud incidentsA similar percentage of agencies reported experiencing at least one incident of fraud in 2009–10 as in 2008–09 (n=61 of 152 respondents, 40% in 2009–10 compared with n=58 of 149 respondents, 39% in 2008–09). Of the 152 agencies that responded to the 2009–10 survey, 47 (31%) indicated that they had experienced at least one incident of internal fraud during this time. Of these, 37 were FMA Act agencies and 10 were CAC Act bodies (Figure 2).
In relation to external fraud, 51 (34%) agencies reported experiencing at least one incident of external fraud during 2009–10; 40 were FMA Act agencies and 11 were CAC Act bodies (Figure 2). The number of agencies reporting external fraud increased by four percent between the 2008–09 (n=45, 30%) and the 2009–10 reporting periods. That more fraud was reported by FMA Act agencies than CAC Act agencies may be because CAC Act agencies tended to be smaller government bodies dealing with smaller sums of money, thus making them less attractive to external and internal fraud offenders. Other explanations might relate to differences in counting rules within agencies. Larger agencies may also have specialised fraud sections with enhanced detection and investigation capabilities.
Incidents of fraud
The total number of fraud incidents reported for 2009–10 was 705,942. This represented a 12 percent reduction in the number of incidents
had never undertaken a fraud risk assessment, far better than the global average of 15 percent.
Similarly, nearly all agencies (88%, n=134) had completed a fraud control plan within the previous two financial years, with 56 percent (n=85) completing a plan in 2009–10. Two percent of responding agencies (n=3) had never completed a fraud control plan (Table 3).
Revisions to the survey instrument in 2011 will clarify the type of risk assessments and plans agencies use and will enable agencies that embed their fraud prevention policies and activities in more general agency-wide risk management arrangements to report this fact clearly.
Fraud incidentsA fraud incident, for the purposes of the survey, was defined as:
‘All counts alleged against a single accused person during one investigation and might comprise a number of counts of offences that are actually prosecuted. An incident may take place on a single date, or over a period of time.’
The survey divided fraud into two distinct categories—internal fraud and external fraud. Internal fraud was defined as ‘any incident of suspected fraud allegedly committed by an employee or contractor of the agency’. External fraud was defined as ‘any incident of suspected fraud allegedly committed against the agency by a person other than an employee or contractor of the agency’.
Table 3 Date of most recent fraud control plan (2008–09 and 2009–10)
2009–10 survey 2008–09 survey
n % n %
Current financial year 85 56 93 62
Previous financial year 49 32 39 26
Two years ago 10 7 8 5
More than two years ago 5 3 7 5
Never had a fraud control plan 3 2 2 1
Total 152 100 149 100
Source: Commonwealth fraud survey 2009–10 data [AIC computer file]

21Results for 2009–10
Other agencies reported more fraud incidents than in the preceding year. One agency’s experience of fraud increased by 41 percent from 2,594 incidents in 2008–09 to 3,659 in 2009–10, while another reported an increase in fraud incidents of 178 percent from 197 in 2008–09 to 547 in 2009–10 (11% increase). Factors that could be responsible for these large changes may be changes in reporting practices. For example, some agencies may include allegations of non-compliance with regulatory measures in their reporting of fraud. The survey in 2010–11 asks agencies to identify non-compliance separately from actual fraud, thus clarifying this aspect of the survey. Other changes in reporting practices may include significant changes to agencies’ roles, structures or functions, or agencies
reported in 2008–09, which totalled 800,698 incidents. Analysis showed that 90 percent of the frauds reported in 2008–09 were reported by one large agency, which experienced nearly 720,000 incidents of external fraud. In 2009–10 this large agency reported 104,175 fewer fraud incidents than in 2008–09 (719,326 incidents in 2008–09 and 615,151 in 2009–10, a reduction of 14.5%). In 2009–10, however, the fraud counting rules within this agency changed, which could have contributed to the large reduction in the number of incidents reported. Two other agencies reported substantial reductions in frauds experienced—one from 1,491 incidents in 2008–09 to 1,240 in 2009–10 (17% reduction), and the other from 921 in 2008–09 to 646 in 2009–10 (30% reduction).
Figure 2 Fraud experience by type of agency governance (percentage of agencies)
External NoExternal YesInternal NoInternal Yes
0
20
40
60
80
100
CAC 50%FMA
77
63
78
63
21
37 37
Table 4 Agency experience of fraud incidents, by type of perpetrator (number of agencies)
Any external incident
Any internal incident No Yes Total
No 91 14 105
Yes 10 37 47
Total 101 51 152
Source: Commonwealth fraud survey 2009–10 data [AIC computer file]

22 Fraud against the Commonwealth 2009–10 annual report to government
between one and 10 employees, seven agencies either had zero employees or did not respond. Some agencies reported zero staff if they were managed by larger agencies and therefore did not have any specific staff operating within that agency.
Agency size was found to be statistically related to agency experience of fraud. Agencies were grouped into three categories according to size: up to 500 employees, 501 to 1000, and more than 1000. It was found that the group with up to 500 employees was significantly less likely to have reported incidents of fraud in 2009–10 compared with the other two groups (Figure 3). In contrast, the category of agencies with more than 1,000 employees was significantly more likely to have experienced fraud (n=31, 94%, df=2, χ2 =66.0, p<0.001). Cramér’s V of 0.66 indicated that there was a strong association between the size of the agency and reported incidents of fraud. Furthermore, only 8 (5%) agencies that reported having more than 500 employees did not report any fraud incidents. These findings indicate that smaller agencies were less likely to report having experienced fraud incidents than agencies with more than 500 employees.
taking on new programs or service delivery functions. Alternatively, human or system error may have contributed to the changes detected. Further in-depth analysis with the agencies would be required to explore each of these factors.
Twenty-four percent of responding agencies experienced both internal and external incidents in 2009–10, representing a one percent increase from the 2008–09 findings. Agencies that experienced one type of fraud (either internal or external) were significantly more likely to also experience the other type (χ2=62.3, df=1 p<0.001). Cramér’s V of 0.64 indicated that there was a strong level of association between these two variables. Table 4 shows the number of agencies that experienced each type of fraud in 2009–10.
Agency size and fraudIn 2009–10, agencies reported having between no staff and 81,366 full-time equivalent (FTE) employees (including ongoing staff, non-ongoing and other staffing categories). Fifteen agencies reported having
Figure 3 Incidence of fraud, by agency size (percentage of agencies)
Fraud not experiencedFraud experienced
0
20
40
60
80
100
More than 1000501–1000Up to 500
13
55
85
20
1
a: employees included both permanent and employees on a non-ongoing contract; 62 agencies experienced fraud with six reported having zero staff
Source: Commonwealth fraud survey 2009–10 data [AIC computer file]

23Results for 2009–10
Internal fraudRespondents were asked to report on two aspects of internal fraud incidents—the ‘focus’ or the benefit that was being sought and the ‘method’ used to carry out the alleged activity. It was anticipated that by collecting data in both ways the survey would highlight the types of fraud that affected agencies as well as the methods being used. This information could then be used to create better fraud prevention strategies across all Australian Government agencies.
Focus of internal fraud incidents
The five categories of focus were equipment, entitlements, information, financial benefits, and ‘other’ for any incidents relating to a benefit that did not fall into one of the four defined subcategories.
If a respondent agency answered ‘yes’ to experiencing any incidents relating to a category of fraudulent benefit, that agency was required to specify what the incident had involved. For example, if an agency stated that it had experienced fraud focused on ‘entitlements’, it was then asked about whether the fraud involved false travel claims or payroll fraud etc. Within each subcategory there was also an option to state that the nature of the specific incident could not be determined. This was used in cases in which it was known that an incident of that general category had occurred, but there was insufficient information to define the exact nature of the fraud.
The survey assessed both the number of agencies affected by each fraud category and the total number of incidents reported, regardless of how many agencies reported them. From previous results, it was expected that there would be a
Agency fraud control sectionsInformation was also gathered on the size and composition of fraud control sections within agencies and how this related to fraud experiences. Fifty-three percent of respondents indicated they had at least a part-time employee in their agency dedicated to fraud control, which represented a large reduction from 2008–09 when 62 percent of respondents reported having at least one employee dedicated to fraud control.
Overall, it was found that agencies with a dedicated fraud control section were significantly (χ2 =29.9, df=1, p<0.0001, Cramér’s V of 0.44—indicating a low level of association) more likely to have reported fraud incidents than those without such a section. This finding, however, differed depending on whether internal or external fraud was involved. Table 5 shows that a higher percentage of agencies that reported experiencing external fraud had a fraud control section than agencies experiencing internal fraud. The level of association between the variables of experience of fraud and presence of a fraud control section was generally weak, as indicated by the Cramér V figure showing a higher level of association as it approaches 1.0.
Another factor considered was the size of the agencies that had a fraud control section, as agency size has been shown as an important factor in reported victimisation, with larger agencies more likely to report experiencing fraud. Larger agencies (over 1,000 employees), which represented only 22 percent of all agencies, were more likely to have a fraud section (88%). This was slightly fewer than in 2008–09 (93%).Those agencies with fewer than 500 employees were least likely to have a dedicated fraud section (41%). This was lower than in 2008–09, when 50 percent of such agencies had a dedicated fraud section.
Table 5 Experience of fraud by agencies with a fraud control section (% of agencies)
Internal External Any
Yes (Fraud control section) 47* 52** 60***
No (No fraud control section) 53 48 40
All 100 100 100
*(χ2 =20.8, df=1, p<0.0001, Cramér’s V = 0.37)
** (χ2 =26.0, df=2, p<0.0001), Cramér’s V = 0.41)
*** (χ2 =29.9, df=1, p<0.0001), Cramér’s V = 0.44)
Source: Commonwealth fraud survey 2009–10 data [AIC computer file]

24 Fraud against the Commonwealth 2009–10 annual report to government
Although fraud focusing on obtaining ‘financial benefits’ was the category of internal fraud experienced by the greatest number of agencies (n=30, 20%), fraud focused on ‘information’ was the most frequently reported type of internal fraud (n=1,080, 36%), (Figure 5). Fraud relating to ‘obtaining or using personal information without authorisation’ accounted for 29 percent of all internal fraud reports (n=869 out of 3,001 reported incidents).
Methods of committing internal fraud
In addition to collecting information on types of alleged fraud, the survey examined the methods used to carry out internal fraud. The data from questions about fraud methods were analysed by counting the number of agencies affected by a particular type of fraud method as well as the methods used in most incidents. Fraud involving the ‘misuse of documents’ affected the largest proportion of agencies, with 16 percent (n=24) of agencies reporting each of these activities (Figure 6).
The category with the highest number of incidents that employed particular fraud methods, as was the
difference in the distribution of fraud types by size of problem. That is, the type of fraud experienced by those reporting large numbers of incidents was expected to differ from those reporting fewer incidents. In total, 31 percent of agencies (n=47) experienced at least one internal fraud incident in 2009–10. The largest proportion of agencies (n=30, 20%) reported fraud that involved obtaining ‘financial benefits’ followed by fraud focused on obtaining ‘equipment’ (n=27, 18%), ‘entitlements’ (n=25, 16%), ‘information’ (n=22, 14%) and ‘other’ (n=5, 3%). See Figure 4.
For the various types of internal fraud focus, it was found that ‘leave and related entitlements’ was the type of fraud that affected the greatest number of agencies (n=19), followed by ‘misuse of government equipment’ (n=15) (see Table 6). Interestingly, ‘misuse of government equipment’ was a new category for 2009–10 and was shown to be an area of concern. In the ‘other’ category, one agency reported internal fraud involving ‘assisting customers to circumvent controls’ in 293 cases, while another agency reported 20 incidents relating to ‘damage of government property’.
Figure 4 Agency experience of internal fraud, by focus (% of agencies)
0
5
10
15
20
25
OtherFinancial benefitsInformationEntitlementsEquipment
18
16
14
20
3
Source: Commonwealth fraud survey 2009–10 data [AIC computer file]

25Results for 2009–10
Table 6 Internal fraud, by focus of incident (number of agencies and incidents)
Focus of fraud Agencies Mean Total incidents
Equipment
Theft of telecommunications or computer equipment (not including mobile devices)
13 6 72
Theft of other government equipment 7 11 76
Theft of consumable stock (office related) 5 1 5
Theft of consumable stock (other) 5 5 26
Misuse of government equipment 15 8 118
Unable to be determined 1 1 1
Other equipment 4 1 5
Entitlements
Expenses (other than travel) 5 1 5
Travel claims 11 2 27
Payroll fraud 7 4 25
Leave and related entitlements 19 6 119
Unable to be determined 1 2 2
Other entitlements 5 64 320
Information
Obtaining or using information without authorisation (excluding personal information)
10 11 110
Obtaining or using personal information without authorisation 8 109 869
Providing false or misleading information, or failing to provide information when required to do so
12 6 75
Use of agency logo or name without authorisation 6 2 13
Misuse of agency intellectual property 5 1 5
Unable to be determined 1 2 2
Other information 2 3 6
Financial benefits
Obtaining cash/currency without permission (including theft of petty cash) 13 5 63
Misuse or theft of government credit cards, travel cards or other cash cards 14 6 90
Misuse or theft of Cabcharge 9 5 43
Theft of property other than cash 7 4 28
Procurement offences 5 2 11
Bankruptcy offences (including hiding or disposing of assets) 0 0 0
Falsification of document in order to gain financial benefit 12 5 63
Unable to be determined 0 0 0
Other financial benefits 4 4 14
Source: Commonwealth fraud survey 2009–10 data [AIC computer file]

26 Fraud against the Commonwealth 2009–10 annual report to government
Figure 5 Internal fraud by focus of incident (% of incidents)
0
10
20
30
40
50
Other fraudsFinancial benefitsInformationEntitlementsEquipment
10 10
36
10 11
Source: Commonwealth fraud survey 2009–10 data [AIC computer file]
Figure 6 Internal fraud, by method of commission (% of agencies)
0
5
10
15
20
25
Other methodsCorruptionMisuse of documentsMisuse of IDMisuse of IT
13
5
16
13
9
Source: Commonwealth fraud survey 2009–10 data [AIC computer file]

27Results for 2009–10
Table 7 Internal fraud, by method of commission (number of agencies and incidents)
Method type Agencies Meana Total incidents
Misuse of information technologies
Accessing information or programs via a computer without authorisation 8 150 1,011
Copying or altering data or programs without authorisation 7 5 34
Misuse of email 8 4 35
Manipulation of a computerised accounting system 4 1 4
Insertion of malicious code 0 0 0
Interference with computer networks 1 6 6
Unable to be determined 0 0 0
Other misuse of IT 6 6 34
Misuse of identity
Creating and/or using a fictitious identity 1 1 1
Use of another employee’s or contractor’s identity without their knowledge 2 2 3
Fraudulently using another person’s identity with their permission 2 2 3
Unauthorised use of another person’s password, PIN, or access pass 3 2 5
Unauthorised use of another person’s Tax File Number or Australian Business Number 0 0 0
Unable to be determined 1 1 1
Other misuse of ID 2 1 2
Misuse of documents
Creating and/or using a false or altered agency document 16 8 125
Creating and/or using a false or altered document (not belonging to the agency) 14 3 38
Dishonestly concealing documents 0 0 0
Failing to provide documents when required to do so 2 24 48
Unable to be determined 2 16 32
Other misuse of documents 4 3 11
Corruption
Bribery of an employee 3 16 48
Accepting kickbacks or gratuities 6 2 9
Failure to disclose/abuse of a conflict of interest 11 31 342
Collusion or conspiracy 4 6 23
Abuse of power 13 3 45
Unable to be determined 3 31 92
Other corruption 2 122 243
a: Mean per agency with an incident
Source: Commonwealth fraud survey 2009–10 data [AIC computer file]

28 Fraud against the Commonwealth 2009–10 annual report to government
Not all agencies that experienced internal fraud reported a financial loss as a result of the incident(s). While 31 percent (n=47) of agencies experienced internal fraud, only 16 percent of all agencies (n=25), or 53 percent of agencies that experienced an internal fraud incident, specified a loss from internal fraud. Further, 34 percent (n=16) of those that experienced internal fraud were unable to calculate their losses or were unwilling to report such losses.
The internal fraud type that resulted in the largest financial loss to Australian Government agencies was ‘fraud relating to entitlements’, with over $1.2m dollars lost in this way (Table 8). This type of fraud resulted in a loss for nine percent of all agencies (n=14), with an average loss of more than $91,000 for each agency affected. The financial losses experienced as a result of internal fraud in 2009–10 differed somewhat from the findings in 2008–09. The number of agencies affected was similar across the different methods of commission, although the total loss for ‘financial benefits fraud’ was less in 2009–10 at $375,853 than the $684,663 reported in 2008–09. Financial losses due to ‘corruption’ increased from nil in 2008–09 to $3,800 in 2009–10.
The total amount lost for each fraud type against the percentage of agencies that experienced internal fraud incidents is presented in Figure 6. With the exception of ‘fraud relating to entitlements’ there was no relationship between the number of agencies reporting incidents and the amount lost for each fraud type.
It is important to note that fraud incidents can have a non-financial impact on agencies, and a small financial loss can be associated with a significant non-financial impact. In total, 23 agencies reported a loss from internal fraud that could not be quantified (Table 9). Taking into account the difficulties associated with calculating fraud losses, it is clear that the figures of estimated loss in this report considerably underestimate the actual internal fraud losses incurred by Australian Government agencies in 2009–10.
Recoveries
Only 32 percent (n=15) of agencies that experienced internal fraud recovered money from these incidents. The amounts recovered by agencies were diverse,
case in the 2008–09 survey, was ‘accessing information or programs via a computer without authorisation’ (n=1,011). The number of reported incidents in this category, however, was much smaller than in 2008–09 (n=1,816). ‘Failure to disclose/abuse of a conflict of interest’ ranked second in frequency of reported incidents (n=342). The largest number of agencies (n=16) experienced ‘creating and/or using a false or altered agency document’, followed by ‘creating and/or using a false or altered document (not belonging to the agency)’ (n=14) (Table 7).
Losses and recoveries
Losses
Due to the separation of fraud types and methods in the survey design, estimates of the total losses sustained by agencies from all reported incidents of fraud were not requested. Instead, questions were intended to produce an estimate of loss for each fraud category. A general indication of total loss can be obtained by adding the total losses for each category, although there is a possibility of some double counting where agencies report losses attributable to an incident that involved two types of fraud. Such instances are likely to be few, so the total losses provide a good indication of overall dollars lost by agencies.
In 2009–10, the 3,001 incidents of internal fraud reported by 47 agencies involved a total of $2,039,162, or a mean of $680 lost per incident. However, only 53 percent of agencies that experienced an internal fraud incident specified a loss, which means that the total presented is a significant under-estimate. In 2008–09, there was a mean loss of $551 per incident of internal fraud—60 percent of agencies that experienced internal fraud specified a loss.
The difficulties in calculating fraud losses are well known and were outlined in the introduction to this report. For the purposes of this survey, fraud losses were defined as:
The amount, in whole dollars, thought to have been lost to the agency from fraud incidents, prior to the recovery of any funds, and excluding the costs of detection, investigation or prosecution.

29Results for 2009–10
$240,000 (Table 10). The amount recovered in cases involving ‘entitlement fraud’ ranged from $215 to $225,489. In all, $599,350 was recovered from incidents of internal fraud.
Suspects
Ninety-four percent (n=44) of agencies that experienced an internal fraud incident identified at least one suspect. Fraud relating to ‘financial
ranging from a minimum of $230 through to a maximum of $359,310. Agencies most commonly recovered losses through administrative remedies. No agencies used civil action to recover losses during 2009–10.
In relation to methods of committing fraud and recoveries, ‘entitlement fraud’ represented the category with the largest amount recovered—in excess of $330,000. This was followed by ‘financial benefits fraud’ with recoveries of more than
Table 8 Internal fraud losses by focus of incident (number and value)
Type Agencies (n) Mean ($)a Total ($)
Equipment 11 32,896 356,353
Entitlements 14 91,577 1,282,076
Information 1 800 800
Financial Benefits 17 22,109 375,853
Corruption 2 1,900 3,800
Other frauds 2 10,140 20,280
a: mean number of agencies with an incident
Source: Commonwealth fraud survey 2009–10 data [AIC computer file]
Figure 7 Agency experience of internal fraud, by focus of incident and reported losses (% of agencies and value)
0
5
10
15
20
25
30
35
40
Other fraudsCorruptionInformationFinancial benefits
EntitlementsEquipment 0
300,000
600,000
900,000
1,200,000
1,500,000% of total agencies reporting external fraud Losses ($)
Source: Commonwealth fraud survey 2009–10 data [AIC computer file]

30 Fraud against the Commonwealth 2009–10 annual report to government
benefits’ was the type of fraud for which the largest number of agencies identified suspects (n=25). However, the fraud type that generated the most suspects was ‘fraud related to information’, with 961 suspects identified by 21 agencies (Table 11).
As individuals suspected of internal fraud were, by definition, employees of the agency, information on
their job role was gathered, together with the duration of their employments in some cases (Table 12). However, this information was not always collected by agencies due to limitations in record keeping. Of the 2,832 internal fraud suspects, information on job role and duration of employment was reported for only 2,001 (71%). Of those cases in
Table 9 Internal fraud losses that could not be quantified, by method of commission (number and % of agencies)
Fraud type Agencies (n) Agencies (%)
Equipment 5 3
Entitlements 4 3
Information 4 3
Financial benefits 4 3
Corruption 3 2
Other frauds 3 2
Source: Commonwealth fraud survey 2009–10 data [AIC computer file]
Table 10 Internal fraud recoveries, by focus of incident and recovery type (number of agencies and value)a
Fraud type Criminal Civil Administrative remedy Other Total
Equipment
Amount recovered ($) 6,368 0 9,075 4,800 20,243
Agencies (n) 1 0 3 2 6
Entitlements
Amount recovered ($) 5,250 0 308,167 18,597 332,014
Agencies (n) 1 0 9 3 13
Information
Amount recovered ($) 0 0 0 800 800
Agencies (n) 0 0 0 1 1
Financial benefits
Amount recovered ($) 163,234 0 59,278 18,094 240,606
Agencies (n) 2 0 7 4 13
Corruption
Amount recovered ($) 0 0 0 800 800
Agencies (n) 0 0 0 1 1
Other frauds
Amount recovered ($) 943 0 3,458 486 4,887
Agencies (n) 1 0 2 1 4
a: agencies reported recovering money using more than one method per category
Source: Commonwealth fraud survey 2009–10 data [AIC computer file]

31Results for 2009–10
agency represented the greatest number of suspects (n=124, or 27 percent of the 456 suspects whose current job role and duration of employment was specified). Eighteen percent (n=365) of the employees suspected of internal fraud were unable to be identified by position or duration of employment. Such missing data was less than half the size of what was reported in 2008–09 (n=1,491, 47%), possibly indicating improvement in data collection in agencies. Overall, the reported data relating to suspects of internal fraud were consistent with the findings in 2008–09.
Fraud detection and investigation
Alongside fraud incident data, information was also gathered on the ways in which internal fraud was both detected and investigated. Agencies provided information on the detection of 2,481 internal fraud incidents. The ‘internal controls/audit/investigation’ method of detection was frequently used (n=22 agencies), producing the highest total number of incidents detected (n=1,275). This category of detection had the highest mean detection rate of 58 incidents detected per agency.
which duration of employment and position could be determined, most suspects were in junior or non-management roles (n=426); suspects from executive/senior management levels were comparatively rare (n=22). This contrasts with the results of recent fraud surveys where managerial employees were most likely to be the perpetrators who caused the largest financial losses through fraud, especially in the public sector. For example, KPMG (2010) found that in the public sector organisations surveyed, 85 percent of losses suffered were caused by managers, while the largest proportion of incidents was committed by non-managerial employees (62%). It should be noted that the results of KPMG’s survey related to proved incidents of fraud, unlike the present survey which included alleged and substantiated incidents.
Where the duration of employment was known, but not the position held, suspects were most likely to have been employed for more than nine years (n=368), followed by employment from between one and three years (n=311). In total, across all positions, junior non-management staff employed from between one and three years at the responding
Table 11 Internal fraud suspects, by focus of incident (number of agencies and suspects)
Type Agencies that identified suspects Mean suspects Total suspects
Equipment 21 10 207
Entitlements 24 17 406
Information 21 57 961
Financial benefits 25 9 218
Corruption 13 50 650
Other 13 30 390
Source: Commonwealth fraud survey 2009–10 data [AIC computer file]
Table 12 Suspects’ duration of employment and current job role (number of suspects)
PositionLess than
1 year 1–<3 years 3–<6 years6–<9 years
More than 9 years Unknown Total
Junior non-management 17 124 77 53 73 82 426
Management 1 16 12 13 54 13 109
Executive/senior management 1 0 1 2 10 8 22
Other 0 1 0 0 1 22 24
Unknown 67 311 163 146 368 365 1,420
Total 86 452 253 214 506 490 2,001
Source: Commonwealth fraud survey 2009–10 data [AIC computer file]

32 Fraud against the Commonwealth 2009–10 annual report to government
Agencies provided information about the investigation of 2,633 internal fraud incidents. The overwhelming majority of internal fraud incidents were investigated by the agency that experienced the fraud (Table 14). This was true for the number of agencies (89%) as well as for the number of incidents investigated (97%). The total number of incidents investigated was slightly higher than the number of incidents detected, which may be due to agencies investigating possible cases of non-compliance and determining that fraud was not evident.
Detection by ‘staff member/colleagues’ was the most common form of discovery identified by 36 agencies, although it had a much lower mean of 13 incidents detected per agency using this method.
Detection by ‘external whistleblower/informant (not anonymous)’—informants outside the agency who reported their suspicions in the public interest—was another common method of detection, resulting in 592 identified incidents and a mean of 33 incidents per agency (Table 13).
Table 13 Internal fraud detection methods (number of agencies and incidents)
Method of detection Agencies Meana Total incidents detected
Internal controls/audit/investigation 22 58 1,275
Staff member/colleague discovered/reported 36 13 453
Anonymous whistleblower/informant 13 5 70
External audit/investigation 5 4 18
Notification by police or other law enforcement agencies/investigations 7 4 29
External whistleblower/informant (not anonymous) 18 33 592
Credit card issuer 1 1 1
Media 2 2 3
Offender self-reported 3 7 20
Unable to be determined 4 2 7
Other 2 7 13
Total 2,481
a: mean of agencies that detected an incident
Source: Commonwealth fraud survey 2009–10 data [AIC computer file]
Table 14 Method used to investigate internal fraud incidents (number of agencies and investigations)
Manner investigated Agencies Meana Total investigations
Agency investigation only—no external investigation 42 61 2,553
External investigator 7 1 10
Australian Federal Police 8 3 20
State or territory police 9 3 24
Credit card issuer 2 2 3
Media 1 1 1
Another agency 6 3 18
Other 3 1 4
Total 2,633
a: mean of agencies that detected an incident
Source: Commonwealth fraud survey 2009–10 data [AIC computer file]

33Results for 2009–10
External fraudAs previously noted, external fraud was defined as ‘any incident of suspected fraud allegedly committed against the agency by a person other than an employee or contractor of the agency’. Where appropriate, agencies were able to record one incident in multiple categories of fraud type. As was the case for internal fraud, the survey questions about external fraud incidents were presented in two sections—the first concerning the ‘focus’ or benefit to be obtained and the second concerning the ‘method’ that was used to carry out the incident.
Focus of external fraud incidentsExternal fraud types were grouped into five categories—equipment, entitlements, financial benefits, information and other. ‘Other’ was for any incidents relating to a benefit that did not fall into one of the other four identified categories.
If a respondent agency answered ‘yes’ to experiencing any incidents relating to a category of fraud benefit, it was required to specify what the incident involved. For example, if an agency stated that it had
Referrals for police investigation and prosecution
The number of agencies that reported referring internal fraud incidents to the AFP, state and territory police and the CDPP was small (Table 15). In 2009–10, agencies referred a total of 94 incidents involving internal fraud for police investigation or prosecution by the Commonwealth Director of Public Prosecutions (CDPP). Of these, agencies referred 34 internal fraud incidents to the Australian Federal Police (AFP) and a further 25 internal fraud incidents to state and territory police. Agencies also referred 35 internal fraud incidents to the CDPP in 2009–10. This indicates that the agency involved investigated the majority of its fraud incidents, rather than involving police and prosecutors. This is in accordance with the Commonwealth Fraud Control Guidelines 2002, which require agencies to have primary responsibility for fraud investigation. Relatively small numbers of incidents were also referred to the CDPP for prosecution. It appears that internal frauds involving ‘entitlements’ were most likely to result in referral to the CDPP in 2009–10.
Table 15 Internal fraud referrals, by focus of incident and agency referred to (number of incidents)
Internal AFP State and territory police CDPP
Equipment
Agencies 2 4 2
Incidents (n) 5 16 5
Entitlements
Agencies 5 0 6
Incidents (n) 12 0 13
Information
Agencies 3 1 2
Incidents (n) 4 2 6
Financial benefits
Agencies 7 4 4
Incidents (n) 11 5 9
Other frauds
Agencies 2 2 1
Incidents (n) 2 2 2
Source: Commonwealth fraud survey 2009–10 data (AIC computer file)

34 Fraud against the Commonwealth 2009–10 annual report to government
Although the number of agencies that experienced internal and external fraud was quite similar (n=47 and n=51 respectively), the number of actual incidents experienced was considerably higher in the case of external fraud. It was also evident that the external fraud types that produced the largest number of incidents were experienced by only a small proportion of agencies. Overwhelmingly, ‘misusing or claiming benefits without entitlement relating to social security’ produced the highest number of incidents (n=613,527), although only three agencies reported experiencing this type of external fraud. Compared with 2008–09, the incidence of social security related fraud was less in 2009–10. Further investigations with one of the agencies in question, revealed that this was largely due to a change in counting rules within that agency, which was responsible for reporting 99 percent of these types of incidents (n= 717,414 in 2008–09; n=613,527 in 2009–10).
When looking at other specific fraud types, agencies were most likely to experience ‘theft of telecommunications or computer equipment’ (n=18), ‘providing false or misleading information, or failing to provide information when required to do so’ (n=13), or ‘fictitious claims/forgery’ (n=13) (Table 16).
experienced fraud focused on ‘entitlements’, it was then asked whether the fraud related to housing, social security etc. Within each fraud category, there was also an option to state that the specific fraud focus was ‘unable to be determined’. This was used in cases in which it was known that an incident of that general category had occurred, but there was insufficient information to define the exact nature of the fraud.
The survey also counted the number of agencies affected by each fraud type and the total number of incidents reported regardless of how many agencies reported them. Based on the findings of the 2008–09 survey, it was expected that there would be a difference between the fraud types that affected most agencies and those that generated the largest number of incidents.
Thirty-four percent (n=51) of the total number of agencies providing usable data reported having experienced some kind of fraud perpetrated by an external entity—that is, a person not employed by the agency. The fraud categories that affected most agencies were ‘financial benefits’ (21% n=32) and ‘equipment’ (16%, n=24), (Figure 8).
Figure 8 External fraud, by focus of incident (% of agencies)
0
5
10
15
20
25
Other fraudsInformationFinancial benefitsEntitlementsEquipment
16
13
21
14
7
Source: Commonwealth fraud survey 2009–10 data [AIC computer file]

35Results for 2009–10
Table 16 External fraud, by focus of incident (number of agencies and incidents)
Fraud type Agencies Mean incidentsa Total incidents
Equipment
Theft of telecommunications or computer equipment (including mobile devices) 18 727 13,083
Theft of other government equipment 11 2 26
Theft of consumable stock (office-related) 4 2 6
Theft of consumable stock (other) 2 2 3
Misuse of government equipment 3 8 24
Unable to be determined 0 0 0
Other 4 162 648
Entitlements
Misusing or claiming benefits without entitlement relating to housing 0 0 0
Misusing or claiming benefits without entitlement relating to social security 3 204,509 613,527
Misusing or claiming benefits without entitlement relating to health benefits 2 562 1,123
Misusing or claiming benefits without entitlement relating to visa/citizenship 2 33,151 66,302
Misusing, evading or claiming benefits without entitlement relating to child support 1 464 464
Revenue fraud 4 167 669
Customs and excise fraud (evading excise) 1 563 563
Unable to be determined 3 1,335 4,006
Other (combined) 11 521 5,733
Information
Obtaining or using information without authorisation (excluding personal information)
5 2 9
Providing false or misleading information, or failing to provide information when required to do so
13 147 1,913
Obtaining or using personal information without authorisation 3 154 461
Use of agency logo or name without authorisation 6 2 12
Misuse of agency intellectual property 1 1 1
Unable to be determined 2 234 468
Other Information 2 8 16
Financial benefits
Obtaining cash/currency without permission (including theft of petty cash) 6 4 21
Misuse or theft of government credit cards, travel cards or other cash cards 8 10 76
Theft of misuse of cabcharge 9 3 25
Theft of property other than cash 6 3 17
Procurement offences 1 20 20
Fictitious claims/forgery 13 7 85
Unable to be determined 2 12 23
Other 13 499 6,485
Other frauds
Other (combined) 17 564 4,004
a: mean calculated on agencies that reported an incident
Source: Commonwealth fraud survey 2009–10 data [AIC computer file]

36 Fraud against the Commonwealth 2009–10 annual report to government
and ‘corruption’ were comparatively rare (both 7%), with ‘misuse of identification’ more common (11%).
The specific method of external fraud experienced by the greatest number of agencies was ‘creating and/or using a false or altered document (not belonging to the agency)’ (n=16); 666 incidents were reported where this method of fraud was used (Table 17). The largest number of incidents were recorded in relation to ‘failing to provide documents when required to do so’ (n=7,573), which was experienced by seven agencies. This was followed by ‘unauthorised use of another person’s tax file number or Australian business number’ (n=2,859), which involved just two agencies. Compared with ‘misuse of IT’ in connection with internal fraud, external fraud incidents involving the ‘misuse of IT’ were rare, with only four agencies reporting external fraud occurring through information having been accessed via a computer without authorisation. One agency reported interfering with computer networks in relation to six incidents of internal fraud (see Table 7).
In the ‘other frauds’ category, agencies reported a range of fraudulent activities including, but not limited to, community protection matters (n=2,536); non-payment of national park entry fees (n=640); illegal importation (n=13); illegal foreign fishing vessels operating in Australian waters (n=23); plagiarism (n=27); and cheating in examinations (n=6).
Methods used in external fraud incidents
With respect to the methods used to commit external fraud, it was found that fraud involving the ‘misuse of documents’ affected the largest proportion of agencies—17 percent of all agencies reported this method of fraud (Figure 9). A similar finding was reported in 2008–09, where ‘misuse of documents’ was the most common method identified, although this was slightly less in 2009–10 than in 2008–09 (21%). In contrast to internal fraud, external fraud incidents involving the ‘misuse of IT’
Figure 9 External fraud, by method of commission (% of agencies)
0
5
10
15
20
Other methodsCorruptionMisuse of documentsMisuse of IDMisuse of IT
7
11
17
7
11
Source: Commonwealth fraud survey 2009–10 data [AIC computer file]

37Results for 2009–10
Table 17 External fraud, by method of commission (number of agencies and incidents)
Method type Agencies Meana Total incidentsb
Misuse of information technologies
Accessing information or programs via a computer without authorisation
4 115 460
Copying or altering data or programs without authorisation 1 2 2
Manipulation of a computerised accounting system 1 1 1
Insertion of malicious code 0 0 0
Interference with computer networks 2 4 7
Unable to be determined 0 0 0
Other misuse of IT 5 2 8
Misuse of identify
Creating and/or using a fictitious identity/forgery 10 15 153
Use of an employee’s or contractor’s identity without their knowledge 4 1 5
Fraudulently using another person’s identity with their permission 0 0 0
Unauthorised use of another person’s password, PIN, or access pass 0 0 0
Unauthorised use of another person’s tax file number or Australian Business Number
2 1,430 2,859
Unable to be determined 2 4,356 8,711
Other misuse of ID 5 2 8
Misuse of documents
Creating and/or using a false or altered agency document 13 7 96
Creating and/or using a false or altered document (not belonging to the agency)
16 42 666
Dishonestly concealing documents 0 0 0
Failing to provide documents when required to do so 7 1,082 7,573
Unable to be determined 7 3,303 23,123
Other misuse of documents 9 19 170
Corruption
Bribery of an employee 1 42 42
Accepting kickbacks or gratuities 2 2 4
Failure to disclose/abuse of a conflict of interest 4 3 11
Collusion conspiracy 4 5 19
Abuse of power 3 14 43
Unable to be determined 3 7 22
Other corruption 2 1 2
Other methods
Other 40 43,537 608,704
a: mean calculated on agencies that reported an incident
b: respondents were able to provide multiple responses, hence the absence of column totals
Source: Commonwealth fraud survey 2009–10 data [AIC computer file]

38 Fraud against the Commonwealth 2009–10 annual report to government
a 17 percent reduction ($105m) from the losses reported in 2008–09. The external fraud type that resulted in the largest financial loss to agencies was fraud relating to ‘entitlements’, costing agencies nearly $488m in 2009–10 (see Table 18). ‘Financial benefits fraud’ affected the greatest number of agencies that experienced an external fraud incident (35%, n=18), which is fairly consistent with the reported figures for 2008–09; however, the total amount lost was approximately $14.5m less than was reported in 2008–09.
Fraud in relation to ‘equipment’ showed a marked decrease compared with 2008–09, decreasing from $1,429,052 in 2008–09, to $217,370 in 2009–10. The greatest area of decrease between 2008–09 and 2009–10, however, concerned fraud relating to ‘financial benefits’. Losses totalling $20,800,000 were reported in 2008–09, down to only $6,274,774 in 2009–10. This is most likely due to the impact of changes in counting rules adopted by the relevant agency. Losses due to ‘information’ fraud increased from no losses reported in 2008–09 to $572,018 in 2009–10, although this involved only one agency that suffered a large loss as a result of the fraud incident.
The amount lost for each fraud type for the number of agencies that experienced external fraud incidents is presented in Figure 10. Without exception across all fraud types, there was a substantial difference between the number of agencies that reported incidents and the amount lost for each fraud type. While there were a relatively small number of agencies that suffered fraud incidents relating to ‘entitlements’ compared with ‘financial benefits’, the amount lost due to ‘entitlement fraud’ was
Losses and recoveries
Losses
Owing to the separation of fraud types and methods in the survey design, estimates of the total losses sustained by agencies with respect to external fraud were not collected from respondents. Instead, questions were intended to produce an estimate of loss for each fraud category. As was the case when reporting on internal fraud losses, a general indication of total loss can be obtained by adding the total losses for each category, although there is a possibility of some double counting where agencies report losses attributable to an incident that involved two types of method. In 2009–10, the 702,941 incidents of external fraud reported by 51 agencies involved a total loss of $495,534,658. However, only 65 percent of agencies that experienced an external fraud incident specified a loss.
As in the case of internal fraud, fraud losses from external fraud were defined as:
the amount, in whole dollars, thought to have been lost to the agency from fraud incidents, prior to the recovery of any funds, and excluding the costs of detection, investigation or prosecution.
Not all agencies that experienced external fraud reported a loss. While 34 percent (n=51) of all agencies experienced an external fraud incident, only 22 percent (n=33) reported a loss from external fraud (or 65 percent of agencies that experienced an external fraud).
The total estimated losses due to external fraud in 2009–10, were close to $496m, which represented
Table 18 External fraud losses, by focus of incident (number of agencies and value)
Fraud type Agencies (n) Mean ($)a Total lost ($)b
Equipment 16 13,586 217,370
Entitlements 8 60,948,151 487,585,211
Information 1 572,018 572,018
Financial benefits 18 348,654 6,275,774
Corruption 2 441,503 883,005
Other frauds 2 640 1,280
a: mean calculated on agencies that reported an incident
b: respondents were able to provide multiple responses, hence the absence of column totals
Source: Commonwealth fraud survey 2009–10 data [AIC computer file]

39Results for 2009–10
money (n=22). The amount of money recovered by agencies from external fraud varied, with amounts ranging from $83 to more than $86m for one agency alone. The total recovered was approximately $196m (Table 20). Recovery for fraud relating to ‘financial benefits’ was the most common fraud type that led to recovery of funds (n=18), with the use of ‘administrative remedies’ the most common method used to recover funds (n=18). The largest total recoveries were made using administrative methods—internal procedures not involving civil or criminal action—in connection with fraud relating to ‘entitlements’ (over $86m), involving five agencies. In 2008–09 no financial losses involving ‘entitlements’ were recovered using criminal prosecution or civil remedies, while in 2009–10 two agencies recovered almost $150,000 through criminal prosecution and another agency recovered over $3,000 through civil remedies. The total amount recovered for ‘other’ through ‘other’ means of recovery was almost $86.6m. This compares to $30m in the same category for 2008–09, showing a considerable increase (Table 20).
considerably more than losses caused by ‘financial benefit fraud’ and each of the other fraud types. It is important to note, however, that the impact of fraud incidents could affect agencies in non-financial ways and a small financial loss, as seen in the case of corruption and fraud relating to information, might not necessarily mean that the fraud had not had a significant effect on the victimised agency.
Owing to the inherent difficulties associated with calculating fraud losses, agencies were given the option of specifying losses that they were unable to quantify. In total, 37 agencies reported suffering a loss from external fraud that could not be quantified (Table 19). Given the difficulties of calculating losses and the fact that 19 agencies identified losses that could not be quantified, it is likely that the figures of estimated loss in this report underestimate the external fraud losses incurred by Australian Government agencies in 2009–10.
Recoveries
In 2009–10, 43 percent of agencies that experienced external fraud were able to recover
Figure 10 Agency experience of external fraud, by focus of incident and reported losses (% of agencies and value)
0
5
10
15
20
25
30
35
40
Other fraudsCorruptionInformationFinancialbenefits
EntitlementsEquipment0
100
200
300
400
500
600% of total agencies reporting external fraud Losses ($)
Source: Commonwealth fraud survey 2009–10 data [AIC computer file]

40 Fraud against the Commonwealth 2009–10 annual report to government
Table 19 External fraud losses that could not be quantified, by focus of incident (number and % of agencies)
Fraud type Agencies (n) Agencies (%)
Equipment 7 5
Entitlements 5 3
Information 8 5
Financial benefits 10 7
Corruption 3 2
Other frauds 4 3
Source: Commonwealth fraud survey 2009–10 data [AIC computer file]
Table 20 External fraud recoveries, by focus of incident and method of recovery (number of agencies and value)a
Fraud type Criminal Civil Administrative remedy Other Total
Equipment
Amount recovered ($) 0 0 21,640 0 21,640
Agencies (n) 0 0 1 0 1
Entitlements
Amount recovered ($) 149,421 3,373 86,814,519 0 86,967,313
Agencies (n) 2 1 5 0 8
Information
Amount recovered ($) 0 0 126,600 79,278 205,878
Agencies (n) 0 0 2 1 3
Financial benefits
Amount recovered ($) 408,660 200 11,661,031 128,519 12,198,410
Agencies (n) 5 1 8 4 18
Corruption
Amount recovered ($) 522 0 0 81,246 81,768
Agencies (n) 1 0 0 1 2
Other frauds
Amount recovered ($) 10,096,025 0 9,460 86,555,653 96,661,138
Agencies (n) 1 0 2 1 4
a: agencies could recover money through more than one method per category of fraud
Source: Commonwealth fraud survey 2009–10 data [AIC computer file]

41Results for 2009–10
Comparing 2008–09 with 2009–10 findings, there was a decline in the number of incidents detected by ‘internal controls/audit/investigation’ (from 730,145 to 596,094) and those incidents detected by ‘external anonymous whistleblower/informant’ (from 71,559 to 45,972). Both of these changes were probably due to the change in fraud reporting and counting practices adopted by two large agencies that relied on these two methods to control fraud and non-compliance risks. There has also been a rise in the incidents detected by ‘other’ methods (from 190 to 12,354).
Respondents provided information about the manner in which 665,846 incidents of external fraud were investigated in 2009–10. As was the case with investigating internal fraud incidents, the agency involved investigated the clear majority of these incidents (Table 23). This was true with respect to both the number of agencies that reported external fraud (73%) and the number of incidents involved (99%). Compared with 2008–09, fewer external fraud incidents were investigated by the Australian Federal Police (79 incidents in 2008–09 compared with 59 incidents in 2009–10) and/or state or territory police (52 incidents in 2008–09 compared with 37 incidents in 2009–10). The total number of incidents investigated was fewer than the number of incidents detected. This was probably because, although some incidents were detected, not all were necessarily investigated. Further qualitative research would be required to confirm this.
Referrals for police investigation and prosecution
The number of agencies referring external fraud incidents to the AFP, state and territory police and the CDPP was small, as was the case with internal fraud incidents (Table 24). In 2009–10, agencies referred a total of 5,428 incidents involving external fraud for police investigation or prosecution by the CDPP. Of these, agencies referred 134 incidents to the AFP, a further 101 to state and territory police and 5,193 incidents to the CDPP.
Frauds targeting ‘entitlements’ were most often referred for police or prosecution activity (n=4,707), followed by ‘other’ fraud types (n=603), although
Suspects
Eighty-eight percent of agencies that experienced an incident of external fraud identified at least one suspect, a slightly lower proportion than in 2008–09 (96%). Suspects were identified by 26 agencies with respect to fraud relating to ‘financial benefits’ followed by individuals suspected of fraud involving ‘equipment’, in which 18 agencies identified suspects. The largest number of suspects was identified for external fraud incidents that related to ‘entitlements’ (n=691,111), which was consistent with the high number of incidents for this type of fraud (Table 21). The number of agencies that identified suspects by the various fraud types was fairly consistent with findings from 2008–09, despite the substantial change in the number of incidents between the two years.
As external fraud is committed by members of the public, data on the employment background of suspects would not necessarily be collected by agencies. Accordingly, information on this variable was not included in the survey. Further research, perhaps undertaken through the analysis of prosecution files, would be required to obtain this information, although this would be a limited data source given the large number of matters dealt with by other means.
Fraud detection and investigation
In addition to fraud incident data, information was gathered on the ways in which external fraud was both detected and investigated. Agencies provided information on the detection of 703,424 external fraud incidents. It was found that most agencies detected external fraud through ‘internal controls/audit/investigation’ (n=33); this method was also responsible for detecting the greatest number of fraud incidents (n=596,094, see Table 22).
Although only four accused perpetrators were ‘self-reported’, this led to the detection of the highest average of fraud incidents. It was reported that one of the accused had committed virtually all of the 5,631 self-reported incidents, committing 5,627 fraud incidents before self-reporting.

42 Fraud against the Commonwealth 2009–10 annual report to government
Table 23 Methods used to investigate external fraud incidents (number of agencies and incidents)
Method of investigation Agencies Meana Total
Agency investigation only—no external investigation 37 17,835 659,899
External investigator 4 65 261
Australian Federal Police 17 3 59
State or territory police 16 2 37
Media 0 0 0
Another agency 11 17 182
Other 11 492 5,408
Total 665,846
a: mean calculated on agencies that investigated an incident
Source: Commonwealth fraud survey 2009–10 data [AIC computer file]
Table 22 External fraud detection methods (number of agencies and incidents)
Method of detection Agencies Meana
Total incidents detectedb
Internal controls/audit/investigation 33 18,063 596,094
Staff member/colleague discovered 29 1,344 38,974
Anonymous whistleblower/informant 3 4 12
External audit/investigation 5 173 863
Notification by police or other law enforcement agencies/investigations 8 88 705
External whistleblower/informant (not anonymous) 21 2,189 45,972
Media 5 2 8
Accused self-reported 4 1,408 5,631
Unable to be determined 3 937 2,811
Other frauds 5 1,235 12,354
a: mean calculated on agencies that detected an incident
b: respondents were able to provide multiple responses, hence the absence of column totals
Source: Commonwealth fraud survey 2009–10 data [AIC computer file]
Table 21 External fraud, by focus of incident (number of agencies and suspects)
Type Agencies Mean suspectsa Total suspects
Equipment 18 5 85
Entitlements 13 53,162 691,111
Information 15 155 2,319
Financial benefits 26 243 6,308
Corruption 4 12 49
Other frauds 12 356 4266
a: mean calculated on agencies with a suspect
Source: Commonwealth fraud survey 2009–10 data [AIC computer file]

43Results for 2009–10
Training and fraudIn the 2009–10 survey, agencies were asked to specify the employee resources that they devoted to fraud control. Specifically, agencies were asked to report the number of staff they employed in each section on fraud control and the number of staff in these sections that had a fraud control qualification. A qualification could be in the form of a certificate or diploma in fraud investigation or some aspect of fraud control. It was found that the largest number of employees within fraud control sections of agencies worked on investigations and that those working in investigations had formal qualifications more often than those working in fraud prevention (93% compared with 15% respectively) (Table 25).
this was still a small proportion of the total number of these incidents. The referrals reported in 2009–10 showed a general decrease in all categories compared with 2008–09. The greatest decline from 2008–09 to 2009–10 was in the number of referrals to the AFP for frauds relating to ‘entitlements’ (from n=67 to n=35 respectively); however, the number of referring agencies remained the same (n=4). Also, the number of referrals to the CDPP for fraud relating to ‘information’ also decreased between 2008–09 and 2009–10 (from 20 to 4 referrals). Referral rates, of course, are influenced by a variety of factors, including the initial detection of incidents, adequacy of evidence and ability of policing and prosecution agencies to deal with matters.
Table 24 Number of external fraud referrals, by focus of incident (number of agencies and incidents)
Focus AFP State and territory police CDPP
Equipment
Agencies 4 11 0
Referrals 6 36 0
Entitlements
Agencies 4 4 7
Referrals 35 7 4,665
Information
Agencies 6 1 1
Referrals 9 2 4
Financial benefits
Agencies 9 9 8
Referrals 18 15 28
Other frauds
Agencies 5 4 5
Referrals 66 41 496
Source: Commonwealth fraud survey 2009–10 data [AIC computer file]
Table 25 Qualifications of agency fraud control staff (number and % of staff)
Fraud prevention Fraud investigation Fraud other
Employees in fraud section (n) 680 1,126 1,620
Employees with a qualification (n) 101 1,044 125
Fraud section employees with a qualification (%) 15 93 8
Source: Commonwealth fraud survey 2009–10 data [AIC computer file]

44 Fraud against the Commonwealth 2009–10 annual report to government
for more structured training courses, standardised training across APS agencies and for increased information to be available to agencies to use when selecting courses. To facilitate the provision of staff training, some agencies have suggested that advice should also be sought from external professional companies that deal with fraud and risk management to enhance APS-wide training.
Thirty-four agencies responded to a question concerning the need for further improvement in opportunities for staff training in the area of fraud control. Their responses were classified into five general areas (agencies sometimes provided suggestions in more than one category):
• staff to complete a tertiary certificate or diploma in governance in fraud control and/or investigations (11 agencies—32%);
• APS-wide short course training on fraud awareness to be provided by the Australian Government instead of external providers on fraud and risk management (22 agencies—64%);
• in-house fraud and ethics training with additional information on the intranet as a reference point (25 agencies—74%);
• more informal mentoring and buddy systems for those involved in fraud control (3 agencies—9%); and
• regular reviews of fraud prevention policies and procedures (17 agencies—50%).
It should be noted that seven of the 34 responding agencies (8% of the total sample) reported that no further training was required.
From 2008–09 to 2009–10, the number of dedicated fraud section employees increased in ‘prevention’, from 454 to 680. There was also an increase in staff assigned to ‘other’ categories, from 442 to 1,620. In contrast, the number of dedicated fraud section employees in ‘investigation’ decreased by almost half, from 2,062 in 2008–09 to 1,126 in 2009–10.
With the substantial increase in fraud prevention staff, the proportion of fraud prevention staff with a relevant qualification, as a percentage of total fraud staff, decreased from 19 percent to 15 percent between 2008–09 and 2009–10. However, there was a substantial increase in the percentage of staff with qualifications out of total fraud staff between 2008–09 and 2009–10, from 30 percent to 43 percent respectively in connection with ‘investigation’ activities. There was a slight decrease in qualifications from 10 percent to 8 percent for staff working in ‘other’ fraud control activities. The quadrupling of staff numbers assigned to work in this area over the same period should be noted.
Fraud training
The 2002 Guidelines dictate the levels of training required for staff in the areas of fraud control, and current Fraud against the Commonwealth survey findings indicated that agencies were generally favourable to the idea of regular and mandatory training of staff in those matters. However, there were concerns raised about consistency and standards among the current training courses available. Agencies suggested there was a need

45Policing and prosecutions
Policing and prosecutions
In addition to gathering information from agencies on their experience of fraud and their fraud control arrangements, the AIC also gathered information from the AFP and CDPP on certain aspects of fraud investigations and prosecutions that they undertook in the preceding year. Unfortunately, it was not possible to relate these data back to individual agency responses and hence to report on which types of fraud matters resulted in differing policing and prosecution outcomes. Data collection practices within the AFP and CDPP also differed in various other respects, as described below.
Australian Federal Police reportingParagraph 8.15 of the Guidelines requires the AFP to provide the AIC with the following information each year on fraud matters it has investigated:
• the number of referrals accepted and declined by the AFP;
• the number of accepted referrals that led to prosecution;
• the type of offences;
• the estimated financial loss investigated;
• fulfilment of AFP service standards relating to case handling; and
• results of the investigation quality assurance review process, with an analysis of best practice and deficiencies.
The numbers of referrals accepted and declined
As defined by the Guidelines, fraud-related referral records held by the AFP included the following case types:
• civil proceedings;
• corporate bankruptcy;
• corruption;
• counterfeit currency;
• fraud;
• identity fraud;
• money laundering and Anti-Money Laundering and Counter-Terrorism Financing Act 2006 offences; and
• trans-economic crime.
During 2009–10, the AFP accepted 94 referrals and declined 29. This compares to 368 and 47 respectively in 2008–09. The number of referrals has decreased considerably since 2008–09. This is due primarily to changed business rules in the recording of undeclared currency referrals. Previously, each referral, regardless of outcome, was recorded as a separate case; in

46 Fraud against the Commonwealth 2009–10 annual report to government
• 74 percent of applicable cases included acceptance or rejection letters to the agency within the 28-day timeframe. In instances relating to the referral of complex matters, the AFP adopted a position of extending the 28-day evaluation period to undertake an appropriate assessment of the case. When this occurs, the AFP informs the referring agency that an extended evaluation period is necessary.
• 100 percent of acceptance letters contained either the contact details of the case officer and/or contact details for the Operations Monitoring Centre.
• 68% of the 50 cases did not require a quarterly case management report (QCMR). Of the cases that required a QCMR only 31% complied.
• The AFP Police Real-time Online Management Information System (PROMIS) was not able to accurately capture information about change of case officers.
These statistics are consistent with the figures provided by the AFP for the 2008–09 random sample on all indicators.
The investigation quality assurance review process— best practice and deficiencies
During the reporting period, the AFP received no requests to conduct quality assurance reviews (QARs). The purpose of a QAR is to establish whether an investigation was conducted in a way
2009–10, this practice was amended so that only cases proceeding to either arrest or summons were recorded. During 2009–10, 24 matters resulted in legal action, compared with 48 in 2008–09. This may include matters that were referred to the AFP in previous financial years. Losses involved in the 94 matters accepted for investigation during 2009–10 were estimated at $38,706,165, compared with losses of $70,068,615 in 2008–09 for the reported 368 cases. The reduction in losses is most likely attributable to the reduction in matters accepted for investigation by the AFP.
The type of offences
The type of offences recorded for 2009–10 and their frequency are shown in Table 26.
Changes to business rules for recording undeclared currency referrals, grouped under ‘money laundering’, has resulted in a decrease from the 371 money laundering offences recorded in 2008–09.
Fulfilment of AFP service standards relating to case handling
The AFP assessed service standards by conducting a random sample of 50 cases referred during 2009–10. The following results were reported:
• 100 percent of all cases reported included a completed Case Categorisation and Prioritisation Model, which took into account the views expressed by agencies and impact and priority.
Table 26 Type and frequency of offences recorded by the AFP 2009–10 (number of offences)
Incident type Offences
Civil proceeding 0
Corporate bankruptcy 0
Corruption 7
Counterfeit currency 4
Fraud 79
Identity fraud 41
Money laundering (Financial Transaction Reports Act 1988) 91
Trans-economic 0
Total 222
Source: AFP internal data
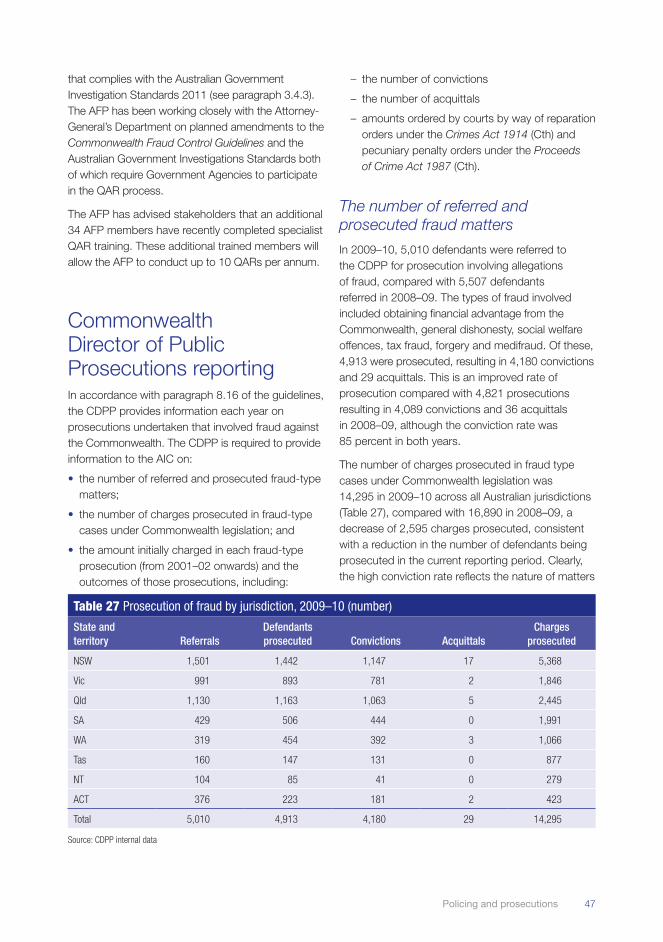
47Policing and prosecutions
– the number of convictions
– the number of acquittals
– amounts ordered by courts by way of reparation orders under the Crimes Act 1914 (Cth) and pecuniary penalty orders under the Proceeds of Crime Act 1987 (Cth).
The number of referred and prosecuted fraud matters
In 2009–10, 5,010 defendants were referred to the CDPP for prosecution involving allegations of fraud, compared with 5,507 defendants referred in 2008–09. The types of fraud involved included obtaining financial advantage from the Commonwealth, general dishonesty, social welfare offences, tax fraud, forgery and medifraud. Of these, 4,913 were prosecuted, resulting in 4,180 convictions and 29 acquittals. This is an improved rate of prosecution compared with 4,821 prosecutions resulting in 4,089 convictions and 36 acquittals in 2008–09, although the conviction rate was 85 percent in both years.
The number of charges prosecuted in fraud type cases under Commonwealth legislation was 14,295 in 2009–10 across all Australian jurisdictions (Table 27), compared with 16,890 in 2008–09, a decrease of 2,595 charges prosecuted, consistent with a reduction in the number of defendants being prosecuted in the current reporting period. Clearly, the high conviction rate reflects the nature of matters
that complies with the Australian Government Investigation Standards 2011 (see paragraph 3.4.3). The AFP has been working closely with the Attorney-General’s Department on planned amendments to the Commonwealth Fraud Control Guidelines and the Australian Government Investigations Standards both of which require Government Agencies to participate in the QAR process.
The AFP has advised stakeholders that an additional 34 AFP members have recently completed specialist QAR training. These additional trained members will allow the AFP to conduct up to 10 QARs per annum.
Commonwealth Director of Public Prosecutions reportingIn accordance with paragraph 8.16 of the guidelines, the CDPP provides information each year on prosecutions undertaken that involved fraud against the Commonwealth. The CDPP is required to provide information to the AIC on:
• the number of referred and prosecuted fraud-type matters;
• the number of charges prosecuted in fraud-type cases under Commonwealth legislation; and
• the amount initially charged in each fraud-type prosecution (from 2001–02 onwards) and the outcomes of those prosecutions, including:
Table 27 Prosecution of fraud by jurisdiction, 2009–10 (number)
State and territory Referrals
Defendants prosecuted Convictions Acquittals
Charges prosecuted
NSW 1,501 1,442 1,147 17 5,368
Vic 991 893 781 2 1,846
Qld 1,130 1,163 1,063 5 2,445
SA 429 506 444 0 1,991
WA 319 454 392 3 1,066
Tas 160 147 131 0 877
NT 104 85 41 0 279
ACT 376 223 181 2 423
Total 5,010 4,913 4,180 29 14,295
Source: CDPP internal data

48 Fraud against the Commonwealth 2009–10 annual report to government
From the period 1 July 2009 to 30 June 2010, 14,007 defendants charged with fraud and deception who appeared before all courts had a total of 49,009 federal offences finalised—2,686 in the Higher Courts, 45,979 in the Magistrates’ Courts and 344 in the Children’s Courts (ABS 2011). Of the 14,007 offenders, 25 percent (n=192) were represented in the Higher Courts, 35 percent (n=13,027) in the Magistrates’ Court and 5 percent (n=10) in the Children’s Court (ABS 2011). Of these defendants, 34 percent (n=4,821) had a principal federal offence of fraud and deception.
Overall, 99 percent of fraud offences were proved, withdrawn or disposed of other than by acquittal (ABS 2011). This is the same rate as for the CDPP’s conviction rate reported in the current survey (99%). This is understandable as most federal prosecutions relate to fraud offences.
Penalties for offences relating to fraud and deception most commonly involved community supervision or work orders (84%), as opposed to other penalties (ABS 2011). In addition, 19 percent of defendants with a principal sentence involving monetary orders had been charged with principal federal offences involving fraud or deception (ABS 2011).
chosen for prosecution, although in serious fraud cases generally, it is usual for accused persons to plead guilty once the prosecution case is known (Smith 2003). Only in a small proportion of cases will contested and complex matters proceed to trial, and few of these will result in acquittal (Smith 2003).
The CDPP laid charges in 2009–10 involving a total of $99,899,333.98 in respect of all types of fraud, which was almost $20.8m greater than in 2008–09, when $79,110,493.46 was alleged to have been defrauded. In 2009–10, the CDPP secured $59,337,503 by way of reparation under the Crimes Act 1914 (Cth) and pecuniary orders under the Proceeds of Crime Act 1987 (Cth)—some $14m more than the $45,277,119 secured in 2008–09.
To complement the data provided by the CDPP, the Australian Bureau of Statistics also collects data from Australian higher courts (Supreme and Intermediate), Magistrates’ and Children’s Courts. Not all federal offences are prosecuted by the CDPP, as some are heard in state and territory courts in conjunction with other local offences prosecuted by other agencies.

49Conclusions
Conclusions
Comparing internal and external fraudsOne of the clear findings from the present survey concerned the differences that existed between agencies’ experience of internal as opposed to external fraud. As in previous years, agencies were asked to report their findings separately for incidents of fraud allegedly committed by staff and contractors (internal fraud) and by parties external to the agency (external fraud). The following discussion compares the results obtained from the survey on this variable to determine if similarities or differences were present in the incidence and cost of fraud experienced as well as in the nature of the incidents reported.
Fraud typesOverall in 2009–10, external fraud affected slightly more Australian Government agencies (n=51 agencies, 34%) than internal fraud (n=47 agencies, 31%). Consistent with the greater number of agencies affected by external fraud, agencies also reported a greater number of incidents related to external fraud (n=702,941) than internal fraud (n=3,001). Yet while external fraud affected more agencies generally, the fraud types that resulted in the largest number of incidents tended to affect only a small number of agencies. The two external fraud types that produced the largest number of incidents—‘fraud relating to social security’ and ‘fraud relating to visas and citizenship’—were reported by only two agencies. For internal fraud
Table 28 Agency experience of fraud by focus of incident—summary (number and % of agencies)a
Type of incidentAgencies that experienced an
internal fraud incident (n)Total
agencies (%)Agencies that experienced an
external fraud incident (n)Total
agencies (%)
Equipment 27 18 24 16
Entitlements 25 16 19 13
Information 22 14 22 14
Financial benefits 30 20 32 21
Other frauds 5 3 11 7
a: percentages have been rounded to whole numbers
Source: Commonwealth fraud survey 2009–10 data (AIC computer file)

50 Fraud against the Commonwealth 2009–10 annual report to government
• The specific method used in the largest proportion of incidents involving external fraud was ‘failing to provide documents when required to do so’ (n=7,573), an increase from 2008–09 (n=794), while for internal fraud it was ‘accessing information or programs via a computer without authorisation’ (n=1,011), showing a decrease from 2008–09 (n=1,816).
• There was a large discrepancy between internal and external fraud in the number of incidents that involved the ‘misuse of IT’ and ‘accessing information or programs via a computer without authorisation’ more specifically. This was the most frequent method of internal fraud incidents; however, it was reported in 460 incidents of external fraud by four agencies, compared with only three incidents by three agencies in 2008–09.
• By way of contrast, ‘unauthorised use of another person’s Tax File Number or Australian Business Number’ was one of the most common external fraud methods used in 2009–10, although it was only reported by two agencies. In the case of internal fraud this method was reportedly not experienced by any agencies, representing only a reduction of one incident reported by one agency in 2008–09. In 2008–09, agencies reported no incidents of external fraud committed through the use of ‘unauthorised use of another person’s Tax File Number or Australian Business Number’. Further inquiries by the AIC revealed that changes in one agency’s interpretation of the definition of fraud and consequential changes to counting rules were responsible for the large increase in incidents involving this method in 2009–10.
the most frequent incident type—‘obtaining or using personal information without authorisation’—affected only eight agencies.
The method of ‘obtaining or using personal information’ accounted for the largest number of incidents of internal fraud (n=869, 29% of incidents), while only 0.1 percent of incidents of external fraud involved this method. When looking at fraud types that affected most agencies, rather than those that resulted in the largest number of incidents, fraud involving ‘financial benefits’ was the most prevalent type for agencies in both internal and external fraud, affecting 20 percent and 21 percent respectively (Table 28). This is consistent with the findings reported in 2008–09.
Fraud methodsThe most common methods used to carry out fraud were consistent whether the alleged offender was an internal employee within the agency or external to the agency. ‘Misuse of documents’ was reported as being committed internally in 16 percent of agencies (n=24) and 17 percent externally (n=26). ‘Misuse of IT’ and ‘corruption’ were the next most commonly committed methods for internal fraud (20 agencies in both cases), while ‘misuse of identity’ and ‘other’ fraud methods were the next most common for external fraud (17 and 16 agencies respectively) (Table 29). These findings mostly remained consistent with the 2008–09 findings.
Some methods used to commit fraud, however, showed marked differences depending on whether the accused was internal or external to the agency in question. The principal areas of difference were as follows.
Table 29 Agency experience of fraud by method of commission—summary (number and % of agencies)
Type of incident
Agencies that reported method for
internal fraud (n)
Total agencies
(%)
Agencies that reported method for
external fraud (n)
Total agencies
(%)
Misuse of information technologies 20 13 10 7
Misuse of identity 7 5 17 11
Misuse of documents 24 16 26 17
Corruption 20 13 10 7
Other methods 13 9 16 11
Source: Commonwealth fraud survey 2009–10 data (AIC computer file)

51Conclusions
was fraud targeted at ‘financial benefits’. This affected 17 agencies that reported internal fraud and 18 agencies that reported external fraud. Compared with the 2008–09 reporting period, fewer Australian Government agencies reported financial losses, with 23 and 21 agencies reporting financial loss from internal and external fraud respectively.
Agencies were able to recover money from external frauds (n=22) and internal frauds (n=15) in 2009–10. While rates of recovery differed, the methods used to recover the largest amounts of money were administrative methods for both internal and external fraud. Money recovered from losses relating to ‘entitlements’ was most common for both internal fraud and external fraud recoveries.
Suspects
Suspects were slightly more likely to be identified by agencies for internal fraud than for external fraud. In total, 94 percent of agencies with an internal fraud identified at least one suspect, compared with 88 percent for external fraud. The high rate of identified suspects is not surprising given that internal fraud is committed by employees who are known to the agency. The high rate of identified suspects for external fraud is more surprising, since external fraud can be committed by any member of the public, although this rate has dropped slightly for external fraud since 2008–09 (96%). Consistent with findings from the 2010 KPMG survey, non-management employees were the most likely group to commit fraud, at least with respect to the number of incidents, although not with respect to losses sustained (KPMG 2010: 6).
Looking at fraud more generally, of the 61 agencies that reported any incident involving either internal or external fraud, 74 percent (n=45) identified at least one suspect for one fraud type. These results showed a reduction in the suspects identified compared to 2008–09, with 97 percent of suspects identified as having committed at least one fraud.
However, while agencies were more likely to identify individuals suspected of internal fraud, the number of individuals suspected of external fraud was much larger. The fraud type that had the highest number of external suspects, ‘entitlement fraud’, involved 691,111 suspects and 13 agencies, while
• In 2008–09 no agencies reported any external fraud involving ‘unauthorised use of another person’s Tax File Number or Australian Business Number’ as the primary method. It is likely that the reporting or business activities in the two agencies that reported this method have changed, accounting for the increase in fraud using this method.
It should also be noted that across both internal and external fraud, there were fraud incidents for which agencies could not categorise the method. Most significantly, seven agencies reported 23,123 fraud incidents in the ‘misuse of documents’ method and were unable to further categorise these. A further 8,711 fraud incidents fell into the ‘misuse of identity’ category; however, they also could not be further defined. As discussed below, 40 agencies reported the extremely large number of 608,704 external fraud incidents that were simply classified as ‘other’ for method of commission.
Losses and recoveries
Of all agencies that experienced at least one incident of fraud (n=61), there were 41 agencies (42%) that specified a financial loss arising from either internal or external fraud. This finding was consistent with the number of agencies that suffered a loss in 2008–09. For internal fraud, 25 agencies identified a loss; for external fraud 33 agencies identified losses, compared with 29 agencies for both internal and external fraud in 2008–09.
External fraud resulted in substantially higher losses to Australian Government agencies than internal fraud. The majority of external fraud losses were a result of fraud targeted at entitlements, with an estimated loss of $487,585,211 across eight agencies. The 2009–10 loss represents a slight decrease from the loss due to entitlements fraud experienced in 2008–09, which was estimated as a $488,588,745 loss. Similarly, for internal fraud the loss from entitlements was also the most expensive category, resulting in an estimated loss of $1,282,076, which had increased from $860,862 in 2008–09. Overall, more than $497m (n=$497,573,820) was lost to fraud in 2009–10.
For both internal and external fraud incidents, the fraud type that resulted in a loss for most agencies

52 Fraud against the Commonwealth 2009–10 annual report to government
incidents were detected, both internal and external frauds were most likely to be investigated by the agency alone.
In addition to detection and investigation within agencies, financial crime investigations have also been undertaken by taskforces that involve law enforcement and intelligence agencies as well as the government agency in question. Project Wickenby is an example of a multi-agency collaborative taskforce implemented to investigate organised tax fraud and associated offshore money-laundering activities. It involved a number of investigative and intelligence agencies, including the Australian Taxation Office (ATO), AFP, Australian Crime Commission (ACC), Australian Securities and Investments Commission (ASIC), and was supported by the Australian Transaction Reports and Analysis Centre (AUSTRAC), the Attorney-General’s Department and the Australian Government Solicitor (AGS) and international partners when necessary. The CDPP played an important role in prosecuting offenders and recovering proceeds from these crimes under the Proceeds of Crime Act 2002. Project Wickenby was funded between February 2006 and June 2010, and as at 30 September 2010 the CDPP had prosecuted 60 defendants in various jurisdictions investigated by the AFP and ACC. In addition, the CDPP has recouped a total of $513.2m in outstanding tax collections, compliance dividends
‘information fraud’ had the highest number of internal fraud suspects at 961. Compared with 2008–09, the number of suspects fell from nearly 790,000 for external fraud and decreased from around 1,800 for internal fraud out of 3,001 internal fraud incidents. In 2009–10 the highest number of suspects identified from one agency was 613,498 relating to external ‘entitlement fraud’ and the highest number of suspects identified from one agency for internal fraud was reportedly 548 for fraud relating to ‘corruption ’.
Detection and investigation
The most prevalent methods for detecting frauds were the same for both internal and external fraud, namely ‘internal controls/internal audit’ which was used to detect 1,275 incidents of internal fraud and 596,094 incidents of external fraud. ‘Internal controls/internal audit’ was also the method of detection found to be most prevalent in the 2008–09 reporting period, accounting for a similar number of internal fraud incidents as in 2009–10. In the case of external fraud, this method of detection decreased from 730,145 in 2008–09 to 596,094 in 2009–10. Consistent for both internal and external fraud, the greatest number of agencies detected fraud through ‘internal controls/internal audit’, with 42 agencies using this method for internal fraud detection and 33 agencies using this method for external fraud. Once
Box 4 Australian Taxation Office
The ATO is one of Australia’s largest public sector agencies, which in 2009–10 collected net cash revenue of $253.2b. As such, it is an attractive target for those seeking to defraud the Commonwealth.
Since 2006, Project Wickenby, a multi-agency taskforce, has worked across Australia to deter, identify, audit, investigate and prosecute promoters, intermediaries and participants involved in abusive tax haven schemes. Since 2006, 7,243 cases have been completed under Project Wickenby and raised liabilities totalling more than $1.7b.
As a result of Project Wickenby, the ATO has collected $174m from active compliance adjustments and a further $302m has been collected due to improved compliance activities from those previously subject to Wickenby action. As such, Project Wickenby is proving an effective deterrent to tax evaders. The ATO has uncovered that there has been a reduction since 2007–08 in the flow of finances from Australia to tax havens such as Switzerland, Vanuatu and Lichtenstein, areas of focus for Project Wickenby, with a reduction of between 18% and 45% in cash flow between 2007–08 and 2008–09 and from 12% and 40% between 2008–09 and 2009–10. The ATO has put in place a number of publications and educational measures to deter would-be tax evaders and tax practitioners from offending.
One individual was detected and subsequently prosecuted for tax evasion under Project Wickenby. The accused, a solicitor, was a director of a company at the time the alleged offences were committed. Over a period from January to March 2003, the defendant concocted two separate situations where he was evading tax through the use of his overseas banking account based in Switzerland. This led to the defendant being charged with two counts of defrauding the Commonwealth, under the Crimes Act and one count of conspiring to dishonestly cause a risk of loss to a Commonwealth entity, under the Criminal Code. On 15 April 2010, the defendant was convicted by the Supreme Court of Victoria and sentenced to 12 months imprisonment with a condition that he be of good behaviour for 12 months thereafter.
Source: ATO 2010a ; CDPP 2010b

53Conclusions
with cargo terminal operators; and pre-clearance intervention on approximately 161,000 transactions to test compliance and risk.
In April 2010, the Australian Government announced new anti-smoking measures, which included raising the tobacco excise by 25 percent. As such, an increase in tobacco smuggling resulted and led to 60 convictions, $513,616 in fines and penalties and nine custodial sentences ranging from one to 10.5 years (Australian Customs and Border Protection Service 2010).
Box 5 highlights some of the Australian Customs and Border Protection Service activities relating to fraud detection and investigation for 2009–10.
Similarly, Medicare Australia’s National Compliance Program is risk-based and identifies a mixture of activities to support and manage compliance. Factors identified that may lead to non-compliance include incorrect claiming and inappropriate practice by health care providers. Medicare Australia focuses on further refining and extending support services and enhancing the audit system to overcome non-compliance (Medicare Australian 2010). In addition, Medicare Australia implemented a new product to identify and analyse compliance risk in 2009–10. This new product involved examining the nature of the risk, relevant legislation, any factors that cause the risk to occur and any other issues that could affect how Medicare Australia responds (Medicare Australia 2010).
and other monies as a result of a number of Project Wickenby matters (ATO 2010b). Box 4 shows some of the successful outcomes arising from Project Wickenby.
Changes to agency fraud procedures
Agency-specific changes may have an impact on fraud detection and investigation, including advances in staff resourcing and training. In 2009–10, the Australian Customs and Border Protection Service delivered training in fraud control and ethics to 2,473 officers, a substantial increase from the 57 officers trained in 2008–09. The training was provided throughout Australia in accordance with the Fraud Control Framework, which seeks to encourage preparedness, prevention, detection and resolution of fraud-related activity. This level of enhanced training may have contributed to the observed reduction in fraud incidents reported by the Australian Customs and Border Protection Service during that period. In support of prevention activities, the Australian Customs and Border Protection Service implemented the Compliance Action Plan in 2009–10. This is a risk-targeted program of treatments to ensure compliance with Customs and Border Protection requirements. This led to 244 audits of imports and exports and 259 other post-transaction activities to investigate revenue and regulated goods risks; visits to 62 percent of licensed depots and warehouses; engagement
Box 5 Australian Customs and Border Protection Service
The Australian Customs and Border Protection Service investigates serious, complex and sensitive breaches of a range of border controls in accordance with legislation covering customs and the Australian border control. Investigations comply with the Commonwealth Fraud Control Guidelines and the Australian Government Investigation Standards in collaboration with other agencies such as federal, state and territory police.
In 2009–10, the Australian Customs and Border Protection Service inspected (via X-ray) 101,822 sea cargo containers; 1,492,762 air cargo containers; and 62,209,682 items of mail and examined (by actually opening the item) 14,175 sea cargo containers; 66,821 air cargo containers; and 202,858 items of mail.
The activities of the Australian Customs and Border Protection Service led to the prosecution of an excise fraudster during the reporting period. The defendant, one of two directors of a company that was predominantly involved in the importation of goods, (the mailing of clothing into Australia), arranged false statements from six Chinese companies on 57 occasions. These invoices were then used to falsely declare the goods to the Australian Customs and Border Protection Service. By understating the value of the goods, the defendant avoided paying excise duty of $195,524.01. Both company directors were charged with 57 counts of obtaining a financial advantage by deception, under the Criminal Code; the defendant was also charged with an additional 45 counts of aiding, abetting, counselling or procuring the company to obtain a financial advantage by deception. Both company directors pleaded guilty in the Downing Centre Local Court in Sydney on 16 April 2010. The company was fined $195,524.01 and the defendant was sentenced to 16 months imprisonment and released forthwith on condition that he be of good behaviour for 26 months.
Source: Australian Customs and Border Protection Service 2010; CDPP 2010

54 Fraud against the Commonwealth 2009–10 annual report to government
delivering those services. These results highlight the ongoing need for individual agencies to be aware of the unique risks they face and to continually update fraud prevention strategies and control plans so they are tailored to the needs of their agency.
While the results of the survey showed that internal and external fraud are often targeted at different benefits and use different methods, it appeared that they were not entirely separate phenomena. Agencies that experienced either internal or external fraud were significantly more likely to experience the other type as well. This relationship worked in both directions, indicating that while there were differences in the types of incidents between internal and external fraud, agencies were not necessarily more likely to be a victim of one type over the other.
Another consideration to arise from the survey results was that when attempting to measure fraud levels and the risk of victimisation, it is important to analyse data looking at both the number of agencies affected as well as the number of incidents recorded. It has been shown consistently since 2007–08 that a large number of fraud incidents affect only a small number of agencies. Although some fraud types resulted in a substantial loss to the Australian Government because of the large number of incidents or the amount of money lost, these often tended to only affect specific agencies. Fraud types which resulted in a smaller financial loss could affect a larger proportion of Australian Government agencies.
In 2009–10, Medicare Australia received 2,876 tip-offs from health care professionals and members of the public that were further assessed to determine whether non-compliance had occurred. Medicare Australia has seen a significant reduction in frauds reported, which could be attributable to these practices (Medicare Australia 2009). Box 6 highlights some of Medicare Australia’s achievements for 2009–10.
Fraud trends in 2009–10 Australian Government agencies are subject to a diverse range of fraud risks. Agencies can be targeted internally, as well as from external entities, using diverse methods of offending, and fraud attempts can focus on the various benefits or services an agency may provide. The threat posed to governments by external fraud is often different to threats from internal fraud. This year’s survey demonstrated that the types of fraud incidents and methods used for internal and external fraud were often different. Further, the experience of external fraud has been quite different across agencies, and the types of fraud incidents that affect each agency are often unique to the service provided by that body.
While the risks relating to fraud involving social security or visas may appear high due to the large number of incidents reported, these fraud types will only affect the few agencies that are involved with
Box 6 Medicare Australia
As part of its responsibilities to protect the public interest, Medicare Australia has a fraud control program that complies with the Commonwealth Fraud Control Guidelines. Under this program Medicare Australia:
• prepares fraud risk assessments and fraud control plans in accordance with the Guidelines;
• puts in place appropriate fraud prevention, detection, investigation and reporting procedures and processes; and
• collects and reports annual fraud data in line with the Guidelines.
The Australian Government services fraud tip-off line helps Medicare Australia conduct further assessments into fraudulent claims. In 2009–10, Medicare Australia received 1,864 tip-offs from health professionals and members of the public, and a further 1,011 through other avenues which were further assessed to determine whether non-compliance had occurred.
Medicare Australia continued to build on the new compliance framework developed in 2008–09, which expands compliance responses to include provision of targeted information, audits to verify compliance, reviews of practitioners and investigations. During 2009–10, Medicare Australia finalised 3,594 compliance claims, of which eight individuals were referred to the CDPP for criminal prosecution. These eight referrals and four prior referrals led to the prosecution of 12 members of the public, four medical practitioners and one pharmacy/pharmacist and the recovery through repayment orders of almost $418,942 in 2009–10. In addition, Medicare Australia recouped almost $10.3m in the recovery of benefits incorrectly paid through administrative means.
Source: Medicare Australia 20010

55Conclusions
control policies based on knowledge of changing trends in fraud and its prevention. The present report also shows the need for more consistent data-recording practices and measurement of fraud, particularly concerning the question of the extent to which regulatory non-compliance ought to be included within the scope of the Guidelines and survey.
Future data collectionScope of the Guidelines and definitions of fraud
In gathering information for the current report, some agencies alerted the AIC to a number of difficulties they had encountered in responding to the annual survey and in interpreting the provisions of the current Fraud Control Guidelines. Difficulties arose because of the wide diversity in agencies subject to the Guidelines both for fraud risk as well as the size and nature of their operations.
One of the major limitations for agencies in complying with the Guidelines when reporting fraud to the AIC lies in the inability of the Guidelines to ensure consistent data is collected from across agencies and within agencies from year to year. The competing interests of adhering to the Guidelines and developing policy, reporting ‘fraud’ and managing daily, ongoing compliance concerns create complex issues for larger Australian Government agencies. Over the last three years, considerable differences have emerged in the way in which large agencies have defined fraud for reporting purposes, resulting in large variations from year to year. This has led to a lack of clarity in measuring overall levels of fraud experienced.
Although the Guidelines provide a clear statement of what agencies should report each year, there remains a need for greater consistency by agencies in how they interpret the Guidelines regarding annual fraud reporting to the AIC. This could be achieved through publishing explanatory notes and illustrative examples for agencies to use when deciding which matters to report each year.
The size of agencies was also shown to be an important factor in fraud victimisation. Larger agencies in the 2009–10 survey were more likely to have experienced fraud than smaller agencies. This supported previous findings in the private and not-for-profit sectors that larger agencies are more vulnerable to fraud (BDO Chartered Accountants and Advisers 2008; KPMG 2009). The 2010 ANAO survey found that smaller agencies with fewer than 249 employees had less rigorous fraud reporting and fraud control procedures in place (ANAO 2010). This could, arguably, lead to fewer fraud incidents being detected and reported, thus contributing to the overall lower incidence of reported fraud among smaller agencies. Further research is needed to explore this aspect in more depth.
A positive relationship was also found in the results of the present survey between the agency having a dedicated fraud section and detection of fraud. There are a number of possible explanations for this. It could be that having staff dedicated to fraud control leads to enhanced vigilance in detecting fraud within the agency. Alternatively, it could be argued that agencies with enhanced fraud risks, or previous experience of fraud, have found it necessary to increase fraud control resources and staffing to deal with the problem. Again, further research is needed to explore this.
The present report did not attempt to calculate the cost of responding to fraud, although the burden that responding to fraud places on agencies through time, resources and financial losses should not be underestimated. Nor has this report attempted to calculate the cost of fraud prevented through anti-fraud awareness campaigns.
This report has, however, provided policy-relevant information about the types of fraud that affected Australian Government agencies and the methods used to commit them. As the survey used to collect the data for the report is substantially the same as in 2008–09, it was possible to make certain comparisons between the results for the two years. In future years, the results from the annual survey will be able to provide trend data over a greater period of time, which will benefit agencies in preparing fraud

56 Fraud against the Commonwealth 2009–10 annual report to government
Implications for future monitoring of Commonwealth fraud trendsTo address these developments and improve the Commonwealth’s fraud control arrangements, the Australian Government Attorney-General’s Department undertook a review of the Guidelines. Following the review, completed in 2011, a number of improvements have been achieved and greater consistency in reporting should be apparent under the new regime. In May 2010 the ANAO also released a performance audit of the fraud control arrangements of Australian Government agencies (ANAO 2010). Both these activities have provided an opportunity for refining and improving federal fraud control arrangements.
The ANAO found that 97 percent of respondent agencies reported that they use the definition of fraud as specified in the Guidelines (ANAO 2010). This represents a marked improvement since 2002, when the ANAO reported that only 50 percent of agencies were defining fraud as specified in the Guidelines (ANAO 2010).
However, recalling the ANAO findings presented earlier in this paper, the ANAO echoed AIC findings that an inherent issue in collecting comparable data relating to fraud relates to the inconsistent use of fraud definitions—‘The integrity of such trend information is contingent upon common definitions for fraud’ (ANAO 2010:14).
As was evident in the previous year’s fraud report, the results for 2009–10 provide an increased level of policy-relevant information and more analysis than was available in previous years. Including specific
Training within Australian Government agencies
As agencies are responsible for investigating the bulk of fraud allegations themselves, rather than referring them to the AFP, it is imperative that the quality of training provided to the fraud personnel is adequate. In 2009-10, agencies indicated that 99 percent of external fraud incidents were investigated by agencies themselves (659,899 of 665,846 incidents where information on investigation was provided), and 97 percent of internal fraud incidents % (2,553 of 2,633 incidents where information on investigation was provided. While these differences may be attributed to the differences between the two fraud types, it does demonstrate the importance of the investigation process. The large number of fraud investigations carried out by agencies increases the importance of agencies having a clear understanding of the nature and extent of fraud affecting Australian Government agencies. These agencies need to be funded adequately and provided with the resources necessary to prevent and control fraud as it affects them. As noted above, 34 agencies completed the open-ended questions pertaining to training for fraud personnel in the 2009–10 survey, and 32% (n=11) expressed a desire for fraud personnel to have enhanced training opportunities, such as tertiary qualifications in fraud control or investigations, as long as it was uniform across the APS agencies involved. Currently, the Certificate IV in Government (Investigations) is recommended for personnel in fraud sections. However, the quality of the information within the course differs between training institutions, which can lead to non-uniform practices between agencies.

57Conclusions
to provide more specific information to deal with this problem will be investigated for use in future surveys. It is important to note, however, that it is only with greater understanding of how fraud incidents occur that preventive measures can be devised and implemented.
A further area of research for future reports includes the determination of the profile of fraudsters offending against the Commonwealth. The revised 2010–11 survey instrument will include a new section asking respondents to provide information about the ‘most serious fraud’ case of internal fraud that they experienced during the preceding financial year. It is hoped that this information can lead to an enhanced understanding of the types of fraud affecting agencies, how employees are involved in fraud and what preventive actions can be taken to reduce the risk of fraud incidents taking place in Australian Government agencies.
Fraud remains a problem for all public sector bodies and, because the Australian Government deals in such large amounts of revenue collection and payment of benefits and refunds, opportunities for dishonesty will always be present. Knowing with certainty where fraud takes place and how individuals perpetrate acts will provide an evidence base that can be used by all agencies to design appropriate risk-reduction measures. If successful, these could lead to considerable savings for the Australian Government, arguably far in excess of the amounts required to implement the control measures in question. It is through the regular collection of data on agencies’ experience of fraud that the effectiveness of fraud-reduction activities can be measured and adjusted to maximise loss reduction across the sector as a whole.
questions on fraud types and methods has allowed for a better understanding of the types of fraud affecting agencies and resulting in loss of revenue for the government. However, this survey has been, and will continue to be, limited owing to the manner in which the Guidelines are expressed and the definition of fraud adopted. Although the ANAO report (2010) found that agencies generally defined fraud in accordance with the definition provided in the Guidelines, there is no available evidence to indicate whether agencies adopt the same interpretation of fraud as each other. The way agencies define fraud and interpret the guidelines has a direct impact on what they then report in the survey and how that information can then be used for preventive action and policy reform. Further qualitative investigations are needed to explore this aspect in greater depth, to determine how uniform the definition of fraud is across agencies and how differences may affect the nature and extent of fraud reported.
Future research could further explore the problem of external fraud, which accounts for by far the largest proportion of fraud detected by agencies, particularly the largest agencies. It would be useful to explore why these large agencies have apparently good levels of protection against internal fraud and yet continue to remain vulnerable to external fraud risks.
Other areas of external fraud risks that future surveys could address include the need for further categorisation of methods of fraud. The 2009–10 report demonstrated that agencies tend to overuse the ‘other’ categories when given the option. For example, when examining the methods used in external fraud incidents, 608,704 incidents, reported by 40 agencies, were classified as involving ‘other’ methods of commission. Ways of enabling agencies

58 Fraud against the Commonwealth 2009–10 annual report to government
References
All URLs correct at 1 February 2012
Association of Certified Fraud Examiners 2010 (ACFE). 2010 Global fraud study: Report to the nations on occupational fraud and abuse. Austin TX: ACFE
Attorney-General’s Office 2006. Fraud review: Final report. London: Attorney-General’s Office
Auditing and Assurance Standards Board (AUASB) 2006. The auditor’s responsibility to consider fraud in an audit of a financial report. Auditing standard ASA 240. Melbourne: AUASB
Australian Bureau of Statistics 2011. Federal defendants, selected states and territories 2009–10. ABS cat. no. 4515.0. Melbourne: ABS
Australian Bureau of Statistics 2008. Personal fraud 2007. ABS cat. no. 4528.0. Melbourne: ABS
Australian Competition and Consumer Commission (ACCC) 2008. Carbon offset claims: Trade practices issues and other key concerns. Canberra: ACCC
Australian Customs and Border Protection Service 2010. Annual report 2009–10. Canberra: Australian Customs and Border Protection Service
Australian Food and Grocery Council 2008. Carbon Pollution Reduction Scheme Green Paper submission no. 774. Canberra. http://www.climatechange.gov.au/publications/cprs/green-paper/cprs-greenpaper.aspx
Australian Government 2008. Carbon Pollution Reduction Scheme White Paper. Canberra
Australian National Audit Office (ANAO) 2010. Fraud control in Australian Government agencies. Audit report no. 42 2009–10. Canberra: ANAO
Australian National Audit Office (ANAO) 2004. Survey of fraud control arrangements in APS agencies. Audit report no. 14 2003–04. Canberra: ANAO
Australian National Audit Office (ANAO) 2000. Survey of fraud control arrangements in APS agencies. Performance audit report no. 47 1999–2000. Canberra: ANAO
Australian Payments Clearing Association Ltd 2010. Payment fraud statistics 2009–10. Canberra: Australian Payments Clearing Association Ltd
Australian Taxation Office 2010a. Annual report 2009–10. Canberra: Australian Taxation Office
Australian Taxation Office 2010b. Project Wickenby: Is it worth the risk? Results at 30 September 2010. Canberra: Australian Taxation Office. http://www.ato.gov.au/corporate/content.asp?doc=/content/00220075.htm&page=7&H7
Barrett R 2011. Carbon scheme ‘open to fraud’. The Australian, 30 September: 6
BDO Chartered Accountants and Advisers 2010. Not-for-profit fraud survey: 2010. Brisbane: BDO
BDO Chartered Accountants and Advisers 2008. Not-for-profit fraud survey: 2008. Brisbane: BDO
Centrelink 2010. Annual report 2009–10. Canberra: Centrelink
Clarke RVG & Mayhew P (eds) 1980. Designing out crime. London: HMSO
Commonwealth Director of Public Prosecutions (CDPP) 2010. Annual report 2009–10. Canberra: CDPP

59References
National Fraud Authority 2010. Annual fraud indicator, January 2010. London: National Fraud Authority. http://www.attorneygeneral.gov.uk/nfa/GuidetoInformation/Documents/NFA_fraud_indicator.pdf
PricewaterhouseCoopers 2011. Findings from the 2011 Global State of Information Security Survey. Berlin: PricewaterhouseCoopers
PricewaterhouseCoopers 2009. Economic crime: People, culture & controls. The 5th biennial global economic crime survey. Berlin: PricewaterhouseCoopers
PricewaterhouseCoopers 2007. Economic crime: People, culture & controls. The 4th biennial global economic crime survey. Berlin: PricewaterhouseCoopers
Rollings K 2008. Counting the costs of crime in Australia: A 2005 update. Research and public policy series no. 91. Canberra: Australian Institute of Criminology. http://www.aic.gov.au/publications/current series/rpp/81-99/rpp91.aspx
Smith RG 2008. Coordinating individual and organisational responses to fraud. Crime, law and social change 49(5): 379–396
Smith RG 2003. Serious fraud in Australia and New Zealand. Research and public policy series no. 48. Canberra: Australian Institute of Criminology and PricewaterhouseCoopers. http://www.aic.gov.au/publications/current series/rpp/41-60/rpp48.aspx
Smith RG & Grabosky PN 1998. Taking fraud seriously: Issues and strategies for reform. Sydney: Institute of Chartered Accountants in Australia, Fraud Advisory Council
Smith RG & Jorna P 2011. Corrupt misuse of information and communications technologies, in Graycar A & Smith RG (eds), Handbook of global research and practice in corruption. Cheltenham: Edward Elgar Publishing Ltd
United Nations 2009. Report of the commission on crime prevention and criminal justice on its eighteenth session: Draft resolution I: International cooperation in the prevention, investigation, prosecution and punishment of economic fraud and identity-related crime. E/2009/30–E/CN.15/2009/20. New York: United Nations http://www.unodc.org/documents/commissions/CCPCJ-session18/CCPCJ18-Documents/E_CN15_2009_20.pdf
Victorian Parliament, Drugs and Crime Prevention Committee 2004. Inquiry into fraud and electronic commerce: Final report of the Drugs and Crime Prevention Committee. Melbourne: Parliament of Victoria
Choo K-KR, Smith RG & McCusker R 2007. Future directions in technology-enabled crime: 2007–09. Research and public policy series no. 78. Canberra: Australian Institute of Criminology. http://www.aic.gov.au/publications/current series/rpp/61-80/rpp78.aspx
Ernst & Young 2010. (11th Global fraud survey) Driving ethical growth: New markets, new challenges. Sydney: Ernst & Young
Fraud Advisory Panel 2006. Which way now? Evaluating the government’s fraud review. London: Fraud Advisory Panel
Grabosky P 1991. Controlling fraud, waste and abuse in the public sector. Canberra: Australian Institute of Criminology. http://www.aic.gov.au/documents/D/8/5/%7BD85289A2-1BD1-4652-ABD3-C85F0A9F5082%7Dfraud.pdf
Grabosky PN, Smith RG & Dempsey G 2001. Electronic theft: Unlawful acquisition in cyberspace. Cambridge: Cambridge University Press
KPMG 2011. Fraud Barometer, edition 4. Sydney: KPMG
KPMG 2010. Fraud and misconduct survey 2010. Sydney: KPMG
KPMG 2009. Fraud survey 2008. Sydney: KPMG
KPMG 2006. Fraud survey 2006. Sydney: KPMG
Kroll 2010. Global fraud report 2010–11. New York: The Economist Intelligence Unit and Kroll
Kroll 2009. Global fraud report 2008–09. New York: The Economist Intelligence Unit and Kroll
Levi M & Smith RG 2011. Fraud vulnerabilities and the global financial crisis. Trends and Issues in Crime and Criminal Justice, no. 422, Canberra: Australian Institute of Criminology
Macalister T & Webb T 2011. Carbon fraud may force longer closure of EU emissions trading. The Guardian. http://www.guardian.co.uk/environment/2011/jan/23/carbon-trading-scheme-security-delay
Mayhew P 2003. Counting the costs of crime in Australia: Technical report. Technical and background paper series no. 4. Canberra: Australian Institute of Criminology. http://www.aic.gov.au/publications/current series/tbp/1-20/tbp004.aspx
Medicare Australia 2010. Annual report 2009–10. Canberra: Medicare Australia
National Fraud Authority 2011. Annual fraud indicator, January 2011. London: National Fraud Authority. http://www.attorneygeneral.gov.uk/nfa/WhatAreWeSaying/Documents/AFI%202011.pdf

Appendixes

61Appendix 1: Survey
Respondent information
Question 1: On behalf of which agency are you completing this survey?
Question 2: Please provide the following information concerning the person who completed this survey:
Name
Phone number Area ( ) Number
Branch or division of employment
Question 3: Which of the following best describes your agency’s legislative governance?
Financial Management and Accountability Act 1997 (Cth)
Commonwealth Authorities and Companies Act 1997 (CAC) for agencies that receive at least 50 percent of funding for their operating costs from the Commonwealth or a Commonwealth agency
Commonwealth Authorities and Companies Act 1997 (CAC) for agencies that do not receive at least 50 percent of funding for their operating costs from the Commonwealth or a Commonwealth agency
Other
Don’t know
Certifying compliance in annual reports to Parliament
Question 4: Has your Chief Executive Officer certified to your Minister or Presiding Officer, in your agency’s 2009-10 annual report, that he or she is satisfied that their agency has adequate fraud control measures that comply with the Guidelines (including reporting) for the 2009–10 financial year?
Yes
No
Don’t know
Question 5: In which financial year was your agency’s most recent fraud risk assessment completed (fraud risk assessments need not necessarily be stand-alone activities)?
2009–10
2008–09
2007–08
Prior to 2007–08
Never had a fraud risk assessment
Appendix 1: Survey

62 Fraud against the Commonwealth 2009–10 annual report to government
Question 6: When was your agency’s most recent fraud control plan developed (fraud control plans need not necessarily be stand-alone documents)?
2008–09
2007–08
2006–07
Prior to 2006–07
Never had a fraud control plan
Suspected fraud incidents
Definitions
Allegation of fraud
An allegation is a statement or accusation by a person that an offence has or may have been committed. This does not require substantial proof of the offence or identification of suspects.
Internal fraud
For the purposes of this survey, ‘internal fraud’ means any incident of suspected fraud allegedly committed by an employee of the agency.
External fraud
For the purposes of this survey, ‘external fraud’ means any incident of suspected fraud allegedly committed by a person other than an employee of the agency.
Incident
Separate occasions of fraud are called ‘incidents’. When completing this survey an incident refers to all fraudulent offences alleged against a single suspect during one investigation. One incident may take place on a single date or over a period of time and might comprise a number of offences that are actually prosecuted.
The basis for inclusion of incidents in this survey is an allegation where there exists sufficient evidence to warrant an initial investigation by the agency. Incidents should be included even if the allegations turn out to have no substance after examination, however do not include incidents involving vindictive or frivolous complaints if these are unsubstantiated and no investigation is undertaken.
Focus of fraud
This section relates to the focus of the alleged fraud incidents, i.e. the resource or object of benefit targeted by the alleged incident. An incident may involve more than one focus of fraud, please include multiple targets where applicable.
Method
This section refers to the methods used to carry out the alleged fraud incidents. An incident may involve the use of more than one method, please include multiple methods where applicable.
Timeframe
The timeframe for incidents is the 2009–10 financial year. The start date of an incident should be the date the agency was notified of or discovered the allegation.
Noncompliance
Noncompliance is the failure to meet conditions and obligations set out, for example visa conditions. It may occur through a lack of understanding or awareness of obligations, because compliance is difficult or it may be deliberate. If evidence cannot establish the requisite degree of intention, recklessness or negligence in adhering to obligations, noncompliance, as opposed to fraud may result.
Suspected fraud incidents
When answering the following questions, information should be provided with respect to types of fraud alleged against individual suspects. For the purposes of this survey, fraud has been divided into categories of ‘internal’ and ‘external’ fraud. These refer to incidents carried out by suspects who were either internal or external to an agency.

63Appendix 1: Survey
Question 7: What is the total number of fraud incidents that your agency experienced in the financial year 2009–10?
Question 8: Of the incidents above, how many involved internal fraud?
Question 9: Of the incidents above, how many involved external fraud?
Question 10: Of the incidents above, how many involved collusion between internal and external parties?
Internal fraud
For the purposes of this survey, ‘internal fraud’ refers to any incident of suspected fraud allegedly committed by an employee or contractor of the agency.
Internal fraud incidents
Question 11: Throughout the 2009–10 financial year did your agency identify or have reported to it any alleged incidents of internal fraud?
Yes
No (Skip to question 41)
Focus of internal fraud incidents
This section relates to the focus of the alleged fraud incidents, i.e. the resource or object of benefit targeted by the alleged incident. A fraud incident may include more than one focus, please include multiple targets where applicable.
Question 12: Did your agency experience any incidents of fraud which focussed on equipment (an example is provided in the glossary)?
Yes
No (Skip to question 14)
Don’t know (Skip to question 14)
Question 13: How many alleged incidents of internal fraud were focussed on obtaining each of the following categories of equipment?
EQUIPMENT
Theft of telecommunications or computer equipment (including mobile devices)
Theft of other government equipment
Theft of consumable stock (office related)
Theft of consumable stock (other)
Misuse of government equipment
Unable to be determined
Other—please specify type
Question 14: Did your agency experience any incidents of fraud which focussed on entitlements (an example is provided in the glossary)?
Yes
No (Skip to question 16)
Don’t know (Skip to question 16)
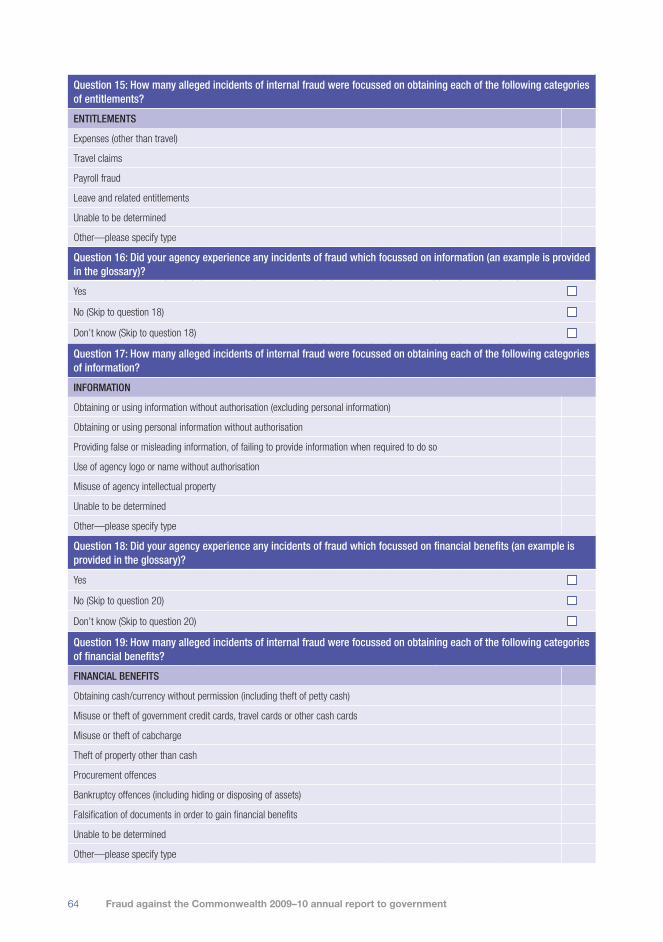
64 Fraud against the Commonwealth 2009–10 annual report to government
Question 15: How many alleged incidents of internal fraud were focussed on obtaining each of the following categories of entitlements?
ENTITLEMENTS
Expenses (other than travel)
Travel claims
Payroll fraud
Leave and related entitlements
Unable to be determined
Other—please specify type
Question 16: Did your agency experience any incidents of fraud which focussed on information (an example is provided in the glossary)?
Yes
No (Skip to question 18)
Don’t know (Skip to question 18)
Question 17: How many alleged incidents of internal fraud were focussed on obtaining each of the following categories of information?
INFORMATION
Obtaining or using information without authorisation (excluding personal information)
Obtaining or using personal information without authorisation
Providing false or misleading information, of failing to provide information when required to do so
Use of agency logo or name without authorisation
Misuse of agency intellectual property
Unable to be determined
Other—please specify type
Question 18: Did your agency experience any incidents of fraud which focussed on financial benefits (an example is provided in the glossary)?
Yes
No (Skip to question 20)
Don’t know (Skip to question 20)
Question 19: How many alleged incidents of internal fraud were focussed on obtaining each of the following categories of financial benefits?
FINANCIAL BENEFITS
Obtaining cash/currency without permission (including theft of petty cash)
Misuse or theft of government credit cards, travel cards or other cash cards
Misuse or theft of cabcharge
Theft of property other than cash
Procurement offences
Bankruptcy offences (including hiding or disposing of assets)
Falsification of documents in order to gain financial benefits
Unable to be determined
Other—please specify type

65Appendix 1: Survey
Question 20: Did your agency experience any incidents of fraud which focussed on any other types of fraud?
Yes
No (Skip to question 22)
Don’t know (Skip to question 22)
Question 21: How many alleged incidents of internal fraud involved other types of fraud?
OTHER
Please enter type
Please enter type
Please enter type
Please enter type
Internal fraud methods
This section relates to the methods used to carry out the alleged fraud incidents. An incident may involve the use of more than one method, please include multiple methods where applicable.
Question 22: Of the incidents specified above in the ‘Focus’ section, did any involve misuse of information technologies to carry out the fraud?
Yes
No (Skip to question 24)
Don’t know (Skip to question 24)
Question 23: Of the incidents specified above, did any involve misuse of IT to carry out the fraud? (an example is provided in the glossary)
MISUSE OF INFORMATION TECHNOLOGIES
Accessing information via a computer without authorisation
Copying or altering data or programs without information
Misuse of email
Manipulation of a computerised accounting system
Insertion of malicious code
Interference with computer networks
Unable to be determined
Other—please specify type
Question 24: Of the incidents specified above, did any involve misuse of identity to carry out the fraud? (an example is provided in the glossary)
Yes
No (Skip to question 26)
Don’t know (Skip to question 26)

66 Fraud against the Commonwealth 2009–10 annual report to government
Question 25: How many alleged incidents of internal fraud involved each of the following methods relating to Misuse of Identity?
MISUSE OF IDENTITY
Creating and/or using a fictitious identity
Use of another employee’s or contractor’s identity without their knowledge
Fraudulently using another person’s identity with their permission
Unauthorised use of another person’s password, PIN or access pass
Unauthorised use of another person’s TFN or ABN
Unable to be determined
Other.—please specify type
Question 26: Of the incidents specified above, did any involve misuse of documents to carry out the fraud? (an example is provided in the glossary)
Yes
No (Skip to question 28)
Don’t know (Skip to question 28)
Question 27: How many alleged incidents of internal fraud involved each of the following methods relating to documents?
MISUSE OF DOCUMENTS
Creating and/or using a false or altered agency document
Creating and/or using a false or altered document (not belonging to the agency)
Dishonestly concealing documents
Failing to provide documents when required to do so
Unable to be determined
Other—please specify type
Question 28: Of the incidents specified above, did any involve corruption to carry out the fraud? (an example is provided in the glossary)
Yes
No (Skip to question 30)
Don’t know (Skip to question 30)
Question 29: How many alleged incidents of internal fraud involved each of the following categories of corruption?
CORRUPTION
Bribery of an employee
Accepting kickbacks or gratuities
Failure to disclose/ Abuse of a conflict of interest
Collusion or conspiracy (include collusion or conspiracy with internal and external parties)
Abuse of power
Unable to be determined
Other—please specify type

67Appendix 1: Survey
Question 30: Did your agency experience any incidents of fraud that involved other methods?
Yes
No (Skip to question 32)
Don’t know (Skip to question 32)
Question 31: How many alleged incidents of internal fraud involved other methods of committing fraud?
OTHER
Please enter type
Please enter type
Please enter type
Please enter type
Detection of internal fraud
Question 32: How many alleged incidents of internal fraud were primarily detected in each of the following ways:
Internal controls/audit/investigation
Staff member/colleague discovered/ reported
Internal anonymous whistleblower/ informant
External audit/ investigation
Notification by police or other law enforcement agencies/investigation
External whistleblower/ informant (not anonymous)
Credit card issuer
Media
Offender self-reported
Unable to be determined
Other—please specify type
Internal fraud investigation
Question 33: How many incidents of alleged internal fraud were investigated in each of the following ways? If the incident was investigated initially by the agency, please include the investigations that took place after this initial enquiry
If the incident was initially investigated by your agency please answer with regard to the way investigations were carried out after this initial enquiry.
Agency internal investigation only—no external investigation
External investigator
Australian Federal Police
State or Territory police
Credit card issuer
Media
Another agency
Other—please specify type

68 Fraud against the Commonwealth 2009–10 annual report to government
Internal fraud referrals
Question 34: How many alleged incidents of internal fraud that were referred to the following agencies within the 2009–10 financial year related to each of the following targets?
AFP State or Territory Police CDPP
Equipment
Entitlements
Financial
Information
Other
Question 35: How many alleged incidents of internal fraud that were referred to the following agencies within the 2009–10 financial year involved each of the following methods?
AFP State or Territory Police CDPP
Misuse of IT
Misuse of identity
Misuse of documents
Corruption
Other
Internal fraud suspects
Question 36: How many persons were suspected of each of the following types of internal fraud?
Equipment
Entitlements
Financial
Information
Corruption
Other
Question 37: Of each of the suspects of internal fraud, what was their primary role and total duration of employment? If none enter ‘0’
Length of employment
PositionLess than one year
1–<3 years3–<6 years
6–<9 yearsMore than
9 yearsDon’t know
Junior/non-management position
Management
Executive/Senior management
Other
Don’t know

69Appendix 1: Survey
Internal fraud losses and recoveries
Question 38: How much is estimated to have been lost to the agency in relation to each of the following types of internal fraud during 2009–10?
Please indicate whole dollars thought to have been lost to the agency, prior to the recovery of any funds, and excluding the costs of investigation or prosecution
Enter dollars hereInsert an X if other losses were
suffered that cannot be quantified
Equipment $
Entitlements $
Financial $
Information $
Corruption $
Other $
Question 39: During the 2009–10 financial year, did your agency recover any monies in respect of all incidents of alleged fraud?
This question refers to money recovered by the agency. Do not include money recovered through fines if this does not return to the agency.
Yes
No (Skip to question 41)
Don’t know (Skip to question 41)
Question 40: Please indicate how many dollars were recovered during 2009–10 using each of the following methods in respect of all incidents of alleged fraud:
Criminal prosecutions Civil remedyAdministrative
remedyOther means
Equipment
Entitlements
Financial
Information
Corruption
Other
External fraud
For the purposes of this survey, ‘external fraud’ means any incident of suspected fraud allegedly committed by a person other than an employee of the agency
External fraud incidents

70 Fraud against the Commonwealth 2009–10 annual report to government
Question 41: Throughout the 2009–10 financial year did your agency identify or have reported to it any alleged incidents of external fraud?
Yes
No (Skip to question 70)
Focus of external fraud incidents
This section relates to the focus of the alleged fraud incidents, i.e. the resource or object of benefit targeted by the alleged illegality. A fraud incident may include more than one focus, please include multiple targets where applicable.
Question 42: Did your agency experience any incidents of fraud which focussed on equipment? (an example is provided in the glossary)
Yes
No (Skip to question 44)
Don’t know (Skip to question 44)
Question 43: How many alleged incidents of external fraud were focussed on obtaining each of the following categories of equipment?
EQUIPMENT
Theft of telecommunications or computer equipment (including mobile devices)
Theft of other government equipment
Theft of consumable stock (office related)
Theft of consumable stock (other)
Misuse of government equipment
Unable to be determined
Other—please specify type
Question 44: Did your agency experience any incidents of fraud which focussed on entitlements? (an example is provided in the glossary)
Yes
No (Skip to question 46)
Don’t know (Skip to question 46)
Question 45: How many alleged incidents of external fraud involved each of the following categories of entitlements?
ENTITLEMENTS
Misusing or claiming benefits without entitlement relating to housing
Misusing or claiming benefits without entitlement relating to social security
Misusing or claiming benefits without entitlement relating to health benefits
Misusing or claiming benefits without entitlement relating to visas/citizenship
Misusing, evading or claiming benefits without entitlement relating to child support
Revenue fraud
Customs and excise fraud (evading excise)
Unable to be determined
Other—please specify type
Other—please specify type
Other—please specify type
Other—please specify type

71Appendix 1: Survey
Question 46: Did your agency experience any incidents of external fraud which focussed on financial benefits? (an example is provided in the glossary)
Yes
No (Skip to question 48)
Don’t know (Skip to question 48)
Question 47: How many alleged incidents of external fraud involved each of the following categories of financial benefits?
FINANCIAL BENEFITS
Obtaining cash/currency without permission (including theft of petty cash)
Misuse or theft of government credit cards, travel cards or other cash cards
Theft or misuse of cabcharge
Theft of property other than cash
Procurement offences
Fictitious claims/forgery
Unable to be determined
Other—please specify type
Question 48: Did your agency experience any incidents of external fraud which focussed on information? (an example is provided in the glossary)
Yes
No (Skip to question 50)
Don’t know (Skip to question 50)
Question 49: How many alleged incidents of external fraud were focussed on obtaining each of the following categories of information?
INFORMATION
Obtaining or using information without authorisation (excluding personal information)
Providing false or misleading information, or failing to provide information when required to do so
Obtaining or using personal information without authorisation
Use of agency logo or name without authorisation
Misuse of agency intellectual property
Unable to be determined
Other—please specify type
Question 50: Did your agency experience any incidents of external fraud which focussed on any other types of fraud?
Yes
No (Skip to question 52)
Don’t know (Skip to question 52)

72 Fraud against the Commonwealth 2009–10 annual report to government
Question 51: How many alleged incidents of external fraud involved other categories of fraud?
OTHER
Please enter type
Please enter type
Please enter type
Please enter type
External fraud methods
This section relates to the methods used to carry out the alleged fraud incidents. An incident may involve the use of more than one method, please include multiple methods where applicable.
Question 52: Of the incidents specified above, did any involve misuse of IT to carry out the fraud? (an example is provided in the glossary)
Yes
No (Skip to question 54)
Don’t know (Skip to question 54)
Question 53: How many alleged incidents of external fraud involved each of the following methods relating to information technologies?
MISUSE OF INFORMATION TECHNOLOGIES
Accessing information via a computer without authorisation
Copying or altering data or programs without authorisation
Manipulation of a computerised accounting system
Insertion of malicious code
Interference with computer networks
Unable to be determined
Other—please specify type
Question 54: Of the incidents specified above in the ‘Focus’ section, did any involve misuse of identity to carry out the fraud?
Yes
No (Skip to question 56)
Don’t know (Skip to question 56)
Question 55: How many alleged incidents of external fraud involved each of the following methods relating to identity?
MISUSE OF IDENTITY
Creating and/or using a fictitious identity/forgery
Use of an employee’s or contractor’s identity without their knowledge
Fraudulently using another person’s identity with their permission
Unauthorised use of another person’s password, PIN or access pass
Unauthorised use of another person’s TFN or ABN
Unable to be determined
Other—please specify type

73Appendix 1: Survey
Question 56: Of the incidents specified above, did any involve misuse of documents to carry out the fraud? (an example is provided in the glossary)
Yes
No (Skip to question 58)
Don’t know (Skip to question 58)
Question 57: How many alleged incidents of external fraud involved each of the following methods relating to documents?
MISUSE OF DOCUMENTS
Creating and/or using a false or altered agency document
Creating and/or using a false or altered document (not belonging to the agency)
Dishonestly concealing documents
Failing to provide documents when required to do so
Unable to be determined
Other—please specify type
Question 58: Of the incidents specified above, did any involve corruption to carry out the fraud? (an example is provided in the glossary)
Yes
No (Skip to question 60)
Don’t know (Skip to question 60)
Question 59: How many alleged incidents of external fraud involved each of the following methods of corruption?
CORRUPTION
Bribery of an employee
Accepting kickbacks or gratuities
Failure to disclose/ abuse of a conflict of interest
Collusion or conspiracy (include collusion or conspiracy with internal and external parties)
Abuse of power
Unable to be determined
Other—please specify type
Question 60: Did your agency experience any incidents of fraud that involved other methods?
Yes
No (Skip to question 62)
Don’t know (Skip to question 62)
Question 61: How many alleged incidents of external fraud involved other methods of committing fraud?
OTHER
Please enter type
Please enter type
Please enter type
Please enter type

74 Fraud against the Commonwealth 2009–10 annual report to government
Detection and investigation of external fraud
Question 62: How many alleged incidents of external fraud were primarily detected in each of the following ways?
Internal controls/ audit/ investigation
Staff member/ colleague discovered
Internal anonymous whistleblower/ informant
External audit/ investigation
Notification by police or other law enforcement agencies/ investigation
External whistleblower/ informant (not anonymous)
Media
Offender self-reported
Not recorded/unknown
Other—please specify type
Question 63: How many alleged incidents of external fraud were investigated in each of the following ways?
If the incident was initially investigated by your agency please answer with regard to the way investigations were carried out after this initial enquiry.
Agency internal investigation only—no external investigation
External investigator
Australian Federal Police
State or Territory police
Media
Another agency
Other—please specify type
External fraud referrals
Question 64: How many alleged incidents of external fraud that were referred to the following agencies within the 2009–10 financial year related to each of the following targets?
AFP State or Territory police CDPP
Equipment
Entitlements
Financial
Information
Other
Question 65: How many alleged incidents of external fraud that were referred to the following agencies within the 2009–10 financial year involved each of the following methods?
AFP State or Territory police CDPP
Misuse of IT
Misuse of identity
Misuse of documents
Corruption
Other

75Appendix 1: Survey
External fraud suspects
Question 66: How many persons were suspected of each of the following types of external fraud?
Equipment
Entitlements
Financial
Information
Corruption
Other
External fraud losses and recoveries
Question 67: How much is estimated to have been lost to the agency in relation to each of the following types of external fraud?
Enter dollars herePlace an X if other losses were
suffered that cannot be quantified
Equipment $
Entitlements $
Financial $
Information $
Corruption $
Other $
Question 68: During the 2009–10 financial year did you agency recover any monies in respect of any incidents of external fraud?
Yes
No (Skip to question 70)
Don’t know (Skip to question 70)
Question 69: Please indicate how many dollars were recovered during the 2009–10 financial year using each of the following methods in respect of all incidents of alleged external fraud:
Criminal prosecutions Civil remediesAdministrative
remediesOther means
Equipment
Entitlements
Financial
Information
Corruption
Other
Agency fraud resources
The following section relates to full-time equivalent staff, e.g. two employees each working half the hours of a full time employee should be counted as one.
Question 70: What was the total number of staff in your agency at the end of the 2009–10 financial year?
Ongoing employees
Non-ongoing employees

76 Fraud against the Commonwealth 2009–10 annual report to government
Question 71: At the end of the 2009–10 financial year, how many staff did your agency have dedicated to fraud control in the following areas?
Prevention
Investigation
Other
Question 72: Of the number of staff dedicated to fraud control how many had a formal qualification as indicated in the Commonwealth Fraud Control Guidelines? E.g. a certificate or diploma in fraud investigation or similar
Prevention
Investigation
Other
Question 73: What changes would you suggest, if any, for improving the training of staff in the area of fraud control?
Additional Information
Question 74: What has made a difference in your agency to prevent fraud in the 2009–10 financial year?
Question 75: What has made a difference in your agency to detect fraud in the 2009–10 financial year?
Question 76: Please provide any general comments or feedback
Question 77: Please provide an estimate of the time taken to complete this survey
Hours Mins

77Appendix 2: Respondent agencies
Responding FMA Act agencies and CAC Act agencies that receive at least 50 percent government fundingAboriginal Hostels Ltd
Administrative Appeals Tribunal
Aged Care Standards and Accreditation Agency Ltd
Attorney General’s Department
AusAID
Australia Council
Australian Broadcasting Corporation
Australian Bureau of Statistics
Australian Centre for International Agricultural Research
Australian Commission for Law Enforcement Integrity
Australian Communications and Media Authority
Australian Competition and Consumer Commission
Australian Crime Commission
Australian Curriculum, Assessment and Reporting Authority
Australian Customs and Border Protection Service
Australian Electoral Commission
Australian Federal Police
Australian Film Television and Radio School
Australian Fisheries Management Authority
Australian Human Rights Commission
Australian Industry Development Corporation
Australian Institute of Aboriginal and Torres Strait Islander Studies
Australian Institute of Criminology
Australian Institute of Family Studies
Australian Institute of Health and Welfare
Australian Institute of Marine Science
Australian Law Reform Commission
Australian Learning and Teaching Council Ltd
Australian Maritime Safety Authority
Appendix 2: Respondent agencies

78 Fraud against the Commonwealth 2009–10 annual report to government
Australian National Audit office
Australian National Maritime Museum
Australian National University
Australian Nuclear Science and Technology Organisation
Australian Office of Financial Management
Australian Organ and Tissue Donation and Transplantation Authority
Australian Pesticides and Veterinary Medicines Authority
Australian Prudential Regulation Authority (APRA)
Australian Public Service Commission
Australian Radiation Protection and Nuclear Safety Agency
Australian Research Council
Australian Reward Investment Alliance
Australian Securities and Investments Commission
Australian Security Intelligence Organisation
Australian Solar Institute Limited
Australian Sports Anti-Doping Authority
Australian Sports Commission
Australian Strategic Policy Institute Limited
Australian Taxation Office
Australian Trade Commission (Austrade)
Australian Transaction Reports and Analysis Centre
Australian Transport Safety Bureau
Australian War Memorial
Bundanon Trust
Bureau of Meteorology
Cancer Australia
Centrelink
Coal Mining Industry (Long Service Leave Funding) Corporation
Comcare
Commonwealth Department of Veterans’ Affairs
Commonwealth Grants Commission
Commonwealth Rehabilitation Services
Commonwealth Superannuation Administration (ComSuper)
Corporations and Markets Advisory Committee
Criminology Research Council
CrimTrac
CSIRO
Department of Agriculture, Fisheries and Forestry
Department of Broadband, Communications and the Digital Economy
Department of Climate Change and Energy Efficiency

79Appendix 2: Respondent agencies
Department of Defence and Defence Material Organisation
Department of Education, Employment and Workplace Relations
Department of Families, Housing, Community Services and Indigenous Affairs
Department of Finance and Deregulation
Department of Foreign Affairs and Trade
Department of Health and Ageing
Department of Human Services
Department of Immigration and Citizenship
Department of Infrastructure Transport Regional Development and Local Government
Department of Innovation, Industry, Science and Research
Department of Parliamentary Services
Department of Resources, Energy and Tourism
Department of the Environment, Water, Heritage and the Arts
Department of the House of Representatives
Department of the Prime Minister and Cabinet
Department of the Senate
Department of the Treasury
Director of National Parks
Equal Opportunity for Women in the Workplace Agency
Fair Work Australia
Family Court of Australia
Federal Court of Australia
Federal Magistrates Court of Australia
Fisheries Research and Development Corporation
Food Standards Australia New Zealand
Future Fund Management Agency
General Practice Education and Training Ltd
Geoscience Australia
Grains Research and Development Corporation
Grape and Wine Research and Development Corporation
Great Barrier Reef Marine Park Authority
Health Workforce Australia
HIH Claims Support Ltd
IIF Foundation Pty Ltd
IIF Investments Pty Ltd
Indigenous Land Corporation
Insolvency and Trustee Service Australia
Inspector-General of Taxation
IP Australia
Medicare Australia

80 Fraud against the Commonwealth 2009–10 annual report to government
Migration Review Tribunal - Refugee Review Tribunal
Murray-Darling Basin Authority
National Archives of Australia
National Blood Authority
National Breast and Ovarian Cancer Centre
National Capital Authority
National Competition Council
National Film and Sound Archive
National Gallery of Australia
National Health and Medical Research Council
National Library of Australia
National Museum of Australia
National Native Title Tribunal
National Offshore Petroleum Safety Authority
National Water Commission
National Environment Protection Council Service Corporation
Northern Land Council
Office of National Assessments
Office of Parliamentary Counsel
Office of Auditing and Assurance Standards Board
Office of Australian Accounting Standards Board
Office of the Australian Building and Construction Commissioner
Office of the Commonwealth Ombudsman
Office of the Director of Public Prosecutions
Office of the Fair Work Ombudsman
Office of the Inspector-General of Intelligence and Security
Office of the Official Secretary to the Governor-General
Office of the Privacy Commissioner
Office of the Renewable Energy Regulator
Old Parliament House
Outback Stores Pty Ltd
Private Health Insurance Ombudsman
Productivity Commission
Professional Services Review
Royal Australian Mint
Rural Industries Research and Development Corporation
Safe Work Australia
Seafarers Safety, Rehabilitation and Compensation Authority
Special Broadcasting Service Corporation
Sugar Research and Development Corporation

81Appendix 2: Respondent agencies
Torres Strait Regional Authority
Tourism Australia
Wheat Exports Australia
Responding agencies that were neither FMA Act agencies nor CAC Act agencies that receive at least 50 percent government fundingArmy Amenities Fund Company
Airservices Australia
Albury-Wodonga Corporation
Australian Business Arts Foundation
Australian Military Forces Relief Trust Fund
Australian Postal Corporation
Australian Reinsurance Pool Corporation
Australian River Co. Limited
Australian Sports Foundation Limited
Australian Submarine Corporation Pty Ltd
Australian Wine and Brandy Corporation
Central Land Council
Civil Aviation Safety Authority
Cotton Research and Development Corporation
Defence Housing Australia
Export Finance and Insurance Corporation
Indigenous Business Australia
National Australia Day Council Limited
Private Health Insurance Administration Council (PHIAC)
RAAF Welfare Recreational Company
Royal Australian Air Force Welfare Trust Fund
Royal Australian Navy Central Canteens Board
Wreck Bay Aboriginal Community Council

www.aic.gov.au
Australia’s national research and knowledge centre on crime and justice
AIC Reports Monitoring Reports 18